Industry report - Fino Payments Bank
186
%RP%Argentina | China | Hong Kong | India | Poland | Singapore | UK | USA | UAE CRISIL Limited: CRISIL House, Central Avenue, Hiranandani Business Park, Powai, Mumbai – 400076. India Phone: + 91 22 3342 3000 | Fax: + 91 22 3342 3001 | www.crisil.com Industry report Digitalisation of financial services, payments and remittances market in India October 2021
-
Upload
khangminh22 -
Category
Documents
-
view
0 -
download
0
Transcript of Industry report - Fino Payments Bank

%RP%Argentina | China | Hong Kong | India | Poland | Singapore | UK | USA | UAE
CRISIL Limited: CRISIL House, Central Avenue, Hiranandani Business Park, Powai, Mumbai – 400076. India
Phone: + 91 22 3342 3000 | Fax: + 91 22 3342 3001 | www.crisil.com
Industry report Digitalisation of financial services, payments and remittances market in India
October 2021


Contents
Macroeconomic scenario .......................................................................................................................................... 3
Financial Inclusion ................................................................................................................................................... 44
Indian banking Industry ........................................................................................................................................... 68
Digitization of transactions and payments in India .............................................................................................. 92
Payment Banks ....................................................................................................................................................... 119
Point of Sale (POS) Market .................................................................................................................................... 134
Domestic Remittances ........................................................................................................................................... 144
Cash Management Services (CMS) ...................................................................................................................... 151
AADHAR Enabled Payment System (AePS) / Micro-ATM (MATM) .................................................................... 155
Banking technology solutions .............................................................................................................................. 161
Peer Benchmarking ................................................................................................................................................ 165

2
Macroeconomic scenario
COVID-19 pandemic impacts world and Indian economy; bounce back
expected in fiscal 2022
According to the provisional estimates released by the NSO, India’s real GDP growth in fiscal 2021 stood at -7.3%
versus the earlier estimate of -8.0%. After sluggish growth in first half of the fiscal owing to rising Covid-19 cases,
gross domestic product (GDP) growth has moved into positive territory in the second half of the year reflecting a
pickup in economic activity.
Fiscal 2020 was volatile for the global economy. The first three quarters were ensnared in trade protectionist policies
and disputes among major trading partners, volatile commodity and energy prices, and economic uncertainties
arising from Brexit. Hopes of broad-based recovery in the fourth quarter were dashed by the Covid-19 pandemic,
which has infected more than 236 million people in 224 countries (as of October 7, 2021), leading to considerable
human suffering and economic disruption.
The COVID-19 pandemic sharply slowed the Indian economy in the first quarter of Fiscal 2021, but the huge
economic costs that it extracted, forced the economy to open up and get back on its feet in the second quarter of
Fiscal 2021. What also helped was a sharp cutback in operating costs for corporates due to job and salary cuts,
employees exercising work from home options, low input costs due to benign interest rates, crude and commodity
prices.
The fierce second wave of Covid-19 pandemic took the healthcare ecosystem to the brink and beyond in Q1 of fiscal
2022, but it did not hit economic activity as hard as the first wave did. The main reason for this would be decentralised
and less-stringent lockdowns, which reflect the ‘learning to live with the virus attitude’ that authorities adopted. Many
states also permitted construction and manufacturing activities to continue during the lockdown.
The pandemic came at the most inopportune time since India was showing signs of recovery following a slew of
fiscal/monetary measures as nominal GDP grew by 8.8% on year in Q4 of fiscal 2021 as compared to 4.7% in Q4 of
fiscal 2020. Having said that, CRISIL Research foresees growth rebounding in Fiscal 2022, on the back of a very
weak base, a counter-cyclical Union Budget for Fiscal 2022 pushing investments and some benefit from a rising-
global-tide-lifting-all-boats effect. The gradual increase in vaccinations against COVID-19 is also expected to boost
confidence and support stronger recovery. Even after the strong rebound, fiscal 2022 real GDP is expected to be
only slightly higher than that in fiscal 2020.
The budget’s focus on pushing capital expenditure (capex) despite walking a fiscal tightrope however provides
optimism and creates a platform for higher growth. Given that the focus of the budget was on investment rather than
consumption push, the full impact of the expenditure will be seen in the near term via multiplier effects, and over time,
through enhancement of productive capacity. To that extent, CRISIL Research believes that the budgetary provisions
help raise the medium-term prospects for the economy.
This budget not only focussed on pushing central capex but also attempted to nudge state government capex. A
Reserve Bank of India (RBI) study points out that an increase in capex by the central and state governments by one
rupee each induces an increase in output by Rs 3.25 and Rs 2.0, respectively (Source: RBI Bulletin – April 2019).

3
Budgetary support and vaccines expected to boost economic growth
Note: P - Projected
Source: National Statistics Office (NSO), International Monetary Fund (IMF) and CRISIL Research estimates
The possibility of a third Covid wave post the festive season does pose a downside risk to economic growth in fiscal
2022. In the aftermath of the second wave witnessed in the first quarter of the fiscal, many states had implemented
localised restrictions in the form of weekend lockdowns, restricting non-essential businesses from operating and/or
night curfews to prevent the spread of the infection. Although the Covid cases during 2nd wave have declined to below
40,000 in mid-July 2021 from over 4 lakh cases in 5th May 2021, there is still the looming fear of a third wave.
CRISIL Research forecasts India’s GDP for fiscal 2022 to grow by around 9.5% in our base case scenario, assuming
that 70% of the adult population will be vaccinated by December 2021 and a third Covid wave does not strike us.
Covid-19 vaccinations have also started gaining pace in India. While close to 64% of India’s adult population has
received the first dose of the Covid-19 vaccine (as of September 19, 2021), 21% of India’s adult population has taken
the second dose.
A third wave would pose a significant downside risk to the growth forecast, as would a slower-than-anticipated pace
of vaccination. We forecast India’s GDP to grow by 8% in fiscal 2022 in our pessimistic scenario.
GDP growth scenarios based on assumptions of case peak
Source: CRISIL Research
114 123 132 140 146 135 148 159 169 179
8.0% 8.3%7.0% 6.3% 4.0%
-7.3%
9.5% 7.8%5.7%
6.5%
-10%
-5%
0%
5%
10%
15%
0
50
100
150
200
FY 16 FY 17 FY 18 FY 19 FY 20 FY 21 FY 22 P FY 23 P FY 24 P FY 25 P
Real GDP Growth (Y-o-Y)
(Rs trillion)
9.5%
8.0%
7.0%
7.5%
8.0%
8.5%
9.0%
9.5%
10.0%
Base case scenario Pessimistic Scenario
Fiscal 2022 GDP growth (y-o-y)

4
In fiscal 2023, CRISIL Research expects growth to remain strong at 7.8% and become more broad-based, as a
sufficient proportion of population gets vaccinated by then. This will particularly strengthen growth for contact-based
services, which have been the biggest victims. Beyond that, growth is expected to moderate.
Prior to the onset of the pandemic, India’s GDP growth slowed on account of existing vulnerabilities such as a weak
financial sector and subdued private investment. However, in light of production-linked incentive (PLI) scheme,
reduction in corporate tax rate, labour law reforms together with healthy demographics and a more favourable
corporate tax regime, India is expected to witness strong GDP growth when the global economy eventually recovers,
supported by prudent fiscal and monetary policy.
Due to higher liquidity push, inflation moved out of target band
Note: P - Projected
Source: National Statistics Office (NSO) and CRISIL Research
CPI inflation has been on the higher side in recent years
Source: National Statistics Office (NSO) and CRISIL
CPI Inflation was out of RBI’s target band of 2-6% from April 2020 to November 2020; however, it remained within
RBI’s target band from December 2020 to April 2021. In May 2021 and June 2021, the inflation levels observed slight
elevation and were out of RBIs target band; however, in July 2021 and August 2021, CPI inflation declined to 5.6%
and 5.3%, respectively.
4.9%4.5%
3.6% 3.4%
4.8%
6.2%
5.3%
2.0%
3.0%
4.0%
5.0%
6.0%
7.0%
FY 16 FY 17 FY 18 FY 19 FY 20 FY 21 FY 22 P
CPI (Inflation)
5.8%
7.2%
6.3% 6.2%
6.7% 6.7%
7.3%7.6%
6.9%
4.6%
4.1%
5.0%
5.5%
4.2%
6.3% 6.3%
5.6%5.3%
3%
4%
5%
6%
7%
8%
CPI (Inflation)

5
Inflation continues to face pressure from high international commodity prices, including edible oils and metals, which
are at decadal highs and crude oil prices which remain beyond the comfort zone at over ~$70 per barrel. Recent data
has indicated firms passing on rising input costs to consumers despite weak demand conditions. We expect the pass-
through to gain more steam as domestic demand strengthens in the second half of this fiscal.
The lid on overall inflation will be kept by food, as it benefits from the high base of last year. However, the progress
of monsoon and impact of rising global food prices will remain a key monitorable. CRISIL pegs fiscal 2022 average
CPI inflation at 5.3% for fiscal 2022.
Macroeconomic outlook for Fiscal 2022
Macro variables FY20 FY21E FY22P Rationale for outlook
GDP (y-o-y) 4.0% -7.3% 9.5%*
The second wave and the resultant localised lockdowns has impeded the
path to economic recovery, leading CRISIL to revise down the growth
forecast for Fiscal 2022 to 9.5%, from 11.0% earlier. That said, expected
pick-up in economic activity post-vaccination and support from global
growth would act as positives
Consumer price
index (CPI) inflation
(y-o-y)
4.8% 6.2% 5.3%
Upside risks on inflation are growing from surging international
commodity prices. While producers are bearing a greater burden of rising
input costs for now, these could get passed to retail prices once demand
recovers. Food inflation could also face pressure from disruptions to the
rural economy due to the pandemic’s spread, and rising global prices
10-year
Government
security yield
(March-end)
6.2% 6.2% 6.5%
The RBI’s unconventional policy measures have been instrumental in
keeping G-sec yields at decadal lows, at a time when the bond market is
facing an unprecedented rise in Government borrowing. Supply
pressures could have a bearing on yields once the RBI starts normalising
liquidity. Adverse global developments such as premature withdrawal of
monetary easing by US Federal Reserve could further add pressure
CAD (Current
account
balance)/GDP (%)
-0.9% 1.3% -1.2%
The trajectory of COVID-19 infections, pace of the vaccination drive, and
duration of state lockdowns will have an important bearing on domestic
demand and, consequently, import growth. Increased prices of
commodities, especially crude oil – India’s largest import item – will drive
imports. External demand will support exports, backed by strong
economic recovery among India’s major trading partners in the US,
Europe, and Asia
Rs/$ (March
average) 74.4 72.8 75.0
With the second wave adversely impacting India’s economic recovery,
and amid inflationary pressures, the rupee may weaken against the
dollar. The current account balance turning into deficit (from a surplus last
Fiscal), will exert further downside pressure on the rupee. Some support
may be seen due to the RBI’s interventions to mitigate volatility. Record
high forex reserves and foreign investor inflows, owing to interest rate
differential between India and global economies, will also prop up the
rupee
*Downward bias
Note: P – Projected
Source: Reserve Bank of India (RBI), National Statistics Office (NSO), CRISIL Research

6
GDP to bounce back over the medium term
After clawing back in fiscal 2022, CRISIL Research forecasts India’s GDP to grow at 6.0-7.0% per annum between
fiscals 2023 and 2025. This growth will be supported by the following factors:
• Focus on investments rather than consumption push enhancing the productive capacity of the economy.
• The production linked incentive (PLI) scheme which aims to incentivise local manufacturing by giving volume-
linked incentives to manufacturers in specified sectors
• Raft of reform measures by the government along with a more expansionary stance of monetary policy leading
to a steady pick-up in consumption demand
• Policies aimed towards greater formalisation of the economy are bound to lead to an acceleration in per capita
income growth
Risks to growth
Covid-19 cases increasing, a third wave this fiscal: The second Covid-19 wave has thrown cold water over the
Indian economy that was beginning to warm up after the most severe contraction since Independence. The rash of
afflictions that followed forced states to lock down, hurting consumer and business confidence yet again. Mercifully,
daily cases seem to have peaked for now, though they remain above the peak of the first wave. But the risks of
another wave and tardy vaccinations mean states would be chary of fully unlocking anytime soon. It can have a
debilitating impact on economic activity and thereby growth.
Elevated inflation: Significant cost-push pressures on account of surging international commodity prices and supply
disruptions has raised cost of production for manufacturing firms. Pass-through to consumer prices could further
pose as a headwind to recovery in demand.
Premature tightening of global monetary policies: Resurgence of inflation globally could lead major central banks
to unwind their extraordinary easy monetary policies sooner than expected. This could hit sentiment, possibly leading
to capital outflows from the Indian economy and some tightening in domestic financial conditions.
Geopolitical developments: External developments, most importantly the US-China trade war, have proved to
significantly impact global GDP growth as well as export earnings and capital flows to emerging markets such as
India. While there is some respite with the signing of Phase 1 of the US-China trade deal, several issues remain
unresolved. Any re-escalation of tensions could again work adversely. Geopolitical developments in the Middle
East could also disrupt crude oil supply and prices, likely hurting a wide range of domestic macroeconomic
parameters, including current account deficit, inflation and GDP growth.
Persistent stress in financial sector: This has been one of the major drags on GDP growth. Liquidity issues faced
by NBFCs and risk aversion amongst lenders has hampered credit growth as well as transmission of monetary policy
easing. While credit growth is expected to improve in the current fiscal with stronger GDP growth, the system is
expected to continue to face uncertainty over asset quality with the Covid-19 pandemic continuing to cast its shadow
on the economy. Easing of constraints and risk aversion in the financial system is critical for pick-up in growth.

7
India’s GDP to recover sharply
India was one of the fastest growing economies in the world pre-COVID, with annual growth of around 6.7% in
between calendar year 2014 to 2019. Over the few years prior to the onset of the pandemic, India’s macroeconomic
situation had gradually improved with the twin deficits (current account and Fiscal) narrowing and the growth-inflation
mix improving and durably so. The Government adopted an inflation-targeting framework that provides an institutional
mechanism for inflation control, while modernising central banking.
While economic growth in calendar year 2020 has been dented due to COVID-19, CRISIL expects the economy to
rebound and India to regain its tag of one of the fastest growing economies globally in the medium-term.
Going forward, rapid urbanisation, rising consumer aspiration and increasing digitisation coupled with government
support in the form of reforms and policies is expected to support growth. For example, the government has recently
announced production-linked incentives across identified sectors with an aim to propel the growth of India as a
manufacturing destination. At a macro level, digitalization has led to various benefits like linkage to Aadhaar identity
cards, direct benefit transfer and various other government benefits.
The IMF forecasts India’s GDP to grow by 9.5% in calendar year 2021 due to the lower base of calendar year 2020
and approved vaccines and policy measures. At this pace of growth, India is forecasted to be one of the fastest
growing economies in the world in 2021. Going forward as well, IMF forecasts India’s GDP to grow at a faster pace
than other economies.
India is one of the fastest-growing major economies (GDP growth, % year-on-year)
Note: GDP growth is based on constant prices, Data represented is for calendar years, P: Projected
Source: IMF (World Economic Outlook – July 2021 and April 2021 update), CRISIL Research
2014 2015 2016 2017 2018 2019 2020 2021 2022 P 2023 P 2024 P 2025 P
India 7.4 8.0 8.3 7.0 6.1 4.2 -8.0 9.5 8.5 6.8 6.7 6.6
China 7.3 6.9 6.8 6.9 6.7 6.0 2.3 8.1 5.7 5.4 5.3 5.1
Japan 0.4 1.2 0.5 2.2 0.3 0.3 -4.8 2.8 3.0 1.1 0.7 0.6
United states 2.5 3.1 1.7 2.3 3.0 2.2 -3.5 7.0 4.9 1.4 1.5 1.6
United kingdom 2.6 2.4 1.9 1.9 1.3 1.5 -9.9 7.0 4.8 2.0 1.8 1.5
Brazil 0.5 -3.5 -3.3 1.3 1.3 1.4 -4.1 5.3 1.9 2.1 2.0 2.0
Russia 0.7 -2.0 0.5 1.8 2.8 2.0 -3.1 4.4 3.1 2.1 1.8 1.8
South Africa 1.8 1.2 0.4 1.4 0.8 0.2 -7.0 4.0 2.2 1.4 1.3 1.3
-15.0
-10.0
-5.0
0.0
5.0
10.0
15.0

8
Along with being one of the fastest growing economy in the world, India ranks fifth in the world in terms of nominal
GDP in calendar year 2020. In terms of purchasing power parity (PPP), India is the third largest economy in the
world, only after China and the United States.
GDP Ranking of key economies across the world (2020)
Country GDP Rank % share (World GDP) PPP Rank % share (World GDP,PPP)
United States 1 24.7% 2 15.8%
China 2 17.4% 1 18.3%
Germany 3 4.5% 4 3.4%
United Kingdom 4 3.2% 9 2.3%
India 5 3.1% 3 6.7%
France 6 3.1% 8 2.3%
Italy 7 2.2% 10 1.9%
Canada 8 1.9% 14 1.4%
Korea 9 1.9% 13 1.7%
Russia 10 1.8% 5 3.1%
Note: Japan is not considered in the key economies as data for 2020 is not available
Source: World Bank, CRISIL Research
Contribution of various sectors to GDP
As compared to various developed economies, which witnessed a good contribution from manufacturing and industry
first and subsequently in services, the Indian transformation story has been different. A notable feature of Indian
economy has been the services sector’s rising contribution to the overall output of the economy. Over the last three
fiscal years ending fiscal 2020, the service sector has grown at a rate of ~7%, thereby taking the contribution of
services sector to 62.9% in terms of Gross Value Added (GVA) at constant prices. In fiscal 2021, overall GVA
contracted by ~6.5% with industry and services sector contracting by ~7.4% and ~8.4% respectively.
Share of sector in GVA at constant prices
Note: E – Estimated, P - Projected
Source: RBI; CRISIL Research
16.5% 15.4% 15.2% 15.1% 14.6% 14.6% 16.5% 15.6%
22.5% 23.3% 23.4% 23.4% 23.1% 22.4% 21.8% 22.3%
61.0% 61.3% 61.4% 61.4% 62.3% 62.9% 61.7% 62.1%
0%
10%
20%
30%
40%
50%
60%
70%
80%
90%
100%
FY15 FY16 FY17 FY18 FY19 FY20 FY21 E FY22 P
(%)
Agriculture Industry Services

9
Industry and services sector can be further classified into sub-sectors. In industry, majority of the contribution comes
from manufacturing sector which contracted by ~5% and in the services sectors, highest contribution comes from
financial, real estate and professional services segment which witnessed a muted growth of ~1%. Within services
sector - Trade, Hotels, Transport, Communication and Services related to broadcasting was severely hit as it
witnessed a contraction of ~15% followed by construction which contracted by ~6% in fiscal 2021.
Share of sub-sectors in GVA by Industry (FY21) Share of sub-sectors in GVA by Services (FY21)
Source: RBI, CRISIL Research
Budget turns expansionary with an eye on medium term
India’s first union budget after a once-in-a-century global pandemic -- and only the fourth to follow a contraction in its
independent history – voted for an infrastructure-led, counter-cyclical Fiscal stimulus to mend the broken economy.
The idea clearly, was to push the growth multiplier rather than stoke consumption through steroids, even if that meant
stretching the glide path of Fiscal deficit. If there is an overarching picture, it is that this budget sets the tone for much-
needed infrastructure growth for the next 3-4 years. That will help both, sustain development and create jobs. But
implementation, which is all-crucial, remains the elephant in the room.
Broadly, the budget had five key highlights:
• Growth-focussed, expansionary
Significantly, it chose to push the pedal on investment at this juncture. Studies highlight how the positive spill over
effects of public investment only amplify during periods of uncertainty. For the Indian economy specifically, capital
expenditure (capex) typically has higher multiplier effect than revenue spending, by crowding in private investment.
This budget not only focussed on pushing central capex but also attempted to nudge state Government capex. A
Reserve Bank of India (RBI) study points that an increase in capex by the central and state Governments by one
rupee each induces an increase in output by Rs. 3.25 and Rs. 2.0, respectively.
• Improved spending quality
Manufacturing, 77%
Mining and Quarrying, 9%
Electricity, Gas, Water Supply & Other Utility
Services, 14%Financial, Real
Estate & Professional
Services, 36%
Trade, Hotels, Transport,
Communication & Broadcasting related
services, 27%
Public Administration, Defence and
Other Services, 25%
Construction, 12%

10
While maintaining focus on capex, the budget also allowed for some normalisation of extraordinary spending that
took place in response to the pandemic. That said, it also attempts to improve quality of spends (compared with the
pre-pandemic trend). Thus, Government has not only chosen to re-orient expenditure but also has tried to improve
the expenditure mix to make way for more capex.
• Enhanced transparency
Deficit numbers have shot up. But one reason for this is enhanced transparency in the budget, which lends to their
credibility. The budget relies less on off-budget items for funding investments and more on capex allocations. It also
puts an end to the practice of funding Food Corporation of India’s shortfall through borrowings from National Small
Savings Fund (NSSF) and replaces it with budgetary allocation. As per CRISIL estimates, excluding the impact of
inclusion of NSSF funds for FCI and Government fully serviced bonds, Fiscal deficit would have been lower about
0.5-1% of gross domestic product (GDP) in Fiscal 2021 and about 0.6% lower in Fiscal 2022
• An eye on medium term
It tries to lift the medium-term growth potential through a capex push and sharper focus on financial sector reforms
such as:
o Recapitalising public sector banks (PSBs) so they can support economic recovery: The pandemic
landed a double whammy on a financial sector that was already weighed down by non-performing assets
(NPAs) and slack credit demand. Frontloading of capital infusion for banks (Rs. 200 billion has been provided
for Fiscal 2022) to withstand possible asset quality deterioration was an imperative.
o Cleaning up bank books: By creating asset management and reconstruction companies, the intention is to
consolidate, manage and dispose of stressed assets of PSBs.
o Disinvestment: In another progressive step for the financial sector, the government, in the budget, also
announced its intention to privatise two public sector banks (PSBs) and one general insurance company.
The disinvestment process of Air India, BPCL, and Life Insurance Corporation of India (LIC) have been
moved to fiscal 2022.
o Bank Privatisation: In another progressive step for the financial sector, the Government, in the budget, also
announced its intention to privatise two public sector banks (PSBs) and one general insurance company.
o Reforming the beleaguered manufacturing sector: Manufacturing was in doldrums even before the
pandemic struck, and was worst-affected in Fiscal 2021 after services. The budget announced more
measures to address that in continuation with the Atmanirbhar Bharat package and production-linked
incentive scheme, such as customs duty rationalisation, with particular focus on micro, small and medium
enterprises (MSMEs).
o Roadmap for public sector investment: The budget bats for a massive push to infrastructure creation; it
intends to augment funds for the flagship National Infrastructure Pipeline and lays down a roadmap to do so
by increasing capex, monetising assets and developing instruments for infrastructure financing. That should,
as earlier mentioned, have a high multiplier effect on growth and employment.

11
o Asset monetisation: The budget also announced the launch of the National Monetisation Pipeline (NMP)
to leverage operating public infrastructure, the first of its kind in India. The Government envisages
monetization of roads, railways, airports, and oil and gas pipelines under this initiative. The funding of the
National Infrastructure Pipeline will critically hinge on the success of these efforts to monetise existing assets.
NMP estimates aggregate monetisation potential of Rs 6 trillion through core assets of Central Government
over a 4-year period from FY22-FY25.
Sector-wise monetisation pipeline over the next 4 years
Sector Estimated Potential (Rs billion)
Roads 1,602
Railways 1,525
Power Transmission 452
Power Generation 398
Telecom 351
Warehousing 289
Mining 287
Natural Gas Pipeline 244
Product pipeline/
Others 225
Aviation 207
Urban Real Estate 150
Ports 129
Stadiums 115
Total 6,000
Source: NITI Aayog, CRISIL Research
• Growth-led approach to heal pandemic-induced scars: Post-pandemic recovery has been sharply uneven.
Manufacturing is recovering faster led by policy support, pent up demand and some shift away from services.
Services (especially contact-based ones like trade, hotels, transport and communication) continue to bear the
brunt. Smaller firms and micro enterprises have been more severely hit than larger ones. And the rural poor
received more support to incomes and jobs than the urban, who were also significantly affected. The budget
attempts to correct some of these anomalies. The budget is premised upon infrastructure spending creating jobs
for the unskilled and semi-skilled workforce.
All in all, the economy is recovering faster than expected by CRISIL. Consistently good agriculture performance,
successful flattening of the COVID-19 curve and a pick-up in Government spending in recent months has reduced
the downside to the current Fiscal’s de-growth and led to an upward revision in next Fiscal’s growth prospects.

12
Financial services sector in India
Among services, the financial sector is growing with increasing presence and size of the banking industry leading to
higher banking penetration in the country. As of March 2010, India had 81 scheduled commercial banks, 82 regional
rural banks, and 12,662 non-banking financial companies (NBFCs), which together had deposits of Rs 45 trillion and
extended credit of Rs 37 trillion.
In 2013, RBI constituted a committee to study “Comprehensive Financial Services for Small Businesses & Low
Income households” headed by Dr. Nachiket Mor. The focus of the committee was to recommend innovative solutions
to RBI to accelerate financial inclusion in unbanked and underbanked section of the society in a cost effective way.
The committee recommended setting up “high technology—low cost" banking models to accelerate financial
inclusion. Subsequently, in 2015, the Reserve Bank of India laid down the framework and licensed ‘vertically
differentiated banking systems’, such as Payments Bank (PBs) and Small Finance Banks (SFBs) with the objective
of extending the reach and availability of financial services to hitherto unserved or underserved sections of the
society.
SFB licences were granted to 10 institutions with the aim to service the underserved through savings instruments,
and supplying credit to small business units, small and marginal farmers, micro and small industries, and other
unorganised sectors. RBI also granted in-principle approval to 11 players to launch payment banks. Three players
subsequently withdrew their application. Of the remaining eight, seven institutions – India Post Payments Bank Ltd,
Airtel Payments Bank Ltd, PayTM Payments Bank Ltd, Fino Payments Bank, Aditya Birla Idea Payments Bank Ltd,
NSDL Payments Bank and Jio Payments Bank had commenced operations. In 2019, Aditya Birla Idea Payments
Bank announced the winding up of its banking business. The objective of a payments bank is to provide a small-
savings account facility, and payment and remittance services to the migrant labour force, low-income households,
small businesses and other unorganised sector entities. Both SFBs and Payments banks have grown in terms of
presence as well as size at a very fast pace over the last three years.
As of March 2020, all banks and NBFCs in India cumulatively had deposits of Rs. 147 trillion and outstanding loans
of Rs. 137 trillion, translating into a 10-year CAGR of 11% in deposits and 13% in credit. As of March 2021, all banks
has cumulative deposits of ~ Rs 154 trillion (excluding co-operative banks and payments banks) and credit
outstanding of ~Rs 107 trillion (excluding co-operative banks).
Bank group Number of
banks
Number of
branches
(March 2021)
4 year CAGR
(number of
branches)
Deposits (Rs
Billion)
(March 2021)
4-year CAGR
(deposits)
Public sector banks 12 92,566 -1% 94,599 4%
Private banks 22 36,676 7% 46,236 16%
Co-operative banks 2550 NA NA 9,196* 2%^
Foreign banks 46 921 31% 7,520 13%
Regional rural banks 43 22,292 1% 5,169 9%
Small Finance banks 10 5,102 87% 877 105%
Payments bank 6 748 250% 23* 223%^
Total 2,689 158,305 154,400**
13
Note: NA: Not available, (*) – Data as of fiscal 2020, (^) – 3-year CAGR (FY17-FY20), (**) – Does not include co-operative banks and payments
banks
Source: Reserve Bank of India (RBI); CRISIL Research
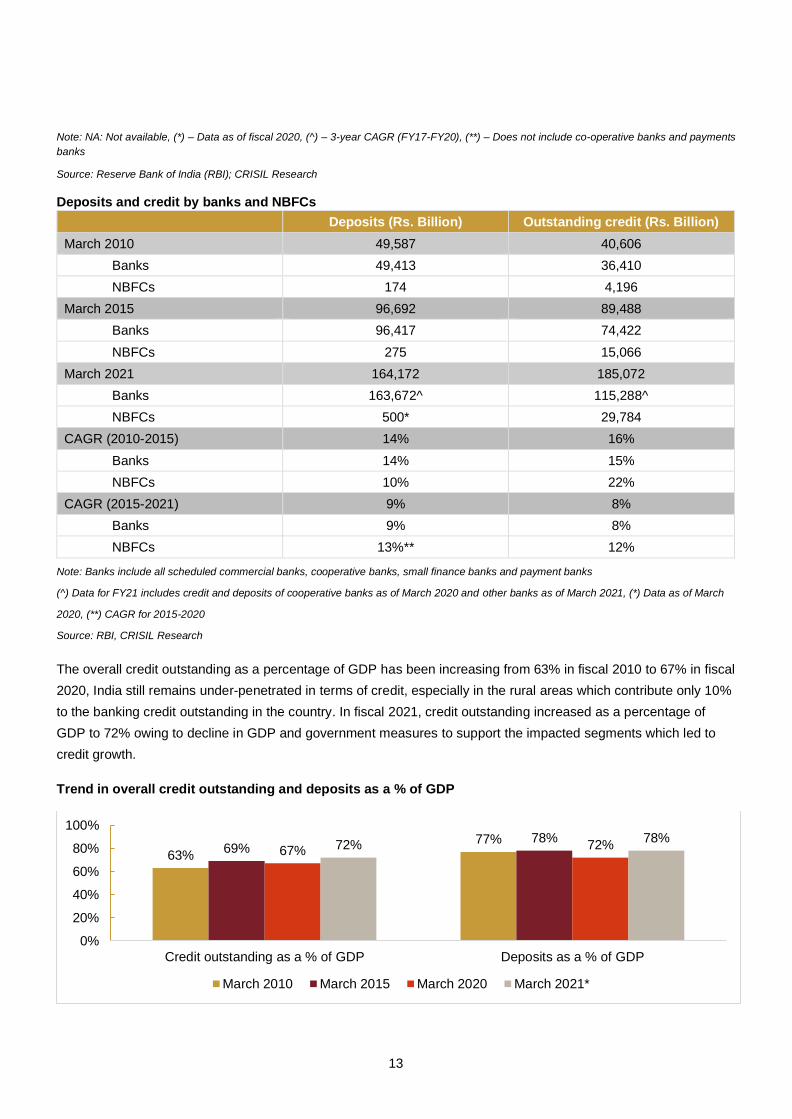
Deposits and credit by banks and NBFCs
Deposits (Rs. Billion) Outstanding credit (Rs. Billion)
March 2010 49,587 40,606
Banks 49,413 36,410
NBFCs 174 4,196
March 2015 96,692 89,488
Banks 96,417 74,422
NBFCs 275 15,066
March 2021 164,172 185,072
Banks 163,672^ 115,288^
NBFCs 500* 29,784
CAGR (2010-2015) 14% 16%
Banks 14% 15%
NBFCs 10% 22%
CAGR (2015-2021) 9% 8%
Banks 9% 8%
NBFCs 13%** 12%
Note: Banks include all scheduled commercial banks, cooperative banks, small finance banks and payment banks
(^) Data for FY21 includes credit and deposits of cooperative banks as of March 2020 and other banks as of March 2021, (*) Data as of March
2020, (**) CAGR for 2015-2020
Source: RBI, CRISIL Research
The overall credit outstanding as a percentage of GDP has been increasing from 63% in fiscal 2010 to 67% in fiscal
2020, India still remains under-penetrated in terms of credit, especially in the rural areas which contribute only 10%
to the banking credit outstanding in the country. In fiscal 2021, credit outstanding increased as a percentage of
GDP to 72% owing to decline in GDP and government measures to support the impacted segments which led to
credit growth.
Trend in overall credit outstanding and deposits as a % of GDP
63%
77%69%
78%67% 72%72%
78%
0%
20%
40%
60%
80%
100%
Credit outstanding as a % of GDP Deposits as a % of GDP
March 2010 March 2015 March 2020 March 2021*

14
Note: E- Estimates, (*) - for March 2021, credit outstanding includes estimated number for overall systemic credit, and deposits include only
banking deposits
Source: RBI, CRISIL Research
Role of RBI in the financial services sector
RBI, the central bank of India, was established in 1939. Though originally privately owned, since nationalisation in
1949, the Reserve Bank is fully owned by the Government of India. It has been entrusted with a multidimensional
role which includes implementation of monetary policy and maintaining monetary stability in the country. The
preamble of RBI describes its roles and functions as “to regulate the issue of Bank notes and keeping of reserves
with a view to securing monetary stability in India and generally to operate the currency and credit system of the
country to its advantage; to have a modern monetary policy framework to meet the challenge of an increasingly
complex economy, to maintain price stability while keeping in mind the objective of growth”. The primary role of the
RBI, as the Act suggests, is monetary stability, that is, to sustain confidence in the value of the country’s money or
preserve the purchasing power of the currency. Ultimately, this means low and stable expectations of inflation,
whether that inflation stems from domestic sources or from changes in the value of the currency, from supply
constraints or demand pressures. In addition, the RBI has two other important mandates; inclusive growth and
development, as well as financial stability.
In a country where a large section of the society continue to be unserved or underserved in terms of financial services,
inclusive growth assumes great significance. Access to finance is essential for poverty alleviation and reducing
income inequality. One of the core functions of the RBI, therefore, is to promote financial inclusion that leads to
inclusive growth. As the central bank of a developing country, the responsibilities of the RBI also include the
development of financial markets and institutions. Broadening and deepening financial markets and increasing their
liquidity and resilience so that they can help allocate and absorb the risks entailed in financing India’s growth is a key
objective of the RBI.
India’s financial system is dominated by banks. Their regulation and supervision is therefore important both from the
viewpoint of protecting the depositors’ interest and preserving financial stability. The RBI, deriving powers from the
Banking Regulation Act, 1949, designs and implements the regulatory policy framework for banks operating in India.
Over the years, non-banks providing credit and related services have also been bought under the purview of RBI’s
regulation and supervision.
Central banks are at the heart of a country’s payment and settlement system. One of the principal functions of central
banks is to be the guardian of public confidence in money, and this confidence depends crucially on the ability of
economic agents to transmit money and financial instruments smoothly and securely through payment and settlement
systems. The RBI has, over the years, taken several initiatives in building a robust and state-of-the-art payment and
settlement system that not only improves the plumbing of the financial system but also its stability.
The last two and a half decades have also seen growing integration of the national economy and financial system
with the world. While rising global integration has its advantages in terms of expanding the scope and scale of growth
of the Indian economy, it also exposes India to global shocks. The crisis of 2007-08 gave a glimpse of financial
instability in other economies posing threat to India’s financial stability. Hence, preserving financial stability has
become an even more important mandate for the RBI.

15
RBI, under various legal frameworks, is involved in banking functions, issuance of bank notes, monetary policy
functions, public debt functions, foreign exchange management, banking regulation and supervision, regulation and
supervision of NBFCs, regulation and supervision of co-operative banks, regulation of derivatives and money market
instruments, payments and settlement functions, credit information companies regulation functions and consumer
protection and promotion functions.
Retail spending in India projected to touch Rs 91 trillion by fiscal 2025;
smaller stores and organised retail to co-exist
Payments banks and fintechs have been increasing their presence and reach by increasing touch points through
retails outlets which have a widespread presence in India. In India, the private final consumption expenditure
(PFCE) was 58% of GDP in fiscal 2021 at Rs 116 trillion and India’s retail spending on goods was at ~50% of its
private consumption.
India’s consumption trend (Rs. trillion)
Source: RBI, CRISIL Research
Retail sector is expected to decline in fiscal 2021 in line with decline in GDP and PFCE. With implementation of
nationwide lockdown on account of Covid-19, retail consumption has taken a hit. Sale of non-essential goods saw
the brunt due to lockdown, but sale of essentials was allowed and thus it witnessed growth. Going forward too,
essential products (especially food & grocery) will witness normal growth. However, non-essentials will witness a
gradual recovery even during second half of the fiscal on account of impact on incomes due to pandemic. As
essentials (food & grocery and pharmacy) form around 56% of overall retail which is expected to have witnessed
growth of 8-9%, overall retail is estimated to have contracted by ~5% in fiscal 2021.
Overall retail spends on goods are expected to witness 15-17% growth in fiscal 2022 on account of a low base, full
year of store operations, higher discretionary spending and waning impact of the pandemic. In the long run, we
project the overall retail sector in India to grow at a CAGR of 11-13% during FY21-25.

16
Overall retail market to grow at 11-13% CAGR over fiscal 2021 to fiscal 2025
Note: E: Estimated, P-Projected
Source: CRISIL Research
While organised retail penetration (comprising both organised brick and mortar stores as well retail spending on e-
commerce platforms) in India is increasing at a feverish pace, for large swathes of the Indian population, particularly
lower middle class customers and customers in the semi urban and rural areas, small mom and pop stores remain
the primary outlet for retail spending.
Amongst various retail categories, food and grocery, which accounts for ~67% of overall retail market, has the lowest
organised retail penetration. There are about 12 million mom and pop (kirana) stores spread throughout the country,
which are estimated to account for almost 90% of the FMCG sales in the country. Eyeing the huge reservoir of
consumer data these stores possess, fintech companies are devising ways to make operations smoother for them
— be it by launching apps or point of sale (POS) systems or digitalising their operations and processes. These
merchants provide a huge potential for payment banks and fintechs to grow.
Share of various segments in overall retail market (FY21) Organised retail penetration (ORP) in
various segments (FY21)
3943
4953
5762 59
6876
8591
0
10
20
30
40
50
60
70
80
90
100
FY15 FY16 FY17 FY18 FY19 FY20 FY21 FY22P FY23P FY24P FY25P
-5%
(in Rs Trillion)

17
Note: Others includes categories like gems and jewellery, watches, personal care products etc.
Source: CRISIL Research
Key growth drivers
India has world’s second largest population
India’s population was ~1.2 billion and comprised nearly 245 million households. The population, which grew nearly
18% between 2001 and 2011, is expected to increase about 11% between 2011 and 2021, to 1.4 billion. The
population is expected to reach 1.5 billion by 2031, and number of households is expected to reach ~376 million over
the same period.
India’s population growth trajectory
Note: P: Projected; Data represented is for calendar years
Source: United Nations Department of Economic and Social affairs, CRISIL Research
Food and grocery
67%
Apparel6%
Consumer durables
4%
Furnishing2%
Footwear2%
Pharmacy2%
Books and music2%
Others15%
3.9%
27.7%
65.3%
8.6%
23.1%
8.1%
1.9%
18.0%
Food and grocery
Apparel
Consumer durables
Furnishing
Footwear
Pharmacy
Books and music
Others
0.40.4
0.50.7
0.8
1.0
1.2
1.41.5
0.0
0.2
0.4
0.6
0.8
1.0
1.2
1.4
1.6
1.8
1951 1961 1971 1981 1991 2001 2011 2021P 2031P
(In bn)

18
Number of households in India
Note: P: Projected; Data represented is for calendar years
Source: Census India, CRISIL Research
Favourable demographics
As of 2020, India has one of the largest young populations in the world, with a median age of 28 years. About 90%
of Indians will still be below the age of 60 by calendar 2021 CRISIL Research forecasts that 63% of them will be
between 15 and 59 years. In comparison, in calendar year 2020, the United States (US), China and Brazil had 77%,
83% and 86%, respectively, of their population below the age of 60.
India’s demographic dividend
Note: E: Estimated; Data represented is for calendar years
Source: United Nations Department of Economic and Social affairs, CRISIL Research
Urbanisation
Urbanisation is one of India’s most important economic growth drivers as it will drive substantial investments in
infrastructure development, which, in turn, is expected to lead to job creation, development of modern consumer
services and increased ability to mobilise savings. The country’s urban population has been rising consistently over
the decades. In 1950, it was 17% of total population. As per the 2018 revision of World Urbanization prospects,
India’s urbanisation was expected to reach to 35% in 2020. This is expected to reach 37% by 2025.
100119
148187
245
319
376
0
50
100
150
200
250
300
350
400
1971 1981 1991 2001 2011 2021P 2031P
(In mn)
35% 31% 27% 24%
27%28%
26%24%
30% 33%37%
40%
7% 9% 10% 13%
0%
10%
20%
30%
40%
50%
60%
70%
80%
90%
100%
2001 2011 2021 P 2031 P
0-14 15-29 30-59 60+

19
Urban population as a percentage of total population (%)
Note: P – projected; Data represented is for calendar years
Source: Census 2011, World Urbanization Prospects: The 2018 Revision (UN)
Increasing per capita GDP
Per capita income is estimated to have contracted by 8% in fiscal 2021 compared with a growth of ~2.9% in the
preceding fiscal. CRISIL forecasts that the per capita income will gradually improve with a pick-up in GDP growth
and sustained low inflation. This will be an enabler for domestic consumption. As per IMF estimates, India’s per capita
income (at constant prices) is expected to grow at 6.2% compound annual growth rate (CAGR) from Fiscals 2021-
25.
Per capita income
Per
capita
income
Level in FY21 (INR
thousands)
Growth at constant prices (%)
Current
prices
Constant
prices
FY13 FY14 FY15 FY16 FY17 FY18 FY19 FY20 FY21 E FY25P
146 100 3.3 4.6 6.2 6.7 6.8 5.7 5.8 2.9 -8.0 6.2*
Note – E: Estimated, (*) - 4-year CAGR growth (FY21-FY25), As per IMF estimates of April 2021
Source – Ministry of Statistics and Program Implementation (MOSPI), International Monetary Fund (IMF), CRISIL Research
Trend in Nominal GDP per capita
Note: P: Projected
17.0 17.919.8
23.1
25.527.7
30.9
34.9
37.4
1950 1960 1970 1980 1990 2000 2010 2020P 2025P
72 81 90 98 107 118130
143 152 146165
180196
213
0
50
100
150
200
250
FY 12 FY 13 FY 14 FY 15 FY 16 FY 17 FY 18 FY 19 FY 20 FY 21 FY 22P FY 23P FY 24P FY 25P
(In Rs thousands)
Nominal GDP per capita

20
Source: MOSPI, World Bank, CRISIL Research
Rising Middle India population to propel economic growth
An estimated 83% of households in India had an annual income of less than Rs 0.2 million in fiscal 2012. This
proportion has reduced to reach 76% in fiscal 2017 and is estimated to touch 65% in fiscal 2022, with continuous
increase in the GDP and household incomes. Proportion of Middle India (defined as households with annual income
of between Rs 0.2 to 1 million) has been on a rise over the last decade and is expected to grow further with rise in
disposable incomes.
To illustrate, CRISIL Research estimates that there were 41 million households in India in this category as of fiscal
2012, and by fiscal 2022, they are estimated to increase to 103 million households translating into a CAGR of 10%
over this time period. A large number of these households, which have entered the Middle Income bracket in the last
few years, are likely to be from semi-urban and rural areas. The rise in incomes in these areas is also evident when
one observes the trend in share of deposits coming into banks. As of March 2020, districts outside the top 200
districts, accounted for 30% of total deposits, up from the 25% share as of the same period in 2015.
Consistent improvement in the literacy levels, increasing access to information and awareness, increase in the
availability of basic necessities such as electricity, cooking gas, toilets and improvement in road infrastructure has
led to an increase in aspirations of Middle India, which is likely to translate into increased opportunities for consumer
goods makers as well as financial service providers. In fact, some of these trends are already visible. Smart phone
ownership, internet users and the proportion of users accessing social media is increasing at a breakneck speed.
Smaller cities and towns (with population less than 1 million) account for a significant portion of sales of e-retailers.
Household distribution by income
Note: E: Estimated, The boxes on top og each bar in the chart represent the total number of households in millions
Source: CRISIL Research
83% 76%65%
16% 21%32%
1% 2% 3%
0%10%20%30%40%50%60%70%80%90%
100%
FY12 E FY17 E FY22 E
Below Rs 0.2 million Rs 0.2 to 1 million Rs 1 million and above
256 283 321Households in millions

21
Middle India households to witness high growth over fiscal 2012 to fiscal 2022
Source: CRISIL Research
Access to bare necessities across rural areas has improved considerably over the last few
years
The bare necessities index (BNI), which was included as part of the Economic Survey for 2020-21, indicates how the
access to bare necessities in semi-urban and rural areas has improved considerably in the last few years, thereby
enhancing the quality of life and aspirations of the populace. The BNI summarises 26 indicators on five dimensions
viz., water, sanitation, housing, micro-environment, and other facilities. The BNI has been created for all states for
2012 and 2018 using data from two NSO rounds (69th and 76th) on drinking water, sanitation, hygiene and housing
conditions in India. The BNI indicates that access to the bare necessities has improved across all States in the country
in 2018 as compared to 2012. Access to bare necessities is the highest states such as Kerala, Punjab, Haryana and
Gujarat while it is the lower in Odisha, Jharkhand, West Bengal and Tripura. The improvements are widespread as
they span each of the five dimensions. Furthermore, inter-state disparities in the access to bare necessities have
declined in 2018 when compared to 2012 across rural and urban areas. This is because the States where the level
of access to the bare necessities was low in 2012 have gained relatively more between 2012 and 2018. Access to
the bare necessities has improved disproportionately more for the poorest households when compared to the richest
households across rural and urban areas.
The below graphs indicate the state-wise values of BNI in 2012 and 2018 for India as a whole as well as urban and
rural areas. A higher value indicates better access to bare necessities in a state ad vice-versa. The three colours,
green, yellow and red, used in the maps show the level of a state in providing access to bare necessities to its
households. Green (above 0.70) indicates high level, followed by yellow (0.50 to 0.70), which indicates medium level.
In contrast, red (below 0.50) indicates very low level of access. The difference in colours in a map indicate the regional
variation in the access to bare necessities for the households.
Pan-India BNI (Urban + Rural in 2012) Pan-India BNI (Urban + Rural in 2018)
212
41
3
217
60
6
209
103
10
0
50
100
150
200
250
Below Rs 0.2 million Rs 0.2 to 1 million Rs 1 million and above
(in mn)
FY12 E FY17 E FY22 E
-0.2% CAGR

22
Source: Economic Survey 2020-21
BNI for Rural India (2012) BNI for Rural India (2018)
Source: Economic Survey 2020-21 BNI for Urban India (2012) BNI for Urban India (2018)

23
Source: Economic Survey 2020-21
Financial penetration to rise with increase in awareness of financial products
Overall literacy in India is at 77.7% as per the results of recent NSSO survey conducted in 2018 which is still below
the world literacy rate of 86.5%. However, according to the National Financial Literacy and Inclusion Survey (NCFE-
FLIS) 2019, only 27% of Indian population is financially literate indicating huge gap and potential for financial services
industry. The survey defines financial literacy as combination of awareness, knowledge, skill, attitude and behaviour
necessary to make sound financial decisions and ultimately achieve individual financial wellbeing.
Overall literacy rate on a rise in India
Source: Census 2011, NSO Survey on household social consumption (2017-18), CRISIL Research
With increasing financial literacy, mobile penetration, awareness and the Prime Minister’s Jan Dhan Yojana bank
accounts (scheme aimed at bringing the unbanked under the formal banking system), there has been a rise in the
participation of individuals from non-metro cities in banking. With more people attached to formal banking sector, the
demand for financial products in smaller cities has seen a major uptick in recent years. Going forward, CRISIL
Research expects financial penetration to increase on account of increasing financial literacy.
64.8%
74.0%
77.7%
55.0%
60.0%
65.0%
70.0%
75.0%
80.0%
2001 2011 2018

24
Share of top 8 cities in banking deposits exhibits a reducing trend indicating increasing financial penetration
Note: 1) Classification of districts is done based on population as per Census 2011.
2) Mumbai Metropolitan Region (MMR), National Capital Region (NCR), Bengaluru and Kanpur have each been considered as a
district.
3) MMR includes Thane and Mumbai, NCR includes Delhi, Gurugram, Gautam Buddha Nagar, Ghaziabad and Faridabad,
Bengaluru includes Bangalore Urban and Bangalore Rural, Kanpur includes Kanpur Nagar and Kanpur Dehat
Source: RBI, CRISIL Research
Digitisation aided by technology to play pivotal role in growth of economy
Technology is expected to play an important role by progressively reducing the cost of reaching out to smaller
markets. India has seen a tremendous rise in fintech adoption in the past few years and has the highest fintech
adoption rate globally of 87% which is significantly higher than the global average rate of 64% (Source: InvestIndia).
Among many initiatives by the government, the Unified Payments Interface (UPI) is playing a pivotal role towards
financial inclusion. It provides a single-click digital interface across all system for smartphones linked to bank
accounts and facilitates easy transactions using a simple authentication method. The volume of digital transactions
has also seen a surge in the past few years, driven by increased adoption of UPI. Apart from financial services
industry, digitisation in other industries like retail will also play an important role in growth of economy.
UPI usage data statistics
As of month No of banks
live on UPI
Volume of transactions
(million)
Amount of transactions
(Rs. billion)
YoY growth (on value
basis) in transactions
(%)
March 2017 49 9 28 NA
March 2018 91 178 242 764%
March 2019 142 800 1,335 452%
March 2020 148 1,247 2,065 55%
January 2021 207 2,303 4,312 99%
February 2021 213 2,293 4,251 91%
March 2021 216 2,732 5,049 145%
April 2021 220 2,641 4,937 227%
May 2021 224 2,540 4,906 125%
47% 43% 37% 38%
10%11%
11% 11%
5% 5%5% 5%
7% 8%8% 8%
7% 8%9% 9%
24% 25% 30% 30%
0%
10%
20%
30%
40%
50%
60%
70%
80%
90%
100%
FY10 FY15 FY20 FY21
Top 8 districts Next 20 districts Remaining districts in top 50
Next 51-100 districts Next 100-200 districts Other districts

25
June 2021 229 2,808 5,474 109%
July 2021 235 3,248 6,063 109%
August 2021 249 3,556 6,391 114%
September 2021 259 3,654 6,544 99%
Source: National Payments Corporation of India (NPCI), CRISIL Research
Post demonetisation, cash in the economy is on the rise indicating untapped potential
Despite rise and digital payments enabled through strong growth of fintechs, cash in circulation in the country has
increased post demonetisation of high value currency notes in November 2015, indicating a predominant presence
of cash in the economy. This means that there is still a lot of untapped potential for offering technology-based
solutions and assisted digital solutions to customers to make their day-to-day life much easier.
Cash in circulation to GDP ratio (%)
Source: RBI, CRISIL Research
Rural economy
Rural economy is becoming structurally far more resilient…
At a time when the Indian economy has been severely impacted by the Covid-19 pandemic, the rural economy has
been a harbinger of hope.
The rural economy is far more resilient today due to two consecutive years of good monsoon, increased spends
under MNREGA and irrigation programmes, direct benefit transfer (DBT), the PM-Kisan scheme, PM Ujwala Yojana
for cooking gas, PM Awas Yojana for housing, and Ayushman Bharat scheme for healthcare. To supplement this,
there has been a continuous improvement in rural infrastructure such as electricity and roads. These government
initiatives have led to lesser leakages and higher incomes in the hands of the rural populace, thereby enhancing their
ability and willingness to spend on discretionary products and services.
13.916.0
12.6
17.621.4
23.527.6
11.1%11.6%
8.2%
10.3%11.3% 11.6%
14.0%
0.0%
2.0%
4.0%
6.0%
8.0%
10.0%
12.0%
14.0%
16.0%
0.0
5.0
10.0
15.0
20.0
25.0
30.0
FY15 FY16 FY17 FY18 FY19 FY20 FY21
(Rs trillion)
Cash in circulation Cash in circulation as a % of GDP
Demonetisation led to decrease in cash in fiscal 2017
CAGR: 12%

26
The structural changes, combined with a positive macro environment, will improve rural business prospects, provide
business opportunities for the banking and financial services sector and drive the long term growth of the economy.
….and has been relatively less impacted by Covid-19
The rural economy accounts for almost half of India’s GDP and has performed much better than urban India in the
aftermath of Covid-19. There are three reasons for this.
First, agricultural activity has continued largely unhindered, normal monsoons and lower spread of Covid-19 in rural
areas given the lower population density. Second, the government has pitched in with support by making available
an additional Rs 500 billion of funding towards the Mahatma Gandhi National Rural Employment Guarantee Act
(MNREGA) and also disbursing Rs 570 billion towards the PM-Kisan scheme. Third, the structure of the non-
agriculture rural economy has helped it bear the Covid-induced shock better. Rural economy contributes to 51% of
India’s manufacturing GDP, but the rural share in services GDP (excluding public administration, defence and utilities)
is much lower at around 26%. With services, with contact-based services being impacted more compared to
manufacturing post Covid-19, rural India’s relatively higher dependence on both manufacturing and agriculture has
helped partly buttress the impact of Covid-19.
Within the rural economy, agriculture itself is set to grow at ~2.5% on-year in fiscal 2021, close to its trend rate.
In large part, the strong agriculture growth will be borne out by the timely onset and well spread south-west monsoon.
This means a lot to Indian farmers, a majority of whom depend on rains for kharif sowing and production - that makes
up about half of India’s annual agricultural output.
Further, higher government procurement of food grains to support the Pradhan Mantri Garib Kalyan Anna Yojana,
also spurred higher production. Finally, an increase in minimum support prices (MSPs) promises better returns to
farmers.
Measures to counter the pandemic’s onslaught on growth
Reserve Bank of India goes all out to combat the crisis
The Monetary Policy Committee (MPC) of the Reserve Bank of India (RBI) slashed the repo rate by 115 basis points
(bps) to address financial market stress in the wake of the pandemic and the subsequent lockdown. In an unusual
move, the MPC also asymmetrically slashed the reverse repo initially by 90 bps and by another 25 bps and 40 bps
subsequently. The repo and reverse repo rates now stand at 4.00% and 3.35%, respectively. To tide over any
unwarranted volatility, the MPC also increased borrowing limits under the marginal standing facility (MSF) of the
liquidity adjustment facility window from 2% to 3%. The MSF rate now stands at 4.25% (down from 5.40%).
The RBI also announced a host of other measures to address financial market stress due to the pandemic / lockdown:
• Reducing debt servicing burden through moratorium period: The RBI initially permitted lending institutions
to allow a moratorium of three months on repayment of instalments for term loans outstanding as on March 1,
2020 and defer interest payments due on working capital facilities outstanding. The moratorium was further
extended by another three months till August 31, 2020. However, the banks were instructed to provide 10%
additional provisioning for availing this benefit, which could be later adjusted against the provisioning

27
requirements for actual slippages. These measures are intended to boost confidence in the economy and provide
relief to the borrowers
• Loan restructuring: The central bank constituted a committee which identified 26 sectors for restructuring which
included aspects related to leverage, liquidity and debt serviceability to be factored by the lending institutions
while finalising resolution plans for borrowers. However, only those borrower accounts would be eligible for
resolution which were classified as standard, but not in default for more than 30 days with any lending institution
as on March 1, 2020
• Enhancing liquidity: Apart from reducing repo and reverse repo rate, the RBI reduced the cash reserve ratio
(CRR) requirements of all banks by 100 bps to 3% of net demand and time liabilities (NDTL). Further, the
minimum daily CRR balance maintenance was reduced to 80% from 90% till June 26, 2020. In view of the
exceptionally high volatility in domestic financial markets, the RBI also increased MSF borrowing limit from 2%
to 3% of bank’s NDTL up to June 30, 2020
• Supporting financial market liquidity: The RBI initially announced targeted long-term repo operations
(TLTROs) of up to three years’ tenure for a total of up to Rs 1 trillion. Liquidity availed under the scheme by banks
had to be deployed in investment grade corporate bonds, commercial paper, and non-convertible debentures.
Subsequently, TLTROs worth Rs 500 billion were announced specifically for non-banking financial companies
(NBFCs) and micro finance institutions (MFIs), with 50% targeted towards small and mid-sized firms. Investments
made by banks under this facility would be classified as held to maturity (HTM), and also be excluded under the
large exposure framework. In addition, the government announced a Rs 450 billion partial credit guarantee
scheme and Rs 300 billion special liquidity scheme, aimed at addressing the concern over credit risk perception
on mid and small size non-banks.
• Pushing credit growth: The RBI decided to postpone the implementation of net stable funding ratio to October
1, 2021 to encourage banks to lend in these challenging times. Deferring the last tranche of capital conservation
buffer to October 1, 2021 was also a step in the same direction. The central bank also announced Rs 500 billion
refinancing facility for NABARD (Rs 250 billion), SIDBI (Rs 150 billion) and NHB (Rs 100 billion) to increase credit
availability to microfinance, micro, small and medium enterprises (MSMEs) and the housing sector
• Addressing rupee volatility: Banks in India which operate International Financial Services Centre banking units
have been allowed to participate in the Non-deliverable Forward (NDF) market with effect from June 1, 2020
• Regulatory changes: With regards to the moratorium provided on loans, the RBI clarified these measures would
not result in asset quality downgrade, nor would it affect the credit history of borrower
• Measures during second wave of Covid-19: On May 5, 2021, RBI announced several measures to protect
small and medium businesses, individual borrowers from the adverse impact of the intense second wave of
Covid-19 across the country. RBI also made provisions for banks to advance loans to businesses and restructure
loans for enhancing liquidity in the system to help mitigate the crisis. Restructuring framework 2.0 was announced
wherein individuals, small businesses and MSMEs having aggregate exposure of up to Rs 250 million, who have
not availed restructuring under any of the earlier restructuring frameworks (including under the Resolution
Framework 1.0 dated August 6, 2020), and who were classified as ‘Standard’ as on March 31, 2021 are eligible
to be considered. Restructuring under the proposed framework may be invoked up to September 30, 2021 and

28
shall have to be implemented within 90 days after invocation. Further, for small businesses and MSMEs
restructured earlier, banks and NBFCs have also been permitted, as a one-time measure, to review the working
capital sanctioned limits, based on a reassessment of the working capital cycle, margins, etc. The RBI also
permitted modification of plans under Restructuring framework 1.0 by increasing the period of moratorium and/or
extending the residual tenor up to a total of 2 years.
Additionally, the RBI incentivised small finance banks (SFBs) to increase credit flow to small borrowers in two
ways: one, by opening a special long-term repo operation (SLTRO) window of Rs. 100 billion for small finance
banks (SFBs) for extending loans of up to Rs. 1 million to individuals and small businesses; and two, by
classifying on-lending by SFBs to small MFIs with assets as less than Rs. 5 billion as priority sector lending.
In June 2021, the RBI further enhanced the exposure limit for availing restructuring under restructuring framework
2.0 from Rs. 250 million to Rs. 500 million.
‘Aatmanirbhar’ package is a timely relief amid the pandemic
Liquidity boost for NBFCs
The government announced a Rs 450 billion partial guarantee scheme (for NBFCs) and Rs 300 billion special liquidity
scheme for NBFCs, housing finance companies (HFCs) and MFIs, aimed at covering the concern of credit risk
perception on mid and small size non-banks.
Change in MSME definition
To bring in more enterprises under the ambit of MSMEs and the relief package being offered by the regulator, the
government revised the MSME investment limit across each category and introduced an alternate/additional criteria
of turnover buckets to the definition. It further helped remove the difference between the definition of manufacturing
based and services based MSMEs. Given below is the composite revised definition of MSMEs in comparison to the
old existing one:
Existing and revised definitions of MSMEs
Existing MSME classification
Criteria : Investment in plant and machinery or equipment
Classification Micro Small Medium
Manufacturing
enterprises
Investment < RS 2.5
million
Investment < Rs 50
million
Investment < Rs 100
million
Services enterprises Investment < Rs 1 million Investment < Rs 20
million
Investment < Rs 50
million
Revised MSME classification
Composite Criteria : Investment and annual turnover
Classification Micro Small Medium
Manufacturing and
Services enterprises
Investment < Rs 10
million and Turnover < Rs
50 million
Investment < Rs 100
million and Turnover
< Rs 500 million
Investment < Rs 500
million and Turnover <
Rs 2.5 billion
Source: Ministry of MSME, CRISIL Research

29
Collateral-free loans to MSMEs (Rs 3 trillion)
Banks and NBFCs are directed to offer up to 20% of entire outstanding credit to MSMEs. MSMEs with up to Rs 250
million outstanding credits and Rs 1 billion turnover are eligible for these loans. It will have four-year tenure with a
moratorium of 12 months on principal payment and can be availed till October 31, 2020. The government will provide
complete credit guarantee cover to lenders on principal and interest amount.
Subordinate debt to MSMEs (Rs 200 billion)
The government is also facilitating the provision of Rs 200 billion as subordinate debt for stressed assets of MSMEs.
It will also provide Rs 40 billion as partial credit guarantee support to banks for lending to MSMEs.
Equity infusion in MSMEs (Rs 500 billion)
The government has committed to infuse Rs 500 billion in equity of MSMEs having growth potential and viability. It
will also encourage MSMEs to list on stock exchanges.
Clearing MSME dues; guarantee scheme
The government has requested central public sector enterprises to release all pending MSME payments within 45
days. It will boost transaction-based lending by fintech enterprises. Under the Emergency Credit Line Guarantee
Scheme (ECLGS), banks will offer Rs 3 trillion government guaranteed loans to MSME borrowers that are not non-
performing assets (NPAs) to address short-term liquidity concerns and boost the MSME sector.
Global tenders disallowed up to Rs 2 billion
The government will not allow foreign companies in government procurement tenders of value up to Rs 2 billion. This
is likely to ease the competition faced by the MSMEs against foreign companies.
Loan interest subvention scheme (Rs 15 billon)
Under this scheme, the government has provided 2% interest subvention for loans given under Mudra-Shishu
scheme. These loans are up to the ticket size of Rs 50,000 and are mostly given by NBFC-MFIs benefiting low
income groups customers.
Special credit facility for street vendors (Rs 50 billon)
The government announced this scheme to facilitate easy access of credit to street vendors to offset the adverse
effect of pandemic on their livelihoods.
‘Aatmanirbhar 3.0’ stimulus package rolled out to boost economy in November 2020
The finance minister, on November 12, 2020, announced a stimulus package. Under the package, 12 stimulus
measures were rolled out to boost employment in the formal and informal economy, help housing infrastructure,
enhancing ease of doing business, extending the deadline for the Credit Line Guarantee Scheme, etc. The
announcement was made a day after the government announced a Rs 2 trillion production-linked incentives (PLIs)
scheme for boosting identified manufacturing sectors. The government also announced some fresh projects,
collaterally boosting employment in the country.
An additional outlay of Rs 180 billion for PM Awaas Yojana (PMAY) Urban was announced, which will help ground
1.2 million houses and complete 1.8 million houses. The move is expected to create additional 7.8 million jobs and
improve production and sale of steel and cement, resulting in a multiplier effect on the economy. Stimulus packages
worth Rs. 2.65 trillion were announced by the government.

30
Following are the twelve announcements made in the Aatmanirbhar 3.0 stimulus package:
1. Aatmanirbhar Bharat Rozgar Yojana: Aatmanirbhar Bharat Rozgar Yojana, operational during October 1, 2020 to
June 2021 to incentivise creation of new employment opportunities during COVID recovery phase.
2. Emergency credit line guarantee scheme 2.0: Launch of an emergency credit line guarantee scheme 2.0 for
guaranteed credit to 26 stressed sectors. Tenure of additional credit under ECLGS 2.0 to be 5 years, including 1
year of moratorium on principal repayment. Emergency credit line guarantee scheme extended till March 31 2021.
3. PLI scheme: Introduction of the PLI scheme in 13 key sectors for enhancing India’s manufacturing capabilities
and exports.
4. PMAY – Urban: Rs 180 billion will be provided over the Budged Estimates for 2020-21 for PM Awaas Yojana
(PMAY) - Urban through additional allocation and extra-budgetary resources. This is over and above Rs 80 billion
already budgeted this year.
5. Support for construction and infrastructure - Relaxation of earnest money deposit (EMD) and performance security
on government tenders.
• Performance security on contracts to be reduced to 3% instead of 5-10%
• EMD will not be required for tenders and will be replaced by Bid Security Declaration
• Relaxations will be given till December 31, 2021
6. Demand booster for residential real estate income-tax relief for developers and home buyers: Increase in the
differential from 10% to 20% for the period from the date of the announcements to June 20, 2021 for only primary
sale of residential units of value up to Rs 2 billion.
7. Government will invest Rs 60 billion as equity in the NIIF debt platform. Infra project financing of Rs 1.1 trillion
will be provided by the government.
8. Government will provide support to farmers with Rs 650 billion for subsidised fertilisers
9. Boost for the rural employment -Enhanced outlays under PM Garib Kalyan Rozgar Yojana: Rs 400 billion was
additionally provided in Atmanirbhar Bharat 1.0. Further outlay of Rs 100 billion to be provided for PM Garib
Kalyan Rozgar Yojana in the current fiscal.
10. Boost for exports - Rs 30 billion to EXIM Bank for lines of credit: Rs 30 billion will be released to EXIM Bank for
promotion of project exports through lines of credit under the IDEAS scheme.
11. Capital and industrial stimulus: Rs 102 billion additional budget outlay will be provided towards capital and
industrial expenditure.
12. Research and development grant for Covid-19 vaccine development: Rs 9 billion provided for Covid Suraksha
Mission for research and development of an Indian Covid-19 vaccine to the Department of Biotechnology

31
‘Kamath Committee’ identifies 26 sectors for loan restructuring
On August 7, 2020, the RBI announced the constitution of a committee under the chairmanship of KV Kamath to
make recommendations on the required financial parameters for a ‘Resolution framework for Covid-19 related stress.
On September 4, the committee submitted the report which included aspects related to leverage, liquidity and debt
serviceability for 26 sectors which could be factored by the lending institutions while finalising a resolution plan for a
borrower. However, only those borrower accounts would be eligible for resolution which were classified as standard,
but not in default for more than 30 days with any lending institution as on March 1, 2020. Under this framework, the
resolution may be invoked not later than December 31, 2020 and must be implemented within 90 days from date of
invocation for personal loans and 180 days for other exposures.
Scope of ECLGS Scheme further expanded post the covid-19 wave
Recently in September 2021, with a view to support various businesses impacted by the second wave of COVID 19
pandemic, the timeline for Emergency Credit Line Guarantee Scheme (ECLGS) has been extended till March
2022 or till guarantees for an amount of Rs 4.5 lakh crore are issued under the scheme, whichever is earlier. Further,
the last date of disbursement under the scheme has also been extended to June 2022. As of September 24, 2021,
loans sanctioned have crossed Rs 2.86 trillion under the scheme.
In June 2021, the government increased the overall admissible guarantee limit from Rs 3.0 trillion to Rs 4.5 trillion.
Along with this, the limit of admissible guarantee and loan amount is increased from 20% to 40% of outstanding for
Covid-affected sectors like Hospitality sector, Travel & Tourism sector, Leisure & Sporting sector and Civil Aviation
sector, subject to a maximum of Rs.200 crore per borrower.
Earlier, in May 2021, the Government announced the following further modifications to the ECLGS scheme:
• The scope was expanded to cover loans up to Rs. 20 million to hospitals/nursing homes/clinics/medical
colleges for setting up on-site oxygen generation plants with interest rate capped at 7.5%
• Additional ECLGS assistance of up to 10% of the outstanding loans as on February 29, 2020 to borrowers
covered under ECLGS 1.0 was allowed
• Civil Aviation sector was included in the list of sectors covered
• Ceiling of Rs. 5 billion of loan outstanding for eligibility under ECLGS 3.0 was removed, subject to
maximum additional ECLGS assistance to each borrower being limited to 40% or Rs. 2 billion, whichever is
lower
• Borrowers who had availed loans under ECLGS 1.0 of overall tenure of 4 years comprising of repayment
of interest only during the first 12 months with repayment of principal and interest in 36 months were
allowed to increase the tenure to 5 years (repayment of interest only for the first 24 months with repayment
of principal and interest in 36 months thereafter)
Earlier, in March 2021, the Government had made the following modifications to the scheme

32
• The scope of ECLGS was expanded to cover business enterprises in hospitality, travel & tourism, leisure &
sporting sectors which had, as on February 29, 2020, total credit outstanding not exceeding Rs. 5 billion
and were less than or equal to 60 days past due as on that date.
• The validity of ECLGS was extended up to June 30, 2021 or till guarantees for an amount of Rs. 3 trillion
are issued.
Key structural reforms: Long-term positives for the Indian economy
Financial inclusion
According to the World Bank’s Global Findex Database 2017, the global average of adult population with an account
(with a bank, financial institution, or mobile money providers) was ~69% in 2017. India’s financial inclusion has
improved significantly between 2014 and 2017, with the adult population with bank accounts rising from 53% (as per
Global Findex Database 2014) to 80% in 2017 with concerted efforts by the government to promote financial inclusion
and the proliferation of supporting institutions.
As per the Global Findex Database 2017, ~50% of the world’s unbanked adults are in India, Bangladesh, China,
Indonesia, Mexico, Nigeria and Pakistan. Of the world’s total unbanked adults (~1.7 billion), 415 million are from just
two countries – India (11% or 190 million) and China (13% or 225 million), because of their huge population.
The two key initiatives launched by the government to promote financial inclusion are the Pradhan Mantri Jan Dhan
Yojana (PMJDY) and Pradhan Mantri Jeevan Jyoti Bima Yojana (PMJJBY). Under the PMJDY, the government’s
aim is to ensure that every household in India has a bank account which they can access from anywhere and avail
of all financial services such as savings and deposit accounts, remittances, credit and insurance affordably. PMJJBY
is a one-year life insurance scheme that offers a life cover of Rs 0.2 million at a premium of Rs 330 per annum per
member, which can be renewed every year. The government has also launched the Pradhan Mantri Suraksha Bima
Yojana (PMSBY), which is an accident insurance policy and offers an accidental death and full disability cover of Rs
0.2 million at a premium of Rs 12 annually. As per the Government of India, more than 100 million people have
registered for these two social security schemes.
Pradhan Mantri Jan Dhan Yojana (PMJDY) launched in August 2014, is aimed at ensuring ensure that every
household in India has a bank account which they can access from anywhere and avail of all financial services such
as savings and deposit accounts, remittances, credit and insurance affordably. PMJDY focuses on household
coverage compared with the earlier schemes that focused on coverage of villages. It aims to extend banking facilities
to all within a reasonable distance in each sub-service area (consisting of 1,000-1,500 households) across India.
As on March 31, 2021, 422 million PMJDY accounts had been opened, of which, 66% were in rural and semi-urban
areas, with total deposits of Rupees 1,456 billion.
GST implementation
Introduced on July 1, 2017, the GST is an indirect tax regime that subsumed multiple cascading taxes levied by the
central and state governments. Its implementation has spawned structural changes in the supply chain and logistics
network in the country. The crux of the GST mechanism is input tax credit, which ensures more players in the supply

33
chain come under the tax ambit. As supply from only registered taxpayers will get input tax credit, businesses and
stakeholders will insist on registration of their suppliers and traders, leading to an increase in the share of organised
participants. The GST regime has been stabilising fast and is expected to bring more transparency and increase in
formalisation, eventually leading to higher economic growth.
PLI scheme to boost manufacturing in the long run
The government has budgeted ~Rs 2 trillion to give incentives to the local manufacturing units in 13 key sectors. The
key sectors likely to get benefit from the scheme include automobiles, pharma, telecom, electronics, food, textile,
steel and energy. By incentivising production subject to achieving the desired scale, the scheme aims to spawn a
handful of globally competitive large scale manufacturing units in the identified sectors. Furthermore, the government
also hopes to reduce India's dependence on raw material imports from China. The scheme is expected to provide a
boost to economic growth over the medium-term and create more employment opportunities as many of these sectors
are labour intensive in nature.
Broad Sector Segment Budgeted (Rs. Bn)*
Automobiles
Advance Chemistry Cell (ACC) Battery 181 441
Automobiles & auto components 260
Electronics
Mobile manufacturing and specified electronic Components
409
521 Electronic/technology products 50
White goods (ACs & LED) 62
Pharma and medical equipment
Critical key starting materials/drug intermediaries and active pharmaceutical ingredients
69
253 Manufacturing of medical devices. 34
Pharmaceuticals drugs 150
Telecom Telecom & networking products 122 122
Food Food products 109 109
Textile Textile products: MMF segment and technical textiles 107 107
Steel Speciality steel 63 63
Energy High efficiency solar PV modules 45 45
Total 1662
*Approved financial outlay over a five-year period
Source: Government websites; CRISIL Research
IBC a key long-term structural positive
The Insolvency and Bankruptcy Code (IBC) is a reform that will structurally strengthen the identification and resolution
of insolvency in India. The IBC enhances the credit enforcement structure and provides certainty around the
timeframes for insolvency resolution. It attempts to simplify legal processes, preserve value for creditors and provide
them with greater certainty of outcome. With this reform, the RBI has sent a strong signal to borrowers to adhere to
credit discipline and also encourage banks to break resolution deadlocks by introducing definite timelines. IBC will
enhance investors’ confidence when investing in India. Internationally, recovery rates have improved significantly
after the implementation of bankruptcy reforms, as can be seen in the following table:

34
Country Year of bankruptcy
reform
Pre-reforms Five years post-reforms
Recovery rate (%) Time (years) Recovery rate (%) Time (years)
Brazil 2005 0.2 10.0 17.0 4.0
Russia 2009 28.2 3.8 42.8 2.0
China 2007 31.5 2.4 36.1 1.7
India 2016 26.0 4.3 43* 1.6*
Note: * As of 2019
Source: World Bank, CRISIL Research
Reduction in corporate tax rates to boost capital base of financial institutions
On September 20, 2019, the Finance Minister announced Taxation Laws (Amendment) Ordinance 2019 to make
certain amendments in the Income Tax Act, 1961, to allow any domestic company an option to pay income tax at the
rate of 22%, subject to the condition that they will not avail of any exemption/incentive. The effective tax rate for these
companies will be 25.17% inclusive of surcharge and cess. Also, such companies will not be required to pay minimum
alternate tax.
A company that does not opt for the concessional tax regime and avails of the tax exemption/incentive will continue
to pay tax at the pre-amended rate. However, these companies can opt for concessional tax regime after expiry of
their tax holiday/exemption period. After the exercise of the option they will be liable to pay tax at the rate of 22% and
the option, once exercised, cannot be subsequently withdrawn. Further, in order to provide relief to companies which
continue to avail of exemptions, the rate of minimum alternate tax has been reduced from 18.5% to 15%.
In addition, to stabilise the flow of funds in the capital market, the provision of not applying additional surcharge as
per the Finance Act, 2019, on capital gains arising out of sale of equity share in a company or unit of equity oriented
fund or business trust liable for securities transaction tax, in the hands of an individual, Hindu undivided family (HUF),
association of persons (AOP), body of individuals (BOI) and artificial judicial person (AJP). The enhanced surcharge
will also not apply to capital gains on sale of any security, including derivatives, in the hands of foreign portfolio
investors. Also, to provide relief to listed companies that have announced share buyback before July 5, 2019, tax on
the buyback of shares will not be charged as per these latest amendments.
The recent amendments could boost the capital base of the financial institutions and help revive growth in the financial
services sector, which has been battling with high NPAs, increasing defaults and liquidity concerns. This move could
also revive the private capex cycle leading to credit growth in the economy.
Household savings to increase
India’s slowing economy took a toll on much-needed savings too, with the savings rate touching a 15-year low, and
household savings also falling. This has weakened India’s macro-economic position which is already hobbled by low
investment and rising external borrowing to fund capital needs. Household savings also declined as consumers spent
more in purchasing durables and travelling. Indian households contribute to about 60% of the country’s savings. But
India remains favourable compared with emerging market peers such as Brazil.
According to World Bank, the savings rate, or the proportion of gross domestic savings (GDS) in GDP in the Indian
economy has trended down in the past decade. India’s GDS peaked at 36.8% of GDP in fiscal 2008 and dipped to

35
32.0% in fiscal 2009. That was largely on account of a sharp slowdown in public savings, as the government resorted
to fiscal stimulus to address the external shock from global financial crisis (GFC).
CRISIL Research expects India to continue being a high savings economy. However, household savings as a
percentage of GDP has been sliding since fiscal 2012, with its share in total savings falling significantly from 23.6%
in fiscal 2012 to 18.0% in fiscal 2016. The household savings as % of GDP rose to 19.6% in fiscal 2020. CRISIL
Research expects the household savings to increase further on account of expected decline in discretionary spending
during the pandemic. However, the absolute amount of savings might not increase at the same pace since the GDP
growth is estimated to decline by 7.3% in fiscal 2021.
We are also sanguine on savings rate increasing in the medium-term, as households become more focused post the
pandemic-induced uncertainty and start saving for the future.
Savings rate has increased marginally in fiscal 2020
Note: E: Estimated
Source: Ministry of Statistics and Programme Implementation (MOSPI), RBI, CRISIL Research
Gross Domestic Savings rate: India vs other countries (2019)
Source: World Bank, Handbook of Statistics on Indian Economy 2018-19, RBI, MOSPI, CRISIL Research
22.4%
23.6%
25.2%
23.1%23.6%
22.5%
20.3%19.6%
18.0% 18.1%
19.3% 19.3% 19.6%
15%
17%
19%
21%
23%
25%
27%
FY08 FY09 FY10 FY11 FY12 FY13 FY14 FY15 FY16 FY17 FY18 FY19 FY20
Household Savings (% of GDP)
55%
47%
35% 35%31% 30% 28%
25% 25% 24% 23%19% 18% 16% 16%
0%
10%
20%
30%
40%
50%
60%
Sin
gapore
Ch
ina
Kore
a
Sw
itzerland
Ma
laysia
India
Germ
any
Worl
d
Austr
alia
Me
xic
o
Fra
nce
South
Afr
ica
US
Bra
zil
UK

36
Total credit to households on GDP: India vs other countries (Q4FY21)
*All reporting countries
Source: Bank of International Settlements, CRISIL Research
Gross domestic savings trend
Parameters (Rs billion) Mar-13 Mar-14 Mar-15 Mar-16 Mar-17 Mar-18 Mar-19 Mar-20
GDS 33,692 36,082 40,200 42,823 48,251 54,807 57,770 63,860
GDP (At current prices) 99,440 1,12,335 1,24,680 1,37,719 1,53,917 1,70,900 1,88,870 2,03,510
Percentage of GDP 33.9% 32.1% 32.2% 31.1% 31.3% 32.1% 30.6% 31.4%
Household sector savings* 22,353 22,853 24,391 24,749 27,871 32,966 36,465 39,908
Percentage of GDP 22.5% 20.3% 19.6% 18.0% 18.1% 19.3% 19.3% 19.6%
Gross financial savings 10,640 11,908 12,572 14,962 16,147 20,564 21,341 22,846
Financial liabilities 3,304 3,587 3,768 3,854 4,686 7,507 7,784 6,641
Savings in physical assets 14,650 14,164 15,131 13,176 15,946 19,442 22,481 23,272
Savings in the form of gold
and silver ornaments 367 368 456 465 465 467 427 431
*Net financial savings, savings in physical assets and in the form of gold and silver ornaments
Note: The data is for financial year ending March; Physical assets are those held in physical form, such as real estate, etc.
Source: MOSPI, National Accounts National Accounts Statistics, CRISIL Research
Household savings growth
Note: The data is for financial year ending March
Source: MOSPI, CRISIL Research
Private final consumption expenditure (PFCE) has grown ~7% over fiscal 2014-20
133 124104
9080 76 71 69 62 59 55
38 37 3617
Sw
itzerland
Au
str
alia
Kore
a
Un
ite
dK
ingdom
Un
ite
d S
tate
s
Ma
laysia
Wo
rld
Fra
nce
Ch
ina
Germ
any
Sin
gapore
India
Bra
zil
South
Afr
ica
Me
xic
o
20,656 22,353 22,853
24,391 24,749 27,871
32,966 36,465
39,908
FY12 FY13 FY14 FY15 FY16 FY17 FY18 FY19 FY20
Rs billion

37
Source: RBI, CRISIL Research
Share of physical savings to remain stable in the wake of Covid
While households’ savings in physical assets has declined to 58% in fiscal 2020 from 67% in fiscal 2012, financial
savings has witnessed an uptrend to 41% in fiscal 2020 from 31% in fiscal 2012.
With volatility in the financial markets post Covid and the prevalent lower rates of return in the fixed income products
on account of accommodative stance of the central bank, sizeable proportion of savings is expected to continue to
remain in physical assets. Along with increase in financial literacy, the relative outperformance of financial assets
over recent years, and the government’s efforts to fight shadow economy activity, we expect the share of financial
assets as a proportion of net household savings to increase over the next five years. The rise in financial assets will
further boost the investment under mutual funds.
Note: The data is for financial year ending March
Source: Handbook of Statistics on Indian Economy 2018-19, RBI, MOSPI, CRISIL Research
Digitisation: Catalyst for the next growth cycle
Technology is expected to play a pivotal role in taking the financial sector to the next level of growth, by helping
surmount the challenges stemming from India’s vast geography, which makes physical footprints in smaller locations
commercially unviable. Technology is conducive for India, considering its demographic structure where the median
56 59 64 69 74 79 83
FY14 FY15 FY16 FY17 FY18 FY19 FY20
(Rs trillion)
Private final consumption expenditure (PFCE)
31% 33% 36% 36%45% 41% 40% 37% 41%
67% 66% 62% 62%53% 57% 59% 62% 58%
2% 2% 2% 2% 2% 2%1% 1% 1%
FY12 FY13 FY14 FY15 FY16 FY17 FY18 FY19 FY20
% of net household savings
Financial savings(Net) Savings in Physical assest Savings in form of gold and silver

38
age is less than 30 years. The young population is tech savvy and at ease with using it to conduct the entire gamut
of financial transactions. With increasing smartphone penetration and faster data speeds, consumers are now
encouraging digitisation as they find it more convenient. Digitisation will help improve efficiency and optimise cost.
Players with better mobile and digital platforms will draw more customers and emerge as winners in the long term.
In August 2020, RBI has announced a new licence for NUE (new umbrella entity) for retail payments. These NUEs
will innovate and compete with NPCI in setting up and managing new payment systems in the retail space.
Mobile and internet penetration: Higher mobile penetration, improved connectivity and faster and cheaper data
speed, supported by Aadhaar and bank account penetration have led India to shift from being a cash-dominated
economy to a digital one.
Data-savvy and younger users to drive adoption of smartphones
Note: P: Projected
Source: CRISIL Research
Data subscribers as a proportion of wireless subscribers to increase significantly through FY25
Note: E: Estimated, P: Projected
Source: Telecom Regulatory Authority of India (TRAI), CRISIL Research
19% 25% 30%38% 42% 48%
58% 60% 63% 64% 65%
81% 75% 70%62% 58% 52%
42% 40% 37% 36% 35%
FY15 FY16 FY17 FY18 FY19 FY20 FY21 FY22P FY23P FY24P FY25P
Smartphone installed base Feature phone installed base
31%34%
40%
53%
62% 64%
74%78%
87%90%
0%
10%
20%
30%
40%
50%
60%
70%
80%
90%
100%
FY16 FY17 FY18 FY19 FY20 FY21 FY22P FY23P FY24P FY25P

39
Rise in 4G penetration and smartphone usage
The digital revolution has paved the way for digital payments. India had 1,181 million wireless subscribers as of
March 31, 2021, and the number is growing at a steady pace every year. The reach of mobile network, internet and
electricity is also expanding the digital payments footprint to remote areas. This is likely to increase the number of
digital payment transactions.
All-India mobile and data subscriber base
FY16 FY17 FY18 FY19 FY20 FY21P FY22P FY23P FY24P FY25P
Wireless subscribers
(million) 1034 1170 1183 1162 1157 1181 1178 1191 1195 1203
Data subscribers (million) 322 401 473 615 720 756 860 925 1042 1077
Data subscribers as a
proportion of wireless
subscribers
31% 34% 40% 53% 62% 64% 74% 78% 87% 90%
4G data subscribers
(million) 8 131 287 478 645 719 842 901 1022 1070
4G data subscribers
proportion 2% 33% 61% 78% 90% 95% 98% 97% 98% 99%
Note: E: Estimated, P: Projected
Source: TRAI, CRISIL Research
Mobile data consumption in India has grown ~25 times in the past five fiscals at a CAGR of ~90%. The proportion of
data subscribers is hence expected to rise to ~90% in fiscal 2025 from ~62% at FY 20. India's 4G data rates is at the
lower end in the world. So, a combination of affordable handsets, growing consumer preference for data on the go
and affordable data tariffs are set to accelerate the adoption of wireless internet in India, leading to a 4G data
subscriber proportion at ~100%.
According to Bank of International Settlements, digital payments and per capita transactions in India is low as
compared with similar countries. The government has taken multiple initiatives to give a boost to digitalisation in the
country. This includes biometric identification of all Indian citizens through the Aadhaar programme, financial
inclusion through the ‘Jan Dhan Yojana’, launch of Aadhaar-enabled payment systems, and push to online tax filings.
UPI, which is based on the immediate payment service or IMPS platform, allows a user to transfer money from one
bank account to another bank account instantly, and is seen as the next big leap in digital payments. Recent initiatives
aimed at addressing the structural issues around lending requirement including GST filings, government launched
UPI 2.0.

40
Number of non-cash payments transactions per capita, per annum (CY 2019)
Source: Bank of International Settlements, CRISIL Research
Consumers are increasingly finding transacting through mobile convenient. CRISIL Research expects the share of
mobile banking and prepaid payment instruments to increase dramatically over the coming years. In addition, CRISIL
Research expects improved data connectivity, low digital payment penetration and proactive government measures
to drive digitalisation in the country, transforming it into a cashless economy.
Government initiatives that have driven digital payments in India
The payments space has seen rapid innovation in the past few years, led by government and regulatory initiatives
and changing consumer preferences. JAM (Jan Dhan, Aadhaar and Mobile), demonetisation of high-value currency
notes in November 2016, implementation of GST and unveiling of the Unified Payments Interface, or UPI, are some
of the notable regulatory initiatives that have spurred growth in the space.
The Digital India programme is a flagship programme of the Government of India with a vision to transform India into
a digitally empowered society and knowledge economy. “Faceless, Paperless, Cashless” is one of professed aims
of Digital India. Promotion of digital payments has been accorded highest priority by the Government of India to bring
each and every segment of our country under the formal fold of digital payment services. The Vision is to provide
facility of seamless digital payment to all citizens of India in a convenient, easy, affordable, quick and secured manner.
Aadhaar: Aadhaar, which literally means foundation, is a 12-digit unique identity number issued to Indians based on
their biometric and demographic data. It is the world’s largest biometric ID system, with over 1.2 billion enrolled
members as of June 19, 2018. Over 99% of the citizens aged 18 and above are now enrolled.
Data collection for Aadhaar is done by the Unique Identification Authority of India under the Ministry of Electronics
and Information Technology. Application programming interfaces (APIs) have been developed using Aadhaar to
launch payment systems that allow real-time transactions with just a mobile phone.
It also enables the completion of an electronic KYC (know your customer) and the download of digital signatures.
With bank accounts, driving licence and mobile phone linked, an Aadhaar card is the most important identification
card and has several key benefits.
24
197223
313
484523
0
100
200
300
400
500
600
India Brazil China Russia UK USA

41
JAM Trinity - Government on its side introduced JAM Trinity (Jan Dhan, Aadhaar and Mobile) in fiscal 2014 to
integrate these infrastructure and digital financial inclusion. With this, the government improved its focus to provide
easy access of banking facilities and enhance ability to digitize transactions. This expanded use of digital payments
by the government for welfare and served as the biggest launchpad of the ambitious reform of Direct Benefit Transfer
(DBT). The government has transferred more than Rs 3.8 trillion in fiscal 2020 through 426 schemes. As of February
2021, total amount transferred through DBT has reached Rs 14.2 trillion.
Source: DBT, CRISIL Research
Demonetisation: On November 8, 2016, the Government of India announced the demonetisation of Rs 500 and Rs
1,000 notes in order to curb black money, corruption, counterfeit currency and terror funding. This has led to increase
in transparency, formalisation and digitisation in the country. Customer preference has shifted from cost factors to
convenience and ease of performing transactions. Several payment processing firms and FinTech companies
leveraged demonetisation to penetrate the market. In an effort to expand their market share and attract customers,
many players offered loyalty points, instant cashbacks and referral rewards to their users which further fuelled
customer acceptance towards digital modes of payments and transactions.
UPI - A crucial contributor to the Indian digital payments market was the introduction of India’s real-time payments
platform, Unified Payments Interface (UPI). In 2016, National Payments Corporation of India (NPCI), the country’s
umbrella organization for payments and the central infrastructure that was created by the Reserve Bank of India
(RBI) and Indian Banks Association (IBA), introduced a method called UPI – Unified Payments Interface. This
collaborative effort was focused on making India a cashless economy and driving digital payment inclusion.
UPI is a payments system that facilitates instant fund transfer between two bank accounts on a mobile platform,
without requiring any detail of the beneficiary’s bank account. UPI, which is based on the immediate payment service
or IMPS platform, allows a user to transfer money from a bank account to another bank account instantly, making it
simpler from a customer perspective. It supports both Peer-to-Peer (P2P) and Peer-to-Merchant (P2M) financial
transactions, as well as various other value-added non-financial transactions like real-time balance check and
transaction history, to name a few.
59 142437 440 426 318
619 747
1,909
3,298
3,816
4,316
0
500
1000
1500
2000
2500
3000
3500
4000
4500
5000
FY16 FY17 FY18 FY19 FY20 FY21
Number of DBT schemes Funds transferred (In Rs bn)

42
Role of RBI – RBI plays a pivotal role in monitoring and supervising the payments system in India. The Payment and
Settlement Systems Act, 2007 provides for the regulation and supervision of payment systems in India. The Act
empowers RBI to supervise the payment systems in India. Reserve Bank has been continuously setting goals and
targets in the form of Payment Systems Vision document, every three years since 2001, presenting the road map for
improving the payment systems of our nation. Empowering every Indian with access to a bouquet of e-payment
options that is safe, secure, convenient, quick and affordable is Reserve Bank's Payment System's Vision for 2019-
2021.
In September 2016, the RBI had proposed setting up of an account aggregator. These account aggregators would
provide granular insights into customers’ financial assets or their borrowing history with the requisite consent. The
four major financial regulators — RBI, Insurance Regulatory and Development Authority (IRDA), Pension Fund
Regulatory and Development Authority (PFRDA) and Securities and Exchange Board of India (SEBI) – came together
to allow regulated entities under their control to share data with account aggregators after taking user consent. This
framework will lead to significant reduction in loan processing time and costs as financial data can be shared digitally.
Role of NPCI - RBI has authorized various Payment System Operators (PSOs) such as NPCI, CCIL, ATM networks,
TReDS platform providers, to name a few, to operate payment systems in India. National Payments Corporation of
India (NPCI) was established in 2008 by RBI and Indian Banks’ Association as an umbrella organization for operating
retail payment systems in India. The role of NPCI is to provide infrastructure to the banking system in India for physical
and electronic payment systems. NPCI has rolled out a variety of innovative retail payment products viz., IMPS,
RuPay card scheme, UPI, NACH, Aadhaar-enabled Payments System (AePS), Aadhaar Payments Bridge System
(APBS), NETC, *99# (USSD based) and BBPS. Further, NPCI's alliance with international network partners (Discover
Financial Services, Japan Credit Bureau and China Union Pay) has paved the way for international acceptance of
RuPay.
Increasing share of digital channels in domestic monetary transactions
The share of different channels in domestic money transfer has changed significantly over the past five years. Banks,
for example, are witnessing a change in customer behaviour with fewer customers visiting bank branches for
transactions. This change in behaviour was led by demonetisation when cash transactions slowed down, many new
accounts were opened and digital banking witnessed a surge in use and continued its growth trajectory. The
preference has also shifted from cost factors to convenience and ease of performing transactions, which helps in
saving time spent in queues, not disturbing the daily working hours and avoiding any potential monetary loss.

43
Transactions in volume terms
Note: P: Projected; Digital transactions includes RTGS – excluding interbank clearing, ECS, NEFT, IMPS, NACH, cards and prepaid instruments;
Non-digital transactions include cheques/paper clearing and ATM transactions. Amount above each bar indicates volume of transactions in the
year.
Source: RBI, CRISIL Research
Transactions in value terms
Note: P: Projected; Digital transactions includes RTGS – excluding interbank clearing, ECS, NEFT, IMPS, NACH, cards and prepaid instruments;
Non-digital transactions include cheques/paper clearing and ATM transactions Amount above each bar indicates value of transactions in the year.
Source: RBI, CRISIL Research
Fintech industry in India
Fintechs today are on top of the mind of traditional financial institutions as they watch traditional business models
change, and increasingly deliberate whether to collaborate or compete with fintech. The term Fintech is used to
describe firms that leverage technology, data, and business insights to provide various financial products and
services to customers. The business model of fintech firms differ widely but in almost all cases they use technology
25% 30%39%
50%59% 62%
77%92%
75% 70%61%
50%41% 38%
23%8%
0%
10%
20%
30%
40%
50%
60%
70%
80%
90%
100%
FY14 FY15 FY16 FY17 FY18 FY19 FY20 FY21
Digital transactions Non-digital transactions
87% 88%90% 91%
93% 93%95% 96%
13% 12%10% 9%
7% 7%5% 4%
80%
82%
84%
86%
88%
90%
92%
94%
96%
98%
100%
FY14 FY15 FY16 FY17 FY18 FY19 FY20 FY21
Digital transactions Non-digital transactions
(In bn) 9.79 11.71 15.12 19.54 23.58 29.02 34.90 44.38
898 930 1,028 1,226 1,481 1,745 2,196 In Rs tn 1,471

44
to change or support existing way of doing business, and hold the promise of enhancing customer convenience,
facilitating access to credit for hitherto unserved or underserved customer segments and/or improving operating
efficiency. The emergence of fintech firms has enabled customers create formal records through digital payments or
transaction data and thereby improve their access to credit.
Digital payments landscape has the highest number of fintechs in India and now other financial segments like lending,
insurance, wealth are also attracting fintechs.
Players using digital medium across different financial segments
Financial segments Business segments Examples of such players
present in the segment
Payments
Payment banks
Payment aggregators
P2P Payment solutions
Prepaid payment instruments
Fino Payments Bank, Pine labs,
PayTM, Razorpay, BillDesk,
MSwipe, PayNearby, PhonePe,
GooglePay, Mobikwik, PayU
Lending Digital lenders
Intermediaries
LendingKart, Capital Float,
Bankbazaar, EarlySalary, LazyPay
Wealth tech
Investment platforms
Robo advisors
Thematic Investing
Discount brokers
Zerodha, Kuvera, FundsIndia,
Upstox, Groww, PayTM Money
Insure tech Digital Insurers
Digital insurance advisors
Acko, Digit, Policy Bazaar,
VahanCheck, Coverfox
Reg tech Accounting
Tax compliance Fintellix, FixNix
Open/ Neo banking Neo banking platforms Niyo, Open, Jupiter
Digital payments landscape in India is being driven by fintechs along with India’s unique digital public infra and
embedded offerings. Fintechs are now also expanding beyond their core offerings to increase engagement, the
addressable market and to drive monetisation. For example, players like PayTM and PhonePe with core offerings as
payments and wallets, respectively, have expanded into e-commerce and investing services. Fintechs, having
acquired a substantial user base, are also offering short-term credit and small ticket personal loans in partnership
with banks. PayTM, Flipkart and Amazon, for example, provide short-term credit (15-30 days) of Rs 5,000-60,000 for
online spends.
In India, growth of fintech has been driven by a confluence of factors:
• Favourable demographics – India has a population of close to 500 million Generation Z or Gen Zers–
defined as those born after 2001. The most defining aspect of this generation is that they have no idea about
what the world was before the internet. In some sense, they are digital natives, and are therefore, more likely
to uptake digital products/services, provided that they are relevant to the context in which they operate.
Moreover, increasing technology adoption by the millennials (Generation Y), who also form a major
proportion of the population, will also drive the growth of technology-oriented platforms and fintechs in India

45
• Rising Internet penetration – The wireless internet subscriber base has grown at a CAGR of 20% from 300
mn in fiscal 2015 to touch 720 mn in fiscal 2020. The wireless internet subscriber base is estimated to be
772 million as of fiscal 2021. CRISIL Research expects over 900 million subscribers to be using the mobile
internet by fiscal 2025 due to the ubiquitous availability of high-speed internet services and increasing
affordability of services and handsets.
• Availability of low cost infrastructure – Payment service providers such as NPCI, Mastercard and Visa
and other infrastructure providers such as mobile phone manufacturers and internet service providers have
been continuously working towards lowering the cost of digital infrastructure. This has helped support fintech
solutions.
• Changing customer expectations: With rising incomes and awareness, and development of technology,
consumer behaviour and expectations are changing rapidly. Consumers, used to an instant experience,
whether for making purchases (through e-commerce websites) or for travelling (through cab hiring firms), are
demanding a superior experience from other service providers such as lenders as well – paperless, faster,
seamless and convenient. The demographic shift to digitally literate younger consumers and their inclination
to constantly look for better deals means customers’ propensity to shift has increased, too.
• Availability of huge amount of data and related intelligence – Increased use of smartphones coupled
with rising internet penetration, use of wearables, telematics, Internet of Things (IoT) and other connected
devices is helping players to capture customer data from alternate sources and build social and psychological
profiles of customers, thereby enabling accurate and faster decision making. For example, a lot of data on
retail customers is being generated whenever they use web search, mobile applications, shop/browse on e-
commerce websites, and undertake banking transactions. Using big data analytics, AI and ML, technologies,
firms can process the data more efficiently and provide personalized offerings to customers.
• Key government initiatives – One of the key initiatives by RBI has been the launch of United Payment
Interface (UPI), bringing multiple payments service providers on to a single platform and enabling swift
payment. IndiaStack has lowered the cost of consumer on-boarding and transactions significantly.

46
• IndiaStack provides distinct technology layers:
Source: IndiaStack, CRISIL Research
Government initiatives like JAM (Jan-Dhan, Aadhaar, and Mobile) has enabled government to make Rs 14.2 trillion
of direct transfers as of February 2021. Other programs such as Digital India, Start-up India have fuelled the growth
of fintechs in India.
Key technologies shaping fintech
Technological developments and continuous progress in the maturity of technologies has helped shape up the fintech
market. Application Programming Interface (API) standards, for instance, have enabled different pieces of software
from different financial players to interact and exchange data in a secure environment, enabling comparisons and
more competition. APIs are the main reason that startups are able to build their products faster.
However, there are challenges as well when it comes to usage of technology. AI, for instance, is dependent on
credible and quality data, and therefore, service providers putting in place structured mechanisms for collecting,
validating, standardizing and archiving data to make it relevant for AI.
Application of technology by fintech
Presenceless
layer
Digital capture of data and eKYC for
customer requests through universal
biometric digital identity
Aadhar authentication
Cashless layerA single interface for all bank accounts
and mobile wallets creates an online
ecosystem for payments
UPI, RTGS, IMPS
Paperless layer
Records are digitally alligned with
individual's digital identity enabling
automated sanctions and eliminating
maasive paper work
eKYC, eSign
Consent layerFree and secure flow of data through
digital distributionBlockchain, Open source data

47
Going forward, India presents a huge opportunity for growth of fintechs owing to high potential in the underpenetrated
customer segments. Most fintech firms today target customers who use smartphones and value convenience and
timely availability of credit. To attract mid-to-low-income customers and the rural population, there is a need to
develop tailor-made solutions and adequate use-cases by overcoming challenges posed by low literacy, lack of trust,
low awareness and behavioural factors. Given the improvement in support infrastructure (electricity and internet
connectivity and IndiaStack), this segment provides huge potential to grow.
•Offers immense computing power and storage, enabling fintech firms to streamline product offerings according to user demand near real time
Cloud
•Helps companies in gaining insights and predictive analysis based on consumer data and behaviour
Big data and analytics
•Aides data driven decisions at lower cost to provide innovative experience to customers efficiently
Artificial intelligence
•Enables secure and convenient authentication for KYC, mobile applications and payments
Biometrics
•Enables fintech firms to enhance monitoring and risk assessment for services provided to customers
Internet of things (IoT)
•Transparent and decentralised nature of open source system enables firms to understand challenges and benefits faced by other firms
Open source/API
•Enables companies to explore cost efficient way of operations, assure transparency and quicker & enhanced customer experiences
Blockchain
•Enables easy interpretation of large amount of data of customers through their digital footprints
Machine learning
•Helps firms to streamline processes and improve customer experiences
Robotics
•Chatbots helps in providing an initial layer of customer interaction, bringing in efficiency and higher customer satisfaction
Chatbots

48
Financial Inclusion
Current scenario and key developments
The COVID-19 pandemic has spread across the world, and India is no exception. The lockdown of nearly 1.3 billion
people and a large number of businesses led to disruption and dislocation on a scale never imagined. It slammed
the brakes on economic activity and caused enormous human suffering. Nonetheless, with opening of lockdown and
businesses restarting, economy is on the path of recovery.
In these unprecedented times, to provide some relief to the customers, the RBI had introduced measures that permits
lending institutions to allow a moratorium of six months on repayment of instalments for term loans outstanding as
on March 1, 2020. Lending institutions were permitted to defer interest payments on working capital facilities
outstanding as on March 1, 2020, by a period of six months which ended on August 31, 2020. However, lending
institutions were instructed to provide 10% additional provisioning for on all loans that are overdue but not NPAs
(non-performing assets) wherein the moratorium is approved, which could be later adjusted against the provisioning
requirements for actual slippage. These measures were required to boost confidence in the economy.
In these times of crisis, financial inclusion as also access to finance becomes more imperative than ever for
vulnerable households and businesses to navigate the crises and recover after the pandemic. In terms of the credit
to GDP ratio, India has a low credit penetration compared with other developing countries, such as China indicating
that the existing gap needs to be bridged. Similarly, in terms of credit to households as a proportion of GDP as well,
India lags other markets, with retail credit hovering at around 22% of GDP as of fiscal 2020.
Credit to GDP ratio (%)
Note: Data is represented for calendar years for all countries except India. For India, numbers are for fiscal year
Source: Bank of International Settlements, CRISIL Research
73 70 69 71 70
204 205 201 205222
78 77 76 8191
117 117 120 122132
72 71 72 73 74
160 163 161 156170
150151 150 150
164
0
50
100
150
200
250
2016 2017 2018 2019 2020
India China Brazil Germany South Africa United Kingdom United States

49
Retail Credit to GDP ratio (2020)
Note: For countries except India, data is represented for calendar years. For India, data represented is for fiscal year 2021.
India’s focus on financial inclusion is increasing; however, a large section of the
population is still unbanked
According to the World Bank’s Global Findex Database 2017, the global average of adult population with an account
(with a bank, financial institution, or mobile money providers) was about 69% in 2017. India’s financial inclusion has
improved significantly in the past three years, with the adult population with bank accounts rising from 53% (as per
Global Findex Database 2014) to 80% (in 2017) with concentrated efforts from the government and the rise of various
supporting institutions. Although the rise in the number of bank accounts has not translated into a corresponding
increase in the number of transactions and fruitful usage of those accounts.
Financial exclusion is widely prevalent in countries, such as India, due to poverty and low income, financial illiteracy,
high transaction costs, and lack of infrastructure (primarily information technology). Consequently, a significant
proportion of the population still lacks access to formal banking facilities. According to NABARD All India Rural
Financial Inclusion Survey 2016-17, 40% loans were reported as taken from non-institutional investors or informal
channels like relative and friends, money lenders and local landlords.
As per the Global Findex Database 2017, ~50% of the world’s unbanked adults are in India, Bangladesh, China,
Indonesia, Mexico, Nigeria and Pakistan. Of the world’s total unbanked adults (about 1.7 billion), 415 million are from
just two countries – India (11% or 190 million) and China (13% or 225 million) – because of their huge population.
To tackle financial exclusion, the Indian government introduced the PMJDY, a scheme that facilitates opening bank
accounts by the unbanked. However, the effective use of these new accounts, increase in the number of transactions
in these accounts and availability of credit remain key challenges, which need to be effectively addressed as
borrowings from the formal sources still remains low.
Adult population with a bank account (%): India vis-à-vis other countries
22%
37% 36%
59%62%
79%
90%
0%
10%
20%
30%
40%
50%
60%
70%
80%
90%
100%
India Brazil South Africa Germany China United States UnitedKingdom

50
Note: 1. Global Findex data for India excludes northeast states, remote islands and selected districts. 2. Account penetration is for the population
within the age group of 15+
Source: World Bank - The Global Findex Database 2017, CRISIL Research
India has lower commercial bank branches and ATM penetration compared to other countries, indicating huge room
for financial inclusion and banking services penetration. As of calendar year 2020, India has 14.7 branches and 17
ATMs for 100,000 adults according to World Bank data which is relatively lower than other developing and developed
countries.
Commercial bank branch penetration across the world
Note: (*) – UK data is as of 2013 calendar year
Source: World Bank, RBI, CRISIL Research
ATM penetration across the world
10
0%
10
0%
10
0%
10
0%
99
%
98
%
98
%
96
%
94
%
94
%
94
%
93
%
82
%
82
%
80
%
80
%
76
%
74
%
72
%
70
%
69
%
69
%
69
%
50
%
49
%
49
%
0%
10%
20%
30%
40%
50%
60%
70%
80%
90%
100%
De
nm
ark
Ca
na
da
Neth
erlands
Austr
alia
Germ
any
Ja
pa
n
Sin
gapore
Un
ite
d…
Fra
nce
Italy
Spain
Un
ite
d S
tate
s
Th
aila
nd
Kenya
Chin
a
India
Ru
ssia
n…
Sri L
anka
Saudi A
rabia
Bra
zil
South
Afr
ica
Tu
rke
y
Wo
rld
Rw
an
da
Indonesia
Arg
entina
29.7
25.1
17.9
15.2 14.7 14.2
9.4 9.2 8.8
0.0
5.0
10.0
15.0
20.0
25.0
30.0
35.0
US UK* Brazil Indonesia India World Germany South Africa China
Commercial bank branches per 100,000 adults (2020)

51
Note: (*) – US data is as of 2009 calendar year
Source: World Bank, RBI, CRISIL Research
The low levels of adults with bank accounts in comparison with various countries can be further explained by the
large number of rural households in the country, which account for nearly two-thirds of the total households in the
country. The shift in households towards urban regions is taking place albeit at a very slow pace.
Two-thirds of total households are in rural India
Source: World Bank; Census; CRISIL Research
Although the majority of Indian households are located in the rural region, the banking infrastructure in these regions
is relatively inferior and, thus, there is a gap in the supply and demand of financial services in the backward regions
of the country, which is a pocket of opportunity for the financial services sector.
State wise share of rural population (as per Census 2011)
States
Total population
(in thousands)
Rural population (% of total
population)
States
Total population
(in thousands)
Rural population (% of total
population)
Uttar Pradesh 199,812 78% Chhattisgarh 25,545 77%
137
7382
76 7361
38 43
17
0
20
40
60
80
100
120
140
160
USA Germnany UK Brazil China South Africa Indonesia World* India
ATMs per 100,000 adults (2020)
33% 33% 34% 34% 34% 35% 35%
67% 67% 66% 66% 66% 65% 65%
0%
10%
20%
30%
40%
50%
60%
70%
80%
90%
100%
FY15 FY16 FY17 FY18 FY19 FY20 FY21
Urban Rural

52
Maharashtra 112,374 55% Haryana 25,351 65%
Bihar 104,099 89% Delhi 16,788 2%
West Bengal 91,276 68% Jammu and Kashmir 12,541 73%
Andhra Pradesh 84,581 67% Uttarakhand 10,086 70%
Madhya Pradesh 72,627 72% Himachal Pradesh 6,865 90%
Tamil Nadu 72,147 52% Tripura 3,674 74%
Rajasthan 68,548 75% Meghalaya 2,967 80%
Karnataka 61,095 61% Manipur 2,856 61%
Gujarat 60,440 57% Nagaland 1,979 71%
Odisha 41,974 83% Goa 1,459 38%
Kerala 33,406 52% Arunachal Pradesh 1,384 77%
Jharkhand 32,988 76% Mizoram 1,097 48%
Assam 31,206 86% Chandigarh 1,055 3%
Punjab 27,743 63% Sikkim 611 75%
Source: Census 2011, CRISIL Research
Rural India accounts for about half of GDP, but only about 10% of total credit and 11% of
total deposits
As of March 2020, there were about 640,000 villages in India, inhabited by about 893 million people, comprising
about 66% of the country’s population. About 47% of India’s GDP comes from rural areas. But their share in banking
credit and deposits is abysmally low with just 9% of total credit and 11% of total deposits coming from rural areas.
The massive divergence in the rural areas’ share of India’s GDP and banking credit and deposit services compared
with urban areas is as an indicator of the extremely low penetration of the banking sector in rural areas.
GDP contribution from rural and urban areas
Source: CSO; RBI; CRISIL Research estimates (for GDP contribution as per 2017)
Low share of banking credit and deposit indicates lower penetration in rural areas
47%
53%
GDP Contribution
Rural Urban

53
Source: CSO; RBI; CRISIL Research estimates (for GDP contribution as per 2017)
As rural areas in India have lower financial inclusion compared with urban areas and there is less competition for
banking services in rural areas compared with urban areas, this presents significant growth opportunities in rural
areas.
India’s ATM withdrawal to Cash-in-circulation ratio lies behind other countries indicating lower debit card penetration
is in the country. However, with initiatives like PMJDY focussed towards increasing financial penetration and
inclusion, the government has been attempting to change the situation. Under PMJDY, the beneficiaries have been
issued RuPay debit cards which has also been a key enabler from rural participation in financial system. As of March
2021, 309 million RuPay debit cards have been issued to 422 million PMJDY beneficiaries. Out of these, 66% of the
beneficiaries belong to rural and semi-urban areas.
ATM withdrawal to CIC (Cash in circulation) ratio (CY 2019)
Source: Bank of International Settlements, CRISIL Research
Number of RuPay debit cards issued under PMJDY
83% 80% 79% 77%
10% 11% 12% 14%
7% 9% 9% 9%
0%
20%
40%
60%
80%
100%
FY10 FY15 FY20 FY21
Banking credit distribution trend
Urban Semi-urban Rural
77% 75% 73% 73%
14% 15% 16% 16%
9% 10% 11% 11%
0%
20%
40%
60%
80%
100%
FY10 FY15 FY20 FY21
Banking deposit distribution trend
Urban Semi-urban Rural
1.42.1
2.6
5.2
6.36.8
0.0
1.0
2.0
3.0
4.0
5.0
6.0
7.0
8.0
India United Kingdon Russia Brazil China South Africa
(times)

54
Source: PMJDY, CRISIL Research
According to a recent survey done by PRICE (People Research on India’s Consumer Economy & Citizen
Environment), in partnership with NPCI on Tracking Digital Payments Awareness, Adoption and Use Behaviour of
Households, following conclusions were drawn regarding the extent of financial penetration across various groups in
India:
% of households who have Income groups
Total Bottom 40% Middle 40% Top 20%
Bank Account 100% 100% 100% 100%
Get SMS from bank 82% 89% 94% 87%
Showed Aadhaar Card to bank 69% 62% 77% 68%
PSU Bank accounts 85% 73% 66% 78%
Private Bank accounts 7% 12% 13% 10%
Both 7% 15% 22% 13%
Bank Branch < 2 kms from home 53% 54% 53% 53%
ATM < 2 kms from home 58% 59% 67% 60%
Reached by Bank Mitra 54% 56% 62% 56%
Has Debit Card 68% 79% 84% 77%
Uses Debit Card for Cash withdrawal 95% 87% 100% 94%
Note: The households were divided into three groups, the Bottom (40%), Middle (40%) and Top (20%). Bottom 40% had an
average household income/ yr of Rs 1,10,000 and 80% of these households lived in rural areas. Middle 40% had average
household income/ yr of Rs 1,80,000 and 60% of these households lived in rural areas. Top 20% had average household income/
yr of Rs 3,60,000 and 45% of these households lived in rural areas.
Source: NPCI report titled Digital Payments Adoption in India, 2020
The number of bank credit accounts in rural areas grew at a CAGR of 5% between the end of Fiscal 2015 and the
end of Fiscal 2021 and the number of bank deposit accounts grew at a CAGR of 7% between the end of Fiscal 2015
and the end of Fiscal 2021. However, with payments bank increasing their reach and expanding into rural areas and
increasing financial awareness, faster growth in rural areas can be expected in the future given the huge untapped
potential. Between the end of Fiscal 2015 and the end of Fiscal 2021, the number of credit accounts in semi-urban
areas grew at a CAGR of 10% and between the end of Fiscal 2015 and the end of Fiscal 2020, the number of deposit
178
220237
279293
309
0
50
100
150
200
250
300
350
Mar-16 Mar-17 Mar-18 Mar-19 Mar-20 Mar-21
(in mn)

55
accounts grew at a CAGR of 8%. Between the end of Fiscal 2015 and Fiscal 2021, the number of credit accounts in
urban areas grew at a CAGR of 17% and between the end of Fiscal 2015 and the end of Fiscal 2021, the number of
deposit accounts grew at a CAGR of 6%.
Bank credit accounts in rural, semi-urban and urban areas
Note: Urban includes data for Urban and Metropolitan areas; amounts are as of the end of the fiscal year indicated. Data
represents only bank credit accounts
Source: RBI; CRISIL Research
Bank deposit accounts in rural, semi-urban and urban areas (FY21)
Note: Urban includes data for Urban and Metropolitan areas; amounts are as of the end of the fiscal year indicated. Data represents only bank
deposit accounts
Source: RBI; CRISIL Research
5039
535445
6053
47
6756 53
85
6761
104
63 62
123
68 69
134
0
20
40
60
80
100
120
140
160
Rural Semi-urban Urban
(in millions)
FY15 FY16 FY17 FY18 FY19 FY20 FY21
494
405
541576
471
599604541
681642
568
701667
589
716705
617
748726
632
758
0
100
200
300
400
500
600
700
800
Rural Semi-urban Urban
FY15 FY16 FY17 FY18 FY19 FY20 FY21
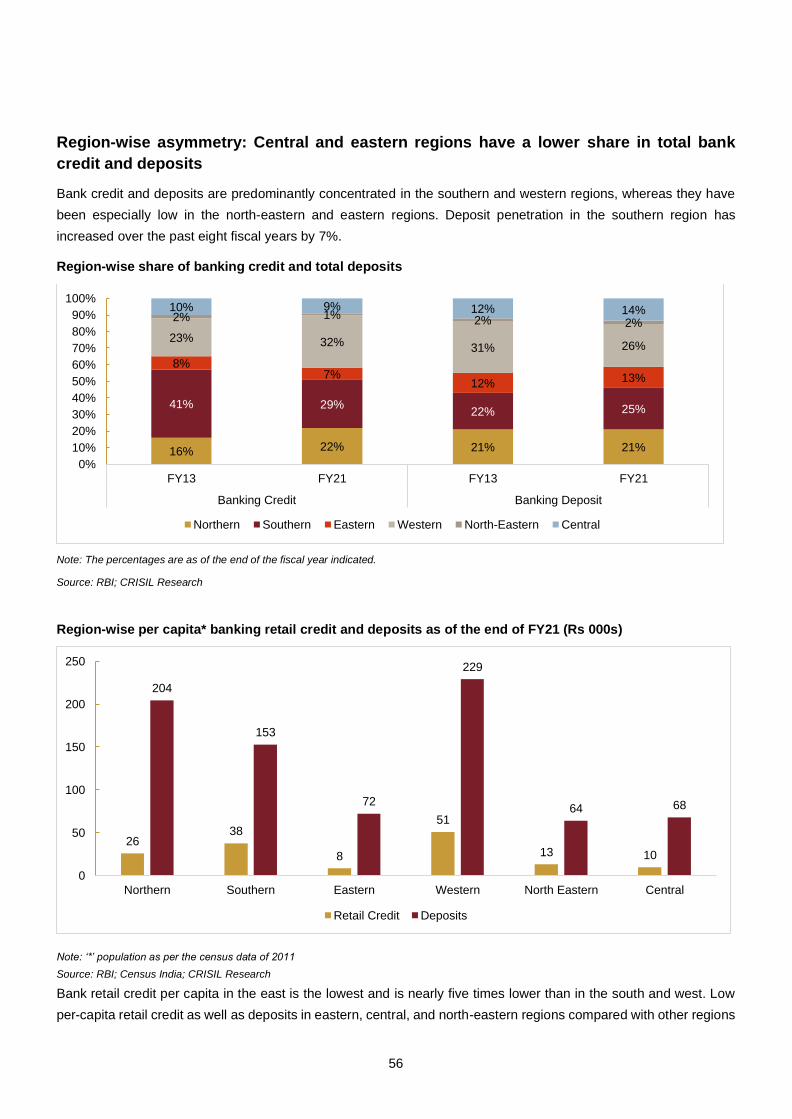
56
Region-wise asymmetry: Central and eastern regions have a lower share in total bank
credit and deposits
Bank credit and deposits are predominantly concentrated in the southern and western regions, whereas they have
been especially low in the north-eastern and eastern regions. Deposit penetration in the southern region has
increased over the past eight fiscal years by 7%.
Region-wise share of banking credit and total deposits
Note: The percentages are as of the end of the fiscal year indicated.
Source: RBI; CRISIL Research
Region-wise per capita* banking retail credit and deposits as of the end of FY21 (Rs 000s)
Note: ‘*’ population as per the census data of 2011
Source: RBI; Census India; CRISIL Research
Bank retail credit per capita in the east is the lowest and is nearly five times lower than in the south and west. Low
per-capita retail credit as well as deposits in eastern, central, and north-eastern regions compared with other regions
16% 22% 21% 21%
41% 29%22% 25%
8%7%
12% 13%
23% 32%31% 26%
2% 1% 2% 2%
10% 9% 12% 14%
0%
10%
20%
30%
40%
50%
60%
70%
80%
90%
100%
FY13 FY21 FY13 FY21
Banking Credit Banking Deposit
Northern Southern Eastern Western North-Eastern Central
2638
8
51
13 10
204
153
72
229
64 68
0
50
100
150
200
250
Northern Southern Eastern Western North Eastern Central
Retail Credit Deposits

57
implies low penetration of banks in these areas. This provides an opportunity for all lending and deposit accepting
institutions to expand in these regions and also expand their reach in specific areas around them. In terms of deposits,
the southern region is moderately penetrated compared with the northern and western regions, leaving a lot of
headroom for growth for the players to capitalise on.
The number of branches and ATM facilities in the eastern regions, where credit penetration and deposit-base are
low is also below those of the southern and western regions, which CRISIL Research believes is largely due to lower
focus from the bigger banks.
Region-wise presence of bank ATM and branches (as of March 31, 2021)
Note: ‘*’ population is as per the census data of 2011
Source: RBI; Census India; CRISIL Research
Large variations in deposits and credit outstanding across states and districts
There is a wide variation across states and within various districts in the same state as well in terms of credit, which
indicates latent opportunity for providing banking services to unserved or underserved customers. Uttar Pradesh and
Bihar are the most populous states in India, accounting for 16% and 9% respectively of overall population in India,
as compared to other states like Assam, Jharkhand and Odisha with share of ~3%. Based on bank credit accounts
in rural areas, Himachal Pradesh, Odisha, Jharkhand and Bihar have more than 45% of the credit accounts in rural
areas compared to Maharashtra, Delhi, Kerala and Mizoram where the share of accounts in rural areas is below
10%. In value terms, bigger states like Maharashtra, Delhi, Kerala and Gujarat have less than 10% of credit
outstanding in rural areas compared to Meghalaya, Himachal Pradesh and Jammu & Kashmir with more than 30%
of rural credit outstanding.
Maharashtra and Delhi, among the states with high share in overall credit, have more than 70% of total credit
outstanding concentrated in the top five districts as of FY21.
97 101 108
136
177 175
121 128139
235 245
316
0
50
100
150
200
250
300
350
Eastern Central North Eastern Western Northern Southern
(per million population*)
Branches ATMs

58
State-wise rural credit accounts in banks and top five districts concentration (FY21)
State No. of
districts
% share in
overall
population
in India
Share in
overall
credit
Credit to
Deposit
ratio
(FY19)
Concentration
of credit in top
5 districts
% of credit
in rural
areas
Concentration
of credit
accounts in
top 5 districts*
% credit
accounts in
rural areas
Maharashtra 99 9% 29% 95% 90% 2% 73% 8%
Delhi 4 1% 13% 94% 100% 0% 100% 0%
Tamil Nadu 88 6% 10% 102% 62% 11% 44% 26%
Karnataka 83 5% 7% 61% 74% 8% 44% 28%
Gujarat 92 5% 6% 69% 72% 6% 51% 17%
Uttar Pradesh 207 16% 5% 41% 37% 17% 18% 36%
Andhra Pradesh 62 8% 4% 129% 64% 15% 45% 30%
West Bengal 40 7% 4% 46% 73% 13% 46% 45%
Kerala 37 3% 4% 62% 66% 2% 52% 4%
Rajasthan 90 6% 3% 77% 53% 14% 39% 32%
Madhya Pradesh 135 6% 3% 67% 54% 11% 33% 26%
Haryana 62 2% 3% 52% 62% 9% 43% 20%
Punjab 60 2% 2% 54% 60% 21% 47% 29%
Bihar 99 9% 1% 39% 46% 22% 36% 46%
Odisha 69 3% 1% 39% 60% 20% 47% 50%
Chhattisgarh 64 2% 1% 62% 73% 8% 47% 21%
Assam 69 3% 1% 47% 50% 25% 35% 46%
Jharkhand 56 3% 1% 30% 67% 17% 53% 46%
Jammu and Kashmir 43 1% 1% 31% 60% 34% 50% 50%
Uttarakhand 28 1% 1% 35% 89% 21% 81% 31%
Himachal Pradesh 22 1% 0% 31% 74% 57% 67% 69%
Goa 4 0% 0% 24% 100% 16% 100% 30%
Tripura 16 0% 0% 41% 87% 28% 83% 35%
Meghalaya 20 0% 0% 37% 93% 30% 88% 42%
Manipur 25 0% 0% 56% 83% 28% 79% 29%
Nagaland 21 0% 0% 39% 87% 21% 82% 25%
Arunachal Pradesh 30 0% 0% 24% 74% 25% 65% 31%
Sikkim 20 0% 0% 34% 100% 28% 81% 39%
Mizoram 7 0% 0% 43% 85% 7% 100% 7%
Note: Arranged in descending order of share in overall credit outstanding of banks, (*) As of FY20
Source: RBI, CRISIL Research
Similarly in terms of bank deposits, Odisha, Jharkhand, Assam, Himachal Pradesh, Sikkim and Meghalaya have
more than 50% of the deposit accounts in rural areas compared to Maharashtra, Delhi and Kerala where the share
of accounts in rural areas is below 20%. In value terms, Maharashtra, Delhi, Kerala, Karnataka, Tamil Nadu and
Haryana have less than 10% of deposits in rural areas compared to Sikkim, Tripura, Meghalaya, Arunachal Pradesh,
Himachal Pradesh and Jammu & Kashmir with more than 25% of rural deposits.
Maharashtra and Karnataka, among the bigger states have more than 75% of total deposits concentrated in the top
five districts as of FY21.

59
State-wise rural deposit accounts in banks and top five districts concentration (FY21)
State No. of
districts
% share in
overall
population
in India
% Share
in overall
deposits
Concentration
of deposits in
top 5 districts
% of
deposits in
rural areas
Concentration
of deposit
accounts in
top 5 districts*
% deposit
accounts in
rural areas*
Maharashtra 35 9% 21% 85% 3% 52% 18%
Delhi 11 1% 10% 100% 1% 61% 2%
Uttar Pradesh 74 16% 9% 39% 20% 15% 46%
Karnataka 29 5% 8% 79% 7% 44% 30%
Tamil Nadu 32 6% 7% 66% 9% 35% 24%
West Bengal 23 8% 6% 69% 17% 38% 47%
Gujarat 46 7% 6% 61% 11% 42% 26%
Kerala 33 5% 4% 63% 3% 46% 4%
Haryana 14 3% 4% 67% 9% 39% 25%
Rajasthan 22 2% 3% 54% 15% 34% 37%
Punjab 32 6% 3% 56% 21% 46% 32%
Madhya Pradesh 22 2% 3% 51% 12% 23% 32%
Bihar 52 6% 3% 48% 23% 27% 48%
Odisha 38 9% 3% 57% 24% 33% 56%
Andhra Pradesh 30 3% 2% 62% 16% 32% 30%
Jharkhand 24 3% 2% 69% 18% 40% 52%
Chhattisgarh 33 3% 1% 64% 18% 37% 45%
Assam 28 2% 1% 59% 22% 27% 53%
Uttarakhand 13 1% 1% 85% 23% 71% 44%
Jammu and Kashmir 20 1% 1% 68% 28% 50% 50%
Himachal Pradesh 10 1% 1% 73% 61% 67% 74%
Goa 2 0% 1% 100% 23% 100% 34%
Tripura 8 0% 0% 91% 28% 81% 47%
Meghalaya 10 0% 0% 92% 26% 77% 54%
Arunachal Pradesh 13 0% 0% 77% 26% 66% 40%
Nagaland 7 0% 0% 95% 10% 94% 23%
Manipur 10 0% 0% 89% 25% 78% 38%
Mizoram 4 0% 0% 89% 13% 82% 30%
Sikkim 11 0% 0% 100% 28% 100% 51%
Note: Arranged in descending order of share in overall deposits. (*) Data as of FY20
Source: RBI, CRISIL Research
States with low financial penetration present a strong case for growth
Uttar Pradesh, Bihar & Madhya Pradesh has a strong potential for growth in the coming years
GDP growth has been varied across states with Karnataka growing at the fastest rate of 9.9% CAGR (FY 2015-FY
2020), followed by Haryana (9.1%), Gujarat (8.7%) and Andhra Pradesh (8.6%). In the South, states like Andhra
Pradesh, Karnataka and Tamil Nadu have huge headroom for growth given the credit penetration and economic
growth. Similarly, In the West, states like Maharashtra, Gujarat have showcased good growth in terms of GDP and
Gujarat has a relatively lower credit penetration, which provides a huge potential to be addressed.

60
Uttar Pradesh and Bihar have the lowest credit account penetration among all other states in the country. These
states also exhibit lower CRISIL Inclusix score indicating low financial inclusion. With lower financial penetration,
these states present huge untapped market and potential for growth in future, as their GDP gradually increases.
State-wise GDP and GDP growth (FY 2021)
States
Real GDP
(FY 2020)
Rs. Billion
YOY
growth
Real GDP
growth
CAGR (FY
2015-FY 2020)
Credit
account
penetration
Deposit
account
penetration^
Branch
penetration
ATM
penetration
CRISIL
Inclusix
Score (2016)
Maharashtra* 20391 6.0% 6.6% 32% 164% 108 211 62.7
Tamil Nadu 13129 8.0% 8.0% 14% 182% 147 331 77.2
Karnataka 12010 6.8% 9.9% 9% 190% 157 259 82.1
Uttar Pradesh 11873 4.4% 7.3% 2% 175% 80 96 44.1
Gujarat* 11864 9.2% 8.7% 7% 149% 126 175 62.4
West Bengal 7932 7.3% 6.7% 3% 146% 90 120 53.7
Rajasthan 7116 5.0% 6.4% 4% 123% 101 137 50.9
Andhra Pradesh 6720 8.2% 8.6% 9% 167% 137 231 78.4
Delhi 6344 7.4% 8.2% 25% 277% 197 422 86.1
Haryana 5722 7.7% 9.1% 10% 187% 180 237 67.7
Madhya Pradesh 5618 7.6% 7.9% 4% 133% 89 128 48.7
Kerala* 5594 7.5% 6.7% 11% 200% 180 267 90.9
Punjab 4189 5.3% 6.1% 9% 196% 212 232 70.9
Bihar 4150 10.5% 8.2% 1% 114% 65 71 38.5
Odisha 4024 5.3% 8.3% 4% 137% 113 157 63
Chhattisgarh 2435 5.3% 5.6% 4% 140% 99 129 45.7
Jharkhand 2400 6.7% 5.2% 3% 127% 86 97 48.2
Assam* 2340 6.4% 8.1% 3% 124% 86 117 47.9
Uttarakhand* 1933 6.9% 7.3% 5% 123% 193 239 69
Himachal Pradesh 1244 5.6% 6.9% 5% 180% 217 242 72.3
Jammu & Kashmir* 1128 6.1% 7.3% 8% 151% 125 182 47.8
Tripura 405 9.6% 8.5% 3% 133% 139 123 66.2
Meghalaya 267 8.2% 5.8% 4% 88% 111 121 34.6
Note: 1. (*) – As of FY 2019, (^) – As of FY 2020
2. Credit account penetration is calculated as total number of retail bank credit accounts/population of the state 3. Deposit account penetration is calculated as total number of bank deposit accounts/ population of the state 4. Branch penetration is calculated as Number of bank branches per million people 5. ATM penetration is calculated as Number of ATMs per million people 6. For Credit and Deposit account penetration, this does not represent unique borrowers or depositors, total number of accounts have been considered 7. Andhra Pradesh and Telangana have been considered as one state
8. CRISIL Inclusix, India’s first financial inclusion index, was launched in 2013 with the objective of creating a dependable yardstick that would
become a policy input to further the cause of inclusion. CRISIL Inclusix weighs three service providers (banks, insurers and microfinance
institutions) on four dimensions (branch, credit, deposit and insurance).
Source: RBI, MOSPI, CRISIL Research
CRISIL Inclusix, an index that measures the extent of financial inclusion at a geographical level across all districts in
India, reported a score of 58.0 at the end of fiscal 2016 from 50.1 in fiscal 2013 and 35.4 in fiscal 2009. The index
score each district in India on a scale of 0 to 100 with 0 being the worst and 100 being the best. The overall
improvement of the score in fiscal 2016 was mostly driven by JAM trinity: Jan Dhan Yojana, Aadhaar and mobile.
Kerala had the highest CRISIL Inclusix score as of 2016 with only 1 district having a score less than 70. Goa,
Karnataka, Andhra Pradesh are other states with higher Inclusix scores and no districts having a score below 50.

61
States such as Uttar Pradesh and Bihar, on the other hand, have an Inclusix score below 45, with a large majority of
districts – 50% in case of Uttar Pradesh and 65% for Bihar – having Inclusix scores below 40.North-eastern states
like Manipur, Nagaland and Meghalaya have the lowest Inclusix scores with hardly any district having a score more
than 50.
State
CRISIL
Inclusix Score
(2016)
Number of districts with CRISIL Inclusix score in the stated range
More than 70 60-70 50-60 40-50 Less than 40 Total
number of districts
Kerala 90.9 13 1 0 0 0 14
Goa 88.9 2 0 0 0 0 2
Puducherry 87.7 3 1 0 0 0 4
Chandigarh 86.7 1 0 0 0 0 1
Delhi 86.1 1 0 0 0 0 1
Karnataka 82.1 20 5 5 0 0 30
Andhra Pradesh 78.4 10 3 0 0 0 13
Tamil Nadu 77.2 22 8 2 0 0 32
Telangana 72.8 7 3 0 0 0 10
Himachal Pradesh 72.3 9 2 1 0 0 12
Punjab 70.9 9 10 1 2 0 22
Uttarakhand 69.0 3 7 3 0 0 13
Haryana 67.7 7 10 1 2 1 21
Tripura 66.2 2 1 0 5 0 8
Andaman & Nicobar 63.9 1 0 0 0 2 3
Odisha 63.0 6 7 8 7 2 30
Maharashtra 62.7 9 6 8 11 2 36
Gujarat 62.4 10 5 4 7 7 33
Daman and Diu 60.7 0 1 1 0 0 2
Dadra and Nagar Haveli 60.2 0 1 0 0 0 1
Sikkim 60.2 1 0 0 2 1 4
West Bengal 53.7 2 4 5 6 3 20
Lakshadweep 51.3 0 0 1 0 0 1
Rajasthan 50.9 2 3 10 10 8 33
Madhya Pradesh 48.7 3 3 12 15 18 51
Jharkhand 48.2 2 3 2 5 12 24
Assam 47.9 2 4 3 8 10 27
Jammu & Kashmir 47.8 1 2 3 7 9 22
Chhattisgarh 45.7 2 0 5 5 15 27
Uttar Pradesh 44.1 4 4 5 25 37 75
Mizoram 43.2 0 0 1 1 6 8
Bihar 38.5 1 0 0 12 25 38
Arunachal Pradesh 34.7 1 0 2 0 14 17
Meghalaya 34.6 0 0 1 0 10 11
Nagaland 32.4 0 1 0 2 8 11
Manipur 32.0 0 1 0 0 8 9
Total 58.0 156 96 84 132 198 666
Source: CRISIL Inclusix, CRISIL Research

62
Key steps taken by the government to boost financial inclusion
To improve financial inclusion, especially in rural areas, the government is focusing on improving the overall and rural
infrastructure for penetration of financial services as well as empowering the development of parallel supporting
institutions. This has provided an opportunity for payment banks and other financial institutions to cater to the
unserved population or act as a channel between the larger financial institutions and other service providers to better
serve the underserved customers.
Considerable progress has been made over the past 5-7 years to bring unbanked individuals into the formal banking
system. The RBI and the government have taken several measures, such as:
Pradhan Mantri Jan Dhan Yojana
Pradhan Mantri Jan Dhan Yojana (PMJDY), launched in August 2014, is aimed at ensuring affordable access to
financial services – banking/savings and deposit accounts, remittances, credit, insurance, and pension.
PMJDY focuses on household coverage as compared with the earlier schemes that focused on coverage of villages.
It aims to extend banking facilities to all within a reasonable distance in each sub-service area (consisting of 1,000-
1,500 households) across India.
As on March 31 2021, 422 million PMJDY accounts had been opened, of which, 65% were in rural and semi-urban
areas, with total deposits of Rs 1,455 billion.
Number of PMJDY accounts Total balance in PMJDY accounts
Source: PMJDY; CRISIL Research
Source: PMJDY; CRISIL Research
Although the opening of Jan Dhan accounts has increased financial inclusion, the high proportion of zero-balance or
dormant accounts is a concern. However, the number of inoperative accounts under PMJDY is declining, as per the
official website of the Government of India. The data shows that the percentage of inoperative accounts (of total Jan
Dhan accounts) declined from 76.8% in September 2014 to less than 14% in August 2020.
While the government’s move to route subsidies through this channel is a major reason for decreasing zero-balance
accounts, the increased availability of low-cost financial instruments is popularising formal financial institutions
145
214
282314
353383
422
0
50
100
150
200
250
300
350
400
450
Mar-15 Mar-16 Mar-17 Mar-18 Mar-19 Mar-20 Mar-21
(in million)
146
357
630
785
961
1184
1455
0
200
400
600
800
1000
1200
1400
1600
Mar-15 Mar-16 Mar-17 Mar-18 Mar-19 Mar-20 Mar-21
(in Rs billion)

63
amongst the unbanked population. In fact, since the launch of the insurance and pension Jan Suraksha schemes in
August 2015, the proportion of dormant accounts has fallen.
With various other schemes, such as Pradhan Mantri Social Security Schemes including Pradhan Mantri Jeevan
Jyoti Bima Yojana, Atal Pension Yojana and Pradhan Mantri Suraksha Bima Yojana being run under PMJDY, people
have ample reason to enrol for the PMJDY.
Pradhan mantra Suraksha Bima Yojana: PMSBY was launched on 9 th May 2015. It offers a renewable one year
accidental death cum disability cover of Rupees 200,000 to all ·subscribing bank account holders in the age group
of 18 to 70 years for a premium of Rs.12/- per annum per subscriber. As of 24 February, 2021, 227 people were
enrolled under the scheme and 44,353 claims had been disbursed out of 57,716 claims received.
Pradhan Mantri Jeevan Jyoti Bima Yojana: PMJJBY was launched on May 9, 2015. It offers a renewable one year
term life cover of Rs 200,000 to all subscribing bank account holders in the age group of 18 to 50 years, covering
death due' to any reason, for a premium of Rs.330/- per annum per subscriber. The scheme is offered / administered
through LIC and other Life Insurance companies willing to offer the product on similar terms. As on 24 February,
2021, 100 million people have been enrolled under this scheme and 219,078 claims have been disbursed out of
236,368 claims received.
Atal Pension Yojana: The Atal Pension Yojana (APY) was launched on May 9, 2015 to create a universal social
security system for all Indians, especially the poor, the under-privileged and the workers in the unorganised sector.
APY is administered by Pension Fund Regulatory and Development Authority (PFRDA). APY is open to all bank
account holders in the age group of 18 to 40 years and the contributions differ, based on pension amount chosen.
Subscribers would receive the guaranteed minimum monthly pension of Rs. 1000 or Rs. 2000 or Rs. 3000 or Rs.
4000 or Rs. 5000 at the age of 60 years. As of 31 May, 2020, there were more than 22 million subscribers for this
scheme.
Pradhan Mantri Mudra Yojana: PMMY is a scheme launched by the Hon’ble Prime Minister on April 8, 2015 for
providing loans up to 1 million to the non-corporate, non-farm small/micro enterprises. These loans are classified as
MUDRA loans under PMMY. These loans are given by Commercial Banks, RRBs, Small Finance Banks, MFIs and
NBFCs. As of 26 March 2021, 244.8 million MUDRA loans worth more than Rs 15 trillion have been sanctioned.
Standup India Scheme: The scheme was launched by the Hon’ble Prime Minister on April 5, 2016. The objective
of the scheme is to facilitate bank loans between Rs.1 million and Rs. 10 million to at least one Scheduled Caste
(SC) or Scheduled Tribe (ST) borrower and at least one woman borrower per bank branch for setting up a greenfield
enterprise. This enterprise may be in manufacturing, services, agri-allied activities or the trading sector. In case of
non-individual enterprises at least 51% of the shareholding and controlling stake should be held by either an SC/ST
or woman entrepreneur. As of March 31, 2021, 113,441 applications amounting to Rs 254 billion have been
sanctioned under the scheme.
Payment banks
Another step taken towards financial inclusion was the RBI granting in-principle approval on August 19, 2015 to 11
players to launch payment banks. The decision came after the recommendations from Nachiket Mor Committee to
set up a specialized bank (“Payments Bank”) to cater to the low income groups. After the licences were granted to

64
11 players, three players withdrew their application. Of the remaining eight, seven institutions – India Post Payments
Bank Ltd, Airtel Payments Bank Ltd, PayTM Payments Bank Ltd, Fino Payments Bank, Aditya Birla Idea Payments
Bank Ltd and Jio Payments Bank and NSDL Payments Bank had commenced operations. In 2019, Aditya Birla
Payments Bank Ltd shut down its operations due to mounting losses.
The objective of a payments bank is to widen the spread of payment services and deposit products to small
businesses, low-income households, migrant labor workers and other unorganized entities by enabling high volume
low value transactions in deposits and payments/remittance services in a secured technology-driven environment.
Payment banks can accept deposits, subject to a cap of Rs. 200,000 per customer, and provide payment and
remittance services through channels, such as the internet, branches, business correspondents (BCs) and mobile
banking. (The deposit limit was enhanced to Rs 2,00,000 from the earlier limit of Rs 1,00,000 in April 2021.) However,
these banks cannot offer credit facilities directly, but can choose to act as a BC of another bank for credit and other
services.
Along with maintaining a cash reserve ratio (CRR) with the RBI, payment banks are required to invest a minimum of
75% of their demand deposit balance in government securities eligible under the statutory liquidity ratio (SLR), with
maturity of up to one year, and hold a maximum 25% in current and fixed deposits with Scheduled Commercial Banks
(SCBs).
Small Finance Banks (SFBs)
Till March 2021, the RBI has awarded SFB licenses to 11 institutions, which aim to service the underserved through
savings instruments, and supplying credit to small business units, small and marginal farmers, micro and small
industries, and other unorganised sector/lending through informal channels. SFBs are also required to dedicate 75%
of their Adjusted Net Bank Credit (ANBC) towards priority sector. Shivalik Mercantile Co-operative Bank (SMCB) had
received an in-principal approval from RBI on Jan 6, 2020 and has commenced operations as a small finance bank
with effect from 26th April 2021. It became the first urban co-operative bank (UCB) in India to transition to a SFB
under the voluntary transition scheme. For the SFBs, nearly 20% of their deposits arise from the rural and semi-
urban areas, whereas the credit view shows a geographic skew with 33% of the advances in rural and semi-urban
areas as of March 2020. This has led to increasing credit penetration in the rural areas, thereby ensuring financial
inclusion. Recently, in June 2021, RBI gave in-principle approval to Centrum Financial Services to set up a small
finance bank paving a way for the take-over of Punjab & Maharashtra Co-Operative (PMC) Bank Limited. Resilient
Innovations Private Limited (BharatPe) will be an equal partner. The SFB will be guided by the directions and
timelines of the RBI on the amalgamation of PMC Bank Ltd.
Microfinance Institutions
MFIs have played a significant role to play in furthering financial inclusion, by providing small ticket loans to
customers, usually for productive purposes. As of March 2021, NBFC-MFIs together had a total gross loan portfolio
of Rs 880 billion, accounting for 32% of total micro finance loans (excluding SHG) outstanding. Microfinance players
are heavily focussed towards rural areas with rural credit accounting for 74% of the overall NBFC-MFI credit.

65
Business Correspondents (BCs)
In one of its foremost measures, the RBI introduced the BC model of banking outreach in January 2006, aimed at
leveraging information and communication technology to widen access to the banking system. BCs are retail agents
engaged by banks to offer banking services at locations other than a bank branch/ATM. They are authorised to
perform a variety of activities including collection of small-value deposits, disbursal of small-value credit, recovery of
principal, collection of interest, sale of micro insurance, mutual fund products, pension products, other third-party
products, and receipt and delivery of small value remittances/other payment instruments. In July 2014, the RBI
allowed NBFC-MFIs to work with banks as BCs. As of March 2020, 600 million basic savings bank deposit accounts
(BSBDA) were opened through BCs.
Aadhaar
Adoption of Aadhaar and Aadhaar authentication in the Indian financial system is expected to transform the financial
landscape. To increase financial inclusion, the Unique Identification Authority of India partnered with the RBI, National
Payments Corporation of India (NPCI), Indian Banks Association (IBA) and banks to develop:
• Aadhaar Payments Bridge (APB) – The system was launched in 2011 to enable a smooth transfer of all
government welfare scheme payments to a beneficiary’s Aadhaar Enabled Bank Account (AEBA)
• Aadhaar enabled payment system (AEPS) – A system that leverages Aadhaar online authentication and
enables AEBAs to be operated in anytime-anywhere banking mode by the marginalised and financially
excluded via micro ATMs
According to the Ministry of Electronics and IT, Aadhaar-generated unique identity covered over 99% of total
estimated adult population of India, as of December 2020. An Aadhaar number will be used to verify the identity of a
person receiving a subsidy or a service. Disbursements will take place through a centralised electronic benefit transfer
system using the unique Aadhaar beneficiary numbers.
The Aadhaar (Targeted Delivery of Financial and Other Subsidies, Benefits and Services) Bill, 2016, came into effect
on March 25, 2016, to strengthen the role of the Aadhaar card. The Bill aims at providing targeted delivery of subsidies
and services to individuals residing in India by assigning them a unique Aadhaar numbers. To reduce the cost of
consumer on-boarding and transactions, the government launched IndiaStack. IndiaStack is a set of APIs that allows
government businesses, start-ups and developers to utilise a unique digital infrastructure to solve problems, such as
presence less, paperless and cashless services delivery.
Also, Aadhaar-enabled micropayments have many features, including elimination of the need for individual KYC
requirements by banks for no-frills or basic accounts, and reductions in the direct and indirect KYC cost of financial
institutions on account of the UIDAI’s ‘know your residence’ standards being sufficient for authentication.
Aadhaar-enabled payments with clear authentication and verification process allow financial institutions to network
with village-based BCs. Thus, customers will be able to withdraw money and make deposits at the local BC. UIDAI’s
authentication will help banks verify residents both in person and remotely. The electronic transfer, backed by UIDAI’s
authentication, will help residents transact electronically, reducing the cost of transactions. Also, it has helped reduce
the KYC approval turnaround time from the previous 10-15 days, when the customer had to submit various
documents for identity and address proof, to almost-instant KYC approval.

66
As per the Supreme Court’s Judgment of September 2018, the Aadhaar Act was held constitutional, however, it was
also held that Aadhaar cannot be made mandatory for availing banking services and body corporates/persons were
restrained from using Aadhaar details pursuant to a contract only. It further held that the use of the Aadhaar must be
backed by a legislation. Accordingly, the amendment in the legislation was brought about in February 2019, whereby
banks were allowed to use Aadhaar for KYC but with customer consent. This enabled banks to open instant bank
accounts using eKYC based on Aadhaar authentication through the OTP mode. The change in the RBI’s KYC
guidelines is in line with the changes made by the government to the Prevention of Money-laundering Rules (PMLA)
in February 2019 and the Aadhaar and Other Laws (Amendment) Ordinance, 2019 (passed in Lok Sabha in July
2019). The Department of Revenue, vide its circular issued in May 2019, had also notified that all regulated entities
may approach their respective regulators to seek Aadhaar authentication facilities. However, fintech companies are
still not allowed to use biometrics or OTP-based eKYC and are only permitted to use offline Aadhaar verification.
Furthermore, maximum lending through OTP-based e-KYC is Rs 60,000.
Digital India
An umbrella programme to transform India into a knowledge economy has supported the financial inclusion initiative.
Some of the initiatives under this programme include development of digital infrastructure, delivery of government
services digitally and improvement in digital literacy, especially in rural India.
Some of the initiatives include:
• Direct-benefit transfer: As of end of fiscal 2014, only 28 schemes were covered under the direct-benefit
transfer (DBT), where the payment is directly done into the bank account of the beneficiary, This has grown
to 427 schemes as of the end of fiscal 2020. This has resulted in fewer slippages, and faster and easier
remittance to the intended. This, in turn, is expected to give rise to the usability of agent network for other
related transactions, when the money is already in the bank accounts of customers. CRISIL Research
expects the availability of funds in the bank accounts of the beneficiaries will support growth in digital
transactions.
Amount transferred to beneficiaries through DBT
Note: DBT also includes in-kind transfers which includes transfer of goods and services at very low price or for free to the beneficiaries of various
such government scheme
Source: DBT website; CRISIL Research
74
389 619
747
1,703
2,141
2,397 2,553
206
1,157
1,419
1,763
-
500
1,000
1,500
2,000
2,500
3,000
FY14 FY15 FY16 FY17 FY18 FY19 FY20 FY21
(Rs billion)
Cash In Kind

67
• Common service centres 2.0: This is a service delivery-oriented entrepreneurship model, with a large
variety of services made available for citizens. Under Digital India, at least one common service centre
(CSC) was envisaged for each of the 250,000 gram panchayats, including the 100,000 operational CSCs
launched in the initial version of the programme. The objectives of the programme include:
− Non-discriminatory access to e-services for rural citizens
− Expanding the self-sustaining CSC network to the gram panchayat level
− Empowering District e-Governance Societies (DeGSs) under the district administration for implementation
− Creating and strengthening the institutional framework for rollout and project management, thereby
supporting the state and district administrative machinery
− Enabling and consolidating online services under a single technology platform
− Providing a centralised technological platform for delivery of services, transparently to citizens
− Increasing the sustainability of village-level entrepreneurs (VLEs) by sharing maximum commission earned
through delivery of e-services and encouraging women to join as VLEs
The services to be provided at the CSCs include agriculture services, education and training services, rural
banking and insurance services, entertainment services, utility services, healthcare services, and other
commercial services.
• BharatNet: This project aims to provide 100 Mbps broadband connectivity to almost all the 0.25 million
gram panchayats in the country. Under the first phase of the project, 100,000 gram panchayats were to be
connected by laying underground optical fibre cable (OFC). Under Phase-II, targeted to be completed by
March 2019, connectivity will be provided to the remaining 0.15 million gram panchayats, using an optimal
mix of underground fibre, fibre over power lines, radio and satellite media. As per Bharat Broadband Network
Limited (BBNL), ~0.14 million gram panchayats have been linked with this. Moreover, under the 'Digital India
program', the government also proposed to provide free-high speed Wi-Fi in 2,500 cities and towns, at an
estimated investment of Rs 70 billion. Under the plan, the government aims to set up 50,000-60,000 Wi-Fi
hotspots across the country.
CRISIL Research expects, on completion, these projects will help catalyse the growth of digital services to the rural
masses, and especially to the lower category of the population. This strengthening of digital infrastructure will help
various sectors including healthcare, education, skills training, etc. It would provide the private enterprises with an
opportunity to expand their services in these remote underserved areas.
Priority sector lending aimed at facilitating financial inclusion
The definition of 'priority sector' was formalised in 1972, based on a report submitted by the Informal Study Group on
Statistics, relating to advances to priority sectors, constituted by the RBI in May 1971. The requirement for PSL as a
proportion of Adjusted NBC was set at 33.3% for SCBs in 1979, and raised to the current 40% in 1985. Currently, all
banks including foreign banks need to comply with this 40% requirement.
Targets and sub-targets for banks were further classified under the priority sector and revised at intervals. As per the
latest regulations, unveiled in 2015, medium enterprises, social infrastructure and renewable energy are part of the
priority sector, in addition to the existing categories. Also, non-achievement of priority sector targets has been

68
assessed on a quarterly average basis at the end of the respective year, from fiscal 2017 onwards, instead of
annually.
As per the RBI, these sub-divisions include:
• Agriculture: For all SCBs, 18% of the ANBC or the credit equivalent amount of off-balance sheet exposure
(CEOBE), whichever is higher, is to be extended for agriculture. Within the 18% target for agriculture, a
target of 10% of ANBC or CEOBE, whichever is higher, has been prescribed for small and marginal farmers.
Also, the sub-target of 10% of ANBC or the CEOBE, whichever is higher, is applicable for foreign banks
with 20 branches or more, for lending to small and marginal farmers.
• Social infrastructure: A maximum bank loan of Rs 50 million will be extended per borrower to build social
infrastructure, including schools, healthcare, drinking water, and sanitation facilities, as well as construction/
refurbishment of household toilets and household-level water improvements in tier II to VI centres. Bank
credit to MFIs, extended for on-lending to individuals and to members of self-help groups (SHGs)/ joint
lending groups for water and sanitation facilities, will be eligible for categorisation as the priority sector under
‘social infrastructure’.
• Renewable energy: Bank loans up to Rs 150 million will be given to borrowers for solar-based power
generators, biomass-based power generators, wind mills, micro-hydel plants, and for non-conventional
energy-based public utilities (street lighting systems), and remote village electrification. For individual
households, the loan limit is Rs 1 million per borrower.
• Microcredit: As much as 7.5% of ANBC or the CEOBE for all SCBs should be given in the form of
microcredit. Further, the sub-target of 7.5% of ANBC or CEOBE, whichever is higher, for banks lending to
microenterprises will also be applicable to foreign banks with 20 branches and above from fiscal 2019.
• The RBI has also removed the currently applicable loan limits of Rs 50 million and Rs 100 million per
borrower to micro/small and medium enterprises (services), respectively, for classification under the priority
sector. Accordingly, all bank loans to MSMEs, engaged in the provision or rendering of services as defined
in terms of investment in equipment under the MSMED Act, 2006, will qualify under the priority sector without
any credit cap.
• Advances to weaker sections: 12% of ANBC or the CEOBE, whichever is higher, must to be extended to
weaker sections. Foreign banks with 20 branches or more had to achieve the weaker sections target within
five years, between April 1, 2013 and March 31, 2018, as per the action plan submitted by them and
approved by the RBI.
• Education loans: These include loans and advances granted to individuals only for educational purposes,
including vocational courses, of up to Rs 1 million. These loans and advances will be considered eligible for
the priority sector.
• Housing: The government has tried to bring greater convergence of PSL guidelines for housing loans with
the Affordable Housing Scheme and boost low-cost housing for economically weaker sections and lower
income groups. Thus, it decided to revise the housing loan limits for PSL eligibility from the existing Rs 2.8
million to Rs 3.5 million in metropolitan centres (with a population of 1 million and above), and from the

69
existing Rs 2 million to Rs 2.5 million in other centres, provided the overall cost of the dwelling unit in the
metropolitan centre and at other centres does not exceed Rs 4.5 million and Rs 3 million, respectively.
For foreign banks with less than 20 branches, no specific sub-targets for sectors are laid out. For these banks, up to
32% can be in the form of lending to exports and not less than 8% can be to any other priority sector.
In September 2020, RBI new guidelines for PSL, wherein higher weights would be assigned to districts having a
relatively lower credit penetration. From FY22, a weight of 125% would be assigned to incremental priority sector
credit in identified districts where credit flow is lower and per capita PSL is lower than Rs 6,000. A lower weight of
90% will be assigned to incremental PSL in identified districts where credit flow is relatively higher and per capita
PSL is more than Rs 25,000. Other districts will continue to have the existing weightage of 100%. This will incentivise
credit flow to credit deficient geographies.
Technology and digitalisation to aid financial inclusion in India
In India, technology has significantly improved the accessibility and affordability of financial services that were
previously inaccessible to the unbanked or underbanked masses. In the past nine years, our country has
accelerated the pace of financial inclusion. From 40% of Indian adults with a bank account in 2011, this number
has consistently increased to 80% in 2018 according to the Global Findex Data. However, lower levels of financial
literacy and lack of awareness, especially in rural India has led to only 48% of these accounts being active.
Conventional banking models are not feasible for low ticket size of transactions, deposits, loans, etc. in rural or
remote areas and brick and mortar businesses are proving to be an uneconomical proposition for banks. Improving
mobile and smartphone penetration, robust infrastructure laid down by the government to enable digitisation and
rising number of fintechs in India will help in overcoming the challenges faced by the traditional banking model and
lead to higher financial inclusion.
Fintech companies have been at the forefront of the growth in digital payments in India. These include payment
companies that facilitate P2P and retail payments through mobile wallets or UPI, such as Paytm, PhonePe, PayU,
MobiKwik and FreeCharge, as well as technology companies like Pine Labs and Mswipe who provide hardware and
POS devices for digital payments. The foundational digital infrastructure laid by Aadhaar and the India Stack has
created the business case for many of these growing fintechs. New smartphone users and people exploring digital
payments for the first time can be signed up at minimal costs based on their digital identities. For a number of fintechs,
access to the India Stack is fundamental to their business models. Evolving business models of these fintechs and
Financial Inclusion
Rising mobile and internet penetration
Strong government
focus on Digital India
Increasing number of
fintechs

70
strong focus of government on digitisation from granting licenses to building the infrastructure for digital payments
landscape will lead to improving financial inclusion by tapping the underbanked population of India.
Business opportunities available owing to financial inclusion on the asset and liability side
Factors such as lack of documents, migration of individuals for work or other purposes, lack of transaction history
with financial institutions, etc., have led to low inclusion of households in the financial system. Also, the costs involved
in setting up a network to serve the traditionally ignored categories, such as migrants, rural population, retailers, shop
owners, and MSMEs, is high.
In addition, the gap between various regions of the country, as highlighted above, is very wide. However, owing to
the government’s emphasis and growth of the banking facility in these regions, the gap is slowly getting plugged.
This gives financial institutions an opportunity to expand their services in underserved regions.
Key business opportunities among various population categories - assets and liabilites
Source: CRISIL Research
Migrants - ~100 million migrant workforce
•Remittance services
•Account services
•Deposit services
Retailers - ~24-25 million retail outlets
•Payments
•Loans
• Digitalisation of business functions
MSME - ~63.4 million businesses
•MSME loans
•Working capital finance
•Fee-based services
Rural population - ~ 66% of India's population
•Basic banking services
•Personal loans
•Bill payments and bookings
• Investment in mutual funds and insurance products
•Education loans
•Gold loans

71
Indian banking Industry
Evolution of the Indian Banking Industry
The banking industry plays a crucial role in mobilising savings and stimulating the economic development of a nation.
The banking structure in India has multiple layers to cater to the varied and specific requirements of customers. The
existing banking structure in the country has evolved over several decades and has been serving the credit and
banking services needs of the economy. The evolution of the Indian banking industry can be divided into four phases
following independence. Nationalisation of banks in the first phase was one of the biggest structural reforms the
industry has seen. In the second phase, the Indian economy was liberalised in 1991 to make it more market- and
service-oriented. This move markedly improved the performance and strength of the banking structure. At present,
the Indian commercial banking system is very well-developed and comparable with most of the advanced and
emerging economies in the world.
Development of Indian banking industry
Source: CRISIL Research
Phase I: Nationalisation of banks (up to 1990)
Phase II: Financal sector reforms and
liberalisation of banks (1991 to 2008)
Phase III: Post global financial crisis (2008 to
2014)
Phase IV: Introduction of small finance banks and payments banks (2015
to present)

72
Structural developments in the Indian banking industry and changes related to universal banking licence:
First phase: Nationalisation
of banks (up to 1990)
Second phase: Financial
sector reforms and
liberalisation of banks (1991
to 2008)
Third phase: Post global
financial crisis
(2008 to 2015)
Fourth phase: Introduction
of SFBs and payments
banks (2015 onwards)
.
Key developments:
*Following a series of
mergers and
amalgamations, the number
of commercial banks in the
country decreased from 640
in 1947 to 85 in 1969
*State Bank of India Act,
1955
*State Bank of India
(Subsidiary Banks) Act,
1959
*Bank nationalisation:
Banking Companies
(Acquisition and Transfer of
Undertakings) Ordinance
1969: Government acquired
14 commercial banks with
deposits over Rs 500 million
1980: The government
nationalised six banks with
deposits over Rs 2,000
million
~
Key developments:
January 1993:
The RBI released guidelines
for licencing of new banks
in the private sector. Ten new
banks were formed on the
basis of these guidelines
January 2001:
The RBI revised
the guidelines for new bank
licences. Later, two new
banks — Kotak Mahindra
Bank and YES Bank — were
formed
~
Key developments:
August 2010:
The RBI released a
discussion paper on the entry
of new banks into the private
sector
August 2011:
The RBI released
draft guidelines for licensing of
new banks in the private
sector
February 2013:
The RBI released
final guidelines for licencing of
new banks
September 2013:
A committee was formed,
headed by Bimal Jalan, to
screen the applications
April 2014:
The RBI granted in-principle
approval to IDFC and
Bandhan Financial Services to
set up banks
Key developments:
August 2015:
In-principle approval to 11
applicants to set up payment
banks
September 2015:
In-principle approval to 10
applicants to set up SFBs
August 2016:
Guidelines for ‘on tap’
Licensing of Universal Banks
in the Private Sector
October 2016: Guidelines for
SFBs and payment banks
December 2019:
Guidelines for ‘on tap’
Licensing of Small Finance
Banks in the Private Sector
Source: RBI, CRISIL Research
Phase 1: Nationalisation of banks
Following a spate of mergers and amalgamations, the number of commercial banks in the country decreased from
640 in 1947 to 85 in 1969. The first phase of the Indian banking industry’s evolution is the most prominent one as it
• Nationalisation of 20
banks in two phases
(1969 and 1980)
• 12 new private banks
opened between
1991 and 2008
• Two new private
banks opened during
the period;
• in-principle approval
granted to 11
payment banks & 10
SFBs
•

73
laid down the foundation of the Indian banking industry. It began with the State Bank of India Act (1955), through
which the RBI acquired a controlling interest in Imperial Bank of India and it became State Bank of India. However,
the government later acquired the RBI’s stake in the State Bank of India to avoid any conflict of interest. In a move
to smoothen the functioning of the banking industry, the government passed the State Bank of India (Subsidiary
Banks) Act in 1959, which made eight state banks associates of the SBI.
The biggest reform during the first phase came with the nationalisation of banks, which occurred in two stages. First,
in July 1969, the Government of India acquired 14 large commercial banks with the basic objective of ensuring credit
flow to priority sectors of the economy. Second, in April 1980, six more banks, with cumulative deposits of over Rs
2,000 million, were nationalised. This move increased banking penetration in the country considerably.
Phase 2: Financial sector reforms and liberalisation of banks (1991 to 2008)
The period beginning from the early 1990s witnessed the transformation of the banking sector as a result of the
financial sector reforms that were introduced as a part of structural reforms initiated in 1991. The reform process in
the financial sector was undertaken with the prime objective of creating a strong and resilient banking system. The
progress achieved in the areas of strengthening the regulatory and supervisory norms ushered in greater
accountability and market discipline among the participants.
Since 1991, the size of the Indian economy in terms of GDP at market prices has increased several times.
Consequent to the recommendations of the Narasimham Committee I in 1991, guidelines were released in 1993 with
a minimum capital requirement of Rs 1,000 million for new banks. Under the 1993 guidelines, 10 new private sector
banks received their licence. In the aftermath of the recommendations of the Second Report of the Narasimham
Committee on Banking Sector Reforms, a new set of guidelines were issued in 2001 with the capital requirement of
banks set at Rs 3,000 million. Under the 2001 guidelines, two new private sector banks were licenced.
With competition increasing in the immediate aftermath of liberalisation, credit and deposits continued to grow at a
healthy 19% and 18% CAGR, respectively, between the ends of fiscal 1991 and 2008. Several players in the private
sector acquired critical mass during the phase and the share of private sector increased to 21% by the end of fiscal
2008.
Phase 3: Post global financial crisis (2008 to 2015)
The third phase of the banking evolution started with the global financial crisis. The crisis hit the global banking
industry severely and many big global banks collapsed. Foreign banks operating in India significantly withdrew from
the credit market in several jurisdictions, and more so where they had branch presence. Growth in lending by foreign
banks dropped to 4% and -1% during fiscals 2009 and 2010. The crisis also impacted the growth of the Indian banking
industry. However, compared with advanced economies, India faced the global financial crisis of 2007-09 from a
position of strength, with the limited openness of the Indian financial system working in its favour. To further
strengthen the Indian banking system, multiple measures like Basel III introduction and revised regulatory framework
for NBFCs were undertaken by the RBI after the crisis. On December 30, 2011, the RBI released the draft guidelines
for Indian banks under Basel III. Final guidelines on Basel III Capital Regulations were implemented in India with
effect from April 1, 2013, in a phased manner until March 31, 2019.

74
Phase 4: Introduction of small finance banks and payments banks (2015 to present)
The fourth phase of the banking evolution started with RBI granting small finance bank licenses to ten players and
payment bank licenses to eleven entities in 2015. The objectives of setting up of small finance banks were to further
financial inclusion by provision of savings vehicles, and supply of credit to small business units; small and marginal
farmers; micro and small industries; and other unorganised sector entities, through high technology-low cost
operations. The objectives of setting up of payments banks were to further financial inclusion by providing small
savings accounts and payments/remittance services to migrant labour workforce, low income households, small
businesses, other unorganised sector entities and other users. In October 2016, RBI came out with operating
guidelines for Small Finance Banks and Payments Banks.
In 2016, RBI also notified on guidelines for ‘on tap’ licensing of Universal Banks in the Private Sector with an objective
to increase competition and bring newer ideas into the banking system. Similarly, in December 2019, RBI notified on
guidelines for ‘on-tap’ licensing of Small Finance Banks in the Private Sector with a similar objective to encourage
competition.
In June 2020, the RBI had constituted a five-member IWG (internal working group) headed by Shri Prasanna Kumar
Mohanty to examine existing licensing and regulatory guidelines relating to ownership and control, corporate structure
and other related issues. In November 2020, the report of the IWG was released. Major recommendations of the
group include allowing the large corporate/industrial houses as promoters of banks after necessary amendments to
the Banking Regulations Act, 1949, considering well run large Non-banking Financial Companies (NBFCs, with an
asset size of Rs 500 billion and above, including those which are owned by a corporate house) for conversion into
banks, and relaxing the eligibility criteria for Payments Banks intending to convert to a Small Finance Bank from a
track record of 5 years of experience as Payments Bank to 3 years. Other recommendations revolved around
corporate structure of Non-operative Financial Holding Company (NOFHC), listing requirements for banks,
harmonisation of licensing guidelines, promoter shareholding, initial capital, pledging of shares and ADR/GDR issued
by banks.
Banking industry overview
The Indian banking system currently consists of 12 public sector banks, down from 26 owing to the merger of some
public sector units to make them more relevant, 22 private sector banks, 46 foreign banks, 43 regional rural banks,
11 SFBs, 6 payment banks, 2,550 cooperative banks. All the banks fall under the purview of the RBI.

75
Structure of Indian banking system
All India Financial Institutions includes NABARD, SIDBI, EXIM Bank
Source: RBI, CRISIL Research
Key regulatory developments in the banking sector
Changes in interest rate regime
Effective October 25, 2011, the RBI deregulated the deposit rate on savings bank accounts. It also changed the base
rate calculation methods to reflect the marginal cost of funds. All floating rate rupee loans sanctioned and credit limits
renewed from April 1, 2016 were priced with reference to a bank’s marginal cost of funds-based lending rate
(MCLR,) which is the internal benchmark for such purposes. The RBI issued a circular on September 4, 2019 making
it mandatory for banks to link all floating rate personal or retail loans and floating rate loans to housing, auto and
MSME borrowers to an external benchmark with effect from October 1, 2019. Subsequent to the introduction of this
system, monetary policy transmission improved and it was decided that all new floating rate loans extended to MSME
from April 1, 2020 would be linked to external benchmarks. Effective monetary transmission needs to happen on both
sides, to avoid asset liability mismatch, hence banks would like to look at possibilities of linking their liabilities with
external benchmark. Banks are free to choose one of the several benchmarks indicated in the circular. Banks are
also free to choose their spread over the benchmark rate, subject to the condition that the credit risk premium may
undergo a change only when a borrower’s credit assessment undergoes a substantial change, as agreed upon in
the loan contract.
With the advent of various digital systems and to address various integration issues, there have been efforts to bring
industry-wide standards. With respect to loan pricing, banks are being nudged to link the price of all their loans and
deposits to an external observable benchmark, but no such regulation applies at present.
Reserve Bank of India (RBI)
Financial institutions
Banks
Commercial banks
Scheduled banks
Public sector banks
Private banks
Foreign banks
Small finance banks
Payment banks
Regional rural banks
Non-scheduled
banks
Co-operative banks
NBFCs

76
Developments related to the licencing of Universal banks in the private sector
The share of public sector banks in the total assets of banks declined from over 90% in the early 1990s to ~74% in
March-end 2011. Another drive for providing licences to a limited number of new banks had begun following the
announcement in the Union Budget 2011 and as indicated in the RBI's Policy Statement of April 2010.
Further, in February 2013, fresh guidelines for licencing of new banks were issued. The guidelines, inter alia,
permitted business/industrial houses to promote banks, conversion of NBFCs into banks and setting up of new banks
in the private sector by entities in the public sector through a Non-Operative Financial Holding Company (NOHFC)
structure. The minimum capital requirement for setting up a bank was Rs 5 billion. In 2014, the RBI granted in-
principle approval to IDFC and Bandhan Financial Services to set up banks, both of which commenced operations
in fiscal 2016.
Consolidation of public sector banks
The government has been consolidating public sector banks (PSBs) to create banks with stronger balance sheets,
rationalize capital structure of the banks, improve efficiency of the banks, diversify risk and improve ability to finance
larger projects. The aim is enhance value for stakeholders over a period of time. In 2017, five associated banks (State
Bank of Bikaner & Jaipur, State Bank of Mysore, State Bank of Travancore, State Bank of Patiala and State Bank of
Hyderabad) and Bharatiya Mahila Bank became a part of SBI. In fiscal 2019, Dena Bank and Vijaya Bank was
merged with Bank of Baroda. LIC also acquired a controlling 51% stake in the stressed IDBI Bank
In August 2019, the government further announced its plan to merge 10 state-owned banks into four to strengthen a
sector which is struggling with bad loan clean-up and create banks with stronger balance sheet to boost credit growth.
The banks which were impacted due to this exercise are as follows:
• Oriental Bank of Commerce and United Bank are merged into Punjab National Bank, making it the second
largest nationalised bank in terms of business and branch network
• Canara Bank and Syndicate Bank merged into a single entity, making it the fourth largest PSB after Bank
of Baroda
• Andhra Bank and Corporation Bank were merged into the Union Bank of India, creating the fifth-largest
lender of the country
• Indian Bank and Allahabad Bank were merged into a single unit, making it the seventh-largest PSB
This merged entities became effective from April 1, 2020 onwards and are expected to reap benefits from economies
of scale and synergy with respect to current and saving accounts, network of branches and employees. This exercise
is also expected to bring down operational cost significantly and increase banks’ ability to absorb shocks.
Licencing of SFBs and Payments Banks
In September 2013, Committee on Comprehensive Financial Services for Small Businesses and Low Income
Households, headed by Nachiket Mor, was formed by the RBI. In January 2014, the Nachiket Mor Committee
submitted various recommendations, among which it recommended the formation of two new categories of bank
called Payments Bank and Small Finance Banks. In November 2014, RBI released the final guidelines for Payment

77
Banks and Small Finance Banks. In 2015, RBI gave "in-principle" licences to eleven entities to launch Payments
Banks and awarded Small Finance Bank licences to 10 players. However, of the 11 in-principle payment licensees,
three withdrew their application subsequently. Aditya Birla Idea Payments Bank also closed their operations in
September 2019. The payments bank which are currently operational include Airtel Payments Bank, India Post
Payment Bank (IPPB), Fino Payments Bank, PayTM Payments Bank, NSDL Payments Bank and Jio Payments
Bank.
On-tap Universal banks’ licensing in the private sector
After the successful experience of licensing two universal banks in 2014 and granting final approvals for SFBs and
payment banks, in August 2016, the RBI released the framework for granting ‘on-tap’ licences to universal banks in
the private sector. Under this facility, the RBI accepts applications and grants banking licence throughout the
year. The policy allows aspirants to apply for a universal bank licence at any time, subject to the fulfilment of the set
conditions.
Some of the key eligibility features are:
• Minimum 10 years of successful track record of existing NBFCs (that are resident-owned and controlled) /
promoter / promoting entity / promoter group / entities / group in private sector (that are resident-owned and
controlled). Non-financial business of such entity / group should not account for 40% or more in cases where
the total asset of the entity / group adds to more than Rs 50 billion.
• Initial minimum paid-up voting equity capital of Rs 5 billion. Minimum net worth of Rs 5 billion at all times
(also applicable to NBFCs converting into banks).
• Aggregate foreign investment limit not more than 74%.
• After getting the licence, as per the guidelines, the entity shall get its shares listed on the stock exchanges
within six years of the commencement of business by the bank. The bank shall open at least 25% of its
branches in unbanked rural centres (population up to 9,999 as per the latest census). The bank shall comply
with the priority sector lending targets and sub-targets as applicable to the existing domestic scheduled
commercial banks.
As per the RBI’s guidelines, the licensing window will be open on-tap, and the applications in the prescribed form
along with requisite information could be submitted to the RBI at any point of time. The applications will be referred
to a Standing External Advisory Committee (SEAC) to be set up by the Central bank. The committee will submit its
recommendations to the RBI for consideration. The Internal Screening Committee (ISC), consisting of the governor
and the deputy governors, will examine all the applications and submit its recommendations to the Committee of the
Central Board of the RBI for a final decision to issue in-principle approval. The validity of the in-principle approval
issued by the RBI will be 18 months from the date of granting in-principle approval and would thereafter lapse
automatically.

78
On-tap Small Finance Banks’ licensing in the private sector
RBI, in December 2019, released the final Guidelines for ‘on-tap’ licensing of small finance banks in the private sector
and opened the window for applicants to approach the regulator at any point in time for on-tap licensing of SFBs.
Below are some of the key eligibility features:
• Existing Non-Banking Finance Companies (NBFCs), Micro Finance Institutions (MFIs), and Local Area
Banks (LABs) in the private sector, that are controlled by residents and having successful track record of
running their businesses for at least a period of five years will be eligible to apply for SFB licence.
• Additionally, existing Payments Banks (PBs) which are controlled by residents and have completed five years
of operations will also be eligible to apply for SFB licence.
• The minimum paid-up voting equity capital for small finance banks shall be Rs 2 billion. In case of an existing
NBFC/MFI/LAB/PB, the entity shall have a minimum net worth of Rs 2 billion, or it shall infuse additional paid-
up voting equity capital to achieve net worth of Rs 2 billion within eighteen months from the date of in-principle
approval or as on the date of commencement of operations, whichever is earlier. For cooperative banks, the
entity shall have a minimum net worth of Rs 1 billion, which should be increased to Rs 2 billion within five
years from the date of commencement of operations.
• Listing of the small finance bank will be mandatory within three years after it reaches the net worth of ₹ 5
billion for the first time.
The SFB will be required to maintain a minimum capital adequacy ratio of 15 per cent of its risk weighted assets
(RWA) on a continuous basis, subject to any higher percentage as may be prescribed by RBI from time to time. Tier
I capital should be at least 7.5 per cent of RWAs. Tier II capital should be limited to a maximum of 100 per cent of
total Tier I capital. Basel II norms will be generally applicable to the small finance banks, unless stipulated otherwise.
As per the RBI’s guidelines, the licensing window will be open on-tap, and the applications in the prescribed form
along with requisite information could be submitted to the RBI at any point of time. The applications will be referred
to a Standing External Advisory Committee (SEAC) to be set up by the central bank. The committee will submit its
recommendations to the RBI for consideration. The Internal Screening Committee (ISC), consisting of the governor
and the deputy governors, will examine all the applications and submit its recommendations to the Committee of the
Central Board of the RBI for a final decision to issue in-principle approval. The validity of the in-principle approval
issued by the RBI will be 18 months from the date of granting in-principle approval and would thereafter lapse
automatically.
Recently, in June 2021, RBI gave in-principle approval to Centrum Financial Services to set up a small finance bank
paving a way for the take-over of Punjab & Maharashtra Co-Operative (PMC) Bank Limited. Resilient Innovations
Private Limited (BharatPe) will be an equal partner. The SFB will be guided by the directions and timelines of the RBI
on the amalgamation of PMC Bank Ltd. Shivalik Small Finance Bank has already started operations at the beginning
of this fiscal after receiving approval to do so as an SFB.

79
Regulatory development timeline for banking sector
November 1974: Official notification on priority sector lending norms
• In November 1974, banks were advised to raise the share of these sectors in their aggregate advances to the levelof 33.33% by March 1979
April 1992: Prudential norms and introduction of Basel I in the Indian banking system
• Prudential norms relating to income recognition, asset classification, provisioning and capital adequacy (Basel I) were introduced in a phased manner
January 1993: Reduction in SLR
• A phased reduction in SLR was undertaken from January 1993. SLR was progressively brought down from the peakrate of 38.5% in February 1992 to the then statutory minimum of 25% by October 1997
April 1993: Phased reduction in CRR
• CRR was progressively reduced effective April 1993 from the peak level of 15% to 4.5% by June 2003
April 1993: Rationalisation of lending interest rates
• Rationalisation of lending interest rates was undertaken from April 1993, initially by simplifying the interest ratestipulations and the number of slabs, and later by deregulation of interest rates. Deposit interest rates, other thanthose on savings deposits and FCNR(B), were fully deregulated
April 1997: Phasing out maximum permissible bank finance
• The maximum permissible bank finance (MPBF) was phased out from April 1997
March 2000: Change CAR norms for banks
• In order to strengthen the capital base of banks, the capital to risk-weighted assets ratio for banks was raised to 9%from 8%, from the year ended March 31, 2000
January 2001: Revised guidelines on new bank licences
• The RBI revised the guidelines for new bank licences. Two new banks — Kotak Mahindra Bank and YES Bank —were formed

80
2001-2004: FDI limit in foreign banks
• With a view to liberalising foreign investment in the banking sector, the government announced an increase in the foreign direct investment (FDI) limit in private sector banks under the automatic route to 49% in 2001 and further to 74% in March 2004, including investment by FIIs, subject to guidelines issued by the RBI
February 2005: Policy framework for governance in private sector banks
• A comprehensive policy framework for governance in private sector banks was put in place in February 2005 to ensure (i) ultimate ownership and control was well diversified; (ii) important shareholders were ‘fit and proper’; (iii) directors and CEO were ‘fit and proper’ and observed sound corporate governance principles; (iv) private sector banks maintained minimum capital for optimal operations and for systemic stability; and (v) policy and processes were transparent and fair
February 2005: Guidelines on Basel II issued by the RBI
• In February 2005, the RBI issued the first draft guidelines on Basel II. Initially, the Basel II implementation target was set for March 2007 but was postponed later. The RBI had implemented Basel II standardised approach (for credit and market risks) and basic indicator approach in internationally active banks by March 2008 and other scheduled commercial banks by March 2009
July 2005: Guidelines to banks on purchase / sale of non-performing assets
• To increase the options available to banks for resolving their non-performing assets (NPAs) and to develop a healthy secondary market for NPAs, where securitisation companies and reconstruction companies are not involved, the RBI issued guidelines to banks on purchase / sale of NPAs
November 2005: No-frills account
• Banks were advised to introduce a facility of ‘no-frills’ account with nil or low minimum balances in November 2005
January 2006: Permission to use services of BCs
• In January 2006, banks were permitted to use the services of non-governmental organisations (NGOs/ SHGs), MFIs other civil society organisations as intermediaries in providing financial and banking services through the use of business facilitator and BC models
July 2007: Revision in credit exposure norms for banks
• Revision in exposure norms for banks
July 2010: Introduction of base rate mechanism for lending by banks
• The base rate system was introduced with the aim of enhancing transparency in the lending rates of banks and enabling better assessment of transmission of monetary policy. With effect from July 1, 2010, all categories of domestic rupee loans were priced only with reference to the base rate and this system was applied to all new loans and to old loans that came up for renewal

81
2010-2011: Deregulation of savings rate
• Effective October 25, 2011, the RBI deregulated the deposit rate on savings bank accounts
April 2012: Revisions to the guidelines on securitisation transactions
• Guidelines on the minimum lock-in period and minimum retention criteria for securitised loans originated and purchased by banks and NBFCs. These guidelines also cover prudential treatment of transfer of assets through direct assignment of cash flows and the underlying securities, if any
May 2012: Final guidelines on Basel III implementation
• Guidelines on implementation of Basel III capital regulations in India
July 2014: Revised Basel III norms
• Revised guidelines on Basel III capital regulations implemented in India with effect from April 1, 2013, in a phased manner till March 31, 2019
April 2014: New universal banking licence to IDFC and Bandhan
• In 2014, the RBI granted in-principle approval to IDFC and Bandhan Financial Services to set up banks, both of which started operations in fiscal 2016
April 2015: Revision in priority sector guidelines
• Medium enterprises, social infrastructure and renewable energy to form part of the priority sector. The distinction betweendirect and indirect agricultural priority lending has been dispensed. The priority sector non-achievement would beassessed on a quarterly average basis at the end of the respective year from fiscal 2017 onwards, instead of annual basisas at present
August 2015: Introduction of payment banks
• In-principle approval for setting up payments banks were granted to 11 applicants on August 19, 2015
September 2015: Introduction of SFBs
• On September 16, 2015, in-principle approvals were granted to 10 applicants for setting up SFBs
May 2016: Promulgation of the Insolvency and Bankruptcy Code
• A watershed event that has allowed the valuation of age-impaired assets to be put in persepective. While the transfer of such assets to various asset reconstruction companies was not effective owing to valuation issues, IBC, through its auction mechanism, allows such assets to have executable bids
August 2016: Guidelines for ‘on tap’ Licensing of Universal Banks in the Private Sector
• Focusing towards increasing the level of competition and bringing new ideas in the system, the RBI decided to grant on-tap universal banking licences to the applicants that satisfy the eligibility criteria
October 2016: Introduction of marginal cost of funds-based lending rate
• This new methodology replaces the base rate system introduced in July 2010. All rupee loans sanctioned and credit limitsrenewed w.e.f. April 1, 2016 are being priced with reference to the MCLR

82
Source: RBI, company reports, CRISIL Research
Systemic credit growth to revive in fiscal 2022
Corporate credit determines the growth in overall credit as it accounts for nearly two-third of systemic credit. Overall
systemic non-retail credit grew ~9% in fiscal 2019, driven by mainly public sector undertakings and energy sector (oil
and gas and power generation and distribution). The corporate credit of banks grew just ~3% on-year as of March
2019, as demand dropped sharply, and alternate capital market channels opened up. The financial sector, which
October 2016: Guidelines for SFBs and payment banks
• Considering payments banks and SFBs’ differentiated nature of business and their focus on financial inclusion, separate operating guidelines for these banks were issued in October 2016. The guidelines elaborate the areas of prudential regulations, risk management, ownership and control regulations, corporate governance, and banking operations to be adhered to by these banks
November 2016: Withdrawal of legal tender character of existing Rs 500 and Rs 1,000 bank notes
• Withdrawal of currency notes with denominations of Rs 500 and Rs 1,000 from circulation with actions to be taken by citizens and procedure for exchange of the notes and the provision for such facility along with further reporting mechanism for the banks were notified
December 2016: Final guidelines on large exposure framework
• Towards aligning the exposure norms for Indian banks with the Basel Committee of Banking Supervision standards and to further diversify the banks’ lending base, on December 1, 2016, the RBI issued final guidelines on LEF, effective April 1, 2019. The exposure limits will consider a bank’s exposure to all its counterparties and groups of connected counterparties
December 2018: Guidelines on loan system for delivery of bank credit
• To enhance credit discipline among larger borrowers, the guidelines on the loan system for delivery of bank credit were finalised wherein the minimum level of loan component, effective date of loan, share of woirking capital of loan, amount and tenor of loan, repayment/rollover/renewal of loan component and risk weights related guidelines were issued
June 2019: Revised prudential framework on stressed assets
• In addition to building an incentive for early adoption of a resolution plan, its applicability was also extended to SFBs, NBFC -SI, deposit-taking NBFCs and All India Term Financial Institutions
December 2019: Guidelines for ‘on tap’ Licensing of Small Finance Banks in the Private Sector
• After a review of the performance of the existing small finance banks and to encourage competition, the Reserve Bank, after gaining experience in dealing with these banks, has considered ‘on tap’ licensing of these banks. Under this facility, the RBI accepts applications and grants small finance banking licence throughout the year.
September 2020: Banking Regulation (Ammendment) Bill, 2020
• Lok Sabha passed banking Regualtion Ammendment Bill, 2020 to bring urban and multi-state co-operative banks under the supervision of the RBI.
• The bill allows RBI to initiate a scheme for reconstruction of a bank without placing it under moratorium. Also, if the RBI imposes moratorium on a bank, the lender can not grant any loans or make investments in any credit instruments during the moratorium tenure.
• The co-operative banks will be allowed to issue equity, preference, or special shares on face value or at a premium to its members, or to any other person residing within their area of operations. The banks may also issue unsecured debentures or bonds or similar securities with maturity of ten or more years to such persons. Such issues can be made only after prior approval from RBI.

83
was already reeling under the NBFC liquidity crisis, saw financial institutions turn cautious towards corporate lending
and shift their focus towards the retail segment. While this shift has caused retail credit to drive overall credit growth,
it witnessed a slowdown in growth from 18% in fiscal 2018 to 15% in fiscal 2019 on account of a slump in
consumption. The slowdown in economic activity, coupled with heightened risk aversion among lenders, has further
tightened the overall credit growth to ~6% in fiscal 2020. Retail credit grew by 13.5% in fiscal 2020.
Overall systemic credit growth took a hit in first half of fiscal 2021 on account of a significant slowdown in retail credit
and intensifying Covid-19 pandemic which triggered a national lockdown. The pandemic came as a jolt for an already
slowing economy with a decadal low growth in GDP, low private consumption, cautious lending by financial
institutions, poor capital expenditure (capex), and in turn, weakening credit growth. However, with a slew of
government and regulatory measures announced, Indian economy is reviving in the second half of the fiscal. In fiscal
2021, credit is estimated to have grown by ~6% supported by an uptick in economic activity along with pent-up and
festive demand. In fiscal 2022, as a result of the budgetary push towards investments, sharp economic recovery and
pick-up in private investment, systemic credit growth is expected to pick up to around 8-10% levels. In the following
fiscal (FY23), we project systemic credit growth to be in-line with expected nominal GDP growth.
Systemic growth to bounce back in fiscal 2022 and 2023
Note: P: Projected ; Systemic credit includes domestic banking credit, NBFC credit, commercial papers, external borrowings,
corporate bonds excluding those issued by Banks and NBFC
Source: RBI, Company Reports, CRISIL Research
Deposit growth to moderate in fiscal 2022 with expected increase in
spending
The banking sector enjoyed double-digit deposit growth of ~13% between fiscals 2013 and 2015, driven by highly
competitive deposit rates offered by the sector and growing demand for deposits. However, this strong growth slowed
to ~7% in fiscal 2016 as the Reserve Bank of India (RBI) cut the repo rate. Subsequently, banks followed suit by
reducing deposit and lending rates.
Due to demonetisation in the second half of fiscal 2017, deposit growth jumped back to ~10% with households
depositing their savings with banks. As a result, during this period, the deposit-to-household-savings ratio also rose
93 101 108
118 134
143 152
165 181
198
12.7%
8.6%
6.5%
9.0%
13.7%
6.6% 6.4%
8.3%
9.9% 9.5%
0.0%
2.0%
4.0%
6.0%
8.0%
10.0%
12.0%
14.0%
16.0%
-
50
100
150
200
250
FY2015 FY2016 FY2017 FY2018 FY2019 FY2020 FY2021 FY2022P FY2023P FY2024P
Systemic Credit Growth rate

84
significantly, from 26% in the previous fiscal to near 39% in fiscal 2017. In fiscal 2018, deposit growth rate fell to its
lowest in over 55 years to ~6%, as the effect of demonetisation subsided, and households moved their savings from
deposits to other lucrative instruments such as shares and debentures. However, in fiscal 2019, deposit growth
picked up and clocked 9%, in the wake of capital market volatility and higher deposit rates offered by the banks. In
addition, inclusion of more people under the formal financial services channel improved deposit mobilisation as
players continued to expand in the unbanked area.
In fiscal 2020, with slowdown in the economy, deposits grew at a moderate ~8%. The banking sector witnessed
movement of deposits from private sector banks to public sector banks as one of the private sector bank's gross
NPAs spiralled. Towards the end of fiscal 2020, Yes Bank was put under moratorium for 30 days, wherein withdrawal
of deposits was restricted before a management change was effected by the regulator and the central government.
With lending linked to an external benchmark and in a falling interest cycle scenario, banks have reduced deposit
rates to preserve spread.
With the Covid-19 pandemic, nationwide lockdowns and sluggish economic activity, consumer spending took a hit in
fiscal 2021. Although the pandemic impacted the income levels, deposits have grown~12% year-on-year as of March
2021. The growth in deposits can be attributed to reduction in spending by consumers and the safe haven provided
by banks as people turned risk averse in the aftermath of the pandemic. History too suggests that savings rate tends
to increase in uncertain times such as pandemics.
In fiscal 2022, deposits growth is expected to moderate on account of higher spending as the economy revives from
the impact of pandemic. Moreover, owing to high deposits growth in fiscal 2021, banks are well placed to support the
credit growth. With banks reducing the interest rates in line with market rates, investors are expected to seek alternate
avenues to park their funds leading to moderate growth of 6-8% CAGR in deposits between fiscals 2021 and 2024.
Deposits across banks are expected to grow at 6-8% till fiscal 2024 (Rs trillion)
Source: RBI, CRISIL Research
Private Banks continue to improve their share in banking deposits
89.2 96.0
107.3 114.3
126.4
154.4167.1
178.4 190.9
Mar-16 Mar-17 Mar-18 Mar-19 Mar-20 Mar-21 Mar-22P Mar-23P Mar-24P

85
Note: Payments bank share for FY21 is calculated based on FY20 data.
Source: RBI, CRISIL Research
The share of SFBs in deposits as well as credit has seen a steady rise over the years and is expected to reach 1%
and 1.5% respectively by fiscal 2024 from the current 0.6% and 1.0% in deposits and credits in fiscal 2021. This will
be on the back of robust growth on account of focused penetration and on the ground reach of these entities in
comparison to the other more established player groups.
SFBs share in overall banking credit and deposit to grow
Note: E: Estimated
Source: RBI, CRISIL Research
Share of current and savings deposits increased in fiscal 2021
FY16 FY17 FY18 FY19 FY20 FY21
Payment Banks 0.0% 0.0% 0.0% 0.01% 0.03% 0.03%
SFBs 0.0% 0.0% 0.2% 0.3% 0.5% 0.6%
RRBs 3.2% 3.4% 3.4% 3.4% 3.4% 3.3%
Foreign Banks 4.6% 4.2% 4.2% 4.5% 4.8% 4.9%
Private Banks 21.5% 23.0% 25.4% 28.7% 28.9% 29.9%
PSBs 70.6% 69.4% 66.8% 63.1% 62.4% 61.3%
0.00% 0.00%
0.2%0.3%
0.5%0.6%
1.00%
0.40%0.50%
0.60%0.70%
0.90%1.00%
1.50%
0.00%
0.20%
0.40%
0.60%
0.80%
1.00%
1.20%
1.40%
1.60%
FY16 FY17 FY18 FY19 FY20 FY21E FY24E
SFB share in Banking Deposit SFB share in Banking Credit

86
Note: Data includes data for banking deposits of public sector banks, private sector banks, regional rural banks, foreign banks
and SFBs
Source: RBI, CRISIL Research
State-wise deposits and share of various deposits (FY21)
States
Total
Deposits
(Rs bn)
3-year
CAGR
Share of
deposits in
India
Current
Deposits
Saving
Deposits
Term
Deposits
Maharashtra 30,535 10% 20% 15% 22% 63%
Delhi 13,988 7% 9% 11% 24% 65%
Uttar Pradesh 12,872 10% 8% 6% 49% 44%
Karnataka 12,153 13% 8% 11% 31% 58%
Tamil Nadu 10,209 12% 7% 10% 33% 56%
West Bengal 9,091 8% 6% 8% 35% 57%
Gujarat 8,473 10% 5% 9% 34% 57%
Telangana 6,217 14% 4% 18% 32% 50%
Kerala 6,105 12% 4% 5% 32% 62%
Haryana 5,571 15% 4% 10% 37% 54%
Rajasthan 4,788 12% 3% 7% 42% 50%
Punjab 4,670 10% 3% 4% 38% 57%
Madhya Pradesh 4,585 10% 3% 7% 42% 51%
Bihar 4,021 8% 3% 6% 58% 36%
Odisha 3,703 11% 2% 6% 39% 56%
Andhra Pradesh 3,665 10% 2% 7% 41% 52%
Jharkhand 2,589 9% 2% 7% 41% 53%
10% 9% 9% 9% 9% 9% 10%
26% 28% 32% 33% 33% 33% 34%
64% 63% 59% 58% 58% 58% 56%
0%
10%
20%
30%
40%
50%
60%
70%
80%
90%
100%
FY2015 FY2016 FY2017 FY2018 FY2019 FY2020 FY2021
Current Savings Term

87
States
Total
Deposits
(Rs bn)
3-year
CAGR
Share of
deposits in
India
Current
Deposits
Saving
Deposits
Term
Deposits
Chhattisgarh 1,769 10% 1% 9% 47% 44%
Assam 1,756 9% 1% 8% 51% 42%
Uttarakhand 1,668 11% 1% 5% 41% 54%
Jammu and Kashmir 1,433 11% 1% 10% 43% 47%
Himachal Pradesh 1,131 10% 1% 3% 37% 60%
Goa 861 9% 1% 4% 28% 67%
Chandigarh 824 10% 1% 7% 32% 61%
Tripura 287 9% 0% 6% 47% 47%
Meghalaya 262 7% 0% 13% 47% 40%
Puducherry 225 10% 0% 6% 36% 59%
Arunachal Pradesh 199 14% 0% 16% 46% 38%
Nagaland 137 11% 0% 21% 46% 33%
Manipur 126 12% 0% 21% 57% 22%
Mizoram 123 13% 0% 9% 54% 37%
Dadra and Nagar
Haveli and Daman
and Diu
118 11% 0% 9% 43% 48%
Sikkim 111 9% 0% 7% 38% 55%
Andaman & Nicobar
Islands 62 10% 0% 10% 52% 38%
Ladakh 62 NA 0% 17% 47% 36%
Lakshadweep 13 8% 0% 3% 80% 17%
Total 154,400 10% 100% 10% 34% 56%
Note: Data includes data for banking deposits of public sector banks, private sector banks, regional rural banks, foreign banks
and SFBs
Source: RBI, CRISIL Research
With increasing financial penetration and access to financial services in the rural and semi-urban areas, the share of
deposits in these areas have also increase over the last ten years. While the share of metropolitan areas in the
deposits distribution has reduced over the years, share of urban areas has remained stable and semi-urban areas
have seen an increase in share of deposits.
Share of bank deposits in rural and semi-urban areas has increased over the last decade

88
Source: RBI, CRISIL Research
CASA deposits to grow faster in rural and semi-urban areas
Source: RBI, CRISIL Research
57% 53% 51% 51%
21% 22% 22% 22%
13% 15% 16% 16%
9% 10% 11% 11%
0%
10%
20%
30%
40%
50%
60%
70%
80%
90%
100%
FY10 FY15 FY20 FY21
Metropolitan Urban Semi-urban Rural
12% 12%
13%
12%
14%
11%
5%
6%
7%
8%
9%
10%
11%
12%
13%
14%
15%
2015-2021 2021-2025 P
CAGR %
Rural Semi-urban Urban

89
Comparison of different business models
Universal Banks Small Finance Bank Payments Bank
Products
Products
offered
• Full spectrum of
banking, savings,
investment and
insurance products
• Can offer savings and investment
products apart from credit products /
loans
• Can act as Corporate Agent to offer
insurance products
• Cannot act as Business
Correspondent to other banks
• Banking services - Demand
deposits, ATM/Debit cards,
payments and remittance
services
• Other ancillary services –
Cash Management
Services, Recharges, Bill
Payments, Fast Tag etc.
• Can act as Business
Correspondent to another
bank and offer savings,
deposits, credit and
investment products
• Can act as Corporate Agent
to offer insurance products
and loan products
Prudential norms
Capital
adequacy
framework
• Minimum Tier 1 capital:
7%
• Minimum capital
adequacy ratio: 9%
• Minimum Tier 1 capital: 7.5%
• Minimum capital adequacy ratio:
15%
• Minimum Tier 1 capital:
7.5%
• Minimum capital adequacy
ratio: 15%
NIM • No Margin Cap • No Margin Cap • No Margin Cap
CRR / SLR • Maintenance of
CRR/SLR ratio
mandatory
• CRR – 4%
• SLR – 18.75%
• Maintenance of CRR/SLR ratio
mandatory
• CRR – 4%
• SLR – 18.75%
• Maintenance of CRR/SLR
ratio mandatory
• CRR – 4%
• SLR - 75% ( of its demand
deposit balances)
Leverage ratio • Minimum leverage ratio
of 4%
• Minimum leverage ratio of 4% • Minimum leverage ratio of
3%
LCR (liquidity
coverage ratio)/
NSFR (net
stable funding
ratio)
• Mandatory requirement
to maintain liquidity
coverage ratio
• NSFR applicable to
scheduled commercial
banks
• Minimum liquidity coverage ratio of
100% by Jan 1, 2021
• NSFR will be applicable to SFBs on
par with scheduled commercial
banks as and when finalized
• No such requirement
Priority sector lending
Targeted
lending to
sectors
• 40 percent for priority
sector lending of their
Adjusted Net Bank
Credit (ANBC) or
equivalent off-balance
sheet exposure
(whichever is higher)
• 75 per cent for priority sector
lending of their Adjusted Net Bank
Credit (ANBC)
o 18% of ANBC to Agriculture
o 7.5% of ANBC to micro-
enterprises
o 10% of ANBC to weaker
sections
• Cannot undertake lending
activities

90
o 18% of ANBC to
Agriculture
o 7.5% of ANBC to
micro-enterprises
10% of ANBC
to weaker
sections
• At least 50 per cent of loan portfolio
should constitute loans and
advances of upto Rs. 2.5 million
Bank loans /
market funding
• Access to broader array
of market borrowings
• Access to broader array of market
borrowings
• No access to bank loans
• Access to call money and
CBLO market
Source: RBI, CRISIL Research

91
Global trends in banking
Players in the banking ecosystem in India would need to be cognisant of global trends and new sources of emerging
competition, and accordingly refine their strategies. Globally, the following factors are reshaping competitive
dynamics:
Web-only banks acting as strong competitors to traditional counterparts: Globally, web-only banks (also known
as neobanks) have started eating into the market share of traditional financial institutions in both assets and liabilities.
These banks have been able to wean away customers from large established financiers by offering attractive rates
of interest on deposits and easier availability of loans. They have, however, still not been able to become the primary
account of the customer (salaries, for example, continue to be with traditional banks). For example, Marcus, the
digital consumer financial service platform of Goldman Sachs, had $97 billion online retail deposits as of December
2020 ($60 billion as of December 2019) and in the UK, neobanks, Monzo and Revolut, together have ~17 million
customers as of March 2021, i.e. 25% of the country’s population.
Open banking making customer data available to challengers as well: Technically, open banking refers to a
system in which financial institutions’ data can be shared for users and third party developers through open
application programming interface (API). In simple words, it requires financial institutions to make available customer
data to third party service providers, subject to receiving the required authorisation from customers.
Through open banking, financial institutions can access a single view on customer’s entire financial profile across
multiple institutions, thereby allowing them to serve the customers better and manage risks efficiently. In the US,
some large banks, such as JPMorgan Chase & Co, Wells Fargo & Company, and Citigroup Inc, have begun to create
their own API networks for open banking.
Open banking came into prominence with the implementation of the 2015 Revised Payment Service Directive in the
European Union (EU) and the 2017 open banking directive in the UK. Since then, the movement towards open
banking has been gaining ground around the world with the movement towards open banking, pure access to
customer data will cease to be a source of competitive advantage for financial institutions in the long run.
Entry of new types of players in lending
Enormous amount of data is collected by players operating in payments, social media, cab aggregation,
entertainment, e-commerce, retail logistics, and the food delivery spaces. Using this data, they analyse customer
preferences, spending pattern, online footprints, and behavior which helps them in offering seamless, speedy, and
customised services to their customers. These companies have also started exploring opportunities in credit by
leveraging on this data.
For example, in the US, Amazon provides working capital loans to merchants operating on its platform. PayPal
Holdings has made a mark in lending to small businesses by leveraging transaction data rather than data from lending
relationships. In India, too, more players in consumer-facing businesses with a repository of data are expected to
enter the lending business, which will drive faster expansion of the addressable market.

92
Digitization of transactions and payments in India
Overview and Trends
The Indian digital payment space has seen extraordinary growth in the last few years. The growth has been driven
by multiple factors like launch of new payment products, increasing smartphone penetration, increasing mobile
internet users driven by lower data charges and a strong push from the government in order to increase adoption of
digital channels. The government has used levers such as ubiquitous availability of mobile broadband, increase in
smart phone penetration and various incentives for the use of digital payment products to support the country’s digital
payments journey. In 2008, Reserve Bank of India (RBI) and Indian Bank’s Association (IBA) established National
Payments Corporation of India (NPCI) to create a robust payment and settlement infrastructure in India. Since, then
numerous regulations and guidelines have been passed to facilitate and boost the growth of digital payments in India.
NPCI has a diversified shareholding structure with several prominent public and private sector banks, SFBs as well
as players offering payment services picking up stake in NPCI over a period of time. As of November 2020, NPCI
had 67 shareholders. At the time of its inception, NPCI had ten core promoter banks – State Bank of India (SBI),
Punjab National Bank (PNB), Bank of Baroda (BOB), Canara Bank, Union Bank of India, Bank of India, HDFC Bank,
Citibank, HSBC and ICICI Bank.
Evolution of digital payments space in India
Source: NPCI, RBI, IndiaStack.org, CRISIL Research
Over the last decade, NPCI has launched various innovative products like Unified Payment Interface (UPI), National
Electronic Toll Collection (NETC) and Bharat Bill Pay Service (BBPS), AADHAR Enabled Payment System (AePS)
and other retail payment and settlement systems. The convenience of these payments systems along with ubiquitous
availability of mobile broadband has ensured acceptance as they provided consumers an alternative to the use of

93
cash and paper for making payments. The participation of non-bank fintechs in the payment ecosystem in the form
of Prepaid Payment Instruments (PPI) issuers, Bharat Bill Payment Operating Units (BBPOUs) and other third party
application providers in the UPI platform has furthered the adoption of digital payments in India. Further, in April 2020,
to increase the global outreach of NPCI payments systems, a subsidiary NPCI International Payments Limited (NIPL)
was established to export offerings of NPCI in the foreign markets with primary focus on internationalisation of RuPay
and UPI.
These innovations have led to the emergence of various players such as Payments Bank (such as PayTM Payments
Bank and Fino Payments Bank), Fintechs (such as Razorpay, PayU, and PayTM) and incumbent banks (such as
Axis, HDFC Bank, ICICI Bank) too have launched their own digital payment platforms. Consumer apps provided by
Google (Google Pay), Amazon (Amazon Pay) and Walmart (PhonePe) have created a strong presence in UPI
payments to strengthen their foothold in the digital payments space. These fintechs and usage of their application for
payments is also helping the consumers create formal transaction records, which will ease access of credit in times
to come.
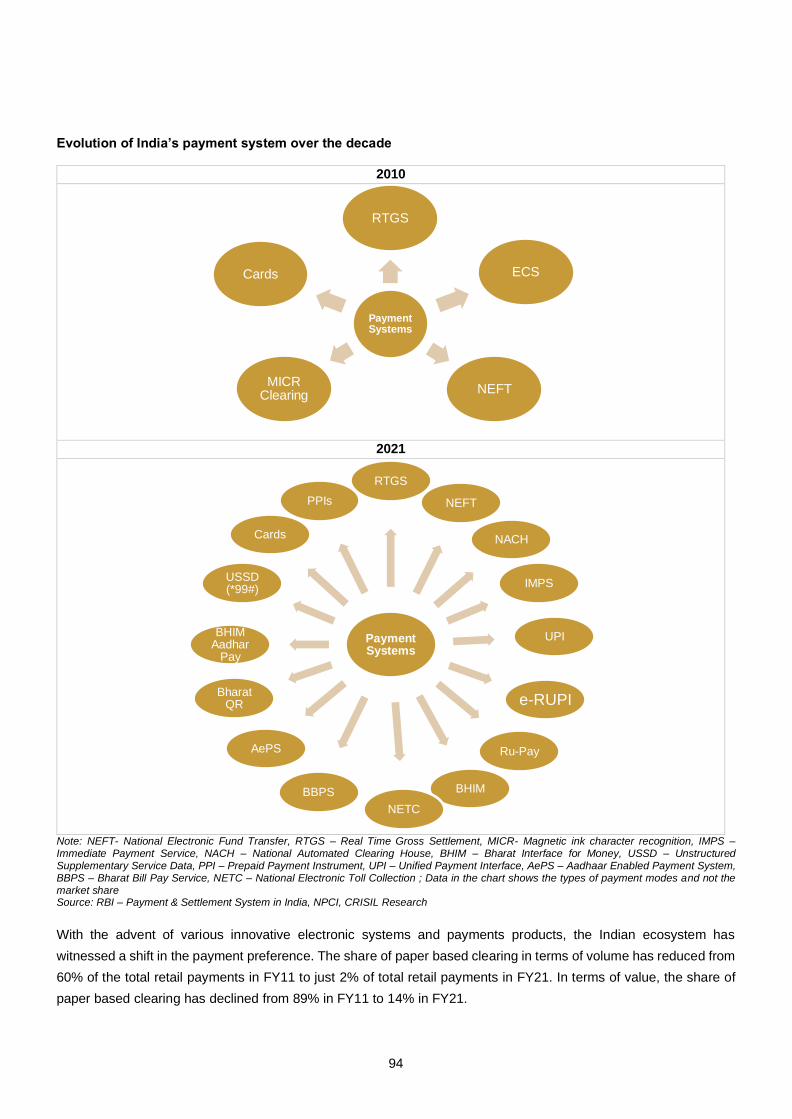
94
Evolution of India’s payment system over the decade
2010
2021
Note: NEFT- National Electronic Fund Transfer, RTGS – Real Time Gross Settlement, MICR- Magnetic ink character recognition, IMPS – Immediate Payment Service, NACH – National Automated Clearing House, BHIM – Bharat Interface for Money, USSD – Unstructured Supplementary Service Data, PPI – Prepaid Payment Instrument, UPI – Unified Payment Interface, AePS – Aadhaar Enabled Payment System, BBPS – Bharat Bill Pay Service, NETC – National Electronic Toll Collection ; Data in the chart shows the types of payment modes and not the market share Source: RBI – Payment & Settlement System in India, NPCI, CRISIL Research
With the advent of various innovative electronic systems and payments products, the Indian ecosystem has
witnessed a shift in the payment preference. The share of paper based clearing in terms of volume has reduced from
60% of the total retail payments in FY11 to just 2% of total retail payments in FY21. In terms of value, the share of
paper based clearing has declined from 89% in FY11 to 14% in FY21.
Payment Systems
RTGS
ECS
NEFTMICR
Clearing
Cards
Payment Systems
RTGS
NEFT
NACH
IMPS
UPI
e-RUPI
Ru-Pay
BHIM
NETC
BBPS
AePS
Bharat QR
BHIM Aadhar
Pay
USSD (*99#)
Cards
PPIs

95
Share of retail payment system by volume (FY21)
FY11 Transaction Volume - 2.3
billion
FY20 Transactions Volume – 35.2
billion
FY21 Transactions Volume –
44.2 billion
Note: Retail electronic include credit transfers (NEFT, IMPS, UPI) and direct debit transfers (ECS & NACH)
Source: Payment and Settlement System in India - RBI, CRISIL Research
Retail electronic payment mix by volume (FY21)
FY11 Transaction Volume –
0.4 billion
FY20 Transaction Volume-
21.5 billion
FY21 Transaction Volume-
32.8 billion
Source: Payment and Settlement System in India - RBI, CRISIL Research
Paper, 60%
Retail Electronic,
18%
Card Payments, 22%
PPIs, 0%
Paper, 3%
Retail Electronic, 61%
Card Payments,
21%
PPIs, 15%
Paper, 2%
Retail Electronic, 74%
Card Payments, 13%
PPIs, 11%
NEFT, 33%
NACH, 67%
NEFT, 13%
IMPS, 12%
UPI, 58%
NACH, 17%
ECS, 0%
Others, 0%
UPI, 57%
IMPS, 7%
NACH, 5%
NEFT, 6%
ECS, 0%
Others, 25%

96
Share of retail payment system by value (FY21)
FY11 Transaction Value-
Rs. 114.4 trillion
FY20 Transaction Value –
Rs. 389.8 trillion
FY21 Transaction Value –
Rs. 415.1 trillion
Note: Retail electronic include credit transfers (NEFT, IMPS, UPI) and direct debit transfers (ECS & NACH)
Source: Payment and Settlement System in India - RBI, CRISIL Research
Retail electronic payment mix by value (FY21)
Source: Payment and Settlement System in India - RBI, CRISIL Research
With changing dynamics, banks and other financial institutions have also adopted newer business models. Payment
infrastructure, which earlier used to be a cost centre for banks, has now turned into a core offering and a point of
creating differentiation. The customers are now seeking ease of transaction at cost effective prices across various
platforms. This has also led to strong collaboration between banks and fintechs to enable payments modernization
and financial inclusion.
Paper, 89%
Retail Electronic,
10%
Card Payments, 1%
PPIs, 0%
Paper, 20%
Retail Electronic, 75%
Card Payments, 4%
PPIs, 1%
Paper, 14%
Retail Electronic,
83%
Card Payments, 3%
PPIs, 0%
FY11 Transaction Value –
Rs. 12 trillion
FY20 Transaction Value –
Rs. 294 trillion
FY21 Transaction Value –
Rs. 289 trillion
NEFT, 79%
NACH, 21%
NEFT, 78%
IMPS, 8%
UPI, 7%
NACH, 7%
ECS, 0%
Others, 0%
UPI, 14%
IMPS, 8%
NACH, 5%
NEFT, 69%
ECS, 0%
Others, 3%

97
Digital & Cash Transactions
Surge in digital transaction volumes reflected in rising share
While usage of cash remains high, particularly in person-to-merchant transactions in India, we have observed a surge
in digital transactions in the past few years, led by government and regulatory initiatives and changing consumer
preferences. JAM (Jan Dhan, Aadhaar and Mobile), demonetisation of high-value currency notes in November 2016,
implementation of GST in July 2017 and unveiling of the Unified Payments Interface, or UPI, are some of the notable
regulatory initiatives that have spurred growth in the space. Digital payment volumes (digital transactions includes,
Retail Electronic Clearing, Prepaid Payment Instruments, RTGS – excluding interbank clearing, ECS, NEFT, IMPS,
NACH and card transactions at ATM) have more than tripled in the last three years ending FY20.
In volume terms, digital payments transactions have logged a CAGR of 49% from fiscal 2015 to fiscal 2021 owing to
factors such as a younger population, rising smartphone penetration, increasing mobile internet users, convenience
of transacting digitally, and booming ecommerce sector. The transaction value of digital payments witnessed a CAGR
of 9% to reach Rs. 1,379 trillion in fiscal 2021 from Rs 823 trillion in fiscal 2015. The growth rate came down slightly
in the immediate aftermath of changes in KYC norms, including voluntary use of Aadhaar identification, being made
applicable to prepaid payment instrument (PPI) companies in March 2018, but has bounced back since then. In fiscal
2021 as well, while digital payments transaction volume grew by 14%, transaction value declined by ~15%, mainly
owing to a sharp contraction of RTGS payments as a result of Covid-19.
In Q1FY22, transaction volumes for digital payments reached 12.8 billion as compared to 7.2 billion in Q1FY21,
thereby registering a growth of 77% on year. The transaction value of digital payments also witnessed a growth of
27% to reach Rs. 365 trillion in Q1FY22 as compared to Rs 286 trillion in Q1FY21. Going forward, the trend is
expected to continue as digital payments gain in popularity and become more ubiquitous.
The value of digital transactions as a proportion of private consumption expenditure in between fiscal 2015 and fiscal
2021 also rose from 1136% to 1245%, which shows that the usage of digital transactions for consumption has been
on the rise over the past few years.
Digital transaction value as a % of private final consumption expenditure (PFCE)
Note: E: Estimated, PFCE is based on current prices
Source: RBI, CRISIL Research
1136% 1132%1231%
1359%1444%
1319%1245%
0%
200%
400%
600%
800%
1000%
1200%
1400%
1600%
FY15 FY16 FY17 FY18 FY19 FY20 FY21

98
Rapid growth in number of digital payments transactions in India
Note: Digital transactions includes Retail Electronic Clearing, PPIs, RTGS – excluding interbank clearing, ECS, NEFT, IMPS, UPI,
Mobile Banking, NACH & card transactions at ATMs
Source: RBI, CRISIL Research
Digital payments transactions growth (in value terms) mirrors the rise in volumes
Note: Digital transactions includes Retail Electronic Clearing, PPIs, RTGS – excluding interbank clearing, ECS, NEFT, IMPS, UPI,
Mobile Banking, NACH & card transactions at ATMs
Source: RBI, CRISIL Research
In fiscal 2021, retail electronic digital transaction such as UPI, AePS, NETC and BBPS saw a sharp rise in transaction
volumes as people preferred to transact via contactless payments system, owing to outbreak of Covid-19, However,
the usage of debit and credit cards at POS machines at retail shops saw a decline as most of shops selling non-
essential goods, remained shut for almost first half of the year. In fiscal 2021, retail digital payment transaction volume
3.7 6.3 10.7
16.6
29.6 35.8
40.9
12.8
0.0
5.0
10.0
15.0
20.0
25.0
30.0
35.0
40.0
45.0
FY
15
FY
16
FY
17
FY
18
FY
19
FY
20
FY
21
Q1F
Y22
(Transactions in billion)
Digital Payments Volume
823 920 1,122
1,370 1,630 1,623
1,379
365
0
200
400
600
800
1,000
1,200
1,400
1,600
1,800
FY
15
FY
16
FY
17
FY
18
FY
19
FY
20
FY
21
Q1F
Y22
(Rs trillion)
Digital Payments Value

99
and value grew by 14% and 13% respectively to reach 40.8 billion and Rs. 353 trillion. Going forward as well, the
convenience of digital payments, ease of usage, and recipients also increasingly preferring digital payments would
result in some sections of consumers continuing to prefer this medium. This, along with the continuous rise in retail
spends, will drive growth for digital transactions.
Retail digital payment transaction volumes have grown at 53% CAGR between 2015 and 2021…
Note: Retail digital payments include all digital payments except RTGS and Paper Clearing
Source: RBI, CRISIL Research
…Value growth in retail digital payments transactions also extremely strong
Note: Retail digital payments include all digital payments except RTGS and Paper Clearing
Source: RBI, CRISIL Research
3.2 6.2
10.6
16.5
29.5
35.7
40.8
12.8
0
5
10
15
20
25
30
35
40
45
50
FY15 FY16 FY17 FY18 FY19 FY20 FY21 Q1FY22
Retail digital payments volume
81 96
140
203
274 312
353
91
0
50
100
150
200
250
300
350
400
450
500
FY15 FY16 FY17 FY18 FY19 FY20 FY21 Q1FY22
Retail Digital Payments Value
(in Rs. trillion)
(Transactions – in billions)

100
Split of Retail digital payments (FY20)
Transactions volume – 35.9 billion Transaction value – Rs. 312 trillion
Source: RBI, NPCI, CRISIL Research
Split of Retail digital payments (FY21)
Transactions volume – 40.8 billion Transaction value – Rs. 353 trillion
Source: RBI, NPCI, CRISIL Research
On January 1, 2021, the RBI launched a composite Digital Payments Index (DPI) to capture the extent of digitization
of payments across the country with March 2018 as the base period. The index comprises of five major parameters
to measure the penetration of digital payments. These include payment enablers, payment infrastructure – demand
side factors, payment infrastructure – supply side factors, and payment performance and consumer centricity. Each
of these parameters have certain sub-parameters, which in turn consists of various measurable indicators.
UPI, 35.4%
NETC, 1.6%
BBPS, 0.4%
Cards, 20.7%
AePS, 1.2%
PPI, 15.1%
IMPS, 7.3%
NEFT, 7.8%
NACH, 10.5%
UPI, 6.8%
BBPS, 0.1% Cards,
4.9%
AePS, 0.4%
PPI, 0.7%
IMPS, 7.5%
NEFT, 73.3%
NACH, 6.3%
UPI, 57%
NETC, 3%
BBPS, 1%
Cards, 6%
AePS, 2%
PPI, 13%
IMPS, 7%
NEFT, 6%
NACH, 5%
UPI, 14.2%
NETC, 0.1%
BBPS, 0.1%
Cards, 1.8%
AePS, 0.8%
PPI, 0.7%
IMPS, 8.1%
NEFT, 69.1%
NACH, 5.1%

101
Parameters and Sub-parameters of RBI’s Digitals Payment Index
Parameters Sub Parameters Parameter Weightage
Payment Enablers Internet, Mobile, Aadhaar, Bank accounts, Participants, Merchants
25%
Payment Infrastructure – Demand Side
Debut cards, Credit cards, PPIs, FASTag, Customer registered in Mobile and Internet Banking
10%
Payment Infrastructure – Supply Side
Bank branches, Business Correspondents ATMs, POS Terminals, QR codes, Intermediaries
15%
Payment Performance Digital payments system – Volume and Value, Unique users, Paper clearing, Currency in circulation, Cash withdrawals
45%
Consumer Centricity Awareness and Education, Declines, Complaints, Frauds, System Downtime
5%
Source: RBI, CRISIL Research
The RBI and government has been continuously pushing for digital transaction over the years to bring in more
transparency and reduce the cost of transactions; the launch of DPI is a significant step to measure to progress on
this front. The DPI score for March 2018 is set at 100 and it was found to reach 207.4 and 270.6 in March 2020 and
March 2021, which shows the growth in digital payments.
Digital Payments Index
Note: Indexed to 100 as of March 2018 Source: RBI, CRISIL Research
100
153.4
207.4
270.6
0
50
100
150
200
250
300
Mar 2018 March 2019 March 2020 March 2021

102
Digital payments continue to rise, but so does ATM withdrawals
While digital payments are rising, cash usage in the economy remains high as evident from the graph below that
captures digital payments and ATM withdrawals as a percentage of GDP. The value of withdrawals from ATMs has
reached ~Rs. 32 trillion in FY20, up by around 14% from Rs. 28 trillion in FY19. In fiscal 2021, the aggregate value
of ATM withdrawals stood at Rs 29 trillion.
While digital payments are increasingly becoming popular, cash also remains a significant mode of doing day-to-day
transactions, especially in semi-urban and rural areas. The lack of trust in technology, limited awareness, inadequate
payment infrastructure, and poor network connectivity has restricted digital transactions and discouraged people from
using these payment modes. As a result, cash is still a preferred mode of payment in rural India due to comfort in
transacting through cash. Furthermore, public preference has shifted to withdrawing cash on an as-needed basis
instead of making large withdrawals at storing cash at home. Deposits with banks have also swelled over the last
couple of years, which is reflected in the rise in currency in circulation.
Retail digital payment and Cash transaction are both on the rise
Source: RBI, MOSPI, CRISIL Research
Retail digital payments forecast to grow at 25-27% CAGR during FY21 to FY25
CRISIL Research forecasts the digital payments value in India to reach Rs 3,500 trillion in fiscal 2025 from Rs 1,379
trillion in FY21, translating into CAGR of 25-27% between fiscal FY21 and FY25. The growth in the digital transaction
can be attributed to rise in smart phones and mobile internet adoption, convenience offered by digital payments, and
ubiquitous availability of payment solutions. Players in the ecosystem as also regulators are continuously evaluating
various technology options to come up with cost-effective solutions as well as multiple use cases in order to keep the
two parties at the centre of the payments ecosystem – merchants and customers – engaged.
During the same time, retail digital payments is expected to quadruple and reach Rs. 1, 343 trillion by FY25,
translating into a 40% CAGR growth over the next four years. CRISIL Research expects regulatory environment to
largely favour a nudge towards digital payments and incentivising it, which will lead to faster adoption of digital
payments by the consumers, thereby driving growth of retail digital transactions in the time to come.
17.3% 17.1% 17.1% 15.8% 14.3% 15.0% 15.0% 14.4% 13.4%
146%138%
146%
160%171%
182% 186% 188%182%
0%
20%
40%
60%
80%
100%
120%
140%
160%
180%
200%
Q1 FY20 Q2 FY20 Q3 FY20 Q4 FY20 Q1 FY21 Q2 FY21 Q3 FY21 Q4 FY21 Q1FY22

103
Digital payments value to cross Rs 3,500 trillion by FY25
Note: Digital transactions includes Retail Electronic Clearing, PPIs, RTGS – excluding interbank clearing, ECS, NEFT, IMPS, UPI, Mobile Banking,
NACH & card transactions at ATMs, P: Projected
Source: RBI, CRISIL Research
Retail digital payments value to quadruple; to reach Rs 1,343 trillion by FY25
Note: Retail digital payments include all digital payments except RTGS and Paper Clearing
P: Projected
Source: RBI, CRISIL Research
823
1,623 1,379
1,825
2,281
2,852
3,521
-
500
1,000
1,500
2,000
2,500
3,000
3,500
4,000
FY15 FY20 FY21 FY22P FY23P FY24P FY25P
(in Rs. Trillion)
81 96 140 203
274 312 353
512
728
1,033
1,343
-100
100
300
500
700
900
1,100
1,300
1,500
FY15 FY16 FY17 FY18 FY19 FY20 FY21 FY22P FY23P FY24P FY25P
Retail Digital Payment Value
(In Rs. Trillion)

104
Share of retail digital payments to grow at a faster pace
Year Retail digital payment-
Transaction Value
Retail digital payments as a % of overall digital
payments
FY2015 Rs. 81 trillion 10%
FY2020 Rs. 312 trillion 19%
FY2021 Rs. 353 trillion 26%
FY2025P Rs. 1,345 trillion 38%
Note: P: Projected, Retail digital payments include all digital payments except RTGS and Paper Clearing
Source: RBI, CRISIL Research
Enablers for growth in digital transactions
In India, the Central bank has been the primary enabler of digital transactions in India. Over the years, it has laid
emphasis on the development of digital payment ecosystem, right from conceptualisation, to execution and propelling
investments in technology to enable the customer to transact in a seamless manner while addressing security
concerns. This, along with rising internet penetration, increasing usage of cards, acceptance and adoption of various
payments infrastructure and e-commerce platforms and changing consumer behaviour is expected to enable and
drive digital transactions in the country.
Continuous rise in retail spending on goods
Retail spending on goods and services in India has grown at a 5 year CAGR of 10% between fiscal 2015 and fiscal
2020. But, in fiscal 2021, retail consumption saw a hit due to the implementation of nationwide lockdown. However,
CRISIL Research expects retail spending to gradually recover in fiscal 2022, on account of low base, full year of
store operations and waning impact of the pandemic. In the long run, retail spending is expected to reach Rs. 91
trillion by fiscal 2025, contributing to the digital payments growth in the country.
Overall retail spending to grow at ~11-13% CAGR between fiscal 2021 and fiscal 2025
Note: P: Projected
Source: CRISIL Research
3943
4953
5762 59
68
76
8591
0
10
20
30
40
50
60
70
80
90
100
FY15 FY16 FY17 FY18 FY19 FY20 FY21 FY22P FY23P FY24P FY25P
-5%
(in Rs Trillion)

105
Ecommerce spending to drive digital transactions
The Indian e-commerce sector has had a phenomenal run in the recent past. The sector has managed to attract
consumers and has grown at a ~35% CAGR from Rs. 0.38 trillion fiscal 2015 to Rs. 1.72 trillion in fiscal 2020 on the
back of rising internet penetration, increasing awareness of online shopping, penetration into tier 2 and tier 3 with the
help of assisted model (where e-commerce firms tie up with merchants to cater customers) and lucrative deals offered
by well-established players and start-ups. As a proportion of total organised retail (organised brick and mortar stores
and e-commerce), the share of e-commerce has jumped from 9% in FY15 to 24% in FY20. In fiscal 2021, the e-
retailing business is estimated to have grown by ~12%. Going forward, CRISIL Research expects e-commerce sector
to grow at a four year CAGR of ~24% to reach close to Rs 4.5 trillion by fiscal 2025, which will necessitate the growth
of digital payments in the country.
E-retail continue to grow at a CAGR of ~23-25% between fiscal 2021 and fiscal 2025
Note: P: Projected
Source: CRISIL Research
Increase in cards and POS terminal to augment digital transactions
Over the last decade, the usage of debit and credit cards in India has increased substantially. Between fiscal 2011
and 2021, the number of debit cards issued in the country has increased from 230 million to 898 million, while issued
credit cards has increased from 20 million to 62 million. As more cards are getting issued, there has been a growth
in the acceptance infrastructure as well. As of March 2020, the POS infrastructure in the country has more than
doubled over the past 5 years to reach 4.4 million terminals, which further increased to 4.7 million terminals at end
of fiscal 2021. CRISIL Research expects this trend to continue, resulting in an increase in digital transactions.
0.380.64
0.91.15
1.41.7
1.9
2.4
3.0
3.7
4.5
0
0.5
1
1.5
2
2.5
3
3.5
4
4.5
5
FY15 FY16 FY17 FY18 FY19 FY20 FY21 FY22P FY23P FY24P FY25P
12%
(in Rs Trillion)

106
Deployment of POS terminals to continue to reach ~12 million by FY2025
Note: P: Projected
Source: RBI, CRISIL Research
Low penetration of per-capita digital payments transactions
According to Bank of International Settlements (CY 2019), non-cash payments transactions volume per capita in
India is the lowest compared to other countries; which presents a strong headroom for growth. The government has
taken multiple initiatives to give a fillip to digitalisation in the country. This includes biometric identification of all Indian
citizens through the Aadhaar programme, financial inclusion initiatives, launch of UPII and other digital payment
systems and giving a push to online tax filings.
Number of non-cash payments transactions per capita, per annum (CY 2019)
Source: Bank of International Settlements, CRISIL Research
Products like contactless and digital cards to enable greater digital transactions
Introduction of contactless cards has enabled users to just tap and pay for transactions under Rs 2,000 by using the
card at a contactless payment machine. Payment service providers are exploring innovative payment infrastructure
by leveraging host card emulation (HCE) for secure near field communication (NFC) payment transactions. This will
enable customers to easily use their cards on their NFC enabled smartphones to make contactless payments. The
card issuers are also innovating and have introduced digital or virtual cards in the last one year. The digital card
1.1 1.4
2.53.1
3.74.4 4.7
6.0
7.7
9.7
12.1
0.0
2.0
4.0
6.0
8.0
10.0
12.0
14.0
FY15 FY16 FY17 FY18 FY19 FY20 FY21 FY22 P FY23 P FY24 P FY25 P
(in millions)
24
197223
313
484523
0
100
200
300
400
500
600
India Brazil China Russia UK USA

107
arrives in the individual’s mobile application and has features like Touch ID or Face ID for authentication, which
increases the convenience of transactions on e-commerce and other platforms. Further, significant growth in users
over the last decade for payment apps and wallets such as PayTM, MobiKwik, and PhonePe are also enabling digital
transactions in the ecosystem.
Regulatory moves to also spur gradual shift from cash to digital payments
DFS lies at the heart of financial inclusion in India. Despite the government’s effort to create interconnected digital
infrastructure, the adoption of DFS, especially in rural India, is marred by digital literacy, which has a direct impact
on the acceptance of digital products. The lack of trust in technology, limited awareness, inadequate payment
infrastructure, and poor network connectivity has restricted digital transactions and discouraged people from using
these payment modes. As a result, cash is still a preferred mode of payment in rural India. In the past, lack of
documents has been a big deterrent in weaning rural customers away from traditional banking services. However,
AePS has helped address this and rural citizens are now carrying out basic digital transactions using their biometric
ID and AADHAR.
In August, 2020, RBI released a document setting out the framework to adopt and authorize the establishment of
new umbrella entities (NUEs) for retail payments and open the channels to private sector players. According to RBI,
setting up of NUEs will address the concentration risk (with NPCI), complement and supplement NPCI’s work and
enable new innovations to come out at a much faster rate, which will help get more and more people into digital
payments. Going forward, CRISIL Research expects that with the help of NUE, multiple use cases will emerge to fill
the void in the India payment space and fasten the adoption of digital payments in India.
In January 2021, RBI announced the creation of Payment Infrastructure Development Fund (PIDF) to boost digital
payments in Tier 3 cities to Tier 6 cities. PIDF has a corpus of Rs. 3.45 billion, of which Rs. 2.5 billion is from RBI
and the remaining from authorised cards networks in India. This fund will be used to subsidize banks and non-banks
for deployment of payment infrastructure for those merchants, who still doesn’t have access to POS machines. This
move is also expected to encourage deployment of point of sale infrastructure, improve digital payments and provide
better access of financial services in under penetrated or unpenetrated areas.
Apart from the in rural and semi-urban regions and rising competition among players is expected to fasten the shift
from cash to a digital payments:
• Sustained push from the Banks and FIs: As legacy system age, they become more expensive to maintain,
with fewer resources to ensure stability. Cash handling infrastructure, thus becomes a burden for financial
institutions, especially for low value transactions. Hence, fintechs along with banks are now focusing on
payments convergence so that costs related to cash may be eliminated, when tapping into new markets.
This push will also drive digital transactions as the customers will use reliable technology solutions offered
by banks on their own platform or other dedicated platform obtained through collaboration.
• Targeted campaign to increase customer awareness: A large section of the Indian population, especially
in the smaller cities and rural areas, is simply not aware of digital payments. A targeted campaign to
showcase the benefits of digital payments for merchants and consumers alike, even in a small way, could
help boost adoption.

108
• Increasing competition: The first wave of adoption of digital payments was driven by ease of transactions
and seamless user experience. However, going forward, competition amongst different players to capture
market share through various allied services will lead the next wave of growth in digital transaction.
Offline payments mechanism to drive the push for digital transactions
While payment companies have been acquiring merchants and pushing them to move to digital payments platform,
the RBI is prodding payment companies to develop offline solutions to help overcome network constraints, which
has inhibited the spread of digital transactions particularly in rural areas. Offline payments are transactions that are
either processed without a data connection or where the transaction is recorded offline and processed at a different
point of time. In the offline mode using cards, the card details of the transaction are stored at the terminal which is
used to generate a transaction response for receipt. Later, when the internet connection is established, the stored
payment data is processed. Currently, NPCI has one such product – Unstructured Supplementary Services Data
(USSD) in its repertoire, which allows non-internet based mobile devices (smartphones as well as basic mobile
phones) to avail banking service by dialling option(*99#). But the product has not garnered traction, with just Rs 1.4
billion worth of transactions being recorded in fiscal 2021.
In August 2020, the RBI proposed to allow a pilot scheme for small value payments in offline mode with built-in
features for safeguarding the interest of users. Under this scheme, authorised Payment System Operators (PSOs) –
banks and non-banks – were allowed to provide offline payment solution using cards, wallets or mobile devices for
remote and proximity payments. Post the pilot scheme, the Central bank will decide on formalising the system based
on the experience gained.

109
RBI directives on Digital payments security controls
While digital payments offer ease of transactions as well as convenience to end users, as with any other payment
system, the bedrock on which the long-term sustainability of digital payments would stand will be security.
In the wake of rising concerns over digital fraud and data theft, the RBI, in February 2021, unveiled a new set of
rules for enhancing digital payment security controls. These guidelines specify security protocols to be adopted in
internet banking, mobile applications and cards issued by banks, payment banks, SFBs, and card-issuing non-bank
lenders. The guidelines are intended to come into effect within six months.
Some of the directives of RBI include:
• For mobile applications, where the service and authentication tools such as one-time-password are received
on the same device, the players are required to come up with better alternatives to authenticate a transaction.
• Reconciliation process of transactions must follow a near-real-time framework, which would ensure that all
stakeholders are provided necessary information within a 24-hour time period.
• The web pages of the lenders, which provide digital payment products and services, should not store
customer sensitive information in HTML fields, cookies, or any other client side storage.
• The lenders must have a specific section on their digital payment products and services which clarify how
customers can lodge complaints in the event of a grievance.
• The applications or web pages provided by the lenders must have a mechanism to mark a transaction as
fraudulent for seamless and immediate notification to the lenders.
In addition, the RBI has mandated that except for card issuing banks, NBFCs and payment banks, no
online company or payment aggregator will be allowed to maintain credit or debit card details in their
databases for remote transactions. This would impact one click checkout and recurring billing transactions
as card holders would be required to enter their credentials each time they initiate a transaction instead of
just confirming their three-digit card verification value (CVV) code as they do today.
After chip and PIN-based cards became commonplace for debit and credit cards, identity theft and payment fraud at
physical point-of-sales has increasingly become more difficult, and by now turning its focus to online payment frauds,
it appears that RBI is laying the ground for tokenisation or some other form of encryption technology.

110
Digital payment instruments
Unified Payment Interface (UPI)
UPI is a mobile based payment system, wherein users can send and receive money instantly using a Virtual Payment
Address (VPA). The unique feature of VPA-based transaction is the secure aspect of UPI architecture as it obviates
the need for sharing account or bank details to the remitter. It supports person to person (P2P) and person to
merchant (P2M) payments and can be used over smart phone (app based), feature phone (USSD based) and at
merchant location. Since its launch in 2016, UPI, has witnessed an exponential growth of 495% CAGR in terms of
volumes to reach 22.3 billion in fiscal 2021 from 0.02 billion in fiscal 2017. Similarly, the value of transactions has
increased from Rs. 0.07 trillion to reach Rs. 41 trillion between fiscal 2017 and fiscal 2020; growing at a CAGR of
393% during the same time. The outbreak of Covid-19 was a minor blip in the growth story as transactions saw a
minor drop in early months of FY20-21; however, the shift towards digital transactions through the UPI platform has
seen an acceleration since then. UPI recorded its highest number of transactions of 2,234 million and 2,303 million,
amounting to Rs. 4.1 trillion and Rs. 4.3 trillion in the month of December 2020 and January 2021 respectively.
The launch of UPI 2.0 in 2018 saw expansion of its use cases. Invoice verification, linking of overdraft account,
additional security through signed intent and QR code were some of the features that were introduced. In July 2020,
NPCI also allowed customers to set a recurring mandate with UPI to pay for mobile bills, EMIs, insurance premiums
and make mutual fund investments. This is expected to provide a major push to the volumes and revenue of UPI
transactions. The government has also mandated a zero merchant discount rate (MDR) for all domestic UPI
transactions. CRISIL Research, thus expects that with new payment technologies and increasing use cases across
sectors, the growth momentum of digital transaction is expected to continue as evident from FY21 transactions
volume, which has already doubled as compared to volumes of fiscal 2020. In H1FY22, the UPI transactions has
seen further traction and cumulative transactions volumes and value touched 18.4 billion and Rs. 34 trillion
respectively. During the same period in fiscal 2021, transaction volumes through UPI was 8.5 billion and amounted
to Rs. 15 trillion.
UPI transactions volumes have zoomed between FY17 and FY21
Source: RBI, NPCI, CRISIL Research
0.02 0.9
5.4
12.5
22.3
8.5
18.4
0
5
10
15
20
25
FY2017 FY2018 FY2019 FY2020 FY 2021 H1FY21 H1FY22
UPI Transaction Volume (in Billion)
(Transaction volume - in billions)
117%

111
UPI transactions value continue to rise with surge in volumes
Source: RBI, NPCI, CRISIL Research
National Electronic Toll Collection & Bharat Bill Pay Service
National Electronic Toll Collection (NETC)
National Electronic Toll Collection is an interoperable nationwide toll payment solution developed by NPCI to meet
the electronic tolling requirements. It encompasses a common set of processes, business rules and technical
specifications which enables a customer to use their FASTag as payment mode on any toll plaza, irrespective of who
is operating the toll plaza. Apart from UPI, BBPS and NETC has also witnessed a strong growth. BBPS has provided
an organised platform for bill payments whereas NETC has allowed digitisation of payment at the toll gates on
highways and public transport respectively. The government had mandated the use of “FASTag” based toll payments
through NETC, with effect from January 1, 2021, which was later extended to February 15, 2021. The FASTag is
issued by bank or the Indian Highways Management Company Limited (IHMCL) and affixed on to a vehicle and is
linked to an underlying payment instrument and can be used for payment of toll. NETC was witnessing a strong
growth with volumes of 35 million, 64 million, 93 million and 110 million in November 2019, December 2019, January
2020 and February 2020 respectively. However, owing to the nationwide lockdown the volume dropped significantly.
After economic activity started to resume in the country and restrictions on inter-state travel became relaxed, the
volumes gradually returned to over pre-Covid levels to reach 125 million, 138 million and 148 million in November
2020, December 2020 and January 2021 respectively. In H1FY22, the momentum of NETC transactions has
continued to grow as it witnessed its highest volume of 201 million and 193 million in August 2021 and September
2021 respectively.
0.07 1.1
8.8
21.3
41.0
15.5
34.3
0
5
10
15
20
25
30
35
40
45
50
FY2017 FY2018 FY2019 FY2020 FY 2021 H1FY21 H1FY22
UPI Transaction Value (in Trillion)
(Transaction value- in Rs. Trillion)

112
NETC transactions grew at a CAGR of 173% between FY17 and FY21
Source: RBI, NPCI, CRISIL Research
NETC transaction value grew at a CAGR of 137% between FY17 and FY21
Source: RBI, NPCI, CRISIL Research
Bharat Bill Pay Service (BBPS)
Bharat Bill Pay to grow with expansion of new billing categories
Bharat Bill Payment system is a Reserve Bank of India (RBI) conceptualised system driven by NPCI. It is a one stop
ecosystem for payment of all bills providing an interoperable and accessible “Anytime Anywhere” bill payment service
to all customers with certainty, reliability and safety of transactions. If offers myriad bill collection categories like
electricity, telecom, DTH and other utility payments. It also offers repetitive payments like insurance premium, mutual
funds, credit cards etc. The emergence of Covid-19 has accelerated the digital payment landscape and we have
seen a surge in volume of transaction through BBPS. In H1FY22, BBPS transaction volumes and value has crossed
overall transactions for whole of fiscal 2021 to reach 289 million transactions amounting to Rs. 513 billion.
0.02 0.1
0.3
0.6
1.3
0.4
1.0
0.0
0.2
0.4
0.6
0.8
1.0
1.2
1.4
1.6
1.8
2.0
FY2017 FY2018 FY2019 FY2020 FY2021 H1FY21 H1FY22
NETC Transaction Volume (in Billion)
(Transaction volume - in billions)
153%
0.01 0.03 0.06 0.1
0.2
0.1
0.2
0.0
0.1
0.2
0.3
0.4
0.5
0.6
0.7
0.8
FY2017 FY2018 FY2019 FY2020 FY2021 H1FY21 H1FY22
NETC Transaction Value (in Trillion)
(Transaction value- in Rs. trillion)
100%

113
Going forward, revival of commercial activities, improvement in consumer spending, continued on boarding of new
billers under existing categories and addition of new biller categories is expected to bring additional transaction
volumes. Banks and other mobile application are also integrating their customer facing interface and system to
support BBPS which will also aid growth for BBPS. CRISIL Research believes that the consumers who shifted to
online mode of bill payment due to Covid-19 will continue to use online mode of payments, going forward. In addition,
CRISIL Research expects increasing internet and smart phone penetration will also drive transactions from the rural
customers, who will use the platform to make utility bill payments.
Increasing internet and smartphone penetration to drive transaction volume for BBPS
Source: RBI, NPCI, CRISIL Research
Rising transaction volumes augmented transaction value for BBPS
Source: RBI, NPCI, CRISIL Research
0.03 11
74
146
276
112
289
-
50
100
150
200
250
300
350
FY2017 FY2018 FY2019 FY2020 FY2021 H1FY21 H1FY22
BBPS Volume (in Million)
0.05 11
91
217
429
179
513
-
100
200
300
400
500
600
FY2017 FY2018 FY2019 FY2020 FY2021 H1FY21 H1FY22
BBPS Value (in Billion)
(Transaction volume - in million)
(Transaction value- in billion)

114
Credit and Debit cards
Cards spends more than doubled during fiscal 2017 to fiscal 2020; trend to continue despite blip in fiscal 2021
Credit card and debit cards spends have registered a robust growth of 31% and 35% CAGR over a period of 3 years
to reach Rs 7.3 trillion and Rs. 8.0 trillion respectively in fiscal 2020. The transaction volumes during the same time
has increased at CAGR of 26% and 29% for credit card and debit card respectively. Demonetisation was one of the
significant factors that led to faster growth in transaction volume and value of cards. Further, the government’s
emerging vision of a cash-less society, focus on digitalisation, developments in e-commerce, and availability of point
of sale infrastructure have significantly encouraged payments through credit and debit cards.
Government push and availability of POS infrastructure has encouraged card volumes
Source: RBI, CRISIL Research
Credit card & debit card spends grew at 31% and 35% CAGR between fiscal 2017 and 2020 (in Rs. Bn)
Source: RBI, CRISIL Research
Fiscal 2021 though saw subdued spends on credit as well as debit cards. This is on account of outbreak of Covid-19
which has negatively impacted sectors such as hotels and restaurants, sales at physical stores, tourism and
1,087 1,405
1,762 2,177
868
198
2,399
3,343
4,414
5,123
2,080
458
-
1,000
2,000
3,000
4,000
5,000
6,000
FY2017 FY2018 FY2019 FY2020 FY2021 Q1FY22
Credit Card Transactions (in million) Debit Card Transactions (in million)
3,284
4,589
6,034
7,308
2,807
688
3,299
4,607
5,934
8,048
3,780
882
-
1,000
2,000
3,000
4,000
5,000
6,000
7,000
8,000
9,000
FY2017 FY2018 FY2019 FY2020 FY2021 Q1FY22
Credit Card Spends (in Rs. Billion) Debit Card Spends (in Rs. Billion)

115
hospitality, which will curtail the growth for this payment mode. In Q1FY22, with reopening of economy, tours and
travel, shopping malls etc., the transaction volumes and values for credit and debit cards have witnessed a month
on month rise and CRISIL Research expects that the usage of both credit and debit cards will increase with the effect
of pandemic expected to wane over a period of time and people returning to spending at physical stores and
restaurants. The current pandemic is also expected to bring a change in the customer behaviour, which will lead to
a higher adoption of card payments. In March 2019, Ministry of Government and Housing Affairs launched National
Common Mobility Card (NCMC), an interoperable transport card which offers a combination of debit/credit with a
prepaid cards where debit/credit component would be used in the online environment whereas prepaid card will be
used in an offline environment. The adoption of National Common Mobility Card (NCMC) is also expected to convert
a large chunk of cash transactions in public transport in the urban regions and boost digital transactions through
cards.
AADHAR Enabled Payment System (AePS)
AADHAR Enabled Payment System (AePS) is a bank led model that uses AADHAR authentication to allow
interoperable transactions at POS terminals. It was launched with an objective to facilitate banking services in the
underbanked regions of the country. Since its launch in 2016, AePS has seen a strong growth in its transaction
volume; volumes increased at a CAGR of 178% between fiscal 2017 and fiscal 2021. In terms of value, it has
increased at a CAGR of 216% during the same period. Post-Covid, the usage of AePS has jumped manifold,
indicating the increasing convenience of this channel as also the change in customer behaviour. In H1FY22, the
AePS transactions volume has witnessed a growth of 2% compared to the same time in fiscal 2021.
AePS transaction grew at a CAGR of ~178% between FY17 and FY21
Source:RBI, NPCI, CRISIL Research
16 106
254
437
963
525 534
-
200
400
600
800
1,000
1,200
FY2017 FY2018 FY2019 FY2020 FY2021 H1FY21 H1FY22
AePS Volume (in Million)
(Transaction value- in million)

116
AePS transaction value grew at a CAGR of 216% between FY17 and FY21
Source:RBI, NPCI, CRISIL Research
23
269
678
1,189
2,286
1,077
1,455
-
500
1,000
1,500
2,000
2,500
FY2017 FY2018 FY2019 FY2020 FY2021 H1FY21 H1FY22
AePS Value (in Billion)
(Transaction value- in billion)
35%

117
Prepaid payments instruments (PPIs)
PPIs are instruments that facilitate purchase of goods and services, remittance facilities etc. against the value stored
in such instrument. These instruments have been in the market since 2002, but its usage has been limited to gift
cards, foreign exchange cards and meal cards (Eg: Sodexo cards) for general usage. The usage of PPIs became
more prevalent after December 2019, when a new type of PPI was launched which can be loaded/re-loaded from a
bank account/credit card and can be issued based on essential minimum details obtained from the customer.
Interoperability was also allowed amongst the PPIs which provided the customers an option to use the card at various
outlets without the need for multiple on-boarding at multiple issuers. While consumers have benefitted from this
convenient payment option, the merchants have also adopted PPIs due to relatively lower cost associated in setting
up infrastructure and processing payments. PPIs thus witnessed a growth of 26% CAGR in terms of volume and 24%
CAGR in terms of transaction value between fiscal 2017 and fiscal 2021.
In April 2021, RBI proposed to make interoperability mandatory for full KYC PPIs and for all acceptance infrastructure
and also allowed cash withdrawals from full KYC PPIs. In order to incentivize the migration of PPIs to full-KYC, the
RBI also increased the upper limit that customers can store in PPIs from the earlier level of Rs. 1,00,000 to Rs
2,00,000. In addition, PPIs will also have access to NEFT and RTGS channels. While these measures are expected
to enhance the functionality of wallets, the requirement of full KYC may continue to limit the uptake of PPIs. Players
also will have put in place appropriate incentives and use-cases to propel PPI adoption.
RBI’s measures to enhance the functionality of PPIs
Source: CRISIL Research
RBI’s measures to enhance the
functionality of PPIs such as
wallets
Customers of wallets can store upto Rs 2 lakhs subject to being
fully KYC compliant (This limit was Rs 1
lakh earlier)
Interoperability made mandatory for full KYC PPIs, thereby making money transfer
from wallet to wallet and from wallet to
bank possible
PPIs will have access to NEFT
and RTGS, enhancing their ability to cater to relatively higher
value transactions
Cash withdrawal allowed for full KYC PPIs from
PoS terminals and ATMs; no limit specified as of
now

118
PPI transaction volume estimated to grow at a CAGR of 26% between FY17 and FY21
Source:RBI, CRISIL Research
PPI transactions value grew at a CAGR of 24% between FY17 and FY21
Source:RBI, CRISIL Research
1,963
3,459
4,607
5,332 4,987
1,319
-
1,000
2,000
3,000
4,000
5,000
6,000
FY2017 FY2018 FY2019 FY2020 FY2021 Q1FY22
PPIs Transaction Volume (in Million)
838
1,416
2,133 2,156 1,965
624
-
500
1,000
1,500
2,000
2,500
FY2017 FY2018 FY2019 FY2020 FY2021 Q1FY22
PPIs Transaction Value (in Billion)
(Transaction volume- in million)
(Transaction value- in Rs. billion)
CAGR: 24%

119
Payment Banks
Overview of Payment Bank Licence
In 2013, the RBI constituted a committee to study “Comprehensive Financial Services for Small Businesses & Low
Income households” headed by Dr. Nachiket Mor. The focus of the committee was to recommend innovative solutions
to accelerate financial inclusion in unbanked and underbanked section of the society in a cost effective way. The
committee recommended setting up of a specialized bank (“Payments Bank”) to cater to the low income groups. The
draft guidelines for setting up Payments Bank were issued by the RBI in July 2014, and comments were sought from
various participants by August 2014. Finally, the RBI has released the final guidelines for licensing of Payments Bank
in November 2014.
The guidelines were announced with aim to create a banking entity which is adequately capitalised, financially
inclusive and has a competitive business model.
Guidelines for Payments Bank Licence
Parameters Guidelines
Objective
• Widening the spread of payment services and deposit products to small
businesses, low-income households, migrant labor workers and other
unorganized entities by enabling high volume low value transactions in
deposits and payments/remittance services in a secured technology-driven
environment.
Eligible Promoters
• The eligible entities which can set up a payment bank include an existing non-
bank, prepaid instrument issuers (PPI) & other entities such as individuals /
professionals; Non-Banking Finance Companies (NBFCs), corporate BCs,
mobile telephone companies, super-market chains, companies, real sector
cooperatives; that are owned and controlled by residents; and public sector
entities.
• The promoter/promoter group can also enter into a joint venture with an
existing scheduled commercial bank to set up a payment bank. If the promoter
succeeds in obtaining a payment’s bank licence, it would be required to set up
the payment bank under a separate structure unless it is an existing PPI
licence holder opting for conversion into a payments bank.
Scope of activities
• The payments bank shall confine its activities to further the objectives for which
it is set up. Therefore, the payments bank is permitted to set up its own outlets
such as branches, Automated Teller Machines (ATMs), Business
Correspondents (BCs), etc. to undertake only certain restricted activities
permitted to banks under the Banking Regulation Act, 1949.
• The payment banks can accept demand deposits (Non-NRI deposit), issue
ATM/ debit cards/PPIs, offer remittance services (incl. cross-border
remittances) and internet banking services, act as a BC for another bank and
undertake non-risk sharing simple financial services activities not requiring any
fund commitment, such as distribution of MFs, insurance products, pension
products, etc. and undertake utility bill payments.

120
• Given that the primary role of payments bank is to provide payments and
remittance services and demand deposit products to small businesses and
low-income households, payments banks are restricted to holding a maximum
balance of Rs. 100,000 per individual customer. On 7th April 2021, the limit
was further increased to Rs. 200,000 per individual customer.
Deployment of Funds
• The payments bank cannot undertake lending activities. Apart from amounts
maintained as Cash Reserve Ratio (CRR) with RBI on its outside demand and
time liabilities, it will be required to invest minimum 75 per cent of its "demand
deposit balances" in Government securities/Treasury Bills with maturity up to
one year that are recognized by RBI as eligible securities for maintenance of
Statutory Liquidity Ratio (SLR) and hold maximum 25 per cent in current and
time / fixed deposits with other scheduled commercial banks for operational
purposes and liquidity management.
Capital Requirement
• The minimum paid-up equity capital of the payments bank shall be Rs. 1 Bn.
The payments bank shall be required to maintain a minimum capital adequacy
ratio of 15 per cent of its risk weighted assets (RWA) on a continuous basis,
subject to any higher percentage as may be prescribed by RBI from time to
time. Tier I capital should be at least 7.5 per cent of RWAs. Tier II capital should
be limited to a maximum of 100 per cent of total Tier I capital.
Promoter Contribution
• When the payments bank reaches the net worth of Rs.5 Bn, and therefore
becomes systemically important, diversified ownership and listing will be
mandatory within three years of reaching that net worth.
• The promoter’s minimum initial contribution to the paid-up equity capital shall
be at least 40% for the first 5 years.
Foreign Shareholding
• Foreign shareholding has been allowed up to 74% (automatic route up to 49%
of the paid up capital and approval route beyond that till 74%)
• At all times, at least 26 per cent of the paid-up capital will have to be held by
residents. In the case of Foreign Institutional Investors (FIIs) / Foreign Portfolio
Investors (FPIs), individual FII / FPI holding is restricted to below 10 per cent
of the total paid-up capital, aggregate limit for all FIIs /FPIs / Qualified Foreign
Investors (QFIs) cannot exceed 24 per cent of the total paid-up capital, which
can be raised to 49 per cent of the total paid-up capital by the bank concerned
through a resolution by its Board of Directors followed by a special resolution
to that effect by its General Body.
• In the case of NRIs, the individual holding is restricted to 5 per cent of the total
paid-up capital both on repatriation and non-repatriation basis and aggregate
limit cannot exceed 10 per cent of the total paid-up capital both on repatriation
and non-repatriation basis. However, Non-Resident Indian (NRI) holding can
be allowed up to 24 per cent of the total paid-up capital both on repatriation
and non-repatriation basis provided the banking company passes a special
resolution to that effect in the General Body.
Other Conditions
• At least 25% of a Payments Bank’s physical access points (own or others’
network; not branches) have to be in rural centers
Source: RBI, CRISIL Research

121
In August 2015, the RBI gave “in-principle” licences to eleven payment banks. These new banks were expected to
accelerate financial inclusion in India. However, of the 11 in-principle payment licencees, three withdrew their
application subsequently. Aditya Birla Idea Payments Bank also closed their operations in September 2019. The
payments bank which are currently operational include Airtel Payments Bank, India Post Payment Bank (IPPB), Fino
Payments Bank, PayTM Payments Bank, NSDL Payments Bank and Jio Payments Bank.
Payments Bank in India
Name of the Payments Bank Year of Incorporation Year of Commencement of Operation
Airtel Payments Bank November 2016 November 2016
Fino Payments Bank April 2017 June 2017
PayTM Payments Bank November 2017 November 2017
Jio Payments Bank November 2016 April 2018
India Post Payments Bank September 2018 September 2018
NSDL Payments Bank October 2018 October 2018
Source: Company Website, CRISIL Research
As per the guidelines for on-tap licensing of small finance banks (SFB) in the private sector, released in December
2019, payments banks can also apply for conversion into SFB after five years of operations, if they are eligible
otherwise based on the guidelines.
Payment Banks have led to proliferation of non-branch type touchpoints
After granting of Payment Bank licence, it is seen that, true to the form, the payment banks have set up a vast network
of touchpoints by leveraging established nature of some of their parent network and through collaboration. For
instance, Fino Payments Bank has widened its network through collaboration and partnerships with Bharat Petroleum
to use their outlets as digital banking points. Fino’s digital kiosk acts as a last mile service point in the underpenetrated
regions of the country. Fino Payments Bank has also tied up with Rajcomp, which runs Government of Rajasthan’s
citizen service initiative under which e-Mitra points of Rajcomp will act as a banking point of Fino Payments Bank
and provide banking services to customers. This extensive alternative banking channel has brought about a paradigm
shift in the way people used to avail banking services. Now, the customers need not travel long to go to a traditional
bank branch, instead, they can visit the local banking touchpoint at their convenience and avail assisted digital
banking services such as new account opening, deposit, withdrawal, money transfer and utility bill payments.
Airtel Payments Bank, on the other hand, has leveraged its parent’s network of retailers and Kirana shops and India
Post Payment Bank has enabled the post offices in India to provide payment banks services.

122
Functioning offices of payments banks in India as at end of Q1FY22
Note: Data includes only functioning offices and no banking touchpoints
Source: RBI, CRISIL Research
Region-wide distribution of the offices of payments bank (Q1FY22)
Note: Data includes only functioning offices and no banking touchpoints
Source: RBI, CRISIL Research
Population group wise distribution of payments bank offices (Q1FY22)
Note: Data includes only functioning offices and no banking touchpoints
Source: RBI, CRISIL Research
179
848820
748 750
0
100
200
300
400
500
600
700
800
900
FY2018 FY2019 FY2020 FY2021 Q1FY22
Northern, 16%
North Eastern, 9%
Eastern, 19%
Central, 21%
Western, 17%
Southern, 18%
Rural, 4%
Urban, 44%
Semi Urban, 39%
Metropolitan, 12%

123
Rural areas has the least presence of payments bank functioning offices, whereas urban areas has the highest
number of functioning offices as of Q1FY22. However, these functioning offices form a very small proportion of total
number of touchpoints of payments banks, as they leverage on their vast network of merchants and doorstep service
providers to provide banking and related services in the last mile.
For instance, Fino Payments Bank had nearly 0.72 million banking touchpoints at end of June 2021. India Post
Payments Bank had a network of 0.14 million access points and 0.17 million doorstep bankers who provide financial
service to the customer at the end of fiscal 2020. At end of fiscal 2021, PayTM Payments Bank allowed consumer to
make payments though its 0.087 million online merchants and 21 million in-store merchants. Airtel Payments Bank,
which is the only payments bank with a mobile network operator (MNO) parent had approximately 0.5 million banking
touchpoints as on October 7, 2021, leveraging on its parent’s existing network of retailers who provide mobile
connections and recharges at their shop. These touchpoints have enabled payments bank to garner an increasing
share of the deposits pie.
The payments bank are looking to increase their footprints and are continuously deepening their penetration across
various states and regions. For example, Fino Payments Bank has set a target to establish a network of 1 million
customer touchpoints by March 2023. Going forward, CRISIL Research expects payments banks will continue to
increase their touchpoints and collaborate with other players as required to cater to the needs of customers through
their ecosystem.
The Payment Banks Ecosystem
In order to build a comprehensive suite of low cost banking and payment services for the huge customer base,
payment banks collaborate with multiple partners across distribution networks, the national payment infrastructure,
technology providers and banking and payment providers. Payment banks rely heavily on the use of various
interoperable platforms through services enabled by NPCI for facilitation of digital transactions.
India’s Payment Banks Ecosystem
Source: CRISIL Research
To summarise, payment banks leverage distribution, technology and partnerships to maximise their outreach and
effectiveness as it allows them to go Phygital i.e. have a mix of physical outlets via merchant networks and
partnerships combined with digital platform enabled solutions/offerings at these merchants. This operating model
Distribution through on the ground retailers and franchisee outlets
NPCI for payments backbone
Partnership with Banks and NBFCs for cash management
Technology providers for core banking and payment system
Payments Bank

124
allows potential customers with a choice of availing financial services with assistance from agents at the banking
outlet/touchpoints or availing self-service through the mobile banking application.
Payment banks’ make use of the phygital model in rural areas
Banking transactions are largely a trust affair, and therefore, banks have traditionally relied upon a physical branch
along with digital presence to be able to build trust with customers. However, physical models have not worked in
rural banking due to high costs, while India’s rural customers are not ready to go completely digital financially. Hence,
the banks are relying upon the phygital model (also known as an assisted-digital model) – a combination of digital
channel and human touch at the front end to assist customers – to address the pain points of a rural customer –
limited accessibility, financial and digital literacy.
Some of the key advantages of using phygital model include:
1. Digitization of customer cash: Cash transaction is the primary reason for account dormancy in rural India.
The local banks and other financial institutions, through their Phygital model could digitize customer income
and expenses, which could drive account primacy and encourage banking behavior.
2. Phygitisation of local merchants: The financial institutions could leverage the local merchant or kirana
stores as a trust point, where the customer will get assistance in adopting digital mode of using financial
services i.e. helping the customer in downloading the application, checking their balances and making a fund
transfer. The familiarity of the merchant and the handholding will boost customer confidence of being able to
manage such transaction on their own. The financial institutions can later elevate these local merchant to
the status of a banker, thereby establishing their touchpoint and trust-point in a scalable and cost effective
manner.
The phygital model, thus has created new value propositions and helped companies respond with far greater
efficiency. Going forward, this model of operation is expected to build organizational resilience through more anytime,
anywhere touchpoints and increase opportunities for mutually beneficial partnerships with various stakeholders.
However, not all payments banks operate in the rural and semi-urban regions, indicating variations in their business
model and target customer segments. For instance, Fino Payments Bank uses the phygital model (assisted digital
model) to drive business through scale in the rural and semi-urban regions. On the other hand, PayTM Payments
Bank has a stronger focus on large cities and urban areas and primarily operates through digital channels.
Customer segment and products of Payments Banks
Payment banks generally focus on four key customer segments – unbanked, underbanked, small size businesses
and youth in semi-urban areas through differentiated value propositions. During the start of their operations, the
primary channel for payment banks is usually agents, who help their customer in understanding the digital models
and gradually shift them to a self-service digital channels to avail banking services using a mobile application.
Customer segment & value proposition of payment banks

125
Customer segment
Unbanked Underbanked Small Size Business Youth in Semi-urban regions
Target customers
Low income individual, domestic workers and migrant
workers
Low income individual, domestic
workers and migrant workers
Mobile network operator agents, Small merchants and kirana stores, Agri-traders &
small service providers
Youth, students who are well acquainted with mobile wallets
Products
Savings A/c & Mobile wallets, Loan
disbursements through tie-ups with Banks and NBFCs and distribution of
Insurance & investment products
Savings A/c & Mobile wallets,
Loan disbursements
through tie-ups with Banks and NBFCs and distribution of
Insurance & investment products
Savings A/c, Current A/c, Loan
disbursements through tie-ups with Banks and NBFC and distribution
of insurance & investment products
Mobile wallets, CASA
Transaction type
Domestic money remittance, Cash-in and Cash-out, Bill
payments
Domestic money remittance, Cash-in and Cash-out, Bill
payments
Cash-in and Cash-out, Bill payments, Money
Transfers
Digital transactions through wallet
Primary Channel Agents are primary
touch points Agents are primary
touch points Agents, Self-service Self-service
Source: CRISIL Research
Apart from payments bank, there are other players who provide similar services such as cash-in cash out, remittance
services, ticket bookings, recharges and bill payment. For example, EbixCash is a payments oriented business which
provides money transfer services, travel bookings, insurance and wallet services. Oxigen Services also allows
customers to make mobile/DTH recharges, money transfer through banks and the Oxigen wallet
Addressable market (revenue from CASA, payment services, remittance and
cash collection and management) expected to grow at 16% CAGR between
FY21 and FY25
Addressable market refers to the potential revenue pool available for an entity focused on providing CASA deposit
accounts in rural and semi-urban areas and the entire range of payment and remittances related services across
urban, semi-urban and rural areas. CRISIL Research estimates the addressable market to be approximately Rs. 0.85
trillion in fiscal 2021. We project this market to grow at a CAGR of 16% over the next 4 years to reach Rs. 1.57 trillion
by fiscal 2025, largely driven by strong growth in the payments space due to technology and changing consumer
behavior.

126
Total addressable market is estimated to be at Rs 0.85 trillion in fiscal 2021
Note: E: Estimated. P: Projected; Revenue from CASA is for rural and semi-urban regions
Source: RBI, Company Reports, Company Website, CRISIL Research estimates
Deposits for payment banks grew by ~64% in fiscal 2020
Deposits collected by payments banks grew by 64% in fiscal 2020. Cumulatively, the quantum of deposits rose from
Rs 25.7 billion as at the end of FY19 to reach Rs. 42.1 billion as of FY20. During this time period, payment banks
witnessed a 46% on-year increase in their revenues. Their operational expenses also increased by 46% over the last
fiscal owing to expansion in banking touchpoints, which has increased the aggregate consolidated losses of payment
banks. In aggregate, the six payment banks made net losses to the tune of Rs.8.14 billion in FY20.
In fiscal 2021, overall deposits for payment bank (excluding India Post Payments Bank) grew by 29% to reach Rs.
43.1 billion. PayTM Bank deposits had a total deposit of Rs.34.5 billion (excluding FDs with partner banks), whereas
Fino Payment Bank witnessed a growth of 107% on year in deposits to reach Rs. 2.4 billion.
Payments bank focusing on increasing volumes, touch points with customers
and cross sell to turn profitable
While payment banks in India cumulatively are not profitable, PayTM Payments Bank and Fino Payments Bank are
having profitable operations. Fino Payments Bank turned operationally profitable in the fourth quarter of FY20 and
remained profitable thereafter. PayTM Payments Bank reported a net profit of Rs 0.3 billion in FY20 whereas Fino
Payments Bank reported a net profit of Rs. 0.2 billion in FY21. Payment banks are leveraging their strength to reach
out to their core customer base, enhance volumes and turn profitable. They have been launching new products to
provide a bouquet of products and services to their customers under the payment banks umbrella and ensure
stickiness.

127
For instance, in December 2020, IPPB, due to its massive distribution network has set up a full suite of banking
services and launched its new digital payments app “DakPay” to cater to the financial needs of various sections of
the society – be it sending money or making payments enabling cashless ecosystem using a virtual debit card. The
DakPay service is aimed at providing not only banking services, but also postal financial services at doorstep,
thorough the postman of Indian Post. Apart from this, IPPB is also focusing on pan India government to customer
(G2C) payments, especially rural direct benefit transfers.
Fino Payments Bank is also looking to utilise its massive network to reach out to customers and has enabled
microcredit and gold loans on behalf of various banking partners. It has also leveraged its strong capability to manage
bulk and retail cash on behalf of various MFIs and NBFCs, which has increased its cash management business.
Airtel Payments Bank has been leveraging its network of retailers to cross sell financial products. It has also entered
into a partnership with Mastercard to develop customised financing products for farmers and MSMEs in India. One
such product is a digital platform to educate farmers on advance farming methods and provide them with means to
connect to the marketplace, while enabling them to receive payments directly in their Airtel Payments Bank account.
With credit penetration as well as the penetration of insurance and mutual funds still at a very low level, cross sell to
retail unserved and/or underserved customers remains an attractive opportunity for payment banks. For example,
although mutual fund penetration (mutual fund AUM as a percentage of GDP) has grown from 8.7% in fiscal 2002 to
~15.9% in fiscal 2021, penetration levels remain well below those in other developed markets, which presents an
opportunity for payments banks to cross sell investment products to customers in rural and semi-urban areas.
Lower insurance penetration presents headroom for growth of insurance products
Note: Insurance penetration is measured as ratio of premium to GDP
Source: IRDA, Swiss Re 3/2021, CRISIL Research
Insurance penetration in India is low compared to other countries (CY2020)
2.6%2.7% 2.7% 2.8% 2.7% 2.8%
3.2%
0.7% 0.7% 0.8%0.9% 1.0% 0.9% 1.0%
0.0%
0.5%
1.0%
1.5%
2.0%
2.5%
3.0%
3.5%
2014 2015 2016 2017 2018 2019 2020
Life insurance penetration Non - life insurance penetration

128
Note: Insurance penetration is measured as ratio of premium to GDP
Source: Swiss Re 3/2021, IRDA, CRISIL Research
Mutual fund penetration (Mutual Fund AUM as % of GDP)
Note: Based on end of fiscal AUM and GDP at current prices, * Calculated on annualised GDP
Source: AMFI, IMF, RBI, CRISIL Research
Mutual fund penetration in India is lower as compared to other countries
India’s mutual fund penetration (AUM-to-GDP) is significantly lower than the world average of 75% and also lower
than many developed economies such as the US (140%) and the UK (78%) and key emerging economies such as
Brazil (81%).
Mutual fund AUM as a % of GDP in India is low compared to other countries (2020)
4.1% 4.2% 4.5%
7.4%8.1%
11.1%12.0%
0.0%
2.0%
4.0%
6.0%
8.0%
10.0%
12.0%
14.0%
Brazil India China World Japan UnitedKingdom
United States
8.70% 9%
11.40%
12.50% 12.50%
10.90%
15.90% 16%
0.00%
2.00%
4.00%
6.00%
8.00%
10.00%
12.00%
14.00%
16.00%
18.00%
March 2015 March 2016 March 2017 March 2018 March 2019 March 2020 March 2021 June 2021*

129
Note: AUM data as of CY 2020: Q4 for all countries; only open-ended funds have been considered. Includes, equity, debt and others. GDP is
based on current prices estimation by IMF in world economic outlook April 2020.
Source: IMF, IIFA, CRISIL Research
15.0% 18.0%
47.0%
75.0% 78.0% 81.0%
140.0%
0.0%
20.0%
40.0%
60.0%
80.0%
100.0%
120.0%
140.0%
160.0%
India China Japan World UnitedKingdom
Brazil United States

130
Peer Comparison of Payments Banks
In this section, we have compared various payment banks operating in India on the basis of publicly available
information.
Jio Payments Bank and NSDL Payments Bank are well capitalised compared to its peers
All the payment banks are well capitalised. As of end-fiscal 2021, Jio Payments Bank and NSDL Payments Bank had
a capital adequacy ratio of 2347% and 230% respectively. This is followed by Airtel Payments Bank and India Post
Payments Bank with a total capital adequacy ratio of 90.2% and 79.2% respectively in fiscal 2020. Fino Payments
Bank has a capital adequacy ratio of 56.25% as at end of March 2021.
Fino Payments Bank has 2nd highest number of branches after India Post Payments Bank
India Post Payments Bank had the highest number of branches (650), followed Fino Payments Bank (54). PayTM
Payments Bank had the highest quantum of deposits amongst payment banks, with deposits of Rs 34.5 billion as of
March 2021, followed by India Post Payments Bank. The higher quantum deposit for India Post Payment Bank is on
account of its large network of functioning offices. Fino Payments Bank also has the second largest network of
banking touchpoint at 0.72 million after PayTM Payments Bank at 21 million.
Peer comparison (FY2021)
Players Deposits
(in Rs.
Billion)
Net worth
(in Rs. Billion)
CRAR
(%)
Branches** Banking
Touchpoints
(in millions)
PayTM Payments Bank 34.5 4.8 62.4* 6 21#
India Post Payments
Bank*
8.55 5.7 79.2 650 0.14
Airtel Payments Bank 5.96 3.2 90.2* 31 0.5^
Fino Payments Bank^ 2.51 1.5 54.84 54 0.72
Jio Payments Bank 0.17 1.3 2,347 9 NA
NSDL Payments Bank 0.07 1.4 230 1 NA
Note: * Data is for FY20; ** Data is for 9MFY21; ^ Data is for Q1FY22, #Includes in-store and online merchants, Table is arranged
based in decreasing order of Deposits
Source: Company Website, Company Reports, CRISIL Research
Operational performance of payments banks
The below table shows the transaction done on cards issued by payments bank at ATMs and POS.
Fino Payments Bank has the second highest outstanding card and volume of transactions
As of August 2021, Fino Payments Bank had the second highest outstanding debit cards of 2.88 million after PayTM
Payments Bank (66.06 million). In terms of transaction volume, Fino Payments Bank has processed 6.9 million

131
transactions through debit cards at POS and ATMs in fiscal 2021. Fino Payments Bank overtook Airtel Payments
Bank in terms of transaction volume and value of transactions at ATM/PoS in FY21.
Volume and Value of transactions and card issued (August FY21)
Players Debit cards
outstanding
(in million)
Value of transaction at
ATM & POS
(in Rs billion)
Volume of transaction
at ATM &POS
(in million)
PayTM Payments Bank 66.06 36.44 18.10
India Post Payments Bank 2.22 0.84 1.42
Airtel Payments Bank 1.97 1.70 1.83
Fino Payments Bank 2.88 11.81 4.43
NSDL Payments Bank 0.18 0.07 0.10
Note: Data for value and volume of transactions includes transaction done through both ATM & POS (April 2021 to August 2021)
Source: RBI, CRISIL Research
Volume and Value of transactions and card issued (FY21)
Players Debit cards
outstanding
(in million)
Value of transaction at
ATM & POS
(in Rs billion)
Volume of transaction
at ATM &POS
(in million)
PayTM Payments Bank 63.77 84.53 46.06
India Post Payments Bank 1.11 0.37 0.70
Airtel Payments Bank 1.72 2.69 4.46
Fino Payments Bank 2.26 17.12 6.91
NSDL Payments Bank 0.1 0.1 0.20
Note: Data for value and volume of transactions includes transaction done through both ATM & POS in fiscal 2021, Transactions
is calculated basis monthly level data as on 4th June 2021
Source: RBI, CRISIL Research
Volume and Value of transactions and card issued (FY20)
Players Debit cards
outstanding
(in million)
Value of transaction at
ATM & POS
(in Rs billion)
Volume of transaction
at ATM &POS
(in million)
PayTM Payments Bank 57.53 69.6 57.42
Airtel Payments Bank 1.19 2.4 6.54
Fino Payments Bank 1.11 11 5.45
Note: Data for value and volume of transactions includes transaction done through both ATM & POS
Source: RBI, CRISIL Research

132
Product mix of various payments banks
The table below details the products and services being offered by various payment banks in India. Apart from the
offering a suite of products and services to customers in the hinterland, Fino also acts as a correspondent for partner
banks and enables digital financial transactions for customers at the bottom of the pyramid on behalf of various
banking partners.
Banks in general levy charges to customer on non-maintenance of minimum balance requirement on monthly or
quarterly frequency. In addition, other charges such as SMS or debit card charges are also levied to the customer
on an annual/monthly or quarterly basis. Subscription based accounts are those wherein charges are paid by the
customer for availing a savings account with no minimum balance requirement and they also get debit card as well
as SMS facilities on payment of an annual subscription fee. These accounts provide free transaction limits (cash
deposits, cash withdrawals, debit card withdrawals and fund transfer charges) on monthly basis, post exhaustion of
which only the transaction fees will be levied to the customer.
In July, 2020, Fino Payments Bank also launched a new product– Bhavishya, a subscription based savings account
for minors in the 10-18 years age bracket to make children banking ready and inculcate a savings habit. The product
is targeted at capturing rural population in the early stages of their financial journey and as they become adults,
account holders could plan their financial goals in a much better way. The annual subscription charges for the account
stand at Rs 349 annually (inclusive of GST). Fino Payments Bank is the only bank to offer a subscription-based
savings account in India.
Product wise comparison
Products
Fino
Payments
Bank
Airtel
Payments
Bank
India Post
Payments
Bank
PayTM
Payments
Bank
NSDL
Payments
Bank
Savings & Current A/C
Sweep Account Facility
Mobile Wallet
Debit Card
Payments
Cash Management Services
Insurance
Doorstep Banking
Business Correspondent
Business
Source: Company Website, CRISIL Research

133
Business segment wise comparison
Products
Fino
Payments
Bank
Airtel
Payments
Bank
India Post
Payments
Bank
PayTM
Payments
Bank
NSDL
Payments Bank
CASA Business Savings and
Current A/C,
Sweep
Account
Savings and
Current A/C
Savings and
Current A/C,
Sweep
Account
Savings and
Current A/C,
Sweep
Account
Savings and
Current A/C
Remittance Mobile Wallet,
Money
Transfer
Mobile Wallet,
Money
Transfer
Money
Transfer
Mobile Wallet,
Money
Transfer
Money Transfer
POS/Payments Debit card Debit card Debit card Debit card Debit card
Cash Management
Services
Cash
collection
Cash
collection
Cash
collection
NA NA
Financial Product
Distributor
Insurance Insurance Insurance NA Insurance
Banking Service Door step
Banking and
Business
Correspondent
Door step
Banking
Door step
Banking
Door step
Banking
Business
Correspondent
Source: Company Website, CRISIL Research
Fino Payments Bank posted a net profit in fiscal 2021
As of end-fiscal 2021, Airtel and Fino Payments Bank had a total revenue of Rs. 6.2 billion and Rs. 7.9 billion
respectively. Airtel Payments Bank posted a net loss of Rs. 4.3 billion during the year, whereas Fino Payments Bank
reported profits of Rs. 0.2 billion in fiscal 2021. During Q1FY22, Fino Payments Bank reported a revenue growth of
37% on year and its net profit rose by 69% on year to Rs 31 million.
Profitability of players in fiscal 2021
Players Revenue
(in Rs. Billion)
Revenue per
touchpoint
(in Rs)
Net Profit
(in Rs. Billion)
RoE (%)
PayTM Payments Bank 19.9 NA 0.2 4.1
Fino Payments Bank 7.8 12,211 0.2 14.6
Airtel Payments Bank 6.2 12,544 (4.3) (144.3)
NSDL Payments Bank* 0.6 NA (0.1) (9.3)
India Post Payments Bank* 0.5 1,667 (3.3) (58.2)
Jio Payments Bank 0.1 NA (0.9) (52.7)
Note: Players are arranged in decreasing order of revenue, * Data for fiscal 2020
Source: Company Reports, CRISIL Research

134
Point of Sale (POS) Market
POS market overview
PoS terminals are devices typically used at a retail location to capture payment information electronically and - in
some cases - on paper vouchers. These terminals are setup by acquirers and may accept payment through cards,
or other means. PoS terminals are also used for cash withdrawals using debit cards / open loop prepaid cards issued
by banks. The limits for such withdrawal are up to Rs 1000/- per day in Tier I and II centres and up to Rs. 2,000/- per
day in Tier III to VI centres. Customer charges, if any, on such cash withdrawals are not more than 1% of the
transaction amount.
Typical working of POS terminals
Source: CRISIL Research
In India, there were 4.7 million PoS terminals and 0.24 million ATMs deployed across the country as on March 31,
2021. As of August 2021, there were 4.75 million POS terminals in India. ATMs and PoS terminals have grown at a
CAGR of 4% and 28%, respectively over the past five years. While the number of ATMs (a "cash" infrastructure) has
grown at a low pace, the growth of non-cash infrastructure, mainly depicted by PoS, has been significant. This can
be attributed to benefits like lower cost of acquisition and higher mobility offered by POS terminals compared to
ATMs. The stupendous growth in PoS has given further fillip to digitization in India.

135
PoS terminals have grown five-fold in the last 5 years
…
… ATMs grew at a 4% CAGR over the same period
Note: E-Estimated
Source: RBI, CRISIL Research
Demonetisation led a sudden uptick in PoS based transactions
PoS transactions volume and value have grown at a 39% and 36% CAGR respectively over fiscal 2015 to fiscal
2020. In fiscal 2017, demonetization led to a huge increase in number of PoS terminals and PoS-based transactions
with 78% year on year growth in volume of transactions and 65% year on year growth in volume of transactions. In
fiscal 2017, after demonetization was announced in November 2016, a sudden increase in the volume of PoS
transactions was observed with 119% growth in second half of fiscal 2017 over first half of fiscal 2017. Subsequent
to the announcement of demonetization in November 2016, in a span of four months from December 2016 to March
2017, 0.93 million PoS machines were added; in contrast, as of November 2016, the total stock of PoS machines
installed was 1.6 million.
The momentum in both PoS installations and transaction volumes has not abated since then. Driven by increasing
PoS penetration, rising disposable incomes and government initiatives towards a cashless economy, the transaction
volume and value have also been growing at a fast pace. In fiscal 2021, however, due to the Covid-19 pandemic
induced lockdown, transaction growth has declined due to lower usage of PoS terminals. In first half of fiscal 2022,
the second wave impacted transaction volumes and value in the months of April and May. However, recovery has
been observed in the month of August and transaction volumes in April to August 2021 were around 2.3 billion
recording 16% growth over the same period last year and corresponding transaction value was Rs 5.9 trillion during
April to August 2021 recording 48% growth over the same period last year.
1,127 1,386
2,529
3,083
3,722
4,371 4,720 4,748
-
500
1,000
1,500
2,000
2,500
3,000
3,500
4,000
4,500
5,000
FY15 FY16 FY17 FY18 FY19 FY20 FY21 Aug-21
(in 000's)
181199
208 207218
234 239 240
0
50
100
150
200
250
300
FY15 FY16 FY17 FY18 FY19 FY20 FY21 Aug-21
(in 000's)

136
PoS based transactions grew at a 39% CAGR over fiscal 2015 through fiscal 2020, but declined in fiscal
2021 due to Covid-19 impact
Note: E-Estimated
Source: RBI, CRISIL Research
Value of PoS based transactions also grew at a 36% CAGR over fiscal 2015 through fiscal 2020, but
declined in fiscal 2021 due to Covid-19 impact
Note: E-Estimated
Source: RBI, CRISIL Research
Reduction in Merchant Discount Rate (MDR) also drove the increase in PoS
based transactions
In order to boost digital payments and acceptance, the government has reduced the MDR rates for debit cards over
the years. The government, in January 2020, also introduced zero MDR for certain modes of payments like RuPay
debit cards, UPI and UPI QR codes. This move led to an increase in acceptance of PoS terminals amongst merchants
1,423 1,959
3,486
4,748
6,177
7,277
5,810
2,019 2,350
-
1,000
2,000
3,000
4,000
5,000
6,000
7,000
8,000
FY15 FY16 FY17 FY18 FY19 FY20 FY21 Apr-Aug2020
Apr-Aug2021
(in millions)
3,113 3,996
6,583
9,190
11,969
14,328
12,869
4,038
5,978
-
2,000
4,000
6,000
8,000
10,000
12,000
14,000
16,000
FY15 FY16 FY17 FY18 FY19 FY20 FY21 Apr-Aug2020
Apr-Aug2021
(in Rs billion)

137
and an increase in transactions. For payments made through credit cards, MDR continues to be applicable. Before
the government removed the MDR on certain payment modes, the applicable MDR rate was 0.6% for transactions
above Rs 2,000 with a maximum cap of Rs 150 per transaction through RuPay debit cards and 0.3% with maximum
cap of Rs 100 per transaction through BHIM UPI.
MDR is the commission charged by bank and service providers for providing digital payments and settlement
infrastructure. When a credit card is swiped on a POS machine, the merchant is charged a fee by the bank for using
the POS machine. This fee is then divided between acquiring bank (financial institution that maintains merchant’s
bank account), issuing bank (credit card issuer) and card network (Visa, Mastercard, Rupay).
The reduction in MDR has led to some concerns that the speed of deployment of PoS devices may be impacted as
infrastructure providers may not find it economical to deploy PoS machines in some regions. Ostensibly, to address
such concerns, the government, in the Union Budget 2021-22, earmarked an amount of Rs 15 billion towards a
scheme that will provide financial incentive to promote digital modes of payment.
India still lags behind in terms of PoS penetration despite high growth in
deployed PoS terminals
Over the last six years, India has made considerable progress with reference to the absolute number of PoS terminals
deployed in the country. However, the number of people served per PoS terminal continues to be high at 287 as of
fiscal 2021. Compared to other countries, India still has the highest number of people served per PoS terminals,
which indicates enormous untapped potential for PoS terminals in the country. Moreover, most of the PoS terminals
are located in large urban cities, while in rural areas and smaller districts the penetration of PoS terminals is far lower.
People served per PoS terminal reduced considerably over fiscal 2015 to fiscal 2021, but remains at higher
levels
Source: RBI, CRISIL Research
1124
926
514
426
357307 287
0
200
400
600
800
1000
1200
FY15 FY16 FY17 FY18 FY19 FY20 FY21

138
India has the highest number of people served per PoS terminal compared to other countries
Note: For India, the data is as of March 2020. For other countries, the data is as of December 2019
Source: BIS, RBI, CRISIL Research
Private sector banks have lion’s share in the PoS market; Payments Banks
are increasing their presence
As of August 2021, private banks account for majority of the PoS devices installed in India with 67.7% share followed
by public sector banks (25.5%). Payments banks have also started penetrating this market by increasing their market
share from 0.3% as of March 2019 to 5.7% as of August 2021.
Share of various bank groups in deployed PoS terminals (as of August 2021)
Bank group Number of PoS terminals Market Share
Private Banks 3,215,369 67.7%
Public Sector Banks 1,209,936 25.5%
Payments banks 272,691 5.7%
Foreign Banks 42,797 0.9%
Small Finance Banks 6,767 0.1%
Total 4,747,560 100.0%
Source: RBI, CRISIL Research
Retail industry provides huge potential for growth of PoS market in India
Retail industry deploys the highest proportion of PoS terminals in India. Share of digital payments in overall retail
industry is estimated to be in the range of 13-18% as of fiscal 2021. Within the retail industry, organised retail industry
is growing at a fast pace especially in urban areas which has also led to faster growth in PoS transactions. In fiscal
2021, organized retail industry is estimated to account for only 12% of overall Rs 56 trillion retail market. CRISIL
Research estimates that 25-30% of the transactions (in value terms) at a pan-India level currently take place through
digital payment modes in the organized retail segment. The corresponding percentage is estimated to be much higher
at 55-60% for the e-commerce industry. With the expected increase in organized retail penetration in the country and
1940
307
50
111
22
0
50
100
150
200
250
300
350
Brazil China India* Russia South Africa United Kingdom

139
adoption of e-commerce as well as an increase in the proportion of digital payments, both these segments will
contribute to PoS market growth.
Source: CRISIL Research
Majority of the retail industry is still captured by the unorganized segment and most of the retail spending in rural
and semi-urban areas happens through unorganized retail stores which are relatively underpenetrated in terms of
PoS deployment. CRISIL Research estimates that only 10-15% of the transactions (in value terms) at a pan-India
level currently take place through digital payments mode in the unorganized retail segment; in small unorganized
stores located in semi-urban and rural areas, the proportion of retail digital payments are estimated to be much lower
than this nation-wide average . This segment of the retail industry provides huge potential for growth of PoS market
in India.
Number of PoS terminals to grow at a 26% CAGR over fiscal 2021 to fiscal 2025
Note: P-Projected
Source: RBI, CRISIL Research
1.1 1.4
2.53.1
3.74.4 4.7
6.0
7.7
9.7
12.1
0.0
2.0
4.0
6.0
8.0
10.0
12.0
14.0
FY15 FY16 FY17 FY18 FY19 FY20 FY21 FY22 P FY23 P FY24 P FY25 P
(in millions)

140
Movement towards O+O in retail industry to also create growth opportunities
Online plus offline (O+O) refers to business models wherein online vendors are increasingly looking at creating a
physical presence for customer fulfilment and physical stores are developing an online presence in order to woo
customers. This encompasses in-store pick up of items purchased online, allowing items purchased online to be
returned at a physical stores and allowing physical store customers to place orders online through appropriate
technology interventions.
Besides increase in the proportion of digital transactions in the retail industry, we also foresee increasing opportunities
due to increased emphasis on online plus off-line play, more popularly known as O+O. Traditional brick and mortar
players are increasing their online presence, and at the same time, online players are investing in creating an on-
the-ground presence. This trend will be influenced by technological progress, changes in customer behaviour, and
entry of new consumer brands in the market place. The onset of the Covd-19 pandemic, demonetisation of high value
currency notes and implementation of GST have also acted as catalysts in accelerating the O+O shift.
Transactions growth to be driven primarily by increase in PoS terminals
Between fiscal 2015 and 2020, transaction volume and value has grown at a 39% and 36% CAGR respectively.
However, majority of this growth came immediately after demonetisation in fiscal 2017. In fiscal 2021, the transaction
volumes and value for POS declined by 20% and 10% respectively. However, with economy opening up, CRISIL
Research expects the transaction volumes to grow at 37% CAGR from fiscal 2021 to fiscal 2025 to reach 21 billion
transactions through PoS terminals. Transaction value is expected to grow at 35% CAGR over the same period to
touch Rs 43 trillion. Expected increase in PoS terminals along with improvement in credit and debit card penetration
and changing consumer behaviour are key factors that will support the growth in transactions through PoS.
PoS transactions to grow at 23% CAGR over FY20
to FY25…
…leading to a growth of 25% CAGR in value of PoS
transactions

141
Source: RBI, CRISIL Research
Growth drivers
Majority of the growth in transactions will come from robust increase in number of PoS terminals. Other factors like
low debit and credit card penetration and usage in the country and changing consumer behavior towards digital
payments will also lead to increase in PoS based transactions.
Higher Debit card usage: As of August 2021, there are 914 million debit cards which indicates that debit card
penetration in India is at 67%. Despite considerable presence of debit cards, the number of transactions per debit
card at a PoS terminal annually is only 6 which is very low. With increasing financial literacy and acceptance of
payment infrastructure, usage of debit cards is expected to improve which will lead to growth in transactions.
Increase in Credit card penetration: As of August 2021, there are only 64 million credit cards outstanding, leading
to a credit card penetration of only 4.7% in India. With growth in the number of credit cards issued, PoS transactions
would also witness a concurrent increase as more than 50% of credit card transactions occur through PoS terminals.
Changing consumer behavior: With increasing push from government towards digital payments, the consumer
behavior towards the same has also been evolving. After demonetization, consumers started adopting these
modes of payment and have gained confidence in transacting digitally. Covid-19 pandemic has also given a further
impetus to consumers for transacting digitally. However, this change is more prominent in urban areas. In rural and
semi-urban areas, cash is still preferred for many transactions. Going forward, with higher digital payments
penetration and increasing trust of consumers in digital payments, transactions are also expected to increase.
Growth, on the supply side, in PoS terminals will be primarily driven by the following factors:
Regulatory push through PIDF: In January 2021, RBI announced the creation of Payment Infrastructure
Development Fund (PIDF) to boost digital payments in Tier 3 cities and Tier 6 cities. PIDF has an initial corpus of Rs.
3.45 billion, of which Rs. 2.5 billion is contributed by RBI and the remaining from authorised cards networks as well
as card-issuing banks in India. This fund will be used to subsidize banks and non-banks for deployment of payment
1.4 2.0 3.5
4.7 6.2
7.3 5.8
8.1
11.1
15.2
20.7
-
5.0
10.0
15.0
20.0
25.0
(in billions)
3.1 4.0 6.6
9.2 12.0
14.3 12.9
17.6
24.0
32.2
43.2
-
5.0
10.0
15.0
20.0
25.0
30.0
35.0
40.0
45.0
50.0
(in Rs trillion)

142
infrastructure for those merchants, who still don’t have access to POS machines. This move is also expected to
encourage deployment of point of sale infrastructure, improve digital payments and provide better access of financial
services in under penetrated or unpenetrated areas.
Salient features regarding operationalisation of PIDF
Objective
• The objective of PIDF is to increase the number of acceptance devices multi-fold in the
country. The Scheme is expected to benefit the acquiring banks / non-banks and
merchants by lowering overall acceptance infrastructure cost.
Validity Period • 3 years from January 2021, extendable by 2 more years, if necessary
Target
• Increasing payments acceptance infrastructure by adding 3 million touch points – 1
million physical and 2 million digital payment acceptance devices every year
• The primary focus of the scheme is to create payment acceptance infrastructure in
Tier-3 to Tier-6 centres. Special focus will be given to North-eastern states
• Tentative distribution of targets across the centres is 30% in tier 3 and tier-4 centres,
60% in tier 5 and tier 6 centres and 10% in north-eastern states
• Merchants providing essential services (transport, hospitality, etc.), government
payments, fuel pumps, PDS shops, healthcare, kirana shops will be targeted
Funding
• Initial contribution of Rs 2.5 billion from RBI, Rs 1 billion from authorised card networks
and card issuing banks basis the number of debit and credit cards issued by them
• Recurring contribution from card networks and card issuing banks based on their
turnover as well as for banks, the number of new debit and credit cards issued by them.
Claims
management
• Maximum cost of physical acceptance device eligible for subsidy is Rs 10,000
(including one-time operating cost up to a maximum of Rs 500).
• Maximum cost of digital acceptance device eligible for subsidy is Rs 300 (including
one-time operating cost up to a maximum of Rs 200)
• Acquirers meeting or exceeding their targets and/or ensuring greater utilisation of
acceptance devices in terms of transactions to be incentivized and vice-versa
Subsidised amount of cost of physical and digital payment acceptance devices (as a
percentage of total cost of the device) based on location of deployment will be as under:
Location Physical payment acceptance device
Digital payment acceptance device
Tier 3 and tier 4 centres 30% 50%
Tier 5 and tier 6 centres 40% 60%
North eastern states 50% 75%
Source: RBI, CRISIL Research

143
Offering other value added services to merchants: Major players in the industry have also started focusing on
value added services that can be provided to the merchants acquired through PoS sales. Given the high cost of
merchant acquisition, acquirers have been working towards introducing new revenue streams in the business by
offering various PoS solutions. These include billing management, sales analytics, GST solutions, expense
management applications inventory management software etc.
Data collection through POS software enables the players to provide value added services to the merchants. The
type of data collected can include customer details (such as purchase trends), payment method used, inventory
details (as POS software is typically synchronized with inventory software), tax details, employee productivity, sales
trend (repeat sales data, time of sale, merchandise purchased) and even geographic location and demographic
data. POS data can thus enable the service provider to track spending trends at a city or an area level or a retail
segment level, which can enable them to provide customized merchant solutions.
Changing merchant mindset: The retail merchants are making attempts to attract customers and enhance
customer experience by offering flexible payment solutions (such as buy now pay later) through the PoS terminal.
This shift in the retailer or merchant mind-set will increase the acceptance of payment infrastructure leading to
growth in PoS terminals.

144
Emergence of newer technology: With introduction of newer payment methods such as Near Field Communication
and QR codes based systems in India, the PoS segment is also evolving with improved technology usage to
accommodate these newer methods of payments. Along with technology upgrade, the players in the industry are
also working towards making technology affordable. For example, PayTM, in March 2021, announced the launch of
a smart PoS application, which can convert mobile phones into card payment machines. Domestic
Remittances
Overall Market Size
Domestic remittance transfers predominantly refers to migrant workers sending money from the places where they
work to their homes in other states/regions for meeting the needs and day-to-day expenses of their family members.
As the urban population in India has consistently been increasing, we are witnessing an increasing trend of migration
from villages and smaller semi-urban areas to larger cities and towns As per the census 2011 data, India had 456
million migrants (38% of the total population) as compared to 307 million migrants (30% of the total population) in
2001. The number of migrants who moved from rural to urban areas also increased from 52 million in 2001 to 78
million in 2011, leading to a rise in share of rural to urban migrant in the population from 5.1% in 2001 to 6.5% in
2011. The number of migrants in the total population is expected to have further increased over the last decade,
leading to strong growth in the domestic remittances market. While recent data on the number of migrants in India is
not available, the Economic Survey 2021 notes that 6.31 million migrant workers travelled to their home towns
through Shramik Special trains from May to August 2020 after the onset of the Covid-19 pandemic and nation-wide
lockdown.
CRISIL Research estimates the total domestic remittances market to be just a shade over Rs 2 trillion in fiscal 2020.
Between fiscal 2017 and 2020, this trend in migration of population has continued, leading to an 11% CAGR growth
in the domestic remittance market.
In fiscal 2021, the covid-19 pandemic and the nationwide lockdown plummeted the remittance flow in the first half of
the year, triggered by sudden job loss and the migrants returning to their home states. However, the remittances
picked up in the second half of fiscal 2021 on account of government schemes such as Prime Minister Garib Kalyan
Yojana and resumption of economic activities.
Going forward, CRISIL Research expects remittances to gradually increase as the economic situation comes back
to normal in fiscal 2022. In the long term, digital India and financial inclusion initiatives in the country is expected to
support remittances growth, with more and more people availing remittance services for funds transfers to remote
areas. We project the market to touch Rs 3.4 trillion by FY25, translating into a ~12-13% CAGR in remittances during
FY20-25, notwithstanding the small blip in growth in FY21.
Domestic remittance market to grow at a 12-13% CAGR between fiscal 2021 and fiscal 2025

145
Note: E: Estimated, P: Projected Source: Economic Survey 2017, CRISIL Research
Growth drivers
Urbanisation and migration of population to urban regions to drive growth
Urbanisation is one of India’s most important economic growth drivers as it will drive substantial investments in the
country, which, in turn, is expected to lead to job creation, development of modern consumer services and increased
ability to mobilise savings. The country’s urban population has been rising consistently over the decades. In 1950, it
was 17% of total population. As per the 2018 revision of World Urbanization prospects, the proportion of urban
population in India was estimated at 34% as of 2020. This is expected to reach 37% by 2025, which will drive growth
in the domestic remittances market in the times to come.
Urban population as a percentage of total population (%)
Note: P - Projected
Source: Census 2011, World Urbanization Prospects: The 2018 Revision (UN)
1.51.6
1.82.05 2.1
2.42.7
3.0
3.4
0.0
0.5
1.0
1.5
2.0
2.5
3.0
3.5
4.0
FY2017E FY2018E FY2019E FY2020E FY2021E FY2022P FY2023P FY2024P FY2025P
Domestic Remittance Market Size (in Rs trillion)
17.0 17.919.8
23.125.5
27.7
30.9
34.937.4
0.0
5.0
10.0
15.0
20.0
25.0
30.0
35.0
40.0
1950 1960 1970 1980 1990 2000 2010 2020P 2025P

146
Revival of economy to aid remittances
India’s GDP growth is expected to clock 9.5% in fiscal 2022 after declining in fiscal 2021 . Further improvement in
activities such as infrastructure and real estate development will see labourers returning back to city to take up their
jobs. This is expected to result in a rebound in remittance services in the medium term.
Improvement in financial system infrastructure to drive remittances
According to the G20 National Remittance Plans of 2019, India is committed to increase remittances market
competitiveness, improve financial infrastructure and pursue policies to reduce remittance rates. Thus, the
government is expected to continue to focus towards deepening of financial infrastructure in the remote parts of the
countries through product innovation and harnessing of new technologies. This will enhance the outreach of
payments systems including remittances service, through active participation and co-operation with regional players
for establishing standard protocols for larger systemic benefit. For example, within a short span of time, we have
witnessed UPI becoming a very popular payment system, across platforms and applications due to strong
government focus, increase in use cases, and the convenience offered.
Emphasis on Direct benefit transfer (DBT) by the government
The transfer of government subsidies and payments directly into the bank accounts of beneficiaries has helped cut
out middlemen and enable better targeting of subsidies. The DBT scheme has achieved greater effectiveness with
the help of Jan Dhan accounts. The government is targeting to bring all government schemes gradually under the
ambit of DBT, which will cut leakages and improve the transparency in the system. Customers availing of government
subsidies, on their part, will be required to avail of remittance services to withdraw funds deposited into their accounts
instead of relying on unorganised middlemen.
Growing BC penetration and emergence of newer channels for remittance
The channels use for remittance vary largely as companies use channels like NEFT, IMPS, RTGS, PPIs and new
modes of payments like NPCI’s enabled Aadhaar enabled payment system (AePS). Much of the domestic remittance
in India currently happens through agents or touchpoints who acts as business correspondent (BCs) for banks and
provide a range of basic banking services. As more and more payment based fintechs are entering the industry,
digital wallets are increasingly becoming popular for P2P transactions. Compared to traditional methods, they’re also
faster, cheaper and convenient. Sending money from one digital wallet to another account is instantaneous, wherein
the sender just require the phone number of the recipient. The recipient can link the mobile wallet for credit directly
into the bank account or cash out the remittance at any other convenient time.
Revenue model of service providers in the remittance business
The market for domestic remittance was once dominated by India Post and a multitude of informal service providers.
However, over the past decade, the banks have developed various models to provide remittance services and acquire
a larger share of this market opportunity. Domestic money remittance (DMR) enables a walk in customer to transfer
funds to any bank account, anywhere in the country. The customer just has to deposit the amount to be transferred
to the DMR agent or the agent at the banking touchpoint, who would then transfer the amount using NEFT or IMPS
to the beneficiary. The majority of the costs associated with the remittance is towards API usage and commission

147
paid to the agents who facilitate the transactions. The customer can also choose to remit funds directly through the
mobile based platform using the phone number of the beneficiary.
The revenue source for the DMR providers is primarily dependent on the volume of transaction. They earn a fee,
which is paid by the sender. The domestic remittance charges are set as an absolute amount, which varies across
different slabs of amount transferred. Overall, as a proportion of the amount remitted, the charges vary between
0.5%-1.0percent of the fund transferred. The scale of operations of the DMR providers, availability of touchpoints,
trust and convenience offered to the customer is also forms a critical part of the remittance business.
Players Charges for Fund Transfer
Fino
Payments
Bank
• With Fino Payments Bank (Through Mobile Banking) – Free
• Within Fino Payments Bank (Through Merchants) – Rs. 10
• Within Fino Payments Bank (Through Branch) – Free
• Fino to Other Bank (Through Mobile Banking)- Rs 5- Rs. 15
• Fino to Other Bank (Through Merchants & Branch) – Rs. 5 to Rs. 15
Airtel
Payments
Bank
• Within Airtel Payments Bank (Internet & mobile banking, USSD) – Free
• From Airtel Payments Bank to other banks (NEFT) – Free
• From Airtel Payments Bank to other banks (IMPS) – 1% of remittance amount
India Post
Payments
Bank
• Within India Post Payments Bank (IPPB) – Free
• IPPB to other banks (Mobile banking)- Rs. 5-10 (IMPS), Rs. 2.25- Rs. 20 (NEFT),
Rs. 24-Rs. 50 (RTGS)
• IPPB to other banks (Through Touchpoints)- Rs. 10-50 (IMPS), Rs. 2.25- Rs. 25
(NEFT), Rs. 24-Rs. 50 (RTGS)
PayTM
Payments
Bank
• IMPS, UPI, NEFT Transfers – No charges
• Domestic transfer through PayTM Banking Point – Min Rs. 10 or 1% of the
remittance amount (whichever is higher)
Note: The charges is as per disclosures on the websites of the companies as of mid-March 2021
Source: Company websites, CRISIL Research

148
Guidelines for mobile banking transactions in India
Mobile phones, as a medium for extending banking services, have attained greater significance because of their
ubiquitous nature. The rapid growth of mobile users in India, through wider coverage of mobile phone networks, have
made this medium an important platform for extending banking services to every segment of banking clientele in
general and the unbanked segment in particular. In order to ensure a level playing field, RBI brought out a set of
operating guidelines for adoption by banks in October 2008, which were further updated in 2011, 2014 and 2015.
In December 2011, limits of mobile banking transactions was increased from Rs. 1,000 to Rs. 5,000 and the norms
for domestic money transfers was also relaxed.
In December 2014, RBI directed banks to provide easy registration option to the customers and sought a higher
degree of standardization in the above process. In order to address the challenge in extending the facility of Mobile
pin (MPIN) generation to the customers registered for mobile banking, RBI allowed banks to explore different options.
In order to quicken the process of MPIN generation and also widen the accessibility to their mobile banking registered
customers, banks was also allowed consider adopting various channels / methods such as:
• Through the ATM channels (similar to option available for change of PIN on their own ATMs as well as in
inter-operable ATM networks)
• Through an option provided in the Unstructured Supplementary Service Data (USSD) menu for mobile
banking (both their own USSD platform, if any, as well as under the inter-operable USSD Platform for mobile
banking)
• Banks’ own internet banking website, with necessary safeguards
• Use of MPIN mailers (like PIN mailers for cards)
• Common website can also be designed as an industry initiative
Banks could also undertake customer education and awareness programme in multiple languages through different
channels of communication to popularise their process of mobile banking registration/activation and its usage etc. In
December 2015, RBI further extended the channels to be used for customer registration to include phone banking
and IVR to fasten the process for customer registration which was critical for mobile banking operations.
The guidelines contains all rules / regulations / procedures prescribed to be followed by banks for operationalising
mobile banking in India and is applicable to all commercial banks (including Regional Rural Banks), Urban
Cooperative Banks, State Cooperative Banks and District Cooperative Banks.
Currently, under the RBI guidelines:
• Banks are permitted to offer mobile banking services (through SMS, USSD or mobile banking application)
after obtaining necessary permission from the Department of Payment & Settlement Systems, Reserve Bank
of India.
• Banks which are licensed, supervised and having physical presence in India, are permitted to offer mobile
banking services. Only banks who have implemented core banking solutions are permitted to provide mobile
149
banking services. Banks may also use the services of Business Correspondent appointed in compliance with
RBI guidelines, for extending this facility to their customers.
• Banks are required to put in place a system of registration of customers for mobile banking. Banks should
strive to provide options for easy registration for mobile banking services to their customers, through multiple
channels, thus minimising the need for the customer to visit the branch for such services. The time taken
between registration of customers for mobile banking services and activation of the service should also be
minimal.
• Banks are permitted to offer mobile banking facility to their customers without any daily cap for transactions
involving purchase of goods and services. However, the banks may put in place per transaction limit
depending on the bank’s own risk perception, with the approval of its Board.
• Transactions up to Rs 5000/- can be facilitated by banks without end-to-end encryption. The risk aspects
involved in such transactions may be addressed by the banks through adequate security measures.
• In order to facilitate the use of mobile phones for remittance of cash, banks are permitted to provide fund
transfer services, which facilitate transfer of funds from the accounts of their customers for delivery in cash
to the recipients. The disbursal of funds to recipients of such services can be facilitated at ATMs or through
any agent(s) appointed by the bank as business correspondents.
Regulations governing domestic money transfer in India
Prior to 2011, only banks were permitted to initiate money transfers in the country subject to adherence of KYC/AML
guidelines. A large number of people, particularly the migrant population, who do not have access to formal banking
channels face difficulties in using the authorized channels for transferring funds. Hence, in October 2011, RBI
introduced new guidelines to provide certain relaxations to provide money transfer facilities in a safe, secure and
efficient manner across length and breadth of the country.
The relaxations include:
• Liberalising the cash pay-out arrangements for amounts being transferred out of bank accounts to
beneficiaries not having a bank account and enhancing the transaction cap from the existing limit of Rs.
5,000 to Rs. 10,000 subject to an overall monthly cap of Rs. 25,000 per beneficiary.
• Enabling walk in customers not having bank account (for instance migrant workers) to transfer funds to bank
accounts (of say family members or others) subject to a transaction limit of Rs. 5,000 and a monthly cap of
Rs. 25,000 per remitter.
• Enabling transfer of funds among domestic debit/credit/pre-paid cards subject to the same
transaction/monthly cap as mentioned above.
• In addition, Banks/non-banks were directed to put in place a robust system of safeguards including velocity
checks and alerts to customers about credit into accounts using this facility. Any unusual spurt in volume of
credits in a particular account/group of accounts shall be immediately investigated and appropriate
authorities shall be alerted regarding suspicious transactions. RBI also mandated such fund transfers to be

150
effected on a real/near real time basis and the Inter-bank settlement of funds to be effected using RBI
approved payment systems only.
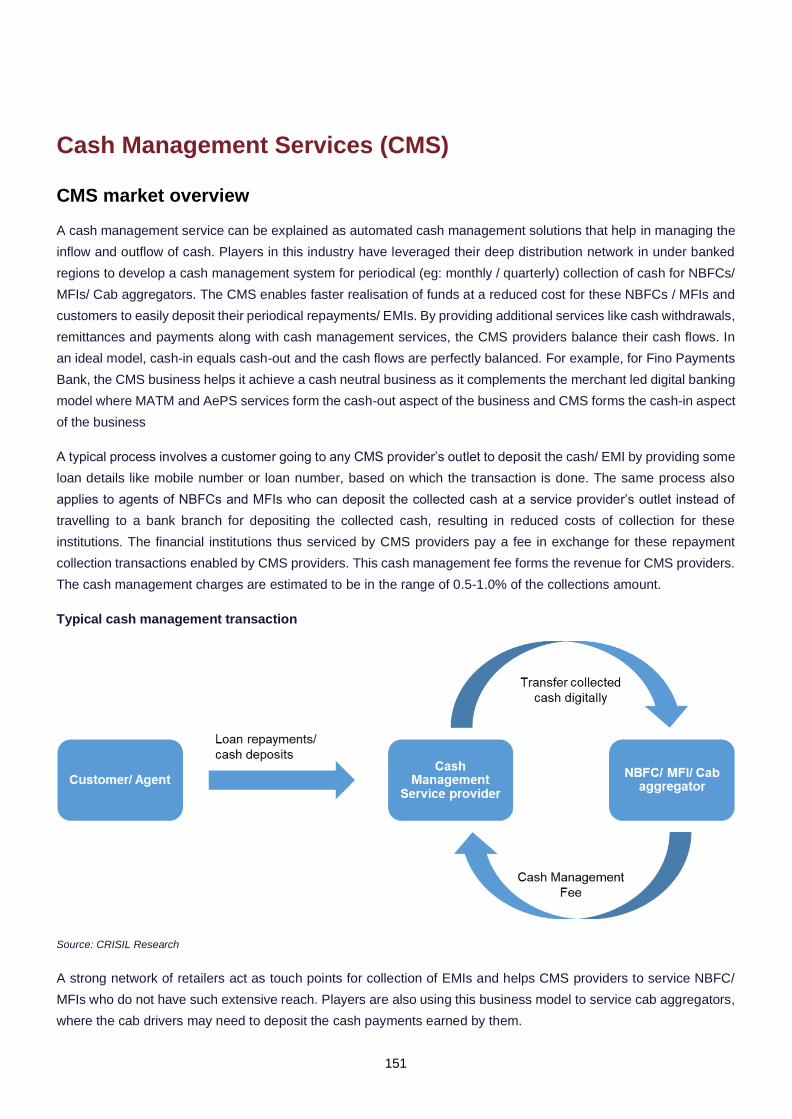
151
Cash Management Services (CMS)
CMS market overview
A cash management service can be explained as automated cash management solutions that help in managing the
inflow and outflow of cash. Players in this industry have leveraged their deep distribution network in under banked
regions to develop a cash management system for periodical (eg: monthly / quarterly) collection of cash for NBFCs/
MFIs/ Cab aggregators. The CMS enables faster realisation of funds at a reduced cost for these NBFCs / MFIs and
customers to easily deposit their periodical repayments/ EMIs. By providing additional services like cash withdrawals,
remittances and payments along with cash management services, the CMS providers balance their cash flows. In
an ideal model, cash-in equals cash-out and the cash flows are perfectly balanced. For example, for Fino Payments
Bank, the CMS business helps it achieve a cash neutral business as it complements the merchant led digital banking
model where MATM and AePS services form the cash-out aspect of the business and CMS forms the cash-in aspect
of the business
A typical process involves a customer going to any CMS provider’s outlet to deposit the cash/ EMI by providing some
loan details like mobile number or loan number, based on which the transaction is done. The same process also
applies to agents of NBFCs and MFIs who can deposit the collected cash at a service provider’s outlet instead of
travelling to a bank branch for depositing the collected cash, resulting in reduced costs of collection for these
institutions. The financial institutions thus serviced by CMS providers pay a fee in exchange for these repayment
collection transactions enabled by CMS providers. This cash management fee forms the revenue for CMS providers.
The cash management charges are estimated to be in the range of 0.5-1.0% of the collections amount.
Typical cash management transaction
Source: CRISIL Research
A strong network of retailers act as touch points for collection of EMIs and helps CMS providers to service NBFC/
MFIs who do not have such extensive reach. Players are also using this business model to service cab aggregators,
where the cab drivers may need to deposit the cash payments earned by them.

152
CMS providers capitalise on reach, technology and cash handling efficiency
Source: CRISIL Research
High proportion of cash based repayments of MFIs and NBFCs will support
CMS growth
While adoption of digital payment modes has been increasing in the country, the semi-urban and rural areas are still
quite underpenetrated as far as digital payment modes are concerned, owing to lack of awareness and lower literacy
levels leading to higher cash intensity. NBFCs and MFIs focused towards these geographical segments and those
targeting customers with relatively poor financial literacy therefore deploy collection agents and/or deploy their own
teams to collect repayment of loans due from their customers. CRISIL Research estimates that in fiscal 2021, cash
collections as a proportion of overall NBFC retail credit repayments is around 29-31%, slightly lower as compared to
31-33% in fiscal 2018. This reduction can be attributed to increasing awareness, usage and penetration of electronic
and digital modes of payments. Although the proportion of cash collections in the total repayments received by
NBFCs and MFIs has reduced, the amount of repayment collection in cash, in absolute terms, is estimated to have
increased from Rs 1.2-1.4 trillion in fiscal 2018 to Rs 1.9-2.1 trillion in fiscal 2021. This increase can be attributed to
the growth in the loan book of NBFCs in the preceding years and higher cash collections in loan segments like
microfinance loans, two wheeler loans, commercial vehicle loans, gold loans and MSME loans.
Source: CRISIL Research estimates
Technology to manage
collections in a seamless manner
for clients
Mechanism to handle cash in an efficient manner
Wide network of retailers/
touchpoints
1.2 - 1.4
1.9 - 2.1
FY18 E FY21 E
Loan repayment collections in cash for NBFCs and MFIs (Rs trillion)

153
Significant potential for CMS providers in the MFI partner segment
The microfinance industry focuses on the rural customer segment extensively. As of March 2021, 71% of the loan
outstanding of MFIs was accounted for by rural customers (Source: Sa-Dhan Quarterly MF report (Q4-FY21)). Total
loan outstanding of the microfinance industry was Rs 2,593 billion (excluding SHG) as of March 2021 with NBFC-
MFIs accounting for 32% of the loans. Considering the customer profile that these MFIs cater to, maintaining the
asset quality of the portfolio is one of their primary focus areas and hence repayment collections is a significant area
of operations.
According to a study on adoption of cash-light models among MFIs in India commissioned by Microfinance Institutions
Network (MFIN), in the fourth quarter of fiscal 2017, only 5% of the total MFI repayment was through cashless modes.
Over the last few years after demonetisation, the MFIs have increasingly focused on cashless disbursement but
cashless collections still account for a very low proportion. According to Sa-Dhan, proportion of cashless
disbursements for MFIs stood at 79% for last quarter of fiscal 2021(Source: Sa-Dhan Quarterly MF report (Q4-FY21)).
As of 2021, CRISIL Research estimates the cashless collections to be only 6-8% of MFI repayments. While the
proportion of cashless collections would increase going forward, we do not foresee a significant spurt in the same
because of the literacy level of MFI customers and inadequate infrastructure in rural areas. Thus, there exists
significant potential for the CMS providers to process these repayment transactions digitally and cater to the
requirements of MFIs.
NBFCs penetrating deeper into semi-urban and rural segments to drive CMS growth
The top 50 districts in the country, which can be considered as metro and urban areas, are estimated to account for
50-55% of the retail credit of NBFCs as of fiscal 2021. These top 50 districts contribute to 24% of the population. The
remaining 45-50% NBFC retail credit is across the remaining districts, which are relatively lesser penetrated in terms
of financial services. Increasing penetration of financial services in rural and semi-urban areas will support the credit
growth in these areas going forward.
NBFCs have a diversified portfolio catering to various consumer segments and adoption of cashless collections is
more common in NBFCs compared to that in MFIs. However, retail credit segments like two wheeler loans, tractor
loans, commercial vehicle loans, gold loans and MSME loans, which predominantly cater to rural and semi-urban
population, still have a high proportion of repayments collected through cash. CRISIL Research estimates the
proportion of cash repayments in the overall retail credit collections of NBFCs to be in the range of 25-30%, which
provides potential for CMS providers to grow their business and cater to NBFCs focussed on these retail loan
segments.
Lower bank branch penetration also to drive growth for CMS providers
Bank branch penetration is low in India compared to other countries in the world. This causes an inconvenience to
customers of MFIs and NBFCs to deposit their repayments/ EMIs to bank branches, especially in rural areas where
electronic and digital modes of payments have very low penetration. CMS providers, who operate through a wide
network of retailers or kirana stores, offer a convenient mode of transaction for these customers. Number of branches
per hundred thousand adults are only 14.6 for India compared to other developed and developing countries where
this number is relatively high.

154
Commercial bank branch penetration across the world
Note: (*) – UK data is as of 2013 calendar year
Source: World Bank, RBI, CRISIL Research
Moreover, in India, there is a huge gap in bank branches serving rural areas and urban areas. In rural areas, number
of bank branches per hundred thousand population is only 6 compared to the 23 in urban areas. CMS providers,
through wide reach and presence, are trying to capture this untapped potential.
Players providing Cash Management Services in India
In India, various players in the financial services industry provide cash management services including commercial
banks, payments banks and CMS service providers who also operate as a business correspondent. However, the
types of services offered by commercial banks and other players are quite different. Commercial banks offer a
whole suite of cash management services (also known as treasury management) to large corporates and
businesses, as a value added service, which include assessing market liquidity, managing cash flow and
investments. They also offer solutions to manage receivables and payables for their customers. For example,
HDFC Bank, under wholesale banking segment, provides CMS as a value added service which includes collections
and payments services.
Payment Banks and CMS providers acting as business correspondents are mainly involved in cash collection
services for NBFCs and MFIs through EMI collection at touch points. Some of these players also offer cash
collection services to cab aggregators or food aggregators. For example, Bankit offers CMS to various institutions
like Arohan, Ziploan, Indiabulls Housing Finance etc. Among Payment Banks, Airtel Payments Bank offer CMS to
NBFCs and MFIs and Fino Payments Bank also offers the service to multiple clients.
29.7
25.1
17.9
15.2 14.7 14.2
9.4 9.2 8.8
0.0
5.0
10.0
15.0
20.0
25.0
30.0
35.0
US UK* Brazil Indonesia India World Germany South Africa China
Commercial bank branches per 100,000 adults (2020)
155
AADHAR Enabled Payment System (AePS) / Micro-ATM
(MATM)
Overview
AADHAR Enabled Payment System (AePS) is a bank led model that uses Aadhaar authentication to allow
interoperable transactions at Micro-ATMs (MATM) / POS terminals which was launched in 2016. Under this system,
Aadhaar number is used not only to identify the beneficiary but also authenticate transactions. The financial services
offered through AePS include cash withdrawal, cash deposit, balance enquiry, Aadhaar to Aadhaar fund transfer.
The non-financial transactions include - demographic authentication, best finger detection (BFD) and e-KYC. Micro
ATMs were introduced by NPCI to encourage cashless transaction in India.
Micro-ATM is a portable device used by a merchant or a business correspondent to connect to his/her bank,
authenticate customers and perform transactions. Although it is called micro-ATM, it does not have cash storage or
dispensation facilities. The cash balances are reflected online but physical cash is deposited with or handed out by
the merchant or a BC. The micro-ATMs are based on a bank-led model for financial inclusion, where the Aadhaar
infrastructure is an overlay on the existing banking and payments infrastructure and support transactions such as
deposits, withdrawals, funds transfer, balance enquiry & a mini-statement. The advantages of using a micro-ATM is
that its cost of deployment is low as compared to a normal ATM and it is an interoperable device which can work with
any bank.
There are various participants involved in the deployment of a micro-ATM network, the roles of which are as
follows:
a. Issuing bank: The issuing bank is the bank that owns the customer relationship, and stores account details
in its Core Banking Systems (CBS). The customer banks with the issuing bank and interacts with it for any
queries, it serves as a touch point for authorizing transactions, carrying out transactions and dispute
resolution.
b. Acquiring bank: The acquiring bank is the bank that owns the BC relationship at the transaction point. An
acquirer is often a traditional bank that contracts with a payment processing company or may also a payment
processor that does not offer regular banking service.
c. Business Correspondent (BC): A BC is appointed by the bank providing access to basic banking services
using micro-ATM. Banks may either appoint an individual BC or a corporate BC, who further can appoint
sub-agents. BC may own the customer as well.
d. Technology Service Provider (TSP): TSP provides technology to the acquiring Bank to support BC
operations.
e. Multilateral switch: The multilateral switch is used in the case of 'off-us' transactions to provide
interoperability. It routes transactions from the acquiring bank to the issuing bank, and routes the
authorization, settlement and reconciliation messages. An 'off-us' transaction in case of funds transfer may
involve multiple banks, viz., the acquiring bank, the issuing bank, and the recipient's bank and the process

156
is put through by the multilateral switch. This multilateral switch is operated by NPCI and other interbank
switch vendors.
f. UIDAI: The Aadhaar platform supports the micro-payments platform by providing methods for secure
authentication of an individual, using the Aadhaar number and demographic data, biometrics and OTP. The
secure authentication provided by the UIDAI facilitates interoperability among micro-ATM devices operated
by different banks, much like the existing ATM network.
Requirements for AePS transactions
Even though Aadhaar Enabled Payment Systems does not need any document nor any card, it does require one to
link Aadhaar to their bank account. The main requirements of an AePS transaction are as follows:
Prerequisites for AePS transaction
Requirements by Merchant Customer
Bank Account Required for transfer of funds
to Merchant’s Bank account Money will be transferred from
the payer’s account
Business
Correspondent Required for operating AePS
micro-ATM device Not required by customer
Aadhaar Mandatory Mandatory
Aadhaar registered
with Bank
Merchant’s bank account has
to be linked to his Aadhaar
for making transactions
Aadhaar number to be mapped
to bank account for
authentication
Biometric scanner Required for biometric
authentication with Aadhaar Not required by customer
Micro ATM
Required for initiating
payments using Aadhaar no.
/ fingerprint scanner Not required by customer
Source: NPCI, CRISIL Research
AePS transactions grew by 92% in fiscal 2021 to touch Rs 2,286 billion
Over the past few years, AePS transaction over MATM has witnessed a strong growth, with transaction volumes
increasing at a CAGR of 178% between fiscal 2017 and fiscal 2021. In terms of value, it has increased at a CAGR
of 216% during the same period. The micro-ATMs have added impetus to the financial inclusion efforts as the banks
can rely on the micro-ATM infrastructure to reach the unbanked and under-banked regions of the country, thereby
allowing the customer to access secured banking facilities at their doorsteps. The micro-ATMs deployed in the
country have also increased at a fast rate to reach 0.49 million as of August 2021 from 0.28 million as of May 2020.
The development also shows the government’s push towards digital technology for making banking services
accessible to the masses.
AePS transactions have seen an unprecedented and substantial surge in April 2020 in terms of transaction handled.
In April 2020, AePS transaction volume and value increased by over 150% and 45% over March 2020. This indicates
that the outreach of the BC and micro-ATMs payment mechanism spread widely during and post the lockdown in the
rural areas of the country. Direct Benefit Transfer Schemes (DBT) announced by the central government has also
encouraged the rural populace to actively avail services to receive the cash supports transferred to their Aadhaar

157
linked banked accounts. Further, the support from telecom operators to setup AePS infrastructure for last mile
connectivity of BCs and micro-ATMs boosted enrolment numbers for use of AePS transactions.
In the month of January 2021, AePS transaction value stood at Rs. 220 billion as compared to Rs. 147 billion in April
2020 and Rs 199 billion in June 2020, which indicates that customers enrolled in AePS ecosystem continue to avail
AePS service in greater measure and this is expected to drive growth in the coming years. Cumulatively, in fiscal
2021, AePS transactions (in value terms) rose by 92% to touch Rs 2,286 billion as compared to the same period last
year. In H1FY22, AePS transactions volume has reached 534 million, registering a 2% growth as compared to same
time in the last fiscal. AePS transaction value have also witnessed a growth of 35% to reach Rs. 1,455 billion as
compared to Rs1,077 billion in H1FY21.
AePS transaction have zoomed between FY17 and FY21….
Source:RBI, NPCI, CRISIL Research
…And so have AePS transaction value between FY17 and FY21
Source:RBI, NPCI, CRISIL Research
16 106
254
437
963
525 534
-
200
400
600
800
1,000
1,200
FY2017 FY2018 FY2019 FY2020 FY2021 H1FY21 H1FY22
AePS Volume (in Million)
(Transaction value- in million)
23
269
678
1,189
2,286
1,077
1,455
-
500
1,000
1,500
2,000
2,500
FY2017 FY2018 FY2019 FY2020 FY2021 H1FY21 H1FY22
AePS Value (in Billion)
(Transaction value- in billion)
35%

158
AePS transactions value to jump five-fold between FY20-25
Going forward, CRISIL Research expects AePS transactions volume and transactions value to grow at a 31% and
29% respectively between fiscal 2021 and fiscal 2025. Consequently, AePS transactions value are projected to touch
Rs 6.4 trillion by fiscal 2025. The growth will be driven by increasing business correspondent and micro-ATM
penetration to reach the remote regions of the country. Further, development of new use-cases and adoptions of
steps such as biometric and iris authentication to curb transaction failures are also expected to drive transaction
volumes and value in the coming years.
AePS transactions volume to grow at 31% CAGR between fiscal 2021 and 2025
Note: P: Projected
Source: NPCI, CRISIL Research
AePS transactions value to grow at 29% CAGR between fiscal 2021 and 2025
Note: P: Projected
Source: NPCI, CRISIL Research
16 106
254437
963
1,297
1,712
2,243
2,802
-
500
1,000
1,500
2,000
2,500
3,000
FY2017 FY2018 FY2019 FY2020 FY2021 FY2022P FY2023P FY2024P FY2025P
(in Million)
23 269
678
1,189
2,286
3,142
4,021
5,067
6,392
-
1,000
2,000
3,000
4,000
5,000
6,000
7,000
FY2017 FY2018 FY2019 FY2020 FY2021 FY2022P FY2023P FY2024P FY2025P
(in Rs. Billion)

159
Growth Drivers
Under penetration of ATMs in rural areas presents a big opportunity for micro-ATMs
According to “Report of the Committee to Review the ATM Interchange Fee Structure” by RBI, the ATM access in
India lags most of the emerging markets and large economies like Russia, China, South Africa, US, UK, etc. with
only 21 ATMs being available per 100,000 adults in the year 2019. While the overall ATM access in India is low, the
ATMs are also unevenly deployed across rural and urban areas. Close to 65% of population live in rural areas but
only 20% of ATMs are deployed in rural centres and rest being in metro, urban and semi-urban centres. Thus, there
is a huge requirement for ATM deployment in India to make it accessible to masses and make it even more available
in semi-urban & rural centres where it is highly underserved. This poses a great opportunity for micro ATMs to cater
to the growing demand and deepen penetration to reach the last mile of the country and address the challenges
faced by rural population in fulfilling the cash withdrawal requirement.
ATMs per 100,000 adults (2020)
Note: (*) – US data is as of 2009 calendar year
Source: World Bank, RBI, CRISIL Research
New use cases and increasing transaction efficiency to maintain momentum for AePS transactions
AePS dominates rural geographies with high dependence on cash-in cash out transactions from bank and
remittances. In Q2FY21, it emerged as a critical cash out medium for migrants, workers and other informal sector
workers. However, issues such as recurring transaction failure, especially for off-us transactions and problems in
reconciliation of failed transactions restricted the uptake of AePS. Going forward, increasing use cases of the micro-
ATMs and AePS such as utility bill payments and insurance premium payments in the rural areas as also adoption
of Iris and face biometrics to curb transaction failures is expected to increase usage of AePS over micro-ATMs.
Increasing BC penetration to drive AePS transactions over micro-ATMs
According to National Strategy for Financial Inclusion (NSFI) for the period 2019-2024, RBI has come up with slew
of measures such as introduction of pilot Centres for Financial Literacy (CFLs) to strengthen financial literacy and
training programmes for skill up-gradation for performance of BCs for effective delivery of financial services. The RBI
has also advised all State/Union Territory Level Bankers’ Committees (SLBCs/UTLBCs) in October 2019 to identify
one district in their jurisdictions and allot it to a member bank with a significant footprint, with a view to expanding and
137
7382
76 73
61
3843
17
0
20
40
60
80
100
120
140
160
USA Germnany UK Brazil China South Africa Indonesia World* India

160
deepening of the digital payment ecosystem in the country. The endeavour is to make the district 100 per cent digitally
enabled within one year. Continued focus of the Central government and RBI on digital payments using Aadhaar to
authenticate transactions over micro-ATMs and business correspondent outlets is expected to fuel the growth for
AePS transactions in the coming years.
Competitive landscape
As of August 2021, there were 0.49 million micro-ATMs deployed in the country. With 0.25 million devices being
deployed by Fino Payments Bank, it has the largest network of micro-ATMs in India. As of August 2021, about 51%
of the micro-ATM deployed in the country is from Fino Payments Bank followed by SBM Bank (12%) and State Bank
of India (SBI) at 8%
Player wise share of micro-ATMs (as of August 2021)
Note: Others include data for all banks excluding Fino Payments Bank, SBI and SBM Bank
Source: RBI, CRISIL Research
Revenue model for service providers
The micro-ATM service providers provide payment solution to the retailers to manage all forms of payments, including
debit/credit cards, Bharat QR code, Aadhaar Pay and UPI. The retailers provide a one-time fee to the service
providers for procurement of devices and a transaction processing fee to MATM/AePS service providers. In addition,
some MATM/AePS service providers also earn a transaction processing fee from partners who use their API for
facilitation of transactions. The cost for owning a micro-ATM/POS machine ranges between Rs 3,000 – Rs. 5,000 for
the retailers, whereas other high-end POS terminals price ranges between Rs. 10,000 – 15,000. The transaction
charges range between 0.25-0.40% percent of the transaction amount, which is paid to micro-ATM service provider.
Fino Payments Bank, 51%
SBM Bank, India, 12%
State Bank of India, 8%
Others, 29%

161
Banking technology solutions
API Landscape
An application programming interface (API) is primarily a development tool that essentially bridges a gap between
digital services, thereby allowing one application to access information or capabilities of another. But, over the past
few years, APIs have been elevated from a development technique to a business model driver. Organizations are
increasingly using APIs to build an ecosystem involving various partners to unlock new value for their businesses. In
order to leverage their strength, the APIs are now managed like a product – one built on top of a potentially complex
technical footprint that includes legacy and third party systems, which can be shared, reused and monetized to extend
the reach of service providers and open up new revenue streams.
Evolution of API
The idea behind APIs has existed since the beginning of computing, however, in the last decade, its usage has grown
significantly due to a fast pace of adoption of agile delivery models. This has put a higher emphasis on rapid
experimentation to enable processing of transactions between different elements in the technology solution stack.
Evolution of APIs
Remarks
1960-1980
The era saw basic interoperability leading to programmatic exchange of information using simple
network protocols. Example of some of these techniques include Advanced Research Projects
Agency Network (ARPANET) and Transmission Control Protocols (TCP)
1980-1990
From simple transmission, the APIs were refined using interfaces, procedures etc. to build on the
existing infrastructure and provide additional services which could allow remote interaction across
different entities lying in different networks
1990-2000
Between 1990 and 2000, the industry saw middleware technologies which lies between the
operating systems and applications running on it. The middleware allows communication and data
management for distributed application. Some techniques which was predominantly used in this
time were message oriented middleware and service oriented architecture.
2000- Present
In today’s time, businesses build APIs to enable and accelerate new service development and
offerings. During the last few years, we have seen the emergence of API economy and witnessed
software as a service (SaaS), platform as a service (PaaS) and infrastructure as a service
(IaaS) becoming an important mode for of delivering solutions. This is a cost effective way for
enterprises to use specific programmes and resources in a flexible or variable cost model rather
than buy them outright and install them on their technology stack.
In the same way as plug-and-play model has worked for software service providers, a plug and
play banking equivalent – banking as a service (BaaS) is now evolving and doing so for financial
services

162
Traditionally retail banks owned end-to-end service delivery by integrating experience, process and products;
however, this approach came under attack with the advent of fintechs which started to compete for customers by
proving a superior user experience leveraging technology. This forced banks to rethink their business model – leading
to an emergence of banking as a service.
A lot of established banks such as ICICI Bank and HDFC Bank today offer similar API banking services for fintechs,
aggregators, merchants, third party service providers, direct selling agents (DSAs) and API developers to build
various applications using their open API in areas of payments, customer servicing and sourcing. For instance, HDFC
Bank offers APIs for NEFT and RTGS payments that enables external partners of the bank to perform payment
transactions. ICICI Bank offers an “EasyPay” payment API which allows institutions to collect money from their
customers. It generates QR code for the merchant, receives money from the customer and updates the status of the
transaction. These open banking integrations have also brought digital inclusiveness to smaller towns and rural
regions, and enhanced the awareness and relevance of banking services and products for rural India.
However, for larger banks, these APIs form a very small part of their revenue, and are created with the objective of
better connecting with their target customer base. Given the wide market expanse and the diversity of customer base,
there exists considerable opportunity for players to work on new use cases targeting specific segments – for example,
unbanked and underbanked segments. Fino Payments Bank, for example, offers APIs to business correspondents
that enables them to provide services to their customers in semi-urban and rural areas in a cheaper and faster
manner. YAP provides a bank-in-box service that enables digital platforms, fintechs as well as brick-and-mortar offline
businesses to connect with other fintechs, public platforms such as UPI, licensed banks and NBFCs to offer specific
solutions to their end-users.
Banking as a service (BaaS) model begins with a third party service provider paying a fees to a financial institution,
who opens its API to the new fintech/third party provider, thereby granting access to systems and information that
will be necessary to build a new financial or banking product for the end consumer. This allows the financial
institutions that launch their BaaS platforms to create new revenue streams which include charging clients a monthly
fee for the platform and an additional variable cost based on the service used. The API ecosystem value chain has
three participants:
• API/BaaS Providers – They choose which business assets to make available as an API, under what terms
and conditions and what will be roles and responsibilities for the provider
• API Consumer – These involves the partners who under the designated terms and condition build on the
existing API to enhance the experience on an existing product or make a new product available to the end
user
• End User – The end user is someone who does not see the API, rather draws benefit by undertaking a
transaction from the use of application that is provided

163
Banking as a service (BAAS) business model
Source: CRISIL Research
Beyond adding a new revenue stream arising out of sale of technology, developing a BaaS solution also allows
financial institutions to establish relationships and forge partnerships with new fintechs and entities with emerging
business models, thereby keeping themselves ahead of the trends. In addition, continuous development and
enhancement of API also allows the service provider to react faster to the market changes through faster adoption
of newer technology and reduce time to reach the market.
Relevance of API infrastructure providers in Indian context
The financial services ecosystem in India is undergoing a metamorphosis, given the rapid disruptions due to
technology. On one hand, we are witnessing the emergence of large and specialised fintech players who are offering
their services across multiple domains such as payments, credit, wealth management, insurance and broking. On
the other hand, several businesses in consumer-facing segments are looking to provide financial solutions to their
customers and suppliers. Given the extant regulatory environment, many of these businesses would require
partnerships with licensed banks, NBFCs and fintech players to offer financial services to their customers. However,
bandwidth constraints and lack of focus often inhibits the ability of larger entities to focus on such initiatives. It is here
that the licensed banks offer their core banking solutions via the use of APIs to various fintechs and other partners,
enabling them to provide differentiated products for specific use cases to their customers.
Growth Drivers
Focus on creating differentiated user experience to boost usage of APIs
The companies are employing responsive websites, interactive mobile applications and other user friendly digital
interfaces to enhance their interactions with customers. API capabilities allow the fintechs and other partners to
implement newer ideas arising from design thinking for providing services such as payments, mobile wallets and
collections. This ensures they are able to provide various services under a single platform to their customers, thereby
enhancing the experience and also aiding in customer stickiness.

164
Newer business use cases and ease of access to drive growth for API providers
APIs enable companies to leverage the capabilities of other organizations, thereby reducing their cost of owning the
technology and applying resources for maintenance. Continued growth of this asset light model to build businesses
around APIs rather than rebuilding it from scratch will drive growth for the API service providers. Continued innovation
and focus on development of new tools by API providers in areas of retirement planning, portfolio management and
other such relevant use cases around their existing platform will also drive revenues for the API based service
providers. API companies can also offer bundled and integrated offerings with different pricing options to their
customers and allow them to avail features and benefits based on their business requirements.
To conclude, the rapid growth of APIs has been triggered by steps taken by various entities in this space to leverage
the benefits of technology to offer low-cost banking solutions. Given the evolving context post Covid-19 pandemic, it
is clear that technology will play a much larger role in financial services and adoption of newer technology will continue
to increase through various partnerships between banks and fintechs as well as other consumer-facing entities.
Essentially, APIs can provide the rails on which fintechs and other incumbents can build new-use cases keeping in
mind their target customer segment. CRISIL Research believes that platform centric models, which run through APIs,
will continue to gain traction with potential API customers preferring agile and asset-light business models, while
enhancing focus on offering relevant solutions to customers.

165
Peer Benchmarking The banking and payments landscape in India is evolving at a rapid pace with the emergence of new players such
as
• Small finance banks and payment banks that offer a host of solutions to their target customers which
includes underserved and unserved people in rural and semi-rural areas of India
• Infrastructure solutions providers such as PoS and payment gateway companies looking to provide a host
of value added services such as buy now pay later (BNPL) solutions, working capital loans and other value
added services including customized / small ticket size products to attract middle-income / lower middle-
income class on their platforms
• Pure play payment and remittance companies looking to top up their payment offerings with other solutions
such as credit and investment solutions
• Neo banks attempting to tap niche customer segments such as MSMEs
• BaaS and API focused players providing the infrastructure that enables their customers building new
products for specific use cases to integrate with licensed banks, NBFCs, and fintechs
While the nuances underlying the business model and the target customer segment of these companies may be
different, there is a common underlying thread across all these players i.e. to leverage technology effectively to
provide a range of services in a seamless and more efficient manner to their customers. Moreover, several players
are also seeing improvement in the unit economics, with an increase in size and scale.
Given that many of these businesses in India are at a nascent or early growth stage of their life cycle, we opine that
it is pertinent to look at global comparables as well. Therefore, in this chapter, we have compared both Indian and
global players operating in the following spheres – payments and remittances, PoS solutions, neo banks, digital
banks, and banking technology solutions. We have given a brief overview of the business and operations of each of
these entities, their vintage, and the trend in their financial performance (wherever available). Our analysis reflects
considerable variation in the target customer segments, focus areas, stage of evolution, scale and profitability of
each company. While many of the companies in India are growing at an extremely strong pace, profitability remains
elusive for 10 of the 13 companies we looked at (based on FY20 financials). Going forward, building sufficient scale
on both sides of a transaction (customers as well as merchants), putting in place reliable technology and systems,
building new use cases relevant to the target segment and thereby enhancing transaction frequency, looking
beyond payments to cross sell other services to customers and having relevant partnerships will be critical to the
success of entities focused on this space.

166
Indian Peers
Players in Payments and Remittance Business
Company
Name
Year of
Inception Company Overview
Bharat Pe
(Resilient
Innovations
Pvt.
Limited)
2018
• BharatPe is an offline acquirer of merchants providing a QR code for UPI payments,
POS machine for card acceptance, and loans to small merchants.
• The company's mobile application is a full-stack service app for merchants across
small and medium businesses, offering loans, investments, insurance and other
financial services.
• The company revenue stood at Rs. 129 million in its first year of operation (fiscal
2020).
Operational Data*
Merchants: 5 million+
Transaction value: $7 billion (Annualized), Transaction Volume : 50 million+ (Monthly)
POS machines deployed: 35,000+ (YTD since July 2020)
Financials
for the year
(ending
March)
Net worth
(Rs
million)
Revenue
(Rs
million)
Revenue
growth
(%)
EBITDA
(Rs
million)
PAT (Rs
million)
EBITDA
Margin
(%)
PAT
Margin
(%)
RoE (%)
2020 7,761 129 NM -2,155 -2,162 -1,669% -1,675% -28%
Company
Name
Year of
Inception Company Overview
BillDesk
(IndiaIdeas.
com
Limited)
2000
• BillDesk is an online payment gateway company owned by IndiaIdeas.com Ltd
offering billers, banks and customers a comprehensive bill presentment, payment and
management service.
• The company provides payments platform for enterprise wide electronic payments
and collections, related reconciliation and settlement operations across multiple
delivery channels and wide range of payment methods.
• Its technology, payments services and its processing network are used by many
organizations across diverse industry segments such as, banking, financial services,
telecom, insurance, utilities, education, entertainment and e-commerce businesses.
• The company has been witnessing higher revenue growth sequentially over the last
three years ending FY20.
• In Sept 2021, BillDesk’s acquired by PayU, the Prosus(Naspers)-owned fintech for
US$ 4.7 billion
Financials
for the year
(ending
March)
Net worth
(Rs
million)
Revenue
(Rs
million)
Revenue
growth
(%)
EBITDA
(Rs
million)
PAT (Rs
million)
EBITDA
Margin
(%)
PAT
Margin
(%)
RoE (%)
2020 21,850 14,389 30% 3,277 2,315 23% 16% 11%
2019 19,544 11,077 19% 2,448 1,519 22% 14% 10%
2018 12,027 9,293 15% 2,231 1,303 24% 14% 11%

167
Company
Name
Year of
Inception Company Overview
Infibeam
Avenues
Limited
2007
• Infibeam operates an online payment system with technology platform solutions. The
company operates as a payment processor for online merchants, websites and
commercial users for which it charges a fee on successful transactions.
• Infibeam’s payment system, CCAvenue, provides nearly 250 payment options in
India, processing payments across 27 international currencies that enables online and
mobile payments for merchants.
• Infibeam also provides a host of services like money transfer, recharge, travel,
insurance, cash collection, prepaid cards, AePS and BBPS through various platforms
such as the Government e-Marketplace (GeM), Bharat Bill payment services
(BillAvenue) and hospitality solution (ResAvenue), among others.
• The company has maintained a stable PAT Margin of 6-8% over the last three years.
Operational Data
• Merchants: 3 million, Active agents: 30,000+ (March 2021)
• Transaction value stood at Rs 1.4 trillion with 182 million transaction in FY21
• Payments revenue share: 78%, Platforms revenue share: 22% (FY21)
Financials
for the year
(ending
March)
Net worth
(Rs
million)
Revenue
(Rs
million)
Revenue
growth
(%)
EBITDA
(Rs
million)
PAT (Rs
million)
EBITDA
Margin
(%)
PAT
Margin
(%)
RoE (%)
2021 26,571 5,858 -2% 605 494 10% 8% 2%
2020 26,353 5,954 7% 1,391 599 23% 6% 1%
2019 25,995 5,539 81% 988 617 18% 7% 2%
Company
Name
Year of
Inception Company Overview
Instamojo
Technologi
es Pvt.
Limited
2012
• Instamojo provides cloud based payment processing solution for businesses and
merchants. It is an on-demand payments and ecommerce platform that empowers
micro-entrepreneurs, startups, MSMEs.
• The company has pioneered "Payment Links" in India, which is an easy to start and
easy to integrate payment solution, enabling entrepreneurs and businesses to quickly
get started with collecting payments online.
• Products: MojoPayments (payment services), MojoCommerce( enabling sellers to
create and manage online store), Mojo Capital ( small business loans), Mojo Express
( shipping and logistics)
• While the revenue of the company has been growing at a 46% CAGR over fiscal 2018
and 2020, the losses have expanded over the same period.
Operational Data*
Payment links: 3 million+
Online stores created: 50,000+
Loans disbursed: Rs 2 billion+
Financials
for the year
(ending
March)
Net worth
(Rs
million)
Revenue
(Rs
million)
Revenue
growth
(%)
EBITDA
(Rs
million)
PAT (Rs
million)
EBITDA
Margin
(%)
PAT
Margin
(%)
RoE (%)
2020 196 348 18% (123) (137) -36% -39% -87%
2019 120 294 80% (78) (85) -26% -29% -83%

168
2018 83 163 161% 1 (1) 1% -1% -7%
Company
Name
Year of
Inception Company Overview
One
Mobikwik
Systems
Pvt.
Limited^
2009
• MobiKwik is a fintech platform, operating businesses in consumer payments, payment
gateway, and financial services.
• The MobiKwik wallet can be used across a host of payments services, including bill
recharges, utility bill payments, cab bookings, ticket bookings, payments for groceries,
as well as payments to online digital and offline retail stores. Besides, the company
cross sells insurance and other third party products.
• The company has witnessed strong revenue growth between fiscal 2018 and 2020 as
well as decreasing losses in the same period.
Operational Data
• Registered users: 101.37 million (March 2021)
• Merchants: 3.44 million (3.37 million physical stores), Billers: 283 (March 2021)
• Revenue from consumer payments business: 73%, Fintech business: 21%, Payment
gateway business: 7% in fiscal 2021
Financials
for the year
(ending
March)
Net worth
(Rs
million)
Revenue
(Rs
million)
Revenue
growth
(%)
EBITDA
(Rs
million)
PAT (Rs
million)
EBITDA
Margin
(%)
PAT
Margin
(%)
RoE (%)
2021 (200.13) 2,951 -18% (1,089) (1,113) -37% -38% NM
2020 (308.52) 3,591 136% (954) (999) -27% -28% NM
2019 (15.73) 1,524 83% (1,497) (1,480) -98% -97% NM
Company
Name
Year of
Inception Company Overview
Oxigen
Services
India Pvt.
Limited
2004
• Oxigen Services India is a payment solution and remittance service provider in India.
It is involved in the business of service aggregation and distribution utilising mobile,
POS and web for online payment processing and money transfer services.
• It provides a payment processing platform for leading service providers across various
industries like telecom, DTH, utility bill payments, bookings for hotels and movie
tickets, mobile wallet top-ups, and airline and railway ticketing services.
• The company has been witnessing a declining trend in revenues and profit margin of
the company has also turned negative between fiscal 2018 and 2020
Operational Data
Touchpoints: 200,000 (April 2019)
Financials
for the year
(ending
March)
Networth
(Rs
million)
Revenue
(Rs
million)
Revenue
growth
(%)
EBITDA
(Rs
million)
PAT (Rs
million)
EBITDA
Margin
(%)
PAT
Margin
(%)
RoE (%)
2020 364 3,143 -44% (192) (365) -6% -12% -67%
2019 730 5,590 -46% (446) (634) -8% -11% -62%
2018 1,312 10,313 -62% (179) 22 2% 0% 2%

169
Company
Name
Year of
Inception Company Overview
PayTM
(One 97
Communica
tions Ltd)
2010
• PayTM is a financial services company that offers full-stack payments & financial
solutions to consumers, offline merchants and online platforms owned by One97
Communication Limited. It also operates as a Payments Bank.
• PayTM offers a digital goods and mobile commerce platform and is a payment
solutions provider to e-commerce merchants using a semi-closed wallet.
• Products and services offered by PayTM include DTH/mobile recharge, utility bill
payments, travel bookings, insurance, investment in stocks and mutual funds, e-
commerce and wallet services.
Operational Data
• In fiscal 2021, it has existing users network of 333 million and over 21 million
registered merchants, of which over 50% of registered merchants hold an account
with Paytm Payments Bank. It has ~64 million savings accounts and offers interest
rate of 2.5% p.a.
• Issued a cumulative of ~ 9 million FASTags and partnered with 270 toll plazas in fiscal
2021
• App downloads: 40 million
• Transaction Value - Rs 4.6 trillion (June 2020), Transaction volume - 4.8 billion (June
2020)
Financials
for the year
(ending
March)
Net worth
(Rs
million)
Revenue
(Rs
million)
Revenue
growth
(%)
EBITDA
(Rs
million)
PAT (Rs
million)
EBITDA
Margin
(%)
PAT
Margin
(%)
RoE (%)
2021 65,162 31,868 -5% (13,829) (17,010) -43% -51% -23%
2020 84,114 33,506 -1% (26,395) (28,332) -79% -85% -39%
2019 60,360 33,916 3% (38,637) (39,596) -114% -117% -58%
Company
Name
Year of
Inception Company Overview
PayU
Payments
Pvt. Limited
2011
• PayU operates as an online payment gateway and payment service provider. It offers
a variety of other products such as PayU Buttons, Payment links and Excel Plugin.
• PayU also launched LazyPay in 2017, an alternate lending platform to offer credit
solutions such as Small Ticket Credit (Buy Now Pay Later), App-based loans (Instant
personal loans) and Point of Sale Credit (Merchant EMI).
• Over the last three years ending FY20, the company has been witnessing strong
revenue growth. While it is still making losses at the EBITDA level, the quantum of
losses has been coming down.
Operational Data*
Merchants: 450,000+
Financials
for the year
(ending
March)
Net worth
(Rs
million)
Revenue
(Rs
million)
Revenue
growth
(%)
EBITDA
(Rs
million)
PAT (Rs
million)
EBITDA
Margin
(%)
PAT
Margin
(%)
RoE (%)
2020 9,676 12,163 35% (677) (983) -6% -8% -10%
2019 9,873 9,011 49% (917) (1,207) -11% -13% -13%
2018 8,022 6,056 95% (1,333) (1,498) -22% -25% -17%

170
Company
Name
Year of
Inception Company Overview
Phone Pe
Pvt. Limited 2015
• PhonePe is a mobile payments app that allows users to transfer money instantly by
using their mobile number. Its online payment system is based on Unified Payments
Interface (UPI) and a digital wallet.
• The company offers services such as money transfers, Recharges, bill payments,
credit card payments, Gold purchase, Online and offline merchant payments, Mutual
funds and Insurance
Operational Data
As of February 2021:-
Registered Users: 280 million, Monthly active users: 112 million
Merchants: 17.5 million, Billers: 1200+
Total number of transactions: 1.07 billion
Annual Transaction Value: $337 billion
Financials
for the year
(ending
March)
Net worth
(Rs
million)
Revenue
(Rs
million)
Revenue
growth
(%)
EBITDA
(Rs
million)
PAT (Rs
million)
EBITDA
Margin
(%)
PAT
Margin
(%)
RoE (%)
2020 12,851 4,272 74% (16,872) (17,715) -395% -415% -159%
2019 9,420 2,458 401% (18,993) (19,047) -773% -775% -371%
2018 847 490 185% (7,826) (7,910) -1596% -1613% -843%
Company
Name
Year of
Inception Company Overview
Razor Pay
Software
Pvt. Limited
2014
• Razorpay is a payments gateway provider. It is a platform that enables businesses to
accept, process, and disburse payments through a wide suite of products.
• It gives access to all payment modes including credit card, debit card, net banking,
UPI and popular wallets including JioMoney, Mobikwik, Airtel Money, FreeCharge,
Ola Money, and PayZapp.
• In addition, it has also built a neo banking platform for MSMEs, and offers business
banking and credit products through tie ups with banks.
• The company has seen extremely strong growth in revenues in the last 3 years
ending FY20, and net losses too have narrowed.
Operational Data*
Online merchants: 5 million+
Financials
for the year
(ending
March)
Net worth
(Rs
million)
Revenue
(Rs
million)
Revenue
growth
(%)
EBITDA
(Rs
million)
PAT (Rs
million)
EBITDA
Margin
(%)
PAT
Margin
(%)
RoE (%)
2020 2,475 5,194 163% (30) (62) 0% -1% -3%
2019 1,235 1,975 114% (33) (33) -2% -2% -3%
2018 760 922 257% (26) (128) -3% -14% -34%
Note: *: Based on website disclosures as on March 20, 2021; ^Consolidated financials
Source: Company reports, Company websites, CRISIL Research
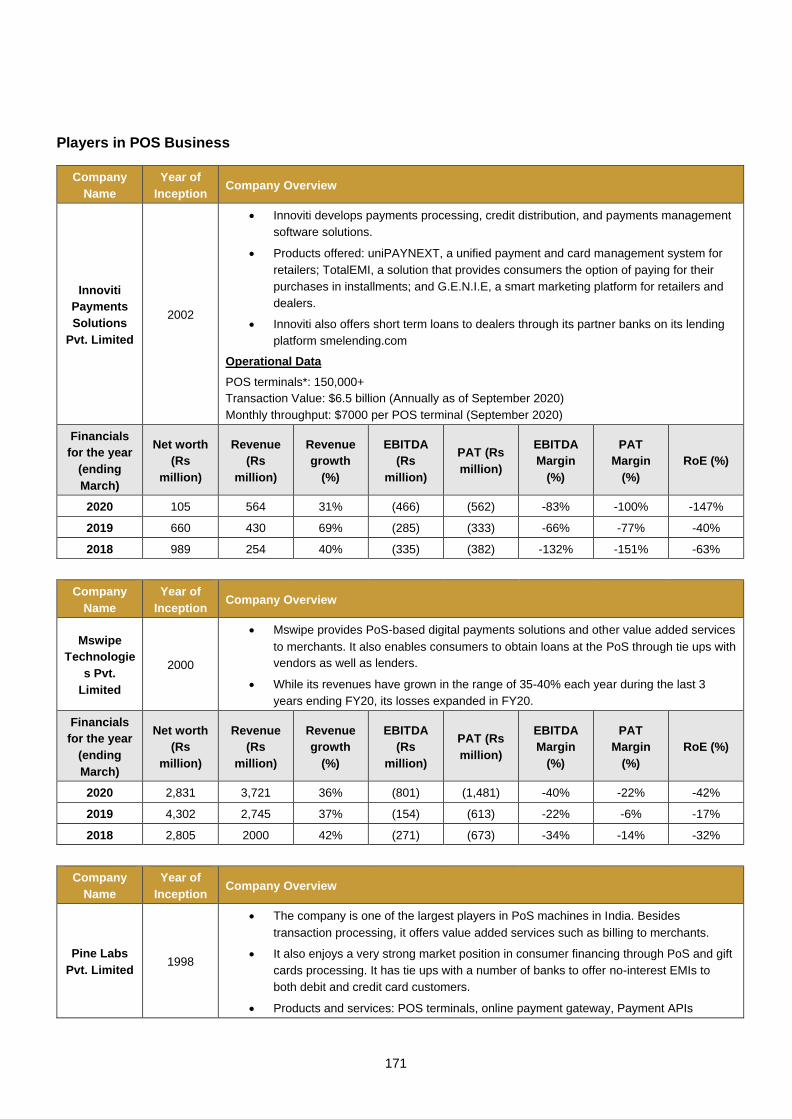
171
Players in POS Business
Company
Name
Year of
Inception Company Overview
Innoviti
Payments
Solutions
Pvt. Limited
2002
• Innoviti develops payments processing, credit distribution, and payments management
software solutions.
• Products offered: uniPAYNEXT, a unified payment and card management system for
retailers; TotalEMI, a solution that provides consumers the option of paying for their
purchases in installments; and G.E.N.I.E, a smart marketing platform for retailers and
dealers.
• Innoviti also offers short term loans to dealers through its partner banks on its lending
platform smelending.com
Operational Data
POS terminals*: 150,000+
Transaction Value: $6.5 billion (Annually as of September 2020)
Monthly throughput: $7000 per POS terminal (September 2020)
Financials
for the year
(ending
March)
Net worth
(Rs
million)
Revenue
(Rs
million)
Revenue
growth
(%)
EBITDA
(Rs
million)
PAT (Rs
million)
EBITDA
Margin
(%)
PAT
Margin
(%)
RoE (%)
2020 105 564 31% (466) (562) -83% -100% -147%
2019 660 430 69% (285) (333) -66% -77% -40%
2018 989 254 40% (335) (382) -132% -151% -63%
Company
Name
Year of
Inception Company Overview
Mswipe
Technologie
s Pvt.
Limited
2000
• Mswipe provides PoS-based digital payments solutions and other value added services
to merchants. It also enables consumers to obtain loans at the PoS through tie ups with
vendors as well as lenders.
• While its revenues have grown in the range of 35-40% each year during the last 3
years ending FY20, its losses expanded in FY20.
Financials
for the year
(ending
March)
Net worth
(Rs
million)
Revenue
(Rs
million)
Revenue
growth
(%)
EBITDA
(Rs
million)
PAT (Rs
million)
EBITDA
Margin
(%)
PAT
Margin
(%)
RoE (%)
2020 2,831 3,721 36% (801) (1,481) -40% -22% -42%
2019 4,302 2,745 37% (154) (613) -22% -6% -17%
2018 2,805 2000 42% (271) (673) -34% -14% -32%
Company
Name
Year of
Inception Company Overview
Pine Labs
Pvt. Limited 1998
• The company is one of the largest players in PoS machines in India. Besides
transaction processing, it offers value added services such as billing to merchants.
• It also enjoys a very strong market position in consumer financing through PoS and gift
cards processing. It has tie ups with a number of banks to offer no-interest EMIs to
both debit and credit card customers.
• Products and services: POS terminals, online payment gateway, Payment APIs

172
• Revenues have been growing at a stupendous pace, but at the net level, its losses
have widened.
Operational Data*
Number of merchants: 150,000, Touchpoints: 450,000
Financials
for the year
(ending
March)
Net worth
(Rs
million)
Revenue
(Rs
million)
Revenue
growth
(%)
EBITDA
(Rs
million)
PAT (Rs
million)
EBITDA
Margin
(%)
PAT
Margin
(%)
RoE (%)
2020 2,524 7,016 43% 596 (577) 8% -8% -20%
2019 3,253 4,913 62% 869 (33) 18% -1% -1%
2018 2,281 3,030 55% 449 (25) 15% -1% -1%
Note: *: Based on website disclosures as on March 20, 2021
Source: Company reports, Company websites, CRISIL Research
Players in Neo banking business
Company
Name
Year of
Inception Company Overview
InstantPay
India
Limited
2013
• InstantPay is a neo-banking platform providing a range of banking services.
• The company offers accounts, payments, cards, business loans, investments,
insurance and other services. The company made loss of Rs 17 million on revenues
of Rs 1,802 million in FY20.
Operational Data*
Customer base: 10 million monthly active customers
Transaction Value - $1 billion (quarterly); Transaction volume - 1 million (daily)
Bank partners - ICICI Bank, Axis Bank, IndusInd Bank and YES Bank
Financials
for the year
(ending
March)
Net worth
(Rs
million)
Revenue
(Rs
million)
Revenue
growth
(%)
EBITDA
(Rs
million)
PAT (Rs
million)
EBITDA
Margin
(%)
PAT
Margin
(%)
RoE (%)
2020 (19) 1,802 67% (16) (17) -1% -1% 154%
2019 (3) 1,077 43% (3) (3) 0% 0% 413%
2018 1 753 1007% (25) (26) -3% -3% -187%
Company
Name
Year of
Inception Company Overview
Niyo
Solutions
Inc. (Finnew
Solutions
Pvt Ltd )
2015
• Neo banking platform offering savings bank accounts, prepaid cards, forex cards and
direct MF investing through its platform in partnership with various banks. Besides, it
also offers small ticket loans to its customers
Financials
for the year
(ending
March)
Net worth
(Rs
million)
Revenue
(Rs
million)
Revenue
growth
(%)
EBITDA
(Rs
million)
PAT (Rs
million)
EBITDA
Margin
(%)
PAT
Margin
(%)
RoE (%)
2020 995 295 36% (866) (877) -293% -297% -124%
2019 418 217 414% (318) (323) -147% -149% -89%
2018 305 42 1269% (82) (84) -194% -198% -54%

173
Company
Name
Year of
Inception Company Overview
Open
Financial
Technologi
es Pvt.
Limited
2017
• Open is a neo-bank which provides business banking service that combines
everything from banking to invoicing & automated bookkeeping in one place. It offers
digital banking service for startups and small and medium enterprises.
• Products and services: Accounts, Payment gateway, Cards, Business loans, APIs,
Virtual card, UPI, Autopay, Accounting and Invoice Management
• The company witnessed an exponential growth on a smaller base in fiscal 2020
along with contraction in losses.
Financials
for the year
(ending
March)
Net worth
(Rs
million)
Revenue
(Rs
million)
Revenue
growth
(%)
EBITDA
(Rs
million)
PAT (Rs
million)
EBITDA
Margin
(%)
PAT
Margin
(%)
RoE (%)
2020 1,754 86 1551% (408) (422) -474% -490% -41%
2019 321 5 NA (62) (70) -1193% -1337% -42%
2018 8 - NA (23) (16) NA NM -214%
Note: *: Based on website disclosures as on March 20, 2021 Source: Company reports, Company websites, CRISIL Research
Players in Payments Bank business
Company
Name
Year of
Inception Company Overview
Airtel
Payments
Bank
2016
• Airtel Payments Bank was launched by Bharti Airtel, India’s largest telecom
provider, to support the cashless revolution promised by the Government of India. It
was the first payments bank in India to go live nationally.
• Products and services: Savings bank account, Money transfers, Recharges, Travel
bookings
• With improving revenue streams, the losses for the company have also reduced
over last three fiscals ending FY2020.
Operational data*
Customer base: 30 million, Active users: 14 million (March 2020)
Touchpoints: 500,000
Transaction Value: Rs 500 billion (annualized)
Financials for
the year
(ending
March)
Net worth
(Rs
million)
Revenue (Rs
million)
Revenue
growth (%)
PAT (Rs
million)
PAT Margin
(%) RoE (%)
2021 3,216 6,171 30% (4,344) -70% -144%
2020 2,805 4,743 86% (4,646) -100% -196%
2019 1,933 2,544 59% (3,388) -140% -159%
Company
Name
Year of
Inception Company Overview
Fino
Payments
Bank
2017
• Fino Payments Bank (FPB) is promoted by Fino Paytech Ltd. The bank provides
banking services to its target customers using technology platforms such as
Aadhaar-enabled Payment System (AePS), mPOS devices, Micro ATMs, tablet or
mobile. On the digital front, the bank offers mobile banking app BPay, online
account opening, Netbanking and UPI.

174
• FPB’s ‘phygital’ approach is backed by deep distribution across the country,
leveraging technology and entering into relevant partnerships to make banking
simple, convenient and paperless.
• The company has the largest network of Micro-ATMs in India with 55% market
share in micro-ATMs deployed in the country as of March 2021.
• The company's revenues are next only to PayTM amongst payment banks in India.
It turned profitable at the net level in Q4 FY20 and reported a profit of Rs. 205
million in fiscal 2021
Operational Data
Banking customers: 20 million (June 2020)
Merchants: 3,66,861 (June 2021), Touchpoints*: 7,24,671 (June 2021)
Transaction Value – Rs. 390 billion (April – June 2021); Transaction volume – 123 million
(April-June 2021)
Financials for
the year
(ending
March)
Net worth
(Rs
million)
Revenue (Rs
million)
Revenue
growth (%)
PAT (Rs
million)
PAT Margin
(%) RoE (%)
2021 1,505 7,909 14% 205.00 3% 15%
2020 1,300 6,913 86% (320.00) -5% -22%
2019 1,621 3,711 61% (624.00) -17% -32%
Company
Name
Year of
Inception Company Overview
India Post
Payments
Bank
2018
• India Post Payments Bank (IPPB) was set up under the Department of Post,
Ministry of Communication with 100% equity owned by Government of India.
IPPB’s reach and its operating model is built on the key pillars of India Stack -
enabling paperless, cashless and presence-less banking in a simple and secure
manner at the customers' doorstep through a CBS-integrated smartphone and
biometric device
• Key products and services offered by IPPS include deposits, money transfer, DBT,
third party products like loans, insurance, investments and post office saving
schemes, bill and utility payments and enterprise and merchant payments.
• In December 2020, IPPS launched a new digital payment app "Dakpay" to provide
digital, financial and assisted banking services.
• The operating expenses have increased drastically for the company between fiscal
2018 and 2020 leading to sharp expansion in losses.
Operational Data
Customer base: 40 million+ (February 2021)
Touchpoints: 136,078+ banking access points and 174,000+ doorstep bankers
Transaction volume - 125 million (September 2019-September 2020), Transaction Value: Rs
336 billion (September 2019-September 2020)
Financials for
the year
(ending
March)
Net worth
(Rs
million)
Revenue (Rs
million)
Revenue
growth (%)
PAT (Rs
million)
PAT Margin
(%) RoE (%)
2020 5,740 547 13% (3,339) -810% -58%
2019 5,743 482 21% (1,651) -348% -24%
2018 7,990 398 -12% 11 3% 0%

175
Company
Name
Year of
Inception Company Overview
PayTM
Payments
Bank
2017
• PayTM Payments Bank is a mobile-first bank with zero balance - zero digital
transaction charge account facility. The bank offers accounts (savings and current),
debit card, payment wallet and payment services such as NACH, FASTAG, IMPS,
UPI and NEFT.
• It was the first payment bank to turn profitable in fiscal 2019.
Operational Data
• In fiscal 2021, it has existing users network of 333 million and over 21 million
registered merchants, of which over 50% of registered merchants hold an account
with Paytm Payments Bank. It has ~64 million savings accounts and offers interest
rate of 2.5% p.a.
• Issued a cumulative of ~ 9 million FASTags and partnered with 270 toll plazas in
fiscal 2021
• App downloads: 40 million
• Transaction Value - Rs 4.6 trillion (June 2020), Transaction volume - 4.8 billion
(June 2020)
Financials for
the year
(ending
March)
Net worth
(Rs
million)
Revenue (Rs
million)
Revenue
growth (%)
PAT (Rs
million)
PAT Margin
(%) RoE (%)
2021 4,812 19,875 -10% 179 1% 4%
2020 3,976 22,062 32% 299 1% 8%
2019 3,678 16,673 131% 198 1% 6%
2018 3,486 7,219 NM (207) -3% -8%
Company
Name
Year of
Inception Company Overview
Jio Payments
Bank 2016
• Jio Payment Bank is owned by Reliance Industries Limited and it started its
commercial operations in 2018 with the aim to simplify financial inclusion in India.
• It allows customer to make recharges, pay bills and transfer money from MyJio
application or by visiting the Jio Payments Bank outlet. All these transactions use
biometric Aadhaar to enable secure transactions.
• The company has witnessed a 28% on-year revenue growth in fiscal 2020 and has
also been profitable at the net level.
Financials for
the year
(ending
March)
Net worth
(Rs
million)
Revenue (Rs
million)
Revenue
growth (%)
PAT (Rs
million)
PAT Margin
(%) RoE (%)
2021 1,256 133 -32% -897 -677% -53%
2020 2,152 194 28% 5 3% 0.2%
2019 2,147 152 NA (11) -7% -0.7%
Company
Name
Year of
Inception Company Overview
NSDL
Payments
Bank
2018 • NSDL Payments Bank commenced its operations in October 2018 to support the
initiative of providing simplified banking services. It has its flagship NSDL Jiffy

176
application, which provides secure processing of transactions and a banking
experience (including facilitation of investments in mutual funds)
• The company has seen tepid growth in revenue over the past two years, whereas
operational expenses grew at a faster rate leading to widening of losses.
Financials for
the year
(ending
March)
Net worth
(Rs
million)
Revenue (Rs
million)
Revenue
growth (%)
PAT (Rs
million)
PAT Margin
(%) RoE (%)
2020 1,047 64 8% (139) -218% -12%
2019 1,259 59 9% (65) -110% -6%
Note: *: Based on website disclosures as on March 20, 2021 Source: Company reports, Company websites, CRISIL Research

177
Global Peers
Players in Payments and Remittance Business
Company
Name
Country
and Year
of
Inception
Company Overview
Afterpay
Limited
Australia,
2015
• Afterpay Limited provides payments solutions for customers, merchants, and
businesses in Australia, New Zealand, the United States, Canada, and the United
Kingdom.
• It operates on a "Buy now, Pay later" business model providing purchase financing to
the customers by splitting payments into 4 installments for both online and in-store
purchase at zero interest.
Operational Data
Active customers: 13.1 million (December 2020)
Active merchants: 74,700 (December 2020)
Financials
for the
year
(ending
June)
Net worth
(USD
million)
Revenue
(USD
million)
Revenue
growth
(%)
EBITDA
(USD
million)
PAT
(USD
million)
EBITDA
Margin
(%)
PAT
Margin
(%)
R&D (%
of
revenue)
RoE (%)
2020 719 395 97% 19 -217 5% -4%
NA
-3%
2019 493 201 86% -7 -33 -4% -17% -11%
2018 140 108 391% 12 -7 11% -6% -5%
Company
Name
Country
and Year
of
Inception
Company Overview
Global
Payments
Inc.
USA, 1967
• Global Payments Inc. provides payment technology and software solutions for card,
electronic, check, and digital-based payments in the Americas, Europe, and the Asia-
Pacific.
• The company operates through three segments: Merchant Solutions, Issuer
Solutions, and Business and Consumer Solutions.
• In Merchant Solutions segment, the company offers authorization services, settlement
and funding services, customer support and help-desk functions, chargeback
resolution, terminal rental, sales and deployment, payment security services,
consolidated billing and statements and on-line reporting. It also offers value-added
services, including analytic and engagement tools, payroll and human capital
management services and reporting.
• In Issuer Solutions, the company offers solutions to manage card portfolios,
commercial payments and e-Payables solutions. In addition, account management
and servicing, fraud solution services, analytics and business intelligence, cards,
statements and correspondence, customer contact solutions and risk management
solutions are also offered.
• In Business and Consumer Solutions, the company offers general purpose reloadable
prepaid debit and payroll cards, demand deposit accounts and other financial service
solutions to the underbanked and other consumers and businesses.
Operational Data
Merchants: 3.5 million (December 2020)
Transaction Volume*: 50 billion (annualized)
Revenue share from businesses (FY20): Merchant Solutions (63%), Issuer Solutions (26%),
Business and Consumer Solutions (11%)

178
Financials
for the
year
(ending
December
)
Net worth
(USD
million)
Revenue
(USD
million)
Revenue
growth
(%)
EBITDA
(USD
million)
PAT
(USD
million)
EBITDA
Margin
(%)
PAT
Margin
(%)
R&D (%
of
revenue)
RoE (%)
2020 27,487 7,466 51% 2,552 605 34% 8% 5.84% 2%
2019 28,054 4,942 46% 1,701 469 34% 9% 6.21% 3%
2018 4,186 3,386 -15% 1,279 484 38% 14% 6.29% 12%
Company
Name
Country
and Year
of
Inception
Company Overview
GMO
Payment
Gateway
Inc.
Japan,
1995
• GMO Payment Gateway, Inc., together with its subsidiaries, provides financial
services and integrated payment related services.
• It operates through three segments: Payment Enhancement Business, Payment
Processing Business, and Money Service Business.
• The company offers PG multi-payment service, a payment platform that provides
credit card payment, convenience store payment, account transfer, and multi-
currency credit card payment.
• It also provides GMO payment after delivery; Ginko Pay Base System, a smartphone
app that enables payments to be made by an immediate debit from the bank account;
and GMO-PG processing platform, which helps financial institutions or financial
service providers start payment-related services.
Operational Data
Operating stores: 160,535 (December 2020)
Transaction Value: JPY 5.8 trillion, Transaction Volume: 2.57 billion (FY20)
Revenue share from businesses (FY20): Payment Processing Business (70%), Money Service
Business (28%, Payment Enhancement Business (2%)
Financials
for the
year
(ending
Septembe
r)
Net worth
(USD
million)
Revenue
(USD
million)
Revenue
growth
(%)
EBITDA
(USD
million)
PAT
(USD
million)
EBITDA
Margin
(%)
PAT
Margin
(%)
R&D (%
of
revenue)
RoE (%)
2020 301 299 23% 100 69 33% 23%
NA
25%
2019 248 244 2% 90 45 37% 19% 19%
2018 234 239 26% 63 38 26% 16% 18%
Company
Name
Country
and Year
of
Inception
Company Overview
PayPal
Holdings
Inc.
USA, 1998
• PayPal is an online payment system that operates one of the largest digital payment
platforms globally. It helps consumers as well as businesses accept and make
payments online in more than 200 countries across the world and across more than
100 different currencies.
• Its payment solutions include PayPal, PayPal Credit, Braintree, Venmo, Xoom,
Hyperwallet, and iZettle products.
• The company's payments platform allows consumers to send and receive payments,
withdraw funds from their bank accounts, and hold balances in their PayPal accounts
in various currencies.
• It also offers gateway services that enable merchants to accept payments online with
credit or debit cards, as well as digital wallets

179
Operational Data
Customer base: 348 million including 29 million merchants (December 2020)
Transaction Value - $936 billion (CY 2020); Transaction Volume – 15.4 billion (CY 2020)
Financials
for the
year
(ending
December
)
Net worth
(USD
million)
Revenue
(USD
million)
Revenue
growth
(%)
EBITDA
(USD
million)
PAT
(USD
million)
EBITDA
Margin
(%)
PAT
Margin
(%)
R&D (%
of
revenue)
RoE (%)
2020 20,063 23,230 29% 6,265 4,202 27% 18% 12% 23%
2019 16,929 18,051 15% 3,631 2,459 20% 14% 12% 15%
2018 15,386 15,633 19% 2,970 2,057 19% 13% 12% 13%
Company
Name
Country
and Year
of
Inception
Company Overview
Venmo USA, 2009
• Venmo is a mobile payment service owned by PayPal. It is an app-based digital wallet
platform for consumer payment and also offers debit and credit cards to its
customers.
• The company designs and develops an online payment and community platform
which enables its users to make and share payments, connect with other users, and
transfer money from their bank.
Operational Data
Users*: 60 million, Active accounts: 52 million+ (December 2019)
Transaction Value: $102 billion (CY 2019)
Financials NA
Company
Name
Country
and Year
of
Inception
Company Overview
Xoom
Corporati
on
USA, 2001
Xoom is an international money transfer service, owned by PayPal, that enables its customers
to send money and prepaid mobile phone reloads to people and pay bills for people around the
world.
Financials NA
Company
Name
Country
and Year
of
Inception
Company Overview

180
Yeahka
Limited China, 2011
• Yeahka is a payment-based technology platform in China providing payment and
business services to merchants and consumers.
• The company's principal business lines include one-stop payment service and
technology-enabled business services which consists of marketing services,
merchant SaaS products, and fintech services.
Operational Data
Active payment service customers (Merchants): 5.5 million (December 2020)
Active business service customer: 982,000 (December 2020)
Active payment consumers: 645 million+ (December 2020)
Transaction Value: RMB 1.5 trillion (FY20)
Revenue share from businesses (FY20): Payment Services (80%),Business Services (20%)
Financials
for the
year
(ending
December
)
Net worth
(USD
million)
Revenue
(USD
million)
Revenue
growth
(%)
EBITDA
(USD
million)
PAT
(USD
million)
EBITDA
Margin
(%)
PAT
Margin
(%)
R&D (%
of
revenue)
RoE (%)
2020 475 350 128% 351 441 15% 19% 6% 34%
2019 -83 340 3% 353 85 16% 4% 3% -13%
2018 -120 149 NA 33 -183 3% -18% 9% NA
Note: *: Based on website disclosures as on March 20, 2021, Financials is converted from local currency to USD considering exchange rate on 31st March 2021
Source: Company reports, Company websites, CRISIL Research
Players in Digital Banking Business
Company
Name
Country
and Year of
Inception
Company Overview
Atom
Bank plc UK, 2014
• Atom Bank plc provides banking services through smartphones, tablets, phablets,
phones, and Internet in the United Kingdom.
• It offers a range of products including fixed deposits, accounts, mortgages, business
loans, and secured loans to customers.
Operational Data
Customer base: 65,000 (October 2018)
Financials
for the
year
(ending
March)
Net worth
(USD
million)
Revenue
(USD
million)
Revenue
growth
(%)
EBITDA
(USD
million)
PAT
(USD
million)
EBITDA
Margin
(%)
PAT
Margin
(%)
R&D (%
of
revenue)
RoE (%)
2020 269 64 22% -81 -91 -128% -143%
NA
-32.60%
2019 290 52 103% -35 -110 -68% -211% -46.40%
2018 184 26 1600% -56 -72 -221% -282% -44.20%
Company
Name
Country
and Year of
Inception
Company Overview
Monzo
Bank
Limited
UK, 2015
• Monzo is a digital-only bank platform and marketplace that allows customers to
access a range of products and services.
• The company offers current, business, joint, and individual savings accounts; and
overdrafts and loans in the United Kingdom, and the United States. It also offers
customers the ability to transact through a mobile application.
Operational Data*
Customer base: 5+ million

181
Financials
for the
year
(ending
February)
Net worth
(USD
million)
Revenue
(USD
million)
Revenue
growth
(%)
EBITDA
(USD
million)
PAT
(USD
million)
EBITDA
Margin
(%)
PAT
Margin
(%)
R&D (%
of
revenue)
RoE (%)
2020 176 94 248% 51 -157 54% -167% 0.60% -94%
2019 158 27 641% -68 -65 -253% -239% 1.30% -55%
2018 77 4 2117% -45 -42 -1234% -1148% 0.00% -82%
Company
Name
Country
and Year of
Inception
Company Overview
Revolut
Limited UK, 2015
• Revolut is a digital bank for consumers and business.
• Retail services - Electronic money and payment services through prepaid cards,
currency exchange, P2P payments and cryptocurrency exposure
• Business services - Multicurrency exchange, prepaid corporate cards, international
and domestic bank transfers to MSMEs.
• Revolut offers various products like Accounts, Wealth, Payments, Insurance, etc.
Operational Data
Customer base: 12+ million (March 2020)
Financials
for the
year
(ending
December
)
Net worth
(USD
million)
Revenue
(USD
million)
Revenue
growth
(%)
EBITDA
(USD
million)
PAT
(USD
million)
EBITDA
Margin
(%)
PAT
Margin
(%)
R&D (%
of
revenue)
RoE (%)
2020 572 304 35% -269 -282 -88% -93% 14.1% -80%
2019 132 226 178% -142 -145 -63% -64% 8.4% -73%
2018 266 81 360% -45 -45 -55% -55% 9.3% -28%
Company
Name
Country
and Year of
Inception
Company Overview
Starling
Bank
Limited
UK, 2014
• Starling is a digital bank serving personal and business consumers. It also offers B2B
banking and payments services.
• Its retail banking app offers personal, business, joint, Euro, USD, child and current
accounts. The Starling Marketplace offers customers in-app access to third party
financial services.
Operational Data
Customer base*: 2 million+
Retail card Transactions Volume: 82 million (FY19), Retail card transaction value: GBP 1.6
billion (FY19)
Financials
for the
year
(ending
November
)
Net worth
(USD
million)
Revenue
(USD
million)
Revenue
growth
(%)
EBITDA
(USD
million)
PAT
(USD
million)
EBITDA
Margin
(%)
PAT
Margin
(%)
R&D (%
of
revenue)
RoE (%)
2019 95 33 371% -66 -67 -202% -204%
NA
-103%
2018 36 7 41% -37 -37 -531% -532% -92%
2017 45 5 1% -15 -15 -299% -301% -47%
Note: *: Based on website disclosures, Financials is converted from local currency to USD considering exchange rate on 31st March 2021
Source: Company reports, Company websites, CRISIL Research

182
Players in POS Business
Company
Name
Country and
Year of
Inception
Company Overview
Square
Inc. USA, 2009
• Square Inc is a merchant services aggregator and a mobile payment company.
• The Company develops point-of-sale software that helps in digital receipts, inventory,
and sales reports, as well as offers analytics and feedback. Square also provides
financial and marketing services.
• Business products and services - POS Hardware, POS software, financial services
• Individual products and services - Mobile payment services
Operational Data
Customer base: 36 million monthly transacting active customers on its mobile payment
application CashApp (December 2020)
For business segment, Payment Value - $103.7 billion (FY20); Payment volume - $2 billion
(FY20)
Financials
for the
year
(ending
December)
Net worth
(USD million)
Revenue
(USD
million)
Revenue
growth
(%)
EBITDA
(USD
million)
PAT
(USD
million)
EBITDA
Margin
(%)
PAT
Margin
(%)
R&D (%
of
revenue)
RoE (%)
2020 2,681 9,497 102% -14.9 213 0% 2% 9% 10%
2019 1,715 4,713 43% 31 375 1% 8% 14% 26%
2018 1,120 3,298 49% -32 -38 -1% -1% 15% -4%
Company
Name
Country and
Year of
Inception
Company Overview
Verifone
Holdings
Inc.
USA,1981
• VeriFone is a player in the merchant point of sale (POS) payment systems market,
with over half of its annual sales from providing POS payment terminals that enable
merchants to accept payment cards.
• Its product portfolio also comprises of contactless and countertop systems as well as
electronic cash register and payment devices, PIN pads, indoor and outdoor
unattended payment solutions, wireless handheld payment devices, and point-of-sale
receipt printers.
Operational Data*
Transaction Volume: 10.3 billion (annualized)
Financials NA
Note: *: Based on website disclosures as on March 20, 2021,Financials is converted from local currency to USD considering exchange rate on 31st March 2021
Source: Company reports, Company websites, CRISIL Research
Players in Banking as a Service (BaaS) business
Company
Name
Country
and Year of
Inception
Company Overview
Bankable
Limited UK, 2010
• Bankable provides a range of payment solutions under a “Banking as a Service”
model wherein the solutions are available in the form of white-label self-service
platforms as well as via APIs
• The company’s services include Virtual Ledger Manager (VLM), a cloud based virtual
account solution that offers cash management for global corporates; Digital Banking,
a platform that offers digital banking; Payment Card Programmes, a prepaid card
programme management service; and E-wallet.
• It serves to industries, such as travel, telco, bank, insurance, and FinTech.

183
Treezor France,
2016
• Treezor, SAS operates a banking platform that facilitates payment management for
merchants, collaborative platforms, and banks. The company offers a B2B and multi-
channel solution covering the entire payment chain.
• The company's products include acquisition online, card program, payment SEPA,
marketplace and crowdfunding, KYC and compliance, e-wallet and core-banking, bin-
sponsorship, white label jacket, and local currency.
• The company has issued more than 850,000 Mastercard payment cards as of 2019
Note: *: Based on website disclosures,, Financials is converted from local currency to USD considering exchange rate on 31st March 2021
Source: Company reports, Company websites, CRISIL Research

184
About CRISIL
CRISIL is a leading, agile and innovative global analytics company driven by its mission of making markets function better. It is India’s foremost provider of ratings, data, research, analytics and solutions, with a strong track record of growth, culture of innovation and global footprint. It has delivered independent opinions, actionable insights, and efficient solutions to over 100,000 customers. It is majority owned by S&P Global Inc, a leading provider of transparent and independent ratings, benchmarks, analytics and data to the capital and commodity markets worldwide.
About Research CRISIL Research is India's largest independent integrated research house. We provide insights, opinion and analysis on the Indian economy, industry, capital markets and companies. We also conduct training programs to financial sector professionals on a wide array of technical issues. We are India's most credible provider of economy and industry research. Our industry research covers 86 sectors and is known for its rich insights and perspectives. Our analysis is supported by inputs from our network of more than 5,000 primary sources, including industry experts, industry associations and trade channels. We play a key role in India's fixed income markets. We are the largest provider of valuation of fixed income securities to the mutual fund, insurance and banking industries in the country. We are also the sole provider of debt and hybrid indices to India's mutual fund and life insurance industries. We pioneered independent equity research in India, and are today the country's largest independent equity research house. Our defining trait is the ability to convert information and data into expert judgements and forecasts with complete objectivity. We leverage our deep understanding of the macro-economy and our extensive sector coverage to provide unique insights on micro-macro and cross-sectoral linkages. Our talent pool comprises economists, sector experts, company analysts and information management specialists.
CRISIL Privacy CRISIL respects your privacy. We may use your contact information, such as your name, address, and email id to fulfil your request and service your account and to provide you with additional information from CRISIL. For further information on CRISIL's privacy policy please visit www.crisil.com.
Disclaimer
CRISIL Research, a division of CRISIL Limited (CRISIL) has taken due care and caution in preparing this Report based on the information
obtained by CRISIL from sources which it considers reliable (Data). However, CRISIL does not guarantee the accuracy, adequacy or
completeness of the Data / Report and is not responsible for any errors or omissions or for the results obtained from the use of Data /
Report. This Report is not a recommendation to invest / disinvest in any company / entity covered in the Report and no part of this report
should be construed as an investment advice. CRISIL especially states that it has no financial liability whatsoever to the subscribers/
users/ transmitters/ distributors of this Report. CRISIL Research operates independently of, and does not have access to information
obtained by CRISIL’s Ratings Division / CRISIL Risk and Infrastructure Solutions Limited (CRIS), which may, in their regular operations,
obtain information of a confidential nature. The views expressed in this Report are that of CRISIL Research and not of CRISIL’s Ratings
Division / CRIS. No part of this Report may be published / reproduced in any form without CRISIL’s prior written approval.