Community Engagement: Leadership Tool for Catastrophic Health Events
Upload
independentCategory
view
1download
0
HEALTH ECONOMICSHealth Econ. 16: 1159–1184 (2007)Published online 21 February 2007 in Wiley InterScience (www.interscience.wiley.com). DOI: 10.1002/hec.1209
CATASTROPHIC PAYMENTS FOR HEALTH CARE IN ASIA
EDDY VAN DOORSLAERa,n, OWEN O’DONNELLb, RAVINDRA P. RANNAN-ELIYAc, APARNAA
SOMANATHANc, SHIVA RAJ ADHIKARId, CHARU C. GARGe, DENI HARBIANTOf, ALEJANDRO N.
HERRINg, MOHAMMED NAZMUL HUQh, SHAMSIA IBRAGIMOVAi, ANUP KARANj, TAE-JIN LEEk,
GABRIEL M. LEUNGl, JUI-FEN RACHEL LUm, CHIU WAN NGn, BADRI RAJ PANDEd, RACHEL
RACELISg, SIHAI TAOo, KEITH TINl, KANJANA TISAYATICOMp, LAKSONO TRISNANTOROf,
CHITPRANEE VASAVIDp and YUXIN ZHAOq
aErasmus University, The NetherlandsbUniversity of Macedonia, Greece
c Institute for Health Policy, Sri LankadNepal Health Economics Association, Nepal
eWorld Health Organisation, SwitzerlandfGadjah Mada University, Indonesia
gUniversity of the Philippines, PhilippineshJahangirnagar University, Bangladesh
iNational Statistical Committee, Kyrgyz Republicj Institute for Human Development, India
kHallym University, South KorealUniversity of Hong Kong, Hong Kong SAR
mChang Gung University, TaiwannUniversity of Malaysia, Malaysia
oNorth China Coal Medical College, Chinap International Health Policy Program, ThailandqNational Health Economics Institute, China
SUMMARY
Out-of-pocket (OOP) payments are the principal means of financing health care throughout much of Asia. Weestimate the magnitude and distribution of OOP payments for health care in fourteen countries and territoriesaccounting for 81% of the Asian population. We focus on payments that are catastrophic, in the sense of severelydisrupting household living standards, and approximate such payments by those absorbing a large fraction ofhousehold resources. Bangladesh, China, India, Nepal and Vietnam rely most heavily on OOP financing and havethe highest incidence of catastrophic payments. Sri Lanka, Thailand and Malaysia stand out as low to middleincome countries that have constrained both the OOP share of health financing and the catastrophic impact ofdirect payments. In most low/middle-income countries, the better-off are more likely to spend a large fraction oftotal household resources on health care. This may reflect the inability of the poorest of the poor to divert resourcesfrom other basic needs and possibly the protection of the poor from user charges offered in some countries. But inChina, Kyrgyz and Vietnam, where there are no exemptions of the poor from charges, they are as, or even more,likely to incur catastrophic payments. Copyright # 2007 John Wiley & Sons, Ltd.
Received 1 August 2005; Revised 17 November 2006; Accepted 6 December 2006
KEY WORDS: health care financing; catastrophic health payments; Asia
INTRODUCTION
Out-of-pocket payments are the principal means of financing health care throughout much of Asia(O’Donnell et al., 2005). This has consequences for the utilisation of health care and subsequently
nCorrespondence to: Department of Health Policy and Management, Erasmus University, Rotterdam, The Netherlands.E-mail: [email protected]
Copyright # 2007 John Wiley & Sons, Ltd.
health. There are also potentially important consequences for household living standards. Welfare isreduced by the uncertainty of medical expenditures. Households may be able to borrow to coverunexpected medical bills but at the risk of being trapped in long-term debt. As a result, opportunities toescape poverty through investments in human capital may be lost. Where there is a lack of access tocredit, a characteristic of less-developed economies particularly binding for the financing of investmentsin health, medical expenses must be covered from the current household budget and from wealth. Somehouseholds might be able to finance medical expenses from savings, by selling assets or by cutting backon expendable items of consumption. More severely economically constrained households may beforced to cut back on necessities and consequently be pushed into poverty. Illness then presents adifficult choice between diverting a large fraction of household resources to cover the costs of treatmentand forgoing treatment at the expense of health.
The threat that out-of-pocket (OOP) payments pose to household living standards is increasinglyrecognised as a major consideration in the financing of health care (Commission on Macroeconomicsand Health, 2001; OECD and WHO, 2003; World Bank, 2004; World Health Organisation, 2005). Theextent to which such concern is justified depends upon the unpredictability of OOP payments, theirmagnitude relative to household resources and their distribution in relation to that of income. Wedescribe the magnitude and distribution of OOP payments for health care in fourteen countries andterritories that account for 81% of the total population of Asia (49% of the world population). Ourfocus is on expenditures that are catastrophic, in the sense that they severely disrupt household livingstandards. Following others (Berki, 1986; Wyszewianski, 1986; Wagstaff and Van Doorslaer, 2003;Xu et al., 2003; Russell, 2004), we approximate such catastrophic payments by those in excess of asubstantial fraction of the household budget. Spending a large fraction of household resources on healthcare can threaten living standards either in the short term, as current consumption of other goods andservices must be sacrificed, or in the long term, as assets are divested, savings depleted or debtaccumulated. One conception of fairness in health finance is that households should be protectedagainst such catastrophic medical expenses (World Health Organisation, 2000).
Most previous estimates of the impact of OOP payments on living standards in developing countrieshave relied on data from small-scale health surveys that are not nationally representative, often beingrestricted to rural areas (Sauerbron et al., 1995; Ensor and Pham, 1996; Sauerbron et al., 1996;Pannarunothai and Mills, 1997; Wilkes et al., 1998; Fabricant et al., 1999; Ranson, 2002; Segall et al.,2002; Skarbinski et al., 2002; Russell, 2004; van Damme, 2004). We analyse data from nationallyrepresentative household expenditure surveys that record both OOP payments for health care and totalhousehold expenditure in detail and so offer accurate estimates of the magnitude of OOP paymentsrelative to the household budget. We extend the existing evidence on catastrophic payments derivedfrom nationally representative expenditure data (Pradhan and Prescott, 2002; Wagstaff and VanDoorslaer, 2003; Xu et al., 2003) by adding estimates for China and India, and many other Asiancountries.
The structure of the paper is as follows. Next, we provide background information on the financingcontribution and composition of OOP payments and on public health care charging policy in each ofthe fourteen study territories. Then we summarise the magnitude and distribution of OOP paymentsrelative to household budgets. Further, the extent to which OOP payments for health care arecatastrophic is examined. Finally, we summarise and interpret the main findings, and acknowledge somelimitations.
OUT-OF-POCKET FINANCING OF HEALTH CARE IN ASIA
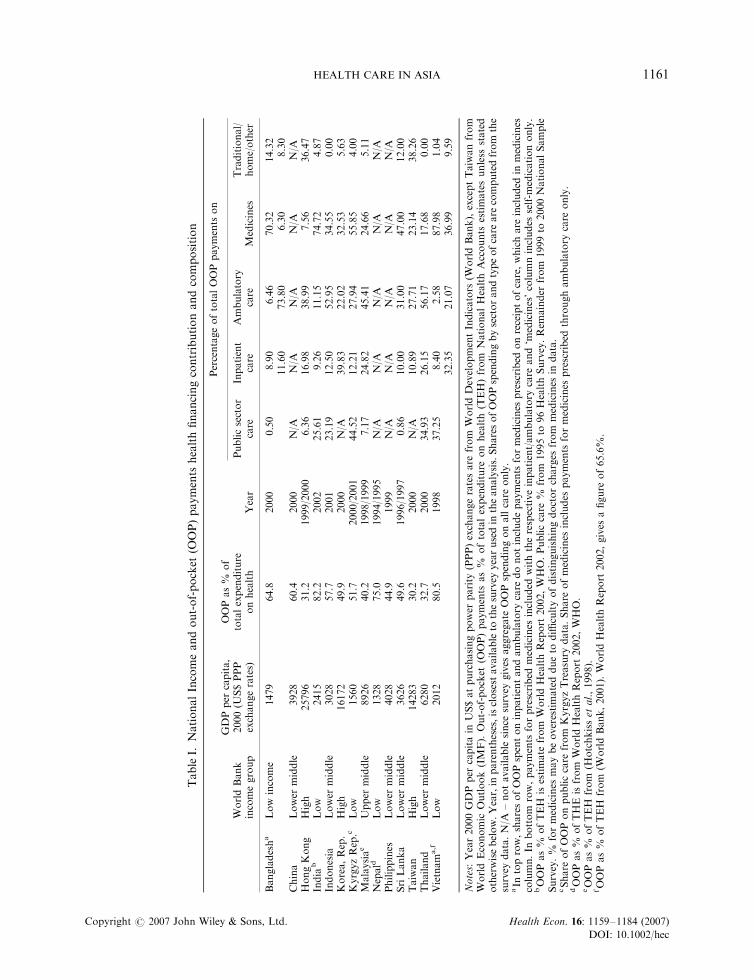
The fourteen territories included in the analysis span the whole range of economic development fromlow to high income (Table I). In each case, OOP payments fund at least 30%, and often much more, of
E. VAN DOORSLAER ET AL.1160
Copyright # 2007 John Wiley & Sons, Ltd. Health Econ. 16: 1159–1184 (2007)
DOI: 10.1002/hec
TableI.
NationalIncomeandout-of-pocket
(OOP)payments
healthfinancingcontributionandcomposition
GDPper
capita,
OOPas%
of
PercentageoftotalOOPpayments
on
WorldBank
incomegroup
2000(U
S$PPP
exchangerates)
totalexpenditure
onhealth
Year
Publicsector
care
Inpatient
care
Ambulatory
care
Medicines
Traditional/
home/other
Bangladesha
Low
income
1479
64.8
2000
0.50
8.90
6.46
70.32
14.32
11.60
73.80
6.30
8.30
China
Lower
middle
3928
60.4
2000
N/A
N/A
N/A
N/A
N/A
HongKong
High
25796
31.2
1999/2000
6.36
16.98
38.99
7.56
36.47
India
bLow
2415
82.2
2002
25.61
9.26
11.15
74.72
4.87
Indonesia
Lower
middle
3028
57.7
2001
23.19
12.50
52.95
34.55
0.00
Korea,Rep.
High
16172
49.9
2000
N/A
39.83
22.02
32.53
5.63
KyrgyzRep.c
Low
1560
51.7
2000/2001
44.52
12.21
27.94
55.85
4.00
Malaysiae
Upper
middle
8926
40.2
1998/1999
7.17
24.82
45.41
24.66
5.11
Nepald
Low
1328
75.0
1994/1995
N/A
N/A
N/A
N/A
N/A
Philippines
Lower
middle
4028
44.9
1999
N/A
N/A
N/A
N/A
N/A
SriLanka
Lower
middle
3626
49.6
1996/1997
0.86
10.00
31.00
47.00
12.00
Taiwan
High
14283
30.2
2000
N/A
10.89
27.71
23.14
38.26
Thailand
Lower
middle
6280
32.7
2000
34.93
26.15
56.17
17.68
0.00
Vietnam
a,f
Low
2012
80.5
1998
37.25
8.40
2.58
87.98
1.04
32.35
21.07
36.99
9.59
Notes:Year2000GDPper
capitain
US$atpurchasingpower
parity
(PPP)exchangeratesare
from
WorldDevelopmentIndicators
(WorldBank),exceptTaiwanfrom
WorldEconomic
Outlook(IMF).
Out-of-pocket
(OOP)payments
as%
oftotalexpenditure
onhealth(TEH)from
NationalHealthAccounts
estimatesunless
stated
otherwisebelow.Year,in
parentheses,isclosestavailableto
thesurvey
yearusedin
theanalysis.SharesofOOPspendingbysectorandtypeofcare
are
computedfrom
the
survey
data.N/A
–notavailable
since
survey
gives
aggregate
OOPspendingonallcare
only.
aIn
toprow,sharesofOOPspentoninpatientandambulatory
care
donotincludepayments
formedicines
prescribed
onreceiptofcare,whichare
included
inmedicines
column.In
bottom
row,payments
forprescribed
medicines
included
withtherespectiveinpatient/ambulatory
care
and‘m
edicines’columnincludes
self-m
edicationonly.
bOOPas%
ofTEH
isestimate
from
WorldHealthReport
2002,WHO.Publiccare
%from
1995to
96HealthSurvey.Rem
ainder
from
1999to
2000NationalSample
Survey.%
formedicines
maybeoverestimateddueto
diffi
cultyofdistinguishingdoctorcharges
from
medicines
indata.
cShare
ofOOPonpubliccare
from
KyrgyzTreasury
data.Share
ofmedicines
includes
payments
formedicines
prescribed
throughambulatory
care
only.
dOOPas%
ofTHE
isfrom
WorldHealthReport
2002,WHO.
eOOPas%
ofTEH
from
(Hotchkisset
al.,1998).
fOOPas%
ofTEH
from
(WorldBank,2001).WorldHealthReport
2002,gives
afigure
of65.6%
.
HEALTH CARE IN ASIA 1161
Copyright # 2007 John Wiley & Sons, Ltd. Health Econ. 16: 1159–1184 (2007)
DOI: 10.1002/hec
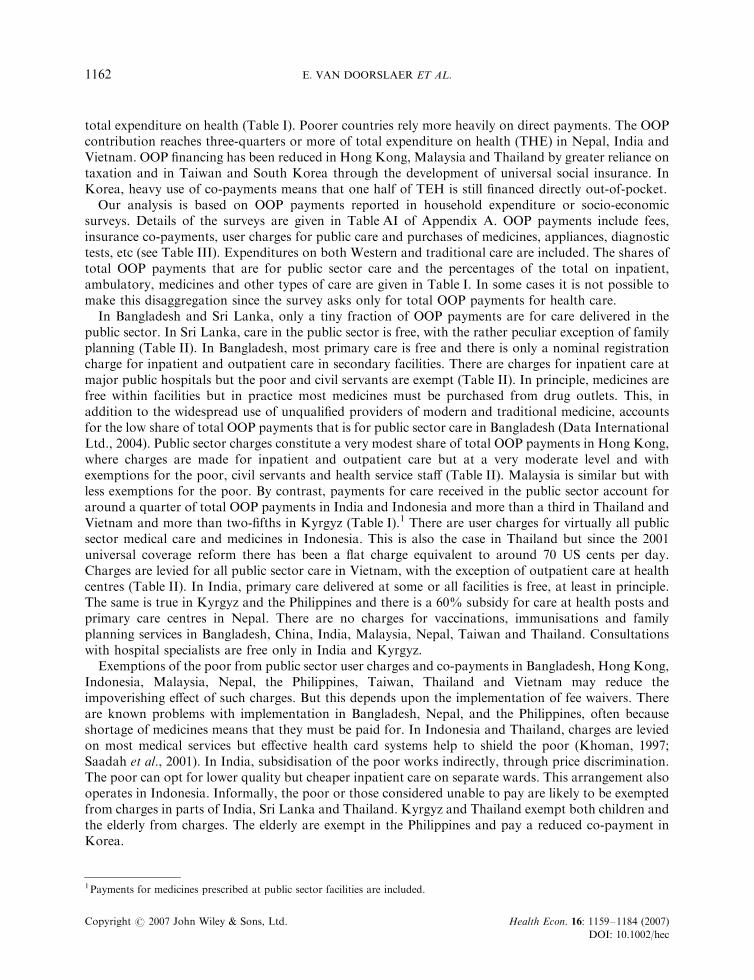
total expenditure on health (Table I). Poorer countries rely more heavily on direct payments. The OOPcontribution reaches three-quarters or more of total expenditure on health (THE) in Nepal, India andVietnam. OOP financing has been reduced in Hong Kong, Malaysia and Thailand by greater reliance ontaxation and in Taiwan and South Korea through the development of universal social insurance. InKorea, heavy use of co-payments means that one half of TEH is still financed directly out-of-pocket.
Our analysis is based on OOP payments reported in household expenditure or socio-economicsurveys. Details of the surveys are given in Table AI of Appendix A. OOP payments include fees,insurance co-payments, user charges for public care and purchases of medicines, appliances, diagnostictests, etc (see Table III). Expenditures on both Western and traditional care are included. The shares oftotal OOP payments that are for public sector care and the percentages of the total on inpatient,ambulatory, medicines and other types of care are given in Table I. In some cases it is not possible tomake this disaggregation since the survey asks only for total OOP payments for health care.
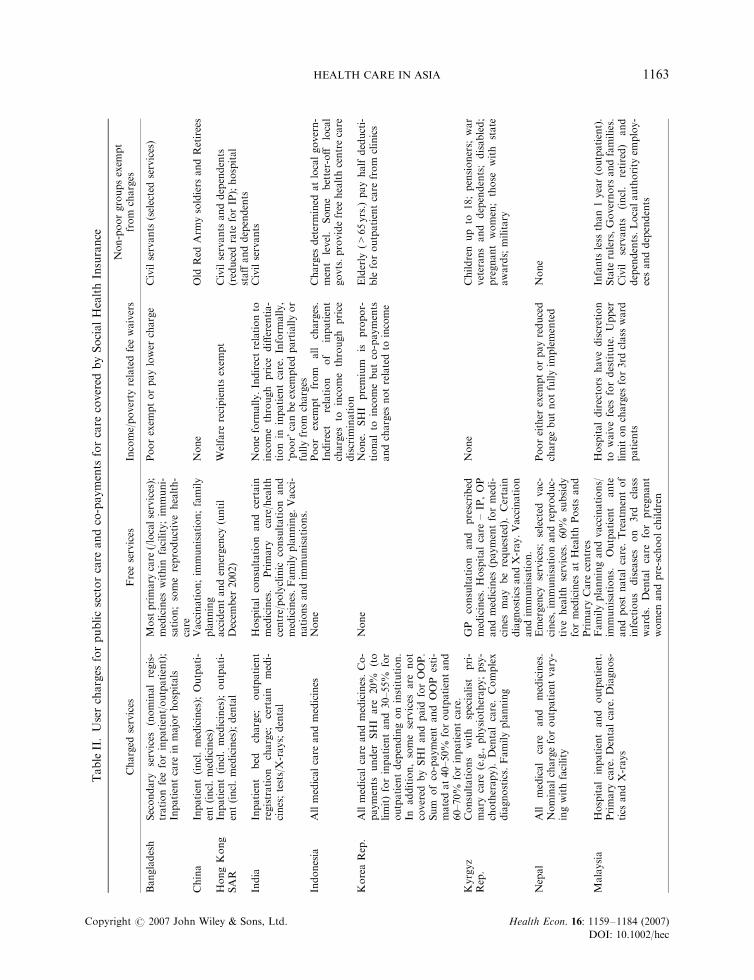
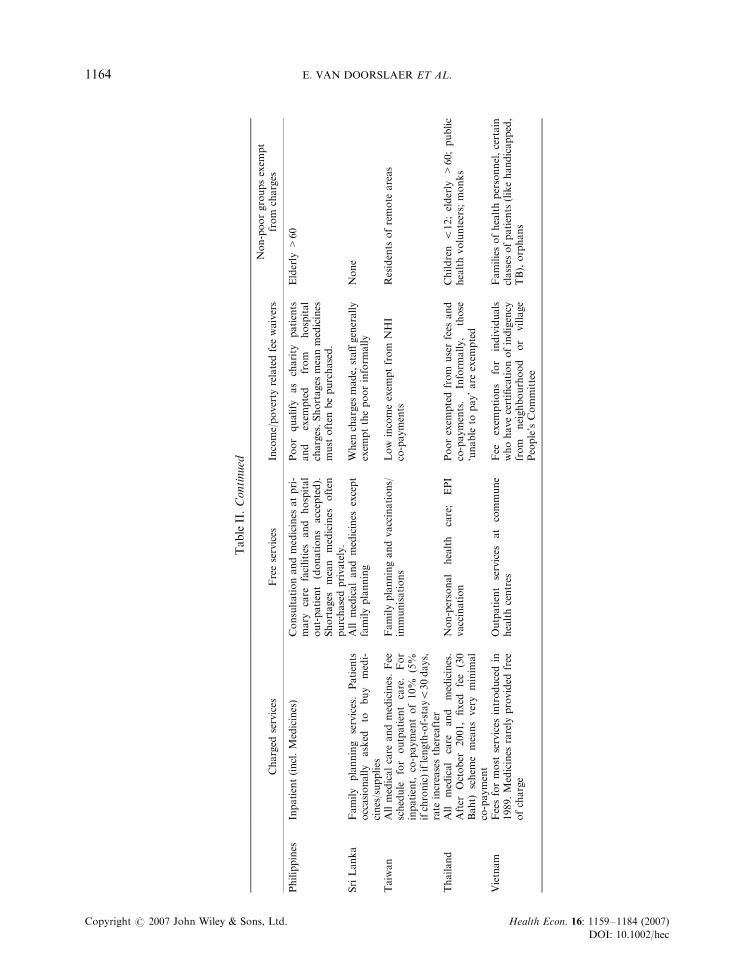
In Bangladesh and Sri Lanka, only a tiny fraction of OOP payments are for care delivered in thepublic sector. In Sri Lanka, care in the public sector is free, with the rather peculiar exception of familyplanning (Table II). In Bangladesh, most primary care is free and there is only a nominal registrationcharge for inpatient and outpatient care in secondary facilities. There are charges for inpatient care atmajor public hospitals but the poor and civil servants are exempt (Table II). In principle, medicines arefree within facilities but in practice most medicines must be purchased from drug outlets. This, inaddition to the widespread use of unqualified providers of modern and traditional medicine, accountsfor the low share of total OOP payments that is for public sector care in Bangladesh (Data InternationalLtd., 2004). Public sector charges constitute a very modest share of total OOP payments in Hong Kong,where charges are made for inpatient and outpatient care but at a very moderate level and withexemptions for the poor, civil servants and health service staff (Table II). Malaysia is similar but withless exemptions for the poor. By contrast, payments for care received in the public sector account foraround a quarter of total OOP payments in India and Indonesia and more than a third in Thailand andVietnam and more than two-fifths in Kyrgyz (Table I).1 There are user charges for virtually all publicsector medical care and medicines in Indonesia. This is also the case in Thailand but since the 2001universal coverage reform there has been a flat charge equivalent to around 70 US cents per day.Charges are levied for all public sector care in Vietnam, with the exception of outpatient care at healthcentres (Table II). In India, primary care delivered at some or all facilities is free, at least in principle.The same is true in Kyrgyz and the Philippines and there is a 60% subsidy for care at health posts andprimary care centres in Nepal. There are no charges for vaccinations, immunisations and familyplanning services in Bangladesh, China, India, Malaysia, Nepal, Taiwan and Thailand. Consultationswith hospital specialists are free only in India and Kyrgyz.
Exemptions of the poor from public sector user charges and co-payments in Bangladesh, Hong Kong,Indonesia, Malaysia, Nepal, the Philippines, Taiwan, Thailand and Vietnam may reduce theimpoverishing effect of such charges. But this depends upon the implementation of fee waivers. Thereare known problems with implementation in Bangladesh, Nepal, and the Philippines, often becauseshortage of medicines means that they must be paid for. In Indonesia and Thailand, charges are leviedon most medical services but effective health card systems help to shield the poor (Khoman, 1997;Saadah et al., 2001). In India, subsidisation of the poor works indirectly, through price discrimination.The poor can opt for lower quality but cheaper inpatient care on separate wards. This arrangement alsooperates in Indonesia. Informally, the poor or those considered unable to pay are likely to be exemptedfrom charges in parts of India, Sri Lanka and Thailand. Kyrgyz and Thailand exempt both children andthe elderly from charges. The elderly are exempt in the Philippines and pay a reduced co-payment inKorea.
1Payments for medicines prescribed at public sector facilities are included.
E. VAN DOORSLAER ET AL.1162
Copyright # 2007 John Wiley & Sons, Ltd. Health Econ. 16: 1159–1184 (2007)
DOI: 10.1002/hec
TableII.Usercharges
forpublicsectorcare
andco-payments
forcare
covered
bySocialHealthInsurance
Charged
services
Freeservices
Income/poverty
relatedfeewaivers
Non-poorgroupsexem
pt
from
charges
Bangladesh
Secondary
services
(nominalregis-
trationfeeforinpatient/outpatient);
Inpatientcare
inmajorhospitals
Mostprimary
care
(/localservices);
medicines
within
facility;im
muni-
sation;somereproductivehealth-
care
Poorexem
ptorpaylower
charge
Civilservants
(selectedservices)
China
Inpatient(incl.medicines);
Outpati-
ent(incl.medicines)
Vaccination;im
munisation;family
planning
None
Old
Red
Arm
ysoldiers
andRetirees
HongKong
SAR
Inpatient(incl.medicines);
outpati-
ent(incl.medicines);dental
accidentandem
ergency
(until
Decem
ber
2002)
Welfare
recipients
exem
pt
Civilservants
anddependents
(reducedrate
forIP);hospital
staffanddependents
India
Inpatient
bed
charge;
outpatient
registration
charge;
certain
medi-
cines;tests/X-rays;dental
Hospitalconsultation
and
certain
medicines.
Primary
care/health
centre/polyclinic
consultation
and
medicines.Familyplanning.Vacci-
nationsandim
munisations.
Noneform
ally.Indirectrelationto
income
through
price
differentia-
tion
ininpatientcare.Inform
ally,
‘poor’canbeexem
ptedpartiallyor
fullyfrom
charges
Civilservants
Indonesia
Allmedicalcare
andmedicines
None
Poor
exem
pt
from
all
charges.
Indirect
relation
of
inpatient
charges
toincome
through
price
discrim
ination
Charges
determined
atlocalgovern-
ment
level.
Some
better-off
local
govts.providefree
healthcentrecare
KoreaRep.
Allmedicalcare
andmedicines.Co-
payments
under
SHIare
20%
(to
limit)forinpatientand30–55%
for
outpatientdependingoninstitution.
Inaddition,someservices
are
not
covered
bySHIandpaid
forOOP.
Sum
ofco-paymentand
OOP
esti-
matedat40–50%
foroutpatientand
60–70%
forinpatientcare.
None
None.
SHI
premium
ispropor-
tionalto
incomebutco-payments
andcharges
notrelatedto
income
Elderly
(>65yrs.)
payhalf
deducti-
ble
foroutpatientcare
from
clinics
Kyrgyz
Rep.
Consultations
with
specialist
pri-
mary
care
(e.g.,physiotherapy;psy-
chotherapy).
Dentalcare.Complex
diagnostics.Familyplanning
GP
consultation
and
prescribed
medicines.Hospitalcare
–IP,OP
andmedicines
(paymentformedi-
cines
may
berequested).
Certain
diagnosticsandX-ray.Vaccination
andim
munisation.
None
Children
up
to18;pensioners;
war
veteransand
dependents;disabled;
pregnantwomen;those
with
state
awards;military
Nepal
All
medical
care
and
medicines.
Nominalchargeforoutpatientvary-
ingwithfacility
Emergency
services;selected
vac-
cines,im
munisationandreproduc-
tivehealth
services.60%
subsidy
formedicines
atHealthPostsand
Primary
Care
centres
Pooreither
exem
ptorpayreduced
chargebutnotfullyim
plemented
None
Malaysia
Hospitalinpatient
and
outpatient.
Primary
care.Dentalcare.Diagnos-
tics
andX-rays
Familyplanningandvaccinations/
immunisations.
Outpatient
ante
andpost
natalcare.Treatm
entof
infectious
diseases
on
3rd
class
wards.
Dentalcare
forpregnant
women
andpre-schoolchildren
Hospitaldirectors
havediscretion
towaivefees
fordestitute.Upper
limitoncharges
for3rd
class
ward
patients
Infants
less
than1year(outpatient).
State
rulers,Governors
andfamilies.
Civil
servants
(incl.
retired)
and
dependents.Localauthority
employ-
eesanddependents
HEALTH CARE IN ASIA 1163
Copyright # 2007 John Wiley & Sons, Ltd. Health Econ. 16: 1159–1184 (2007)
DOI: 10.1002/hec
TableII.Continued
Charged
services
Freeservices
Income/poverty
relatedfeewaivers
Non-poorgroupsexem
pt
from
charges
Philippines
Inpatient(incl.Medicines)
Consultationandmedicines
atpri-
mary
care
facilities
and
hospital
out-patient
(donations
accepted).
Shortages
mean
medicines
often
purchasedprivately.
Poor
qualify
as
charity
patients
and
exem
pted
from
hospital
charges.Shortages
meanmedicines
must
often
bepurchased.
Elderly
>60
SriLanka
Family
planning
services.Patients
occasionally
asked
tobuy
medi-
cines/supplies
All
medicaland
medicines
except
familyplanning
When
charges
made,staffgenerally
exem
ptthepoorinform
ally
None
Taiwan
Allmedicalcare
andmedicines.Fee
schedule
for
outpatient
care.For
inpatient,
co-paymentof10%
(5%
ifchronic)iflength-of-stay530days,
rate
increasesthereafter
Familyplanningandvaccinations/
immunisations
Low
incomeexem
ptfrom
NHI
co-payments
Residents
ofremote
areas
Thailand
All
medical
care
and
medicines.
After
October
2001,fixed
fee
(30
Baht)
schem
emeansvery
minim
al
co-payment
Non-personal
health
care;
EPI
vaccination
Poorexem
ptedfrom
userfees
and
co-payments.
Inform
ally,
those
‘unable
topay’are
exem
pted
Children
512;elderly
>60;public
healthvolunteers;monks
Vietnam
Feesformost
services
introducedin
1989.Medicines
rarely
provided
free
ofcharge
Outpatient
services
at
commune
healthcentres
Fee
exem
ptions
for
individuals
whohavecertificationofindigency
from
neighbourhood
or
village
People’sCommittee
Familiesofhealthpersonnel,certain
classes
ofpatients
(likehandicapped,
TB),orphans
E. VAN DOORSLAER ET AL.1164
Copyright # 2007 John Wiley & Sons, Ltd. Health Econ. 16: 1159–1184 (2007)
DOI: 10.1002/hec
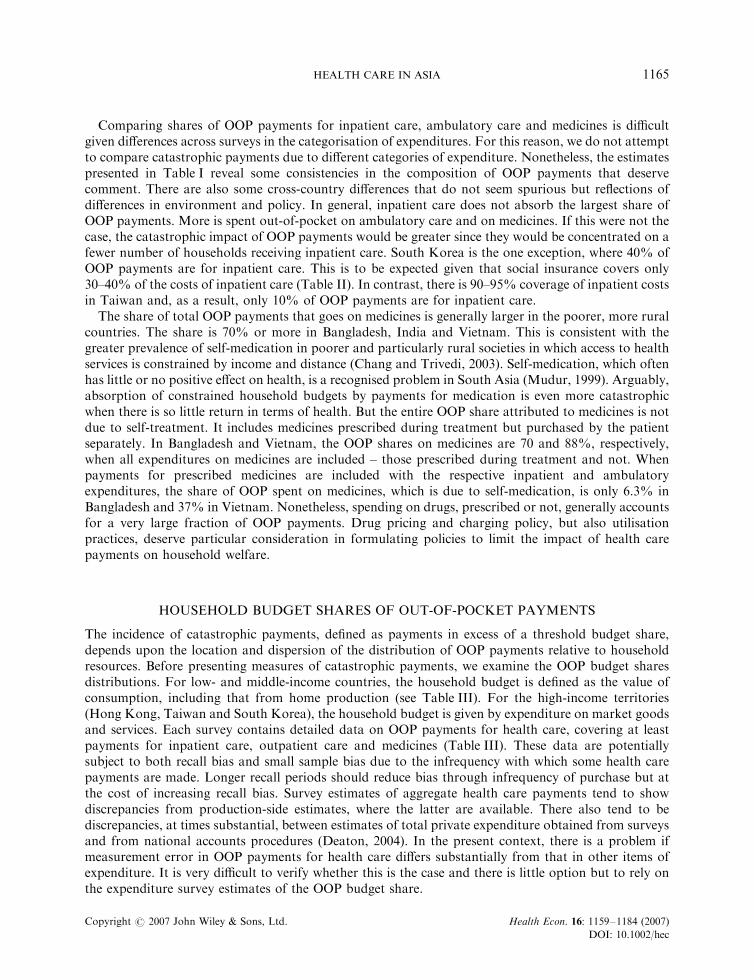
Comparing shares of OOP payments for inpatient care, ambulatory care and medicines is difficultgiven differences across surveys in the categorisation of expenditures. For this reason, we do not attemptto compare catastrophic payments due to different categories of expenditure. Nonetheless, the estimatespresented in Table I reveal some consistencies in the composition of OOP payments that deservecomment. There are also some cross-country differences that do not seem spurious but reflections ofdifferences in environment and policy. In general, inpatient care does not absorb the largest share ofOOP payments. More is spent out-of-pocket on ambulatory care and on medicines. If this were not thecase, the catastrophic impact of OOP payments would be greater since they would be concentrated on afewer number of households receiving inpatient care. South Korea is the one exception, where 40% ofOOP payments are for inpatient care. This is to be expected given that social insurance covers only30–40% of the costs of inpatient care (Table II). In contrast, there is 90–95% coverage of inpatient costsin Taiwan and, as a result, only 10% of OOP payments are for inpatient care.
The share of total OOP payments that goes on medicines is generally larger in the poorer, more ruralcountries. The share is 70% or more in Bangladesh, India and Vietnam. This is consistent with thegreater prevalence of self-medication in poorer and particularly rural societies in which access to healthservices is constrained by income and distance (Chang and Trivedi, 2003). Self-medication, which oftenhas little or no positive effect on health, is a recognised problem in South Asia (Mudur, 1999). Arguably,absorption of constrained household budgets by payments for medication is even more catastrophicwhen there is so little return in terms of health. But the entire OOP share attributed to medicines is notdue to self-treatment. It includes medicines prescribed during treatment but purchased by the patientseparately. In Bangladesh and Vietnam, the OOP shares on medicines are 70 and 88%, respectively,when all expenditures on medicines are included – those prescribed during treatment and not. Whenpayments for prescribed medicines are included with the respective inpatient and ambulatoryexpenditures, the share of OOP spent on medicines, which is due to self-medication, is only 6.3% inBangladesh and 37% in Vietnam. Nonetheless, spending on drugs, prescribed or not, generally accountsfor a very large fraction of OOP payments. Drug pricing and charging policy, but also utilisationpractices, deserve particular consideration in formulating policies to limit the impact of health carepayments on household welfare.
HOUSEHOLD BUDGET SHARES OF OUT-OF-POCKET PAYMENTS
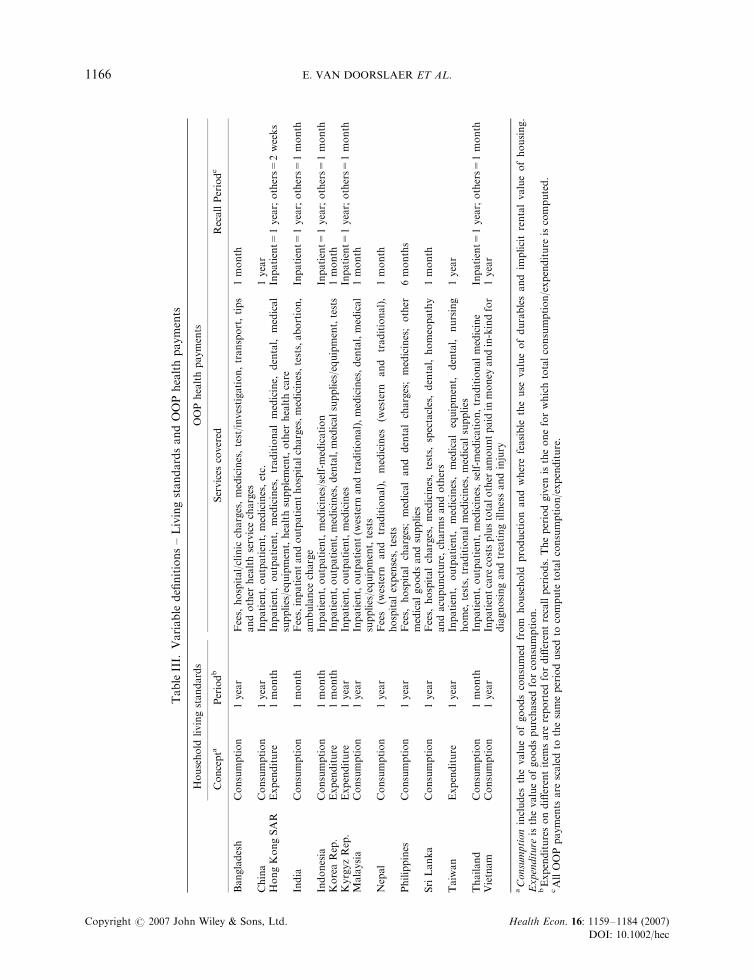
The incidence of catastrophic payments, defined as payments in excess of a threshold budget share,depends upon the location and dispersion of the distribution of OOP payments relative to householdresources. Before presenting measures of catastrophic payments, we examine the OOP budget sharesdistributions. For low- and middle-income countries, the household budget is defined as the value ofconsumption, including that from home production (see Table III). For the high-income territories(Hong Kong, Taiwan and South Korea), the household budget is given by expenditure on market goodsand services. Each survey contains detailed data on OOP payments for health care, covering at leastpayments for inpatient care, outpatient care and medicines (Table III). These data are potentiallysubject to both recall bias and small sample bias due to the infrequency with which some health carepayments are made. Longer recall periods should reduce bias through infrequency of purchase but atthe cost of increasing recall bias. Survey estimates of aggregate health care payments tend to showdiscrepancies from production-side estimates, where the latter are available. There also tend to bediscrepancies, at times substantial, between estimates of total private expenditure obtained from surveysand from national accounts procedures (Deaton, 2004). In the present context, there is a problem ifmeasurement error in OOP payments for health care differs substantially from that in other items ofexpenditure. It is very difficult to verify whether this is the case and there is little option but to rely onthe expenditure survey estimates of the OOP budget share.
HEALTH CARE IN ASIA 1165
Copyright # 2007 John Wiley & Sons, Ltd. Health Econ. 16: 1159–1184 (2007)
DOI: 10.1002/hec
TableIII.
Variable
definitions–LivingstandardsandOOPhealthpayments
Household
livingstandards
OOPhealthpayments
Concepta
Periodb
Services
covered
RecallPeriodc
Bangladesh
Consumption
1year
Fees,
hospital/clinic
charges,medicines,test/investigation,transport,tips
andother
healthservicecharges
1month
China
Consumption
1year
Inpatient,outpatient,medicines,etc.
1year
HongKongSAR
Expenditure
1month
Inpatient,
outpatient,
medicines,traditionalmedicine,
dental,
medical
supplies/equipment,healthsupplement,other
healthcare
Inpatient=
1year;others=
2weeks
India
Consumption
1month
Fees,inpatientandoutpatienthospitalcharges,medicines,tests,abortion,
ambulance
charge
Inpatient=
1year;others=
1month
Indonesia
Consumption
1month
Inpatient,outpatient,medicines/self-medication
Inpatient=
1year;others=
1month
KoreaRep.
Expenditure
1month
Inpatient,outpatient,medicines,dental,medicalsupplies/equipment,tests
1month
KyrgyzRep.
Expenditure
1year
Inpatient,outpatient,medicines
Inpatient=
1year;others=
1month
Malaysia
Consumption
1year
Inpatient,outpatient(w
estern
andtraditional),medicines,dental,medical
supplies/equipment,tests
1month
Nepal
Consumption
1year
Fees
(western
and
traditional),medicines
(western
and
traditional),
hospitalexpenses,tests
1month
Philippines
Consumption
1year
Fees,
hospitalcharges;medicaland
dentalcharges;medicines;other
medicalgoodsandsupplies
6months
SriLanka
Consumption
1year
Fees,
hospitalcharges,medicines,tests,
spectacles,dental,homeopathy
andacupuncture,charm
sandothers
1month
Taiwan
Expenditure
1year
Inpatient,
outpatient,
medicines,medicalequipment,
dental,
nursing
home,
tests,traditionalmedicines,medicalsupplies
1year
Thailand
Consumption
1month
Inpatient,outpatient,medicines,self-m
edication,traditionalmedicine
Inpatient=
1year;others=
1month
Vietnam
Consumption
1year
Inpatientcare
costsplustotalother
amountpaid
inmoney
andin-kindfor
diagnosingandtreatingillnessandinjury
1year
aConsumptionincludes
thevalueofgoodsconsumed
from
household
productionandwherefeasible
theuse
valueofdurablesandim
plicitrentalvalueofhousing.
Expenditure
isthevalueofgoodspurchasedforconsumption.
bExpendituresondifferentitem
sare
reported
fordifferentrecallperiods.Theperiodgiven
istheoneforwhichtotalconsumption/expenditure
iscomputed.
cAllOOPpayments
are
scaledto
thesameperiodusedto
compute
totalconsumption/expenditure.
E. VAN DOORSLAER ET AL.1166
Copyright # 2007 John Wiley & Sons, Ltd. Health Econ. 16: 1159–1184 (2007)
DOI: 10.1002/hec
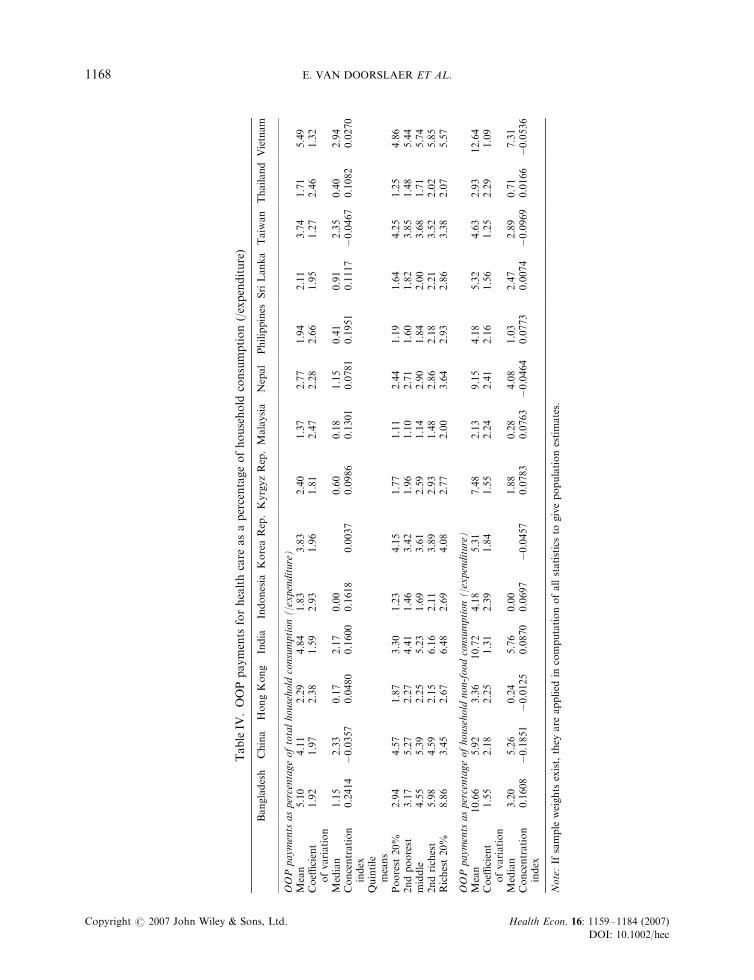
There is substantial variation across territories in the mean OOP budget share (Table IV). Averagedacross all households, OOP payments for health care absorb 4–5.5% of total household consumption inChina, India, Bangladesh and Vietnam. All four of these countries rely on OOP payments for at least60% of health financing. With the exception of (urban) China, they are among the poorest countriesexamined here. Associated with poverty, population health deficiencies drive up expenditures on healthcare and medicines. The mean OOP budget share is much lower – 1.4–2.7% – in Malaysia, Thailand,Indonesia, the Philippines, Sri Lanka, Hong Kong, Kyrgyz and Nepal. With the exceptions ofIndonesia, Kyrgyz and Nepal, these countries are less poor than the first group and rely less heavily onOOP financing. The low mean OOP budget shares in Indonesia and Nepal, despite their heavy relianceon OOP financing, indicate low aggregate levels of spending on health care. This reflects the severity ofpoverty and the prioritisation of subsistence needs. In the two high-income territories operating a socialinsurance model with co-payments – Korea and Taiwan – the mean OOP budget share is in the middleof the range, around 3.8%. The lower average budget share in Hong Kong (2.3%) is understandablegiven its higher levels of income and population health and, in comparison with Korea, its lowerreliance on OOP financing.
Within each territory, there is a great deal of variation in the OOP budget share across households,suggesting that OOP payments are highly unpredictable. With the exceptions of India, Kyrgyz, Taiwanand Vietnam, the standard deviation of the share is at least 1.9 times the mean. This coefficient ofvariation is greatest in the four countries with the smallest mean shares – Malaysia, Thailand, Indonesiaand the Philippines. The distributions are all highly right-skewed with the mean twice the median ormore in all cases but for Taiwan, China and Vietnam. Using the median as measure of central tendency,Taiwan is among the territories with the highest OOP budget shares. This, together with the relativelylimited variance and skewness in Taiwan, is explained by high rates of utilisation (O’Donnell et al.,2005), extensive co-payments for most services but high insurance coverage of inpatient care. It is lessclear why the distribution is relatively dense in Vietnam. A possible explanation is that the extensivepractice of self-medication gives rise to consistently high OOP payments (Chang and Trivedi 2003).
With the exceptions of China and Taiwan, concentration indices of OOP budget shares are positive,indicating that the better-off spend a larger fraction of their resources on health care. This can also beobserved in the quintile specific means of the OOP budget share. The gradient is steepest in Bangladesh,the Philippines, Indonesia and India. In Bangladesh, the richest fifth of households, on average, spendalmost 9% of the household budget on health care, while the poorest fifth spend less than 3%.Bangladesh, India and Indonesia are among the poorest countries included in the study. The mostplausible explanation of the steep income gradients in these countries is that the better-off can respondto health problems with the purchase of medical care and medicines, while the poorest of the poorcannot afford to divert resources from other pressing demands on very constrained budgets. However,one should not overlook the fact that the poorest households in Bangladesh – a very poor country –spend a larger fraction of their available resources on health care than the richest households in high-income Hong Kong. This is explained by the tremendous differences in population health and insurancecoverage. China and Vietnam are similar to Bangladesh and India in having a high mean OOP budgetshare but differ in that the distribution does not display a steep income gradient. In China, the richactually spend relatively less out-of-pocket on health care. A consequence, one might suppose, of thelack of any fee exemptions for the poor, the collapse of collective payment schemes in rural areas andthe greater health insurance cover enjoyed by the better-off, urban population (Henderson et al., 1995;Bloom and Gu, 1997; Carrin et al., 1997; Akin et al., 2004). Fee waivers exist in Vietnam but, at the timeof the survey, were restricted to the indigent identified by village committees (Table II). Hong Kongappears to shield the poor better from charges than the social insurance systems of Korea and Taiwan.
Our finding that the OOP budget share is most often increasing with the household budget isinconsistent with the common assertion that the poor spend proportionately more out-of-pocket onhealth care in low-income countries (Whitehead et al., 2001). The evidence cited to support this
HEALTH CARE IN ASIA 1167
Copyright # 2007 John Wiley & Sons, Ltd. Health Econ. 16: 1159–1184 (2007)
DOI: 10.1002/hec
TableIV
.OOPpayments
forhealthcare
asapercentageofhousehold
consumption(/expenditure)
Bangladesh
China
HongKong
India
Indonesia
KoreaRep.KyrgyzRep.Malaysia
Nepal
Philippines
SriLanka
Taiwan
Thailand
Vietnam
OOPpayments
aspercentageoftotalhousehold
consumption(/expenditure)
Mean
5.10
4.11
2.29
4.84
1.83
3.83
2.40
1.37
2.77
1.94
2.11
3.74
1.71
5.49
Coeffi
cient
ofvariation
1.92
1.97
2.38
1.59
2.93
1.96
1.81
2.47
2.28
2.66
1.95
1.27
2.46
1.32
Median
1.15
2.33
0.17
2.17
0.00
0.60
0.18
1.15
0.41
0.91
2.35
0.40
2.94
Concentration
index
0.2414�0.0357
0.0480
0.1600
0.1618
0.0037
0.0986
0.1301
0.0781
0.1951
0.1117�0.0467
0.1082
0.0270
Quintile
means
Poorest
20%
2.94
4.57
1.87
3.30
1.23
4.15
1.77
1.11
2.44
1.19
1.64
4.25
1.25
4.86
2ndpoorest
3.17
5.27
2.27
4.41
1.46
3.42
1.96
1.10
2.71
1.60
1.82
3.85
1.48
5.44
middle
4.55
5.39
2.25
5.23
1.69
3.61
2.59
1.14
2.90
1.84
2.00
3.68
1.71
5.74
2ndrichest
5.98
4.59
2.15
6.16
2.11
3.89
2.93
1.48
2.86
2.18
2.21
3.52
2.02
5.85
Richest20%
8.86
3.45
2.67
6.48
2.69
4.08
2.77
2.00
3.64
2.93
2.86
3.38
2.07
5.57
OOPpayments
aspercentageofhousehold
non-foodconsumption(/expenditure)
Mean
10.66
5.92
3.36
10.72
4.18
5.31
7.48
2.13
9.15
4.18
5.32
4.63
2.93
12.64
Coeffi
cient
ofvariation
1.55
2.18
2.25
1.31
2.39
1.84
1.55
2.24
2.41
2.16
1.56
1.25
2.29
1.09
Median
3.20
5.26
0.24
5.76
0.00
1.88
0.28
4.08
1.03
2.47
2.89
0.71
7.31
Concentration
index
0.1608�0.1851�0.0125
0.0870
0.0697
�0.0457
0.0783
0.0763�0.0464
0.0773
0.0074�0.0969
0.0166�0.0536
Note:If
sample
weights
exist,they
are
applied
incomputationofallstatisticsto
givepopulationestimates.
E. VAN DOORSLAER ET AL.1168
Copyright # 2007 John Wiley & Sons, Ltd. Health Econ. 16: 1159–1184 (2007)
DOI: 10.1002/hec
assertion is not from nationally representative expenditure surveys but from health surveys conducted inone, usually rural, region (Ensor and Pham, 1996; Pannarunothai and Mills, 1997; Fabricant et al.,1999; Segall et al., 2002).2 Such surveys ignore payments made by the better-off urban population anddo not measure total household resources as accurately as expenditure surveys, often relying on income,which, particularly for poor households, is less indicative of living standards in developing countriesthan is consumption. Support for our finding that the OOP budget share typically increases with totalhousehold consumption is provided by a study of India that is based on nationally representativeexpenditure survey data (Peters et al., 2001).
The relationship between the OOP budget share and the size of the budget will be biased in a positivedirection, however, if health care is financed from savings, credit or the sale of assets rather than fromthe sacrifice of current consumption. In that case, the total expenditure of households spending heavilyon health care will be temporarily raised above permanent income. They appear better-off than theyactually are.
Besides the endogeneity of total consumption, the tendency for the OOP budget share to rise with thesize of the household budget may reflect the fact that poor households devote the larger part of availableresources to covering subsistence expenses on food and shelter. The disruptive effect of OOP paymentson the living standards of the poor might be better assessed through their share of household resourcesnet of non-discretionary expenses. Definition of the latter is obviously problematic. Non-foodexpenditures are an approximation (Wagstaff and Van Doorslaer, 2003). The mean share of OOPpayments in household non-food expenditures is presented in the bottom part of Table III. Thedifferences between the OOP shares of total and of non-food expenditures are greater in the poorercountries, reflecting the greater share of resources devoted to food. The OOP share remains highest inBangladesh, India and Vietnam, with 10.6–12.6% of non-food expenditures spent on health care. InKyrgyz and Nepal, both of which are very poor, the ratio of OOP payments to total expenditure isrelatively moderate but the OOP share of non-food expenditure is very high. The relative position ofChina moves in the opposite direction, reflecting its higher level of income. The switch in denominatorresults in a consistent fall in the value of concentration indices. This is to be expected given that the itemremoved from the denominator – food – is a necessity. Six of the indices are now negative, indicatingthat the OOP share of non-food expenditure falls as the level of non-food expenditure rises. Thisrelationship is particularly strong in China.
CATASTROPHIC PAYMENTS
Reliance on OOP financing leaves households exposed to the risk of incurring high medical expensesshould a household member fall ill. If the health care expenses were large relative to householdresources, the disruption to material living standards could be substantial and may be consideredcatastrophic. Ideally, longitudinal data would be used to estimate the extent to which living standardsare seriously disrupted by the purchase of medical care in response to illness shocks. This would allowone to identify how spending on non-medical goods and services changes following some health shock(Gertler and Gruber, 2002). But appropriate panel data are not available for all countries included inthis study. An approximation to the disruptive effect of health expenditures on material living standardsmust be made. We follow a number of authors in defining medical spending as ‘catastrophic’ if itexceeds some fraction of total household resources (Berki, 1986; Wyszewianski, 1986; Wagstaff and VanDoorslaer, 2003; Xu et al., 2003; Russell, 2004). The idea is that spending a large fraction of thehousehold budget on health care must be at the expense of consumption of other goods and services.This opportunity cost may be incurred in the short term, if health care is financed by cutting back on
2See also unpublished reports cited by (Fabricant et al., 1999), that are also usually specific to one rural region.
HEALTH CARE IN ASIA 1169
Copyright # 2007 John Wiley & Sons, Ltd. Health Econ. 16: 1159–1184 (2007)
DOI: 10.1002/hec
current consumption, or in the long-term, if it is financed through savings, the sale of assets or credit.3
The welfare loss from the sacrifice of current consumption will be greater. But long-term consequencescould also be severe. For example, if depleted savings or assets are not sufficient to meet subsequenteconomic shocks, or if the household sinks into a spiral of debt. The health payments budget sharealone does not tell us what financing strategy has been adopted and therefore does not allow distinctionbetween short and long term effects.
Approximating the catastrophic economic consequences of illness through high health paymentsbudget shares has a number of limitations. First, it identifies only the households that incurcatastrophic medical expenditures and ignores those that cannot meet these expenses and so forgotreatment. Through the subsequent deterioration of health, such households probably suffer a greaterloss of welfare than those incurring catastrophic payments. Recognising this, Pradhan and Prescott(2002) attempt to estimate exposure to, rather than incurrence of, catastrophic payments. Second,there is no distinction between types of medical care purchased. A wealthy household with thecapacity to spend a large fraction of its budget on cosmetic surgery would not usually be considered tohave experienced a catastrophe, but it would be considered catastrophic for a poor household to spendthe same fraction on essential medicines for a sick child. However, in low-income settings in particular,little medical care consumption would be considered frivolous. Below, we present estimates ofcatastrophic payments that differentially weight large health budget shares incurred by the rich and thepoor. Third, the choice of the threshold budget share above which health payments are consideredcatastrophic is obviously subjective. A common choice has been 10% of total expenditure (Pradhan andPrescott, 2002; Ranson, 2002; Wagstaff and Van Doorslaer, 2003); with the rationale that thisrepresents an approximate threshold at which the household is forced to sacrifice other basic needs, sellproductive assets, incur debt, or be impoverished (Russell, 2004). Here we consider a range of thresholdsdefined with respect to both total consumption and non-food consumption. As argued above, use ofthe latter might be more appropriate to assess the disruptive effect of OOP payments on the livingstandards of the poor.4 Notwithstanding these limitations, most households that spend a substantialfraction of their budget on health care can be expected to experience a disruption to their material livingstandards. Such spending may therefore be used as a proxy to part of the catastrophic economicconsequences of illness.
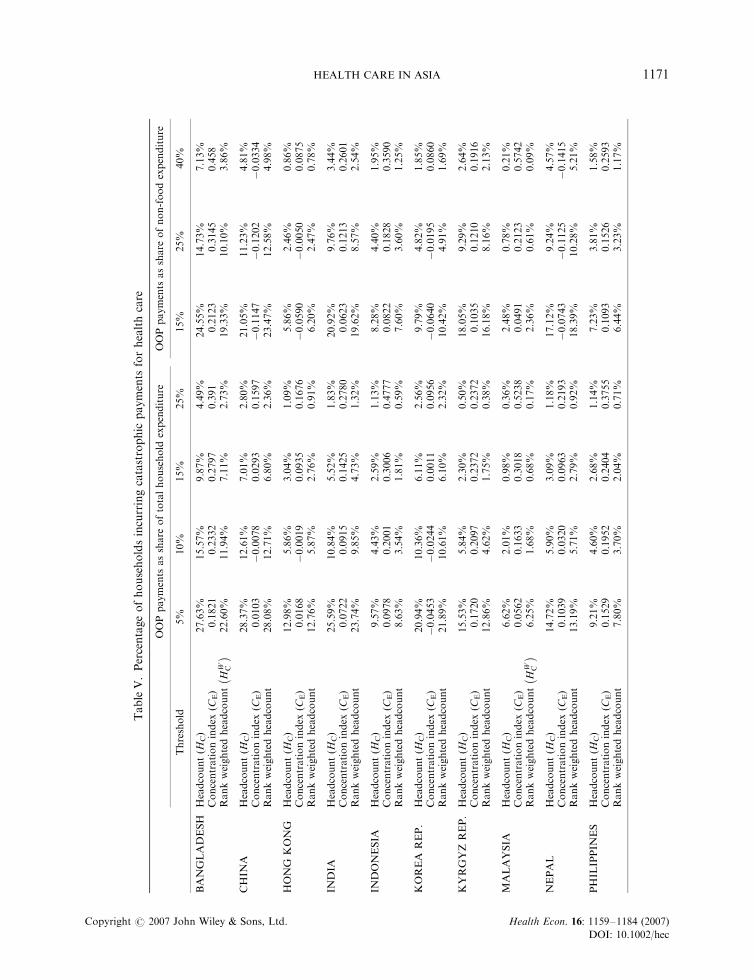
In Table V, we present the catastrophic payment headcount (HC) – the percentage of householdsincurring catastrophic payments (Wagstaff and Van Doorslaer, 2003). Let Ti be OOP paymentsof household i, xi be household consumption (total or non-food), z be the threshold budget shareand Ei be an indicator equal to 1 if Ti/xi>z and zero otherwise. Then, Hc ¼
Pni�1 Ei=n
� �� 100; where
n is the sample size. The headcount necessarily falls as the threshold is raised. For example, 28%of Bangladeshi households spend in excess of 5% of the total household budget on health careand a substantial 4.5% spend in excess of a quarter of the budget on health care.5 Changingthe threshold does not affect substantially the countries that have the highest/lowest incidenceof catastrophic payments (Figure 1). Catastrophic payments are most prevalent in Bangladesh,
3For evidence on strategies households adopt to finance medical expenditures see (Ensor and Pham, 1996; Sauerbron et al., 1996;Wilkes et al., 1998; Peters et al., 2001; Skarbinski et al., 2002; van Damme, 2004; Bonu et al., 2005).
4Researchers at the World Health Organisation (Xu et al., 2003) set the threshold at 40% of capacity to pay, defined as non-subsistence effective income. This is household expenditure net of the estimated cost of subsistence food needs. Subsistencespending on food is defined as the average food expenditure of households in the 45th-50th percentile of the food budget sharedistribution. Since the food budget share is declining with the total budget, this will roughly correspond to the food expenditureof those with median welfare (taking food share a money metric indicator of utility). Actual food expenditure is used for thosespending less than this value. We prefer to avoid the problem of estimating subsistence food needs and keep the analysis moretransparent by referring to OOP as a share of total and of non-food expenditure.
5We have computed standard errors for all point estimates but do not give them in the tables. With large samples, the simpleparameters of interest are estimated with a high degree of precision. Presentation of standard errors would clutter the tables tolittle advantage.
E. VAN DOORSLAER ET AL.1170
Copyright # 2007 John Wiley & Sons, Ltd. Health Econ. 16: 1159–1184 (2007)
DOI: 10.1002/hec
TableV.Percentageofhouseholdsincurringcatastrophic
payments
forhealthcare
OOPpayments
asshare
oftotalhousehold
expenditure
OOPpayments
asshare
ofnon-foodexpenditure
Threshold
5%
10%
15%
25%
15%
25%
40%
BANGLADESH
Headcount(H
C)
27.63%
15.57%
9.87%
4.49%
24.55%
14.73%
7.13%
Concentrationindex
(CE)
0.1821
0.2332
0.2797
0.391
0.2123
0.3145
0.458
Rankweightedheadcount
HW C
��
22.60%
11.94%
7.11%
2.73%
19.33%
10.10%
3.86%
CHIN
AHeadcount(H
C)
28.37%
12.61%
7.01%
2.80%
21.05%
11.23%
4.81%
Concentrationindex
(CE)
0.0103
�0.0078
0.0293
0.1597
�0.1147
�0.1202
�0.0334
Rankweightedheadcount
28.08%
12.71%
6.80%
2.36%
23.47%
12.58%
4.98%
HONG
KONG
Headcount(H
C)
12.98%
5.86%
3.04%
1.09%
5.86%
2.46%
0.86%
Concentrationindex
(CE)
0.0168
�0.0019
0.0935
0.1676
�0.0590
�0.0050
0.0875
Rankweightedheadcount
12.76%
5.87%
2.76%
0.91%
6.20%
2.47%
0.78%
INDIA
Headcount(H
C)
25.59%
10.84%
5.52%
1.83%
20.92%
9.76%
3.44%
Concentrationindex
(CE)
0.0722
0.0915
0.1425
0.2780
0.0623
0.1213
0.2601
Rankweightedheadcount
23.74%
9.85%
4.73%
1.32%
19.62%
8.57%
2.54%
INDONESIA
Headcount(H
C)
9.57%
4.43%
2.59%
1.13%
8.28%
4.40%
1.95%
Concentrationindex
(CE)
0.0978
0.2001
0.3006
0.4777
0.0822
0.1828
0.3590
Rankweightedheadcount
8.63%
3.54%
1.81%
0.59%
7.60%
3.60%
1.25%
KOREA
REP.
Headcount(H
C)
20.94%
10.36%
6.11%
2.56%
9.79%
4.82%
1.85%
Concentrationindex
(CE)
�0.0453
�0.0244
0.0011
0.0956
�0.0640
�0.0195
0.0860
Rankweightedheadcount
21.89%
10.61%
6.10%
2.32%
10.42%
4.91%
1.69%
KYRGYZREP.
Headcount(H
C)
15.53%
5.84%
2.30%
0.50%
18.05%
9.29%
2.64%
Concentrationindex
(CE)
0.1720
0.2097
0.2372
0.2372
0.1035
0.1210
0.1916
Rankweightedheadcount
12.86%
4.62%
1.75%
0.38%
16.18%
8.16%
2.13%
MALAYSIA
Headcount(H
C)
6.62%
2.01%
0.98%
0.36%
2.48%
0.78%
0.21%
Concentrationindex
(CE)
0.0562
0.1633
0.3018
0.5238
0.0491
0.2123
0.5742
Rankweightedheadcount
HW C
��
6.25%
1.68%
0.68%
0.17%
2.36%
0.61%
0.09%
NEPAL
Headcount(H
C)
14.72%
5.90%
3.09%
1.18%
17.12%
9.24%
4.57%
Concentrationindex
(CE)
0.1039
0.0320
0.0963
0.2193
�0.0743
�0.1125
�0.1415
Rankweightedheadcount
13.19%
5.71%
2.79%
0.92%
18.39%
10.28%
5.21%
PHIL
IPPIN
ES
Headcount(H
C)
9.21%
4.60%
2.68%
1.14%
7.23%
3.81%
1.58%
Concentrationindex
(CE)
0.1529
0.1952
0.2404
0.3755
0.1093
0.1526
0.2593
Rankweightedheadcount
7.80%
3.70%
2.04%
0.71%
6.44%
3.23%
1.17%
HEALTH CARE IN ASIA 1171
Copyright # 2007 John Wiley & Sons, Ltd. Health Econ. 16: 1159–1184 (2007)
DOI: 10.1002/hec
TableV.Continued
OOPpayments
asshare
oftotalhousehold
expenditure
OOPpayments
asshare
ofnon-foodexpenditure
Threshold
5%
10%
15%
25%
15%
25%
40%
SRILANKA
Headcount(H
C)
10.97%
2.98%
1.54%
0.47%
9.32%
3.40%
1.31%
Concentrationindex
(CE)
0.1240
0.2368
0.3217
0.4845
�0.0549
�0.0207
�0.1036
Rankweightedheadcount
9.61%
2.27%
1.05%
0.24%
9.83%
3.47%
1.44%
TAIW
AN
Headcount(H
C)
19.14%
6.35%
2.79%
0.87%
4.47%
1.49%
0.41%
Concentrationindex
(CE)
�0.0124
�0.0245
�0.0534
�0.0872
�0.0347
�0.0738
�0.02328
Rankweightedheadcount
19.38%
6.50%
2.94%
0.95%
4.63%
1.60%
0.42%
THAIL
AND
Headcount(H
C)
8.43%
3.52%
1.92%
0.80%
4.54%
1.83%
0.71%
Concentrationindex
(CE)
0.1230
0.2043
0.2693
0.3916
0.0566
0.1793
0.2002
Rankweightedheadcount
7.39%
2.80%
1.41%
0.49%
4.28%
1.50%
0.57%
VIE
TNAM
Headcount(H
C)
33.77%
15.11%
8.47%
2.89%
29.37%
15.10%
5.97%
Concentrationindex
(CE)
�0.0315
0.0270
0.0971
0.2955
�0.1299
�0.1020
�0.0116
Rankweightedheadcount
34.84%
14.70%
7.65%
2.03%
33.19%
16.64%
6.04%
E. VAN DOORSLAER ET AL.1172
Copyright # 2007 John Wiley & Sons, Ltd. Health Econ. 16: 1159–1184 (2007)
DOI: 10.1002/hec
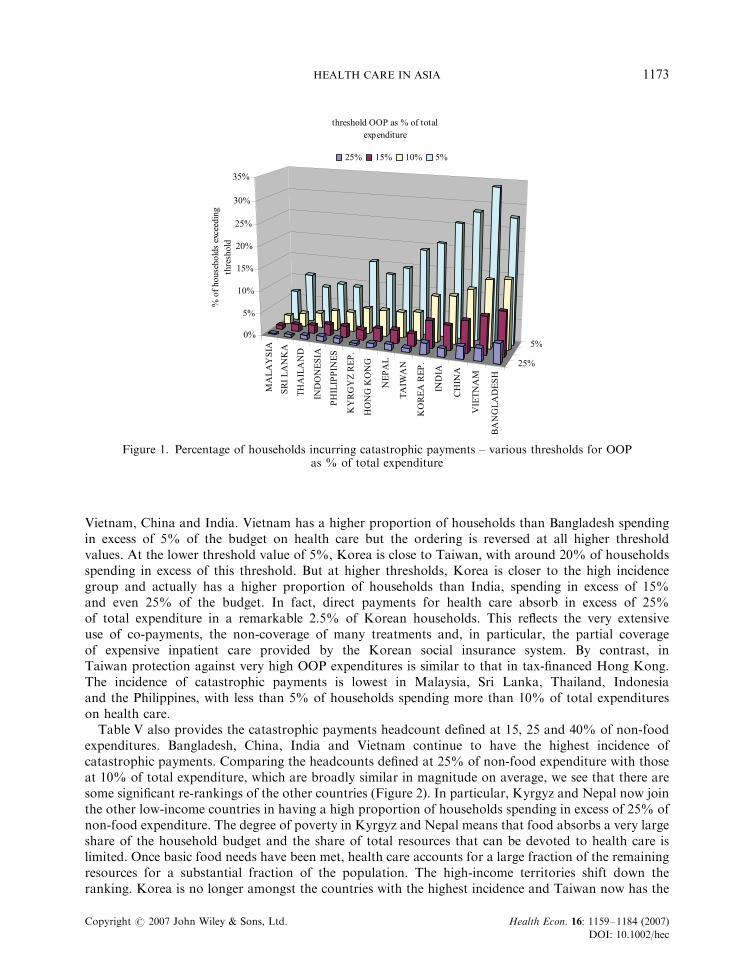
Vietnam, China and India. Vietnam has a higher proportion of households than Bangladesh spendingin excess of 5% of the budget on health care but the ordering is reversed at all higher thresholdvalues. At the lower threshold value of 5%, Korea is close to Taiwan, with around 20% of householdsspending in excess of this threshold. But at higher thresholds, Korea is closer to the high incidencegroup and actually has a higher proportion of households than India, spending in excess of 15%and even 25% of the budget. In fact, direct payments for health care absorb in excess of 25%of total expenditure in a remarkable 2.5% of Korean households. This reflects the very extensiveuse of co-payments, the non-coverage of many treatments and, in particular, the partial coverageof expensive inpatient care provided by the Korean social insurance system. By contrast, inTaiwan protection against very high OOP expenditures is similar to that in tax-financed Hong Kong.The incidence of catastrophic payments is lowest in Malaysia, Sri Lanka, Thailand, Indonesiaand the Philippines, with less than 5% of households spending more than 10% of total expenditureson health care.
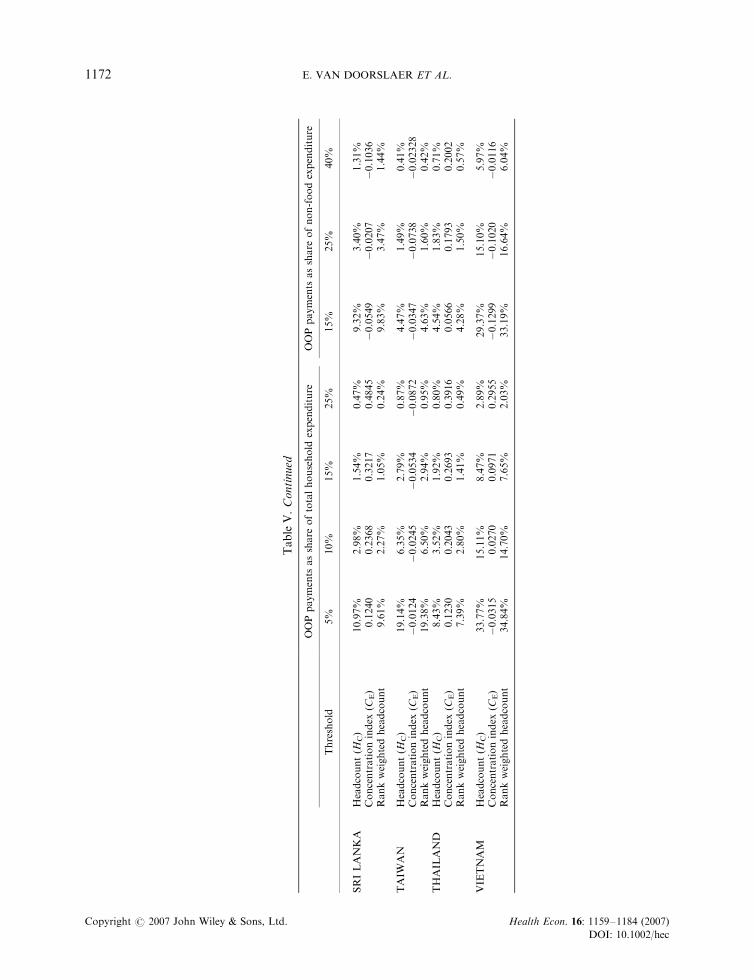
Table V also provides the catastrophic payments headcount defined at 15, 25 and 40% of non-foodexpenditures. Bangladesh, China, India and Vietnam continue to have the highest incidence ofcatastrophic payments. Comparing the headcounts defined at 25% of non-food expenditure with thoseat 10% of total expenditure, which are broadly similar in magnitude on average, we see that there aresome significant re-rankings of the other countries (Figure 2). In particular, Kyrgyz and Nepal now jointhe other low-income countries in having a high proportion of households spending in excess of 25% ofnon-food expenditure. The degree of poverty in Kyrgyz and Nepal means that food absorbs a very largeshare of the household budget and the share of total resources that can be devoted to health care islimited. Once basic food needs have been met, health care accounts for a large fraction of the remainingresources for a substantial fraction of the population. The high-income territories shift down theranking. Korea is no longer amongst the countries with the highest incidence and Taiwan now has the
Figure 1. Percentage of households incurring catastrophic payments – various thresholds for OOPas % of total expenditure
HEALTH CARE IN ASIA 1173
Copyright # 2007 John Wiley & Sons, Ltd. Health Econ. 16: 1159–1184 (2007)
DOI: 10.1002/hec
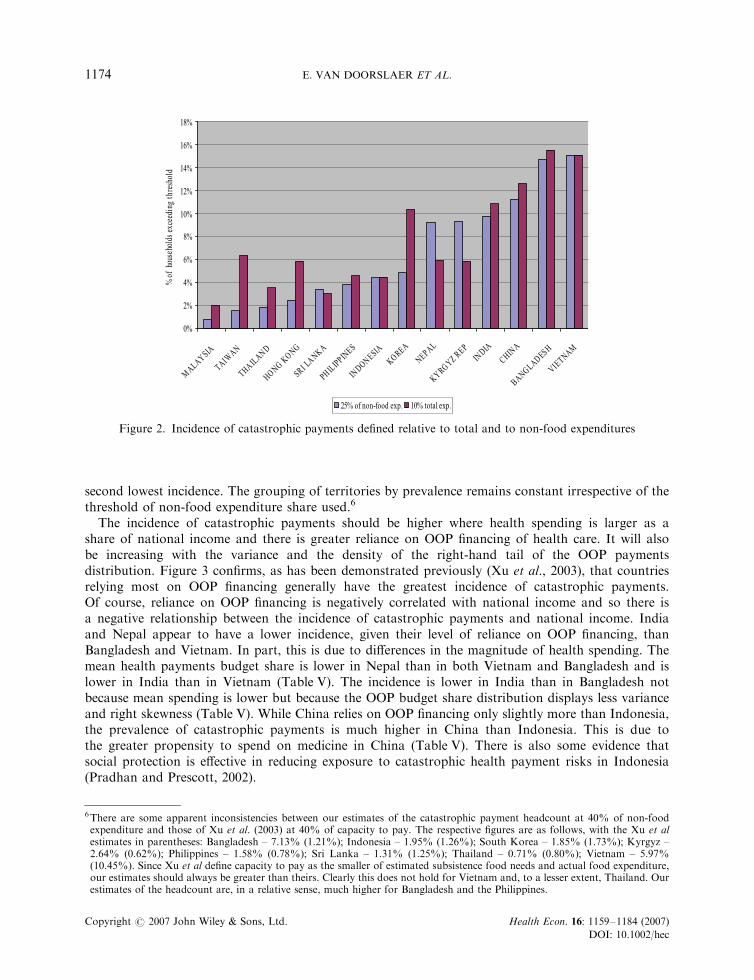
second lowest incidence. The grouping of territories by prevalence remains constant irrespective of thethreshold of non-food expenditure share used.6
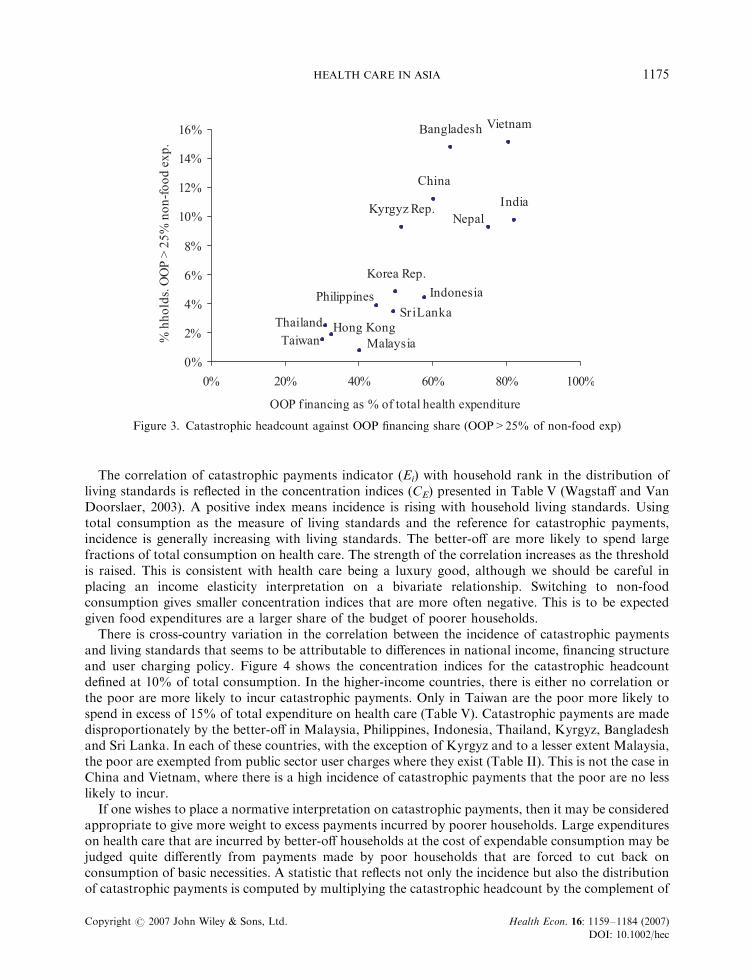
The incidence of catastrophic payments should be higher where health spending is larger as ashare of national income and there is greater reliance on OOP financing of health care. It will alsobe increasing with the variance and the density of the right-hand tail of the OOP paymentsdistribution. Figure 3 confirms, as has been demonstrated previously (Xu et al., 2003), that countriesrelying most on OOP financing generally have the greatest incidence of catastrophic payments.Of course, reliance on OOP financing is negatively correlated with national income and so there isa negative relationship between the incidence of catastrophic payments and national income. Indiaand Nepal appear to have a lower incidence, given their level of reliance on OOP financing, thanBangladesh and Vietnam. In part, this is due to differences in the magnitude of health spending. Themean health payments budget share is lower in Nepal than in both Vietnam and Bangladesh and islower in India than in Vietnam (Table V). The incidence is lower in India than in Bangladesh notbecause mean spending is lower but because the OOP budget share distribution displays less varianceand right skewness (Table V). While China relies on OOP financing only slightly more than Indonesia,the prevalence of catastrophic payments is much higher in China than Indonesia. This is due tothe greater propensity to spend on medicine in China (Table V). There is also some evidence thatsocial protection is effective in reducing exposure to catastrophic health payment risks in Indonesia(Pradhan and Prescott, 2002).
Figure 2. Incidence of catastrophic payments defined relative to total and to non-food expenditures
6There are some apparent inconsistencies between our estimates of the catastrophic payment headcount at 40% of non-foodexpenditure and those of Xu et al. (2003) at 40% of capacity to pay. The respective figures are as follows, with the Xu et alestimates in parentheses: Bangladesh – 7.13% (1.21%); Indonesia – 1.95% (1.26%); South Korea – 1.85% (1.73%); Kyrgyz –2.64% (0.62%); Philippines – 1.58% (0.78%); Sri Lanka – 1.31% (1.25%); Thailand – 0.71% (0.80%); Vietnam – 5.97%(10.45%). Since Xu et al define capacity to pay as the smaller of estimated subsistence food needs and actual food expenditure,our estimates should always be greater than theirs. Clearly this does not hold for Vietnam and, to a lesser extent, Thailand. Ourestimates of the headcount are, in a relative sense, much higher for Bangladesh and the Philippines.
E. VAN DOORSLAER ET AL.1174
Copyright # 2007 John Wiley & Sons, Ltd. Health Econ. 16: 1159–1184 (2007)
DOI: 10.1002/hec
The correlation of catastrophic payments indicator (Ei) with household rank in the distribution ofliving standards is reflected in the concentration indices (CE) presented in Table V (Wagstaff and VanDoorslaer, 2003). A positive index means incidence is rising with household living standards. Usingtotal consumption as the measure of living standards and the reference for catastrophic payments,incidence is generally increasing with living standards. The better-off are more likely to spend largefractions of total consumption on health care. The strength of the correlation increases as the thresholdis raised. This is consistent with health care being a luxury good, although we should be careful inplacing an income elasticity interpretation on a bivariate relationship. Switching to non-foodconsumption gives smaller concentration indices that are more often negative. This is to be expectedgiven food expenditures are a larger share of the budget of poorer households.
There is cross-country variation in the correlation between the incidence of catastrophic paymentsand living standards that seems to be attributable to differences in national income, financing structureand user charging policy. Figure 4 shows the concentration indices for the catastrophic headcountdefined at 10% of total consumption. In the higher-income countries, there is either no correlation orthe poor are more likely to incur catastrophic payments. Only in Taiwan are the poor more likely tospend in excess of 15% of total expenditure on health care (Table V). Catastrophic payments are madedisproportionately by the better-off in Malaysia, Philippines, Indonesia, Thailand, Kyrgyz, Bangladeshand Sri Lanka. In each of these countries, with the exception of Kyrgyz and to a lesser extent Malaysia,the poor are exempted from public sector user charges where they exist (Table II). This is not the case inChina and Vietnam, where there is a high incidence of catastrophic payments that the poor are no lesslikely to incur.
If one wishes to place a normative interpretation on catastrophic payments, then it may be consideredappropriate to give more weight to excess payments incurred by poorer households. Large expenditureson health care that are incurred by better-off households at the cost of expendable consumption may bejudged quite differently from payments made by poor households that are forced to cut back onconsumption of basic necessities. A statistic that reflects not only the incidence but also the distributionof catastrophic payments is computed by multiplying the catastrophic headcount by the complement of
Figure 3. Catastrophic headcount against OOP financing share (OOP>25% of non-food exp)
HEALTH CARE IN ASIA 1175
Copyright # 2007 John Wiley & Sons, Ltd. Health Econ. 16: 1159–1184 (2007)
DOI: 10.1002/hec
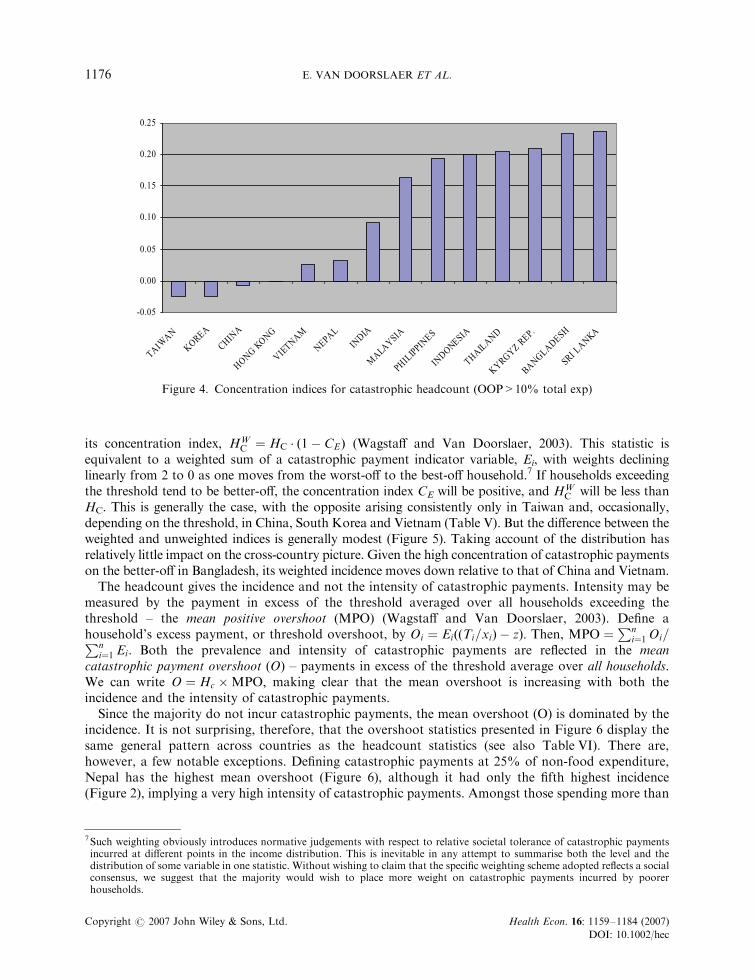
its concentration index, HWC ¼ HC � 1� CEð Þ (Wagstaff and Van Doorslaer, 2003). This statistic is
equivalent to a weighted sum of a catastrophic payment indicator variable, Ei, with weights declininglinearly from 2 to 0 as one moves from the worst-off to the best-off household.7 If households exceedingthe threshold tend to be better-off, the concentration index CE will be positive, and HW
C will be less thanHC. This is generally the case, with the opposite arising consistently only in Taiwan and, occasionally,depending on the threshold, in China, South Korea and Vietnam (Table V). But the difference between theweighted and unweighted indices is generally modest (Figure 5). Taking account of the distribution hasrelatively little impact on the cross-country picture. Given the high concentration of catastrophic paymentson the better-off in Bangladesh, its weighted incidence moves down relative to that of China and Vietnam.
The headcount gives the incidence and not the intensity of catastrophic payments. Intensity may bemeasured by the payment in excess of the threshold averaged over all households exceeding thethreshold – the mean positive overshoot (MPO) (Wagstaff and Van Doorslaer, 2003). Define ahousehold’s excess payment, or threshold overshoot, by Oi ¼ EiððTi=xiÞ � zÞ: Then, MPO ¼
Pni¼1 Oi=Pn
i¼1 Ei: Both the prevalence and intensity of catastrophic payments are reflected in the meancatastrophic payment overshoot (O) – payments in excess of the threshold average over all households.We can write O ¼ Hc �MPO; making clear that the mean overshoot is increasing with both theincidence and the intensity of catastrophic payments.
Since the majority do not incur catastrophic payments, the mean overshoot (O) is dominated by theincidence. It is not surprising, therefore, that the overshoot statistics presented in Figure 6 display thesame general pattern across countries as the headcount statistics (see also Table VI). There are,however, a few notable exceptions. Defining catastrophic payments at 25% of non-food expenditure,Nepal has the highest mean overshoot (Figure 6), although it had only the fifth highest incidence(Figure 2), implying a very high intensity of catastrophic payments. Amongst those spending more than
Figure 4. Concentration indices for catastrophic headcount (OOP>10% total exp)
7Such weighting obviously introduces normative judgements with respect to relative societal tolerance of catastrophic paymentsincurred at different points in the income distribution. This is inevitable in any attempt to summarise both the level and thedistribution of some variable in one statistic. Without wishing to claim that the specific weighting scheme adopted reflects a socialconsensus, we suggest that the majority would wish to place more weight on catastrophic payments incurred by poorerhouseholds.
E. VAN DOORSLAER ET AL.1176
Copyright # 2007 John Wiley & Sons, Ltd. Health Econ. 16: 1159–1184 (2007)
DOI: 10.1002/hec
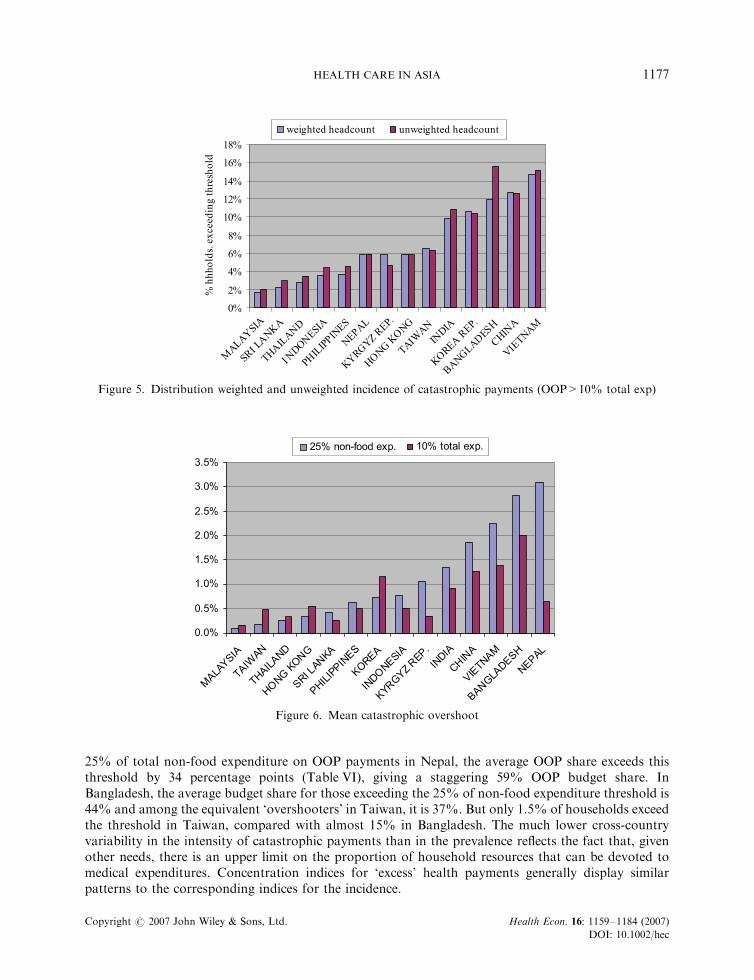
25% of total non-food expenditure on OOP payments in Nepal, the average OOP share exceeds thisthreshold by 34 percentage points (Table VI), giving a staggering 59% OOP budget share. InBangladesh, the average budget share for those exceeding the 25% of non-food expenditure threshold is44% and among the equivalent ‘overshooters’ in Taiwan, it is 37%. But only 1.5% of households exceedthe threshold in Taiwan, compared with almost 15% in Bangladesh. The much lower cross-countryvariability in the intensity of catastrophic payments than in the prevalence reflects the fact that, givenother needs, there is an upper limit on the proportion of household resources that can be devoted tomedical expenditures. Concentration indices for ‘excess’ health payments generally display similarpatterns to the corresponding indices for the incidence.
Figure 5. Distribution weighted and unweighted incidence of catastrophic payments (OOP>10% total exp)
Figure 6. Mean catastrophic overshoot
HEALTH CARE IN ASIA 1177
Copyright # 2007 John Wiley & Sons, Ltd. Health Econ. 16: 1159–1184 (2007)
DOI: 10.1002/hec
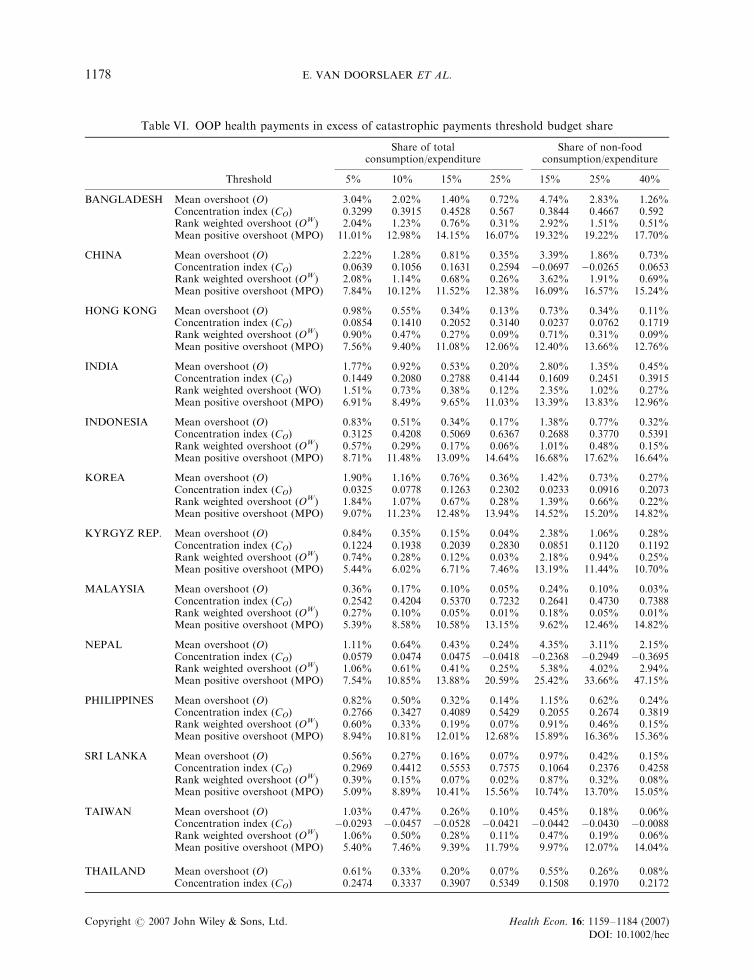
Table VI. OOP health payments in excess of catastrophic payments threshold budget share
Share of totalconsumption/expenditure
Share of non-foodconsumption/expenditure
Threshold 5% 10% 15% 25% 15% 25% 40%
BANGLADESH Mean overshoot (O) 3.04% 2.02% 1.40% 0.72% 4.74% 2.83% 1.26%Concentration index (CO) 0.3299 0.3915 0.4528 0.567 0.3844 0.4667 0.592Rank weighted overshoot (OW) 2.04% 1.23% 0.76% 0.31% 2.92% 1.51% 0.51%Mean positive overshoot (MPO) 11.01% 12.98% 14.15% 16.07% 19.32% 19.22% 17.70%
CHINA Mean overshoot (O) 2.22% 1.28% 0.81% 0.35% 3.39% 1.86% 0.73%Concentration index (CO) 0.0639 0.1056 0.1631 0.2594 �0.0697 �0.0265 0.0653Rank weighted overshoot (OW) 2.08% 1.14% 0.68% 0.26% 3.62% 1.91% 0.69%Mean positive overshoot (MPO) 7.84% 10.12% 11.52% 12.38% 16.09% 16.57% 15.24%
HONG KONG Mean overshoot (O) 0.98% 0.55% 0.34% 0.13% 0.73% 0.34% 0.11%Concentration index (CO) 0.0854 0.1410 0.2052 0.3140 0.0237 0.0762 0.1719Rank weighted overshoot (OW) 0.90% 0.47% 0.27% 0.09% 0.71% 0.31% 0.09%Mean positive overshoot (MPO) 7.56% 9.40% 11.08% 12.06% 12.40% 13.66% 12.76%
INDIA Mean overshoot (O) 1.77% 0.92% 0.53% 0.20% 2.80% 1.35% 0.45%Concentration index (CO) 0.1449 0.2080 0.2788 0.4144 0.1609 0.2451 0.3915Rank weighted overshoot (WO) 1.51% 0.73% 0.38% 0.12% 2.35% 1.02% 0.27%Mean positive overshoot (MPO) 6.91% 8.49% 9.65% 11.03% 13.39% 13.83% 12.96%
INDONESIA Mean overshoot (O) 0.83% 0.51% 0.34% 0.17% 1.38% 0.77% 0.32%Concentration index (CO) 0.3125 0.4208 0.5069 0.6367 0.2688 0.3770 0.5391Rank weighted overshoot (OW) 0.57% 0.29% 0.17% 0.06% 1.01% 0.48% 0.15%Mean positive overshoot (MPO) 8.71% 11.48% 13.09% 14.64% 16.68% 17.62% 16.64%
KOREA Mean overshoot (O) 1.90% 1.16% 0.76% 0.36% 1.42% 0.73% 0.27%Concentration index (CO) 0.0325 0.0778 0.1263 0.2302 0.0233 0.0916 0.2073Rank weighted overshoot (OW) 1.84% 1.07% 0.67% 0.28% 1.39% 0.66% 0.22%Mean positive overshoot (MPO) 9.07% 11.23% 12.48% 13.94% 14.52% 15.20% 14.82%
KYRGYZ REP. Mean overshoot (O) 0.84% 0.35% 0.15% 0.04% 2.38% 1.06% 0.28%Concentration index (CO) 0.1224 0.1938 0.2039 0.2830 0.0851 0.1120 0.1192Rank weighted overshoot (OW) 0.74% 0.28% 0.12% 0.03% 2.18% 0.94% 0.25%Mean positive overshoot (MPO) 5.44% 6.02% 6.71% 7.46% 13.19% 11.44% 10.70%
MALAYSIA Mean overshoot (O) 0.36% 0.17% 0.10% 0.05% 0.24% 0.10% 0.03%Concentration index (CO) 0.2542 0.4204 0.5370 0.7232 0.2641 0.4730 0.7388Rank weighted overshoot (OW) 0.27% 0.10% 0.05% 0.01% 0.18% 0.05% 0.01%Mean positive overshoot (MPO) 5.39% 8.58% 10.58% 13.15% 9.62% 12.46% 14.82%
NEPAL Mean overshoot (O) 1.11% 0.64% 0.43% 0.24% 4.35% 3.11% 2.15%Concentration index (CO) 0.0579 0.0474 0.0475 �0.0418 �0.2368 �0.2949 �0.3695Rank weighted overshoot (OW) 1.06% 0.61% 0.41% 0.25% 5.38% 4.02% 2.94%Mean positive overshoot (MPO) 7.54% 10.85% 13.88% 20.59% 25.42% 33.66% 47.15%
PHILIPPINES Mean overshoot (O) 0.82% 0.50% 0.32% 0.14% 1.15% 0.62% 0.24%Concentration index (CO) 0.2766 0.3427 0.4089 0.5429 0.2055 0.2674 0.3819Rank weighted overshoot (OW) 0.60% 0.33% 0.19% 0.07% 0.91% 0.46% 0.15%Mean positive overshoot (MPO) 8.94% 10.81% 12.01% 12.68% 15.89% 16.36% 15.36%
SRI LANKA Mean overshoot (O) 0.56% 0.27% 0.16% 0.07% 0.97% 0.42% 0.15%Concentration index (CO) 0.2969 0.4412 0.5553 0.7575 0.1064 0.2376 0.4258Rank weighted overshoot (OW) 0.39% 0.15% 0.07% 0.02% 0.87% 0.32% 0.08%Mean positive overshoot (MPO) 5.09% 8.89% 10.41% 15.56% 10.74% 13.70% 15.05%
TAIWAN Mean overshoot (O) 1.03% 0.47% 0.26% 0.10% 0.45% 0.18% 0.06%Concentration index (CO) �0.0293 �0.0457 �0.0528 �0.0421 �0.0442 �0.0430 �0.0088Rank weighted overshoot (OW) 1.06% 0.50% 0.28% 0.11% 0.47% 0.19% 0.06%Mean positive overshoot (MPO) 5.40% 7.46% 9.39% 11.79% 9.97% 12.07% 14.04%
THAILAND Mean overshoot (O) 0.61% 0.33% 0.20% 0.07% 0.55% 0.26% 0.08%Concentration index (CO) 0.2474 0.3337 0.3907 0.5349 0.1508 0.1970 0.2172
E. VAN DOORSLAER ET AL.1178
Copyright # 2007 John Wiley & Sons, Ltd. Health Econ. 16: 1159–1184 (2007)
DOI: 10.1002/hec
CONCLUSION
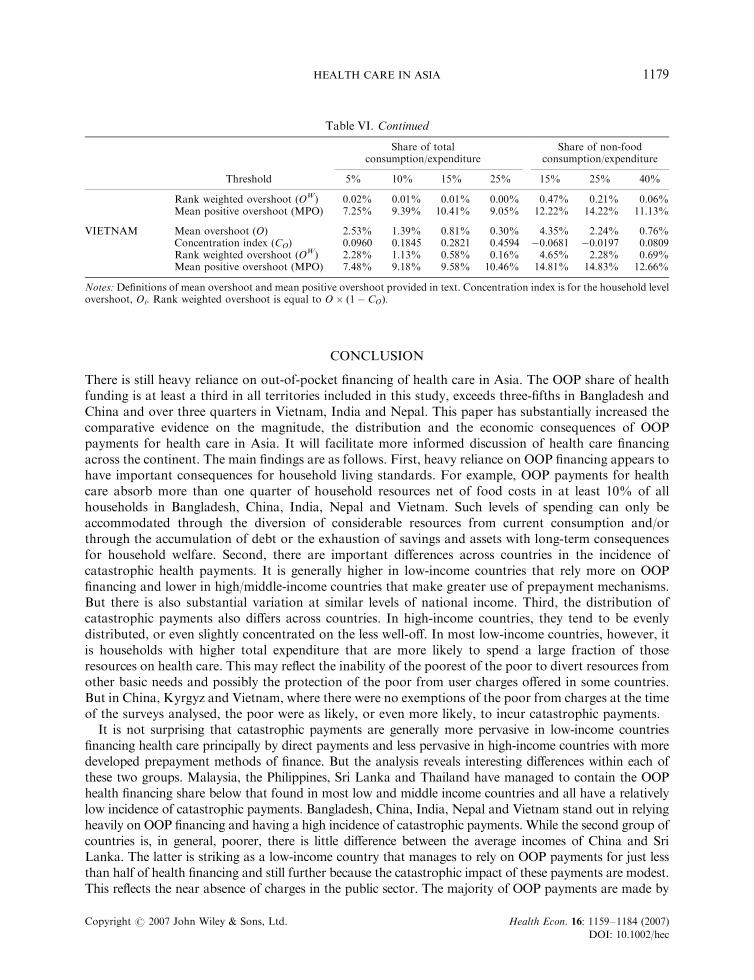
There is still heavy reliance on out-of-pocket financing of health care in Asia. The OOP share of healthfunding is at least a third in all territories included in this study, exceeds three-fifths in Bangladesh andChina and over three quarters in Vietnam, India and Nepal. This paper has substantially increased thecomparative evidence on the magnitude, the distribution and the economic consequences of OOPpayments for health care in Asia. It will facilitate more informed discussion of health care financingacross the continent. The main findings are as follows. First, heavy reliance on OOP financing appears tohave important consequences for household living standards. For example, OOP payments for healthcare absorb more than one quarter of household resources net of food costs in at least 10% of allhouseholds in Bangladesh, China, India, Nepal and Vietnam. Such levels of spending can only beaccommodated through the diversion of considerable resources from current consumption and/orthrough the accumulation of debt or the exhaustion of savings and assets with long-term consequencesfor household welfare. Second, there are important differences across countries in the incidence ofcatastrophic health payments. It is generally higher in low-income countries that rely more on OOPfinancing and lower in high/middle-income countries that make greater use of prepayment mechanisms.But there is also substantial variation at similar levels of national income. Third, the distribution ofcatastrophic payments also differs across countries. In high-income countries, they tend to be evenlydistributed, or even slightly concentrated on the less well-off. In most low-income countries, however, itis households with higher total expenditure that are more likely to spend a large fraction of thoseresources on health care. This may reflect the inability of the poorest of the poor to divert resources fromother basic needs and possibly the protection of the poor from user charges offered in some countries.But in China, Kyrgyz and Vietnam, where there were no exemptions of the poor from charges at the timeof the surveys analysed, the poor were as likely, or even more likely, to incur catastrophic payments.
It is not surprising that catastrophic payments are generally more pervasive in low-income countriesfinancing health care principally by direct payments and less pervasive in high-income countries with moredeveloped prepayment methods of finance. But the analysis reveals interesting differences within each ofthese two groups. Malaysia, the Philippines, Sri Lanka and Thailand have managed to contain the OOPhealth financing share below that found in most low and middle income countries and all have a relativelylow incidence of catastrophic payments. Bangladesh, China, India, Nepal and Vietnam stand out in relyingheavily on OOP financing and having a high incidence of catastrophic payments. While the second group ofcountries is, in general, poorer, there is little difference between the average incomes of China and SriLanka. The latter is striking as a low-income country that manages to rely on OOP payments for just lessthan half of health financing and still further because the catastrophic impact of these payments are modest.This reflects the near absence of charges in the public sector. The majority of OOP payments are made by
Table VI. Continued
Share of totalconsumption/expenditure
Share of non-foodconsumption/expenditure
Threshold 5% 10% 15% 25% 15% 25% 40%
Rank weighted overshoot (OW) 0.02% 0.01% 0.01% 0.00% 0.47% 0.21% 0.06%Mean positive overshoot (MPO) 7.25% 9.39% 10.41% 9.05% 12.22% 14.22% 11.13%
VIETNAM Mean overshoot (O) 2.53% 1.39% 0.81% 0.30% 4.35% 2.24% 0.76%Concentration index (CO) 0.0960 0.1845 0.2821 0.4594 �0.0681 �0.0197 0.0809Rank weighted overshoot (OW) 2.28% 1.13% 0.58% 0.16% 4.65% 2.28% 0.69%Mean positive overshoot (MPO) 7.48% 9.18% 9.58% 10.46% 14.81% 14.83% 12.66%
Notes:Definitions of mean overshoot and mean positive overshoot provided in text. Concentration index is for the household levelovershoot, Oi. Rank weighted overshoot is equal to O� ð1� COÞ:
HEALTH CARE IN ASIA 1179
Copyright # 2007 John Wiley & Sons, Ltd. Health Econ. 16: 1159–1184 (2007)
DOI: 10.1002/hec
the better-off for private alternatives to public care. Indonesia relies on OOP financing only slightly lessthan China but has much smaller catastrophic impact of health payments. In part, this may be due totargeted exemptions in Indonesia, implemented through a health card, that have had some successin shielding poor families from high health payments (Pradhan and Prescott, 2002). The lack of such ascheme in China not only results in a greater prevalence of catastrophic payments but also in a greaterconcentration of OOP payments on low-income households. But the low incidence of catastrophicpayments in Indonesia also reflects the low propensity to spend on health care.8 Thailand has been evenmore successful than Sri Lanka in constraining the living standards consequences of OOP health payments.Its more developed economy with a larger formal sector allows a greater share of health funding to beraised from taxes. In addition, an effective health card system has protected the poor from charges andthe introduction of universal coverage, with a flat rate minimal charge, has further weakened the impactof OOP payments on household budgets. In Malaysia, charges for public sector care have been keptlow and catastrophic payments largely avoided. Among the three high-income territories, the incidenceof catastrophic payments is much higher in Korea than in Hong Kong and Taiwan due to the substantialco-payments within the Korean social insurance system and, particularly, the partial coverage ofinpatient care.
While this study significantly expands the available evidence on the living standards consequences ofOOP payments for health care in Asia, it provides only a partial picture of a multifaceted problem.Besides the occurrence of catastrophic payments, lack of insurance against health care expenses imposesother costs on household welfare that should be examined in complementary analyses. First, householdsmay be impoverished by health payments. We have addressed this issue for the low/middle incomecountries included in the study elsewhere (Van Doorslaer et al., 2006). Second, OOP payments raise theprice barrier to the quantity and quality of care consumed. As noted above, poor households may notbe observed to incur catastrophic payments since they cannot afford to divert spending from subsistencefood needs. The flip side of catastrophic payments is the catastrophic loss of health and subsequenterosion of earnings capacity due to inability to afford health care. It is therefore important tocomplement the study of health care payments with that of health care utilization (O’Donnell O et al.,2007). In addition to medical spending, illness shocks have catastrophic economic consequencesthrough lost earnings. In fact, Gertler and Gruber (2002) find earnings losses to have a more disruptingeffect on household living standards than medical spending following a health shock in Indonesia. Thelack of sickness and disability insurance may impose an even greater welfare loss than that of healthcare insurance.
ACKNOWLEDGEMENTS
We are grateful to two anonymous referees and to participants at seminars of the Global HealthInstitute at Harvard University and in Santiago de Chile for helpful comments on an earlier version.The European Commission, INCO-DEV programme (ICA4-CT-2001-10015), funded the EQUITAPproject from which this paper derives. Analysis for Taiwan was funded by Taiwan Department ofHealth (DOH91-PL-1001 and DOH92-PL-1001) and for Hong Kong by the Health, Welfare and FoodBureau, Government of the Hong Kong Special Administrative Region.
APPENDIX A
The description of surveys is given in Table AI.
8 In 2000, total expenditure on health was only 2.7% of GDP in Indonesia, compared, for example, with 5.3% in China (WorldHealth Report, 2002).
E. VAN DOORSLAER ET AL.1180
Copyright # 2007 John Wiley & Sons, Ltd. Health Econ. 16: 1159–1184 (2007)
DOI: 10.1002/hec
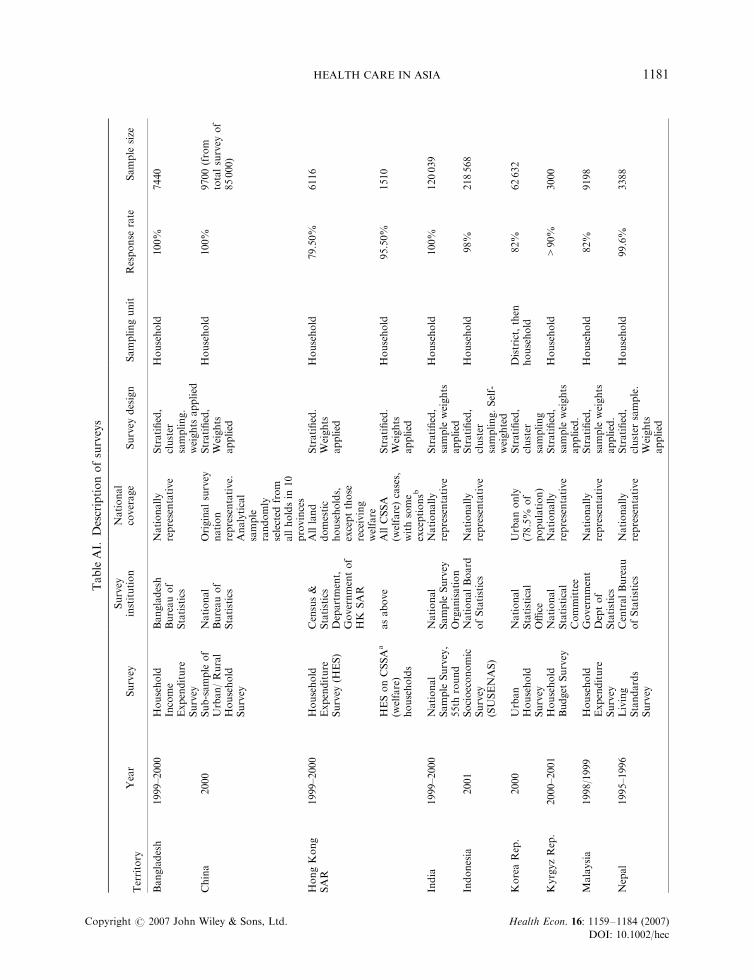
TableAI.
Descriptionofsurveys
Territory
Year
Survey
Survey
institution
National
coverage
Survey
design
Samplingunit
Response
rate
Sample
size
Bangladesh
1999–2000
Household
Income
Expenditure
Survey
Bangladesh
Bureauof
Statistics
Nationally
representative
Stratified,
cluster
sampling.
weights
applied
Household
100%
7440
China
2000
Sub-sample
of
Urban/Rural
Household
Survey
National
Bureauof
Statistics
Originalsurvey
nation
representative.
Analytical
sample
randomly
selected
from
allholdsin
10
provinces
Stratified,
Weights
applied
Household
100%
9700(from
totalsurvey
of
85000)
HongKong
SAR
1999–2000
Household
Expenditure
Survey
(HES)
Census&
Statistics
Department,
Governmentof
HK
SAR
Allland
domestic
households,
exceptthose
receiving
welfare
Stratified.
Weights
applied
Household
79.50%
6116
HESonCSSA
a
(welfare)
households
asabove
AllCSSA
(welfare)cases,
withsome
exceptionsb
Stratified.
Weights
applied
Household
95.50%
1510
India
1999–2000
National
Sample
Survey,
55th
round
National
Sample
Survey
Organisation
Nationally
representative
Stratified,
sample
weights
applied
Household
100%
120039
Indonesia
2001
Socioeconomic
Survey
(SUSENAS)
NationalBoard
ofStatistics
Nationally
representative
Stratified,
cluster
sampling.Self-
weighted
Household
98%
218568
KoreaRep.
2000
Urban
Household
Survey
National
Statistical
Office
Urbanonly
(78.5%
of
population)
Stratified,
cluster
sampling
District,then
household
82%
62632
KyrgyzRep.
2000–2001
Household
Budget
Survey
National
Statistical
Committee
Nationally
representative
Stratified,
sample
weights
applied.
Household
>90%
3000
Malaysia
1998/1999
Household
Expenditure
Survey
Government
Deptof
Statistics
Nationally
representative
Stratified,
sample
weights
applied.
Household
82%
9198
Nepal
1995–1996
Living
Standards
Survey
CentralBureau
ofStatistics
Nationally
representative
Stratified,
cluster
sample.
Weights
applied
Household
99.6%
3388
HEALTH CARE IN ASIA 1181
Copyright # 2007 John Wiley & Sons, Ltd. Health Econ. 16: 1159–1184 (2007)
DOI: 10.1002/hec
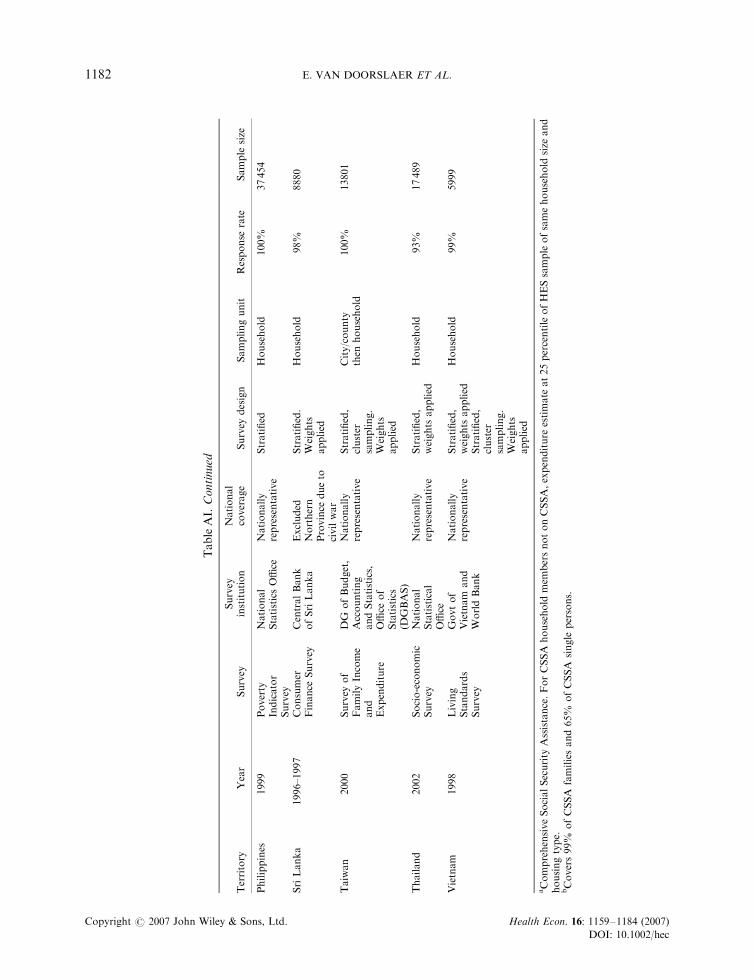
TableAI.Continued
Territory
Year
Survey
Survey
institution
National
coverage
Survey
design
Samplingunit
Response
rate
Sample
size
Philippines
1999
Poverty
Indicator
Survey
National
StatisticsOffice
Nationally
representative
Stratified
Household
100%
37454
SriLanka
1996–1997
Consumer
Finance
Survey
CentralBank
ofSriLanka
Excluded
Northern
Province
dueto
civilwar
Stratified.
Weights
applied
Household
98%
8880
Taiwan
2000
Survey
of
FamilyIncome
and
Expenditure
DG
ofBudget,
Accounting
andStatistics,
Office
of
Statistics
(DGBAS)
Nationally
representative
Stratified,
cluster
sampling.
Weights
applied
City/county
then
household
100%
13801
Thailand
2002
Socio-economic
Survey
National
Statistical
Office
Nationally
representative
Stratified,
weights
applied
Household
93%
17489
Vietnam
1998
Living
Standards
Survey
Govtof
Vietnam
and
WorldBank
Nationally
representative
Stratified,
weights
applied
Stratified,
cluster
sampling.
Weights
applied
Household
99%
5999
aComprehensiveSocialSecurity
Assistance.ForCSSA
household
mem
bersnotonCSSA,expenditure
estimate
at25percentileofHESsampleofsamehousehold
size
and
housingtype.
bCovers99%
ofCSSA
familiesand65%
ofCSSA
single
persons.
E. VAN DOORSLAER ET AL.1182
Copyright # 2007 John Wiley & Sons, Ltd. Health Econ. 16: 1159–1184 (2007)
DOI: 10.1002/hec
REFERENCES
Akin J, Dow WH, Lance PM. 2004. Did the distribution of health insurance in China continue to grow lessequitable in the nineties? Results from a longitudinal survey. Social Science & Medicine 58: 293–304.
Berki SE. 1986. A look at catastrophic medical expenses and the poor. Health Affairs 5(4): 138–145.Bloom G, Gu X. 1997. Health sector reform: Lessons from China. Social Science & Medicine 45(3): 351–360.Bonu S, Rani M, Peters DH, Jha R et al. 2005. Does use of tobacco or alcohol contribute to impoverishment from
hospitalization costs in India? Health Polcy and Planning 20(1): 41–49.Carrin G, Aviva R, Yang H et al. 1997. The reform of the rural cooperative medical system in the People’s Republic
of China: Interim experience in 14 pilot counties. Social Science & Medicine 48(7): 961–972.Chang F-R, Trivedi PK. 2003. Economics of self-medication: Theory and evidence.Health Economics 12(9): 721–739.Commission on Macroeconomics and Health. 2001. Macroeonomics and Health: Investing in Health for Economic
Development. World Health Orgnanisation: Geneva.Data International Ltd. 2004. Bangladesh National Health Accounts, 1999–2001. Health Economics Unit, Ministry
of Health and Family Welfare: Dhaka.Deaton A. 2004. Measuring Poverty in a Growing World (or Measuring Growth in a Poor World). Princeton
University, Princeton, NJ.Ensor T, Pham BS. 1996. Access and payment for health care: The poor of nothern Vietnam. International Journal
of Health Planning and Management 11: 69–83.Fabricant SJ, Kamara CW, Mills A. 1999. Why the poor pay more: Household curative expenditures in rural Sierra
Leone. International Journal of Health Planning and Management 14: 179–199.Gertler P, Gruber J. 2002. Insuring consumption against illness. American Economic Review 92(1): 51–70.Henderson G, Jin S, Akin J, Li Z et al. 1995. The distribution of medical insurance in China. Social Science &
Medicine 41(8): 1119–1130.Hotchkiss DR, Rous JJ, Karmacharya K, Sangraula P. 1998. Household health expenditures in Nepal:
Implications for health care financing reform. Health Policy and Planning 13(4): 371–383.Khoman S. 1997. Rural health care financing in Thailand. In Innovations in health care financing: Proceedings of a
World Bank Conference, Scheieber GJ (ed.), 10–11 March. The World Bank: Washington, DC, 183–193.Mudur G. 1999. Abuse of OTC drugs rising in South Asia. British Medical Journal 318: 556.O’Donnell O, Van Doorslaer E, Rannan-Eliya R et al. 2005. Who pays for health care in Asia? EQUITAP,Working
Paper # 1. Erasmus University, Rotterdam and IPS, Colombo.O’Donnell O, van Doorslaer E, Rannan-Eliya RP et al. 2007. The incidence of public spending on health care:
comparative evidence from Asia. World Bank Economic Review, in press. doi: 10.1093/wber/lhl009OECD and WHO. 2003. DAC Guidelines and Reference Series – Poverty and Health. Paris, OECD andWHO: Paris.Pannarunothai S, Mills A. 1997. The poor pay more: health-related inequality in Thailand. Social Science
& Medicine 44(12): 1781–1790.Peters D, Yazbeck A, Sharma R et al. 2001. Better Health Systems for India’s Poor. Findings, Analysis and Options.
World Bank: Washington, DC.Pradhan M, Prescott N. 2002. Social risk management options for medical care in Indonesia. Health Economics 11:
431–446.Ranson MK. 2002. Reduction of catastrophic health care expenditures by a community-based health insurance
scheme in Gujarat, India: Current experiences and challenges. Bulletin of the World Health Organisation 80(8):613–621.
Russell S. 2004. The economic burden of illness for households in developing countries: a review of studies focusingon malaria, tuberculosis, and human immunodeficiency virus/acquired immunodeficiency syndrome. AmericanJournal of Tropical Medicine and Hygiene 71(Suppl. 2): 147–155.
Saadah F, Pradhan M, Sparrow R. 2001. The Effectiveness of the Health Card as an Instrument to Ensure Access toMedical Care for the Poor During the Crisis. World Bank: Washington, DC.
Sauerbron R, Adams A, Hien M. 1996. Household strategies to cope with the economic cost of illness. SocialScience & Medicine 43(3): 291–301.
Sauerbron R, Ibrangho I, Nougtara A et al. 1995. The economic costs of illness for rural households in BurkinaFaso. Tropical Medicine & Parasitol 42: 219.
Segall M, Tipping G, Lucas H et al. 2002. Economic transition should come with a health warning: the case ofVietnam. Journal of Epidemiology and Community Health 56: 497–505.
Skarbinski J, Walker HK, Baker L et al. 2002. The burden of out-of-pocket payments for health care in Tblisi,Republic of Georgia. Journal of American Medical Association 287(8): 1043–1049.
van Damme W. 2004. Out-of-pocket health expenditure and debt in poor households: evidence from Cambodia.Tropical Medicine and International Health 9(2): 273–280.
HEALTH CARE IN ASIA 1183
Copyright # 2007 John Wiley & Sons, Ltd. Health Econ. 16: 1159–1184 (2007)
DOI: 10.1002/hec
Van Doorslaer E, O’Donnell O, Rannan-Eliya RP et al. 2006. Effect of health payments on poverty estimatesin 11 countries in Asia: An analysis of household survey data. The Lancet 368(14): 1357–1364.
Wagstaff A, Van Doorslaer E. 2003. Catastrophe and impoverishment in paying for health care: with applicationsto Vietnam 1993–98. Health Economics 12: 921–934.
Whitehead M, Dahgren G, Evans T. 2001. Equity and health sector reforms: can low-income countries escape themedical poverty trap? The Lancet 358: 833–836.
Wilkes AHY, Bloom G, Xingyuan G. 1998. Coping with the costs of severe illness in rural China. IDS WorkingPaper 58, Brighton, Sussex, UK.
World Bank. 2001. Growing Healthy? A Review of Vietnam’s Health Sector. The World Bank: Hanoi.World Bank. 2004. The Millenium Development Goals for Health: Rising to the Challenges. World Bank:
Washington, DC.World Health Organisation. 2000. World Health Report 2000. World Health Organisation: Geneva.World Health Organisation. 2005. Sustainable health financing, universal coverage and social health insurance.
115th World Health Assembly Resolution EB115.R13, Geneva.Wyszewianski L. 1986. Financially catastrophic and high cost cases: Definitions, distinctions and their implications
for policy formulation. Inquiry 23(4): 382–394.Xu K, Evans DE, Kawabate K et al. 2003. Household catastrophic health expenditure: a multicountry analysis.
Lancet 362: 111–117.
E. VAN DOORSLAER ET AL.1184
Copyright # 2007 John Wiley & Sons, Ltd. Health Econ. 16: 1159–1184 (2007)
DOI: 10.1002/hec
Copyright © 2022 FDOKUMEN