The Effect of the Introduction of Low Reward on Performance
32
Bachelor Thesis Finance Department Financial Experiments: The effect of rewards on performance The Effect of the Introduction of Low Reward on Performance A paper based on the paper: "Pay enough or don't pay at all", by Uri Gneezy and Aldo Rustichini (2000) Lucas Lemmens ANR: 969374 Bedrijfseconomie Bachelor Thesis [email protected] Supervisor: E.S. Pikulina 18-05-2012 Tilburg University
-
Upload
khangminh22 -
Category
Documents
-
view
0 -
download
0
Transcript of The Effect of the Introduction of Low Reward on Performance
Bachelor Thesis Finance Department
Financial Experiments: The effect of rewards on performance
The Effect of the Introduction of Low Reward on
Performance
A paper based on the paper: "Pay enough or don't pay at all", by Uri Gneezy
and Aldo Rustichini (2000)
Lucas Lemmens
ANR: 969374
Bedrijfseconomie
Bachelor Thesis
Supervisor: E.S. Pikulina
18-05-2012
Tilburg University
Cleijten
Rectangle
2
Abstract
This paper is based on the paper Pay enough or don't pay at all from Uri Gneezy and Aldo
Rustichini, released in the Quarterly Journal of Economic in 2000, in which two experiments
were described to test monetary incentives on performance. The experiment conducted in this
paper is based on the first experiment performed by Gneezy and Rustichini.
This paper analyzes the IQ experiment of Gneezy and Rustichini and checks if the drawn
conclusions are valid. In their experiment 160 participants were invited to do a test resembling
an IQ questionnaire. The participants were divided into four groups with different pay-outs:
one group with no payment, one with a small piece-rate payment, a group with a moderate
piece-rate payment and a group with a high piece-rate payment. The scores of the different
groups were compared. The outcome of the experiment showed that the group with the small
compensation scored the worst. Gneezy and Rustichini concluded that the intrinsic motivation
was diminished by the small compensation and therefore stated that no compensation is better
than a low compensation. Because of the possibility of different reference points of the
participants and differences in skill and characteristics, a design was created to test whether
the conclusion drawn from the IQ experiment is valid. In this new design the treatment group
has to solve mathematical questions in the first stage for a low piece-rate reward, and has to
do the same in the second stage for no extra payment. The results of this experiment are
compared to those of Gneezy and Rustichini, after which conclusions are drawn concerning
the effects of monetary incentives on performance. Due to a lack of time, the actual
experiment could not be conducted. However, the experiment of Gneezy and Rustichini was
thoroughly analyzed and the new design is ready to be put into practice.
3
Table of contents
ABSTRACT .................................................................................................................................................2
TABLE OF CONTENTS ................................................................................................................................3
1. INTRODUCTION ....................................................................................................................................4
1.1. THE PROBLEM BACKGROUND ...............................................................................................................4
1.2. THE PROBLEM STATEMENT ...................................................................................................................7
1.3. ACADEMIC RELEVANCE ........................................................................................................................7
1.4. OVERVIEW OF THE REST OF THE CHAPTERS ..............................................................................................8
2. CONCEPTUAL FRAMEWORK .................................................................................................................9
2.1. IDENTIFYING THE VARIABLES ................................................................................................................9
2.1.1. INDEPENDENT VARIABLES: EXTRINSIC MOTIVATION, INTRINSIC MOTIVATION AND SKILL ....................................9
2.1.2. MODERATING VARIABLE: LEVEL OF REWARD .................................................................................... 10
2.1.3. MEDIATING VARIABLE: EFFORT ................................................................................................... 10
2.1.4. DEPENDENT VARIABLE: PERFORMANCE .......................................................................................... 10
2.2. GRAPHICAL REPRESENTATION OF THE THEORETICAL FRAMEWORK ........................................................... 10
2.3. THE RELATIONSHIP BETWEEN THE VARIABLES ....................................................................................... 11
3. THE EXPERIMENT OF G&R ................................................................................................................. 12
3.1. DESIGN .......................................................................................................................................... 12
3.2. RESULTS ........................................................................................................................................ 12
3.3. EXPOSITION AND LIMITATIONS .......................................................................................................... 14
4. EXPERIMENTAL DESIGN ..................................................................................................................... 17
4.1. DESIGN .......................................................................................................................................... 17
4.2. RESULTS ........................................................................................................................................ 18
5. CONCLUSION ..................................................................................................................................... 20
REFERENCES .......................................................................................................................................... 21
APPENDIX 1: INSTRUCTIONS FOR THE TREATMENT GROUP ................................................................ 24
APPENDIX 2: INSTRUCTIONS FOR THE CONTROL GROUP .................................................................... 25
APPENDIX 3: QUESTIONS USED IN THE EXPERIMENT .......................................................................... 26
4
1. Introduction
1.1. The Problem Background
There is no consensus between economics and other social sciences concerning incentives for
motivation in financial experiments.
In general, economics states that a bigger reward leads to a better performance. Mason and
Watts (2010) concluded that people complete more tasks when payment is higher. When
financial rewards are present, one tends to work harder to obtain the reward, in contrast with
an absence of financial rewards, where one has less incentive to perform well.
Other social sciences, particularly psychology, state that financial rewards are not the solution
to make one perform well. Camerer and Hogarth (1999) state that intrinsic motivation gives
one enough motivation to perform. Financial rewards might induce one to put in more effort,
but it does not necessarily leads to a better performance, especially when a task requires skill.
First of all, to be motivated means to be moved to do something (Ryan & Deci, 2000). So, it
is a reason or multiple reasons for one to exercise a certain action. There are basically two
kinds of incentives that motivate people to put effort in something:
First there is extrinsic motivation. Davis et al. (1992) describes it as follow:
Extrinsic motivation refers to the performance of an activity because it is perceived to
be instrumental in achieving valued outcomes that are distinct from the activity itself,
such as improved job performance, pay, or promotions. (p.1112)
In other words, the extrinsic motivation is formed by the compensation you receive for
exercising the activity, and is independent from the activity itself. It is the part that motivates
you, not because you like the activity that you are doing or you want to perform because of
personal incentives, but because of the tangible reward you receive for it.
In contrast to extrinsic motivation there is intrinsic motivation, on which Davis et al. (1992)
state:
While extrinsic motivation influences behavior due to the reinforcement value of
outcomes, intrinsic motivation refers to the performance of an activity for no apparent
reinforcement other than the process of performing the activity per se. (p.1112)
5
Thus, the reason you have to perform is derived purely from the activity itself. All other
factors outside of the activity are omitted. For example: enjoyment, interest, determination in
finishing the activity are called the intrinsic motivation. It can be defined as a task being
interesting, or as the satisfaction one gains from an intrinsically motivated task engagement
(Ryan & Deci, 2000). These definitions derive from two different views: the operant theory
and the learning theory. The operant theory states that intrinsically motivating activities are
activities where the reward is in the activity itself (Skinner, 1953). The learning theory (Hull,
1943) states that intrinsically motivated activities satisfy the innate psychological needs.
According to Gneezy & Rustichini (2000) the two commonly used measures to determine
intrinsic motivation are the free-choice period and the self-report.
The free-choice period is the amount of time freely spent on the activity. (Gneezy &
Rustichini, 2000). It is the period when the experiment itself is not going on, but the
participant is in contact with the activity. The time spent on the activity outside the
experiment is used to determine the intrinsic motivation. For example, the experiment consist
of solving puzzles and when the experiment is over the supervisor tells the participant that he
will be back in a few minutes and that the participant is allowed to do whatever he likes to do
(e.g. reading magazines, solving more puzzles, do other things). This is called the free-choice
period. The time spent on solving puzzles during this period is used to determine the intrinsic
motivation (Pelletier & Vallerand, 1996).
The self-report is the report by the subjects on motivation (Gneezy & Rustichini, 2000),
commonly in the form of a survey. To measure the intrinsic motivation, the Intrinsic
Motivation Inventory (IMI)1 can be used, which has been used in several experiments
concerning intrinsic motivation and self-regulation (e.g., Ryan, 1982; Ryan, Mims &
Koestner, 1983; Deci, Eghrari, Patrick, & Leone, 1994). It is a multidimensional measurement
device for laboratory experiments to assess the subjective experience of participants
concerning the activity. There are six subscales in the IMI: interest/enjoyment, perceived
competence (positive predictor), effort, value/usefulness, felt pressure and tension (negative
predictor), and perceived choice while performing a given activity (positive predictor).
Although there are six subscales, the interest/enjoyment subscale is the only one that assesses
the intrinsic motivation and is thus considered the self-report measure of intrinsic motivation.
1 Intrinsic Motivation Inventory:
http://www.selfdeterminationtheory.org/questionnaires/10-questionnaires/50
6
The different subscales are useful for different kind of studies. Therefore, it is rare that all
subscales are used in one particular experiment. Experimentalists use the subscales related to
the explored subject. McAuley and Tammen (1989) found strong support for the validity of
the IMI.
Some activities do not depend on external rewards, since motivation is provided by their own
inherent reward (Deci, 1971). It would seem logical to give people a monetary compensation
if you want them to perform better. However, the following was concluded after a study held
with high school students performing an interesting activity (Kurglanski, Friedman & Zeevi,
1971): tangible rewards can undermine the intrinsic motivation, causing a worse performance
than when no compensation is offered. This paradoxical conclusion implies that it is better to
pay nothing at all than to give people a small compensation for their effort, in order to get
their best performance. This is confirmed by other studies performed with pre-school
students, where not necessarily financial rewards, but even symbolic rewards could
undermine the intrinsic motivation (Lepper, Green & Nisbett, 1973). This is also applicable to
some real-life examples like donating blood or collecting money for charity.
Gneezy and Rustichini (2000) stated that no compensation is better than low compensation,
but that sufficient piece-rate compensation induces the best performance, causing a non-linear
relationship between payment and performance. The explanation behind this statement is:
when people do not get compensated, they exercise the task purely out of intrinsic motivation.
When they receive low compensation, a part of their intrinsic motivation is replaced by
extrinsic motivation: the financial reward. When doing an intrinsically interesting activity, or
an activity for a good cause, the compensation diminishes the intrinsic motivation, with worse
performances as a result. People may (subconsciously) feel discouraged by this low
compensation. When people receive a sufficient piece-rate reward (a fixed reward for each
correct action), the extrinsic motivation is usually very high. In other words, people receive
enough money for performing a task to make the task worth doing. The better they perform on
the task, the better they get compensated (with a compensation which is worth performing
well for), so people have a good reason to put in as much effort as possible. This induces the
best performance. You can see the performance as a net result of intrinsic and extrinsic
motivation: when no compensation is offered the performance is solely based on intrinsic
motivation. When monetary rewards are introduced, the performance is now based on both
intrinsic and extrinsic motivation. When a reward has a negative effect on the motivation (in
7
case of low payment), it will cause a lower net result with a worse performance as a
consequence. When the reward has a positive effect (in case of sufficient payment), it will
lead to a higher net result, causing a better performance.
Gneezy and Rustichini (2000) (when it concerns their experiment this is stated as: G&R)
study the differential effect of small and large rewards. They look at the behavioral response
to different rewards in a single-stage setup. This means that the comparison is done across
individuals and not across the performance of the same individual, since there is only one
stage in the experiment. The effects of introducing a reward and the effects of increasing this
reward are studied. The performances from the different groups are compared and analyzed.
Their main findings are that the participants who received a moderate or high piece-rate
reward scored the best, followed by the participants who received no extra payment. The
participants who received a low piece-rate reward scored the worst.
As stated before, this paper analyzes the study of G&R and checks if the conclusion that is
drawn above - low compensation has a detrimental effect on performance - is valid, and how
this can be tested.
1.2. The Problem Statement.
What effect has the introduction of low reward on the performance?
For now, it is enough to know that by a low reward a reward is meant that does not provide
encouragement to performing the task. Later, a more defined description is given.
1.3. Academic Relevance.
The effect of intrinsic and extrinsic motivation on performance is not only interesting to
finance and economics, but to all socials studies. It tells about human thinking and decision
making. Also, the fact that there is no consensus in this area makes it interesting and relevant
to investigate. This paper contributes to the ongoing discussion whether intrinsic or extrinsic
motivation leads to the best performance.
This paper contributes to the literature regarding monetary incentives on performance, by
extending the work of G&R. It shows how the conclusion - low reward leads to detrimental
8
effects on performance - can be tested. If this test is passed, their study will form strong
evidence for positive effects of a high reward on performance and detrimental effects of a low
reward on performance. If this test is not passed, a close look will have to be taken at their
experiment to check what possibilities could cause certain assumptions to be wrongly made.
The main result of the analysis of the experiment of G&R is that its outcome is not clear
enough to confirm the conclusions they drew. The new design should be put into practice and
based on its outcome conclusions can be drawn concerning the effect of a low reward on
performance.
1.4. Overview of the rest of the chapters.
In chapter 2, the conceptual framework is presented. Also the variables that are used are
clarified and defined.
In chapter 3, the IQ-experiment of G&R is explained and analyzed. Their results are shown
and the limitations are exposed.
In chapter 4, a new design is presented. Possible results of the new experiment are described
and explained.
In chapter 5, the conclusions are drawn concerning the experiment and some
recommendations are given.
9
2. Conceptual Framework
In this chapter, the variables which play a role in this paper are defined. An explanation is
given what is meant by the different variables used in the experiment. A graphical
representation of the conceptual framework is made and the expected relations between the
variables are given.
2.1. Identifying the Variables
In order to get a clear picture of the dependent and independent variables that will be used in
this paper, it is important to define these variables. The variables applied to the experiment of
G&R are defined below.
2.1.1. Independent Variables
Extrinsic motivation: The extrinsic motivation is the motivation the participants receive from
getting a monetary reward.
Intrinsic motivation: In experimental psychology literature, intrinsic motivation is measured
by the amount of time freely spent on the activity or the self-report of the subjects on their
motivation. Also, psychologists study modification in behavior through conditioning or
learning. For this, multiple stages in the experiment are necessary. In the experiment of G&R,
there is only one stage. Instead of looking at the performance of the same participant in the
different stages, the performance of individuals is compared with other individuals in different
groups. The subjects in the group with no payment are taken as the group performing out of
intrinsic motivation. The intrinsic motivation in this experiment is thus measured by the
performance of the subjects in the group with no payment.
Skill: A factor that might be underestimated in the experiment of G&R is the level of skill.
Since the performances are compared between the subjects, and not within the performance of
the subject, it is possible that the different groups have different skill levels. Because of this it
is possible that conclusions are falsely drawn, when the influence of differences in skill are
high enough to influence the results in performance. Since the new design consists of two
stages and the results will now be compared within the performance of the subject, instead of
between subjects, the element of skill is of no importance.
10
2.1.2. Moderating Variable
Level of reward: The level of reward consists of the zero payment, the low payment or the
high payment. The different payments influence the motivation to perform.
2.1.3. Mediating Variable
Effort: There is no good possibility to measure the effort in this experiment, but it belongs
certainly in the conceptual framework. So, effort is included, but will not be measured in the
experiment.
2.1.4. Dependent Variable
Performance: The performance is measured by the amount of questions answered correctly. It
is easy to compare performances since the measurement is done on ratio scale.
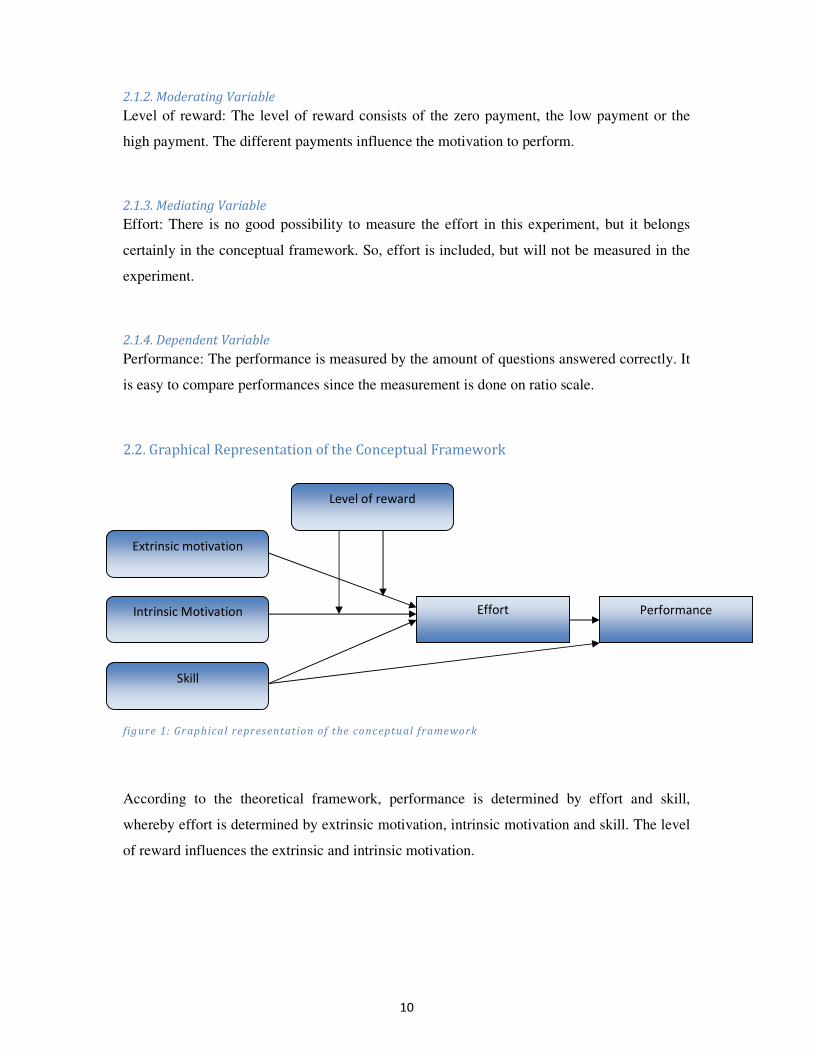
2.2. Graphical Representation of the Conceptual Framework
figure 1: Graphical representation of the conceptual framework
According to the theoretical framework, performance is determined by effort and skill,
whereby effort is determined by extrinsic motivation, intrinsic motivation and skill. The level
of reward influences the extrinsic and intrinsic motivation.
Extrinsic motivation
Intrinsic Motivation Effort
Skill
Level of reward
Performance
11
2.3. The relationship between the variables
The level of reward influences both intrinsic and extrinsic motivation. With no payment
extrinsic motivation is absent, so only intrinsic motivation and skill decides the amount of
effort that is put in. With low rewards extrinsic motivation is inserted and intrinsic motivation
is lowered; the prediction is that this results in a lower net result and thus less effort is put in.
With high rewards, the extrinsic motivation rises with the expectation that the effort put in is
the highest of the three possible pay-outs.
Skill as well influences effort; the prediction is a positive monotonic relation between the
variables. Skill is also affecting performance directly: the higher skilled one is, the better the
performance will be. Just as the performance will be better when more effort is put in.
So, theoretically this is the correct conceptual framework. However, in the experiment effort
is hard to measure and we excluded skill to make the findings as objective as possible.
12
3. The Experiment of G&R
The design and results of the IQ experiment of G&R are shown in this chapter. Next, an
exposition is given concerning the experiment and limitations are shown.
3.1. Design
The experiment was performed at the University of Haifa, where 160 students participated.
They were requested to answer 50 questions which were taken from an psychometric (IQ)
test. For participating, students received 60 NIS (New Israeli Shekel), which at the time of the
experiment was about $17. They were divided into four different groups, with different
treatments. The subjects in the 1st group were requested only to answer as many questions as
they could; they did not receive extra money based on their performance. The second group
was given an additional 10 cents of a NIS for each question answered correctly. In the 3rd
group the subjects were given 1 NIS for each correct answer and in the 4th group 3 NIS. Since
the NIS is not relevant, the most important thing is that the reward of the second group is seen
as low and the reward of the third and forth group is seen as high.
3.2. Results
The best results were scored in the third and forth group, with respectively 34.7 and 34.1
correct answers on average. Group 1 scored 28.4 correct answers and group 2 performed the
worst with 23.1 correct answers on average. In the following figure the performance of the
individuals of the four groups is shown in ascending IQ rank; ranked 1 scored the worse and
ranked 40 scored the best.
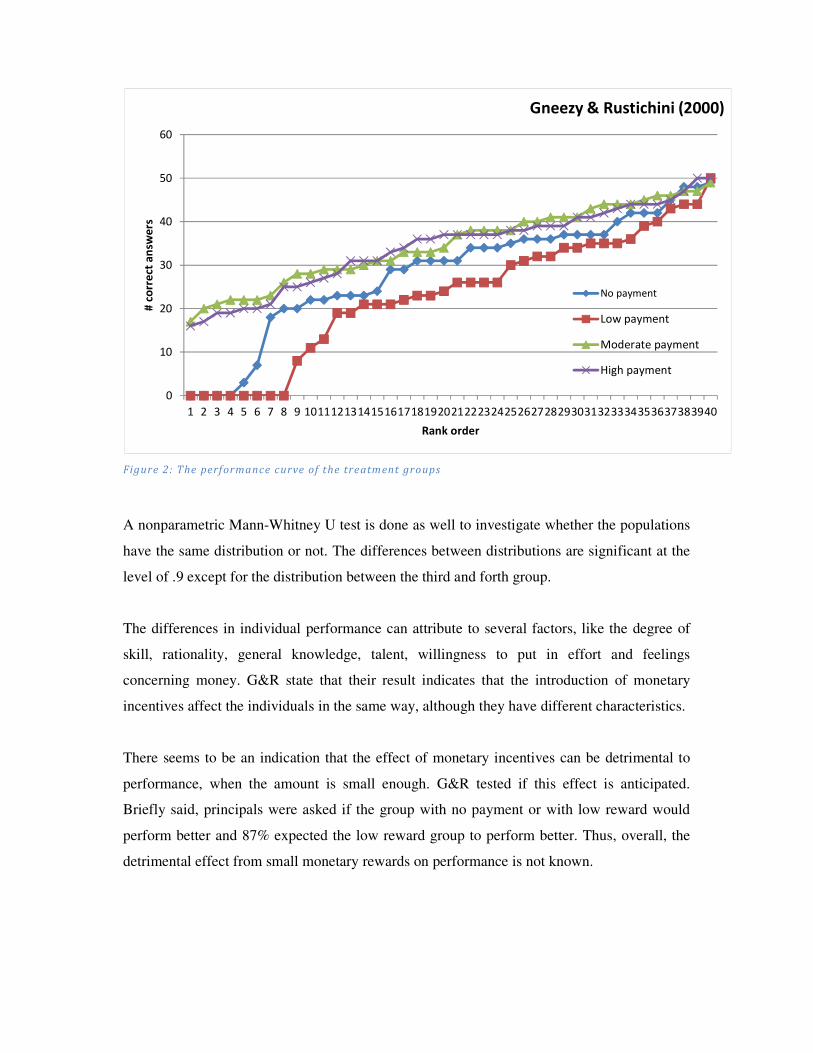
Figure 2: The performance curve of the treatment groups
A nonparametric Mann-Whitney U test is done as well to investigate whether the populations
have the same distribution or not. The differences between distributions are significant at the
level of .9 except for the distribution between the third and forth group.
The differences in individual performance can attribute to several factors, like the degree of
skill, rationality, general knowledge, talent, willingness to put in effort and feelings
concerning money. G&R state that their result indicates that the introduction of monetary
incentives affect the individuals in the same way, although they have different characteristics.
There seems to be an indication that the effect of monetary incentives can be detrimental to
performance, when the amount is small enough. G&R tested if this effect is anticipated.
Briefly said, principals were asked if the group with no payment or with low reward would
perform better and 87% expected the low reward group to perform better. Thus, overall, the
detrimental effect from small monetary rewards on performance is not known.
0
10
20
30
40
50
60
1 2 3 4 5 6 7 8 9 10111213141516171819202122232425262728293031323334353637383940
# c
orr
ect
an
swe
rs
Rank order
Gneezy & Rustichini (2000)
No payment
Low payment
Moderate payment
High payment
14
The main conclusion G&R drew from the experiment is that extrinsic motivation produces a
reduction in the performance, for all positive but small enough compensations compared to
zero compensation (or better: when any mention concerning compensation is bequeathed).
3.3. Exposition and Limitations
There are several academic models available on the subject of the G&R experiment, which
can be used to explain its conclusions. Frey and Oberholzer-Gee (1997) provided a model on
monetary rewards and intrinsic motivation. In the model the agent has an utility function,
u(a,r) and intrinsic motivation, m(a,r) where a stands for the activity and r for the monetary
reward. The model states a negative linear effect from monetary reward on intrinsic
motivation. According to the model, a very low payment should decrease the activity only a
little, which is not the case in this experiment. The model is in this case unable to explain the
discontinuity.
Another explanation is based on the attribution theory, based on a cognitive explanation of the
displacement. People look at their actions like they are an outsider. When one receives no
monetary compensation, one interprets his motive as an intrinsic motivation. When a
monetary compensation is provided, regardless of the level of this compensation, one
interprets the monetary reward as being his motive. The perception is changed and this change
is large, independent of the level of the reward. The problem is that this concerns experiments
where participants can observe themselves and change their behavior, and since this
experiment has a single-stage set-up this explanation is less appropriate.
An analysis of Figure 2 can leads to several interesting observations. Rydval and Ortmann
(2004) analyzed the experiment of G&R as well and concluded three remarkable things:
Firstly, between the moderate and high reward group there is hardly any across-treatment
variation (variation between the different groups); the slopes are almost identical. The within-
treatment variation (variation inside a particular group) however is quite high. This is
probably caused by the different cognitive ability of the subjects. When incentives are high
enough, the incentive differentials are not determined by the individual performance, but by
the cognitive ability instead.
15
Secondly, when looked at the low-incentive payments, it is clear that the overall motivation of
the participants the low reward group is lower than the no reward group, since the
performance curve lies completely beneath the others. It is highly unlikely to say that this is
because of the differences in ability as in the moderate and high reward group. Instead,
motivation seems to be the reason of the across-treatment differences. Analyzing the worst
performances from the low-incentive groups, we see scores that indicate a refusal to perform,
instead of just a lack of motivation. Such scores are not present in the high-incentive groups,
which indicates this is a specific kind of motivational problem.
Thirdly, the variation within-treatment is much greater than the variation across-treatment.
The difference in median between the best and the worst group is only 13 (24 vs. 37), as well
as the difference in the third quartile. While the smallest difference within a group is no less
than 34 (16 vs. 50, no and low reward group). The across-treatment differences can be
attributed to motivational reasons, the within-treatment differences on the other hand are
because of differences in ability. This leads to the conclusion that not only the incentive
effects are the reason for the variation in performance, but the ability differentials as well,
maybe even more than G&R had taken into account.
However, Rydval and Ortman’s observations on within-treatment differences are not
completely valid regarding the no- and low-incentive groups. Rather, the behavior of these
groups is more complex. Very noticeable is that, contrary to the moderate and high-incentive
group, the no- and low-incentive groups consist of a minority of participants who have not
answered a single question and a majority of participants who have. While the differences in
the majorities of these groups can be attributed to differences in ability, the differences
between the minority and the majority in each group are caused by motivational reasons. This
makes an across-treatment analysis more complex and requires a closer look.
Even if they conclude that the small reward leads to worse performances, this has to be placed
in the right context. The small reward is namely on top of a relatively very high standard
compensation, the 60 NIS every participant gets for showing up.
The contract describing the experiment is what G&R call an incomplete contract. The
participants in the first and second group probably interpret their contracts differently. The
16
participants in the group were no monetary compensation is offered for correct answers
interpret the contract as G&R say:
"A payment of 60 NIS is provided for participation in the experiment, and I now
know that this participation consists of answering the questions." (p. 803)
To some of the participants in group 1 it felt that their part of the deal was to answer the
questions as well as possible.
The thoughts of the participants in the second group are according to G&R as follows:
"Sixty NIS were paid for showing up. The activity of answering the questions is now
paid by rate." (p. 804)
They have a complete other perception than the participants in the first group. The reference
point of the second group is the rate of 10 cents per correct answer, which is very small
compared to the sixty NIS for showing up, leading to a very low activity. Since this rate is so
low, they feel that their job was to show up and feel not indebted to answer questions
correctly.
So, the conclusion that small monetary compensation leads to reduction in performance,
might not be valid in this case, since the two groups had different reference points and only a
small part of the group showed a worse performance. To test whether this statement is true the
set-up should be different. Too much skill is involved in the experiment of G&R. This is
changed in the new design; the skill is excluded in the new set-up to make the design relevant.
The next chapter will continue on this, giving an experimental design to test the effect of low
reward on performance.
17
4. Experimental Design
An interesting extension would be to first pay a group a small amount for each question
answered correctly and then let them perform the same task for no compensation. This group
is called the treatment group. This should be compared with a control group who will perform
both exactly the same tasks, but then from the start be offered zero compensation. In this case,
the same reference point is present in the first and second stage of the experiment.
4.1. Design
The subjects are 80 students from Tilburg University. The subjects are divided in two groups
of 40: the control group and the treatment group. The participants of the control group are
numbered from 1 to 40, the participants of the treatment group 41 to 80. Each student is
promised €7 for participation. The experiment is divided into two stages with duration of 25
minutes per stage, which is told to the participants. In both stages the subjects are required to
answer 15 mathematical questions taken out of a GMAT exam. The choice of the questions is
mostly based on effort and math skill, and specific knowledge is excluded as much as
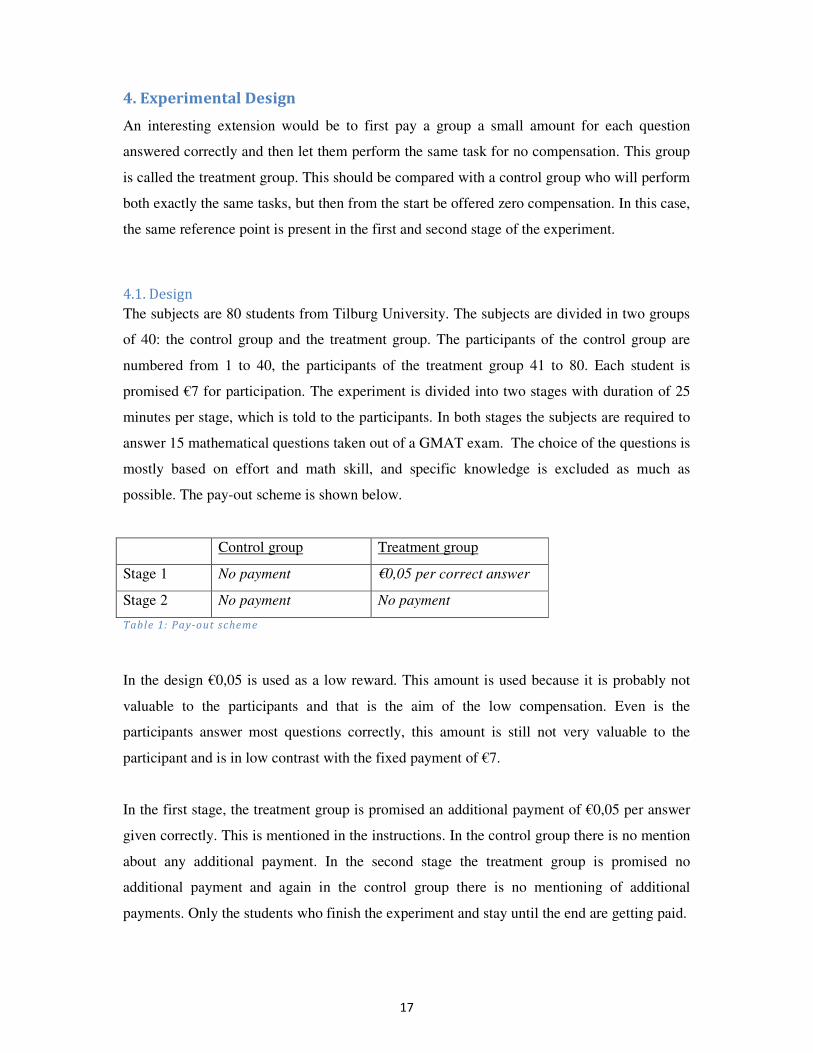
possible. The pay-out scheme is shown below.
Control group Treatment group
Stage 1 No payment €0,05 per correct answer
Stage 2 No payment No payment
Table 1: Pay-out scheme
In the design €0,05 is used as a low reward. This amount is used because it is probably not
valuable to the participants and that is the aim of the low compensation. Even is the
participants answer most questions correctly, this amount is still not very valuable to the
participant and is in low contrast with the fixed payment of €7.
In the first stage, the treatment group is promised an additional payment of €0,05 per answer
given correctly. This is mentioned in the instructions. In the control group there is no mention
about any additional payment. In the second stage the treatment group is promised no
additional payment and again in the control group there is no mentioning of additional
payments. Only the students who finish the experiment and stay until the end are getting paid.
18
After the introduction the papers with the first 15 questions are handed out, with the
instruction page on top to make sure no-one starts earlier; students are allowed to read the
instructions, but it is prohibited to look at the questions until the instructor gives a sign. The
only material allowed on the student his desk is scratch paper and a pen or pencil. Once all the
participants have received the papers the instructor gives a sign that they are allowed to start.
Once everyone has finished the first stage of the test, or the 25 minutes are over, the papers
are collected. No information is given about the performance to the participants. The same
procedure is used for the second stage. In the meantime the questions from the first stage are
checked by an assistant. The money earned by each participant is noted after the assistant
finished checking the answers. When the second stage is finished, the papers are collected and
participants are asked to come to the supervisor his desk, one by one. The money earned is
handed to the participant in cash, and no further mention is made about the performance to the
participant. The instructions are presented in the appendix.
4.2. Results
Due to the lack of time it is not possible to actually conduct the experiment. Because of that,
potential results instead of actual results are reviewed and alternative explanations for these
results. Different possible outcomes of the experiment are presented. Note that the design of
the experiment is still applicable and useful for further research.
The scores in the two stages from the treatment group are compared. The same is done for the
scores in the two stages of the control group. If the scores in the second stage are significantly
better than the scores in the first stage in the treatment group, then indeed the conclusion can
be drawn that the small monetary compensation leads to reduction in performance. The scores
of the control group will be put down as a base which the scores of the treatment group will
be compared with.
The new design tests if small monetary compensation leads to a worse performance. For this
to be valid, the performance of the treatment group in the first stage should be significantly
worse than the performance in the second stage, taking into account the difference in
difficulty of the questions in the first and in the second stage.
19
The control group is there to check for this difference in difficulty. Since they have no
incentive to perform better or worse in the different stages, the difference in performance in
the two stages can be attributed to the difference in difficulty of the questions as well as
possible learning effects. Because of this, the results of the treatment group in the second
stage should be divided by the "difficulty rate" based on the performance of the control group.
For instance, when the control group scores on average 8 correct answers in the first stage and
10 in the second stage, this induces that the questions in the second stage are easier, or a
learning effect is present. The correct answers from the treatment group in the second stage
should then be divided by 1.25 (10/8) to correct for this difference in difficulty of the
questions and/or to exclude the learning effect.
To test whether the means of the performance in the two stages of the treatment group
significantly differ from each other, a paired samples T-test should be performed. This test
can be executed in the statistical program SPSS. The scores of the participants of both stages
have to be implemented. The sample size, means of both groups, as well as the standard
deviation are calculated and with that the paired samples T-test is executed. The T-value,
degrees of freedom and the significance is computed and with these statistics it is possible to
calculate the chance that the two means significantly differ from each other. When the
significance value is for instance 0.048 then it can be concluded that the two means differ
from each other with 95.2% confidence.
When there is no significant difference or even a significantly better performance in the first
stage, then there is reason to question the assumption that low rewards leads to a worse
performance. The degree of skill, rationality, general knowledge, talent, willingness to put out
effort and feelings concerning money of the different participants are important factors that
can cause big differences in performance between participants and thus between the different
groups as well. Those factors are excluded in this experiment, since performance is checked
within the group.
20
5. Conclusion
This paper analyzed the IQ experiment of Gneezy and Rustichini and found that their
experimental design is not valid. The conclusion that the low reward leads to worse
performance is still questionable and on the outcome of G&R’s experiments cannot be
concluded. A new improved design is made to test the effect of a low reward on performance.
With this new design a representative experiment can be conducted and valuable things can
be said about the effect of low rewards on performance.
It is a pity that this experiment could not be conducted at this moment. Interesting conclusions
could be drawn and a real extension to the literature concerning rewarding systems in
financial experiments was then performed. However, all facets are ready to conduct the
experiment, which will hopefully be performed at a later moment in time. Even though the
icing on the cake is missing, there has been a lot of dedication and enjoyment working on this
paper and a strong base is made to test the effect of a low reward on performance.
21
References
Camerer, C. F. & Hogarth, R. M. (1999). The effects of financial incentives in experiments: A
review and capital-labor-production framework. Journal of Risk and Uncertainty,
19(1-3), 7-42. doi:10.1023/A:1007850605129
Davis, F. D., Bagozzi, R.P., Warshaw, P.R. (1992) Extrinsic and intrinsic motivation to use
computers in the workplace. Journal of Applied Social Psychology, 22, 1111-1132.
doi: 10.1111/j.1559-1816.1992.tb00945.x
Deci, E. L. (1971). Effects of externally mediated rewards on intrinsic motivation. Journal
of Personality and Social Psychology, 18, 105–115.
Deci, E.L., Eghari, H., Patrick, B.C. & Leone, D.R. (1994). Facilitating Internalization: The
Self-Determination Theory Perspective. Journal of Personality, 62,119-142.
doi: 10.1111/j.1467-6494.1994.tb00797.x
Frey, B. S. & Oberholzer-Gee, F. (1997, September). The cost of price incentives: An
empirical analysis of motivation crowding-out. American Economic Review, 87, 746–
755.
GMAT Practice Questions. (n.d.). Retrieved from http://www.platinumgmat.com/
Gneezy, U. & Rustichini, A. (2000). Pay enough or don't pay at all. The Quarterly Journal of
Economics, 115(3), 791-810. doi: 10.1162/003355300554917
Hull, C. L. (1943). Principles of behavior: An introduction to behaviour theory. New York:
Appleton–Century–Crofts.
Intrinsic Motivation Inventory. (n.d.). Retrieved from http://www.selfdeterminationtheory.org
22
Kurglanski, A.W., Friedman, I. & Zeevi, G. (1971). The effects of extrinsic incentive on some
qualitative aspects of task performance. Journal of Personality, 39, 606-617.
doi:10.1111/j.1467-6494.1971.tb00066.x
Lepper, M. R., Green, D. & Nisbett, R. E. (1973). Undermining children’s intrinsic interest
with extrinsic rewards: A test of the ‘‘overjustification’’ hypothesis. Journal of
Personality and Social Psychology, 28, 129–137. doi: 10.1037/h0035519
Mason, W. & Watts, D. (2009, december). Financial incentives and the "performance of
crowds". ACM SIGKDD Explorations Newsletter, 11(2), 100-108.
doi:10.1145/1809400.1809422
McAuley, E. & Tammen, V.V. (1989). The effects of subjective and objective competitive
outcomes on intrinsic motivation. Journal of Sport & Exercise Psychology, 11, 84-93.
Pelletier, L.G. & Vallerand, R.J. (1996). Supervisor's beliefs and subordinates' intrinsic
motivation: A behavioral confirmation analysis. Journal of Personality and Social
Psychology, 71(2), 331-340. doi: 10.1037/0022-3514.71.2.331
Ryan, R. M. (1982). Control and information in the intrapersonal sphere: An extension of
cognitive evaluation theory. Journal of Personality and Social Psychology, 43(3), 450-
461. doi: 10.1037/0022-3514.43.3.450
Ryan, R. M. & Deci, E. L. (2000). Intrinsic and extrinsic motivations: Classis definitions and
new directions. Contemporary Educational Psychology, 25, 54-67.
doi: 10.1006/ceps.1999.1020
Ryan, R. M., Mimms, V. & Koestner, R. (1983). Relation of reward contingency and
interpersonal context to intrinsic motivation: A review and test using cognitive
23
evaluation theory. Journal of Personality and Social Psychology, 45(4),736-750.
doi: 10.1037/0022-3514.45.4.736
Rydval, O., Ortmann, A. (2004). How financial incentives and cognitive abilities affect task
performance in laboratory settings: an illustration. Economics Letters, 85, 315-320.
Skinner, B. F. (1953). Science and human behaviour. New York: Macmillan.
van Dijk, F., Sonnemans, J. & van Winden, F. (1999). Incentive systems in a real effort
experiment. European Economic Review, 45, 187-214.
doi: 10.1016/S0014-2921(00)00056-8
24
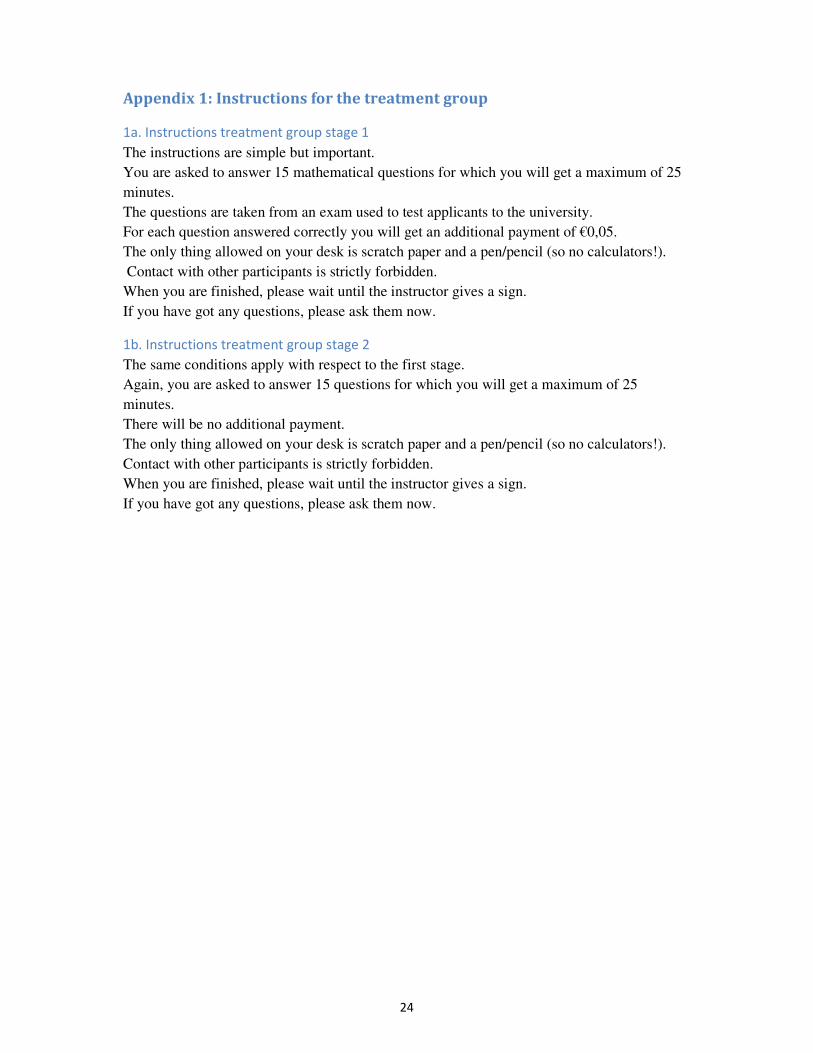
Appendix 1: Instructions for the treatment group
1a. Instructions treatment group stage 1
The instructions are simple but important.
You are asked to answer 15 mathematical questions for which you will get a maximum of 25
minutes.
The questions are taken from an exam used to test applicants to the university.
For each question answered correctly you will get an additional payment of €0,05.
The only thing allowed on your desk is scratch paper and a pen/pencil (so no calculators!).
Contact with other participants is strictly forbidden.
When you are finished, please wait until the instructor gives a sign.
If you have got any questions, please ask them now.
1b. Instructions treatment group stage 2
The same conditions apply with respect to the first stage.
Again, you are asked to answer 15 questions for which you will get a maximum of 25
minutes.
There will be no additional payment.
The only thing allowed on your desk is scratch paper and a pen/pencil (so no calculators!).
Contact with other participants is strictly forbidden.
When you are finished, please wait until the instructor gives a sign.
If you have got any questions, please ask them now.
25
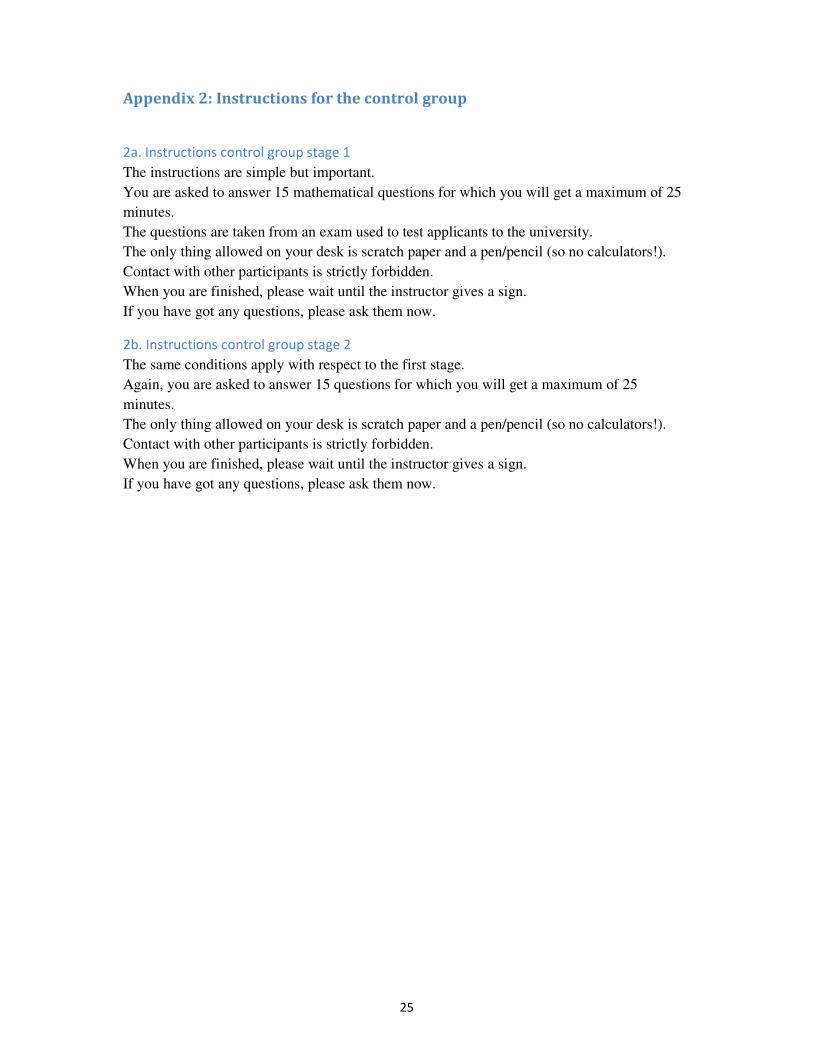
Appendix 2: Instructions for the control group
2a. Instructions control group stage 1
The instructions are simple but important.
You are asked to answer 15 mathematical questions for which you will get a maximum of 25
minutes.
The questions are taken from an exam used to test applicants to the university.
The only thing allowed on your desk is scratch paper and a pen/pencil (so no calculators!).
Contact with other participants is strictly forbidden.
When you are finished, please wait until the instructor gives a sign.
If you have got any questions, please ask them now.
2b. Instructions control group stage 2
The same conditions apply with respect to the first stage.
Again, you are asked to answer 15 questions for which you will get a maximum of 25
minutes.
The only thing allowed on your desk is scratch paper and a pen/pencil (so no calculators!).
Contact with other participants is strictly forbidden.
When you are finished, please wait until the instructor gives a sign.
If you have got any questions, please ask them now.
26
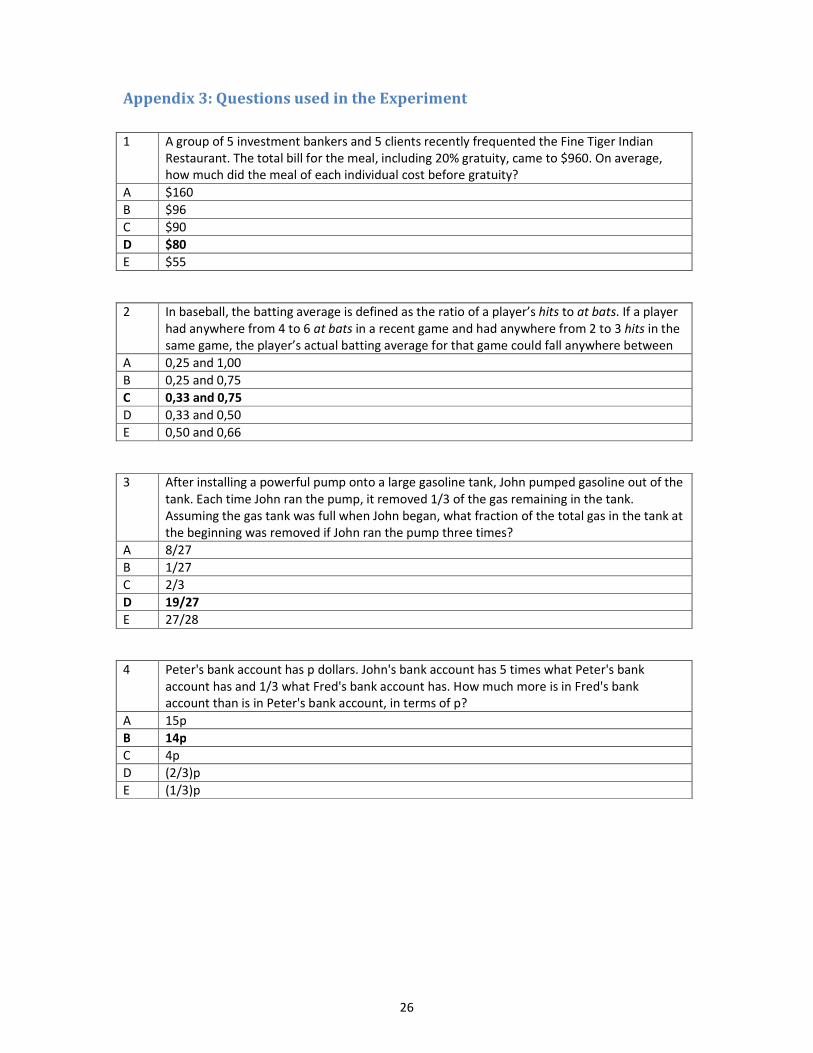
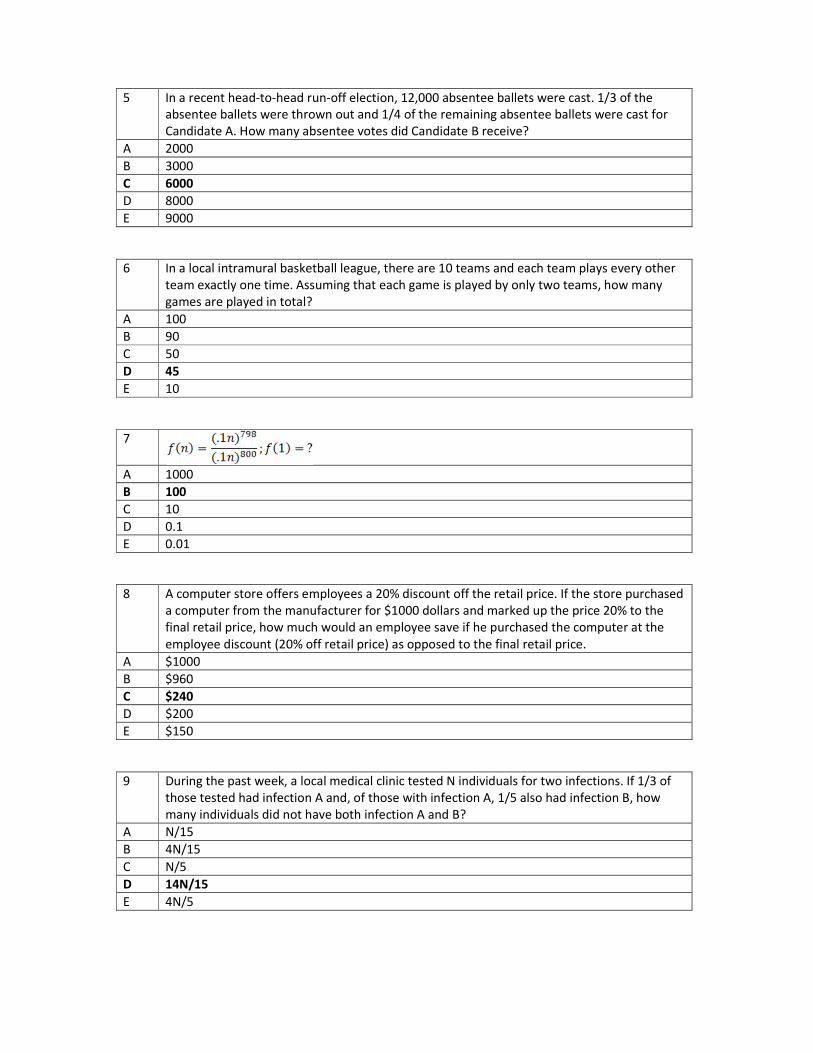
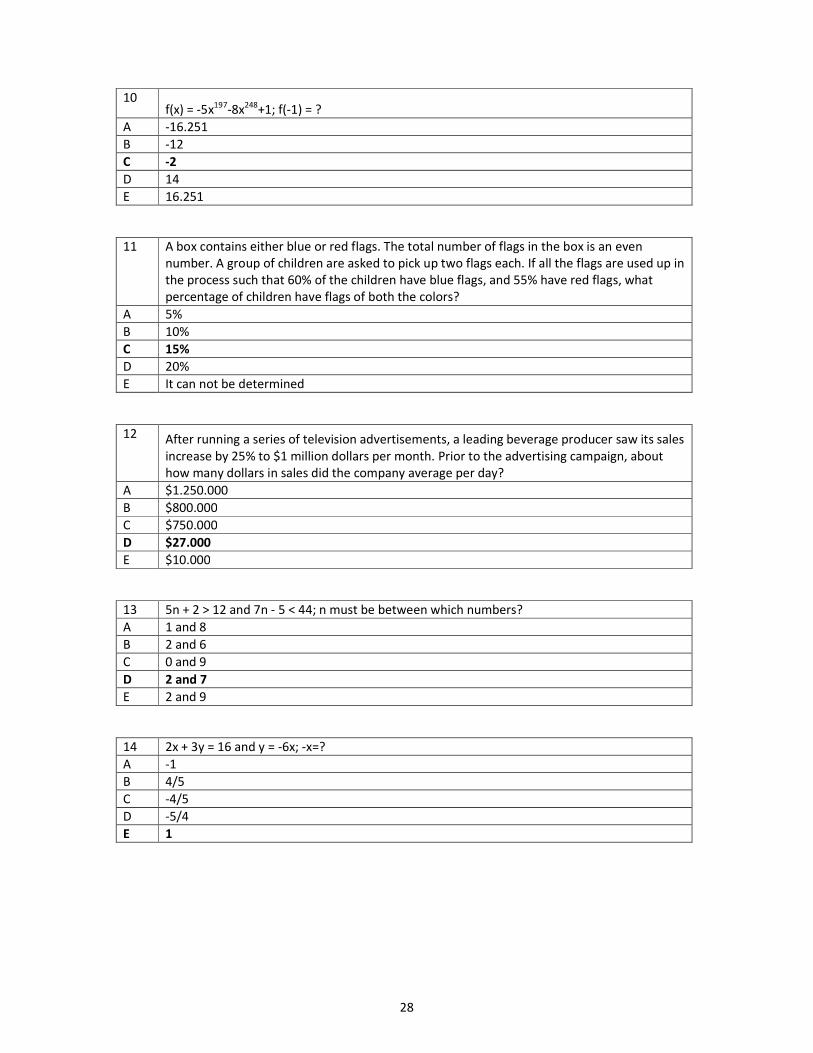
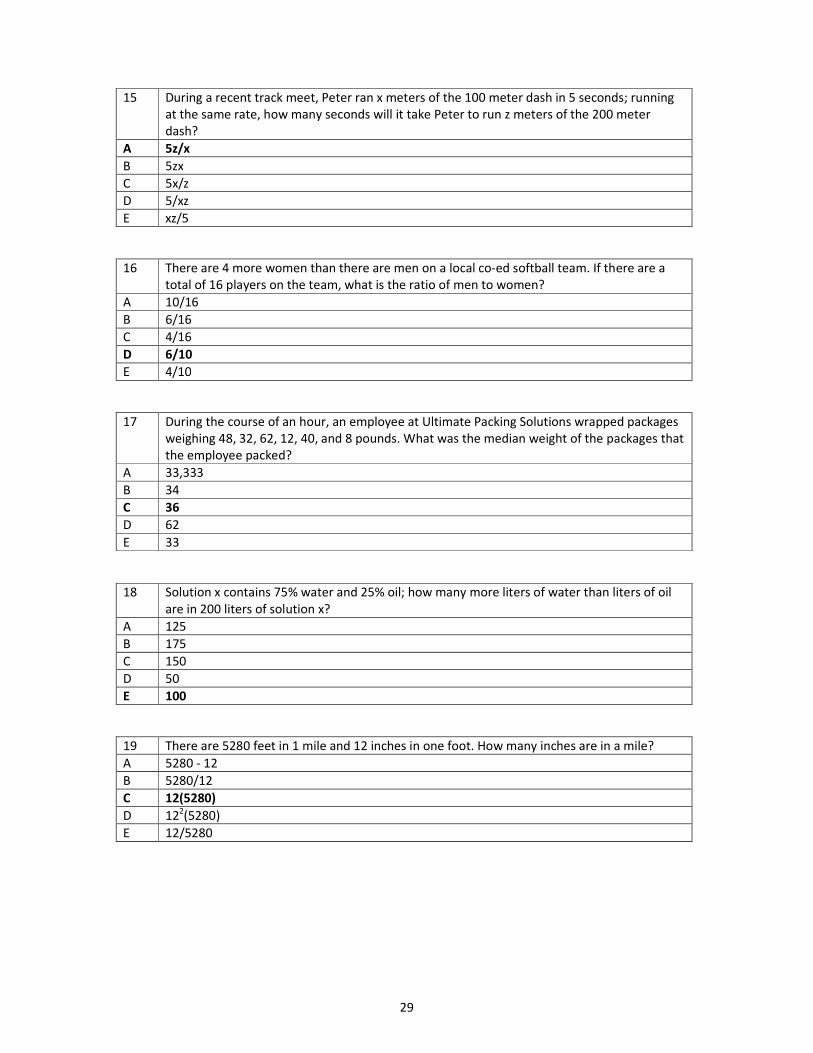
Appendix 3: Questions used in the Experiment
1 A group of 5 investment bankers and 5 clients recently frequented the Fine Tiger Indian
Restaurant. The total bill for the meal, including 20% gratuity, came to $960. On average,
how much did the meal of each individual cost before gratuity?
A $160
B $96
C $90
D $80
E $55
2 In baseball, the batting average is defined as the ratio of a player’s hits to at bats. If a player
had anywhere from 4 to 6 at bats in a recent game and had anywhere from 2 to 3 hits in the
same game, the player’s actual batting average for that game could fall anywhere between
A 0,25 and 1,00
B 0,25 and 0,75
C 0,33 and 0,75
D 0,33 and 0,50
E 0,50 and 0,66
3 After installing a powerful pump onto a large gasoline tank, John pumped gasoline out of the
tank. Each time John ran the pump, it removed 1/3 of the gas remaining in the tank.
Assuming the gas tank was full when John began, what fraction of the total gas in the tank at
the beginning was removed if John ran the pump three times?
A 8/27
B 1/27
C 2/3
D 19/27
E 27/28
4 Peter's bank account has p dollars. John's bank account has 5 times what Peter's bank
account has and 1/3 what Fred's bank account has. How much more is in Fred's bank
account than is in Peter's bank account, in terms of p?
A 15p
B 14p
C 4p
D (2/3)p
E (1/3)p
5 In a recent head-to-head run-off election, 12,000 absentee ballets were cast. 1/3 of the
absentee ballets were thrown out and 1/4 of the remaining absentee ballets were cast for
Candidate A. How many absentee votes did Candidate B receive?
A 2000
B 3000
C 6000
D 8000
E 9000
6 In a local intramural basketball league, there are 10 teams and each team plays every other
team exactly one time. Assuming that each game is played by only two teams, how many
games are played in total?
A 100
B 90
C 50
D 45
E 10
7
A 1000
B 100
C 10
D 0.1
E 0.01
8 A computer store offers employees a 20% discount off the retail price. If the store purchased
a computer from the manufacturer for $1000 dollars and marked up the price 20% to the
final retail price, how much would an employee save if he purchased the computer at the
employee discount (20% off retail price) as opposed to the final retail price.
A $1000
B $960
C $240
D $200
E $150
9 During the past week, a local medical clinic tested N individuals for two infections. If 1/3 of
those tested had infection A and, of those with infection A, 1/5 also had infection B, how
many individuals did not have both infection A and B?
A N/15
B 4N/15
C N/5
D 14N/15
E 4N/5
28
10 f(x) = -5x197-8x248+1; f(-1) = ?
A -16.251
B -12
C -2
D 14
E 16.251
11 A box contains either blue or red flags. The total number of flags in the box is an even
number. A group of children are asked to pick up two flags each. If all the flags are used up in
the process such that 60% of the children have blue flags, and 55% have red flags, what
percentage of children have flags of both the colors?
A 5%
B 10%
C 15%
D 20%
E It can not be determined
12 After running a series of television advertisements, a leading beverage producer saw its sales
increase by 25% to $1 million dollars per month. Prior to the advertising campaign, about
how many dollars in sales did the company average per day?
A $1.250.000
B $800.000
C $750.000
D $27.000
E $10.000
13 5n + 2 > 12 and 7n - 5 < 44; n must be between which numbers?
A 1 and 8
B 2 and 6
C 0 and 9
D 2 and 7
E 2 and 9
14 2x + 3y = 16 and y = -6x; -x=?
A -1
B 4/5
C -4/5
D -5/4
E 1
29
15 During a recent track meet, Peter ran x meters of the 100 meter dash in 5 seconds; running
at the same rate, how many seconds will it take Peter to run z meters of the 200 meter
dash?
A 5z/x
B 5zx
C 5x/z
D 5/xz
E xz/5
16 There are 4 more women than there are men on a local co-ed softball team. If there are a
total of 16 players on the team, what is the ratio of men to women?
A 10/16
B 6/16
C 4/16
D 6/10
E 4/10
17 During the course of an hour, an employee at Ultimate Packing Solutions wrapped packages
weighing 48, 32, 62, 12, 40, and 8 pounds. What was the median weight of the packages that
the employee packed?
A 33,333
B 34
C 36
D 62
E 33
18 Solution x contains 75% water and 25% oil; how many more liters of water than liters of oil
are in 200 liters of solution x?
A 125
B 175
C 150
D 50
E 100
19 There are 5280 feet in 1 mile and 12 inches in one foot. How many inches are in a mile?
A 5280 - 12
B 5280/12
C 12(5280)
D 122(5280)
E 12/5280
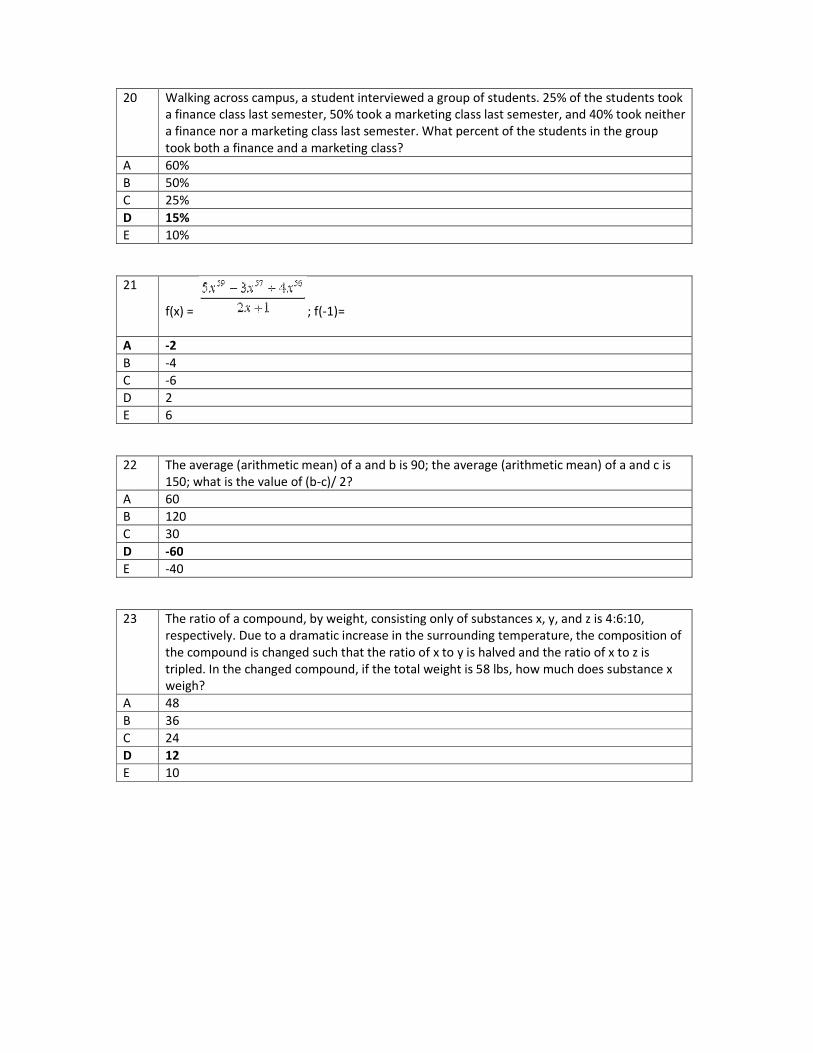
20 Walking across campus, a student interviewed a group of students. 25% of the students took
a finance class last semester, 50% took a marketing class last semester, and 40% took neither
a finance nor a marketing class last semester. What percent of the students in the group
took both a finance and a marketing class?
A 60%
B 50%
C 25%
D 15%
E 10%
21
f(x) = ; f(-1)=
A -2
B -4
C -6
D 2
E 6
22 The average (arithmetic mean) of a and b is 90; the average (arithmetic mean) of a and c is
150; what is the value of (b-c)/ 2?
A 60
B 120
C 30
D -60
E -40
23 The ratio of a compound, by weight, consisting only of substances x, y, and z is 4:6:10,
respectively. Due to a dramatic increase in the surrounding temperature, the composition of
the compound is changed such that the ratio of x to y is halved and the ratio of x to z is
tripled. In the changed compound, if the total weight is 58 lbs, how much does substance x
weigh?
A 48
B 36
C 24
D 12
E 10
31
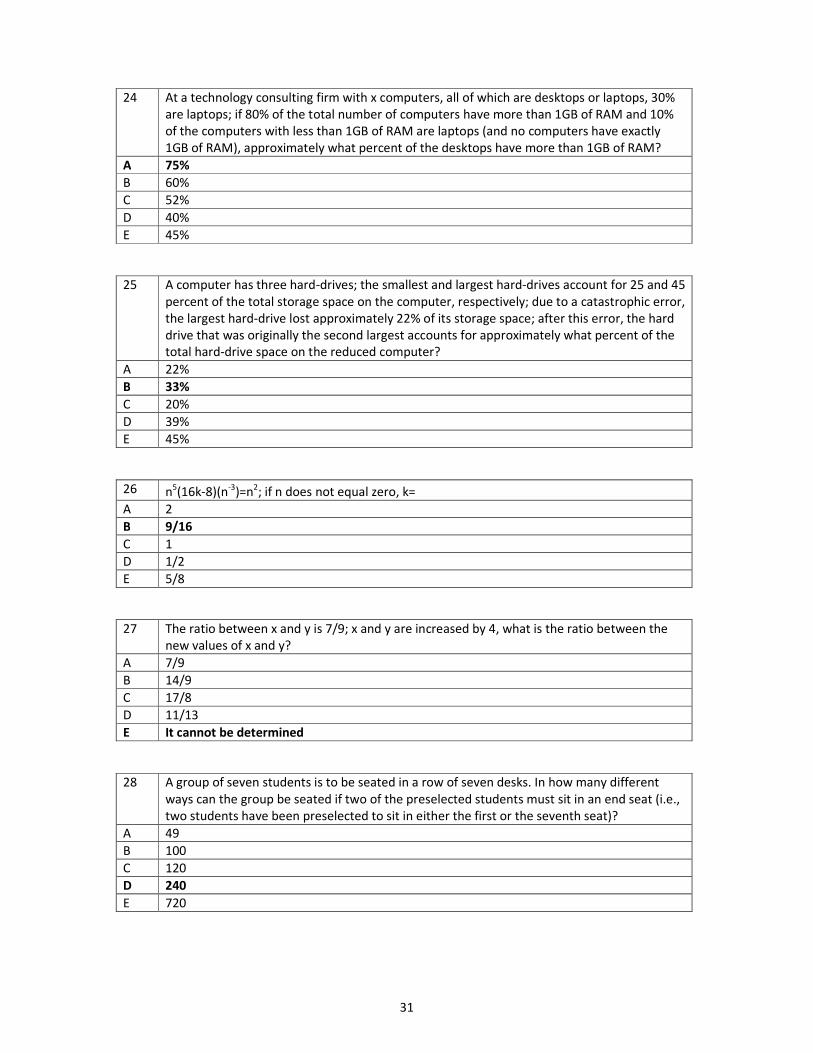
24 At a technology consulting firm with x computers, all of which are desktops or laptops, 30%
are laptops; if 80% of the total number of computers have more than 1GB of RAM and 10%
of the computers with less than 1GB of RAM are laptops (and no computers have exactly
1GB of RAM), approximately what percent of the desktops have more than 1GB of RAM?
A 75%
B 60%
C 52%
D 40%
E 45%
25 A computer has three hard-drives; the smallest and largest hard-drives account for 25 and 45
percent of the total storage space on the computer, respectively; due to a catastrophic error,
the largest hard-drive lost approximately 22% of its storage space; after this error, the hard
drive that was originally the second largest accounts for approximately what percent of the
total hard-drive space on the reduced computer?
A 22%
B 33%
C 20%
D 39%
E 45%
26 n5(16k-8)(n-3)=n2; if n does not equal zero, k=
A 2
B 9/16
C 1
D 1/2
E 5/8
27 The ratio between x and y is 7/9; x and y are increased by 4, what is the ratio between the
new values of x and y?
A 7/9
B 14/9
C 17/8
D 11/13
E It cannot be determined
28 A group of seven students is to be seated in a row of seven desks. In how many different
ways can the group be seated if two of the preselected students must sit in an end seat (i.e.,
two students have been preselected to sit in either the first or the seventh seat)?
A 49
B 100
C 120
D 240
E 720
32
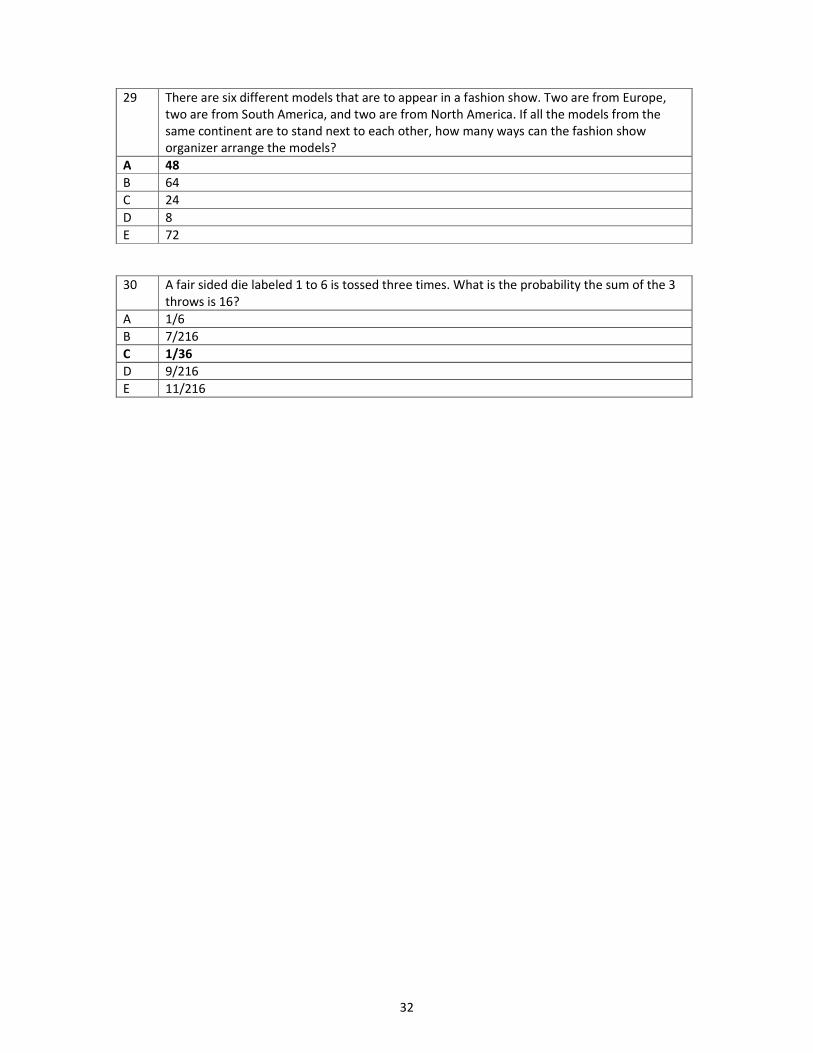
29 There are six different models that are to appear in a fashion show. Two are from Europe,
two are from South America, and two are from North America. If all the models from the
same continent are to stand next to each other, how many ways can the fashion show
organizer arrange the models?
A 48
B 64
C 24
D 8
E 72
30 A fair sided die labeled 1 to 6 is tossed three times. What is the probability the sum of the 3
throws is 16?
A 1/6
B 7/216
C 1/36
D 9/216
E 11/216