the effect of pulse structure on soft tissue laser ablation - CORE
207
THE EFFECT OF PULSE STRUCTURE ON SOFT TISSUE LASER ABLATION AT MID-INFRARED WAVELENGTHS By Mark A. Mackanos Dissertation Submitted to the Faculty of the Graduate School of Vanderbilt University in partial fulfillment of the requirements for the degree of DOCTOR OF PHILOSOPHY in BIOMEDICAL ENGINEERING December, 2004 Nashville, Tennessee Approved: Professor Robert L. Galloway Jr. Professor Richard F. Haglund Jr. Professor E. Duco Jansen Professor Anita Mahadevan-Jansen Professor Karen M. Joos
-
Upload
khangminh22 -
Category
Documents
-
view
2 -
download
0
Transcript of the effect of pulse structure on soft tissue laser ablation - CORE

THE EFFECT OF PULSE STRUCTURE ON SOFT TISSUE LASER ABLATION
AT MID-INFRARED WAVELENGTHS
By
Mark A. Mackanos
Dissertation
Submitted to the Faculty of the
Graduate School of Vanderbilt University
in partial fulfillment of the requirements
for the degree of
DOCTOR OF PHILOSOPHY
in
BIOMEDICAL ENGINEERING
December, 2004
Nashville, Tennessee
Approved:
Professor Robert L. Galloway Jr.
Professor Richard F. Haglund Jr.
Professor E. Duco Jansen
Professor Anita Mahadevan-Jansen
Professor Karen M. Joos

ACKNOWLEDGEMENTS
First, I would like to thank my dissertation committee for the support and help
throughout the completion of this research. Especially, to my advisor, Duco Jansen, I am
very grateful for your support, encouragement, and friendship throughout my graduate
career. Your guidance and seemingly unending wealth of knowledge has been greatly
appreciated throughout the years.
I would like to thank the FEL staff, especially John Kozub, for his help in all
things research related and otherwise and for the numerous lengthy midnight discussions
on a variety of topics. The entire staff of the FEL center has been a wealth of knowledge
and support whenever it was needed. To Michelle Baltz-Knorr, for her help in
performing the mass spectrometry analysis and for being there to listen and understand
when I complained about FEL problems. I would like to thank Alan Schwettman and
Dmitri Simanovski at Stanford University, for their help and guidance in performing the
OPO experiments. In addition, I would like to thank Dave Piston, for his work in
supporting my research.
I would also like to thank the other member of the Biomedical Optics Lab and my
fellow officemates for their friendship and support. Finally, I would like to thank my
parents and family for giving me the tools and support throughout life, which has allowed
me to reach this goal.
ii

TABLE OF CONTENTS
Page
ACKNOWLEDGEMENTS................................................................................................ ii
LIST OF FIGURES ........................................................................................................... vi
LIST OF TABLES........................................................................................................... viii
Chapter I. INTRODUCTION ...................................................................................................1 1.1: Introduction and Motivation ............................................................................2 1.2: Specific Aims...................................................................................................6 1.3: References........................................................................................................9 II. BACKGROUND ...................................................................................................13 2.1: Significance ...................................................................................................14 2.2: Tissue Interactions at 6.45 µm.......................................................................14
2.3: Effect of Pulse Duration/ Pulse Structure on Ablation ..................................16 2.3.1: Vanderbilt Mark-III Free Electron Laser........................................17 2.3.2: Pulse-stretched FEL........................................................................17 2.3.3: Optical Parametric Oscillators ........................................................19 2.3.4: Strontium Vapor Laser....................................................................19 2.4: Ablation .........................................................................................................20 2.4.1: Phase Diagrams...............................................................................21 2.4.2: Surface Vaporization ......................................................................22 2.4.3: Normal Boiling ...............................................................................22 2.4.4: Phase Explosions ............................................................................23 2.5: Precise Tissue Ablation .................................................................................24 2.6: Ablation with the FEL ...................................................................................24 2.7: Thermomechanical Response of Tissue to Pulsed Irradiation.......................25 2.7.1: Thermal Confinement .....................................................................25 2.7.2: Stress Confinement .........................................................................26 2.8: Ablation Plume Dynamics .............................................................................29 2.9: Ablation Metrics ............................................................................................32 2.9.1: Ablation Threshold .........................................................................32 2.9.2: Ablation Efficiency.........................................................................33 2.10: Mid-infrared Beam Delivery .......................................................................33 2.11: Significance .................................................................................................34 2.12: References....................................................................................................35
iii

III. EFFECT OF MICROPULSE DURATION ON MID-INFRARED TISSUE
ABLATION USING A STRETCHED FREE ELECTRON LASER PULSE TRAIN ...................................................................................................................38
3.1: Abstract..........................................................................................................39 3.2: Introduction....................................................................................................40 3.3: Methods .........................................................................................................43 3.3.1: The FEL Pulse Stretcher ..............................................................43 3.3.2: Ablation Threshold Determination ..............................................47 3.3.3: Ablated Crater Depth Measurement ............................................52 3.4: Results and Discussion ..................................................................................53 3.4.1: Ablation Threshold Determination .................................................53 3.4.2: Ablated Crater Depth Measurement ...............................................57 3.5: Conclusions....................................................................................................63 3.6: References......................................................................................................65 IV. THE EFFECT OF FREE ELECTRON LASER PULSE STRUCTURE ON THE
MECHANISM OF SOFT-TISSUE ABLATION AT MID-INFRARED WAVELENGTHS .................................................................................................67
4.1: Abstract..........................................................................................................68 4.2: Introduction....................................................................................................69 4.3: Methods .........................................................................................................72 4.3.1: Brightfield Imaging.........................................................................72 4.3.2: Histological Analysis......................................................................74 4.3.2.1: Canine Cornea..................................................................75 4.3.2.2: Mouse Dermis..................................................................77 4.3.3: Mass Spectroscopic Protein Analysis .............................................78 4.4: Results and Discussion ..................................................................................81 4.4.1: Brightfield Imaging.........................................................................82 4.4.2: Histological Analysis......................................................................85 4.4.2.1: Canine Cornea..................................................................86 4.4.2.2: Mouse Dermis..................................................................90 4.4.3: Mass Spectrometry .........................................................................93 4.5: Conclusions....................................................................................................95 4.6: References......................................................................................................96 V. COMPARISON OF ZnGeP2 OPTICAL PARAMETRIC OSCILLATOR AND
MARK-III FREE ELECTRON LASER FOR MID-INFRARED LASER ABLATION OF SOFT TISSUE............................................................................99
5.1: Abstract........................................................................................................100 5.2: Introduction..................................................................................................101 5.3: Methods .......................................................................................................105 5.3.1: Mark-III Free Electron Laser........................................................105
iv

5.3.2: Er:YAG pumped ZnGeP2 Optical Parametric Oscillator .............106 5.3.3: Ablation Threshold Determination ...............................................107 5.3.4: Ablated Crater Depth Measurements............................................110 5.3.5: Brightfield Imaging.......................................................................112 5.4: Results and Discussion ................................................................................115 5.4.1: Ablation Threshold Determination ...............................................115 5.4.2: Ablated Crater Depth Measurements............................................119 5.4.3: Brightfield Imaging.......................................................................125 5.5: Conclusions..................................................................................................130 5.6: References....................................................................................................132 VI. CONCLUSIONS AND FUTURE DIRECTIONS...............................................135 6.1: Summary......................................................................................................136 6.2: Future Directions .........................................................................................142 6.3: References....................................................................................................143 Appendix A. ABLATION OF SOFT TISSUE AT 6.45 µM USING A STRONTIUM VAPOR
LASER.................................................................................................................144 B. DELIVERY OF MID-INFRARED (6-7 µM) LASER RADIATION IN A
LIQUID ENVIRONMENT USING INFRARED-TRANSMITTING OPTICAL FIBERS................................................................................................................160
v

LIST OF FIGURES
Page Figure 2.1: Temperature v. Pressure of the Thermodynamic Phase Diagram..................21 Figure 2.2: Conditions for Stress, Thermal, and No Confinement ...................................28 Figure 3.1: Diagram of the Pulse Stretcher.......................................................................45 Figure 3.2: Relative Intensity and Duration of 1, 100, and 200 ps micropulses...............46 Figure 3.3: FEL Fast-Spectrometer Data ..........................................................................48 Figure 3.4: Ablation Threshold of Water vs. Mouse Dermis at 6.1 µm, 200 ps...............54 Figure 3.5: Results of Ablation Threshold Analysis for Pulse Stretched FEL .................55 Figure 3.6a: Pulse Stretched FEL Crater Depth on Gelatin at 6.1 µm .............................58 Figure 3.6b: Pulse Stretched FEL Crater Depth on Mouse Dermis at 6.1 µm .................59 Figure 3.7a: Pulse Stretched FEL Crater Depth on Gelatin at 6.45 µm ...........................61 Figure 3.7b: Pulse Stretched FEL Crater Depth on Mouse Dermis at 6.45 µm ...............62 Figure 4.1a: Illustration of Histological Analysis on Canine Cornea...............................76 Figure 4.1b: Illustration of Histological Analysis on Mouse Dermis...............................79 Figure 4.2: Pulse Stretched FEL Brightfield Imaging at 6.1 µm......................................83 Figure 4.3: Pulse Stretched FEL Brightfield Imaging at 6.45 µm....................................84 Figure 4.4: Results of Histological Analysis on Canine Cornea ......................................87 Figure 4.5: Quantitative Thermal Analysis of Canine Cornea .........................................89 Figure 4.6: Results of Histological Analysis on Mouse Dermis.......................................91 Figure 4.7: Quantitative Thermal Analysis of Mouse Dermis..........................................92 Figure 4.8: MALDI Mass Spectrometry Results ..............................................................94 Figure 5.1: Brightfield Imaging Setup ............................................................................113
vi

Figure 5.2: Ablation Threshold Analysis for ZGP-OPO vs. FEL...................................116 Figure 5.3: Crater Depth Analysis for ZGP-OPO vs. FEL on Gelatin ...........................120 Figure 5.4: Crater Depth Analysis for ZGP-OPO on Mouse Dermis .............................122 Figure 5.5: Crater Depth vs. Spotsize for Constant Irradiance .......................................124 Figure 5.6: Brightfield Imaging for ZGP-OPO vs. FEL at 6.1 µm.................................127 Figure 5.7: Brightfield Imaging for ZGP-OPO vs. FEL at 6.45 µm...............................128 Figure 5.8: Brightfield Imaging for ZGP-OPO vs. FEL at 6.73 µm...............................129 Figure A.1: Strontium Vapor Pulse Profile.....................................................................148 Figure A.2: Theoretical Diffraction Limited Spotsize for Strontium Vapor Laser ........149 Figure A.3: Brightfield Imaging of Strontium Vapor Laser ...........................................150 Figure A.4: Gross Images of Bovine Muscle Irradiated with the Strontium Vapor .......151 Figure B.1: FTIR Spectra of Perfluorocarbon Liquids ...................................................175 Figure B.2: FTIR Spectra of Perfluorodecalin and Saline..............................................176 Figure B.3: Absorption Coefficients of PFCL’s at Three Target Wavelengths .............177 Figure B.4: Chronicle of Ablation for Water at 6.45 µm ...............................................179 Figure B.5: Chronicle of Ablation for PF-5060 at 6.45 µm ...........................................180 Figure B.6: Chronicle of Ablation for Perfluorodecalin at 6.45 µm...............................181 Figure B.7: Ablation of Gelatin through Perfluorodecalin at 2.94 µm...........................183 Figure B.8: Ablation of Gelatin through Perfluorodecalin at 6.45 µm...........................184 Figure B.9: Effect of Multiple pulses on Crater Drilling Through Perfluorodecalin .....185 Figure B.10: Ablation Depth vs Number of Pulses Delivered Under Perfluorodecalin.186
vii

LIST OF TABLES
Page Table 5.1: Ablation Parameters for FEL and ZGP-OPO ................................................104 Table A.1: Performance of Strontium Vapor Laser at Different Frequencies................154 Table B.1: Physical Properties of Perfluorocarbon Liquids ...........................................170 Table B.2: Physical Properties of Silver Halide and Arsenic Sulfide Fibers..................173
viii

CHAPTER I
INTRODUCTION
Mark Andrew Mackanos
Department of Biomedical Engineering
Vanderbilt University
Nashville, Tennessee 37235
1

1.1 Introduction and Motivation
A clinically viable application of pulsed laser ablation was not reported until the
early 1970’s [1]. It was only at the beginning of the 1980’s that lasers were routinely
used for ophthalmic dissection and ablation procedures [2]. In other medical
subspecialties, routine laser use did not occur until the mid-1980’s [2-5]. The delay
between the invention of the laser and its successful clinical application was due largely
to a lack of understanding of the fundamental mechanisms that govern laser-tissue
interactions and a lack of having the correct laser parameters. Currently, medical
procedures that employ pulsed lasers are present in nearly every medical subspecialty; for
many ophthalmologists and dermatologists, lasers are considered essential tools for
medical practice [6]. Nevertheless, in many cases, the laser parameters used are
determined by the physical limitations of conventional laser devices and empirical studies
of laser tissue interaction. Lasers have tremendous potential as high precision surgical
devices owing to their ability to be focused to a small spot size and the ability to select
wavelengths that are either strongly or selectively absorbed in the target tissue. The goal
of laser ablation is to remove a defined volume of tissue while leaving the adjacent tissue
biologically viable [7, 8]. While numerous ablation modes and interaction mechanisms
exist, tissue ablation in eloquent structures of the body, such as brain or eye, requires
precise ablation of the target tissue while minimizing collateral damage to adjacent tissue
structures. The elements required for an understanding of the process of tissue ablation
include: tissue optics, non-equilibrium thermodynamics, photochemistry, plasma physics,
biomechanics, and many others. In addition, the biology of wound healing is an
important parameter, because, the tissue that is left behind after the ablation process has
2

stopped needs to remain viable. The viability of this remaining tissue is of great
importance in determining the effectiveness of ablation.
Ablation can be distinguished in two general categories: first, physiological
ablation occurs where no tissue removal takes place but biological function is halted, i.e.
coagulation, hyperthermia etc.; the second, classical or physical ablation can be defined
as any process that involves the incision or removal of tissue, regardless of the
photophysical or photochemical processes involved [6]. Pulsed laser tissue ablation is
driven by the kinetics of phase transitions and/or the photochemical decomposition.
Consideration of these processes leads to an understanding of the crucial role of tissue
ejection in the ablation process [6]. For ablation in an air environment, the dynamics of
the ablation plume, consisting of vaporized and ejected material, and the role of the
plume in modifying the amount of energy that reaches the tissue must be considered.
Metrics such as ablation threshold, ablation enthalpy, and ablation efficiency have been
classically employed to characterize the ablation process [6].
Lasers in both the ultraviolet and the infrared range of the spectrum have the
potential for carrying out precise ablation in biological tissues due to the strong
absorption at these wavelengths. Excimer lasers, which operate in the ultraviolet range
have proven to be particularly adept at carrying out effective tissue ablation in corneal
stroma [9]; however, concerns about the potential mutagenic effects of ultraviolet
radiation have limited applications to other tissues; in addition, this light cannot be
delivered via fiber optics. As an alternative to this mutagenic potential, mid-infrared
wavelengths have been investigated [7, 10, 11]. Infrared laser ablation aims to achieve
3

the precise removal of tissue where peripheral tissue is free from chemical, thermal, and
mechanical damage [12].
A series of experimental investigations have demonstrated that targeting a mid-
infrared Mark-III Free-Electron Laser to wavelengths near 6.45 µm results in tissue
ablation with minimal collateral damage and a substantial ablation rate, useful for human
surgery. Wavelengths near 6.45 µm couple into the spectral wing of the bending mode of
water centered at 6.1 µm as well as the amide-II vibrational mode centered at 6.45 µm
[7]. Thermodynamic reasoning suggests that the reduction in collateral damage at this
wavelength is due to the differential absorption, which causes compromised tissue
integrity by laser heating of the non-aqueous components prior to explosive vaporization
[7, 13]. These properties are advantageous for surgery because they reduce the structural
integrity of the tissue, thus reducing amount of energy needed for ablation. Based on
these findings, the Mark-III FEL has been used successfully in human neurosurgery and
ophthalmic surgery [7, 14-17]. While the Mark-III FEL has been used in eight human
surgeries to date, it is unlikely that this laser will, nor was it intended to, ever become
broadly used clinically due to its expense and difficult implementation. Recent
developments in conventional laser technology have provided access to this wavelength
[18-28]. While the average power and peak power of these sources are still not quite
equivalent to the FEL, recent data on these novel sources indicates that ablation studies
are feasible [26, 27]. This specific wavelength can currently be achieved with
commercial optical parametric oscillators (OPO) and experimental strontium vapor
lasers. The research described here aims to investigate the feasibility of these alternative
sources as viable replacements for the FEL. Relevant ablation parameters will be
4

compared with the body of research already completed with the FEL, which has proven
to have much promise for effective infrared laser ablation. Studies have shown that mid-
infrared laser ablation at λ=6.45 µm is most effective in neural tissue [29-31]. Other
studies involving the FEL have shown that 6.1 µm is most effective on cornea and similar
to 6.45 µm on optic nerve [14-16], while 7.2-7.4 and 7.6-7.8 µm is most effective on skin
[32].
One of the attractive features of using light in surgical applications is the delivery
of the light through optically transmitting fibers. These fibers are small in size, which
enables minimally invasive surgical techniques (MIS). To date, technology has placed
significant limits on the use of optical fibers to transmit the laser wavelengths most
suitable for precise tissue ablation in air, 193 nm (ArF excimer), 248 nm (KrF excimer),
2.79 µm (Er:YSSG), 2.94 µm (Er:YAG), and 10.6 µm (CO2). Therefore, other
wavelengths are commonly used that are well transmitted through regular, low-OH,
quartz fibers which have a transmission range from 400 – 2500 nm: λ=308 nm (XeCl
excimer), 2.01 µm (Cr:Tm:YAG), and 2.12 µm (Cr:Tm:Ho:YAG) [6]. Currently, beam
delivery of mid-IR light is typically accomplished using an open beam, hollow wave-
guides, or an articulated arm. While an open beam and an articulated arm have no
problem with internal light losses, they are not practical for MIS applications, since they
require an open path to the target. Hollow wave-guides are more practical for MIS
applications, they are subject to high losses in the mid-IR (up to 50% due mostly to
coupling), especially when bent [17, 33-35]. Therefore, a need exists for IR transmitting
optical fibers. Recent studies in our lab, in which we compared several IR transmitting
fibers, have proven the use of silver halide optical fibers as a viable delivery method for
5

MIS applications[36] see also: Appendix A of this thesis. This is especially important to
facilitate the clinical use of the alternative non-FEL sources as they become available.
This research encompasses a set of experiments designed to determine the
viability of non-FEL laser sources capable of delivering 6.1, 6.45, and 6.73 µm laser light
in a clinical setting. To achieve a thorough understanding of the laser tissue interactions
and, in particular, the role of several key laser parameters, it was necessary to study the
effects of laser ablation using traditional histological analysis and physical metrics. A
viable alternative will be defined by relevant ablation yield for clinical applications with
minimal collateral damage, similar to or better than that observed with the FEL or other
commonly used non-FEL sources such as the Er:YAG. This research focuses on
identifying the importance of a number of key parameters on the process of mid-infrared
ablation with respect to wavelength, pulse structure, and energy. As a result of this
research a viable alternative to the FEL with more clinical relevance remains a distinct
possibility.
1.2 Specific Aims
The objectives of this research were to study the use of mid-infrared light,
specifically 6.1, 6.45, and 6.73 µm in wavelength, as a tool for tissue micromachining.
Specifically, we wanted to determine the importance of the unique FEL micropulse
structure on the process of mid-infrared soft-tissue ablation as we move towards the
development of alternative sources. We studied tissue ablation with different FEL pulse
structures and conventional lasers (OPO and Strontium Vapor) operating at 6.1, 6.45, and
6.73 µm for comparison with the Mark-III FEL in an effort to determine if another laser
6

source is capable of the efficient ablation and minimal collateral damage of the FEL in
soft tissue. The use of a more conventional laser source is required for the transfer of this
technology into common clinical practice.
The research project comprises the following specific aims:
Aim 1. Investigate the effects of pulse structure on the ablation process by varying the
FEL pulse structure and comparing the results of tissue interaction experiments
with the original pulse structure at 6.1 and 6.45 µm in wavelength for applications
of tissue micromachining. The effect of pulse structure on the process of ablation
was studied by changing the native micropulse structure of the Mark-III FEL
through the use of a pulse stretcher. Physical metrics, including the ablation
threshold, the ablated crater depth, and bright-field imaging of the ablation
dynamics in an air environment, were studied in chapter 3 and 4. The tissue
effects of 6.1 and 6.45 µm laser light on cornea and skin through the application
of the clinical gold standard of histology were also investigated. Histology
provides an accepted measure of collateral damage and efficiency due to tissue
ablation. In addition, mass spectrometry was applied to proteins to study the
effects of 6.45 µm laser radiation on the excision of the amide bond to determine
definitively the ablation mechanism in tissue (Chapter 4).
Aim 2. Perform fundamental ablation studies to compare alternative laser sources to the
FEL at λ= 6.1 and 6.45 µm with similar parameters for applications of tissue
micromachining. By studying alternative sources, a better understanding of the
mechanism of ablation at these wavelengths was determined. Ablation
experiments to determine ablation threshold, ablated crater depth, and bright-field
7

imaging of the ablation dynamics in an air environment, were applied to the
Mark-III FEL and ZnGeP2 OPO lasers with similar parameters (spot-size, energy,
repetition rate). The results of these experiments were compared with the results
that have already been obtained using the FEL with its native pulse structure to
determine whether a suitable bench top replacement for the FEL is a possibility.
The results of these experiments are described in chapter 5.
In addition to the research contained in the main body of this dissertation, a great deal of
related research was also performed and has been presented in the appendix.
Appendix A: Ablation of soft tissue at 6.45 µm using a strontium vapor laser
This manuscript describes a set of experiments performed by these authors that involved
the use of a strontium vapor laser and was published in the Proceedings of SPIE[37].
This laser is being developed as a potential alternative to the FEL in a collaborative
project between Professor A. N. Soldatov (Tomsk State University, Tomsk, Russia),
Pulslight Inc. (Sophia, Bulgaria), and the W. M. Keck Foundation Free Electron Laser
Center as a potential alternative to the FEL. We were able to characterize the current
state of this laser with regards to its operating parameters; specifically, the pulse energy,
repetition rate, relative fraction of output wavelength, and beam mode (minimum
spotsize). We were also able to perform bright-field imaging and simple macroscopic
analysis of ablation on tissue. The results of this preliminary analysis are presented in
this appendix.
8

Appendix B: Delivery of midinfrared (6 to 7 µm) laser radiation in a liquid environment using infrared-transmitting optical fibers This manuscript describes experiments performed to investigate the potential delivery
methods of mid-infrared (6-7 µm) light to tissues for potential minimally invasive
surgical applications and was published in the Journal of Biomedical Optics [36]. While
this manuscript was not the primary focus of the research in this dissertation, it is an
integral part of the development and translation of a mid-infrared ablation laser to the
clinical arena. It is essential to have fiber optic delivery methods available for these
wavelengths in order for this technology to have clinical relevance. This manuscript
looks at the current state-of-the-art with respect to the fiber delivery technology available
for mid-infrared light delivery. In addition, many potential minimally invasive surgical
applications involve the delivery of light in a liquid environment. Due to the high
absorption of the mid-infrared in water (saline), we looked at potential replacements for
water in such an environment. The application on which we focused was the use of
perfluorocarbon liquids as potential vitreous substitutes for retinal surgical applications.
The effectiveness of various perfluorocarbon liquids for this application was
characterized in this manuscript.
1.3 REFERENCES
1. Krasnov, M.M., Laseropuncture of Anterior Chamber Angle in Glaucoma. American Journal of Ophthalmology, 1973. 75(4): p. 674-678.
2. Krauss, J.M., C.A. Puliafito, and R.F. Steinert, Laser Interactions With the
Cornea. Survey of Ophthalmology, 1986. 31(1): p. 37-53. 3. Hillenkamp, F., Lasers in Biology and Medicine, in Lasers in Biology and
Medicine, F. Hillenkamp, R. Pratesi, and C.A. Sacchi, Editors. 1980, Plenum Press: New York. p. 37.
9

4. Srinivasan, R., Ablation of Polymers and Biological Tissue by Ultraviolet-Lasers.
Science, 1986. 234(4776): p. 559-565. 5. Srinivasan, R. and B. Braren, Ultraviolet-Laser Ablation of Organic Polymers.
Chemical Reviews, 1989. 89(6): p. 1303-1316. 6. Vogel, A. and V. Venugopalan, Mechanisms of pulsed laser ablation of biological
tissues. Chem Rev, 2003. 103(2): p. 577-644. 7. Edwards, G.S., M.S. Hutson, and S. Hauger, Heat Diffusion and Chemical
Kinetics in Mark-III FEL Tissue Ablation. SPIE, Commercial and Biomedical Application of Ultrafast and Free-Electron Lasers, 2002. 4633: p. 184-193.
8. Welch, A.J., et al., Laser thermal ablation. Photochem Photobiol, 1991. 53(6): p.
815-23. 9. Srinivasan, R., Ablation of Polymers and Biological Tissue By Ultraviolet-
Lasers. Science, 1986. 234(4776): p. 559-565. 10. Walsh, J.T. and T.F. Deutsch, Pulsed Co2-Laser Ablation of Tissue - Effect of
Mechanical- Properties. Ieee Transactions On Biomedical Engineering, 1989. 36(12): p. 1195-1201.
11. Wolbarsht, M.L., Laser-Surgery - CO2 or HF. IEEE Journal of Quantum
Electronics, 1984. 20(12): p. 1427-1432. 12. Edwards, G., et al., Comparison of OPA and Mark-III FEL for Tissue Ablation at
6.45 Microns. SPIE, Commercial and Biomedical Application of Ultrafast and Free-Electron Lasers, 2002. 4633: p. 194-201.
13. Hutson, M.S., S.A. Hauger, and G. Edwards, Thermal diffusion and chemical
kinetics in laminar biomaterial due to heating by a free-electron laser. Physical Review E, 2002. 65(6): p. Art. No.-061906.
14. Joos, K.M., et al., Free Electron Laser (FEL) laser-tissue interaction with human
cornea and optic nerve. in: Ophthalmic Technologies VI, J-M Parel, K. M. Joos, P. O. Rol (eds), SPIE, Bellingham, 1996. 2673: p. 89-92.
15. Joos, K.M., et al., Optic nerve sheath fenestration with a novel wavelength
produced by the free electron laser (FEL). Lasers Surg Med, 2000. 27(3): p. 191-205.
16. Joos, K.M., et al., Acute optic nerve sheath fenestration in humans using the free
electron laser (FEL): a case report. in: Ophthalmic Technologies XII, F. Manns, P. Soderberg and A. Ho (eds), SPIE, Bellingham, WA, 2002. 4611: p. 81-85.
10

17. Edwards, G.S., et al., Free electron laser based biophyscal and biomedical
instrumentation. Review of Scientific Instrumentation, 2003. 74(7): p. 3207-3245. 18. Catella, G.C., et al., IR laser/OPO systems for biomedical and chemical sensing.
IEEE, LEOS, 2002. 2: p. 504-505. 19. Ganikhanov, F., T. Caughey, and K.L. Vodopyanov, Narrow-linewidth middle-
infrared ZnGeP2 optical parametric oscillator. Journal of the Optical Society of America B-Optical Physics, 2001. 18(6): p. 818-822.
20. Loveland, D.G., et al., Design of a 1.7-W Stable Long-Lived Strontium Vapor
Laser. Measurement Science & Technology, 1991. 2(11): p. 1083-1087. 21. Loveland, D.G. and C.E. Webb, Measurement of the Electron-Density in a
Strontium Vapor Laser. Journal of Physics D-Applied Physics, 1992. 25(4): p. 597-604.
22. Pan, B.L., Z.X. Yao, and G. Chen, A discharge-excited SrBr2 vapour laser.
Chinese Physics Letters, 2002. 19(7): p. 941-943. 23. Pan, B.L., et al., Emission of laser pulses due to transitions from metastable to
metastable levels in strontium vapor. Applied Physics B-Lasers and Optics, 2003. 76(4): p. 371-374.
24. Platonov, A.V., A.N. Soldatov, and A.G. Filonov, Pulsed Strontium Vapor Laser.
Sov. J. Quantum Electron., 1978. 8(1): p. 120-121. 25. Platonov, A.V., A.N. Soldatov, and A.G. Filonov, Strontium-Vapor Pulsed Laser.
Kvantovaya Elektronika, 1978. 5(1): p. 198-201. 26. Shori, R.K., et al., High Energy AgGaSe2 Optical Parametric Oscillator
Operating in 5.7 -7 µm Region. IEEE, 2000: p. 179-181. 27. Vodopyanov, K.L., et al., ZnGeP2 optical parametric oscillator with 3.8-12.4-mu
m tunability. Optics Letters, 2000. 25(11): p. 841-843. 28. Walter, W.T., et al., Efficient Pulsed Gas Discharge Lasers. IEEE Journal of
Quantum Electronics, 1966. QE 2(9): p. 474-&. 29. Tribble, J., et al., Dynamics of gelatin ablation due to free-electron-laser
irradiation. Phys Rev, 1997. E 55: p. 7385-7389. 30. Uhlhorn, S.R., et al., Tissue ablation with the free-electron laser: contributions of
wavelength and pulse structure. in: Laser-Tissue Interaction X, Jacques SL,
11

Mueller GJ, Roggan A, Sliney DH (eds), SPIE, Bellingham, 1999. 3601: p. 356-61.
31. Edwards, G., et al., Tissue ablation by a free-electron laser tuned to the amide II
band. Nature, 1994. 371(6496): p. 416-9. 32. Ellis, D.L., et al., Free electron laser wavelengh specificity for cutaneous
contraction. Lasers in Surgery and Medicine, 1999. 25: p. 1-7. 33. Pratisto, H.S., et al., Clinical beam delivery of the Vanderbilt FEL: design and
performance of a hollow waveguide - based handheld probe for neurosurgery. in: Specialty Fiber Optics for Medical Applications, A. Katzir; J.A. Harrington (eds), 1999. 3596: p. 55-61.
34. Shen, J.H., et al., Hollow-glass waveguide delivery of an infrared free electron
laser for microsurgical applications. Appl Optics, 2001. 40(4): p. 583-7. 35. Pratisto, H.S., S.R. Uhlhorn, and E.D. Jansen, Beam delivery of the Vanderbilt
Free Electron Laser with hollow wave guides: effect on temporal and spatial pulse propagation. Fiber and Integrated Optics, 2000. 20(1): p. 83-94.
36. Mackanos, M.A., et al., Delivery of midinfrared (6 to 7-mu m) laser radiation in a
liquid environment using infrared-transmitting optical fibers. Journal of Biomedical Optics, 2003. 8(4): p. 583-593.
37. Mackanos, M.A., et al., Ablation of soft tissue at 6.45 um using a strontium vapor
laser. SPIE, Commercial and Biomedical Application of Ultrafast and Free-Electron Lasers, 2004. 5319: p. 201-208.
12

CHAPTER II
BACKGROUND
Mark Andrew Mackanos
Department of Biomedical Engineering
Vanderbilt University
Nashville, Tennessee 37235
13

2.1 Significance
Traditionally, the free electron laser (FEL) has been the only laser source cable of
delivering 6.45 µm laser radiation. This wavelength of light has been shown to have
efficient ablation yields with minimal collateral damage presumably from tissue
denaturation due to the breaking of the amide-II bond [1]. To date, over fifty million
dollars have gone into FEL research over the past decade and a half. Interesting findings
have been made resulting in ablation that is superior in terms of collateral damage to any
laser except the 193 nm excimer. Therefore, there is a need to translate these findings
beyond the FEL, as it will never become a viable clinical source due to cost and many
logistical issues. It is the goal of this research to facilitate/enable the transition from the
FEL to an alternative source capable of delivering 6.45 µm laser radiation. At the
conclusion of this research, we were able to confirm that alternative sources to the FEL
remain a possibility as well as define the parameters necessary for such a laser.
2.2 Tissue Interactions at 6.45 µm
Both water and protein are present to absorb 6.45 µm light. Specifically, the
amide-II absorption band as well as the 6.1 µm bending mode of water competes at this
wavelength for absorption. The amide bond helps link the amide bonds in collagen
together in a highly ordered matrix. Thus, targeting the wavelength of light to this
molecular bond will effectively reduce tissue integrity. The absorption spectra of a range
of tissue types have been studied yielding the following observations: sclera and
especially the cornea are highly organized, collagenous tissues; dermis additionally
contains proteoglycans and elastin in a more complex fibril architecture; brain is a non-
14

collagenous, cellular tissue [2-6]. Ocular and neural tissues have been shown to have
roughly the same water content, while dermal tissue is less hydrated. Despite these
differences, the infrared spectrum for cornea is typical of soft tissue based on the water
and collagen content [2, 3, 5, 6].
Two models that describe infrared laser ablation include the optical-breakdown
model and the thermal-confinement model. The optical-breakdown model is based on
plasma formation and subsequent shock wave formation, cavitation and tissue disruption.
At the intensities routinely used during FEL ablation of soft tissue, plasma formation is
not seen; therefore, a model solely based on optical breakdown would not account for the
method of tissue ablation typically seen with the FEL and hence will not be discussed
here. The thermal-confinement model recognizes competing thermal effects: the
vaporization of water driving an explosive ablation versus thermal diffusion leading to
collateral damage. This model accounts for the observation that collateral damage is
limited if the pulse duration is less than the thermal relaxation time of the ablated volume.
This model predicts that laser radiation at 2.94 µm would provide the most efficient
ablation; however, the most efficient ablation of tissue was seen at 6.45 µm [1]. To
explain this discrepancy, an alternative model that recognizes the importance for infrared
tissue ablation of both compromising the mechanical integrity of tissue and developing a
pressure head through the liquid-vapor transition. This model has been termed the
partitioning-of-energy model [1]. Both proteins and water will absorb infrared radiation
in the 5.9-6.6 µm range. After the infrared absorption, there is a brief moment when both
species have non-equilibrium energy distributions. Pyrolytic fragmentation of
biopolymers occurs at temperatures ranging from 400-1,000 °C and the activation energy
15

for chain scission or depolymerization is 900-1,400 J g-1 [7]. At lower energies, collagen
undergoes structural transitions from highly ordered arrays of cross-linked triple helices
with high tensile strength to amorphous gelatin, which is much weaker structurally. The
conversion of collagen to gelatin at this wavelength is energetically more accessible than
either vaporization or pyrolytic fragmentation, which indicates that the protein absorption
leads to loss of structural integrity, while the water absorption provides the explosive
force as accounted for by the thermal confinement model. The wavelength dependence
of ablation for soft tissue is similar to that of corneal stroma, which suggests a common
mechanism based on neither tissue organization nor collagen content, but on the selective
denaturation of structural proteins [1].
2.3 Effect of Pulse Duration/ Pulse Structure on Ablation
The 6.45 µm wavelength has been shown to be effective for soft tissue ablation
with minimal collateral damage due the reduction of tissue integrity caused by the
breaking of the amide-II bond at this wavelength. Currently, however, the importance of
pulse duration and pulse structure on the process of ablation is not known. A thorough
understanding of these pulse effects is essential for the transition from the FEL as a tissue
ablation source to a non-FEL laser source. The effects of pulse duration and temporal
pulse structure will be investigated through modulation of the FEL pulse structure and
through the use of other non-FEL sources, which have varying pulse structures, but the
common wavelength of interest. The alternative sources include strontium vapor, and
OPO lasers. These lasers as well as the native FEL will be discussed here.
16

2.3.1 Vanderbilt Mark-III Free Electron Laser
Free electron lasers are broadly tunable, pulsed sources providing both high
average and high peak power and great versatility for applications research. The
Vanderbilt Mark-III FEL is continuously tunable from 2-9 µm. It has a complex pulse
structure; each macropulse, with a duration of 4-5 microseconds, is a burst of picosecond
pulses, known as “micropulses,” with a micropulse frequency of 2.85 GHz. There are
~15,000 micropulses per macropulse [1]. Depending on wavelength and the demands of
the specific application, the macropulse repetition rate is set for 1 to 30 Hz with
micropulse energies up to 10 µJ and macropulse energies up to 100 mJ, which yields
macropulse peak powers on the order of ~20 kW and micropulse powers in the megawatt
range. Since a single 6.45 µm macropulse at a given energy focused to a several
hundred-µm diameter spot consistently ablates soft tissue, the macropulse repetition rate
is not a critical parameter necessary for study in this research. At the present time, the
FEL is one of just a few types of lasers able to access the 6.45 µm wavelength (OPO’s
and strontium vapor lasers being the others), and until recently, the only laser with
adequate peak power and average power to be suitable for tissue ablation with clinically
useful ablation rates.
2.3.2 Pulse-stretched FEL
Another effort to analyze the effects of pulse structure versus wavelength at 6.45
µm involves using the FEL with a different pulse structure. A system has been
developed at the W. M. Keck Free Electron Laser Center that can “stretch” the
picosecond micropulse of the FEL into a longer pulse. This system is known as a pulse
17

compressor. This system has the ability to stretch the one-picosecond micropulse to 30-
200 picoseconds in length. Notably, the micropulse frequency of 2.85 GHz and the
macropulse duration of 4-5 µs remain unchanged, while the pulse energy is reduced only
by losses in the pulse stretcher (80-90%) [8]. Also, with a few minor upgrades to the
current pulse compressor (stretcher) system, the pulse can be changed anywhere from 2-
300+ picoseconds in length (at a 3 GHz repetition rate, 333 ps is the longest pulse that
can be obtained before the frequency starts to change). This device uses the naturally
wide frequency bandwidth of the FEL (50-100 nm) to its advantage. The light is
dispersed into its different spectral components through the use of a grating. These
spectral components are then sent through a system of multiple reflectors (retro-mirrors)
that cause different spectral components to travel different pathlengths. This causes the
micropulse to spread out temporally due to light traveling a longer pathlength arriving
later than light traveling a shorter pathlength. This offers us the ability to analyze the
effects of vastly different pulse structures from the native FEL pulse on the process of
ablation, while still using the same experimental setup and keeping all other parameters
constant. Using the FEL with relatively high reliability (~90% “up-time”) was an
advantage over experimental alternative sources for these experiments. As this is cutting
edge technology, the FEL allowed us to collect valuable data that will help bridge the gap
between the multimillion-dollar FEL and much cheaper and efficient bench top laser
sources, as they become available.
18

2.3.3 Optical Parametric Oscillators
An Er:YAG pumped OPO has been developed at Stanford University in
collaboration with Picarro Incorporated (Sunnyvale, CA). This laser is capable of
producing mid-infrared light from 2-10 Hz with ~250 µJ per pulse [9, 10]. Energy is
delivered in single pulses of 100 ns in duration, from 1-10 Hz. An Er:YAG pumped
ZnGeP2 (ZGP) crystal is used as a means to efficiently generate wavelengths in the λ=6-8
µm region. Angle tuning of the ZGP crystal is used to obtain the desired output
wavelength. This laser is able to deliver the required wavelengths of light with super-
ablative radiant exposures to conduct ablation studies at 6.1, 6.45, and 6.73 µm with a
pulse duration/structure that is drastically different from that of the FEL, but more
feasible to produce using conventional laser sources.
2.3.4 Strontium Vapor Laser
In addition to the optical parametric oscillator (OPO) and the pulse stretched FEL,
a third source exists that is capable of delivering 6.45 µm light. This source is a
strontium vapor laser designed and built by Dr. A. N. Soldatov at the Innovation and
Technology Business University West-Siberian affiliate, Tomsk, Russia. Dr. Soldatov, in
collaboration with Pulslight Inc. (Sophia, Bulgaria), has recently built another such laser
for the W. M. Keck Free Electron Laser Center. This laser was delivered in the spring of
2003. This source operates with a repetition rate of 20 kHz, and therefore, from a laser
tissue interaction point of view, operates more like a continuous wave laser than a pulsed
laser, the latter being preferable; however, having another source to compare is
invaluable for obtaining insight into the ablation mechanics at this wavelength. The laser
19

produces light at 6.456 µm, 3.0665 µm, and 3.0111 µm from the strontium atoms; while
producing 1.0917 µm and 1.033 µm light from singly ionized strontium ions [11]. The
average power output of this laser is 1.2 W with 80% of this energy produced at 6.45 µm.
Initial studies were performed with this laser to determine the single pulse energy, and
ablation dynamics (see Appendix A and Mackanos et al.) [12]. The results of this study
showed that the laser did not have enough pulse energy for single pulse ablation. In fact,
in its current configuration, approximately 30 pulses are needed in order to deliver
sufficient energy to reach the ablation threshold. Further development of this technology
to provide or the necessary energy is currently underway. The results of this research are
summarized in Appendix A.
2.4 Ablation
Ablative cutting or material removal requires the fracture of chemical bonds. The
breakage of bonds leads either to the removal of molecules, molecular fragments, and
molecular clusters or to the formation of voids within the bulk of the material. Void,
bubble, or crack formation results in the ejection of non-decomposed material fragments
upon mechanical failure of the material. Vaporization, molecular fragmentation, and
void formation are all phase transitions and can be accomplished via photothermal,
photomechanical, or photochemical mechanisms [6].
Surface vaporization, normal boiling, and phase explosion can characterize the
concept of ablation. A true understanding of these concepts also relies on an
understanding of phase transitions and the phase diagram (Figure 2.1). These concepts
must be defined before the concept of ablation can be understood.
20

2.4.1 Phase Diagrams
A schematic of the pressure versus temperature projection of the phase diagram
for liquid and gaseous water is shown in figure 2.1. The A-C curve, represents the
boundary between temperature and pressure, in which liquid and gaseous water are in
equilibrium with one another and is know as the binodal [6].
The B-C-D curve denotes a
region of states representing the
intrinsic stability limit of the liquid
or vapor phase and is known as the
spinodal [6]. At the spinodal, the
superheated liquid phase or sub-
cooled vapor phase is no longer
stable with respect to the random
density fluctuations that occur in all
materials at nonzero temperatures.
Thus the segment of the spinodal
denoted B-C represents the limit to
which metastable liquids can be
superheated, while the segment D-C represents the limit to which metastable vapor can
be sub-cooled. The binodal and spinodal curves intersect at the critical point C, above
which no thermodynamic distinction can be made between liquid and vapor phases [6].
Ablation is often driven by a phase transition from the liquid to the vapor state, and thus
Figure 2.1 Pressure vs. temperature projection of the thermodynamic phase diagram including the spinodal curve. Specific states of interest are (1) ambient temperature and pressure, (2) boiling temperature under ambient conditions, (3) spinodal temperature at ambient pressure, and (4) saturated conditions corresponding to the ambient spinodal temperature. From Vogel and Venugopalan, 2003
21

along segment B-C of the spinodal. During laser heating at sub-ablative thresholds, the
spinodal curve will be followed; however, for the rapid heating above the ablation
threshold, the binodal curve will be followed. This diagram helps represent the processes
relative to the temperature and pressure that are seen during the ablation process in water
as well as in tissue.
2.4.2 Surface Vaporization
Equilibrium vaporization takes place at a liquid-vapor interface, where liquid
water at a free surface is transformed to vapor at the saturation temperature and pressure
[13]. Equilibrium vaporization can occur when the liquid is in any thermodynamic state
that lies along the binodal. The rate of energy deposition into the system dictates the
vaporization rate. An enhancement of the vaporization rate occurs when the liquid
surface temperature rises rapidly and the liquid system is no longer in equilibrium with
the surrounding vapor. A net flux of mass from the surface to the surroundings continues
until the vapor pressure returns to equilibrium. The balance of evaporation and
condensation becomes restored at this point [6].
2.4.3 Normal Boiling
Normal boiling occurs on the binodal curve and is defined by the equilibrium
point of temperature at a given pressure. Normal boiling relies on the presence of
dissolved gas or other heterogeneities within the liquid that catalyze the nucleation and
growth of vapor bubbles. The rate of energy deposition into the system by the laser is
22

balanced by the energy of the vapor leaving the system. In a normal boiling process
driven by laser irradiation of a free surface, the transition from saturated liquid to
saturated vapor occurs in a finite layer of mixed phase at the sample surface [6]. The
thickness of this layer is comparable to the optical penetration depth of the incident
radiation. The surface temperature is fixed to the saturation conditions corresponding to
the pressure at the target surface and there is no temperature gradient within the
vapor/liquid layer.
2.4.4 Phase Explosions
When the rate of volumetric energy deposition provided by the laser radiation is
more rapid than the rate of energy consumed by vaporization and normal boiling, the
tissue water is driven to a metastable superheated state [6]. The liquid can remain in this
metastable state until the spinodal temperature is reached as seen in Figure 2.1. At the
spinodal temperature, the stability is compromised, and the liquid undergoes “spinodal
decomposition”, a spontaneous process by which a thermodynamically unstable liquid
relaxes toward equilibrium [14]. At the spinodal temperature, the liquid phase
disappears and the superheated liquid becomes unstable, and the transition to the vapor
phase via spinodal decomposition is spontaneous.
The relaxation process during spinodal decomposition results in a significant
pressure rise. If this pressure rise results in tissue fracture, the liquid-vapor mixture will
be exposed to atmospheric pressure and be ejected as saturated vapor and saturated liquid
droplets in an explosion. The transformation of superheated liquid to an equilibrium state
23

of mixed phase may involve both bubble nucleation and spinodal decomposition which
are collectively referred to as “phase explosion” [6].
2.5 Precise Tissue Ablation
Precise tissue ablation requires the use of laser wavelength with a small optical
penetration depth in tissue that serves to confine the energy deposition to a small volume.
In addition, thermal confinement is also required for precise ablation in order to limit the
spatial extent of thermal diffusion during irradiation and maximize the temperatures in
the absorbed volume. Stress confinement leads to a more efficient ablation process as it
serves to reduce the volumetric energy density required for material removal, resulting in
an increase of the ablation efficiency and a reduction of the thermal injury in the tissue
that remains.
2.6 Ablation with the FEL
Traditionally, the infra-red laser ablation of tissue has focused on using the strong
water absorption peak around 2.94 µm in wavelength to rapidly heat the tissue beyond
vaporization temperatures, thereby removing tissue during this explosive process. Only
recently have researchers begun to consider targeting specific protein absorption bands
with laser radiation. Edwards et al. [1], observed that the maximum ablation yield and
minimal collateral damage occurred at λ = 6.45 µm, which corresponds to the amide-II
absorption band of protein. Some of the incident radiation is absorbed by the amide-II
bonds in protein, which causes the structural proteins to be heated beyond their melting
24

point which compromises the mechanical integrity of tissue while the liquid-vapor
transition of the heated water develops a pressure head, which drives the ablation process.
The FEL is being used in dermatology research for the application of skin
resurfacing by Ellis et al. [4], in ophthalmology for optic nerve fenestration by Joos et al.
[15-17], and in neurosurgery for tumor resection by Copeland et al. [18-20]. To date the
FEL has been used to carry out eight human surgeries and continues to have many
ongoing research projects to provide for new surgical application targeted at this unique
wavelength due its efficient ablation with minimal collateral damage.
2.7 Thermomechanical Response of Tissue to Pulsed Irradiation
The spatial distribution of volumetric energy density resulting from pulsed laser
irradiation of tissue generates significant thermal and mechanical transients. These
thermomechanical transients are the driving force for all laser ablation processes that are
not photochemically mediated.
2.7.1 Thermal Confinement
In the absence of photochemical or phase transition processes, the energy
absorbed by the tissue in response to pulsed laser irradiation is entirely converted to heat.
Once the energy is absorbed, it is subject to spatial redistribution by thermal diffusion.
Spatially confined microsurgical effects can be achieved by the use of laser exposures
that are shorter than the characteristic thermal diffusion time of the heated volume [6].
For laser ablation, the heated volume is typically a layer of tissue of thickness 1/µa, and
25

the characteristic thermal diffusion time, τth [s], is given as td = 1/(4αµa2), where α is the
thermal diffusivity [m2/s]. Thermal confinement is attained when the ratio of the laser
pulse duration to the thermal diffusion time is somewhat less than 1. Water is most often
the main chromophore for pulsed IR ablation. When using a wavelength that is absorbed
by water, one must consider whether the concept of thermal confinement applies not only
to the heated volume as a whole but also to the individual microscopic tissue structures
that absorb the radiation. If the laser radiation is thermally confined in a small volume of
the tissue, the possibility exists that ablation can occur before it would be expected in the
same volume of water. Thus one must be cognizant of the microscopic tissue effects of
tissue when trying to understand the ablation mechanism with respect to a given laser
source.
2.7.2 Stress Confinement
Rapid heating of tissue by pulsed laser radiation also leads to the generation and
propagation of thermoelastic stresses as the heated tissue volume reconfigures to its new
equilibrium state. The longitudinal speed of sound in the medium, σ [m/s], the laser
pulse duration, τp [s], the depth of the heated volume, 1/µa [m], and an intrinsic
thermophysical property known as the (dimensionless) Grüneisen coefficient, Γ, govern
the magnitude and temporal structure of the thermoelastic stresses. The Grüneisen
coefficient is simply the internal stress per unit energy density generated upon depositing
energy into a target under constant volume conditions.
26

Thermoelastic stresses are most prominent when the laser pulse duration tp is
smaller than, or on the order of, the characteristic time for a stress wave to propagate
across the heated volume. Stress confinement is achieved when the ratio of the laser
pulse duration to the stress propagation time, τstr., is less than 1. In this case, heating of
the laser-affected volume is achieved under isochoric conditions, and the internal stresses
generated do not propagate outside the heated volume during the laser irradiation,
causing pressure buildup and propagation of strong transients after the laser pulse.
While thermal expansion of a heated volume generates compressive thermoelastic
stresses, subsequent propagation of these thermoelastic stresses result in transients that
contain both compressive and tensile components [6]. Tensile stresses arise from the
reflection of the compressive stress waves at a boundary to a medium with lower acoustic
impedance (tissue-air, tissue-water) or from the three-dimensional characteristics of
acoustic wave propagation. The magnitude of these stress transients is most prominent
when irradiation takes place under conditions of stress confinement and when the laser
beam diameter is comparable to the optical penetration depth of the incident radiation.
The tensile stresses can significantly affect the ablation process by catalyzing the phase
transition processes or by causing direct tissue fracture and mechanical failure (known as
spallation).
Depending on the temperature rise in a given target, negative thermoelastic
stresses can lead to the accelerated growth of preexisting nucleation centers or initiate the
nucleation and growth of vapor bubbles. The presence of tensile stresses can cause
explosive boiling processes at temperatures much less than 300 °C [6]. Thermoelastic
tensile stresses can reduce both the ablation threshold and the ablation enthalpy. This
27
reduction is likely achieved by direct fracture of the tissue matrix or by its catalytic effect
on nucleation and explosive boiling.
Figure 2.2 The conditions for stress confinement, thermal confinement, and no confinement are shown with respect to pulse duration and penetration depth. The dotted line is the penetration depth at 6.45 µm. Inscribed on this line are the pulse durations for the FEL macropulse (5 µs), which is not confined, the strontium vapor pulse (50 ns), which is thermally confined, and the OPO pulse (100 ns), which is thermally confined. The micropulse duration for the native FEL and the stretched pulse are not shown because they are to the far left of the given line and are both stress and thermally confined. From Uhlhorn, 2002 [21].
Figure 2.2 shows the effect of pulse length and penetration depth on the
mechanisms of stress confinement and thermal confinement. The relevant pulse
structures of the laser sources discussed in this proposal have been placed along the 6.45
µm penetration depth line. It is clearly seen that the FEL macropulse is not confined,
while the pulses for the strontium vapor and OPO lasers are thermally confined. The
28

native and stretched FEL micropulses are off the diagram to the left, thus they are both
stress and thermally confined.
2.8 Ablation Plume Dynamics
The ablation process is typically characterized by a sub-ablative phase followed
by the development of a vapor plume and material ejection [6]. The ablation plume
consists of water vapor droplets and/or particulate tissue fragments. The expansion of the
plume into the surrounding air is coupled with the generation of acoustic transients that,
for high volumetric energy densities in the ablated material, evolve into shock waves.
To date, most investigations of the plume dynamics and acoustic phenomena
associated with pulsed laser ablation of biological tissues have been performed
experimentally. Particulate matter in the ablation plume has been visualized using bright-
field photography or photographic recording of scattered light [6]. Schlieren
photography has enabled the visualization of vapor and gaseous ablation products in
addition to the ejected particles. Specific data on the ablation dynamics, including the
time delay between laser irradiation and the onset of tissue removal, the velocities of
acoustic transients, vapor plume, and particulate matter, and the duration of post-pulse
material ejection, have been obtained by photographic techniques or by the use of a probe
laser beam directed parallel to the target surface, known as pump-probe imaging [6].
Pump-probe techniques have also provided quantitative time-resolved information
regarding plume transmission and the shape and amplitude of acoustic transients.
Ablation begins with the formation of a vapor plume and continues with the
ejection of condensed material mixed with vapor. Apart from an external shock wave,
29

which propagates outward, away from the ablation plume, another shock wave within the
plume travels backwards, toward the surface of the target. This shock wave, like the
external shock wave, originates at the contact front between the plume and the ambient
air, where density and pressure rise due to the collision of the expanding vapor with the
surrounding air. The vapor molecules propagating with the plume have a nonzero
average velocity. When they collide with air molecules that are on average at rest, they
are partially reflected back into the plume. This reflection leads to the formation of the
internal shock wave that begins to propagate toward the target surface when the
rarefaction from the expansion of the vapor plume has reduced the pressure in the plume
considerably below its initial value. Material ejection is best viewed using bright-field
imaging. Ejection is driven by a phase explosion and is followed by recoil-induced
material expulsion [6].
The shock wave is often emitted after the end of the laser irradiation depending
upon the threshold radiant exposure and pulse duration. At high radiant exposures,
however, shock wave emission begins during the laser pulse. Ablation of water and soft
tissue can be characterized by a time difference between shock wave emission and
particle ejection. This time difference indicates that at moderate to high radiant
exposures, the large volumetric energy densities produced in the superficial tissue layers
drives the tissue water to a supercritical state and also enables the thermal dissociation of
the molecules of the extracellular matrix [6]. Particle velocities increase with increasing
tissue strength and radiant exposure, consistent with the concept of confined boiling. The
increase with radiant exposure is related to the delayed onset of particle ejection after the
laser pulse. Larger radiant exposures will lead to larger volumetric energy densities in
30

the target and thus to higher pressures and velocities for plume expansion and shock
wave emission. The volumetric energy density can become sufficiently high to initiate
pyrolysis or plasma formation resulting in the creation of a luminous plume [6].
For ablation in soft tissue, material ejection continues for a considerable time after
the end of the laser pulse. Post-pulse ablation can last 3-5 orders of magnitude longer
than the laser pulse duration. Post-pulse ablation generally lasts longer for mechanically
weaker tissues, larger radiant exposures, and larger laser beam diameters. One possible
driving force for the continuation of the ablation process after the end of the laser pulse is
the heat retained in the tissue. A progressive weakening of the tissue matrix through
thermal denaturation enables a propagation of the ablation front until the vapor pressure
in the residual tissue drops below the ultimate tensile strength of the weakened tissue
matrix. The lengthening of the ablation process by the combined action of thermal
diffusion and denaturation is most pronounced for laser wavelengths with large optical
penetration depth, i.e., long thermal relaxation times, and for mechanically weak tissues
or tissue phantoms.
Another source of post-pulse ablation is hydrodynamic phenomena. These
phenomena include recoil stress-induced material expulsion and jetting from collapsing
bubbles in the target that were produced by thermoelastic tensile stress. Another possible
cause of the persistence of a particle cloud close to the tissue surface is the cessation of
the movement of plume constituents ejected at late times.
31

2.9 Ablation Metrics
Two important metrics can be used to quantify ablation: the ablation threshold
and ablation efficiency. These metrics can vary greatly depending on the laser
parameters and the tissue properties, as well as the environment in which the ablation has
taken place, i.e., in a liquid or gaseous environment.
2.9.1 Ablation Threshold
The ablation threshold, Hth (J/cm2), represents the minimum radiant exposure
required to achieve effective ablative material removal. Thus, while we consider heated
removal relying solely on surface vaporization to occur below the ablation threshold, any
material ejection process, whether accomplished via a phase explosion or confined
boiling, is considered to occur at radiant exposures above the ablation threshold.
Irradiation of material above the ablation threshold produces a collective volumetric
ejection of large molecular clusters. Thus, the ablation threshold can be defined as the
radiant exposure necessary to achieve volumetric material ejection of tissue. This
emphasizes that pulsed laser ablation of tissue requires destruction of the extracellular
matrix and cannot be considered to have occurred by mere dehydration or vaporization of
the tissue. A sensitive, indirect measurement of the ablation threshold can be made using
a piezoelectric transducer to measure the appearance of recoil stress connected with
material removal.
32

2.9.2 Ablation Efficiency
Ablation efficiency, ηabl (mJ/g), is a metric for the total energy necessary to
remove a given mass of tissue. At the ablation threshold, ηabl is considered to be zero.
For steady-state ablation processes, the ablation efficiency increases monotonically and
asymptotically approaches one over the heat of ablation for large radiant exposures. In
contrast, for blow-off processes, the ablation efficiency reaches a maximum at moderate
radiant exposures, where energy is wasted in “overheating” the superficial layers of the
tissue sample [6]. A direct correspondence between ablation efficiency and the ultimate
tensile strength of the tissue has been observed [22]. Also, for tissues possessing a high
ultimate tensile strength, the ablation efficiency reaches a maximum for radiant exposures
approximately 4 times the ablation threshold and remains roughly constant at higher
radiant exposures. The increase of material removal with larger radiant exposures is
likely due to the increased susceptibility of mechanically weak targets to recoil-induced
material removal.
2.10 Mid-infrared Beam Delivery
Traditionally, beam delivery of mid-infrared light has been limited to applications
in an air environment. This greatly reduces the tissues and applications that can be
reached in a surgical environment to those that can be directly exposed to the light. In
addition, cumbersome and expensive delivery with an articulated arm has been the only
method available for beam delivery [20]. Recently advances using hollow wave guides
have been shown to allow for beam delivery in ophthalmic surgeries [16, 17]; however,
applications requiring high pulse energies are not possible due to the low transmission
33

efficiencies of the wave guides. The existence of optical fibers capable of delivering
mid-infrared light for minimally invasive surgical procedures is critical for the
advancement of this technology for more widespread clinical use.
New advances in fiber-optic technologies of materials including silver halide and
arsenic sulfide fibers have been shown by our group that beam delivery for MIS
applications is possible. Silver halide fibers are capable of delivering these wavelengths
of light with up to a 60% transmission efficiency [23] while still being flexible enough
for easy implementation into minimally invasive surgical tools. In addition to the
requirements of fiber optic transmission, many MIS applications require the delivery of
light in a liquid environment, where the mid-infrared light is highly absorbed. This
necessitates the removal or displacement of water or saline in order to allow for the
delivery of the mid-infrared light. The study of perfluorocarbon liquids has be carried
out by this research group for this possibility, specifically for the replacement of the
vitreous in ophthalmic applications [23]. These studies have shown that the delivery of
mid-infrared light for minimally invasive surgical applications is possible. The results of
this study can be found in Appendix B.
2.11 Significance
A great deal of research has been completed using the FEL for surgical
applications. It has been shown by a variety of groups that targeting the amide-II bond
for tissue ablation allows for very efficient removal of tissue with minimal collateral
damage. However, the complete mechanism for this has never been completely
understood. We used the alternative laser sources described in a series of experiments
34

designed to determine the effects of pulse structure on the ablation of tissue at 6.45 µm.
In addition, the FEL, due to its limitations will never be a viable clinical source;
therefore, we examined alternative 6.45 µm laser sources for their applicability as a
replacement to the FEL in order to transition these methods from a purely research
standpoint to clinically viable application.
2.12 References
1. Edwards, G., et al., Tissue Ablation By a Free-Electron Laser Tuned to the Amide-II Band. Nature, 1994. 371(6496): p. 416-419.
2. Edwards, G., et al., Comparison of OPA and Mark-III FEL for Tissue Ablation at
6.45 Microns. SPIE, Commercial and Biomedical Application of Ultrafast and Free-Electron Lasers, 2002. 4633: p. 194-201.
3. Edwards, G.S., M.S. Hutson, and S. Hauger, Heat Diffusion and Chemical
Kinetics in Mark-III FEL Tissue Ablation. SPIE, Commercial and Biomedical Application of Ultrafast and Free-Electron Lasers, 2002. 4633: p. 184-193.
4. Ellis, D.L., et al., Free electron laser wavelengh specificity for cutaneous
contraction. Lasers in Surgery and Medicine, 1999. 25: p. 1-7. 5. Hutson, M.S., S.A. Hauger, and G. Edwards, Thermal diffusion and chemical
kinetics in laminar biomaterial due to heating by a free-electron laser. Physical Review E, 2002. 65(6): p. Art. No.-061906.
6. Vogel, A. and V. Venugopalan, Mechanisms of pulsed laser ablation of biological
tissues. Chem Rev, 2003. 103(2): p. 577-644. 7. Liebman, S.A. and E.J. Levy, Pyrolysis and GC in Polymer Analysis. 1 ed. Vol. 1.
1984: Dekker. 8. Kozub, J.A., et al. Effect of micropulse duration on tissue ablation using a
stretched free electron laser pulse train. in Photonics West. 2004. San Jose, CA: SPIE.
9. Ganikhanov, F., T. Caughey, and K.L. Vodopyanov, Narrow-linewidth middle-
infrared ZnGeP2 optical parametric oscillator. Journal of the Optical Society of America B-Optical Physics, 2001. 18(6): p. 818-822.
35

10. Vodopyanov, K.L., et al., ZnGeP2 optical parametric oscillator with 3.8-12.4-mu m tunability. Optics Letters, 2000. 25(11): p. 841-843.
11. Platonov, A.V., A.N. Soldatov, and A.G. Filonov, Pulsed Strontium Vapor Laser.
Sov. J. Quantum Electron., 1978. 8(1): p. 120-121. 12. Mackanos, M.A., et al., Ablation of soft tissue at 6.45 um using a strontium vapor
laser. SPIE, Commercial and Biomedical Application of Ultrafast and Free-Electron Lasers, 2004. 5319: p. 201-208.
13. Albagli, D., et al., Laser-Induced Thermoelastic Deformation - a 3-Dimensional
Solution and Its Application to the Ablation of Biological Tissue. Medical Physics, 1994. 21(8): p. 1323-1331.
14. Debenedetti, P., Metastable Liquids: Concepts and Principles. Princeton
University Press, 1996. 15. Joos, K.M., et al., Free Electron Laser (FEL) laser-tissue interaction with human
cornea and optic nerve. in: Ophthalmic Technologies VI, J-M Parel, K. M. Joos, P. O. Rol (eds), SPIE, Bellingham, 1996. 2673: p. 89-92.
16. Joos, K.M., et al., Optic nerve sheath fenestration with a novel wavelength
produced by the free electron laser (FEL). Lasers Surg Med, 2000. 27(3): p. 191-205.
17. Joos, K.M., et al., Acute optic nerve sheath fenestration in humans using the free
electron laser (FEL): a case report. in: Ophthalmic Technologies XII, F. Manns, P. Soderberg and A. Ho (eds), SPIE, Bellingham, WA, 2002. 4611: p. 81-85.
18. Copeland, M.L., et al., First human application of a free electron laser.
International Free Electron Laser Conference Users Workshop, 2000. 19. Copeland, M., et al., First Human Surgery with a Free Electron Laser. SPIE,
Plenary Session, 2000. 20. Edwards, G.S., et al., Free electron laser based biophyscal and biomedical
instrumentation. Review of Scientific Instrumentation, 2003. 74(7): p. 3207-3245. 21. Uhlhorn, S.R., Free electron laser ablation of soft tissue: The effects of
chromophore and pulse characteristics on ablation mechanics. Ph.D. Thesis, Vanderbilt University, 2002.
22. Walsh, J.T. and T.F. Deutsch, Pulsed Co2-Laser Ablation of Tissue - Effect of
Mechanical-Properties. IEEE Transactions on Biomedical Engineering, 1989. 36(12): p. 1195-1201.
36

23. Mackanos, M.A., et al., Delivery of midinfrared (6 to 7-mu m) laser radiation in a liquid environment using infrared-transmitting optical fibers. Journal of Biomedical Optics, 2003. 8(4): p. 583-593.
37

CHAPTER III
EFFECT OF MICROPULSE DURATION ON MID-INFRARED TISSUE ABLATION USING A STRETCHED FREE ELECTRON LASER PULSE TRAIN
Mark A. Mackanos1, John A. Kozub2, and E. Duco Jansen1
1—Department of Biomedical Engineering
2—W. M. Keck Foundation Free Electron Laser Center
Vanderbilt University
Nashville, Tennessee 37235
This manuscript was submitted to Physics in Medicine and Biology.
38

3.1 Abstract
Pulsed mid-infrared (6.45 µm) radiation has been shown to cut soft tissue with
minimal collateral damage (<40 µm); however, the mechanism of ablation has not been
elucidated to date. The goal of this research was to examine the role of the unique pulse
structure of the Vanderbilt Mark-III Free Electron Laser (FEL) and its role in the efficient
ablation of soft tissue with minimal collateral damage. The pulse structure consists of a
2.856 GHz train of one picosecond micropulses within a 4-5 µs macropulse envelope
operated between 2 and 30 Hz. The effect of the picosecond micropulse was examined
by running the native FEL pulse structure through a pulse stretcher in order to increase
the micropulse length from 1 picosecond up to ~200 picoseconds.
This allowed us to determine whether or not the picosecond train of micropulses
played any role in the ablation process. The pulse stretcher was varied between 1 and
200 picoseconds. The ablation threshold was determined for water and mouse dermis for
each micropulse length using PROBIT analysis of 100 individual observations of the
macropulse. While the results of the analysis showed a statistically significant difference
between 1 and 200 picoseconds, the average percent difference amounts to only 28% and
is not proportional to the 200-fold drop in peak irradiance.
The ablation efficiency was also measured on 90% w/w gelatin and mouse dermis
for the different micropulse lengths. Multiple ablation craters were made by varying the
number of pulses delivered between 5 and 500. The ablated crater depth was measured
using a light microscope. A small but statistically significant difference was observed
between 1 and 200 picoseconds; with the 200 ps pulse being more efficient on gelatin,
with the opposite trend for mouse dermis. We have shown that there is a small effect of
39

micropulse duration of the FEL on the ablation process; however, this effect is negligible
between 1 and 200 picoseconds given a 200-fold decrease in peak intensity. These
results suggest that as we move forward in developing alternative laser sources for tissue
ablation to replace the FEL, the picosecond micropulse structure is not a critical
parameter that needs to be duplicated.
3.2 Introduction
The free electron laser (FEL) operating at 6.45 µm in wavelength has been shown
to ablate neural tissue in a highly efficient manner with minimal collateral damage (<40
µm); however, the mechanism of this efficient ablation has not been elucidated[1-3]. The
Mark III FEL is a unique source of pulsed laser radiation. The gain medium is a series of
short pulses of electrons that are accelerated to relativistic speeds and interact briefly with
light stored in the laser cavity[4], the output radiation is also a series of short pulses
(about 1 ps), repeated at the electron beam repetition rate of 2.856 GHz. The pulse train
is maintained for 4-5 microseconds, totaling over 10,000 micropulses per macropulse.
During any micropulse, the instantaneous power can be several megawatts; however, the
low duty cycle keeps the average power during the macropulse below ~ 20 kilowatts.
Since most solid state or gas lasers have a much simpler pulse structure (often quasi-
continuous for tens of nanoseconds), comparison with other lasers, even if operating at
the same wavelength is difficult. It is, however, essential to determine which of these
features are important, be it the high-intensity during the short micropulses, the unusually
high repetition rate, or the high average power during the macropulse. In an effort to
40

determine which of these parameters are important to the mechanism of ablation at this
wavelength, the effect of pulse structure was investigated.
In the absence of photochemical or phase transition process, the entire energy
absorbed by a given tissue in response to pulsed laser irradiation is converted to a
temperature rise [5]. Once the energy is deposited, it is subject to spatial redistribution
by thermal diffusion. This redistribution is characterized by two specific times: the
thermal confinement time and the stress confinement time. Thermal confinement exists
when the laser pulse duration is less than the thermal diffusion time of a given tissue
(τp<δ2/4α), where τp = laser pulse duration, α = thermal diffusivity, δ = 1/µa, µa =
absorption coefficient) [5]. Stress confinement exists when the laser pulse duration is
smaller than the characteristic time for a stress wave to propagate across the heated
volume of tissue (τp<σ/δ), where σ = speed of sound in tissue) [5]. For situations where
thermal confinement exists, the temperature profile is almost fully confined to the volume
in which the radiation is absorbed. For pulse durations longer than the thermal diffusion
time, significantly reduced peak temperatures are seen due to the redistribution of energy
over a larger volume cause by thermal diffusion. Stress confinement may provide for
more efficient ablation as there is evidence that it serves to reduce the volumetric energy
density required for material removal[5]. An increase in the ablation efficiency and a
reduction of the thermal injury in the remaining tissue could result from this situation.
For the FEL, the macropulse is thermally confined but not stress confined, while the
entire range of micropulses studied (1-200 ps) is both thermally and stress confined.
From this we would not expect a difference between the stretched micropulses, as they
41

are all contained in the same regime with respect to the thermal and stress confinement
times.
An analysis of the effect of pulse structure at 6.45 µm involves using the FEL
with a different pulse structure. A system has been developed at the W. M. Keck Free
Electron Laser Center that can “stretch” the picosecond micropulse of the FEL into a
longer pulse. This system is known as a pulse compressor[6, 7]. The current system has
the ability to stretch the one-picosecond micropulse to 30-200+ picoseconds in length
while maintaining a constant micropulse energy. Consequently, this results in the
irradiance during the micropulse dropping to 1/200 of the original peak intensity (note:
350 picoseconds is the longest pulse that can be used without pulse to pulse overlap
becoming an issue). Notably, the micropulse frequency of 2.856 GHz and the macropulse
duration of 4-5 µs remain unchanged, while the pulse energy is reduced only by losses in
the pulse stretcher (70%) due to grating efficiency and atmospheric absorption. In
addition, the spectral content and spatial mode of the laser remain unchanged. This
device uses the naturally wide frequency bandwidth of the FEL (60-100 nm) to its
advantage. The light is dispersed into its different spectral components by using a
grating. These spectral components are then sent through a system of multiple reflectors
that cause different spectral components to travel different path-lengths. This causes the
micropulse to spread out temporally due to light traveling a longer path-length arriving
later than light traveling a shorter path-length. This will offer us the ability to analyze the
effect of vastly different pulse structures from the native FEL pulse on the process of
ablation, while still using the same system and keeping all other parameters constant.
The FEL will allow us to collect valuable data that will specify the parameters necessary
42

to help bridge the gap between the multimillion-dollar FEL and much cheaper and
efficient bench top laser sources, as they become available.
The determination of the ablation threshold for the pulse stretched FEL is critical
for carrying out any analysis of the ablation mechanism at 6.45 µm. There are many
methods available for this determination; however, it is difficult to define what the actual
threshold is. This definition; however, is critical to the decision of which determination
method will be used. For the purposes of this paper, we will define the threshold of
ablation as the amount of energy necessary to cause an ablation plume, i.e. ejected
material, to be seen by visual inspection with one single micropulse with a 50%
probability (ED50) [5].
The ablated crater depth is another important metric for analysis of the ablation
mechanism at this wavelength. It provides an easy method for analyzing the effects of
ablation at 6.45 µm on a target tissue. To employ this metric, we measured the depth of a
created crater given a defined number of pulses delivered at a constant radiant exposure.
3.3 Methods
3.3.1 The FEL pulse stretcher
The key to the design of the pulse stretcher is the use of a grating which takes
advantage of the wide spectral bandwidth of the FEL (100 nm). The angle of the grating
causes the longer wavelengths to travel a greater distance through the device than the
shorter wavelengths, giving the output pulse a frequency-dependent time delay, or chirp,
and a temporal width proportional to the bandwidth of the incoming pulse. The FEL,
43

when tuned to either 6.1 or 6.45 µm, has a beam diameter of about 12 mm. Therefore, it
was necessary to telescope the beam down, with a 300 mm focal length curved mirror
and a 100 mm focal length lens, by a factor of 3:1 in order to enable the use of a
reasonable sized grating. The grating (ML303, Optometrics, Ayer, MA) was blazed at
10.6 µm with 150 lines/mm. Once the pulse passes through the telescope and is
dispersed by the grating, it is then retro-reflected back to the grating to halt the dispersive
effect. The beam is then translated vertically and returned through the system to be
spatially reconstructed.
A diagram of the pulse stretcher used in this study is shown in Figure 3.1. The
resulting delay per unit wavelength is a function of the dispersive power of the grating,
the grating angle, and the length of the dispersive section of the stretcher. The resultant
stretch was determined with a first-order geometrical approximation and confirmed with
an autocorrelation technique as described by Kozub et al.[8]. The dispersive path is
changed by moving the first retro-reflector; the minimum and maximum pathlength is
determined by the beam size and blockage by optical mounts in the setup. The resultant
delay interval can be varied from 30-200 picoseconds (FWHM) at either 6.1 or 6.45 µm.
A representation of the relative intensities for the stretched pulses from 1-200 ps is
illustrated in Figure 3.2. The exiting pulse has the same divergence, waist size, and
spectral content as the input pulse, but with a variable micropulse width. Losses in the
pulse stretcher are due to both the efficiency of the grating and atmospheric losses. The
pulse stretcher is currently open to the air and has a total pathlength of roughly 1.75
meters. The total efficiency of this stretcher is on the order of 30%. This allows for 3-4
44

1ps
FWHM * (ps/nm)
Retro Mirror
Mirror Grating
Mirror
Lens
Mirror
Curved Mirror
Mirror
Figure 3.1 A diagram of the pulse stretcher is shown. After passing through a 3:1 telescope, the pulse is dispersed by a grating and is then retro-reflected back to the grating to halt the dispersive effect; the beam is then translated and returned through the system to be spatially reconstructed. The angle of the grating causes the longer wavelengths to travel a greater distance through the device than the shorter wavelengths; giving the output pulse a frequency-dependent time delay (chirp) and a temporal width proportional to the bandwidth of the incoming pulse. The resulting delay per unit wavelength is a function of the dispersive power of the grating, the grating angle, and the length of the dispersive section of the stretcher. The exiting pulse has the same divergence, diameter, and spectral content as the input pulse with a variable micropulse width. Losses are mostly determined by the efficiency of the grating. The pulse stretcher currently in use with the Vanderbilt FEL has a total efficiency of about 30% and is capable of stretching FEL pulses at 6.45 and 6.1 µm from 30 to 200 picoseconds.
45

0
0.005
0.01
0.015
0.02
0 100 200 300 400 500 600 700
Time (ps)
Inte
nsity
(a.u
.)
.
1 ps100 ps200 ps
Figure 3.2 The relative intensity and duration of the 1, 100, and 200 ps micropulses are shown with two consecutive micropulses. The value on the y-axis is in arbitrary units and is scaled to 0.02 out of 1 to illustrate the relative intensity differences.
46

mJ per pulse to be delivered to the sample, which is enough to reach two to four times the
ablation threshold of water, depending on wavelength.
Since the spectral content and hence the micropulse width varies considerably
over the macropulse as shown in Figure 3.3, we quote the average micropulse width over
the macropulse. Before each ablation experiment, the fast spectrum of the FEL
macropulse was recorded, and the resulting average micropulse bandwidth was
multiplied by the chip-rate to give the average micropulse duration over the macropulse
from the stretcher. By tuning the FEL for the desired bandwidth, and adjusting the
stretcher chirp-rate, it is possible to attain any pulse width between 30 and 200
picoseconds [8]. To attain 1 ps pulses with the same spatial characteristics as the
stretched pulses, a mirror was placed after the telescope but before the grating, in order to
bypass the stretcher. The output beam was viewed on a 2-D pyroelectric array (Spiricon
Inc.) to verify the proper spatial reconstruction. The focused spotsize at the sample was
measured using a scanning knife-edge technique.
3.3.2 Ablation Threshold Determination
For the measurement of the ablation threshold, two different samples were
chosen; water and mouse dermis. Water, 0.2 µm filtered biotech grade water (Fisher
Biotech), was used because it provides an unchanging level surface for ablation
regardless of the number of pulses delivered by the laser, while maintaining constant
hydration. The water level was carefully maintained to make sure that there were
negligible evaporative losses to prevent the spotsize from changing throughout the course
47

Figure 3.3 A plot of the FEL ‘fast-spectrometer’ data, showing the spectral content of the macropulse with time; the vertical axis is wavelength (µm) and the horizontal axis is time (µs). Specifically, the location of the energy with respect to wavelength does not remain constant over the entire macropulse. While the majority of the energy is centered at the target wavelength of 6.45 µm in this figure, a significant amount of energy extends from 6.35 µm to 6.55 µm, giving a minimum 100 nm of bandwidth (FWHM) over the course of the macropulse. Although the finite amount of energy across the wavelengths at any given time is variable, the integrated spectrum over the entire macropulse remains constant with 100 nm of bandwidth.
48

of the threshold measurements. Water provides an easily obtainable and consistent
source for comparison between different pulse lengths. Unfortunately, water does not
provide a complete picture of the effects of tissue ablation. While water does absorb the
6.1 and 6.45 µm light well, it lacks the amide I and II absorption peaks, corresponding to
6.1 and 6.45 µm respectively, and the mechanical strength exhibited by tissue.
Therefore, it was necessary to carry out additional experiments on excised mouse dermis.
Mouse dermis samples were harvested from sacrificed mice within 24 hours post-
mortem. The skin was shaved and depilated using Nair and rinsed multiple times using
saline solution. Thin strips of skin approximately 1.5 cm in size were removed from the
ventral side of the mouse, cleaned of fascia, and stored in a refrigerator on saline soaked
towels until use. The skin strips were used within 24 hours of harvesting for all
experiments. Skin samples were irradiated on the sub-dermal side to minimize variation
between samples due to age, hydration state, and hair.
The threshold determination was performed using a 500 µm, diameter spot-size
for each pulse length. The spotsize was determined using an automated spot-size
measurement system which implements a standard knife-edge technique for Gaussian
laser beams [9]. The laser was focused onto a flat piece of mouse dermis on a three-axis
translation stage (Newport Corp., Irvine, CA) by a 200 mm focal length CaF2 lens (ISP
Optics, Irvington, NY). The stage allowed for the movement of the sample under the
focus of the incident laser beam, so that each successive laser pulse ablates a new
location. The skin was moved 0.5 mm at a time to maintain the proper spacing between
ablation points to avoid any overlap between successive pulses.
49

Great care was taken to maintain a consistent hydration state of the dermis. It has
been seen through previous experiments of this type that the water content of the skin,
especially at the surface, will decline rapidly due to evaporation; therefore, as the water
content changes, so will the ablation threshold. The experiments were run as quickly as
possible to avoid any large changes in threshold due to evaporation. In addition, a fresh
piece of skin was used for each successive set of measurements.
The FEL was operated at 30 Hz to maintain a reasonable (~10%) pulse-to-pulse
stability in pulse energy, while an electromechanical shutter (Melles Griot, Rochester,
NY) along with specially built timing circuit was used to pick off a single pulse for
irradiation of the sample. The ablation zone was brightly illuminated using a directional
fiberoptic white light source. A black screen was placed behind the sample surface to
provide contrast so that the observer could detect the ablation plume more sensitively. A
rough estimate of the ablation threshold was determined by adjusting the incident pulse
energy using a double Brewster plate polarizer (II-VI Incorporated, Saxonburg, PA) until
an ablation plume was seen, and an acoustic explosion became audible at the surface of
the sample. Once a rough estimate of the ablation threshold was determined, a data
analysis software package known as PROBIT, developed at the Ultrashort Laser
Bioeffects Program at Brooks Air Force Base in San Antonio, TX was used to determine
a more accurate ablation threshold[10]. This method involves varying the pulse energy
delivered slightly above and below the estimated threshold point by rotating the polarizer
while performing the measurement repeatedly until a large sample size is obtained. Due
to the 10% pulse-to-pulse variation of the incident pulse energy delivered by the FEL, it
was critical to know the exact energy of each pulse delivered to the sample for every
50

observation. The pulse energy was measured by picking off a 10% reflection of the
incident beam by inserting a CaF2 window (ISP Optics, Irvington, NY) into the beam
line. This reflection was sent to a pyroelectric detector (J8, Molectron Detector Inc.,
Portland, OR). A calibration curve was plotted by varying the pulse energy with the
polarizer and reading the values from the reflected detector and a reference detector (J50,
Molectron Detector Inc., Portland, OR) at the sample location. A linear fit was
performed on the data to determine the calibration factor between the two detectors. This
calibration factor was then applied to the recorded values from the J8 detector for each
threshold observation.
For each laser pulse, the same observer, blind to the delivered pulse energy, gave
a yes or no response with regards to whether or not any ejected material was seen in front
of the black background. One hundred data points were collected as a 0 or 1 in
combination with the pulse energy as determined by the J8 pyroelectric detector. The
calibration factor was applied and then converted to radiant exposure given a measured
spotsize using a knife-edge technique. These values were then entered into the PROBIT
software in order to determine the results. The software output provided the probability
versus radiant exposure as well as the 10 and 90% fiducial limits of the analyzed data.
The fifty percent probability point, or ED50, of the data is considered to be the ablation
threshold, or the radiant exposure at which there is a 50% chance of ablation. This
procedure was performed on 1, 100, and 200 picosecond pulses for both samples.
51

3.3.3 Ablated Crater Depth Measurement
For the ablated crater depth measurement, we used two samples as well. First we
used 90% w/w gelatin, which served as a consistent model without the biological
variability inherent in mouse dermis. Gelatin, while less rigid than tissue, provides for
more consistent results because it remains more homogeneous throughout irradiation and
exhibits less sample to sample variation. In addition, we used mouse dermis, which when
compared with gelatin helps to provide an accurate view of how varying the micropulse
duration affects the ablation process with respect to the crater depth.
A 500 µm diameter spotsize was focused onto the sample in an air environment
with a CaF2 lens (f=200mm). The hydration state of the sample was carefully
maintained. The sample was placed on a translation stage as described previously to
facilitate the precise movement of the sample with respect to the incident laser beam. All
experiments were carried out with 3 mJ per pulse, which corresponds to a radiant
exposure of ~15 mJ/mm2, with a repetition rate of 5 Hz. Craters were generated with 5,
10, 25, 50, 100, and 500 pulses respectively. The creation of a crater for each parameter
set was repeated five times until a six-by-five matrix of craters with 1.5 mm spacing
between craters was created. A new matrix was created on both gelatin and mouse
dermis for 1, 100, and 200 picosecond pulses at both 6.1 and 6.45 µm.
The analysis was performed by treating the surface of the samples with 6 µm
diameter polystyrene microspheres. These microspheres were used as a contrast agent
that could be focused onto under a light microscope, thus providing for a distinct top and
bottom surface. The focus of the microscope objective was adjusted until a microsphere
on the top of the sample surface was in focus, while taking note of the focusing
52

micrometers location. Next, the objective was adjusted using the focusing micrometer
until a microsphere at the bottom of the ablated crater was clearly in focus. The
difference between the focusing micrometer at the top and bottom of each crater was
calculated as the ablated crater depth with a 6 µm axial resolution (due to the diameter of
the microspheres used). Each of the five craters at each data point was averaged together
to determine the ablated crater depth for each set of sample parameters.
3.4 Results and Discussion
3.4.1 Ablation Threshold Determination
Three curves are obtained as a result of the PROBIT analysis for each threshold
data set (figure 3.4). The middle curve is the probability or dose curve, which indicates
the calculated probability that the ablation event will occur at a given radiant exposure.
The upper and lower curves correspond to the upper and lower 95% confidence intervals
of the data. The 50% probability point on the probability curve is defined as the ED50 of
the data set and is defined here as the ablation threshold. At this point, there is an equal
probability of seeing or not seeing an ablation event. Figure 3.4 shows the comparison of
the probability curve and the upper and lower 95 % confidence intervals for the 200 ps,
pulse on both water and mouse dermis at 6.1 µm. From this figure it can be easily seen
that there is a discernable difference between the threshold of the mouse dermis and that
of water. In addition a clear increase in the spread of the data for the mouse dermis can
be seen, as expected due to the inherent biological variability of the tissue and the
53

0
0.1
0.2
0.3
0.4
0.5
0.6
0.7
0.8
0.9
1
0 1 2 3 4 5 6
Radiant Exposure (mJ/mm2)
Prob
abili
ty
n
200ps water200ps mouse dermis
Figure 3.4 A comparison of the ablation threshold for water and mouse dermis at 6.1 µm with a 200 ps micropulse length is shown. The resultant curves are shown as probability versus radiant exposure in (mJ/mm2). The central solid line represents the probability (dose) curve from the PROBIT analysis. The dotted lines represent the upper and lower 95% confidence intervals of the data. An increased spread in the data for the mouse dermis compared to the water is clearly seen, as is an increase in the threshold radiant exposure.
54

0
1
2
3
4
5
6
7
8
9
Water 6.1 um Water 6.45 um Mouse Dermis 6.1 um Mouse Dermis 6.45 um
Rad
iant
Exp
osur
e (m
J/m
m^2
) .
.
1 ps100 ps200 ps
Figure 3.5 The results of the PROBIT analysis of threshold are summarized in this figure. The threshold radiant exposure in (mJ/mm2) is shown for water and mouse dermis at 6.1 and 6.45 µm for 1, 100, and 200 ps micropulse lengths. The error bars represent the 99% confidence intervals of the data. Each stretched pulse is statistically significant when compared to the 1 ps (native) pulse (P<0.01), except for one outlier at 6.1 µm, 200 ps, on mouse dermis.
55

stochastic nature of the ablation process. A similar set of curves was obtained for each
data set as described above.
The threshold, or ED50, point was taken from each set of curves and plotted plus
or minus the 95% confidence intervals in figure 3.5. This figure summarizes the results
of the threshold experiments. This figure shows the threshold values obtained for water
and mouse dermis for the 1, 100, and 200 ps stretched pulses at both 6.1 and 6.45 µm in
wavelength. The error bars represent the 99% confidence intervals of each data point.
This figure shows a significant difference between the threshold radiant exposures
between 6.1 and 6.45 µm, as expected due to the tenfold increase in absorption
coefficient from 6.45 to 6.1 µm [11].
The difference; however, is smaller than what would be predicted by the
absorption coefficient alone. There are several explanations for this result: the wide
bandwidth of the FEL, red shifting of the absorption spectrum due to heating, and a
decrease in the detection threshold due to less material being removed at 6.1 µm. The
wide bandwidth of the FEL (100 nm), while centered at 6.1 or 6.45 µm also includes a
significant percentage of light from 6.0-6.2 at 6.1 µm (6.35-6.55 at 6.45 µm). As a result,
the detected ablation threshold is an integrated value over the entire FEL spectrum at a
given wavelength, which reduces the difference in the absorption coefficients between
the two wavelengths of interest. As a result of sample heating, the absorption spectrum of
the sample is red shifted [12]. Since the absorption at 6.1 µm is located at a peak, a slight
red shift at the absorption peak leads to a reduction in the absorption coefficient for this
wavelength, which further leads to a reduction in the difference between the two
wavelengths. In addition, the penetration depth at λ=6.1 µm is on the order of 1 µm. At
56

this depth, very little material is removed, making the detection of the event increasingly
difficult. As a result, the detection threshold would tend to be seen as higher than the
actual value for λ=6.1 µm when compared to λ=6.45 µm.
A trend can also be seen for increasing micropulse durations. As the micropulse
duration is increased for both wavelengths, the measured ablation threshold is reduced.
There is a significant difference (P<0.01) for the threshold at 100 and 200 ps when
compared with the 1 ps (native) micropulse duration. The only data point that was not
significant was the 200 ps data point on mouse dermis at 6.1 µm and is considered to be
an outlier. While the trend of decreasing threshold for increasing micropulse durations is
consistent for both wavelengths, the absolute amount of change is quite small (<50% in
all cases) given the large decrease in peak intensity due to the stretching of the
micropulse. The data shows a 1.5 time reduction in threshold given a 200 fold reduction
in peak energy. This suggests that any difference in micropulse duration with respect to
the ablation threshold is insignificant.
3.4.2 Ablated Crater Depth Measurement
The ablated crater depth measurements yielded a total of four graphs. Each graph
shows the measured crater depth for an increasing number of macropulses from five to
five hundred at 1, 100, and 200 ps micropulse durations. The error bars represent the
standard deviation for each data set. Figure 3.6a shows the results obtained at 6.1 µm on
gelatin. This figure shows significant increase (P<0.01) in the ablated crater depth for the
100 and 500 pulse craters at 200 ps when compared with the 1 ps native pulse. Figure
3.6b shows the same set of data on mouse dermis. This data shows a reduction in
57

0
200
400
600
800
1000
1200
0 100 200 300 400 500 600
Number of Pulses
Dep
th (u
m)
1 ps100 ps200 ps
Figure 3.6 A. Crater depth (µm) versus the number of pulses (macropulse) delivered to 90% w/w gelatin at 6.1 µm. The number of pulses was varied between 5, 10, 25, 50, 100, and 500. The micropulse length was varied between 1, 100, and 200 ps. Each data point represents an average of 5 craters. The error bars represent the standard deviation of the 5 craters at each data point. The 100 and 500 pulse craters at 200 ps were found to be significantly deeper (P<0.01) when compared with the 1 ps pulse length.
58

0
50
100
150
200
250
300
350
400
450
0 100 200 300 400 500 600
Number of Pulses
Dep
th (u
m)
1 ps100 ps200 ps
Figure 3.6 B. Crater depth (µm) versus the number of pulses (macropulse) delivered to mouse dermis at 6.1 µm. Each data point represents an average of 5 craters (10 craters at 200 ps). The 50 pulse craters at 100 ps and the 25, 50, 100, and 500 pulse craters at 200 ps were found to be significantly shallower (P<0.01) when compared with the 1 ps pulse length.
59

ablation efficiency by fifty percent when compared to the gelatin data. This reduction is
expected due to the increased structural integrity when compared to gelatin. An
increased spread of the data is also expected due to the inherent biological variability of
the mouse dermis. The opposite trend is also seen when compared to the gelatin data.
The 1 ps pulse leads to the deepest craters, with the 200 ps pulse duration leading to the
shallowest craters. No statistically significant difference was seen between the 100 and
200 ps pulses due to the large spread in the mouse dermis data. The 50 pulse craters at
100 ps and the 25, 50, 100, and 500 pulse craters at 200 ps were found to be significant
(P<0.01) when compared with the 1 ps pulse length. Figures 3.7a and 3.7b represent the
results of the same experiment at 6.45 µm in wavelength. Once again, the stretched
pulses were responsible for creating deeper craters in gelatin, but shallower craters in
mouse dermis. The 10 and 25 pulse craters at 100 ps and the 5, 10, 25, and 500 pulse
craters at 200 ps were found to be significant (P<0.01) when compared with the 1 ps
pulse length in gelatin. No significance was seen given the criterion for P<0.01 in the
mouse dermis data at 6.45 µm. While the same trends were seen at both 6.1 and 6.45 µm
in gelatin and mouse dermis, the absolute differences seen are not large given the spread
in data and the large reduction in peak intensity.
In the absence of photochemical processes, the energy absorbed by the tissue in
response to pulsed laser irradiation is entirely converted to heat. Once the energy is
absorbed, it is subject to spatial redistribution by thermal diffusion. Spatially confined
microsurgical effects can be achieved by the use of laser exposures that are shorter than
the characteristic thermal diffusion time of the heated volume[5]. Thermal confinement
is attained when the ratio of the laser pulse duration to the thermal diffusion time is
60

0
100
200
300
400
500
600
700
800
900
1000
0 100 200 300 400 500 600
Number of Pulses
Dep
th (u
m)
1 ps100 ps200 ps
Figure 3.7 A. Crater depth (µm) versus the number of pulses (macropulse) delivered to 90% w/w gelatin at 6.45 µm. The number of pulses was varied between 5, 10, 25, 50, 100, and 500. The micropulse length was varied between 1, 100, and 200 ps. Each data point represents an average of fifteen craters (10 craters at 100 ps). The error bars represent the standard deviation of the 15 craters at each data point. The 10 and 25 pulse craters at 100 ps and the 5, 10, 25, and 500 pulse craters at 200 ps were found to be significantly deeper (P<0.01) when compared with the 1 ps pulse length.
61

0
50
100
150
200
250
300
350
0 100 200 300 400 500 600
Number of Pulses
Dep
th (u
m)
1 ps100 ps200 ps
Figure 3.7 B. Crater depth (µm) versus the number of pulses (macropulse) delivered to mouse dermis at 6.45 µm. Each data point represents an average of 5 craters. The error bars represent the standard deviation of the 5 craters at each data point. There was no significant difference (P<0.01) for the 100 and 200 ps data when compared with the 1 ps pulse length.
62

somewhat less than 1. If the laser radiation is thermally confined in a small volume of
the tissue, the possibility exists that ablation can occur before it would be expected in the
same volume of water [5, 13]. The rapid heating of tissue by pulsed laser radiation also
leads to the generation and propagation of thermoelastic stresses as the heated tissue
volume reconfigures to its new equilibrium state. Stress confinement is achieved when
the ratio of the laser pulse duration to the stress propagation time is less than 1. Under
these conditions, thermoelastic tensile stresses can be generated leading to a reduction in
both the ablation threshold and the ablation enthalpy [14]. Changing the micropulse
duration from 1 to 200 picoseconds has not caused a change in either the thermal
confinement or stress confinement of the target; therefore, we would not expect to see
any large changes in the ablation metrics studied.
3.5 Conclusions
The data collected in the experiments presented here shows only small changes in
either the ablation threshold or the ablation efficiency resulting from FEL micropulses
that vary over two orders of magnitude in pulse width and equivalently, peak intensity. If
nonlinear effects were important in the ablation mechanism, this variation in intensity
would surely have affected the results more significantly. The ablation threshold is very
sensitive to any change in the physical mechanism, but this data shows only a small
change with micropulse length. These results strongly suggest that nonlinear effects, e.g.
in beam propagation or absorption, are not important in the ablation of soft tissue at a
wavelength of 6.1 µm or 6.45 µm, and are consistent with earlier experiments comparing
lasers with similar peak powers but different average powers[15]. Our results are also
63

consistent with the hypothesis that it is the secondary or tertiary structure of the protein
that is altered when the amide II band is excited, perhaps by assisting the ‘helix-coil’
transition, or by weakening the hydrogen bonds between polymers and bound water
molecules. The stretching and bending of the amide bonds, even at low amplitude, could
conceivably weaken many adjacent bonds which hold together the matrix of collagen
fibers.
Ongoing experiments at Vanderbilt will use an upgraded version of the pulse
stretcher to give FEL micropulses as long as 300 ps; at this pulse width, successive pulses
will overlap in time, giving a quasi-continuous output over the entire macropulse. This
will effectively remove the micropulse structure of the FEL, making it a kilowatt
average-power laser, with no peak power to distinguish from average power during the
macropulse. With the micropulse structure removed, the intensity of the macropulse can
be varied to explore the effect of average power without concern for peak power.
The results of these experiments not only contribute to our understanding of the
mechanism of mid-IR tissue ablation, but also serve to indicate what features of an FEL
pulse train are necessary to effectively cut tissue. The results shown here indicate that the
micropulse train is unimportant relative to the ablation threshold and the ablation
efficiency. The tissue effects of the micropulse train remain to be seen and are addressed
in chapter 4. This information is crucial to the design of smaller and more efficient lasers
that can reproduce the results obtained with the FEL.
64

3.6 References
1. Edwards, G., et al., Tissue ablation by a free-electron laser tuned to the amide II band. Nature, 1994. 371(6496): p. 416-9.
2. Edwards, G.S., M.S. Hutson, and S. Hauger, Heat Diffusion and Chemical
Kinetics in Mark-III FEL Tissue Ablation. SPIE, Commercial and Biomedical Application of Ultrafast and Free-Electron Lasers, 2002. 4633: p. 184-193.
3. Edwards, G., et al., Comparison of OPA and Mark-III FEL for Tissue Ablation at
6.45 Microns. SPIE, Commercial and Biomedical Application of Ultrafast and Free-Electron Lasers, 2002. 4633: p. 194-201.
4. Brau, C.A., Free Electron Lasers. 1990, Boston: Academic Press. 5. Vogel, A. and V. Venugopalan, Mechanisms of pulsed laser ablation of biological
tissues. Chem Rev, 2003. 103(2): p. 577-644. 6. Maine, P., et al., Generation of Ultrahigh Peak Power Pulses by Chirped Pulse
Amplification. Ieee Journal of Quantum Electronics, 1988. 24(2): p. 398-403. 7. Treacy, E.B., Optical Pulse Compression with Diffraction Gratings. Ieee Journal
of Quantum Electronics, 1969. QE 5(9): p. 454-&. 8. Kozub, J.A., et al. Effect of micropulse duration on tissue ablation using a
stretched free electron laser pulse train. in Photonics West. 2004. San Jose, CA: SPIE.
9. Khosrofian, J.M. and B.A. Garetz, Measurement of a Gaussian Laser-Beam
Diameter through the Direct Inversion of Knife-Edge Data. Applied Optics, 1983. 22(21): p. 3406-3410.
10. Cain, C., G. Noojin, and L. Manning, A comparison of various probit methods for
analyzing yes/no data on a log scale. USAF Armstrong Laboratory Technical Report, 1996(Tech. Rep. AL/OE-TR-1996-0102).
11. Hale, G.M. and M.R. Querry, Optical-Constants of Water in 200-Nm to 200-Mum
Wavelength Region. Applied Optics, 1973. 12(3): p. 555-563. 12. Cummings, J.P. and J.T. Walsh, Thermal Changes in the Absorption Spectrum of
Water Near 6.1 um. Lasers in Surgery and Medicine, 1993. Supplement 5: p. 2-3. 13. Uhlhorn, S.R., Free electron laser ablation of soft tissue: The effects of
chromophore and pulse characteristics on ablation mechanics. Ph.D. Thesis, Vanderbilt University, 2002.
65

14. Venugopalan, V., N.S. Nishioka, and B.B. Mikic, Thermodynamic response of soft biological tissues to pulsed infrared-laser irradiation. Biophysical Journal, 1996. 71(6): p. 3530-3530.
15. Kozub, J.A., B. Feng, and W.E. Gabella, Measurements of the spectral and
temporal evolution of FEL macropulses. Proceedings of SPIE, 2002. 4633: p. 153-161.
66

CHAPTER IV
THE EFFECT OF FREE ELECTRON LASER PULSE STRUCTURE ON THE MECHANISM OF SOFT-TISSUE ABLATION AT MID-INFRARED
WAVELENGTHS
Mark A. Mackanos1, John A. Kozub2, David L. Hachey3, Karen M. Joos4, Darrel L. Ellis5, and E. Duco Jansen1
1—Department of Biomedical Engineering
2—W. M. Keck Foundation Free Electron Laser Center
3 – Mass Spectrometry Research Center, Department of Pharmacology
4 – Vanderbilt Eye Institute
5 – Department of Medicine, Division of Dermatology
Vanderbilt University
Nashville, Tennessee 37235
This manuscript was submitted to Physics in Medicine and Biology.
67

4.1 Abstract
Previous studies have shown that changing the pulse structure of the FEL from 1
to 200 ps and thus reducing the peak irradiance of the micropulse by 200 times had little
or no effect on both the ablation threshold radiant exposure and the ablated crater depth
for a defined radiant exposure. This study focuses on the ablation mechanism at 6.1 and
6.45 µm with a careful emphasis on the role of the FEL pulse structure. Three separate
experiments were performed to gain insight into this mechanism. The first was a careful
analysis of the ablation plume dynamics seen for a 1 ps micropulse compared with a 200
ps micropulse as seen through bright-field analysis. The second experiment was a
histological analysis of corneal and dermal tissue to determine whether there is less
thermal damage associated with one micropulse duration versus another. The final set of
experiments involved the use of mass spectrometric analysis to determine whether or not
amide bond breakage could occur in the proteins present in tissue as a result of direct
absorptions of mid-infrared light into the amide I and amide II absorption bands, which
correspond to 6.1 and 6.45 µm respectively. While small differences are seen in the size,
but not the dynamics of ablation, as a result of the brightfield imaging; given the 200 fold
decrease in peak energy, the differences are negligible. It is clear that from an ablation
dynamics standpoint, there is no advantage to having a 1 ps train of pulses. These results
imply that a continuous 5 µs macropulse would be just as effective in creating the same
ablation process. No significant difference was seen in the extent of thermal damage on
either canine cornea or mouse dermis between the 1 and 200 ps micropulse durations at
either wavelength studied. However, 6.1 µm proved to have significantly less thermal
damage compared with 6.45 µm for both tissues. Mass spectrometry also showed that
68

there was no amide-bond breakage due to irradiation at 6.45 µm on protein contrary to
the popular hypothesis held by the FEL community.
4.2 Introduction
The ultimate goal of soft tissue laser ablation is the removal of a well defined
volume of material while leaving the remaining tissue around the ablation site viable. In
order to achieve this, it is necessary to determine the laser parameters that will both ablate
tissue with a relatively high efficiency, while leaving minimal collateral damage. Laser
sources in the ultraviolet and infrared are both good candidates due to their absorption in
biological tissue; however, the mutagenic potential of ultraviolet light precludes their use
in most applications. Therefore, a great deal of focus has been centered on lasers in the
mid-infrared. At mid-infrared wavelengths, specifically, 6.1 and 6.45 µm, light is
absorbed by both water and protein. Studies have shown that lasers operating at these
wavelengths produce efficient ablation with minimal collateral damage, due to a
proposed weakening of the structural integrity of the tissue matrix before explosive
vaporization takes place.
The Vanderbilt Mark-III Free Electron Laser (FEL) operating at 6.45 µm in
wavelength first demonstrated the ablation of soft tissue in a highly efficient manner with
minimal collateral damage (<40 µm) in 1994 [1]; however, the mechanism of this
efficient ablation has not been fully understood to date. In the ten years since this
landmark discovery, a great deal of research has gone into the study of soft tissue ablation
at both 6.1 and 6.45 µm using the FEL for possible clinical applications, including eight
human surgeries. The success of the Mark-III FEL for clinical applications has been
69

limited; however, due to the large overhead and difficult implementation of an FEL as a
clinical laser system.
Transition of this technology to more conventional, smaller, laser sources is
needed for further advancement. Only recently alternative laser sources, covering the
wavelengths of interest, have started to be developed. Our lab is currently investigating
two promising sources: an Er:YAG pumped zinc germanium phosphide optical
parametric oscillator (ZGP-OPO) and a strontium vapor laser based on metal vapor laser
technology. While these lasers operate at the same wavelength as the FEL, their pulse
structures vary significantly from the native FEL pulse structure. In order for these lasers
to replace the FEL as a viable clinical tool, the role of pulse structure in the ablation
mechanism needs to be more completely understood.
The Mark-III FEL is a unique pulsed laser source. The gain medium of this laser
is a series of short pulses of electrons that are accelerated to relativistic speeds and
interact briefly with light stored within the laser cavity [2], the output radiation is
consequently a series of short pulses (about 1 ps), repeated at the electron beam repetition
rate of 2.856 GHz. The micropulse train is maintained for up to 5 microseconds,
providing a total of over 10,000 micropulses per macropulse. During any given
micropulse, the instantaneous power can be up to several megawatts; however, the low
duty cycle keeps the average power during the macropulse below ~ 20 kilowatts. Since
most solid state or gas lasers have a much simpler pulse structure (often quasi-continuous
for tens of nanoseconds), comparison of the FEL with more traditional lasers, even while
operating at the same wavelength is quite complicated. It is essential, for continued
research into alternative sources for the FEL, to determine which of these features are
70

important, be it the high-intensity or high repetition rate of the micropulse or the high
average power during the macropulse.
An analysis of the effect of pulse structure at 6.1 and 6.45 µm involves using the
FEL with a different pulse structure using a pulse stretcher as described in chapter 3.
This offers us the ability to analyze the effect of vastly different pulse structures from the
native FEL pulse on the process of ablation, while still using the same system and
keeping all other parameters constant. The FEL allows us to collect valuable data that
will specify the parameters necessary to help bridge the gap between the multimillion-
dollar FEL and much cheaper and efficient bench top laser sources, as they become
available.
Previous studies have shown that changing the pulse structure of the FEL from 1
to 200 ps and thus reducing the peak irradiance of the micropulse by 200 times had little
or no effect on both the ablation threshold radiant exposure and the ablated crater depth
for a defined radiant exposure. This study focuses on the ablation mechanism at 6.1 and
6.45 µm with a careful emphasis on the role of the FEL pulse structure. Three separate
experiments were performed to gain insight into this mechanism. The first was a careful
analysis of the ablation plume dynamics for a 1 ps micropulse compared with a 200 ps
micropulse as seen through bright-field (pump-probe) analysis. The second experiment
was a histological analysis of corneal and dermal tissue to determine whether there is less
thermal damage associated with one micropulse duration versus another. The final set of
experiments involved the use of mass spectrometric analysis to determine whether or not
amide bond breakage could occur in the proteins present in tissue as a result of direct
absorptions of mid-infrared light into the amide I and amide II absorption bands, which
71

correspond to 6.1 and 6.45 µm respectively. This has been a question for many years
since Edwards et al. published their proposed mechanism of FEL ablation at 6.45 µm[1,
3]. Edwards et al. suggested that a partitioning of energy at this wavelength was
occurring in which the protein structure was being comprised by the light prior to the
explosive vaporization taking place, which led to a reduction in the mechanical and
thermal damage to soft tissues [4]. While this mechanism was proposed, and the FEL
community has been working under this hypothesis, little research has been performed to
confirm it. In an effort to determine whether a chemical change is taking place at the
protein level, prior to explosive vaporization, we used mass spectrometry to determine
the existence, or extent of amide bond breakage in protein due to FEL irradiation at 6.1 or
6.45 µm. These experiments will lead to a better understanding of the laser parameters
necessary for alternative laser sources to have success as replacements for the FEL with
increased clinical relevance.
4.3 Methods
4.3.1 Bright-field Imaging
The brightfield imaging system was implemented on a 1.5 meter long 2 inch
diameter rail (Newport Inc., Irvine, CA). This rail serves as the optical axis for the
imaging system. All of the optical parts are then mounted onto rail carriers for easy
adjustment. Once the imaging system is assembled it can be easily moved from one laser
setup to another.
72

The probe laser for the imaging system was a nitrogen laser (Laser Photonics LN
1000), with a rhodamine dye module. (Laser Photonics LN 102). This laser provides a 4
ns pulse width in a single-shot operation mode at 644 nm in wavelength. The
synchronization between the pump and probe lasers (FEL-Nitrogen) was done with a
digital delay/pulse generator (Stanford Research Systems Inc., Model DG535). The
output of the probe laser source was coupled into a 600 µm multimode fiber with a length
of ~1000 meters (3M Specialty Fibers Power Core Optical Fiber). The fiber length
significantly reduces the coherence of the probe light and therefore improves the image
quality by eliminating speckle. The output of the fiber was mounted to the rail and rail
carrier with a fiber chuck (Newport Inc., Irvine, CA) and then collimated using a 25 mm
focal length plano-convex lens before reaching the sample stage.
The sample was a Petridish of water (0.2 micron filtered biotech grade water,
FisherBiotech) placed on a fixed stage in the focus of the pump laser beam with a beam
diameter of 500 µm as determined by an automated knife-edge measurement technique.
The resultant image was collected using a 105 mm f/2.8D autofocus lens (Nikon Micro
Nikkor Telephoto AF). The image was focused onto a high-resolution color digital video
camera (AVT Dolphin F-145C, Allied Vision Technologies, Germany). The camera was
synchronized with an external trigger to the firing of the nitrogen laser, relative to the
firing of the FEL, through the digital delay/pulse generator.
The results were captured using a Firewire-based software program (FireView,
Intek Software, Germany) and saved as bitmap images on a laptop computer. A single
FEL pulse at a time was imaged by picking it off from the normal pulse train by using a
one-shot box, an electronic circuit that outputs one single TTL pulse synchronized with
73

an FEL laser pulse, to provide for a single shot hitting the target synchronized with the
probe laser and camera, while still allowing the FEL to operate at 30 Hz. An
electromechanical shutter (04 IES 211, Melles Griot, Rochester, New York) was used to
allow one pulse to hit the target at a time. The timing of the probe laser was varied
relative to the start of the pump-laser pulse. The time was varied from 1 µs to 1 ms with
1 µs intervals. Imaging was performed on water in Petri dish oriented on a sample stage
normal to the incident FEL beam. Water provided a constant sample with no variation
between experiments. Imaging was performed with a 1 ps and 200 ps micropulse
duration at 6.1 and 6.45 µm with a 500 µm diameter spotsize as determined by a standard
knife-edge technique[5]. The imaging was performed using a constant pulse energy of 3
mJ which corresponds to three times the ablation threshold at 6.45 µm and ten times the
ablation threshold at 6.1 µm.
4.3.2 Histological Analysis
Histological analysis was performed on ablated craters of both canine cornea and
mouse dermis. Ablation craters were made using 25 pulses per crater with 3 mJ per pulse
at five hertz. The pulse energy was chosen for consistency with the experiments
performed in chapter 3. In addition, the choice of 25 pulses per crater was warranted to
achieve a sufficiently deep crater depth for detection and analysis during histology
without going completely through the sample. From previous results, 25 pulses proved to
be the ideal number of pulses to maximize the crater depth while still not penetrating the
entire sample.
74

4.3.2.1 Canine Cornea
The corneal experiments were performed on intact enucleated canine eyes with
the epithelial layer still intact to provide for a consistent smooth surface for irradiation
thus preventing any damage to the stroma. This was important to prevent any damage to
the stroma that could be mistaken as laser damage during later analysis as well as to
maintain a consistent surface for all samples. The eyes were kept refrigerated upon
removal until the ablation experiments were performed. All eyes were used within 24
hours of enucleation. A three by seven grid of craters was made about the center of each
cornea. The craters were made with a 500 µm diameter spotsize with 1.5 mm spacing
between the centers of adjacent spots.
This experiment was repeated on three eyes for each of the following sets of
parameters: 6.1 µm, 1 and 200 ps; 6.45 µm, 1 and 200 ps, for a total of twelve eyes.
Upon completion of the laser treatment, major axis of the crater grid was marked with a
blue dye for easy identification by the histology technician. The corneas were then
removed with a pair of scissors circumferentially around the sclera. The remaining
cornea was then placed on a special glass dome that supported the corneal shape during
fixation. The corneas were fixed in jars filled with PenFix (Richard-Allen, Kalamazoo,
MI) for twelve hours. The corneas were then processed for embedding in paraffin.
The corneas were cut laterally through their equator perpendicular to the major
axis of the craters to ensure that each histological slice would contain two adjacent slices
of cornea with roughly three craters per slice (Figure 4.1a. Section A.). The two
hemispheres of cornea were then embedded in paraffin with opposite orientation (Figure
4.1a. Section B.). The paraffin block was then sectioned in 10 µm sections and stained
75

A
B 1
1
2
2
A 1
C 2
Figure 4.1 This figure is an illustration of the methods involved in the processing of the tissue samples for histological analysis. A. This figure shows the processing of the corneal samples. Panel A represents the cornea as viewed from above with the craters centered on the cornea. The crater spacing was 1.5 mm, with a total of 3 x 7 500 µm craters. The line represents the location at which the cornea was cut before embedding in paraffin. Panel B shows the orientation of the two hemispheres of the cornea once they were embedded in paraffin. Panel C represents one section of the paraffin block on a glass slide, used for analysis.
76

using hematoxylin and eosin stain for analysis (Figure 4.1a. Section C.). The slides were
analyzed with a 20x objective using a light microscope (Zeiss Axiovert 135, Carl Zeiss
Inc., Thornwood, New York). The slides were analyzed using polarization microscopy as
described by Vogel et al. to locate the area of stroma that had lost its native birefringence
due to thermal denaturation of the collagen within the stroma [6]. This zone was then
compared to the darkened stained region as seen under normal illumination. It was
determined, by the authors, that this zone was identical to that seen under polarization
microscopy and was thus used as the zone of collateral thermal damage. Images of each
slice were recorded using a high resolution color digital video camera (AVT Dolphin
145C, Allied Vision Technologies, Germany) with a 1280x960 resolution. The resultant
images were analyzed by measuring the zone of collateral damage at three locations for
each crater. One measurement was done on each side of the crater just below the
epithelial layer, with the third measurement at the bottom of each crater (marked by
arrows in Figure 4.4.). These three measurements were averaged to arrive at the depth of
collateral damage for each crater slice. Significance was determined by multiplying the
standard error of the mean for each set of data by the critical value for a two-tailed t-
distribution with a 99% confidence interval.
4.3.2.2 Mouse Dermis
The mouse dermis was obtained from freshly sacrificed animals within six hours
of death. The dorsal skin from young mice (<7 weeks) was surgically removed. The
sub-dermal muscle layer was removed with a scalpel. The skin was then stored on saline-
moistened gauze in a refrigerated Petri dish until use within six hours. A three by fifteen
77

matrix of craters was made with 1.5 mm spacing between the centers of each crater.
Once the craters were made at each of the four parameters listed above, the tissue was
marked with a blue stain to identify the location of the crater grid. The skin was then cut
into smaller strips surrounding each grid and placed into sealed tubes of
Tellyesniczky/Fekete fixative for twenty-four hours[7]. Once the skin samples were
fixed they were stored in 70% ethanol until they were prepared for histology.
The samples were cut perpendicular to the major axis of the crater grid in three or
four places (Figure 4.1b. Section A.) and embedded in paraffin (Figure 4.1b. Section B.).
The skin was then sectioned in 10 µm thick slices and mounted on slides (Figure 4.1b.
Section C.). The slides were then stained using Gomori’s trichrome stain for light-
microscopic evaluation [8]. The zone of thermal damage was indicated by tincture
changes in the Gomori’s trichrome-stained tissue. The lateral thermal damage was
defined as the average thickness from the border of tincture change to the edge of the
crater.
4.3.3 Mass Spectrometric Protein Analysis
Mass spectrometric analysis was performed using matrix-assisted laser
desorption/ionization mass spectrometry (MALDI), with an Applied Biosystems Voyager
4335 mass spectrometer (Applied Biosystems, Foster City, CA). A combination of
experiments was performed to test for the presence of amide bond breakage, or any other
bond breakage as a result of mid-infrared laser irradiation.
The first experiment involved using a 10 mg/ml cytochrome c (cytochrome c from
equine heart mol. wt. 12,384, Sigma, St. Louis, MO) solution dissolved in deuterium
78

B
1 B 1 2
3
2
3
1 2 C A 3
Figure 4.1 B. This figure shows the processing of the dermal samples. Panel A represents the dermis as viewed from above with the craters centered on the piece of dermis. The crater spacing was 1.5 mm, with a total of 3 x 15 500 µm craters. The lines represent the locations at which the dermis was cut before embedding in paraffin. Panel B shows the orientation of the three pieces of the cornea once they were embedded in paraffin. Panel C represents one section of the paraffin block on a glass slide, used for analysis.
79

oxide (Cambridge Isotope Laboratories, Andover, MA). Cytochrome c was used to
provide a large protein source with a high number of amide bonds per molecule (103
amide bonds) that would be as similar as possible to what would be contained in tissue,
while deuterium oxide was used to shift the water absorption peak away from the 6.1 µm
location[9] so that the laser energy could be directly coupled into the protein structure
rather than into the surrounding water, since both protein and water absorb at this
wavelength[10]. A custom-made thin layer sample cell consisting of a piece of Parafilm
(127 µm thickness) was used as a spacer mounted to a fused quartz bezel. This thin
sample chamber was used to maximize the amount of sample that would be irradiated by
the laser light, since the penetration depth of the mid-infrared wavelengths is so shallow.
A 5 mm-diameter circle was cut out of the Parafilm to provide for a 2.3 µl sample
chamber. Once the sample was placed in the sample chamber with a pipette, the chamber
was sealed with plastic wrap to prevent subsequent dehydration of the sample.
The sample was irradiated at 6.45 µm with 23.5 mJ in a 0.84 mm diameter spot,
which corresponds to a radiant exposure of 42 mJ/mm2 (10 times ablation threshold for
water). The sample was irradiated by the FEL at 30 Hz for three seconds. The remaining
sample (1 µl) was then removed from the sample chamber with a micro-pipetter and
prepared for MALDI by mixing it with a 1:3 dilution by volume of water with 0.1%
trifluoroacetic acid (TFA). This solution (3 µl) was then mixed with 30 µl of α-cyano-4-
hydroxycinnamic acid (CHCA), 10 mg/ml in acetone, to give a 1:10 dilution which was
then dried onto a stainless steel sample plate which was placed in the mass spectrometer
for analysis.
80

The next experiment placed 1.15 mg of dry powdered cytochrome C into the
sample chamber. This sample was irradiated with the same parameters as described
above for 25 seconds at 30 Hz. The powdered cytochrome C (0.4 mg) was removed from
the sample holder and mixed with 40 µl of water with TFA for a 10 mg/ml dilution. A 3
µl fraction of this solution was then mixed with 6 µl of water with TFA for a 1:3 dilution
to match the concentration of the liquid sample. The resultant 9 µl of sample was then
mixed with 90 µl of 10 mg/ml HCCA in acetone for a 1:10 dilution. The result was once
again placed into the mass spectrometer for analysis.
4.4 Results and Discussion
This paper is primarily concerned with determining the role of the unique Mark-
III FEL pulse structure with regards to the micropulse duration and its effects on the
mechanism of ablation. The analysis moves beyond the simple metrics of threshold
radiant exposure and ablated crater depth and tries to look at effects related to the
ablation plume including: the ablation plume dynamics; histological effects on tissue,
including cornea and skin; and mass spectrometric analysis to determine the presence or
absence of amide bond breakage in protein due to FEL irradiation at 6.45 µm. While our
previous work (Chapter 3 of this dissertation) has shown that there is no significant effect
of FEL micropulse duration on the mechanism of ablation at 6.1 and 6.45 µm with
regards to ablation threshold and efficiency, further analysis of the ablation process is
needed to fill in the understanding of the process in a more complete manner. Once this
understanding is achieved, we will be able to determine whether or not it is possible to
81

transfer this technology to alternative sources that may be more clinically viable than the
FEL.
4.4.1 Bright-field Imaging
The bright-field imaging compares the ablation dynamics between the 1 ps FEL
micropulse and the 200 ps FEL micropulse at 6.1 and 6.45 µm. The imaging results are
shown in figures 4.2 and 4.3. Figure 4.2 is a comparison of 1ps to 200 ps at 6.1 µm with
an energy delivered of 3 mJ per pulse. The ablation process for both sets of images
exhibits similar dynamics. A fast ejecting vapor phase is seen at 5 and 10 µs after the
start of the laser pulse, while the plume of ejected water droplets starts to form at 25 µs.
The plume reaches its maximum size around 100 µs and starts to collapse as seen at 250
µs. By 1 ms, the plume has collapsed, and the recoil of the water is seen. The process is
consistent in both the shape of the plume dynamics as well as their time course. There is
only a slight difference in the size of the ablation plume that can be seen between 1 ps
and 200 ps, with 200 ps being 1.3 times larger in the y-direction; however, given a 200
fold reduction in the peak irradiance of the micropulse, the difference is negligible.
The same process can be seen at 6.45 µm in figure 4.3. The ablation dynamics
and timing are consistent with those seen in figure 4.2 at 6.1 µm. Once again, the
ablation event is marginally larger for the 200 ps stretched pulse when compared to the 1
ps native FEL micropulse (1.1 times larger, y-direction); however the difference is again
minor when compared to the difference in peak irradiance.
The bright-field imaging technique provides an excellent tool for quantifying the
dynamics involved during the time between subsequent FEL macropulses. This
82

Figure 4.2 The results of the bright-field (pump-probe) imaging are shown for 6.1 µm on water. The scale bar represents 1 mm. The images presented were taken at the time intervals shown in microseconds after the start of the subsequent laser pulse. The top eight frames are of an FEL micropulse duration of 1 ps, while the bottom eight frames are of an FEL micropulse duration of 200 ps. A similar ablation mechanism can be seen for both pulse durations with respect to plume dynamics, plume size, and timing. The spotsize of the FEL was 500 µm with 3 mJ per pulse which corresponds to 10x the ablation threshold.
83

Figure 4.3 The results of the bright-field (pump-probe) imaging are shown for 6.45 µm on water. The scale bar represents 1 mm. The images presented were taken at the time intervals shown in microseconds after the start of the subsequent laser pulse. The top eight frames are of an FEL micropulse duration of 1 ps, while the bottom eight frames are of an FEL micropulse duration of 200 ps. A similar ablation mechanism can be seen for both pulse durations with respect to plume dynamics, plume size, and timing. The spotsize of the FEL was 500 µm with 3 mJ per pulse, which corresponds to 3x the ablation threshold.
84

technique provides clear evidence of the ablation related events from the start of laser
irradiation until the ablation event for each individual pulse has concluded. The results
obtained here, further reinforce the conclusions that we have seen in previous analysis. It
was previously shown that increasing the micropulse duration from 1 to 200 ps leads to a
small reduction in the ablation threshold (Chapter 3 of this dissertation). For a fixed
energy (3 mJ), the 200 ps pulse has a reduced threshold associated with it and therefore
reaches higher above the threshold than the 1 ps pulse, which could account for this slight
increase in height. While small differences are seen, given the 200 fold decrease in peak
energy, the differences are negligible. It is clear that from an ablation dynamics
standpoint, there is no advantage to having a 1 ps train of pulses. These results imply that
a continuous 5 µs macropulse would be just as effective in creating the same ablation
process.
4.4.2 Histological Analysis
We next looked at the relevance of the micropulse duration with regards to tissue
damage. We chose two tissues for this analysis due to their wide range of properties and
because they have been used extensively in this type of ablation studied with the FEL and
other lasers[1, 3, 8, 10-21]. Cornea was chosen because of its thin epithelium and
underlying highly ordered and consistent structure of collagen and water in the
stroma[22]. This tissue provided a nice analogue to the gelatin studies that had been
carried out previously as well as modeling studies performed by Edwards and Hutson[23,
24]. Cornea allows for clear histological examination due to its highly consistent
structure, and provided for a well-defined zone of thermal damage that was clearly visible
85

with simple hematoxylin and eosin stain. Mouse dermis was also selected as another
sample to test the ablation process induced by FEL irradiation at 6.1 and 6.45 µm. The
analysis of thermal damage is much more complicated with this tissue; however, it
provides more insight into the role of FEL pulse structure with respect to thermal damage
on soft tissue as the microstructure of the skin is quite different when compared to the
cornea which could lead to varied effects on the thermal damage[10]. Mouse dermis, in
contrast to cornea, has a great deal of biological variation due to the different cell types in
the dermis, epidermis, and hair follicles[7, 8, 25].
4.4.2.1 Canine Cornea
The results of the histological analysis of the canine cornea are summarized by a
qualitative analysis of the slides with respect to the collateral damage produced in the
stroma and a quantitative analysis of the thermal damage produced in the stroma
surrounding the laser ablation site. Specifically, the slides were analyzed for tearing or
fracturing of the stroma around the ablation site to get a qualitative understanding of any
differences present between the 1 ps and 200 ps micropulses at the two wavelengths
studied, as well as a quantitative measure of the zone of thermal damage surrounding the
ablation site.
In each of the four images seen in figure 4.4 the epithelial layer has been
completely removed, while some of the stroma has been removed as well. Accurate
measurements of thermal damage are difficult to obtain in histology specimens due to
processing shrinkage of up to 30% [26]. However, comparison among experimental
groups with identical processing can be made easily. The four ablated-crater images do
86

Figure 4.4 The results of the histological analysis on canine cornea are shown for both 6.1 and 6.45 µm with a 1 and 200 ps micropulse duration. An average of 3 mJ per pulse was delivered for 25 pulses. The scale bar represents 0.1 mm. The zone of thermal damage is clearly seen as a discoloration of the stroma surrounding the ablated crater. The crater extended beyond the epithelial layer into the corneal stroma in each sample.
87

not show any significant tissue fracture or tearing of the stroma around the ablation sites.
In addition, the zone of thermal damage (the darker stained margin surrounding the
crater) appears to quite consistent for all of the parameters examined. There is no clear
difference due to qualitative analysis of the slides for any of the parameters studied.
The result of the quantitative analysis of the dog cornea is summarized in figure
4.5. From a quantitative measure of the zone of thermal damage, the average extent
depth of damage at 6.1 µm was found to be 24.83 µm ± 1.9 µm, 99% confidence at 1 ps
and 24.33 µm ± 1.13 µm, 99% confidence at 200 ps. At 6.45 µm, the zone of damage
was found to be 34.68 µm ± 1.58 µm, 99% confidence at 1 ps and 36.3 µm ± 2.45 µm,
99% confidence at 200 ps. These numbers are consistent with what has been found by
previous investigators with the FEL on cornea[1, 3, 27]. There is no significant difference
between the 1 ps and 200 ps micropulse duration with respect to the average thermal
damage surrounding the ablated craters (n ≥ 60) at either of the wavelengths examined.
There is however, a significant difference between the amount of thermal damage present
between the 6.1 and 6.45 µm craters. This is as expected, since previous authors
confirmed that there was less thermal damage present at 6 or 6.1 µm when compared
with 6.45 µm[3, 28, 29].
The results of this analysis showed no significant difference between the extent
of collateral damage induced by the native FEL pulse train when compared to the
collateral damage induced by the stretched FEL pulse train. The results were well within
the 99% confidence intervals of the data, which were quite small due to the small
variation in the results. Given the large sample size, n ≥ 60, the results are highly
88

0
5
10
15
20
25
30
6.1 um 6.45 um
Dep
th (u
m)
.
1 ps200 ps
Figure 4.5 The quantitative thermal analysis of the canine cornea is shown for the entire parameter space. The error bars represent the 99% confidence intervals (p < 0.01, n ≥ 60).
89
reproducible. It is clear that from the analysis of cornea, there is no effect of the
micropulse duration on the thermal damage surrounding the ablated crater.
4.4.2.2 Mouse Dermis
Figure 4.6 shows the qualitative results of the mouse dermis analysis. This figure
shows a representative image of mouse dermis for each parameter set studied. The white
line indicates the zone of tincture change that was determined to be the extent of thermal
damage in the tissue. Inside this zone, not only is there a tincture change, but the collagen
matrix has lost its ordered structure and can be seen as being more cloudy. In addition,
the structure of the skin within this zone, when compared to the same tissue outside of
this zone, has been structurally changed. These markers for thermal damage were all
used in determining the extent of thermal damage. The damage was then measured as
described in the corneal analysis above.
The quantitative analysis of mouse dermis is shown in figure 4.7. The extent of
thermal damage at 6.1 µm was found to be 9.19 µm +/- 2.52 µm, 99% confidence, for
1ps; compared with 8.96 µm +/- 1.90 µm, 99% confidence, for 200 ps. At 6.45 µm the
extent of thermal damage was found to be 19.92 µm +/- 7.27 µm, 99% confidence, for
1ps; compared with 20.27 µm +/- 5.04 µm, 99% confidence, for 200 ps. There is no
significant difference between the 1 and 200 ps micropulse duration seen at either 6.1 or
6.45 µm. While the error bars seen in figure 4.7, 99% confidence intervals, are larger for
the skin when compared with the cornea (due to increased variation of the dermis when
compared to cornea), the absolute extent of thermal damage and the trend between 6.1
and 6.45 µm is consistent. The results that we obtained were also consistent with the
90

Figure 4.6 The qualitative thermal analysis of the canine cornea is shown for the entire parameter space. The error bars represent the 99% confidence intervals (p < 0.01, n ≥ 60). The white line delineates the zone of thermal damage. An average of 3 mJ per pulse was delivered for 25 pulses. The scale bar represents 0.05 mm.
91

0
5
10
15
20
25
30
6.1 um 6.45 um
Dep
th (u
m)
.
1 ps200 ps
Figure 4.7 The quantitative thermal analysis of the mouse dermis is shown for the entire parameter space. The error bars represent the 99% confidence intervals (p < 0.01, n ≥ 15).
92

thermal damage seen with the FEL by previous authors at these wavelengths; however,
previous authors have shown that the 7 µm region provides for less thermal damage than
the regions we studied[8, 25]. While we were not concerned with obtaining the minimum
possible extent of thermal damage for skin, irradiating it at 6.1 and 6.45 µm gave us
increased insight into the process of thermal damage associated with the micropulse
structure of the FEL. It is clear that there is no effect on the extent or type of thermal
damage associated with the micropulse structure of the FEL. These results show that any
differences seen in the extent of thermal damage are due to wavelength dependence and
not the micropulse structure.
4.4.3 Mass Spectrometry
The results of the mass spectrometric analysis are summarized in figure 4.8a and
figure 4.8b. Figure 4.8a is the native peptide prior to irradiation by the FEL at 6.45 µm.
There are three distinct peaks present in this figure. The peak centered at 12,384 m/z is
for the singly charged cytochrome c molecule and is represented by a 1. The number 2
represents the doubly charged molecule, while the number 3 represents the triply charged
molecule. The large feature of the spectrum along the left edge of the figure is due to the
matrix that was mixed with the cytochrome c sample and is considered noise. Figure
4.8b shows the results of the irradiated protein. The spectrum has exactly the same
features as the native protein. A program called ChemSketch Viewer (ACDLabs.com)
was used to determine the change in mass due to the loss of one or more amide bonds to
determine the possible location for peaks signifying a change in the chemical structure of
the protein. In this spectrum, the region from 7000 to 11000 m/z is where we would
93

Figure 4.8 This figure shows the results of the MALDI experiment performed on cytochrome c. Panel A is the native cytochrome c, while panel B shows the results obtained for the cytochrome c irradiated at 6.45 µm for 3 seconds at 30 Hz with 23.5 mJ and a 0.84 mm diameter spotsize. In each panel, the 1, 2, and 3 represent the singly, doubly, and triply charged cytochrome c peaks respectively. The peak labeled 1 is the singly charged peak of 12,384 m/z. The region between 7,000 and 11,000 m/z in panel B is the location where we would expect to see small peaks indicating amide bond breakage if present.
94

expect to find a few peaks corresponding to the cytochrome c molecule with one or more
amide bonds missing. From this figure, it is clearly seen that no such peaks exist above
the random noise in the spectrum. The results of the mass spectrometric analysis show
that there is no change to the chemical structure of the protein (cytochrome C), whether
dry protein (data not shown), or protein mixed with deuterium oxide as determined by
experts in mass spectrometry. This is consistent with our understanding given that the
bond energy of the amide bond would need ~102 photons at 6.45 µm to be
photochemically broken.
This gives further insight into the ablation mechanism at mid-infrared
wavelengths and helps our understanding of the processes involved in soft tissue ablation
at these wavelengths. It is clear that even given the high peak intensity of the 1 ps
micropulse, ~ 1 GW/cm2, the chemical structure of the protein will remain intact, and
therefore there is no advantage to having the high peak intensity. Therefore, an
alternative, more traditional pulse structure would have no disadvantages and may be a
feasible alternative to the FEL as a surgical ablation laser.
4.5 Conclusions
The results from this research show that there is no “magic” effect of the
micropulse duration on the mechanism of ablation in the mid-infrared that has been
demonstrated with the FEL to have minimal collateral damage with high ablation yields.
The actual ablation plume dynamics remained largely unchanged as a result of increasing
the micropulse duration 200-fold. In addition, the histological analysis on canine cornea
and mouse dermis showed no difference in thermal or mechanical damage between the
95

two different pulse structures. However, 6.1 µm showed significantly less thermal
damage on both cornea and dermis when compared with 6.45 µm. In addition, we
demonstrated that the high peak intensity of the native FEL micropulse had no effect on
the chemical structure of ablated proteins. The research suggest that the unique pulse
structure of the FEL has no advantages for the ablation process, and other more
conventional laser sources such as the ZGP-OPO remain viable alternatives to the FEL.
This is an important finding if this technique is to be transferred to a laser source with
more clinical relevance.
4.6 References
1. Edwards, G., et al., Tissue ablation by a free-electron laser tuned to the amide II band. Nature, 1994. 371(6496): p. 416-9.
2. Brau, C.A., Free Electron Lasers. 1990, Boston: Academic Press. 3. Joos, K.M., et al., Free Electron Laser (FEL) laser-tissue interaction with human
cornea and optic nerve. in: Ophthalmic Technologies VI, J-M Parel, K. M. Joos, P. O. Rol (eds), SPIE, Bellingham, 1996. 2673: p. 89-92.
4. Edwards, G., et al., Tissue Ablation By a Free-Electron Laser Tuned to the
Amide-II Band. Nature, 1994. 371(6496): p. 416-419. 5. Khosrofian, J.M. and B.A. Garetz, Measurement of a Gaussian Laser-Beam
Diameter through the Direct Inversion of Knife-Edge Data. Applied Optics, 1983. 22(21): p. 3406-3410.
6. Vogel, A., et al., Factors determining the refractive effects of intrastromal
photorefractive keratectomy with the picosecond laser. Journal of Cataract and Refractive Surgery, 1997. 23(9): p. 1301-1310.
7. Sundberg, J.P. and D. Boggess, Systematic Approach to Evaluation of Mouse
Mutations. 2000, Boca Raton, FL: CRC Press. 8. Robbins, J., L. Reinisch, and D. Ellis, Wound healing of 6.45-mu-m free electron
laser skin incisions with heat-conducting templates. Journal of Biomedical Optics, 2003. 8(4): p. 594-600.
96

9. Zelsmann, H.R., Temperature-Dependence of the Optical-Constants for Liquid
H2o and D2o in the Far Ir Region. Journal of Molecular Structure, 1995. 350(2): p. 95-114.
10. Vogel, A. and V. Venugopalan, Mechanisms of pulsed laser ablation of biological
tissues. Chem Rev, 2003. 103(2): p. 577-644. 11. Brazitikos, P.D., et al., Erbium:YAG laser surgery of the vitreous and retina.
Ophthalmology, 1995. 102(2): p. 278-90. 12. D'Amico, D.J., et al., Multicenter clinical experience using an erbium:YAG laser
for vitreoretinal surgery. Ophthalmology, 1996. 103(10): p. 1575-85. 13. Edwards, G., et al., Comparison of OPA and Mark-III FEL for Tissue Ablation at
6.45 Microns. SPIE, Commercial and Biomedical Application of Ultrafast and Free-Electron Lasers, 2002. 4633: p. 194-201.
14. Frenz, M., et al., Comparison of the effects of absorption coefficient and pulse
duration of 2.12 um and 2.79 um radiation on laser ablation of tissue. IEEE J Quant Electr, 1996. 32: p. 2025-2036.
15. Howard, J., et al., Healing of laser incisions in rat dermis: comparisons of the
carbon dioxide laser under manual and computer control and the scalpel. Lasers Surg Med, 1997. 20: p. 90-96.
16. Krauss, J.M., C.A. Puliafito, and R.F. Steinert, Laser Interactions With the
Cornea. Survey of Ophthalmology, 1986. 31(1): p. 37-53. 17. Nahen, K., [Acoustic Online-Control of Infrared-Photoablation of Biological
Tissue] German, in Medical Laser Department. 2001, Medical University of Lubeck: Lubeck, Germany. p. 305.
18. Tsubota, K., Application of erbium: YAG laser in ocular ablation.
Ophthalmologica, 1990. 200(3): p. 117-22. 19. van Leeuwen, T.-G., E.D. Jansen, and M. Motamedi, Excimer laser ablation of
soft tissue: a study of the content of rapidly expanding and collapsing bubbles. IEEE Journal of Quantum Electronics, 1994. 30(1): p. 1339-1345.
20. Walsh, J.T. and T.F. Deutsch, Pulsed CO2-Laser Ablation of Tissue - Effect of
Mechanical- Properties. IEEE Transactions On Biomedical Engineering, 1989. 36(12): p. 1195-1201.
21. Zweig, A.D., et al., Lateral thermal damage along pulsed laser incisions. Lasers
Surg Med, 1990. 10(3): p. 262-74.
97

22. McIlwain, J.T., An Introduction to the Biology of Vision. 1996, Cambridge, UK:
Cambridge University Press. 222. 23. Edwards, G.S., M.S. Hutson, and S. Hauger, Heat Diffusion and Chemical
Kinetics in Mark-III FEL Tissue Ablation. SPIE, Commercial and Biomedical Application of Ultrafast and Free-Electron Lasers, 2002. 4633: p. 184-193.
24. Edwards, G.S., et al., Free electron laser based biophyscal and biomedical
instrumentation. Review of Scientific Instrumentation, 2003. 74(7): p. 3207-3245. 25. Ellis, D.L., et al., Free electron laser wavelengh specificity for cutaneous
contraction. Lasers in Surgery and Medicine, 1999. 25: p. 1-7. 26. Thompson, S., 30% Shrinkage of tissue due to fixation during histological
analysis, E.D. Jansen, Editor. 2004: Nashville, TN. 27. Auerhammer, J.M., et al., Dynamic behavior of photoablation products of corneal
tissue in the mid-IR: a study with FELIX. Applied Physics B-Lasers and Optics, 1999. 68(1): p. 111-119.
28. Fowler, W.C., et al., The free electron laser: a system capable of determining the
gold standard in laser vision correction. Nuclear Instruments & Methods in Physics Research Section A -- Accelerators Spectrometers Detectors and Associated Equipment, 1999. 429(1-3): p. 497-501.
29. Jean, B. and T. Bende, Infrared photoablation of the cornea. Klinische
Monatsblatter Fur Augenheilkunde, 1999. 214(4): p. 195-202.
98

CHAPTER V
COMPARISON OF ZnGeP2 OPTICAL PARAMETRIC OSCILLATOR AND MARK-III FREE ELECTRON LASER FOR MID-INFRARED LASER
ABLATION OF SOFT TISSUE
Mark A. Mackanos1, Dmitrii Simanovskii2, H. Alan Schwettman3, and E. Duco Jansen1
1—Department of Biomedical Engineering
Vanderbilt University
Nashville, Tennessee 37235
2 – Hansen Experimental Physics Laboratory
3 – Department of Physics
Stanford University
Stanford, California 94305-4085
This manuscript was prepared for submission in Applied Physics B.
99

5.1 Abstract
The goal of medical laser ablation is to remove material in an efficient manner
with minimal collateral (thermal) damage. A Mark-III free electron laser (FEL), tuned to
6.45 µm in wavelength has demonstrated minimal collateral damage and high ablation
yield in ocular and neural tissues. While the use of this wavelength of light produced by
the FEL has shown much promise for surgical applications, further advances are limited
due the high overhead related with the use of the FEL; therefore, alternative mid-infrared
sources are needed for further development. In this study we compare the Mark-III FEL
with a ZGP-OPO at mid-infrared wavelengths. The ablation threshold of both water and
mouse dermis was determined. The ablation threshold results show that the difference in
pulse structure between these two laser sources has no effect on the ablation threshold of
water or mouse dermis. In contrast, there is a significant difference between the OPO
and FEL crater depths. At 6.1 µm, the OPO craters are 8 times the depth of the FEL
craters. The OPO craters at 6.45 and 6.73 µm are 6 and 5 times the depth of their
corresponding FEL craters respectively. Bright-field (pump-probe) images show the
classic ablation mechanism from formation of a plume through collapse and recoil. The
timescale of the crater formation, ejection, and collapse phases occurs on a faster scale
(5-10 times) for the OPO when compared with the FEL. This research has shown that a
ZGP-OPO laser could prove to be a viable alternative to the FEL for clinical applications.
100

5.2 Introduction
The ultimate goal of medical laser ablation is to remove a defined amount of material
in an efficient manner while doing the least amount of collateral (thermal or mechanical)
damage possible. To this end, two classes of laser sources have been examined;
specifically, lasers in the ultraviolet and the infrared have been studied since they are
both highly absorbed in water and thus tissue [1]. Due to the mutagenic potential of
ultraviolet lasers; however, lasers in the infrared hold more promise for medical
applications [1]. Traditionally, the investigation of mid-infrared tissue ablation has been
centered at 2.1 µm (Ho:YAG) and 2.94 µm (Er:YAG) because these wavelengths are
easily obtainable through conventional laser sources. The thermal damage associated
with these lasers, especially the free-running lasers which have 100-250 µs pulse
durations has been quite significant, since they are not thermally confined. While q-
switching these lasers leads to thermal confinement, the absorption coefficient at 2.94 is
also extremely high (1 µm penetration depth), which leads to a great deal of thermal
diffusion out of the irradiated zone which leads to thermal damage as well [2-5]. Due to
the shortcomings of these wavelengths, the need for laser source around 6 µm is evident.
Investigations in the infrared have recently been centered on two specific wavelengths,
6.1 and 6.45 µm. These wavelengths coincide with the amide-I and amide-II absorption
bands of protein respectively[1]. In addition, these wavelengths coincide with the
bending mode of water, which has a peak absorption at 6.1 µm[1]. At these two
wavelengths, energy is coupled into the protein matrix as well as the bound and unbound
water within the tissue. It has been postulated that some of the energy imparted to the
tissue is coupled into the protein matrix causing conformational changes which then
101

reduces the structural integrity of the tissue allowing for tissue removal with less
collateral damage when compared with other wavelengths [6]. Recently Edwards et al.
have described a model for cornea comprised of superheated saline surrounded by
collagen fibers in which the temperature and pressure of these saline layers increases
until the outer protein layers mechanically fail. At 6.45 µm the collagen becomes brittle
due to denaturation and fractures when marginally stressed, leading to less collateral
damage compared with other wavelengths[7]. Biophysical investigations with a Mark-III
free electron laser (FEL), tuned to 6.45 µm in wavelength have demonstrated minimal
collateral damage and high ablation yield (removal of material) in ocular and neural
tissues [7-12].
The Mark-III FEL has been used successfully in human neurosurgery and ophthalmic
surgery based on these findings [8-10, 13-16]. While the use of this wavelength of light
produced by the FEL has shown much promise for surgical applications, further advances
are limited due the high overhead related with the use of the FEL. Further in depth
investigation and widespread clinical use requires the development of alternative laser
sources in the mid-infrared (6-8 µm); however, the role the unique pulse structure of the
FEL plays in the efficient removal of soft tissue with minimal collateral damage has not
be clearly defined.
Currently several different sources are under investigation as potential FEL
replacements. This includes a strontium vapor laser, based on metal vapor laser
technology, a nonlinear optical parametric oscillator based on an Nd:YAG pumped
ZnGeP2 crystal (ZGP-OPO), and an Er:YAG pumped AgGaSe2 OPO[17-24]. Of these
potential alternative sources, only the ZGP-OPO currently is sufficiently reliable and has
102

enough energy per pulse (~250 µJ) to reach three times the ablation threshold for water
and soft tissue at the wavelengths of interest given a ~60 µm spot size. In addition a
great deal of research has been carried out by this author involving changing the native
structure of the FEL micropulse and is discussed in chapters 3 and 4 of this dissertation.
The results of this research suggest that the micropulse structure of the FEL is not
important to the process of soft-tissue ablation.
This paper focuses on the comparison of the Mark-III FEL with the ZGP-OPO at 6.1,
6.45, and 6.73 µm (similar water absorption compared to 6.45 µm without protein
absorption) in wavelength with a similar spot size. The ablation threshold of both water
and mouse dermis was determined at the three wavelengths of interest with both laser
sources. The 6.1 µm wavelength was chosen due to the location of the water peak and
the amide-I absorption band at this wavelength. The 6.45 µm wavelength was chosen due
to its location at the amide-II absorption band with one tenth the absorption in water as
seen at 6.1 µm. Additionally, 6.73 µm was chosen for comparison because it has roughly
the same water absorption as 6.45 µm with minimal protein absorption. The efficiency of
both lasers with their differing pulse structures was also examined on 90% w/w gelatin
and mouse dermis. In addition, bright-field (pump-probe) imaging was performed to
analyze the dynamics seen in the ablation plume for both laser sources. This research
will provide much insight into the possibility of using a ZGP:OPO as an alternative to the
FEL for medical applications.
From an ablation physics point of view, the pulse durations of both laser sources are
thermally confined, but not stress-confined (FEL micropulse is stress-confined, see Table
5.1). This suggests that both sources should operate in a similar manner with respect to
103

6.1 um 6.45 um 6.73 umAbsorption Coefficient (1/mm) 270 82 62
Penetration Depth (mm) 0.0037 0.0122 0.0161Thermal Confinement Time (s) 2.29E-05 2.48E-04 4.34E-04Stress Confinement Time (s) 2.405E-09 7.919E-09 1.047E-08
FEL micropulse (s) 1.00E-12 1.00E-12 1.00E-12FEL macropulse (s) 5.00E-06 5.00E-06 5.00E-06
ZGP-OPO (s) 1.00E-07 1.00E-07 1.00E-07
Table 5.1 This table summarizes the relevant ablation parameters for the FEL and the ZGP-OPO for the three wavelengths used.
104

the ablation threshold and the ablation efficiency. The 100 nanosecond pulse of the ZGP-
OPO suggests that the ablation dynamics from the sub-ablative phase, development of the
vapor plume, and material ejection will be similar to that seen with the 5 microsecond
FEL macropulse while occurring on a much shorter timescale[25]. Each of these was
examined in depth by the proceeding research.
5.3 Methods
In this research we used both a Mark-III free electron laser and an Er:YAG
pumped ZGP optical parametric oscillator for the comparison of the effect of pulse
structure on the ablation threshold, ablated crater depth (ablation efficiency), and the
ablation plume dynamics. By using identical optics and maintaining constant controls
over all parameters, we were able to gain a great deal of insight into the effect of pulse
structure on the ablation of soft-tissue for comparison of these two laser sources.
5.3.1 Mark-III Free Electron Laser
The Mark-III FEL is a unique source of mid-infrared pulsed laser radiation. The
gain medium, in contrast to traditional lasers, is a series of short pulses of electrons that
are accelerated to relativistic speeds and interact briefly with light stored within the laser
cavity [26], the output radiation therefore, is a series of short pulses (about 1 ps), repeated
at the repetition rate of the electron beam, which is 2.856 GHz. This micropulse train is
maintained for up to 5 microseconds, providing for over 10,000 micropulses per
macropulse [27]. During any given micropulse, the instantaneous power (peak power)
can be several megawatts; however, the low duty cycle of the macropulse keeps the
105

average power below ~ 20 kilowatts [27]. The spectral bandwidth of the FEL is also non-
negligible with a minimum limit of 1% of the target wavelength and typically varied
between 60-100 nanometers depending on the operating parameters for our experiments.
Since most solid state or gas lasers have a much simpler pulse structure (often quasi-
continuous for tens of nanoseconds), comparison with other lasers, even if operating at
the same wavelength, is difficult. It is, however, essential to determine which of these
features are important, be it the high-intensity during the short micropulses, the unusually
high repetition rate, or the high average power during the macropulse. In an effort to
determine whether or not these parameters are important, another laser source with a
more traditional pulse structure, operating at the same wavelengths needs to be examined.
5.3.2 Er:YAG pumped ZnGeP2 Optical Parametric Oscillator
The tunable infrared laser source used for comparison was a zinc-germanium-
phosphide optical parametric oscillator (OPO) (Picarro, Inc., Sunnyvale, CA). The OPO
was pumped by a Q-switched erbium doped yttrium aluminum garnet (Er:YAG) laser
operating at λ=2.94 µm with a 100 ns pulse duration and 2-3 mJ per pulse and a TEM00
spatial mode[24, 28]. The Er:YAG was in turn pumped by a flashlamp with 8-9 J per
pulse from 1-5 Hz. An AR-coated 20x10x7 mm ZGP crystal (Inrad, Inc., Northvale, NJ)
was cut for type-II phase matching and used in a cavity with two mirrors separated by 3
mm[29]. Tuning of the OPO was achieved by rotating the crystal with a computer driven
motion controller (Newport, Irvine, CA)[29]. A continuous tuning range from 6-8 µm
was optimized with the two mirrors of the OPO cavity. The maximum energy per pulse
was ~250 µJ.
106

5.3.3 Ablation Threshold Determination
For the measurement of the ablation threshold, two different samples were chosen;
water (0.2 micron filtered biotech grade water, FisherBiotech) and mouse dermis. Water
was used because it provides an unchanging level surface for ablation regardless of the
number of pulses delivered by the laser, while maintaining constant hydration. The water
level was carefully maintained to make sure that there were negligible evaporative losses
to prevent the spot size from changing throughout the course of the threshold
measurements. Water provides an easily obtainable and consistent source for comparison
between different wavelengths and pulse durations. Unfortunately, water does not
provide a complete picture of the effects of tissue ablation. While water does absorb the
wavelengths of interest, it lacks the amide I and II absorption peaks, corresponding to 6.1
and 6.45 µm respectively, and the mechanical strength (structure) exhibited by tissue.
Therefore, it was necessary to carry out additional experiments on excised mouse dermis.
Mouse dermis samples were harvested from sacrificed mice within 24 hours post-
mortem. The skin was shaved and depilated using Nair and rinsed multiple times using
saline solution. Thin strips of skin approximately 1.5 cm in size were removed from the
ventral side of the mouse, cleaned of fascia, and stored in a refrigerator on saline soaked
towels until use. The skin strips were used within 24 hours of harvesting for all
experiments. Skin samples were irradiated on the sub-dermal side to minimize variation
between samples due to age, hydration state, and hair.
The threshold determination was performed using a ~60 µm, diameter spot size
for the OPO, as determined by diffraction-limited geometry and confirmed through the
use of a standard knife-edge technique; and a ~90 µm diameter for the FEL, as
107

determined by an automated knife-edge technique[30]. The laser was expanded and
refocused onto a flat piece of mouse dermis on a 3-axis translation stage (Newport Inc.,
Irvine, CA) by a set of convex and concave gold mirrors. The convex mirror had a focal
length of -104.6 mm, while the concave mirror had a 304.8 mm focal length. The f-
number of the system was 5.41 and the minimum obtainable spot was roughly the
wavelength times the f-number. The stage allowed for the movement of the sample under
the focus of the incident laser beam, so that each successive laser pulse ablates a new
location. The skin was moved 0.5 mm at a time to maintain the proper spacing between
ablation points to avoid any overlap between successive pulses.
Great care was taken to maintain a consistent hydration state of the dermis. It has
been seen through previous experiments of this type that the water content of the skin,
especially at the surface, will decline rapidly due to evaporation; therefore, as the water
content changes, so will the ablation threshold. The experiments were run as quickly as
possible to avoid any large changes in threshold due to evaporation. In addition, a fresh
piece of skin was used for each successive set of measurements.
The FEL was operated at 30 Hz to maintain reasonable (~10%) pulse-to-pulse
stability in pulse energy, while an electromechanical shutter (Melles Griot, Rochester,
NY) along with specially built timing circuit was used to pick off a single pulse for
irradiation of the sample. The OPO was operated at 5 Hz and a shutter was used to pick
off a single pulse. The ablation zone was brightly illuminated using a directional fiber-
optic white light source. A black screen was placed behind the sample surface to provide
contrast so that the observer could detect the ablation plume more sensitively. A rough
estimate of the ablation threshold was determined by adjusting the incident pulse energy
108
using a double Brewster plate polarizer (II-VI Incorporated, Saxonburg, PA) until an
ablation plume was seen, and an acoustic explosion becomes audible at the surface of the
sample. Once a rough estimate of the ablation threshold was determined, a data analysis
software package known as PROBIT, developed at the Ultrashort Laser Bioeffects
Program at Brooks Air Force Base in San Antonio, TX was used to determine a more
accurate ablation threshold[31]. This method involves varying the pulse energy delivered
slightly above and below the estimated threshold point by rotating a double Brewster
plate polarizer while performing the measurement repeatedly until a large sample size is
obtained. Due to the 10% pulse-to-pulse variation of the incident pulse energy delivered
by the two lasers, it was critical to know the exact energy of each pulse delivered to the
sample for every observation. The pulse energy was measured by picking off a 10%
reflection of the incident beam by inserting a CaF2 window (ISP Optics, Irvington, NY)
into the beam line. This reflection was sent to a pyroelectric detector (J8, Molectron
Detector Inc., Portland, OR). A calibration curve was plotted by varying the pulse
energy with the polarizer and reading the values from the reflected detector and a
reference detector (PE10, Ophir Optronics, Wilmington, MA) at the sample location. A
linear fit was performed on the data to determine the calibration factor between the two
detectors. This calibration factor was then applied to the recorded values from the J8
detector for each threshold observation.
For each laser pulse, an observer, blind to the applied pulsed energy, gave a yes or
no response with regards to whether or not any ejected material was seen in front of the
black background. One hundred data points were collected as a 0 or 1 in combination
with the pulse energy as determined by the J8 pyroelectric detector. The calibration
109

factor was applied and then converted to radiant exposure given a measured spot size
using a knife-edge technique[30]. These values were then entered into the PROBIT
software in order to determine the results. The software output provided the ablation
probability versus radiant exposure as well as the 10 and 90% fiducial limits of the
analyzed data. The fifty percent probability point, or ED50, of the data is considered to be
the ablation threshold, or the radiant exposure at which there is a 50% chance of ablation.
This procedure was performed at 6.1, 6.45, and 6.73 µm for both the OPO and the FEL
on each sample.
5.3.4 Ablated Crater Depth Measurements
Ablated crater depth measurements were made on gelatin and mouse dermis. Gelatin
(90% w/w) served as a consistent model without the biological variability inherent in
mouse dermis. While less rigid than tissue, gelatin provides for more consistent results
because it is relatively reproducible and remains more homogeneous throughout
irradiation. In addition, we used mouse dermis, which when compared with gelatin helps
to provide an accurate view of the ablation process with respect to the crater depth.
A 60 µm diameter beam (90 µm, FEL) was focused onto the sample in an air
environment with the mirror system described above. The 60 µm diameter spot size
corresponds to the diffraction limited spot size in the 6 µm region of the infrared
spectrum, which is the smallest spot size that could be achieved with the ZGP-OPO. This
spot size was necessary, due to the energy limitations of the ZGP-OPO, to achieve three
times the ablation threshold for water. The smallest spot size that could be achieved with
the FEL for comparison was 90 µm, due to diffraction of the beam through the polarizer.
110

The hydration state of the sample was carefully maintained to ensure the accuracy of this
method. The sample was placed on a translation stage as described previously to
facilitate the precise movement of the sample with respect to the incident laser beam. All
experiments were carried out with a radiant exposure at three times the ablation threshold
at each wavelength, as determined above, with a repetition rate of 5 Hz. Craters were
generated with 1, 5, 10, 25, 50, 100, and 500 pulses respectively. Each point was
repeated five times until a seven-by-five matrix of craters with 0.5 mm spacing between
craters was created. A new matrix was created on gelatin and mouse dermis at 6.1, 6.45,
and 6.73 µm for each laser source.
The analysis was performed by treating the surface of the samples with 6-µm
diameter polystyrene microspheres suspended in water. These microspheres were used as
a contrast agent that could be focused onto under a light microscope, thus providing for a
distinct top and bottom surface for each crater. The focus of the microscope objective
was adjusted until a microsphere on the top of the sample surface was in focus, while
taking note of the focusing micrometers location. Next, the objective was adjusted using
the focusing micrometer until a microsphere at the bottom of the ablated crater was
clearly in focus. The difference between the focusing micrometer at the top and bottom
of each crater was calculated as the ablated crater depth. Each of the five craters at each
data point was averaged together to determine the ablated crater depth for each set of
sample parameters.
111

5.3.5 Bright-field Imaging
The bright-field imaging system was implemented on a 1.5 meter long 2 inch
diameter rail (Newport Inc., Irvine, CA) as shown in figure 5.1. This rail serves as the
optical axis for the imaging system. All of the optical parts are then mounted onto rail
carriers for easy adjustment. Once the imaging system is assembled it can be easily
moved from one laser setup to another.
The probe laser for the imaging system with the FEL was a nitrogen laser (Laser
Photonics LN 1000), with a rhodamine dye module. (Laser Photonics LN 102). This
laser provides a 4 ns pulse width in a single-shot operation mode at 644 nm in
wavelength. The probe laser for the OPO experiments was a combination of four laser
sources. A Nd:YLF laser (Spectra Physics Millenia) provides a continuous wave of 5
watts at 527 nm. This pumps a Ti:Saph oscillator stage (Spectra Physics Tsunami) which
provides 100 fs pulses with a repetition rate of 80 MHz and an average power of 1 watt.
The output of the oscillator is then sent to regenerative amplifier (Spectra Physics
Spitfire) which is in turn pumped by a pulsed Nd:YLF at 527 nm with 8 mJ per pulse
(Spectra Physics Merlin). The regenerative amplifier stretches the oscillator pulse to 1 ns
with 1 mJ at 800 nm in a single shot mode.
The synchronization between the pump and probe lasers (FEL-Nitrogen or OPO-
Regenerative Amplifier) was done with a digital delay/pulse generator (Stanford
Research Systems Inc., Model DG535). The output of the probe laser source (both) was
coupled into a 600 µm multimode fiber with a length of ~1000 meters (3M Specialty
Fibers Power Core Optical Fiber). The fiber length significantly reduces the coherence of
the probe light and therefore improves the image quality by eliminating speckle. The
112

Figure 5.1 The bright-field (pump-probe) imaging setup is shown. The probe laser is a nitrogen dye laser with a 4 ns pulse duration. The pump laser is either the FEL or the ZGP-OPO. All of the components are mounted on a rail to maintain their alignment for easy adjustment and movement.
N2 Dye Laser (Probe)
Mid-IR Source (Pump)
Fiber
Illuminating Imaging Lens
Digital VideoCamera
Sample Lens
113

output of the fiber is mounted to the rail and rail carrier with a fiber chuck (Newport Inc.,
Irvine, CA) and then collimated using a 25 mm focal length plano-convex lens before
reaching the sample stage. The sample was a Petridish filled with water placed on a fixed
stage in the focus of the pump laser beam (beam diameter = 60 µm (90 µm FEL)). The
resultant image was collected using a 105 mm f/2.8D autofocus lens (Nikon Micro
Nikkor Telephoto AF). The image was focused onto a high resolution color digital video
camera (AVT Dolphin F-145C, Allied Vision Technologies, Germany). The camera was
synchronized with an external trigger to both lasers through the digital delay/pulse
generator.
The results were captured using a Firewire-based software program (FireView,
Intek Software, Germany) and saved at bitmap images on a laptop computer. The FEL
was operated at 30 Hz using a one-shot box, an electronic box that takes a trigger
synchronized to the FEL at 30 Hz and outputs a single TTL pulse synchronized to the
next subsequent FEL pulse when activated, to provide for a single shot hitting the target
synchronized with the probe laser and camera. An electromechanical shutter (Melles
Griot, Rochester, NY) was used to allow one pulse to hit the target at a time. The OPO
laser ran freely at 2 Hz with a camera image sampled for each pump pulse. The timing
of the probe laser was varied relative to the start of the pump laser pulse. The time was
varied from 1 µs to 1 ms with 1 µs intervals.
114

5.4 Results and Discussion
5.4.1 Ablation Threshold Determination
The ablation threshold on water and mouse dermis was determined at 6.1, 6.45,
and 6.73 µm for both the OPO and FEL lasers. The results are summarized in Figure 5.2.
The error bars in this figure represent the 99% confidence intervals of the data; therefore
data points with error bars that do not overlap represent significance with a p<0.01.
When comparing the results on water, it is clearly seen that there is no significant
difference at either 6.1 or 6.73 µm between the two lasers. There is however, a small
difference at 6.45 µm that is significant. Given the results of the other two wavelengths
and the small difference between the two lasers (FEL is 1.4 times OPO); however, data
point does not fit the observed trend.
Three possibilities exist to explain this data point not fitting the trend. The first
possibility is inaccuracy in the measurement of the spot size. While every possible step is
taken to insure a careful measurement in the spot size, the most accurate estimation of the
spot size that can be obtained is only within ±10% of the diameter. When the diameter is
used to calculate the area of the spot to determine the radiant exposure, this error is
squared, which can easily account for the 8.5% difference between the lower confidence
limit of the OPO data point and the upper confidence limit of the FEL data point. In
addition, there was a small difference in the measured spot size of the OPO and FEL
experiments as described in the methods section. The OPO spot size was ~60 µm while
the FEL spot size was ~90 µm. Both of these were at the diffraction limit for both lasers
with the given set of optics and could not be made any closer; the FEL could not be made
115

0
5
10
15
20
25
30
35
40
45
OPO-Water FEL-Water OPO-Mouse Dermis FEL-Mouse Dermis
Rad
iant
Exp
osur
e (m
J/m
m^2
) .
.
6.1 um6.45 um6.73 um
Figure 5.2 The threshold radiant exposure in (mJ/mm2) is shown for water and mouse dermis at 6.1, 6.45, and 6.73 µm for the OPO and FEL. The error bars represent the 99% confidence intervals of the data. Only the threshold for water at 6.45 µm is significant (P<0.01), between the two lasers. All other data points are within the confidence intervals for the data. Note: the 6.1 µm data point on mouse dermis with the OPO could not be determined because it was below the detection threshold of the measurement.
116

smaller while the OPO could be made larger except that there would be insufficient
radiant exposure to carry out the experiments. Therefore, it is possible that a systematic
error exists between the two measurements due to less material ejection and thus less
light scattering of material in the ejection plume for the OPO laser with the smaller spot
size. The smaller spot size of the OPO laser would make the detection threshold for the
observer higher, since there would be less light scattering for detection. This would
indicate that the threshold radiant exposure for the OPO data should be higher at each
wavelength, which is seen, although the 6.45 µm data point is the only one that is
significant. This would also be apparent in the larger spread of the data which is seen
through the increased size of the error bars for the OPO data, further confirming our
results. The final explanation for this outlier is given by the wide bandwidth of the FEL
spectrum. While the peak intensity of the spectrum is tuned to the wavelength of choice,
the limitations inherent in the FEL are such that there can be up to 50 nm of additional
bandwidth to either side of the central wavelength, as seen experimentally, depending on
the operating parameters of the FEL on a given day. Conversely, the spectrum of the
OPO is extremely narrow. This means that the integrated absorption for the FEL could
vary somewhat significantly from that of the OPO which could also account for the small
difference in the threshold measurements. Given these three possible sources of error in
the threshold measurements, the results suggest that there is no significant difference
between the two laser sources with respect to the threshold radiant exposure of water at
any of the wavelengths investigated.
The threshold radiant exposure was also measured on mouse dermis. The results
are also shown in Figure 5.2. The results show an increase in the threshold values on the
117

order of 1.5 to 3 times the values obtained for water. This is to be expected for two
reasons: first, there is a reduction in the absorption coefficient of skin with respect to
water due to the added protein content of skin, which increases the measured threshold;
second, the increased mechanical integrity of the tissue matrix leads to a further increase
in the measured threshold. This is not unexpected from what has been seen by other
authors [1].
This trend mirrors that observed for water; with 6.1 µm having the lowest
threshold and 6.73 µm having the highest threshold, which corresponds to the lower
absorption coefficient at higher wavelengths. It is also seen that there is no significant
difference between the threshold values for each laser at 6.45 and 6.73 µm. The data
point for mouse dermis at 6.1 µm with the OPO is missing, however. This was caused
because the threshold could not be determined due to a lack of energy necessary to reach
the detection threshold. The small (60 µm) spot size made it very difficult for an
observer to detect any ablation plume in mouse dermis at all. This was further
accentuated by the small penetration depth at 6.1 µm which is on the order of 1 µm.
Since such a small amount of material is available for the scattering of light for detection
by the observer, it was not possible to see the ablation event at this wavelength. Even if
the energy was available for detection at this wavelength, the measured value would be
quite different from the expected value due to the shortcoming of the detection threshold
at this wavelength. The results from both water and mouse dermis provide evidence that
no significant difference exists between the two lasers as a result of their vastly different
pulse structures with respect to the threshold radiant exposure.
118

5.4.2 Ablated Crater Depth Measurements
The ablated crater depth results, in contrast to the threshold measurements, show a
marked difference between the OPO and the FEL. Figure 5.3 shows a comparison of the
measured crater depth in 90% w/w gelatin at three times the ablation threshold as
determined above for 1, 5, 10, 25, 50, 100, and 500 pulses at the three wavelengths of
interest for the two laser sources. The single-pulse crater depth for the FEL was below
the measurement threshold.
The results for the measured crater depth with respect to the number of pulses
delivered at 3 times threshold shows a clear increasing trend for both laser sources as
expected. The OPO data also shows a clear trend of smaller crater depths with increasing
wavelengths. This is expected because there is less thermal diffusion out of the irradiated
zone for shorter wavelengths (higher absorption coefficient) and thus the material is
removed more efficiently for the same amount of energy when compared to the longer
wavelengths where there is more thermal diffusion out of the irradiated zone. Although
there is a clear trend with the wavelengths for the OPO, a similar trend is not seen for the
FEL data, there is no significant difference between the 6.1 and 6.45 µm data from the
OPO. In addition there is no significant difference between the 500 pulse data point for
any of the three wavelengths of the OPO. The error bars represent the 99% confidence
intervals of the data with p<0.01. The FEL data, by contrast, shows no such decreasing
trend with increasing wavelength, while there is no significant difference between any of
the three wavelengths seen for the FEL.
There is however, a significant difference between the OPO and FEL crater
depths at each wavelength. At 6.1 µm, the OPO craters are 8 times the depth of the FEL
119

0
100
200
300
400
500
600
6.1 OPO 6.1 FEL 6.45 OPO 6.45 FEL 6.73 OPO 6.73 FEL
Cra
ter D
epth
(um
) .
1 pulse5 pulses10 pulses25 pulses50 pulses100 pulses500 pulses
Figure 5.3 This figure shows the crater depth in µm versus the number of pulses (macropulse) delivered to 90% w/w gelatin at 6.1, 6.45, and 6.73 µm. The number of pulses was varied between 1, 5, 10, 25, 50, 100, and 500 (1 pulse was below the measurement threshold for the FEL). Each data point represents an average of five craters. The error bars represent the 99% confidence intervals of the 5 craters at each data point. Almost all of the crater depths for the OPO were found to be significant (P<0.01) when compared with the FEL.
120

craters. The OPO craters at 6.45 and 6.73 µm are 6 and 5 times the depth of the
corresponding FEL craters respectively.
Figure 5.4 shows the results of the same experiment performed on mouse dermis.
This figure only plots the results from the OPO, as the FEL craters were all less than 20
µm deep, which was below the detection limits of our measurement system. Therefore,
an accurate measurement for these craters could not be obtained but we can conclude that
the FEL results were consistently shallower than the OPO results. The reduction in crater
depth for the FEL relative to the OPO is consistent with the gelatin findings however. As
expected, the craters in mouse dermis were significantly smaller when compared with the
gelatin craters due to the increases structural integrity of the dermis. No significant
difference was seen between the three wavelengths using the OPO on mouse dermis.
Additionally, the error bars are quite large compared to those obtained in gelatin, due to
the inherent biological variability.
The discrepancy between the crater depth of the OPO and FEL is a significant
finding, and one that warranted a great deal of added exploration. To confirm these
results, another set of identical experiments was performed using the FEL and OPO at
different times to confirm the results that were obtained. The results proved to be
consistent with the original results. Two additional experiments were also performed to
lend further insight into this discrepancy.
First, it was observed that during experiments with the FEL using a 500 µm
diameter spot size, at three times the ablation threshold for this spot size, the measured
crater depth was more consistent with the OPO data (see chapter three); therefore, an
experiment was performed to look at the effect of decreasing the spot size while holding
121

0
20
40
60
80
100
120
140
160
6.1 OPO 6.45 OPO 6.73 OPO
Cra
ter D
epth
(um
) . 5 pulses
10 pulses25 pulses50 pulses100 pulses500 pulses
Figure 5.4 This figure shows the crater depth in µm versus the number of pulses (macropulse) delivered to mouse dermis at 6.1, 6.45, and 6.73 µm. The number of pulses was varied between 5, 10, 25, 50, 100, and 500. Each data point represents an average of five craters. The error bars represent the 99% confidence intervals of the 5 craters at each data point. The FEL crater depth are not shown because there were all less than the measurement threshold (<20 µm).
122

a constant radiant exposure on the depth of the resultant crater. This experiment showed
that by decreasing the spot size from 500 µm to 150 µm, a reduction in the crater depth
on the order of what was measured with the FEL with a 90 µm spot is expected which
further confirmed our results (Figure 5.5).
As a result of the discrepancy seen in crater depth between the ZGP-OPO and the
FEL, we are left with the question of whether the difference is due to the macropulse
duration (100 ns vs. 5 µs) or the micropulse structure (continuous vs. 1 ps at 2.85 GHz).
Ideally, a direct comparison of 100 ns macropulses with and without the micropulse
structure would be done, but the lack of pulse energy with the FEL prevents this
comparison at present. The second important question is how the crater depth (ablation
efficiency) scales with spot size for the ZGP-OPO. Unfortunately, the limited output
energy of the OPO (250 µJ) prevents experiments with a spot size much larger than ~100
µm.
Given the limitations of the two laser sources we are unable to perform any
further experiments to probe any deeper into the discrepancy seen in the crater depths
between the OPO and FEL; therefore, we cannot experimentally confirm the
mechanism(s) responsible for this observation with the limited understanding that we
have. It seems likely that there the fundamental differences between the pulse duration of
the two lasers will lead to the results that we have seen. However, one possible
experiment involves using a Pockels cell to look at the effect of reducing the macropulse
duration of the FEL on the crater depth (ablation efficiency). While there is insufficient
energy to directly compare a 100 ns pulse, it is possible to start with a 5 µs pulse duration
at three times the ablation threshold of water and decrease the pulse duration until the
123

0
50
100
150
200
250
300
350
400
0 0.1 0.2 0.3 0.4 0.5 0.6 0.7 0.8 0.9
Spotsize (mm)
Cra
ter D
epth
(um
) .
Figure 5.5 This figure shows the crater depth vs. spot size at 6.1 µm with a constant irradiance of 1 J/cm2. All craters were made with 100 pulses at five hertz on 90% w/w gelatin. The values shown are for an average of four craters. The error bars represent the standard deviation of the craters.
124

energy falls below the 3 times threshold mark. Hopefully, this will show a trend that will
provide more insight into this result to help determine whether the observed effect is a
result of the macropulse duration or the micropulse structure of the two lasers.
While further experimental investigation is limited, it is possible to suggest a few
possible mechanisms. Since the FEL macropulse is long compared to ablation times, it is
possible that plume screening could play a role in the reduced efficiency seen by the FEL,
as ejected material from ablation early on in the FEL macropulse could screen energy
from the latter part of the macropulse from reaching the tissue and thus reducing the
efficiency. The energy density of the OPO is also higher which could lead to a red-
shifting of the spectrum of the tissue causing an increase in the relative absorption and
thus an increase in the efficiency. In addition, by looking at the ablation event from a
modeling perspective, if the blow off ablation model is applied to the OPO, in which all
of the energy is essentially dumped into the system before the onset of ablation, and the
steady state ablation model, in which the target tissue reaches the onset of ablation during
laser irradiation and then continues to absorb energy at a constant rate during the
remainder of the pulse, then we would expect to see ~50% deeper craters associated with
the ZGP-OPO.
5.4.3 Bright-field Imaging
The bright-field imaging of water is summarized in three figures containing
sixteen frames per figure (Figures 5.6-5.8). The top eight frames of each figure
correspond to the ablation process seen for the FEL for a given delay after the start of the
FEL pulse of 1 µs to 250 µs. The bottom eight frames are the corresponding frames for
125

the OPO laser. Figure 5.6 shows the OPO comparison for three times the ablation
threshold at 6.1 mm. Figure 5.7 and 5.8 shows the same comparison for 6.45 and 6.73
µm respectively.
The images show the classic ablation mechanism from the initial onset of the
ablation plume through the expansion of the ablation plume and the subsequent collapse
and recoil phases. The same mechanism is seen for the OPO and FEL at all three
wavelengths. No differences are seen between the two laser sources with respect to the
dynamics of plume formation and collapse except for the timescale. A small difference
in the size of the plume is seen between the FEL and OPO due to the small difference in
spot size. The size of the plume increases with increasing wavelength due to the increase
in the penetration depth, as well as an increase in the energy delivered. A larger volume
of water is being ablated leading to a larger ablation plume.
The one difference that can be seen as a result of the imaging is in the timing of
the ablation event due to the difference in pulse duration. The onset of the ablation event
due to the OPO pulse is seen at 1 µs after the onset of the laser pulse, which corresponds
to 0.9 µs after the end of the laser pulse. In contrast, the onset for the FEL does not begin
until 10 µs after the start of the laser pulse, which corresponds to 5 µs after the end of the
laser pulse. Similarly, the largest ablation plume is seen at 5 µs (4.9 µs after the end of
the pulse) for the OPO laser, while the largest plume is seen at 25 µs (20 µs after the end
of the pulse) for the FEL. These results are consistent for all three wavelengths,
indicating that it is a pulse duration dependent event and not a wavelength dependent one.
This finding reinforces the results of the crater depth measurements. The energy is being
delivered much more quickly by the OPO when compared with the FEL which shows
126

Figure 5.6 The results of the bright-field (pump-probe) imaging are shown for 6.1 µm. The scale bar represents 1 mm. The images presented were taken at the time intervals shown in microseconds after the start of the subsequent laser pulse. The top eight frames are of the FEL, while the bottom eight frames are of the OPO. A similar ablation mechanism can be seen for both lasers while the time course of the OPO begins much earlier when compare with the FEL. The spot size of the FEL was ~90 µm while the OPO was ~60 µm. The radiant exposure was 3 times threshold for the given combination of laser wavelength and pulse duration.
127

Figure 5.7 The results of the bright-field (pump-probe) imaging are shown for 6.45 µm. The scale bar represents 1 mm. The images presented were taken at the time intervals shown in microseconds after the start of the subsequent laser pulse. The top eight frames are of the FEL, while the bottom eight frames are of the OPO. A similar ablation mechanism can be seen for both lasers while the time course of the OPO begins much earlier when compare with the FEL. The spot size of the FEL was ~90 µm while the OPO was ~60 µm. The size of the ablation plume and thus the amount of material ejected is increased relative to the 6.1 µm images (Figure 5.6) as expected due to the increased penetration depth and pulse energy at this wavelength.
128

Figure 5.8 The results of the bright-field (pump-probe) imaging are shown for 6.73 µm. The scale bar represents 1 mm. The images presented were taken at the time intervals shown in microseconds after the start of the subsequent laser pulse. The top eight frames are of the FEL, while the bottom eight frames are of the OPO. A similar ablation mechanism can be seen for both lasers while the time course of the OPO begins much earlier when compare with the FEL. The spot size of the FEL was ~90 µm while the OPO was ~60 µm. The size of the ablation plume and thus the amount of material ejected is increased relative to the 6.1 and 6.45 µm images (Figure 5.6 and 5.7) as expected due to the increased penetration depth and pulse energy at this wavelength.
129

that the ablation process for the OPO is more energetic (5-10 times faster) which could
lead to a much more efficient ablation process.
5.5 Conclusions
In an effort to determine the relevant parameters needed to perform efficient soft
tissue ablation with minimal collateral damage as shown by the FEL, we have compared
a ZGP-OPO with a Mark-III FEL at three different wavelengths with similar parameters.
Since the proposed mechanism ablation with minimal collateral damage at mid-infrared
wavelengths involves the coupling of energy into the protein structure, thus weakening
the structure, allowing for efficient removal of tissue with minimal damage to the
surrounding tissue, it is important to study the wavelengths where this mechanism can
occur, as well as the pulse structure. The wavelengths of choice were: 6.1 µm, which has
a high water absorption as well as protein absorption at the Amide I band; 6.45 µm,
which has moderate water absorption and protein absorption at the Amide II band; and
6.73 µm, which has moderate water absorption and no protein absorption.
By comparing lasers capable of producing each of the wavelengths of interest,
with very different pulse structures, we were able to gain a great deal of insight into the
role of the unique pulse structure of the FEL with regards to the mechanism of ablation at
the wavelengths of interest. Through this research, we are better able to determine
whether or not the possibility of using a more traditional bench top laser can be a valid
replacement for the FEL in regards to carrying out soft tissue ablation in a clinical setting.
Through the analysis of three main metrics; ablation threshold, crater depth, and ablation
plume dynamics we were able to compare these two laser sources with this goal in mind.
130

The ablation threshold results clearly show that the difference in pulse structure
between these two laser sources has no effect on the threshold radiant exposure necessary
to achieve ablation of water or mouse dermis at the three wavelengths tested. The ablated
crater depth measurements; however, show a vast difference between the two pulse
structures. The OPO laser proved to be far more efficient at removing material in both
gelatin and mouse dermis. Since the same amount of energy is being deposited in a
shorter period of time with the OPO, the associated dynamics produce a more energetic
ablation event which possibly leads to a higher degree of tissue removal. The increased
speed at which the ablation event takes place was seen through the bright-field imaging
analysis (pump-probe). The time scale of the crater formation, ejection, and collapse
phases occurs on a faster scale (5-10 times) for the OPO when compared with the FEL. It
is apparent that there is a difference between the speed of the ablation event, while the
actual ablation mechanism remains very similar between the two laser sources at the
three wavelengths investigated. The increased speed of ablation dynamics can be
completely attributed to the pulse duration, i.e. the speed at which the energy was
imparted to the system[1].
The fact that the removal of material is much greater for similar parameters with
the OPO is encouraging for using the OPO as an FEL replacement for clinical
applications. Since more material is removed for the same amount of energy, it is
plausible to assume that more energy, and therefore heat, is being removed by the ejected
material. Since this increased heat is removed from the ablation site through ejection, it
is no longer available for diffusion into the surrounding tissues, and thus should lead to
less thermal damage between subsequent pulses. Further study of this observation needs
131

to be carried out to confirm this hypothesis, including histological analysis of tissue to
confirm that the collateral damage is indeed similar to or less than that seen with the FEL
at 6.45 µm. If this is indeed the case, the ZGP-OPO laser could prove to be a viable
alternative source for the FEL for clinical applications.
5.6 References
1. Vogel, A. and V. Venugopalan, Mechanisms of pulsed laser ablation of biological tissues. Chem Rev, 2003. 103(2): p. 577-644.
2. Berger, J.W., Erbium-YAG laser ablation: the myth of 1-micron penetration. Arch
Ophthalmol, 1998. 116(6): p. 830-1. 3. Berger, J.W. and D.J. D'Amico, Modeling of erbium: YAG laser-mediated
explosive photovaporization: implications for vitreoretinal surgery. Ophthalmic Surg Lasers, 1997. 28(2): p. 133-9.
4. Binder, S., et al., Erbium:YAG laser vitrectomy: clinical results. Am J
Ophthalmol, 2000. 130(1): p. 82-6. 5. Brazitikos, P.D., et al., Erbium:YAG laser surgery of the vitreous and retina.
Ophthalmology, 1995. 102(2): p. 278-90. 6. Edwards, G., et al., Tissue Ablation By a Free-Electron Laser Tuned to the
Amide-II Band. Nature, 1994. 371(6496): p. 416-419. 7. Edwards, G.S., M.S. Hutson, and S. Hauger, Heat Diffusion and Chemical
Kinetics in Mark-III FEL Tissue Ablation. SPIE, Commercial and Biomedical Application of Ultrafast and Free-Electron Lasers, 2002. 4633: p. 184-193.
8. Edwards, G., et al., Comparison of OPA and Mark-III FEL for Tissue Ablation at
6.45 Microns. SPIE, Commercial and Biomedical Application of Ultrafast and Free-Electron Lasers, 2002. 4633: p. 194-201.
9. Edwards, G.S., et al., Free electron laser based biophyscal and biomedical
instrumentation. Review of Scientific Instrumentation, 2003. 74(7): p. 3207-3245. 10. Ellis, D.L., et al., Free electron laser wavelengh specificity for cutaneous
contraction. Lasers in Surgery and Medicine, 1999. 25: p. 1-7.
132
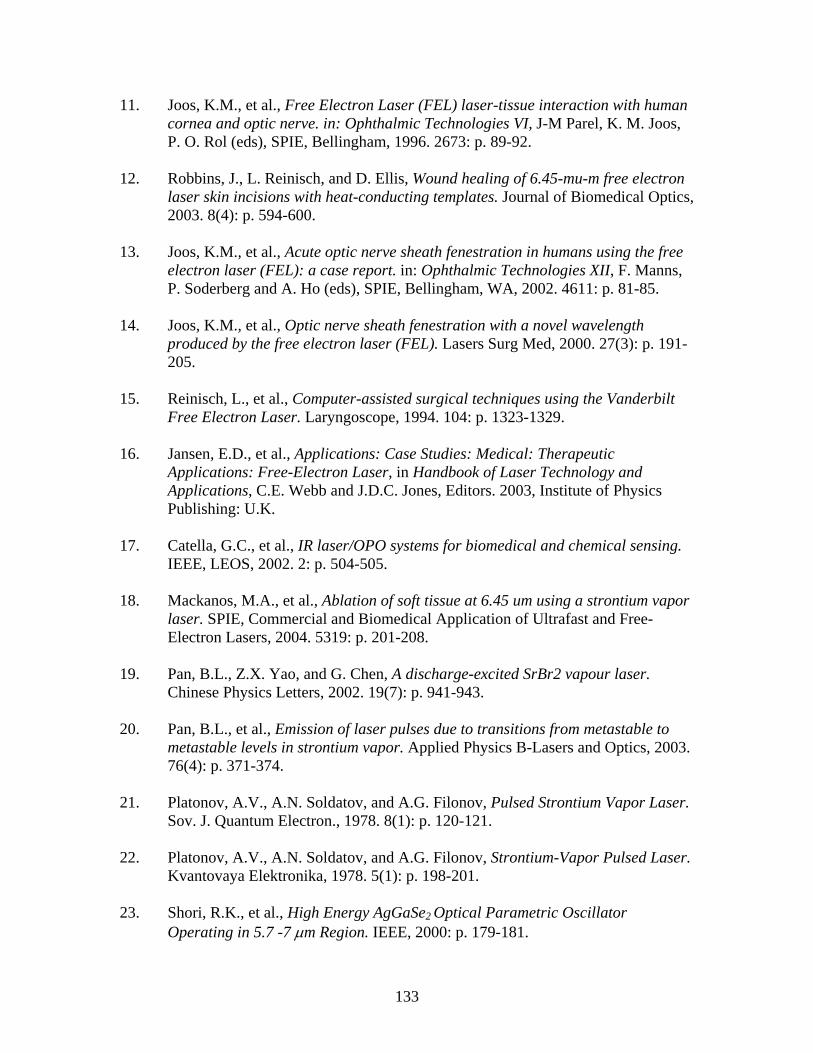
11. Joos, K.M., et al., Free Electron Laser (FEL) laser-tissue interaction with human cornea and optic nerve. in: Ophthalmic Technologies VI, J-M Parel, K. M. Joos, P. O. Rol (eds), SPIE, Bellingham, 1996. 2673: p. 89-92.
12. Robbins, J., L. Reinisch, and D. Ellis, Wound healing of 6.45-mu-m free electron
laser skin incisions with heat-conducting templates. Journal of Biomedical Optics, 2003. 8(4): p. 594-600.
13. Joos, K.M., et al., Acute optic nerve sheath fenestration in humans using the free
electron laser (FEL): a case report. in: Ophthalmic Technologies XII, F. Manns, P. Soderberg and A. Ho (eds), SPIE, Bellingham, WA, 2002. 4611: p. 81-85.
14. Joos, K.M., et al., Optic nerve sheath fenestration with a novel wavelength
produced by the free electron laser (FEL). Lasers Surg Med, 2000. 27(3): p. 191-205.
15. Reinisch, L., et al., Computer-assisted surgical techniques using the Vanderbilt
Free Electron Laser. Laryngoscope, 1994. 104: p. 1323-1329. 16. Jansen, E.D., et al., Applications: Case Studies: Medical: Therapeutic
Applications: Free-Electron Laser, in Handbook of Laser Technology and Applications, C.E. Webb and J.D.C. Jones, Editors. 2003, Institute of Physics Publishing: U.K.
17. Catella, G.C., et al., IR laser/OPO systems for biomedical and chemical sensing.
IEEE, LEOS, 2002. 2: p. 504-505. 18. Mackanos, M.A., et al., Ablation of soft tissue at 6.45 um using a strontium vapor
laser. SPIE, Commercial and Biomedical Application of Ultrafast and Free-Electron Lasers, 2004. 5319: p. 201-208.
19. Pan, B.L., Z.X. Yao, and G. Chen, A discharge-excited SrBr2 vapour laser.
Chinese Physics Letters, 2002. 19(7): p. 941-943. 20. Pan, B.L., et al., Emission of laser pulses due to transitions from metastable to
metastable levels in strontium vapor. Applied Physics B-Lasers and Optics, 2003. 76(4): p. 371-374.
21. Platonov, A.V., A.N. Soldatov, and A.G. Filonov, Pulsed Strontium Vapor Laser.
Sov. J. Quantum Electron., 1978. 8(1): p. 120-121. 22. Platonov, A.V., A.N. Soldatov, and A.G. Filonov, Strontium-Vapor Pulsed Laser.
Kvantovaya Elektronika, 1978. 5(1): p. 198-201. 23. Shori, R.K., et al., High Energy AgGaSe2 Optical Parametric Oscillator
Operating in 5.7 -7 µm Region. IEEE, 2000: p. 179-181.
133

24. Vodopyanov, K.L., et al., ZnGeP2 optical parametric oscillator with 3.8-12.4-mu
m tunability. Optics Letters, 2000. 25(11): p. 841-843. 25. Nahen, K. and A. Vogel, Plume dynamics and shielding by the ablation plume
during Er : YAG laser ablation. Journal of Biomedical Optics, 2002. 7(2): p. 165-178.
26. Brau, C.A., Free Electron Lasers. 1990, Boston: Academic Press. 27. Kozub, J.A., et al. Effect of micropulse duration on tissue ablation using a
stretched free electron laser pulse train. in Photonics West. 2004. San Jose, CA: SPIE.
28. Ganikhanov, F., T. Caughey, and K.L. Vodopyanov, Narrow-linewidth middle-
infrared ZnGeP2 optical parametric oscillator. Journal of the Optical Society of America B-Optical Physics, 2001. 18(6): p. 818-822.
29. Todd, M.W., et al., Application of mid-infrared cavity-ringdown ectroscopy to
trace explosives vapor detection using a broadly tunable (6-8 mu m) optical parametric oscillator. Applied Physics B-Lasers and Optics, 2002. 75(2-3): p. 367-376.
30. Khosrofian, J.M. and B.A. Garetz, Measurement of a Gaussian Laser-Beam
Diameter through the Direct Inversion of Knife-Edge Data. Applied Optics, 1983. 22(21): p. 3406-3410.
31. Cain, C., G. Noojin, and L. Manning, A comparison of various probit methods for
analyzing yes/no data on a log scale. USAF Armstrong Laboratory Technical Report, 1996(Tech. Rep. AL/OE-TR-1996-0102).
134

CHAPTER VI
CONCLUSIONS AND FUTURE DIRECTIONS
Mark Andrew Mackanos
Department of Biomedical Engineering
Vanderbilt University
Nashville, Tennessee 37235
135

6.1 Summary
Since Edwards et al. [1] first described the efficient ablation of soft tissue with
minimal collateral damage using the Mark-III free electron laser at 6.45 µm in 1994, a
great deal of effort has been spent on trying to transition this technology to one with more
clinical relevance than it currently holds. The main problem has been the limitations of
applying this technology in a clinical setting given the obvious limitations of the FEL:
great expense, over fifty-five million dollars have been spent on the medical free electron
program (MFEL) since its inception; large size, the FEL requires its own building, or at
least its own wing in a hospital; and its large overhead, the FEL requires its own staff to
maintain and operate on a daily basis. While eight human surgeries have been performed
to date using the Vanderbilt FEL [2, 3], the limitations described preclude it from having
any widespread clinical relevance. The strength of the FEL lies in the fact that it was,
historically, the only laser source capable of operating at the unique wavelengths in the
mid-infrared part of the electromagnetic spectrum (2-9 µm); specifically, 6.1 and 6.45
µm are of particular interest because they coincide with the amide I and amide II
absorption bands of protein[4]. The FEL, consequently, has proven to be an invaluable
research tool for the investigation of the wavelength range for potential medical
application.
Through this research, two specific applications have surfaced that warrant the
need for this technology to be transitioned for clinical relevance: these applications are
brain tumor resection and optic nerve sheath fenestration [2, 3, 5, 6]. Three of the eight
human surgeries performed were brain tumor resections at 6.45 µm, while the remaining
five were optic nerve sheath fenestrations at 6.45 µm. The results of these surgeries were
136

all successful; however, the further advancement of this technology into the clinic
requires the development of alternative, more conventional, laser sources without the
limitations of the FEL. In the intervening ten years since Edwards’ discovery, research
has been focused on determining the mechanism of ablation at 6.1 and 6.45 µm.
Edwards et al. proposed a mechanism to describe the process of ablation at 6.45 µm using
the FEL that involves the partitioning of energy into the protein structure of tissue,
causing it to denature or change chemically, thus reducing the structural integrity of the
tissue before explosive vaporization takes place [1, 7]; however, until recently, progress
towards proving or disproving this hypothesis has been slow due to technological
limitations.
In recent years new technology has become available that has allowed us to dig
deeper into the process of soft tissue ablation using the FEL at 6.1, 6.45, and 6.73 µm in
wavelength. That research is contained here in this dissertation. The main goal of this
research was to determine the effect of the unique pulse structure of the FEL on the
mechanism of soft tissue ablation for the transitioning of this technology to alternative
laser sources with more clinical relevance than the FEL. In the past few years a large
focus of MFEL research has involved the development of alternative laser sources
capable of delivering these special wavelengths of interest; however, for the transfer of
this technology to take place, and better understanding of the mechanism of ablation at
these wavelengths needs to be obtained to determine whether or not the unique pulse
structure of the FEL needs to be replicated in these potential alternative sources.
To this end, the research contained here focuses on the use of a pulse stretcher to
change the native (2.85 GHz, 1 ps) micropulse structure of the FEL to an almost quasi-
137

CW structure throughout the 5 µs macropulse, where the micropulse is stretched to 200
ps (FWHM). In addition, the peak power of the FEL micropulse was examined for the
presence of amide bond breakage to determine the existence or extent of breakage as a
result of irradiation with 6.45 µm light. In addition, this research compared potential
alternative sources to the FEL to determine if such a source could eventually take the
place of the FEL and have viable clinical applications.
Chapter 3 focuses on the application of the FEL with a stretched micropulse
structure to determine the effects of this unique pulse structure on the ablation process at
6.1 and 6.45 µm. By taking advantage of the wide bandwidth of the FEL, we were able
to send different wavelengths of light along different pathlengths using a grating, thus
causing different wavelengths of light to arrive at different times, thus increasing the 1 ps
native pulse up to 200 ps FWHM. This stretched pulse was then used to examine its
effects on the threshold radiant exposure of ablation on both water and mouse dermis. It
was determined that the threshold of ablation was reduced for the stretched FEL
micropulse when compared to the native 1 ps macropulse. A significant difference was
seen between the 1 and 200 ps micropulse at both 6.1 and 6.45 µm on water as well as
mouse dermis; however the difference was only ~1.5 times the native value, which is
quite small given the 200-fold decrease in peak intensity associated with the stretched
pulse.
The pulse-stretched FEL was next applied to the examination of the ablated crater
depth (ablation efficiency) on gelatin and mouse dermis. The gelatin data showed a
significant increase in the ablation efficiency with an increase in micropulse duration.
138

The mouse dermis showed the opposite trend; however, the magnitude of the difference
is once again small when compared with the 200-fold decrease in peak intensity.
Chapter 4 focuses on the application of the pulse stretched FEL on the dynamics
of ablation with bright-field (pump-probe) imaging, the extent of thermal damage on
tissue, and the effect of the peak intensity of the native, 1 ps, FEL micropulse on the
extent of amide bond breakage on protein. It was determined through brightfield imaging
that there was do difference in the ablation dynamics of water at either 6.1 or 6.45 µm in
wavelength, except for a slight (1.3 times at 6.1 µm, 1.1 times at 6.45 µm) increase in the
size (height) of the ablation plume.
The effect of the stretched pulse was then examined to determine its effect on the
extent of thermal damage on canine cornea and mouse dermis. This analysis showed no
significant difference between the native and stretched pulses with regards to the extent
of thermal damage. Additionally, it was determined that there was a significant
difference between the extent of thermal damage at 6.1 µm when compared to 6.45 µm
with the thermal damage at 6.1 µm being significantly less.
The last experiment in this chapter examined the role of the peak power of the
FEL micropulse on the existence or extent of amide bond breakage in proteins. We used
matrix assisted laser desorption ionization mass spectrometry (MALDI) to examine a
sample of cytochrome c irradiated at 6.45 µm to determine whether or not amide bonds
were being broken as a result of the laser radiation. Our results showed that there was no
such bond breakage occurring.
In Chapter 5 a possible alternative source to the FEL was examined. An Er:YAG-
pumped ZnGeP2 optical parametric oscillator (ZGP-OPO) was compared with the FEL
139

using similar parameters to determine whether or not a difference existed between the
two varying pulse structures (1 ps 2.85 GHz micropulse, 5 µs macropulse for the FEL
and 100 ns CW for the ZGO-OPO). The two lasers were compared with similar spotsizes
and radiant exposures to determine if a difference existed between the two pulse
structures with respect to the threshold radiant exposure for ablation, the ablated crater
depth (ablation efficiency), and ablation dynamics. It was determined that there was no
significant difference between the two lasers with respect to the threshold radiant
exposure of ablation at 6.1, 6.45, and 6.73 µm. There was also no difference seen in the
ablation dynamics except for the speed at which the dynamics took place. The shorter,
100 ns, pulse of the ZGP-OPO leads to faster dynamics of the ablation plume as
expected[4].
There was however, a significant difference in the ablation efficiency on both
gelatin and mouse dermis between the two lasers at all three wavelengths compared. The
ZGP-OPO proved to be 5-8 times more efficient when compared to the FEL. This result
was unexpected, and a great deal of effort has been done to confirm it. Ongoing research
is being performed to examine the reason for this and will be discussed in section 6.2 of
this chapter.
In addition to these three chapters, the two appendices describe additional
research that while not directly including in the dissertation are important to the overall
direction of this research and are quite relevant to its advancement. Appendix A focuses
on an alternative source for the FEL, a strontium vapor laser. This laser was examined
for its delivery of 6.45 µm light for potential ablation applications. Finally, Appendix B
describes research focusing on the delivery methods of mid-infrared light, which are of
140

vital importance if this technology it to have any clinical relevance. The state-of-the-art
in mid-infrared delivery fibers were compared as well as the use of perfluorocarbon
liquids for beam delivery in a liquid environment.
Overall, the following conclusions can be made from the above research:
1.) The effect of the unique micropulse structure of the FEL is not important with
regards to the threshold radiant exposure for ablation at 6.1 and 6.45 µm. There
was no statistically significant difference seen for the parameters studied.
2.) While there is a significant difference due to the micropulse structure of the FEL
on the ablation efficiency, it is quite small, given the 200-fold decrease in peak
intensity.
3.) The ablation dynamics are not changed as a result of stretching the FEL
micropulse as seen through brightfield imaging.
4.) There is no significant difference between the extent of thermal damage for
varying FEL micropulse durations at either 6.1 or 6.45 µm.
5.) The peak power of the native FEL pulse does not lead to amide bond breakage in
protein at 6.45 µm.
6.) ZGP-OPO studies have shown that alternative lasers are capable of efficient
ablation with similar threshold radiant exposures to those seen by the FEL. This
shows that alternative laser sources are a definite option for transition of this
technology with more clinical relevance.
7.) Delivery methods exist for minimally invasive surgical applications once
alternative laser sources are developed with sufficient pulse energies for clinical
application.
141

6.2 Future Directions
While the results presented in this research have provided a significant contribution to
advancement of mid-infrared laser ablation, there are still some experiments that warrant
future investigation. First, while the ZGP-OPO data suggest that this laser is a viable
alternative source to the FEL, histological analysis still needs to be performed to
determine the extent of thermal damage associated with this laser. Next, further analysis
of the significant increase in ablation efficiency in an effort to determine the effect of the
100 ns ZGP-OPO pulse compared with the 5 µs FEL pulse needs to be performed. To
this end, an experiment using a Pockel’s cell to shorten FEL macropulse on the ablation
efficiency has been devised. The FEL will be used to create a series of craters with a
constant radiant exposure with shorter and shorter macropulse durations, until the energy
falls below the three times threshold mark. Third, the FEL pulse stretcher is currently
being reconfigured to stretch the micropulse to 350 ps FWHM. At this point, the
micropulse structure of the FEL will be effectively removed, and the macropulse will be
quasi-CW over its entirety. This will warrant further threshold and efficiency studies to
complete this set of pulse-stretcher research. Finally, while alternative sources are
capable of producing the wavelengths of interest, their current pulse energy is still too
low for efficient removal of tissue for clinical applications; further research by these
authors as well as others is ongoing to raise the available pulse energies by at least an
order of magnitude.
142

6.3 References
1. Edwards, G., et al., Tissue ablation by a free-electron laser tuned to the amide II band. Nature, 1994. 371(6496): p. 416-9.
2. Jansen, E.D., et al., Applications: Case Studies: Medical: Therapeutic
Applications: Free-Electron Laser, in Handbook of Laser Technology and Applications, C.E. Webb and J.D.C. Jones, Editors. 2003, Institute of Physics Publishing: U.K.
3. Edwards, G.S., et al., Free electron laser based biophyscal and biomedical
instrumentation. Review of Scientific Instrumentation, 2003. 74(7): p. 3207-3245. 4. Vogel, A. and V. Venugopalan, Mechanisms of pulsed laser ablation of biological
tissues. Chem Rev, 2003. 103(2): p. 577-644. 5. Joos, K.M., et al., Optic nerve sheath fenestration with a novel wavelength
produced by the free electron laser (FEL). Lasers Surg Med, 2000. 27(3): p. 191-205.
6. Joos, K.M., et al., Acute optic nerve sheath fenestration in humans using the free
electron laser (FEL): a case report. in: Ophthalmic Technologies XII, F. Manns, P. Soderberg and A. Ho (eds), SPIE, Bellingham, WA, 2002. 4611: p. 81-85.
7. Edwards, G.S., M.S. Hutson, and S. Hauger, Heat Diffusion and Chemical
Kinetics in Mark-III FEL Tissue Ablation. SPIE, Commercial and Biomedical Application of Ultrafast and Free-Electron Lasers, 2002. 4633: p. 184-193.
143

APPENDIX A
ABLATION OF SOFT TISSUE AT 6.45 µM USING A STRONTIUM VAPOR LASER Mark A. Mackanos1, Borislav Ivanov2, A.N. Soldatov3, I. Kostadinov4, Marcus H. Mendenhall2,
David W. Piston5, Richard F. Haglund2, Jr., E. Duco Jansen1
1 – Department of Biomedical Engineering
2 – Department of Physics and Astronomy
and W. M. Keck foundation Free-Electron Laser Center
5 – Department of Molecular Physiology and Biophysics
Vanderbilt University
Nashville, Tennessee 37235
3 – Department of Physics
Tomsk State University
Tomsk, Russia
4 – Pulslight Corporation
Sofia, Bulgaria
This manuscript was published in Laser Interaction with Tissue and Cells XV. Proc. SPIE Vol. 5319; 201-208 (2004).
144

A.1 Abstract
A gas-discharge strontium vapor laser has been shown to operate with up to 90% of its
light emitted at 6.45 µm. We have investigated the use of this laser as a potential stand-alone,
tabletop alternative to the FEL for ablation of soft tissue. This custom-made laser currently
delivers up to 2.4 watts of average power at 13 kHz pulse repetition rate (range 5-20 kHz).
Despite a poor spatial beam profile, the laser has been shown to ablate both water and soft tissue.
However, current pulse energies (< 185 µJ) are insufficient for single pulse ablation even when
focused to the smallest possible spot size (130 µm). Instead, the high pulse repetition rate causes
the ablation to occur in a quasi CW manner.
The dynamics of ablation studied by pump-probe (Schlieren) imaging and macroscopic white
light imaging showed micro-explosions but at a rate well below the pulse repetition frequency.
Histological analysis of ablation craters in bovine muscle exhibited significant collateral thermal
damage, consistent with the high pulse frequency, thermal superposition and heat diffusion.
Efforts to increase the pulse energy in order to achieve the threshold for pulse-to-pulse ablation
are ongoing and will be discussed.
A.2 Introduction
Laser radiation at 6.45 µm in wavelength generated by the tunable free electron laser
(FEL) has been shown to provide efficient soft tissue ablation with minimal collateral damage
(<40 µm). To date delivery of this wavelength of light with significant energy for ablation has
been limited to free electron lasers (FEL), in particular, the Mark-III FEL. While the FEL has
been used to deliver light for two separate human surgical studies to date, the size, cost, and
145

considerable overhead needed for operation of such a device preclude it from becoming a viable
clinical delivery system [1-9].
Much work has been carried out at Vanderbilt University in recent years to find and develop a
“bench-top/turn-key” laser delivering 6.45 µm laser radiation with fluence, intensity, and
average power levels capable of tissue ablation that would have a much greater clinical
relevance. In order to develop such a laser source, it is necessary to understand the laser physics
of generating 6.45 µm radiation as well as the ablation parameters that result in efficient tissue
removal with minimal collateral damage. This can be accomplished by comparing the ablation
characteristics of the FEL with those of alternative sources capable of delivering this wavelength
of light at relevant energy levels. To this end, we have developed and continue to study and
improve a strontium vapor (SrV) laser source. Much research has been carried out using SrV
lasers in the blue and ultraviolet parts of the spectrum; however, this is one of the first attempts
to look at medical applications involving 6.45 µm light.
A.3 Background
Walter et al. first suggested the use of strontium vapor as a lasing medium for a metal
vapor laser in 1966[10]. Deech et al. described the first working strontium vapor laser in 1968
[11]. Many different combinations of multi-line pulse laser oscillations have been obtained, in
the range of 430 nm to 6.45 µm, with different mechanisms of strontium neutral and univalent
ions through longitudinal pulsed discharge in helium or neon buffer gas since this first attempt
[12]. Platonov et al. first described a high average power strontium vapor laser at λ=6.45 µm
with a relatively high average power in 1978 [13]. The 6.45 µm laser line is obtained with a
short upper-level lifetime in strontium vapor through the transition from the resonance (5s5p1P10)
146

level to a metastable (5s4d1D2*) level of the strontium atom [12, 14]. This laser also emits
concurrently on laser lines between 1.09 and 3.01 µm. Lasers with self-terminating transitions in
metal atoms have the advantage of high practical efficiency, high repetition rates, and
considerable average and peak powers [14]. The use of short current pulses and a large volume
of the active strontium medium ensures a high average output power due to the stimulated
emission as a result of the self-terminating transitions in strontium atoms for 6.45 µm emission
[14]. Moreover, as with other gas lasers, the SrV laser enjoys, at least in principle, the desirable
characteristic of scalability.
This laser is of the ‘self-heated’ variety, in which small pellets of metallic strontium are
equally spaced at intervals along the length of the discharge tube [15]. The necessary vapor
pressure of strontium is provided by discharge heating of the tube wall in contact with the
pellets, with some direct heating of the pellets by local discharge action [15].
While a self-heated strontium vapor laser does allow for easy implementation and
relatively high pulse energies, some problems do exist. The most important parameter in the
operation of a strontium vapor laser is the partial pressure of strontium vapor. Self-heated lasers
display a high degree of sensitivity to small changes in the input power and the tube operating
temperature because the partial pressure of strontium vapor depends nonlinearly upon the supply
voltage [15]. In addition, it is difficult to avoid partial obscuration of the laser beam by the
strontium pellets in a self heated laser tube, as the pellets are loaded directly into the bore of the
tube, and the bulk of the strontium pellets remain in the solid phase at the operating temperature
of the laser [15].
In this research we looked at ways both analyze and improve the output of the laser to
allow for a direct comparison with the FEL. We looked at the pulse structure, output power,
147

spotsize, and spectral content to analyze the laser parameters at various operating levels. In
addition, we investigated the ablation process using pump-probe (Schlieren) imaging and
conducted macroscopic analysis of tissue ablation. The results of these experiments will be
presented here.
A.4 Methods
A. N. Soldotov at Tomsk State University, Tomsk Russia in collaboration with I.
Kostadinov at PulsLight Inc. (Sofia, Bulgaria) developed the strontium vapor laser used in this
research. This laser is compact, fitting in a case that is four feet by eighteen inches by eighteen
inches. It runs on 208 volts, three-phase electric power and is air-cooled. The laser is of the self-
heating variety as described by Platonov et al, and consists of a BeO insert tube inside an
evacuated quartz tube with strontium pieces distributed throughout the bottom of the insert tube
[14]. The output windows were made of BaF2 to allow for transmission of the mid-infrared light.
The tube was 12 mm in diameter and was 38 cm long. The electrodes were truncated tantalum
cones placed outside the hot zone of the tube. The unstable resonator consists of an aluminized
plane mirror with a 1 mm curved mirror suspended on a post, centered in the output window of
the tube.
Due to the self-heating operation of the laser, output parameters change due to the
repetition rate of the laser. The laser can be operated between five and twenty kilohertz. At the
highest frequencies, the tube becomes the hottest, and the percentage of light at 6.45 is greatest.
However, the risk of strontium vapor escaping from the tube at hotter temperatures is greater;
therefore the laser was operated with 2.5 watts of output power with up to 90% of the energy
centered at 6.45 µm in wavelength to prevent overheating of the tube. The laser was typically
148

operated at 17 kHz, to maintain the proper tube temperature. The repetition rate of the laser
could then be changed to as low as 5 kHz through the use of a switch for short periods of time,
typically less than 3-4 minutes, during which time the tube remained at the approximate
operating temperature. This allowed for the study of the laser throughout its theoretical
repetition range.
The laser was placed on an optical table (Newport Inc., Irvine, California). The output
was sent in a direct line onto an gold-coated off-axis parabolic mirror with a 25.4 mm focal
length (Janos Technology, Townsend, VT), which was focused onto a motorized translation
stage (Isotech Incorporated, Horsham, PA). The energy level was measured using a Scientech
365 power meter (Scientech, Boulder, CO). The spotsize was measured using a standard knife-
edge technique; where the 10-90% limits of the beam were taken to be the beam diameter.
A pump-probe technique was used to image the ablation process in water [16]. A cuvette
filled with water was placed on the translation stage at the tightest focal spot for irradiation. The
source for the imaging illumination was a nitrogen dye laser (Laser Photonics LN 1000), with a
rhodamine dye module operating at 644 nm (Laser Photonics LN 102). The timing between the
strontium laser pulse firing (pump) and the beginning of sample irradiation by the nitrogen laser
(probe) was achieved through the use of a Shutter (Uniblitz VMM-T1, Vincent Associates,
Rochester, NY). The output TTL pulse from the shutter was used to drive the firing of the
nitrogen laser, and was controlled through the use of a digital delay-pulse generator (Stanford
Research Systems Inc., model DG535). This arrangement did not allow for the synchronization
with a single strontium pulse; because, the pulse energy was too low to overcome the threshold
of ablation for a single pulse. Therefore, the synchronization with a single pulse was not
necessary. The output of the nitrogen dye probe laser was coupled into a 600-µm multimode
149

fiber with a length of ~1000 meters. This fiber length allows for the significant reduction of the
coherence of probe light, which improves the image quality by eliminating speckle. The images
were recorded onto an S-VHS videotape using a standard black-and-white CCD camera with a
frame rate of 30 Hz. The images were then digitized using an ATI Rage-Pro Mobility video card
for further processing and analysis.
The macroscopic analysis of tissue was performed on bovine muscle. Small strips of tissue were
placed at the focus of the laser beam on the translation stage. The stage was moved back and
forth throughout the ablation process to create a four-millimeter-long linear lesion. The laser
parameters as well as the speed of the stage were changed for comparison. The lesions were then
viewed under a dissecting microscope and imaged using a CCD camera for later analysis.
A.5 Results and Discussion
Initial tissue ablation experiments showed what appeared to be primarily a thermal
process, without significant evidence for laser ablation. Hence a great deal of time and effort
was expended in an effort to modify and improve the strontium vapor laser for our purposes.
The first goal was to increase the percentage of 6.45 µm light in the total output of the laser.
When the laser was first operated, roughly 75% of the output emission was at 6.45 µm. By
increasing the operating temperature of the laser by increasing the repetition rate this fraction
was increased to over 90%. Anything higher than this was thought to overheat the tube, leading
to both instability and the loss of strontium vapor out of the tube, which would in turn lead to a
loss of efficiency and thus maximum output power.
Next, a variable resistor and a switch were added to the timing circuit of the laser driver.
This resistor allowed us to increase the range of the repetition rate that was accessible through
150

this laser. This allowed the laser to be operated anywhere between 5 and 20 kHz. Any pulse
repetition rate lower than 13 kHz did not provide the operating temperature necessary to sustain
self-heated operation, thus reducing the efficiency of the laser. The solution to this was to
maintain the laser at a higher repetition rate and change the repetition rate using the added switch
for a short period of time.
The operation at lower frequencies is critical for comparing ablation using the SrV laser
to that observed with the FEL. The FEL operates at a maximum frequency of 30 Hz, and thus
operates like a traditional pulsed laser, where each pulse removes material and each subsequent
pulse comes well after the stress and thermal relaxation times of tissue, thus acting like a new
event (barring some residual heat left in the tissue). The strontium vapor laser; however, acts
more like a quasi-CW laser. This is characterized by significant thermal superposition due to
subsequent pulses, which leads to an increase in the thermal damage that occurs to the target
tissue. By reducing the repetition rate significantly, we can reduce the effects of this
superposition of heat that occurs at the higher frequencies. We are currently limited, however, to
5 kHz with the current laser due to heating concerns with the tube. Continued research is needed
in this area to significantly lower the repetition rate further.
Once the laser operation was improved, we investigated the laser output with regards to
the process of ablation. A study of individual pulse structure determined that a ~75 ns pulse was
being delivered with a peak energy of 200 µJ as seen in figure A.1. This was well below the
ablation threshold for the standard 500 µm spotsize that we had been using for comparison with
the FEL (~2 mJ). Given the tube size of the laser, the average power and thus pulse energy that
can be achieved are limited. Alternatively, to increase the radiant exposure, we reduced the
spotsize using a short focal length off-axis parabolic mirror (f.l. = 25.4 mm). This mirror was
151

Figure A.1 A plot of a single SrV pulse obtained on a Spiricon beam profiler, (Spiricon, Logan UT).
152

chosen to reduce the reflective losses at the multiple surfaces of a lens system as well as to focus
the beam very tightly despite having a poor spatial beam profile.
A standard knife-edge spotsize measurement was performed and a spotsize of ~130 µm
was achieved at the smallest point. When compared to the diffraction-limited spotsize, this
number proved to be quite large and corresponds to an M2 statistic of 6.22 as seen in figure A.2.
Obviously, there is much room for improvement here for increasing the mode of the laser to
further decrease the spotsize and consequently increase the radiant exposure.
The original intent with regards to the pump-probe imaging was to analyze the ablation
event caused by a single pulse; however, the radiant exposure was still too low carry out ablation
with a single pulse; ablation was only seen after multiple pulses. The time required for ablation
to occur at each repetition rate was determined by varying the opening time of the shutter for an
observer until material ejection at the surface of water was seen. The results from this are
summarized in table A.1.
The pump-probe imaging was carried out in a free-running mode of the strontium vapor
(pump) laser at 13 kHz with the nitrogen (probe) laser at 5 Hz. A pulsed ablation event was seen
related to the time of ablation seen in table one. The temporal course of ablation was imaged
and is shown in figure A.3: the four frames show the beginning of the ablation event, expansion
of the vapor cavity, ejection of water, and collapse of the vapor cavity. This is as expected
through similar ablation imaging of other lasers.
The results of the soft-tissue ablation on bovine muscle can be seen in figure A.4.
Scanning of the stage was performed to both create the lesion and keep the thermal load on the
tissue to a minimum. The higher repetition rate of the laser removed more tissue, while
153
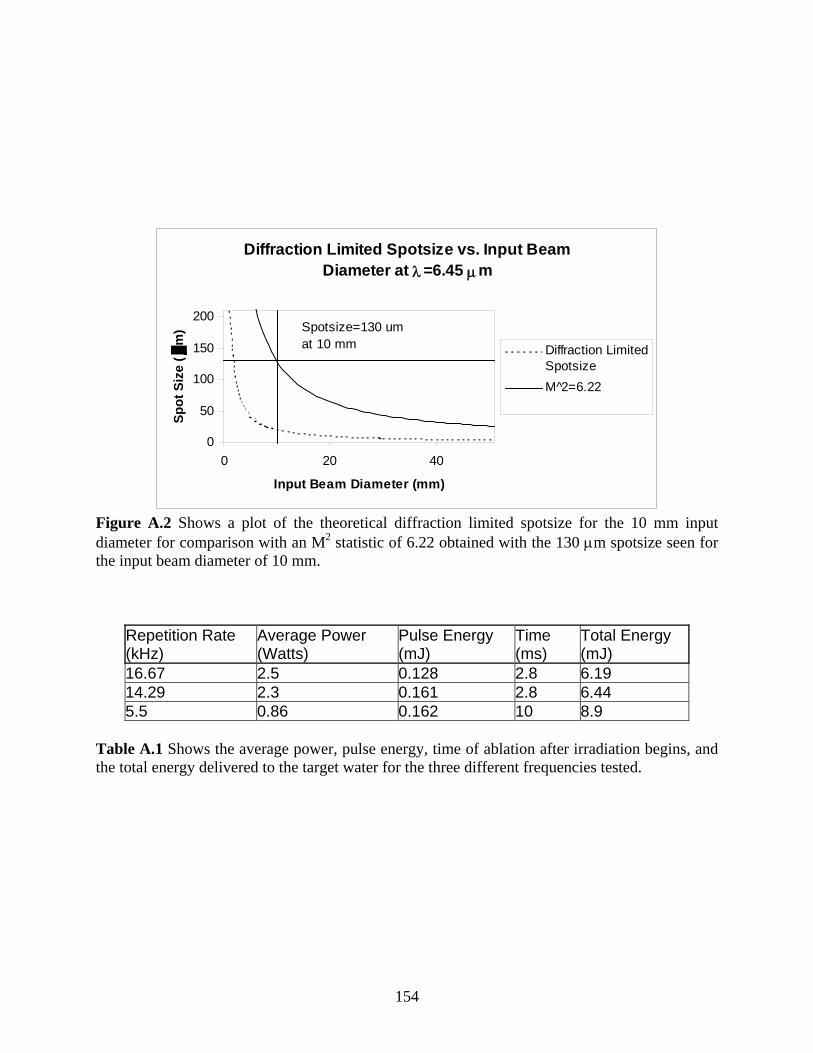
Diffraction Limited Spotsize vs. Input Beam Diameter at λ=6.45 µm
0
50
100
150
200
0 20 40
Input Beam Diameter (mm)
Spot
Siz
e (
m)
Diffraction LimitedSpotsizeM 2̂=6.22
Spotsize=130 um at 10 mm
Figure A.2 Shows a plot of the theoretical diffraction limited spotsize for the 10 mm input diameter for comparison with an M2 statistic of 6.22 obtained with the 130 µm spotsize seen for the input beam diameter of 10 mm.
Repetition Rate (kHz)
Average Power (Watts)
Pulse Energy (mJ)
Time (ms)
Total Energy (mJ)
16.67 2.5 0.128 2.8 6.19 14.29 2.3 0.161 2.8 6.44 5.5 0.86 0.162 10 8.9
Table A.1 Shows the average power, pulse energy, time of ablation after irradiation begins, and the total energy delivered to the target water for the three different frequencies tested.
154

Figure A.3 Pump-probe images of strontium vapor laser ablation of water. Repetition rate = 13 kHz, average power = 2 W. Note that the ablation exhibits a classic nucleated boiling behavior. Deposition of multiple laser pulses was necessary to reach ablation threshold (as single pulses have insufficient energy to ablate).
155

Figure A.4 Gross images of bovine muscle irradiated with the strontium vapor laser. A) top view; B) cross-section of ablated lesions. Lesion 1: repetition rate=16 kHz, average power=2.4 W, spot size 130 um, scan speed=17 mm/s, 30 passes; Lesion 2: repetition rate=5 kHz, average power=0.9 W, spot size 130 um, scan speed=17 mm/s, 30 passes; Lesion 3: repetition rate=5 kHz, average power=0.9 W, spot size 130 um, scan speed=17 mm/s, 10 passes. Scale bar represents 1 mm / div. Note that although the laser ablates the tissue with reasonable efficiency, collateral thermal damage is appreciable due to thermal superposition of subsequent laser pulses.
156

generating more thermal damage as seen in lesion one. Lesion two and three demonstrate both
reduced efficiency and reduced thermal damage when compared with lesion one.
The strontium vapor laser is currently one of only a few 6.45 µm sources capable of
tissue ablation. Others include the FEL, and a high energy AgGaSe2 OPO (Dr. Ramesh Shori,
UCLA). The strontium vapor laser is scalable, comparatively inexpensive and can be configured
as a MOPA to optimize pulse characteristics, unlike the nonlinear optics approach. We still need
increased radiant exposure to provide for single-pulse ablation with less thermal damage; we
believe that this can be achieved in a straightforward way by improving the optics and by
moving to an externally heated cavity.
The beam quality has recently been improved by replacing the front mirror of the
unstable resonator with a specially designed external BaF2 window. In addition, driving the tube
with a fifty percent increase in voltage has increased the pulse power.
A.6 Conclusions
In this study we have examined a potential alternative source to the FEL at 6.45 µm that
is capable of carrying out tissue ablation although with significant collateral thermal damage
owing to the repetition rate of the laser and thermal loading at sub-ablative fluences of the tissue.
While the size and cost of this laser provide for a promising alternative to the FEL with higher
clinical relevance, much improvement is still needed to make this source viable for clinical use.
Future improvements may include seeding the current tube with another laser or a second
strontium tube, increasing the strontium pressure, increasing the cross sectional area of the tube,
and externally heating the tube. These are necessary to increase the beam quality, increase the
157

pulse energy, and decrease the repetition rate, so that we can achieve ablation in a regime
consistent with that of the FEL.
A.7 Acknowledgments
DoD (AFOSR award No. F49620-01-1-0429) ONR (N00014-99-1-0890) W.M. Keck Foundation Free Electron Laser Center staff
A.8 References
1. Edwards, G., et al., Tissue Ablation By a Free-Electron Laser Tuned to the Amide-II Band. Nature, 1994. 371(6496): p. 416-419.
2. Shen, J.H., et al., Acute optic nerve sheath fenestration with the free-electron laser. in:
Ophthalmic Technologies IX, P. O. Rol, K. M. Joos, F. Manns (eds), SPIE, Bellingham, 1999. 3591: p. 235-240.
3. Joos, K.M., et al., Free Electron Laser (FEL) laser-tissue interaction with human cornea
and optic nerve. in: Ophthalmic Technologies VI, J-M Parel, K. M. Joos, P. O. Rol (eds), SPIE, Bellingham, 1996. 2673: p. 89-92.
4. Shetlar, D., et al., Endoscopic goniotomy with the free electron laser. Invest Ophtalmol
Vis Sci (Suppl), 1997. 38: p. 169. 5. Joos, K.M., et al., Optic nerve sheath fenestration with a novel wavelength produced by
the free electron laser (FEL). Lasers Surg Med, 2000. 27(3): p. 191-205. 6. Joos, K.M., et al., Acute optic nerve sheath fenestration in humans using the free electron
laser (FEL): a case report. in: Ophthalmic Technologies XII, F. Manns, P. Soderberg and A. Ho (eds), SPIE, Bellingham, WA, 2002. 4611: p. (in press).
7. Copeland, M.L., et al., First human application of a free electron laser. International Free
Electron Laser Conference Users Workshop, 2000. 8. Copeland, M., et al., First Human Surgery with a Free Electron Laser. SPIE, Plenary
Session, 2000. 9. Edwards, G.S., et al., Free electron laser based biophyscal and biomedical
instrumentation. Review of Scientific Instrumentation, 2003. 74(7): p. 3207-3245.
158

10. Walter, W.T., et al., Efficient Pulsed Gas Discharge Lasers. Ieee Journal of Quantum
Electronics, 1966. QE 2(9): p. 474-&. 11. Deech, J.S. and J.H. Sanders, New Self-Terminating Laser Transitions in Calcium and
Strontium. Ieee Journal of Quantum Electronics, 1968. QE 4(7): p. 474-&. 12. Pan, B.L., et al., Emission of laser pulses due to transitions from metastable to metastable
levels in strontium vapor. Applied Physics B-Lasers and Optics, 2003. 76(4): p. 371-374. 13. Platonov, A.V., A.N. Soldatov, and A.G. Filonov, Strontium-Vapor Pulsed Laser.
Kvantovaya Elektronika, 1978. 5(1): p. 198-201. 14. Platonov, A.V., A.N. Soldatov, and A.G. Filonov, Pulsed Strontium Vapor Laser. Sov. J.
Quantum Electon., 1978. 8(1): p. 120-121. 15. Loveland, D.G., et al., Design of a 1.7-W Stable Long-Lived Strontium Vapor Laser.
Measurement Science & Technology, 1991. 2(11): p. 1083-1087. 16. van Leeuwen, T.G., et al., Noncontact tissue ablation by holmium:YSGG laser pulses in
blood. Lasers Surg Med, 1991. 11(1): p. 26-34.
159

APPENDIX B
DELIVERY OF MID-INFRARED (6-7µM) LASER RADIATION IN A LIQUID ENVIRONMENT USING INFRARED-TRANSMITTING OPTICAL FIBERS
Mark A. Mackanos1, Brandon L. Shaw2, Jas S. Sanghera2, Ishwar Aggarwal2, Abraham Katzir3, E. Duco Jansen1
1—Department of Biomedical Engineering
Vanderbilt University
Nashville, Tennessee 37235
2 – Naval Research Lab
Washington, D.C.
3 – School of Physics and Astronomy
Tel Aviv University
Tel Aviv, Israel
This manuscript was published in The Journal of Biomedical Optics: 8(4): 583-593, (2003).
160

B.1 Abstract
Ablation at wavelengths near λ = 6.45 µm results in tissue ablation with minimal
collateral damage (<40 µm) yet yields a high ablation rate that is useful for human surgery.
However, delivery of this wavelength has been limited to that in air and thus to applications in
which the target tissue can be readily exposed. The goal of this study is to investigate the
potential of a pulsed infrared laser at λ = 6.45 µm for non-contact ablation in a liquid
environment. To this end we investigated fiber delivery in combination with the use of infrared
transparent liquids.
Transmission characteristics and damage thresholds for two types of fiber materials
(silver halide and arsenic sulfide), for high power pulsed laser radiation were determined using
the Mark-III Free Electron Laser. Both fibers had comparable bulk losses (0.54 dB/m and 0.62
dB/m respectively) while the arsenic sulfide fibers showed more coupling losses (37% vs. 27%).
Damage thresholds were higher in arsenic sulfide fibers than in silver halide fibers (1.12
GW/cm2 vs. 0.54 GW/cm2) but both fibers were sufficient to deliver radiant exposures well
above the ablation threshold in tissue.
Seven different perfluorocarbon liquids, known for their transparency at λ = 2.94 µm,
were investigated and their optical transmission was determined using FTIR and direct Beer’s
law measurements. All of the PFCL’s tested had similar values for µa at a given wavelength. (µa
= 0.05 mm-1 at λ = 2.94 µm and µa ~ 3 mm-1 at λ = 6.45). Pump-probe imaging showed the
ablation sequence (λ = 6.45 µm) at the fiber tip in a water environment, which revealed a fast
expanding and collapsing bubble. In contrast the volatile PF-5060 showed no fast bubble
expansion and collapse but rather formation of non-transient gas bubbles. Perfluorodecalin did
not show any bubble formation at the radiant exposures used.
161

It was shown that using the λ = 6.45 µm wavelength delivered via fiber optics in
combination with perfluorodecalin allows for a non-contact laser surgical procedure. Deeper
structures, however, are effectively shielded, as the radiant exposure of the beam will fall below
the ablation threshold due to the absorption by perfluorodecalin. This may optimize the efficacy
and safety of laser-based vitreoretinal surgery.
B.2 Introduction
Lasers have tremendous potential as high precision surgical devices owing to their ability
to be focused to a small spot size and the ability to select wavelengths that are either strongly or
selectively absorbed in the target tissue. While numerous ablation modes and interaction
mechanisms exist, tissue ablation in eloquent structures of the body, such as brain or eye,
requires precise ablation of the target tissue while minimizing collateral damage to adjacent
tissue structures. Of the existing conventional laser sources, particularly those in the UV (< 300
nm) and in the IR (> 2.7 µm) have been shown to exhibit very strong absorption in soft tissue
[1]. A limiting factor in using many laser sources in these absorption bands however, is the lack
of adequate optical fibers. Regular silica fibers, including low-OH fibers transmit from 350 –
2,500 nm. Practically speaking, this has limited surgical applications of many of these lasers, in
particular when ablation in a liquid environment is required, as is the case of vitreoretinal
surgery. Perhaps the most utilized laser for these applications has been the Erbium:YAG laser,
which can be fiber delivered via specialty fiberoptics made of materials such as sapphire or
zirconium fluoride [2-5]. Nevertheless, while the collateral thermal damage induced by the
Er:YAG is small, it is not negligible. An important reason for this is that the pulse duration of the
free-running Er:YAG laser is typically on the order of 250 µs FWHM allowing significant
162

thermal diffusion as this pulse duration is significantly longer than the thermal diffusion time
(approximately 1.6 µs) given the optical penetration depth of ~1 µm at the 2.94 µm wavelength.
Alternatively, the Q-switched Er:YAG typically has a pulse duration of 40-100 ns FWHM and
hence is thermally confined. However, this shorter pulse duration has been shown to result in
more explosive ablation and can lead to increased mechanical damage owing to explosive bubble
expansion and collapse, in particular when applied in close vicinity to solid boundaries where
cavitation can result in damaging jet formation. In a related scenario, collateral damage may be
caused due acoustical impedance mismatch boundaries resulting in strong pressure transients [6].
This may also be true for the free-running Er:YAG, which has 1 µs spikes during its pulse.
Consequently, the search for alternative lasers and laser parameters has been an ongoing quest.
Recent research using a Free Electron Laser (Mark III), a tunable infrared source, has
provided strong evidence that ablation at wavelengths near λ = 6.45 µm results in tissue ablation
with minimal collateral damage (< 40 µm) yet yields a high ablation rate that is useful for human
surgery. In biological soft tissue, this wavelength of light is coupled into the vibrational modes
of water molecules (symmetric and asymmetric stretch) [7] as well as the vibrational mode of the
amide-II bond. It has been postulated that this direct absorption by the essential bond in the
backbone of most structural proteins, has the potential to reduce the tissue integrity, thus
allowing for efficient ablation of ocular and neural tissue with minimal collateral damage [8, 9].
In addition the FEL pulse consists of a 5 µs macropulse, which is made of up a micropulse train
of 1 ps pulses at 3 GHz. The relative contributions of the FEL pulse structure and specific
wavelength to the ablation process continues to be the subject of investigation [10-12].
Based on the various pre-clinical studies [9, 13-20], two clinical protocols are currently
underway that utilize the Mark III FEL in neurosurgical (brain tumor resection) and
163

ophthalmologic (optic nerve fenestration) applications. While these studies are still ongoing,
preliminary results suggest that the FEL at 6.45 µm is able to ablate biological soft tissue in vivo
in humans with minimal and sometimes undetectable collateral damage. To date, the delivery of
mid-infrared laser radiation (for the purpose of this study defined as light in the wavelength
range from 6 - 7 µm) has been limited to that in air and thus to applications in which the target
tissue can be readily exposed. It should be noted that the fiberoptic materials that are used for
transmission of the Er:YAG wavelength (sapphire and zirconium fluoride) do not transmit in the
6-7 µm range. In this study we will explore the possibility of using the FEL at the mid-infrared
part of the spectrum (6-7 µm) delivered via optical fibers to ablate eloquent target structures in a
liquid environment. While there are numerous examples of applications that would benefit from
this approach, we will focus on one of the most obvious ones: vitreoretinal procedures.
The use of laser light with adequate cutting capabilities in vitreoretinal surgery would
allow for safe and extended tractionless removal of different types of vitreoretinal membranes, as
well as retinotomy and retinectomy [21]. Various researchers have investigated the use of the
Er:YAG laser in retinal and vitreous surgery and concluded that the Er:YAG laser is an effective
tool for the complete transection of vitreous membranes as well as the creation of retinectomies
in detached retina. Nevertheless, although the Er:YAG laser has been shown to produce precise
tissue transection and ablation [22-26], there are two main problems in using infrared-laser (IR-
laser) radiation in an aqueous environment such as the vitreous. First, the aqueous environment
by virtue of its strong absorption coefficient for the laser radiation greatly impedes the amount of
laser radiation that actually reaches the target tissue unless the delivery fiber is in direct contact
with the target tissue. This in turn increases the risk of mechanically damaging the delicate
structures in the retina and retinal nerve layer. Second, the formation of fast expanding and
164

subsequent collapsing water vapor bubbles at a submerged fiber tip may cause mechanical
damage both directly or indirectly owing to the generation of strong pressure transients [6, 27].
In order to deliver mid-infrared light to vitreoretinal tissues, a delivery system through a
liquid environment needs to be devised. In addition to a delivery fiber able to transmit the
wavelength range of interest, the laser radiation needs to be delivered to the target retinal layer.
Given the absorption coefficient of vitreous in the 6-7 µm range (µa ~80 mm-1) and the
macropulse duration of the FEL of only 5 µs (as compared to the Er:YAG laser's 250 µs which
allows delivery through a laser-induced vapor channel), this means that either the fiber needs to
be in contact with the tissue or the infrared absorbing vitreous needs to be replaced with a liquid
that does not absorb the infrared laser radiation. When using the Er:YAG laser for this
application, Wesendahl et al. [25] replaced the vitreous with perfluorodecalin, a member of the
perfluorocarbon family, which is routinely used as a temporary vitreous substitute as a means to
prevent retinal detachments during vitreoretinal procedures [28]. Perfluorocarbon liquids
(CF3(CF2)nCF3) have many characteristics that make them beneficial for vitreoretinal
applications including the following: high specific gravity, low viscosity, and immiscibility in
water. In addition, perfluorocarbons conveniently have the added characteristic of relative
transparency in the infrared part of the spectrum with a µa = 0.05 mm-1 at λ = 2.94 µm [25].
Perfluorocarbon liquids were first evaluated for medical use as oxygen carriers in 1966 [29].
PFCL’s were first used as vitreous substitutes and employed clinically for vitreoretinal surgery in
1987 [30, 31]. The introduction of PFCL’s has enhanced the success rate of many vitreoretinal
surgical procedures. Their high specific gravity allows for the hydrokinetic stabilization of the
retina on the posterior pole of the eye during surgery. By this means, the retina is flattened and
the sub-retinal fluid can be displaced without a posterior retinotomy [3].
165

At the current time, the Vanderbilt Free Electron Laser is one of the few lasers in the
world that has the capability of delivering the λ = 6.45 µm wavelength with sufficient pulse
energy and average power to be useful for medical applications. However, in the next few years,
alternative technologies based on solid state developments (OPO’s) as well as other lasers will
become available and have output characteristics that will make them amenable to medical
applications on a broader scale. At that time, delivery devices will be necessary to push this
technology to clinical investigations.
The goal of this study is to investigate the potential of the 6.45 µm wavelength pulsed
infrared laser for ablation in a liquid environment. To this end we have explored transmission
and threshold damage characteristics of two different IR-transmitting fiberoptic materials and
have explored the use of perfluorocarbon liquids as mid-infrared transparent liquid vitreous
substitutes. Ablation characteristics of a water-rich tissue phantom through several
perfluorocarbon liquids were documented.
B.3 Materials and Methods
B.3.1 Fiber Delivery of 6.45 µm Laser Pulses
Silver halide fibers (AgCl0.4Br0.6), School of Physics and Astronomy-Tel Aviv
University, and arsenic sulfide fibers, Naval Research Lab-Washington, D.C., were tested for
transmission characteristics at the wavelengths of interest (2.94, 6.1, and 6.45 µm). The silver
halide fibers (AgCl(x)Br(1-x)) were 700 µm in diameter and were core only. Samples used were
typically 20 cm in length but fibers with 2 m lengths were available and were AgCl0.6Br0.4. The
arsenic sulfide fibers (part of the chalcogenide glass family of materials) were 800 µm in
166

diameter core and were core with cladding. These fibers were typically 100 cm in length. These
fibers were tested to determine their damage thresholds with respect to the high peak power of
the FEL which is on the order of ~GW/cm2. This high peak irradiance is due to the unique pulse
structure of the FEL. It is the pico-second micro-pulse that leads to the high peak irradiance that
is inherent with the FEL used. The Vanderbilt University FEL (Mark III) was used as a test laser
for transmission and damage threshold experiments. The laser light was sent through a double
Brewster plate polarizer (II –VI Incorporated, Saxonburg, PA), which allowed continuous
variation of the laser power. This polarizer was mounted on a motorized rotation stage in the
vacuum beam-line of the FEL and controlled by a vacuum feed-through controller (New Focus,
San Jose CA). In all experiments the laser was tweaked to ensure a pulse-to-pulse variation in
energy of less than 10%, measured over 500 pulses. After leaving the vacuum beam transport
system via a BaF2 window, the light was then focused onto the face of the fiber with a two-inch
diameter, 200 mm focal length CaF2 lens. The beam profile was determined to be a Gaussian
into the fiber and a top hat with varying hot spots out of the fiber by guiding the beam onto a
Spiricon beam profiler. The fiber was positioned just beyond the focal point of the lens in order
to avoid focusing inside the fiber. The coupling was maximized for transmitted power. The
experiment was repeated for multiple fiber samples (n ≥ 3) at λ = 2.94, 6.1, and 6.45 µm. By
rotating the polarizer, the input energy was slowly increased from the minimum the polarizer
would allow (~0.5 mJ / pulse) up to the point of fiber failure. The input power as well as the
transmitted power was determined by using a Molectron EPM 2000 laser energy meter
(Molectron Detector Inc., Portland, OR). Input energy to the fiber was measured just after the
coupling lens using a Molectron J-50 detector. The energy transmitted through the fiber was
measured by placing the detector within 1 cm from the distal end of the fiber. The transmission
167

was determined as a function of wavelength, input energy, and fiber length. Three samples of
each fiber type were used to determine the average transmission for each fiber material. By
using two different lengths of fiber samples, losses due to coupling and Fresnel reflections were
decoupled from bulk losses in the fiber material. In all fibers the damage threshold was defined
as the input energy level at which the transmission of the fiber started to drop, i.e. failure.
B.3.2 Optical Property Determination of Perfluorocarbon Liquids
Seven different perfluorocarbon liquids (PFCL’s) (3M, St. Paul MN; F2 Chemicals Ltd.,
Lea Town, Preston, UK; Oakwood Products Inc., West Columbia, SC) of varying composition,
chain length and branching, were tested for their absolute absorption properties in the infrared
from 2-10 µm. The infrared spectra were obtained using a Fourier Transform Infrared
spectrometer (FTIR). The spectra were obtained using a Bruker IFS 66-V FTIR in the
transmission mode through a 500-micrometer sample chamber. The infrared spectra of the
PFCL’s were compared to that of saline. Saline was used as a control for comparison with the
PFCL’s to simulate the make up of vitreous humor. The absolute transmission measurements
from the FTIR were used to calculate the absorption coefficient of the PFCL’s. The FTIR data
was then compared to data obtained by a Beer’s law experiment using the FEL to determine
whether or not the unique pulse structure of the FEL and whether the high intensities of the laser
caused any differences in the absorption properties of the materials tested. Relevant material
properties of the seven tested PFCL’s (to the extent they are known or provided by the
manufacturers) are shown in Table B.1.
To verify the FTIR data at selected wavelengths and to investigate the effect of intensity
and pulse profile on the absorption rate, a Beer’s law experiment was performed by coupling the
168

light at the three wavelengths of interest (2.94, 6.1, and 6.45 µm) into a silver halide fiber. The
fiber was then placed inside a homemade sample chamber of which the bottom consisted of CaF2
such that the mid-IR light could be transmitted through the bottom of the chamber and was
measured by a detector immediately below the chamber. The chamber was filled with each
PFCL and the fiber was translated away from the CaF2 window in 200-micrometer increments by
a Newport translation stage (Newport, Irvine, CA) until a distance of 4 mm was obtained or no
measurable transmission could be detected. The transmission through the bottom of the sample
chamber was measured at each increment using the power meter. The average of 50 pulses with
a repetition rate of 15 Hz was recorded. An exponential fit to the transmission versus distance
curve yielded the absorption coefficient of the liquid. In these experiments the imaging setup
(next section) was used to ensure that the radiant exposure at the fiber’s distal end was low
enough to avoid bubble formation or cavitation effects that could influence the transmission
measurements.
B.3.3 Target Ablation Through Perfluorocarbon Liquid
A standard pump-probe imaging technique was used to image the ablation process at the
distal end of the fiber [32]. This method was used to document the ablation dynamics both in the
PFCL alone as well as the ablation of a tissue phantom through the PFCL. Based on the fiber
testing experiments we used a silver halide fiber for the ablation experiments. The source for the
imaging illumination was a nitrogen dye laser (Laser Photonics LN 1000), with a rhodamine dye
module operating at 644 nm, (Laser Photonics LN 102). The timing between the FEL pulse
(pump) and the nitrogen dye pulse (probe) was set using a digital delay/pulse generator (Stanford
169

PF-50
601
PF-50
701
PF-50
801
Perflu
orod
ecali
n2,3
Perflu
oro-
1,3-
dimeth
ylcyc
lohex
ane
2
Perflu
orom
ethyld
ecali
n2
Perflu
orop
erhy
drofl
uore
ne2
Wate
r
Boiling Point oC 50-60 75-90 90-107 142 102 155 194 100Vapor Pressure (mmHg) 232 79 45.7 6.6 36 2.175 <1 16.112Density (g/cm3) 1.7 1.7 1.7 1.917 1.828 1.972 1.984 1Viscosity(mm2/sec) 0.4 0.7 0.8 2.66 1.06 3.25 4.84 100Refractive Index N/A N/A N/A 1.313 1.2895 1.3195 1.3289 1.34Molecular Weight N/A N/A N/A 462 400 512 574 18Heat of Vaporisation (kJ/kg) N/A N/A N/A 78.7 82.9 75.5 71 2260
1 3M, 2 F2 Chemicals Ltd., 3 Oakwood Products, Inc.
N/A Data Not Available From Company
Table B.1 The relevant physical properties (to the extent that they are provided by the manufacturers) of the seven different perfluorocarbon liquids that were used are shown in comparison with water. Note that PF-5060, PF-5070, and PF-5080 are identifiers assigned by the manufacturer (3M) representing (mostly) 6-carbon, 7-carbon, and 8-carbon PFCL’s.
170

Research Systems Inc., Model DG535). The output of the nitrogen dye probe laser was coupled
into a 600 µm multimode fiber with a length of ~ 1000 m. This fiber length significantly reduces
the coherence of the probe light and hence improves the image quality by eliminating speckle. A
standard black and white CCD camera was used with a frame rate of 30 Hz to record the images
onto an S-VHS videotape. The images were then digitized using an ATI Rage-Pro Mobility
video card for processing and analysis.
The ablation of the liquid was performed using Perfluorodecalin (which has a high
boiling point), PF-5060 (which has a low boiling point), and water at 6.45 µm in wavelength
with the FEL. For these experiments the silver halide fiber was placed in a horizontal position in
order to avoid trapping of gas bubbles underneath the fiber tip. The fiber was inserted through a
watertight port that was built into a glass cuvette. The ablation of the tissue phantom was done
using Perfluorodecalin at 2.94 µm and 6.45 µm in wavelength. The setup for the tissue phantom
ablation was the same as for the liquid ablation, except that the fiber orientation was vertical, and
the tissue phantom was placed in the bottom of the cuvette. The tissue phantom used was gelatin
that was 90% water by weight.
In order to quantify the effect of varying the distance of the fiber from the target in
perfluorodecalin, the tissue phantom ablation experiment was repeated at λ=6.45 µm by varying
the distance of the fiber from the target surface and the number of pulses delivered. The ablation
depth was then determined for each data point for quantification.
B.4 Results
The results of the fiber experiments are summarized in Table B.2. At λ = 6.45 µm, it was shown
that the silver halide fibers, including all the coupling and Fresnel losses, were able to transmit
171

60 percent of the incident light for a fiber length of approximately 20 cm. The arsenic sulfide
fibers are known to have a fairly significant drop-off in transmission above λ = 6.2 µm so they
were tested at a wavelength of 6.1 µm. The bulk losses of both fiber materials were
approximately the same (0.54 dB/m or 11.7 %/m and 0.62 dB/m or 13 %/m) respectively). The
damage threshold of the silver halide fibers was significantly lower than that of the arsenic
sulfide fibers (7.8 J/cm2 versus 15.9 J/cm2), where these numbers represent the threshold radiant
exposure (at the center of the Gaussian) per macropulse with the laser running at 30 Hz. Derived
from this are the peak irradiance damage threshold values (calculated per micropulse of 1 ps).
These values are 0.54 GW/cm2 and 1.12 GW/cm2 for the silver halide and arsenic sulfide fibers
respectively. Practically speaking, in the 20 cm long fiber samples of silver halide, we were
transmitting up to 7 mJ (output energy) per macropulse (5 µs) at 30 Hz through a 700 µm
diameter fiber reliably for an extended period of time (> 10 min). This represents a radiant
exposure of 1.82 J/cm2 at the distal fiber surface, which was sufficient to conduct the ablation
experiments (Hth = 0.41 J/cm2 for water at λ = 6.45 µm and Hth = 0.0326 J/cm2 for water at λ =
2.94 µm) [33, 34]. In addition, although not quantitatively analyzed in this study, the silver
halide fibers are more flexible, softer, and bendable when compared to the rather stiff and brittle
arsenic sulfide fibers. Moreover, when damaged at the surface, the silver halide fibers could
fairly easily be re-cut without the need to polish; while the arsenic sulfide fibers are difficult to
cut and need to be polished. This, together with the equivalent loss characteristics, led us to
choosing the silver halide fibers for the rest of the experiments. FTIR analysis on the seven
PFCL’s showed no significant differences in the absorption curves for all the PFCL’s tested in
the range from 2 - 7 µm. Beyond 7 µm some differences were observed but this was outside of
172
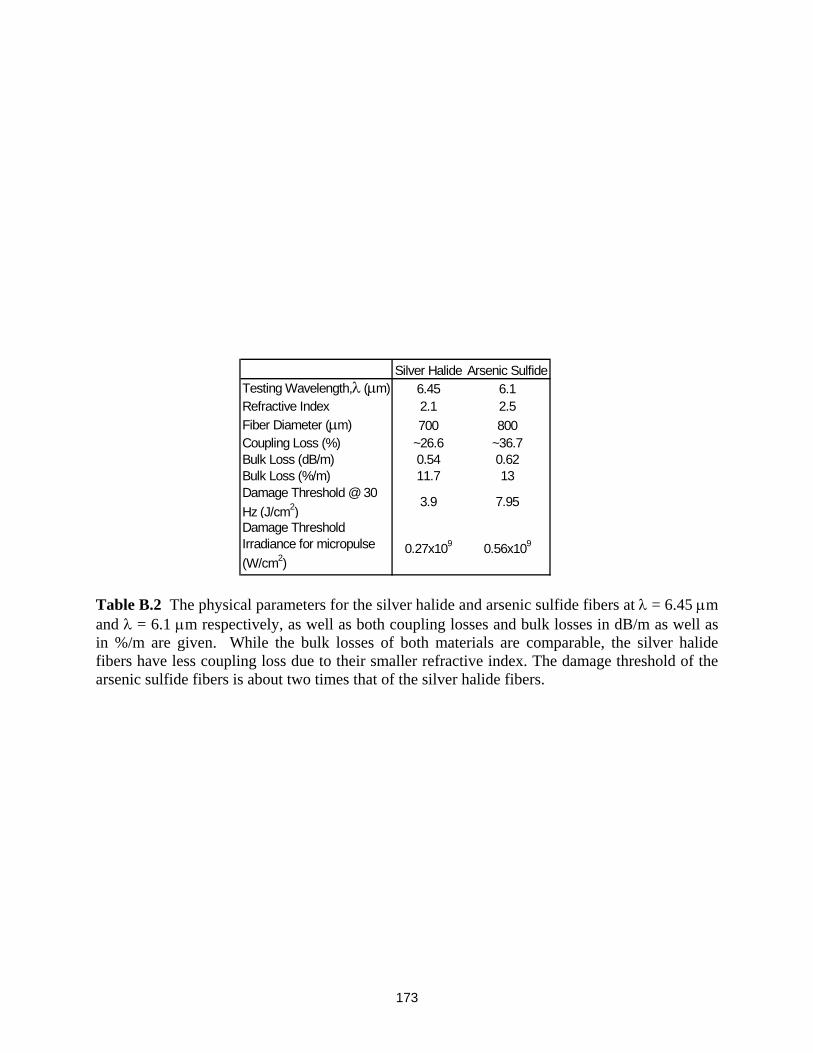
Silver Halide Arsenic SulfideTesting Wavelength,λ (µm) 6.45 6.1Refractive Index 2.1 2.5Fiber Diameter (µm) 700 800Coupling Loss (%) ~26.6 ~36.7Bulk Loss (dB/m) 0.54 0.62Bulk Loss (%/m) 11.7 13Damage Threshold @ 30 Hz (J/cm2)
3.9 7.95
Damage Threshold Irradiance for micropulse (W/cm2)
0.27x10⁹ 0.56x10⁹
Table B.2 The physical parameters for the silver halide and arsenic sulfide fibers at λ = 6.45 µm and λ = 6.1 µm respectively, as well as both coupling losses and bulk losses in dB/m as well as in %/m are given. While the bulk losses of both materials are comparable, the silver halide fibers have less coupling loss due to their smaller refractive index. The damage threshold of the arsenic sulfide fibers is about two times that of the silver halide fibers.
173

the region of interest for this study. Figure B.1 shows the absorption curves for 5 of the 7
PFCL’s: perfluorodecalin, perfluoroperhydrofluorene, perfluoromethyldecalin, as well as 3M's
proprietary PFCL’s encoded PF-5070 (mostly a 7 carbon backbone) and PF-5080 (mostly an 8
carbon backbone). The remaining two PFCL’s, PF-5060 and perfluoro-1,3-dimethylcyclohexane
are not shown in the figure but had absorption curves that were indistinguishable from the ones
plotted here. It can be seen that the absorption coefficient for wavelengths < 3.8 µm is negligible
(and is not accurately measurable with the 500 µm thick sample chamber of the FTIR). For
wavelengths > 5 µm the absorption coefficient increases and at 6.45 µm the absorption
coefficient equals approximately 3 mm-1 for all PFCL’s tested. Figure B.2 shows that saline has
an absorption coefficient at least two orders of magnitude higher than perfluorodecalin at the
wavelengths of interest (λ = 2.94, 6.1, and 6.45 µm) indicating the potential advantage of the
perfluorodecalin as a vitreous substitute for infrared laser delivery. Figure B.3 shows the
absolute absorption coefficients of the seven PFCL’s at the three wavelength of interest as
obtained from the Beer’s law experiment. These values confirmed the values obtained from the
FTIR experiments, indicating that the absorption coefficients of the PFCL’s are independent of
the pulse structure or intensity of the FEL. This figure shows that the absorption coefficient rises
from 0.084 mm-1 at λ = 2.94 µm to 3.36 mm-1 at λ = 6.45 µm, but are not significantly different
between the seven different PFCL’s.
The pump-probe imaging was first performed in saline to compare it with pump-probe
imaging that had been done with non-FEL lasers to determine whether the process of bubble
formation with the FEL was comparable to that of other lasers such as the Ho:YAG. In fact, with
174

0
2
4
6
8
10
12
14
16
18
2 4 6 8 10
Wavelength (µm)
Abs
orpt
ion
Coe
ffici
ent (
1/m
m) Perfluorodecalin
PF-5070
PF-5080
Perfluoroperhydrofluorene
Perfluoromethyldecalin
Figure B.1 FTIR spectra for five of the seven different perfluorocarbon liquids tested. It can be seen that all five of these spectra are nearly identical throughout the 2-7 µm wavelength of interest and only slightly deviate beyond 7 µm. The remaining two PFCL’s (PF-5060 and perfluoro-1,3-dimethylcyclohexane) had similar curves (not shown here). Note that there is no measurable absorption of light (in the 500 µm cuvette used in the FTIR) in the 2-3.5 µm range.
175

0.1
1
10
100
1000
10000
2 4 6 8
Wavelength (µm)
Abso
rptio
n C
oeffi
cien
t (1/
mm
)
Saline
Perfluorodecalin
10
Figure B.2 A comparison of the FTIR spectra for perfluorodecalin and saline is shown. From these spectra it is clear that the absorption coefficient of saline (vitreous) is at least two orders of magnitude higher at the mid-infrared wavelengths of interest (λ = 6.45 µm) and approximately 4 orders of magnitude higher at λ = 2.94 µm than the absorption coefficient of perfluorodecalin. This is of great significance because it indicates that a vast improvement in light transmission can be obtained by replacing the vitreous with a substitute such as perfluorodecalin.
176

0
0.5
1
1.5
2
2.5
3
3.5
4
4.5
PFC
-506
0
PFC
-507
0
PFC
-508
0
Perfl
uoro
deca
lin
Perfl
uoro
-1,3
-di
met
hylc
yclo
hexa
ne
Perfl
uoro
met
hyld
ecal
in
Perfl
uoro
perh
ydro
fluor
ene
Abso
rptio
n C
oeffi
cien
t (1/
mm
) 2.94 um
6.1 um6.45 um
Figure B.3 A plot of the absorption coefficients for all seven PFCL’s at the three target wavelengths obtained from the Beer’s law experiments. The absolute values of the absorption coefficient obtained from the Beer’s law experiment correlate very closely (within 5%) to the results obtained from the FTIR experiment. All seven PFCL’s have similar absorption coefficients for each wavelength, varying from 0.05 mm-1 to 0.1 mm-1 at λ = 2.94 µm and ~3 mm-1 at λ = 6.45 µm.
177

a µa = 3 mm-1, the absorption coefficient for the FEL at λ = 6.45 µm in PFCL is equivalent to the
absorption coefficient of the Ho:YAG laser (λ = 2.1 µm) in water. Figure B.4 shows the results
of this experiment. It can be seen in this figure that the vapor bubble grows until 70 µs after the
onset of the laser pulse and then starts to collapse. Note that the laser pulse itself is only 5 µs in
duration. At 130 µs after the start of the pulse, the bubble has collapsed, and the rebound bubble
is ejected from the tip of the fiber.
Figure B.5 shows the results of the laser delivery in PF-5060, which is the PFC with the
lowest boiling point available to us (see Table B.1). There are several differences compared to
the irradiation of saline that stand out. As early as 1 µs after the onset of the laser pulse, thermal
stress lines ('Schlieren effect') can be seen in the liquid immediately in front of the fiber. This
effect is more pronounced at 5 µs. At 15 µs bubble formation begins and continues until 100 µs.
At 300 µs, multiple bubbles can be seen at the fiber tip. At 800 µs, the bubbles start floating
away from the fiber tip to the surface. These bubbles can still be seen up to 50 ms after the pulse,
which shows that the bubbles do not collapse as they do in water.
In contrast to both water and PF-5060, perfluorodecalin showed a much different
chronicle of ablation. Throughout the time course of the pulse as well as long after, only lines of
heating ('Schlieren effect') could be seen at the fiber tip. No bubble formation or cavitation of the
perfluorodecalin itself was seen (Figure B.6) at the radiant exposures used in this experiment.
Figures 7 and 8 show the ablation dynamics of the gelatin tissue phantom in a perfluorodecalin
environment for λ = 2.94 µm and λ = 6.45 µm respectively. In both figures the image was
captured at 100 µs after the onset of the laser pulse with the four panels representing the
dynamics with the fiber positioned at various distances (1.0 mm, 0.5 mm, 0.3 mm and 0.0 mm)
178

Figure B.4 The chronicle of ablation of water at λ = 6.45 µm using the fast-flash pump-probe imaging setup. A 700 µm diameter silver halide fiber was used to deliver a macropulse energy of 5 mJ (radiant exposure 1.3 = J/cm2) with a duration of 5 µs, at a repetition rate of 5 Hz. Images were taken starting at the beginning of the FEL pulse through 130 µs after the start of the pulse. The vapor cavity continues to expand for 70 µs and subsequently collapses at approximately 110 µs, followed by a rebound bubble that ejects away from the solid face of the fiber (130 µs).
179

Figure B.5 The chronicle of ablation for PF-5060 at λ = 6.45 µm. A 700 µm diameter silver halide fiber was used to deliver a macropulse energy of 5 mJ (radiant exposure 1.3 = J/cm2) with a duration of 5 µs, at a repetition rate of 5 Hz. Images were taken starting at the beginning of the FEL pulse through 50 ms after the start of the pulse. In this series of images lines of heating (‘Schlieren effect’) as well as small bubble formation can be seen from the start of the pulse until 800 µs after the start of the pulse. The bubbles remain long after the pulse in contrast to that seen in water. These bubbles, unlike the transient vapor cavities seen in water, do not collapse and are still seen 50 ms after the pulse as they begin to float away from the fiber tip, and up to the surface.
180

Figure B.6 The chronicle of ablation for perfluorodecalin at λ = 6.45 µm. A 700 µm diameter silver halide fiber was used to deliver a macropulse energy of 5 mJ (radiant exposure 1.3 = J/cm2) with a duration of 5 µs, at a repetition rate of 5 Hz. Images were taken starting at the beginning of the FEL pulse through 50ms after the start of the pulse. This series of images shows increased heat deposition indicated by the lines of heating (‘Schlieren effect’) from the start of the pulse until 5 µs after the pulse. No bubble formation is observed at any time during or after the laser pulse. After the laser pulse, the heat that was generated during the pulse dissipates before the next pulse arrives.
181

from the target tissue phantom. In figure B.7 (with λ = 2.94 µm) with the fiber at a distance of 1
mm from the target tissue, a clear ablation plume originating at the surface of the tissue phantom
can be seen (left top panel). This shows that at λ = 2.94 µm, ablation can easily be accomplished
with the fiber tip as much as 1 mm away from the tissue surface. Once the fiber is brought to
within 0.3 mm of the tissue, a large vapor cavity is seen between the fiber and the tissue surface.
Figure B.8, in contrast (with λ = 6.45 µm), shows that with the fiber positioned at a
distance of 1 mm from the tissue surface, no ablation is seen. Under these conditions, no ablation
of the target tissue was observed at any time after the laser pulse (data not shown). Similar to the
irradiation of just the perfluorodecalin (figure B.6), the Schlieren lines, indicative to heating of
the liquid in front of the fiber, are clearly seen. With the fiber at a distance of 0.5 mm from the
target tissue, the first signs of an ablation plume originating from the target surface and ejected
material can be seen. As the fiber-target distance is reduced even more, the same large vapor
cavity was seen that was observed for λ = 2.94 µm. Figure B.9 shows the comparison of craters
produced in the target tissue phantom by λ = 2.94 µm and λ = 6.45 µm for multiple pulses. This
figure shows that ablation of the target tissue by delivering the laser radiation via the silver
halide fiber and delivered through a layer of 0.5 mm of perfluorodecalin is possible at both
wavelengths, but the ablation efficiency is much greater at λ = 2.94 µm.
The results of the ablation depth experiment are shown in figure B.10. The largest
ablation depth of 587.5 µm was obtained after 500 pulses with the fiber in contact (Z=0.0 mm)
with the tissue phantom surface. With a fiber-target distance of Z=0.7 mm, an ablation depth of
70 µm was seen with 500 pulses delivered. A negligible depth of only 10 µm was seen with a
fiber-target distance of 1.0 mm. There was no detectable crater visible for any less than 500
pulses at this distance.
182

Figure B.7 The ablation of phantom tissue (gelatin with 90% w/w water) through perfluorodecalin at λ = 2.94 µm. A 700 µm diameter silver halide fiber was used to deliver a macropulse energy of 1.0 mJ (radiant exposure 0.26 = J/cm2) with a duration of 5 µs, at a repetition rate of 5 Hz. All images were taken at 100 µs after the beginning of the pulse. The distance between the fiber tip and the tissue was changed from 1.0 mm (left top panel) down to 0.0 mm (right bottom panel). At a distance of 1.0 mm, an ablation plume can clearly be seen originating from the surface of the target with material being ejected from the target tissue. When the fiber is within 0.3 mm of the tissue a large vapor cavity is formed between the fiber and the tissue since the fiber acts as a piston that prevents free escape of heated material.
183

Figure B.8 Ablation of phantom tissue (gelatin with 90% w/w water) through perfluorodecalin at λ = 6.45 µm. A 700 µm diameter silver halide fiber was used to deliver a macropulse energy of 5.5 mJ (radiant exposure 1.43 = J/cm2) with a duration of 5 µs, at a repetition rate of 5 Hz. All images were taken at 100 µs after the beginning of the pulse. The distance between the fiber tip and the tissue was changed from 1.0 mm (left top panel) down to 0.0 mm (right bottom panel). At d = 1.0 mm, heat deposition in the PFCL is seen (Schlieren lines); however no ablation of either the target tissue or the perfluorodecalin is observed. In contrast, at d = 0.5 mm (right top panel), an ablation plume originating from the target tissue is visible with material ejection. When the fiber is brought within 0.3 mm of the tissue, a large vapor cavity originating from the target tissue is created, consistent with that seen at λ = 2.94 µm.
184

15 pulses 30 pulses 45 pulses
Figure B.9 The effect of multiple pulse delivery and crater drilling in target tissue through 0.5 mm of perfluorodecalin. Top row (left to right): respectively 15, 30 and 45 pulses (λ = 6.45 µm, macropulse energy = 5.5 mJ (radiant exposure = 1.43 J/cm2)) delivered through a 700 µm diameter silver halide fiber). A small plume of ejected material is seen in the first frame, after one pulse. After more pulses are delivered, the amount of material removed increases slightly and reaches a plateau as the effective distance between the fiber and bottom of the crater increases. A non-transient bubble forms at the fiber tip. Bottom row (left to right): respectively 15, 30, and 45 pulses (λ = 2.94 µm, macropulse energy = 1.0 mJ (radiant exposure = 0.26 J/cm2)) delivered through a 700 µm diameter silver halide fiber). Large amounts of ejected material can be seen with a growing crater being formed for each additional pulse.
185

0
100
200
300
400
500
600
700
0 200 400Number of Pulses
Abl
atio
n D
epth
(µm
)
z=0 mm
z=0.3 mm
z=0.5 mm
z=0.7 mm
z=1 mm
Figure B.10 The ablation depth in gelatin as a function of the number of pulses delivered through perfluorodecalin was measured (λ = 6.45 µm, macropulse energy = 5.5 mJ (radiant exposure = 1.43 J/cm2)) for different fiber-target distances. Gelatin with 90% (w/w) water was used as the target tissue phantom. The ablation crater depth was measured for different distances (Z) between the silver halide fiber and the gelatin, Z=0.0 mm (n=4), , Z=0.3 mm (n=3), , Z=0.5 mm (n=3), , Z=0.7 mm (n=1), , and Z=1.0 mm (n=1), . The number of pulses delivered at each of these distances was varied between 5 and 500 pulses. The crater depth was measured in real time on a high magnification, close-up video image from a black and white CCD camera.
186

B.5 Discussion
In order to extend and explore the use of pulsed mid-infrared (6 - 7 µm) laser ablation of
biological tissue to applications that require a liquid environment, we investigated a combination
of optical fibers capable of transmitting these wavelengths as well as an infrared transparent
family of perfluorocarbon liquids (PFCL’s).
We have investigated the use of two different fiber optic materials capable of transmitting
laser radiation in the wavelength range around 6.45 µm. The requirements for these delivery
systems are two-fold: 1) transmit the wavelength of interest; and 2) tolerate the peak irradiance
from the FEL pulse. Thus far, delivery systems used for this wavelength include a modified
articulated arm, a free beam delivery system with beam steering via two orthogonal
galvanometric mirrors, and hollow waveguides [18, 35-41]. All of these systems have
advantages and disadvantages in terms of transmission characteristics, damage thresholds,
flexibility and ease of use. However, they are all unable to deliver the laser radiation in a liquid
environment. Only one of these methods, the hollow wave guide, can potentially be packaged to
be used in a liquid environment and has the potential to be used in tight spaces that are difficult
to access (i.e. in minimally invasive procedures) [38]. However, the hollow waveguides suffer
from significant losses that vary in an unpredictable fashion when bent [37, 39] and require
nitrogen purging. Hence, there is a need for fiberoptic materials capable of delivering the laser
radiation in this wavelength range. The materials tested in this study were silver halide,
developed at Tel Aviv University, Israel [42] and arsenic sulfide, developed at the Naval
Research Labs (NRL) [43-45]. It was shown that both fiber materials have similar bulk losses
(0.54 dB/m for silver halide vs. 0.62 dB/m for arsenic sulfide).Nagli et al. reported losses of 0.2
dB/m for unclad silver halide fibers with similar diameters at λ = 10.6 µm and noticed that the
187

bulk losses depended on the wavelength used in combination with the Cl/Br ratio [42]. Sanghera
et al reported losses of 0.76 dB/m for the arsenic sulfide fibers [43-45]. Hence our measured
values for FEL transmission are in fair agreement with values reporter in the literature.
Practically speaking and assuming a fiber length of approximately 2 m is desirable for medical
applications, this means that both fibers can deliver a reasonable fraction of the incident light to
the target tissue (roughly 80%, not considering coupling losses). The most significant loss in
both materials occurs due to the significant Fresnel losses owing to the relatively high refractive
indices of these materials (2.1 and 2.5 respectively). An obvious solution would be to equip the
fibers with antireflective coatings. At the present time, AR coatings, to the extent that they are
available for the wavelengths of interest, are unable to handle the peak irradiance from the pulsed
laser source at the mid-infrared (6 - 7 µm) wavelengths used. In a pilot experiment an AR
coating on the arsenic sulfide fiber had a damage threshold of approximately 0.1 J/cm2 or 0.007
GW/cm2, which is about 2 orders of magnitude less than the fiber itself (data not shown).
Damage thresholds for the arsenic sulfide fibers were shown to be a factor of 2 higher
than those measured for the silver halide fibers (15.9 J/cm2 vs. 7.8 J/cm2). In both fiber materials,
failure occurred at the input end of the fiber surface in all but one instance. Only in one of the
arsenic sulfide fibers did we observe a fracture inside the bulk fiber material, which was
attributed to a material defect. It was found that coupling geometry (placing the fiber beyond the
focal plane of the coupling lens) and clean fiber ends (any dust particles greatly decreased the
damage threshold) were essential in optimizing the damage threshold. It is worth noting that the
silver halide fibers were tested at the desired wavelength of λ = 6.45 µm while the arsenic sulfide
fibers were tested at λ = 6.1 µm. The primary reason for this is that the transmission of the
arsenic sulfide fibers is known to drop off significantly beyond λ = 6.1 µm [46]. Arsenic
188

selenide, another member of the chalcogenide glass family, has been shown to transmit well up
to λ = 9 µm with bulk losses that are similar (0.73 dB/m) and hence would be appropriate to use
at λ = 6.45 µm [45]. However, in the current state of development, these fibers are inferior to the
arsenic sulfide fibers with regards to the damage thresholds which is approximately half that of
the arsenic sulfide fibers [44].
Besides transmission and damage threshold characteristics, other factors to consider are
fiber flexibility, brittleness, ease of handling, and toxicity. Based on these considerations, we
elected to use the silver halide fibers for the ablation testing. In particular the ease of handling,
lack of brittleness, and softness of the silver halide material (the consistency resembles that of
soldering wire) compared to the arsenic sulfide fibers make the silver halide fibers the material
of choice. However, it should be noted that this is not a fundamental limitation of the
chalcogenide fibers, but rather one that can be resolved by adequate cabling and packaging [47].
The perfluorocarbon liquids (PFCL’s) were hypothesized to be infrared transparent
liquids allowing the transmission from the delivery fiber to the target tissue. It has been reported
that for the λ = 2.94 µm this is indeed the case and the absorption coefficient has been reported
to be on the order 0.05 mm-1 [25, 48]. In our experiments this finding was confirmed by both the
FTIR spectroscopy as well as the direct Beer's law experiment with the FEL. In contrast we
found that at the mid-infrared wavelengths of interest (λ = 6.1 µm and λ = 6.45 µm), the
absorption coefficient is not negligible but rather is on the order of 2.07 mm-1 and 3.36 mm-1
respectively. However, these values are still about 2 orders of magnitude less than those of saline
(and hence vitreous) for the same wavelengths.
The seven different PFCL’s did not show a significant difference in their optical
properties at the wavelengths of interest. In addition, both the FTIR and Beer's law/FEL
189

experiments resulted in similar values for the absorption coefficient for a given material,
indicating that there are no significant effects of the dynamic (i.e. intensity dependent) optical
properties. With the optical properties being roughly equal, other parameters need to be
considered when selecting a PFCL of choice. As one of the goals of using the non-absorbing or
minimally absorbing liquid is to avoid bubble formation and the associated potential of bubble
collapse, acoustic transients, and mechanical damage, an obvious consideration is to select the
PFCL with a high boiling point (see Table B.1). Therefore, based on this consideration,
perfluorodecalin, a 10 carbon-backbone molecule with a boiling point of 142 oC was selected for
the ablation experiments. Moreover, the perfluorodecalin was shown to have the lowest
absorption coefficient (figure B.3), and is the most commonly used of the PFCL’s in medical
applications. In contrast, we also used the lowest boiling point PFCL, PF-5060 (3M), with a
boiling point of 50-60 oC (see Table B.1).
The pump-probe imaging revealed several events. First when delivering λ = 6.45 µm via
the delivery fiber in saline, the events of bubble formation and collapse are as expected and in
close agreement to what has been seen before in for example the fiber delivery of a Q-switched
Er:YAG pulse in water [6]. The penetration depth of light at λ = 6.45 µm is approximately 12
µm in water (µa = 80 mm-1) [9, 10] and the pulse (τp = 5 µs) is relatively short compared to the
bubble lifetime. Moreover the bubble dynamics closely follow the Rayleigh relationship for
spherical water vapor cavities, which predicts that the lifetime of the bubble in ms (in this case ~
0.11 ms) equals the bubble size in mm divided by 10 (in this case ~ 0.105 mm) [49]. In contrast,
the delivery of identical (same wavelength, irradiance) laser pulses in the PFCL showed a very
different behavior. In the low boiling point PF-5060, the origination of a long-lived bubble was
observed that did not collapse and eventually rose to the surface. In a separate experiment (data
190

not shown) we observed that this bubble, when trapped underneath the fiber, would remain for at
least one hour, indicating that this is not simply a gaseous phase of the PFCL but rather a unique
gas that originated as a result of the laser irradiation. We speculate that the content of the gas
bubble is either oxygen forced to dissociate from the PFCL (these liquids are known to
reversibly bind oxygen and are being investigated as potential blood substitutes for this reason),
or short chain carbon gasses that are generated by thermal or direct photo-dissociative effects. In
perfluorodecalin no bubble formation (transient or residual) was observed at the radiant
exposures used (1.3 J/cm2). However, at higher radiant exposures, non-transient gaseous bubbles
were observed at higher laser pulse repetition rates in particular (data not shown). If indeed the
bubble content is a breakdown product of the perfluorocarbon material, there may be a legitimate
concern about potential toxicity effects. Tortelli et al. reported that thermal decomposition of
branched-chained perfluoroalkenes could indeed yield toxic compounds [50]. Clearly, prior to
engaging in clinical trial experiments, the contents of the produced gas must be determined.
Using perfluorodecalin as delivery medium, laser-induced lines of heating ('Schlieren effect') are
observed.
We believe that non-uniform heating (hotspots) in the mode of the beam exiting the fiber
may have caused the streaky pattern immediately in front of the delivery fiber. The induced
temperature gradients result in gradients in refractive index, which shows up as dark and light
streaks in the shadow-mode pump-probe imaging. This phenomenon is consistent with what has
been observed in Ho:YAG laser ablation of water in which the absorption coefficient is
equivalent (µa = 3 mm-1) to that in PFCL at λ = 6.45 µm [27]. Despite the fact that the input
beam profile from the FEL is a Gaussian, TEM00 mode, the beam profile out of the silver halide
fiber, measured with a Spiricon Pyrocam I Beam Profiler was a top hat with significant hotspots
191

(data not shown), which caused the uneven heating of the PFCL. This may lead to thermal
lensing, which is characterized by self-defocusing due to the temperature gradients, interference
caused by spherical aberration of the thermal lens, and asymmetric distribution caused by
thermal convection in a fluid medium [51]. However, the extreme thermal lensing induced self-
defocusing that was observed by Frenz et al [46] was not observed in our experiments. Most
likely due to the fact that the pulse energy (and hence the total thermal load) used in our
experiments was ~ 40 times less.
Our imaging experiments showed no evidence of pressure transient generation. Based on
the fact that the laser pulse does not fulfill requirements of stress confinement no thermoelastic
pressure wave is expected. Given the asymmetry of the bubble formation, bubble collapse is
unlikely to cause significant collapse pressures. While we did not attempt to measure pressure
transients associated with ablation of target tissue under PFC, Frenz et al reported pressure
transients of < 0.7 bar for similar experiments with the holmium and erbium laser [46].
We have shown that ablation of a tissue phantom target through PFCL using λ = 6.45 µm
is feasible. However, in contrast to the use of PFCL to transmit radiation at λ = 2.94 µm, the
delivery fiber needs to be in fairly close proximity to the target tissue as the optical penetration
depth is only on the order of 1/3 mm. Practically speaking, for the proposed application of this
laser delivery approach in vitreoretinal procedures, the distal end of the delivery fiber needs to be
close to (< 0.5 mm) but not in contact with the target tissue. An added advantage over using
PFCL’s in combination with the Er:YAG laser at λ = 2.94 µm is that the process is self limiting;
as a crater is ablated in the target tissue, the distance between the fiber and target tissue (now the
bottom of the crater) increases. Using the λ = 6.45 µm wavelength in combination with
perfluorodecalin, where the optical absorption is not insignificant but much smaller than that
192

vitreous, allows for a non-contact laser surgical procedure, yet remote (both lateral and axial)
structures are effectively shielded, as the radiant exposure of the beam reaching the target will
fall below the ablation threshold (as shown in figure B.10). This may optimize the efficacy and
safety of laser-based vitreoretinal surgery.
This study has shown the feasibility of an approach to deliver laser radiation in the mid-
infrared at radiant exposures above the threshold for tissue ablation by means of both fiber optics
and in a liquid environment. This method shows much promise for retinal surgical applications
and has significant implications for other applications that may benefit from the use of these
wavelengths in laser surgery.
B.6 Conclusions
Data presented show feasibility of fiber delivery of high power pulsed mid-infrared laser
radiation at λ = 6.45 µm using silver halide and arsenic sulfide fibers at clinically useful radiant
exposures in a liquid environment. Bulk losses of the two fibers are comparable while the
coupling losses in these high refractive index materials represent the most significant loss of
light. Silver halide fibers were found to be easier to handle and more flexible which made them
the fiber of choice for our experiments.
All of the perfluorocarbon liquids tested had similar absorption characteristics for the
wavelengths of interest. In contrast to the absorption coefficient of the PFCL's at λ = 2.94 µm
which is effectively negligible, at λ = 6.45 µm the absorption coefficient of the PFCL’s is ~ 3
mm-1. Pump-probe imaging showed the ablation sequence (λ = 6.45 µm) at the fiber tip in a
water environment, which revealed a fast expanding and collapsing bubble. In contrast the
volatile PF-5060 showed no fast bubble expansion and collapse but rather formation of non-
193

transient gas bubbles. Perfluorodecalin did not show any bubble formation at the radiant
exposures used.
It was shown that using the λ = 6.45 µm wavelength delivered via fiberoptics in combination
with perfluorodecalin allows for a non-contact laser surgical procedure. Depending on the
radiant exposure from the fiber, ablation through several hundred micrometers of PFCL is
possible in contrast to the limited penetration through native vitreous. Perfluorodecalin offers a
great improvement in enabling non-contact ablation of target structures, while allowing deeper
structures to be shielded, as the radiant exposure of the beam reaching the target will fall below
the ablation threshold. This may optimize the efficacy and safety of laser-based vitreoretinal
surgery.
This study has shown the feasibility of an approach to deliver laser radiation in the mid-
infrared at radiant exposures above the threshold for tissue ablation by means of both fiber optics
and in a liquid environment. This method shows promise for retinal surgical applications and has
significant implications for other applications that may benefit from the use of these wavelengths
in laser surgery.
B.7. Acknowledgements
This work was funded by the DoD (AFOSR award No. F49620-01-1-0429). The authors would
like to thank Dr. Borislav Ivanov, Vanderbilt University Physics Dept., for providing us with PF-
5060, PF-5070, PF-5080, and Perfluorodecalin; F2 Chemicals Ltd., UK for providing us with
perfluorodecalin, perfluoromethyldecalin, perfluoro-1,3,-dimethylcyclohexane, and
perfluoroperhydrofluorene; and the W. M. Keck Foundation Free Electron Laser Center staff for
their help throughout the completion of this work.
194

B.8 References
1. A. J. Welch, M. Motamedi, S. Rastegar, G. L. LeCarpentier, and D. Jansen, “Laser thermal ablation,” Photochem Photobiol, vol. 53, pp. 815-23., 1991.
2. M. L. McHam, D. L. Eisenberg, J. S. Schuman, and N. Wang, “Erbium:YAG laser
sclerectomy with a sapphire optical fiber,” Ophthalmic Surg Lasers, vol. 28, pp. 55-8., 1997.
3. S. Mertens, J. Bednarz, G. Richard, and K. Engelmann, “Effect of perfluorodecalin on
human retinal pigment epithelium and human corneal endothelium in vitro,” Graefes Arch Clin Exp Ophthalmol, vol. 238, pp. 181-5., 2000.
4. C. C. Neubaur and G. Stevens, Jr., “Erbium:YAG laser cataract removal: role of fiber-
optic delivery system,” J Cataract Refract Surg, vol. 25, pp. 514-20., 1999. 5. D. J. D'Amico, P. D. Brazitikos, G. R. Marcellino, S. M. Finn, and J. L. Hobart, “Initial
clinical experience with an erbium:YAG laser for vitreoretinal surgery,” Am J Ophthalmol, vol. 121, pp. 414-25., 1996.
6. J. T. Walsh, Jr. and J. P. Cummings, “Effect of the dynamic optical properties of water on
midinfrared laser ablation,” Lasers Surg Med, vol. 15, pp. 295-305, 1994. 7. J. Tribble, D. C. Lamb, L. Reinisch, and G. S. Edwards, “Dynamics of gelatin ablation
due to free-electron-laser irradiation,” Phys Rev, vol. E 55, pp. 7385-7389, 1997. 8. G. Edwards, R. Logan, M. Copeland, L. Reinisch, J. Davidson, B. Johnson, R. Maciunas,
M. Mendenhall, R. Ossoff, J. Tribble, and et al., “Tissue ablation by a free-electron laser tuned to the amide II band,” Nature, vol. 371, pp. 416-9., 1994.
9. S. R. Uhlhorn, S. Harrison, H. S. Pratisto, and E. D. Jansen, “Tissue ablation with the
free-electron laser: contributions of wavelength and pulse structure,” in: Laser-Tissue Interaction X, Jacques SL, Mueller GJ, Roggan A, Sliney DH (eds), SPIE, Bellingham, vol. 3601, pp. 356-61, 1999.
10. S. R. Uhlhorn, R. A. London, A. J. Makarewicz, and E. D. Jansen, “Hydrodynamic
modeling of tissue ablation with free-electron laser,” in: Laser-Tissue Interaction XI, Duncan DD, Hollinger JO, Jacques SL, (ed), SPIE, Bellingham, vol. 3914, pp. 238-243, 2000.
11. S. R. Uhlhorn, “Free electron laser ablation of soft tissue: The effects of chromophore
and pulse characteristics on ablation mechanics,” Ph.D. Thesis, Vanderbilt University, 2002.
12. J. H. Shen, V. A. Casagrande, K. M. Joos, D. J. Shetlar, R. R.D., W. S. Head, J. A.
Mavity-Hudson, and A. H. Nunnally, “Acute optic nerve sheath fenestration with the
195

free-electron laser,” in: Ophthalmic Technologies IX, P. O. Rol, K. M. Joos, F. Manns (eds), SPIE, Bellingham, vol. 3591, pp. 235-240, 1999.
13. K. M. Joos, G. S. Edwards, J. H. Shen, R. Shetlar, R. Robinson, and D. O'Day, “Free
Electron Laser (FEL) laser-tissue interaction with human cornea and optic nerve,” in: Ophthalmic Technologies VI, J-M Parel, K. M. Joos, P. O. Rol (eds), SPIE, Bellingham, vol. 2673, pp. 89-92, 1996.
14. D. Shetlar, K. Joos, J. H. Shen, and R. Robinson, “Endoscopic goniotomy with the free
electron laser,” Invest Ophtalmol Vis Sci (Suppl), vol. 38, pp. 169, 1997. 15. K. M. Joos, J. H. Shen, D. J. Shetlar, and V. A. Casagrande, “Optic nerve sheath
fenestration with a novel wavelength produced by the free electron laser (FEL),” Lasers Surg Med, vol. 27, pp. 191-205, 2000.
16. K. M. Joos, L. Mawn, J. H. Shen, E. D. Jansen, and V. A. Casagrande, “Acute optic
nerve sheath fenestration in humans using the free electron laser (FEL): a case report,” in: Ophthalmic Technologies XII, F. Manns, P. Soderberg and A. Ho (eds), SPIE, Bellingham, WA, vol. 4611, pp. (in press), 2002.
17. M. L. Copeland, G. Cram, W. Gabella, E. D. Jansen, J. D. Mongin, H. S. Pratisto, S. R.
Uhlhorn, and G. S. Edwards, “First human application of a free electron laser,” Neurosurgery, (submitted).
18. M. Copeland, G. P. Cram, G. S. Edwards, D. Ernst, W. Gabella, and E. D. Jansen, “First
Human Surgery with a Free Electron Laser,” SPIE, Plenary Session, 2000. 19. M. L. Copeland, G. Cram, W. Gabella, E. D. Jansen, J. D. Mongin, H. S. Pratisto, S. R.
Uhlhorn, and G. S. Edwards, “First human application of a free electron laser,” International Free Electron Laser Conference Users Workshop, 2000.
20. C. Azzolini, P. G. Gobbi, R. Brancato, L. Bosi, D. Gallo, M. Zelada, and F. Patelli,
“Interaction between infrared radiation and vitreous substitutes,” Arch Ophthalmol, vol. 115, pp. 899-903., 1997.
21. T. I. Margolis, D. A. Farnath, M. Destro, and C. A. Puliafito, “Erbium-YAG laser
surgery on experimental vitreous membranes,” Arch Ophthalmol, vol. 107, pp. 424-8., 1989.
22. G. A. Peyman and N. Katoh, “Effects of an erbium: YAG laser on ocular structures,” Int
Ophthalmol, vol. 10, pp. 245-53., 1987. 23. K. Tsubota, “Application of erbium: YAG laser in ocular ablation,” Ophthalmologica,
vol. 200, pp. 117-22, 1990.
196

24. T. Wesendahl, P. Janknecht, B. Ott, and M. Frenz, “Erbium: YAG laser ablation of retinal tissue under perfluorodecaline: determination of laser-tissue interaction in pig eyes,” Invest Ophthalmol Vis Sci, vol. 41, pp. 505-12., 2000.
25. A. D. Zweig, B. Meierhofer, O. M. Muller, C. Mischler, V. Romano, M. Frenz, and H. P.
Weber, “Lateral thermal damage along pulsed laser incisions,” Lasers Surg Med, vol. 10, pp. 262-74, 1990.
26. M. Frenz, H. S. Pratisto, F. Konz, and E. D. Jansen, “Comparison of the effects of
absorption coefficient and pulse duration of 2.12 um and 2.79 um radiation on laser ablation of tissue,” IEEE J Quant Electr, vol. 32, pp. 2025-2036, 1996.
27. E. D. Jansen, T. Asshauer, M. Frenz, M. Motamedi, G. Delacretaz, and A. J. Welch,
“Effect of pulse duration on bubble formation and laser-induced pressure waves during holmium laser ablation,” Lasers Surg Med, vol. 18, pp. 278-93, 1996.
28. A. Loewenstein, M. S. Humayun, E. de Juan, Jr., P. A. Campochiaro, and J. A. Haller,
“Perfluoroperhydrophenanthrene versus perfluoro-n-octane in vitreoretinal surgery,” Ophthalmology, vol. 107, pp. 1078-82., 2000.
29. L. Clark and K. Gollan, “Survival of mammals breathing organic liquids equilibrated
with oxygen at atmospheric pressure.,” Science, pp. 1755-1756, 1966. 30. S. Chang, N. Zimmerman, and T. Iwamoto, “Experimental vitreous replacement with
perfluortributylamine,” Am J Ophthalmol, pp. 29-37, 1987. 31. S. Chang, “Low viscosity liquid perfluorcarbons in vitreous surgery,” Am J Ophthalmol,
pp. 29-37, 1987. 32. T. G. van Leeuwen, M. J. van der Veen, R. M. Verdaasdonk, and C. Borst, “Noncontact
tissue ablation by holmium:YSGG laser pulses in blood,” Lasers Surg Med, vol. 11, pp. 26-34, 1991.
33. G. Edwards, D. Evertson, W. Gabella, R. G. R, T. King, J. Kozub, M. Mendenhall, J.
Shen, R. Shores, S. Storms, and R. Traeger, “Free-Electron Lasers: Performance, Reliability, and Beam Delivery,” IEEE Journal of Special Topics in Quantum Electronics, vol. 2, 1996.
34. H. S. Pratisto, S. R. Uhlhorn, and E. D. Jansen, “Beam delivery system at the Vanderbilt
Free Electron Laser Center for Clinical Applications,” Opt Eng, submitted. 35. H. S. Pratisto, S. R. Uhlhorn, M. Copeland, and E. D. Jansen, “Clinical beam delivery of
the Vanderbilt FEL: design and performance of a hollow waveguide - based handheld probe for neurosurgery,” in: Specialty Fiber Optics for Medical Applications, A. Katzir; J.A. Harrington (eds), vol. 3596, pp. 55-61, 1999.
197

36. J. H. Shen, J. A. Harrington, G. S. Edwards, and K. M. Joos, “Hollow-glass waveguide delivery of an infrared free electron laser for microsurgical applications,” Appl Optics, vol. 40, pp. 583-7, 2001.
37. H. S. Pratisto, S. R. Uhlhorn, and E. D. Jansen, “Beam delivery of the Vanderbilt Free
Electron Laser with hollow wave guides: effect on temporal and spatial pulse propagation,” Fiber and Integrated Optics, vol. 20, pp. 83-94, 2000.
38. Y. Matsuura, K. Matsuura, and J. A. Harrington, “Power delivery of free electron laser
light by hollow glass waveguides,” Applied Optics, vol. 35, pp. 5395-3597, 1996. 39. I. Gannot, R. Waynant, A. Inberg, and N. Croitoru, “Broadband flexible waveguides for
free-electron laser radiation,” Applied-Optics, vol. 36, pp. 6289-6293, 1997. 40. L. Nagli, D. Bunimovich, A. Shmilevich, N. Kristianpoller, and A. Katzir, “Optical
properties of mixed silver halide crystals and fibers,” J Appl Phys, vol. 74, pp. 5737-41, 1993.
41. J. S. Sanghera and I. D. Aggarwal, “Development of chalcogenide glass fiber optics at
NRL,” J Non-Cryst Solids, vol. 213/214, 1997. 42. J. S. Sanghera, B. L. Shaw, L. E. Busse, D. Talley, and I. D. Aggarwal, “ Infrared-
transmitting fiber optics for biomedical applications,” - in: Specialty Fiber for Medical Applications, Harrington JA, Katzir A (eds), SPIE, Bellingham, vol. 3596, pp. 178-187, 1999.
43. J. S. Sanghera, L. B. Shaw, L. E. Busse, V. Q. Nguyen, B. C. Cole, R. Mossadegh, P.
Pureza, F. Kung, R. Miklos, D. Talley, D. Roselle, B. B. Harbison, and I. D. Aggarwal, “Development and infrared applications of chalcogenide glass optical fibers,” Fiber and Integrated Optics, vol. 20, pp. 71-82, 2000.
44. J. S. Sanghera, P. Pureza, I. D. Aggarwal, V. Nguyen, M. R., and F. Fung, “Fabrication
of long lengths of low-loss As40S(60-x)Se(x) glass fibers,” J Lightwave Tech, vol. 14, pp. 1-6, 1996.
45. S. Vohra, F. Bucholtz, G. Nau, K. Ewing, and I. D. Aggarwal, “Remote detection of
trichloroethylene in soil by fiber optic infrared reflectance probe,” Appl Spectr, vol. 50, pp. 985-90, 1996.
46. M. Frenz, H. S. Pratisto, C. A. Toth, E. D. Jansen, H. J. Altermatt, A. J. Welch, and H. P.
Weber, “Perfluorocarbon compounds: transmitting liquids for infrared laser tissue ablation,” in: Laser-Tissue Interaction VII, S.L. Jacques and A. Katzir (eds), SPIE, Bellingham, vol. 2681, pp. 343-52, 1996.
47. J. W. Rayleigh, “On the pressure developed in a liquid during the collapse of a spherical
cavity,” Philos Mag S, vol. 34, pp. 94-98, 1917.
198

48. V. Tortelli and C. Tonelli, “Thermal Decomposition of Branched-Chain
Perfluoroalkanes,” J. Fluorine Chem, vol. 60, pp. 165-174, 1993.
199