The Effect of potential discharges on the Stability of the Rosetta Promontory, Egypt
9
The Effect of potential discharges on the Stability of the Rosetta Promontory, Egypt Ali Masria* & Moheb Iskander ** & Abdelazim Negm * & Oliver C. Saavedra * , *** * Environmental Engineering Department., School of Energy and Environmental Engineering, Egypt-Japan University of Science and Technology, E-JUST, Alexandria, Egypt, ** Head of Hydrodynamic Department,Coastal Research Institute, National Water Research Center, Alexandria, Egypt *** Associate Professor, Department of Civil Engineering, Tokyo Institute of Technology,Tokyo, Japan Email:[email protected] ABSTRACT: The Nile River is the source of more than 97 % of Egypts freshwater. Building the Grand Ethiopian Renaissance Dam on the Blue Nile may be lessen the Egyptian water share during the dam-filling period. It may also increase the chances of flooding in case of the dams collapse. The potential effect of that dam on the stability and efficiency of the Rosetta promontory, the terminal of the Nile River with the Mediter- ranean Sea, is investigated by using the Coastal Modeling System software. Field data of wave, wind, tide, sediment characteristics and bed morphology are used to construct and calibrate the model. The developed model scenarios contain the reduction in the water discharge to the sea in increments of 25 % from 25 % to 100% which corresponds to the dam-filling period from 6 to 2 years. The other scenarios allow the maximum discharge through the Nile branch continuously for two months to represent the case of the dams destruction. These scenarios are based on the assumption that the dam will be used only for hydropower generation. The first four scenarios show a limited effect on the promontorys stability and efficiency compared to the recent condition. That is due to the recent limited water discharge through the promontory due to the water scarcity in Egypt and the multi-usage strategy of the water resource applied by the Egyptian government. On the other hand, the flooding scenarios showed an increase in the inlets cross section leading to a relatively large local scour especially in front of the western bank protection work which threats the structures stability. Moreover, the sedimentation spit inside the inlet will be relocated in front of the exit which affects the efficiency of the navigation channel. In addition, it was found that the wave run up and overtopping increase the risk of flood in the cultivated low lands around the promontory specially behind the western side. The wave height and energy inside the inlet dramatically increased after the flooding particularly at the western side bank which will affect the stability of the bank protection work. These side effects can be eliminated by reinforcing the side bank protection work in a limited zone and save the minimum promontory cross section from a flood of 1450 m 2 . 1 INTRODUCTION The Nile River is the most important source of water in Egypt. The Nile provides almost all the fresh water used by 90 million Egyptian living along its banks. The other sources, rainfall of 1.3 billion cubic meters (BCM) and groundwater of 0.9 BCM, are small compared to the 55.5 BCM that the Nile yearly provides. Over the past decades, there have been heated debates over the pros and cons of building large dams Tilt et al. (2009). However, the upstream nations of the Nile River basin began to exploit the water resources in the upper region of the Nile. The dam is built on the Blue Nile River, in the western part of Ethiopia about 40 kilometres from Sudan’s border, figure 1. It is expected to generate 5,250 megawatt of electricity, and cost close to $5 billion, (Salman 2011). GERD will create a reservoir with maximum net head and total height of 133 and 145 m respectively. The GERD reservoir will cover an area of 1,874 km 2 at full supply level of 640 m above mean sea level, with total and active storage volumes of 74 and 60 BCM respectively, for a design flow 4,305 m 3 /sec, Ramadan et al. (2013). (Salman 2011, Hammond 2013) state that there are numerous benefits accruing to Egypt from GERD. The benefits include: 1) increasing the flood control
Transcript of The Effect of potential discharges on the Stability of the Rosetta Promontory, Egypt
The Effect of potential discharges on the Stability of the RosettaPromontory, Egypt
Ali Masria* & Moheb Iskander ** & Abdelazim Negm * & Oliver C. Saavedra *,**** Environmental Engineering Department., School of Energy and Environmental Engineering,
Egypt-Japan University of Science and Technology, E-JUST, Alexandria, Egypt,** Head of Hydrodynamic Department,Coastal Research Institute,
National Water Research Center, Alexandria, Egypt*** Associate Professor, Department of Civil Engineering, Tokyo Institute of Technology,Tokyo, Japan
Email:[email protected]
ABSTRACT: The Nile River is the source of more than 97 % of Egypts freshwater. Building the GrandEthiopian Renaissance Dam on the Blue Nile may be lessen the Egyptian water share during the dam-fillingperiod. It may also increase the chances of flooding in case of the dams collapse. The potential effect of thatdam on the stability and efficiency of the Rosetta promontory, the terminal of the Nile River with the Mediter-ranean Sea, is investigated by using the Coastal Modeling System software. Field data of wave, wind, tide,sediment characteristics and bed morphology are used to construct and calibrate the model. The developedmodel scenarios contain the reduction in the water discharge to the sea in increments of 25 % from 25 % to100% which corresponds to the dam-filling period from 6 to 2 years. The other scenarios allow the maximumdischarge through the Nile branch continuously for two months to represent the case of the dams destruction.These scenarios are based on the assumption that the dam will be used only for hydropower generation. Thefirst four scenarios show a limited effect on the promontorys stability and efficiency compared to the recentcondition. That is due to the recent limited water discharge through the promontory due to the water scarcityin Egypt and the multi-usage strategy of the water resource applied by the Egyptian government. On the otherhand, the flooding scenarios showed an increase in the inlets cross section leading to a relatively large localscour especially in front of the western bank protection work which threats the structures stability. Moreover,the sedimentation spit inside the inlet will be relocated in front of the exit which affects the efficiency of thenavigation channel. In addition, it was found that the wave run up and overtopping increase the risk of flood inthe cultivated low lands around the promontory specially behind the western side. The wave height and energyinside the inlet dramatically increased after the flooding particularly at the western side bank which will affectthe stability of the bank protection work. These side effects can be eliminated by reinforcing the side bankprotection work in a limited zone and save the minimum promontory cross section from a flood of 1450m2.
1 INTRODUCTION
The Nile River is the most important source of waterin Egypt. The Nile provides almost all the freshwater used by 90 million Egyptian living along itsbanks. The other sources, rainfall of 1.3 billion cubicmeters (BCM) and groundwater of 0.9 BCM, aresmall compared to the 55.5 BCM that the Nile yearlyprovides. Over the past decades, there have beenheated debates over the pros and cons of buildinglarge dams Tilt et al. (2009). However, the upstreamnations of the Nile River basin began to exploit thewater resources in the upper region of the Nile. Thedam is built on the Blue Nile River, in the western
part of Ethiopia about 40 kilometres from Sudan’sborder, figure 1. It is expected to generate 5,250megawatt of electricity, and cost close to $5 billion,(Salman 2011). GERD will create a reservoir withmaximum net head and total height of 133 and 145m respectively. The GERD reservoir will cover anarea of 1,874 km2 at full supply level of 640 m abovemean sea level, with total and active storage volumesof 74 and 60 BCM respectively, for a design flow4,305 m3/sec, Ramadan et al. (2013).
(Salman 2011, Hammond 2013) state that there arenumerous benefits accruing to Egypt from GERD.The benefits include: 1) increasing the flood control

Figure 1: Location of Grand Ethiopian Renaissance Dam.
from the upstream part of the Blue Nile catchment.The routing capacity (flood storage capacity) of theNile Basin will also be increased with the implemen-tation of GERD, and this will improve the flood con-trol downstream Aswan High Dam (AHD) and Riskof AHD overtopping or spillage will be eliminated,2) the reduction of evaporation loss, average annualAHD losses will be reduced to 9.5 BCM/year fromabout 10.8 BCM/year in case of AHD alone, and 3)controlling the sediments, and this will extend AHDdesign life by more than a century due to GERD asmore than 50 % of the sediment at Aswan is esti-mated to originate from Abbay/Blue Nile river. (Ab-bas 2011) explained that the dam would not withstandthe sediments and the large amount of water which itis expected to store. In addition, a collapse within 25years is expected causing something like a tsunamiwhich will flood areas including the Sudanese capi-tal, and its impact will reach the Aswan High Dam(AHD). In this case the AHD should release the maxi-mum allowable flow of about 300 million m3/day andthe Toshka weir which located upstream of the AHDwill release all the excess water more than the max-imum level of the AHD to the Toshka canal in thewestern desert to recharge the ground water aquiferin western desert. The same scenario happened safelywith the flood of 1998.The scenarios expected is that a reservoir of this size,in a 6 year period, will inevitably cause a yearly de-crease in the Nile flow to Lake Nasser by about 12BCM which represents 23% of Egypts annual shareof the Nile water, (Ramadan 2013),Ramadan et al.(2011). A decrease in the energy generation of theAHD is also expected especially during the filling pe-riod of the GERD reservoir. (Ramadan, Negm, Sam-many, & A. 2013) studied the environmental impactof GERD on the Egyptian water resources and secu-rity, they concluded that:
1. Impounding of GERD at Normal flow casethrough 6, 3, and 2 years will decrease the ac-tive storage of Lake Nasser by 13.287, 25.413and 37.263 BCM through each year.
2. Impounding of GERD at min flow from BlueNile through 6, 3, and 2 years will decrease theactive storage of Lake Nasser by 44.398, 54.415and 55.138 BCM through each year.
3. Impounding of GERD at min of average flowfrom Blue Nile through 6, 3, and 2 years willdecrease the active storage of Lake Nasser by25.963, 37.814 and 45.105 BCM/year.
4. Continuous impounding of GERD at normalflow hydrological stage through 6 years will re-sult downstream water shortage depending onthe initial storage of Nasser Lake.. . .
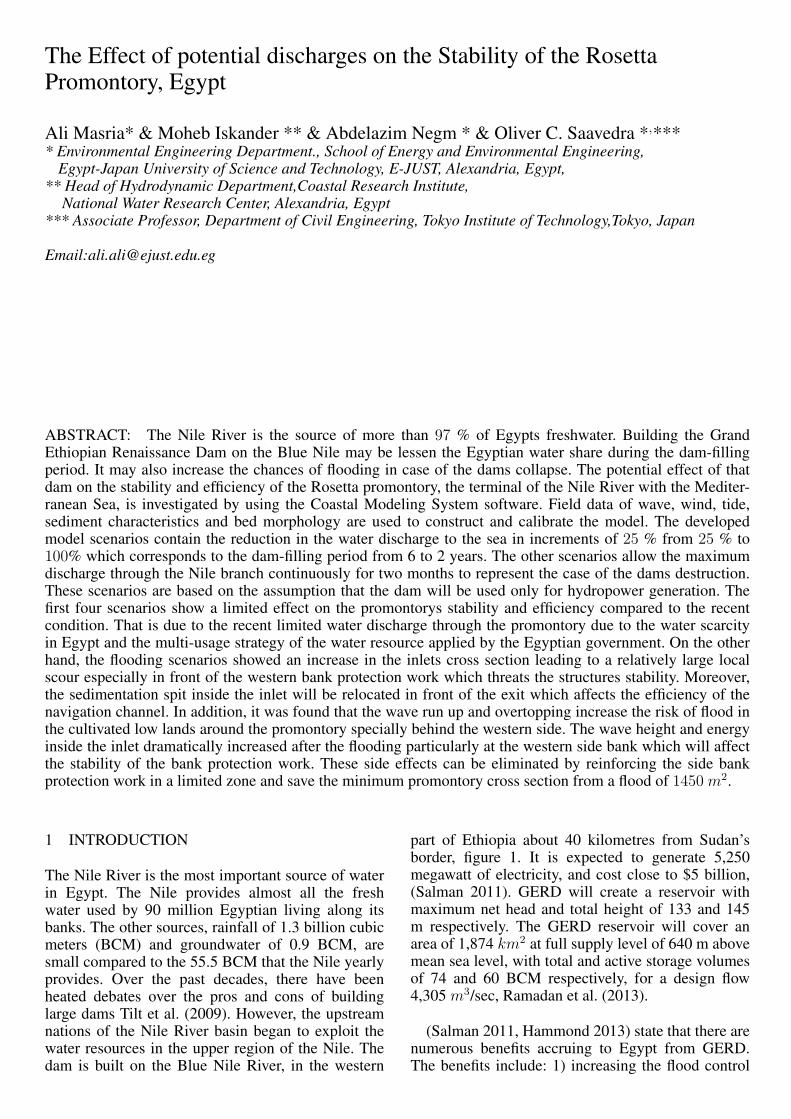
Freshwater input to estuaries is a fundamental featureof all estuarine ecosystems, which may be dramati-cally reduced due to many factors like, reuse of thedrainge water istead of discharging it to the sea, theconstruction of dams in the upper part of the estu-ary to govern the water required for irrigation for ex-ample, Douro estuary in the Iberian Peninsula is lim-ited upstream by a dam, built in1985 for electric pro-duction (Azevedo & Duarte 2010).The terminals ofthe Nile River with the Mediterranean Sea as Rosettapromontory highly affected by the construction of thecontrol structures along the River Nile. The Rosettapromontory is the western estuary of the Nile River tothe Mediterranean Sea. It is located on the eastern sideof Abu Quir Bay at about 60 km east of Alexandriacity, Egypt, as shown in figure 2. After the construc-tion of the AHD and the control works along the NileRiver, the flows discharges and sediments carried outby the Rosetta branch to the sea were greatly reduced(Frihy 1996),El Sayed et al. (2007).As a result, the erosion of the shoreline drastically in-creased as well as the sedimentation accumulated in-side the inlet. Many researches were executed to in-vestigate the shoreline change at the Nile delta andthe near adjacent shore regions based on the analysisof multi-dated satellite images and measured profiles(El Sayed et al. (2005), (Torab & Azab 2007), (Frihy1988) and the stability of the Rosetta inlet (Ahmed2006). As part of the required mitigation procedures,protection works were constructed to control beacherosion at Rosetta inlet. However, the design didnot take into consideration the sedimentation in theRosetta navigation channel. The wide river entrancedescribed probably was responsible for this prob-lem. Fortunately, the problem of sedimentation wassolved in 1998. Unexpected high ood waters ushed thelower Nile distributaries including the Rosetta branch.(Ahmed 2006)), but it came back again due the severereduction in fresh water discharges. In addition, fre-quent dredging is carried out to overcome the siltationproblem inside the estuary, but it failed to solve thesiltation problem (Ahmed 2006)). , (El Sayed, Iskan-der, & Fanos 2007)). The aim of this paper is to in-vestigate the expected influence of the GERD on the
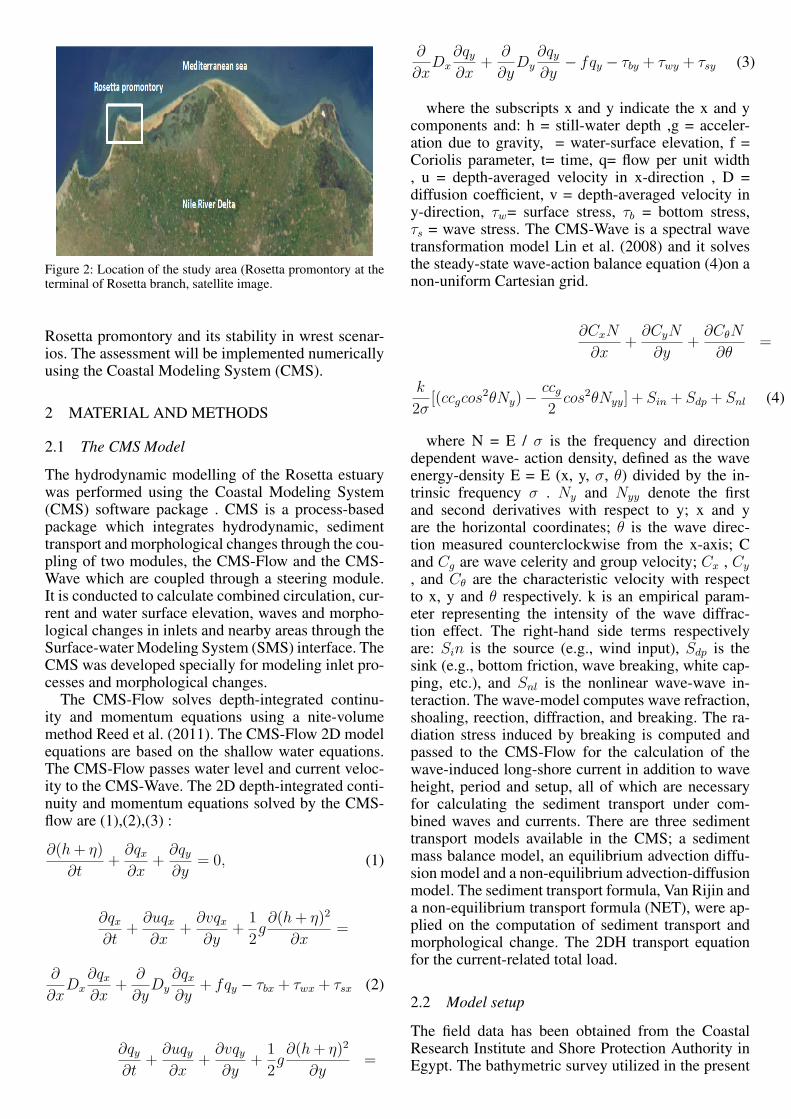
Figure 2: Location of the study area (Rosetta promontory at theterminal of Rosetta branch, satellite image.
Rosetta promontory and its stability in wrest scenar-ios. The assessment will be implemented numericallyusing the Coastal Modeling System (CMS).
2 MATERIAL AND METHODS
2.1 The CMS Model
The hydrodynamic modelling of the Rosetta estuarywas performed using the Coastal Modeling System(CMS) software package . CMS is a process-basedpackage which integrates hydrodynamic, sedimenttransport and morphological changes through the cou-pling of two modules, the CMS-Flow and the CMS-Wave which are coupled through a steering module.It is conducted to calculate combined circulation, cur-rent and water surface elevation, waves and morpho-logical changes in inlets and nearby areas through theSurface-water Modeling System (SMS) interface. TheCMS was developed specially for modeling inlet pro-cesses and morphological changes.
The CMS-Flow solves depth-integrated continu-ity and momentum equations using a nite-volumemethod Reed et al. (2011). The CMS-Flow 2D modelequations are based on the shallow water equations.The CMS-Flow passes water level and current veloc-ity to the CMS-Wave. The 2D depth-integrated conti-nuity and momentum equations solved by the CMS-flow are (1),(2),(3) :
∂(h+ η)
∂t+
∂qx∂x
+∂qy∂y
= 0, (1)
∂qx∂t
+∂uqx∂x
+∂vqx∂y
+1
2g∂(h+ η)2
∂x=
∂
∂xDx
∂qx∂x
+∂
∂yDy
∂qx∂y
+ fqy − τbx + τwx + τsx (2)
∂qy∂t
+∂uqy∂x
+∂vqy∂y
+1
2g∂(h+ η)2
∂y=
∂
∂xDx
∂qy∂x
+∂
∂yDy
∂qy∂y
− fqy − τby + τwy + τsy (3)
where the subscripts x and y indicate the x and ycomponents and: h = still-water depth ,g = acceler-ation due to gravity, = water-surface elevation, f =Coriolis parameter, t= time, q= flow per unit width, u = depth-averaged velocity in x-direction , D =diffusion coefficient, v = depth-averaged velocity iny-direction, τw= surface stress, τb = bottom stress,τs = wave stress. The CMS-Wave is a spectral wavetransformation model Lin et al. (2008) and it solvesthe steady-state wave-action balance equation (4)on anon-uniform Cartesian grid.
∂CxN
∂x+
∂CyN
∂y+
∂CθN
∂θ=
k
2σ[(ccgcos
2θNy)−ccg2cos2θNyy] + Sin + Sdp + Snl (4)
where N = E / σ is the frequency and directiondependent wave- action density, defined as the waveenergy-density E = E (x, y, σ, θ) divided by the in-trinsic frequency σ . Ny and Nyy denote the firstand second derivatives with respect to y; x and yare the horizontal coordinates; θ is the wave direc-tion measured counterclockwise from the x-axis; Cand Cg are wave celerity and group velocity; Cx , Cy
, and Cθ are the characteristic velocity with respectto x, y and θ respectively. k is an empirical param-eter representing the intensity of the wave diffrac-tion effect. The right-hand side terms respectivelyare: Sin is the source (e.g., wind input), Sdp is thesink (e.g., bottom friction, wave breaking, white cap-ping, etc.), and Snl is the nonlinear wave-wave in-teraction. The wave-model computes wave refraction,shoaling, reection, diffraction, and breaking. The ra-diation stress induced by breaking is computed andpassed to the CMS-Flow for the calculation of thewave-induced long-shore current in addition to waveheight, period and setup, all of which are necessaryfor calculating the sediment transport under com-bined waves and currents. There are three sedimenttransport models available in the CMS; a sedimentmass balance model, an equilibrium advection diffu-sion model and a non-equilibrium advection-diffusionmodel. The sediment transport formula, Van Rijin anda non-equilibrium transport formula (NET), were ap-plied on the computation of sediment transport andmorphological change. The 2DH transport equationfor the current-related total load.
2.2 Model setup
The field data has been obtained from the CoastalResearch Institute and Shore Protection Authority inEgypt. The bathymetric survey utilized in the present
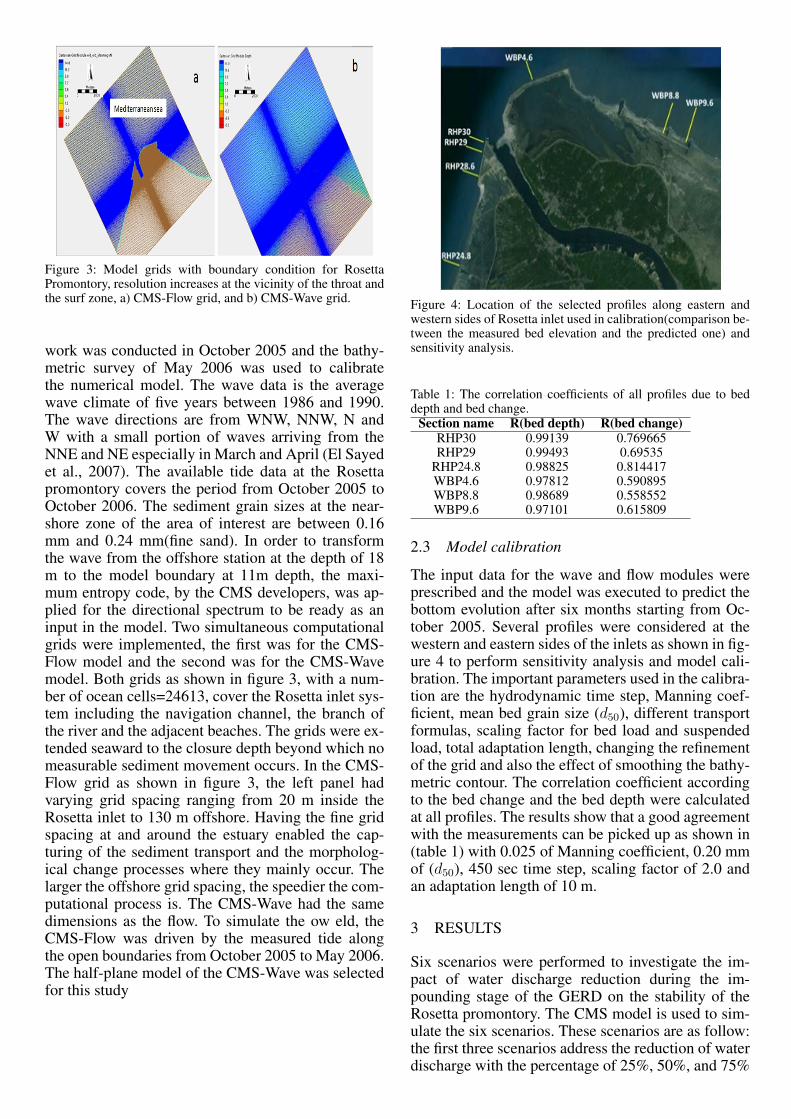
Figure 3: Model grids with boundary condition for RosettaPromontory, resolution increases at the vicinity of the throat andthe surf zone, a) CMS-Flow grid, and b) CMS-Wave grid.
work was conducted in October 2005 and the bathy-metric survey of May 2006 was used to calibratethe numerical model. The wave data is the averagewave climate of five years between 1986 and 1990.The wave directions are from WNW, NNW, N andW with a small portion of waves arriving from theNNE and NE especially in March and April (El Sayedet al., 2007). The available tide data at the Rosettapromontory covers the period from October 2005 toOctober 2006. The sediment grain sizes at the near-shore zone of the area of interest are between 0.16mm and 0.24 mm(fine sand). In order to transformthe wave from the offshore station at the depth of 18m to the model boundary at 11m depth, the maxi-mum entropy code, by the CMS developers, was ap-plied for the directional spectrum to be ready as aninput in the model. Two simultaneous computationalgrids were implemented, the first was for the CMS-Flow model and the second was for the CMS-Wavemodel. Both grids as shown in figure 3, with a num-ber of ocean cells=24613, cover the Rosetta inlet sys-tem including the navigation channel, the branch ofthe river and the adjacent beaches. The grids were ex-tended seaward to the closure depth beyond which nomeasurable sediment movement occurs. In the CMS-Flow grid as shown in figure 3, the left panel hadvarying grid spacing ranging from 20 m inside theRosetta inlet to 130 m offshore. Having the fine gridspacing at and around the estuary enabled the cap-turing of the sediment transport and the morpholog-ical change processes where they mainly occur. Thelarger the offshore grid spacing, the speedier the com-putational process is. The CMS-Wave had the samedimensions as the flow. To simulate the ow eld, theCMS-Flow was driven by the measured tide alongthe open boundaries from October 2005 to May 2006.The half-plane model of the CMS-Wave was selectedfor this study
Figure 4: Location of the selected profiles along eastern andwestern sides of Rosetta inlet used in calibration(comparison be-tween the measured bed elevation and the predicted one) andsensitivity analysis.
Table 1: The correlation coefficients of all profiles due to beddepth and bed change.
Section name R(bed depth) R(bed change)RHP30 0.99139 0.769665RHP29 0.99493 0.69535
RHP24.8 0.98825 0.814417WBP4.6 0.97812 0.590895WBP8.8 0.98689 0.558552WBP9.6 0.97101 0.615809
2.3 Model calibration
The input data for the wave and flow modules wereprescribed and the model was executed to predict thebottom evolution after six months starting from Oc-tober 2005. Several profiles were considered at thewestern and eastern sides of the inlets as shown in fig-ure 4 to perform sensitivity analysis and model cali-bration. The important parameters used in the calibra-tion are the hydrodynamic time step, Manning coef-ficient, mean bed grain size (d50), different transportformulas, scaling factor for bed load and suspendedload, total adaptation length, changing the refinementof the grid and also the effect of smoothing the bathy-metric contour. The correlation coefficient accordingto the bed change and the bed depth were calculatedat all profiles. The results show that a good agreementwith the measurements can be picked up as shown in(table 1) with 0.025 of Manning coefficient, 0.20 mmof (d50), 450 sec time step, scaling factor of 2.0 andan adaptation length of 10 m.
3 RESULTS
Six scenarios were performed to investigate the im-pact of water discharge reduction during the im-pounding stage of the GERD on the stability of theRosetta promontory. The CMS model is used to sim-ulate the six scenarios. These scenarios are as follow:the first three scenarios address the reduction of waterdischarge with the percentage of 25%, 50%, and 75%
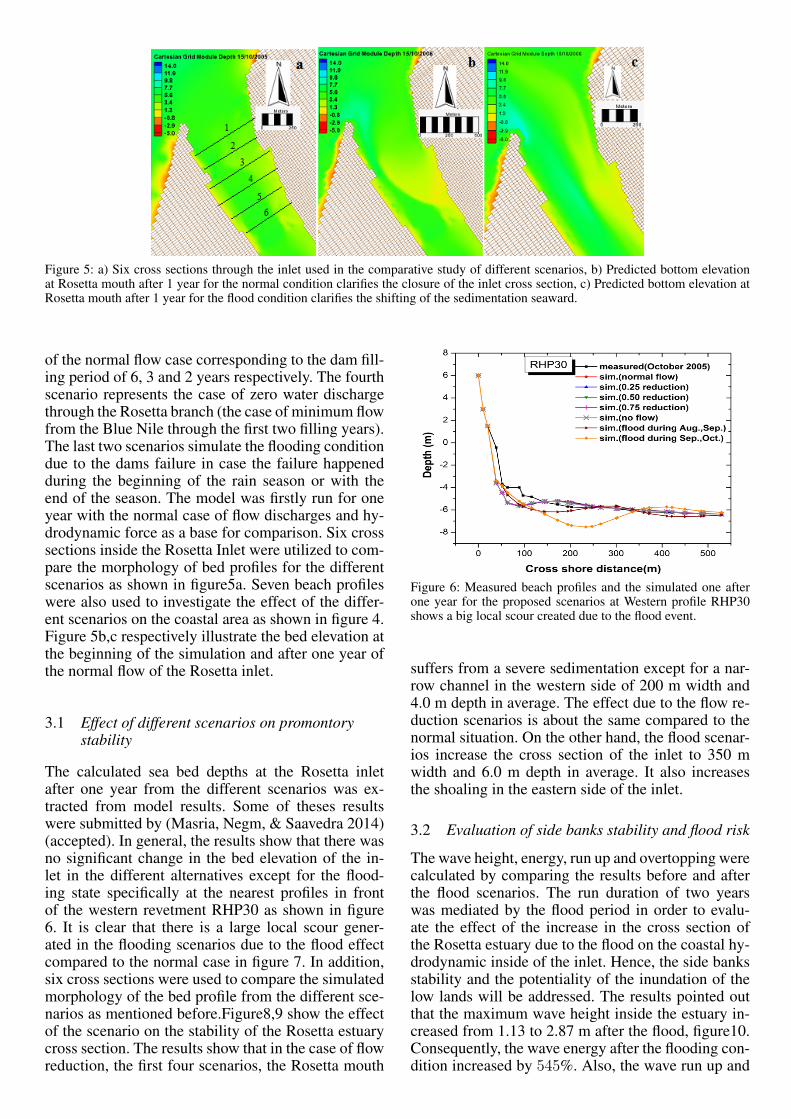
Figure 5: a) Six cross sections through the inlet used in the comparative study of different scenarios, b) Predicted bottom elevationat Rosetta mouth after 1 year for the normal condition clarifies the closure of the inlet cross section, c) Predicted bottom elevation atRosetta mouth after 1 year for the flood condition clarifies the shifting of the sedimentation seaward.
of the normal flow case corresponding to the dam fill-ing period of 6, 3 and 2 years respectively. The fourthscenario represents the case of zero water dischargethrough the Rosetta branch (the case of minimum flowfrom the Blue Nile through the first two filling years).The last two scenarios simulate the flooding conditiondue to the dams failure in case the failure happenedduring the beginning of the rain season or with theend of the season. The model was firstly run for oneyear with the normal case of flow discharges and hy-drodynamic force as a base for comparison. Six crosssections inside the Rosetta Inlet were utilized to com-pare the morphology of bed profiles for the differentscenarios as shown in figure5a. Seven beach profileswere also used to investigate the effect of the differ-ent scenarios on the coastal area as shown in figure 4.Figure 5b,c respectively illustrate the bed elevation atthe beginning of the simulation and after one year ofthe normal flow of the Rosetta inlet.
3.1 Effect of different scenarios on promontorystability
The calculated sea bed depths at the Rosetta inletafter one year from the different scenarios was ex-tracted from model results. Some of theses resultswere submitted by (Masria, Negm, & Saavedra 2014)(accepted). In general, the results show that there wasno significant change in the bed elevation of the in-let in the different alternatives except for the flood-ing state specifically at the nearest profiles in frontof the western revetment RHP30 as shown in figure6. It is clear that there is a large local scour gener-ated in the flooding scenarios due to the flood effectcompared to the normal case in figure 7. In addition,six cross sections were used to compare the simulatedmorphology of the bed profile from the different sce-narios as mentioned before.Figure8,9 show the effectof the scenario on the stability of the Rosetta estuarycross section. The results show that in the case of flowreduction, the first four scenarios, the Rosetta mouth
Figure 6: Measured beach profiles and the simulated one afterone year for the proposed scenarios at Western profile RHP30shows a big local scour created due to the flood event.
suffers from a severe sedimentation except for a nar-row channel in the western side of 200 m width and4.0 m depth in average. The effect due to the flow re-duction scenarios is about the same compared to thenormal situation. On the other hand, the flood scenar-ios increase the cross section of the inlet to 350 mwidth and 6.0 m depth in average. It also increasesthe shoaling in the eastern side of the inlet.
3.2 Evaluation of side banks stability and flood risk
The wave height, energy, run up and overtopping werecalculated by comparing the results before and afterthe flood scenarios. The run duration of two yearswas mediated by the flood period in order to evalu-ate the effect of the increase in the cross section ofthe Rosetta estuary due to the flood on the coastal hy-drodynamic inside of the inlet. Hence, the side banksstability and the potentiality of the inundation of thelow lands will be addressed. The results pointed outthat the maximum wave height inside the estuary in-creased from 1.13 to 2.87 m after the flood, figure10.Consequently, the wave energy after the flooding con-dition increased by 545%. Also, the wave run up and
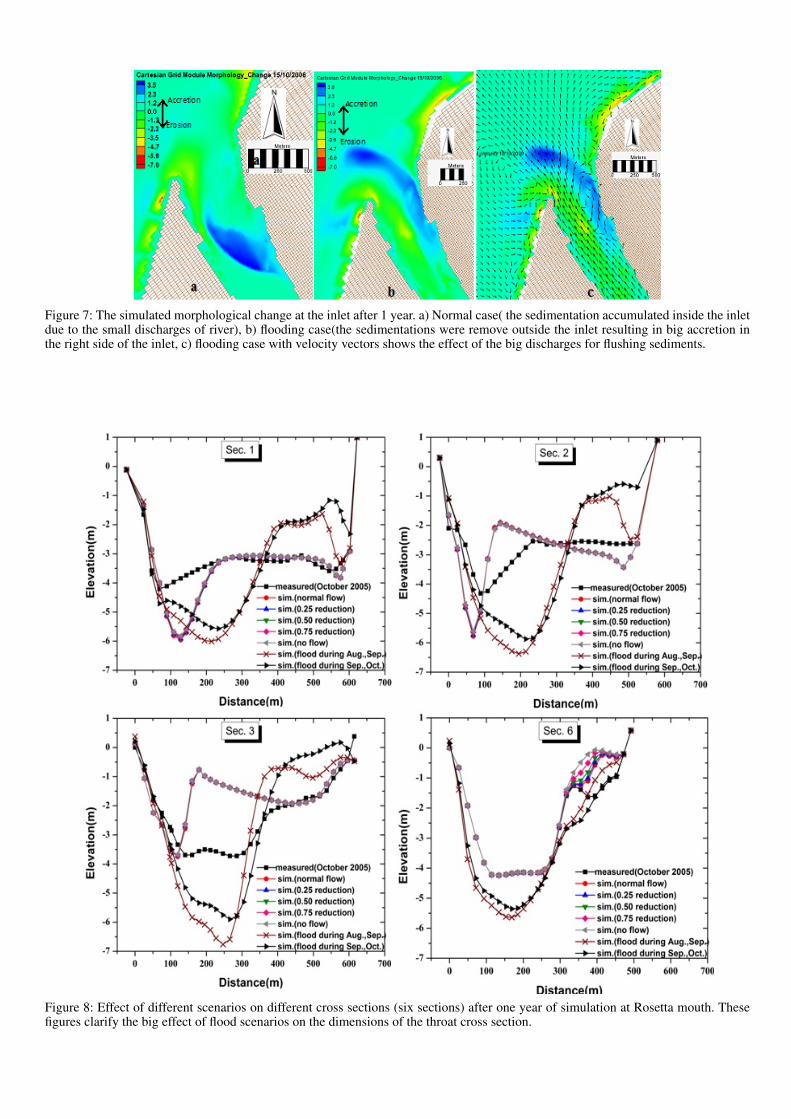
Figure 7: The simulated morphological change at the inlet after 1 year. a) Normal case( the sedimentation accumulated inside the inletdue to the small discharges of river), b) flooding case(the sedimentations were remove outside the inlet resulting in big accretion inthe right side of the inlet, c) flooding case with velocity vectors shows the effect of the big discharges for flushing sediments.
Figure 8: Effect of different scenarios on different cross sections (six sections) after one year of simulation at Rosetta mouth. Thesefigures clarify the big effect of flood scenarios on the dimensions of the throat cross section.
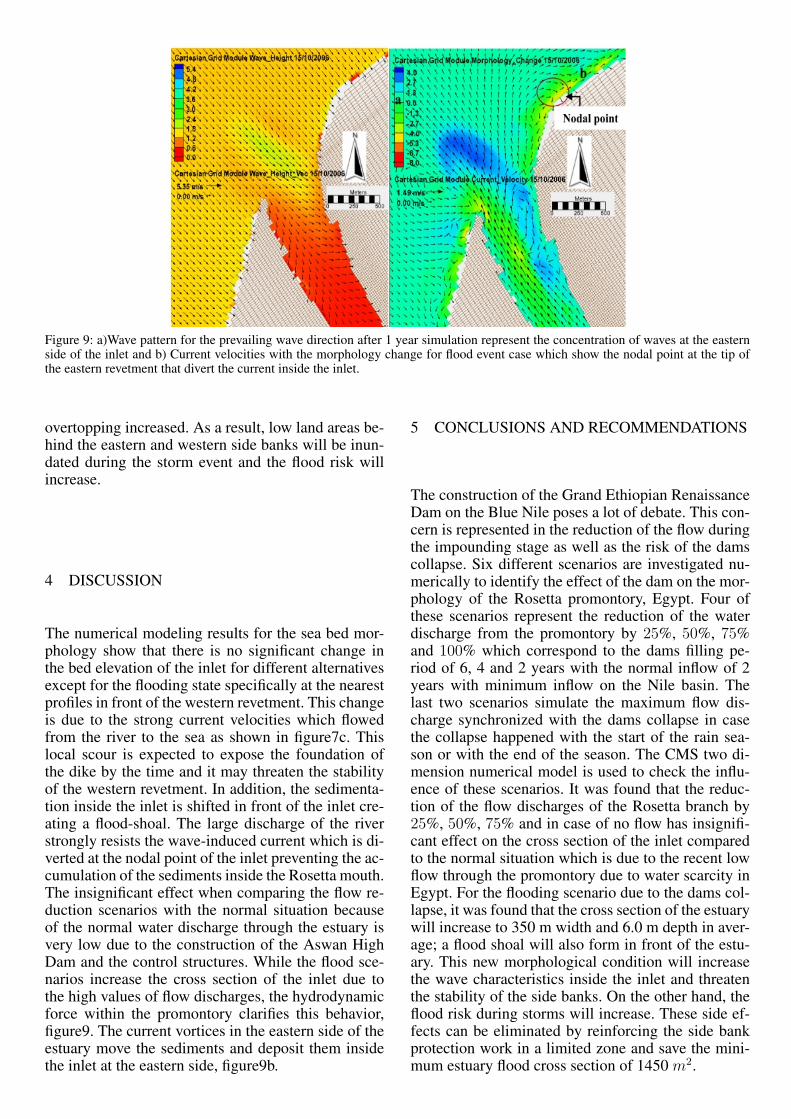
Figure 9: a)Wave pattern for the prevailing wave direction after 1 year simulation represent the concentration of waves at the easternside of the inlet and b) Current velocities with the morphology change for flood event case which show the nodal point at the tip ofthe eastern revetment that divert the current inside the inlet.
overtopping increased. As a result, low land areas be-hind the eastern and western side banks will be inun-dated during the storm event and the flood risk willincrease.
4 DISCUSSION
The numerical modeling results for the sea bed mor-phology show that there is no significant change inthe bed elevation of the inlet for different alternativesexcept for the flooding state specifically at the nearestprofiles in front of the western revetment. This changeis due to the strong current velocities which flowedfrom the river to the sea as shown in figure7c. Thislocal scour is expected to expose the foundation ofthe dike by the time and it may threaten the stabilityof the western revetment. In addition, the sedimenta-tion inside the inlet is shifted in front of the inlet cre-ating a flood-shoal. The large discharge of the riverstrongly resists the wave-induced current which is di-verted at the nodal point of the inlet preventing the ac-cumulation of the sediments inside the Rosetta mouth.The insignificant effect when comparing the flow re-duction scenarios with the normal situation becauseof the normal water discharge through the estuary isvery low due to the construction of the Aswan HighDam and the control structures. While the flood sce-narios increase the cross section of the inlet due tothe high values of flow discharges, the hydrodynamicforce within the promontory clarifies this behavior,figure9. The current vortices in the eastern side of theestuary move the sediments and deposit them insidethe inlet at the eastern side, figure9b.
5 CONCLUSIONS AND RECOMMENDATIONS
The construction of the Grand Ethiopian RenaissanceDam on the Blue Nile poses a lot of debate. This con-cern is represented in the reduction of the flow duringthe impounding stage as well as the risk of the damscollapse. Six different scenarios are investigated nu-merically to identify the effect of the dam on the mor-phology of the Rosetta promontory, Egypt. Four ofthese scenarios represent the reduction of the waterdischarge from the promontory by 25%, 50%, 75%and 100% which correspond to the dams filling pe-riod of 6, 4 and 2 years with the normal inflow of 2years with minimum inflow on the Nile basin. Thelast two scenarios simulate the maximum flow dis-charge synchronized with the dams collapse in casethe collapse happened with the start of the rain sea-son or with the end of the season. The CMS two di-mension numerical model is used to check the influ-ence of these scenarios. It was found that the reduc-tion of the flow discharges of the Rosetta branch by25%, 50%, 75% and in case of no flow has insignifi-cant effect on the cross section of the inlet comparedto the normal situation which is due to the recent lowflow through the promontory due to water scarcity inEgypt. For the flooding scenario due to the dams col-lapse, it was found that the cross section of the estuarywill increase to 350 m width and 6.0 m depth in aver-age; a flood shoal will also form in front of the estu-ary. This new morphological condition will increasethe wave characteristics inside the inlet and threatenthe stability of the side banks. On the other hand, theflood risk during storms will increase. These side ef-fects can be eliminated by reinforcing the side bankprotection work in a limited zone and save the mini-mum estuary flood cross section of 1450 m2.
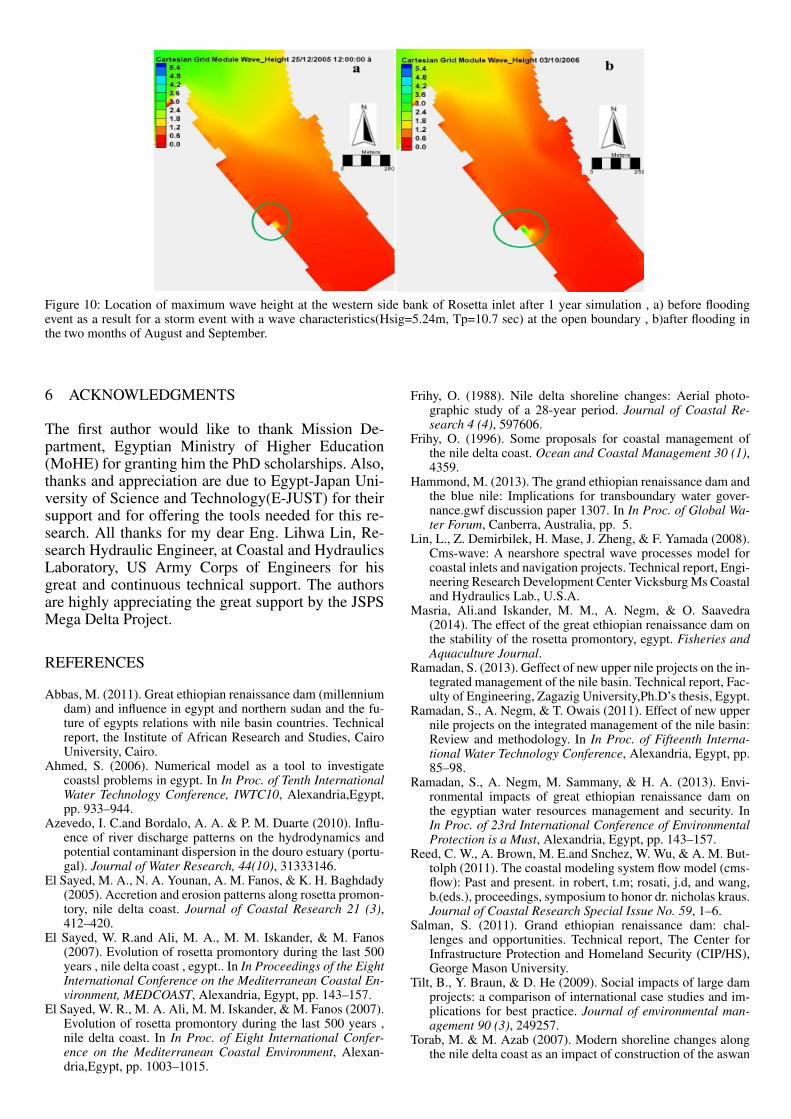
Figure 10: Location of maximum wave height at the western side bank of Rosetta inlet after 1 year simulation , a) before floodingevent as a result for a storm event with a wave characteristics(Hsig=5.24m, Tp=10.7 sec) at the open boundary , b)after flooding inthe two months of August and September.
6 ACKNOWLEDGMENTS
The first author would like to thank Mission De-partment, Egyptian Ministry of Higher Education(MoHE) for granting him the PhD scholarships. Also,thanks and appreciation are due to Egypt-Japan Uni-versity of Science and Technology(E-JUST) for theirsupport and for offering the tools needed for this re-search. All thanks for my dear Eng. Lihwa Lin, Re-search Hydraulic Engineer, at Coastal and HydraulicsLaboratory, US Army Corps of Engineers for hisgreat and continuous technical support. The authorsare highly appreciating the great support by the JSPSMega Delta Project.
REFERENCES
Abbas, M. (2011). Great ethiopian renaissance dam (millenniumdam) and influence in egypt and northern sudan and the fu-ture of egypts relations with nile basin countries. Technicalreport, the Institute of African Research and Studies, CairoUniversity, Cairo.
Ahmed, S. (2006). Numerical model as a tool to investigatecoastsl problems in egypt. In In Proc. of Tenth InternationalWater Technology Conference, IWTC10, Alexandria,Egypt,pp. 933–944.
Azevedo, I. C.and Bordalo, A. A. & P. M. Duarte (2010). Influ-ence of river discharge patterns on the hydrodynamics andpotential contaminant dispersion in the douro estuary (portu-gal). Journal of Water Research, 44(10), 31333146.
El Sayed, M. A., N. A. Younan, A. M. Fanos, & K. H. Baghdady(2005). Accretion and erosion patterns along rosetta promon-tory, nile delta coast. Journal of Coastal Research 21 (3),412–420.
El Sayed, W. R.and Ali, M. A., M. M. Iskander, & M. Fanos(2007). Evolution of rosetta promontory during the last 500years , nile delta coast , egypt.. In In Proceedings of the EightInternational Conference on the Mediterranean Coastal En-vironment, MEDCOAST, Alexandria, Egypt, pp. 143–157.
El Sayed, W. R., M. A. Ali, M. M. Iskander, & M. Fanos (2007).Evolution of rosetta promontory during the last 500 years ,nile delta coast. In In Proc. of Eight International Confer-ence on the Mediterranean Coastal Environment, Alexan-dria,Egypt, pp. 1003–1015.
Frihy, O. (1988). Nile delta shoreline changes: Aerial photo-graphic study of a 28-year period. Journal of Coastal Re-search 4 (4), 597606.
Frihy, O. (1996). Some proposals for coastal management ofthe nile delta coast. Ocean and Coastal Management 30 (1),4359.
Hammond, M. (2013). The grand ethiopian renaissance dam andthe blue nile: Implications for transboundary water gover-nance.gwf discussion paper 1307. In In Proc. of Global Wa-ter Forum, Canberra, Australia, pp. 5.
Lin, L., Z. Demirbilek, H. Mase, J. Zheng, & F. Yamada (2008).Cms-wave: A nearshore spectral wave processes model forcoastal inlets and navigation projects. Technical report, Engi-neering Research Development Center Vicksburg Ms Coastaland Hydraulics Lab., U.S.A.
Masria, Ali.and Iskander, M. M., A. Negm, & O. Saavedra(2014). The effect of the great ethiopian renaissance dam onthe stability of the rosetta promontory, egypt. Fisheries andAquaculture Journal.
Ramadan, S. (2013). Geffect of new upper nile projects on the in-tegrated management of the nile basin. Technical report, Fac-ulty of Engineering, Zagazig University,Ph.D’s thesis, Egypt.
Ramadan, S., A. Negm, & T. Owais (2011). Effect of new uppernile projects on the integrated management of the nile basin:Review and methodology. In In Proc. of Fifteenth Interna-tional Water Technology Conference, Alexandria, Egypt, pp.85–98.
Ramadan, S., A. Negm, M. Sammany, & H. A. (2013). Envi-ronmental impacts of great ethiopian renaissance dam onthe egyptian water resources management and security. InIn Proc. of 23rd International Conference of EnvironmentalProtection is a Must, Alexandria, Egypt, pp. 143–157.
Reed, C. W., A. Brown, M. E.and Snchez, W. Wu, & A. M. But-tolph (2011). The coastal modeling system flow model (cms-flow): Past and present. in robert, t.m; rosati, j.d, and wang,b.(eds.), proceedings, symposium to honor dr. nicholas kraus.Journal of Coastal Research Special Issue No. 59, 1–6.
Salman, S. (2011). Grand ethiopian renaissance dam: chal-lenges and opportunities. Technical report, The Center forInfrastructure Protection and Homeland Security (CIP/HS),George Mason University.
Tilt, B., Y. Braun, & D. He (2009). Social impacts of large damprojects: a comparison of international case studies and im-plications for best practice. Journal of environmental man-agement 90 (3), 249257.
Torab, M. & M. Azab (2007). Modern shoreline changes alongthe nile delta coast as an impact of construction of the aswan

high dam. Journal of geographia technica 2, 6976.