A spatial needs assessment of indigent acute psychiatric discharges in California
16
Regular Article A Spatial Needs Assessment of Indigent Acute Psychiatric Discharges in California Jim E. Banta, PhD, MPH Seth Wiafe, MPH Sam Soret, PhD Charles Holzer, PhD Abstract State and local mental health agencies have responsibility for the psychiatric care of Medicaid beneficiaries and indigents meeting pre-defined criteria. A significant uninsured caseload may prove draining to agencies and hospitals mandated to provide emergency services, resulting in limited access. A spatial needs assessment was conducted to find areas having a greater relative proportion of indigent psychiatric hospitalizations. Robust descriptive and inferential spatial techniques were applied to California 1999–2003 public-use Zip-Code-level hospital discharge data to create maps. These maps reveal a more stable view of spatial variation in the proportion of indigent discharges compared to all psychiatric discharges. Synthetic estimation techniques were also applied to U.S. Census data to estimate the proportion of severe mental illness among households at less than 200% poverty level compared to estimated mental illness among all households. Visually comparing these maps suggests areas of potential mismatch. These results and methods may inform public decision-making. Earlier versions of this work were presented at ESRI International User Conferences, San Diego, CA, USA on July 26, 2005 and August 9, 2006. Address correspondence to Jim E. Banta, PhD, MPH, School of Public Health, Loma Linda University, 24951 North Circle Drive, Loma Linda, CA 92350, USA. Phone: +1-909-5587753. Fax: +1-909-5580469. Email: [email protected]. Seth Wiafe, MPH, School of Public Health, Loma Linda University, 24951 North Circle Drive, Loma Linda, CA 92350, USA. Email: [email protected] Sam Soret, PhD, School of Public Health, Loma Linda University, 24951 North Circle Drive, Loma Linda, CA 92350, USA. Email: [email protected] Charles Holzer, PhD, The University of Texas Medical Branch, 301 University Boulevard, Galveston, TX 77555-0189, USA. Email: [email protected]. Journal of Behavioral Health Services & Research, 2008. c ) 2008 National Council for Community Behavioral Healthcare. Spatial Analysis of Indigent Acute Psychiatric Discharges BANTA et al. 179
Transcript of A spatial needs assessment of indigent acute psychiatric discharges in California

Regular Article
A Spatial Needs Assessment of Indigent AcutePsychiatric Discharges in California
Jim E. Banta, PhD, MPHSeth Wiafe, MPHSam Soret, PhDCharles Holzer, PhD
Abstract
State and local mental health agencies have responsibility for the psychiatric care of Medicaidbeneficiaries and indigents meeting pre-defined criteria. A significant uninsured caseload mayprove draining to agencies and hospitals mandated to provide emergency services, resulting inlimited access. A spatial needs assessment was conducted to find areas having a greater relativeproportion of indigent psychiatric hospitalizations. Robust descriptive and inferential spatialtechniques were applied to California 1999–2003 public-use Zip-Code-level hospital dischargedata to create maps. These maps reveal a more stable view of spatial variation in the proportion ofindigent discharges compared to all psychiatric discharges. Synthetic estimation techniques werealso applied to U.S. Census data to estimate the proportion of severe mental illness amonghouseholds at less than 200% poverty level compared to estimated mental illness among allhouseholds. Visually comparing these maps suggests areas of potential mismatch. These resultsand methods may inform public decision-making.
Earlier versions of this work were presented at ESRI International User Conferences, San Diego, CA, USA on July 26,2005 and August 9, 2006.
Address correspondence to Jim E. Banta, PhD, MPH, School of Public Health, Loma Linda University, 24951 NorthCircle Drive, Loma Linda, CA 92350, USA. Phone: +1-909-5587753. Fax: +1-909-5580469. Email: [email protected].
Seth Wiafe, MPH, School of Public Health, Loma Linda University, 24951 North Circle Drive, Loma Linda, CA 92350,USA. Email: [email protected]
Sam Soret, PhD, School of Public Health, Loma Linda University, 24951 North Circle Drive, Loma Linda, CA 92350, USA.Email: [email protected]
Charles Holzer, PhD, The University of Texas Medical Branch, 301 University Boulevard, Galveston, TX 77555-0189, USA.Email: [email protected].
Journal of Behavioral Health Services & Research, 2008. c) 2008 National Council for Community BehavioralHealthcare.
Spatial Analysis of Indigent Acute Psychiatric Discharges BANTA et al. 179

Background and Significance
State mental health agencies (SMHAs) administer more than $27 billion dollars annually,1
approximately 32% of the $85.4 billion estimated total mental health care expenditures in 2001.2
Although there is a wide variety of organizational structures and funding mechanisms withinSMHAs,1 these agencies are required by law to present sub-state estimates of severe mental illnessin their applications for block grant funds.3 Although the number of people with severe mentalillness may be a reasonable measure of “need,” Aoun et al.4 have shown that there is no one “best”type of population-needs assessment for mental health care, as assessments are used not only byhealthcare professionals for planning services; but also by policy makers for monitoring andpromoting equity. In addition to multiple definitions of need, there are also different methodologiesfor assessing the need for mental health care, including: use of routine data, consumer surveys,modeling need for services, and surveys of the general population.4 Spatial analysis is one method ofexamining need and utilization.5
Medicaid and indigents
As public mental health agencies consider need, finances are also important. Indeed, there is acomplicated relationship between Medicaid funding and mental health care for low-incomepersons. Although Frank and Glied2 have suggested that Medicaid funding has allowed states tospend more on total mental health care, especially care outside the purview of SMHAs, Davoli6 hasargued that federal Medicaid policies have worsened mental health treatment for indigent personswith severe mental illness, primarily due to funding restrictions on state mental hospitals.7 It doesappear that, as many states and counties shift more of their mental health budgets onto Medicaid,there are fewer funds to provide services for low-income, uninsured people with serious mentalillness who are not eligible for Medicaid.8 As an example, during the 1990s in California, thenumber of Medi-Cal (Medicaid) clients served by county mental health increased by 131%, whilethe number of indigents decreased by 8%.9
Surveys from the nation-wide Community Tracking Study (CTS) found that low-income personswith serious mental illness who are not eligible for Medicaid continue to be a concern amongpublic mental health providers, with many believing that reductions in mental-health services haveled to higher levels of homelessness, incarceration, and emergency department visits.8 WithinCalifornia, a majority of emergency department directors believe that limited mental healthtreatment resources for uninsured persons is a significant factor in increased emergency room visitsrelated to suicide attempts.10
Information needed within public mental health
There has been limited research into what types of information would be most helpful in bestmanaging public mental health systems;11 but it is clear that the format for much of the currentlyavailable information is dictated by state and federal funding sources. Although SMHAs receivestate and local funding and federal block grants, Medicaid currently provides more than half of thefunding and is expected to account for two thirds of funding by 2017.7 Not surprisingly, Buck7 hasshown numerous changes in data systems, performance measurement, planning and reportingrequirements, as states move from a “community model” to a “health plan” model of state mentalhealth services resulting from increased Medicaid funding.
Regardless of their motivation and autonomy, SMHAs are obligated to use a variety of data tobest manage their system and perform activities such as rate setting (allocation of resources),provider profiling, and system-level monitoring, as discussed by Tompkins and Perloff11 in theirreview of programs in Arizona. State mental health agencies have generally not taken full
180 The Journal of Behavioral Health Services & Research 35:2 April 2008

advantage of geographic information systems (GIS), which is a combination of computer hardware,software, data, and expertise. Geographic information systems have been used for many years to“link diverse layers of population and environmental information to characterize the manydimensions of health care need for small areas.”5 Beyond analyzing need, GIS is often used toanalyze access to care and geographic variation in utilization.5 An example of GIS being usedwithin a planning process is given by the New York State Office of Mental Health,12 andgeographic analysis of change in Medicaid-funded psychotropic prescription patterns has beendemonstrated in Michigan and New York.13 Despite limited application within SMHAs, theapplication of geography to mental health services began in the late 1800s with the discovery of“Javis’s Law,” i.e., that distance from a mental health hospital predicts utilization, and there havebeen many studies since then looking at the location of delivery sites.14
Hospitalization and GIS
Notwithstanding the decades-long trend away from inpatient psychiatric treatment, there were anestimated 2.3 million psychiatric discharges from non-Federal short-stay hospitals in 2004,accounting for 6.6% of all discharges that year.15 Not surprisingly, there continues to be researchinto this expensive form of treatment.16–18 Although socio-economic status (SES) measures mayaccount for nearly 50% of the variation in admission rates between locations,19 with poverty, socialisolation and social disorganization likely being the constructs linking area-based low SESmeasures with increased psychiatric utilization,20 it appears that acute psychiatric hospitalizationsalso reflect on the mental health care system as a whole, including the network of outpatient careand support services, overall funding, and hospital management.18 Thus, there are publicadministrators in all 50 states with reason to be interested in small-area variation in hospitalizationrates. Within California alone, there are 56 county-level mental health plans (and two plans for ahandful of cities).
Given the financial challenges associated with lack of health insurance, there is a practical needto conduct small-area needs assessments regarding low-income, uninsured populations with mentalillness, particularly if targeted efforts could reduce unnecessary hospitalizations. Such a practicalneed also dovetails with a challenge for mental health geographers to place greater emphasis onsocial justice, given the ‘displacement’ service model in many urban areas which churns very poorpeople between temporary housing, psychiatric wards, jails, prisons, and out-of-home placementfacilities.21 However, just as there are multiple definitions of need, there are different definitions of“small-area” and there is not a consensus as to which level of geography is “best.”22,23 Someresearchers suggest that health disparities are best examined at the census tract level.23,24 Almogand Curtis18 have successfully used Zip-Code-level data in New York City analysis, though it hasbeen acknowledged that Zip Codes may be problematic as their boundaries are based on maildelivery routes and may not correspond well to the natural boundaries of demographic orsocioeconomic characteristics of the underlying population.25
This study applied GIS techniques to existing data to present a method of needs assessmentwhich may provide useful information for both public mental health managers and those interestedin health disparities. The specific objectives were to (1) clearly present small-area variations in theproportion of psychiatric discharges in which patients had no other source of payment, i.e., wereindigent, and (2) compare those areas of increased (or decreased) indigent psychiatric discharges toareas estimated to have increased (or decreased) poverty among those with severe mental illness.This exploratory study used publicly available data from California hospitals rather than datadirectly from the California Department of Mental Health (DMH). Although this study is primarilyconcerned about indigent psychiatric care in the context of public funding, it has been suggestedthat studies of access for low-income persons do not have to be restricted only to the perspective of
Spatial Analysis of Indigent Acute Psychiatric Discharges BANTA et al. 181
the overall public mental health system; it may be useful to examine data focusing on psychiatrichospitals,26 as those hospitals may cost-shift to absorb treatment costs for indigents.
Methods/Analysis
Data
Public-use hospital discharge data for calendar years 1999–2003 were obtained from theCalifornia Office of Statewide Health Planning and Development (OSHPD; http://www.oshpd.ca.gov/HQAD/PatientLevel/index.htm). Information is included for all discharges from licensed acutegeneral care and psychiatric care hospitals, excluding state mental health hospitals and Departmentof Veteran’s Affairs Medical Centers (which are not mandated to report to OSHPD). The statisticalprogram SAS 8.1 (SAS Institute, Gary, NC, USA) was used to extract records having a primarydiagnosis of schizophrenia, other psychosis, affective disorders, or anxiety disorders. The 24secondary diagnosis fields were also examined to determine if there were co-occurring substanceuse/abuse related conditions. The resulting file, containing patient Zip Code (five digits), primarypayer source, age category, gender, race, ethnicity and hospital license type (general acute or acutepsychiatric) was then geocoded, or spatially linked, to a national Zip Code layer using ArcView 9.1software (ESRI, Redlands, CA). Only records for Zip Codes within California were retained forfurther analysis. In the public-use data, OSHPD follows a protocol of masking age, gender,ethnicity, race and Zip Code values to ensure patient confidentiality.
Descriptive spatial mapping
A GIS-based, multi-method approach developed to explore health disparities27 was used toanalyze the hospital discharge data. Smoothed or spatially filtered maps were first created torepresent the continuous distribution of indigent psychiatric discharges as naturally occurringphenomena, without the artificial administrative boundary constraints of Zip Codes. Using theSpatial Analyst extension of ArcGIS 9.1, an adaptive kernel approach27,28 was used to displayareas with higher or lower ratios of indigent discharges.
As opposed to conventional spatial smoothing, the adaptive kernel method implements spatialfilters (or kernels) defined in terms of near constant population size rather than constant geographicsize, i.e., greater emphasis is placed on population size rather than geographic size. A standardizedrisk ratio (SRR) was calculated for approximately 120,000 grid point evenly placed over a map ofCalifornia. The GIS program searched through the adjacent ZIP Codes until at least 500 psychiatricdischarges (set a priori)27 were associated with each grid point. The SRR at each point wascalculated by dividing the number of indigent discharges within the disc centered at thecorresponding grid point by the number of psychiatric discharges, divided by the Californiaproportion of indigent to all psychiatric discharges. To take into account sociodemographicdifferences among locations, smoothed SRRs were adjusted for differences in age, gender, race,ethnicity, diagnosis, and license status of the hospital.
Inferential spatial analysis
A circular spatial scan statistic (SCS)29 was used to find contiguous areas, or clusters, having astatistically significantly higher or lower standardized mortality ratio. The spatial scan statistic is arobust test of spatial randomness that determines the location of any area of California representinga probable cluster of indigent psychiatric discharges, after adjusting for multiple testing inherent inmany possible locations and sizes of the area.30 The growing application of SCS within publichealth for a variety of issues, such as analysis of organ transplantation patterns27 and detection of
182 The Journal of Behavioral Health Services & Research 35:2 April 2008
cancer clusters31, offers promise for its effective use in health services research. Calculations werecarried out using free SaTScan 6.1 software (developed by Martin Kulldorff and available at www.satscan.org).
As with the descriptive mapping, a 2×2 km lattice of nearly 120,000 observational locations wasoverlayed on the state. For each grid point, the radius of the scan window was set to contain atmost 30% of the total number of psychiatric discharges. By searching for clusters withoutspecifying their size or location, the method circumvents pre-selection bias. At each grid point, theSCS provides a measure of whether the observed number of indigent discharges is unlikely for awindow of that size, using reference values for the entire state. The null spatial model was based ona Poisson point process model and hypotheses were evaluated using a maximum likelihood ratiotest, whose P value was obtained through Monte Carlo randomization.32 If there was a cluster, thespatial location and extent was extracted and mapped. Analyses were run unadjusted and adjustedfor age, gender, race, ethnicity, diagnosis, and license status of the hospital.
Census-based synthetic estimation
The population-based estimates of persons with severe mental illness were developed using theCensus Bureau’s Public Use Microdata Sample (PUMS) 5% state file,33 based on the 1-in-20census responses. These files provide a cross-tabulation of the number of individuals within eachPUMA (minimum population of 100,000), broken out by gender, age group, race/ethnicity, maritalstatus, education, poverty status, and residence status. This detailed aggregated data is particularlyuseful for examining geographic patterns of household-level data.34 Note that PUMS refers to thedata, while PUMA refers to the geographic area.
Holzer35 was one of the first to combine survey data with local socioeconomic data, initiallyproviding estimates of the number of persons with mental illness in Texas. Starting with PUMSdata, a process of synthetic estimation35 was used to calculate both the total number of personswith severe mental illness and the number of persons living in households less than 200% offederal poverty level (FPL) having severe mental illness. This process required the development ofa model based upon the relationships between socio-demographic characteristics and mental healthprevalence drawn from the National Comorbidity Study (NCS).35 Basically, the known prevalenceof severe mental illness within each socio-economic subgroup, based on the NCS, was multipliedtimes the number of residents in the corresponding subgroup. After sufficient iterations, estimatednumbers of individuals with severe mental illness were obtained within each age, race/ethnicity,education, marital status, and poverty status category. For this study, the number of householders atless than 200% FPL estimated to have a severe mental illness was divided by the total estimatednumber of persons with severe mental illness to obtain the estimated amount of poverty amongthose with mental illness in each PUMA. The results were geocoded to a Census TIGER shapefilefor 5% PUMAs in California.36
Within California, there are 233 five percent PUMAs, which allows for greater spatial precisionthan the 1% PUMS (1-in-100 census responses) used for the initial county-level prevalenceestimates of severe mental illness prepared for the California Department of Mental Health. It isnoteworthy that these county-level California prevalence estimates were later updated for 2004 and2006, continue to be posted on the DMH website,37 and are still used for planning and reportingpurposes.
Results
The independent variables for both the indigent and non-indigent geocoded discharges areshown in Table 1. Approximately 91% of all identified psychiatric discharges were successfullygeocoded to locations in California, with 3.2% of all psychiatric discharges formally identified as
Spatial Analysis of Indigent Acute Psychiatric Discharges BANTA et al. 183

Table 1California psychiatric inpatient discharges, 1999–2003
Non-indigent n=652,472 (%) Indigent n=31,936 (%)
GenderMale 193,459 (30) 11,002 (34)Female 220,065 (34) 9,241 (29)Unknown gender 238,948 (37) 11,693 (37)Age0–17 years of age 58,427 (9) 1,768 (6)18–34 years 144,276 (22) 12,615 (40)35–64 years 306,647 (47) 13,971 (44)65 years and over 61,846 (9) 173 (1)Unknown age 81,276 (12) 3,409 (11)EthnicityHispanic 45,719 (7) 3,528 (11)Non-Hispanic 285,448 (44) 11,604 (36)Unknown ethnicity 321,305 (49) 16,804 (53)RaceWhite 275,667 (42) 12,875 (40)Black 50,504 (8) 1,792 (6)Native American 801 (0) 126 (0)Asian/Pacific Islander 9,575 (1) 340 (1)Other 19,082 (3) 1,546 (5)Unknown race 296,843 (45) 15,257 (48)DiagnosisSchizophrenia 220,774 (34) 10,345 (32)Other psychosis 71,072 (11) 6,879 (22)Affective 370,867 (57) 14,822 (46)Anxiety 117,145 (18) 6,182 (19)Substance use/abuse 205,619 (32) 11,285 (35)Year of discharge1999 80,363 (12) 1,781 (6)2000 133,264 (20) 5,845 (18)2001 140,671 (22) 7,341 (23)2002 148,664 (23) 8,356 (26)2003 149,510 (23) 8,613 (27)Primary insuranceMedicare 203,339 (31) 0 (0)Medi-Cal 191,897 (29) 0 (0)Private coverage 178,310 (27) 0 (0)Worker’s compensation 2,088 (0) 0 (0)County indigent 0 (0) 28,642 (90)Other government 45,318 (7) 0 (0)Other indigent 0 (0) 3,294 (10)Self pay 24,672 (4) 0 (0)Other payer 6,375 (1) 0 (0)Not reported/error 296 (0) 0 (0)
184 The Journal of Behavioral Health Services & Research 35:2 April 2008

homeless and 5.7% of psychiatric discharges having no known address, partial information, or anout of state residence. Discharges which were not geocoded were significantly more likely to havemissing or unknown values for age, gender, race and ethnicity.
Of the 684,408 geocoded psychiatric discharges, 31,936 (4.7%) were indigent, compared to7.3% among discharges that were not geocoded (data not shown). There was a 92% increase in thenumber of geocoded psychiatric discharges between 1999 and 2003, jumping from 82,144 to158,123. The proportion of psychiatric indigents more than doubled, jumping from 1,781discharges in 1999 (2.2% of geocoded discharges) to 8,613 discharges in 2003 (5.4%). Meanwhile,the percentage of all indigent discharges in California (data not shown) decreased slightly, from2.04% of 3,416,716 acute general-care discharges (excluding psychiatric hospitals) in 1999 to1.88% of 3,645,998 acute discharges in 2003.
Nearly all psychiatric discharges (95.8%) were from specialty psychiatric hospitals. Among thenon-indigents, Medicare accounted for 31% of discharges, Medi-Cal for 29%, and private coveragefor 27%. The public-use dataset had many unknown values for gender (36.6%), age (12.4%), race(45.6%), and ethnicity (48.4%). As the percent of unknown values was similar for both theindigents and non-indigents, it may be reasonable to assume that the unknown values did not biasthe adjusting process in the cluster analysis. Indigents were more likely to be 18–34 years of age(44.2 vs 25.3% among those with known ages), male (54.3 vs 46.8%) and Hispanic (23.3 vs13.8%). They were also more likely to have a diagnosis of “other psychosis” (22 vs 11%).
Table 2 summarizes data by level of geography, for both the 2,189 Zip Codes and the 233PUMAs. There was great variability, particularly among the discharge data, with one Zip Codereporting only one psychiatric discharge in 5 years and another nearly 4,000. Furthermore, nearly28% of Zip Codes had fewer than 11 psychiatric discharges and 37% had no indigent psychiatricdischarges. A mean of 2,993 persons were estimated to have severe mental illness within eachPUMA (range 583 to 9,241). On average, 45% of all persons with a severe mental illness lived in ahousehold at less than 200% of the federal poverty level (range of 7 to 86%).
Spatial patterns
Table 3 presents the results of the cluster detection analysis. Approximately 56% of all indigentdischarges were selected to be in a cluster. In the unadjusted analysis, simply looking at indigentversus non-indigent discharges, there were seven clusters (four with significantly increased ratescompared to the state-wide average and three with lower rates). All of the clusters with significantlylower rates occurred along the Pacific coast—West Los Angeles, Orange County, and San Francisco.After adjusting for age, gender, race, ethnicity, diagnoses, and license status of the hospital, therewere nine clusters (five with increased rates and four with lower rates). In addition to the three coastalclusters, a small cluster of lower rates was found in northeastern Los Angeles County.
In the adjusted analysis, significant clusters of increased rates of indigent discharges were foundin Western Riverside County (26.5% of 26,866 psychiatric discharges were indigent), San JoaquinCounty (41.7% of 7,899 discharges), the Fresno/Tulare/King area (14% of 14,640 discharges),southeast Los Angeles County (30% of 1,519 discharges), and northern California (8.8% of 23,758
Hospital licenseAcute care 27,332 (4) 1,069 (3)Psychiatric care 625,139 (96) 30,867 (97)
Table 1 (continued)
Spatial Analysis of Indigent Acute Psychiatric Discharges BANTA et al. 185

discharges). Of particular interest, note the relatively close spacing of increased and decreasedclusters. In the Bay area, San Francisco’s low indigent cluster (0.01% of 40,448 discharges) is notfar from San Joaquin’s high cluster. Orange County’s low indigent cluster (0.01% of 48,233discharges) sits adjacent to Western Riverside County’s high indigent cluster. Likewise, the lowindigent cluster of Ventura/Western Los Angeles County (0.01% of 214,125 discharges) is close tothe high indigent cluster in Southeast Los Angeles.
As seen in Figure 1, which shows the clusters overlayed on a map with smoothed dischargerates, the rate of indigent psychiatric discharges was not uniform within each of the circularclusters. This underscores the importance of using more than one technique to examine spatial data.In general, there was concordance between statistical clusters and areas of higher or lowersmoothed rates. The most obvious case of variation within a cluster was seen in cluster 8—northernCalifornia counties. Within that geographically large cluster which includes all or parts of 22counties, but no major urban center, there were Zip Codes with both elevated and decreased rates.Cluster 6, in the agricultural basis of Fresno/Tulare/King Counties, whose major urban area is thecity of Bakersfield, also included areas that were not uniformly high. There were two areas ofCalifornia where Zip Codes having relatively high rates of indigent discharges were not selected tobe in a cluster: the Lake Tahoe region of Northern California and central/eastern Riverside Countyin Southern California. The non-selection may have been due to the relatively low populationdensity in those areas. Previous analysis by the authors looking at kidney transplants also foundhigh smoothed rates around Lake Tahoe; but not a significant cluster.27
Figure 2 displays the indigent discharge clusters overlayed on the PUMA data. Within areashighlighted in black, more than 60% of the individuals estimated to have severe mental illness werein households living at less than 200% of the federal poverty level. Two obvious areas where theseareas were not included in an indigent discharge cluster were the majority of the agricultural basinof Central California and the state’s desert southern tip of eastern Riverside and Imperial counties.These may be areas of decreased access to psychiatric hospitalization among those with severe
Table 2Table 2 Summary of geographic data
MeanStandarddeviation Min Max
California discharge data, 1999–2003 (2,189 ZIP Codes)Psychiatric discharges 312.1 506.3 1 3,959Indigent psychiatric discharges 14.6 46.4 0 707ZIP Codes with 1–10 psychiatricdischarges
606 (27.7% of ZIP Codes)
ZIP Codes with NO indigentpsychiatric discharges
806 (36.8% of ZIP Codes)
Estimates of severely mentally ill in California, 2000 (233 PUMAs)Total population (2000) 145,428 35,950 97,795 301,662Estimated # of severely mentally ill 2,993 1,196 583 9,241Estimated # of severely mentally illhouseholders less than 200% FPL
1,478 1,033 132 7,292
Percent of severely mentally ill who arehouseholders at less than 200% FPL
0.45 0.18 0.07 0.86
186 The Journal of Behavioral Health Services & Research 35:2 April 2008

Tab
le3
Clustersof
higher
orlower
indigent
psychiatricdischargerates
Cluster
IDGeograp
hic
area
Indigent
discharges
Psychiatric
discharges
Standardized
risk
ratio(SSR)
p-value
Log
likelihood
ratio
UnadjustedSaT
ScanClusters
1Western
Riverside
County
6,919
26,144
6.96
0.001
6,873.5
2Ventura/W
estLos
Angeles
2,239
205,165
0.18
0.001
5,170.6
3San
Joaquin
3,287
7,861
9.87
0.001
4,427.2
4OrangeCounty
502
52,446
0.19
0.001
1,212.8
5San
Francisco
Bay
412
45,408
0.18
0.001
1,080.1
6Fresno/Tulare/King
2,054
14,584
3.16
0.001
926.2
7EastLos
Angeles
County
2,229
27,394
1.80
0.001
303.6
TOTA
L17,642
379,002
AdjustedSaT
ScanClusters
1Western
Riverside
County
7,129
26,866
6.25
0.001
6,432.8
2Ventura/W
estLos
Angeles
Santa
Barbara
2,405
214,125
0.19
0.001
4872.0
3San
Joaquin
3,292
7,899
6.53
0.001
3,260.8
4San
Francisco
Bay
272
40,448
0.14
0.001
1,122.6
5OrangeCounty
435
48,233
0.22
0.001
848.0
6Fresno/Tulare/King
2,058
14,640
2.47
0.001
613.4
7SoutheastLos
Angeles
County
455
1,519
5.29
0.001
391.2
8NorthernCaliforniacounties
2,091
23,758
1.89
0.001
331.1
9NortheastLos
Angeles
County
435,024
0.18
0.001
117.1
TOTA
L18,180
382,512
Spatial Analysis of Indigent Acute Psychiatric Discharges BANTA et al. 187
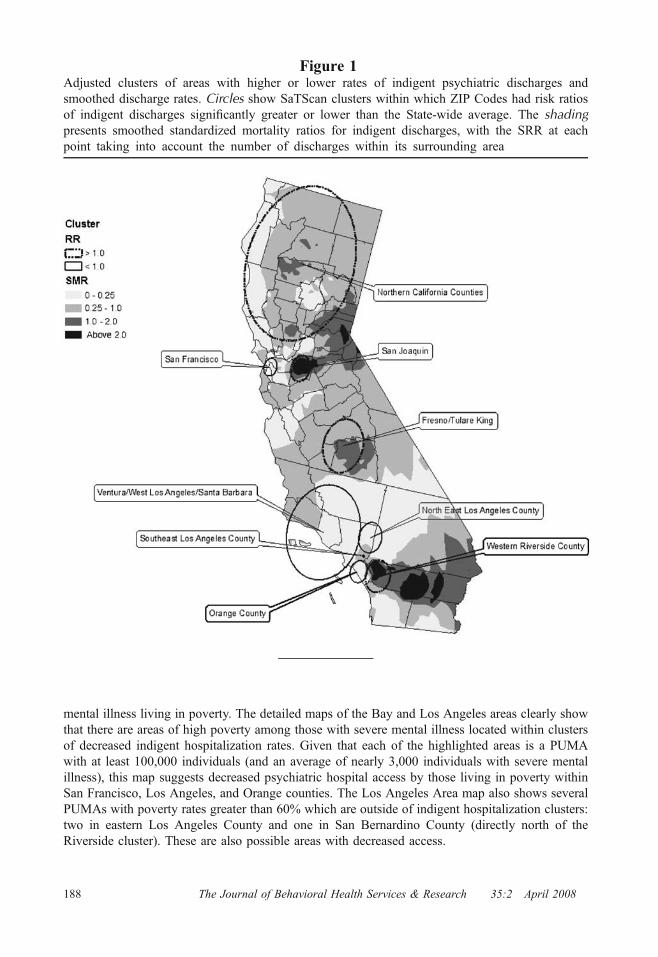
mental illness living in poverty. The detailed maps of the Bay and Los Angeles areas clearly showthat there are areas of high poverty among those with severe mental illness located within clustersof decreased indigent hospitalization rates. Given that each of the highlighted areas is a PUMAwith at least 100,000 individuals (and an average of nearly 3,000 individuals with severe mentalillness), this map suggests decreased psychiatric hospital access by those living in poverty withinSan Francisco, Los Angeles, and Orange counties. The Los Angeles Area map also shows severalPUMAs with poverty rates greater than 60% which are outside of indigent hospitalization clusters:two in eastern Los Angeles County and one in San Bernardino County (directly north of theRiverside cluster). These are also possible areas with decreased access.
Figure 1Adjusted clusters of areas with higher or lower rates of indigent psychiatric discharges andsmoothed discharge rates. Circles show SaTScan clusters within which ZIP Codes had risk ratiosof indigent discharges significantly greater or lower than the State-wide average. The shadingpresents smoothed standardized mortality ratios for indigent discharges, with the SRR at eachpoint taking into account the number of discharges within its surrounding area
188 The Journal of Behavioral Health Services & Research 35:2 April 2008
Discussion
The overall California rate of indigent psychiatric hospitalization (at least 4.7%) does appear tobe high, as a study of psychiatric hospitalizations in Massachusetts found that 3.7% ofhospitalizations in 2000 were for free care.17 In this study, robust GIS analytic techniques wereapplied to California statewide hospital discharge data to find regional clusters of increased (anddecreased) rates of indigent psychiatric hospitalizations. As one uses spatial analysis techniquessuch as cluster detection and presentation methods such as smoothed maps, some areas can beclearly seen to have significantly greater or significantly lower rates of indigent acute psychiatrichospitalizations, although these two different techniques result in slightly different “pictures.”
The relatively small differences between the unadjusted and adjusted analyses suggest thatpatient-level characteristics do not account for much of the variation in geographic-baseddifferences in the proportion of indigent psychiatric discharges. Of particular interest in theadjusted analysis was the finding of high clusters close to low clusters in the large urban centers ofLos Angeles and San Francisco. Although this may be reflective of the “displacement model”referred to by Wolch and Philo,21 there is a possibility that such findings are in part due to thepresence of many geographically small but densely populated Zip Codes or be reflective of referralpatterns to state and county mental health hospitals. Regardless, the tabular data clearly show atemporal increase in both the number of psychiatric discharges and the proportion of indigentdischarges. Further GIS efforts could examine spatial-temporal patterns, and this increase inindigent psychiatric hospitalizations provides impetus for additional data analysis and presentation.
Given the decentralized accountability of local mental health programs, there are policy andsocial justice imperatives to evaluate “area-specific inequalities in health need and serviceutilization,” especially as geographic variation in utilization raises questions about access andquality of care.14 Furthermore, simply identifying particular regions on which to focus efforts is agood example of psychiatric epidemiology contributing to more effective government policy.38
Indeed, as Fortney, et al.39 commented in their thorough spatial study including individual andcommunity-level data, simply identifying areas of elevated hospitalization rates is of interest topayers, even without additional sophisticated analysis.
Presenting the spatial analysis of indigent psychiatric hospitalization data along with estimatedneed (in this case prevalence of poverty among those with severe mental illness) revealed that therewere some areas where increased indigent psychiatric utilization coincided with estimated povertyamong mental patients. However, there were also areas with elevated proportions of mental patientsliving in poverty, where there were not increased rates of indigent admissions. Others have noted thechallenges of directly comparing utilization to population-based measures of mental health need. Onthe one hand, Kessler et al.40 have noted that it is difficult in population-based studies to accuratelydetermine which percentage of individuals actually have a mental disorder. Even if the prevalence ofmental illness is accurately measured, Mechanic has argued that prevalence is not a good measure ofthe need for mental health services, as there is not always a direct relationship between a mentaldiagnosis and disability which requires care.41 Within California, need for inpatient psychiatric care isclearly defined based on diagnosis, symptoms, and behaviors.9 Despite the conceptual andmethodological challenges though, public mental health agencies must allocate limited resources,and needs assessment is one method that may contribute to better decision-making.
The results suggest that in areas such as West Los Angeles, San Francisco, and Orange County,psychiatric hospitals in general may be in a better financial position due to the relatively smallnumber of indigent hospitalizations. On the other hand, there may be fewer financial resources inRiverside, San Joaquin, and Fresno counties, as hospitals and local mental health agencies appearto be bearing a higher rate of indigent psychiatric hospitalizations. It has been acknowledgedwithin the California public system that county-level inequities in mental health funding havepersisted since the 1960s.9 These maps may indicate one result of inequitable financing.
Spatial Analysis of Indigent Acute Psychiatric Discharges BANTA et al. 189

Although this GIS analysis is useful in producing needs-assessment maps that suggest areas withpotential disparities, it cannot explain if those apparent disparities are due to inequitable financing,ineffective outpatient care, or a myriad of other factors. However, there are theoretical models onecan use to examine potential disparities. One such approach is the Behavioral Model of Health
Figure 2Adjusted clusters of areas with higher or lower rates of indigent psychiatric discharges and estimates ofpoverty among those with severe mental illness. Shaded areas show within each PUMA the percentof estimated householders with severe mental illness living below 200% of the federal poverty level
190 The Journal of Behavioral Health Services & Research 35:2 April 2008

Care Utilization,42 which is used to examine variation in utilization, considering personalcharacteristics and the context in which those services are provided. The Behavioral Model hasbeen extended to more formally account for the effects of “community” on health care access andoutcomes.43 Using this approach, researchers found differential effects of community measures inrelation to low-income adults as they considered different types of access (potential and realized)and different types of patients (insured versus uninsured).44
A recent review of the literature45 concluded that there are three major groups of conceptualmodels for explaining how locations influence mental health status (ultimately, need for mentalhealth services). These three major approaches are: structural characteristics models (sociodemo-graphics), neighborhood disorder models (incivilities and feelings of safety), and environmentalstress models (resources and stresses inherent in the built environment).45 Future research guidedby a theoretical model could be used to study areas (identified by GIS techniques) in which thereappears to be increased or decreased access to psychiatric hospital care by those who are uninsured.However, this would require sub-county data, such as general sociodemographics, details aboutMedicaid beneficiaries, public mental resources and expenditures, etc.
Limitations
On a theoretical level, ecological fallacy is a common limitation in spatial analyses. This isactually not a problem in the present study as person-level data for each discharge is available inboth the numerator and denominator, allowing for direct control of individual differences in age,gender, race, and ethnicity. However, reductionism must be considered, as Zip Codes are notdefined just by the sum of resident psychiatric discharges. The whole nature of an area is definedby many features, including residents, buildings, jobs, and social arrangements. This GIS analysismust be viewed as one step in the process of understanding and improving access issues.
On a technical level, standard limitations that have been identified with spatial analysis include themodifiable areal unit problem, i.e., one may have different results with different levels of geographyand edge effects,39 particularly in calculating rates near the state boundary. As previously mentioned,there are problems with using Zip Codes.25 If one looks at multiple years worth of data, there may alsobe an issue with boundaries changing over time.46 Unfortunately, unless one has street-address-leveldata, there often is little other choice in analyzing hospitalization data.18
In addition to standard limitations inherent when analyzing administrative service data, theremay be problems of population denominators, particularly among mobile sub-populations.14 Also,discharges among the severely mentally ill are not complete in this dataset due to the exclusion ofstate mental health hospitals. Given the lower likelihood of geocoding among indigents, dischargerates in some areas were no doubt shown as lower than actual practice. Another potentialnumerator confounder would result if some counties were more successful at getting low-incomepersons enrolled in Medi-Cal; in the past, some counties were more aggressive in obtaining statefunding.9 Finally, although discharges are appropriate if one is concerned about costs, perhaps on aclinical level, a more useful denominator might be individuals, as roughly 40% of psychiatricinpatients are readmitted within a year of discharge.47 However, the use of multiple-robust GISmethods and a large sample size over several years may partially address these technical concerns.
Regarding estimated need, analysis of adults with severe mental illness in Virginia suggested atendency to migrate away from more affluent urban and poor rural areas into less affluent urbanareas, which is also where mental health services tend to be clustered.3 Furthermore, these needmeasures are based on household-level surveys, which excludes the homeless and incarcerated.Thus, these synthetic estimates based on static census data might over-represent need in some areasand under-represent need in others.
Regarding greater use of GIS analyses within state mental health agencies, often cited limitations ofGIS are the costs associated with running and maintaining systems and the difficulty of obtaining
Spatial Analysis of Indigent Acute Psychiatric Discharges BANTA et al. 191

current and complete data.25 Although this study was conducted in a university with existinggeographic information systems capacity, utilization analysis was done using readily available public-use data. Many SMHAs no doubt do have sufficient information technology infrastructure to supportGIS applications. Furthermore, as previously noted, GIS has been explicitly used in public mentalhealth planning in New York.12 As a former analyst within a California county mental healthdepartment, the lead author has given formal GIS presentations48 and witnessed the benefits of limitedapplication of spatial analysis within a public mental health agency.
Implications for Behavioral Health
The federal government has been encouraging the use of geographic information systems in thepublic health community, with the US Department of Health and Human Services recommendingthat all major local, state, and national health data systems that geocode data use GIS.25
Furthermore, many resources are freely available through the National Center for HealthStatistics.49 To date, there has been limited application of GIS to mental health services withingovernment agencies, with the exception of the Department of Veterans Affairs.50 However, GIScan be an important tool for combining disparate data sources to conduct needs assessments,including examination of potential small-area disparities of utilization relative to need. Many statemental health agencies already possess data which includes geographic identifiers. Such data couldbe transformed into maps that clearly present areas with increased or decreased utilization rates,and these utilization maps could be spatially linked with other data. Such maps could enhanceinternal decision-making and also be posted on public websites, being sensitive to legitimateprivacy and confidentiality concerns. Such distribution among stakeholders would contribute to ashared understanding of the “meaning” of these maps. Appropriate spatial analysis techniquesshould be applied to obtain robust results which are not as dependent on the underlying geographicscale of the data. Existing theoretical models should be used in conjunction with GIS techniques tobetter understand reasons for inequitable use of services.
References
1. NRI Inc. State Mental Health Agency Organization and Structure: 2006. Available at: http://www.nri-inc.org/projects/Profiles/Profiles05/2006SMHAOrganization.pdf/Accessed May 15, 2007.
2. Frank RG, Glied S. Changes in mental health financing since 1971: Implications for policymakers and patients. Health Affairs. 2006;25(3):601–613.
3. Dembling BP, Rovnyak V, Mackey S, et al. Effect of geographic migration on SMI prevalence estimates. Mental Health ServicesResearch. 2002;4(1):7–12.
4. Aoun S, Pennebaker D, Wood C. Assessing population need for mental health care: A review of approaches and predictors. MentalHealth Services Research. 2004;6(1):33–46.
5. McLafferty SL. GIS and health care. Annual Review of Public Health. 2003;24:25–42.6. Davoli JI. No room at the inn: How the federal medicaid program created inequities in psychiatric hospital access for the indigent
mentally Ill. American Journal of Law & Medicine. 2003;29:159–183.7. Buck JA. Medicaid, health care financing trends, and the future of state-based public mental health services. Psychiatric Services.
2003;54(7):969–975.8. Cunningham P, McKenzie K, Taylor EF. The struggle to provide community-based care to low-income people with serious mental illness.
Health Affairs. 2006;25(3):694–705.9. California Mental Health Planning Council. California mental health master plan: A vision for California. Available at: http://www.dmh.
ca.gov/Mental_Health_Planning_Council/Master_Plan.asp/ Accessed October 4, 2007.10. Baraff LJ, Janowicz N, Asarnow JR. Survey of California emergency departments about practices for management of suicidal patients
and resources available for their care. Annals of Emergency Medicine. 2006;48(4):452–458.11. Tompkins C, Perloff J. Using information to guide managed behavioral health care. The Journal of Behavioral Health Services &
Research. 2004;31(1):98–110.12. New York State Office of Mental Health. 2004 Interim report statewide comprehensive plan for mental health services. Available at:
http://www.omh.state.ny.us/omhweb/Statewideplan/interim/index.htm/ Accessed October 15, 2007.13. Penfold RB, Kelleher KJ. Use of surveillance data in developing geographic dissemination strategies: A study of the diffusion of
olanzapine to Michigan children insured by medicaid. Clinical Therapeutics. 2007;29(2):359–370.14. Holley HL. Geography and mental health: A review. Social Psychiatry and Psychiatric Epidemiology. 1998;33:535–542.
192 The Journal of Behavioral Health Services & Research 35:2 April 2008

15. DeFrances CJ, Podgornik MN. 2004 National hospital discharge survey. Advance data from vital and health statistics, Number 371,May 4, 2006. Available at: http://www.cdc.gov/nchs/data/ad/ad371.pdf/ Accessed October 2, 2007.
16. Blodgett C, Molinari C. Trends in psychiatric inpatient rates from 1991–1995 in the State of Washington: The effect of insurance type onutilization. Administration and Policy in Mental Health. 2001;28(5):393–405.
17. Hudson CG. Trends in acute psychiatric inpatient care in Massachusetts. Psychiatric Services. 2004;55(11):1302–1304.18. Almog M, Curtis S, Copeland A, et al. Geographical variation in acute psychiatric admissions within New York City 1990–2000:
Growing inequalities in service use? Social Science & Medicine. 2004;59:361–376.19. Koppel S, McGuffing P. Socio-economic factors that predict psychiatric admissions at a local level. Psychological Medicine.
1999;29:1235–1241.20. Thornicroft G. Social deprivation and rates of treated mental disorder. Developing statistical models to predict psychiatric service
utilization. British Journal of Psychiatry. 1991;158:475–484.21. Wolch J, Philo C. From distributions of deviance to definitions of difference: Past and future mental health geographics. Health & Place.
2000;6:137–157.22. Krieger N, Chen JT, Waterman PD, et al. Geocoding and monitoring of U.S. socioeconomic inequalities in mortality and cancer incidence:
Does the choice of area-based measure and geographic level matter? American Journal of Epidemiology. 2002;156(5):471–482.23. Eibner C, Sturm R. U.S.-based indices of area-level deprivation: Results from healthcare for communities. Social Science & Medicine.
2006;62:348–359.24. Krieger N, Chen J, Waterman P, et al. Painting a truer picture of us socioeconomic and racial/ethnic health inequalities: The public health
disparities geocoding project. American Journal of Public Health. 2005;92(2):312–323.25. Mullner RM, Chung K, Croke KG, et al. Geographic information systems in public health and medicine. Journal of Medical Systems.
2004;28(3):215–221.26. Garritson SH. Availability and performance of psychiatric acute care facilities in California from 1992 to 1996. Psychiatric Services.
1999;50(11):1453–1460.27. Soret S, McCleary KJ, Rivers PA, et al. Understanding health disparities through geographic information systems. In: Khan OA, Skinner R,
eds. Geographic Information Systems and Health Applications. Hershey, PA: Idea Group Publishing (an imprint of Idea Group); 2003:12–42.28. Talbot TO, Kulldorff M, Forand SP, et al. Evaluation of spatial filters to create smoothed maps of health data. Statistics in Medicine.
2000;19:2399–2408.29. Kulldorff M. A spatial scan statistic. Communications in Statistics—Theory and Methods. 1997;26:1481–1496.30. Kulldorff M. Geographic Information Systems (GIS) and community health: Some statistical issues. Journal of Public Health Practice
Management. 1999;5(2):100–106.31. DeChello LM, Sheehan TJ. The geographic distribution of melanoma incidence in Massachusetts, adjusted for covariates. International
Journal of Health Geographics. 2006;5:31.32. Kulldorff M. Spatial scan statistics: Models, calculations, and applications. In: Glaz J, Blakrishnan N, eds. Scan Statistics and
Applications. Boston: Birkhauser; 1999:303–322.33. Mackun PJ. The U.S. census bureau’s plans for the census 2000 public use microdata sample files. Available at: http://www.census.gov/
population/www/cen2000/pums.html/ Accessed August 1, 2005.34. Wong D. A geographical analysis of multiethnic households in the United States. International Journal of Population Geography. 1999;5
(1):31–48.35. Holzer CE. Estimation of need for mental health services. Synthetic estimation. Available at: http://psy.utmb.edu/estimation/3_Synthetic/
synthetic.htm/ Accessed August 1, 2005.36. U.S. Census Bureua. Public Use microdata areas cartographic boundary files descriptions and metadata. Available at: http://www.census.
gov/geo/www/cob/pu_metadata.html/ Accessed February 10, 2005.37. Department of Mental Health (California) Statistics & Data Analysis (SDA): Home Page. Available at: http://www.dmh.ca.gov/SADA/
Accessed October 18, 2007.38. Jenkins R. Making psychiatric epidemiology useful: The contribution of epidemiology to government policy. International Review Of
Psychiatry (Abingdon, England). 2003;15(1–2):188–200.39. Fortney J, Rushton G, Wood S, et al. Community-level risk factors for depression hospitalization. Administration and Policy in Mental
Health. 2007;34(4):343–352.40. Kessler RC, Demler O, Frank RG, et al. Prevalence and treatment of mental disorders, 1990 to 2003. The New England Journal of
Medicine. 2005;352(24):2515–2523.41. Mechanic D. Is the prevalence of mental disorders a good measure of the need for services? Health Affairs. 2003;22(5):8–20.42. Andersen RM, Davidson PL. Improving access to care in America: Individual and contextual indicators. In: Andersen RM, Rice TH,
Kominski GF, eds. 3rd edn. Changing the U.S. Health Care System. San Francisco: Jossey-Bass; 2007:3–32.43. Davidson PL, Andersen RM, Wyn R, et al. A framework for evaluating safety-net and other community-level factors on access for low-
income populations. Inquiry. 2004;41(1):21–38.44. Brown ER, Davidson PL, Yu H, et al. Effects of community factors on access to ambulatory care for lower-income adults in large urban
communities. Inquiry. 2004;41(1):39–56.45. Truong KD, Ma S. A systematic review of relations between neighborhoods and mental health. The Journal of Mental Health Policy and
Economics. 2006;9:137–154.46. Krieger N, Waterman P, Chen J, et al. Zip code caveat: Bias due to spatiotemporal mismatches between zip codes and US census-defined
geographic areas—the public health disparities geocoding project. American Journal of Public Health. 2002;92(7):1100–1102.47. Thompson E, Neighbors H, Munday C, et al. Length of stay, referral to aftercare, and rehospitalization among psychiatric inpatients.
Psychiatric Services. 2003;55(2):1271–1276.48. Banta J. Papers Presented at ESRI international user conferences; July 9, 1997, July 28, 1998, and July 10, 2002; San Diego, CA and at
ESRI International Health GIS Conference (was not actual presenter); November 12, 2001; Washington, DC. Papers available at: http://gis.esri.com/library/userconf/proc97/proc97/to250/pap244/p244.htm/, http://gis.esri.com/library/userconf/proc98/PROCEED/TO600/
Spatial Analysis of Indigent Acute Psychiatric Discharges BANTA et al. 193

PAP566/P566.HTM/, http://gis.esri.com/library/userconf/proc02/pap1206/p1206.htm/, http://gis.esri.com/library/userconf/health01/papers/hc01_p03b/hc01_p03b.html/.
49. National Center for Health Statistics. GIS and Public Health. Available at: http://www.cdc.gov/nchs/about/otheract/gis/gis_links.htm/Accessed May 25, 2007.
50. Yu W, Cowper D, Berger M, et al. Using GIS to profile health-care costs of va quality-enhancement research initiative diseases. Journalof Medical Systems. 2004;28(3):271–285.
194 The Journal of Behavioral Health Services & Research 35:2 April 2008