The effect of minor components on milk fat crystallization
13
ABSTRACT: Milk fat is composed of 97–98% triacylglycerols and 2–3% minor polar lipids. In this study triacylglycerols were chromatographically separated from minor components. Iso- lated diacylglycerols from the polar fraction were also added back to the milk fat triacylglycerols. The crystallization behav- iors of native anhydrous milk fat (AMF), milk fat triacylglycerols (MF-TAG), and milk fat triacylglycerols with diacylglycerols added back (MF-DAG) were studied. Removal of minor com- ponents and addition of diacylglycerols had no effect on drop- ping points or equilibrium solid fat contents. Presence of the minor components, however, did delay the onset of crystalliza- tion at low degrees of supercooling. Crystallization kinetics were quantified using the Avrami model. Sharp changes in the values of the Avrami constant k and exponent n were observed for all three fats around 20.0°C. Increases in n around 20.0°C indicated a change from one-dimensional to multidimensional growth. Differences in k and n of MF-DAG from AMF and MF-TAG suggested that the presence of milk fat diacylglycerols changes the crystal growth mechanism. Apparent free energies of nucleation (∆G c,apparent ) were determined using the Fisher- Turnbull model. ∆G c,apparent for AMF was significantly greater than ∆G c,apparent for MF-TAG, and ∆G c,apparent for MF-DAG was significantly less than those for both AMF and MF- TAG. The microstructural networks of AMF, MF-TAG, and MF-DAG, how- ever, were similar at both 5.0 and 25.0°C, and all three fats crys- tallized into the typical β′-2 polymorph. Differential scanning calorimetry in both the crystallization and melting modes re- vealed no differences between the heat flow properties of AMF, MF-TAG, and MF-DAG. Paper no. J9401 in JAOCS 77, 463–475 (May 2000). KEY WORDS: Avrami equation, crystallization, minor com- ponents, milk fat. Triacylglycerols generally constitute 93–98% of the total lipid mass in fats and oils. The balance is composed mainly of polar lipid species such as partial acylglycerols, free fatty acids, and phospholipids. The influence of these minor lipids on fat crystallization has intrigued academic and industrial researchers concerned with fats for decades. Historically, polar lipids and other surface-active compounds have been used to manipulate fat crystallization. Butter manufacturers have long considered the possibility of using additives, in- cluding monoacylglycerols, to improve spreadability and de- crease hardness (1–4). Similarly, the chocolate industry has used emulsifiers to stabilize preferred crystal polymorphs in cocoa butter (5). Oil processors have added partial acylglyc- erols to salad oils to prevent the formation of crystal sedi- ments and cloudiness during cold storage (6). The stabilizing influence of minor components on less stable polymorphic crystal forms has been especially well documented (7). For example, Hernqvist and Anjou (8) showed that diacylglyc- erols cocrystallize with rapeseed triacylglycerols in mar- garines and stabilize the β′ crystal polymorph, delaying the transformation to the less desirable, but thermodynamically more stable, β form. One of the earliest studies published in this area was carried out by the French researcher Loncin in 1958 (9). Loncin inves- tigated the effect of partial glycerols on palm oil plasticity. He concluded that palm oils high in free fatty acids tend to have lower melting points because of the formation of eutectics be- tween the triacylglycerols and the diacylglycerols that are pres- ent (9). Diacylglycerols have since been shown either to en- hance or to retard crystallization in palm oil, depending on their compatibility with the surrounding triacylglycerols. Dipalmi- toylglycerol caused rapid palm olein crystallization, palmitoyl- oleoylglycerol retarded crystallization, and dioleoylglycerol had no significant effect (10). Similarly, in coconut oil triacyl- glycerols, dilauroylglycerol retarded nucleation, but dioleoyl- glycerol had no significant effect (11). Cebula and Smith (12) reported that diacylglycerols in Coberine (a cocoa butter equiv- alent) reduce the fat’s crystallization induction time but subse- quently slow down the velocity of growth (12). In cocoa butter, Davis and Dimick (13,14) found that the surface-active proper- ties of complex lipids, including glycolipids and phospholipids, influenced the formation of stable seed crystals by forming the bulk of the nucleus and aiding in the preferential incorporation of trisaturated glycerols. Similar research has been conducted on a number of different fats and oils by several researchers. In particular, Niiya et al. (15,16), Reddy et al. (17), and Riiner (18) have made significant contributions. The case for milk fat crystallization has also been touched upon. Addition of 1% milk fat monoacylglycerols to milk fat triacylglycerols increased the fat’s spreadability (19). How- Copyright © 2000 by AOCS Press 463 JAOCS, Vol. 77, no. 5 (2000) *To whom correspondence should be addressed at Department of Food Sci- ence, University of Guelph, Ontario, Canada N1G-2WI. E-mail: [email protected] The Effect of Minor Components on Milk Fat Crystallization Amanda J. Wright a , Richard W. Hartel b , Suresh S. Narine a , and Alejandro G. Marangoni a, * Departments of a Food Science, University of Guelph, Ontario Canada N1G 2W1, and b Food Science, University of Wisconsin-Madison, Madison, Wisconsin 53706
Transcript of The effect of minor components on milk fat crystallization

ABSTRACT: Milk fat is composed of 97–98% triacylglycerolsand 2–3% minor polar lipids. In this study triacylglycerols werechromatographically separated from minor components. Iso-lated diacylglycerols from the polar fraction were also addedback to the milk fat triacylglycerols. The crystallization behav-iors of native anhydrous milk fat (AMF), milk fat triacylglycerols(MF-TAG), and milk fat triacylglycerols with diacylglycerolsadded back (MF-DAG) were studied. Removal of minor com-ponents and addition of diacylglycerols had no effect on drop-ping points or equilibrium solid fat contents. Presence of theminor components, however, did delay the onset of crystalliza-tion at low degrees of supercooling. Crystallization kineticswere quantified using the Avrami model. Sharp changes in thevalues of the Avrami constant k and exponent n were observedfor all three fats around 20.0°C. Increases in n around 20.0°Cindicated a change from one-dimensional to multidimensionalgrowth. Differences in k and n of MF-DAG from AMF andMF-TAG suggested that the presence of milk fat diacylglycerolschanges the crystal growth mechanism. Apparent free energiesof nucleation (∆Gc,apparent) were determined using the Fisher-Turnbull model. ∆Gc,apparent for AMF was significantly greaterthan ∆Gc,apparent for MF-TAG, and ∆Gc,apparent for MF-DAG wassignificantly less than those for both AMF and MF- TAG. Themicrostructural networks of AMF, MF-TAG, and MF-DAG, how-ever, were similar at both 5.0 and 25.0°C, and all three fats crys-tallized into the typical β′-2 polymorph. Differential scanningcalorimetry in both the crystallization and melting modes re-vealed no differences between the heat flow properties of AMF,MF-TAG, and MF-DAG.
Paper no. J9401 in JAOCS 77, 463–475 (May 2000).
KEY WORDS: Avrami equation, crystallization, minor com-ponents, milk fat.
Triacylglycerols generally constitute 93–98% of the totallipid mass in fats and oils. The balance is composed mainlyof polar lipid species such as partial acylglycerols, free fattyacids, and phospholipids. The influence of these minor lipidson fat crystallization has intrigued academic and industrialresearchers concerned with fats for decades. Historically,polar lipids and other surface-active compounds have been
used to manipulate fat crystallization. Butter manufacturershave long considered the possibility of using additives, in-cluding monoacylglycerols, to improve spreadability and de-crease hardness (1–4). Similarly, the chocolate industry hasused emulsifiers to stabilize preferred crystal polymorphs incocoa butter (5). Oil processors have added partial acylglyc-erols to salad oils to prevent the formation of crystal sedi-ments and cloudiness during cold storage (6). The stabilizinginfluence of minor components on less stable polymorphiccrystal forms has been especially well documented (7). Forexample, Hernqvist and Anjou (8) showed that diacylglyc-erols cocrystallize with rapeseed triacylglycerols in mar-garines and stabilize the β′ crystal polymorph, delaying thetransformation to the less desirable, but thermodynamicallymore stable, β form.
One of the earliest studies published in this area was carriedout by the French researcher Loncin in 1958 (9). Loncin inves-tigated the effect of partial glycerols on palm oil plasticity. Heconcluded that palm oils high in free fatty acids tend to havelower melting points because of the formation of eutectics be-tween the triacylglycerols and the diacylglycerols that are pres-ent (9). Diacylglycerols have since been shown either to en-hance or to retard crystallization in palm oil, depending on theircompatibility with the surrounding triacylglycerols. Dipalmi-toylglycerol caused rapid palm olein crystallization, palmitoyl-oleoylglycerol retarded crystallization, and dioleoylglycerolhad no significant effect (10). Similarly, in coconut oil triacyl-glycerols, dilauroylglycerol retarded nucleation, but dioleoyl-glycerol had no significant effect (11). Cebula and Smith (12)reported that diacylglycerols in Coberine (a cocoa butter equiv-alent) reduce the fat’s crystallization induction time but subse-quently slow down the velocity of growth (12). In cocoa butter,Davis and Dimick (13,14) found that the surface-active proper-ties of complex lipids, including glycolipids and phospholipids,influenced the formation of stable seed crystals by forming thebulk of the nucleus and aiding in the preferential incorporationof trisaturated glycerols. Similar research has been conductedon a number of different fats and oils by several researchers. Inparticular, Niiya et al. (15,16), Reddy et al. (17), and Riiner(18) have made significant contributions.
The case for milk fat crystallization has also been touchedupon. Addition of 1% milk fat monoacylglycerols to milk fattriacylglycerols increased the fat’s spreadability (19). How-
Copyright © 2000 by AOCS Press 463 JAOCS, Vol. 77, no. 5 (2000)
*To whom correspondence should be addressed at Department of Food Sci-ence, University of Guelph, Ontario, Canada N1G-2WI.E-mail: [email protected]
The Effect of Minor Components on Milk Fat CrystallizationAmanda J. Wrighta, Richard W. Hartelb, Suresh S. Narinea,
and Alejandro G. Marangonia,*Departments of aFood Science, University of Guelph, Ontario Canada N1G 2W1, and bFood Science,
University of Wisconsin-Madison, Madison, Wisconsin 53706

ever, while monoacylglycerols did temporarily decrease but-ter’s hardness, the effect disappeared upon extended storage(3). King (1) could find no consistent relationship betweenthe chemical structure of minor lipids added to milk fat tria-cylglycerols and their resulting effects on physical properties.
Clearly, the relationship between minor components andfat crystallization is complicated. Despite many efforts, thereremains little agreement about the nature of the minor com-ponents’ effects. Our group is interested in resolving the issuefor milk fat in particular. This work seeks first to characterizethe effect of milk fat’s minor components on crystallizationbehavior. The effect on milk fat structure will be pursued at alater stage.
MATERIALS AND METHODS
Separation of milk fat into the milk fat triacylglycerols(MF-TAG) and minor lipids. Anhydrous milk fat (AMF) wasseparated based on the method originally described by Car-roll (20), using Florisil (activated magnesium silicate), intotwo fractions: the MF-TAG and minor lipid components. TheMF-TAG were eluted with 20:80 diethyl ether/hexane andsubsequently the bound, more polar lipids were eluted withmethanol. Purity of the MF-TAG and minor lipid fractionswas verified by thin-layer chromatography (TLC) on silicaplates impregnated with boric acid using 96:4 (vol/vol) chlo-roform/acetone (21).
Characterization of AMF, MF-TAG, and minor polarlipids. Fatty acid analysis of AMF and the MF-TAG was per-formed by gas-liquid chromatography (GLC) according to themethod of Bannon et al. (22). Triacylglycerol compositionsof the two fats were determined by GLC as previously de-scribed (23). Diacylglycerol and monoacylglycerol isomersand free fatty acids were detected using TLC by comparingto Sigma (St. Louis, MO) standards. Cholesterol and choles-terol esters, glycolipids, and phospholipids were colorimetri-cally detected in the methanol fraction on TLC plates withspray reagents (Sigma Chemical Co.). Cholesterol and cho-lesterol esters were identified with ferric chloride, glycolipidswith Bial’s reagent containing orcinol ferric chloride, andphospholipids with the molybdenum blue spray reagent con-taining molybdenum oxide (1.3%) in 4.2 M sulfuric acid.
The polar fraction was analyzed by gas chromatogra-phy–mass spectroscopy using the VG Trio-1000 benchtopquadrupole mass spectrometer (VG-MICROMASS, Man-chester, England), which was operated by the LAB-BASEdata system software supplied with the VG Trio-1000. Theequipment was run in electron ionization mode with an accel-erating potential of 70 volts. A 30-m DB wax column wasused. The temperature was initially held at 60°C for 2 minthen ramped to 180°C at 5°C/min, at which point it was heldfor 30 min. The injector temperature was 200°C. The Dyno-lite detector looked at masses between 40 and 460 atomicmass units.
Collection and characterization of milk fat diacylglyc-erols. Milk fat diacylglycerols were recovered from the
methanol fraction by scraping TLC plates. The lipids were re-covered from the silica by vigorous vortexing in 2:1 chloro-form/methanol. Fatty acid analysis of the diacylglycerols wasperformed as above, and the positional distribution was cal-culated after determining the composition of the 1,2/2,3- and1,3-diacylglycerol bands individually. The diacylglycerolswere added to the MF-TAG at the 0.1 wt% level with heat andvigorous vortexing. MF-TAG with the diacylglycerol addi-tion will be referred to as MF-DAG.
Characterization of AMF, MF-TAG, and MF-DAG crys-tallization behavior. Dropping points were determined ac-cording to Rousseau et al. (23). The crystallization behaviorof the AMF, MF-TAG, and MF-DAG was studied by follow-ing the development of solid fat. Solid fat content (SFC) wasmeasured by pulsed nuclear magnetic resonance (pNMR)with a Bruker PC20 Series NMR analyzer (Bruker, Milton,Canada), according to the AOCS official method Cd 16-81(24). Samples were heated at 80°C for 30 min before analysisto destroy any crystal history. Three replicates of each samplewere then placed in a thermostated water bath, and SFC read-ings were taken at appropriate time intervals. Static crystal-lization was followed in this way at 5.0, 10.0, 15.0, 20.0, 22.5,25.0, and 27.5°C. Induction times of crystallization (τSFC)were determined from curves of SFC as a function of time byextrapolating back to the onset time of the linear SFC in-crease. The crystallization curves were fitted to the Avramiequation by least squares nonlinear regression (25). TheAvrami equation (26–28) can be used to quantify crystalliza-tion kinetics and give an indication of the nature of the crys-tal growth process; that is,
[1]
where SFC(t) describes the SFC as a function of time,SFC(∞) is the limiting SFC as time approaches infinity, k isthe Avrami constant, and n is the Avrami exponent.
The equation was developed to study the kinetics of phasechange, and its principles were first applied to polymer crys-tallization in the 1950s. Researchers have used the Avramimodel in the study of fat crystallization (29–33). The equa-tion describes an event in which there is an initial lag-period,where crystallization occurs very slowly, and a subsequentrapid increase in crystal mass (26). Avrami’s theory takes intoaccount that crystallization occurs by both nucleation andcrystal growth (34) and is based on the assumptions ofisothermal transformation conditions, spatially random nu-cleation, and linear growth kinetics in which the growth rateof the new phase depends only on temperature and not time(35).
The Avrami parameters provide information on the natureof the crystallization process. The constant k represents acrystallization rate constant. It depends primarily on the crys-tallization temperature (33) and generally follows an Arrhe-nius-type temperature dependency (36). The constant k takesboth the nucleation and crystal growth rates into account (37).Half times of crystallization, t1/2, reflect the magnitudes of the
SFC(t)SFC(∞)
= 1− e−ktn
464 A.J. WRIGHT ET AL.
JAOCS, Vol. 77, no. 5 (2000)
rate constants according to the following relationship:
[2]
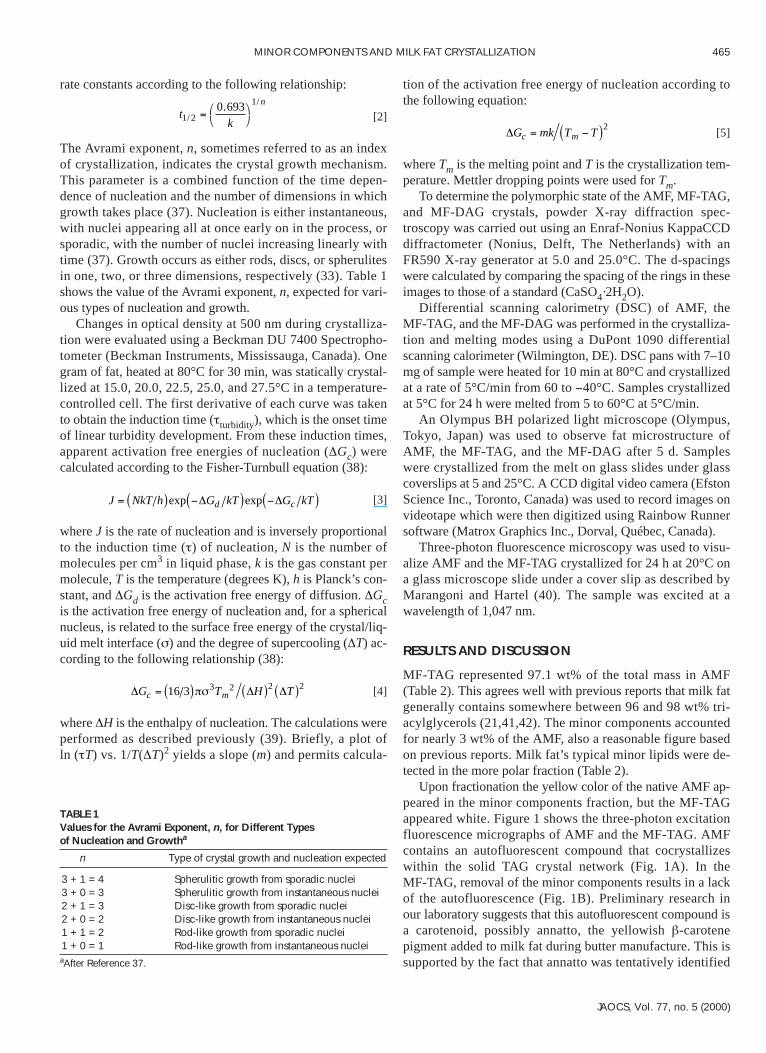
The Avrami exponent, n, sometimes referred to as an indexof crystallization, indicates the crystal growth mechanism.This parameter is a combined function of the time depen-dence of nucleation and the number of dimensions in whichgrowth takes place (37). Nucleation is either instantaneous,with nuclei appearing all at once early on in the process, orsporadic, with the number of nuclei increasing linearly withtime (37). Growth occurs as either rods, discs, or spherulitesin one, two, or three dimensions, respectively (33). Table 1shows the value of the Avrami exponent, n, expected for vari-ous types of nucleation and growth.
Changes in optical density at 500 nm during crystalliza-tion were evaluated using a Beckman DU 7400 Spectropho-tometer (Beckman Instruments, Mississauga, Canada). Onegram of fat, heated at 80°C for 30 min, was statically crystal-lized at 15.0, 20.0, 22.5, 25.0, and 27.5°C in a temperature-controlled cell. The first derivative of each curve was takento obtain the induction time (τturbidity), which is the onset timeof linear turbidity development. From these induction times,apparent activation free energies of nucleation (∆Gc) werecalculated according to the Fisher-Turnbull equation (38):
[3]
where J is the rate of nucleation and is inversely proportionalto the induction time (τ) of nucleation, N is the number ofmolecules per cm3 in liquid phase, k is the gas constant permolecule, T is the temperature (degrees K), h is Planck’s con-stant, and ∆Gd is the activation free energy of diffusion. ∆Gcis the activation free energy of nucleation and, for a sphericalnucleus, is related to the surface free energy of the crystal/liq-uid melt interface (σ) and the degree of supercooling (∆T) ac-cording to the following relationship (38):
[4]
where ∆H is the enthalpy of nucleation. The calculations wereperformed as described previously (39). Briefly, a plot of ln (τT) vs. 1/T(∆T)2 yields a slope (m) and permits calcula-
tion of the activation free energy of nucleation according tothe following equation:
[5]
where Tm is the melting point and T is the crystallization tem-perature. Mettler dropping points were used for Tm.
To determine the polymorphic state of the AMF, MF-TAG,and MF-DAG crystals, powder X-ray diffraction spec-troscopy was carried out using an Enraf-Nonius KappaCCDdiffractometer (Nonius, Delft, The Netherlands) with anFR590 X-ray generator at 5.0 and 25.0°C. The d-spacingswere calculated by comparing the spacing of the rings in theseimages to those of a standard (CaSO4·2H2O).
Differential scanning calorimetry (DSC) of AMF, theMF-TAG, and the MF-DAG was performed in the crystalliza-tion and melting modes using a DuPont 1090 differentialscanning calorimeter (Wilmington, DE). DSC pans with 7–10mg of sample were heated for 10 min at 80°C and crystallizedat a rate of 5°C/min from 60 to −40°C. Samples crystallizedat 5°C for 24 h were melted from 5 to 60°C at 5°C/min.
An Olympus BH polarized light microscope (Olympus,Tokyo, Japan) was used to observe fat microstructure ofAMF, the MF-TAG, and the MF-DAG after 5 d. Sampleswere crystallized from the melt on glass slides under glasscoverslips at 5 and 25°C. A CCD digital video camera (EfstonScience Inc., Toronto, Canada) was used to record images onvideotape which were then digitized using Rainbow Runnersoftware (Matrox Graphics Inc., Dorval, Québec, Canada).
Three-photon fluorescence microscopy was used to visu-alize AMF and the MF-TAG crystallized for 24 h at 20°C ona glass microscope slide under a cover slip as described byMarangoni and Hartel (40). The sample was excited at awavelength of 1,047 nm.
RESULTS AND DISCUSSION
MF-TAG represented 97.1 wt% of the total mass in AMF(Table 2). This agrees well with previous reports that milk fatgenerally contains somewhere between 96 and 98 wt% tri-acylglycerols (21,41,42). The minor components accountedfor nearly 3 wt% of the AMF, also a reasonable figure basedon previous reports. Milk fat’s typical minor lipids were de-tected in the more polar fraction (Table 2).
Upon fractionation the yellow color of the native AMF ap-peared in the minor components fraction, but the MF-TAG appeared white. Figure 1 shows the three-photon excitationfluorescence micrographs of AMF and the MF-TAG. AMFcontains an autofluorescent compound that cocrystallizeswithin the solid TAG crystal network (Fig. 1A). In theMF-TAG, removal of the minor components results in a lackof the autofluorescence (Fig. 1B). Preliminary research in our laboratory suggests that this autofluorescent compound isa carotenoid, possibly annatto, the yellowish β-carotenepigment added to milk fat during butter manufacture. This issupported by the fact that annatto was tentatively identified
∆Gc = mk Tm − T( )2
∆Gc = 16 3( )πσ3Tm2 ∆H( )2 ∆T( )2
J = NkT h( )exp −∆Gd kT( )exp −∆Gc kT( )
t1/ 2 =0.693
k
1/ n
MINOR COMPONENTS AND MILK FAT CRYSTALLIZATION 465
JAOCS, Vol. 77, no. 5 (2000)
TABLE 1Values for the Avrami Exponent, n, for Different Types of Nucleation and Growtha
n Type of crystal growth and nucleation expected
3 + 1 = 4 Spherulitic growth from sporadic nuclei3 + 0 = 3 Spherulitic growth from instantaneous nuclei2 + 1 = 3 Disc-like growth from sporadic nuclei2 + 0 = 2 Disc-like growth from instantaneous nuclei1 + 1 = 2 Rod-like growth from sporadic nuclei1 + 0 = 1 Rod-like growth from instantaneous nucleiaAfter Reference 37.

by GC–MS in the minor components fraction (results notshown).
Tables 3 and 4 show the fatty acid and triacylglycerol com-positions, respectively, of AMF and the MF-TAG determinedby GLC. AMF and MF-TAG had very similar fatty acid andtriacylglycerol compositions. Removal of the minor compo-nents did not affect the overall chemical composition of thebulk material (the TAG). This is significant because it verifiesthat during the separation procedure the TAG were not them-selves fractionated.
Mettler dropping points of AMF, MF-TAG, and MF-DAGwere 34.0 ± 0.2, 33.8 ± 0.2, and 34.2 ± 0.2°C, respectively.Removal of the minor components and addition of diacyl-glycerols back to MF-TAG did not significantly affect thedropping point (P > 0.05). Therefore, the thermodynamic dri-ving force behind crystallization is the same for AMF,MF-TAG, and MF-DAG in subsequent crystallization experi-
ments because the degree of supercooling is the same in allthree systems. The SFC vs. temperature profiles of AMF,MF-TAG, and MF-DAG are shown in Figure 2. The curvesare identical; the same amount of solid fat is present in allthree fats between 0 and 40°C. Milk fat minor components donot seem to alter the thermodynamics of the system sincedropping points and the equilibrium SFC remain unchangeddespite their removal. These results support research by vanden Tempel (6), which found that minor surface-active lipidswill not change the equilibrium SFC of a fat. Van den Tempelsuggested, however, that crystallization kinetics may be al-tered (6).
The effects of milk fat minor components on crystalliza-tion kinetics are shown in Figures 3 and 4. The increase inSFC with time during static crystallization was followed at5.0, 10.0, 15.0 (Fig. 3A–C) and 20.0, 22.5, 25.0, and 27.5°C(Fig. 4A–D). Minor components had an inhibitory effect on
466 A.J. WRIGHT ET AL.
JAOCS, Vol. 77, no. 5 (2000)
TABLE 2Reported (A, B, and C) and Experimentally Determined Composition of Milk Fat
Composition (wt%)
Aa Ba Ca Experimental results
TriacylglycerolsMF-TAG 97.50 95.8 97–98 97.10
Minor polar lipids 2.50 4.2 2–3 2.90Diacylglycerols 0.360 2.25* 0.28–0.59b DetectedMonoacylglycerols 0.027 0.08 0.16–0.38 DetectedCholesterol esters Trace 0.02 — DetectedCholesterol 0.310 0.46 0.419 DetectedPhospholipids 0.596 1.11 0.2–1.00 DetectedGlycolipids Trace NR — DetectedFree fatty acids NR 0.28 0.10–0.44 Detected
aA: Reference 21; B: Reference 41; C: Reference 22. b1,2-Diacylglycerol (21, 41, and 42). Abbreviation: MF-TAG, milk fat triacylglycerol; NR, not re-ported.
FIG. 1. Three-photon excitation fluorescence micrographs of anhydrous milk fat (AMF) (A) and milk fat triacylglycerols (MF-TAG) (B) crystallized at20°C for 24 h under a coverslip.

crystallization, but this effect depended on the degree of su-percooling. At high degrees of supercooling AMF, MF-TAG,and MF-DAG displayed identical crystallization profiles. Allthree fats crystallized very rapidly and reached the same SFCat 5.0, 10.0, and 15.0°C (Fig. 3). Similarly, King (1) foundthat minor lipids did not influence the crystallization patternsof rapidly cooled milk fat. At higher temperatures, the crys-tallization curves became more sigmoidal, and the effects ofthe minor components became more apparent. Between 20.0and 27.5°C, AMF and MF-TAG exhibited different crystal-lization behaviors. MF-TAG started crystallizing earlier thanAMF (Fig. 4). Addition of diacylglycerols to the MF-TAGshifted the crystallization behavior more closely to that ofAMF. At 25.0 and 27.5°C crystallization in the MF-DAG wasparticularly delayed. At lower degrees of supercooling theminor components had an inhibitory effect on the crystalliza-
tion process. Although they did not change the final amountof solid fat attained, minor components increased the induc-tion time (Table 5). Induction times determined by turbiditymeasurements (τturbidity) are also shown, and will be discussedlater. Between 5.0 and 20.0°C, the induction times for AMF,MF-TAG, and MF-DAG were not significantly different (P >0.05). However, at higher temperatures MF-TAG started crys-tallizing earlier than AMF, and MF-DAG had the longest in-duction times (P < 0.001).
To quantify differences in the crystallization behaviors ofAMF, MF-TAG, and MF-DAG, the SFC crystallizationcurves were fitted to the Avrami equation by nonlinear regres-sion. The equation fitted the data very well over the entirerange of fractional crystallization; correlation coefficientswere always greater than 0.96. The Avrami rate constants (k),half times of crystallization (t1/2), and exponents (n) areshown in Table 6.
Avrami constants (k) decreased as the temperature in-creased. The largest drop in k occurred between 20.0 and22.5°C. Here, over only a couple of degrees, the Avrami con-stants drop by a factor of roughly 1000. Over the entire 5.0 to20.0°C range, k for AMF, MF-TAG, and MF-DAG only de-creased by a factor of 10. Up to 20.0°C, temperature had avery strong influence on k (P < 0.001). Between 22.5 and27.5°C, there was no significant effect of temperature on theAvrami constant (P > 0.05). No significant differences wereobserved between k for AMF and the MF-TAG (P > 0.05), al-though the MF-DAG had significantly lower Avrami con-stants (P < 0.001). The native mixture of minor componentsdoes not seem to affect the rate of milk fat crystallization. Di-acylglycerols alone, however, seem to slow the rate. The in-crease in t1/2 for all three fats as a function of increasing tem-perature reflects the decrease in k at higher temperatures.
Changes in the Avrami constant as a function of crystal-lization temperature are shown in Figure 5. These graphsdemonstrate the existence of two distinct regions, one above
MINOR COMPONENTS AND MILK FAT CRYSTALLIZATION 467
JAOCS, Vol. 77, no. 5 (2000)
TABLE 3Fatty Acid Composition of Anhydrous Milk Fat (AMF) and MF-TAGa
AMF MF-TAGFatty acid (mol%) (mol%)
4:0 10.37 ± 0.61 9.36 ± 0.976:0 5.41 ± 0.07 4.85 ± 0.088:0 2.04 ± 0.03 1.91 ± 0.0110:0 3.97 ± 0.04 3.86 ± 0.1012:0 4.04 ± 0.04 4.05 ± 0.1614:0 11.00 ± 0.15 11.35 ± 0.3614:1 1.83 ± 0.00 2.00 ± 0.1815:0 1.19 ± 0.01 1.35 ± 0.1616:0 26.12 ± 0.35 26.48 ± 0.0216:1 2.56 ± 0.02 2.69 ± 0.1417:0 0.66 ± 0.02 0.72 ± 0.0718:0 8.59 ± 0.02 8.57 ± 0.0918:1 19.26 ± 0.18 19.75 ± 0.2818:2 2.41 ± 0.04 2.49 ± 0.0518:3 and 18:2 0.58 ± 0.05 0.57 ± 0.02aDetermined by gas–liquid chromatography. Data reported represent the av-erage of two replicates ± standard deviation. See Table 2 for abbreviation.
TABLE 4Triacylglycerol Composition of AMF and MF-TAGa
Triacylglycerol AMF MF-TAG(carbon number) (wt%) (wt%)
24 0.29 ± 0.00 0.21 ± 0.0126 0.19 ± 0.01 0.15 ± 0.0028 0.42 ± 0.02 0.36 ± 0.0030 1.13 ± 0.07 0.86 ± 0.0432 2.32 ± 0.00 2.26 ± 0.0534 5.76 ± 0.07 5.98 ± 0.0836 12.77 ± 0.16 13.35 ± 0.0838 14.53 ± 0.10 15.32 ± 0.1140 11.78 ± 0.14 12.34 ± 0.0142 8.27 ± 0.03 8.70 ± 0.0444 7.58 ± 0.00 7.76 ± 0.0446 8.26 ± 0.03 8.15 ± 0.0348 9.37 ± 0.08 8.99 ± 0.0050 9.65 ± 0.13 8.54 ± 0.0052 7.91 ± 0.37 6.69 ± 0.00
aAverage of two replicates and standard deviation. For abbreviations seeTable 2 and 3.
FIG. 2. Solid fat content (%) vs. temperature (°C) for anhydrous milk fat(AMF) (▲▲), milk fat triacylglycerols (MF-TAG) (■■ ), and MF-TAG with0.1% diacylglycerols added back (MF-DAG) (●● ). Symbols represent theaverage ± standard error of three replicates.

and the other below 20.0°C. The division between these tworegions is very pronounced. Figure 5B shows that the Avramiexponent remains constant and low (around 0.60) when thetemperature is low. Here, between 5.0 and 15.0°C, tempera-ture had no significant effect on n (P > 0.05). This is not sur-prising since n generally tends to remain constant over an ap-preciable temperature range and is independent of the degreeof supercooling (34,36). Around 20°C, n began to increase.This is the same point at which the greatest change in the
Avrami constant occurred. Above 20.0°C, n continued to in-crease as temperature was increased. Both above and below20.0°C, no significant differences were observed between nfor AMF and the MF-TAG (P > 0.05). Above 20°C, expo-nents for the MF-DAG were slightly higher than for bothAMF and MF-TAG (P < 0.001), which reflects the more sig-moidal nature of the MF-DAG crystallization curves.
The similarities in Avrami exponents for AMF and the MF-TAG suggest that these fats crystallize in a similar fashion. Thedifferences observed for MF-DAG may be indicative ofslightly different modes of crystal growth owing to the pres-ence of diacylglycerols. In AMF, MF-TAG, and MF-DAG, thesharp change in n around 20.0°C suggests the existence of dif-ferent crystallization mechanisms depending on the degree ofsupercooling. The change in n at about this point should indi-cate differences in crystal growth geometry (34). Milk fat crys-tallizes predominantly in the β′-crystal form, although at highrates of cooling (≥1°C/min) the α crystal will form below20.0°C. The α crystal is a metastable form and has a clear pointof 20.0°C when the triacylglycerols transform to the more sta-ble β′-crystal (43). The sharp change observed in the crystal-lization mode around 20.0°C is perhaps related to the forma-tion of the α-crystal at the lower temperatures.
An increase in the induction time and a more sigmoidalcrystallization curve are generally indicated by a higherAvrami exponent (27,37). This was found to be true; at highertemperatures, values of τ and n were significantly higher, andcrystallization curves appeared more sigmoidal. According toSharples (37), below 20°C the experimental n of roughly 0.6may suggest rod-like growth in only one dimension from in-stantaneous nuclei. Generally, as the rate of crystallization in-creases the growth mechanism changes from lineal to poly-hedral, as indicated by an increase in the Avrami exponent(27). The experimental increase in n suggests that crystalgrowth above 20.0°C changes from a one- to a multidimen-sional event.
Beyond this it is impossible to draw unambiguous conclu-sions about the growth mechanism based on the determinedAvrami exponent, unless the type of growth can be verifiedmicroscopically. The situation is further complicated by thefact that, although n should be an integer, fractional valuesare obtained in some analyses, even in cases where theAvrami equation is very accurately obeyed (37). Fractionalvalues for n were consistently obtained from the AMF,MF-TAG, and MF-DAG crystallization curves, despite corre-lation coefficients of at least 0.96. Christian (34) reported thatfor some cases of metals and alloys in which growth is diffu-sion controlled, fractional exponents correlate with specificgrowth mechanisms. In such cases an exponent of roughly 0.5may indicate precipitation on crystal dislocations. Similarly,values greater than 2.5 reflect growth of all shapes with in-creasing nucleation rate (34).
Although the Avrami equation is being used increasinglyin fat research, it has limitations when the nature of thegrowth process cannot be visualized. The resolution of crys-tal nuclei and the initial stages of growth are beyond the ca-
468 A.J. WRIGHT ET AL.
JAOCS, Vol. 77, no. 5 (2000)
FIG. 3. Solid fat content (%) vs. time during static crystallization of AMF(▲▲), MF-TAG (■■ ), and MF-DAG (●● ) at 5.0 (A), 10.0 (B), and 15.0°C (C).Symbols represent the average ± standard error of three replicates. Forabbreviations see Figure 2.

pabilities of a light microscope, so it is impossible to makedefinite conclusions about the modes of crystal growth ob-served at different temperatures. Having said this, the Avramiexponent does provide a phenomenological index of crystal-lization. Accordingly, the similarities in n between AMF andMF-TAG point to the fact that removal of the minor compo-nents does not change the growth mode, and the distinctchange in the exponent around 20°C suggests a change incrystal growth mechanism in both fats around this tempera-ture.
Increases in turbidity of AMF, MF-TAG, and MF-DAGduring crystallization at 15.0, 20.0, 22.5, 25.0, and 27.5°C areshown in Figure 6. Induction times derived from these plots
(τturbidity) are shown in Table 5. At 15.0 and 20.0°C no differ-ences were observed between AMF and the MF-TAG(Fig. 6). Above 20.0°C, however, significant differences wereobserved in τturbidity. MF-TAG consistently had shorter induc-tion times than AMF (P < 0.001). These trends were similarto those when monitoring crystallization using pNMR; ab-sence of minor components in MF-TAG resulted in an earlieronset of crystallization. The situation with the diacylglycerolsis more complicated. At 15.0 and 20.0°C τturbidity forMF-DAG was not significantly different from that of AMFand MF-TAG (P > 0.05), while above that MF-DAG had theshortest induction time (P < 0.001) (Table 5). Each MF-DAGturbidity curve had an initial rise very early in the process,
MINOR COMPONENTS AND MILK FAT CRYSTALLIZATION 469
JAOCS, Vol. 77, no. 5 (2000)
FIG. 4. Solid fat content (%) vs. time during static crystallization of AMF (▲▲), MF-TAG (■■ ), and MF-DAG (●● ) at20.0 (A), 22.5 (B), 25.0 (C), and 27.5°C (D). Symbols represent the average ± standard error of three replicates. Forabbreviations see Figure 2.
TABLE 5Induction Times (min) for Crystallization of AMF, MF-TAG, and MF-DAGa
Temperature Induction time by SFC (τSFC) Induction time by turbidity (τturbidity)
(°C) AMF MF-TAG MF-DAG AMF MF-TAG MF-DAG
5.0 0.05 ± 0.00K 0.05 ± 0.00K 0.05 ± 0.00K ND ND ND10.0 0.50 ± 0.00K 0.50 ± 0.00K 0.50 ± 0.00K ND ND ND15.0 2.00 ± 0.00K 1.83 ± 0.17K 2.00 ± 0.00K 6.78 ± 0.11F 6.89 ± 0.11F 6.11 ± 0.45F
20.0 5.33 ± 0.33J 4.33 ± 0.33J 5.33 ± 0.33J 8.33 ± 0.58E,F 7.22 ± 0.29F 8.11 ± 0.29E,F
22.5 23.33 ± 0.67H 14.83 ± 0.17I 35.33 ± 0.33F 12.67 ± 1.02D,E, 9.11 ± 0.29E,F 10.00 ± 0.84D,E,F
25.0 45.33 ± 0.17E 29.83 ± 0.17G 57.00 ± 0.58D 23.22 ± 2.35C 14.56 ± 0.48D 12.11 ± 0.59D,E
27.5 107.83 ± 0.17B 95.67 ± 0.17C 163.67 ± 0.88A 40.22 ± 1.47A 31.00 ± 0.67B 20.78 ± 1.50C
aDetermined by SFC (τSFC) and turbidity measurements (τturbidity) at 5.0, 10.0, 15.0, 20.0, 22.5, 25.0, and 27.5°C. Mean value of three replicates ± standarderror of the mean. Different superscript letters (A–K) indicate significant differences (P < 0.05) in each column. Comparisons were made between AMF, MF-TAG, and MF-DAG within τSFC and separately within τturbidity. MF-DAG, milk fat triacylglycerols with diacylglycerols added back; SFC, solid fat content;ND, not determined; for other abbreviations see Table 2.

but this bump leveled off until τturbidity was surpassed. Possi-bly the presence of the diacylglycerols led to an increase incrystal mass very early on. Nuclei may have been formed ini-tially, encouraged by the diacylglycerol presence, but did notdevelop appreciably for some time until τturbidity was ex-ceeded.
The Fisher-Turnbull equation can be used to calculate ac-tivation free energies of nucleation based on experimentallydetermined induction times of nucleation (44). Strictly speak-ing, this practice is valid only if the induction times relate ex-clusively to nucleation and do not include crystal growth aswell. In fat crystallization studies it has become popular touse induction times determined by turbidimetric methods(τturbidity) for the purpose. Because the Fisher-Turnbull equa-tion may be useful for comparing crystallization events be-tween fats and with previous studies, we have calculated theactivation free energies of nucleation (∆Gc). However, be-cause there is no assurance that the turbidity induction timesonly represent nucleation, we will consider the calculated freeenergies to be apparent activation free energies of nucleation(∆Gc,apparent). ∆Gc,apparent values were not calculated fromSFC induction times, because these are clearly not inductiontimes of nucleation. Tiny crystals are sometimes visible in themelt before the pNMR signal detects the presence of crystalmass.
As expected, temperature had a significant effect on∆Gc,apparent (P < 0.001). ∆Gc,apparent increased with increasing
temperature (Table 7). AMF, MF-TAG, and MF-DAG hadsignificantly different ∆Gc,apparent (P < 0.001), suggesting thatmilk fat minor components had an effect on the energy bar-rier to nucleation. The higher ∆Gc,apparent for AMF over the MF-TAG suggests that nucleation in AMF occurs lessreadily than in the MF-TAG. Lower induction times translateinto lower ∆Gc,apparent. MF-DAG consistently had lower∆Gc,apparent than AMF and MF-TAG (P < 0.001), which mightindicate a lower energy barrier to nucleation in the MF-DAGas suggested by the lower induction times (Table 5) and tur-bidity profiles during crystallization (Fig. 6).
Previously, good agreement was found between increasesin crystal mass and turbidity during crystallization (45,46).Figure 7 shows good agreement between the τturbidity and τSFCfor AMF, MF-TAG, and MF-DAG. This supports the fact thatincreases in turbidity are due to mass deposition and not justto nucleation, and lends support to considering nucleationfree energies, calculated based on the Fisher-Turnbull equa-tion, as apparent free energies. Nucleation and crystal growthare not necessarily distinct events but can occur simultane-ously (47). Initial increases in turbidity during crystallizationmay reflect only nucleation in cases where all nucleation oc-curs very early on and quite independently from crystalgrowth. However, in cases of sporadic nucleation, wheremore nuclei appear in time, as other nuclei grow, τturbidity isnot a nucleation induction time. The good agreement betweenincreases in turbidity and SFC during crystallization means
470 A.J. WRIGHT ET AL.
JAOCS, Vol. 77, no. 5 (2000)
TABLE 6Avrami Constant, k, Half Times of Crystallization t1/2, and Avrami Exponents n of AMF, MF-TAG, and MF-DAG Crystallized at 5.0, 10.0, 15.0, 20.0, 22.5, 25.0, and 27.5°Ca
Temperature k t1/2 n(°C) (t−k) (min)
AMF5.0 3.1 × 10⁻¹ ± 0.2 × 10⁻¹A 3.47 ± 0.20K 0.65 ± 0.01F
10.0 1.7 × 10⁻¹ ± 0.4 × 10⁻¹B 10.28 ± 1.69K 0.61 ± 0.03F
15.0 6.9 × 10⁻² ± 0.2 × 10⁻²C 36.26 ± 0.75K 0.64 ± 0.00F
20.0 4.0 × 10⁻³ ± 1.0 × 10⁻³D 32.33 ± 3.46J 1.52 ± 0.04E
22.5 1.6 × 10⁻⁷ ± 0.5 × 10⁻⁷D 61.36 ± 14.65H 3.96 ± 0.03C
25.0 2.5 × 10⁻⁶ ± 2.5 × 10⁻⁶D 74.11 ± 12.21E 3.01 ± 0.16D
27.5 6.6 × 10⁻¹⁰ ± 8.2 × 10⁻¹⁰D 165.65 ± 51.28B 4.35 ± 0.22B,C
MF−TAG5.0 3.0 × 10⁻¹ ± 0.3 × 10⁻¹A 3.59 ± 0.32K 0.66 ± 0.02F
10.0 1.6 × 10⁻¹ ± 0.1 × 10⁻¹B 10.08 ± 0.59K 0.65 ± 0.01F
15.0 6.0 × 10⁻² ± 1.0 × 10⁻²C 33.55 ± 4.07K 0.69 ± 0.02F
20.0 9.0 × 10⁻² ± 0.0 × 10⁻²C 23.93 ± 0.86J 0.66 ± 0.01F
22.5 2.3 × 10⁻⁵ ± 4.4 × 10⁻⁵D 27.45 ± 1.36I 2.41 ± 0.05F
25.0 1.6 × 10⁻⁷ ± 1.2 × 10⁻⁷D 54.54 ± 9.23G 3.93 ± 0.18B,C
27.5 3.0 × 10⁻¹¹ ± 2.5 × 10⁻¹¹D 126.92 ± 11.31C 4.98 ± 0.06A,B
MF−DAG5.0 2.7 × 10⁻¹ ± 0.4 × 10⁻¹A 5.26 ± 0.64K 0.59 ± 0.00F
10.0 8.5 × 10⁻² ± 0.3 × 10⁻²A 16.53 ± 0.42K 0.75 ± 0.00E,F
15.0 8.3 × 10⁻² ± 0.1 × 10⁻²A 27.91 ± 0.43K 0.64 ± 0.01F
20.0 1.0 × 10⁻² ± 0.4 × 10⁻²C 25.81 ± 3.93J 1.33 ± 0.06E,F
22.5 2.4 × 10⁻⁸ ± 2.7 × 10⁻⁸D 49.8 ± 13.19F 4.69 ± 0.32A,B,C
25.0 2.6 × 10⁻⁹ ± 1.8 × 10⁻⁹D 87.22 ± 15.92D 4.52 ± 0.18B,C
27.5 4.9 × 10⁻¹² ± 8.5 × 10⁻¹²D 234.90 ± 80.08A 5.46 ± 0.43A
aMean value of three replicates ± standard error of the mean. Different superscript letters (A–K) indi-cate significant differences (P < 0.05) within either k, t1/2, or n columns. For abbreviations see Tables3 and 5.

that turbidity may reasonably replace pNMR or crystal massmeasurements to monitor on-line crystallization processes.However, according to SFC measurements MF-DAG consis-tently crystallized later than AMF and MF-TAG, whereas byturbidity measurements MF-DAG crystallized before the
other fats at 25.0 and 27.5°C (Table 5). This discrepancy inthe trends observed by both methods means that the pNMRand spectrographic methods are not entirely equivalent.
The positional distribution of fatty acids in milk fat di-acylglycerols is compared with that of milk fat in Table 8. Thediacylglycerols are enriched in palmitic acid at the sn-1,3 po-sition. This may encourage interactions with the milk fat tria-cylglycerols which contain more palmitic acid at the sn-2 po-sition, allowing the diacylglycerols to cocrystallize with thetriacylglycerols. Possibly the milk fat diacylglycerols encour-age nucleation (bump in turbidity profiles in Fig. 6); however,overall they exert an inhibitory effect on crystal growth. Fig-ure 8 shows that when 0.1 wt% dipalmitin (mixed isomers)was added back to the MF-TAG, crystallization at 22.5°Cbegan earlier. Dipalmitin is a high-melting compound thatlikely acts as a seed, crystallizing out before the MF-TAG andsubsequently inducing nucleation and crystal growth. Di-palmitin and the milk fat diacylglycerols have different ratesof crystallization and therefore interact differently with theMF-TAG. Complementarity between the milk fat diacylglyc-erols and triacylglycerols may allow the diacylglycerols tococrystallize with the MF-TAG and be incorporated into theembryos or growing crystals. Upon incorporation they seemto retard crystallization. Dipalmitin, on the other hand, en-hances crystallization.
Figure 9 shows polarized light micrographs of AMF,MF-TAG, and MF-DAG after crystallization for 5 d at 5.0 and25.0°C. No differences were observed between the three fats ateither temperature. Removal of the minor components did notaffect the formation of the typical crystal microstructure ofAMF. The influence of temperature on crystal network struc-ture, however, is very obvious. With a high degree of supercool-ing (roughly 28° at 5.0°C), nucleation proceeds very rapidly,and the resulting pattern of crystal structures resembles a starrynight. At higher temperatures (25.0°C), there is more time forthe crystals to arrange into more ordered microstructures.
X-ray diffraction (XRD) patterns of AMF, MF-TAG, andMF-DAG at 5 and 25°C were identical. The patterns forAMF, MF-TAG and MF-DAG at 5°C are shown in Figure 10.Reflections at 3.8, 4.2, and 39 Å were detected in all three fats
MINOR COMPONENTS AND MILK FAT CRYSTALLIZATION 471
JAOCS, Vol. 77, no. 5 (2000)
FIG. 5. Avrami rate constants k (A) and exponents n (B) for AMF (▲▲),MF-TAG (■■ ), and MF-DAG (●● ) as a function of crystallization tempera-ture. Symbols represent the average ± standard error of three replicates.For abbreviations see Figure 2.
TABLE 7Apparent Activation Free Energies of Nucleation (∆Gc,apparent) for AMF, MF-TAG, and MF-DAG Crystallized at 15.0, 20.0, 22.5, 25.0, and 27.5°Ca
Temperature AMF MF-TAG MF-DAG(°C) (kJ/mol) (kJ/mol) (kJ/mol)
15.0 0.61 ± 0.01H,J 0.54 ± 0.01I,J 0.36 ± 0.03J
20.0 1.12 ± 0.03F,G 0.99 ± 0.02G,H,I 0.67 ± 0.05H,I,J
22.5 1.66 ± 0.04E 1.47 ± 0.03E,F 0.99 ± 0.07G,H
25.0 2.46 ± 0.06D 2.18 ± 0.05D 1.48 ± 0.11E,F
27.5 5.18 ± 0.13A 4.59 ± 0.10B 3.11 ± 0.23C
aMean value of three replicates ± standard error of the mean. Different su-perscript letters (A–J) indicate significant differences (P < 0.05) between val-ues. For abbreviations see Tables 3 and 5.
TABLE 8Fatty Acid Positional Distribution (mol%) of AMFa
and Milk Fat Diacylglycerols
AMF Diacylglycerols
Fatty acid sn-2 sn-1,3 sn-2 sn-1,3
4:0 0.0 18.4 0.0 0.06:0 0.0 4.2 4.1 0.28:0 0.0 2.2 2.3 0.110:0 4.1 3.9 3.8 1.412:0 8.3 3.5 4.8 3.514:0 19.2 18.8 11.9 13.616:0 35.7 20.4 21.9 43.718:0 11.5 9.4 7.5 12.218:1 21.0 19.3 9.0 16.0aAfter Willis and Marangoni (48). For abbreviation see Table 3.

at both temperatures. The reflections nearest the center ofeach image represent the long spacings, whereas the outer tworeflection rings are the short spacings. The XRD patterns in-dicate that the absence of minor components and presence ofonly milk fat diacylglycerols did not alter the formation ofmilk fat’s typical β′-2 polymorphic form. In Figure 11 τSFCand τturbidity are plotted as a function of temperature. This typeof plot indicates whether different polymorphic forms arepresent in the temperature range studied. A continuous curveindicates that at all temperatures the same crystal polymorphis formed, while a discontinuous curve indicates the existenceof different polymorphs (31,44,48). The discontinuity of thecurves in Figure 11 suggests that AMF, the MF-TAG, and the
MF-DAG may crystallize in a different polymorphic formabove and below 20.0°C. The discontinuity is especially ob-vious in the plot with induction times by SFC (indicated byarrow in Fig. 11B). This evidence supports the hypothesis thatdifferent crystallization modes above and below 20.0°C, asindicated by the Avrami parameters (Fig. 5), are related toformation of the α-crystal below this temperature (43). Theclear point of the α-crystal is approximately 20°C (43).Below 20°C, α-crystals form more readily, and thereforethere is an increased number of nuclei present. Above 20°C,however, there are fewer nuclei formed and crystal growthpredominates. The isothermal DSC crystallization and melt-ing curves for AMF, MF-TAG, and MF-DAG are shown in
472 A.J. WRIGHT ET AL.
JAOCS, Vol. 77, no. 5 (2000)
FIG. 6. Increase in absorbance measured at 500 nm with time during crystallization of AMF (▲▲), MF-TAG (■■ ), and MF-DAG (●● ) at 15.0 (A), 20.0(B), 22.5 (C), 25.0 (D), and 27.5°C (E). Symbols represent the average ± standard error of three replicates. For abbreviations see Figure 2.

Figure 12. No differences are observed between the threesamples. Consistently the onset crystallization temperaturewas roughly 18°C, and the peak melting temperature wasaround 20°C.
ACKNOWLEDGMENTS
The authors acknowledge the financial assistance of the Natural Sci-ences and Engineering Research Council of Canada (NSERC), Dr.Michael Jennings of the University of Western Ontario for his assis-tance with the XRD analysis, and Frank Mena of the University ofGuelph for his assistance with the GC–MS analysis.
REFERENCES
1. King, N., The Effect of Some Surface Active Substances on thePhysical Forms of Milk Fat, Proceedings of the 17th Interna-tional Dairy Congress, Munich, 1966, C:2, pp. 289–294.
2. Morrison, W.R., Surface-Active Lipids in Milk and Milk Prod-
ucts, in Surface-Active Lipids in Foods, S.C.I. Monograph No.32, Society of Chemical Industry, London, 1968, pp. 75–91.
3. Kapsalis, J.G., J.J. Betscher, T. Kristoffersen, and I.A. Gould,Effect of Chemical Additives on the Spreading Quality of But-ter. I. The Consistency of Butter as Determined by Mechanicaland Consumer Panel Evaluation Methods, J. Dairy Sci. 43:1560–1564 (1960).
4. Kapsalis, J.G., T. Kristoffersen, I.A. Gould and J.J. Betscher,Effect of Chemical Additives on the Spreading Quality of But-ter. II. Laboratory and Plant Churnings, Ibid. 46:107–113(1963).
5. DuRoss, J.W., and W.H. Knightly, Relationship of SorbitanMonostearate and Polysorbate 60 to Bloom Resistance in Prop-erly Tempered Chocolate, Manuf. Confect. July:50–56 (1965).
6. van den Tempel, M., Effects of Emulsifiers on the Crystalliza-tion of Triglycerides, in Surface-Active Lipids in Foods, S.C.I.Monograph No. 32, Society of Chemical Industry, London,1968, pp. 22–33.
7. Aronhime, J., S. Sarig, and N. Garti, Emulsifiers as Additives inFats: Effect on Polymorphic Transformations and Crystal Prop-erties of Fatty Acids and Triglycerides, Food Structure 9:337–352 (1990).
8. Hernqvist, L., and K. Anjou, Diglycerides as a Stabilizer of theBeta Prime Crystal Form in Margarines and Fats, Fette SeifenAnstrichm. 85(2):64–66 (1983).
9. Loncin, M., Influence des glycerides partiels sur la plasticite desmatières grasses, Oleagineux 13:33–37 (1958).
10. Siew, W.L., and W.L. Ng, Effect of Diglycerides on the Crys-tallisation of Palm Oleins, J. Sci. Food Agric. 71:496–500(1996).
11. Gordon, M.H., and I.A. Rahman, Effects of Minor Componentson the Crystallization of Coconut Oil, J. Am. Oil Chem. Soc. 68:577–579 (1991).
12. Cebula, D., and K. Smith, Differential Scanning Calorimetry ofConfectionary Fats: Part II. Effects of Blends and Minor Com-ponents, J. Am. Oil Chem. Soc. 69:992–998 (1992).
MINOR COMPONENTS AND MILK FAT CRYSTALLIZATION 473
JAOCS, Vol. 77, no. 5 (2000)
FIG. 7. Induction time by turbidity (τturbidity) vs. induction time by SFC(τSFC) for AMF (▲▲), MF-TAG (■■ ), and MF-DAG (●● ) crystallized at 5.0,10.0, 15.0, 20.0, 22.5, 25.0, and 27.5°C. For abbreviations see Figure 2.
FIG. 8. Solid fat content (%) vs. time during static crystallization of AMF(▲▲), MF-TAG (■■ ), and MF-DAG (●● ), and MF-TAG with 0.1% dipalmitin(◆◆ ) at 22.5°C. Symbols represent the average ± standard error of threereplicates. For abbreviations see Figure 2.
FIG. 9. Polarized light micrographs of AMF, MF-TAG, and MF-DAG (●● )crystallized at 5.0 and 25.0°C. (A) AMF crystallized at 5.0%C; (B) AMFcrystallized at 25.0°C; (C) MF-TAG crystallized at 5.0°C; (D) MF-TAGcrystallized at 25.0°C; (E) MF-DAG crystallized at 5.0°C; (F) MF-DAGcrystallized at 25.0°C. For abbreviations see Figure 2.

13. Davis, T.R., and P.S. Dimick, Isolation and Thermal Characteri-zation of High-Melting Seed Crystals Formed During CocoaButter Solidification, Ibid. 66:1488–1493 (1989).
14. Davis, T.R., and P.S. Dimick, Lipid Composition of High-Melt-
ing Seed Crystals Formed During Cocoa Butter Solidification,Ibid. 66:1494–1498 (1989).
15. Niiya, I., T. Maruyama, M. Imamura, M. Okada, and T. Mat-sumoto. Effect of Emulsifiers on the Crystal Growth of EdibleSolid Fats. Part III. Effect of Saturated Fatty Acid Monoglyc-eride, Jpn. J. Food Sci. Technol. 20:182–189 (1973).
16. Niiya, I., T. Maruyama, M. Imamura, M. Okada, and T. Mat-sumoto, Effect of Emulsifiers on the Crystal Growth of EdibleSolid Fats. Part IV. Effect of Propylene Glycol Ester of FattyAcid and Unsaturated Fatty Acid Monoglycerides, Ibid. 20:191–198 (1973).
17. Reddy, S.Y., Effect of Diglycerides on the Solidification Prop-erties of Sal (Shorea robusta) Fat, Fat Sci. Technol. 10: 394–397(1987).
18. Riiner, U., The Effect of Hydrolysis on the Solidification ofFats. Lebensm. Wiss. Technol. 4(3):76–80 (1971).
19. Gerson, T., and W.L. Escher, The Effect of Monoglycerides onthe Spreadability of Butter, N.Z.J. Sci. 9:528–533 (1966).
20. Carroll, K.K., Separation of Lipid Classes by Chromatographyon Florisil, J. Lipid Res. 2:135–141 (1961).
21. Christie, W.W., Lipid Analysis; Isolation, Separation, Identifi-cation, and Structural Analysis of Lipids, 2nd edn., PergamonPress, London, 1988, pp. 93–96, 115–119.
22. Bannon, C.D., J.D. Craske, and A.E. Hilliker, Analysis of FattyAcid Methyl Esters with High Accuracy and Reliability. IV.
474 A.J. WRIGHT ET AL.
JAOCS, Vol. 77, no. 5 (2000)
FIG. 10. Powder X-ray diffraction patterns of (A) AMF, (B) MF-TAG, and(C) MF-DAG at 5.0°C. For abbreviations see Figure 2.
FIG. 11. Plot of log (τturbidity) vs. crystallization temperature (A) and log(τSFC) vs. crystallization temperature (B). The discontinuity of the curvessuggests the formation of different polymorphic forms upon crystalliza-tion above and below 20.0°C. AMF (▲▲); MF-TAG (■■ ); MF-DAG (●● ).For abbreviations see Figure 2.

Fats with Fatty Acids Containing Four or More Carbon Atoms,J. Am. Oil Chem. Soc. 62:1501–1507 (1985).
23. Rousseau, D., K. Forestiere, A.R. Hill, and A.G. Marangoni, Re-structuring Butterfat Through Blending and Chemical Interester-ification. 1. Melting Behavior and Triacylglycerol Modifica-tions, Ibid. 73:963–972 (1996).
24. Official Methods and Recommended Practices of the AmericanOil Chemists’ Society, 4th edn., AOCS Press, Champaign, 1993.
25. Marangoni, A.G., On the Use and Misuse of the Avrami Equa-tion in Characterization of the Kinetics of Fat Crystallization,Ibid. 75:1465–1467 (1998).
26. Avrami, M., Kinetics of Phase Change I. General Theory, J.Chem. Phys. 7:1103–1112 (1939).
27. Avrami, M., Kinetics of Phase Change II. Transformation-TimeRelations for Random Distribution of Nuclei, Ibid. 8:212–224(1940).
28. Avrami, M., Kinetics of Phase Change III. Granulation, PhaseChange, and Microstructure, Ibid. 9:177–184 (1941).
29. Ziegleder, G., DSC Thermal Analysis and Kinetics of CocoaButter Crystallization, Fat Sci. Technol. 92:481–485 (1990).
30. Herrera, M.L., C. Falabella, M. Melgarejo, and M.C. Añon,Isothermal Crystallization of Hydrogenated Sunflower Oil: II.Growth and Solid Fat Content, J. Am. Oil Chem. Soc. 76:1–6(1998).
31. Dibildox-Alvarado, E., and J. Toro-Vazquez, Isothermal Crys-tallization of Tripalmitin in Sesame Oil, Ibid. 74:69–76 (1997).
32. Metin, S., and R.W. Hartel, Thermal Analysis of IsothermalCrystallization Kinetics in Blends of Cocoa Butter with Milk Fator Milk Fat Fractions, Ibid. 75:1617– 1624 (1998).
33. Kawamura, K., The DSC Thermal Analysis of CrystallizationBehavior in Palm Oil, Ibid. 56:753–758 (1979).
34. Christian, J.W., The Theory of Transformations in Metals andAlloys; An Advanced Textbook in Physical Metallurgy, Per-magon Press, Oxford, London, 1965, pp. 16–22, 471–495.
35. Henderson, D.W., Thermal Analysis of Non-Isothermal Crys-tallization Kinetics in Glass Forming Liquids, J. Non-Crys-talline Solids 30:301–315 (1979).
36. Graydon, J.W., S.J. Thorpe, and D.W. Kirk, Determination ofthe Avrami Exponent for Solid State Transformations fromNon-Isothermal Differential Scanning Calorimetry, Ibid. 175:31–43 (1994).
37. Sharples, A., Overall Kinetics of Crystallization, in Introductionto Polymer Crystallization, edited by A. Sharples, EdwardArnold Ltd., London, 1966, pp. 44–59.
38. Strickland-Constable, R.F., Nucleation of Solids, in Kineticsand Mechanism of Crystallization, Academic Press, London,1968, pp. 74–129.
39. Herrera, M.L., M. De Leon Gatti, and R.W. Hartel, A KineticAnalysis of Crystallization of a Milk Fat Model System, FoodRes. Int. 32:289–298 (1999).
40. Marangoni, A.G., and R.W. Hartel, Visualization and StructuralAnalysis of Fat Crystal Networks, J. Food Technol. 5:46–51(1998).
41. Bitman, J., and D.L. Wood, Changes in Milk PhospholipidsDuring Lactation, J. Dairy Sci. 73:1208–1216 (1990).
42. National Dairy Council (NDC), Newer Knowledge of Milk andOther Fluid Dairy Products, NDC, Rosemont (1993).
43. van Grotenhuis, E., G.A. van Aken, K.F. van Malssen, and H.Schenk, Polymorphism of Milk Fat Studied by DifferentialScanning Calorimetry and Real-Time X-ray Powder Diffraction,J. Am. Oil Chem. Soc. 76:1031–1039 (1999).
44. Ng, W.L., A Study of the Kinetics of Nucleation in a Palm OilMelt, Ibid. 67:879–881 (1990).
45. Wang, F.S., and C.W. Lin, Turbidimetry for Crystalline Frac-tionation of Lard, Ibid. 72:585–589 (1995).
46. Grall, D.S., and R.W. Hartel, Kinetics of Butterfat Crystalliza-tion, Ibid. 69:741–747 (1992).
47. Sato, K., Crystallization Phenomena in Fats and Lipids, J. Dis-persion Sci. Technol. 10:363–392 (1989).
48. Willis, W.M., and A.G. Marangoni, Assessment of Lipase- andChemically Catalyzed Lipid Modification Strategies for the Pro-duction of Structured Lipids, J. Am. Oil Chem. Soc. 76:443–450(1999).
49. Herrera, M.L., C. Falabella, M. Melgarejo, and M.C. Añon,Isothermal Crystallization of Hydrogenated Sunflower Oil: I—Nucleation, Ibid. 75:1273–1280 (1998).
[Received September 21, 1999; accepted February 6, 2000]
MINOR COMPONENTS AND MILK FAT CRYSTALLIZATION 475
JAOCS, Vol. 77, no. 5 (2000)
FIG. 12. Differential scanning calorimetric curves of AMF, MF-TAG,and MF-DAG in the crystallization (A) and melting (B) modes at 5.0°C/min. For abbreviations see Figure 2.