the effect of leaving home on the diet and nutritional status of ...
234
Diet in transition: the effect of leaving home on the diet and nutritional status of young adults Lucy Beasley Liverpool John Moores University PhD 2005
-
Upload
khangminh22 -
Category
Documents
-
view
2 -
download
0
Transcript of the effect of leaving home on the diet and nutritional status of ...
Diet in transition: the effect of leaving home on the diet and nutritional status of young adults
Lucy Beasley
Liverpool John Moores University
PhD
2005

PUBLISHED PAPERS NOT COPIED
AT THE REQUEST OF THE UNIVERSITY

Acknowledgements
I would like to thank everyone who volunteered to take part in this project, including
" Residents and staff at Belvedere homeless hostel in Runcorn, Stopover
House in Liverpool and the YMCA hostel in Leicester.
" Students at Liverpool John Moores University, Liverpool University and Liverpool Hope University.
" All of the volunteers who set the `snowball' recruitment technique in motion. I would like to thank my supervisors, Allan Hackett and Peggy Maxwell, for their
advice, encouragement and support. Thanks to my sister, Emma, for finding the time and patience to proof read this thesis.
i

Contents
1.0 INTRODUCTION 1
1.1 Diet throughout the lifecycle 2
1.1.1 Foetal and infancy 3
1.1.2 Childhood 4
1.1.2.1 Childhood obesity 6
1.1.3 Adolescence 7
1.1.4 Adulthood 8
1.1.5 Older adults 9
1.2 Diet in transition 10
1.2.1 Starting school 10
1.2.2 Leaving home 11
1.2.3 Starting employment 12
1.2.4 Co-habiting/starting a family 13
1.3 National data for young people's dietary habits and health behaviour 15
1.3.1 The National Food Survey 15
1.3.2 National Diet and Nutrition Survey 15
1.3.3 The Health Survey for England 17
1.3.3.1 Smoking 18
1.3.3.2 Alcohol consumption 18
1.3.4 International surveys 19
1.4 Food Choice 21
1 .6 Policy 24
1.5.1 Choosing Health? White Paper 24
1.5.2 Food and Health Action Plan 24
1.5.3 World Health Organisation (WHO)
Health Policy for Children and Adolescents 25
1.6 Diet and lifestyle of students 27
1.7 Diet and lifestyle of homeless young people 33
1.8 Dietary habits and lifecycle transitions 37
1.9 Aims and objectives 39
11
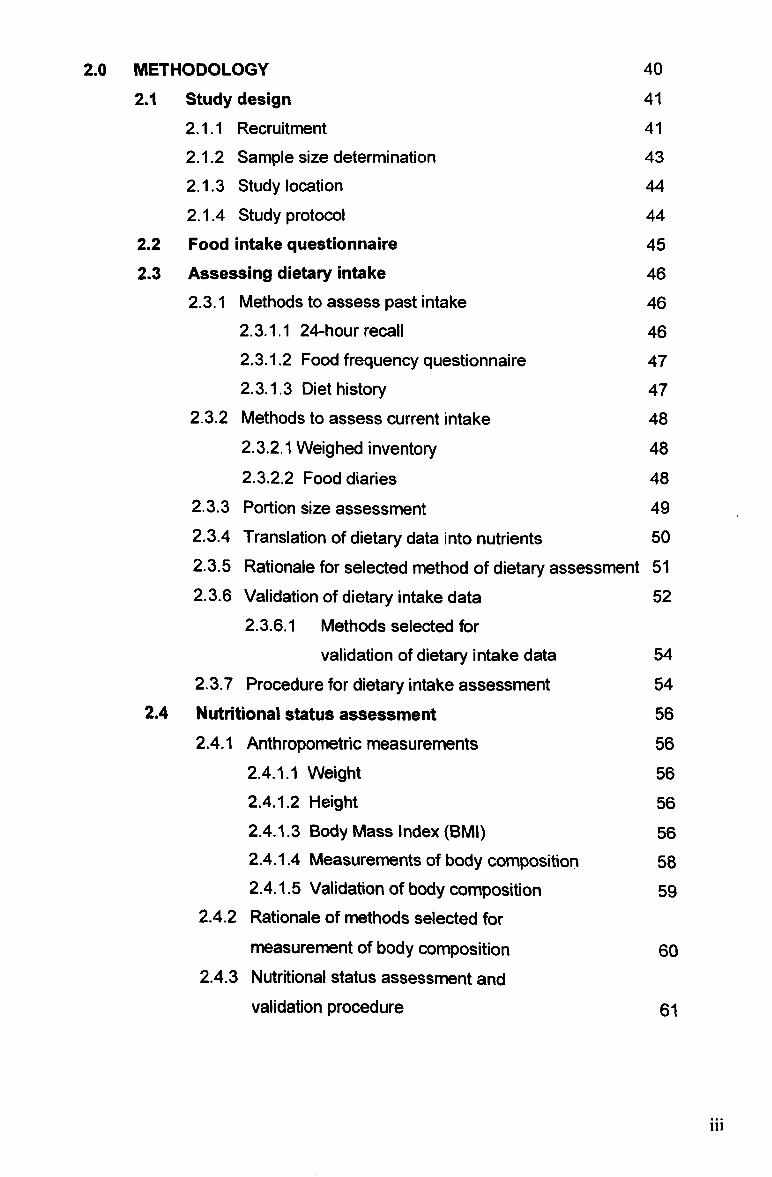
2.0 METHODOLOGY 40
2.1 Study design 41
2.1.1 Recruitment 41
2.1.2 Sample size determination 43
2.1.3 Study location 44
2.1.4 Study protocol 44
2.2 Food intake questionnaire 45 2.3 Assessing dietary intake 46
2.3.1 Methods to assess past intake 46 2.3.1.1 24-hour recall 46 2.3.1.2 Food frequency questionnaire 47 2.3.1.3 Diet history 47
2.3.2 Methods to assess current intake 48 2.3.2.1 Weighed inventory 48
2.3-2.2 Food diaries 48 2.3.3 Portion size assessment 49 2.3.4 Translation of dietary data into nutrients 50 2.3.5 Rationale for selected method of dietary assessment 51 2.3.6 Validation of dietary intake data 52
2.3.6.1 Methods selected for
validation of dietary intake data 54
2.3.7 Procedure for dietary intake assessment 54 2.4 Nutritional status assessment 56
2.4.1 Anthropometric measurements 56
2.4.1.1 Weight 56
2.4.1.2 Height 56 2.4.1.3 Body Mass Index (BMI) 56 2.4.1.4 Measurements of body composition 58 2.4.1.5 Validation of body composition 59
2.4.2 Rationale of methods selected for
measurement of body composition 60 2.4.3 Nutritional status assessment and
validation procedure 61
iii

2.5 Blood Pressure
2.5.1 Methods selected for blood pressure assessment 2.5.2 Blood pressure measurement procedure
2.6 Cholesterol
2.6.1 Methods selected for total blood
cholesterol measurement 2.7 Haemoglobin
2.7.1 Methods selected for haemoglobin measurement 2.8 Blood sampling procedure for total
cholesterol and haemoglobin measurement 2.9 Statistical analysis 2.10 Stages of data collection
3.0 RESULTS
3.1 Health behaviour and food intake questionnaire 3.1.1 Introduction
3.1.2 Methods
3.1.3 Results 3.1.3.1 Questionnaire: Part 1- Health and Lifestyle
3.1.3.2 Questionnaire: Part 2- Food Intake
3.1.4 Discussion 3.2 Changes to student's dietary habits after leaving home
3.2.1 Introduction
3.2.2 Methods
3.2.3 Results
3.2.3.1 Nutritional status 3.2.3.2 Diet
3.2.4 Discussion 3.3 Dietary habits and nutritional status of
residents of young people's homeless hostels
3.3.1 Introduction
3.3.2 Methods
3.3.3 Results
3.3.3.1 Nutritional status 3.3.3.2 Diet
3.3.4 Discussion
63
63
63
65
65
67
67
68
69
69
70
71
71
71
73
74
75
79
85
85
85
86
86
89
97
104
104
104
105 106
107
112 iv
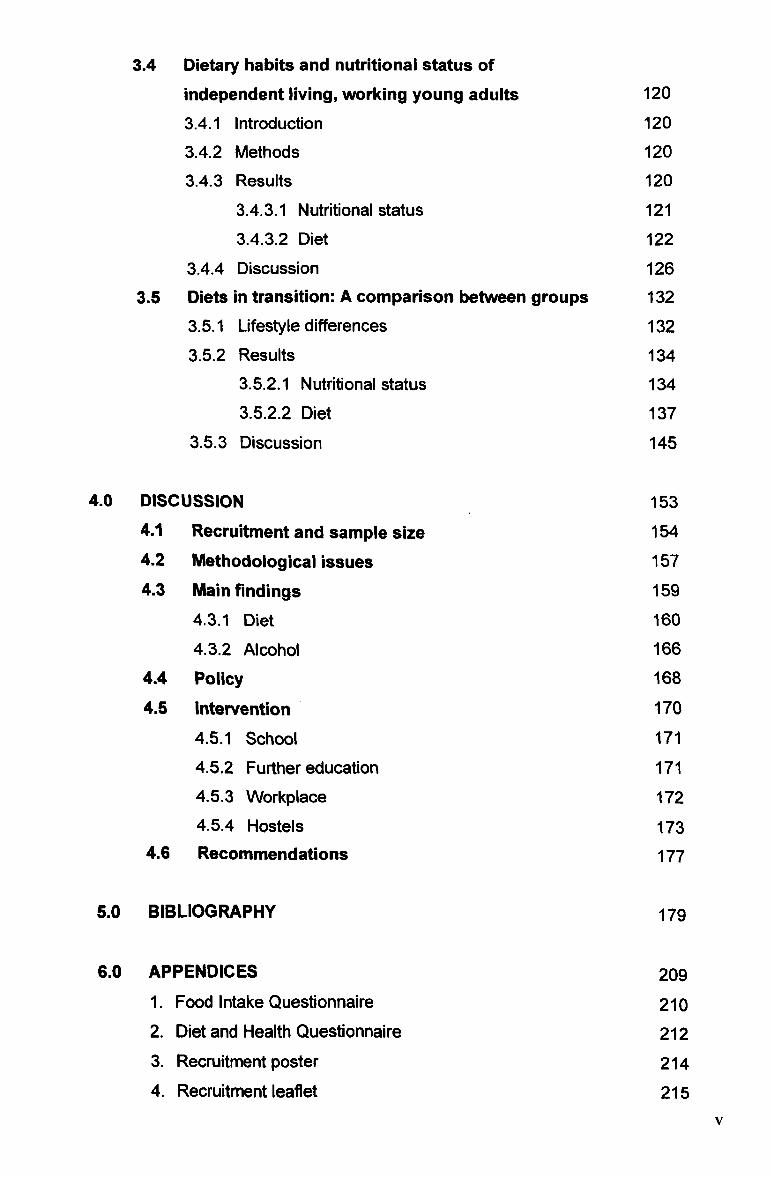
3.4 Dietary habits and nutritional status of independent living, working young adults 120
3.4.1 Introduction 120
3.4.2 Methods 120
3.4.3 Results 120
3.4.3.1 Nutritional status 121
3.4.3.2 Diet 122
3.4.4 Discussion 126 3.5 Diets in transition: A comparison between groups 132
3.5.1 Lifestyle differences 132
3.5.2 Results 134 3.5.2.1 Nutritional status 134 3.5.2.2 Diet 137
3.5.3 Discussion 145
4.0 DISCUSSION 153 4.1 Recruitment and sample size 154 4.2 Methodological issues 157 4.3 Main findings 159
4.3.1 Diet i6o
4.3.2 Alcohol 166 4.4 Policy 168
4.6 Intervention 170
4.5.1 School 171
4.5.2 Further education 171
4.5.3 Workplace 172
4.5.4 Hostels 173 4.6 Recommendations 177
5.0 BIBLIOGRAPHY 179
6.0 AP PENDICES 209 1. Food Intake Questionnaire 210 2. Diet and Health Questionnaire 212 3. Recruitment poster 214 4. Recruitment leaflet 215
V
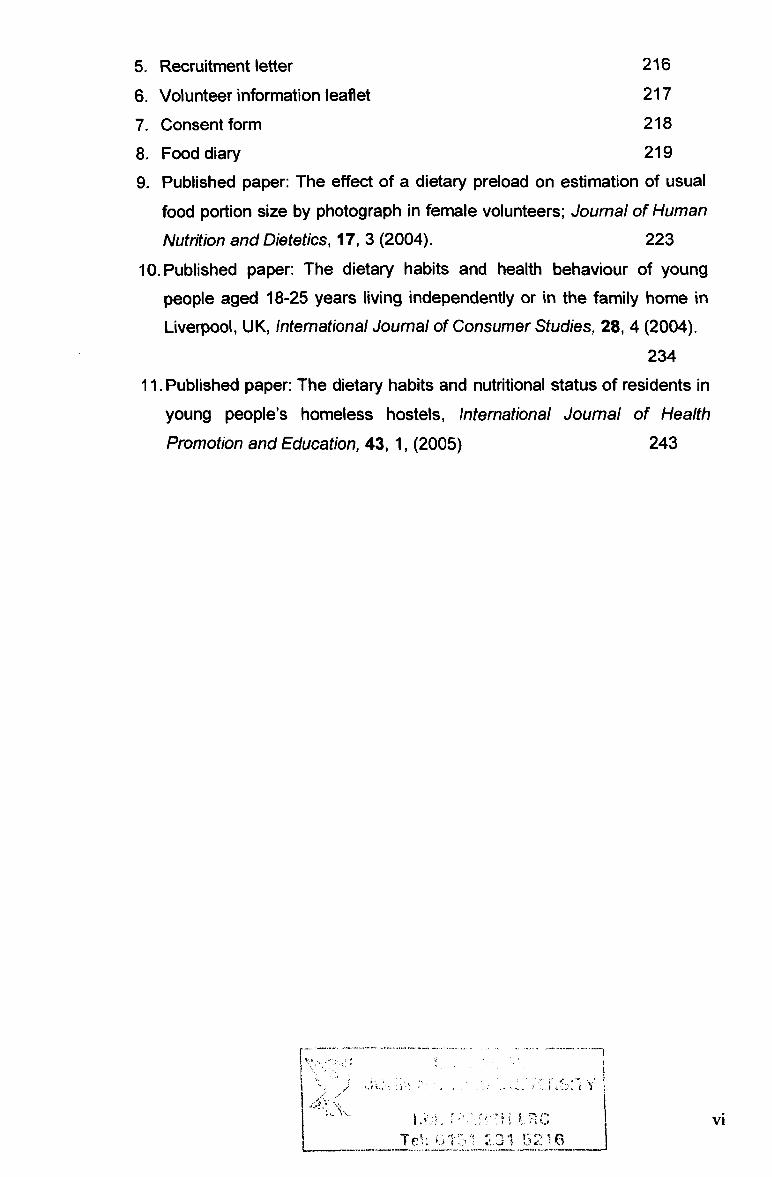
5. Recruitment letter 216
6. Volunteer information leaflet 217
7. Consent form 218
8. Food diary 219
9. Published paper: The effect of a dietary preload on estimation of usual food portion size by photograph in female volunteers; Journal of Human
Nutrition and Dietetics, 17,3 (2004). 223
10. Published paper: The dietary habits and health behaviour of young
people aged 18-25 years living independently or in the family home in
Liverpool, UK, International Journal of Consumer Studies, 28,4 (2004).
234
11. Published paper: The dietary habits and nutritional status of residents in
young people's homeless hostels, International Journal of Health
Promotion and Education, 43,1, (2005) 243
,ý
-xv
Mp! q
'I r
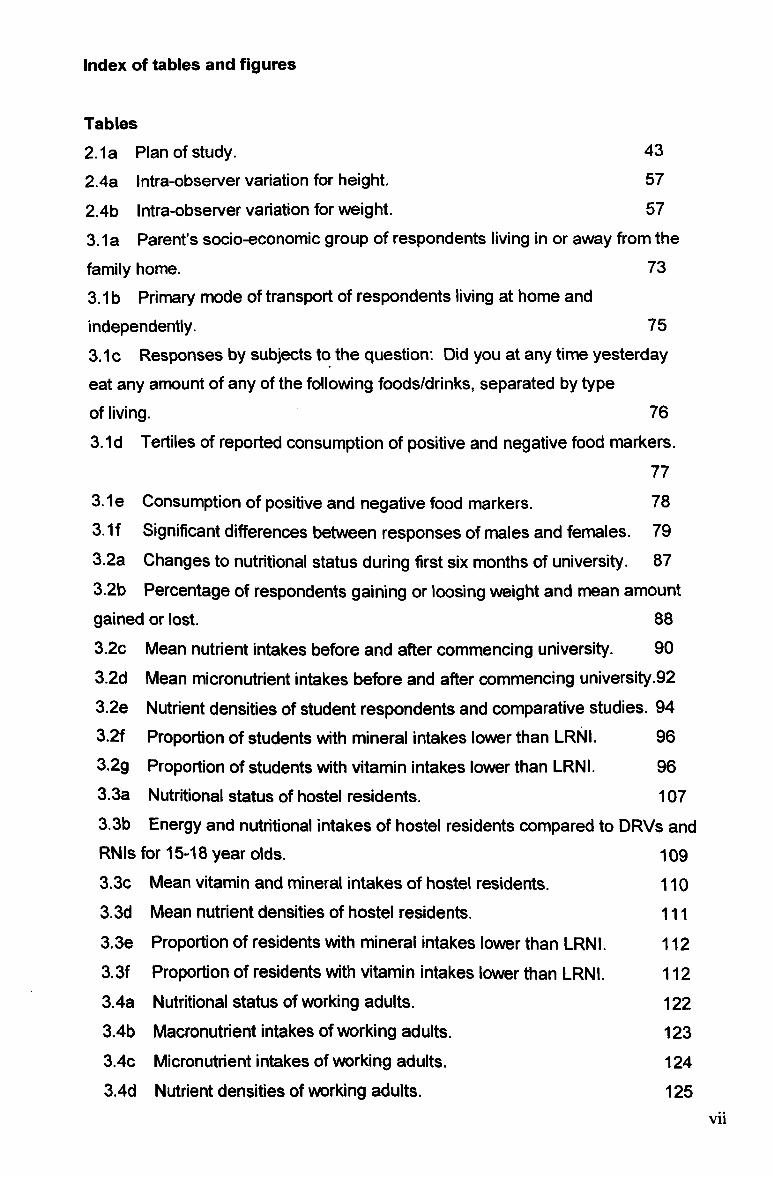
Index of tables and figures
Tables 2.1 a Plan of study. 43
2.4a Intra-observer variation for height. 57
2.4b Intra-observer variation for weight. 57
3.1a Parent's socio-economic group of respondents living in or away from the
family home. 73
3.1 b Primary mode of transport of respondents living at home and independently. 75
3.1 c Responses by subjects to the question: Did you at any time yesterday
eat any amount of any of the following foods/drinks, separated by type
of living. 76
3.1d Tertiles of reported consumption of positive and negative food markers. 77
3.1 e Consumption of positive and negative food markers. 78 3.1f Significant differences between responses of males and females. 79 3.2a Changes to nutritional status during first six months of university. 87
3.2b Percentage of respondents gaining or loosing weight and mean amount gained or lost. 88
3.2c Mean nutrient intakes before and after commencing university. 90
3.2d Mean micronutrient intakes before and after commencing university -92 3.2e Nutrient densities of student respondents and comparative studies. 94 3.2f Proportion of students with mineral intakes lower than LRNI. 96
3.2g Proportion of students with vitamin intakes lower than LRNI. 96 3.3a Nutritional status of hostel residents. 107 3.3b Energy and nutritional intakes of hostel residents compared to DRVs and RNIs for 15-18 year olds. 109 3.3c Mean vitamin and mineral intakes of hostel residents. 110 3.3d Mean nutrient densities of hostel residents. 111
3.3e Proportion of residents with mineral intakes lower than LRNI. 112 3.3f Proportion of residents with vitamin intakes lower than LRNI. 112
3.4a Nutritional status of working adults. 122 3.4b Macronutrient intakes of working adults. 123 3.4c Micronutrient intakes of working adults. 124 3.4d Nutrient densities of working adults. 125
vii
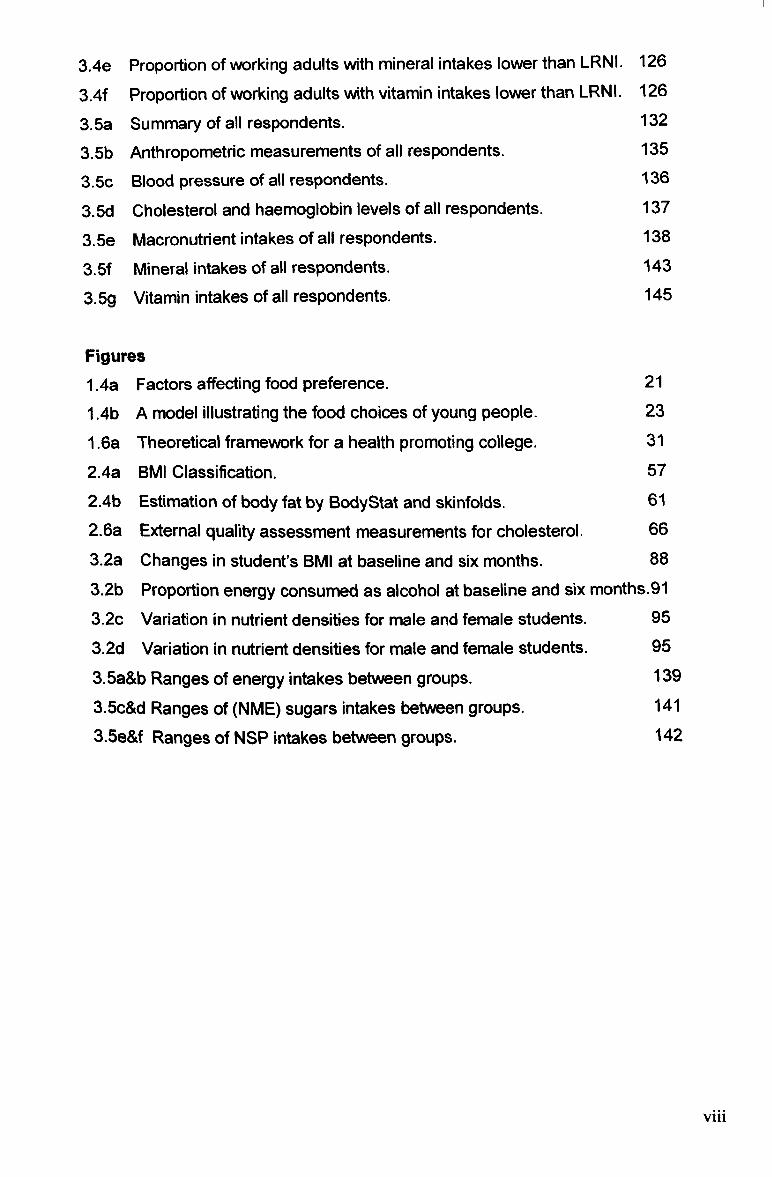
3.4e Proportion of working adults with mineral intakes lower than LRNI. 126
3.4f Proportion of working adults with vitamin intakes lower than LRNI. 126
3.5a Summary of all respondents. 132
3.5b Anthropometric measurements of all respondents. 135
3.5c Blood pressure of all respondents. 136
3.5d Cholesterol and haemoglobin levels of all respondents. 137
3.5e Macronutrient intakes of all respondents. 138
3.5f Mineral intakes of all respondents. 143
3.5g Vitamin intakes of all respondents. 145
Figures
1.4a Factors affecting food preference. 21
1.4b A model illustrating the food choices of young people. 23
1.6a Theoretical framework for a health promoting college. 31
2.4a BMI Classification. 57
2.4b Estimation of body fat by BodyStat and skinfolds. 61
2.6a External quality assessment measurements for cholesterol. 66
3.2a Changes in student's BMI at baseline and six months. 88
3.2b Proportion energy consumed as alcohol at baseline and six months. 91
3.2c Variation in nutrient densities for male and female students. 95
3.2d Variation in nutrient densities for male and female students. 95
3.5a&b Ranges of energy intakes between groups. 139
3.5c&d Ranges of (NME) sugars intakes between groups. 141
3.5e&f Ranges of NSP intakes between groups. 142
viii
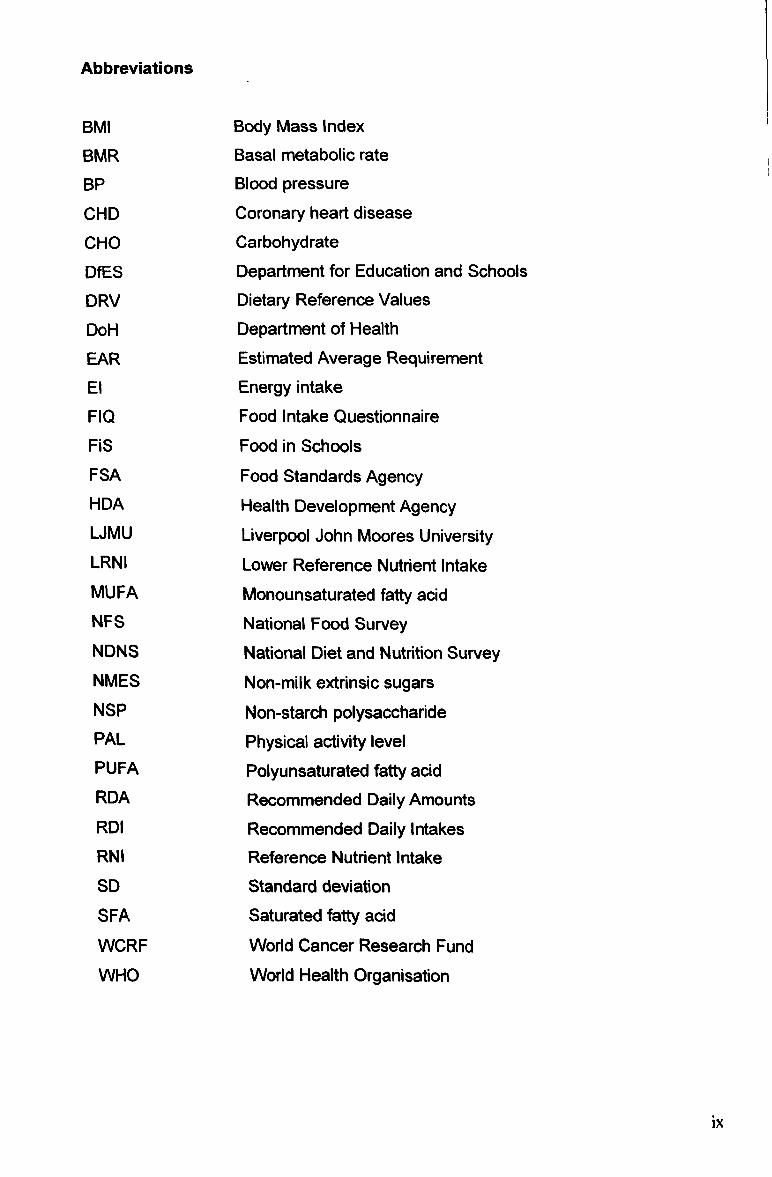
Abbreviations
BMI Body Mass Index
BMR Basal metabolic rate BP Blood pressure
CHD Coronary heart disease
CHO Carbohydrate
DfES Department for Education and Schools
DRV Dietary Reference Values
DoH Department of Health
EAR Estimated Average Requirement
El Energy intake
FIQ Food Intake Questionnaire
FiS Food in Schools
FSA Food Standards Agency HDA Health Development Agency LJMU Liverpool John Moores University LRNI Lower Reference Nutrient Intake MUFA Monounsaturated fatty acid NFS National Food Survey NDNS National Diet and Nutrition Survey NMES Non-milk extrinsic sugars NSP Non-starch polysaccharide PAL Physical activity level PUFA Polyunsaturated fatty acid RDA Recommended Daily Amounts RDI Recommended Daily Intakes RNI Reference Nutrient Intake SD Standard deviation
SFA Saturated fatty acid WCRF World Cancer Research Fund
WHO World Health Organisation
1X
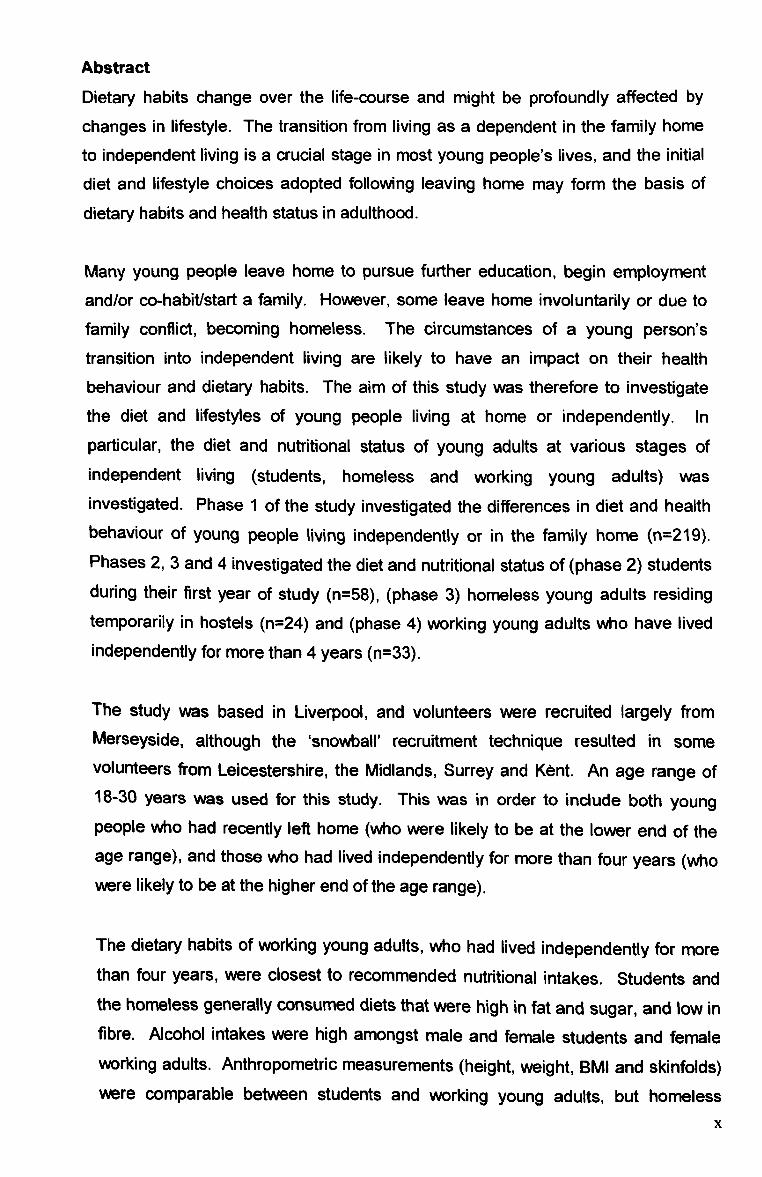
Abstract
Dietary habits change over the life-course and might be profoundly affected by
changes in lifestyle. The transition from living as a dependent in the family home
to independent living is a crucial stage in most young people's lives, and the initial
diet and lifestyle choices adopted following leaving home may form the basis of
dietary habits and health status in adulthood.
Many young people leave home to pursue further education, begin employment
and/or co-habit/start a family. However, some leave home involuntarily or due to family conflict, becoming homeless. The circumstances of a young person's transition into independent living are likely to have an impact on their health
behaviour and dietary habits. The aim of this study was therefore to investigate
the diet and lifestyles of young people living at home or independently. In
particular, the diet and nutritional status of young adults at various stages of independent living (students, homeless and working young adults) was investigated. Phase 1 of the study investigated the differences in diet and health behaviour of young people living independently or in the family home (n=219). Phases 2,3 and 4 investigated the diet and nutritional status of (phase 2) students during their first year of study (n=58), (phase 3) homeless young adults residing temporarily in hostels (n=24) and (phase 4) working young adults who have lived independently for more than 4 years (n=33).
The study was based in Liverpool, and volunteers were recruited largely from Merseyside, although the `snowball' recruitment technique resulted in some volunteers from Leicestershire, the Midlands, Surrey and Kent. An age range of 18-30 years was used for this study. This was in order to include both young people who had recently left home (who were likely to be at the lower end of the age range), and those who had lived independently for more than four years (who were likely to be at the higher end of the age range).
The dietary habits of working young adults, who had lived independently for more than four years, were closest to recommended nutritional intakes. Students and the homeless generally consumed diets that were high in fat and sugar, and low in fibre. Alcohol intakes were high amongst male and female students and female
working adults. Anthropometric measurements (height, weight, BMI and skinfolds) were comparable between students and working young adults, but homeless
X

1.0 INTRODUCTION
1.1 Diet throughout the lifecycle
Food plays an important role in health throughout the lifecycle, starting in the
foetus where specific amounts of nutrients are required to ensure optimal growth
and development; throughout childhood and adolescence when maximum growth is achieved; and into adulthood when weight maintenance and a balanced diet are
required to maintain a healthy nutritional status (Davey-Smith 2000).
Dietary habits are largely determined during childhood, but are likely to be
influenced by changes throughout the lifecycle (Backett and Davison 1995).
Certain stages of the lifecycle are characterised by particular lifestyle changes,
which may have a temporary or long-term effect on dietary habits (Shetty 2002).
The main stages of the lifecycle in terms of nutritional needs may be defined as foetal and maternal, infancy, childhood, adolescence, adulthood and elderly. The
main life events that may affect dietary habits during these stages are: beginning
nursery/primary school, moving to secondary school, leaving home (which may also result in changes to parents' dietary habits), starting a job, co-habitation, having children, retirement, divorce/widowhood and loss of independence/moving to residential care home (Bartley et al 1997).
Leaving home is likely to be the first time that young people are solely responsible for their food choices and for cooking for themselves. In the absence of parental influence on dietary habits and the freedom to develop independence, dietary habits may change somewhat. The Health Development Agency reports that the earlier the transition into independent living is made, the worse health is in adulthood (Graham and Power 2004). Young people from low-income groups tend to move away from the family home to co-habit and start a family at an earlier age than mid-higher income groups, who are more likely to postpone a permanent transition to independence by entering further education (Graham and Power 2004).
Leaving home can potentially have either a positive or negative influence on dietary habits depending on the circumstances behind the young person's transition to independence (Graham and Power 2004). Changes to dietary habits at this point of the lifecycle may become established into adulthood, or may continue to fluctuate according to different lifestyles.
2
1.1.1 Foetal and infancy
Studies in humans and animals have identified a relationship between foetal
nutrition and adult disease. The term nutritional or foetal 'programming' is used to
describe the process whereby a stimulus in-utero results in a permanent response in the foetus, leading to an increased susceptibility to developing disease in
adulthood (Armitage et al 2005). Pre- or post-natal nutritional programming has
been associated with adult size, metabolism, blood lipids, diabetes, blood
pressure, obesity, atherosclerosis, learning behaviour and life span (Lucas 1998).
An infant's initial exposure to food flavours may occur before birth, thereby
influencing later taste preferences, as evidence suggests that flavours from the
mothers diet may be transmitted to the baby via the amniotic fluid (Menn et al 1995). During infancy, food and nutritional intake have a vital role in physical
growth, the maturation of oral structures and functions, development of fine and
gross motor skills and the establishment of relationships with parents and family (Williams and Worthington-Roberts 1992). Feeding patterns undergo more changes during an infant's first year than any other time of life, as an infant develops from the suckling stage at birth to the ability to feed itself (Morgan 1998).
Following birth, the infant's nutritional requirements are met by feeding either
colostrum followed by mature breast milk, or formula milk. Breast milk produced by a mother who is consuming a nutritionally adequate diet provides adequate nutrition for the first 4-6 months of the infant's life, and can also protect against illness, infection and food allergy (FSA 2004). Evidence suggests that the type of feeding adopted during infancy may later influence a child's acceptance of different foods, as a breast-fed child may become accustomed to flavours from the mother's diet that are carried in the breast milk (Sullivan and Birch 1994). Bottle fed babies, however, are not exposed to such flavours and may therefore be more resistant to the acceptance of solid foods. Infants are gradually weaned off milk and introduced to other foods and drinks, so that by the age of two years a variety of foods from the adult diet are consumed by the infant in order to meet their
growing nutritional requirements.
3
1.1.2 Childhood
Following the transition from milk to solid foods, parents are often the primary
influence on their child's food choices at pre-school age, as they are responsible for the type of food offered and the context and social environment in which it is
consumed (Eertman et al 2001). Research suggests that consistently making
healthy food available and accessible in the home increases a child's preference for those foods (Hearn et al 1998). For these preferences to become an
established part of a child's dietary habits, it is necessary to familiarise the child
with these food choices through repeated exposure (i. e. by serving fruit and
vegetables at meal times and as snacks on a daily basis). Parents should also not
only make healthy foods available in the home but also be seen by their children to
be regularly consuming and enjoying these foods. This act of parental modelling
can encourage or discourage particular eating behaviours. Fisher et al (2001)
reported a relationship between frequency of milk consumption of 7-year old girls
and their mothers. The study found that the daughters of mothers who consumed
milk frequently and also made milk available to drink with meals or as snacks drank more milk than the daughters of mothers who consumed milk infrequently. Jansen and Tenney (2001) found that the most significant social modelling effects
were observed for high-energy foods. Children in the study (aged five years)
showed a preference for energy-rich, fatty and sugary food rather than food that
was low in energy that they observed being consumed by significant others.
There is a risk that parental influence on children's eating habits may prove to be
counter-productive in encouraging healthy dietary habits, particularly if rigid guidelines are enforced (Johnson and Birch 1994). The enforcement of rigid guidelines regarding types and quantities of food consumed may inhibit the child's ability to recognise their hunger and satiety levels and regulate their energy intake
accordingly (Birch et al 1987). Many parents use feeding strategies in order to encourage the consumption of 'good' foods and discourage 'bad' foods. Fifty-six
percent of parents reported promising their children a 'special' food if they finished
their dinner, 55% reported not allowing treat foods as a punishment and 48%
rewarded good behaviour with food (Stanek et al 1990). However, strategies such as these have been found to increase children's preference for the reward food
and decrease their acceptance of the food for which they are being rewarded for
eating (Fisher and Birch 1999). Forty percent of parents believed that restricting
4

access to specific foods should decrease their child's preference for these foods
(Casey and Rozin 1989). On the contrary, restricting access to unhealthy foods in
order to discourage consumption often has the opposite effect in that restriction
catches the attention of the child and consequently increases their preference for
the restricted food (Fisher and Birch 1999). This type of approach to healthy
eating also promotes the misconception that all foods are either good or bad as
opposed to teaching them that any food can be consumed in appropriate moderation.
The evolving pattern of family lifestyle is likely to affect the development of healthy dietary habits in children. The number of full-time working mothers is increasing,
and many now return to work before their child begins school, resulting in children
spending a large proportion of their day in childcare. Whilst parents may influence
the type of food consumed by their children whilst in childcare, the responsibility for feeding is largely with the carer. The evolution of family life has also resulted in
a loss of the family meal occasion in many households. Family interaction at mealtimes has been found to have a positive effect on the quality of children's diet (Neumark-Sztainer 2003). However, an increasing number of young children are now fed by a carer or older sibling (Hershey's 2002). Parents are more likely to consume their meal later, often after their children's bedtime. This type of lifestyle
provides scarce opportunity to set a positive example in order to promote healthy
eating practices in children. The removal of social interaction during mealtimes might have a considerable effect on diet.
In the absence of parents (and increasingly in the presence of parents) children are likely to eat meals whilst watching television. A study of school-aged children reported that during one week, 42% of children consumed dinner whilst watching television on a daily basis (Carteret al 2000). Television viewing during mealtimes not only impairs social interaction, but can also be a major influence on food choice. A comprehensive review of food promotion that targets children concluded that the advertised diet, which is substantially less healthy than the recommended diet, affects children's preferences, purchase behaviour and consumption patterns (FSA 2003). Television advertising of foods targeted at children is dominated largely by unhealthy high sugar, high fat products. Research indicates that in the short-term, even a short 30 second exposure to a food commercial results in a
5

child being twice as likely to indicate a preference for the advertised product than
children who had not viewed the commercial (Borzekowski and Robinson 2001).
In the long-term, repeated daily exposure to commercials only advertising
unhealthy foods is likely to have a detrimental effect on dietary habits.
1.1.2.1 Childhood obesity Childhood obesity has recently received extensive media attention following a
statement made by the Chief Medical Officer for England (DoH 2002) describing
childhood obesity as 'a health time-bomb'. Rates of overweight and obesity in
childhood remained fairly constant between the mid 1970's and 80's, but
increased dramatically between the mid-1980s and mid-1990s, from 5% - 9% of
boys being classed as overweight, and whilst a larger proportion of girls were
overweight in the mid-1980's, a similar rate of increase was observed as in the
boys (Chinn and Rona 2002). The Health Survey for England (Prescoft-Clarke
and Primatesta 1998) reported that in the past ten years, obesity has doubled to
8.5% in six year olds and trebled to 15% in fifteen year olds. Type 2-diabetes
(also known as maturity-onset diabetes, as it was previously only seen in middle-
aged/older adults) is now being diagnosed in obese school children.
These increasing rates reflect the changing dietary habits and lifestyles of
contemporary young people. The National Diet and Nutritional Survey: young
people aged 4-18 years (NDNS) (Gregory et al 2000) revealed that intakes of
saturated fat, non-milk extrinsic sugars and salt were high amongst this age group,
whilst fruit and vegetable consumption were less than half the recommended 5
portions a day. The increased consumption of fast food and snacks consumed
away from home, and the replacement of freshly prepared meals with ready-meals in the home are likely to be contributing factors, as well as the fact that children simply prefer foods high in fat and eat fewer foods thought to be beneficial to health (Hackett et al 1997). NDNS data also found only 60% of boys and 40% of
girls were meeting the Health Education Authority's recommendation of at least 1
hour per day of moderate physical activity. These dietary habits and physical
activity levels could be largely due to changes in lifestyles found in modern
society, including an increase in eating out, convenience foods and snacking and increased sedentary activities such as watching television and playing computer
games. The World Health Organisation (WHO) has defined this type of modern
6

environment as `obesogenic', stating that healthy food and living choices are becoming more difficult, particularly for young people who are identified as being
the most susceptible to the obesogenic environment (Chopra et al 2002).
1.1.3 Adolescence
An adequate diet during adolescence is vital for growth and development (Spear
2002) and for long-term health (Fisher et al 1995). As children approach
adolescence, their social environment is likely to determine their dietary habits to a
greater extent than their home environment (Feunekes et al 1998), which may cause dietary habits to deteriorate to a certain extent. Chapman and McClean
(1993) examined the meanings of food to a group of 16-18 year old females. The
consumption of healthy food was associated with parents and being at home,
whilst'junk food' was associated with enjoyment, friends, being away from home
and independence. Studies have demonstrated a generally adequate level of nutritional knowledge amongst adolescents (Young 1993, Frobisher and Maxwell 2001), although nutritional knowledge is often not reflected in their eating behaviour (Story and Resnick 1986). Adolescents also tend not to check nutritional labelling before purchasing/consuming a product (FSA 2003).
Some adolescents use their dietary practices as a way of rebelling against authority, family, culture or social norms; or to assert their independence (Chapman 1994). Others may change their eating habits in support of a specific belief/campaign. Vegetarianism is particularly common amongst adolescents, as this is a time when individuals are becoming more aware of ethical issues regarding meat consumption. A survey concerning the uptake of vegetarianism, commissioned by The Vegetarian Society in 1999 identified the 15-24 year old age group as one of the main areas of growth, with a predicted increase of 6.4% by 2003 (Realeat 1999). Vegetarianism experienced a dramatic growth as a direct response to media coverage of the BSE crisis, genetically modified foods and the use of antibiotics in meat, all of which created a feeling of mistrust in the meat industry by the consumer. Reasons for choosing to follow a meat-free diet at any age include moral (the abhorrence of killing animals for human consumption) or health reasons (vegetarians have lower BMI and less risk of developing coronary heart disease (CHD) or some cancers) (Mintel 2000). Any of these reasons may play a part in a teenager's decision to become vegetarian, but experimentation
7
with new practices and making independent choices about their lifestyle are
equally important at this age. Despite the assertion of independence involved in
becoming vegetarian, their meat-free diet is often purchased and prepared by a
parent. It is therefore possible that some young people revert back to an
omnivorous diet after leaving home when they are responsible for their own food
preparation.
The various factors influencing dietary habits during adolescence may lead to
positive changes to diet, but can also result in negative food behaviour.
Adolescents are frequently not concerned about the long-term consequences of their current dietary habits, such as the risk of developing diet-related chronic disease in adulthood (Bakker 1991). However, many demonstrate varying degrees of concern about their dietary habits with regard to immediate
consequences to body shape. These concerns may develop into an eating disorder in some individuals (Patton et al 1999).
Eating disorders are predominantly a cultural phenomenon of the modern world; a response to conflicting media messages and a need to fit in with peers. Food
promotions on television and in magazines (particularly those targeted at young people) that encourage consumers to purchase predominantly unhealthy foods
conflict with other media messages, which focus on encouraging the pursuit of the ideal body weight. At a time when the necessity to fit in with peers is generally at its peak, and many also experience a decline in self-regard and body image due to physical and hormonal changes of puberty, adolescents often find themselves in a subculture of dieting. Although diets do not directly cause eating disorders,
research indicates that young women who diet at a severe level are eighteen times more likely to develop an eating disorder, and those who diet at a moderate level are five times more likely to develop an eating disorder than those who do not diet (Patton et al 1999).
1.1.4 Adulthood
Adulthood is the most stable stage of the lifecycle in terms of nutritional requirements, which remain fairly constant for several decades, depending on levels of energy expenditure (with the exception of changes during pregnancy and lactation). However, many lifestyle changes occur during adulthood that may
8

influence dietary habits. These include changes to income, marital status (marriage/divorce/widowhood), living environment (leaving home, co-habitation), job (travel, shift work, retirement), and responsibilities (children leaving home,
elderly relatives moving in). Health perceptions and behaviours are also likely to
alter during the course of adulthood (Backett and Davison 1995). Many young,
single adults consider their body to be in peak condition and able to cope with a
certain level of toxins and physiological abuse, having left behind childhood
ailments and showing no symptoms of lifestyle related disease. However, as age
progresses and emotional, financial and time responsibilities change (having long- term partner, mortgage and children), concerns for personal and family health
often increase.
1.1.5 Older adults Nutritional requirements in older adults are similar to those of younger adults, except energy requirements are lower. However the presence of disease and subsequent medication use may affect individual nutritional requirements. Nutritional intake may also be affected by social or environmental factors such as retirement, bereavement, isolation and low-income. Impaired taste perception, reduced salivary flow, difficulty chewing food due to ill-fitting dentures and difficulty
swallowing often occurs with ageing, which can affect the types of foods
consumed and may reduce enjoyment of eating. As mobility decreases with age, an individual may become more reliant on other people to shop for, prepare and cook food. This may result in a loss of independence regarding food choice, particularly if their main meal is provided by a day centre or meals-on-wheels. Older adults often consume a more limited range of foods than during adulthood due to these factors and reduced energy requirements.
9

1.2 Diet in transition
The Government White Paper, 'Choosing Health? ' (DoH 2004) identifies four
major transitional points from childhood to adulthood, at which an individual's
health behaviour may alter as a result of new lifestyle circumstances. These are:
starting primary and secondary schools, leaving home, entering employment and
cohabiting/starting a family.
1.2.1 Starting school Starting school will influence a child's dietary habits as their daily routine changes
and they consume meals away from home and in the absence of a parent or
guardian for the first time. The role of peer pressure in determining dietary habits
also takes precedence over other influential factors as children strive to fit into
their new surroundings and mix with new friends (Hollis 1989). Formal food and
nutrition education in school encompasses a number of subject areas including
Science, Design and Technology and Personal, Social and Health Education
(PSHE) (National Curriculum 1999). Science includes teaching pupils the role of
food and water in life processes and the importance of exercise and healthy eating
to maintain health. Design and Technology includes teaching practical cooking
skills and food safety. PSHE includes teaching awareness about issues
surrounding general health and well-being. Many aspects of food and nutrition
might also be covered indirectly in other subjects.
The taught curriculum is designed to provide children with a fundamental
understanding of food and health. Lesson-based knowledge alone is unlikely to be sufficient to encourage children to make healthy food choices whilst they are at school and away from parental influence. As part of the Food in Schools (FiS) initiative, many schools are also implementing extra-curricular activities such as breakfast clubs, healthy tuck-shops and growing clubs, which allow children to
actively participate in developing a healthy learning environment and enable children to apply their knowledge to their own lifestyles and work towards changing dietary habits (DoH 2005a).
It might be suggested that the best opportunity to work towards educating and developing healthy eating habits is at primary school, when children may be more
responsive to change as far as social norms and peer pressure allows (i. e. if
10

healthy eating is seen to be 'cool'), and before any unhealthy eating habits
become established through adolescence and adulthood. However delivery of the
curriculum and availability of extra-curricular activities appears to vary widely
between schools, resulting in inconsistent delivery of food and health education.
To be effective in changing children's dietary habits, school based education and
activities need to be actively supported by parents (i. e. by providing healthy foods
at home and choosing healthy options if eating out) if children are to perceive
healthy eating as normal rather than a tedious activity which they are told they
should do at school.
1.2.2 Leaving home
Leaving home could have an impact on a young person's dietary habits as they
have more freedom concerning what and when to eat. Young people leave home
for a number of reasons. A survey by The Joseph Rowntree Foundation (2003)
found that 38% of young people reported leaving home for independence, 21 % to
pursue further education, 18% to commence employment, 17% to co-habit with a
partner and 6% due to family disagreement. The age at which young people leave
home has gradually increased over recent years. The 2001 UK census revealed
that children over the age of 18 years live in the family home in 10% of households
(Census 2001). This may be due to the rapid increase in housing prices. In 2002,
UK house prices were increasing at an annual rate of 30%, resulting in the lowest
rate of first-time buyers since 1974 (BBC Online 2003a). Many young people
remain living with their parents until they are either earning a wage high enough to
enable them to afford a mortgage, or until they are able to buy a house with a
partner.
Some young people who had recently left home were found to consume a diet
consisting predominantly of take-away and convenience foods (Roberts 2001).
There may be a number of reasons for this, including their newfound freedom from
parental control concerning eating healthily, limited cooking equipment and/or facilities, or a lack of practical cooking skills. Cookery skills are usually either learnt in school or passed down from parents to children through observation and
participation. However the majority of practical cookery lessons in schools were
replaced by theory-based lessons following the introduction of the National
Curriculum in 1994, resulting in fewer opportunities for children to learn basic
11
cookery skills in school (Ballam 2000). The increased use of convenience foods in
the family home is perhaps resulting in less opportunity for children to learn
practical cooking skills by observing how fresh foods are prepared and cooked. Mintel (2002) reported that the evening meal was generally considered to be more important to families than to single person households at weekends when busy
lifestyles are put aside to make time to prepare meals from scratch. However,
during the week, families with children represent the largest user group of
convenience foods. It is therefore likely that an increasing number of young
people are leaving home with insufficient practical cookery skills to enable them to
cater for themselves (Lang et al 1999).
1.2.3 Starting employment According to the Health Development Agency (2004a), employment is beneficial to health, as opposed to unemployment, which leads to poorer health and shortened life expectancy. Employment offers social contact and participation within society, and earning an income also enables more interaction within society in terms of participating in activities that are not free (e. g. gym membership, eating/drinking out). Some of the adverse affects of unemployment are increased smoking, increased alcohol consumption, more weight-gain, decreased physical activity levels, use of illicit drugs, increased sexual risk-taking and reduced psychological well-being (high rate of depression, self-harm and anxiety) (DoH 2004a). Conversely, for those in employment, lack of job control, monotonous or repetitive work and an imbalance between effort and reward can lead to an increased risk of CHD and other health problems (Anderson et al 2004).
Beginning employment for the first time is a major point of change for many young adults. A new job will entail adapting to a new daily routine and new tasks, as well as meeting a variety of people in different social settings (both work colleagues and clients) and earning an income, which would allow the young person to increase their food expenditure. A new daily routine may have either a positive or negative influence on dietary habits. For those who begin a job with regular 9am- 5pm working hours and lunch break, mealtimes could become more regular due to fitting them around working hours. However for those on shift work or those who have a demanding workload, their work could potentially have a negative effect on
12
their dietary habits, as they would need to eat meals at different times of day or fit
them in around their schedule (Waterhouse et al 2003).
Earning an income will lead to more freedom regarding dietary choices for an individual as they can afford to consume a more varied diet. A higher disposable
income may be used to purchase foods of a higher quality or more fresh foods
(e. g. organic food, RSPCA approved meat) or may be used to purchase high
priced convenience foods (e. g. ready-meals). This choice will depend on a
number of factors including prior dietary habits and level of exposure to varied foods, availability of foods and peer influence. During the working day, meals may
be purchased from workplace canteens or local food outlets/shops, or taken in
from home. An individual who prepares their lunch at home will have more control
over their dietary habits at work, particularly if they include healthy snacks in order
to avoid the unhealthy options probably available in workplace vending machines.
Those who purchase their meal at work might be influenced by their colleague's
food choices. The choice of meals and snacks away from home may be less
healthy than something prepared at home, and choice is also limited by the
frequently higher cost of healthy food purchased away from home and availability.
1.2.4 Co-habiting/starting a family
The life events often associated with early adulthood (marriage and having
children) have been found to be associated with decreased levels of physical
activity in young women, therefore resulting in an increased risk of overweight and
associated illness (Brown and Trost 2003). The transition from single status to co- habitation with a partner is a major lifestyle change, which is likely to influence
dietary habits as a partner's food choices are thought to be one of the main influences on eating habits (Oygard and Klepp 1996).
Co-habitation/marriage may result in either a convergence of food preferences or conflict of food choice, depending on the extent to which partners tolerate each
other's dietary habits (Bore et al 2003). Mortality rates of married people are lower than those of single people (Ebrahim et al 1995), although evidence suggests that following co-habitation, couples are likely to gain weight and partake in less physical activity therefore increasing the risk of developing heart disease (Kahn et al 1991). Montero et al (2000) reported diet change as a result of marriage at 20
13
years of age, observable in an increased consumption of protein and complex
carbohydrates. A couples' diet was once largely determined by the male's food
preferences, although contemporary couples increasingly attempt to
accommodate each other's food choices. However, the majority of meals are still
prepared by the female (Marshall and Anderson 2002). Many newly co-habiting
couples consider eating their evening meal together an important aspect of living
together, so therefore may make considerable effort to organise individual time
commitments in order to accommodate this (Marshall and Anderson 2002).
An Australian health promotion intervention study for newly married couples to
build on re-evaluation of attitudes to health in early marriage and support provided
by partners achieved a number of short-term changes to dietary habits and
physical activity levels (Burke et al 1999). The intervention achieved an increase
in self-efficacy for diet and physical activity, and an increased consumption of fruit
and vegetables along with a decrease in total fat intake. However as with any health intervention, long-term changes will only be achieved from projects that
promote sustainable changes in dietary behaviour that do not depend on the
support of the intervention project.
It is evident that there are key transitional points during the journey from being a dependent to establishing independence, when a young person's lifestyle will
undergo changes as they gain more freedom from parental control, take on new
responsibilities and mix with new groups of people. These changes to lifestyle are likely to result in changes to dietary habits due to new/varying factors that affect food choice such as changes to incomeffinancial responsibilities, more freedom of food choice, different people influencing food choice or changes to daily routine. Despite this being an important stage of the life-course for developing either positive or negative dietary habits that may form the basis of adult life, very little
research has been carried out to investigate how dietary habits change at these transitional points. More research into this area would facilitate a better
understanding of the extent to which dietary changes are either positive or negative during these changes of lifestyle and would highlight potential for health promotion activity to improve the long-term diet and health of future generations.
14
1.3 National data for young people's dietary habits and health behaviour
The National Food Survey (NFS) and the National Diet and Nutritional Survey
(NDNS) are two examples of surveys designed to assess trends and changes to
the food intakes of the British population.
1.3.1 The National Food Survey
The National Food Survey (NFS) is a long-running, annual survey that has been
collecting data about households' food purchases for almost 60 years from a
nationally representative sample of 7-8000 households across the UK. The NFS
is only a crude method of assessing the types of food purchased by a household
in one week. It does not attempt to assess how the food purchased is distributed
between each family member, or to measure the amounts of food consumed. The
NFS does not provide information about dietary intakes for specific age groups, therefore cannot be used to provide any information about dietary habits at key
transitional points throughout the lifecycle. However, as one of the longest running household surveys, the NFS is a source of important information regarding the
changing dietary habits of the UK population in general over more than half a century. Between 1950 and 2000, the NFS has recorded a decrease in
consumption of fats/oils and sugars/preservatives and an increase in fruit, along with a decrease in vegetable and fish and increase in meat consumption (MAFF 2000).
1.3.2 National Diet and Nutrition Survey More detailed information regarding the dietary habits and nutritional intakes of the UK population is available from the National Diet and Nutrition Survey (NDNS), which was established in 1992 by the Ministry of Agriculture, Fisheries and Food (MAFF) and the Department of Health. The Food Standards Agency is now responsible for the part of the survey previously undertaken by MAFF.
Subjects who participate in the NDNS take part in a number of types of data collection. An interview is held to ascertain subject's socio-demographic circumstances, details of medication and their general eating and drinking habits. They are then asked to keep a weighed dietary record of all food and drink consumed during seven consecutive days, and are typically asked to collect a
15
range of other data such as a record of their bowel movements for the same seven days and a seven-day physical activity diary.
Measurements are taken of their weight, height, mid-upper-arm circumference,
waist and hip circumferences and blood pressure. Blood and urine samples are
taken for biochemical analysis, and a dental examination is carried out. Published
data from the NDNS is currently available for the following age groups: children
aged 1 1/2 to 41/2years, young people aged 4 to 18 years, adults aged 19-64 years
and people aged 65 years and over. Young people fall into the latter age groups
in the NDNS report for 4-18 year olds, and the earlier age groups of the 19-64 year
old report. The findings of the NDNS are based on samples living in private
households. The study does not include the dietary habits of people living in
rented accommodation, so therefore does not give an accurate indication of the
nutritional intakes of young adults who have recently left home, as the majority of
this sub-group of young adults will live in rented accommodation.
The National Diet and Nutrition Survey: young people aged 4-18 years (NDNS)
(Gregory et al 2000) is the largest and most comprehensive survey of young
people to be undertaken in the UK. The study involved 1700 young people from
whom detailed measurements of nutritional status, diet and physical activity were taken. This study suggests that young people consume high intakes of saturated fat, non-milk extrinsic sugars and salt; and fibre intakes were below the
recommended 18g/day, (average fruit and vegetable consumption was less than half the recommended 5 portions a day). Whilst vitamin intakes were, on average,
adequate, intakes of a number of minerals including zinc, potassium, magnesium,
calcium, iron, iodine and copper were low amongst the older age groups of 15-18
years, and particularly amongst females.
The study revealed that young people's physical activity levels were fairly low, with 60% of boys and just 40% of girls meeting the recommended one hour of physical activity per day. The amount of time spent in physical activity decreased as age increased. These low levels of physical activity, along with the high intakes of saturated fat and sugar, are likely to contribute to the increased prevalence of childhood obesity.
u: ,ý.
¢fu
7 ýtýrý r 1ý lL
'Sý ý,
TY
}I T& ri ii
16

Inter-generational differences in diet are apparent from NIDNS data. Processed
foods and drinks feature predominantly in the diets of children and young adults, whilst consumption of fresh ingredients increases with age. Foods that were significantly more likely to be consumed by the 19-24 year old age group than the 50-64 year old age group included pizza, coated chicken/turkey, burgers/kebabs,
savoury snacks, carbonated and concentrated soft drinks (not low-calorie) and
alco-pops (p=0.01). Conversely, foods that were consumed significantly more frequently by the 50-64 year old age group included whole grain/high fibre breakfast cereals, oily fish, white fish, leafy green vegetables, cooked carrots and tomatoes, many fresh fruits and canned fruit, eggs, fruit pies, cereal-based puddings, preserves and cakes/pastries (p=0.01). This suggests that the older generation consume a more varied diet consisting of more fresh ingredients than
the younger generation. This may be due to the lack of basic cooking skills
amongst young people, which is a result of a decrease in practical cookery lessons in school and fewer opportunities to learn by observation at home as convenience foods increasingly replace fresh ingredients. The basic simplicity of heating ready-meals compared to preparing fresh ingredients may also influence food choice and appeal to the busy lifestyles of younger generations.
1.3.3 The Health Survey for England The Health Survey for England: the health of young people 1995-97 (Prescott- Clarke and Primatesta 1998) collected data from young people aged 2-24 years regarding nutritional status, eating habits, smoking, alcohol consumption and self- reported health. This survey included young people aged 19-24 years, an age group who had left school and were undergoing lifestyle changes which may lead to altered health and dietary habits. The results demonstrated that 6% of males and 8% of females (aged 16-24 years) were obese (BMI >30) and a further 23% of males and 19% of females were overweight (BMI 25-30). Conversely 17% of males and females were underweight (BMI <20). With regard to attitudes towards weight and body image, females were more likely to report being dissatisfied with their weight than males, as were young people (16-24 years) compared to children. The proportion of obese males and females who stated they were trying to lose weight was lower than those who stated that they considered themselves to be too heavy. However, for overweight and desirable weight males and females and underweight females, the proportion who reported trying to lose weight was
17
higher than those who thought they were too heavy. This indicates varying
attitudes to weight and weight loss depending on actual weight. 20 % of those
within the desirable BMI range of 20-25 believed they were too heavy and 45% of this group reported trying to loose weight.
The survey found that just 20% of boys and 15% of girls aged 13-15 years
consumed five or more portions of fruit and vegetables a day. The consumption
of fruit and vegetables decreased with social class, whereas contrary to findings in
other UK surveys, the consumption of foods high in fat and sugar, and sugary drinks was higher amongst the higher social classes. These findings suggest that
respondents are not balancing their dietary intake with their physiological
requirements. However this is not unique to adolescents, but is increasingly
observed amongst a range of age groups.
1.3.3.1 Smoking
Smoking was assessed in the Health Survey for England (Prescott-Clarke and Primatesta 1998) by self-reported smoking and by cotinine measurements in the blood and saliva. If cotinine levels were in excess of 15ng/ml, the person was likely to smoke. A large proportion (41%) of 20-24 year olds reported smoking, which was close to the proportion found to be smokers by their cotinine levels
(43% males and 42% females). The proportion of self-reported smokers in the
younger age group of 11 -15 years, in the Smoking, Drinking and Drug Use among Young People in England 2000 survey (Becher et al 2000) was lower, with 12%
girls and 9% boys smoking. The study also revealed an increase in girls smoking since the 1980's. Both studies found evidence of smoking being more prevalent amongst the lower social classes. Despite the encouraging decline in the
prevalence of smoking in recent years, a relatively high proportion of these young adults smoked. This suggests that concerns for health are not a high priority amongst many young adults, or at least is of less importance than `fitting in' with peers (which is cited as one of the main reasons for teenage smoking (Feighery et al 1998)).
1.3.3.2 Alcohol consumption Alcohol consumption amongst the 11-15 year old age group surveyed in the Smoking, Drinking and Drug Use survey (Becher et al 2000) revealed no
18
substantial changes to drinking habits amongst this age group since 1980. As with
smoking, drinking was strongly related to age. Five percent of 11 year olds
reported consuming alcohol during the previous week, and 76% reported never
consuming an alcoholic drink, compared to 49% and 14% respectively of 15 year
olds. No sustained changes or notable differences for each sex were observed.
Amongst the 16-24 year olds surveyed in the Health Survey for England (Prescott-
Clarke and Primatesta 1998), the proportion of young people consuming more
than their recommended weekly limit increased rapidly from 16-20 years, then
began to decrease from the age of 20-21 years, which coincides with the age at
which many young people leave home. This finding suggests that young people
may drink excessively when they reach an age when they can purchase alcohol
and gain access to pubs and clubs but probably begin to adopt more responsible
drinking habits with age. A notable increase in the proportion of women drinking in
excess of their weekly limit of 14 units was evident in this survey. The major
increase in alcohol intake in young adulthood contrasts sharply with the high
proportion of young people who report wanting to lose weight. This suggests that
young people either do not realise the potential for weight gain from extra energy
consumed in alcoholic drinks, or as suggested regarding smoking, the health risks
associated with high alcohol consumption are less of a priority to young adults
than fitting in with peers.
1.3.4 International surveys The Health Behaviour of School-aged Children (HBSC) is an international survey
of 28 countries. This survey reported that girls were generally more likely to
consume fruit than boys (Currie et al 2000). The amount consumed varied
considerably between countries, with the lowest levels of consumption observed in
Greenland (29% of boys reported consuming at least one piece of fruit a day) and highest levels observed in Portugal (95% of girls reported consuming at least one piece of fruit a day). Fruit consumption by English children was relatively low. Of
the 28 countries in the survey, English girls had the sixth lowest and boys had the
eighth lowest rates of fruit consumption. In most of the countries, the proportion of children who reported consuming fruit everyday decreased with age. This reflects the findings of UK National Diet and Nutrition Survey data (Gregory et al 2000),
which also indicated a decrease in fruit and vegetable consumption, and a
19
consequential decrease in fibre intakes. The HBSC findings for crisp consumption highlight an area of particular concern for UK children. The proportion of UK 11-15
year olds consuming crisps every day was higher than in any other country, with figures ranging from 82% for Northern Ireland females to 37% for Welsh females.
The influence of parental socio-economic status on children's dietary habits was
evident across all countries. Consumption of healthy foods increased with socio-
economic status, whilst consumption of less nutritious foods was higher amongst lower socio-economic groups.
The survey (Currie et al 2000) found less than half of all respondents took part in
sedentary activity such as watching television and using computers for more than
four hours a day. Respondents who watched television on a regular basis were
more likely to consume 'junk' snack foods. Adolescents were more likely to
disregard long-term benefits of good health practice and concentrate on immediate
benefits (i. e. weight control). In later adolescence and young adulthood, individuals were more likely to begin to adapt attitudes to health and begin to
recognise long-term benefits of eating to improve/maintain health (i. e. reduce/maintain cholesterol, blood pressure).
It is of concern that young people in the UK have amongst the worst pattern of food intake, alcohol intake and physical activity in Europe. This suggests that there are specific environmental/lifestyle factors at work in the UK, which are generating this trend in health behaviour.
20
1.4 Food Choice
An individual's food choice will determine their health status to a large extent. However, food choice is a very complex subject and a large number of factors
influence consumption. A number of food choice models have been developed by
nutritionists, physiologists and psychologists, which attempt to explain the process
of individual food choice. One of the earlier models identified three factors that
may affect food choice: physical, social and physiological (Yudkin 1956). Physical factors included season, geography, economics and food technology. Social
factors encompassed religion, socio-economic status, nutrition education and
advertising. Physiological factors included heredity, allergy and nutritional needs. A fourth factor encompassing individual perception was later identified by Pilgrim
(1957). Further food choice models were developed and adapted to incorporate
various influential factors (Kahn 1981, Randall and Sanjur 1981, Krondl and Lau
1982). These models were incorporated into one all-inclusive model by Booth and Shepherd (1988) (Figure 1.4a), although as research progressed, further factors
were identified leading to the further development of food choice models such as that of Furst et al (1996).
21

Children's food choice, particularly the role of television advertising in influencing
children's diets has been researched extensively (Carteret al 2000, Borzekowski
and Robinson 2001, Crespo et al 2001). However, little is known about factors
that influence food choice during young adulthood (Woodward 1986), including the
effect of leaving home. Warwick et al (1997) suggest that young people are able to identify foods that contribute to a healthy diet, but this understanding is not
reflected in their food choices. Hamilton et al (2000) developed a food choice
model specifically for young people as a basis for promoting healthier food choices
amongst children and young adults (Figure 1.4b). This model identifies factors
that specifically influence young people's food choices (as opposed to adulthood),
and highlights how these are inter-related and also indicates the potential health
implications resulting from these food choices. The main influences identified in
this model are direct influences (age and gender) and indirect influences (peer,
parents and available expenditure). The indirect influences may fluctuate as diet
changes during the transition from adolescence to adulthood, with the main
changes occurring when a young person leaves home to live independently. At
this point, parental influence on food choice could decrease dramatically or even cease completely. Peer influence moves away from individual's consuming similar foods to their peers in order to 'fit in', but may still influence food choice for
practical reasons such as sharing shopping and meal preparation with housemates/partners. Also, those who are less concerned about choosing healthy
foods may have a negative influence on their peers who do try to eat healthily, and
vice-versa. Food choices may also change according to available expenditure
upon leaving home as an individual becomes responsible for their own finances
and purchasing their own food rather than relying on parental income.
Earlier food choice models (Yudkin 1956, Pilgrim 1957) focus largely on factors that may influence the food choices of adults. More recent food choice models have identified some factors that might influence the food choices of young people who are likely not to be wholly responsible for their own eating patterns. However,
no models have been developed based on food choices throughout the life course, which identify key points of transition such as leaving home and how food choices may change at these points.
22

23
1.5 Policy The White Paper, Saving Lives: Our Healthier Nation (DoH 1999) outlines four key
areas of health improvement; to improve death rates from cancer, heart disease,
accidents and mental illness. The paper recognises the importance of a healthy
diet throughout the lifecycle, but does not set any specific targets relating to the
role of nutrition in reducing mortality from obesity, cancer, heart disease or other
diet-related illness.
1.5.1 Choosing Health? White Paper
More recently, the government has identified better health for children and young
people as one of eight key themes in the 'Choosing Health? ' White Paper (DoH
2004a). The paper outlines plans to help young people to make informed
decisions about their health and diet by introducing Health Guides, which enable
them to work with parents/carers and health professionals to develop health goals
and targets. These plans for personal health guides could be of benefit at key
transitional points of childhood and young adulthood (i. e. starting school, leaving
home or starting work), by providing support at these stages of their life course to
enable individuals to consider the impact of particular choices on their health in
relation to their changing lifestyle.
1.5.2 Food and Health Action Plan
Nutrition is dealt with more specifically in the Government's Food and Health
Action Plan (DoH 2004b). The plan aims to improve the nation's diet by
addressing food production, manufacture and preparation, increasing access to healthier food and providing more information for consumers about healthy eating and nutrition. The main focus of projects involving young people is intervention in
schools.
In a bid to improve standards of health education and tackle health inequalities, the Government introduced the Healthy Schools Programme in 1998, followed by
the launch of The National Healthy School Standard the following year, which is jointly funded by the Department of Health (DoH) and the Department for Education and Skills (DfES). In order to meet the healthy eating targets of the National Healthy School Standard, schools are required to present consistent, informed messages about healthy eating; provide, promote and monitor healthier
24
food at lunch and breakfast clubs, where provided, and to include education of
healthy eating and basic food safety practices in the formal curriculum. Prompted
by the rapid increase in childhood obesity, the DoH and DfES launched the Food
in Schools (FiS) programme. The aim of FiS is to promote healthy eating and
provide opportunities to learn about food and health throughout the school day,
including breakfast clubs before school, the availability of healthy foods in tuck
shops and vending machines at break times, providing healthy choices at lunch
time, and introducing after-school cooking and growing clubs. The FiS is not part
of the formal curriculum, but is intended to support formal classroom-based
education. Whilst school-based interventions such as these are beneficial for
promoting healthy dietary habits during the developmental stages of childhood,
which may benefit health in adult life to a certain degree, the messages underlying
these interventions need to be actively supported by parents and peers if positive dietary choices are to be maintained into adulthood.
1.5.3 World Health Organisation (WHO) Health Policy for Children and Adolescents
The WHO department of Child and Adolescent Health Development (CAH) is
involved in the promotion of adequate nutrition throughout childhood and
adolescence to ensure optimal health, growth and development. The main areas
of work include infant and child feeding (ages 0-5 years) and adolescent nutrition. The WHO have produced a policy document, Health Policy for Children and Adolescents (Currie et al 2004), which collaborate the findings of the HBSC and
other major international studies of child and adolescent health in order to address the implications of these findings in terms of health policy in developed countries.
The WHO Regional Committee for Europe (4h session, Copenhagen, September 1998) adopted the following targets for European countries:
European Health2l - Target 4:
By the year 2020 young people in the Region should be healthier and better able to fulfil their roles in society.
25
European Health - Target 13: By the year 2015, people in the Region should have greater opportunities to live in healthy physical and social environments at home, at school, at the workplace and in the local community.
These documents focus on the transition from childhood to adolescence and lifestyle factors specific to these particular life-stages, but do not address the transition from adolescence to young adulthood, and the processes involved such as leaving home.
26
1.6 Diet and lifestyle of students Those who leave home to train or pursue further education may take up to four
years to make the final transition from family home to independent living, due to
the fact that they often live away from home only during term-time, and will return
home for the holidays. The lifestyle of this group who live away from home during
term-time is likely to be a unique experience due to the freedom from both parental
control and the limitations of a full-time working life.
The number of young people pursuing further education has increased
substantially from just 6% of under 21's entering further education in the early
1960's to 43% of 18-30 year olds in 2000 (Department for Education and Skills
2003). The abolition of the grant system and introduction of tuition fees in 1997
and 1998 has resulted in increasing debt for most students (average graduate debt in 2003 was E8666 (DfES 2004)), causing concern as to whether students
can afford to eat healthily (FSA 2003). A survey of student living revealed that in
an average week, students spend E28 on food, El 9 on alcoholic drinks and El 5 on
going out (excluding alcohol); expenditure which is funded largely by student loans
and credit cards (MORI 2002). Students reported they would have more money if
they did not drink alcohol (Mintel 2002a), suggesting that students do potentially have funds to eat healthily.
Most student accommodation is now self-catered, replacing catered halls of
residence and room rentals that included meals. It has been suggested that more
young people are leaving home ill-equipped to cook for themselves, as school
cookery lessons focus more on theory than practice, and meals are generally no longer prepared from raw ingredients in the home (Lang et al 1996). A MORI
survey (2002) reported that 15% of students could not cook a meal for four people when they began university, but 63% of students who had been away from home for more than a year said they would be able to. This suggests that university acts as a training ground for many young people to learn to cook. Furthermore, a survey of 250 students found just 12% of first year students had cooked for themselves on a regular basis prior to university, whilst 52% said they relied mainly on takeaway meals whilst at university (Roberts 2001). A lack of practical cooking skills may limit a student's ability to cook nutritionally adequate meals. However, socialising and studying often take priority over cooking, causing
27
students to replace meals with snacks, or consume convenience foods and
takeaway meals if they lack the motivation to cook (Eves et al 1995).
An Abbey National survey (Roberts 2001) reported the following meals to be most
popular amongst students (all of which require minimal preparation skill, but not all
of which are unhealthy): pasta meals (24%), quick snacks such as beans on toast
or baked potato (18%), takeaway burger, kebab or pizza (16%), supermarket pizza
(12%), vegetarian meal (12%), takeaway curry (6%), homemade curry or chilli
(6%) and meat and two vegetables (5%). An investigation of female students
snacking habits found students consumed an average 2.4 snacks per day, which
contributed 34% of daily energy intake (Whybrow and Kirk 1997). The diet quality
of those with high snacking frequency was not compromised due to a wide range
of snacks being consumed.
Freedom from parental control regarding what and when to eat is likely to
influence a student's dietary habits to a certain extent. In an investigation of how
students' eating habits compared with their recollections of their childhood eating
habits, Branen and Fletcher (1999) found that current dietary habits were
dependent on feeding practises used by a parent/guardian during childhood. This
suggests that parents have the potential to influence their child's dietary habits
after they have left home. However a high level of parental control regarding food
choice resulted in reduced self-control during young adulthood, hence students
may reject more foods after leaving home due to an increased independence
regarding food choice and no longer having to consider the food preferences of
other family members, Mooney and Walbourn (2001) found the foods students
were most likely to reject were meat, vegetables, fried food, fish, sweet snacks, dairy and salty snacks. The most common reason for avoiding specific foods was
concern about body weight, followed by dislike of taste, health concerns, unnatural ingredients and animal ethics. Females were most likely to avoid foods due to Weight concerns, whilst males reported taste as their main reason for specific food
avoidance. Thirty six percent of respondents avoided meat, their main reason being weight concern. Martins et al (1999) suggested that some young people
who do not want to be labelled as a 'dieter' might adopt a vegetarian diet in order to disguise their efforts to loose weight.
28
A number of studies have investigated student's diets, although many pre-date the
increase in student numbers and changes to student finances. Eves et al (1994)
reported decreased energy intakes and correspondingly low nutrient intakes in
females during the latter years of a six-year longitudinal study between 1986 and
1991. This trend was not reflected in male intakes, which therefore ruled out the
possibility that these changes were solely due to reduced student grants. A study
of Spanish university students also found low intakes of energy in males and
females, and corresponding low intakes for some micronutrients (Soriano et al
2000). Edwards and Meiselman (2003) reported a significant decline in energy
intake during the first two terms at university, which later stabilised. However
there was no significant change to body mass index (BMI), which was explained
by a decrease in physical activity. Overall food consumption and frequency of
consumption declined, but intakes of most nutrients were still in excess of
Reference Nutrient Intake (RNI). Butler et al (2004) also reported a decline in
energy and diet quality and a rise in body weight parameters, which was attributed
to a significant decline in physical activity.
Both Edwards and Meiselmann (2003) and Butler et al (2004) reported a decline in
diet quality, which usually results from an increased energy intake due to the
replacement of foods of adequate nutritional quality with energy dense foods
(unless quantities of food consumed decreased somewhat). It may be suggested
that the decrease in energy intakes reported in these studies were a result of
under-reporting, possibly as a result of an awareness that their diet quality has
decreased. Conversely, Moynihan et al (1999) reported an increase in energy intake at university compared to living at home; a consequence of increased
consumption of fat and sugar and a significant decrease in fruit and vegetable intakes. Respondents in the studies of both Eves et al (1994) and Edwards and Meiselman (2003) were catering students. It could therefore be suggested that the
dietary habits of these respondents may not reflect the average student
population, as nutrition and practical catering are generally core components of
catering/hospitality courses.
US health professionals have recognised the deterioration of student's health
during their first semester, mainly observable by weight gain. The tendency for
students to gain an average fifteen pounds is notoriously known as 'freshman
29

fifteen', although recent research suggests that a weight-gain of four pounds is
more accurate (American Dietetic Association 2003). US students are likely to be
generally more aware of the risk of weight-gain due to extensive coverage on
university and health related websites, such as American Dietetic Association,
student. com and Worcester Polytechnic Institute. In the UK it is recognised that
students' eating habits are likely to deteriorate, which is attributed to limited
income (FSA 2003b). The potential for substantial weight-gain during the first
months living away from home has not been studied.
A number of intervention studies have been carried out to investigate the effect of
university-based nutrition education (Liddell et al 1992, Larson-Brown 1993,
Matvienko et al 2001). The intervention project of Matvienko et al (2001) involved
formal lecture and laboratory-based exercises, which taught participants about the
science of nutrition. This study was successful in preventing weight-gain
(compared to considerable weight-gain in control students), although participation
rate was low and respondents were self-selected. The knowledge that their weight
was to be measured throughout the course may have been motivation for the
intervention group to apply their knowledge to their lifestyle during the study, but
this may not have continued after the study finished. Conversely, Liddell et al (1992) and Larson-Brown (1993) introduced more informal interventions based on informing their study population about healthy eating through leaflets and posters,
and providing healthy choices in university cafeterias. These studies were
successful in increasing student's nutritional knowledge (Larson-Brown 1993) and improving the dietary habits of students (Liddell et al 1992). The results of these
studies illustrate how the provision of nutrition information alone may achieve
some temporary improvements to dietary habits, but when accompanied by an increased availability of healthy food choices in catering outlets these changes are
more sustainable in the long-term.
In accordance with the WHO's 'settings' approach to health promotion, the Health Education Authority sponsored two major projects within a further education environment, which worked towards developing a health promoting environment for students and staff to work within (Payne 1996). The 'Health in Further Education Project' (1989-1993) focused on making health education available to a wider range of students than just those enrolled on health based courses, whilst
30
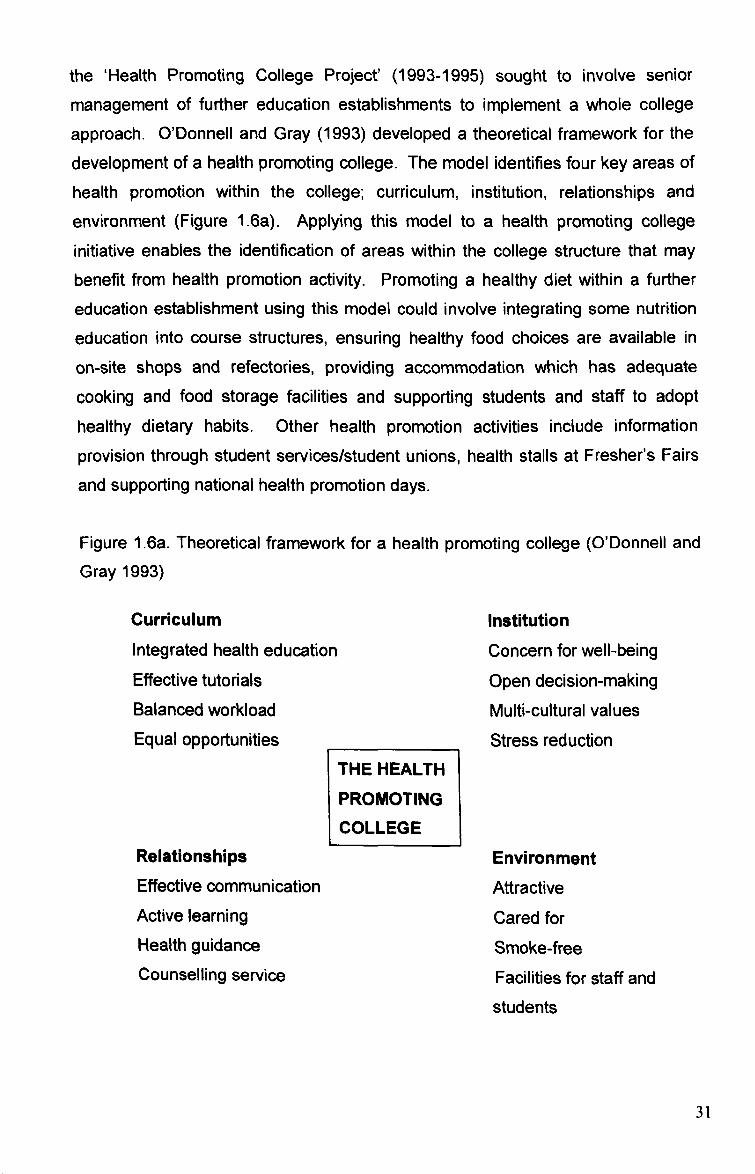
the 'Health Promoting College Project' (1993-1995) sought to involve senior
management of further education establishments to implement a whole college
approach. O'Donnell and Gray (1993) developed a theoretical framework for the development of a health promoting college. The model identifies four key areas of health promotion within the college; curriculum, institution, relationships and
environment (Figure 1.6a). Applying this model to a health promoting college initiative enables the identification of areas within the college structure that may benefit from health promotion activity. Promoting a healthy diet within a further
education establishment using this model could involve integrating some nutrition
education into course structures, ensuring healthy food choices are available in
on-site shops and refectories, providing accommodation which has adequate
cooking and food storage facilities and supporting students and staff to adopt healthy dietary habits. Other health promotion activities include information
provision through student services/student unions, health stalls at Fresher's Fairs
and supporting national health promotion days.
Figure 1.6a. Theoretical framework for a health promoting college (O'Donnell and Gray 1993)
Curriculum
Integrated health education Effective tutorials Balanced workload Equal opportunities
Relationships Effective communication Active learning Health guidance Counselling service
THE HEALTH
PROMOTING
COLLEGE
Institution
Concern for well-being Open decision-making
Multi-cultural values Stress reduction
Environment Attractive Cared for Smoke-free Facilities for staff and students
31
The transition from school to further education is very often accompanied by the
transition from living in the family home to independent living in self-catered
accommodation with people of a similar age-group and circumstances, who share
a range of new experiences associated with the student lifestyle. It may be
suggested that many students appear to exist in a temporary lifestyle 'bubble' as a
result of a newfound freedom from parental control and lack of routine and
responsibility, exemplified by living on borrowed money, consuming excessive
quantities of alcohol and adopting poor dietary habits.
32

1.7 Diet and lifestyle of homeless young people Knowledge about food poverty in the United Kingdom is largely based on information from low-income households, with few studies of the homeless who
are amongst the most vulnerable to food poverty (Dachner and Tarasuk 2002).
The homeless can be divided into three sub-groups: 'primary homelessness'
includes people living rough on the streets who find shelter in improvised
dwellings. 'Secondary homelessness' describes people who frequently move from
one form of temporary accommodation to another. This includes people using
emergency accommodation such as hostels and night-shelters. 'Tertiary
homelessness' includes people who live in bed and breakfast accommodation or boarding houses on a medium to long-term basis (Chamberlain and Mackenkie
1992). Approximately 532 people sleep on the streets in England on any one
night, whilst 400,000 people are classed as secondary or tertiary homeless. This
includes 26,470 people in hostels, 67,500 people in bed and breakfasts, and 9,600
people squatting in derelict buildings (Baker 2001).
The incidence of youth homelessness has increased over recent years in the UK
as well as in other European countries, America and Canada (Dachner and Tarasuk 2002). For most young people, leaving home is a natural stage of their
lifecycle, completing the transition from being cared for by a parent, guardian or
carer, to living independently and being responsible for themselves. However,
many young people are forced to leave home before they chose to. Seventy six
percent of young people surveyed at a Centrepoint hostel in 1997 stated that they did not leave home out of choice (Centrepoint 1997). The main cause of youth homelessness is family conflict; forty five percent of young homeless people have
experienced physical or sexual abuse in the family home (Jones 1999). Young
people may also become homeless due to rejection by their families because of drug addiction and/or involvement in crime (Fountain et al 2002). Often, the circumstances that lead to becoming homeless also cause a breakdown of the individual's social support network, as extended family and friends who the young person may have turned to for support often stand by the family, so the child has no one to turn to for help. This reduces the likelihood of the young person moving back to the family home, as all lines of communication are removed (Randall and Brown 2001).
33
Young people who become homeless face numerous difficulties finding
accommodation and employment. Two thirds of young homeless people leave
school with no qualifications, and many have learning difficulties or are illiterate,
which restricts their prospects for finding work in order to pay housing costs (Craig
1996). Many young people also experience problems claiming Housing Benefit
due to restrictions placed on claimants under the age of 25 years, and 16-17 year
olds are no longer entitled to claim any Income Support (Homeless Pages 2002).
Before the introduction of hostels that cater specifically for young people in the
1980's, most homeless young people were forced to live on the streets, as hostel
accommodation mainly housed older males and did not provide a secure or safe
environment for young people (Dachner and Tarasuk 2002).
In response to rising numbers of young homeless people, some homeless
organisations and local authorities set up hostels and advice services specifically for young people and care leavers. These hostels provide secure accommodation
and are staffed by professionals who are available to give support and help. The
hostels also enable young people to develop life skills such as budgeting, cooking,
cleaning and personal hygiene, in order to ensure that their move to independent
accommodation is as healthy as possible.
Extensive research has been carried out to investigate health and homelessness, but the role of diet and nutrition in promoting the health of homeless people is
often neglected. Homeless people have a high risk of malnutrition and nutritional problems, which increases their risk of developing gastro-intestinal disorders and infectious diseases (Daly 1990). Street sleepers are at particular risk of nutritional disorders as they have no regular source of food and are extremely limited in their food choices. They often rely on food provided by 'soup kitchens', donations from passers-by or edible scraps, which is unlikely to provide an adequate range of nutrients (Daly 1990). One project investigating the dietary intake of homeless people revealed that their diets were high in fat and lacking nutrients, specifically protein, carbohydrate, fibre, vitamins A, B, C and E, calcium, iron, folate, potassium, niacin, sodium, selenium and zinc (Edinburgh Cyrenians 2003). As these respondents were recipients of food supplied by day centres and soup runs, their diet was likely to be better than those who do not benefit from such food projects. The Cyrenian's study reflected the findings of a number of other studies
34
investigating various different sub-groups of homeless populations (Stitt et al 1994,
Coufopoulos 1997, Evans and Dowler 1999, Malmauret et al 2002, Arthur 2003).
The research carried out by the Cyrenians (2003), Arthur (2003), Malmauret et al
(2002) and Evans and Dowler (1999) were concerned with the dietary habits of
single homeless adults who were only responsible for their own food intakes.
Respondents of Arthur's study were Big Issue vendors who had the added benefit
of earning money that could potentially be spent on food from the sale of the
homeless magazine. Respondents of the research carried out by Stitt et al (1994)
and Coufopoulos (1997) were families from homeless households, who had the
additional responsibility of feeding their children as well as finding adequate food
to feed themselves. High energy and fat intakes, and intakes of a number of
micronutrients lower than recommendations were reported in each of these
studies. These findings are of particular concern in the children of homeless
families, as poor dietary habits will affect growth and development and lead to an
increased susceptibility to disease in the long-term. Malmauret et al (2002)
reported low micronutrient intakes amongst single homeless people in Paris, but
found energy and fat intakes were also low.
It is suggested that as well as increasing the risk of developing chronic health
problems such as coronary heart disease (CHD) and stroke, poor dietary intakes
may also affect the homeless person's motivation and ability to develop skills,
therefore reducing their chances of escaping poverty and unemployment (Cyrenians 2003). A poor quality diet may encourage aggression in some people (Gesch et al 2002), whilst the increased likelihood of alcohol and/or substance
abuse amongst homeless populations may exacerbate nutritional problems such
as mal-digestion, malabsorbtion and disruptions in nutrient metabolism (Victorian
Homelessness Strategy 2001).
During adolescence, nutritional requirements are increased due to growth and development (DoH 1991), and adult eating habits are likely to become established. Homeless young people who reside in hostels usually have access to basic kitchen facilities, which generally include cooking appliances (hob, oven and/or microwave), basic food preparation implements (pans, crockery and cutlery) and a fridge and freezer. However, the availability of facilities does not necessarily mean
35
that they are used. Food is often a very low priority of homeless people and their
limited income is frequently spent on cigarettes, marijuana, alcohol and other drugs, all of which affect appetite, and only remaining money is spent on food.
The Edinburgh Cyrenians (2003) found that many homeless people spend a larger
proportion of their income on drugs and/or alcohol than on living costs or food
(expenditure on drink or drugs accounted for approximately 49% of a homeless
person's income, general living costs accounted for 33% and money for food
accounted for 13%).
Many homeless people either do not know how to cook, or lack the motivation to
cook, and often have not had the opportunity to learn how to budget and shop for
food (Victorian Homelessness Strategy 2001). Some hostels now enable
residents to develop these skills. However, as residents usually only stay for a
short time (typically spending a couple of months in a hostel whilst relationships
are rebuilt with family to enable a move back home, only to usually return to the
hostel after relationships break down again at home), it is difficult to provide the
level of support needed to make a significant difference to their lifestyles. At an
age when eating a nutritionally adequate diet is important for growth and development, many young homeless people face difficulties that are far more
overwhelming than concerns about their diet. Due to the extensive problems faced by homeless young people (including behaviouraltlearning difficulties, social
exclusion, alcohol and drug use), previous research has focussed on these issues
in order to improve advice and support available. However, more focus on food
issues has the potential to provide an opportunity for social interaction at meal times and offers the opportunity for young people to develop transferable skills that
may improve employability. Research to investigate the most effective method of promoting healthy eating and budgeting skills to homeless hostel residents would be beneficial in order to not only reduce their risk of disease later in life, but also to improve their present general well-being.
36
11.8 Dietary habits and lifecycle transitions
Dietary requirements are never static throughout the lifecycle, but change with age
and circumstances. Dietary habits are also changeable, so whilst core dietary
habits may be developed during childhood, other factors could influence dietary
habits at different stages of life. These may include conscious decisions to alter food intake as a result of either changing nutritional requirements or an identified
area of concern, but food intake is equally (if not more so) determined by factors
beyond control (e. g. access/avai lability of food) or subconscious factors (e. g.
comfort/boredom eating, ability to regulate appetite). Numerous food choice
models have been developed in an attempt to provide a theoretical framework of food choice. However, it may be suggested that in the developed world, an individual's food choice is far too complex to fully understand and illustrate in a theoretical model.
Life transitions such as leaving home and starting employment affect food choice. These transitions in young adulthood have been identified as stages when health
behaviour and dietary habits could undergo positive or negative changes. Health
education at school does not appear to adequately prepare young people for independent living as it does not address specific issues related to independent
living (i. e. practical cooking skills and food budgeting). Furthermore, the increasing replacement of freshly prepared meals with convenience foods in the family home could result in less opportunity for young people to develop healthy
cooking skills at home, which would be of benefit after leaving home. Young
people may leave home to pursue further education or to start work. These young people usually have adequate time to prepare their move away from home and have some idea of what to expect from independent living. However, homeless
young people usually leave home with no prior preparation due to problems at home and commence independent living in a hostel. These groups of young people leave home in very different circumstances, which is likely to be reflected in their dietary habits.
There is a lack of research about the effect that life-course transitions such as leaving home have on dietary habits. Evidence suggests that nutritional manipulations during critical periods of development in foetal and infancy stages of life 'program' the risk of disease in adulthood. However, the role of nutritional
37

programming in the transition of the diet from childhood to young adulthood is
unclear. It is possible that temporary changes to diet in young adulthood during
life-course transitions such as leaving home may influence an individual's risk of developing disease in adulthood.
38

1.9 Aims and objectives Aim
To investigate how leaving home affects the diet and nutritional status of
young adults (aged 16-30 years).
Objectives:
* Assess the dietary habits and nutritional status of young people through the
use of questionnaires, food diaries, anthropometric measurements and finger-prick blood samples. Investigate the differences in diet and health behaviour of young people living in the family home or independently.
Evaluate the impact of leaving home on the dietary intake and nutritional
status of young people in various independent living situations: Students who have recently left home to begin university in Liverpool, UK. Young working adults who have lived independently for more than 3
years Residents of young person's homeless hostels who may not have left home through choice.
e Make recommendations with regard to how healthier dietary habits might be promoted in young adults.
39
2.0 METHODOLOGY
40
it was expected that substantial changes in dietary habits and nutritional intake
would occur as a result of leaving home and the associated lifestyle changes
experienced by young people. These changes were consequently expected to
have an impact on young people's nutritional status.
2.1 Study design
The study consisted of four inter-related projects involving young people, aged 16-
30 years, at different stages of independent living. The first phase of the project
involved recruiting I't -4 th year students living either away from home or in the
family home, to investigate the different eating habits of the two groups. The
second phase of the project focused on determining whether young people's dietary habits and nutritional status changed when they initially left home to begin
university. The third phase of the study investigated the diet and nutritional status
of a group of young homeless people who had not left home through choice, but
were forced to leave and were likely to be less prepared for independent living
than other young people involved in this study. A final sample of young people
who had lived independently and worked in full-time employment for more than
four years were recruited to compare the impact of study and employment on diet
and nutritional status and investigate whether dietary habits become healthier after the novelty of living away from home has diminished and young people have
adapted to living independently.
2.1.1 Recruitment
Phase 1: Students studying at Liverpool John Moores University were recruited during the 2001-2002 academic year. Subjects were selected from course e-mail listings, and sent food intake and health questionnaires (Appendix 1
and 2) via e-mail.
Phase 2: First year university students were recruited by self-selection during their first semester at university at the beginning of the 2002-2003 and 2003-2004 academic years. Posters and leaflets were distributed around university to encourage volunteers to participate (Appendix 3 and 4). Students were also contacted in person during induction week activities and seminars. Following a brief introduction of the study aims and a verbal explanation of what becoming a volunteer would involve, interested students were asked for an e-mail
41
address and were later contacted to arrange a meeting in order to assess dietary
and nutritional status.
Phase 3. Homeless subjects were recruited from hostels that cater
specifically for the needs of young people. Letters were sent to managers of
eleven young person's homeless hostels in Merseyside and Leicester, informing
them about the nature of the research project (Appendix 5). Hostel managers interested in participating informed residents about the project and arranged a
meeting with residents who wished to volunteer.
. Phase 4. Recruitment of young working adults was carried out using the
'snowball' technique. Volunteers recruited during phases 1-3 were asked to pass
on details of the study to friends, family and colleagues, maximum age 30 years,
who had lived independently and worked full-time for at least 4 years.
42
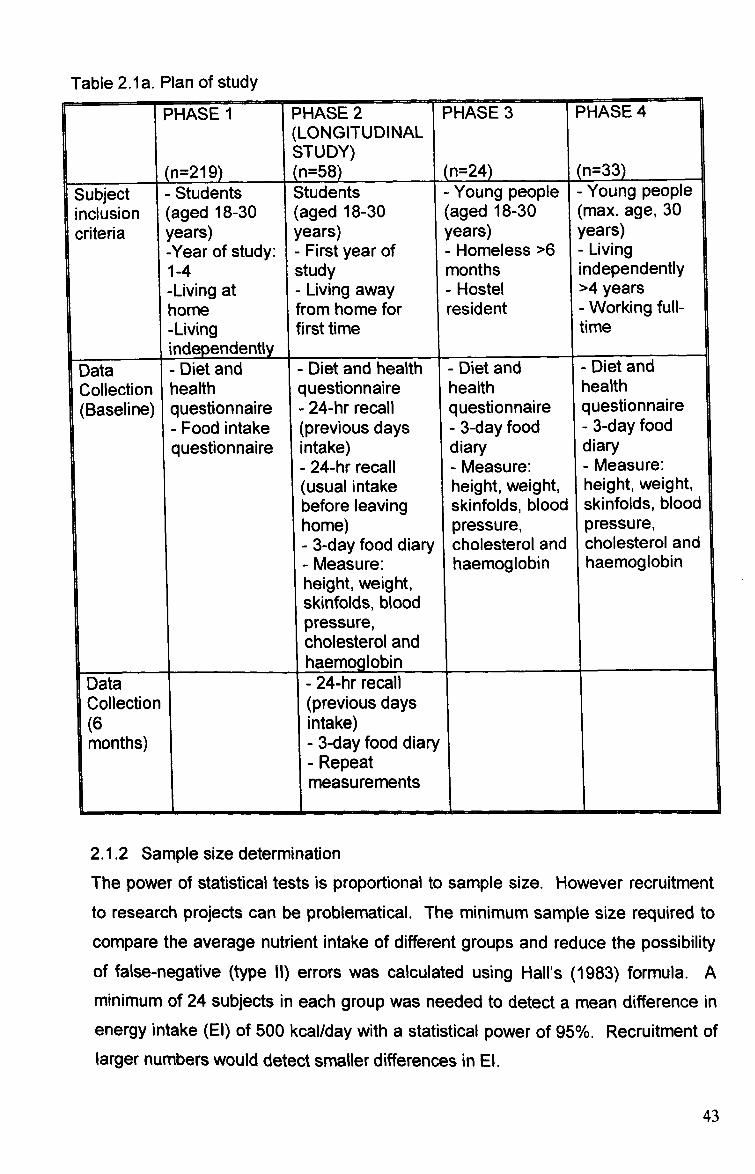
Table 2.1 a. Plan of study
PHASE I PHASE2 PHASE 3 PHASE4 (LONGITUDINAL STUDY)
(n=219) (n=58) (n=24) (n=33) Subject - Students Students - Young people - Young people inclusion (aged 18-30 (aged 18-30 (aged 18-30 (max. age, 30 criteria years) years) years) years)
-Year of study: - First year of - Homeless >6 - Living 1-4 study months independently
-Living at - Living away - Hostel >4 years home from home for resident - Working full-
-Living first time time l independently
Data Diet and - Diet and health - Diet and - Diet and Collection It
ý ea th questionnaire health health
(Baseline) questionnaire - 24-hr recall questionnaire questionnaire - Food intake (previous days - 3-day food - 3-day food questionnaire intake) diary diary
- 24-hr recall - Measure: - Measure: (usual intake height, weight, height, weight, before leaving skinfolds, blood skinfolds, blood home) pressure, pressure, - 3-day food diary cholesterol and cholesterol and - Measure: haernoglobin haernoglobin height, weight, skinfolds, blood pressure, cholesterol and
I haernoglobin Data - 24-hr recall Collection (previous days (6 intake) months) - 3-day food diary
- Repeat
6
measurements
2.1.2 Sample size determination
The power of statistical tests is proportional to sample size. However recruitment to research projects can be problematical. The minimum sample size required to
compare the average nutrient intake of different groups and reduce the possibility
of false-negative (type 11) errors was calculated using Hall's (1983) formula. A
minimum of 24 subjects in each group was needed to detect a mean difference in
energy intake (EI) of 500 kcal/day with a statistical power of 95%. Recruitment of larger numbers would detect smaller differences in El.
43
2.1.3 Study location
The study was based at Liverpool John Moores University (LJMU). Student
volunteers were recruited from LJMU, Liverpool University and Liverpool Hope
University. Homeless volunteers were recruited from hostels in Merseyside and
Leicestershire. The 'snowball' method used to recruit young working adults
resulted in volunteers from Merseyside, the Midlands, Surrey and Kent. Interviews
and measurements were carried out at LJMU or a convenient location for the
subject.
2.1.4 Study protocol LJMU Ethics Committee approved all study procedures. These procedures were
explained to potential subjects during recruitment, either verbally or by e-mail. At
the first meeting with volunteers, procedures were explained in more detail and
subjects were given an information leaflet detailing procedures (Appendix 6). Any
questions raised by subjects were addressed. If subjects were willing to continue,
they completed and signed a consent form (Appendix 7), indicating which
procedures they were, or were not, willing to complete.
Subjects completed a questionnaire detailing personal details (age, sex, socio-
economic group), accommodation details and information about their diet and
health behaviour. Phase 1 subjects also completed Food Intake Questionnaires
(FIQ). Three-day food diaries were given to phase 2-4 subjects (Appendix 8), and
the process of recording food/drink intake was explained. Subjects were asked to
bring their completed food diary to their next meeting when portion sizes were determined (see page 51). Twenty-four hour recalls were then carried out to
determine nutritional intake. The purpose of collecting dietary intake data by
recalls in addition to food diaries was to ensure nutritional intake information was
available for every subject, which could be used if food diaries were not returned. Nutritional status measurements (height, weight, biceps and triceps skinfolds, blood pressure, total cholesterol and haemoglobin) were carried out (see page 61-
62). For longitudinal study subjects, a provisional appointment was arranged for
follow-up measurements to be taken in six months.
44
2.2 Food intake questionnaire Dietary habits and food choices were assessed in phase 1 of the study using an
adapted version of a previously validated Food Intake Questionnaire (FIQ)
developed by Johnson et a[ (2001). The FIQ is designed to assess the food and
drink consumed by subjects during the previous 24-hours. The self-administered
FIQ consists of a list of commonly consumed foods (i. e. various types of cereal,
bread, spread, meat, fish, fruit, vegetables etc). Subjects were required to indicate
whether they had consumed any amount of each food or drink item during the
previous 24-hours by ticking 'Yes' or 'No' against each food/drink.
Johnson et al (1999) assessed the face validity of the FIQ against current dietetic
practice. Participating dieticians were asked to name foods which they consider
important to dietary advice for decreasing fat, sugar and salt intake and increasing
fibre intake. Foods listed most frequently in each category were ranked 1-10.
Items listed in the FIQ that were also in the ranked items were considered face
valid if it had been selected by more than 50% of the sample. A further study
comparing the FIQ to a 3-day food diary found no differences in mean score for
food groups between the FIQ and food diary (Johnson et al 2001). The majority of
correlations for mean scores estimated by separate FIQ were >0.5, ranging from
0.42 for fibre foods to 0.76 for negative marker foods.
For the purpose of this study, the FIQ was adapted slightly to include some types
of food/drink often consumed by young adults (i. e. convenience food, fruit juice)
following feedback from pilot study respondents. Face and content validity of the
diet and health questionnaire was assessed by individual discussion with pilot
study respondents about the issues covered in the questionnaire and the clarity of the questions. Feedback from the pilot study resulted in modifications being made to the phrasing of some questions.
45
2.3 Assessing dietary intake
Despite having such a vital role in the health of the nation, as Garrow (1974)
states: 'the collection of dietary data from free-living subjects is one of the most difficult tasks a physiologist can undertake'. Dietary data is a fundamental aspect
of nutritional surveys, as it is used to inform policy and construct individual advice. There are a number of different methods, which can generally be divided into two
main groups; retrospective questionnaires, histories or recalls of usual diet, and
prospective diet records for a specific number of days (usually 3-7) which are
either weighed or quantified in household measures (Mann and Truswell 2002).
2.3.1 Methods to assess past intake
2.3.1.1 24-hour recall The 24-hour recall method requires subjects to recall the type and quantity of all the food and drink they consumed during the previous 24-hours. A trained
interviewer is required to extract this information with maximum accuracy from the
participant. The 24-hour recall originates from the work of Wiehl (1942), who used
a two-day quantitative diet history, which involved subjects describing all the food they consumed at meal times and in between meals.
There are several benefits associated with 24-hour recalls. Primarily, as it is a retrospective method, subjects cannot alter their actual intake whilst it is being
monitored (Pekkarinen 1970). It also does not rely on long-term recall of foods,
therefore increasing accuracy (Barret-Connor 1991). There is a risk that subjects may purposefully omit to mention certain foods consumed, but this may be kept to a minimum by not giving the subject any opportunity to plan ahead. This method can be carried out relatively quickly and cheaply compared to other methods, and requires minimum commitment from participants, which improves participation rate.
Controversy exists regarding the accuracy of the 24-hour recall, as single recalls are known to underestimate food intake and do not recognise daily variations in eating habits (Bingham 1987). However, collecting a number of 24-hour recalls from each participant on separate occasions can reduce these errors, making it a useful tool to be used in large-scale nutritional surveys (Balogh et al 1971).
"'E; II 'Y ZAI. iýý, ý-
216
46
2.3.1.2 Food frequency questionnaire An alternative retrospective method of dietary assessment is the food frequency
questionnaire (FFQ), designed to establish what subjects eat and how often they
eat it. The questionnaire usually consists of a list of foods and drinks on which
subjects report how often, on average, they consumed each item listed during a
specified period of time, usually the previous year. Each food is given a common
unit or portion size. For example the subject may be asked 'how often do you eat 1 slice of bread? ' and will be given a range of options from 'never or less than
once a month' to 'more than 6 times a day'. Alternatively, the respondent may be
asked 'how many times a week do you eat 1 slice of bread? ' Questions relating to
certain foods are broken down into the different types in order to assess food
choices in more detail. For example, bread may be broken down into sliced, rolls,
baguette, bagels, pitta etc, and into white, wholemeal and wholegrain.
The main disadvantage of the FFQ is there is a limit to the number of items that
can be included, so some foods will be missed. Many FFQs attempt to avoid this
by asking respondents to include anything else consumed at the end of the
questionnaire. Respondents may also experience difficulties reporting frequency
of intake for foods consumed irregularly (e. g. fish) (Norrish et al 1999).
2.3.1.3 Diet history The earliest accounts of diet history are by Turner (1940) and Burke (1947). The
method used most frequently is that of Burke (1947), which involves recalling past intake in three stages. The first two steps of the diet history are comparable to the 24-hour recall and food frequency questionnaire. Step 1 involves interviewing the subject to determine their usual daily eating habits. Data are recorded in household measures, with particular attention to frequency and variations of diet. Step 2 involves cross checking the data obtained in step 1 using a list of specific foods and food groups which the subject is questioned about regarding likes/dislikes and frequency of consumption. The final step involves subjects completing a 3-day food intake record. The diet history has been found to adequately measure energy intake compared to total energy expenditure measured using doubly labelled water (Spearman's r=0.59) (Sjoberg and Hulthen 2004). However other studies have found the diet history unsuitable for ranking intakes of individuals (Black et al 2000, Rothenberg et al 1998).
47

2.3.2 Methods to assess current intake
2.3.2.1 Weighed inventory
The weighed dietary record involves subjects keeping a record of everything they
eat and drink for a specified number of days (usually 3-7), and weighing each item
before consumption and any leftovers. The subject is also asked to give information about the brand of food or drink, and details about how each item is
prepared and cooked. For food and drink consumed away from home where it is
impractical to weigh items, subjects may be asked to include details about what
was consumed, the place of purchase and the price of items. Where possible, the
researcher can then buy and weigh corresponding portions. Alternatively, weights
of foods can be estimated based on either the weights of food consumed at home
given by the individual, or on average portion sizes (Livingstone et al 1990).
Until recently, weighed dietary records were considered to be the most accurate
method of collecting dietary data, as quantities of foods were weighed rather than
estimated using food photographs or models (Barber and Bull 1985). However,
more recent research has highlighted a number of potential errors. The weighed intake methodology often has a lower response rate and may result in subjects altering their u' sual dietary habits during the study due to the time consuming task
of weighing the food (Livingstone et al 1990).
2.3.2.2 Food diaries
Food diaries require subjects to record everything they eat and drink for a specified number of days. Brands of foods and household measures of portion sizes are recorded in the diary. Portion sizes are later estimated by subjects using food photographs or models. Many studies have found food diaries to be an accurate assessment tool (Bingham 1987, Toeller et al 1997), and they are more convenient for the respondent than weighing, which is likely to improve response rate. One problem with diaries is maintaining respondent compliance. Despite being more convenient than weighing, many respondents find recording food intake time consuming, so records may lack detail towards the end of longer recording periods (Gersovitz et al 1978). Three days are generally considered sufficient to collect reliable intake data.
48

2.3.3 Portion size assessment The main problem associated with most dietary assessment tools is estimating
portion size. Evidence suggests that subjects often experience difficulties in
recalling and quantifying dietary information accurately and may be influenced
consciously and/or unconsciously by various factors, resulting in under/over-
reporting (Wirfalt 1998). Previous research has revealed differences in the
perceptions of food portion sizes between males and females (Yuhas et al 1989,
Guthrie 1984), between overweight and normal weight subjects (Lansky and Brownell 1982) and between young and older subjects (Frobisher and Maxwell
2003). The rate of under/overestimation of portion sizes also varies between
different types of food (Wein 1990, Robinson et al 1997).
To minimise error in the estimation of portion size, various measurement aids may be used to act as memory cues, to improve recollection of the portion sizes
consumed. These may be 3-dimensional aids such as food models, household
measures or actual food samples; or 2-dimensional aids such as food
photographs, abstract shapes or computer graphics. The use of measurement aids require subjects to be able to relate the amount of food they actually
consumed to the aids (Biro et al 2002). However it may be postulated that even
with measurement aids, some subjects may indicate portion sizes that they
consider acceptable or normal to consume rather than recalling the size of portion
actually consumed. This might result in reports of larger portions of foods that have a positive health image and smaller portions of foods with a negative health
image.
Food photographs are a popular measurement aid as they can include a wide variety of foods, are more easily transportable than 3-dimensional food models and can be copied for inclusion in a food diary or food frequency questionnaire. Several studies have investigated the extent to which food photographs enable subjects to estimate their portion sizes accurately (Faggiano et al 1992, Nelson et al, 1994; 1996, Robinson et al 1997). However the results of these studies are inconclusive, with varying degrees of error between different food items. One of the main problems with these studies is that study designs do not reflect conditions in free-living subjects, in that subjects were asked to estimate portion size from photographs shortly after consuming the food (within 24-hours), whilst in
49
most nutritional surveys subjects are required to recall a number of meals consumed over several days (Robson and Livingstone 2000).
2.3.4 Translation of dietary data into nutrients When food intake and portion sizes have been determined, this can be translated
into nutritional and energy intake information and compared with recommended intakes. Chemical analysis of foods provides accurate estimations of food energy
and nutrients. However this technique is costly and time-consuming, and requires
a high level of commitment from the subject to store samples of all the foods
consumed. This method is therefore only suitable for small-scale studies. The
alternative is the use of food composition tables. The most widely used tables in
the UK are McCance and Widdowson's food tables (FSA 2002). Initially
developed over 60 years ago, there are currently nine supplements for specific food groups. This nutritional information is available on a number of databases
(e. g. MicrodietTM computer software). Food tables can only provide a general indication of average composition due to factors such as seasonal/geographical variation to growing conditions, changes in nutritional content due to storage and recipe/brand variations to processed food (Webb 2002). As new food products are developed, there is a limit to the number and range of foods that can be included in the food tables. Certain 'fashionable' foods/drinks may not be available in food
tables (i. e. cranberry juice, fresh pasta and fajitas have only recently been added to food databases).
When nutritional intakes have been estimated, they can be compared to Dietary Reference Values (DRV) to assess the adequacy of the diet of an individual or group. DRVs should be used as guidelines as opposed to recommendations for dietary intakes. DRV guidelines take into account the broad range of nutritional requirements of individuals within a population by defining more than one figure for each nutrient. Estimated Average Requirement (EAR) is the estimated average requirement of a group for a particular nutrient. Reference Nutrient Intake (RNI) is the amount of a nutrient (EAR +2 standard deviations) which is sufficient for most individuals (97.5% of the population). RNI exceeds the requirement of most people and habitual intakes above RNI are almost certainly adequate. Lower Reference Nutrient Intake (LRNI) is the amount of nutrient or energy (EAR minus 2 SD) which
50

is sufficient for only a few individuals (2.5%). Habitual intakes below LRNI will
almost certainly be inadequate.
2.3.5 Rationale for selected method of dietary assessment Diet histories were not considered to be suitable for this study, as they are
relatively time consuming, demanding a high level of co-operation from the
volunteer. During initial stages of the study it became evident that a method
requiring a high level of subject co-operation was unlikely to be adhered to.
Food frequency questionnaires usually require subjects to report frequency of
intake over a year, so were considered unsuitable for this study, as some subjects had only recently changed their dietary habits as a result of leaving home. The 3-
day food diary was initially selected as this method provides information regarding dietary behaviour as well as food intake, which, if recorded over two week days
and one weekend day, gives representative information about individual habitual
food intake (Bingham 1987). However, due to a poor rate of return of food diaries
and a lack of detail in some, 24-hour recalls were used in addition to food diaries,
so that food intake data was available for all respondents. Interview based 24-
hour recalls were carried out at appointments when measurements of nutritional
status were taken.
A photographic atlas of food portion sizes (Nelson et al 1997) was used to
estimate each respondent's food portion sizes. The use of food photographs can help to estimate portion sizes (Margetts et al 1989), although it was noted during
this study that the respondents' perceptions of their portion sizes appeared to be
affected by how hungry they were during the interview. Respondents who were interviewed after lunch appeared to indicate smaller portion sizes than those interviewed before lunch, which may result in biased results. This issue was investigated in a separate study (Beasley et al 2004). The results suggested that
satiety influenced respondent's perceptions of food portion size, with significant differences in perceptions of usual portion size before and after consumption of a preload observed for four of the six foods used (Appendix 9) Despite these limitations, food photographs were still considered to be the most appropriate too[ to help subjects estimate portion size.
51

2.3.6 Validation of dietary intake data
The value of numerous published dietary surveys is debatable since the
assumption has often been made that the method of dietary data collection gives
valid measures of habitual intake (Kaaks 1997). All methods of dietary
assessment are subject to a degree of systematic and random error, which needs to be considered when deciding which method is most appropriate. Random error
alone would balance out across the population sample. However systematic error is likely to occur and needs to be addressed. One of the major sources of
systematic error is under-reporting. All methods of dietary data collection tend to
under-report intakes, and under-reporting has been found to occur amongst 18%
to 54% of the population sample in large epidemiological surveys. It is particularly
prevalent amongst overweight and obese subjects (Macdiarmid and Blundell
1998). Some under-reporting is unintentional (i. e. subjects genuinely forget to
record some foods consumed) whilst others consciously omit certain foods from
their record. It is possible that some subjects might not record intake on days
when they consider their diet to be boring, but instead record days when they
consider their intake to be more interesting, which therefore does not reflect
average intake. This tendency to alter food habits due to observation is known as the 'Hawthorne' or 'experimenter' effect (Rosenthal and Rosnow 1991). This may be minimised by stressing the importance of honesty to the subject and
encouraging them not to alter their dietary habits or be selective in the foods they
report. In a study of four African populations from various geographical and
cultural backgrounds, Mennen et al (2000) found no evidence of under-reporting. It is possible that under-reporting is a western phenomenon, which occurs as a result of subjects wishing to appear to consume a 'socially acceptable' diet (i. e. the
consumption of a healthy and variable diet with minimal 'bad' foods).
It is therefore necessary to validate the method of dietary data collection used in
order to ensure information is as accurate as possible. The recommended method of validating dietary data is the use of biomarkers. Biomarkers give an indication
of the accuracy of nutritional intake information generated by a particular method of dietary assessment, as the measurement error of the biomarker is uncorrelated with the errors of the assessment method. They provide a physical measurement that cannot be influenced by the subject changing their habits whilst being
observed. Such biomarkers include 24-hour urinary nitrogen excretion and
52
doubly-labelled water. The doubly-labelled water technique enables the
measurement of total energy expenditure (TEE) under free-living conditions,
which, in weight stable subjects, should be equal to energy intake (El) (Goldberg
and Black 1998). Although this method can only test the accuracy of reported
energy intake, it is assumed that if energy intake is accurate, it is probable that
reported intake of nutrients is also accurate. This technique involves dosing
subjects with doubly-labelled water (2 H2 180), and collecting a urine sample following dosage. Complex laboratory techniques and a cost of E500 for one dose
for a 70kg subject rules out the use of doubly-labelled water for most projects.
Energy intake (EI) and basal metabolic rate (BMR) equations may also be used to
validate dietary intake data. These equations are based on the principle that in
weight-stable subjects, total energy expenditure is equal to energy intake
(TEE=El). Goldberg et al (1991) developed equations to validate dietary intake
data using energy intake and presumed energy requirements expressed as a
multiple of BMR (ELBIVIR). BMR can be determined using the Schofield equations (Schofield et al 1985). Cut-off points are then used to define limits below which a
person of a particular age, weight and sex could not live without loosing weight. These equations are therefore not suitable for subjects following a weight loss diet.
Cut-off 1 defines a minimum possible energy expenditure to test whether reported
energy intake is likely to be representative of long-term habitual intake. Energy
intake data is compared to BMR (EI: BMR), and a figure less than 1.35 is generally
not held to be compatible with weight maintenance and therefore indicates under- reporting dietary intake. Cut-off 1 does not allow for day-to-day variability in energy intake, so may define some subjects as under-reporters when in fact it is by
chance that their energy intake was low during the recording period. Cut-off 2 is a more stringent equation, which was developed to assess whether reported energy intake is a valid report of actual intake during the recording period. This cut-off requires an estimate of physical activity level (TEE/BMR or PAL), which provides a means by which activity levels can be compared directly. An average PAL of 1.55
can be used, which defines a sedentary lifestyle that is applicable to most subjects. Cut-off 2 allows for day-to-day energy intake variations, the number of days for which intake is recorded, the error associated with predictive BMR
calculations (as opposed to measured BMR) and the number of subjects in the sample (Goldberg et al 1991).
53
2.3.6.1 Methods selected for validation of dietary intake data
Estimates of total energy expenditure (TEE) and physical activity level (PAL) can be used to validate reported energy intake (El). However, obtaining accurate
physical activity data can be as problematic as recording dietary data. The use of
activity diaries requires a high level of co-operation, relies on memory, and short but frequent periods of activity that are part of daily routine may not be reported
accurately. Over-reporting activity level is also common, which is likely to be for
similar reasons as under-reporting dietary data (Briefel et al 1997). To obtain a
valid estimation of PAL that can be used to validate dietary data, an independent,
objective method is required. Some studies have used pedometers or
accelerometers for this purpose. However, these instruments are not suitable for
monitoring TEE during swimming/water sports or contact sports such as rugby. Food records were therefore validated using Black's (2000) definition of over-,
under- and acceptable reporters using the El: EE ratio. The Goldberg equations
were used, with cut-off 1 assessing whether reported El was representative of habitual intake, and cut-off 2 assessing whether reported El was a valid estimate
of the recording period.
2.3.7 Procedure for dietary intake assessment
* During the first meeting, volunteers completed an interview-based 24-hour
recall to describe their food intake on the previous day. For the longitudinal
study of university students' dietary habits, a further recall to describe their
usual dietary habits during a typical school day before they left home to begin university was completed. School days were used as opposed to weekends as it was felt that the routine of a weekday would facilitate the recollection of their food habits. A photographic food atlas (Nelson et al 1997) was used during the interview to aid portion size estimation,
Subjects were provided with food diaries and asked to record all food and drink consumed for two weekdays and one weekend day. The importance of recording everything consumed and not altering their dietary habits was stressed to volunteers. The problems encountered when collecting nutritional intake data were explained in order to involve volunteers in the research process with the aim of improving accuracy of food records.
54
Subjects were asked to record intakes on days that would represent their
usual food habits. If any event or illness disrupted their eating habits
significantly, they were asked to report this.
Subjects were asked to record the time of day that all food and drink was
consumed in order to assess the extent to which intake is determined by
daily routine.
Following the completion of food diaries, subjects were interviewed to
establish any further detail required regarding foods consumed, cooking
methods and brands. Portion sizes were estimated using the photographic food atlas.
To estimate BMR for validation, weight and height were measured
according to protocol described in 'Nutritional status assessment and
validation procedure' (page 61) and the Schofield equations (Schofield et al 1985) used.
55
2.4 Nutritional status assessment Nutritional status can be defined as 'the health status of individuals or population
groups as influenced by their intake and utilisation of nutrients' (Mann and
Truswell 2002). Nutritional status is often assessed alongside dietary intake to
give further detail regarding individual/population health status. Nutritional status
assessment can include taking anthropometric (i. e. weight, height, skinfolds etc. )
and/or biochemical (i. e. blood and/or urine samples) measurements which reflect
whether individuals have been consuming sufficient amounts of energy and
nutrients, as well as looking for clinical signs of nutritional deficiencies.
2.4.1 Anthropometric measurements 2.4.1.1 Weight
The measurement of weight alone gives minimal indication of whether an
individual is well nourished, as it is also dependent on height and the proportion of
fat and lean mass. Repeated measurements of weight may be used to track
changes, which reflect changes in nutritional status. Weight measurements often
fluctuate by a few kilograms over 24 hours due to various factors including levels
of hydration. Therefore, weight measurements for longitudinal studies should be
taken at the same time of day.
2.4.1.2 Height
Height measurements are used in childhood studies to assess growth rates. Poor
growth rates are an indicator of malnutrition. Height measurements are often used
with weight to calculate body mass index (BMI) (whether an individual is a healthy
weight for their height).
2.4.1.3 Body Mass Index (BMI)
Body Mass Index (BMI: weight (kg)lheight (m2)) is a quick and simple method of
assessing an individual's nutritional status (Figure 2.4a). It is not a direct measure
of fatness and may produce an inaccurate result in subjects with a high proportion
of lean mass/muscle, as is the case for athletes.
56
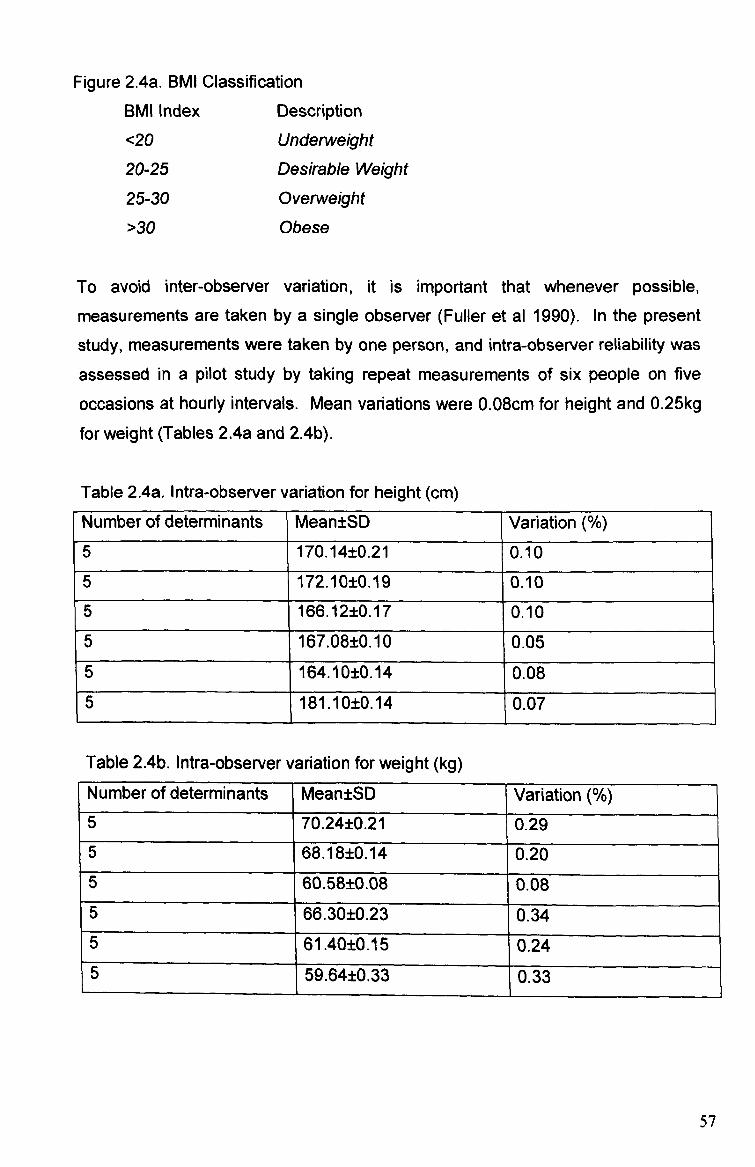
Figure 2.4a. BMI Classification
BMI Index Description
<20 Underweight
20-25 Desirable Weight
25-30 Overweight
>30 Obese
To avoid inter-observer variation, it is important that whenever possible,
measurements are taken by a single observer (Fuller et al 1990). In the present
study, measurements were taken by one person, and intra-observer reliability was
assessed in a pilot study by taking repeat measurements of six people on five
occasions at hourly intervals. Mean variations were 0.08cm for height and 0.25kg
for weight (Tables 2.4a and 2.4b).
Table 2.4a. Intra-observer variation for height (cm)
Number of determinants Mean±SD Variation
5 170.14±0.21 0.10
5 172.10±0.19 0.10
5 166.12±0.17 0.10
5 167.08±0.10 0.05
5 164.10±0.14 0.08 5 181.10±0.14 0.07
Table 2.4b. Intra-observer variation for weight (kg) Number of determinants Mean±SD Variation 5 70.24±0.21 0.29 5 68.18±0.14 0.20 5 60.58±0.08 0.08 5 66.30±0.23 0.34 5 61.40±0.15 0.24 5 59.64±0.33 0.33
57
2.4.1.4 Measurements of body composition Measurements of body composition allow nutritional status to be directly
assessed. Amounts of body fat and lean mass are particularly important for
identifying under/over nutrition. When measuring body composition, the body is
considered to consist of two compartments of fat and fat-free mass. Densitometry
(under-water weighing) involves submerging the subject in a purpose built tank of
water, and the weight of water displaced by the body, corrected for residual air in
the lungs, is used to determine the density of fat and fat-free mass in the body by
Archimedes principle. However, the high level of subject participation required for
this method often results in a poor response rate (Deurenberg 1992).
Dual-energy X-ray absorptiometry (DEXA) scanning, developed to diagnose
osteoporosis, can determine fat mass, lean mass, and bone mineral mass. This
method is considered to be a gold standard of body composition assessment, although the equipment required is not available to many studies (Deurenberg 1992).
The measurement of total body water enables an estimation of the proportion of lean and fat mass. A measured amount of a non-toxic substance (deuterium or
radioactive isotope of hydrogen) is allowed to disperse through the body water. The concentration of the chemical in a body fluid sample is then measured and the
amount of diluting fluid can be estimated.
Bioelectrical impedance is based on the fact that lean-mass is a better conductor of electricity than fat-mass. The passage of an electrical current through electrodes placed on the hands and feet enables the measurement of resistance to the current which can then be used to estimate body fat and lean body mass. Bioelectrical impedance has been found to be comparable to skinfold and underwater weighing methods of measuring body composition (Utter et al 2001, Kitano et al 2001). Furthermore, equipment is simple, inexpensive and portable.
The most widely used measurement of body composition is the measurement of a compressed double fold of fat and skin using skinfold callipers (Jebb and Elia 1993). Skinfold measurements provide an estimate of an individual's body density
58
which, in turn can estimate the level of total body fat using a calibration table or
formula. The most frequently used formula for this purpose is that of Siri (1956).
Skinfolds are often measured at triceps, biceps, subscapular and suprailiac
(Lohman et al 1988), although later studies have found that estimations of body fat
from the sum of just two skinfolds at biceps and triceps are comparable to
estimations using four sites, as the triceps are thought to be the most
representative of the level of subcutaneous fat on the whole body (Mann and
Truswell 2002). These two sites can also be reached easily if the subject wears a
short-sleeved top, whereas to take accurate subscapular and suprailiac
measurements, the subject would be required to undress, which reduces
participation (Jebb and Elia. 1993).
The accuracy of body fat estimations using skinfolds is dependent on a number of
factors. To minimise error, it is vital that the researcher is fully trained in order to
locate the correct measurement sites, and that a standardised protocol is followed
(Lohman et al 1988). It is also useful if measurements are completed by one
researcher using the same callipers, and are taken at the same time of day
throughout the study. There is no consensus regarding which side of the body to
measure skinfolds. No differences have been observed on any sites of the body
except for the arms, where minor differences observed are negligible in the
general population (Lohman et al 1988).
2.4.1.5 Validation of body composition The validation of anthropometric measurements to determine body composition is
problematical (Martin and Drinkwater 1991). The measurement of body density
using under water weighing (densitometry) and dual-energy X-ray absorptiometry
are considered to be the 'gold standards, but were considered impractical for use in this study as they require a high level of subject participation (Deurenberg 1992). Keys et al (1972) describe a correlation between skinfold thickness and BMI in a study of Minnesota students (r=0.850), although the use of skinfolds alone to validate BMI is not recommended, as it is not possible to determine levels
of fat and muscle using BMI. Bioelectrical impedance measured using the Bodysta, NR)1500 hand-held unit was used in this study to validate body composition estimates from skinfold measurements. Fuller et al (1994) found that BodystatO
59

was an accurate method of measuring body composition compared to
densitometry and deuterium dilution. For body fat estimation, the bias between
reference methods and predictions incorporating whole-body bioelectrical
impedance ranged from -7.6% to 8.1 %, with 95% limits of agreement up to 24.7%.
2.4.2 Rationale of methods selected for measurement of body composition
Subjects' height and weight were recorded, and Body Mass Index (BMI) calculated
(weight/heigh? ). Height was measured in centimetres using a portable
stadiometer (Harpenden) with subjects barefooted. Weight was measured in
kilograms using digital scales (Seca) with subjects barefooted and dressed in light
clothing.
Holtain TM callipers were used to measure skinfold thickness at triceps and biceps.
Lohman et al's (1988) protocol was used to determine measurement techniques.
The manual describes precisely where on the triceps and biceps the
measurements should be taken, and states that the measurement should be read
four seconds after applying the calliper. If pressure is applied for any longer than
four seconds it has been suggested that fluid will be forced out of the tissue
resulting in a smaller reading. Technical error of measurements generally
increases with age and levels of fatness of the subject (Lohman et al 1988).
A pilot study was carried out to assess the validity and reliability of the BodystatTm
bioelectrical impedance analysis unit compared to skinfold callipers for measuring body composition (Figure 2.4b). Subjects' body composition was measured at regular intervals during 48 hours using a Bodystat unit, and biceps and triceps
skinfold measurements. Measurements of body fat using bioelectrical impedance
are known to vary more throughout the day than skinfold measurements, as there
are a number of factors, such as hydration levels, which affect the measurement. Body fat percentage which was calculated from skinfold measurements remained constant (19.2%) during the 48 hours, and was slightly higher than body fat
percentage measurements from the BodystatTM . The BodystatTM measurements varied slightly during the 48 hours (17.0-18.6%).
60
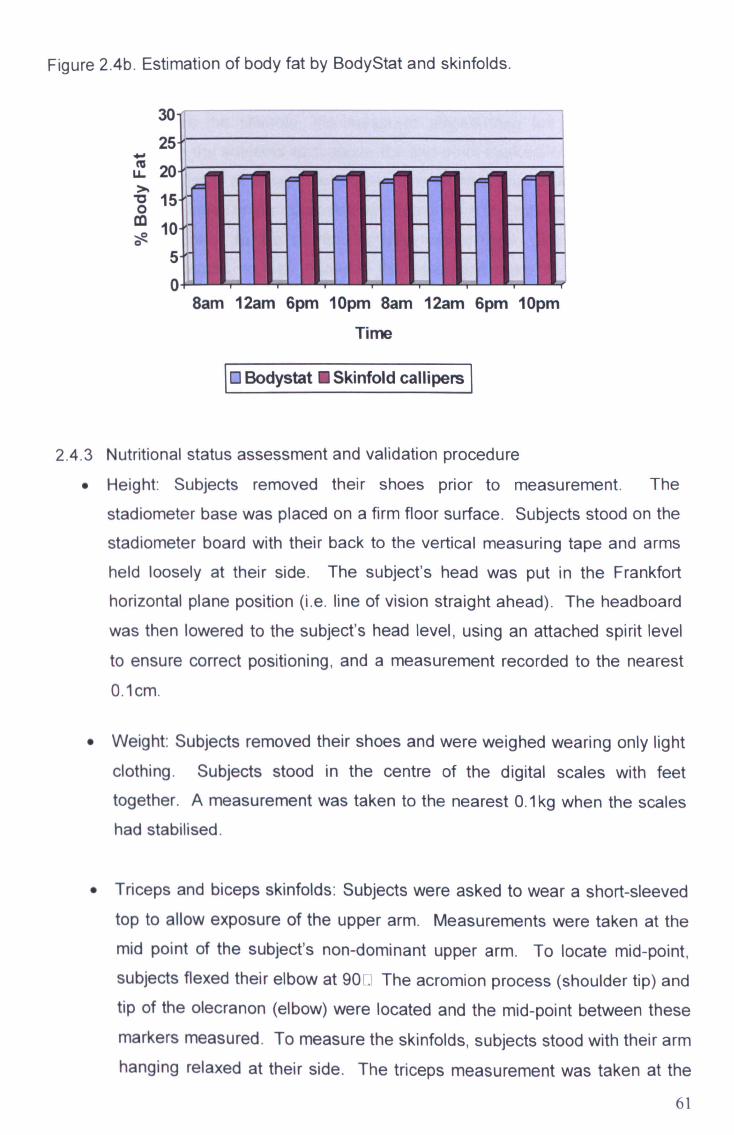
Figure 2.4b. Estimation of body fat by BodyStat and skinfolds.
4a LL 20
ö 15 co 10 0
0
Time
10 Bodystat 0 Skinfold callipem I
2.4.3 Nutritional status assessment and validation procedure Height: Subjects removed their shoes prior to measurement. The
stadiometer base was placed on a firm floor surface. Subjects stood on the
stadiometer board with their back to the vertical measuring tape and arms held loosely at their side. The subject's head was put in the Frankfort
horizontal plane position (i. e. line of vision straight ahead). The headboard
was then lowered to the subject's head level, using an attached spirit level
to ensure correct positioning, and a measurement recorded to the nearest 0.1 cm.
Weight: Subjects removed their shoes and were weighed wearing only light
clothing. Subjects stood in the centre of the digital scales with feet
together. A measurement was taken to the nearest O. 1kg when the scales had stabilised.
* Triceps and biceps skinfolds: Subjects were asked to wear a short-sleeved top to allow exposure of the upper arm. Measurements were taken at the
mid point of the subject's non-dominant upper arm. To locate mid-point, subjects flexed their elbow at 90
. The acromion process (shoulder tip) and
tip of the olecranon (elbow) were located and the mid-point between these
markers measured. To measure the skinfolds, subjects stood with their arm hanging relaxed at their side. The triceps measurement was taken at the
61
8am 12am 6pm lOpm 8am 12am 6pm lOpm

mid point of the back of the upper arm over the triceps muscle, and the
biceps measurement at the front of the upper arm over the biceps muscle. To measure the skinfold, the measurer placed their left palm (if right- handed) on the subjects' arm above the mid-point marked level, with thumb
and index finger pointing downwards. The skinfold was picked up with the
thumb and index finger approximately 1 cm above the marked level, and the
calipers applied to the skinfold at the marked level, with the tip of the
callipers located halfway between the base and crest of the fold. The
measurement was read four seconds after applying the callipers. Measurements were recorded to the nearest O. 1mm. Body fat was then
determined using the appropriate constants from the regression equations
of Durnin and Womersley (1974) using Siri's (1956) equation.
* Bioelectrical impedence: To validate body fat percentages estimated by
biceps and triceps skinfold measurements, subject's body fat was also
measured using bioelectrical impedence. Subjects removed their shoe and
sock from their right foot. Four electrode pads were placed horizontally on the subject's right hand, on the wrist (where the watch face sits) and at the base of the knuckle on the back of the hand; and on the right foot on the front of the ankle and below the second toe. The leads of the BodystatTM
unit were connected to the electrode pads. Subject's data was entered into
the BodystatTM (age, weight, height and physical activity level). Subjects
stood with legs apart and arms outstretched from their side whilst the
measurement was taken, Standard protocol states that subjects should lie horizontally with arms and legs outstretched whilst a measurement is taken. No bed/bench was available for subjects to lie on and it was not practical to
ask subjects to lie on the floor. Therefore, the accuracy of BodystatTM
measurements taken when standing was compared to horizontal
measurements. There was minimal difference between the two positions and it was considered appropriate to take measurements with subjects in a vertical position.
62
2.5 Blood Pressure
For over a century, the most commonly used method for measuring blood
pressure is the Korotkoff technique using a sphygmomanometer (O'Brien 2003).
This method is increasingly being replaced by automated devices that use the
oscillometric technique and do not depend on observer technique (Parati et al
2004). The oscillometric technique involves the detection of pulsations in the
artery when a cuff is inflated and deflated. A third technique is the
photoplethysmographic method, which measures blood pressure by inflating a
small cuff around the finger, but is not recommended due to the potential for
substantial error caused by vasoconstriction of the arteries (O'Brien et al 2002).
2.5.1 Methods selected for blood pressure assessment An automated blood pressure monitoring device was used for this study, as there is increasing evidence to support the accuracy of these devices (Graeftinger 1988). The accuracy of non-automated instruments is dependent on the observer having adequate training to interpret the korotkoff sounds, so the potential error from an untrained observer is high. One Nissei DS-1 15 digital blood pressure monitor was used throughout this study. This model has been compared to the
mercury sphygmomanometer and ausculatory technique (Crews and Harrison 1991) and assessed for long-term reliability (Reid 2003).
The measurement of blood pressure is very sensitive to physical and mental stress. There was a possibility that subjects' blood pressure may be slightly higher than usual if they were at all anxious/nervous about having their measurements taken. Some subjects' measurements were also taken during the university examination period and around the time of coursework deadlines, which might raise blood pressure. Whilst some factors that affect blood pressure levels, such as physical exercise and distractions can be controlled to a certain extent, stress levels cannot be controlled.
2.5.2 Blood pressure measurement procedure 9 Subjects were asked not to partake in any strenuous physical activity prior
to having their blood pressure measured, and were seated and rested for fifteen minutes before measurements were taken in a quiet room with no
63
distractions in order to minimise inaccurately high measurements as a
result of recent activity and stress due to a new, unknown situation.
* When subjects felt sufficiently relaxed, the cuff of the blood pressure
monitor was placed on the upper left arm, positioned with the bottom of the
cuff just above the elbow. The subject's arm was held outstretched and
supported at heart level.
9 The cuff was inflated, and a measurement recorded for systolic and diastolic blood pressure.
64
2.6 Cholesterol The body needs a certain amount of cholesterol to function, although too much
cholesterol increases the risk of developing heart disease. Total plasma
cholesterol consists of two components: low-density lipoproteins (LDL) and high-
density lipoproteins (HDL). HDL cholesterol clears cholesterol from the arteries to
the liver and LDL is excess cholesterol that accumulates and contributes to
hardening of the arteries.
Cholesterol can be measured from either venous or capillary blood samples. Venous blood samples usually require laboratory-based analysis, whilst capillary
samples are easier to take and can be assessed using desktop chemical
analysers with relative ease and speed (Herruer et al 1992). Kafonek (1996)
observed no differences in the coefficient of biological variability between capillary
and venous specimens (total cholesterol 5.2%). A number of reagent strip
analysers are available for capillary blood cholesterol analysis, including Reflotron TM and Accutrend GCTM (Roche Diagnostics). The precision of these instruments can be analysed using laboratory standardisation protocol, as defined by the National Cholesterol Education Panel (1990). This states that the
coefficients of variation for cholesterol determinations should be <5% and the deviations <± 5% of the true values. The accuracy of Reflotron TM was considered debatable before recalibration in 1987, with a 10% negative bias (Boerma et al 1988a). However, more recent studies have found the accuracy of Reflotron TM
improved with a maximum bias of 5% (Boerma 1988b). The main disadvantage of the Reflotron TM is it is not portable so cannot be transported for field studies. Blood specimens need to be collected and stored for later analysis. It was largely for this reason that Accutrend GCTM was used for this study to measure total cholesterol only, which was considered sufficient to detect changes in cholesterol levels as a result of altered dietary habits.
2.6.1 Methods selected for total blood cholesterol measurement The Accutrend GCTM is portable and a number of studies have supported the accuracy of this instrument. Gottschling et al (1995) compared cholesterol determinations using the Accutrend GCTM meter with results obtained from the cholesterol oxidase/p-aminophenazone method (CHOD-PAP) using capillary and venous blood. De Canizo et al (1996) compared the determination of cholesterol
65
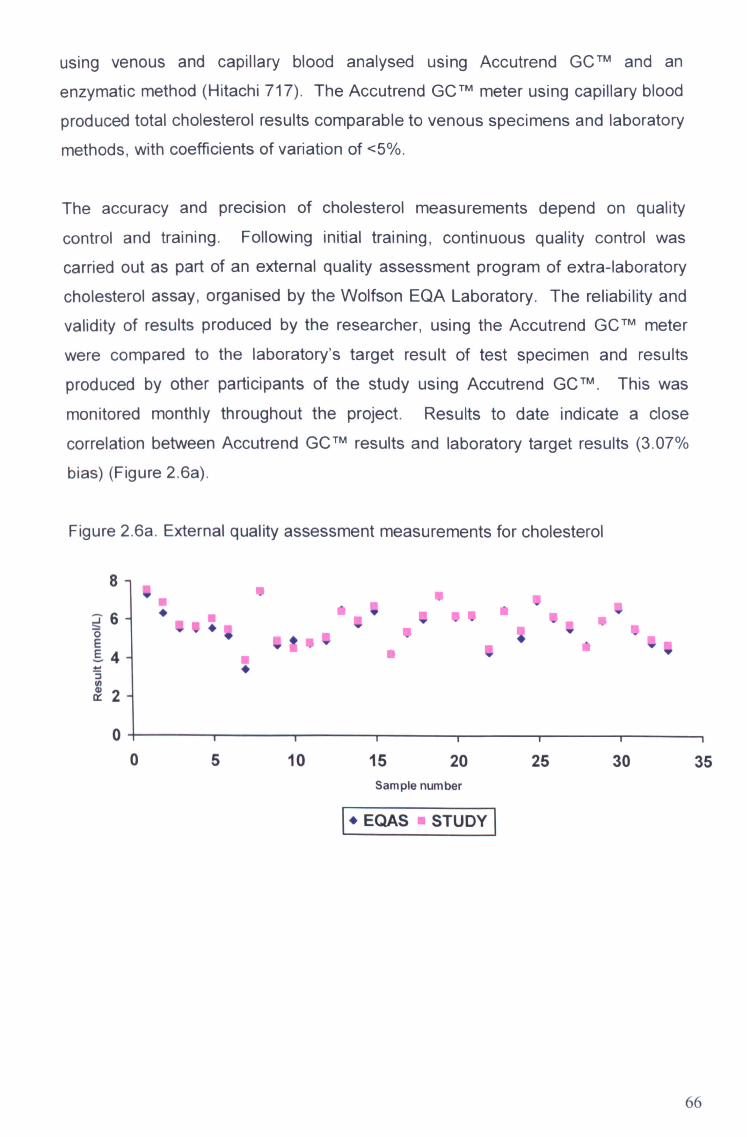
using venous and capillary blood analysed using Accutrend G CTm and an
enzymatic method (Hitachi 717). The Accutrend GCTM meter using capillary blood
produced total cholesterol results comparable to venous specimens and laboratory
methods, with coefficients of variation of <5%.
The accuracy and precision of cholesterol measurements depend on quality
control and training. Following initial training, continuous quality control was
carried out as part of an external quality assessment program of extra- la borato ry
cholesterol assay, organised by the Wolfson EQA Laboratory. The reliability and
validity of results produced by the researcher, using the Accutrend G CTM meter
were compared to the laboratory's target result of test specimen and results
produced by other participants of the study using Accutrend GCTM .
This was
monitored monthly throughout the project. Results to date indicate a close
correlation between Accutrend GCTm results and laboratory target results ( 3.07%
bias) (Figure 2.6a).
Figure 2.6a. External quality assessment measurements for cholesterol
v .4 111
6 1w 0 E
4
2
0 05 10 15 20 25 30
Sample number
I*EQAS STUDY
35
66

2.7 Haemoglobin
The most accurate method of assessing iron status is a bone marrow aspirate,
stained for iron (Provan and O'Shaughnessy 1999). However, this method is time-
consuming, expensive and uncomfortable for the subject, so is usually only used in a clinical setting. An alternative, less invasive measure of iron status is serum ferritin. Ferritin is the main iron storage protein, and the level of serum ferritin is
directly proportionate to the body's iron stores, which therefore provides an
accurate indication of iron status (Webb 2002). However, the measurement of serum ferritin requires a venous blood sample, which was considered likely to
reduce subject participation rates.
Iron status may also be assessed by the measurement of blood haemoglobin. Haemoglobin concentration provides a cruder indication of iron status, as it is less
sensitive to changes to iron stores. However, it is adequate to detect substantial changes to iron status in epidemiological studies and is of considerable clinical significance. The technique recommended by the international Committee for Standardisation in Haernatology (ICSH) and the World Health Organisation (WHO) is the cyanmethemoglobin method, which involves diluting blood in a solution containing potassium cyanide and potassium ferrecyanide. Although this is the recognised standard method it is unsuitable for the use in many research projects, as it requires venous blood and a skilled technician. Zhao and Yin (2003) compared the cyanmethemoglobin method with the HemoCue Tm B-Haemogblobin photometer, reporting minimal systematic error (18.4 +/- 6.1 g/L by capillary blood
samples). Morris et al (2001) found the HemoCue"111 meter to produce accurate measures of haemoglobin in anaernic and non-anaernic subjects. Furthermore, the HemoCue T" has been evaluated against the standard blood cell counter (BCC) method, which found the HemoCueTM to correlate well after an adjustment of 0.5 per dl. (Prakash et al 1999).
2.7.1 Methods selected for haemoglobin measurement The HemoCue TM system draws capillary blood into a disposable microcuvette containing dried reagents. Following insertion of the cuvette into the photometer, light is passed through the sample and the absorbance of methaernoglobinazide is measured, therefore estimating haernoglobin concentration.
67
2.8 Blood sampling procedure for total cholesterol and haernoglobin
measurement Before signing a consent form for finger-prick blood sampling, subjects
were asked if they had ever had a reaction to blood sampling in the past (i. e. fainting at the sight of blood).
e Subjects were asked to wash their hands in warm water prior to
measurement in order to cleanse the hands and increase blood circulation to the fingertips. Subjects whose hands still felt cold were asked to move their fingers to aid circulation.
Subjects were seated throughout the sampling procedure. The pad of the
middle finger on the dominant hand was wiped with a disposable alcohol wipe and dried with a tissue. The finger was punctured at the side of the
pad with an autoclix using a disposable lancet.
The first drop of blood was wiped away as the blood directly under the skin has a higher water concentration. A second drop of blood was allowed to
accumulate and was applied to the reagent strip of the Accutrend GCTM
meter. A measurement of total cholesterol was taken.
The next drop of blood to accumulate was drawn into a capillary action Hemocue TM
microcuvette. Any excess blood on the exterior of the
microcuvette was wiped away and it was then loaded into the Hemocue TM
photometer. A measurement of haemoglobin was taken.
All contaminated items were disposed of in a biological box immediately
after use. The researcher wore disposable gloves for each measurement.
* In the case of any abnormal results, subjects were advised to seek medical advice.
68
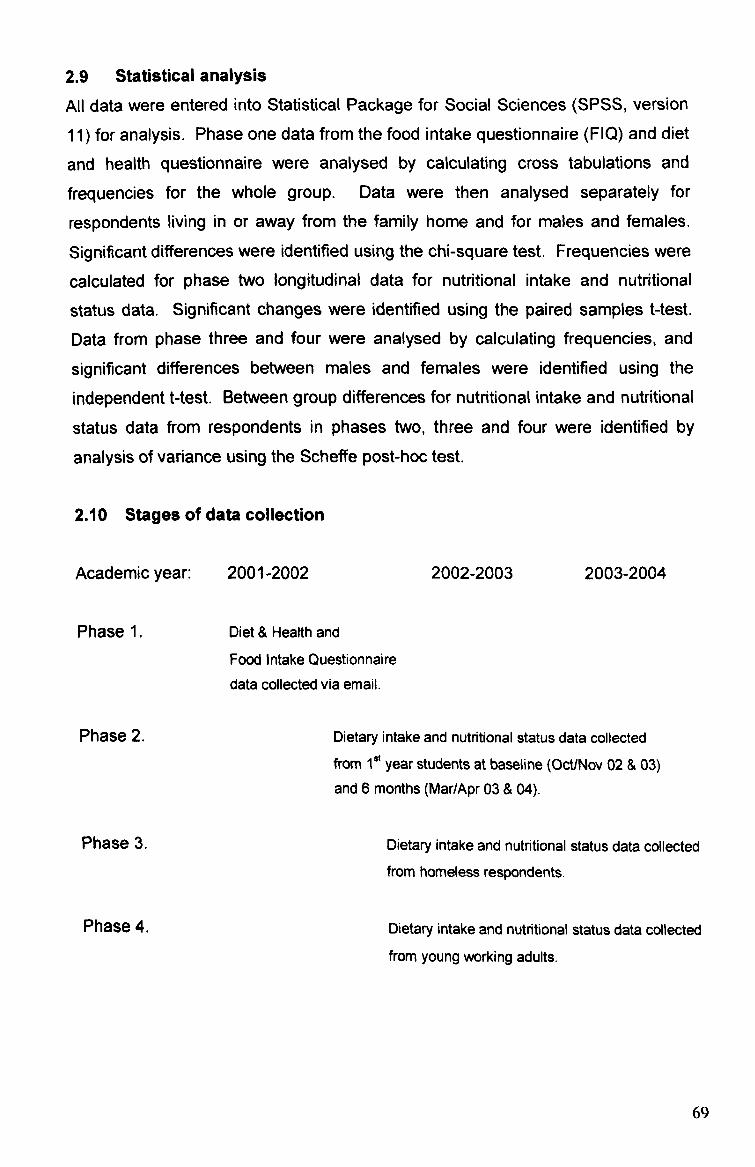
2.9 Statistical analysis All data were entered into Statistical Package for Social Sciences (SPSS, version 11) for analysis. Phase one data from the food intake questionnaire (Fla) and diet
and health questionnaire were analysed by calculating cross tabulations and frequencies for the whole group. Data were then analysed separately for
respondents living in or away from the family home and for males and females.
Significant differences were identified using the chi-square test. Frequencies were
calculated for phase two longitudinal data for nutritional intake and nutritional
status data, Significant changes were identified using the paired samples Mest.
Data from phase three and four were analysed by calculating frequencies, and
significant differences between males and females were identified using the
independent Mest. Between group differences for nutritional intake and nutritional
status data from respondents in phases two, three and four were identified by
analysis of variance using the Scheffe post-hoc test.
2.10 Stages of data collection
Academic year: 2001-2002 2002-2003 2003-2004
Phase 1. Diet & Health and
Food Intake Questionnaire data collected via email.
Phase 2. Dietary intake and nutritional status data collected from 1" year students at baseline (Oct/Nov 02 & 03)
and 6 months (Mar/Apr 03 & 04).
Phase 3. Dietary intake and nutritional status data collected from homeless respondents.
Phase 4. Dietary intake and nutritional status data collected
from young working adults.
69

3.0 RESULTS
70

3.1 Health behaviour and food intake questionnaire
3.1.1 Introduction
An individual's dietary habits begin to develop during childhood and adolescence,
and are likely to be determined by both nature (the development of sensory
perceptions) and nurture (parental influence, and later on, the influence of peers).
However, diet is likely to evolve throughout the lifecycle as circumstances change
and new influences affect an individual's lifestyle. An example of this is the
changes in diet that occur as a result of the transition young people make after
moving away from the family home into independent living. Leaving behind the
meals provided and cooked by parents/guardians and learning how to shop on a
budget and prepare and cook food for themselves may result in the adoption of
poor eating habits, and have a detrimental effect on health. The removal of the
restrictions of parental control may also result in the adoption of unhealthy lifestyle
practices such as smoking and excessive alcohol consumption. This study
therefore seeks to investigate the differences in health behaviour and food choices
between young people, aged 18-30 years, who live in the family home and those
who live independently.
3.1.2 Methods
To investigate the health behaviour of young people, a questionnaire was designed to assess the frequency of positive and negative health behaviours. The
questionnaire asked respondents to give details about their living arrangements to
enable comparisons to be made between those living independently or at home.
Respondents were categorized into socio-economic groups using their parent's
occupation. For the purpose of this study, the Registrar General's classification of
socio-economic status (OPCS 1991) was divided into four groups; 'High',
'Medium', 'Low' and 'U nemployed/Reti red'. Questions were asked about their
average monthly alcohol intake, smoking and physical activity. In addition, they
were asked indirect questions which would give an insight into the healthfulness of their lifestyles such as usual mode of transport and consumption of take-away and convenience foods. The questionnaire was piloted on a sample of 18-30 year olds, and the options for some answers were changed slightly (see Methodology,
page 45).
71

Dietary habits and food choices were assessed using an adapted version of a
previously validated Food Intake Questionnaire (FIQ) developed by Johnson et al
(2001). The FIQ is designed to assess the food and drink consumed by subjects
during the previous 24-hours (see Methodology, page 45). In order to identify
those subjects with good, average or poor eating habits, data was taken from the
FIQ and recoded into positive or negative food markers. The positive food
markers included foods that young people are usually advised to eat more of (i. e.
low-fat, low-sugar, high fibre foods), and the negative markers included foods
which young people are recommended to limit their intake of (i. e. high-fat, sugary,
salty, low fibre foods). The number of positive and negative marker foods
consumed by each respondent was then calculated. Subjects identified in the
upper tertile of the positive food marker group and lower tertile of the negative food
marker group (i. e. those who consumed the most positive foods and the least
negative foods) were included in the 'more desirable' food choice group.
Conversely, subjects identified in the lower tertile of the positive food marker group
and the upper tertile of the negative marker group were included in the 'less
desirable' food choice group. The categorisation of subjects into these diet groups does not indicate that the diets of subjects in either groups are nutritionally
adequate or inadequate, but does suggest that people in the 'more desirable'
group are likely to be consuming foods low in fat and sugar and high in fibre, and
vice-versa for subjects in the 'less desirable' group.
Questionnaires were distributed via e-mail to five hundred students at Liverpool John Moores University. Subjects were selected from the student e-mail address book (grouped by the course they were enrolled on) from various courses taught at the university. Subjects were asked to forward the questionnaires to their friends/relatives of the required age range (18-30 years) who were not students, in order to gain responses from a broadly based sample of young people. Questionnaire data were entered into Statistical Package for Social Sciences for analysis. Cross tabulations and frequencies were calculated for the whole group and separately for respondents living in or away from the family home and for males and females.
72
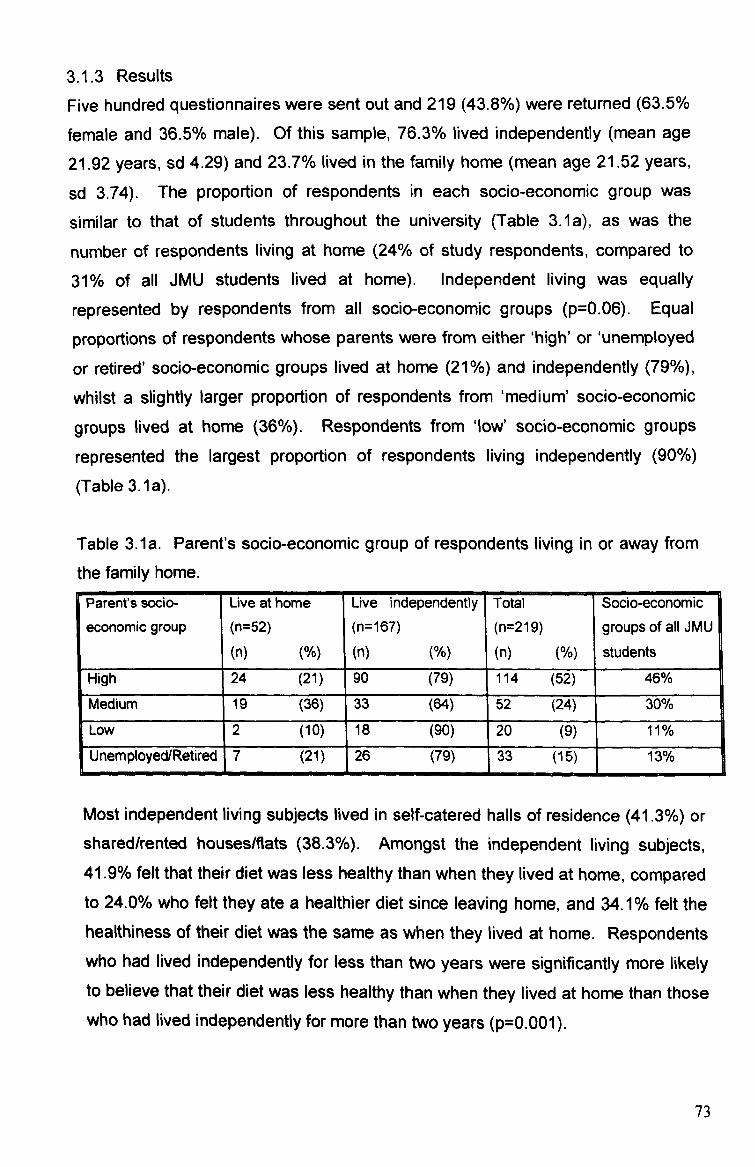
3.1.3 Results
Five hundred questionnaires were sent out and 219 (43.8%) were returned (63.5%
female and 36.5% male). Of this sample, 76.3% lived independently (mean age
21.92 years, sd 4.29) and 23.7% lived in the family home (mean age 21.52 years,
sd 3.74). The proportion of respondents in each socio-economic group was
similar to that of students throughout the university (Table 3.1a), as was the
number of respondents living at home (24% of study respondents, compared to
31% of all JMU students lived at home). Independent living was equally
represented by respondents from all socio-economic groups (p=0.06). Equal
proportions of respondents whose parents were from either 'high' or 'unemployed
or retired' socio-economic groups lived at home (21%) and independently (79%),
whilst a slightly larger proportion of respondents from 'medium' socio-economic groups lived at home (36%). Respondents from ' low' socio-economic groups
represented the largest proportion of respondents living independently (90%)
(Table 3.1 a) -
Table 3.1a. Parent's socio-economic group of respondents living in or away from
the family home.
Parent's socio-
economic group
Live at home (n=52) (n)
Live independently
(n= 167) (n) N
Total (n=219) (n)
Socio-economic
groups of all JMU
students High 24 (21) 90 (79) 114 (52) 46%
Medium 19 (36) 33 (64) 52 (24) 30%
Low 2 (10) 18 (90) 20 (9) 11% Unemployed/Retired 17 (21) 26 (79) 33 (15) 13%
Most independent living subjects lived in self-catered halls of residence (41.3%) or shared/rented housesMats (38.3%). Amongst the independent living subjects, 41.9% felt that their diet was less healthy than when they lived at home, compared to 24.0% who felt they ate a healthier diet since leaving home, and 34.1 % felt the healthiness of their diet was the same as when they lived at home. Respondents who had lived independently for less than two years were significantly more likely to believe that their diet was less healthy than when they lived at home than those who had lived independently for more than two years (p=0.001).
73

3.1.3.1 Questionnaire: Part 1- Health and Lifestyle
When asked how healthy they considered their diet and lifestyle to be, most
respondents perceived their diet and lifestyle to be 'moderately healthy' (61 % of all
respondents), whilst 21% of all respondents considered their diet and lifestyle to
be 'moderately unhealthy'. There was no significant difference between
respondents living at home or independently (p>0.05).
More respondents who lived independently reported consuming alcohol in excess
of recommendations (p=0.05). Of the independent living subjects, 10.8% reported
consuming more than the recommended weekly level of alcohol (21 units/week - females, 28 units/week - males), compared to 3.8% of those who lived at home.
This was also reflected in the number of respondents who stated that they were
teetotal (8.4% of independent living respondents compared to 17.3% who live at
home). Alcohol consumption amongst respondents who lived independently was
lower in those who had lived away from home for longer (p=0.01). Smoking was
more common amongst subjects living independently (p=0.00); 26.9% of
respondents living independently smoked everyday compared to 7.7% of
respondents living at home.
There was no significant difference in the reported amount of physical activity
taken by respondents living at home or independently (p=0.12), although
respondents living independently were more likely to report using an active mode
of transport (i. e. walking or cycling) (p=0.00). Most respondents living
independently stated that their main mode of transport was walking or cycling (47.9% compared to 19.2%) (p=0.00), which added to their level of physical
activity, whilst more respondents living at home used a car as their main mode of transport (51.9% compared to 18.6%) (p=0.00) (Table 3.1b). Males claimed to
take more physical activity than females (p=0.03). Amongst male respondents, 10% stated that they exercised for at least 20 minutes everyday, compared to 4%
of females, and 28% of males exercised for at least 20 minutes 4-6 times a week,
compared to 16% of females.
74

Table 3.1 b. Primary mode of transport of respondents living at home and
independently
Car (n) N
Walk/cycle
(n) M Public transport (n) N
Live Independently 31 (18.6) 80 (47.9) 55 (32.9)
Live at Home 27 (51.9) 10 (19.2) 13 (25.0)
3.1.3.2 Questionnaire: Part 2- Food Intake
Subjects were asked to recall what they had consumed during the previous 24-
hours by ticking 'yes' or 'no' against each food and drink to indicate whether or not
they had consumed it. These results were then analysed to identify differences in
the foods consumed by respondents living at home or independently (Table 3.1c).
Significant differences in reported consumption were found for 3 foods; biscuits
(p=0.05), cake (p=0.05) and crisps (p=0.02), indicating that respondents living at
home were more likely to report consuming these high fat snack foods than those
living independently. Respondents living independently were more likely to report
consuming vegetables, although this result was not significant (p=0.06). A third of
respondents living independently reported not consuming breakfast the previous day, which is likely to have an adverse effect on cognitive performance throughout
the day (Bellisle 2004). Less than a third of both groups reported consuming brown/wholemeal bread, but white bread was reported to have been consumed by
almost two thirds of respondents living independently and half of those living at home. A higher proportion of respondents from both groups reported consuming full fat margarine or butter as opposed to low fat spread. Around half of
respondents from both groups reported adding sugar to their drinks and food, and
around a third added salt to their food.
Bearing in mind the recommendation to consume at least five portions of fruit and vegetables every day, it is of concern to note that 38% of respondents living independently and 39% respondents living at home consumed no fruit, and 19% of respondents living independently and 31% of respondents living at home reported
consuming no vegetables. Furthermore, 14% of respondents living independently and 10% of respondents living at home reported consuming neither any fruit nor
vegetables.
75
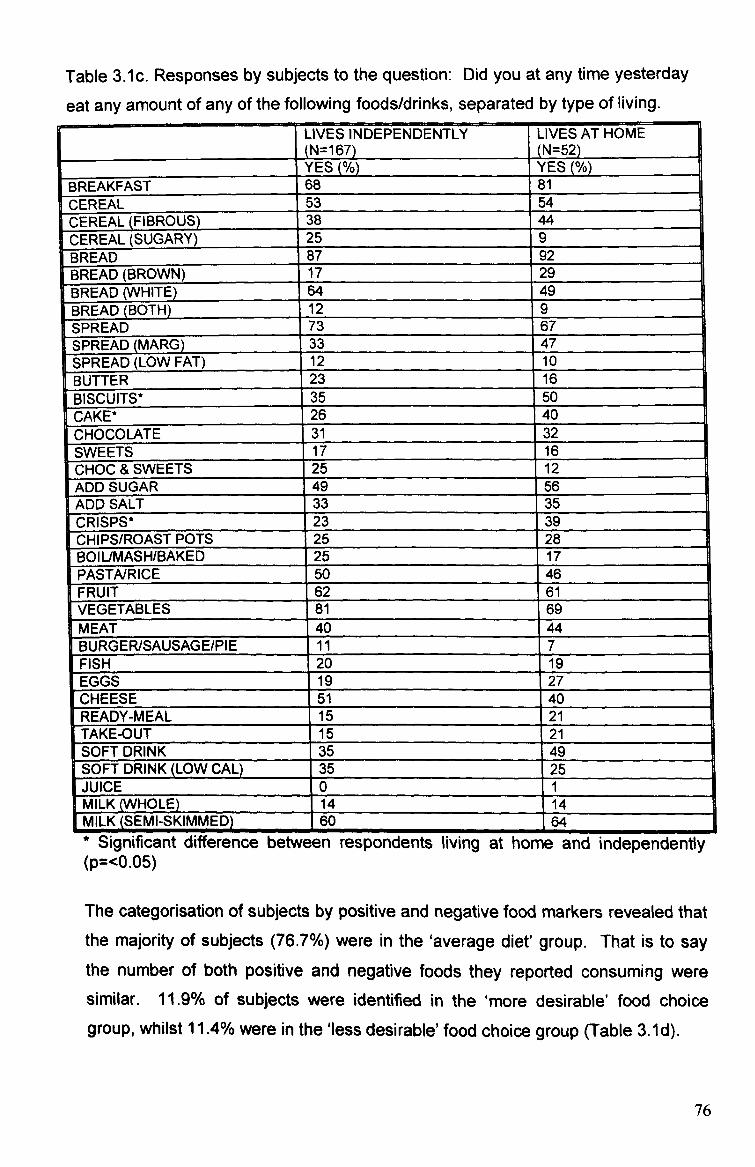
Table 3.1c. Responses by subjects to the question: Did you at any time yesterday
eat any amount of any of the following foods/drinks, separated by type of living.
LIVES INDEPENDENTLY (N=167)
LIVES AT HOME (N=52)
[
YES(%) YES(%) BREAKFAST 68 81 CEREAL 53 54 CEREAL (FIBROUS) 38 44 CEREAL (SUGARY) 25 9 BREAD 87 92 BREAD (BROWN) 17 29 BREAD (WHITE) 64 49 BREAD(BOTH) 12 9 SPREAD 73 67 SPREADIMARG) 33 47 SPREAD (LOW FAT) 12 io BUTTER 23 16 BISCUITS* 35 50 CAKE* 26 40 CHOCOLATE 31 32 SWEETS 17 16 CHOC & SWEETS 25 12 ADDSUGAR 49 56 ADD SALT 33 35 CRISPS* 23 39 CHIPS/ROAST POTS 25 28 BOIUMASH/BAKED 25 17 PASTAIRICE 50 46 FRUIT 62 61 VEGETABLES 81 69 MEAT 40 44 BURGER/SAUSAGE/PIE 11 7 FISH 20 19 EGGS 19 27 CHEESE 51 40 READY-MEAL 15 21 TAKE-OUT 15 21 SOFT DRINK 35 49 SOFT DRINK (LOW CAL)_ 35 25 JUICE 0 1 MILK (WHOLE)
. 14 14
MILK (SEMI-SKIMMED) 60 64 * Significant difference between respondents living at home and independently (p=<0.05)
The categorisation of subjects by positive and negative food markers revealed that the majority of subjects (76.7%) were in the 'average diet' group. That is to say the number of both positive and negative foods they reported consuming were similar. 11.9% of subjects were identified in the 'more desirable' food choice
group, whilst 11.4% were in the'less desirable'food choice group (Table 3.1d).
76

Table 3.1d. Tertiles of reported consumption of positive and negative food
markers.
NEGATIVE FOODS
POSITIVE FOODS
Highest (n)
Middle
(n) N Lowest
(n) N
Lowest 25 11.9* 13 5.9 5 2.2
Middle 52 23.7 17 7.7 19 8.6
Highest 42 19.1 21 9.5 25 11.4A
* More desirable food choice group ALess desirable food choice group
Despite the number of respondents reporting consuming no fruit and/or
vegetables, the most frequently reported positive foods were still vegetables
(78.5%) and fruit (62.1%), (Table 3.1e). The reported consumption of fibrous
breakfast cereals such as Shredded Wheat or Fruit and Fibre was higher than
sugary cereals such as Coco-Pops or Frosties, (42.9% reported consuming fibrous
cereal compared to 10.5% consuming sugary cereal). The number of respondents
who reported consuming brown/wholemeal bread (35.6%) was, however, lower
than the number reporting to have consumed white bread (52.5%). The number of
respondents who reported consuming boiled, baked or mashed potatoes was low
(19.2%). Subjects were more likely to report consuming potatoes in the more
unhealthy forms of chips (31.5%) or crisps (26.5%). The most frequently reported
negative food was chocolate and/or sweets, with 62.6% of subjects reporting
consuming chocolate or sweets, and 15.0% of these subjects reporting consuming both. Half of the respondents reported adding sugar to their drinks and/or breakfast cereals and a third reported adding salt to their food, thus reducing the
beneficial effect of choosing a healthy option (i. e. cereal).
77
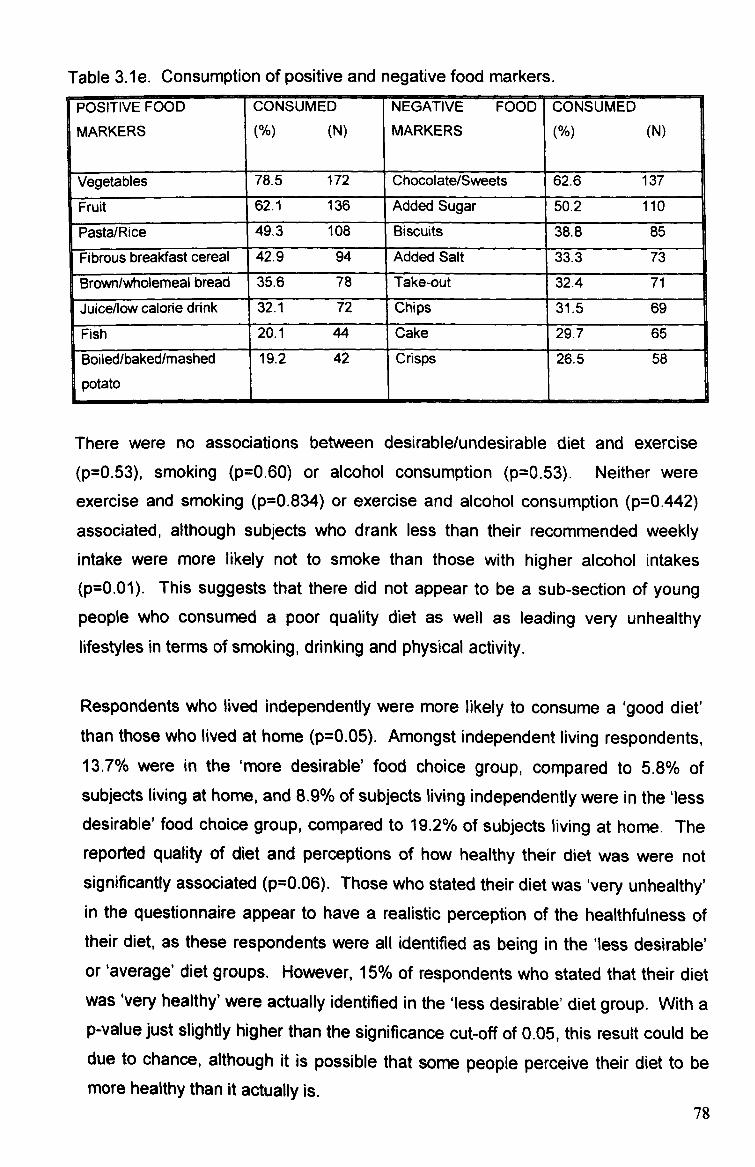
Table 3.1 e. Consumption of positive and negative food markers. POSITIVE FOOD
MARKERS
CONSUMED N (N)
NEGATIVE FOOD MARKERS
CONSUMED N (N)
Vegetables 78.5 172 Chocolate/Sweets 62.6 137
Fruit 62.1 136 Added Sugar 50.2 110
Pasta/Rice 49.3 108 Biscuits 313.8 85
Fibrous breakfast cereal 42.9 94 Added Salt 33.3 73
Brown/wholemeal bread 35.6 78 Take-out 32.4 71
Juice/low calorie drink 32.1 72 Chips 31.5 69
Fish 20.1 44 Cake 29.7 65
Boiled/baked/mashed
potato
19.2 42 Crisps 26.5 58
There were no associations between desirable/undesirable diet and exercise (p=0.53), smoking (p=0.60) or alcohol consumption (p=0.53). Neither were
exercise and smoking (p=0.834) or exercise and alcohol consumption (p=0.442)
associated, although subjects who drank less than their recommended weekly intake were more likely not to smoke than those with higher alcohol intakes (p=0.01). This suggests that there did not appear to be a sub-section of young people who consumed a poor quality diet as well as leading very unhealthy lifestyles in terms of smoking, drinking and physical activity.
Respondents who lived independently were more likely to consume a 'good diet'
than those who lived at home (p=0.05). Amongst independent living respondents, 13.7% were in the 'more desirable' food choice group, compared to 5.8% of
subjects living at home, and 8.9% of subjects living independently were in the'less desirable' food choice group, compared to 19.2% of subjects living at home. The
reported quality of diet and perceptions of how healthy their diet was were not significantly associated (p=0.06). Those who stated their diet was 'very unhealthy' in the questionnaire appear to have a realistic perception of the healthfulness of their diet, as these respondents were all identified as being in the 'less desirable' or'average' diet groups. However, 15% of respondents who stated that their diet was 'very healthy' were actually identified in the 'less desirable' diet group. With a p-value just slightly higher than the significance cut-off of 0.05, this result could be due to chance, although it is possible that some people perceive their diet to be
more healthy than it actually is. 78

Questionnaire and FIQ data were analysed for differences between males and
females. Males were more likely to partake in physical activity on a regular basis
(p=0.03). More females than males were identified in the 'good' diet group
(p=0.05), although there was no significant difference in the number of males and females in the 'bad' diet group. Table 3.1f shows the significant differences found
between male and female responses for six food types. These results generally
indicated that females were more likely to report avoiding foods with a negative health image. 35% of females did not report consuming any type of spread
compared to 17% of males (p=0.02) and more males reported consuming biscuits
(p=0.01). Females were more likely to consume low-calorie soft drinks than males
(p=0.00) and more males than females consumed full fat milk, and vice-versa for
semi-skimmed milk (p=0.01). Amongst females, 67% consumed fruit compared to
53% of males (p=0.05), although there was no significant difference in vegetable consumption (males 77.5% and females 79.1 %). Males were more likely to
consume meat than females (p=0.00).
Table 3.1f. Significant differences between responses of males and females. FEMALE(%) MALE (%) P-VALUE
Exercise xerc-se l Everyday 4 10
F
4-6/wk 16 28 0.03
r Spread consumed? r No 35 17 0.02
Biscu its consumed? Yes 32 50 0.01
Fruit consumed? Yes 67 53 0.05
Meat consumed? No 41 25 0.00
Soft drinks consumed? Low-calorie 44 15 Regular 52 48 0.00
Type of milk consumed Full-fat 9 22
Semi-skimmed 10.01
3.1.4 Discussion
It would appear from these results that although a young person's diet may undergo some changes when they leave home, particularly in the first few years, the quality of their diet does not inevitably deteriorate significantly. This study highlighted differences in the types of foods consumed by those living at home and
79
independently. The higher consumption of meat and potatoes by respondents
who lived at home suggests that their dietary patterns may be based around more
traditional meat, potato and vegetable based evening meals, although the meat
dish was often a ready-meal as opposed to fresh meat, and a lack of vegetables
was also evident. This may be evidence of the traditional family meal evolving from freshly prepared meat, potato and vegetables to a meal more suited to a
busy family lifestyle of ready-prepared meat and potatoes with vegetables being
omitted, possibly due to the extra preparation time involved. It is possible that
those living at home were less restricted in their food choices by a limited budget,
as the main food shopping was usually bought by their parents who were likely to
have a larger food budget than the average young person (Ainley and Ashford
1991). Those living at home were also more likely to have better kitchen facilities
and a wider range of cooking equipment than those in rented accommodation,
who often share crowded kitchens and have limited equipment and food storage
space available. In comparison, respondents living independently, who may be
more limited by a food budget and kitchen facilities, were more likely to consume less 'traditional' foods such as pasta and rice based meals. These types of meals
are quick and easy to prepare for people who cater just for themselves, and may
also reflect a lack of more advanced cooking skills.
This study did not highlight any particularly poor food choices amongst
respondents living independently, although nutritional intake information is needed to investigate this in more detail. However, a more negative pattern of reported consumption was observed in those living at home, with significantly more respondents reporting consuming snack foods such as cake, biscuits and crisps and significantly fewer reporting consumption of vegetables. When compared to data collected using a similar FIQ for adolescents aged 11-13 years (Johnson 2001) and 13-14 years (Hackett et al 1997), the rate of vegetable consumption by
children and young adults appears to increase with age, whilst fruit consumption decreases with age.
This is reflected in NDNS data (Gregory et al 2000, Henderson et al 2003), which indicates that the consumption of most vegetables increases with age whilst fruit decreases with age from childhood to early adulthood until approximately 25 years when fruit consumption also begins to increase. This may be because the
80
sweetness of fruit appeals to children's developing sensory perceptions to a
greater extent than vegetables. Parents may also give children fruit as a snack, but as the child grows up they might develop a preference for chocolate and
sweets as snack foods. The increased consumption of vegetables during early
adulthood, after leaving home could be due to vegetables being easier to include
as part of a meal than fruit, whilst chocolate/sweets continue to be the preferred
choice of many to satisfy a sweet tooth (i. e. for snacks and puddings). The fact
that fruit is generally more expensive than vegetables may also be an influential
factor. Foods such as crisps, cake and biscuits are also more convenient snacks than fruit for young people who are likely to be studying/working away from home
during the day. Whilst fruit may be easily bruised during transportation, crisps,
cake and biscuits are packaged to minimise crumbling. These less healthy snack foods are also more widely available and often cheaper to purchase individually in
shops/food outlets for those who do not plan ahead and take food from home to
consume through the day. The proportion of respondents who did not report
consuming any fruit or vegetables the previous day was comparable to the
findings of NDNS data of 38% males and 36% females who reported consuming less than one portion of fruit and vegetables per day.
The lower numbers consuming alcohol and smoking amongst respondents who live at home may indicate that their lifestyle is still influenced to a certain extent by their parents. However, alcohol consumption was lower in respondents who had lived away from home for longer (p=0.01), indicating that individuals may develop
more responsible habits as they become established in independent living. The frequency of smoking and excessive alcohol consumption by the study sample was lower than reported national rates of smoking and exceeded recommended weekly alcohol limits of 19-24 year olds, in the National Diet and Nutritional Survey (Henderson et al 2003). 29% of 19-24 year olds were reported to smoke on a daily basis in the NDNS, which was similar to the rate of smoking reported by respondents living independently in this study (26.9%), but was higher than the 7.7% of respondents living at home who reported smoking daily. The NDNS reported 46% of 19-24 year olds regularly exceed their weekly alcohol limit, compared to just 10.8% of respondents living independently and 3.8% of respondents living at home in this study. This may be due to study respondents underreporting their drinking patterns, possibly for similar reasons as reported for
81
underreporting negative foods in dietary intake records (if they feel their intakes
are excessive so therefore report less/omit to report consumption). It could also
be possible that the 'healthy volunteer effect' (individuals who lead unhealthy
lifestyles may be less likely to volunteer for a health related project) was more
influential in the present study than in NDNS.
There was evidence of very excessive drinking by 10% of males and 2% of
females who reported consuming between 50 - 75 units/week. However, there
was also evidence of sensible drinking habits, with 12% of males and 8% of
females being teetotal, and a further 68% of males and 72% of females consuming
alcohol within the weekly limit. These results therefore suggest that not all young
people partake in excessive drinking behaviour as frequently as previously
reported (Guardian 2000, HERO 2003). This study found that there were no
associations between food choice group and smoking, alcohol consumption and
physical activity level, which suggests that young people might attempt to make
healthy choices in at least one diet/lifestyle factor, possibly to compensate for
another area of their diet/lifestyle that is unhealthy. Alternatively, it may also be
suggested that the factors influencing health behaviour are different to those which
influence food choice, or the perceptions of the health benefits of not smoking, limiting alcohol consumption and regular physical activity may be different to the
perceived health benefits of good dietary habits.
A number of significant differences were highlighted in this study regarding the
food choices of males and females. The tendency for young females to be more likely than males to report avoiding foods with a negative health image and consuming more foods with a positive health image has been widely reported (Milligan et al 1998, Shepherd and Dennison 1996). These results suggest that females were more health conscious than males. This study revealed that more males claimed to have consumed meat and meat products than females, which reflects the findings of national data concerning the rate of vegetarianism and meat avoidance amongst young adults (Mintel 2000). The tendency for males in this study to report partaking in more regular physical activity than females also reflects the findings of past research which has compared the level of physical activity between adolescent males and females (Harrel et al 2003, Mota et al 2003).
82

It is interesting to note from the present study that young females were generally
more likely to adopt a healthier lifestyle through their food choices. In contrast,
males were more likely to pursue a healthy lifestyle through increased levels of
physical activity. This may reflect gender differences in young adult's self-efficacy
and locus of control relating to diet and health behaviour. Self-efficacy refers to a
person's perceived capability to perform behaviour (Bandura 1997) and locus of
control refers to a person's expectancy about the degree to which they control
their outcomes (Rotter 1975). Whilst females may have a higher level of self-
efficacy related to nutrition knowledge and food skills, thereby increasing their
internal locus of control to achieve health improvements through eating healthily,
males appear to have a higher level of self-efficacy related to physical activity and
exercise, whereby they perceive health improvement to be achievable through
exercise. However, few adopted the necessary combination of both healthy eating
and regular physical activity that is required for a healthy lifestyle as defined by
The Department of Health's 'Our Healthier Nation' (DoH 1999).
Young people living at home may enjoy a wider variety of food, perhaps due to the
fact that they are likely to be less restricted by food budgets and shared kitchen
facilities. Their food choices could also be influenced by their parents, but the
quality of their diet might actually be worse than that of young people living
independently. Their diets featured high fat snack foods such as cake, crisps, and
chocolate, and their main meals often consisted of convenience or take-out food,
which are generally high in fat and salt and low in fibre. Whilst there was little
evidence of parents deterring their children from eating a poor quality diet, parental influence on smoking and drinking behaviour was more evident, suggesting that
parents may perceive the quality of their child's diet to be less of a health risk than
smoking or excessive drinking. This is reflected in the findings of Khattab et al (1999), who report lower perceptions of risk associated with high fat intakes
compared to smoking (15.7% of respondents with high fat intake perceived their diet to be a health risk, compared to 75.5% of heavy smokers who considered their behaviour to be harmful).
These findings have not produced any evidence to suggest that the diets of young people living independently are more unhealthy than those of young people of a similar age and occupation who live in the family home. Despite many young
83

people leaving home possibly with little experience of catering for themselves, it is
likely that most soon adapt to a relatively healthy way of independent living.
The findings of this phase of the study have been published in The International
Journal of Consumer Studies (see Appendix 10).
84
3.2 Changes to student's dietary habits after leaving home
3.2.1 Introduction
The number of young people pursuing further education has increased in recent
years (DfES 2003). The majority of undergraduate students live away from home
when they begin university, although the increased financial pressure of tuition
fees might result in more young people studying in their hometown. Students
have certain characteristics such as attitudes and behavioural patterns in common
with 18-30 year olds in the general population, but also have several distinguishing
factors such as differing financial pressures, responsibilities and routines, which
separate them from the non-student group. The student lifestyle is unique in that it
does not have the routine of a '9-5 day, and for many students, socialising becomes equally if not more important than their studies.
This type of lifestyle is likely to have a profound effect on student's dietary habits.
When meals are no longer provided for them at specific times of day, students
might be more likely to eat what they like, when they like. Mintel (2002a) reported that 46% of students liked cooking compared to 40% of non-students, although the
reported rate of fast food consumption was higher in students than non-students. This reflects the conflicting factors of student living, of enjoying the social element of sharing cooking with housemates and consuming fast food when motivation to
cook amongst all housernates is low. American research suggests that young
people who leave home to live independently are likely to adopt poor eating habits during their first few years away from the family home due to the new found freedom from parental control over what and when to eat (TLHS 2001). The American Dietetic Association (2001) suggests that these changes to eating habits
often result in weight gain, known in the US as 'freshman fifteen'. The purpose of this study was to investigate changes to students eating habits after beginning
university and to assess whether UK students also gain weight during their first
semester.
3.2.2 Methods Undergraduate students from a range of courses were recruited by self-selection from Liverpool universities. Posters, leaflets and e-mails were distributed around campuses asking for volunteers, and the researcher attended seminars to talk briefly to students about the project and invite volunteers to participate. All
85
participants were full-time students who had recently moved away from home for
the first time to begin university. Initial meetings took place during the first four
weeks of the semester. During the first meeting participants were asked to recall
everything they would usually eat and drink on an average school day when they
lived at home. School days were used, rather than weekends as it was felt that
the routine of a weekday would facilitate recollection of food habits. Respondents
were also asked to complete a 24-hour recall of their intake at university to enable
comparisons to be made between habitual intake at home and university. Portion
sizes were estimated with the aid of food photographs (Nelson et al 1999), and
analysed using Microdiet computer software (MicrodietTM, Salford University).
Nutrient densities were calculated to assess the quality of diet in terms of nutrient
quantity per MJ. Nutritional status was assessed by measuring height, weight, BMI and blood pressure. A finger-prick blood sample was taken to measure total
cholesterol and haemoglobin. All measurements were taken following the protocol described in the methodology (pages 54 and 61). Measurements were repeated after six months to assess changes to nutritional status. Data were entered into SPSS (version 11) and analysed using paired samples t-test to identify significant changes to diet and nutritional status on commencement of university.
3.3.3 Results One hundred and seventeen respondents were recruited with a mean age of 20.3
years (17-31 years). Fifty-eight of these respondents maintained full participation throughout the study (50% dropout rate). Of the 58 participants who completed all parts of the study, 29% were male and 71 % female (compared with 31 % male and 69% female of the 117 who completed initial stages). Of all respondents, 89% lived in self-catering accommodation and the remaining 11% lived in catered halls that provided breakfast and evening meals.
3.2.3.1 Nutritional status On average, students gained weight during their first semester, although the amount was less than the 15 pounds reported in the US, or even the more recent figure of 4 pounds (Table 3.2a). Females were more likely to gain weight than males, with an average gain of I. Ikg (2.41b) and 0.7kg (1.41b) respectively. More females gained weight, and the average amount gained was higher than males; 75% of females gained an average 3.2kg and 69% males gained 2. Okg. In the
86
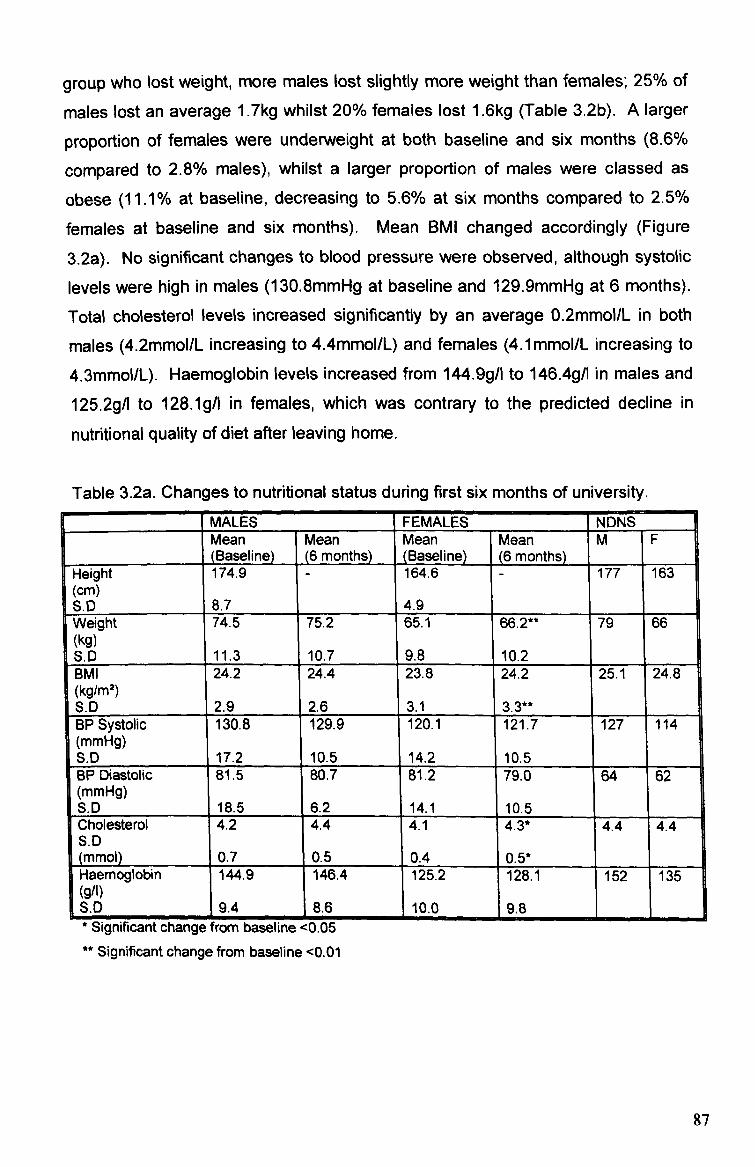
group who lost weight, more males lost slightly more weight than females; 25% of
males lost an average 1.7kg whilst 20% females lost 1.6kg (Table 3.2b). A larger
proportion of females were underweight at both baseline and six months (8.6%
compared to 2.8% males), whilst a larger proportion of males were classed as
obese (11.1% at baseline, decreasing to 5.6% at six months compared to 2.5%
females at baseline and six months). Mean BMI changed accordingly (Figure
3.2a). No significant changes to blood pressure were observed, although systolic levels were high in males (1 30.8mmHg at baseline and 129.9mmHg at 6 months).
Total cholesterol levels increased significantly by an average 0.2mmol/L in both
males (4.2mmol/L increasing to 4.4mmol/L) and females (4.1mmol/L increasing to
4.3mmol/L). Haemoglobin levels increased from 144.9g/l to 146.4g/l in males and
125.2gA to 128.1gA in females, which was contrary to the predicted decline in
nutritional quality of diet after leaving home,
Table 3.2a. Changes to nutritional status during first six months of university. MALES FEMALES NDNS Mean Mean Mean Mean M F (Baseline) (6 months) (Baseline) (6 months)
I
ea i gý ht 174.9 - 164.6 - 177 163 (cm)
I S. D 8.7 4.9 1 Weight 74.5 75.2 65.1 66.2** 79 66 (kg) S. 0 11.3 10.7 9.8 10.2 BMI 24.2 24.4 23.8 24.2 25.1 24.8 (kg/ml) S. D 2.9 2.6 3.1 3.3** BP Systolic 130.8 129.9 120.1 121.7 127 114 (mmHg) S. 0 17.2 10.5 14.2 10.5 BP Diastolic 81.5 80.7 81.2 79.0 64 62 (mmHg) S. D 18.5 6.2 14.1 10.5 Cholesterol 4.2 4.4 4.1 4.3* 4.4 4.4 S. D (mmol) 0.7 0.5 0.4 0.5* Haemoglobin 144.9 146.4 125.2 128.1 152 35 (911) S. D 9.4 8.6 10.0 9.8
, jigniricant cnange Trorn oaseune <u. ub ** Significant change from baseline <0.01
87

Table 3.2b. Percentage of respondents gaining or losing weight and mean amount
gained or lost. Weight Amount (V " No change Weight Amount lost
, Increased gained (kg) r
7 FF
decreased (kg)
9 692.0 Ma I Ee s (n -= 17) 6 25 1.7
Females -7-5 2.3 5 20 1.6
(n=41) I il
Figure 3.2a. Changes in student's BMI at baseline and six months
100%
S 80% c
60% C 0 CL 40%
-61-1 20%
0%
Baseline Six months
0 >30 1125-30 M 20-25 13 <20
Males in the study were lighter than the average 79kg of UK males (aged 19-24
years) reported in the NDNS (Henderson et al 2003), weighing 74.5kg at baseline
and 75.2kg at six months. Female weight following a mean increase of 1. lkg at
six months to 66.2kg was comparable to NDNS weight of 66kg. Male height of
174.9cm was less than NDNS data (177cm), and female height of respondents (164.6cm) was comparable to NDNS (163cm). Both sexes had slightly lower BMIs
than NDNS data. Minimal changes to systolic and diastolic blood pressure of
males and females were observed in study respondents between baseline and six
months, but these levels were higher than NDNS data. There was a mean difference of 2.9mmHg (males) and 7.9mmHg (females) for systolic blood
pressure, and 16.7mmHg (males) and 17. OmmHg (females). Cholesterol levels in
both males and females were lower at baseline but there was minimal difference
between cholesterol levels of respondents at six months (4.4mmol/L and 4.3mmol/L) and NDNS data (4.4mmol/L males and females). NDNS haernoglobin
levels for males (1 52g/1) and females (1 35g/1) were higher than study respondents
89
Males Females Males Females

at baseline (males 144.9g/l, females 125.2g/1) and six months (males 146.4g/l,
females 128.1gA).
3.2.3.2 Diet
Mean energy intakes and fat, protein, carbohydrate (CHO) and alcohol intakes
expressed as proportion of energy before and after commencing university are
shown in table 3.2c. The calculation of El: BMR ratios revealed values of 1.06 and 1.09 in males and 1.45 and 1.34 in females at baseline and six months
respectively. These cut-off values suggest under-reporting by males. Energy
intakes declined in females and increased in males. At six months, males
achieved 78% EAR (Estimated Average Requirement) and females 101% EAR for
energy (compared to 75% and 107% respectively at baseline).
There were no significant changes in fat intakes (intakes increased by 0.7% in
both sexes, resulting in excessive intakes of 106% DRV (males) and 109% DRV (females)). Saturated fat (SFA) intakes were high (13%, increasing to 15% in
males and 14% decreasing to 13% in females), and monounsaturated (MUFA)
and polyunsaturated (PUFA) intakes low in both sexes (11 % MUFA decreasing to 10% in males and consistent 10% in females; 5% PUFA decreasing to 4% in
males and 4% increasing to 5% in females). After leaving home, female fat intakes became closer to recommendations to decrease SFA and increase MUFA
and PUFA intakes, but male intakes changed contrary to recommendations.
Minimal changes were observed in protein and carbohydrate intakes. Protein intakes decreased slightly in both sexes (from 14.8g to 14.6g in males and 14.4g to 13.4g in females), and were slightly less than RNI at baseline and 6 months. Carbohydrate intakes were adequate, decreasing after leaving home, but both sexes were consuming a large proportion of their carbohydrate as non-milk extrinsic (NME) sugars (14% increasing to 16% in males and consistent 17% in females) and insufficient quantities of starch (31% increasing to 33% in males and 30% decreasing to 29% in females). Subjects' NSP intakes at baseline were low (15.4g males, 15. Og females), and quantities declined further at 6 months (13-Og males, 11.7g females) to 72% DRV and 61 % DRV in males and females.
89
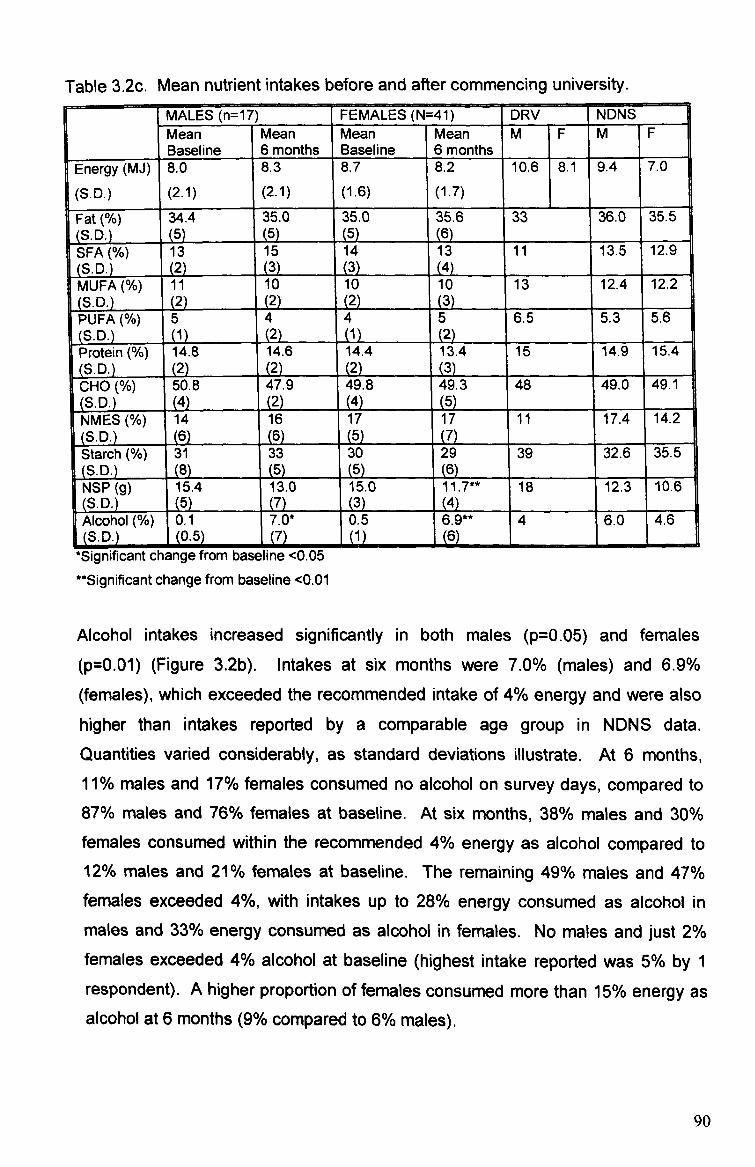
Table 3.2c. Mean nutrient intakes before and after commencing university. MALES (n=17) FEMALES (N=41) DRV NDNS Mean Mean Mean Mean M F M F
1
Baseline 6 months Baseline 6 months
1
Energy (MJ) 8.0 8.3 8.7 8.2 10.6 8.1 9.4 7.0
(S. D. ) (2.1) (2.1) (1.6) (1.7)
1
Fat 34.4 35.0 35.0 35.6 33 36.0 1 35.5 (S. D. ) (5) (5) (6) SFA (%) 13 15 14 13 11 115 12.9 (S. D. ) (2) (3) (3) (4) MUFA 11 10 10 10 13 12.4 12.2 (S. D. ) (2) (2) (3) PUFA 5 4 4 5 6.5 5.3 5.6 (S. D. ) (1) (2) (1) (2) Protein 14.8 14.6 14.4 13.4 15 14.9 15.4 (S. D. ) (2) (2) (2) (3) CHO (%) 50.8 47.9 49.8 49.3 48 49.0 149.1 (S. D. ) (4) (2) (4) (5) NMES 14 16 17 17 11 17.4 14.2 (S. D. ) (6) (6) (7) Starch 31 33 30 29 39 32.6 35.5 (S. D. ) (8) (5) (5) (6) NSP (g) 15.4 13.0 15.0 11.7** Is 12.3 10.6 (S. D. ) (5) (3) Alcohol (%) 0.1 7.0* 0.5 6.9**
2 4 6.0 4.6
(S. D. ) (0-5) (7) .
(1) ý
6 6L I
--. mmmo *Significant change from baseline <0.05 "Significant change from baseline <0.01
Alcohol intakes increased significantly in both males (p=0.05) and females
(p=0.01) (Figure 3-2b). Intakes at six months were 7.0% (males) and 6.9%
(females), which exceeded the recommended intake of 4% energy and were also higher than intakes reported by a comparable age group in NIDNS data.
Quantities varied considerably, as standard deviations illustrate. At 6 months, 11 % males and 17% females consumed no alcohol on survey days, compared to 87% males and 76% females at baseline. At six months, 38% males and 30% females consumed within the recommended 4% energy as alcohol compared to 12% males and 21% females at baseline. The remaining 49% males and 47% females exceeded 4%, with intakes up to 28% energy consumed as alcohol in males and 33% energy consumed as alcohol in females. No males and just 2% females exceeded 4% alcohol at baseline (highest intake reported was 5% by 1 respondent). A higher proportion of females consumed more than 15% energy as alcohol at 6 months (9% compared to 6% males).
90
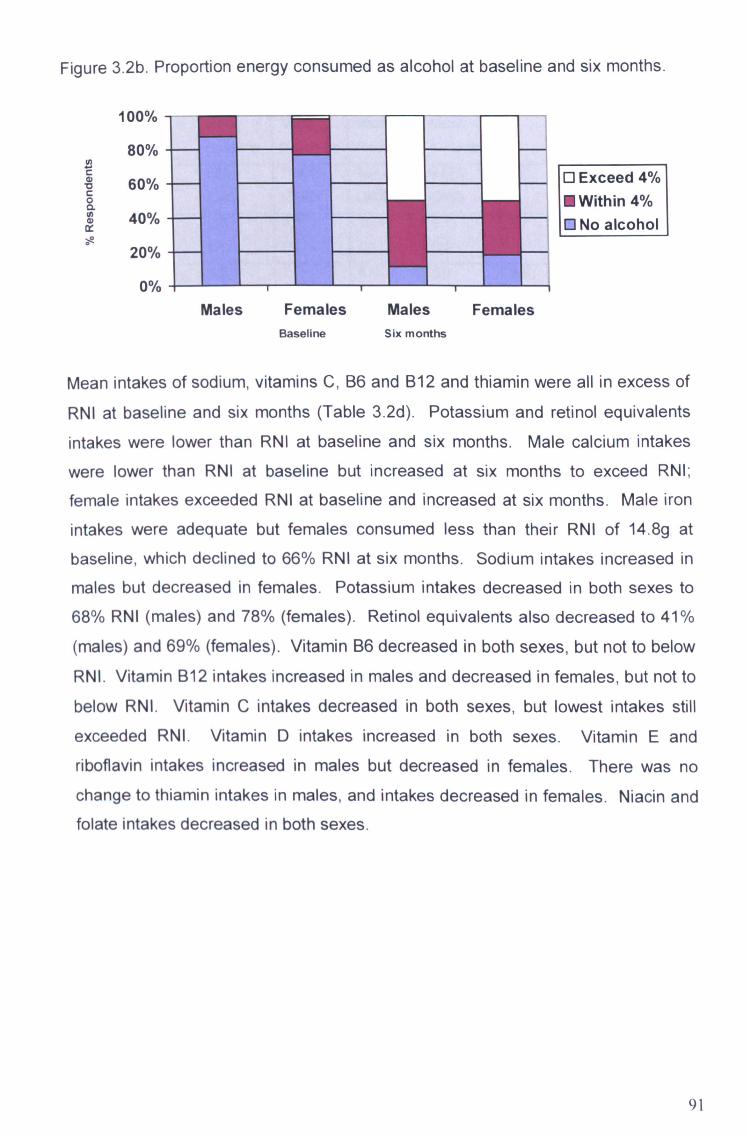
Figure 3.2b. Proportion energy consumed as alcohol at baseline and six months.
100%
80%
60% 0 CL
40%
20%
0%
Baseline Six months
0 Exceed 4% M Within 4% 0 No alcohol
Mean intakes of sodium, vitamins C, B6 and B12 and thiamin were all in excess of
RNI at baseline and six months (Table 3.2d). Potassium and retinol equivalents intakes were lower than RNI at baseline and six months. Male calcium intakes
were lower than RNI at baseline but increased at six months to exceed RNI;
female intakes exceeded RNI at baseline and increased at six months. Male iron
intakes were adequate but females consumed less than their RNI of 14.8g at baseline, which declined to 66% RNI at six months. Sodium intakes increased in
males but decreased in females. Potassium intakes decreased in both sexes to 68% RNI (males) and 78% (females). Retinol equivalents also decreased to 41%
(males) and 69% (females). Vitamin B6 decreased in both sexes, but not to below
RNI. Vitamin B12 intakes increased in males and decreased in females, but not to
below RNI. Vitamin C intakes decreased in both sexes, but lowest intakes still
exceeded RNI. Vitamin D intakes increased in both sexes. Vitamin E and riboflavin intakes increased in males but decreased in females. There was no
change to thiamin intakes in males, and intakes decreased in females. Niacin and folate intakes decreased in both sexes.
91
Males Females Males Females
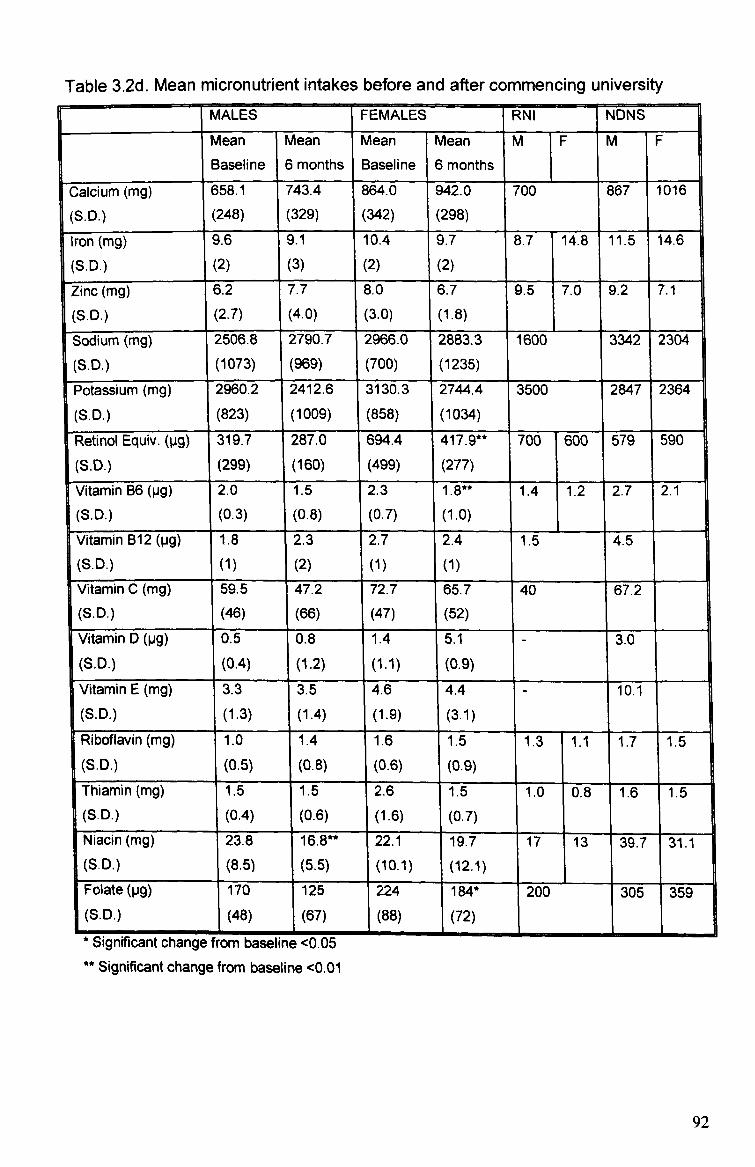
Table 3.2d. Mean micronutrient intakes before and after commencing university MALES FEMALES RNI NDNS
Mean Mean Mean Mean M F M F
I
Baseline 6 months Baseline 6 mon ths
I
Calcium (mg) 658.1 743.4 864.0 942.0 700 867 1016
(S. D. ) (248) (329) (342) (298)
Iron (mg) 9.6 9.1 10.4 9.7 8.7 14.8 11.5 14.6
(S. D. ) (2) (3) (2) (2)
Zinc (mg) 6.2 7.7 8.0 6.7 9.5 7.0 9.2 7.1
(S. D. ) (2.7) (4.0) (3.0) (1.8)
Sodium (mg) 2506.8 2790.7 2966.0 2883.3 1600 3342 2304
(S. D. ) (1073) (969) (700) (1235)
Potassium (mg) 2960.2 2412.6 3130.3 2744.4 3500 2847 2364
(S. D. ) (823) (1009) (858) (1034)
Retinol Equiv. (pg) 319.7 287.0 694.4 417.9** 700 600 579 590
(S. D. ) (299) (160) (499) (277)
Vitamin B6 (pg) 2.0 1.5 2.3 1.8** 1.4 1.2 2.7 2.1
(S. D. ) (0.3) (0.8) (0.7) (1.0)
Vitamin B12 (pg) 1.8 2.3 2.7 2.4 1.5 4.5 (S. D. )
I
(1) (2) (1) (1)
1
Vitamin C (mg) 59.5 47.2 72.7 65.7 40 67.2 (S. D. ) (46) (66) (47) (52)
Vitamin D (pg) 0.5 0.8 1.4 5.1 3.0 (S. D. ) (0.4) (1.2) (1.1) (0.9)
Vitamin E (mg) 3.3 3.5 4.6 4.4 10.1 (S. D. ) (1.3) (1.4) (1-9) (3.1) 1
Riboflavin 1.0 1.4 1.6 1.5 1.3 1.1 1.7 1.5 (S. D. ) (0.5) (0.8) (0.6) (0.9)
Thiamin (mg) 1.5 1.5 2.6 1.5 1.0 0.8 1.6 1.5 I (S. D. ) (0.4) (0.6) (1.6) (0.7)
Niacin kmg) zi. t% 10.6- V. Y-. 1 19.7 17 13 39.7 31.1
(S. D. ) (8.5) (5.5) (10.1) (12.1)
Folate (pg) 170 125 224 184* 200 305 359 (S. D. ) (48) (67) (88) (72)
Significant change from baseline <0.05 Significant change from baseline <0.01
92

Nutrient densities (amount of nutrient per MJ energy consumed) were determined
to assess changes to the quality of diet (Table 3.2e). Changes to densities of
most nutrients assessed at baseline and 6 months were comparable to changes of
absolute quantities. However, absolute quantities of iron and vitamin C decreased
in both sexes, whereas the quality of iron in the diet remained the same in males (1.1mg/MJ) and females (1.2mg/MJ), and vitamin C density remained the same in
males (8.1 mg/MJ) and increased in females (8.6mg/MJ increasing to 9.3mg/MJ).
The only significant change to nutrient densities was observed for male NSP
intakes, which decreased from 1.7g/MJ to 1.3g/MJ (p=0.05).
Nutrient densities at baseline and six months were largely comparable to NDNS
densities, with the exception of retinol equivalents, vitamin E, niacin and folate,
which were lower than NDNS data. Nutrient density data available from the
student study of Moynihan et al (1999) were all comparable to the findings of the
present study. Density data for the earlier student study of Eves et al (1994) were generally higher, being more comparable to current NDNS data with the exception
of folate densities. Female diets generally had a higher nutrient density than
males (Figure 3.2c and 3.2d). Some of the lowest densities observed for female intakes of calcium, iron, vitamin B12, vitamin C and folate were comparable to the higher intakes of males. Less variation in diet quality was observed in females for
all nutrients assessed except for calcium, although mean density for calcium was considerably higher in females than males.
93
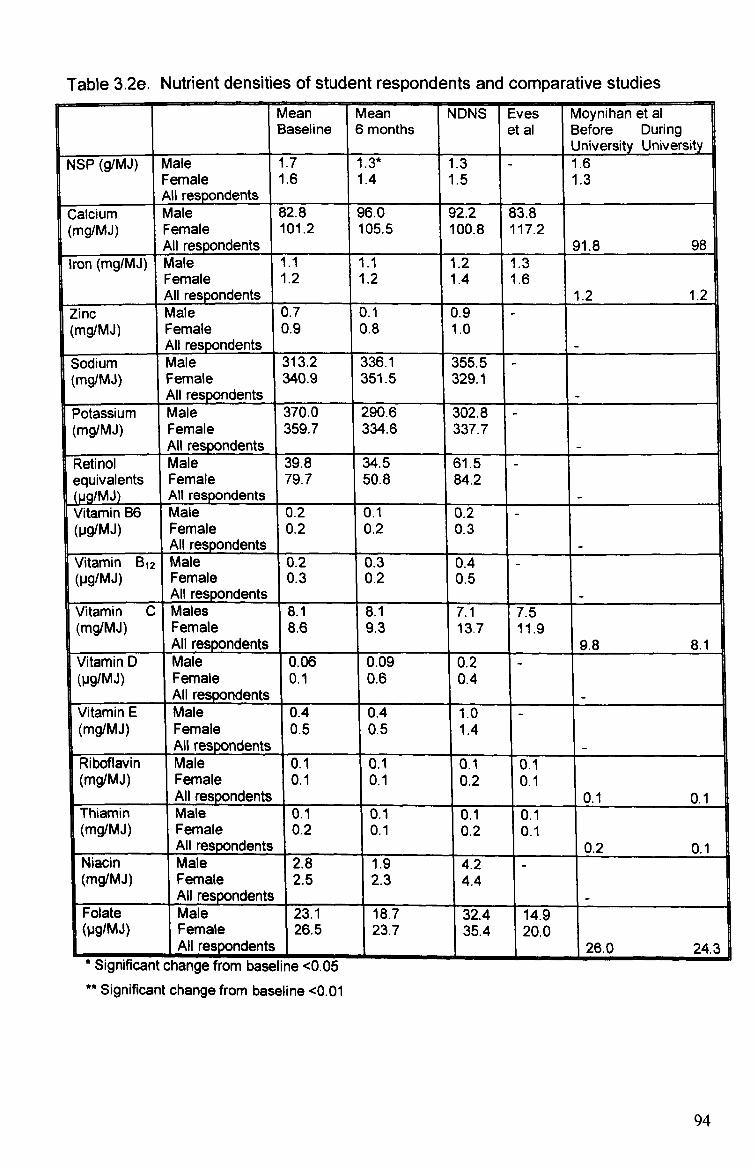
Table 3.2e. Nutrient densities of student respondents and comparative studies Mean Mean NDNS Eves Moynihan et al Baseline 6 months et al Before During
University University NSP (g/MJ) Male 1.7 1.3* 1.3 - 1.6
Female 1.6 1.4 1.5 1.3 All respondents
Calcium Male 82.8 96.0 92.2 83.8 (mg/MJ) Female 101.2 105.5 100.8 117.2
All respondents 91.8 98 Iron (mg/MJ) Male 1.1 1.1 1.2 '1.3
Female 1.2 1.2 1.4 1.6 All respondents 1.2 1.2
Zinc Male 0.7 0.1 0.9 - (mg/MJ) Female 0.9 0.8 1.0
All respondents - Sodium I Male 313.2 336.1 355.5 (mg/MJ) Female 340.9 351.5 329.1
All respondents - Potassium Male 370.0 290.6 302.8 (mg/MJ) Female 359.7 334.6 337.7
All respondents - Retinol Male 39.8 34.5 61.5 equivalents Female 79.7 50.8 84.2 (pg/MJ) All respondents - Vitamin B6 Male 0.2 0.1 0.2 (Pg/Mj) Female 0.2 0.2 0.3
All respondents - Vitamin B12 Male 0.2 0.3 0.4 (pg/MJ) Female 0.3 0.2 0.5
All respondents - Vitamin C Males 8.1 8.1 7.1 7.5 (mg/MJ) Female 8.6 9.3 13.7 11.9
All respo dents 9.8 8.1 Vitamin D Male 0.06 0.09 0.2 - (Pg/Mj) Female 0.1 0.6 0.4
All respondents - Vitamin E Male 0.4 0.4 1.0 - (mg/MJ) Female 0.5 0.5 1.4
All resDondents - Riboflavin Male 0.1 0.1 0.1 0.1 (mg/MJ) Female 0.1 0.1 0.2 0.1
All respondents 0.1 0.1 Thiamin Male 0.1 0.1 0.1 0.1 (mg/MJ) Female 0.2 0.1 0.2 0.1
All respo dents 0.2 0.1 Niacin Male 2.8 1.9 4.2 - (mg/MJ) Female 2.5 2.3 4.4
All respondents Folate Male 23.1 18.7 32.4 14.9 (Pg/Mj) Female
1 26.5 23.7 35.4 20.0
ents, NI respond 26.0 24.3 Significant change from baseline <0.05
** Significant change from baseline <0.01
94
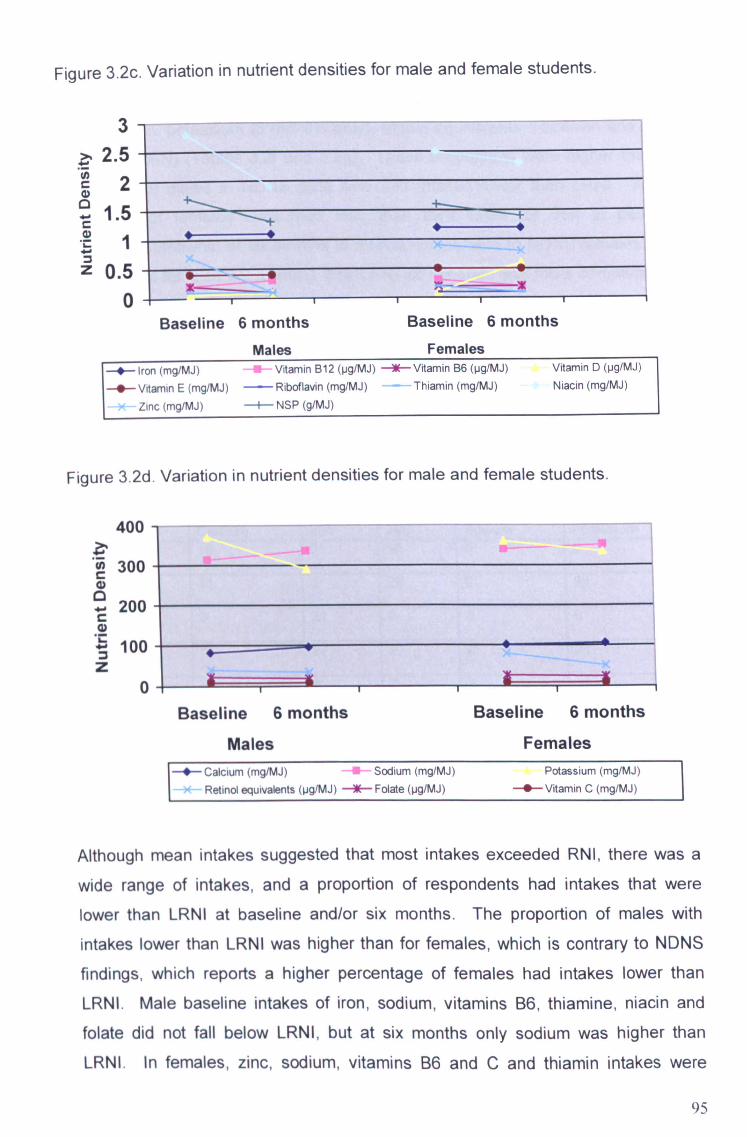
Figure 3.2c. Variation in nutrient densities for male and female students.
3 2.5
2 1.5
0.5 0
Males Females * Iron (mg/MJ) Vitamin B12 (pg/MJ) Vitamin B6 (pg/MJ) Vitamin D (pg/MJ
0 Vitamin E (mg/MJ) - Riboflavin (mg/MJ) Thiamin (mg/MJ) Niacin (mg/MJ)
Zinc (mg/MJ) NSP (g/MJ)
Figure 3.2d. Variation in nutrient densities for male and female students.
400
300
200
100
0
Males Females 0 Calcium (mg/MJ) Sodium (mg/MJ) Potassium (mg/MJ)
Retinol equivalents (pg/MJ) * Folate (pg/MJ) -0- Vitamin C (mg/MJ)
Although mean intakes suggested that most intakes exceeded RNI, there was a
wide range of intakes, and a proportion of respondents had intakes that were
lower than LRNI at baseline and/or six months. The proportion of males with
intakes lower than LRNI was higher than for females, which is contrary to NDNS
findings, which reports a higher percentage of females had intakes lower than
LRNI. Male baseline intakes of iron, sodium, vitamins B6, thiamine, niacin and folate did not fall below LRNI, but at six months only sodium was higher than
LRNI. In females, zinc, sodium, vitamins B6 and C and thiamin intakes were
95
Baseline 6 months Baseline 6 months
Baseline 6 months Baseline 6 months
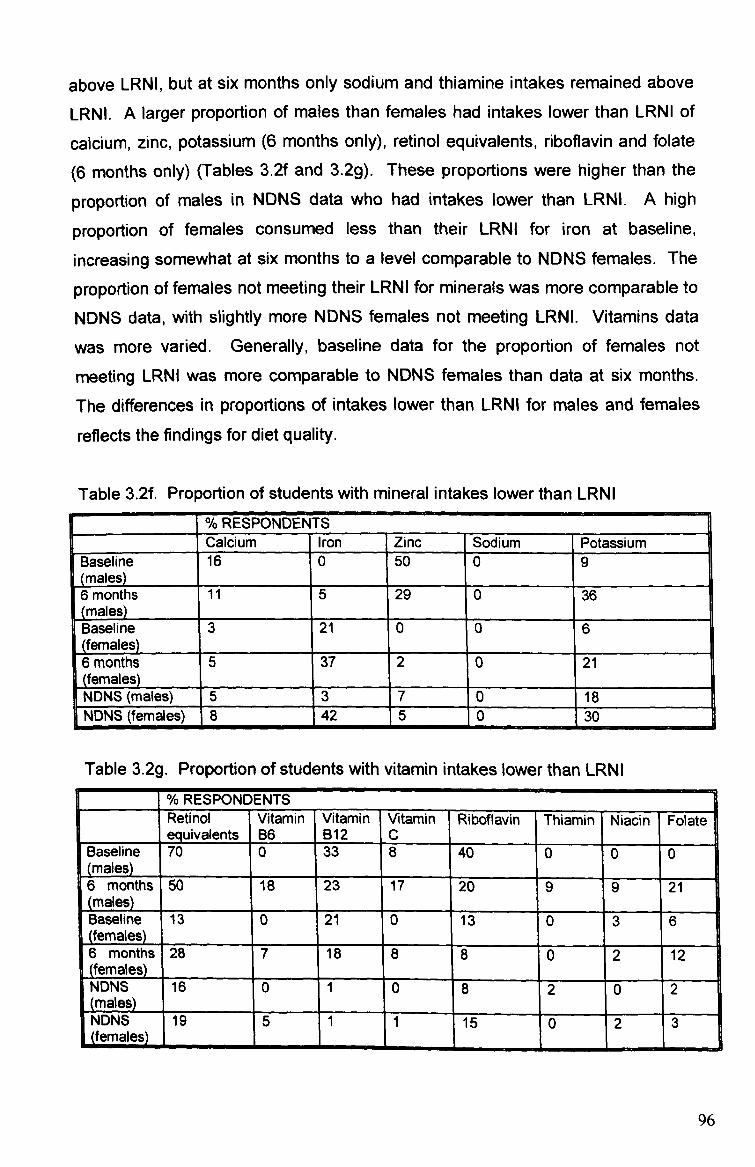
above LRNI, but at six months only sodium and thiamine intakes remained above
LRNI. A larger proportion of males than females had intakes lower than LRNI of
calcium, zinc, potassium (6 months only), retinol equivalents, riboflavin and folate
(6 months only) (Tables 3.2f and 3.2g). These proportions were higher than the
proportion of males in NDNS data who had intakes lower than LRNL A high
proportion of females consumed less than their LRNI for iron at baseline,
increasing somewhat at six months to a level comparable to NDNS females. The
proportion of females not meeting their LRNI for minerals was more comparable to
NDNS data, with slightly more NDNS females not meeting LRNI. Vitamins data
was more varied. Generally, baseline data for the proportion of females not
meeting LRNI was more comparable to NDNS females than data at six months. The differences in proportions of intakes lower than LRNI for males and females
reflects the findings for diet quality.
Table 3.2f. Proportion of students with mineral intakes lower than LRNI % RESPONDEN TS [ Calcium Iron Zinc Sodium Potassium
Baseline (males)
16 0 50 0 9
6 months (males)
11 5 29 0 36
Baseline (females)_
_
3 21 0 0 6 I
6 months ( ema es
5 37 i
2 0 21
NDNS (males) 5 3 ý -
7 0 18 NDNS (females) 8 4 2
_5 0 30
Table 3.2g. Proportion of students with vitamin intakes lower than LRNI
% RESPOND ENTS Retinol Vitamin Vitamin Vitamin Riboflavin Thiamin Niacin Folate equivalents B6 B12 c
Baseline 70 0 33 8 40 0 0 0 (males) 6 months 50 18 23 17 20 9 9 21 males
Baseline 13 0 1 21 0 13 0 3 6 (females) 1 6 months 28 7 18 8 8 0 2 12 females
I a NDNS 16 0 1 0 8 2 0 2 males NDNS 19 5 1 1 15 0 2 3
1
Uernales) wmýwww-wý . 6ý
96

3.2.4 Discussion
Volunteer participation is an essential element of research projects, although
recruiting sufficient numbers and maintaining participation throughout is
problematical, as many are unwilling to participate unless offered an incentive,
which ethical regulations usually prohibit for human volunteers. Follow-up
measurements were taken in March to avoid results being biased by temporary
weight-gain expected during Christmas holidays (Reid and Hackett 1999).
However this coincided with heavy workloads for many students, resulting in a low
follow-up response rate of 50%.
Problems were also encountered regarding dietary data collection. All methods of
dietary data collection have advantages and disadvantages, and it is necessary to
consider these when deciding upon methods (Black 2001). Three-day food diaries
were used initially, although following a poor rate of return and lack of detail in
completed diaries, these were replaced with interview based 24-hour recalls. A
three-day record provides a more representative result of average diet than 24-
hour recalls, although recalls may provide a more honest record -of actual food
intake, as it is a retrospective method so respondents do not alter their dietary
habits due to monitoring. Energy intake to BMR ratios indicated considerable
under-reporting in male subjects, which appeared to increase after leaving home
(cut-off value increased from 0.06 to 0.09). This may be a result of an awareness
of a deterioration in their diet since leaving home, resulting in an increased
tendency to under-report. Protein, fat and carbohydrate intakes expressed as a
percentage of energy were comparable to NDNS data, but the absolute amounts
recorded were notably lower. This suggests universal, as opposed to biased,
under-reporting.
The percentage energy consumed as fat at baseline and six months was higher
than findings of Edwards and Meiselman (2003) who observed a decrease in fat of 30% to 28%, but compares more favourably to Moynihan et al's (1999) findings of 35% before and during university. This may be due to methodological differences
between studies; respondents of Edwards and Meiselman's study were catering students so were likely to have gained a greater understanding of nutritional issues throughout the study, whereas respondents of Moynihan et al and the
present study studied a range of different subjects. Similarly, as the task of
97
completing food records was part of the students' course in Edwards and
Meiselman's study, respondents may have been more aware of the healthfulness
of what they reported consuming. NDNS data for 19-24 year olds reported intakes
of 36% and 35% for males and females, which is generally consistent with results
in the present study. SFA intakes were higher than NDNS data, but MUFA and
PUFA were lower. This suggests that young people in general may adhere more
closely than students to health recommendations to eat less SFA and more MUFA
and PUFA. As respondents of the present study were all pursuing further
education, it was considered likely that their average level of education was higher
than represented in NDNS respondents. However these findings regarding fat
intakes suggest that either students were lacking in specific nutritional knowledge,
or that knowledge does not necessarily result in action. The latter explanation is
likely to be the more plausible, as there is extensive evidence to support the fact
that health promotion interventions that focus on information provision alone are
largely unsuccessful (Jones and Sidell 1999).
It may be suggested that students' SFA intakes were high due to frequent
consumption of snack foods such as crisps, chocolate, pasties and sausage rolls. Students often consumed these foods whilst at university, possibly because these
food choices are often cheaper than healthier alternatives such as sandwiches or fruit that are available on campus. It may therefore be useful to investigate the
availability and cost of healthy food on university campuses. Data for SFA, MUFA
and PUFA intakes were not available for comparison from other student diet
studies. Increased fat intakes were likely to have contributed to weight-gain and increases in blood cholesterol.
Protein intakes were comparable to Eves et al (1994), and males in Edwards and Meiselman's study (2003) but female intakes in the latter study were slightly higher
at around 16%. NDNS data reported comparable intakes of 14.9% and 15.4% in
males and females. Carbohydrate intakes were similar to NDNS data at around 49%, which is also consistent with the DRV of 48%. Comparable studies report lower carbohydrate intakes, particularly in males. Male (NME) sugars and starch intakes were similar to NDNS findings, although female (NME) sugars intakes
were higher and starch intakes lower. Starch intakes were expected to be higher due to the popularity of pasta and rice based meals, however the imbalance of
98

(NME) sugars and starch reflects the lack of balance and routine in respondents'
dietary habits. Few respondents consumed a regular breakfast, lunch and dinner
at appropriate times on every record day, and daily intakes often consisted of
snack foods alone with no main meal. It is therefore difficult for the respondent to
achieve a balance with such dietary habits. The higher intakes of sugar dense
foods in females may be due to'comfort eating' as a result of possible insecurities
related to leaving home and coping with independent living. Females may be
more likely to adopt this type of food-related behaviour in response to their
emotions and external environment than males.
NSP intakes did not meet recommendations at baseline, and declined further in
both sexes (significantly in females) at six months. Moynihan et al (1999) also
reported a decline in student's fruit and vegetable consumption. However, intakes
whilst at university were higher than young people in general (NDNS 2003). Fruit
and vegetables are usually consumed more frequently by higher socio-economic
groups, and the higher consumption rates observed in university students than
NDNS data could be a reflection of the larger proportion of higher socio-economic
groups represented in the student population than the general population. The
decline in fruit and vegetable intake may be attributable to students gaining
independence regarding food choice. Whilst living at home, respondent's dietary
habits were perhaps generally shaped by their parent's food shopping habits, so if
fruit and vegetables were available at home, respondents were more likely to
consume them. However, after leaving home they may prefer to consume other
cheaper, less healthy food items. Alternatively, the reason for decreased fruit and
vegetables may be associated with a lack of storage space, particularly fridge
space, which is often a problem in student accommodation. Many students in
shared accommodation have just one fridge shelf. This limits the amount of
perishable food items they can purchase and leaves no room for storing fruit and
vegetables, which if not consumed quickly become rotten when stored at room temperature.
Nutrient density as an indication of diet quality might be expected to decline after leaving home. However the only significant change in diet quality was a decline in male NSP. Diet quality of respondents in the present study was inferior to NDNS data and Eves et al's study of student diets, but was comparable to the more
99

recent study of Moynihan et al (1999). It may be suggested that the respondents
in Eves et al's study and the NDNS survey consumed a better quality diet as they
were likely to have a higher disposable income than respondents of Moynihan et al
and the present study. A proportion of 19-24 year olds in the NDNS were in paid
employment, and Eves et al's study took place before the introduction of tuition
fees and the abolition of the student grant, whereas students now experience
increasing financial pressure and healthy eating is perhaps not a high priority.
Females generally consumed a better quality diet than males in both the present
and comparable studies. The tendency for females to consume more foods with a
positive health image has been reported in previous research of young people's
diets (Milligan et al 1998, Shepherd and Dennison 1996). Although female's diet
quality was superior to males in the present study, their diet quality was lower than
females in comparable studies. The proportion of females with intakes of iron
lower than LRN1 was comparable to females of this age group in the general
population (NDNS 2003), and indicates an area of concern. Intakes of red meat, a
rich source of haem iron, were low in females and furthermore, sources of non-
haem iron such as leafy green vegetables were consumed by very few
respondents. However, intakes of vitamin C that helps absorption were adequate,
which may have contributed to the maintenance of healthy haernoglobin levels.
Students have a reputation for excessive alcohol consumption (Monahan 2002),
although this is often not substantiated by research studies. Edwards and Meiselman (2003) reported that students consumed more alcoholic drinks on fewer occasions as the academic year progressed, but did not find evidence of binge drinking. Eves et al (1995) reported less than 10% of students had intakes in excess of 20% energy as alcohol. However, the accuracy of seif-reported alcohol consumption is questionable. It may be suggested that those more likely
to partake in excessive binge drinking (defined by the UK charity, Alcohol Concern
as 80 millilitres of alcohol in a single session for men and 60 millilitres for women (Motluk 2004)) may be less likely to volunteer for health research projects. Respondents might under-report to avoid being labelled as an unhealthily heavy drinker, or might over-report in order to fit in with their peers. Students in the
present study were asked to report honestly and in confidence how much alcohol they consumed.
100

Alcohol consumption increased significantly following commencement of
university, which is likely to be due to freedom from parental control and the
pursuit of the type of social life often associated with the student lifestyle. Alcohol
intakes at six months were closer to population averages, although baseline
results may have been low because diet records were based on reported
consumption on a school day, but more alcohol might be consumed at the
weekend when binge drinking is more likely to occur. Average intakes were
slightly higher in males than females, but the highest intakes were observed in
females, illustrating the increased tendency for females to binge drink. Half of all
students consumed in excess of the suggested maximum 4% energy consumed
as alcohol (DoH 1991). Female respondents frequently reported consuming large
quantities of alcohol before going out, stating that they could buy cheaper alcohol
from a supermarket or off-license in order to get drunk before going to a pub or
club where prices are higher. This was also considered to be an integral part of
the fun and socialisation involved in preparing for a night out. Drinking before
going out may have been more common amongst females because they preferred
to drink wine, spirits and alcopops, which are often more expensive than the
preferred male drinks of beer and lager. This head start in alcohol consumption
may also have been one reason for the overall higher intakes in females. Further
investigation is needed to identify whether respondents maintain high alcohol intakes in the long-term.
More significant changes were observed in female diet and nutritional status than
males. This may be an indication of the increased likelihood for female's food
intakes to be affected by their emotional well-being as they adjust to a new lifestyle. Females gained an average 1. lkg and males gained an average 0.7kg. Physical activity levels often decrease at university (Meiselmann et al 1999), which would contribute to weight gain along with changes to diet. Butler et al (2004)
reported significant decreases in energy intake, but significant increases in body
weight, reportedly due to significant decreases in physical activity levels in
students during the first five months of university. Although physical activity was not measured in the present study, the pattern of weight gain and decreasing
energy intake in females reflects these findings. Perhaps as a result of fat intakes increasing and physical activity levels decreasing, total cholesterol levels increased significantly in just 6 months. Cholesterol levels reported in NDNS data
101
were higher amongst 19-24 year olds than 18 year olds (3.8mmol/L and
4.4mmol/L in males, 4.0mmol/L and 4.4mmol/L in females). These increases are
comparable to changes in the present study. Increases reported in NDNS data
are likely to be age-related increases, although lifestyle changes may have also
contributed. No significant changes to blood pressure were observed, which is
surprising considering the marked increase in alcohol consumption. However,
systolic and diastolic blood pressure of respondents was higher than NIDNS data,
which may be a result of higher alcohol intakes.
Three risk factors for developing coronary heart disease (CHD) in middle age increased in students over a relatively short time; weight gain, high cholesterol and
excessive alcohol intake. However, as observed in the general population
regarding type 2 diabetes, diseases that were once only observed in adults
beyond middle age are increasingly diagnosed in children and teenagers as a
result of poor dietary habits and health behaviour from infancy. Younger
generations may be increasing their risk of developing early onset CHD and other diet related diseases (stroke, some cancers) as a result of leading an unhealthy lifestyle in young adulthood. It may be argued that short-term changes in diet and lifestyle (e. g. if increases in weight and cholesterol and excessive alcohol intakes
are a result of temporary behaviour following the transition to independent living)
are not likely to have long-term effects. However, the full impact of this type of behaviour will not be clear until the current generation of young adults approach
middle age. There is a gap in academic literature of studies that track cohorts
over an extended length of time to determine the influence of changing dietary habits in response to lifestyle factors on future health. Short-term poor dietary
habits during pregnancy and/or infancy increase disease risk factors in adulthood (Davey-Smith 2000), but the foetal and infancy stages of the lifecycle are particularly vulnerable stages when adequate nutrition is vital to growth and development. It may be that young adults in the latter stages of growth and development are a lot more resistant to a short period of poor nutrition during their
university years and the long-term health effects could be minimal. However
presumptions cannot be made, and further study is recommended, as it is unlikely that any individual's dietary habits remain constant and unchanging to lifestyle factors throughout their life.
102
in general, respondents' diets met recommendations to a greater extent whilst
living at home than after commencing university in terms of having higher intakes
of NSP and lower intakes of fat and (NME) sugars. Slight deteriorations to diet
were expected due to freedom from parental control. Respondent's intakes at baseline were more comparable to young people in general as reported in the
National Diet and Nutrition Survey (2003) than after 6 months, with the exception
of alcohol, NSP and iron. These findings support the suggestion that student's diets may not be particularly healthy when they first leave home and begin to cook for themselves. Rather than being nutritionally deficient as is the popular belief,
students are likely to have excessive intakes of fats, sugars and alcohol. Students
in the UK are likely to gain weight when they begin university, but to a lesser
extent than reported in the US. However unlike the US, students were not aware
of the potential risk of weight gain after starting university and were therefore not in
a position to make informed decisions about adapting their diet and lifestyle in
order to reduce this risk.
Current information for UK students generally suggests that students cannot afford to eat healthily (FSA 2003b), but does not associate this with potential weight gain. It would therefore be beneficial to include information about the risk of weight gain in nutritional information for students, and also provide practical guidelines for independent living to help students adapt to their new lifestyle. Availability and cost of healthy foods on campus appeared to influence some students' food
choices whilst attending university for lectures. Cheaper pasties, sausage rolls, crisps and chocolate bars were chosen as opposed to healthier, but slightly more expensive sandwiches or limited fresh fruit. It may therefore also be advisable for universities to review current food provision in terms of the extent to which food choices in canteens and shops meet the needs of student's budgets and food preferences.
103

3.3 Dietary habits and nutritional status of residents of young people's
homeless hostels
3.3.1 Introduction
Adolescents usually leave home with their parents' consent, to start
college/university, to begin employment, or to marry. However, an increasing
number of young people leave home without their parents' consent, and find
themselves homeless. Many homeless young people do not choose to leave
home, but feel they have no choice but to escape difficult domestic circumstances. This group of young people therefore have little time to prepare for independent
living. Some homeless young people leave school before completing their
education so experience difficulties finding employment in order to pay housing
costs (Craig 1996). In response to the rising number of young homeless people,
temporary hostels are now available which cater specifically for the needs of
young people. Staff at these hostels provide support and advice on a range of
issues such as healthy eating, substance misuse, smoking, budgeting, personal hygiene and household skills, in order to facilitate their transition to independent
living. This study investigated the diet and nutritional status of young people in
temporary residence in hostels for the homeless.
3.3.2 Methods Residents were interviewed to establish habitual dietary intake, and measurements were taken to assess nutritional status. Questions were asked to
establish the extent of their general knowledge of health and nutrition and to
assess the extent to which their lifestyle reflected their knowledge. Residents
were asked about recommendations made by health professionals regarding healthy eating (whether health professionals recommend that people should be eating more, the same or less of the following foods: fruit and vegetables, sugary foods, carbohydrate foods, fatty foods, high fibre foods and salty foods). They were also asked whether they were trying to improve their health in any way and what, if any, barriers restricted their ability to adopt a healthy diet and lifestyle. Smoking habits and alcohol consumption were also discussed. These interviews were not tape-recorded, since trust and openness might have been compromised.
Residents' dietary intakes were assessed by 24-hour recall interviews and analysed using Microdiet computer software (see methodology, page 54). This
104

method was considered most appropriate as some residents had literacy
difficulties. Residents' meal times were often erratic, so they were asked to
complete three separate 24-hour recalls to improve reliability. Hostel staff were
asked to comment on the dietary habits of residents in general. Nutritional status
assessment included measuring height, weight, BMI, body composition
(determined from biceps and triceps skinfolds) and blood pressure. A finger-prick
blood sample was taken to measure total cholesterol and haemoglobin. All
measurements were taken following the protocols described in the methodology
(page 61).
3.3.3 Results
Eleven hostels were invited to participate although only three agreed. These were
located in Runcorn, Liverpool and Leicester. The participation rate for individuals
in each hostel was 75%, 53% and 40% respectively. Average age of respondents
was 18 years (females) and 19 years (males).
When asked which foods health professionals recommend eating more or less of
(fruit and vegetables, sugary foods, carbohydrate foods, fatty foods, high fibre
foods and salty foods); 27% answered all six questions correctly, a further 27%
answered five correctly, 28% answered four correctly and 18% answered just two
correctly. This suggests that knowledge regarding basic facts of nutrition and healthy eating varied considerably, which may reflect the varying level of
education amongst residents and the large number with special educational
needs.
Despite the wide range of responses, a large proportion of residents demonstrated
an understanding of the basis of a healthy lifestyle in their responses to the
question "Are you trying to improve your health in any way? " The majority of
residents claimed to be trying to improve their health, with 87% percent stating that
they felt they should be partaking in more physical activity, and 75% felt they
should be eating more healthily. However some stated that they were restricted in
their ability to choose healthier foods due to low-income. A quarter of residents (25%) stated that they were currently dieting to lose weight or felt that they needed to'go on a diet', despite, on average, having an acceptable BMI (mean BMI, males 22.93, females 25.32) and body fat (mean body fat, males 13.3%, females 27.0%).
105
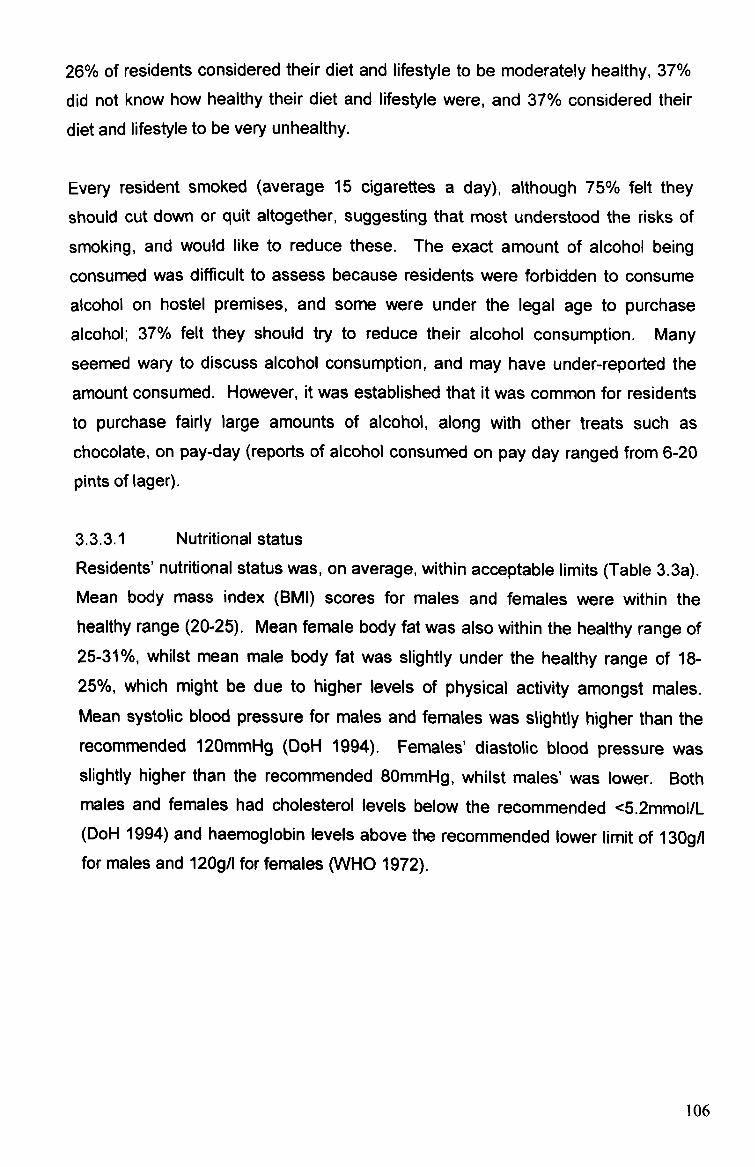
26% of residents considered their diet and lifestyle to be moderately healthy, 37%
did not know how healthy their diet and lifestyle were, and 37% considered their
diet and lifestyle to be very unhealthy.
Every resident smoked (average 15 cigarettes a day), although 75% felt they
should cut down or quit altogether, suggesting that most understood the risks of
smoking, and would like to reduce these. The exact amount of alcohol being
consumed was difficult to assess because residents were forbidden to consume
alcohol on hostel premises, and some were under the legal age to purchase
alcohol; 37% felt they should try to reduce their alcohol consumption. Many
seemed wary to discuss alcohol consumption, and may have under-reported the
amount consumed. However, it was established that it was common for residents to purchase fairly large amounts of alcohol, along with other treats such as
chocolate, on pay-day (reports of alcohol consumed on pay day ranged from 6-20
pints of lager).
3.3.3.1 Nutritional status Residents' nutritional status was, on average, within acceptable limits (Table 3.3a). Mean body mass index (BMI) scores for males and females were within the healthy range (20-25). Mean female body fat was also within the healthy range of 25-31%, whilst mean male body fat was slightly under the healthy range of 18- 25%, which might be due to higher levels of physical activity amongst males. Mean systolic blood pressure for males and females was slightly higher than the
recommended 120mmHg (DoH 1994). Females' diastolic blood pressure was slightly higher than the recommended 80mmHg, whilst males' was lower. Both males and females had cholesterol levels below the recommended <5.2mmol/L (DoH 1994) and haernoglobin levels above the recommended lower limit of 130g/l for males and 120g/l for females (WHO 1972).
106
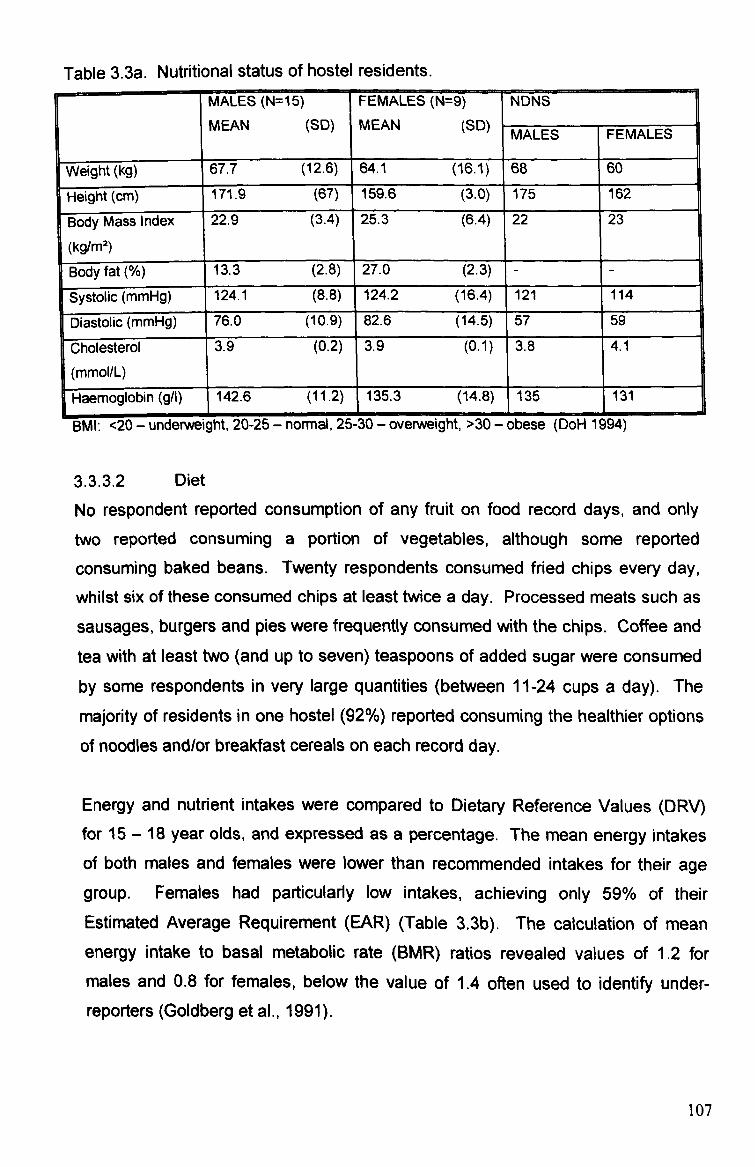
Table 3.3a. Nutritional status of hostel residents. MALES (N=15)
SD MEAN FEMALES (N=9) MEAN SID
NDNS ( ) ( ) MALES FEMALES
v Weight (kg) 67.7 (12.6) 64.1 (16.1) 68 60
Height (cm) 171.9 (67) 159. ýý (3.0) 175 162
BB ody Mass Index
(kg/M2)
22.9 (3.4) 25.3 (6.4) 22 23
Body fat(%) 13.3 (2.8) 27.0 (2.3) - -
ystoli (mmHg) o li :: 7 : c y 124.1 (8.8) 124.2 (16.4) 121 114
c (mmHg) ias -
VDý
to l i 76.0 (10.9) 82.6 (14.5) 57 59
r Oles t Cholesterol (mmol/L)
3.9 (0.2) 3.9 (0.1) 3.8 4.1
Haernoglobin (g/1) 142.6 135.3 (14.8) 1 135 131
13Mi: <zu - unaerweignx, zu-zo - normai, /-o-. ju - overweigni, ;,, 5u - oDese (uorl -i utsq)
3.3.3.2 Diet
No respondent reported consumption of any fruit on food record days, and only
two reported consuming a portion of vegetables, although some reported
consuming baked beans. Twenty respondents consumed fried chips every day,
whilst six of these consumed chips at least twice a day. Processed meats such as
sausages, burgers and pies were frequently consumed with the chips. Coffee and
tea with at least two (and up to seven) teaspoons of added sugar were consumed by some respondents in very large quantities (between 11-24 cups a day). The
majority of residents in one hostel (92%) reported consuming the healthier options
of noodles and/or breakfast cereals on each record day.
Energy and nutrient intakes were compared to Dietary Reference Values (DRV) for 15 - 18 year olds, and expressed as a percentage. The mean energy intakes
of both males and females were lower than recommended intakes for their age group. Females had particularly low intakes, achieving only 59% of their Estimated Average Requirement (EAR) (Table 3.3b). The calculation of mean
energy intake to basal metabolic rate (BMR) ratios revealed values of 1.2 for
males and 0.8 for females, below the value of 1.4 often used to identify under- reporters (Goldberg et al., 1991).
107
Mean fat, protein and carbohydrate intakes were compared to DRVs regarding the
contribution of various nutrients to energy intake. The guidelines that exclude
alcohol were used, because whilst some subjects talked about alcohol
consumption during informal talks, none reported consuming any in their 24-hour
recalls. The contribution of fat and carbohydrate energy intake exceeded the
recommended 35% and 50% for both mates and females. The contribution of SFA, MUFA and PUFA to total fat intake was close to DRV levels. The
contribution of (NME) sugars to total carbohydrate intake was higher than
recommended, particularly amongst female respondents, (largely due to high
intakes of soft drinks and added sugar to hot drinks) whilst starch intakes were lower than recommended. Males'intakes were 9% above the (NME) sugars DRV
and 8% below the DRV for starch, but there was a greater difference in females'
intakes, with (NME) sugars intakes 145% higher than the DRV and starch intakes
23% lower. Protein intakes were lower than the recommended 15% of energy for
both males and females, with intakes of 74% and 64% RNI respectively. Respondents were consuming less than the recommended 18g/day of NSP,
especially females who consumed less than half (8g), due to a lack of wholemeal cereal products and vegetables in their diets.
108
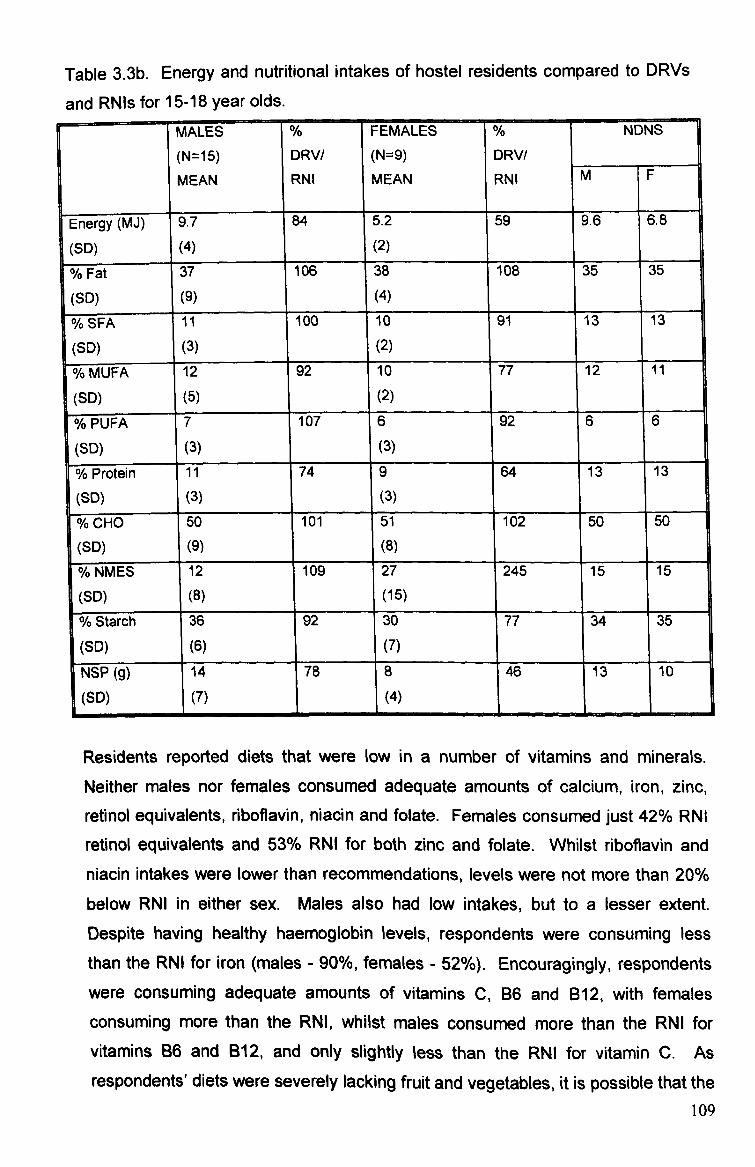
Table 3.3b. Energy and nutritional intakes of hostel residents compared to DRVs
and RNIs for 15-18 year olds. MALES % FEMALES % NDNS
( N=15) DRV/ ( N=9) DRV/
MEAN RNI MEAN RNI M F
Energy (MJ) 9.7 84 5.2 59 9.6 6.8
(SD) (4) (2)
% Fat 37 106 38 108 35 35
(SD) (9) (4)
% SFA I1 100 10 91 13 13
(SD) (3) (2)
% MUFA 12 92 10 77 12 11
(SD) (5) -
(2)
% PUFA 7 10 7 6 92 6 6
(SD) (3) (3)
% Protein 11 74 9 64 13 13
(SD) (3) (3)
% CHO 50 101 51 102 50 50
(SD) (9) 1
(8) i
% NMES 12 109 27 245 15 15
(SD) (8) (15)
% Starch 36 92 30 77 34 35
(6) (7)
NSP (g) 14 78 8 46 13 10
(SD) 1(7) ý
(4) ftý L--
I
Residents reported diets that were low in a number of vitamins and minerals. Neither males nor females consumed adequate amounts of calcium, iron, zinc, retinol equivalents, 6boflavin, niacin and folate. Females consumed just 42% RNI
retinol equivalents and 53% RNI for both zinc and folate. Whilst riboflavin and niacin intakes were lower than recommendations, levels were not more than 20%
below RNI in either sex. Males also had low intakes, but to a lesser extent. Despite having healthy haernoglobin levels, respondents were consuming less than the RNI for iron (males - 90%, females - 52%). Encouragingly, respondents were consuming adequate amounts of vitamins C, B6 and B12, with females
consuming more than the RNI, whilst males consumed more than the RNI for
vitamins B6 and B12, and only slightly less than the RNI for vitamin C. As respondents' diets were severely lacking fruit and vegetables, it is possible that the
109
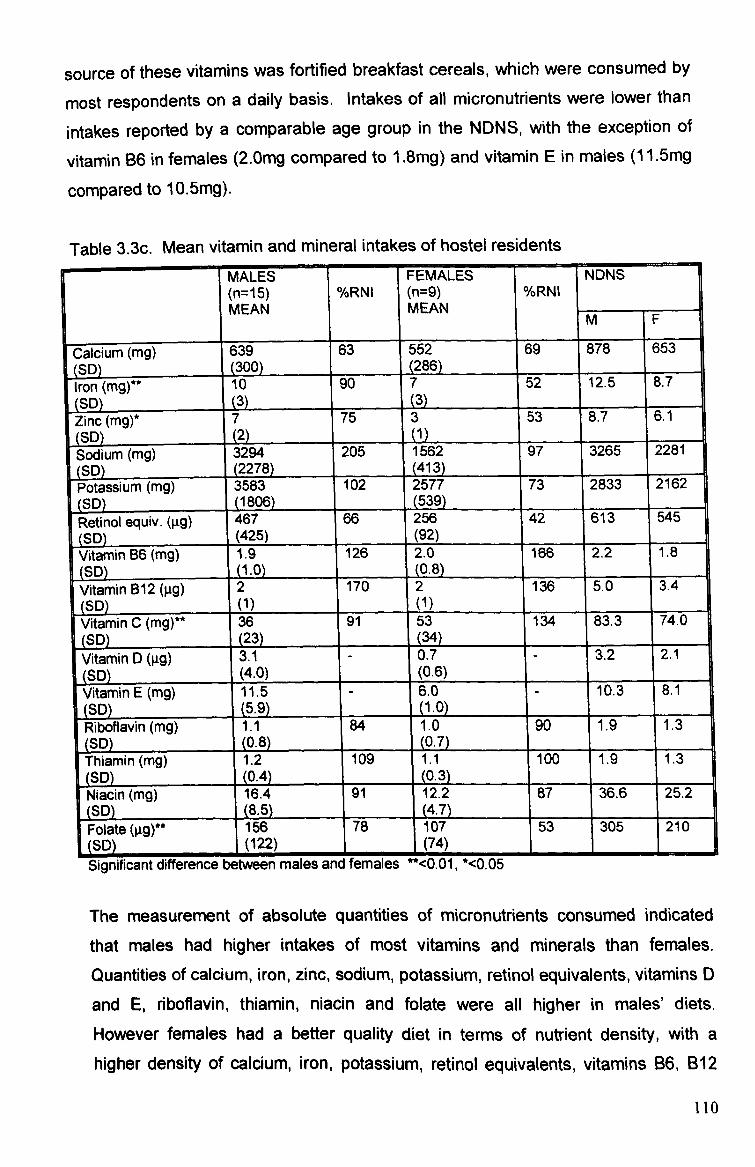
source of these vitamins was fortified breakfast cereals, which were consumed by
most respondents on a daily basis. Intakes of all micronutrients, were lower than
intakes reported by a comparable age group in the NDNS, with the exception of
vitamin B6 in females (2. Omg compared to 1.8mg) and vitamin E in males (1 1.5mg
compared to 10.5mg).
Table 3.3c. Mean vitamin and mineral intakes of hostel residents MALES FEMALES NDNS (n=15) %RNI (n=g) %RNI MEAN MEAN
M F
Calcium (mg) 639 63 552 69 878 653 (SID) (300) 1(286) 1 Iron (mg)** 10 90 7 1 52 12.5 8.7 (SID) (3) (3) Zinc (mg)* 7 75 3 1 53 8.7 6.1
(2) (1) Sodium (mg) 3294 205 1562 97 3265 2281 (SID) (2278) (413) Potassium (mg) 3583 102 2577 73 2833 2162 (SD) (1806) (539) Retinol equiv. (ýtg) 467 66 256 42 613 1 545 (SO) (425) (92)
1
Vitamin B6 (mg) 1.9 126 2.0 166 2.2 1.8 (SD) (1.0) (0.8)
_ Vitamin B12 (gg) 2 170 2 136 5.0 3.4 I 1 (SID) (1) (1)
- Vitamin C (mal** 36 91 53 134 83.3 174.0 1 ( SD) (23) (34) 1
Vitamin D (gg) 3.1 0.7 7 3.2 2.1
(SD) (4.0) E 06 06) (0.6) Vitamin E (mg) 11.5 6 6.
ý 6.0 t
10.3 8.1 (SID) 1(5.9) 11.0 Riboflavin (mg) 1.1 1 84 1.0 90 1.9 1.3 (SID) (0.8) (0.7) Thiamin (mg) 1.2 109 1.1 100 1.9 1.3
1
(SID) (0.4) (0.3) Niacin (mg) 16.4 91 12.2 87 36.6 25.2 (SID) (8.5) (4.7) Folate 156 78 107 53 305 210 (SID) (122) (74) Ainnificant difference between males and females **<0.01. *<0.05
The measurement of absolute quantities of micronutrients consumed indicated
that males had higher intakes of most vitamins and minerals than females.
Quantities of calcium, iron, zinc, sodium, potassium, retinol equivalents, vitamins D
and E, riboflavin, thiamin, niacin and folate were all higher in males' diets.
However females had a better quality diet in terms of nutrient density, with a higher density of calcium, iron, potassium, retinol equivalents, vitamins B6, B12
Ito
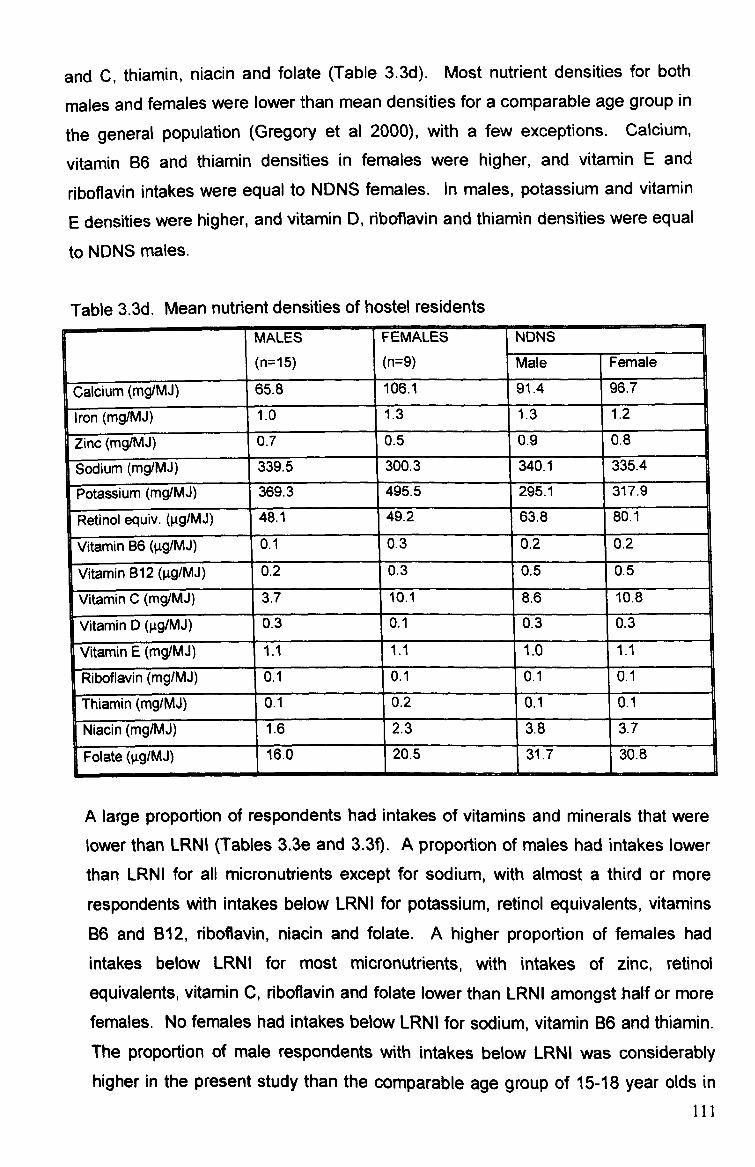
and C, thiamin, niacin and folate (Table 3-3d). Most nutrient densities for both
males and females were lower than mean densities for a comparable age group in
the general population (Gregory et al 2000), with a few exceptions. Calcium,
vitamin B6 and thiamin densities in females were higher, and vitamin E and
riboflavin intakes were equal to NDNS females. In males, potassium and vitamin
E densities were higher, and vitamin D, riboflavin and thiamin densities were equal
to NDNS males.
Table 3.3d. Mean nutrient densities of hostel residents MALES
(n=15)
FEMALES NDNS
(n=9) Male Female
calcium (mg/MJ) 65.8 106.1 91.4 96.7
iron (mg/MJ) 1.0 1.3 1.3 1.2
Zinc (mg/MJ) 0.7 0.5 0.9 0,8 F
Sodium (m so Sodium (mg/MJ) 339.5 300.3 340.1 335.4
P Potassium (I ootassium ((mgjMj) 369.3 1495.5
295.1 317.9
Retinol equiv. (ggIMJ) 48.1 49.2 63.8- 80.1
Vitamin B6 (gg/MJ) 0.1 0.3 0.2 0.2
Vitamin B12 (pg/MJ) 0.2 0.3 0.5 0.5
Vitamin C (mg/MJ) 3.7 10.1 8.6 10.8
Vitamin D (ýtg/MJ) 0.3 0.1 0.3 0.3
Vitamin E (mg/MJ) 1.1 1.1 1.0 1.1
Riboflavin (mg/MJ) 0.1 0.1 0.1 0.1
Thiamin (mg/MJ) 0.1 0.2 0.1 0.1
Niacin (mg/MJ) 1.6 2.3 3.8 3.7
Folate (ltg/M, l) 16.0 20.5 31.7 30.8
A large proportion of respondents had intakes of vitamins and minerals that were lower than LRNI (Tables 3.3e and 3.3f). A proportion of males had intakes lower
than LRNI for all micronutrients except for sodium, with almost a third or more
respondents with intakes below LRNI for potassium, retinol equivalents, vitamins B6 and B12, riboflavin, niacin and folate. A higher proportion of females had
intakes below LRNI for most micronutrients, with intakes of zinc, retinol
equivalents, vitamin C, riboflavin and folate lower than LRNI amongstbalf or more females. No females had intakes below LRNI for sodium, vitamin B6 and thiamin. The proportion of male respondents with intakes below LRNI was considerably higher in the present study than the comparable age group of 15-18 year olds in
III

the general population (Gregory et al 2000). For females, the proportion
consuming less than LRNI was also considerably higher than in NDNS females for
most micronutrients except iron and potassium.
Table 3.3e. Proportion of residents with mineral intakes lower than LRNI
% RESPONDENTS
Calcium Iron Zinc Sodium Potassium
Males
r
14 14 28 0 30
Females 33 33 50 0 0
NDNS
( (Males)
NDNS
males)
9 2 9 0 15
DNS L(fema-les) DNE 19 I
50 I
10 I
0 I
38 I
-. j
Table 3.3f. Proportion of residents with vitamin intakes lower than LRNI
% RESPONDENTS
Retinol Vitamin
equivalents B6
Vitamin B12
Vitamin c
Riboflavin Thiamin Niacin Folate
Males 30 31 29 21 40 7 38 43
Females 50 0 1 18 170 50 0 32 50
NDNS
(males)
12 0 0 0 6 0 0 0
NDNS
(females)
12 5 I
2 0 I
21 I
2 L 1
3.3.4 Discussion
This study has highlighted significant concerns regarding the diets of young homeless people. Although the sample size in this study was small (n=24), the
average age of 18 years and the ratio of mates to females (63% male, 37%
female) is comparable to that of much larger youth homelessness studies, which
report between 30-40% of hostel users are female (O'Mahony, 1988). The low
participation rate was due to the poor response rate from hostel managers (27% of
contacted hostel managers agreed to participate); response from residents whose hostel managers had agreed to participate was more positive (56% of all hostel
residents from 3 participating hostels). Participating hostels were actively involved
in promoting healthy eating to residents, which may have influenced their decision
to become involved in the study and perhaps the other hostels to refuse.
112

However, this may suggest that the dietary habits reported in this study are more
positive than young homeless people in general who reside at hostels that do not
provide healthy eating information and support.
The ratio between energy intake to basal metabolic rate suggests under-reporting
occurred. Residents' dietary habits were often erratic however, and the types and
quantities of food consumed depended on their financial circumstances. A large
proportion of their income was spent on 'feel good' items such as alcohol,
chocolate and takeaways immediately after receiving their benefit payments,
which could result in insufficient funds for food towards the end of the fortnight.
Therefore what appears to be under-reporting might be a true reflection of
residents adjusting eating habits according to their funds, which often occurs
amongst low-income groups (Joseph Rowntree Foundation 1994). The irregular
nature of their eating habits is highlighted by comparing respondents' coefficience
of variation for energy with National Diet and Nutrition Survey (NDNS) data
(Gregory et al. 2000) (homeless males-46.2%, females-36.2% compared to
NDNS males-24.5%, females-25.6%). It is likely that since data collection
coincided with the low point of their financial cycle, respondents could not afford
alcohol or snack foods, resulting in lower than normal energy intakes.
The quality of diet of these homeless hostel residents was poor. This reflects findings of other studies of homeless people, which indicate that homelessness
can have a detrimental effect on diet. Stift et al (1994), Coufopoulos (1997) and Evans and Dowler (1999) found homeless people had high fat and energy intakes
along with low nutrient intakes, which, according to Daly (1990) increases their risk of developing gastrointestinal disorders and infectious diseases in the short term and CHD and stroke in the long term.
Relatively little research has been carried out to investigate the impact of homelessness on diet, although homelessness and health in general is much more widely researched. The research that has investigated diet and homelessness has largely focussed on older age groups of single homeless and families, despite the rising numbers of homeless young people (Dachner and Tarasuk 2002). Centrepoint (2003) estimate that approximately 52000 young people were reported to be homeless by local authorities in 2003, although official
113
homeless statistics often underestimate the actual rate of homelessness due to
unreported 'hidden homeless' (such as individuals sleeping on friends' floors).
This study is unique in that it provides evidence of the dietary habits and nutritional
status of young homeless people who reside in temporary hostel accommodation,
which aim to assist them to make the transition to independent living. Only one
research study was found to have investigated dietary habits of homeless young
people (Dachner and Tarasuk 2002), which was a qualitative study of Canadian
homeless young people who earned money by washing car windows. Respondents in this study also adopted erratic eating patterns, which were dependent on their income, and frequently purchased inexpensive foods from fast
food outlets such as processed meats and chips or easy to prepare foods. This
reflects the findings of the present study, which observed frequent intakes of takeout burgers or fish and chips and breakfast cereals and noodles that require
minimal preparation.
The high intakes of fat in participants' diets had not affected their weight, possibly because overall their energy intakes were low. Total cholesterol levels were also not elevated as a result of high fat intakes, perhaps because the proportion of SFA, MUFA and PUFA contributing to total fat intakes were close to
recommended levels. Additionally, the erratic nature of these respondent's dietary habits meant that fat was not consumed in excess on a daily basis. This finding
was contrary to the findings of Luder et al (1990) who reported high cholesterol levels above a recommended 5.7mmol/L in 82% of adult subjects, which may be due to these subjects being older than subjects in the present study, and having
probably been homeless for longer. This may be an indication of the potential for raised cholesterol levels in respondents in the future.
High intakes of (NME) sugars due to the consumption of large quantities of soft drinks and adding sugar to tea and coffee may have a detrimental effect on dental health by increasing the risk of dental caries. Wright et al (1998) found a higher rate of dental disease in homeless adults than in the general population, and homeless children were 10 times more likely to experience dental problems. Although rates of dental problems are high amongst the homeless, uptake of dental care is low due to problems registering with dentists and the cost of dental care (Golden 1999). It is possible that on the days when respondents do not eat,
114
their only energy intake consists of coffee or tea with added sugar. Hot drinks are
cheap and have a short-term satiating effect, and the high quantities of added
sugar would provide some energy but no other nutrients.
Intakes of B vitamins, thiamin and riboflavin were higher than other micronutrient
intakes and some intakes were higher than NDNS respondents. This may be
attributable to the consumption of breakfast cereals by some respondents. Gibson
(2003) reported an association between the amount of breakfast cereals
consumed and the level of vitamins B6, B12, thiamine and riboflavin in the diet.
However folate intakes, which are usually associated with B vitamin intakes were
low. This may be due to the type of cereal consumed (the cheaper cornflakes
consumed by most respondents may not be fortified with vitamins, but are a
natural source of vitamin 136). The proportion of respondents with intakes of B
vitamins below LRNI was fairly high, particularly in males, which reflects the
dietary habits of those who did not consume breakfast cereals. A high proportion
of respondents had intakes of vitamin C below LRNI, which reflects the absence of fruit in their diets.
Intakes of protein, NSP, calcium, iron, zinc and folate were lower than RNI/DRV in
both male and female subjects. Low NSP intakes were likely to be a result of the
lack of vegetables, fruit and wholemeal cereal products in the diet. Fruit and
vegetables are an important source of numerous nutrients, and adequate intakes
(the Department of Health recommend consuming at least five portions a day
(DoH 2005b)) have been found to reduce the risk of developing CHD, stroke and
some cancers (Appleby et al 1999). The lack of fruit and vegetables in these
respondent's diets might therefore increase their risk of developing such diseases
in adulthood. No respondent consumed iron-rich leafy green vegetables, which
along with low intakes of red meat would have contributed to low iron intakes. The
only meat consumed by respondents was processed products such as sausages
and burgers, which have a higher fat content and lower levels of protein, iron and
various other micronutrients than other meat products. Protein intakes tend to be
associated to zinc intakes due to similar food sources, hence the low zinc intakes in respondents. The main source of calcium in the average UK diet is generally milk, yoghurt and cheese. Although yoghurt and cheese was absent in most food
records, some respondents consumed milk on breakfast cereals and in tea and
115
coffee. In order to achieve peak bone mass, it is important that respondents
increase their calcium intakes at this age. These low intakes could have health
implications such as increased susceptibility to infection and illness and prolonged
recovery rate, and long-term consequences such as increased risk of coronary
heart disease, stroke and osteoporosis (Wright et al 1998).
One factor underestimated during data collection, although staff reported it as a
frequent occurrence, was the tendency for residents to skip meals. During data
collection, many residents reported consuming just two meals a day, and it
became evident that the times at which these meals were consumed were often
unpredictable, but no respondent reported eating nothing. However staff revealed
that many residents often consumed nothing, or very little for a number of days at
a time. It is therefore likely that residents may be more at risk of deficiencies than
these results suggest. It is also possible that frequent periods of fasting may have
implications for behaviour and cognitive performance. Skipping breakfast has
been found to have a negative effect on cognitive performance and concentration
in children and adolescents, particularly those who are malnourished, due to a
temporary shortage of glucose in the brain (Bellisle 2004). It is therefore likely that
longer periods of shortages resulting in skipping meals for days at a time will have
a detrimental effect on behaviour and brain function. Residents of one hostel had
experienced difficulties in registering with dentists and doctors due to having no fixed address; a problem that has been reported in other studies of homelessness
(Wright et al 1998). If residents cannot access the health care that they are
entitled to, poor health as a result of their diet is likely to go undiagnosed and
untreated.
The poor nutritional intakes observed in residents were not reflected in nutritional
status measurements, which were generally within a healthy range, (although
there is the suggestion that the males are tending to underweight, but longitudinal
data are required to confirm this). Compared to mean nutritional status measurements observed in the average population of 15-18 year olds in the National Diet and Nutrition Survey (Gregory et al 2000), these homeless young people were of shorter stature, and had higher BMI and blood pressure. Their
shorter stature may be due to poor dietary habits since childhood affecting their rate of growth and development, whilst higher blood pressure is likely to be a
116

result of more recent factors. Elevated blood pressure levels may be an indication
of high alcohol intakes (which was considered likely in some subjects, who
reported consuming no alcohol on record days but reported consuming large
quantities away from hostel premises after receiving their benefit payments).
However, blood pressure may also be high as a result of stress, which was
predominant in most of these respondent's lives as a result of their homelessness.
Hypertension and high BIVII have been reported in other studies of older homeless
adults (Luder et al 1990). Wright et al (1998) estimate that homeless people are
2-4 times more likely to suffer from hypertension. If these dietary habits are
followed in the long-term, residents are likely to be at an increased risk of
deteriorating nutritional status and developing associated illness such as CHID,
stroke and obesity-related disease.
Many respondents expressed an interest in eating more healthily, but found it
difficult for a variety of reasons. Low income was seen to be the main barrier to
eating healthily, as well as lack of motivation. One resident said that in the past,
she made a great effort to buy fruit and vegetables for herself and her two young
children by purchasing cheap produce from the market at the end of the day.
There was no guarantee that any would be available, but providing healthy food
for her children was motivation. Since her children were taken into care she stated that she was less concerned about eating healthily herself, so no longer made the
extra effort to acquire healthy food. Another resident reported being more inclined
to buy healthier food when he cooked meals with his girlfriend who was also a hostel resident.
The role of social contact at meal times has been found to influence the healthfulness of individual's diets (Mintel 2002b). These hostels encouraged
residents to cook and eat together at least once a week in order to teach cookery
skills and also to reduce feelings of exclusion and loneliness. In two out of the three hostels, residents consumed similar types of foods (in one hostel, breakfast
cereals and noodles featured in most respondent's diet on a daily basis, and in the
second, fried chips and processed meat products were consumed by most respondents at least once a day), suggesting that dietary habits may be peer-led in a communal living environment. The tendency for homeless hostel residents to
consume similar foods and share food has been reported elsewhere by Dachner
117
and Tarasuk (2002) who found that young homeless people often pool their
resources whether it be money or food. This may be useful in encouraging
healthier eating habits within hostels, if a few residents adopt healthier eating
habits and pass these on to other residents. In this study, however, it appeared
that residents were only sharing poor dietary habits.
The incidence of unplanned pregnancy amongst single young women residing in
homeless hostels is high, and the rate of termination low. Twenty four percent of
young women residing in London hostels reported being pregnant during the
previous year, and 76% went ahead with the pregnancy (Gorton 2000).
Respondents in the present study were not asked whether they had children or
were currently pregnant, although two respondents spoke of motherhood and a
further two were pregnant. A balanced diet, limited alcohol intake and not smoking
is vital during pregnancy to reduce the likelihood of low birth-weight and optimise
the health of the child. Furthermore, poor diet during pregnancy may'program' the
child for future poor health as an adult (Lucas 1998).
In a study of pregnant homeless women, Kushner (1998) reported one third of
women recruited to the study experienced miscarriage, 23% had premature babies
and 13% were stillborn. The dietary habits and health behaviours of females in
the present study are likely to have serious implications for the health of both child
and mother. A lack of regular nourishment as a result of erratic meal patterns is
likely to have an impact on growth and development, as is the poor quality of the
food that was consumed. Pregnant women are recommended to consume a diet
rich in folate, or take a supplement in the first trimester to help prevent neural tube
birth defects. Mean folate intakes in females in the present study were just 53%
RNI, and only 7% higher than LRNI, suggesting that it was very likely that
pregnant respondents were consuming insufficient quantities. Respondents also
reported smoking whilst pregnant, hence increasing the possibility of low birth-
weight.
The impact of poor nutrition in young adulthood as observed in this study may have a more severe impact on health in the near future. The hostels that
participated in this study all offered some support to their residents to increase
awareness of healthy eating and teach practical cookery skills to aid their
118

transition into independent living. However, it was evident that the barriers
preventing residents from eating healthily were far more complex than low-income
or lack of knowledge and practical skills. A 20-year-old mother of two who had
recently become homeless and had her children taken into care commented that
she had "more important things on my mind than worrying about eating". This
sums up the general attitude of most of the respondents. At an age when eating a
nutritionally adequate diet is important for growth and development as well as future health, many of these young people were facing difficulties far more
overwhelming than concerns about their diet. Unless residents are able to break
out of the cycle of homelessness, unemployment and low-income, their dietary
habits are likely to continue to suffer, resulting in poor nutritional status and
consequently ill-health in early adulthood.
The findings of this phase of the study have been published in The International
Journal of Health Promotion and Education (See Appendix 11).
119
3.4 Dietary habits and nutritional status of independent living, working
young adults 3.4.1 Introduction
The final group of young people in this investigation were those who had been
living independently and in full-time employment for more than four years. This
group should be more established in their independent lives as the novelty of living
away from home should have diminished. Having lived independently for more
than four years, this group should have more experience of catering for
themselves, and their dietary and lifestyle habits at this stage of their life were likely to be fairly established until the occurrence of a major lifestyle change such
as co-habitation/marriage. Being in full-time employment might also result in more
stabilised dietary habits than observed in students and homeless young people, as
the time restrictions of a working day might result in the development of a routine
for mealtimes and less opportunity to snack during the day. This study investigated the diet and nutritional status of young working adults.
3.4.2 Methods
The inclusion criteria for recruitment to this study was young people (maximum
age 30 years), who have been both living independently and working full-time for 4
years or more. Subjects were recruited by word of mouth (mainly through
respondents recruited to phase 1 and 2 of this study). Dietary habits and
nutritional intakes were assessed using 24-hour recalls. Nutritional status
assessment included measuring height, weight, BMI, body composition (determined from biceps and triceps skinfolds) and blood pressure. A finger-prick
blood sample was taken to measure total cholesterol and haemoglobin. All
measurements were taken following the protocol described in the methodology (pages 54 and 61).
3.4.3 Results Thirty-three subjects were recruited, 39% males and 61% females. The average age of respondents was 24 years (range 19-26 years), and the mean number of years of independent living was six years.
120
3.4.3.1 Nutritional status on average, respondent's nutritional status' were within a healthy range, and were
also comparable to data for the corresponding age group from the National Diet
and Nutrition Survey (Henderson et al 2003) (Table 3.4a). Male and female
respondents were slightly lighter in weight than the average UK population, with a 2kg difference for males and 5kg for females. Respondent's height was within 2cm of the mean height reported for 19-25 year olds in a representative sample of the UK population (Henderson et al 2003). Female BMI and body fat were 23.3
and 26.9% respectively, which is mid-range of the recommended 20-25 kg /M2 (BMI) and 25-31% (body fat). Male BMI of 25.0 was at the upper end of the healthy range, although body fat of 26.9% was at the lower end of the
recommended range of 18-25%. This suggests that male BMI calculations were biased by higher levels of lean body mass.
Male blood pressure was 131.3/82.3mmHg, which is higher than the recommended levels of 120/80mmHg, but neither systolic nor diastolic levels were high enough to indicate hypertension. Female diastolic blood pressure of 81.8mmHg was also slightly higher than 80mmHg, but systolic pressure was lower than recommended at 117. OmmHg. Respondent's systolic blood pressure was comparable to NDNS data at just 4mmHg higher, but a greater difference was observed for mean diastolic, which was 18.3mmHg (males) 19. BmmHg (females) higher than NDNS data. Total cholesterol levels were 4.3mmol/L (males) and 4.4mmol/L (females), which were well below the recommended limit of 5.2mmol/L,
and were also under the lower limit of 4-8mmol/L that is recommended for young people. Haemoglobin levels of 142.1gA (males) and 127.6gA (females) were above the recommended lower limits of 130g/l (males) and 120g/l (females). Mean total cholesterol levels were comparable to NDNS data, with a difference of just 0.1 mmol/L, whilst haemoglobin levels were 1 Og/l lower than NDNS levels.
121
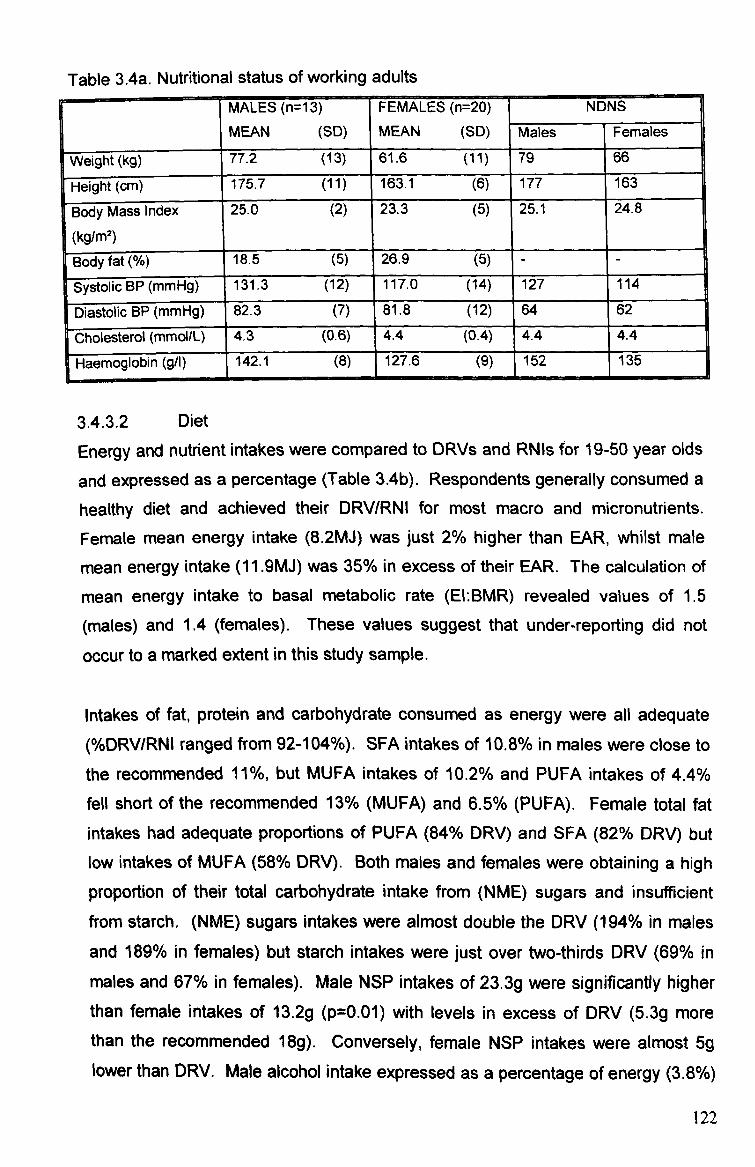
Table 3.4a. Nutritional status of working adults MALES (n= 13) FEMALES (n=20) NDNS
MEAN (SID) MEAN (SID) Males Females
Weight (kg) 77.2 (13) 61.6 (11) 79 66
Height (cm) 175.7 (11) 163.1 (6) 177 163
Body Massindex
(kg/M2)
25.0 (2) 23.3 (5) 25.1 24.8
Body fat 18.5 (5) 26.9 (5) - - Systolic BP (mmHg) 131.3 (12) 117.0 (14) 127 114
Diastolic BP (mmHg) 82.3 (7) 81.8 (12) 64 62
-Cholesterol (mmol/L) 4.3 (0.6) 4.4 (0.4) 4.4 4.4
Haemoglobin (g/1) 142.1 (8)
1
127.6 (9) 152 135
3.4.3.2 Diet
Energy and nutrient intakes were compared to DRVs and RNIs for 19-50 year olds
and expressed as a percentage (Table 3.4b). Respondents generally consumed a
healthy diet and achieved their DRV/RNI for most macro and micronutrients. Female mean energy intake (8.2MJ) was just 2% higher than EAR, whilst mate
mean energy intake (11.91VIJ) was 35% in excess of their EAR. The calculation of
mean energy intake to basal metabolic rate (El: BMR) revealed values of 1.5
(males) and 1.4 (females). These values suggest that under-reporting did not
occur to a marked extent in this study sample.
Intakes of fat, protein and carbohydrate consumed as energy were all adequate (%DRV/RNI ranged from 92-104%). SFA intakes of 10.8% in males were close to
the recommended 11%, but MUFA intakes of 10.2% and PUFA intakes of 4.4% fell short of the recommended 13% (MUFA) and 6.5% (PUFA). Female total fat intakes had adequate proportions of PUFA (84% DRV) and SFA (82% DRV) but low intakes of MUFA (58% DRV). Both males and females were obtaining a high
proportion of their total carbohydrate intake from (NME) sugars and insufficient from starch. (NME) sugars intakes were almost double the DRV (194% in males and 189% in females) but starch intakes were just over two-thirds DRV (69% in
males and 67% in females). Male NSP intakes of 23.3g were significantly higher than female intakes of 13.2g (p=0.01) with levels in excess of DRV (5.3g more than the recommended 18g). Conversely, female NSP intakes were almost 5g lower than DRV. Male alcohol intake expressed as a percentage of energy (3.8%)
122
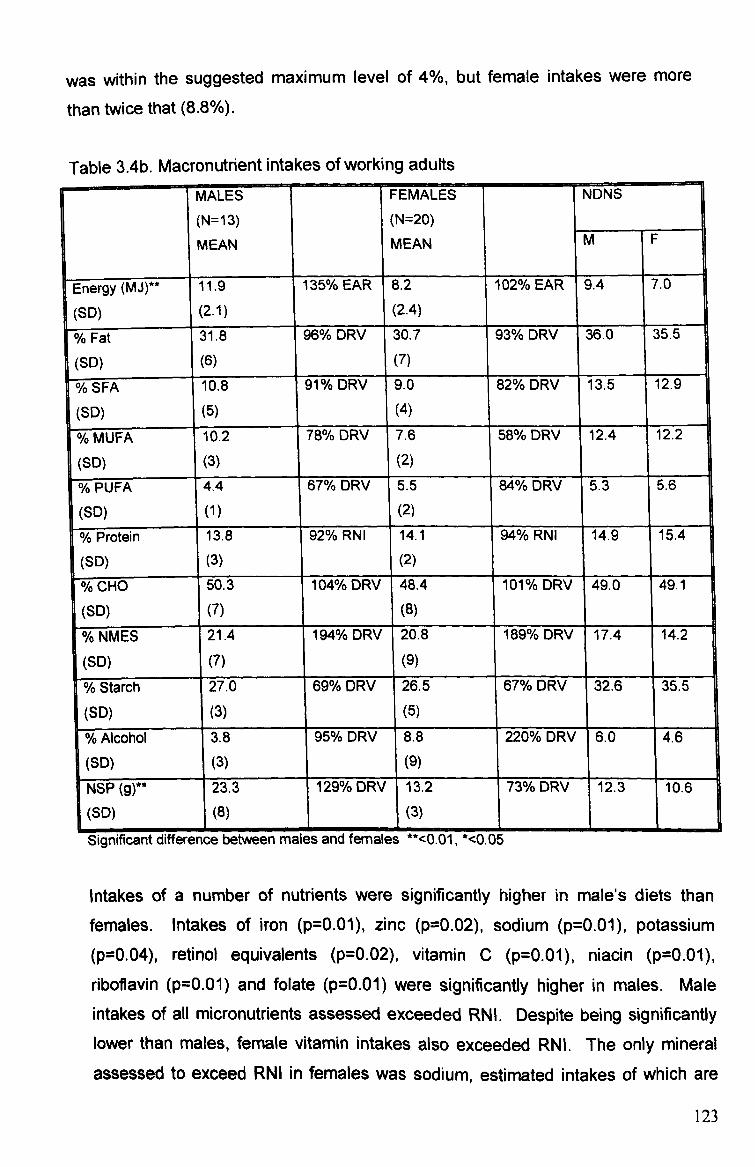
was within the suggested maximum level of 4%, but female intakes were more
than twice that (8.8%).
Table 3.4b. Macronutrient intakes of working adults MALES FEMALES NDNS
(N=13) (N=20)
MEAN MEAN m F
Energy (MJ)-- 11.9 135% EAR 8.2 102% EAR 9.4 7.0
(SID) (2.1) (2.4)
% Fat 31.8 96% DRV 30.7 93% DRV 36.0 35.6
(SID) (6) (7)
% SFA 10.8 91 % DRV 9.0 82% DRV 13.5 12.9
(SID) 1(5) 1 (4)
% MUFA 10.2 78% DRV 7.6 58% DRV 12.4 12.2
(SD) (3) (2)
% PUFA 4ý4 67% DRV 5.5 84% DRV 5.3 5.6
(SD) (1) (2)
% Protein 13.8 92% RNI 14.1 94% RNI 14.9 15.4
(SID) (3) (2)
% CHO 50.3 104% DRV 48.4 101% DRV 49.0 49.1
(SID) (7) (8)
% NMES 21.4 194% DRV 20.8 189% DRV 17.4 14.2
(SD) (7) (9)
% Starch 27.0 69% DRV 26.5 67% DRV 32.6 35.5
1
(SD) (3) (5) 1
% Alcohol 3.8 95% DRV 8.8 220% DRV 6.0 4.6
(SID) (3) (9)
NSP 23.3 129% DRV 1 13.2 73% DRV 12.3 10.6
(SD) (8) (3)
Significant difference between males and females **<0.01, *<0.05
Intakes of a number of nutrients were significantly higher in male's diets than
females. Intakes of iron (p=0.01), zinc (p=0.02), sodium (p=0.01), potassium (p=0.04), retinol equivalents (p=0.02), vitamin C (p=0.01), niacin (p=0.01),
riboflavin (p=0.01) and folate (p=0.01) were significantly higher in males. Male
intakes of all micronutrients, assessed exceeded RNI. Despite being significantly lower than males, female vitamin intakes also exceeded RNI. The only mineral
assessed to exceed RNI in females was sodium, estimated intakes of which are
123
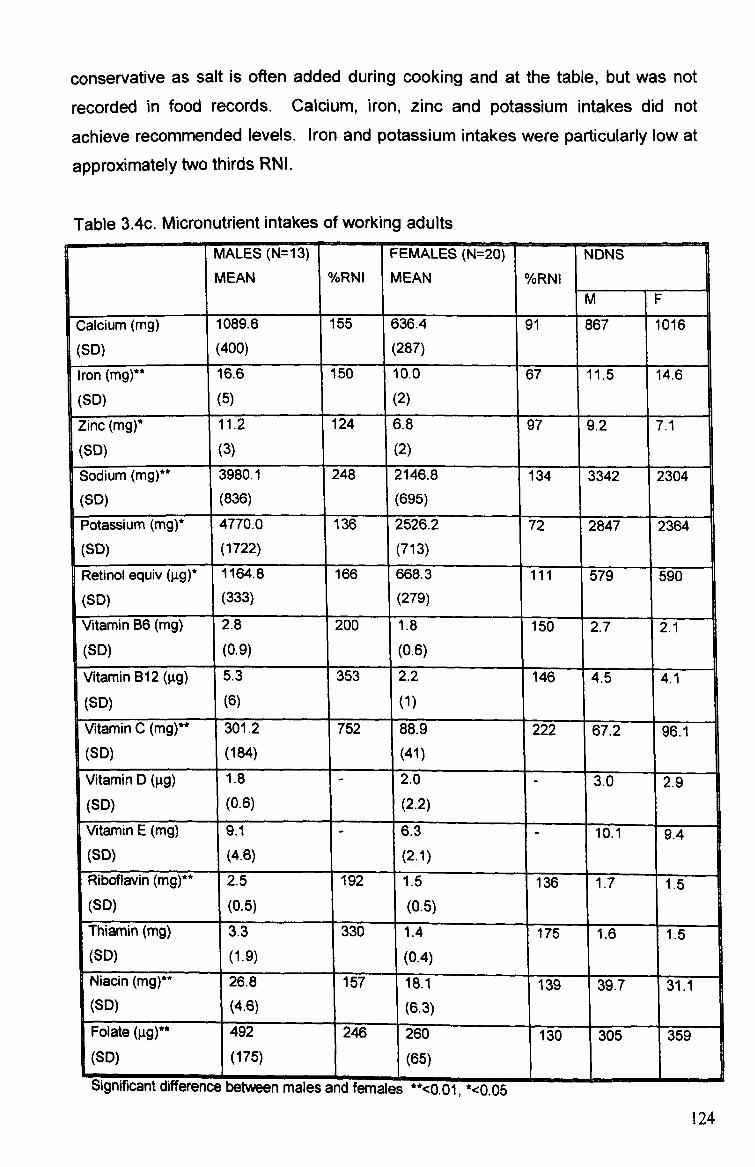
conservative as salt is often added during cooking and at the table, but was not
recorded in food records. Calcium, iron, zinc and potassium intakes did not
achieve recommended levels. Iron and potassium intakes were particularly low at
approximately two thirds RNI.
Table 3.4c. Micronutrient intakes of working adults MALES (N=13) FEMALES (N=20) NDNS MEAN %YORNI MEAN %RNI
M F
Calcium (mg) 1089.6 155 636.4 91 867 1016
(SID) (400) (287)
Iron (mg)** 16.6 150 10.0 67- 11.5 14.6
(SID) (5) (2)
Zinc (mg)* 11.2 124 6.8 97 9.2 7.1
(SID) (3) 1 (2)
Sodium (mg)** 3980.1 248 2146.8 134 3342 2304 (SID) (836) (695)
Potassium (mg)* 4770.0 136 2526.2 72 2847 2364 (SID) (1722) (713)
Retinol equiv (gg)* 1164.8 166 668.3 ill 579 590
(SID) 3) 1 (279) 1
Vitamin B6 (mg) 2.8 200 1.8 150 ' 2.7 2.1 (SID) (0.9) (0.6) Vitamin B12 (gg) 5.3 353 2.2 146 4.5 4.1
(SID) (6) (1)
Vitamin C (mg)** 301.2 752 88.9 222 67.2 96.1 (SID) (184) 1(41)
I
Vitamin D (gg)
I
1.8 2.0 3.0 2.9 (SID) (0.6)
1
(2.2) 1
Vitamin E (mg) 9.1 6.3 10.1 -- 9.4 (SD) (4.6)
1
(2.1) Riboflavin (mg)** 2.5 192 1.5 136 1.7 1.5
1
(SID) (0.5)
1
(0.5)
Thiamin (mg) 3.3 330 1.4 17T 1.6 1.5 (SID) (1-9) (0.4) Niacin (mg)** 26.8 157 18.1 139 39.7 31.1
1
(SO) (4.6) (6.3) Folate 492 246 260 130 305 359 (SID) (175) (65)
WItf"I'MICUIL UlllWlWll%oC WOLVVMII mdiati driu temaies --<u. ul, -<u. ub
124
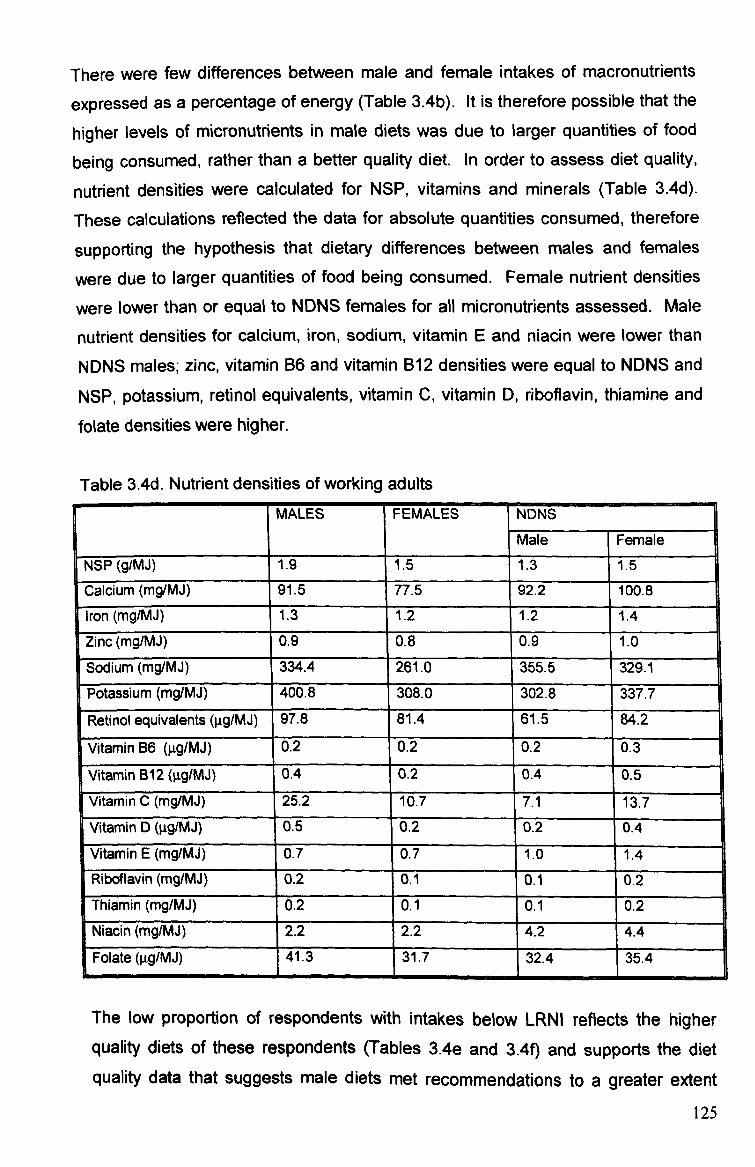
There were few differences between male and female intakes of macronutrients
expressed as a percentage of energy (Table 3.4b). It is therefore possible that the
higher levels of micronutrients in male diets was due to larger quantities of food
being consumed, rather than a better quality diet. In order to assess diet quality,
nutrient densities were calculated for NSP, vitamins and minerals (Table 3.4d).
These calculations reflected the data for absolute quantities consumed, therefore
supporting the hypothesis that dietary differences between males and females
were due to larger quantities of food being consumed. Female nutrient densities
were lower than or equal to NDNS females for all micronutrients assessed. Male
nutrient densities for calcium, iron, sodium, vitamin E and niacin were lower than
NDNS males; zinc, vitamin B6 and vitamin B12 densities were equal to NDNS and
NSP, potassium, retinol equivalents, vitamin C, vitamin D, riboflavin, thiamine and folate densities were higher.
Table 3.4d. Nutrient densities of working adults MALES FEMALES NDNS
Male Female
NSP (gIMJ) 1.9 1.5 1.3 1.5
Calcium (mg/MJ) 91.5 77.5 92.2 100.8
Iron (mg/MJ) 1.3 1.2 1.2 1.4
Zinc (mg/MJ) 0.9 0.8 0.9 1.0
Sodium (mg/MJ) 334.4 261.0 355.5 329.1
Potassium (mg/MJ) 400.8 308.0 302.8 337.7
Retinol equivalents (gg/MJ) 97.8 81.4 61.5 84.2
Vitamin B6 (gg/MJ) 0.2 0.2 0.2 0.3
Vitamin B12 (ltg/MJ) 0.4 0.2 0.4 0.5
Vitamin C (mgIMJ) 25.2 10.7 7.1 13.7
Vitamin D (gg/MJ) 0.5 0.2 02 0.4
Vitamin E (mg/MJ) 0.7 0.7 1.0 1.4 Riboflavin (mg/MJ) 0.2 0.1 0.1 0.2
Thiamin (mg/MJ) 0.2 0.1 0.1 0.2
Niacin (mg/MJ) 2.2 2.2 4.2 4.4
Folate (gg/MJ) 41.3 31.7 32.4 Wý
35.4
The low proportion of respondents with intakes below LRNI reflects the higher quality diets of these respondents (Tables 3.4e and 3.4f) and supports the diet quality data that suggests male diets met recommendations to a greater extent
125
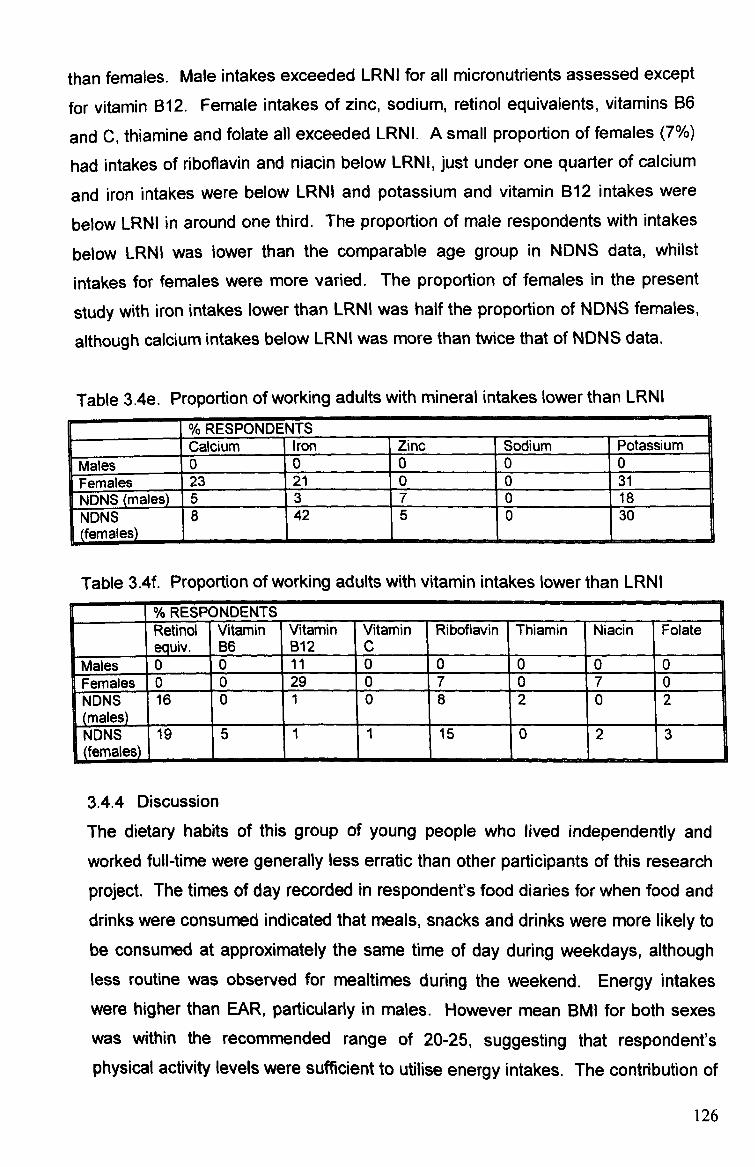
than females. Male intakes exceeded LRNI for all micronutrients assessed except
for vitamin B12. Female intakes of zinc, sodium, retinol equivalents, vitamins B6
and C, thiamine and folate all exceeded LRNL A small proportion of females (7%)
had intakes of riboflavin and niacin below LRNI, just under one quarter of calcium
and iron intakes were below LRNI and potassium and vitamin B12 intakes were
below LRNI in around one third. The proportion of male respondents with intakes
below LRNI was lower than the comparable age group in NDNS data, whilst
intakes for females were more varied. The proportion of females in the present
study with iron intakes lower than LRNI was half the proportion of NDNS females,
although calcium intakes below LRNI was more than twice that of NDNS data.
Table 3.4e. Proportion of working adults with mineral intakes lower than LRNI
% RESPONDE NTS Calcium Iron Zinc Sodium Potassium
Males 0 0 00 0 es
EFemal
23 21 00 31 NDNS Mal NDNS (males)_ 15 3 70 18
, fmIs N NDNS ( fem a es
DNS females)
8 '42 50 30
Table 3.4f. Proportion of working adults with vitamin intakes lower than LRNI
II %RESPONDENTS 9 Retinol equiv.
Vitamin B6
Vitamin B12
Vitamin Riboflavin c
Thiamin Niacin Folate EMales
0 0 11 00 0 0 0 m les Females 0 0 29 07 0 7 0
NDNS 716 (males
0 1
I-
8 0
II
2
I
0
I
2
I NDNS 19
m
M
fles)
I 5 11 15 10 12 3
3.4.4 Discussion
The dietary habits of this group of young people who lived independently and
worked full-time were generally less erratic than other participants of this research
project. The times of day recorded in respondent's food diaries for when food and drinks were consumed indicated that meals, snacks and drinks were more likely to be consumed at approximately the same time of day during weekdays, although less routine was observed for mealtimes during the weekend. Energy intakes
were higher than EAR, particularly in males. However mean BMI for both sexes was within the recommended range of 20-25, suggesting that respondent's physical activity levels were sufficient to utilise energy intakes. The contribution of
126
fat to energy intake was low, which may indicate that respondents were aware of
the health implications of a high fat diet and had adapted their diet to reduce fat
intake and replace high fat foods with more nutrient-dense foods. However, the
high levels of (NME) sugars contributing to energy intake is indicative of unhealthy
dietary habits, and may increase the risk of dental caries.
The nutritional status and dietary intakes of each group of respondents has been
compared to national data for a comparable age group from NDNS surveys.
Students and homeless respondents had particular lifestyle characteristics that
could differentiate them from the national representative of their age group (low
income, lack of daily routine, shared cooking facilities). However, this group of
working adults are more likely to lead comparable lifestyles to NDNS respondents,
with the exception that a proportion of NDNS respondents (14% males, 18%
females) were unemployed (Henderson et al 2003). Energy intakes and
percentage energy intakes from most macronutrients compared favourably to
average population intakes of 19-24 year olds.
Whilst energy intakes were higher than NDNS data for males and females, total fat
intakes were lower, suggesting that respondents were likely to consume more foods of a lower nutrient density. Respondents' intakes of SFA, MUFA and PUFA
adhered to recommendations to consume less saturated fat and more
monounsaturated and polyunsaturated fats more closely than 19-24 year olds in
the general population. These fat intakes should help to maintain healthy blood
cholesterol levels and reduce the risk of respondents developing CHID in the future
(DoH 1991). Low CHID rates in countries such as Greece and Italy have been linked to the low saturated and total fat intakes that characterise the 'Mediterranean diet', along with high fruit and vegetable intakes (Ferro-Luzzi and Sette (19 89).
Protein intakes were lower in males than females in both the present study and NDNS data. This may be due to the recent increasing popularity of high protein diets as a means of weight loss, which are more likely to be followed by females
than males (Westenhoefer 2005). Overall, protein intakes were slightly lower in
study respondents than NDNS data. The contribution of sugars and starch to total
carbohydrate intake in the present study and NDNS was not balanced, with a high
127
proportion of carbohydrates consumed as sugars and insufficient proportions of
starch although both males and females in the present study had higher sugars
and lower starch intakes than NDNS respondents. This may be due to less
concern regarding sugar intake than fat intake, or due to as common
misconception that a high sugar intake is less likely to result in weight gain than a
high fat intake, resulting in less concern regarding intake levels. The unbalanced
carbohydrate intakes may also be a result of the popularity of the high protein, low
carbohydrate diet mentioned previously. It is possible that young people may
decrease their consumption of starch carbohydrates, but may be either unaware
that carbohydrate foods include (NME) sugars so therefore fail to reduce intakes,
or find high sugar foods more difficult to omit from their diet. This would result in
an unbalanced intake of the two carbohydrate food groups as observed in the
present study and NDNS data. The main source of (NME) sugars in the diets of
both males and females was soft drinks and sugary snacks. Males were more
likely to consume soft drinks during the day, whilst females also frequently
consumed soft drinks as a mixer with alcoholic drinks.
Males consumed more fruit and vegetables than females, which is contrary to
NDNS data. This may be because males in the study were more likely to
consume fruit as a snack, whilst females more often opted for sugary snacks such
as chocolate. Female fruit and vegetable intake was comparable to NDNS
females (which reported an average 1.8 portions of fruit and vegetables per day).
Portions per day were not calculated in the present study, but it is estimated that
considering grams per day of NSP consumed by males was almost twice the
amount consumed by females, it is likely that males consumed approximately 3.5
portions per day (although standard deviation for male NSP intakes was higher
than females, suggesting a range of intakes). The low intakes of fruit and
vegetables in female diets is likely to be a contributing factor to the lower
micronutrient intakes, as fruit and vegetables are an important source of a wide
range of nutrients in the diet (FSA 2004) and consuming adequate quantities (at
least five portions a day) helps to protect against CHD and other chronic disease
(DoH 2005b).
Assessing both quantity and density of micronutrients in the diet revealed that
males were consuming a more nutritionally adequate diet than females, which is
128
contrary to NDNS data and previous research that suggests that females are
generally more health conscious than males in terms of dietary habits (Milligan et
al 1998, Shepherd and Dennison 1996). Male energy intakes were higher than
EAR and the comparable age group of the general population as reported in the
NDNS, but El: BMR ratios suggested that neither under nor over-reporting
occurred. Furthermore, BMI levels were within a healthy range and fat intakes
were not excessive. This suggests that the higher energy intakes were a result of
a more varied diet being consumed, which therefore resulted in higher nutrient
intakes.
Female micronutrient intakes were not only substantially lower than male intakes,
but certain micronutrients were also lower than the RNI, with a proportion of
respondents having intakes below LRNI for some micronutrients. Mean intakes of
iron, potassium, calcium and zinc in females were lower than RNI. This reflects
national data (Gregory et al 2000, Henderson et al 2003), which highlight
inadequate intakes of these micronutrients in young people between the ages of
15 years and 35 years. These low iron intakes were not reflected in mean blood
haemoglobin levels, which were 7g/l higher than the recommended lower limit of 120g/l for females, although 30% of females had haernoglobin levels lower than
120g/l so were therefore classed as anaemic. Low iron and calcium intakes in the
present study might be due to low intakes of red meat and dairy products. More
females than males did not consume any meat on survey days, and those who did
consume meat often opted for chicken as part of their main meal or processed ham/chicken/turkey slices at lunchtime, as opposed to the more popular choice of beef by males (albeit often in processed/ready-meals). This reflects the findings of Draper et al (1990) who report a higher rate of meat-avoidance and a preference for white meat amongst females.
Some reasons for the differences in meat consumption observed between males and females include moral/ethical and health considerations for meat avoidance. Females might prefer white meat due to the lower fat content compared to red meat and taste preferences (Draper et al 1990). Dairy products are one of the main sources of calcium, but intakes were low in female diets, possibly due to toast being a more common breakfast choice than cereal with milk, white meat being more popular than cheese at lunchtime and a lack of dairy products in the
129
evening meal. The main source of calcium in females who did not consume milk
(except for in hot drinks) was yoghurt. Adequate intakes of iron and calcium are
important in females to help prevent iron-deficient anaernia and to achieve and
maintain peak bone mass in order to reduce the risk of developing osteoporosis.
There is an increasing concern regarding alcohol consumption in young adulthood. The rate of binge drinking has increased in recent years, resulting in an increase in
alcohol-related crime and disorder (Richardson et al 2003)). However, the health
effects to this current generation of binge drinkers may not be fully evident until
much later. Until recently, excessive binge drinking was more common amongst
males. The rate of excessive drinking in females is now becoming an increasing
concern, with intakes often exceeding males', resulting in increasing rates of liver
cirrhosis in women (Donaldson 2004). This pattern of alcohol consumption was
evident in the present study, with females consuming more than twice their
suggested percentage energy as alcohol (and twice males' intake). Alcohol intakes did not appear to have resulted in elevated blood pressure levels, which
were close recommendations except for male systolic pressure, which was higher than recommended at 131.3mmHg. It is possible that these patterns of alcohol consumption could have implications for blood pressure levels in adulthood, although longitudinal data to track alcohol consumption and blood pressure levels is not available.
It may be suggested that dietary habits of young working adults who have been living independently for at least four years are likely to be more stable than during the developmental stages of childhood and experimental stages of adolescence. Independence is likely to have installed a certain degree of responsibility regarding food choice, as well as a potentially increased awareness of the effects of current food habits on short and long-term health. Student respondents in particular appeared to consider their time at university as a temporary transitional period between the parental home and the responsibility of employment, when they could eat and drink what they wanted with little regard for health consequences. However, it may be suggested that upon commencement of employment, the more permanent nature of their lifestyle as well as the novelty of food choice independence having expired appears to result in the adoption of more healthful dietary habits. Financial independence and a regular income are also likely to
130

have a steadying effect on dietary habits, because when income is earned as opposed to the loans/credit/benefit that was often the main income of students and homeless, individuals may be able to budget more carefully and efficiently resulting in less erratic dietary habits.
131
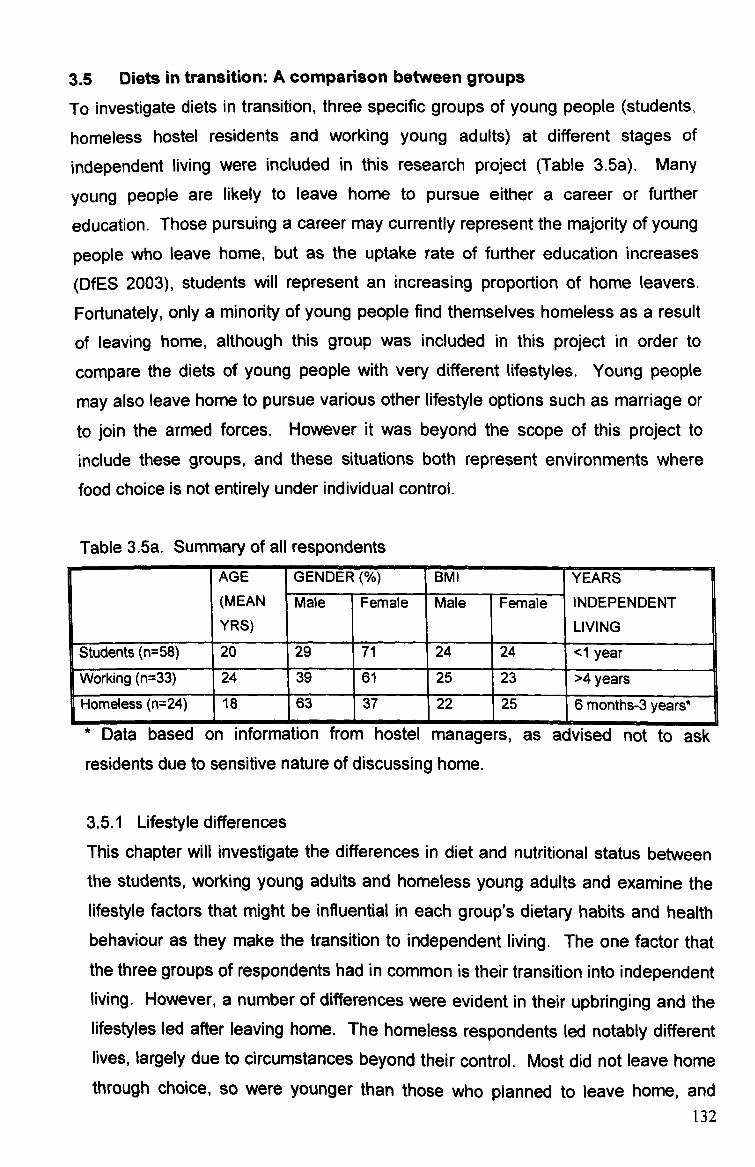
3.5 Diets in transition: A comparison between groups
To investigate diets in transition, three specific groups of young people (students,
homeless hostel residents and working young adults) at different stages of
independent living were included in this research project (Table 3.5a). Many
young people are likely to leave home to pursue either a career or further
education. Those pursuing a career may currently represent the majority of young
people who leave home, but as the uptake rate of further education increases
(DfES 2003), students will represent an increasing proportion of home leavers.
Fortunately, only a minority of young people find themselves homeless as a result
of leaving home, although this group was included in this project in order to
compare the diets of young people with very different lifestyles. Young people
may also leave home to pursue various other lifestyle options such as marriage or to join the armed forces. However it was beyond the scope of this project to include these groups, and these situations both represent environments where food choice is not entirely under individual control.
Table 3.5a. Summary of all respondents AGE GENDER(%) BMI YEARS (MEAN
YRS) Male Female Male Female INDEPENDENT
LIVING
Students (n=58) n n s 20 29 71 24 24 <1 year W0i orking (n=33)
E
24 39 '
61 25 23 >4 years
ms ss (n=24) le Home 18 63 37 22 25 6 months-3 years*
* Data based on information from hostel managers, as advised not to ask
residents due to sensitive nature of discussing home.
3.5.1 Lifestyle differences
This chapter will investigate the differences in diet and nutritional status between the students, working young adults and homeless young adults and examine the lifestyle factors that might be influential in each group's dietary habits and health behaviour as they make the transition to independent living. The one factor that the three groups of respondents had in common is their transition into independent living. However, a number of differences were evident in their upbringing and the lifestyles led after leaving home. The homeless respondents led notably different lives, largely due to circumstances beyond their control. Most did not leave home through choice, so were younger than those who planned to leave home, and
132

were likely to be both practically and psychologically unprepared for independent
living. The often problematic nature of their home life is likely to have resulted in
few opportunities to develop the skills and responsibilities needed to cope with
independent living. Once made homeless, the young people faced numerous
difficulties in establishing independence. In order to break out of the cycle of
homelessness, they need to find employment to pay for permanent
accommodation. However, many reported experiencing prejudice from potential
employers and service providers due to having no permanent address. The
impermanence and lack of routine that dominated their lifestyle is likely to reflect in
their dietary habits. When faced with homelessness, family problems,
unemployment, low income and possibly drug/alcohol misuse, eating healthily is
likely to fade into insignificance for this group of young people.
Students and young working adults left home at a later age, at a time in their life
when they made the transition to independent living for a purpose (beginning work
or university). They were therefore more prepared for leaving the family home and
could plan this stage of their life to a greater extent than the homeless were able to. Overall, the working young adults and students in this study were from higher
socio-economic groups and had experienced a more privileged upbringing. Dietary habits (particularly fruit and vegetable intake) are generally better amongst higher socio-economic groups, which may be due to a higher income and/or wider
understanding of healthy eating (Joseph Rowntree Foundation 1994). Whilst living
at home these young people were more likely to benefit from their parents' dietary
habits and develop a taste for healthier foods, as well as learning by observation
and/or experience how to prepare such foods. After leaving home, these young adults might not have made the same food choices as in the family home, initially tempted by easy to prepare junk food. However, as the novelty of making their
own food choices diminished they should be better prepared to know what type of foods to consume to improve their diet.
Level of education has been found to have an effect on food choices (Kearney et al 2000). Respondent's level of education was varied, with students spending the
most time in education, followed by working young adults and lastly homeless
young adults. Students had the highest level of education having all achieved the
necessary 'A' level (or equivalent) grades to secure a place at university. It is
133

therefore probable that this group had experienced greater exposure to formal
health education than the other groups. The working young adult group consisted
of a variety of education levels from GCSE to degree. This group's experience of
health education is likely to be the most varied, reflecting the diverse levels of
education. The homeless young adults had a lower level of education. Some had
achieved GGSE's and were enrolled on college courses, whilst some had not
completed their schooling so had more limited experience of formal health
education. However, as observed in the dietary habits of these three groups, knowledge/understanding of nutrition and health issues is not necessarily reflected in dietary habits. There is not always a 'cause-effect' relationship between
knowledge of health and actual health behaviour (Jones and Siddell 1997).
Young working adults and homeless young adults might reflect extremes of a
spectrum of independent living from affluence to poverty, with students falling in between the two, For this reason, a comparison between the three groups was carried out to determine whether any one group was at greater risk of nutritional inadequacies than any other, and if so, the nature of these problems. Between-
group differences were identified by analysis of variance using Scheffe post-hoc test.
3.5.2 Results 3.5.2.1 Nutritional status The heights of student and homeless females and the cholesterol levels of student and homeless males were significantly different (Tables 3.5b and 3.5d). Other differences in mean nutritional status data were observed, although as these results were not significant it is possible that the differences occurred by chance. Male height and weight were comparable in students and working young adults, but were somewhat lower in homeless males. The weight of females in each group was more varied, with students having the highest mean weight and working adults the lowest. Female homeless respondents were shortest in stature. Mean BMI of both sexes in all groups was within the healthy range of 20-25. Male and female students, male working young adults and female homeless were all within the upper range (24.2-25-3), whilst female working young adults and male homeless were within the mid-lower range (23.3-22.9). Mean body fat (%) for the
134

three groups of females were comparable. Male homeless body fat was lower
than both that of students and working young adults.
Table 3.5b. Anthropometric measurements of ail respondents ý STUDENT WORKING HOMELESS (p-VALUE) F
Male Female Male Female Male Female Male Female
Weight (kg) 75.2 66.2 77.2 0 31'r r 67.7 654.1 013 0.34
Range 58-91 46-96 55-96 53-91 51-98 50-104
Height (cm) 174.9 164.6* 175.7 163.1 171.9 159.6* 0.53 0.02
Range 154-191 153-175 154-193 151-173 159-183 155-165
1
BMI (kg/M2) 24.4 24.2 25.0 23.3 22.9 25.3 0.22 0.57
Range (20-28) (19-34) (21-29) (18-38) (18-29) 20-41
Body fat 17.3 27.6 18.5 26.9 13.3 27.0 0.12 0.89
Range 6-31 19-37 6-25 19-39 10-18 125-36 1 1 _j Significant ditterence oetween groups --<u. ui, -<u. ut) ýpost noc zscnerTe anaiysis)
Mean systolic and diastolic blood pressure was higher than the recommended 120/80mmHg in all groups except female students (diastolic) and working young
adults (systolic), and male homeless (diastolic) (Table 3.5c). Systolic blood
pressure of male students and working young adults was somewhat higher than in
homeless respondents. The lowest diastolic blood pressure of 76mmHg recorded in male homeless respondents was somewhat lower than that of all the other
groups. Homeless female systolic and diastolic blood pressure was higher than females in the other groups. Blood pressure over 140/90mmHg is considered to
be a cause for concern (DoH 1994). The proportion of students with blood pressure exceeding 140/90mmHg was the lowest of the three groups (4.5% of females and 7.7% of males had systolic and/or diastolic levels higher than 140/90mmHg). A higher proportion of homeless females had blood pressure over 140/90mmHg than homeless males (20.2% females and 12.5% males). Working young adults had the highest proportion of respondents with blood pressure
exceeding 140/90mmHg (21.1% females and 23% males).
135
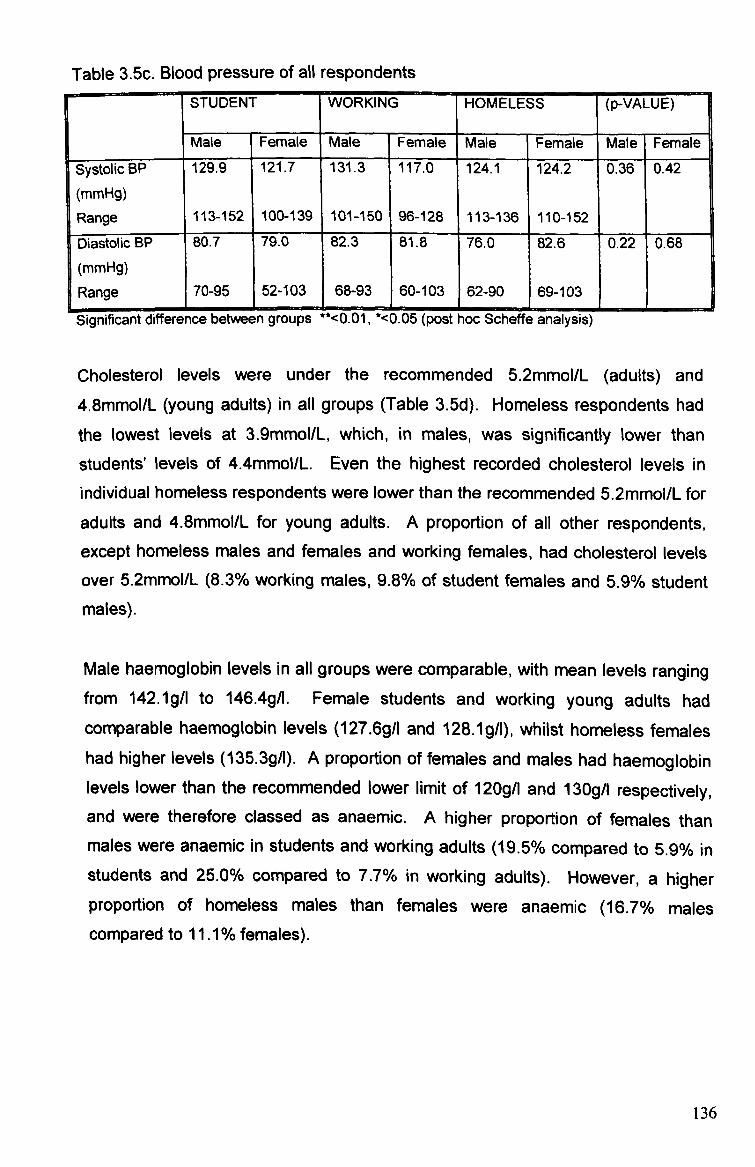
Table 3.5c. Blood pressure of all respondents [ STUDENT WORKING HOMELESS (p-VALUE) ]
Mate Female Male Female Male Female Male Femalee
Systolic BP 129.9 121.7 131.3 117.0 124.1 124.2 0.36 0.42
(rnmHg) Range 113-152 100-139 101-150 1 96-128 113-136 110-152
Diastolic BP 80.7 79.0 82.3 81.8 76.0 82.6 0.22 0.68
(mmHg) Range 70-95 52-103 68-93 60-103 162-90 69-103
Significant difference between groups "<U. Ul, '<U. Ub (post hoc 9cheffe analysis)
Cholesterol levels were under the recommended 5.2mmol/L (adults) and 4.8mmol/L (young adults) in all groups (Table 3.5d). Homeless respondents had
the lowest levels at 3.9mmol/L, which, in males, was significantly lower than
students' levels of 4.4mmol/L. Even the highest recorded cholesterol levels in
individual homeless respondents were lower than the recommended 5.2mmol/L for
adults and 4.8mmol/L for young adults. A proportion of all other respondents, except homeless males and females and working females, had cholesterol levels
over 5.2mmol/L (8.3% working males, 9.8% of student females and 5.9% student males).
Male haernoglobin levels in all groups were comparable, with mean levels ranging from 142.1g/l to 146.4g/l. Female students and working young adults had comparable haernoglobin levels (127.6g/l and 128.1g/l), whilst homeless females had higher levels (135.3g/1). A proportion of females and males had haernoglobin levels lower than the recommended lower limit of 120g/l and 130g/l respectively, and were therefore classed as anaernic. A higher proportion of females than males were anaernic in students and working adults (19.5% compared to 5.9% in students and 25.0% compared to 7.7% in working adults). However, a higher proportion of homeless males than females were anaernic (16.7% males compared to 11.1 % females).
136

Table 3.5d. Cholesterol and haernoglobin levels of all respondents STUDENT WORKING HOMELESS (p-VALUE)
Male Female Male Female Male Female Male Female
Cholesterol 4.4* 4.3 4.3 4.4 3.9* 3.9 0.03* 0.06
(mmol/L) Range 3.8-5.6 3.8-6.2 3.8-5.7 3.7-5.1 3.4-4.4 3.8-4.2
Haemoglobin 146.4 128.1 142.1 127.6 142.6 135.3 0.41 0.15
(g/1)
Range 129-160 108-154 127-154 1 113-149 1 126-157 1 119-160
Significant difference between groups "<0.01, %0.05 (post hoc Scheffe analysis)
3.5.2.2 Diet A number of significant between-group differences were identified for diet (Table 3.5e). Mean energy intakes of female students and working young adults were the
same (8.2MJ), which was significantly higher than homeless females' intakes of 5.2MJ (Figure 3.5a and 3.5b). Homeless males had a wide range of intakes,
whilst homeless females' highest energy intake was somewhat lower than in other groups. Energy intakes of male working young adults were the highest (1 1.9MJ),
whilst male students had the lowest intakes, although these differences were not
significant.
137
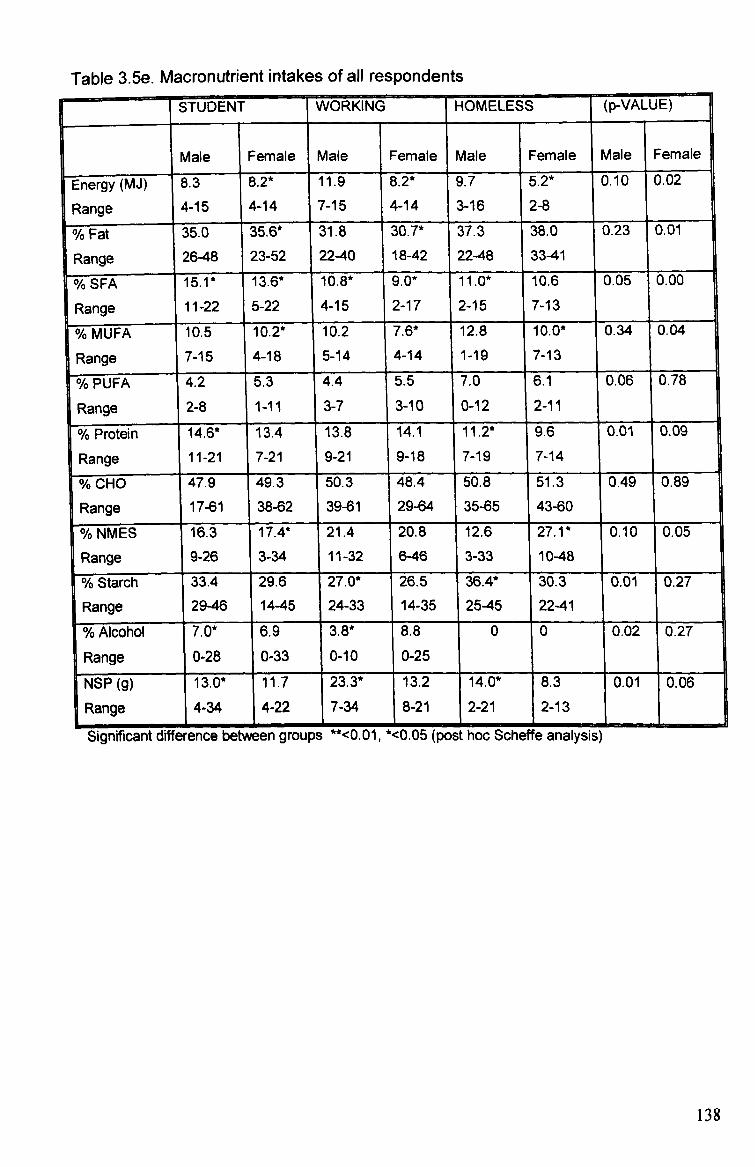
Table 3.5e. Macronutrient intakes of all respondents ISTUDENT WORKING HOMELESS (p-VALUE) F
Male Female Male Female Male Female Male Female
Energy (MJ) 8.3 8.2* 11.9 8.2* 9.7 5.2* 0.10 0.02
Range 4-15
14-14 7-15 4-14 3-16 2-8
% Fat 35.0 35.6* 31.8 30.7* 37.3 38.0 0.23 0.01
Range 26-48 23-52 22-40 18-42 22-48 33-41
% SFA 15.1 * 13.6* 10.8* 9.0* 11.0* 10.6 0.05 0.00
Range 11-22 5-22 4-15 2-17 2-15 7-13
% MUFA y 0 o 10.5 10.2* 10.2 7.6* 12.8 10.0* 0.34 0.04
3nge
ange [
R 7-15 4-18 5-14 4-14 1-19 7-13
00 0 %0 Y( PUFA 4.2 5.3 4.4 5.5 7.0 6.1 0.06 0.78
Range 2-8 1-11 3-7 3-10 0-12 2-11
Yo Protein ,D I 14.6* 13.4 13.8 14.1 11.2* 9.6 0.01 0.09
nge
[R
a 11-21 7-21 9-21 9-18 7-19 7-14
0 00 0 %Y( CHO 47.9 49.3 50.3 48.4 50.8 51.3 0.49 0.89
Range 17-61 38-62 39-61 29-64 35-65 43-60
% NMES 16.3 17.4* 21.4 20.8 12.6 27.1 * 0.10 0.05
Range 9-26 3-34
1
11-32 6-46 3-33 10-48
% Starch 33.4 29.6 27.0* 26.5 36.4* 30.3 0.01 0.27
Range 29-46 14-45 24-33 14-35 25-45 22-41
% Alcohol 7.0* 6.9 3.8* 8.8 0 0 0.02 0.27
Range 0-28 0-33 0-10 0-25
NSP (g) 13.0* 11.7 23.3* 13.2 14.0* 8.3 0.01 0.06
Range 4-34 4-22 7-34 8-21 2-21 2-13
Significant difference between groups **<0.01, *<0.05 (post hoc Scheffe, analysis)
138
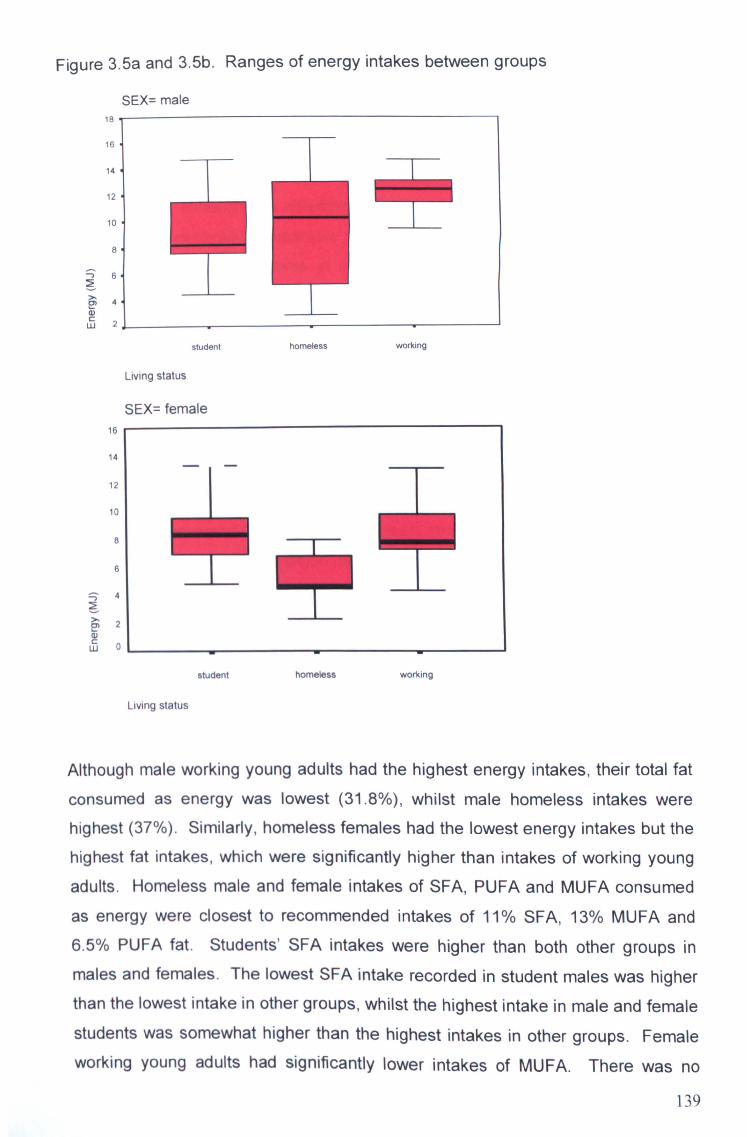
Figure 3.5a and 3.5b. Ranges of energy intakes between groups
LLI
SEX= male 18 16
14
12
L1
10 8
6
4
2
student homeless working
16
14
12
10
8
6
4
2
0
Living status
SEX= female
student homeless working
Living status
Although male working young adults had the highest energy intakes, their total fat
consumed as energy was lowest (31.8%), whilst male homeless intakes were highest (37%). Similarly, homeless females had the lowest energy intakes but the highest fat intakes, which were significantly higher than intakes of working young
adults. Homeless male and female intakes of SFA, PUFA and MUFA consumed as energy were closest to recommended intakes of 11% SFA, 13% MUFA and 6.5% PUFA fat. Students' SFA intakes were higher than both other groups in
males and females. The lowest SFA intake recorded in student males was higher than the lowest intake in other groups, whilst the highest intake in male and female
students was somewhat higher than the highest intakes in other groups. Female
working young adults had significantly lower intakes of MUFA. There was no
139

significant difference in PUFA intakes, although students and working young
adults all had intakes lower than DRV, and were also lower than homeless
respondent's intakes.
Protein intakes of homeless respondents were lower than both students and
working adults, although this difference was only significant in males. The range
of intakes was generally comparable, although the lowest intake in student males
was higher than lowest intakes in other groups, whilst the homeless females'
highest intake was lower than other groups.
There was minimal difference in carbohydrate intakes between all groups,
although a much wider range of intakes was observed in male students whose lowest intake was somewhat lower than other groups, and the range of intakes
between groups varied. There were some group differences in the contribution of
sugars and starch to total carbohydrate intake. The recommended balance of
non-milk extrinsic (NME) sugars and starch in the diet is 11 % (NME) sugars and 39% starch consumed as energy. All groups consumed high intakes of (NME)
sugars (12% - 27%) and insufficient starch (26% - 36%). Intakes were most varied in homeless respondents (Figure 3.5c and 3.5d). Male homeless and students had intakes closest to DRV (12% (NIVIE) sugars, 36% starch and 16% (NME)
sugars and 33% starch respectively). Female students' (NME) sugars intake
(17%) was significantly lower than homeless females (27%).
140
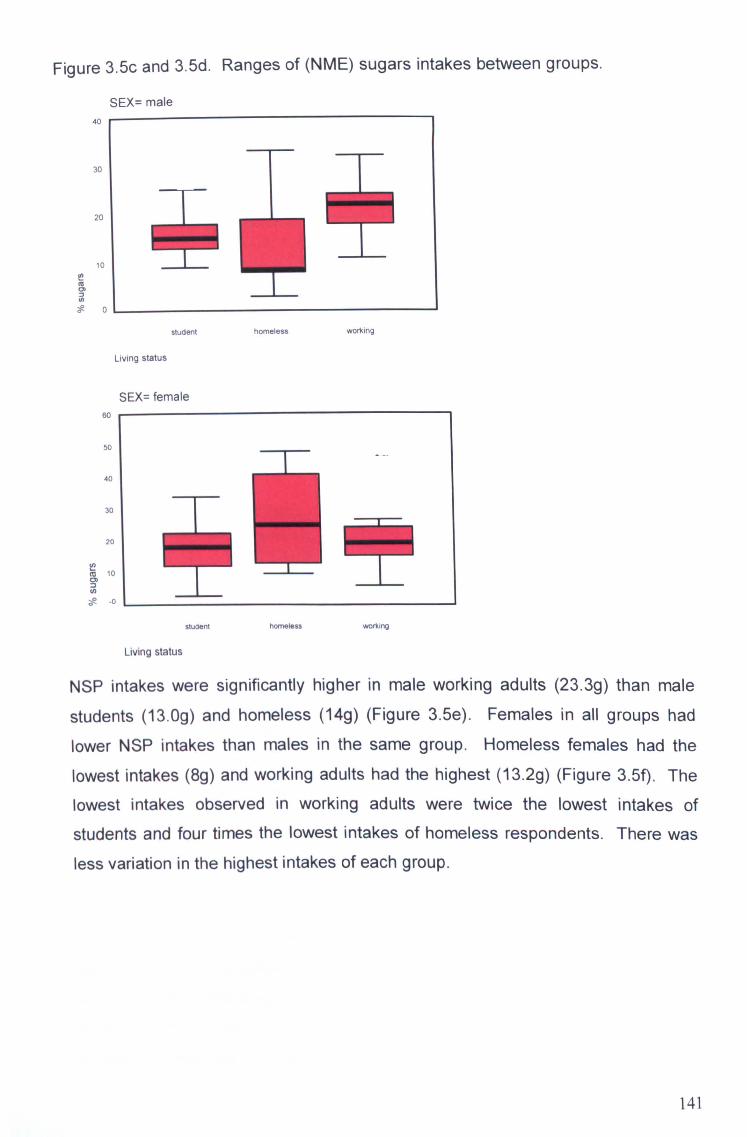
Figure 3.5c and 3-5d. Ranges of (NME) sugars intakes between groups.
SEX= male 4o r-
30
20
10
I
tif (5 a) (I)
0
student homeless wo*ing
Living status
SEX= female
60 1
50
40
30
20
10 c3)
-e -0
student homeless working
Living status
NSP intakes were significantly higher in male working adults (23.3g) than male
students (13.0g) and homeless (14g) (Figure 3.5e). Females in all groups had
lower NSP intakes than males in the same group. Homeless females had the
lowest intakes (8g) and working adults had the highest (13.2g) (Figure 3-5f). The
lowest intakes observed in working adults were twice the lowest intakes of
students and four times the lowest intakes of homeless respondents. There was less variation in the highest intakes of each group.
141

Figure 3.5e and 3.5f. Ranges of NSP intakes between groups.
SEX= male 4o r-
30
20
10
z0
--F --F-
Sludent homeless working
Living status
SEX= female 30 '1
20
10 HH 0)
(I) z
student homeless working
Living status
Male working adults consumed just less than the suggested 4% alcohol as energy,
which was significantly lower than male students' intake of 7.0%. Female working
adults consumed the most alcohol (8.8%), although female students also had a
higher than recommended intake of 6.9%. No alcohol intakes were reported by
homeless respondents. A wider range of intakes were observed in students than
working adults.
Homeless respondents consumed less calcium than the other groups (Table 3.5f).
Both homeless and working adult females consumed significantly less calcium
than student females (636.4mg and 552mg compared to 942. Omg). There was no
significant difference between groups for males, although intakes were higher in
working adults (1089.6mg). Iron intakes were significantly higher in working adult males (16.6mg). Intakes of working adult females, homeless males, and male and female students were comparable (9.1-10. Omg). Homeless females had the
142
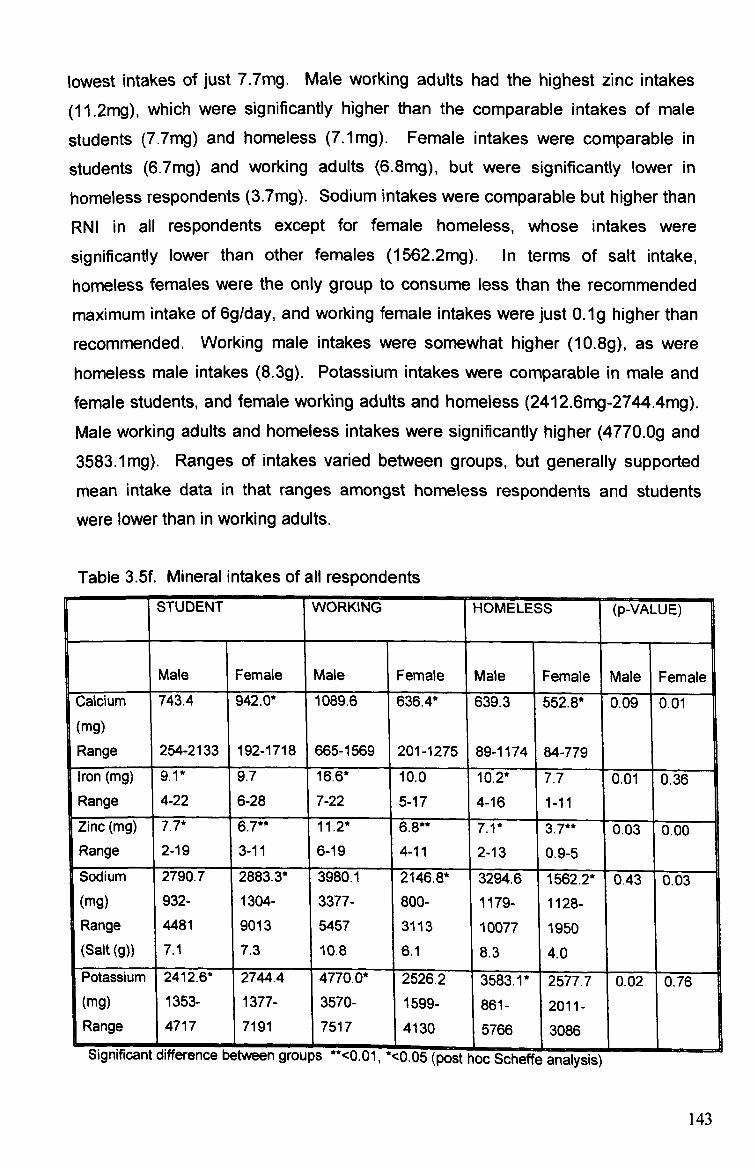
lowest intakes of just 7.7mg. Male working adults had the highest zinc intakes
(11.2mg), which were significantly higher than the comparable intakes of male
students (7-7mg) and homeless (7.1mg). Female intakes were comparable in
students (6.7mg) and working adults (6.8mg), but were significantly lower in
homeless respondents (3.7mg). Sodium intakes were comparable but higher than
RNI in all respondents except for female homeless, whose intakes were
significantly lower than other females (1562.2mg). In terms of salt intake,
homeless females were the only group to consume less than the recommended
maximum intake of 6gIday, and working female intakes were just O-1g higher than
recommended. Working male intakes were somewhat higher (10.8g), as were homeless male intakes (8.3g). Potassium intakes were comparable in male and female students, and female working adults and homeless (2412.6mg-2744.4mg).
Male working adults and homeless intakes were significantly higher (4770. Og and 3583.1mg). Ranges of intakes varied between groups, but generally supported
mean intake data in that ranges amongst homeless respondents and students
were lower than in working adults.
Table 3.5f. Mineral intakes of all respondents
FI STUDENT WORKING HOMELESS (p-VALUE)
Male Female Male Female Male Female Male Female Calcium 743.4 942.0* 1089.6 636.4* 639.3 552.8* 0.09 0.01
(mg) Range 254-2133 1 192-1718 665-1569 201-1275 89-1174 84-779
iron (mg) 9.1* 9.7 16.6* 10.0 10.2* 7.7 0.01 0.36 Range 4-22 6-28 7-22 5-17 4-16 1-11 Zinc (mg) 7.7* 6.7** 11,2* 7.1* 3.7** 0.03 0.00 Range 2-19 3-11 16-19 4-11 2-13 0.9-5 Sodium
I
2790.7 2883.3* 3980ý 1 2146.8* 3294.6 1562.2* OAT 0.03 (mg) 932- 1304- 3377- 800- 1179- 1128- Range 4481 9013 5457 3113 10077 1950 (Salt (g)) 7.1 7.3 10.8 6.1 8.3 4.0 Potassium 2412.6* 2744.4 4770.0* 2526.2 3583.1 * 2577.7 0.02 0.76 (mg) 1353- 1377- 3570- 1599- 861- 2011- Range 14717 7191 517 4130 5766 3086
%Jltjl IIVIVGII IL WIlIqUI IUI KoW LIVLVVr=I I VI VUIJC) -v. u 1, -u. uo kpost noc , jcnette analysis)
143
Male and female working adults had significantly higher intakes of retinol
equivalents (Table 3.5g). Male students and female homeless had the lowest
intakes of just 287. Opg and 256.5pg. There were no significant differences in
intakes of vitamins B6 and B12, although male working adults consumed the most
of both vitamins. Working adults also consumed the most vitamin C, although this
was only significantly higher in males. Homeless respondents had the lowest
intakes, although only homeless males had intakes lower than 40mg RNI. Intakes
of vitamin D varied between groups, but there were no significant differences in
intakes. Female students' intakes were considerably higher than homeless
females (5-1pg compared to 0.7pg), but with a p-value of 0.06, it is possible that
this difference may have occurred by chance. Students had the lowest intakes of
vitamin E, with male intakes significantly lower than homeless males who had the
highest intakes (3,5mg compared to 11.5mg). Female students also consumed
less vitamin E than working adults and homeless, although this was not significant.
Working adult males had the highest riboflavin intakes (2.5mg), which was
significantly higher than homeless male intakes (1.1mg). Intakes amongst all
other respondents were comparable, although homeless were lowest. Working
adult males had significantly higher intakes of thiamin (3-3mg) and niacin (26.8mg)
than male homeless and students. As observed previously, intakes of the
remaining groups were comparable, but homeless intakes were the lowest
recorded. Male and female working adults consumed significantly more folate
than both other groups (492pg and 260pg), whilst homeless females had the
lowest intakes (107pg). Homeless males consumed more folate than male
students. Ranges of vitamin intakes varied between groups, with the ranges of intakes consumed by working adults being generally higher than other groups. The highest intakes of retinol equivalents (homeless females and student males)
and vitamin C (homeless males) were less than the lowest levels of intakes by
working adults.
144
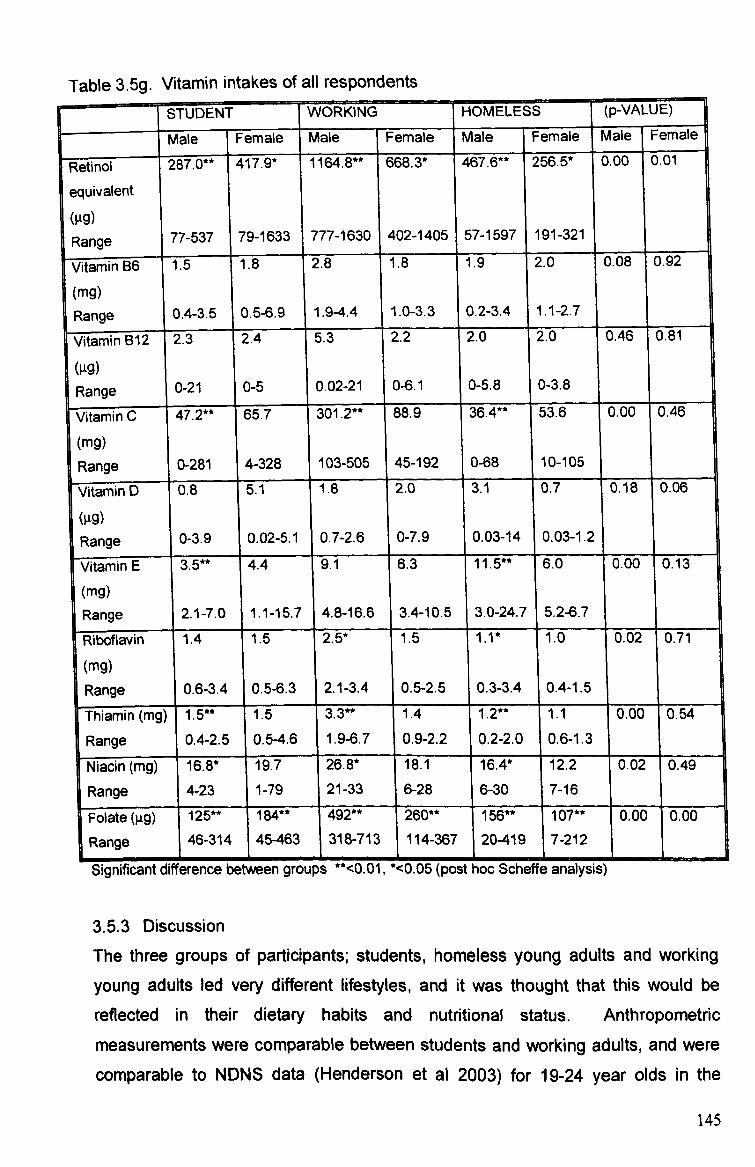
Table 3.5g. Vitamin intakes of all respondents STUDENT WORKING HOMELESS (p-VA UE)
Male Female Male Female Male Fe male Male Female fRefinol 1
287.0** 417.9* 1164.8** 668.3* 467.6** 256.5* 0.00 0.01
equivalent (vg) Range 77-537 79-1633 777-1630 402-1405 57-1597 191-321
rVitamin 6 1.5 1.8 2.8 1.8 1.9 2.0 0.08 0.92
mg)
I
(mg) ( 9) Range 0.4-3.5 1 0.5-6.9 1 1.9-4.4 1 1.0-3.3 10.2-3.4 1 1.1-2.7 1
Vitamin B12 2 .3 2.4 5.3 2.2 2.0 2.0 0.46 0.81
(gg)
L 1
Range 0.21 0-21 -5 0 0.02-21 0-6.1 0-5.8 0-3.8
Vitamin C 47.2** 65.7 301.2** 88.9 36.4** 53.6 0.00 0.46
(Mg) Range i 0-281 4-328 103-505 1 45-192 1 1 ý 1
Vitamin b 0,8 5.1 1.8 12.0 3.1 0.7 0.06 0.18
(gg) Range 0-3.9 0.02-5.1 0.7-2.6 0-7.9 0.03-14 0.03-1.2
Vitamin E 3.5** 4.4 9.1 6.3 11.5** 6.0 0.00 0.13
(rng) Range 2.1-7.0 1.1-15.7 4.8-16.6 3.4-10.5 1 3.0-24.7 5.2-6.7
Riboflavin
1
1.4 1.5 2.5* 1.5 1.1* 1.0 0.02 0.71
(mg)
1
Range 0.6-14 1 Oý5-6ý3 2.1-3.4 10.5-2.5 0.3-3.4 0.4-1.5
Thiamin (mg) 1.5** 1.5 3.3** 1.4 1.2** 1.1 0.00 0.54
Range 0.4-2.5 0.5-4.6 _I
1. M. 7 0.9-2.2 0.2-2.0 10-6-1.3 1 1 Niacirl (mg) 16.8* 19.7 26.8* 18.1 16.4* 12.2 0.02 0.49
Range 4-23 1-79 21-33 6-28 6-30 7-16
Folate (99) 125** 184** 492** 260** 156** 107** 0.00 0.00
Range 46-314 45-463 318-713 114-367 20-419 7-212
1
Significant difference between groups "<0.01, '<0.05 (post hoc Scheffe analysis)
3.5.3 Discussion The three groups of participants; students, homeless young adults and working young adults led very different lifestyles, and it was thought that this would be
reflected in their dietary habits and nutritional status. Anthropometric
measurements were comparable between students and working adults, and were comparable to NDNS data (Henderson et al 2003) for 19-24 year olds in the
145

general population. Homeless respondents had notably lower measurements,
which may be an indication of socio-economic background and long-term poor
dietary habits during the growth and developmental stages of childhood and
adolescence. Anthropometric measurements of homeless respondents also
compared less favourably to mean measurements of the 15-18 years age group in
NDNS data with shorter statues and higher BMI's. This reflects data concerning
the nutritional status of low-income groups, which report a higher rate of obesity
due to a reliance on cheaper energy-dense foods and low fruit and vegetable
intakes due to limited access and affordability (Joseph Rowntree Foundation
1994), and poor growth rates due to the increased risk of low birth-weight and poor
pre- and post-natal nutrition (Lucas 1998).
Mean blood pressure was generally higher amongst all respondents than NDNS
data, which may reflect the higher alcohol intakes of most respondents. Mean
alcohol intakes of male and female students and female working adults were
higher than that of NDNS subjects, and although homeless respondents did not
report alcohol intake in their food record, their descriptions of their habitual dietary
habits suggest that alcohol was sometimes consumed in large quantities when
they could afford to buy it. Cholesterol levels for all respondents were comparable
to NDNS data, and reflect the level of SFA, PUFA and MUFA in their diet.
Longitudinal data for students in the present study indicated an increase in
cholesterol over six months, which is likely to be a result of changes to dietary fat
intakes and decreased physical activity levels (Meiselmann 1999, Butler et al
2004).
A clear pattern is apparent of homeless males having the least healthy dietary
habits and working adult males having the healthiest. The lowest intakes of NSP,
protein and micronutrients, and highest intakes of total fat were observed amongst homeless males, closely followed by homeless females. Not only were mean intakes low, the proportion of respondents with daily intakes below LRNI was high
for most micronutrients assessed. It was considered likely at the outset of the
project that the homeless respondents would have poor dietary habits, largely due
to them experiencing more barriers to healthy eating than the students and working adults, such as availability and affordability of healthy foods as well as healthy eating being of lower priority compared to dealing with problems
146
associated with homelessness. However it may be suggested that habitual
intakes are even lower than reported in this study, as the data in the present study
is based on residents reporting some food consumption on each record day.
However habitual intakes could be even more erratic than reported here, because,
according to hostel managers, residents frequently consume minimal, if any, food
for a number of days. Conversely, working adults' dietary habits were closest to
recommendations to increase fruit and vegetable intake and reduce SFA intake
and also had the lowest proportion of respondents with intakes lower than LRNL
Working young adults were predicted to be the group who would consume the
healthiest diet, as they were likely to have a higher disposable income than the
homeless or students. They may also have gained more experience of cooking for
themselves for a longer period of time due to having lived away from home for
longer.
it is interesting to note that it was male respondents who had both the healthiest
(working adults) and the least healthy (homeless) dietary habits. Males
sometimes make less healthy food choices than females (fewer males consumed
wholemeal bread, skimmed milk, polyunsaturated spread in the NDNS (Henderson
et al 2003)). This is generally supported by findings for homeless and student
respondents in the present study who were less likely to consume foods with a
positive health image such as wholemeal bread, semi-skimmed milk, salad, fish
and low calorie soft drinks. It may be suggested that a higher proportion of male
working adults in the present study were graduates so were likely to have a higher
disposable income than males in the general population (Prospects Today 2004),
so could therefore afford to eat a more varied and healthier diet. The higher
energy intake of this group suggests that larger quantities of food were consumed by this group, therefore ensuring higher absolute quantities of nutrients. However,
nutrient density data indicates that the quality of diet was also healthiest. It may be suggested that whilst females attempt to consume a healthy diet by choosing healthier options such as wholemeal bread, skimmed milk and more fruit and
vegetables, they may also be more likely to have a 'sweet tooth' and be more
susceptible to eating in response to emotions (comfort/boredom eating) as
opposed to their appetite (Wilhelm and Clarke 1998).
147
There were more significant between-group differences in male respondents than
females. Amongst males, intakes of iron, vitamins A and C, niacin, riboflavin,
thiamin, folate and fibre were significantly higher in young working adults than in
either homeless young adults or students. The diets of male working adults were
the healthiest of all the groups and sexes assessed, with most macronutrients and
all micronutrients equalling or exceeding DRV. Micronutrient and NSP intakes
were lower amongst student and homeless males than working adults, and were
often also less than recommended quantities. Fat intakes were higher (despite a
lower energy intake). Rosenstock et al (1988) suggested that health behaviour
results from a rational weighing up of the potential costs and benefits of the
behaviour. Backett and Davison (1995) stated that young adulthood is frequently
considered to be a time when individuals perceive their body to be in peak
condition and able to cope with poor dietary habits and health behaviour. They
may therefore consider the costs of improving their diet and lifestyle to outweigh
the potential benefits. However, as new or anticipated responsibilities are
approached (e. g. co-habitation, a mortgage, having children), young adults may
perceive the benefits of improving their diet and health to be more worthwhile. it is
therefore possible that, with the oldest mean age of all three groups (24 years,
compared to 20 years (students) and 18 years (the homeless)) working young
adults might be at a more advanced stage of the life course when they are more likely to have reassessed their past dietary habits and health behaviour and made
a conscious decision to improve their dietary habits in order to maintain their health status for the future.
It is possible that the more varied diets amongst male respondents are due to a wider range of cooking skills. Whilst cookery programmes and personalities (i. e. Ready, Steady, Cook; Jamie Oliver etc. ) have made cookery more popular amongst males, some still believe in the traditional attitude that cooking is not a job for males. Therefore whilst some will be equipped with fairly advanced cooking skills and an understanding of preparing fresh, healthy ingredients, others may not have prepared even the most basic meal. Evidence from respondent's food records regarding practical cooking skills was varied. Young working adults used more fresh ingredients in their meals, although often used some form of convenience food alongside these fresh ingredients (i. e. pasta/curry sauce, shop bought pie). Conversely, fresh ingredients were consumed less frequently by
148
students and homeless, who were more likely to consume one-pot ready meals or frozen, processed foods (i. e. sausage and chips). This does not necessarily indicate that the students and homeless lacked practical cookery skills. It is
possible that these two groups were just less experienced in food preparation, so
preparing fresh ingredients was perceived as being more time-consuming and
generating more washing-up than convenience foods.
There was minimal difference between student and homeless (both sexes) intakes
of iron, sodium, zinc, folate, retinol equivalent, vitamin B12, % (NME) sugars and fibre, although homeless intakes of protein were significantly lower than students. The similarities observed between students and homeless respondents' diets were a surprising result because of such differences in the lifestyles of the two groups. The students were generally from more privileged backgrounds so had probably had more opportunity to observe and develop healthy eating knowledge and skills from their family and peers. It may also be argued that they had a higher disposable income so could therefore afford to eat a more varied diet than homeless respondents. Homeless respondents received E42.30/week from their Job Seekers Allowance, which was not supplemented from any other source. Conversely, a maximum annual student loan of C4095 provides F-136.50/week based on a thirty-week academic year, which in many cases is likely to be
supplemented by parental contributions. Although hostel accommodation was cheaper than average student accommodation (E8.95/week compared to E50/week), students still had a higher disposable income than homeless.
The similarities between the diets of students and homeless may be due to a shared lack of experience of independent living. The students had lived away from home for less than a year, and although it was not possible to ask homeless
respondents specifically how long they had lived away from the family home due to the sensitivity of discussing their home life, some spoke about constantly moving in and out of home within a few months. This would make it difficult to develop independent living skills either at home or in the hostels. On the other hand, working adults had lived independently for a number of years, and therefore had more opportunity to learn how to cook and adopt more healthful food choices. Students and homeless respondents also shared the constraints of communal kitchens, whilst working adults generally shared with fewer people. In some
149

cases, communal cooking appeared to have a positive effect on students and
homeless respondents. When a meal was prepared together, it was more likely to
be a relatively balanced meal as opposed to snacking, which was a common
preference to cooking when motivation to cook was absent. Respondents would
also benefit from the social element of the meal occasion.
However communal kitchen facilities often appeared to have a detrimental effect
on diet. Students in particular reported frequently being unable to use the kitchen
when they wanted to prepare a meal because there was not enough room for all
housernates to prepare separate meals at the same time, so rather than wait until
the kitchen was free, they would consume snacks or takeout. Students also
reported choosing snacks/takeout as opposed to preparing a meal when no clean
pans and utensils were available due to washing-up not being done. Limited food
storage also influenced students and homeless respondents food choices. A lack
of fridge and freezer space resulted in respondents being unable to purchase
many fresh items, particularly fruit and vegetables.
The most notable factor that students and homeless have in common is the lack of
routine and a certain degree of responsibility in their lifestyle. It was evident from
respondent's food records that homeless respondents rarely got up before 1 lam,
and students often only got up early when they had a lecture to attend. This lack
of routine resulted in meals being consumed at irregular times throughout the day
and increased snacking (particularly late at night). Working adults were the only
truly independent group of the three involved in the study, and this was reflected in
their dietary habits. Breakfast, lunch and dinner were generally consumed at
regular intervals, and at similar times during the day. This was a necessity for
working adults, because their working hours determined when they had time to
consume meals. Whilst the dietary habits of working young adults are becoming
established according to their income and lifestyle, the diets of students and homeless are more likely to be in an impermanent transitory phase. When
students graduate and begin employment, their diets are likely to become more
established as they adapt to their new, more permanent routine. However, the
homeless may experience more difficulties in their transition to independence, and the impermanence of homelessness is likely to result in continued poor dietary
habits.
150
Overall, there were no substantial differences between the diets of students,
working young adults and young people aged 19-24 years in the general
population, as reported in NDNS (Henderson et al 2003), but some marked differences were observed between homeless young adults and young people in
the general population (none of whom were homeless). Macronutrient data was
comparable to the other groups of respondents and NDNS data with the exception
of NSP, which was somewhat lower largely due to a lack of fruit, vegetables and fibrous cereal products. An absence of these foods in the diets of most homeless
respondents has consequently resulted in low intakes of a number of
micronutrients. To allow for variations in energy intakes between groups, diet
quality was calculated to assess nutrient density (mg/MJ). These findings
supported the data relating to absolute quantities that working adults consumed a better quality diet. Some nutrient densities observed in students were low (iron,
retinol equivalents, vitamin E, niacin and folate) and most nutrient densities (except for potassium) for homeless respondents were low compared to diet
quality of the general population.
Today Is generation of young adults are the first to have grown up with the benefit
of updated dietary recommendations, including Dietary Reference Values (which
advise on over forty nutrients compared to the previous ten covered by the 1969 UK Recommended Daily Intakes (RDI) and 1979 UK Recommended Daily Amounts (RDA)) and the recommendations to decrease fat and salt intake and increase fruit and vegetable intakes (WCRF 1997). Furthermore, the introduction
of the National Curriculum in 1988 has ensured that young people receive health
and nutrition education at school. However, national surveys indicate that young people are consuming less fruit and vegetables and more processed and snack foods that are often high in fat and low in fibre (Henderson et al 2003, Health Survey for England 2003). These national trends were reflected in the dietary habits of respondents in the present study. Socio-economic differences in diet have been identified by various studies, particularly lower fruit and vegetable intakes amongst lower socio-economic groups (Henderson et al 2003), which is reflected in the poorer quality diets of homeless respondents in the present study. However, the barriers to a healthy diet are more likely to be physical factors such as access and availability rather than knowledge and understanding of what constitutes a healthy diet, for which no differences have been found between
151

socio-economic groups. It may be suggested that, in the light of the findings of the
dietary habits of the three groups of young people in the present study, dietary
habits were determined largely by lifestyle factors such as daily routine, availability
of kitchen facilities and financial circumstances.
152

4.0 DISCUSSION
153
Quantitative methods of data collection were used to investigate the dietary habits
and nutritional status of young people following a key point of transition in their life
course; that of leaving home to live independently. The findings on nutritional
intake, food choice and nutritional status were used to identify lifestyle and social
circumstance factors that may have influenced dietary habits after leaving home.
4.1 Recruitment and sample size
Recruiting volunteers to participate in research projects is becoming increasingly
difficult, particularly for small projects with very limited resources, which are unable
to offer incentives to encourage participation. LJMU Ethics Committee specifically
prohibits the use of incentives to recruit volunteers to research projects.
Adolescents and young adults are notoriously difficult to recruit for research
projects and retain throughout longitudinal studies (Boys et al 2003), although
Hendricks and Cutler (2004) and Morrow-Howell (2000) also report a decline in
motivation to volunteer after the age of 55 years. It is possible that life
circumstances, as opposed to age, is more influential in an individual's decision to
volunteer for a research project. Those with an interest in the research area, or
those who can relate to the subject of the research are more likely to volunteer for
a project and complete all aspects of the study, as they are interested to know the
outcome of the overall study, as well as their individual result. In the present
study, respondents who were openly interested in their health status and
nutritional intake completed their food records to a higher standard. For example,
two respondents who stated they were suffering from eating disorders (and a
number of others who were suspected sufferers) were particularly meticulous
about their food records, and discussed their nutritional intake results in detail.
Similarly, it was observed in a psychology research project that required subjects to stay awake for 32 hours, the majority of respondents experienced problems
sleeping so stated they were prepared to participate in a demanding project such
as this in order to find out more about their sleep patterns. This may be because
these respondents hoped to gain some help for their problems through
volunteering for a research project. The increased likelihood of respondents with a
particular interest in the research subject to volunteer is often referred to as the
'healthy volunteer effect'. In the present study, the response rate from 'healthy
volunteers' was balanced out by using a range of recruitment methods such as
154

approaching students during lectures, which resulted in the majority of seminar
group members volunteering thereby giving a more representative sample. When
interpreting results, it is necessary to take into account the extent of bias resulting
from the number of potential unrepresentatively healthy volunteers.
The first study, which involved the completion of a health behaviour questionnaire
and food intake questionnaire required minimal volunteer participation. Subjects
did not have to meet the researcher to have any measurements taken, and were
not required to complete a follow-up questionnaire. Five hundred questionnaires
were sent to young people via e-mail-, two hundred and nineteen were returned
(participation rate 44%). Participation in the other studies all involved subjects
completing at least one set of anthropometric measurements, giving finger-prick
blood samples and completing a 3-day food record (all procedures were explained
to subjects, who were under no obligation to complete all measurements).
The studies that required a higher level of participation had mixed response rates. It was expected that students would be the most willing to volunteer initially and the easiest group to retain throughout the study, as they would also have to
complete project work requiring volunteer recruitment so were thought to be more
likely to understand the importance of becoming involved in research projects.
This was not the case. Response rates to initial recruitment drives (posters and
leaflets distributed around campus, e-mails, requesting volunteers at the
beginning/end of lectures) were fairly low. Students were willing to volunteer when
approached around campus, but would frequently make an appointment and fail to
turn up. It appeared that students were interested in the project, but lacked the
motivation and/or time to keep the appointment when measurements would be
taken. It is also possible that they may have changed their mind about giving a
* finger-prick blood sample (although it was explained that they did not have to have
any measurement taken that they were not sure about) and so decided to
withdraw from the whole project. In view of this, the recruitment process was adapted to target students during seminars and take small groups out of their
seminars (subject to agreement from lecturers) to take their measurements. This
not only increased the sample size, but also addressed the problem of the 'healthy
volunteer effect, as the majority of each seminar group were willing to miss a few
minutes of their education to have their anthropometric and blood measurements 155

taken. However, further problems occurred when students were needed for
follow-up measurements 6 months later.
At their initial meeting, the project was outlined to subjects and all were willing to
have a second set of measurements taken in 6 months. However when they were
asked to attend the follow-up session, 50% dropped out of the study. The main
reason behind the problems recruiting students appeared to be a lack of
motivation and/or time. Students expressed an interest in participating, with the
majority stating they would be willing to volunteer in order to find out their
cholesterol, haernoglobin and blood pressure levels. However, despite initial
interest and the offer of a free health check, many were only willing to spare their
time during seminars to participate. As seminars had ceased for the examination
study period at the time of follow-up measurements, response rates were poor.
Conversely, the response rate was much higher amongst homeless respondents in the hostels that agreed to participate in the study. Initial response rates from hostel managers who were contacted about the study was fairly low. Only three of the eleven hostel managers contacted agreed to participate and one expressed an interest but regretted that they were already involved in a research project and felt they did not have time to participate in another. The remaining seven hostel
managers did not wish to participate. Although initial response rates from hostel
managers was low, the response rate from hostel residents whose managers had been willing to participate was more positive (75%, 53% and 40%). Whilst the main reason that students participated was to gain some feedback about their health status and diet quality, or possibly boredom for those who volunteered during seminars, homeless respondents were more likely to volunteer in order to be of assistance to the researcher. Every resident who signed up to participate kept their appointment time.
Young working adult volunteers were recruited by word of mouth. The inclusion criteria were a maximum age of thirty years, lived independently for more than four years and in full-time employment. It was necessary to set these inclusion criteria in order to reflect the lifestyle of an average young person who had lived away from home for a longer length of time than the previous groups and to make comparisons between each group in terms of how long they had lived
156
independently, and how this influenced their diet. This group of volunteers
showed a willingness to participate in the project, as observed in the homeless, in
order to help the researcher reach the target number of volunteers required. These respondents completed their food diaries as requested (as opposed to
students), and actively encouraged their peers to volunteer. There may therefore
be differences between the three groups in terms of motivation, which might be
reflected in the results. This should be borne in mind when considering group
comparisons.
4.2 Methodological issues
There is considerable controversy regarding measuring dietary intake and the
associated methodological issues, due to the possibility of a high degree of imprecision in self-reported dietary intake (Shoeller 1995). Dietary intake
measurement is an evolving area of research. The weighed inventory was once
considered to be the 'gold standard' method of measuring dietary intake, but is
now used less frequently due to more recent research indicating a number of flaws in this method (Livingstone et al 1990). The likelihood of under-reporting and associated problems has emerged during the last decade, prompting extensive research into the reasons for under-reporting and ways of identifying under- reporters in a study sample. Respondent's estimation of portion size from food
photographs has been found to be influenced by their level of satiety (Beasley et al 2004: Appendix 9). All dietary surveys have to address the potential methodological issues when deciding which method of data collection to use. Whilst it is possible to choose the most suitable method for each individual survey, identify certain factors which may affect the accuracy of results (i. e. under- reporters, respondent's changing their habitual intake during the study period), and carry out validation and reliability studies for the method chosen, the fact remains that dietary intake data often does not wholly reflect habitual intakes (Shoeller 1995).
Recording dietary intake can be a time consuming task for a volunteer, depending on which method of data collection is used. Food diaries were the first choice of method in the present study to collect dietary data (except for homeless respondents who had a high rate of learning difficulties within the sample, so 24- hour recalls were considered more appropriate). If food diaries are completed
157

according to instructions, subjects should record everything they eat and drink
immediately after it has been consumed or as it is being prepared in order to
ensure everything is recorded in detail, relevant labelling from packaging is
included and quantities are estimated (including leftovers). However, in reality,
many subjects are more likely to record their whole days intake at the end of the
day.
In the present study, problems were experienced with student respondents failing
to return their food diaries, despite a number of follow-up e-mai lsttelep hone calls.
The rate of return was so poor in the pilot study that it was necessary to change
the method of data collection to the less demanding and time-consuming method
of 24-hour recall. Therefore, 24-hour recall became the main method of dietary
data collection for both students and homeless, whilst working young adults
continued to use food diaries. It may be possible that the differences in diet
between working young adults and students/homeless occurred as a result of the
different methods used to measure dietary intake. However this is considered
unlikely as all respondents recorded 3 days intake, and as stated previously many
subjects complete their food diary at the end of the day, therefore recalling their
intake over 24-hours in a similar way to that required by the 24-hour recall method.
Despite the numerous methodological issues associated with collecting dietary
data, dietary surveys have produced some vital evidence linking particular dietary
habits with either disease prevention or increased risk of disease. Furthermore,
information about dietary habits is vital in order to arrive at meaningful dietary
advice. Dietary guidelines are partially formulated from dietary surveys, and are
continually updated as research reveals further links between diet and health (i. e.
guidelines to decrease saturated fat intakes in order to reduce the risk of
cardiovascular disease and consume adequate polyunsaturated and monounsaturated fats to protect heart health). Following extensive research into
vegetarian diets using dietary surveys, it was widely recognised that a meat-free diet could be beneficial to health. Numerous studies have compared the diet and health of vegetarians with omnivores and reported that vegetarians had lower BMI than omnivores and were less likely to develop many diseases including CHD and some cancers (Appleby et al 1998, Bingham 1999, Key et al 1998). However,
more recent research identified the emergence of a contemporary vegetarian diet,
158

which is based on convenience foods that are often high in fat rather than fresh
fruit and vegetables, and is therefore less beneficial to health (Reid 2001). This
illustrates how dietary surveys can provide links between diet and disease so are
therefore fundamental in the development of dietary guidelines and can also
provide an insight into the changing dynamics of the dietary habits of a population.
Therefore, whilst the methodology of dietary surveys continues to evolve as more
research is carried out, the information generated by these surveys also moves
forward as dietary habits evolve. Dietary surveys are an important element of
nutritional research provided that data is interpreted with a detailed appraisal of
the studies strengths and weaknesses.
4.3 Main findings
The aim of this research project was to investigate how leaving home affects the
diet and nutritional status of young adults. The transition from living as a
dependent in the family home to the responsibility of independent living is a crucial
stage of a young person's life, and initial diet and lifestyle choices may form the
basis of their dietary habits and health in adult life. However little is known about the dietary habits of this age group, and therefore young people leaving home
have been largely excluded from nutritional advice at a crucial stage of their
development when dietary habits may change for better or worse. Extensive
research has investigated the dietary habits and influences on food choice at the
various stages of the lifecycle (i. e. infancy, childhood, adolescence, adulthood and
elderly), although few longitudinal studies have been carried out to investigate diet
and health throughout the life course and the influences on 'diets in transition' have been poorly identified.
Childhood and adolescence are particularly well researched due to the importance
of healthy choices at these stages of growth and development (Spear 1995, Fisher
et al 1995). However very few studies have investigated how dietary habits
change when young people leave home (Edwards and Meiselman 2003,
Moynihan et al 1999). To meet the study aims and objectives, four studies were
completed. Firstly, a questionnaire-based study investigated the differences in
dietary habits and health behaviour between young people aged 18-25 years who live in the family home and those who have moved away from home to live
independently. This study included young people in general, whether they were
159
employed, students or unemployed/benefit claimants. The aim of the study was to
investigate whether the diets and health behaviour of young people who still lived
at home and subject to a certain degree of parental influence, were better or worse
than those who had left home and were responsible for their own diet and health
choices.
4.3.1 Diet
The findings of the first study revealed some differences in the diets of young
people living in or away from the family home. However, these differences did not
always indicate poor dietary habits in respondents living independently and
healthier diets in those living at home. Both groups had their positive and negative
dietary habits, which overall resulted in few differences (see Results, page 76).
For example, young people living at home consumed more traditional meat and
vegetable based meals, but also consumed more cakes, biscuits and crisps.
Young people living away from home consumed more pasta and rice based
meals, but also consumed more alcohol.
The role of parental influence was suggested by the young people's dietary habits
and health behaviour, although this influence was not always positive. Fewer
respondents who lived at home smoked, and their alcohol intake was also
significantly lower than those living independently, presumably due to parents
moderating this type of negative health behaviour in their home. However, with
regard to diet, the frequent consumption of snack foods high in fat and sugar
promotes the consumption of negative foods. This raises questions about the role
parents take in influencing their children's health behaviour as they grow up. During the transition from preschool to primary and secondary school and leaving
home/further education, the parental role in their child's health behaviour changes. During early childhood, parents are the main influence on dietary habits and health
behaviour. Positive health behaviour by parents has been found to be reflected in
their children's behaviour (Eertman et al 2001). As a child grows up, other factors
will increasingly influence food choice and health behaviour. These may be
positive influences such as health education in school. However, positive influences are often in competition with an increasing number of negative influences such as television advertisements and peers. With such contrasting
160
messages, parents have a responsibility to set a positive example to support their
child's health education.
As a child reaches adulthood, parents may exert less influence on their child's dietary habits compared with other health behaviours such as alcohol intake and
smoking. A number of respondents who lived at home reported not smoking and
consuming less alcohol than their peers because, as well as being concerned for
the effects on their health, their parent(s) did not want cigarette odour in their
home, and would disapprove of them arriving home drunk in the early hours of the
morning. Regarding food choices, many young people reported that their parents did not dictate what they could or could not eat, and thus often consumed a diet
that was less healthy than when they were younger. This is reflected in the large
number of respondents who had left home who felt that their dietary habits were healthier than when they lived in the family home (see Results, page 73). It is
possible that the different parental attitude to smoking and alcohol, and diet is due
to parents being more concerned about the health effects of smoking and alcohol than of consuming a poor diet. It may also be suggested that some parents may not be concerned about health effects at all but are worried about the smell, noise and disruption of smoking and excessive alcohol intakes. This attitude suggests a lack of understanding of the potential long-term health effects of consuming a poor diet consisting largely of processed foods.
The next phase of the study involved researching the diets and nutritional status of young people at various stages of independent living (students, homeless and working young adults) to investigate the extent to which diet is affected by a young person's transition away from the family home, into a newly independent lifestyle. The student study investigated further the differences between young people's diets at home and living independently. More specifically, this study looked at the changes to a young person's diet when they leave home to begin university, and the consequential changes to nutritional status. The young working adults represented young people at the end of their transition into independent living, who had more experience of cooking for themselves, whilst the homeless group represented those who left home in difficult circumstances and were not prepared for independent living.
161
A comparison of the three study groups revealed that both the students and
homeless who had left home fairly recently consumed poor diets, whilst the diets
of working adults who had lived independently for more than four years were more
comparable to recommended intakes (see Results, page 138-145). The fact that
the dietary habits of the students and homeless appeared to be comparable
suggests that information provision alone is not successful in changing dietary
habits. Some homeless respondents had attended healthy eating advice sessions
and practical cooking sessions, so had a basic understanding of some nutritional
topics. A large proportion of student volunteers were enrolled on a course that
included various levels of food and nutrition education, but had not put their
knowledge into practice. The dietary habits of respondents appeared to be
influenced more by social circumstances than knowledge. The young adults with
the responsibility of full-time employment and consequentially a higher income had
healthier dietary habits, students fitted their dietary habits around their social and
study life resulting in frequent snacking and the homeless ate when they could
afford to, so often missed meals for days.
If, as these findings suggest, it just takes time, experience and routine for young
people to adapt to independent living and improve their dietary habits, this poses
the question: does it matter if young people consume a poor diet if it is only short-
term? Few studies have investigated the effects of short-term nutritional problems
on long-term health, although some evidence suggests that temporary changes to
diet can have an impact on long-term health and mortality. As a result of rationing during the Second World War, the diet of the UK population became more equal because rationing allowed everyone the same amount of food regardless of
affluence, and also became healthier due to the replacement of scarce products
such as meat, fat eggs and sugar with home-grown vegetables and brown bread.
The rationed diet was consumed for fourteen years, and resulted in a decline in
infant mortality and an increased life expectancy (British Nutrition Foundation
2004).
Conversely, a recent, more short-term experiment to investigate the health impact
of consuming a diet consisting solely of high fat fast food for a month resulted in
the previously heafthy subject gaining 25 pounds, and suffering from chest pains
and breathing problems, and liver function was affected (Spurlock 2004).
162

Although this was not a wholly reliable study, with just one subject adopting very
extreme poor dietary habits, it does give an indication of the possible immediate
health effects of consuming a temporary poor diet although the long-term effects of
the experiment are not yet evident. The present study found that weight-gain
occurred as a result of poor dietary habits over a relatively short period of time
(see Results, page 87). Weight gain is generally much easier and quicker than
weight loss. Therefore, any weight gain and associated risk factors such as raised
cholesterol and blood pressure may persist in the long-term. People who have
poor height gain in childhood have been found to be at greater risk of hip fracture
in adulthood (Cooper 2001). Stunted growth rates may be due to the mother
consuming a poor diet and/or smoking during pregnancy, poor diet during infancy
and insufficient calcium intakes and/or low levels of physical activity in later
childhood and adolescence. Short-term low calcium intakes might have an impact
on young people's bone mass development and consequently long-term bone
health, as peak bone mass is achieved in early adulthood. It is recommended that
young people under the age of 30 years consume plenty of calcium and take part in regular physical activity in order to assist maximum bone development (FSA
2004). If young adults consume insufficient calcium during the latter stages of bone mass development, the potential for future bone-related problems (i. e.
osteoporosis) could increase, although evidence linking inadequate nutrition to
peak bone mass is inconclusive (DoH 1991).
Poor nutrition during the foetal and infancy stages of life have substantial impacts
on health in later life (Barker 1992), and it may be suggested that other periods of poor nutrition and/or adoption of negative health behaviours influences adult health. Bartley et al (1997) state that economic, social and psychological factors throughout the life course interact with biological risk factors in the development of chronic disease. Changes to diet and lifestyle as a result of changing economic, social and psychological factors at critical periods in human development (including transition from primary to secondary school, entry to labour market, leaving parental home and transition to parenthood) are dependent to a certain extent on levels of social and economic support available (Bartley et al 1997).
The level of social capital within groups during life transitions is likely to influence the extent to which associated changes to diet and lifestyle are positive or
163
negative. Acheson (1998) reported that people with good social networks live
longer than those with poor networks. Young people leaving home are likely to
experience a decreased level of social support if they move away from their
established support network (parents, friends, local groups) to a new area where
they have to build up new support systems (such as making new friends, attending
different clubs and societies, and developing working relationships with new
people). The extent to which young people develop their social capital after
leaving home might influence the adoption of positive or negative food choices and
health behaviours.
It could be suggested that the social support networks available to the three
independent living groups in the present study were varied. The group of working
adults who had lived independently for a longer period of time were likely to have a
more established social network, as they had longer to build up friendships and become integrated in the local community. However, it may be suggested that
students and homeless were more likely to have become integrated in their
immediate community (i. e. university or hostel life), but were less likely to
participate in the geographical local community. Integration into these specific
communities appeared to involve the development of some negative health
behaviours such as alcohol consumption and smoking, but also encouraged
participation in positive behaviours such as physical activity at sports clubs and
communal mealtimes.
A report by the Health Development Agency (HDA) on childhood disadvantage
and adult health (Graham and Power 2004) states that there are key points during the transition of diet from infancy to adulthood where an individual experiences changes to their lifestyle, such as beginning primary and secondary school, which may move in the direction of having either positive or negative health effects. The transition from childhood to adulthood is identified as one of the key life-stages that defines health behaviour during adult life. The transition from childhood to adulthood is defined in the HDA report as leaving full-time education and taking up employment, leaving the family home and becoming a parent. Young adults from lower socio-economic groups tend to make this transition at the minimum school leaving age of 16 years, and many have children by the age of 20 years, whilst those from higher socio-economic groups delay the final transition to
164

independence by spending an extended time in education and co-habiting at a
later age. This may therefore be contributing to the widening health inequalities
gap (Acheson 1998) as the earlier the transition into adulthood occurs the worse their health status is, because those leaving home early are more likely to become
parents and are less likely to continue their education or enter into employment due to parental responsibilities (Graham and Power 2004).
The introduction of tuition fees has created further barriers for individuals from
lower socio-economic groups to enter further education (Nicholson 2002),
therefore encouraging an early transition to independence by those not continuing
their education. Local council provision of homes for young families with children
also results in an earlier transition than those from higher socio-economic groups
who often delay their transition away from the family home due to high house
prices (BBC Online 2003a).
The transition of young people who run away from home and become homeless is likely to be even earlier, as the problems that usually trigger the run-away often begin in early adolescence (Jones 1999). This was supported by findings of the
present study, where homeless respondents had left home at a younger age than the students. Nutritional intakes of homeless and student respondents were comparable at present, which does not support the HDA's view that health status is compromised by an early transition into independent living. The cost of tuition fees is having an effect on the financial situation of those who do continue into further education, which could result in some students finding themselves in a similar situation as observed in low-income households of needing to 'squeeze' their food budget according to other bills that are not so flexible (e. g. rent payments, electricity/gas) (Joseph Rowntree Foundation 1994). However, it is likely that students' dietary habits will improve to a certain extent when they leave home permanently (as opposed to just living independently during term-time) and begin work, whereas the homeless respondents will face more difficulties in improving the circumstances of their present lifestyle, so dietary habits may not change substantially for a considerable period.
165
4.3.2 Alcohol
The findings of the present study regarding alcohol intake reflect the growing
concern in contemporary society regarding binge drinking amongst young people
and the associated cost to both health and society. Data suggests that the
transition into independent living often triggers a significant increase in alcohol
intake (see Results, page 90) due to the freedom of choice associated with an
independent lifestyle. Young women reported consuming more alcohol than men
despite their lower recommended limit, which reflects the current concerns of
rising alcohol intakes by young women in the UK (BBC Online 2003b). This may
be due to binge drinking amongst women becoming more socially acceptable,
although this poses the question: to whom is it acceptable. It is considered the
norm by some young adults to consciously binge drink during a night out, thinking
that their peers will approve of this (HDA 2004b). In situations where young
people are adapting to a new lifestyle and making new friends (i. e. during the
transition into independent living) they may be more likely to submit to this type of
peer pressure in order to fit in. There is a certain degree of expectation at many
social occasions (not necessarily restricted to the young adult age group) that
alcohol should be consumed in order to break down boundaries and make
socialising easier (Engineer et al 2003).
This type of attitude and behaviour surrounding alcohol consumption appears to be a particular problem in the UK. Southern European countries are generally
more regular consumers of alcohol, but adopt a 'little and often' approach to
alcohol intake, usually consuming within their daily recommended intake with their
main meal. The quantity consumed per occasion is much higher in the UK (HDA 2004c). The problem of binge drinking amongst young people has received considerable media attention. However, the media gives mixed messages about alcohol consumption. Television programmes such as 'Club Reps' and 'Ibiza Uncovered' film the behaviour of young people who binge drink whilst on holiday,
and portray this type of alcohol-induced behaviour as normal for young people having fun. Conversely, news coverage highlight the anti-social behaviour in holiday resorts that results from this type of binge drinking (BBC Online 2003b). News reports also focus on the negative health effects of binge drinking. Some magazines aimed at young women (i. e. Cosmopolitan, Marie Clare) have recently attempted to address the conflict of promoting drinking as part of a night out and
166
regulating amounts consumed. These articles have defined binge drinking and
highlighted associated problems to health and personal safety by identifying ways
in which to achieve a balance between having fun and drinking sensibly.
Advertisements for alcoholic drinks associate alcohol with fun and loosing
inhibitions, but are often accompanied by small print advising people to drink
sensibly. The Government introduced a summer 'crackdown' on binge drinking in
2004, which attempted to start a 'culture change' in alcohol consumption by
introducing on the spot fines for alcohol induced antisocial behaviour and a
crackdown on underage alcohol sales. Despite the 1900 fines of E80 that were
served over the course of two months, this crackdown appeared to have little
effect on achieving any behaviour change regarding alcohol intake, suggesting
that monetary fines are not a successful method of curbing binge drinking (BBC
Online 2004).
Government policy has attempted to address the issue of binge drinking in young
adulthood. The White Paper 'Choosing Health? ' (DoH 2004a) recognises that
adolescents seek opportunities to push boundaries and adopt risk-taking
behaviour and outlines plans to provide young people with alternative ways of doing this which are more positive than abusing alcohol and drugs. The 2004
Alcohol Harm Reduction Strategy for England (Strategy Unit 2004) also outlines
ways in which the Government plans to tackle binge drinking and associated
problems. This includes a clamp down on irresponsible promotions and the
provision of better information to consumers relating to the problems associated
with alcohol misuse. In order to reverse the growing trend of binge drinking in
young adulthood, it is necessary to change the attitudes of society as a whole.
In light of the emphasis in the Choosing Health? report on informing consumers to
enable them to make good health choices, a suggested starting point would be a total ban on alcohol advertisements and clear warnings on beverage labels
relating to recommended intakes to aid consumers to regulate their intake. It
would also be beneficial to educate consumers about alcohol in order to enable individuals to reassess their attitudes to alcohol consumption. Many young people understand the potential health effects of binge drinking, but adopt the
misconception that it won't happen to them. This attitude is observed frequently in
young smokers who acknowledge the link between smoking and lung cancer, but
167
think they are an exception (Grannis 2004). However, as discussed regarding
changing dietary habits, the provision of information alone about the risks
associated with binge drinking is unlikely to change drinking patterns. To promote
safer drinking amongst young people, it is necessary to change attitudes towards
alcohol consumption. In contemporary UK society it is sometimes considered dull
to limit alcohol intake (except when driving; a result of recent successful
promotions concerning the dangers of drink-driving). This view is supported
somewhat by some advertisements, television programmes, magazine articles and
celebrity's behaviour, but is largely fuelled by peer pressure. To achieve behaviour change, it is necessary to change attitudes to make binge drinking
unacceptable. Some young women's magazines have begun to promote safe drinking, but this message needs to reach a much wider audience. Young people
who have recently left home might be more likely to binge drink due to more freedom from parental influence regarding their lifestyle. This group may therefore benefit from an intervention to promote safe d'rinking and enable young people to
adopt safer alcohol consumption patterns.
4.4 Policy
In recognition of the effect childhood health has on later life, the WHO's European
region has implemented a strategy to work towards improving health from birth to
eighteen years in order to benefit the future health of both individuals and the
population as a whole (Currie et al 2004). In the UK, the recent White Paper 'Choosing Health? '(DoH 2004a) addresses some issues surrounding children and young people's health. This included outlines for the possible introduction of a 'Children's and young people's plan', which would involve a multi-discipli nary approach to health promotion. One element of this plan involves the introduction
of Children's Health Guides to provide more support to parents/carers and children in making healthy lifestyle choices. During infancy, parents/carers, would receive information and advice from health professionals about how to give their child a healthy start in life, and as the child grows up they will take more responsibility for their Health Guide by working with parents/carers and health professionals to develop health goals and targets.
These plans for personal Health Guides take into account the potential for health behaviour change at key transitional points of childhood and young adulthood (i. e.
168
starting school, leaving home or starting work), and will aim to provide support at
these stages to enable individuals to consider the impact of particular choices on
their health. This would ideally help individuals take more responsibility for their
own health by recognising potential positive or negative impacts and reassessing
their health behaviour against the changing dynamics of their lifestyle. However, it
is possible that some young people who have recently left home may be unwilling
to seek support from a health guide, as they may want to pursue independence by
making their own decisions about their health and lifestyle. Support from a health
guide could be perceived as being a replacement for parental or carer influence,
which may reduce their sense of independence.
The White Paper suggests that the provision of consistent support, clear boundaries and incentives can help young people to make positive health choices
as they gain independence. However, these guides are likely to be of least benefit
for those who possibly need this type of support the most. The paper states that health guide support will be given to young adults by parents/carers, school staff and health professionals such as school nurses and health visitors. Homeless
young adults often have poor school attendance records and many leave school before 16 years (Craig 1996), many experience difficulties registering with GP's
and dentists due to having no fixed address, and support from parents/carers generally ceases upon becoming homeless. The level of support available from hostel staff varies from hostel to hostel. It is therefore possible that, as is the case for many national and community health promotion activities that are largely
accessed through health professionals and community groups, health guides will be inaccessible to homeless and low-income young adults who often experience social isolation. For young people who do have access to health guides, those who adopt risk-taking behaviour (i. e. alcohol/drug abuse) are unlikely to pay heed to advice provided by health guides (although advice and support may be more easily accessible through the Health Guide system when the young person is ready to seek help). The forthcoming cross-government Green Paper will outline plans to offer young people positive alternatives to risk taking behaviour as they make the transition through adolescence to adulthood in order to curb the increasing number of young people who misuse alcohol and drugs.
169

The Choosing Health White Paper and Food and Health Action Plan (DoH 2004a,
2004b) identified children and young people as being a priority for receiving
assistance to help them to make healthy choices regarding their diet and lifestyle.
The focus of the plans to improve the diet and health of the nations young people is to provide health information and enable young people to access professional health advice (from health guides and school nurses) in order to help them to
make informed choices about their dietary habits and health behaviour. Whilst
information provision is an important element of supporting healthier choices, it
may be suggested that this health education approach is too narrow to achieve
substantial behaviour change, and a wider health promotion approach is needed to influence the broader social context of health behaviour. Health information has
become more widely available in recent years, and national promotions such as 5
a day have informed consumers about the health benefits of consuming five
portions of fruit and vegetables. However, despite the fact that this information is
more widely available, national fruit and vegetable consumption has decreased in
recent years (Henderson et al 2003), although consumption frequently increases in communities which have local initiatives to promote consumption by addressing wider issues such as access, availability and affordability of fruit and vegetables (Dalziel et al 2004). This reflects the theory illustrated in a number of health
promotion models (e. g. Theory of planned Behaviour, Health Belief Model), that informing the consumer plays a part in achieving behaviour change, but often only when used alongside numerous other influential factors such as individual's
attitudes and perceptions and environmental/social factors.
4.5 Intervention In the light of the findings of this study, and the rising levels of obesity and diet- related disease, it may be suggested that health promotion interventions targeted at young people who are preparing to leave home or have left home would be beneficial to increase their understanding of the long-term importance of a healthy diet and lifestyle. The age at which most young people make the transition to independent living would be an appropriate time for a health promotion intervention because at this stage of their life, many are more aware of the importance of healthy eating, and recognise that achieving a healthy diet is dependent on their own choices as opposed to parents/schools choices. This type of intervention would require a concerted approach by a multidisciplinary team of
170
organisations and individuals involved with young people during their transition
into independent living, including educational establishments, workplaces, Primary
Care Trust's, policy makers, the food industry and the media.
4.5.1 School
A suggested starting point would be to target teenagers during their final GGSE or
A level year at secondary school. Health education often takes a back seat to
examination studies between the ages of 16-18 years, so upon leaving school
(often to be shortly followed by leaving home) the extent of an adolescent's
understanding of food and nutrition is often based on their primary and early
secondary school compulsory health education, which usually ceases at the age of
16 years. The introduction of life-skills modules to outline key messages for eating
healthily, along with basic practical cookery sessions (involving the preparation of
quick and cheap meals) would enable young people to gain some experience of
cooking for themselves. In addition, sessions to help young people understand
the financial issues of independent living may help to prepare them for food
budgeting.
4.5.2 Further education Universities and colleges also have an important role to play in promoting healthy
eating after a young person leaves home to commence further education. Halls of
residence rooms are now generally only available for first year and foreign
students, and very few are catered halls. Students are therefore required to
purchase appropriate cooking equipment when they leave home, and share
kitchen facilities with a number of other students. Some university refectories set
a poor example of healthy eating, offering unappetising meals with very few
healthy options available. Whilst it may not be realistic to recommend re- introducing catered accommodation, more support to help students establish a healthy diet during their transition into independent living would be beneficial.
Support could be provided through independent living workshops designed to help
students budget for food, make sensible choices when food shopping and know
how to prepare healthy meals. For those less motivated to attend workshops, this
information could be provided in fresher packs and made available around campus
and electronically via campus wide information systems. At university campuses located on the outskirts of towns and cities, student's food choices whilst on
171
campus are restricted to what is available in the refectory or shop. These
universities therefore have a responsibility to provide meal options that reflect a
varied balanced diet (i. e. providing mainly balanced meals with a few unhealthy
options, as opposed to providing mainly unhealthy meals with limited healthy
options).
Some universities and colleges receive government support to develop strategies
for health to work towards creating a healthy working, learning and living
environment. The Health Promoting University initiative was introduced in 1995,
and aims to help students to make healthy choices in a healthy environment
throughout their time of study (Watkins 2003). It currently only operates in five
universities in the UK, but adequate funding, a co-ordinated approach and support
from a senior level of universities would encourage the implementation of the
initiative in more establishments. A suggested starting point to working towards
becoming a health promoting university could be the formation of a group to be
responsible for implementing health promotion projects. This may include the
Student Union, student welfare services and student/staff volunteers. Support
from external organisations such as local health promotion services, food workers
and alcohol/drug support services could also be sought. Project funding could be
applied for from The Higher Education Funding Council. who have previously
awarded grants to universities to implement health promotion activities (Hampshire
2003). Projects might include the development of an online source of information
and advice regarding relevant health topics such as healthy eating, alcohol, drugs,
sexual health and mental health. To help students to put this advice into practice,
various projects could be implemented to make healthy choices easier. This might include practical cooking sessions, the development of a student food co-op to
improve access and affordability of fresh fruit and vegetables, providing a wider
range of healthy foods in university shops and canteens, planning regular
promotions on soft drinks in student bars to discourage excessive alcohol
consumption and providing alternative drinking environments with a modern caM
atmosphere.
4.5.3 Workplace Workplace refectories also have a responsibility to provide a balanced choice of meals for employees. Respondents in the present study demonstrated a higher
172

level of practical cooking skill when preparing meals at home, but it is important
that workplace cafeterias also enable them to make healthy choices during
working hours. The standard of workplace catering can vary widely between
establishments, as no nutritional standards apply to this type of catering
establishment. It may be beneficial to introduce standards similar to those used in
schools in order to promote a healthy diet in the workplace. It is in the interest of
the employer to promote healthy eating in the workplace, as healthy employees
are likely to be more productive and have fewer days off work due to ill health
(HIDA 2004). It may be beneficial for workplaces to implement a health promotion
group, as suggested for universities, to take responsibility for implementing
relevant health promotion activities. A number of studies have found workplace
settings to be a successful base for healthy eating interventions, with decreases in
cholesterol levels of between 2.5% and 10% (HDA 2004a)
4.5.4 Hostels
The main problem with establishment-based initiatives is that they often fail to
reach those who are most in need of advice and support (i. e. low-income and
ethnic minority groups). Young people from these groups sometimes have a poor
school attendance record, so are likely to miss a proportion of health education
and school-based health promoting activities. Many experience problems in
accessing health services so may not receive the advice and support they need.
Furthermore, the rate of unemployment is high amongst low-income groups so
they will not benefit from workplace based health promotion initiatives either. This
problem was observed amongst homeless respondents in the present study, who
experienced problems in registering with a GP and dentist because local practices did not allow them to register whilst they had no permanent address. This type of discrimination towards the homeless is in urgent need of addressing and should be rectified by ensuring registration with health professionals is not dependent on having an address. Homeless hostels play an important part in promoting health
to residents, as they are often a homeless person's only source of help and
support, and provide a vital link between residents and health care professionals. The level of advice and support from hostel staff varies widely between hostels, as
each hostel is an independent establishment, so there is no standard policy to indicate the exact role of the hostel in promoting health or assisting access to healthcare. It may therefore be beneficial to introduce a signposting system to use
173

in hostels nationwide to identify ways in which staff can work with individuals to
identify their specific needs and refer them to appropriate healthcare professionals
and/or community support groups.
Whatever intervention is used to promote healthy eating, the conflicting messages
of contemporary society will compromise the success of such projects. Whilst the
rising levels of obesity have been recognised as a major public health concern
requiring urgent action, convenience food products that are high in saturated fat,
salt and sugar are still being aggressively marketed, particularly to young people. These ready-meal products appeal to consumers due to the ease of preparation,
and few observe the nutritional information on the packaging. Whilst this type of
packaged meal helps consumers to regulate their portion sizes, this type of meal is
often of poor nutritional quality. It appears that British consumers are increasingly
consuming a diet of deteriorating quality and not utilising even the most basic
practical cooking skills. The younger generation are therefore growing up with
microwave meals and convenience food, so are not given the opportunity to learn
any practical skills (even by observation). This is resulting in young people leaving
home ill-equipped to prepare any fresh ingredients, and may therefore follow their
parents' example of consuming convenience food.
It would be beneficial for parents to set an example to their children by preparing some healthy meals from fresh ingredients. However, convenience foods are an asset to contemporary lifestyle in terms of ease of preparation, but are in need of ingredient/nutritional regulation. Food manufacturers should be encouraged to invest in developing a healthier portfolio of products, which have less added fat,
sugar and salt. Additionally, a more consumer-friendly method of labelling food would be beneficial in order to assist the 'informed consumer' to make healthy choices. The level of fats, sugar and salt in processed foods varies widely between brands, making it necessary for the consumer to check the nutritional content of individual products if they wish to assess which is the healthiest. Checking the nutritional content of foods using current labelling information is quite complex and time consuming. It would therefore be beneficial to develop and widen the use of the nutrient profiling system being developed by the Food Standards Agency and currently used by Co-op supermarkets, which labels foods as having high, medium or low levels of fat, sugar, salt and fibre. This type of
174
labelling enables consumers to assess the healthfulness of a product at a glance
rather than reading the detailed nutritional label.
As children grow up, they will develop dietary habits and health behaviours based
on what they observe. Adult behaviours such as dietary habits, alcohol
consumption, physical activity and smoking may be influenced by childhood
observations but are generally determined during adolescence (Graham and
Power 2004). The evidence relating to smoking behaviour in adolescence
compared to adulthood is clear: young people who do not smoke regularly in
adolescence are unlikely to smoke in adulthood, but regular adolescent smokers
are likely to continue smoking into middle-age (Graham and Power 2004). The
evidence tracking dietary habits and alcohol consumption from adolescence to
adulthood indicates these behaviours are less strongly linked throughout
transition, thereby possibly making these behaviours more open to change as a
result of lifestyle transitions or external influences such as health promotion interventions. The Health Development Agency states that health behaviour is
transmitted through generations with advantages and disadvantages being
reinforced in adult life, thereby increasing the health inequalities gap. Evidence
suggests that social circumstances in adulthood are more influential on dietary
habits than childhood experiences, although social circumstances in adulthood are
often determined by social circumstances in childhood.
This was supported by findings of the present study, which observed three groups of independent living young adults with very different social circumstances, but
who also shared certain factors that influenced their diet and lifestyle. Working
adults generally had a more established network of support, and had the highest income, which contributed to this group having the healthiest dietary habits. Students and homeless respondents were both living on a lower income and had inferior accommodation with often crowded, shared kitchen facilities. These
respondents were also less established within their community, as the majority had moved from different geographical locations and were only beginning to build up social networks within their communities. These factors appeared to result in some poor dietary habits, such as snacking rather than preparing a meal for one (when they did not share the cooking with house/hostel mates) and comfort eating. As students were generally from higher socio-economic backgrounds, it is likely
175
that the social circumstances they have in common with homeless young people
following transition into independent living are only temporary. After their next
major transition of leaving university and entering employment, it may be
suggested that they will gradually develop the type of lifestyle observed in working
adults. However, the impermanent nature of hostel dwelling and associated cycle
of poverty, along with a lack of support to help homeless people to consume a
healthy diet could result in long-term social isolation and consequently poor dietary
habits. As Kuh and Ben Shlomo (1998) have stated- 'The possibility exists of intervening to break biological and social chains of risk at several stages of life,
and of targeting those particularly at risk at times when change is most likely'.
Public health policy should adopt a life course strategy, applicable to society as a
whole, with attention to key periods of transition such as leaving home, where health behaviours and dietary habits are particularly flexible (and could change
either positively or negatively) to encourage and support individuals to adopt healthy changes that can be sustained in the long-term.
176
4.6 Recommendations
implementing life-skills modules targeted at young people before they leave
home would be beneficial to outline key messages for eating healthily,
along with basic practical cookery sessions to enable young people to gain
some experience of cooking for themselves. In addition, sessions to help
young people understand the financial issues of independent living may
help to prepare them for food budgeting. These life-skills modules might be
implemented at schools and youth groups.
There is a need for education and training of professionals who work with
young people, to enable them to be in a position to give informed advice
about diet and health, or refer them to appropriate health professionals
and/or community health initiatives.
Those involved in promoting young people's health should work in
partnership with relevant organisations and establishments to ensure health
initiatives are available to the whole community. This would help to make health information, advice and initiatives available to all young people, including homeless young people who may not benefit fully from
school/establishment based initiatives.
The development of nutritional and healthy eating advice targeted
specifically at young people who have left home, which take into account the lifestyle changes that are likely to be associated with independent living.
To introduce projects aimed at enabling homeless people to consume a healthy diet whilst developing new skills (such as Crisis Fareshare (Evans 1996)) to homeless hostels. Also to widen the Fruit for Schools and free school milk scheme to include homeless hostels in the recipients of free fruit and milk. In light of the findings indicating low folate intakes of female homeless hostel residents along with the increased likelihood of pregnancy in this
group of young people, it may be beneficial to introduce free supplements to improve nutrition during pregnancy and reduce the potential risk of neural-tube birth defects.
To increase awareness of the Health Promoting University Initiative amongst further education establishments and enable university's to incorporate the concept into its strategic plans by providing guidance
177

regarding the establishment of a health promotion co-ordinator, and gaining
support from a steering group of staff, the students union and senior
management. To implement food policy guidelines in university and workplace canteens,
outlining nutritional standards to reduce the level of fat, salt and sugars and increase levels of fibre in the food provided.
in light of the findings of this study, the following areas of research are
recommended:
*A longitudinal study investigating the dietary habits and nutritional status of
children and young people throughout their transition to adulthood in order to understand the impact of transitional points of the life course on diet and health.
A longitudinal study to investigate the impact of homelessness on dietary habits and nutritional status; specifically to follow subjects through their transition from hostel accommodation to identify the extent to which more permanent accommodation is secured, and the associated changes to dietary habits.
The development of food data analysis software to improve analysis of food data (i. e. to report how many portions of fruit and vegetables have been
consumed based on the recommended portion weights).
178

5.0 BIBLIOGRAPHY
179
ACHESON, D. (1998) Independent Inquiry into inequalities in health report. TSO,
London.
AINLEY, P. and ASHFORD, S. (1991) Young People leaving Home. Cassell,
London.
AMERICAN DIETETIC ASSOCIATION (2001) Tips for avoiding the Freshman
Fifteen [online]. Available online at: http: //www. eatright. org/erm/ermO83099. htmi.
[Accessed 3 May 20021.
ANDERSEN, I., BURR, H., KRISTENSEN, TS., GAMBORG, M., OSLER, M.,
PRESCOTT, E. and DIDERICHSEN, F. (2004) Do factors in the psychosocial work
environment mediate the effect of socioeconomic position on the risk of myocardial
infarction? Study from the Copenhagen Centre for Prospective Population Studies.
Occupational and Environmental Medicine, 61,886-892.
APPLEBY, P., THOROGOOD, M., MANN, J., and KAY, T. (1999) The Oxford
Vegetarian Study: an overview. American Journal of Clinical Nutrition. 70,525S-
531S.
ARMITAGE, J., TAYLOR, P. and POSTON, L. (2005) Experimental models of developmental programming; Consequences of exposure to an energy rich diet
during development. Journal of Physiology [E-publication ahead of print) Available
at http: //www. ncbi. nim. nih. gov/entrez/query. fcgi? cmd=Retrieve&db=pubmed&dopt=A bstract&list_uids=15695245. [Accessed 24 march 2005].
ARTHUR, G., HACKETT, A. F. and MAXWELL, S. M. (2003): Dietary habits of the homeless. Proceedings of the Nutrition Society. 62,54A.
BACKETT, K., DAVISON, C. (1995) Lifecourse and lifestyle: The social and cultural location of health behaviours. Social Science and Medicine, 40,5,629- 638.
180

BAKER, 0. (2001): Hidden but not Forgotten - The Experiences of Hostel
Residents. Crisis, London.
BAKKER, M. (199 1) Healthy eating in Liverpool, Children's food intake, knowledge
and attitudes. Department of Public Health, Liverpool University.
BALLAM, R. (2000) Cooking and kids. Nutrition Bulletin, 25,99.
BALOGH, M., KAHN, H., MEDALIE, J. (1971) Random repeat 24-hour dietary
recalls. American Journal of Clinical Nutrition, 24,304-310.
BANDURA, A. (1997). Self-efficacy The exercise of control. W. H. Freeman and Company, New York.
BARANOWSKI, T. AND HEARN, M. (1997) Families and health behaviour
change. In Gocham D (eds. ), Handbook of Behavioural Medicine Research.
Plenum, New York, vol. IV, 303-323.
BARBER, S. and BULL, N. (1985) Food and Nutrient intakes by British women
aged 15-25 years, with particular reference to dieting habits and iron intakes. Ecology of Food and Nutrition, 16,161-169.
BARKER, D. (1990) The foetal and infant origins of adult disease. British Medical Joumal, 301,1111.
BARRET-CONNOR, E. (1991) Nutrition Epidemiology: how do we know what they ate? Arnefican Journal of Clinical Nutrition, 54 (suppl. ), 182S-187S.
BARTLEY, M., BLANE, D. and MONTGOMERY, S. (1997) Health and the life course: why safety nets matter. British Medical Journal, 314,1194-1196.
BBC ONLINE (2003a) First-time homebuyers at record low [online] BBC News Online, 5 August 2003. Available online at: http: //news. bbc. ca. uk/l/hi/business/3125103. stm. [Accessed 20 August 20031
181

BBC ONLINE (2003b) TV show blamed for Faliraki trouble. [online] Available at
http: //news. bbc-ca. uk/l/hi/england/lancashire/3196179. stm. [Acessed 20
September 20041.
BBC ONLINE (2004) Drink yob blitz sparks fine rise. [online] Available at
news. bbc. co. uk/I/hi/uk/3537290. stm. [Accessed 15 February 2005].
BEASLEY, L., HACKETT, A., MAXWELL, S. and STEVENSON, L. (2004) The
effect of a dietary preload on estimation of usual portion size by photograph in
female volunteers. Journal of Human nutrition and Dietetics, 17,219-225.
BECHER, H., BOREHAM, R., EMERY, P., HINDS, K., JAMISON, J. and SCHAGEN, 1. (2000) Smoking, Drinking and Drug Use among Young People in
England 2000. ONS: HMSO.
BELLISLE, F. (2004) Effects of diet on behaviour and cognition in children. British
Joumal of Nutrition, (Suppl. 2), S227-232.
BINGHAM, S. (1987) The dietary assessment of individuals: methods, accuracy,
new techniques and recommendations. Nutrition Abstracts and Review, 57,705-
42.
BINGHAM, S. (1999) High-meat diets and cancer risk. Proceedings of the Nutrition Society, 58,243-248.
BIRCH, L., MCPHEE, L., SHOBA, B. and STEINBERG, L. (2003) "Clean up your
plate": Effects of child feeding practices on the conditioning of meal size. Learning
and Motivation, 18,3,301-317.
BIRO, G., HULSHOF, K., OVESEN, L. and AMORIN CRUZ, J. (2002) Selection of methodology to assess food intake. European Joumal of Clinical Nutrition, 56,2, 525-532.
182
BLACK, A., (2000) The sensitivity and specificity of the Goldberg cut-off for
El: BMR for identifying diet reports of poor validity. European Journal of Clinical
Nutrition, 54,395-404.
BOERMA, G., GELDERLAND, J., VAN GORP, 1. and LEIJNSE, B. (1988a) Use of
the Reflotron system for cholesterol assay in capillary blood, venous blood, and
serum-evaluation of accuracy and lot-to-lot reagent comparability. Clinical
Chemistry, 34,10,2117-2119.
BOERMA, G., VAN GORP, I., LIEM, T., LEIJNSE, B., BELLM, J. and
CARSTENSEN, C. (1988b) Revised calibration of the Reflotron cholesterol assay
evaluated, Clinical Chemistry, 34,6,1124-7.
BOOTH, D. and SHEPHERD, R. (1988) Sensory influences on food acceptance:
the neglected approach to nutrition promotion. Nutrition Bulletin, 13,39-54.
BORE, C., SOBAL, J. and RAUCSHENBACH, B. (2003) Food choice among
newly married couples: convergence, conflict, individualism and projects. Appetite,
40,1,25-41.
BORZEKOWSKI, D. and ROBINSON, T. (2001) The 30-second effect: an
experiment revealing the impact of television commercials on food preferences of preschoolers. Journal of the American Dietetic Association. 101,42-46.
BOYS, A., MARSDEN, J., STILLWELL, G., GRIFFITHS, P. and FARREL, M. (2003) Minimising respondent attrition in longitudinal research: practical implications from a cohort study of adolescent drinking. Joumal of Adolescence, 26,3,363-373.
BRANEN, L. and FLETCHER, J. (1999) Comparison of college students' current eating habits and recollections of their childhood food practices. Journal of Nutrition Education, 31,6,304-309.
183

BRIEFEL, R., SEMPOS, C., MCDOWELL, M., CHIEN, S. and ALAIMO, K. (1997)
Dietary methods research in the third National Health and Nutrition Examination
Study: under-reporting of energy intake. American Journal of Clinical Nutrition, 65,
1203S-1209S.
BRITISH NUTRITION FOUNDATION (2004) Wartime Rationing. [online] Available
at hftp: //www. nutrition. org. uk/uploadNVartimeý/ý20rationingý/ý20caseý/ý20study. pdf. [Accessed 12 March 20051.
BROWN, W. and TROST, S. (2003) Life transitions and changing physical activity
pafterns in young women. American Journal of Preventative Medicine, 25,2,140-
143.
BURKE, B. (1947) The dietary history as a tool in research. Joumal of the American Dietetic Association, 23,1041-1046.
BURKE, V., GIANGIULIO, N., GILLAM, H., BEILIN, L., HOUGHTON, S. and MILLIGAN, R. (1999) Health promotion in couples adapting to a shared lifestyle. Health Education Research, 14,2,269-288.
BUTLER, S., BLACK, D., BLUE, C., and GRETEBECK, R. (2004) Change in diet, physical activity and body weight in female college freshman. American Journal of Health Behaviour, 28,1,24-32.
CARTER, J., CULLEN, K. and BARANOWSKI, T. (2000) BMI related to number of meals eating watching TV as repofted by 4th to 6th grade students: demographic differences. Abstract for the American Dietetic Association Meeting. Denver, GO.
CASEY, R. and ROZIN, P. (1989) Changing children's food preferences: parent opinions. Appetite, 12,3,171-182.
CENSUS (2001) Households [online] UK Census National Report 2001,7 May 2003. Available online at: hftp: //www. statistics. gov. uk/cci/nugget. asp? id=350. [Accessed 28 June 2003].
184
CENTREPOINT (1997): Centrepoint Annual Statistics., Centrepoint, London
CENTREPOINT (2003) Youth homelessness statistics. [online] Available at http: //www. centrepoint. org. uk/main. asp? id=482_1952_19258 [Accessed 29 March
2004].
CHAMBERLAIN, C. AND MCKENZIE, D. (1992): Understanding Contemporary
Homelessness: Issues of Definition and Meaning. Australian Journal of Social
Issues. 27,4,274-297.
CHAPMAN, G. and MCCLEAN, H. (1993) 'Junk food and 'healthy food': meanings of foods in adolescent women's culture. Nutrition Education, 22,1,6-13.
CHAPMAN, G. (1994) Food practices and concerns of teenage girls, National Institute of Nutrition Review, 23, National Institute of Nutrition.
CHINN, S. and RONA, R. J. (2002) International definitions of overweight and obesity for children: a lasting solution? Annals of Human BiologY. 29,3,306-13.
CHOPRA, M., GALBRAITH, S. and DARNTON-HILL, 1. (2002) A global response to a global problem: the epidemic of over-nutrition. Bulletin of the World Health Organisation, 80,952-958.
COOPER, C., ERIKSSON, J., FORSEN, T., OSMOND, C., TUOMILEHTO, J. and BARKER, D. (2001) Maternal height, childhood growth and risk of hip fracture in later life: a longitudinal study. Osteoporosis Intemational, 12,8,623-629.
COUFOPOULOS, A. (1997): Homelessness, diet and health. PhD Thesis. Liverpool John Moores University.
C RAI G, T. (1996): Off to a bad start. A longitudinal study of homeless Young people in London, Mental Health Foundation, London.
185
CRESPO, C., SMITH, E., TROIANO, R., BARTLETT, S., MACERA, C. and
ANDERSEN, R. (2001) Television watching, energy intake, and obesity in US
children: results from the third National Health and Nutrition Examination Survey,
1988-1994. Archives of Pediatric Adolescent Medicine, 155,360-365.
CREWS, W. and HARRISON, D. (1991) An evaluation of the DS-175, DS-145,
and DS-1 15, digital blood pressure/pulse meter devices. Biomedical Instruments
and Technology 25,3,211-4.
CROCKETT, S., MULLIS, R. and PERRY, C. (1988) Parent nutrition education: a
conceptual model. The Joumal of School Health, 58, b2,53-57.
CURRIE, C., HURRELMANN, K., SETTERTOBULTE, W., SMITH, R. and TODD,
J. (2000) Health and Health Behaviour Among Young People [International Report
from the 1997198 HBSC survey]. WHO Policy Series: Health policy for children and adolescents. Issue 1, WHO Regional Office for Europe, Copenhagen.
CURRIE, C., ROBERTS, C., MORGAN, A., SMITH, R., SETTERTOBULTE, W., SAMIDAL, 0., BARNEKOW RASMUSSEN, V. (2004) Young People's Health in Context: Intemational reporf from the HBSC 2001102 survey. WHO Policy Series: Health policy for children and adolescents Issue 4, WHO Regional Office for
Europe, Copenhagen.
DACHNER, N. and TARASUK, V. (2002): Homeless 'squeegee kids': Food insecurity and daily survival. Social Science and Medicine, 64,7,1039-1049.
DALY, G. (1990): Health Implications of Homelessness: Reports from Three Countries. Journal of Sociology and Social Welfare, 17,1,111-125.
DALZIEL, D., HENTHORNE, K. and EVANS, L. (2004) 5A Day Process Review. Big Loftery Fund, London.
DAVEY-SMITH, G. (2000) Learning to live with complexity: ethnicity, socio- economic position, and health in Britain and the United States. American Journal of Public Health, 90,1694-1698.
186
DEL CANIZO, F., FROILAN, C. and MOREIRA-ANDRES, M. (1996) Precision and
accuracy of the measurement of total cholesterol using the reflectometer
Accutrend GC: Usefulness in primary care for diagnosis of hypercholesterolemia.
[online] Available at
hftp: //www. ncbi. nim. nih. gov/entrez/query. fcgi? cmd=Retrieve&db=pubmed&dopt=A
bstract. [Accessed 22nd April 20041.
DEMORY-LUCE, D., MORALES, M., NICKLAS, T., BARANOWSKI, T., ZAKERI, 1.
and BERENSON, G. (2004) Changes in food group consumption patterns from
childhood to young adulthood: the Bogalusa Heart Study. Joumal of the American
Dietetic Association, 104,11,1684-1691.
DEPARTMENT OF HEALTH (1991) Dietary Reference Values for Food Energy
and Nutrients for the United Kingdom. TSO, London.
DEPARTMENT OF HEALTH (1994): Nutritional Aspects of Cardiovascular
Disease. TSO, London.
DEPARTMENT OF HEALTH (1999) Saving Lives: Our Healthier Nation. TSO,
London.
DEPARTMENT OF HEALTH (2002) Annual Report of the Chief Medical Officer 2002. TSO, London.
DEPARTMENT OF HEALTH (2004a) Choosing Health? Making healthier choices
easier TSO, London.
DEPARTMENT OF HEALTH (2004b) Choosing a better diet a food and health
action plan [online] Available at hftp: //www. dh. gov. uk/assetRoot/04/10/57/09/04105709. pdf. [Accessed 18 March 2004].
187
DEPARTMENT OF HEALTH (2005a) Food in Schools pilot projects [online]
Available at http: //www. dh. gov. uk/PolicyAndGuidance/HealthAndSocialCareTopics/FoodInSch
ools/FoodinSchooisGenerallnformation/fs/en [Accessed 5 August 2004]
DEPARTMENT OF HEALTH (2005b) 5A Day. [online] Available at
hftp: //www. dh. gov. uk/PolicyAndGuidance/HealthAndSocialCareTopics/FiveADay/f
s/en [Accessed 20 March 2005]
DEPARTMENT FOR EDUCATION AND SKILLS (2003) Participation rates in
higher education for the academic years 199912000 - 2002/2003 (online] Available
at hftp: //www. dfes. gov. uk/rsgateway/DB/SFR/sOO0456/SFR07-2004. pdf [Accessed
28th March 20041.
DEPARTMENT FOR EDUCATION AND SKILLS (2004) Student loans and the
question of debt. [online) Available at http: /twww. dfes. gov. uk/hegateway/uploads/Debtý/ý20-ý/ý2OFinal. pdf [Accessed 30 March 20051.
DEURENBERG P (1992) The assessment of body composition: uses and misuses. Nestle Foundation Annual Report, 35-71,
DONALDSON, L. (2004) On the state of the public health: Annual report of the Chief Medical Officer 2003. TSO, London.
DRAPER, A., WHEELER, E. and LEWIS, J. (1990) Who are 'vegetarians' and what do they think about food? Proceedings of the Nutrition Society, 49,60A
DURNIN, J. and WOMERSLEY, J. (1974) Body fat assessed from total body density and its estimation from skinfold thickness measurements on 481 men and women aged from 16-72 years. British Journal of Nutrition, 32,77-97.
EBRAHIM, S., WANNAMETHEE, G., MCCALLUM, A., WALKER, M. and SHAPER, A. (1995) Marital status, change in marital status, and mortality in middle-aged British men. American Journal of Epidemiology, '142,8,834-842.
188

ECKEL, L. and MOORE, S. (2004) Diet-induced hyperphagia in the rat is
influenced by sex and exercise. American Joumal of Physiology - Regulatory,
Integrative and Comparative Physiology, 287,5, R1 080-1085.
EDINBURGH CYRENIANS (2003): Edinburgh Cyrenians Food Education Project.
[online] Available at: hftp: //www. cyrinians. org. uk/goodfood/index. htm [Accessed:
02/12/031.
EDWARDS, J. and MEISELMAN, H. (2003) Changes in dietary habits during the
first year at university. Nutrition Bulletin, 28,21-34.
EERTMANS, A., BAEYENS, F. and VAN DEN BERGH, 0. (2001) Food likes and their relative importance in human eating behaviour: review and preliminary suggestions for health promotion. Health Education Research, 16,4,443-456.
ENGINEER, R., PHILLIPS, A., THOMPSON, J. and NICHOLLS, J. (2003) Drunk
and disorderly: a qualitative study of binge drinking amongst 18-24 year olds. Home Office Research; Development and Statistics Directorate, London.
EVANS, N. (1996): What do homeless people eat and can Crisis FareShare help improve their diet? Nutrition and Food Science, 3,15-17.
EVANS, N. and DOWLER, E. (1999): Food, health and eating among single homeless people and marginalized people in London. Journal of Human Nutrition
and Dietetics, 12,3,179-199.
EVES, A., KIPPS, M., and PARLETT, G. (1994) Changes in the diets of university students over a six-year period (1986-1991) Journal of Human Nutrition and Dietetics, 7,363-376.
EVES, A., KIPPS, M., and PARLETT, G (1995) Undernourished students - myth or reality. Nutrition and Food Science, 2,5-11.
189
FAGGIANO, F., VINEIS, P., CRAVANZOL, D., PISANI, P., XOMPERO, G.,
RIBOLI, E. AND KAAKS, R. (1992) Validation of a method for the estimation of
food portion size. Epidemiology, 3,379-382.
FEIGHERY E, BORZEKOWSKI DL, SCHOOLER C, FLORA J. (1998) Seeing,
wanting, owning: the relationship between receptivity to tobacco marketing and
smoking susceptibility in young people. Tobacco Control, 7,2,123-8.
FERRO-LUZZI, A. and SETTE, S. (1989) The Mediterranean diet: an attempt to define its present and past composition. European Journal of Clinical Nutrition, 43
(suppl): 13-29.
FEUNEKES, G., DE GRAF, C., MEYBOOM, S. and VAN STAVEREN, W. (1998)
Food choice and fat intake of adolescents and Adults: Associations of intakes
within social networks. Preventative Medicine, 27,5,645-656,
FISHER, J. and BIRCH, L. (1999) Restricting access to foods and children's eating. Appetite, 32,405-419.
FISHER, J., MITCHELL, D., SMICIKLAS-WRIGHT, H. and BIRCH, L. (2001) Maternal milk consumption predicts the trade-off between milk and soft drinks in
young girls'diets. Journal of Nutrition, 131,246-250.
FOOD STANDARDS AGENCY (2002) McCance and Widdowson's the Composition of Foods: Summary Edition. Royal Society of Chemistry, UK.
FOOD STANDARDS AGENCY (2003a) Review of Research on the Effects of Food Promotion to Children Part One: Main Report. [online] Available at hftp: //www. food. gov. uk [Accessed 29 March 20051.
FOOD STANDARDS AGENCY (2003b) Eating tips for students (online] Available at http: //www. foodstandards-gov. uk/multimedia/Webpage/studenteating [Accessed 21 st May 20031.
FOOD STANDARDS AGENCY (2004) Manual of Nutrition. TSO, London.
190
FOUNTAIN, J., HOWES, S. and BAKER, 0. (2002) Home and Dry?
Homelessness and Substance Abuse. Crisis, London.
FROBISHER, C. and MAXWELL, S. (2001) The attitudes and nutritional
knowledge of a group of 11-12 year olds in Merseyside. International Journal of
Health Promotion and Education, 39,4,121-127.
FROBISHER, C. and MAXWELL, S. (2003) The estimation of food portion sizes: a
comparison between using descriptions of portion sizes and a photographic food
atlas by children and adults. Journal of Human Nutrition and Dietetics, 16,3,181-
8
FULLER, N., SAWYER, M. and ELIA, A. (1994) Comparative evaluation of body
composition methods and predictions and calculation of density and hydration
fraction of fat-free mass, in obese women. Intemational Joumal of Obesity, 18,
503-512.
FURST, T., CONNORS, M., BISOGNI, C., SOBAL, J. and WINTER-FALK, L.
(1996) Food choice: a conceptual mode4l of the process. Appetite, 26,247-266.
GARROW, J. (1974) Energy balance and obesity in man. North Holland Publishing Company, Amsterdam and London.
GERSOVITZ, M., MADDEN, J. and SMICIKLAS-WRIGHT, H. (1978) Validity of the 24-hr. dietary recall and seven-day record for group comparisons. Joumal of the American Dietetic Association, 73,1,48-55.
GESCH, C. B., HAMMOND, S. M., HAMPSON, S. E., EVES, A. and CROWDER,
M. J. (2002): Influence of supplementary vitamins, minerals and essential fatty
acids on the antisocial behaviour of young adult prisoners. Randomised, placebo-
controlled trial. British Joumal of Psychiatry, 11811,22-28.
191
GIBSON, S. (2003) Micronutrient intakes, micronutrient status and lipid profiles
among young people consuming different amounts of breakfast cereal - rt r s. fu he
analysis of data from the National Diet and Nutrition Survey of Young People aged
4 to 18 years. Public Health Nutrition, 6,8,815-820.
GOLDBERG, G. R., BLACK, A. E., JEBB, S. A., COLE, T. J., MURGATROYD, P. R.,
COWARD, W. A. and PRENTICE, A. M. (1991): Critical evaluation of energy intake
data using fundamental principles of energy physiology: 1. Derivation of cut-off limits to identify under-recording. European Journal of Clinical Nutrition. 45,569-
581.
GOLDBERG, G. and BLACK, A. (1998) Assessment of the validity of reported energy intakes - review and recent developments. Scandinavian Journal of Nutrition, 42,6-9.
GOLDEN, S. (1999) The women outside: meanings and myths of homelessness. University of California Press, Berkeley and Oxford.
GORTON, S. (2000) Homeless young women and pregnancy: pregnancy in hostels for single and homeless people. Crisis, London.
GOTTSCHLING, H., REUTER, W., RONQUIST, G., STEINMETZ, A. and HATTEMER, A. (1995) Multicentre evaluation of a non-wipe system for the rapid determination of total cholesterol in capillary blood, Accutrend Cholesterol on Accutrend GC. European Journal of Clinical Chemistry and Clinical Biochemistry, 33,6,373-381.
GRAETINGER, J. (1988) The 1988 National Resident Matching Program. Annals of International Medicine; 1108,5,761-762.
GRAHAM, H. and POWER, C. (2004) Childhood disadvantage and adult health: a life course framework. Health Development Agency, London.
GRANNIS, F. W. (2004) The Lung Cancer and Cigarette Smoking Web Page. [online] Available at hftp: //www. smokinglungs. com/ [Accessed 5 January 20051.
192
GREGORY, J., LOWE, S., BATES, C. J., PRENTICE, A., JACKSON, L. V.,
WITHERS, G., WENLOCK, R. and FARRON, M. (2000) National Diet and
Nutrition Survey: young people aged 4 to 18 years. Volume 1: Report of the diet
and nutrition survey, TSO, London.
GUARDIAN (2002) To your ill health [online] Guardian Unlimited, 17 September
2002. Available online at:
hftp: //education. guardian-co. uk/egweekly/story/0,5500,793094,00. htmi.. [Accessed
12 September 20031
HACKETT, A. F., KIRBY, S. and HOWIE, M. (1997) A national survey of the diet of
children aged 13-14 years living in urban areas of the United Kingdom. Journal of Human Nutrition and Dietetics, 10,37-51.
HALL, J. (1983) A method for the rapid assessment of sample size in dietary
studies. American Joumal of Clinical Nutrition, 37,473-477.
HAMPSHIRE, M. (2003) To a healthy degree. [online] Available at hftp: //www. hda. nhs. uk/hdt/0203/universities. html [Accessed 29 September 2003].
HAMILTON, J., McILVEEN, H. and STRUGNELL, C. (2000) Educating young consumers -a food choice model. Journal of Consumer Studies and Home Economics, 24,113-123.
HARRELL, J., PEARCE, P., MARKLAND, E., WILSON, K., BRADLEY, C. and MCMURRAY, R. (2003) Assessing physical activity in adolescents: common activities of children in 6th-8th grades. Journal of the American Academy of Nursing Practice, 15,170-8.
HEALTH DEVELOPMENT AGENCY (2004a) Workplace interventions: alcohol and diet. [online]
Available at http: //www. hdaonline. org. uk/downloads/pdfs/choosing_health/CHB19- alcohol_diet-14-7. pdf [Accessed 20 February 2005].
193
HEALTH DEVELOPMENT AGENCY (2004b) Young people and alcohol. [online]
Available at http: //www. wiredforhealth-gov. uk/cat. php? catid=865&docid=7075
[Accessed 20 February 2005].
HEALTH DEVELOPMENT AGENCY (2004c) Binge drinking in the UK and on the
Continent. [online] Available at
hftp: //www. hda. nhs. uk/downloads/pdfs/choosing_health/CHBB-binge-drinking. pdf.
[Accessed 12 January 2005].
HEARN, M., BARONOWSKI, T., BARONOWSKI, J., DOYLE, C., SMITH, M., LIN,
L. and RESNICOW, K. (1998) Environmental influences on dietary behaviour
among children: availability and accessibility of fruits and vegetables enable
consumption. Journal of Health Education, 29,26-32.
HENDERSON, L., GREGORY, J., IRVING, K. and SWAN, G. (2003) The National
Diet and Nutrition Survey: Adults aged 19-64 years. HMSO, London.
HENDRICK, J. and CUTLER, S. J. (2004) Volunteerism and socioemotional
selectivity in later life. Journal of Gerontology, 59,5, S251-257.
HERO (2003) Unhappy happy hours [online] Higher Education and Research
Opportunities. Available online at:
http: //www. hero. ac. uk/studying/unhappy_happy_hours3494-cfm. [Accessed 12
September 2003]
HERRUER, M., KLUITENBERG, W. and ZUIDERHOUDT, F. (1992) Comparison
of the ratio HDL-cholesterol/total cholesterol on the Reflotron vs. conventional wet
chemistry methods. European Joumal of Clinical Chemistry and Clinical
Biochemistry, 3,153-5.
HERSHEYS (2002) Children's Eating Pattems. [online] Available at hersheysnutrition. comichildren/media/children. pdf [Accessed 1 March 2003]
HOLLIS, G. (1989) The nutrition magician: integrating nutrition into basic education. Mothers Child, 8,1,6-7.
194

HOMELESS PAGES (2002): Benefit Claims. (online] Available at
http: //www. homelesspages. org. uk/ [Accessed 11/04/2003].
JAMES, W., NELSON, M., RALPH, A. and LEATHER, S. (1998) Socio-econornic
determinants of health. The contribution of nutrition to inequalities in health. British
Medical Joumal, 316,7127,308-9.
JANSEN, A. and TENNEY, N. (2001) Seeing mum drinking a 'light' product: is
social learning a stronger determinant of taste preference acquisition than caloric
conditioning? European Journal of Clinical Nutrition, 56,6,418-22.
JEB, S. and ELIA, M (1993) Techniques for the measurement of body
composition: a practical guide. Intemational Joumal of Obesity Related Metabolic Disorders, 17,11,611-21.
JOHNSON, S. and BIRCH, L. (1994) Parents' and children's adiposity and eating style. Pediatrics, 94,653-661.
JOHNSON B.; HACKETT A. F.; BIBBY A. and CROSS J. (1999) An investigation
of the face validity of a food intake questionnaire: lessons for dietary advice. Journal of Human Nutrition and Dietetics, 12,4,307-316.
JOHNSON B.; HACKETT A.; ROUNDFIELD M. and COUFOPOULOS A. (2001) An investigation of the validity and reliability of a food intake questionnaire. Joumal of Human Nutrition and Dietetics, 14,6,457-465.
JONES, A. (1999): Out of Sight, Out of Mind? Women's experience of single homelessness. Crisis, London.
JONES L. and SIDELL M. (1999) The Challenge of Promoting Health: Exploration and Action. Macmillan Press Ltd, London.
JOSEPH ROWNTREE FOUNDATION (1994) Eating on a low-income. [online] Available at http: //www. jrf. org. uk/knowledge/flndings/socialpolicy/SP66. asp [Accessed 5 September 20041.
195
JOSEPH ROWNTREE FOUNDATION (2003) The youth divide: diverging
pathways to adulthood. [online] Available at
http: //www. jrf. org. uk/knowledgeffindings/f`oundations/792. asp. [Accessed 15
February 2005).
KAAKS, R. and RIBOLI, E. (1997) Validation and calibration of dietary intake
measurements in the EPIC Project: Methodological considerations. Intemational
Joumal of Epidemiology, 26,1 (Suppl - 1), S1 5-S24.
KAFONEK, S., DONOVAN, L., LOVEJOY, K. and BACHORIK, P. (1996)
Biological variation of lipids and lipoproteins in fingerstick blood. Clinical
Chemistry, 42,2002-2007.
KAHN, M. (1981) Factors affecting consumer preferences and their utilization in
hospitality management. In The Practice of Hospitality Management (Ed. Pizam,
A., Lewis, R., Manning, P. ), AVI Publishing, Westport.
KAHN, H. and WILLIAMSON, D. (1991) Is race associated with weight change in
US adults after adjustment for income, education and marital factors? American Journal of Clinical Nutiltion, 53, (suppl. ) 1566S-1 570S,
KEARNEY, M., KEARNEY, J., DUNNE, A. and GIBNEY M. (2000) Sociodemographic determinants of perceived influences on food choice in a nationally representative sample of Irish adults. Public Health Nutrition, 2,219-26.
KEY, T., FRASER, G., THOROGOOD, M., APPLEBY, P., BERAL, V., REEVES, G., BURR, M., CHANG-CLAUDE, J., FRENTZEL-BEYME, R., KUZMA, J., MANN, J., and MCPHERSON K (1998) Mortality in vegetarians and non-vegetarians: a collaborative analysis of 8300 deaths among 76000 men and women in five
prospective studies. Public Health Nutrition, 1,33-41.
KHATTAB, M., ABOLFOTOUH, M., ALAKIJA, W., AL-HUMAIDI, M. and AL- WAHAT, S (1999) Risk factors of coronary heart disease: attitude and behaviour in family practice in Saudi Arabia. Eastern Mediterranean Health Journal, 5,1,35- 45.
196

KITANO, T., KITANO, N., INOMOTO, T. and FUTATSUKA, M. (2001) Evaluation
of body composition using dual-energy X-ray absorptiometry, skinfold thickness
and bioelectrical impedance analysis in Japanese female college students. Joumal
Nutrition Sci Vitaminol, 47,2,122-125.
KRONDL, M. and LAU, D. (1982) Social determinants in human food selection. In
The psychobiology of Human Food Selection (Ed. Barker, L. ), 130-151. Ellis
Florwood Limited, England.
KUH, D. and BEN-SHLOMO, Y. (1997) Conclusions in A Life Course Approach to
Chronic Disease. Oxford University Press, London.
KUSHNER (1998) Homelessness and health. [online] Available at hftp: //www. mcaws. gov. bc. ca/housing/homelessNoll-hlth. pdf. [Accessed 29 March 20051.
LANG, T., CARAHER, M., DIXON, P. and CAR-HILL, R. (1996) Class income and
gender in cooking: results from an English survey. In: Culinary Arts and Sciences.
Global and National Perspectives, (Ed. Edwards, J., ), 415-425. Computational
Mechanics Publications, Southampton.
LANG, T., CARAHER, M., DIXON, P. and CARR-HILL, R. (1999) Cooking Skills
and Health. Health Education Authority, London.
LANSKY, D. and BROWNELL, K. D. (1982) Estimates of food quantity and calories; error in self-report among obese patients. American Journal of Clinical Nutrition 35,727-732.
LARSON-BROWN, L. (1993) Point-of-choice nutrition education in a university residence hall cafeteria. Joumal of Nutrition Education, 25,6,350-356.
LIDDELL, J., LOCKIE, G. and WISE, A. (1992) effects of a nutrition education programme on the dietary habits of a population of students and staff at a centre for higher education. Journal of Human Nutrition and Dietetics, 5,23-33.
197
LIVINGSTONE, M., PRENTICE, A., STRAIN, J., COWARD, W., BLACK, A. and
BARKER, M. (1990) Accuracy of weighed dietary records in studies of diet and
health. British Medical Joumal, 300,708-12.
LOHMAN, T., ROCHE, A. and MARTORELL, R. (1988): Anthropometric
Standardisation Reference Manual. Human Kinetics Books, USA.
LUCAS, A. (1998) Programming by early nutrition: an experimental approach. Journal of Nutrition, 128 (2 Suppl), 401 S-406S.
LUDER, E., BOEY, E., BUCHALTER, B. and MARTINEZ-WEBER, C. (1990) Assessment of the nutritional status of urban homeless adults. Public Health Report, 104,451-7.
MACDIARMID, J., and BLUNDELL., J. (1998) Assessing dietary intake: Who,
what, and why of under-reporting. Nutrition Research Reviews, 11,231-253.
MAFF. (2000). National Food Survey 1999. TSO, London.
MALBUT, K. and FALASCHETTI, E. (2003) Health Survey for England 2003. TSO,
London.
MALMAURET, L., LEBLANC, J., CUVELIER, 1. and VERGER, P. (2002) Dietary intakes and vitamin status of a sample of homeless people in Paris. European Journal of Clinical Nutrition, 56,4,313-320.
MANN, J. and TRUSWELL, A. (2002) Essentials of Human Nutrition. Oxford University Press, New York.
MARGETTS, B., CADE, J. and OSMMOND, C. (1989) Comparison of food frequency questionnaire with diet record. Intemational Joumal of Epidemiology, 18,868-873.
MARSHALL, D. and ANDERSON, A. (2002) Proper meals in transition: young married couples on the nature of eating together. Appetite, 39,193-206.
198

MARTIN, A. and DRINKWATER, D. (1991) Variability in the measures of body fat.
Assumptions or technique? Sports Medicine, 5,277-88.
MARTINS, Y., PLINER, P. and O'CONNOR, R. (1999) Restrained eating among
vegetarians-. does a vegetarian eating style mask concerns about weight?
Appetite, 32,1,145-54.
MATVIENKO, O., LEWIS, D and SCHAFER, E. (2001) A college nutrition science
course as an intervention to prevent weight gain in female college freshmen.
Journal of Nutrition Education, 33,2,95-10 1.
MEISELMAN, H. MASTROIANNI, G., BULLER, M. and EDWARDS, J. (1999)
longitudinal measurements of three eating and behaviour scales during a period of change. Food Quality and Preference, 10,1-8.
MENNEN, L., JACKSON, M., CADE, J., MBANYA, J., LAFAY, L., SHARMA, S.,
WALKER, S., CHUNGONG, S., WILKS, R., BALKAU, B., FORRESTER, T. and CRUICKSHANK, J. (2000) Underreporting of energy intake in four populations of African origin. Intemational Journal of Obesity Related Metabolic Disorders, 24,7, 882-7.
MILLIGAN, R., BURKE, V., BEILIN, L., DUNBAR, D., SPENCER, M., BALDE, E.
and GRACEY, M. (1998) Influence of gender and socio-economic status on dietary patterns and nutrient intakes in 18-year-old Australians. Australian and New Zealand Journal of Public Health. 22 (4) 485-93.
MINISTRY OF AGRICULTURE, FISHERIES AND FOOD (2000) National Food Survey Annual report on food expenditure, consumption and nutrient intakes.
TSO, London.
MINTEL (2000) The Vegetarian. Mintel International Group Limited, London.
MINTEL (2002a) Student Lifestyles. Mintel International Group Limited, London.
199
MINTEL (2002b) Weekend vs weekday eating habits. Mintel International Group,
London.
MONTERO, P., BERRIS, C., VAREA, C. and ARIAS, S. (2000) Lifetime dietary
changes and its relation to increase in weight in Spanish women. Intemational
Journal of Obesity Related Metabolic Disorders, 24,1,14-9.
MOONEY, K. and WALBOURN, L. (2001) When college students reject food: not
just a matter of taste. Appetite, 36,41-50.
MOORE, S., COLE, T. and POSKITT, E. (1997) Season of birth predicts mortality
in rural Gambia. Nature, 388,434A.
MORREW-HOWELL, N. (2000) Productive engagement of older adults: Effects on
well-being. Centre for Social Development, Washington University.
MORI (2002) The student living report. [online] Available at hftp: //www. mori-com/polls/2002/unite. shtml [Accessed 8th April 20031.
MOTA, J., SANTOS, P., GUERRA, S., RIBEIRO, J. C. and DUARTE, J. A. (2003)
Patterns of daily physical activity during school days in children and adolescents. American Journal of Human Biology, 15 (4) 547-53.
MOTLUK, A. (2004) Intemperate society. New Scientist, 21st August 2004,28-33.
MOYNIHAN, P., BARTON, R., KERBER, M. and BUTLER, T. (1999) The food and
nutrient intake of students before commencing university and during the first
semester. Proceedings of the Nutrition Society, 58,37A.
NATIONAL CHOLESTEROL EDUCATION PANEL (1990) Report of the Expert Panel for Population Strategies for Blood Cholesterol Reduction. The National Cholesterol Education Program. National Heart Lung and Blood Institute, Public Health Service, U. S. Department of Health and Human Services, NIH Publication No. 90-3046.
200

NATIONAL CURRICULUM (1999) Curriculum online. [online] Available at
http: //www. curriculumonline. gov. uk/Default. htm. (Accessed 29 March 20051.
NAVARRO, M. (2001) Can students stop the urge to chomp? [online] Available at
http: //articles-student. conVarticle/freshmanfifteen [Accessed 10 August 2003].
NELSON, M., ATKINSON, M. and DARBYSHIRE, S. (1994) Food photography 1:
The perception of food portion sizes from photographs. British Journal of Nutrition
72,649-663,
NELSON, M., ATKINSON, M. and DARBYSHIRE, S. (1996) Food photography Il:
Use of food photographs for estimating portion size and nutrient content of meals.
British Journal of Nutrition 76,31-49.
NELSON, M., ATKINSON, M. and MEYER, J. (1997) Food Portion Sizes: A
Photographic Atlas. MAFF, London.
NEUMARK-SZTAINER, D., HANNAN, P., and STORY, M. (2003) Family meal
patterns: Associations with sociodemographic characteristics and improved dietary
intake among adolescents. Journal of the American Dietetic Association, 103,317-
22.
NICHOLSON M (2002) Champion of access stands solid as a rock against top-up fees. Financial Times, Nov. 28tt'2002, p. 4.
NORRISH, A., FERGUSON, L., KNIZE, M., FELTON, J., SHARPE, S. AND
JACKSON, R. (1999) Heterocyclic amine content of cooked meat and risk of
prostate cancer. Journal of the National. Cancer Institute. (Bethesda), 91,2038-
2044.
O'BRIEN, E., PICKERING, T., ASMAR, R., MYERS, M., PARATI, G., STAESSEN, J., MENGDEN, T., IMAI, Y., WAEBER, B. and PALATINI, P. (2002) Working Group on Blood Pressure Monitoring of the European Society of Hypertension International Protocol for validation of blood pressure measuring devices in adults. Stood Pressure Monitoring, 7,3-17.
201
O'DONNELL, T. and GRAY, G. (1993) The Health Promoting College. Health
Education Authority, London.
O'MAHONY, B. (1988): A capital offence: The plight of the young single homeless
in London. Barnardo's, Essex.
OPCS (1991) Standard Occupational Classification Volume 3. London: HMSO.
OYGARD, L. and KLEPP, K. (1996) Influences of social groups on eating
patterns: a study among young adults. Joumal of Behavioural Medicine, 19,1,
1-15.
PARATI, G., BILO, G. and MANCIA, G. (2004) Blood pressure measurement in
research and in clinical practice: recent evidence. Current Opinion on Nephrol
Hypertension, 13,3,343-57.
PATTON, G., SELZER, R., COFFEY, C., CARLIN, J. and WOLFE, R. (1999)
Onset of adolescent eating disorders: population based cohort study over 3
years. British Medical Journal, 318,7186,765-768.
PAYNE, A. (1996) Health promotion in fufther education. In Health Promotion:
Professional perspectives, (Eds. Scriven, A. and Orme, J. ) Macmillan Press
Ltd, London.
PILGRIM, F. (1957) The components of food acceptance and their measurement. Amen . can Journal of Clinical Nutrition, 6,171-175.
PRAKASH, S., KAPIL, U., SINGH, G., DWIVEDI, S. and TANDON, M. (1999) Utility of Hemocue in estimation of haemoglobin against standard blood cell counter method. Journal of Association of Physicians of India, 47,10,995-997.
202
PRESCOTT-CLARKE, P. and PRIMATESTA, P. (1998) The Health Survey for
England: the health of young people 1995-97. TSO, London.
PRIME MINISTER'S STRATEGY UNIT (2004) Alcohol Harm Reduction Strategy
for England. [online] Available at http: //www. strategy. gov. uk/output/Page3669. asp [Accessed 10 January 2005].
PROSPECTS TODAY (2004) How do graduate and non-graduate salaries
compare? hftp: //www. prospects. ac. uk/cms/ShowPage/Home_page/How - much - co
uld_l_earn_/Salaryý_and_vacancy_FAQs/p! edLjLm; jsessionid=a630a 1 759783s$3F
$AE$#36272.
PROVAN, D. and O'SHAUGNESSY, D. Recent advances in haematology. British Medical Joumal, 318,7189,991-4.
RXIANDALL, E. and SANJUR, D. (1981) Food preferences-their conceptualisation and relationship to consumption. Ecology of Food and Nutrition, 111,151-161.
RANDALL, G. and BROWN, S. (2001): Trouble at Home: Family Conflict, Young People and Homelessness. Crisis, London.
REALEAT (1999) The Realeat Survey 1984-1999 Changing Attitudes to Meat Consumption. The Haldane Foods Group, London.
REID R and HACKETT AF (1999) Changes in nutritional status in adults over Christmas, 1998. Journal of Human Nutrition and Dietetics 12,513-516.
REID, R. and HACKETT, A. (2001) A database of vegetarian convenience foods. British Food Joumal, 11,873-880.
RICHARDSON, A. and BUDD, T. (2003) Alcohol, crime and disorder: a study of young adults. Home Office Research, London.
203
ROBERTS, N. (2001) There's no place like home: an investigation into the
experiences of young homeless women in direct and non-direct entry
accommodation in Liverpool (Dissertation), Liverpool John Moores University.
ROBERTS S (2001) Can't Cook, Won't Cook. [online] Available at hftp: //
www. staffsunion. corrVdepartments/gkonline/articies/gk44/news/cantcook. htrn.
[Accessed 5 May 2003]
ROBINSON, F., MORRITZ, P., MCGUINESS, P. and HACKETT, A. F. (1997) A
study of the use of a photographic food atlas to estimate served and self-served
porbon sizes. Joumal of Human Nutrition and Dietetics, 10,117-124.
ROBSON, P. and LIVINGSTONE, M. (2000) An evaluation of food photographs as
a tool for quantifying food and nutrient intakes. Public Health Nutrition 3, (2) 183-
192.
ROSENSTOCK, I., STRECHER, V. and BECKER, M. (1988) Social learning
theory and the Health Belief Model. Health Education Q, 15,2,175-83.
ROTHENBERG, E., BOSAEUS, I., LERNFELT, B., LANDHAL, S. and STEEN, B.
(1998) Energy intake and expenditure: validation of a diet history by heart rate monitoring, activity diary and doubly labelled water. European Joumal of Clinical Nutrition, 52,832-838.
ROTTER J. (1975) Some problems and misconceptions related to the construct of internal versus external control of reinforcement. Journal of Consultant Clinical Psychology, 43,56-67.
SCHOFIELD, W., SCHOFIELD, C., and JAMES, W. (1985) Basal metabolic rate - review and prediction. Human Nutrition: Clinical Nutrition, 39(suppl. ) 1-96.
SHEPHERD, R. and DENNISON, C. M. (1996) Influences on adolescent food choice. Proceedings of the Nutrition Society, 55 (1 B) 345-57.
204

SHETTY, P. (2002) Nutrition through the lifecycle. [online] Available at
hftp: //www. rsc. org/pdf/books/nutritionsc. pdf (Accessed 9/01/05]
SHOELLER, D. (1995) Limitations in the assessment of dietary energy intake by
self-report. Metabolism, 44 (Suppl 2), 18-22.
SIRI, W. (1956) The gross composition of the body. In Advances in Biological and
Medical Physics (eds Lawrence, J. and Tobias, C. ), 239-280. Academic Press,
London.
SJOBERG, A. and HULTHEN, L. (2004) Assessment of habitual meal pattern and
intake of foods, energy and nutrients in Swedish adolescent girls: comparison of
diet history with 7-day record. European Joumal of Clinical Nutrition, 58,8,1181-9.
SORIANO, J. MOLT6, J., and MANES, J. (2000) Dietary intake and food pattern among university students. Nutrition Research, 20,9,1249-1258.
SPEAR, B. (2002) Adolescent growth and development. Journal of the American
Dietetic Association, 102,3, (Suppl. )S23-9.
SPURLOCK, M. (2004) Supersize Me. Samuel Goldwyn Films.
STANEK, K. ABBOTT, D. and CRAMER, S. (1990) Diet quality and the eating environment of preschool children. Joumal of the Ametican Dietetic Association, 11,1582-1584.
STITT, S., GRIFFITHS, G. and GRANT, D. (1994): Homeless and Hungry: The
evidence from Liverpool. Nutrition and Health. 9,275-287.
STORY, M. and RESNICK, M. (1986) Adolescents' views on food and nutrition. Journal of Nutrition Education, 18,4,188-192.
SULLIVAN, S. and BIRCH, L. (1994) Infant dietary experience and acceptance of solid foods. Pediatrics, 93,2,271-7.
205
THE GALLUP ORGANISATION (1995) Food, physical activity and fun: What kids
think. The American Dietetic Association National Centre for Nutrition and
Dietetics, The International Food Information Council and The President's Council
on Physical Fitness and Sports, Chicago.
TUFTS LONGITUDINAL HEALTH STUDY (2001) "Freshman fifteen" a myth?
[online] Available at httD: //enews. tufts. edu/stories/01 I 102Freshmani 5M)dh. htm.
Accessed 8 February 2003].
TOELLER, M., BUYKEN, A., HEITKAMP, G., MILNE, R., KLISCHAN, A., GRIES,
F., EURODIAB IDDIVI COMPLICATIONS STUDY GROUP (1997) Repeatability of three-day dietary records in the EURODIAM IDDM complications Study. European
Journal of Clinical Nutrition, 61,74-80.
TURNER, D. (1940) The estimation of the patient's home dietary intake. Joumal of the American Dietetic Association, 31,797-802.
UTTER, A., SCOTT, J., OPPLIGER, R., VISICH, P., GOSS, F., MARKS, B.,
NIEMAN, D. and SMITH, B. (2001) A comparison of leg-to-leg bioelectrical
impedance and skinfolds in assessing body fat in collegiate wrestlers. Journal of Strength cond res, 15,2,157-160.
VICTORIAN HOMELESSNESS STRATEGY (2001): Primary and acute responses to people who are homeless or at risk of homelessness. Department of Human Services, Victoria, Canada.
WARWICK, J., McILVEEN, H. and STRUGNELL, C. (1997) Food choices and the
younger generation. Joumal of Consumer Studies and Home Economics, 21,141 - 149.
WATERHOUSE J, BUCKLEY P, EDWARDS B and REILLY T. (2003) Measurement of, and some reasons for, differences in eating habits between night and day workers. Chronobiology International, 20,6,1075-92
206
WATKINS, G. (2003) Health Promoting University. [online] Available at
http: //www. uclan. ac. uk/facs/health/hpufindex. htm [Accessed 20 September 2004].
WEBB, G. (2002) Nutrition: A health promotion approach. Arnold, London.
WEIN, E., SABRY, J. and EVERS, F. (1990) Recalled estimates of food portion
size. Journal of the Canadian Dietetic Assosiation. 51,400-403.
WESTENHOEFER, J. (2005) Age and gender dependent profile of food choice. Forum Nutrition, 67,44-51.
WHYBROW, S. and KIRK, T. (1997) Nutrient intakes and snacking frequency in female students. Journal of Human Nutrition and Dietetics, 10,237-244.
WOODWARD, D. (1986) What influences adolescent food intake? Human
Nutrition: Applied Nutrition, 40A, 185-194).
WIEHL, D. (1942) Diets of a group of aircraft workers in Southern California.
Millbank Memorial Fund Quarterly, 20,329-366.
WILHELM AND CLARKE (1998) Eating disorders from a primary care perspective. [online] Available at hftp: //www. mja. com. au/public/mentalhealth/course/12wilheim. pdf. (Accessed 14 May 2004]
WIRFALT, E. (1998) Cognitive aspects of dietary assessment. Scandinavian Journal of Nutrition, 42,56-59.
WORLD CANCER RESEARCH FUND (1997) Food, Nutrition and the Prevention of Cancer: A Global Perspective. World Cancer Research Fund, London.
WORLD HEALTH ORGANISATION (1972): Nutritional Anaernias. Technical Report Series: 503. WHO, Geneva, Switzerland.
207
WORCESTER POLYTECHNIC INSTITUTE STUDENT HEALTH CENTRE (1999)
The Dreaded "Freshman Fifteen" [online] Available at
http: //www. wpi. eduiAdmin/Health/Info/fifteen. html). [Accessed 2 June 2003].
WRIGHT, J., RUBIN, B. and DEVINE, J. (1998) Beside the golden door policy, politics and the homeless. Aldine de Groyter, New York.
YOUNG, 1. (1993) Healthy eating policies in schools: an evaluation of effects on
pupils' knowledge, attitudes and behaviour. Health Education Journal, 52,1,3-9.
YUDKIN, J. (1956) Man's choice of food. Lancet, 1,645-649.
YUHAS, J., BOLLAND, J. and BOLLAND, T. (1989) The impact of training, food
type, gender and container size on the estimation of food portion size. Joumal of the American Dietetic Association. 89,1473-1477.
ZHAO, X. and YIN, S. (2004) Comparison of HemoCue with cyanmethemoglobin
method for estimating haernoglobin [online] Available at hftp: //www. ncbi. nlm. nih. gov/entrez/query. fcgi? cmd=Retrieve&db=pubmed&dopt=A bstract&list. [Accessed 29th March 2004].
208
6.0 APPENDICES
209
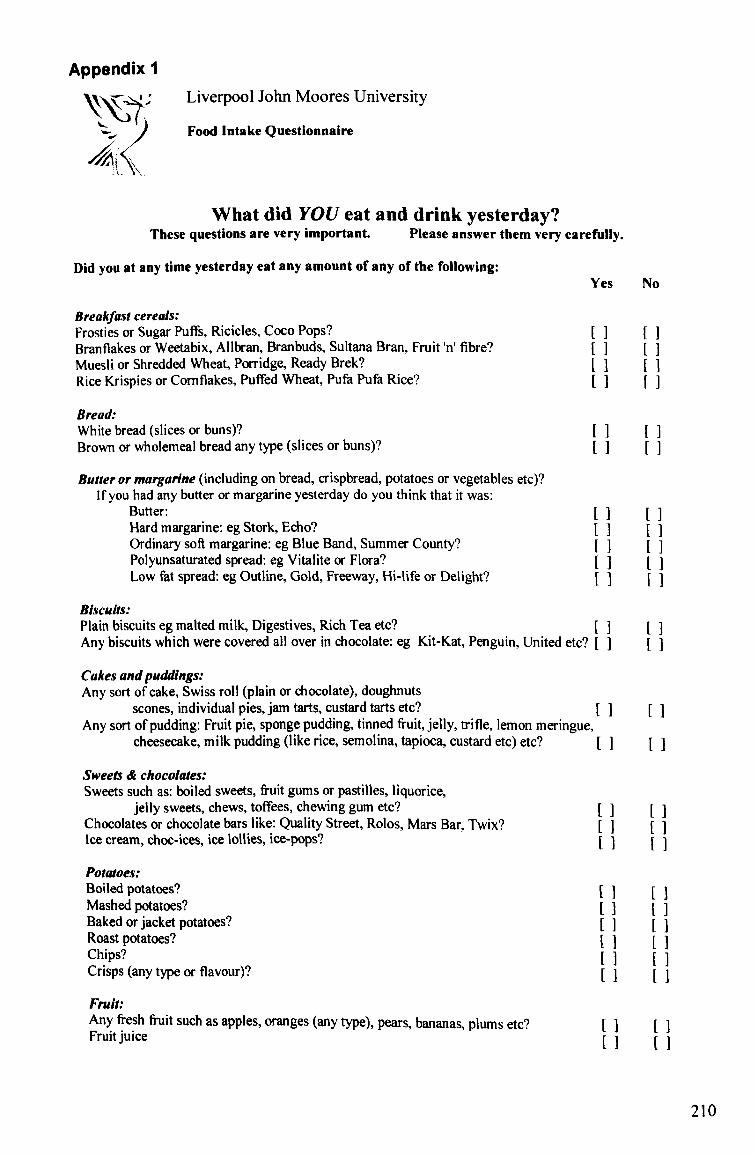
Appendix 1
Liverpool John Moores University
Food Intake Questionnaire
What did YOU eat and drink yesterday? These questions are very important. Please answer them very carefully.
Did you at any time yesterday eat any amount of any of the following: Yes
Breakfast cereals: Frosties or Sugar Puffs, Ricicles, Coco Pops? Branflakes or Weetabix, Allbran, Branbuds, Sultana Bran, Fruit'n' fibre? Muesli or Shredded Wheat, Porridge, Ready Brek? Rice Krispies or Comflakes, Puffed Wheat, Pufa Pufa Rice?
Bread. White bread (slices or buns)? Brown or wholemeal bread any type (slices or buns)?
Butter or margarine (including on bread, crispbread, potatoes or vegetables etc)? If you had any butter or margarine yesterday do you think that it was:
Butter: Hard margarine: eg Stork, Echo? Ordinary soft margarine: eg Blue Band, Summer County? Polyunsaturated spread: eg Vitalite or Flora? Low fat spread: eg Outline, Gold, Freeway, Hi-life or Delight?
Biscuits: Plain biscuits eg malted milk, Digestives, Rich Tea etc? Any biscuits which were covered all over in chocolate: eg Kit-Kat, Penguin, United etc?
Cakes and puddings: Any sort of cake, Swiss roll (plain or chocolate), doughnuts
scones, individual pies, jam tarts, custard tarts etc? Any sort of pudding: Fruit pie, sponge pudding, tinned fruit, jelly, trifle, lemon meringue,
cheesecake, milk pudding (like rice, semolina, tapioca, custard etc) etc?
Sweets & chocolates: Sweets such as: boiled sweets, fruit gums or pastilles, liquorice,
jelly sweets, chews, toffees, chewing gum etc? Chocolates or chocolate bars like: Quality Street, Rolos, Mars Bar, Twix? Ice cream, choc-ices, ice lollies, ice-pops?
Potatoes: Boiled potatoes? Mashed potatoes? Baked or jacket potatoes? Roast potatoes? Chips? Crisps (any type or flavour)?
Fruit. Any fresh fivit such as apples, oranges (any type), pears, bananas, plums etc? Fruit juice
No
210
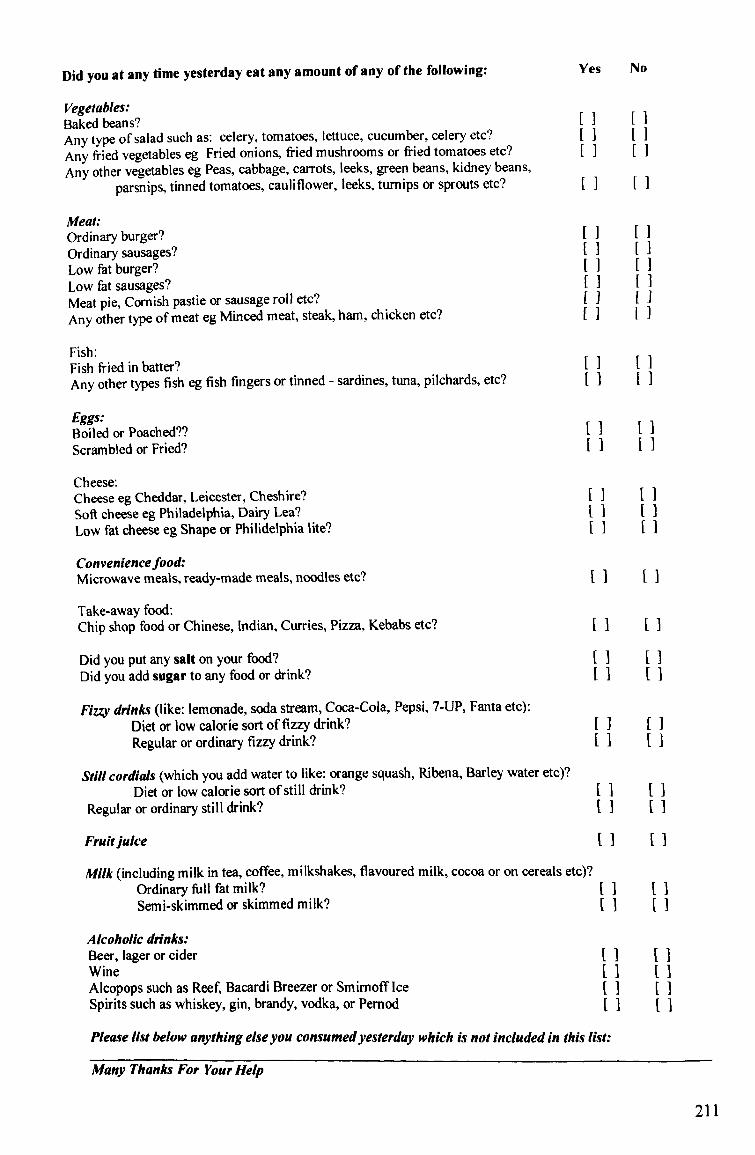
Did you at any time yesterday eat any amount of any of the following: Yes No
Vegetables: Baked beans? Any type of salad such as: celery, tomatoes, lettuce, cucumber, celery etc? Any fried vegetables eg Fried onions, fried mushrooms or fried tomatoes etc? Any other vegetables eg Peas, cabbage, carrots, leeks, green beans, kidney beans,
parsnips, tinned tomatoes, cauliflower, leeks, turnips or sprouts etc?
Meat: Ordinary burger? ordinary sausages? Low fat burger? Low fat sausages? Meat pie, Cornish pastie or sausage roll etc? Any other type of meat eg Minced meat, steak, ham, chicken etc?
Fish: Fish fried in batter? Any other types fish eg fish fingers or tinned - sardines, tuna, pilchards, etc?
Eggs: Boiled or Poached?? Scrambled or Fried?
Cheese: Cheese eg Cheddar, Leicester, Cheshire? Soft cheese eg Philadelphia, Dairy Lea? Low fat cheese eg Shape or Philidelphia lite?
Conveniencefood: Microwave meals, ready-made meals, noodles etc?
Take-away food: Chip shop food or Chinese, Indian, Curries, Pizza, Kebabs etc?
Did you put any salt on your food? Did you add sugar to any food or drink?
Fizzy drinks (like: lemonade, soda stream, Coca-Cola, Pepsi, 7-UP, Fanta etc): Diet or low calorie sort of fizzy drink? Regular or ordinary fizzy drink?
Still cordials (which you add water to like: orange squash, Ribena, Barley water etc)? Diet or low calorie sort of still drink?
Regular or ordinary still drink?
Frulijuice
Milk (including milk in tea, coffee, milkshakes, flavoured milk, cocoa or on cereals etc)? Ordinary full fat milk? Semi-skimmed or skimmed milk?
Alcoholic drinks: Beer, lager or cider Wine Alcopops such as Reef, Bacardi Breezer or Smimoff Ice Spirits such as whiskey, gin, brandy, vodka, or Pernod
Please list below anything else you consumedyesterday which is not included in this list:
Many Thanks For Your Help
211

Appendix 2
Liverpool John Moores University
DIET & HEALTH QUESTIONNAIRE
All your answers will be kept completely confidential. You are under no obligation to fill in this questionnaire.
1. Are you male or female? MII
2. 3.
4.
5.
6.
How old are you? - years
What are the occupations of your mother and/or father or guardian?
What is your employment status? Full-time student Part-time student Full-time employment Part-time employment Unemployed II What type of accommodation do you live in?
Shared, rented accommodation [] Student halls of residence Family Home Rent/lodge alone Hostel Own home [ Other (please state) How often do you exercise per week? (i. e. continuous physical activity for
more than 20 minutes which causes slight breathlessness/perspi ration) Every day []3 times a week [I Once a week [] Infrequently [] Never
Please state activities:
7. Do you smoke? No [I Yes []_Perday S. How much alcohol do you consume per week?
Tyl2e of drink NuMber consumed ger week Glass of wine Beer/cidertlager (112 pint) Spirits (single shot) Alcho-pop (1 bottle)
212

9. How often do you consume take-away meals? (i. e. Chinese, Indian, Fish & Chips etc. )
More than 3 times a week Once a week Once a fortnight Once a month Less than once a month Never
10. How often do you consume ready-to-eat convenience food?
(i. e. ready-meals, pizza, curries, fish fingers)
More than 3 times a week [I Once a week Once a fortnight Once a month [I Less than once a month [] Never
11. How healthy do you consider your diet and lifestyle to be?
Very unhealthy Moderately unhealthy Don't know
Moderately healthy
Very healthy
12. If you DO NOT currently live at home, do you think your diet is more healthy or less healthy than when you lived at home?
More healthy [I The same [I Less healthy
213
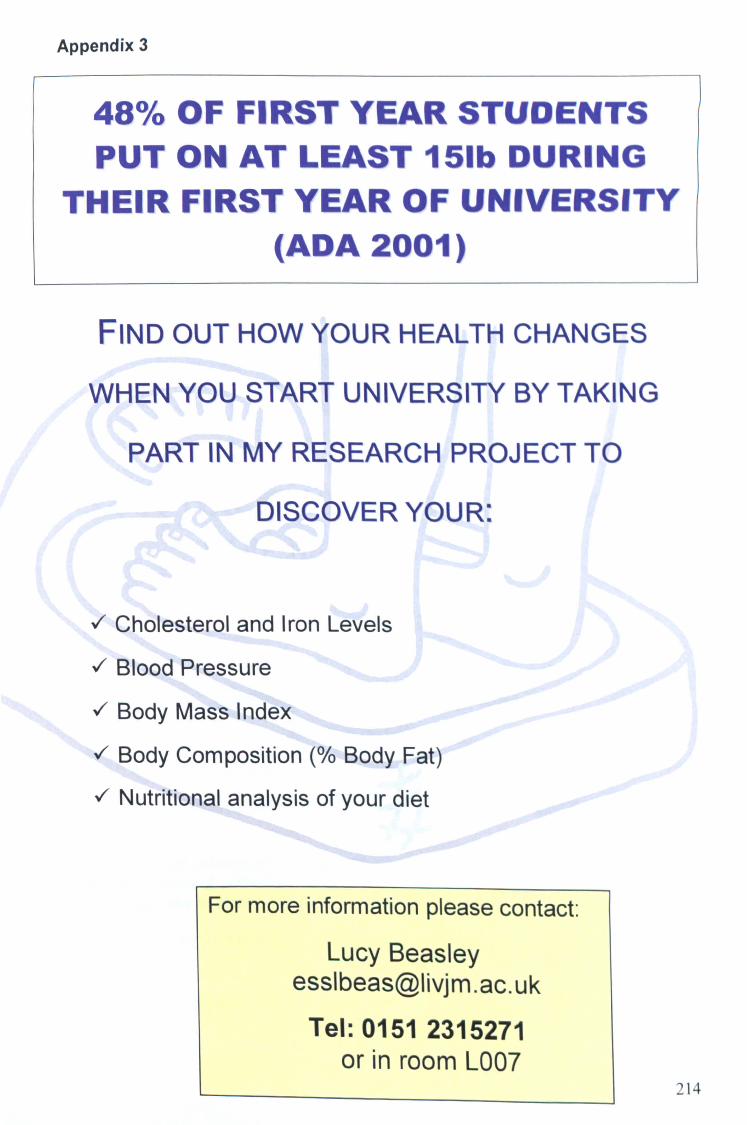
Appendix 3
48% OF FIRST YEAR STUDENTS PUT ON AT LEAST 151b DURING
THEIR FIRST YEAR OF UNIVERSITY (ADA 2001)
FIND OUT HOW YOUR HEALTH CHANGES
WHEN YOU START UNIVERSITY BY TAKING
PART IN MY RESEARCH PROJECT TO
DISCOVER YOUR: (( 64*4 rw*" -,, o L'
,/ Cholesterol and Iron Levels
-/ Blood Pressure
Body Mass Index
Body Composition (% Body Fat)
Nutritional analysis of your diet
For more information please contact:
Lucy Beasley essibeas@livjm. ac. uk
Tel: 0151 2315271 or in room L007
214
Appendix 4
II
II
IRST YEAPS EEDED 0
CANYO U SPAPE 15 M LN UTES VO P, A MEE HEALTH CHECK-. 151
FIND OUT:
Cholesterol and iron levels Blood pressure
Body composition (% f at) Nutritional analysis of your diet
This information is needed from first year students for a research project, which is investigating how your diet and health changes when you leave home. (Your results will be kept completely confidential).
FOR MORE INFORMATION PLEASE E-MAIL LUCY BEASLEY AT:
essibeas@livjm. ac. uk 215
Appendix 5
Liverpool John Moores University IM Marsh Campus
Barkhill Road Liverpool L17 6BD
2 01h July 2003
Dear Hostel Manager,
I am writing to invite your residents to take part in a new research project. The aim of the project is to look at the diet and nutritional status of young people who are temporary residents of homeless hostels. Very little research has been done to investigate the nutritional adequacy of the diets of young homeless people, although observational evidence suggests that many struggle to consume a diet which meets Dietary Reference Values. The results of the study will enable dieticians and other health professionals who work with the homeless to give better dietary advice than is currently available, and to adapt their advice to suit the specific needs of the homeless.
Participating in the study would involve recording resident's diet, height, weight, cholesterol and haemoglobin levels. In return, I will provide them with a nutritional breakdown of their average diet and advise them how to change their diet in order to improve their nutritional intake.
The study is based at Liverpool John Moores University, although I am working with hostels in all areas during July and August.
I quite understand if you would prefer not to take part in this study, but please give it a lot of thought first. The more people who take part, the more useful the results will be. If you would be interested in taking part in this project or would like some further information, please contact me on 07751580554, or e-mail ESSLBEAS@Iivjm. ac. uk.
Thank you for taking the time to read this letter you -
Yours sincerely,
Lucy Beasley
I look forward to hearing from
216
Appendix 6
PUP-POSE OF STUDY
Some evidence suggests that young people who have recently left home and are adapting to a different lifestyle often change their dietary habits considerably and consume large quantities of convenience food due to time constraints and lack of basic cookery skills and/or motivation to cook.
This study aims to look in detail at the dietary habits and nutritional status of young adults after leaving home
YOUP INVOLVEMENT IN THE STUDY
1) Measurements.
I will need to record your height, weight, and skinfolds. *
*Skinf old measurements are the measurement of a pinch of skin on your biceps and triceps which allows me to assess your body composition..
2) Blood pressure and f inger prick sample.
Taking your blood pressure simply involves a band being placed around your upper arm which squeezes then relaxes. The f inger prick blood sample does not hurt - the end of your f inger will be pricked with a clean pin, then 1 or 2 drops of blood are drawn off into capillary tubes.
If you do not want to do any of these tests, you do not have to. You can change your mind at any time.
It will take approximately 20 minutes to complete the measurements.
- Measurements will be taken at a time and place to suit you.
All information will be treated with confidentiality.
- You will be inf ormed if your results show anything which should be looked at by your GP.
217
Appendix 7
Form of Consent (To take part as a subject in a research project).
Consent of subject
1, (insert name) agree to take part in the study of diet and nutritional status of young adults after leaving home, which is currently being carried out at Liverpool John Moores University.
The details of the study have been explained to me verbally and in writing. I agree to the following measurements being taken:
1. Height 2. Weight
13. Bioelectrical impedance 4. Biceps skinfold 5. Triceps skinfold
16. Finger prick blood sample 17. Blood pressure ] 8. Keeping a record of all food and drink consumed over three days ] 9. Completion of questionnaire
(Please tick to indicate which procedures are acceptable to you)
It has been explained to me that I may stop participating, in whole or part, whenever I please, and in response to my wishes I will not be contacted further concerning the study.
I understand that all information will be treated confidentially.
Signed: Date:
218

Appendix 8
L 6veepooVjoýwv M oore* U n4ve*-sity
3 -DAY FOODIDIARY
NAME:
AVMESS:
7'EL:
F-MAIL:
SURVEY DAYS: I- 2. 3.
TWANXYOU FOR -rAXINQ ME TIMf'rO COMPLETIF TWIS FOOD DIARY.
IF YOU HAVE ANY PROBLEMS OR QUERIES, PLEASE CON"rAC-r:
LUCY BEASLEY ON 0151 231 5271 OIZO7751580554
OR F-MAIL
219

IMPORTANT - PLEASE PEAD THIS: Please write down the time, amount and description of ALL FOOO AM bR1 that you consume, including snacks, sweets and alcohol. Inaccurate recording of food and drink consumed often occurs when carrying out this type of research. To minimise this happening, it would be helpful if you could carry the diary with you at all times and write down everything as you eat and drink it. borO worry if it sounds really unhealthy on paper, it often looks worse than it is when you write everything down. Please record I day during the weekend and 2 days during the week. If you go out to pubs/clubs at least once a week, please record one of these days, and record all alcohol consumed. (Again, don't worry if it sounds a lot, it is just important that your information is representative of your normal eating/drinking habits). Give as much detail of the food/drink product as possible, such as brand name, low-fat, etc. Record any left-overs. (e. g. if you don't finish a drink, or if you leave the mi Ik from your cereal record how much is lef t. If you are unwell during any of the survey days, please give details at the back of this booklet.
EXAMPLE DAY
Time Food or Drink Amount Activities/ Comments
Sam Tesco muesli I cup Got up at 7.30am Milk (semi) to cover Orange 'uice pint
8.30am Walked to uni - medium pace 30 min Ilam Coffee (instant Mug Left I mug coffee
Caft Direct) Semi-skimmed milk bash
Ipm Ham salad 1 pre-packed Bought f rom canteen so exact sandwich sandwich quantities not known Banana medium Pepsicoke 500ml
4.30pm Walked home - medium pace 30 mins 5.10pm Tea (Clipper) -T pint
Milk (semi) bash 7pm Pasta with 4 oz dry weight
Tesco pesto 2 teaspoons fried courgette I & mushrooms 2 large
9pm Maltesers Standard pack Watched TV for 2hrs Strongbow 2x5OOml can cider
11.30pm I- Bed
220
Time Food or Drink Amount Activities/
Comments
221
Time Fo(xf or brink Amount Activities/
Comments
Were you unwell f or any of the survey days?
OR
Was there any other factor(s) that you feel af f ected or changed your appetite during the survey days?
If YES, please give details of any illness or other influential factor which resulted in a disturbance to your usual eating habits, and describe how your eating behaviour changed as a result of this.
Dgy I
bgy
Dgy 3
222