First-trimester maternal plasma cell-free fetal DNA and preeclampsia
Upload
khangminh22Category
view
0download
0
Strathmore University
SU+ @ Strathmore University Library
Electronic Theses and Dissertations
2016
The effect of free maternal health care
services on perceived quality of service
delivery at Nakuru Provincial General Hospital
Murima, John Mwangi
Strathmore Business School Strathmore University
Follow this and additional works at: https://su-plus.strathmore.edu/handle/11071/2474
Recommended Citation
Murima, J. M. (2016). The effect of free maternal health care services on perceived quality of service delivery at
Nakuru Provincial General Hospital (Thesis). Strathmore University. Retrieved from
http://su-plus.strathmore.edu/handle/11071/4583
This Thesis - Open Access is brought to you for free and open access by DSpace @Strathmore University. It has been accepted for inclusion in Electronic Theses and Dissertations by an authorized administrator of DSpace @Strathmore University. For more information, please contact [email protected]
i
THE EFFECT OF FREE MATERNAL HEALTH CARE SERVICES ON PERCEIVED
QUALITY OF SERVICE DELIVERY AT NAKURU PROVINCIAL GENERAL HOSPITAL
BY
JOHN MWANGI MURIMA
MBA HEALTHCARE MANAGEMENT
MBA-HCM/78988/13
A DISSERTATION SUBMITTED TO THE STRATHMORE UNIVERSITY BUSINESS
SCHOOL FOR A DEGREE OF MASTER OF BUSINESS ADMINISTRATION (MBA) IN
HEALTHCARE MANAGEMENT AT THE INSTITUTE OF HEALTHCARE
MANAGEMENT
2016

ii
DECLARATION
This MBA Dissertation is my original work and has not been submitted at any other university.
Signature……………………………… Date…………………………...
John Mwangi Murima
This Dissertation has been submitted with my approval as the supervisor:
Signature…………………………….. Date…………………….……
Prof. Gilbert O. Kokwaro
Director, Institute of Healthcare Management
Strathmore University Business School
iii
TABLE OF CONTENTS
DECLARATION .................................................................................................................................................... ii
LIST OF ABBREVIATIONS ................................................................................................................................. v
LIST OF TABLES ................................................................................................................................................. vii
LIST OF FIGURES ............................................................................................................................................. viii
ACKNOWLEDGEMENT .................................................................................................................................... ix
DEDICATION ........................................................................................................................................................ x
ABSTRACT ............................................................................................................................................................ xi
1.1 Background ...................................................................................................................................... 1
1.2 Problem Statement .......................................................................................................................... 3
1.4 Objectives ......................................................................................................................................... 4
1.4.1 General Research Objective ................................................................................................................ 4
1.4.1.1 Specific Objectives ............................................................................................................................. 4
1.4.1.2 Research Questions ........................................................................................................................... 4
1.3 Justification ...................................................................................................................................... 5
CHAPTER 2: LITERATURE REVIEW ................................................................................................................ 7
2.1 Quality of Healthcare ..................................................................................................................... 7
2.2 Measurement of Quality Healthcare ............................................................................................ 8
2.3 Maternal Healthcare ..................................................................................................................... 11
2.4 Maternal Healthcare Financing ................................................................................................... 13
2.5 Conceptual Framework ................................................................................................................ 16
CHAPTER 3: STUDY METHODOLOGY ......................................................................................................... 18
3.1 Study Site ........................................................................................................................................ 18
3.2 Study Design .................................................................................................................................. 18
3.3 Sample Size Calculation ............................................................................................................... 18
3.4 Inclusion Criteria ........................................................................................................................... 19
iv
3.5 Exclusion Criteria .......................................................................................................................... 19
3.6 Data Collection and Analysis ...................................................................................................... 19
3.7 Ethical consideration .................................................................................................................... 20
CHAPTER 4: RESEARCH FINDINGS ............................................................................................................. 21
4.1 Social-Demographic Characteristics ........................................................................................... 21
4.2 Physical and Organizational Resources ..................................................................................... 22
4.3 Process Compliance ...................................................................................................................... 25
4.4 Outcomes of the Free Maternity Services .................................................................................. 27
CHAPTER 5: DISCUSSION ............................................................................................................................... 30
5.1 Social Demographic Characteristics of Mothers delivering at NPGH .................................. 30
5.2 Physical and organizational resources to support the FMS .................................................... 31
5.3 Process Compliance ...................................................................................................................... 32
5.4 Main Outcomes of the FMS at NPGH ........................................................................................ 33
5.5 Study Limitations .......................................................................................................................... 34
CHAPTER 6: CONCLUSION AND RECOMMENDATIONS ...................................................................... 35
6.1 Conclusion ..................................................................................................................................... 35
6.2 Recommendations ......................................................................................................................... 35
REFERENCES ...................................................................................................................................................... 36
Annex 1: Participant Information and Consent From .................................................................................... 39
Annex 2: Questionnaire ...................................................................................................................................... 42
Annex 3: Facility Norms and Standards of Maternal Care delivery ............................................................ 47
Annex 4: Ethical Approval ................................................................................................................................. 52

v
LIST OF ABBREVIATIONS
ANC - Antenatal Care
BP - Blood Pressure
ENT - Ear Nose and Throat
FHR - Fetal Heart Rate
FMS - Free Maternity Services
FSB - Fresh Still Birth
GDP - Gross Domestic product
GOK - Government of Kenya
HB - Haemoglobin
HP - Hewlett-Packard
IOM - Institute of Medicine
IV - Intra Venous
KDHS - Kenya Demographic Health Survey
KHSSP - Kenya Health Sector Strategic and Investment Plan
MCH - Maternal Child Health
MDG - Millennium Development Goals
MOH - Ministry of Health
MMR -Maternal Mortality Rate
MTP - Medium Term Plan
NHA - National Health Accounts
NHSSP - National Health Sector Strategic Plan
NPGH - Nakuru Provincial General Hospital
PPH - Postpartum Hemorrhage
RRI - Rapid Response Initiatives
RVPGH – Rift Valley Provincial General Hospital
vi
SBA - Skilled Birth Attendant
SOPs - Standard Operating Procedures
SPSS - Statistical Package of Social Sciences
TBA - Traditional Birth Attendants
THE - Total Health Expenditure
UN - United Nations
UNFPA – United Nations Population Fund
WHO - World Health Organization

vii
LIST OF TABLES
Table 4.1: Age Distribution of mothers delivering at NPGH ................................................................ 21
Table 4.2: Educational level of mothers delivering at NPGH .............. Error! Bookmark not defined.
Table 4.3: Employment Status of mothers delivering at NPGH .......................................................... 22
Table 4.4: Satisfaction with the availability of Beds and Linen............................................................. 22
Table 4.5: Satisfaction with sanitary facilities in the ward .................................................................... 22
Table 4.6: Satisfaction with privacy and confidentiality ........................................................................ 23
Table 4.7: Organizational Resources ......................................................................................................... 24
Table 4.8: Physical Examination Complete .............................................................................................. 25
Table 4.9: RRI Theatre Sheet and in Use .................................................................................................. 27
Table 4.10: Length of Stay (LOS) at the Health facility .......................................................................... 27
Table 4.11: Recommendation of facility by the postnatal mothers....................................................... 28
Table 4.12: Repeat Facility Use .................................................................................................................. 28

viii
LIST OF FIGURES
Figure 2.1: Donabedian Quality Framework ............................................................................................. 8
Figure 2.2: Trends in maternal mortality ratio in Kenya, 1990-2013 .................................................... 12
Figure 2.3: The Iron Triangle in Healthcare ............................................................................................. 13
Figure 2.4: Healthcare Financing: Who pays in Kenya? ........................................................................ 14
Figure 2.5: Service Delivery; Key Human Resources ............................................................................. 16
Figure 2.6: The Conceptual Framework ................................................................................................... 17
Figure 4.1: Service Delivery Key Human Resources .............................................................................. 23
Figure 4.2: Signed Medical or Surgical Consent ..................................................................................... 25
Figure 4.3: Pain Relief Medication Prescribed ......................................................................................... 26
Figure 4.4: Partograph ................................................................................................................................ 26
Figure 4.5: Proportion of patients paying for services or commodities ............................................... 28

ix
ACKNOWLEDGEMENT
Immeasurable appreciation and deepest gratitude for the help and support are extended
to the following persons who in one way or another have contributed in making this
dissertation possible.
Prof Gilbert Kokwaro, Director Institute of Healthcare Management and my supervisor,
for the advice support, guidance, variable comments and suggestions and provisions that
benefited much in the completion and success of this study.
Members of the MBA – Healthcare Management Cohort One, for the group support and
the morale to complete the course work as well as this dissertation.
Mr Peter Waiganjo – Fellow MBA HCM Colleague for the encouragement and
assistance in developing the dissertation proposal
Ms Purity Gakero – Mwangi for her role as a link between myself and my supervisor
for this MBA dissertation.
Mr Stephen Lelei – A consultant with Delloitte Kenya for his assistance in the statistical
analysis of the data

x
DEDICATION
This book is dedicated to my mother Mrs Rahab Wanjiku Murima for inspiring me to
work hard in my studies since i was a young boy. It is also dedicated to my wife Wairimu
Mwangi and the children – Lorna, Nick and Bill.
xi
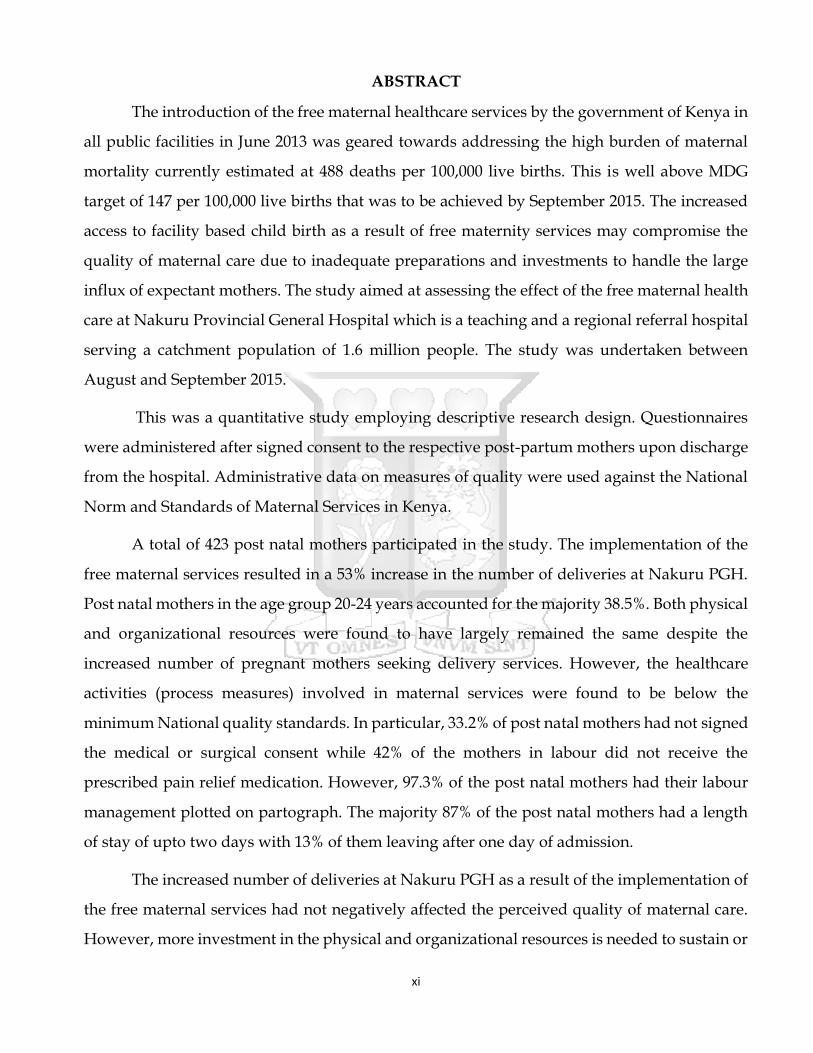
ABSTRACT
The introduction of the free maternal healthcare services by the government of Kenya in
all public facilities in June 2013 was geared towards addressing the high burden of maternal
mortality currently estimated at 488 deaths per 100,000 live births. This is well above MDG
target of 147 per 100,000 live births that was to be achieved by September 2015. The increased
access to facility based child birth as a result of free maternity services may compromise the
quality of maternal care due to inadequate preparations and investments to handle the large
influx of expectant mothers. The study aimed at assessing the effect of the free maternal health
care at Nakuru Provincial General Hospital which is a teaching and a regional referral hospital
serving a catchment population of 1.6 million people. The study was undertaken between
August and September 2015.
This was a quantitative study employing descriptive research design. Questionnaires
were administered after signed consent to the respective post-partum mothers upon discharge
from the hospital. Administrative data on measures of quality were used against the National
Norm and Standards of Maternal Services in Kenya.
A total of 423 post natal mothers participated in the study. The implementation of the
free maternal services resulted in a 53% increase in the number of deliveries at Nakuru PGH.
Post natal mothers in the age group 20-24 years accounted for the majority 38.5%. Both physical
and organizational resources were found to have largely remained the same despite the
increased number of pregnant mothers seeking delivery services. However, the healthcare
activities (process measures) involved in maternal services were found to be below the
minimum National quality standards. In particular, 33.2% of post natal mothers had not signed
the medical or surgical consent while 42% of the mothers in labour did not receive the
prescribed pain relief medication. However, 97.3% of the post natal mothers had their labour
management plotted on partograph. The majority 87% of the post natal mothers had a length
of stay of upto two days with 13% of them leaving after one day of admission.
The increased number of deliveries at Nakuru PGH as a result of the implementation of
the free maternal services had not negatively affected the perceived quality of maternal care.
However, more investment in the physical and organizational resources is needed to sustain or

xii
improve on the gains made in the quality of care offered. Similar studies are needed in other
facilities to come up context-specific recommendations to sustain the free maternity services.

1
CHAPTER 1: INTRODUCTION
1.1 Background
Maternal health refers to the health of a woman during pregnancy, childbirth and
postpartum period (WHO, 2014). The key objective of maternal healthcare is not only to ensure
no impairment of the health or death of the mother but also to ensure that every pregnancy
culminates in the delivery of a healthy baby (Say et al., 2014). Improving maternal health was
one of the eight Millennium Development Goals (MDG-5) adapted by the United Nations
member states in the year 2000 whereby countries committed themselves to reduce the
maternal mortality rates by three quarters (75%) by the year 2015 (Plan, 2008). Globally, an
average of 1000 maternal deaths occurs every day from preventable causes and 99% of which
occurs in the developing countries. Sub-Saharan Africa accounts for over 50% of these deaths
(Filippi et al., 2006).
Kenya has long suffered from high maternal morbidity and mortality rates. The most
recent estimates set the maternal mortality rate at 488 deaths per 100,000 live births, well above
the MDG target of 147 per 100,000 by 2015(KDHS 2009). For every woman who dies in
childbirth in Kenya, it is estimated that another 20-30 women suffer serious injury or disability
due to complications during pregnancy or delivery (Bourbonnais, 2013). Approximately 57%
of all deliveries in Kenya occur away from the health care facilities largely under the care of
traditional birth attendants who are ill-equipped to handle obstetric emergencies (KDHS, 2009).
A key strategy of reducing both materno-foetal morbidity and mortality is to improve
and promote a “health facility centered child birth” where expertise of qualified and skilled
health providers manage labour and complications plus availability of effective referral
systems for specialized care when needed (Filippi et al., 2006). In line with the Vision 2030 and
the 2010 constitution, the Kenya health sector has elaborated its Health Policy to guide
attainment of the long term health goals. The policy framework has an overarching goal, ‘to
attain the highest possible standard of health in a responsive manner’. The policy aim to achieve
this goal through supporting provision of equitable, affordable, and high-quality health and
related services at the highest attainable standards for all Kenyans (KHSSP 2014). However,
“perceived” quality of care being provided by traditional birth attendants (TBA’s) has been

2
identified as a major reason why pregnant mothers seek their care during delivery. Politeness,
pain relief by massaging mothers in labour and provision of hot beverages after delivery has
endured many pregnant mothers to these TBA’s. Financial, social, cultural and geographical
barriers to accessing care in these health facilities have largely contributed to maternal mortality
and morbidity (Kitui, Lewis, & Davey, 2013).
In addition to providing free maternal healthcare services, the public health sector
should also focus on quality of care by adopting the Donabedian model’s measurement
categories – structure, process and outcome which represent different characteristics of
healthcare services. Through this the health sector may realize increased health facility
deliveries and improved patient outcomes. Measures of structure evaluate the physical and
organizational resources available to support healthcare delivery (Spath, 2009). In respect to
maternal healthcare, this includes the number, skills, training and development of the health
work force, the number of equipment available, functional and in use, the laboratory testing
capabilities, availability and stock out of important medical supplies and referral capabilities.
Others include equipped operating theatres, intensive care units and medical waste disposal
capabilities.
Measures of process looks at whether activities performed during delivery of health care
services are delivered satisfactorily (Spath, 2009). In respect of maternal healthcare, these
include the available and use of standard clinical guidelines and protocols to manage obstetric
complications such as hemorrhage, pre-eclampsia and sepsis. The availability and use of
partographs to monitor progress of labour, use of infection prevention protocols and materno-
foetal clinical audits are also important process measures.
Measures of outcomes evaluate the results of healthcare services – the effect of structural
and process (Spath, 2009). In respect to maternal healthcare, these measures include the
maternal death rates, number and types of complications, the average length of inpatient stay
and customer satisfaction or patient experience. The recent implementation of the free maternal
healthcare services in the Kenyan public health facilities was a top – bottom policy directive.
The sudden upsurge of numbers of pregnant women seeking maternal healthcare services may
potentially strain the health facilities in terms of physical infrastructure, human resource, and

3
financial resources, thereby affecting the processes’ compliance which may eventually affect
the maternal healthcare outcomes.
The aim of this research study was to assess the effect of the free maternal care services
on perceived quality of service delivery at Nakuru Provincial General Hospital. These study
findings are expected to provide a better understanding of the challenges in delivering quality
care and form the basis of developing policies to support and sustain provision of quality free
maternal services.
1.2 Problem Statement
Improving maternal health was one of the eight Millennium Development Goals (MDG-
5) adopted by the United Nations member states that included Kenya. These countries
committed themselves to reducing the maternal mortality by three quarters by the year 2015
(Sambo & Kirigia, 2014). Kenya is one of these countries with the highest burden of maternal
deaths with a current maternal mortality ratio of 488 per 100,000 live births (Bourbonnais, 2013).
Kenya did not achieve the MDG – 5 target of 147 per 100,000 live births by September 2015.
Nakuru County is one of the 15 counties with the highest burden of maternal mortality rates of
374 per 100,000 live births (Summary Report of the Assessment of UNFPA 2014).
Approximately 57% of all maternal deliveries in Kenya occur away from the health care
facilities largely under the care of traditional birth attendants (TBAs) who are ill-equipped to
diagnose and manage obstetric complications (Macro, 2010). A key strategy of reducing both
feto-maternal mortality and morbidity is to improve and promote delivery at health facilities
where expertise of qualified and skilled health providers manage labour and complications
(Filippi et al., 2006). Approximately 51% of all health facilities in Kenya are owned and run by
the government (Muga, et al., 2005). Consequently, an increased access to these health care
facilities by pregnant mothers for antenatal care and delivery can greatly lower feto-maternal
mortality and morbidity. However, financial barriers tend to impede access to health care
services especially among those populations living in low resource settings (WHO., 2013). To
address this barrier and increase access to care in the public health facilities, the Kenya
Government introduced the free maternal healthcare services on the 1st June 2013 through a
presidential directive.
4
Increased access to the maternal services due to the introduction of the free maternity
services (FMS) in the absence of consummerate strengthening of the health system could have
resulted in lowered quality of care and inadvertently reduced confidence of the system hence
lower utilization. The introduction of the FMS resulted in a 22% increase in the utilization of
the maternal services (MOH., 2015). There was minimal input of new physical and organization
resources from the government before and after the implementation of the FMS. This could
have compromised the quality of the maternal care due to the utilization of the available
resources at the hospital level and this could have undermined the MOH health sector strategy
of lowering the MMR through increased health facility based deliveries.
1.4 Objectives
1.4.1 General Research Objective
The main objective was to evaluate the effect of free maternal healthcare services on the
perceived quality of service delivery at Nakuru Provincial General Hospital.
1.4.1.1 Specific Objectives
1. To determine whether the current physical and organizational resources available at
Nakuru Provincial General Hospital are sufficient to sustainably support delivery of
quality maternal healthcare services
2. To determine whether the delivery of maternal healthcare services at Nakuru Provincial
General Hospital meet the minimum care National Quality Standards.
3. To evaluate the effect of free maternal healthcare services at Nakuru Provincial General
Hospital on maternal outcome measures (e.g., the length of stay at the hospital)
These objectives were to help address the following research questions:
1.4.1.2 Research Questions
1. What are the minimum physical and organizational resources needed at Nakuru
Provincial General Hospital to sustainably support quality maternal healthcare services?
5
2. Are the current maternal services delivery at Nakuru Provincial General Hospital
complying with the set National quality Standards, and if not, how can they be
improved?
3. What are the outcomes measures of free maternal healthcare services at Nakuru
Provincial General Hospital since the introduction of the free maternity services, and
how can they be improved and sustained?
1.3 Justification
Improving maternal health was one of the eight Millennium Development Goals (MDG
5) adopted by the UN members states in the year 2000 whereby countries committed
themselves to reduce the maternal mortality rates by three quarters (75%) by the year 2015 (Plan
2008). Kenya still has unacceptably high maternal morbidity and mortality rates. The most
recent estimates set the maternal rate at 488 deaths per 100,000 live births, well above the MDG
5 target of 147 deaths per 100,000 live births by 2015 (KDHS, 2009). Kenya did not achieve MDG-
5 target (reduction of maternal mortality by three quarters) by September 2015 and therefore,
other innovative ways to achieve this goal are needed. The current maternal mortality rate for
Nakuru County is 374 per 100,000 live births (UNFPA, 2014).
Kenya has chosen a key strategy that has been adopted successfully by some countries
like Sri Lanka in reducing maternal fetal morbidity and mortality is improving and promoting
“health facility centered child birth “ where expertise of qualified and skilled health providers
manage labour and complications plus availability of an effective referral system for specialized
when needed (Filippi et., al. 2006).
However, financial barriers tend to improve access to healthcare services especially
among those populations living in low resource settings (WHO, 2013). To address the financial
barrier and increase access to care, the Kenya Government introduced and implemented free
maternal services in June 2013 which resulted in a 22% increase in the number of deliveries
(MOH., 2015). Implementation of free maternal services in absence of commensurate
strengthening of health system may have compromised the quality of maternal care and
therefore undermining the MOH health sector strategy of lowering the maternal mortality
through increased health facility based deliveries.

6
These study findings are expected to provide a better understanding of the challenges
in delivering quality care and form the basis of developing policies to support and sustain
provision of quality free maternal services.
7
CHAPTER 2: LITERATURE REVIEW
2.1 Quality of Healthcare
In its broadest sense, ‘quality” is an attribute of a product or service but there is no
existing universally accepted definition. However, various definitions share common elements;
that quality involves meeting or exceeding customer expectations and that it is dynamic and it
can be improved (Spath, 2009). However, most definitions of quality care contain two
components that are important to people seeking health care services. The first component is
providing care of high technical quality which implies that a patient receives only the
procedures, tests or services for which the desired health outcomes exceed the health risks and
that they are performed in a technically excellent manner. The second component of quality
care demands that all patients wish to be treated in a humane and culturally appropriate
manner and be allowed to participate fully in deciding about their therapy (Brook, et al., 2000).
In the health setting, the consumers, providers and payers (mainly insurance and
employers) may define healthcare quality from the perspective of their interests. To healthcare
consumers, quality care may imply the provision of right treatments and procedures that are
safe and guarantees good outcomes in a friendly, clean and pleasant environment. Healthcare
payers view quality in terms of cost-effectiveness implying their interests in the value of return
for their health care expenditures. For healthcare providers in addition to the consumer safety
and better outcomes at cost-effective environment, they are also concerned by potential threats
of legal liabilities (Spath, 2009).
In the United States, the institute of Medicine (IOM) has defined quality of care as the
degree to which health services for individuals and populations increase the likelihood of
desired health outcomes that are consistent with current professional knowledge (Medicine,
1990). It is imperative that this definition of quality care encompasses the interests of the
healthcare consumers, providers and payers. Although all healthcare professionals uphold the
principle “first, do no harm,” patients are occasionally harmed by caregivers’ actions or
inaction.
In the United States, the institute of medicine estimates that about 100,000 Americans die each
year as a result of preventable medical errors (Kohn, Corrigan, & Donaldson, 2000). One of the
8
main objectives of every healthcare organization is to reduce risk of patient harm occurring
during the delivery of care.
Historically, medical error prevention was essentially entrusted to individual healthcare
workers who were expected to do the “right thing–correctly–every time”. Therefore healthcare
organizations emphasized on training and hiring competent personnel believing that they will
make no or minimal mistakes and this was fundamentally a flawed concept. While recognizing
the importance of competent workforce in preventing medical errors, the truth is that most
medical errors occurs due to faulty work systems’ design and processes. Patients and
caregivers’ safety is a key pillar of quality care and therefore work systems’ designs and
processes must be examined to identify changes that can reduce the chances of medical errors.
These include medical waste segregation and safe disposal, availability and use of various
clinical guidelines and protocols. Where medical errors have occurred, a corrective action
should be taken to minimize the degree of harm and review of the processes done to prevent
the recurrence of the same in the future (Spath, 2009).
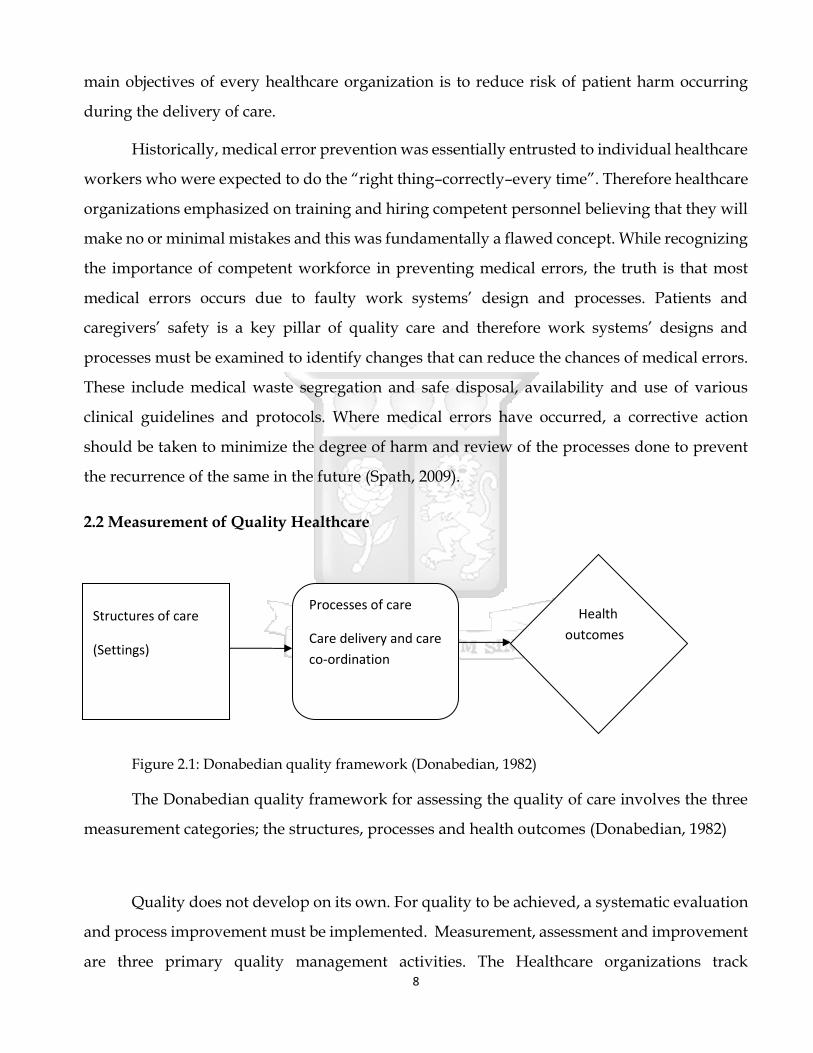
2.2 Measurement of Quality Healthcare
Figure 2.1: Donabedian quality framework (Donabedian, 1982)
The Donabedian quality framework for assessing the quality of care involves the three
measurement categories; the structures, processes and health outcomes (Donabedian, 1982)
Quality does not develop on its own. For quality to be achieved, a systematic evaluation
and process improvement must be implemented. Measurement, assessment and improvement
are three primary quality management activities. The Healthcare organizations track
Structures of care
(Settings)
Processes of care
Care delivery and care
co-ordination
Health
outcomes
9
performance through various measurement activities to gather information about the quality
of patient care and support functions. The results are then evaluated in the assessment step and
compared with the expected performance. If performance is acceptable, then continuous
measurement is advocated to avoid deterioration and if not acceptable appropriate action is
undertaken and then continuously measured to detect any improvement or none.
Measures of structure evaluate the physical and organizational resources available to
support healthcare delivery and therefore indirectly measures performance. The health
workforce is a key component of the organizational resources. The health workforce is defined
as the stock of all people engaged in actions whose primary intent is to enhance health (KHSSP,
2014). The rate of maternal mortality and morbidity is a measure of quality maternal care.
Sri Lanka, a non-industrialized country with limited resources, has largely succeeded in
reducing maternal mortality and morbidity. Key to this success was the strategy of free access
to maternal healthcare services and promoting facility deliveries under supervision of skilled
birth attendants. More than 98% of deliveries occur in health facilities and under skilled birth
attendants (Haththotuwa et., al, 2012). The Kenya government is currently pursuing a similar
strategy with free maternal health services in all public health facilities. However, for this
strategy to succeed in Kenya, the government requires to address the availability of appropriate
and equitability distribution of health workers, attraction and retention of healthcare providers,
improving institutional and health workers’ performance, and capacity building (KHSSP,
2014).
The promotion of facility based deliveries under skilled birth attendants also requires
major investment in the physical infrastructure. Availability of operating theatres, wards to
avoid bed sharing and general clean environment will improve the quality of care. Quality of
maternal healthcare services also requires availability of functional equipment. These include
radiological obstetric ultrasounds, Doppler scans and laboratory testing capabilities including
blood transfusion. Quality of maternal healthcare services require an effective and efficient
referral system with necessary logistical support provision such as mechanically sound and
equipped ambulances, drivers, fuel and communication channels.

10
A case study on assessing the trauma care at two Kenyan hospitals (Naivasha and Thika
District Hospitals) found that despite high volume of trauma cases, these hospitals did not have
adequate physical and organizational capabilities to handle the cases (Wesson et al., 2013).
These included lack of adequate theatre facilities, intensive care units, no mechanical
ventilators outside theatres and functional radiological equipment.
Measures of structure involve the measurement and assessment of the availability of
equipment, operating theatre, adequate space to ensure patient privacy, availability of
adequate numbers of functional and in use equipment that are easily accessed. Availability of
adequate essential supplies to support quality patient care is paramount. Laboratory tests
support to make diagnosis and patient progress including the availability of blood and blood
products especially in emergency situations. Health workers are a key component of structural
measures that includes the training and development, skill mix, adequate numbers, for
example nurse to patient ratio. A de-motivated and overworked healthcare workforce will
definitely affect the quality of care. The availability of all these resources must be evaluated
against the expected standards.
Governments through the relevant ministry responsible for healthcare or/and the
medical professional organizations have developed clinical practice guidelines and protocols.
These clinical guidelines and protocols are defined as systematically developed statements to
assist practitioners and patient decisions about appropriate healthcare for specific clinical
circumstances (Institute of Medicine, 1990). Guidelines and protocols are important to health
care quality improvement because they can reduce variations in practice and change physician
behavior to promote use of interventions supported by the best evidence available based on
current medical research and professional consensus (Spath, 2009). Adherence to these clinical
guidelines and protocols is an important process measure of quality of care.
In Kenya, national clinical guidelines and protocols are developed and published by the
ministry of health through a participatory process that includes professional bodies,
universities and private sector players. In maternal healthcare services, there are national
clinical guidelines on management of postpartum hemorrhage, eclampsia and puerperal sepsis
which are major cause of maternal mortality and morbidity. Patient management require

11
documentation of patient history (complains), physical examination findings, investigations
ordered and results, treatments given or procedures performed, and any complications
encountered. Measurement of processes involves evaluating the quality of this documentation
(completeness) including the compliance of signed patient informed consent forms and use of
partograph (graphical labour charting). Compliance to these clinical guidelines and protocols
by care givers is an important measure of quality care.
Measures of outcome evaluate the results of healthcare services – the effects of structure
and process. These include patient mortality (deaths) and complications (morbidity) rates to
identify opportunities for improvement. Outcome measures are also used to evaluate the
utilization of healthcare services. These include the average length of hospital stay and even
the average cost of treatment. Increase attention to the patient-centered healthcare has placed
greater emphasis on measuring a wide range of patient experiences. This is the framework that
was used to undertake the first national assessment of the FMS in Kenya in September 2014
(MOH., 2015).
2.3 Maternal Healthcare
Maternal healthcare refers to the health of women during pregnancy, childbirth and the
postpartum period which are believed to be the most dangerous days of her lifetime –
particularly for those women in the developing countries (WHO, 2013). Globally, an average of
1000 women die from preventable causes every day of which 99% occur in the developing
countries with sub-Sahara Africa accounting for 50% of these deaths (Filippi et al., 2006).
Maternal mortality and morbidity is higher among women living in low resource settings
particularly the young adolescents who face a higher risk of complications (WHO, 2013).
Improving maternal health was one of the eight Millennium Development Goals (MDG–
5) adopted by the United Nations Member States in the year 2000 when these countries
committed themselves to reduce maternal mortality by three quarters (75%) by the year 2015
(Filippi et al., 2006). The 2013 UN Millennium Development Goals (MDGs) progress report
showed that many regions of the world had made progress on the fifth goal of improving
maternal health. However, the region of Sub – Saharan Africa is still lagging behind and did
not meet the agreed targets of reducing by three quarters the maternal mortality ratio between
12
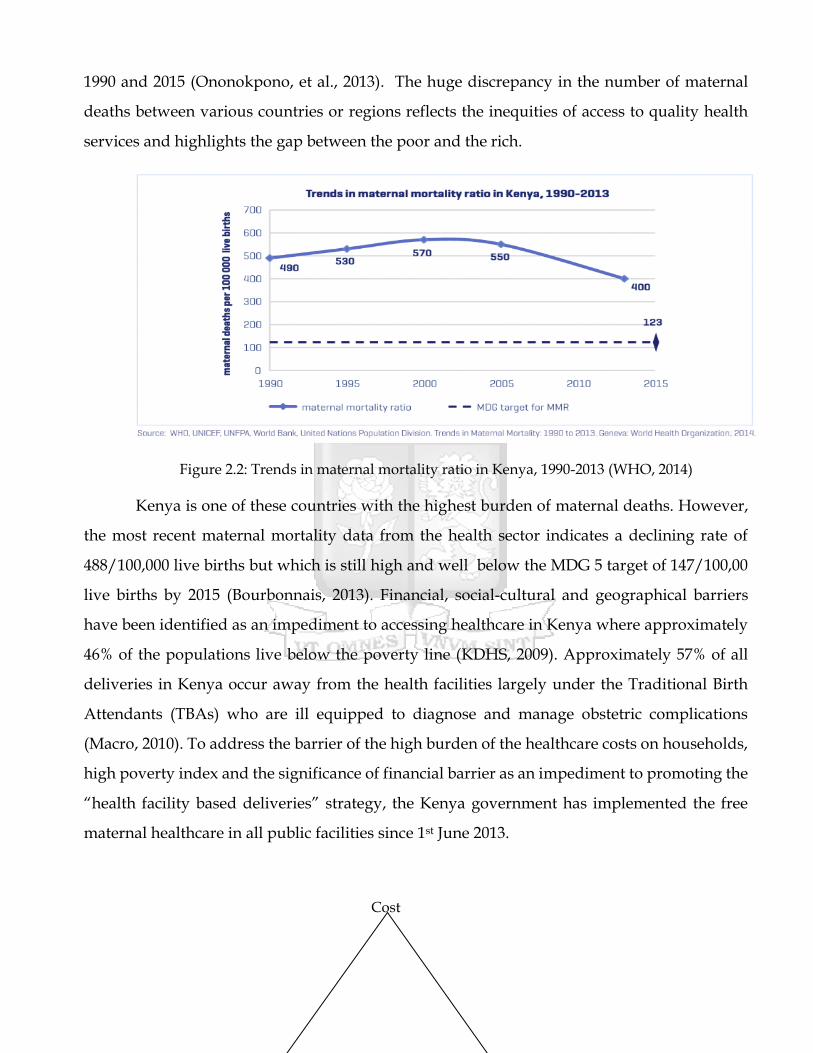
1990 and 2015 (Ononokpono, et al., 2013). The huge discrepancy in the number of maternal
deaths between various countries or regions reflects the inequities of access to quality health
services and highlights the gap between the poor and the rich.
Figure 2.2: Trends in maternal mortality ratio in Kenya, 1990-2013 (WHO, 2014)
Kenya is one of these countries with the highest burden of maternal deaths. However,
the most recent maternal mortality data from the health sector indicates a declining rate of
488/100,000 live births but which is still high and well below the MDG 5 target of 147/100,00
live births by 2015 (Bourbonnais, 2013). Financial, social-cultural and geographical barriers
have been identified as an impediment to accessing healthcare in Kenya where approximately
46% of the populations live below the poverty line (KDHS, 2009). Approximately 57% of all
deliveries in Kenya occur away from the health facilities largely under the Traditional Birth
Attendants (TBAs) who are ill equipped to diagnose and manage obstetric complications
(Macro, 2010). To address the barrier of the high burden of the healthcare costs on households,
high poverty index and the significance of financial barrier as an impediment to promoting the
“health facility based deliveries” strategy, the Kenya government has implemented the free
maternal healthcare in all public facilities since 1st June 2013.
Cost
13
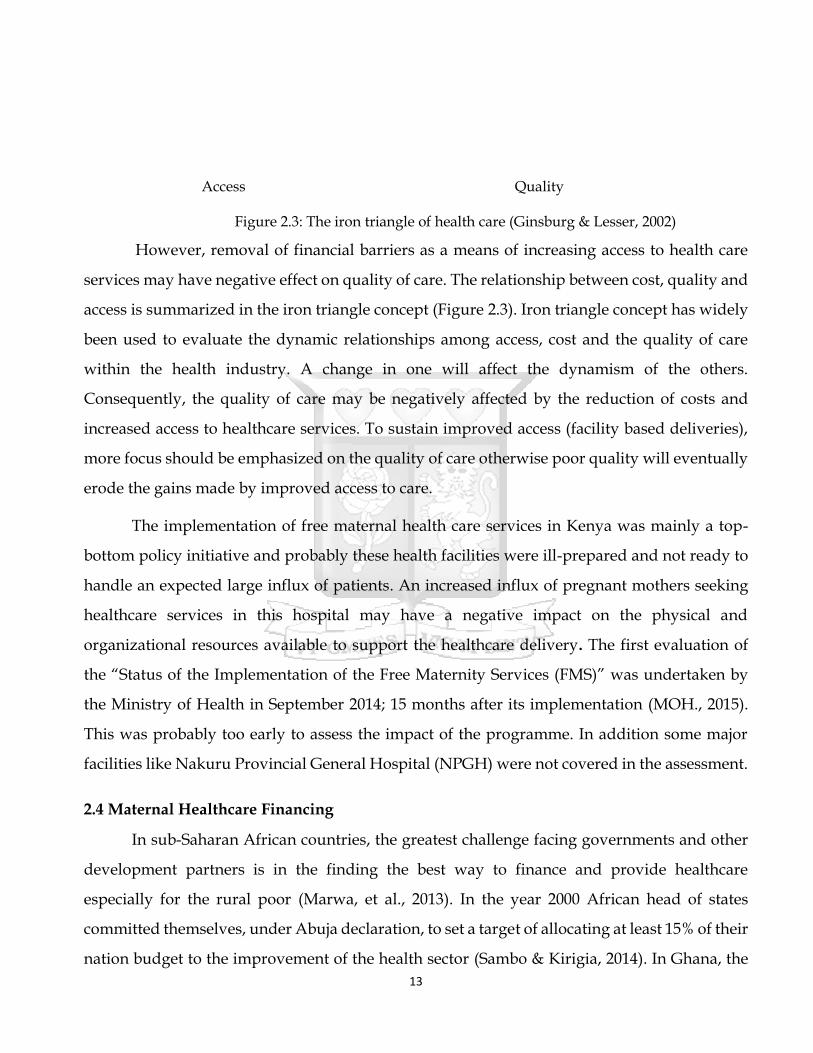
Access Quality
Figure 2.3: The iron triangle of health care (Ginsburg & Lesser, 2002)
However, removal of financial barriers as a means of increasing access to health care
services may have negative effect on quality of care. The relationship between cost, quality and
access is summarized in the iron triangle concept (Figure 2.3). Iron triangle concept has widely
been used to evaluate the dynamic relationships among access, cost and the quality of care
within the health industry. A change in one will affect the dynamism of the others.
Consequently, the quality of care may be negatively affected by the reduction of costs and
increased access to healthcare services. To sustain improved access (facility based deliveries),
more focus should be emphasized on the quality of care otherwise poor quality will eventually
erode the gains made by improved access to care.
The implementation of free maternal health care services in Kenya was mainly a top-
bottom policy initiative and probably these health facilities were ill-prepared and not ready to
handle an expected large influx of patients. An increased influx of pregnant mothers seeking
healthcare services in this hospital may have a negative impact on the physical and
organizational resources available to support the healthcare delivery. The first evaluation of
the “Status of the Implementation of the Free Maternity Services (FMS)” was undertaken by
the Ministry of Health in September 2014; 15 months after its implementation (MOH., 2015).
This was probably too early to assess the impact of the programme. In addition some major
facilities like Nakuru Provincial General Hospital (NPGH) were not covered in the assessment.
2.4 Maternal Healthcare Financing
In sub-Saharan African countries, the greatest challenge facing governments and other
development partners is in the finding the best way to finance and provide healthcare
especially for the rural poor (Marwa, et al., 2013). In the year 2000 African head of states
committed themselves, under Abuja declaration, to set a target of allocating at least 15% of their
nation budget to the improvement of the health sector (Sambo & Kirigia, 2014). In Ghana, the
14
government introduced the exemption policy in 2004 in both the private and public facilities
for child birth costs. This led to increased access and utilization of health services without
deterioration of the quality of maternal care. However, Ghana allocates an average of 5% the
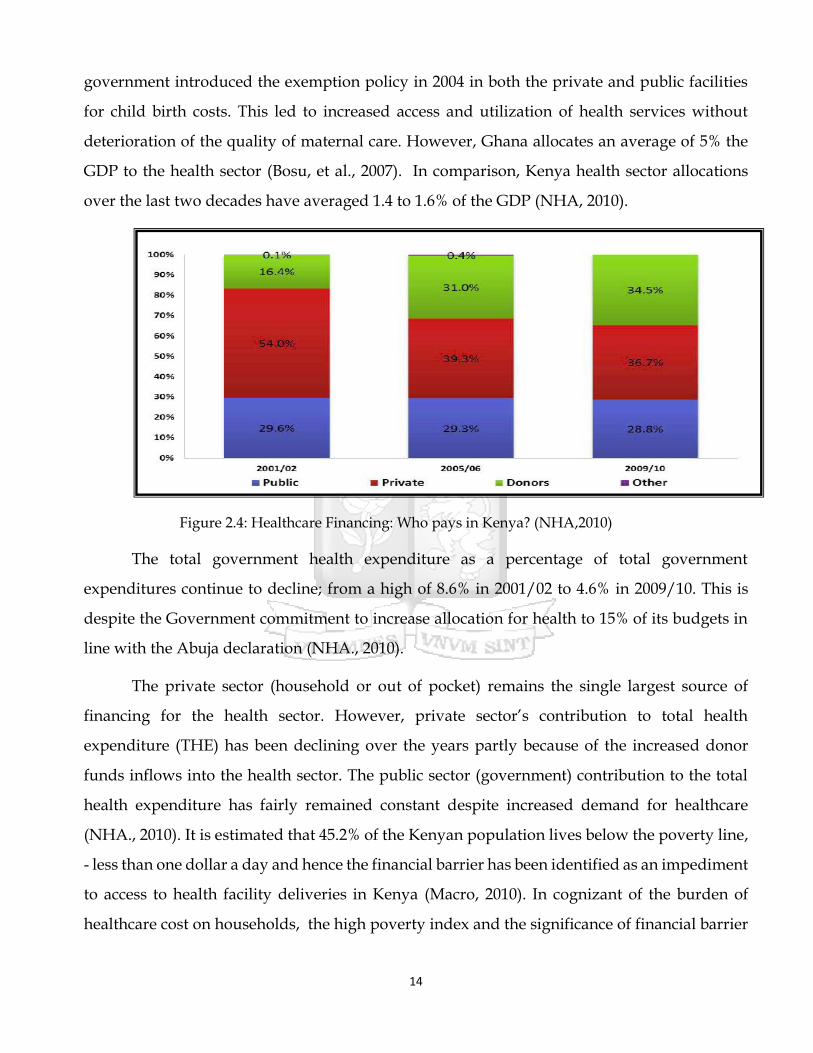
GDP to the health sector (Bosu, et al., 2007). In comparison, Kenya health sector allocations
over the last two decades have averaged 1.4 to 1.6% of the GDP (NHA, 2010).
Figure 2.4: Healthcare Financing: Who pays in Kenya? (NHA,2010)
The total government health expenditure as a percentage of total government
expenditures continue to decline; from a high of 8.6% in 2001/02 to 4.6% in 2009/10. This is
despite the Government commitment to increase allocation for health to 15% of its budgets in
line with the Abuja declaration (NHA., 2010).
The private sector (household or out of pocket) remains the single largest source of
financing for the health sector. However, private sector’s contribution to total health
expenditure (THE) has been declining over the years partly because of the increased donor
funds inflows into the health sector. The public sector (government) contribution to the total
health expenditure has fairly remained constant despite increased demand for healthcare
(NHA., 2010). It is estimated that 45.2% of the Kenyan population lives below the poverty line,
- less than one dollar a day and hence the financial barrier has been identified as an impediment
to access to health facility deliveries in Kenya (Macro, 2010). In cognizant of the burden of
healthcare cost on households, the high poverty index and the significance of financial barrier
15
as an impediment to access health facility deliveries, the Kenya government introduced free
maternity services effective 1st June, 2013 in all public health facilities.
The government of Bangladesh has a free maternity care policy in the public owned
healthcare facilities. However in their study findings, Nahar and Costello, were able to
demonstrate the presences of considerable hidden costs which were found to be a major
contributor to low utilization of ‘free’ maternity services especially among the low income
populations in Dhaka City, Bangladesh (Nahar & Costello, 1998).
Similarly, the possibility of hidden costs incurred by pregnant mothers seeking free
maternal care in the Kenyan public health facilities can be a barrier to a successful
implementation of this policy initiative. In the first comprehensive report by the MoH on the
status of implementation of free maternity services, 28% of pregnant mothers seeking delivery
services had reported to have paid some fees to access care (MOH., 2015).
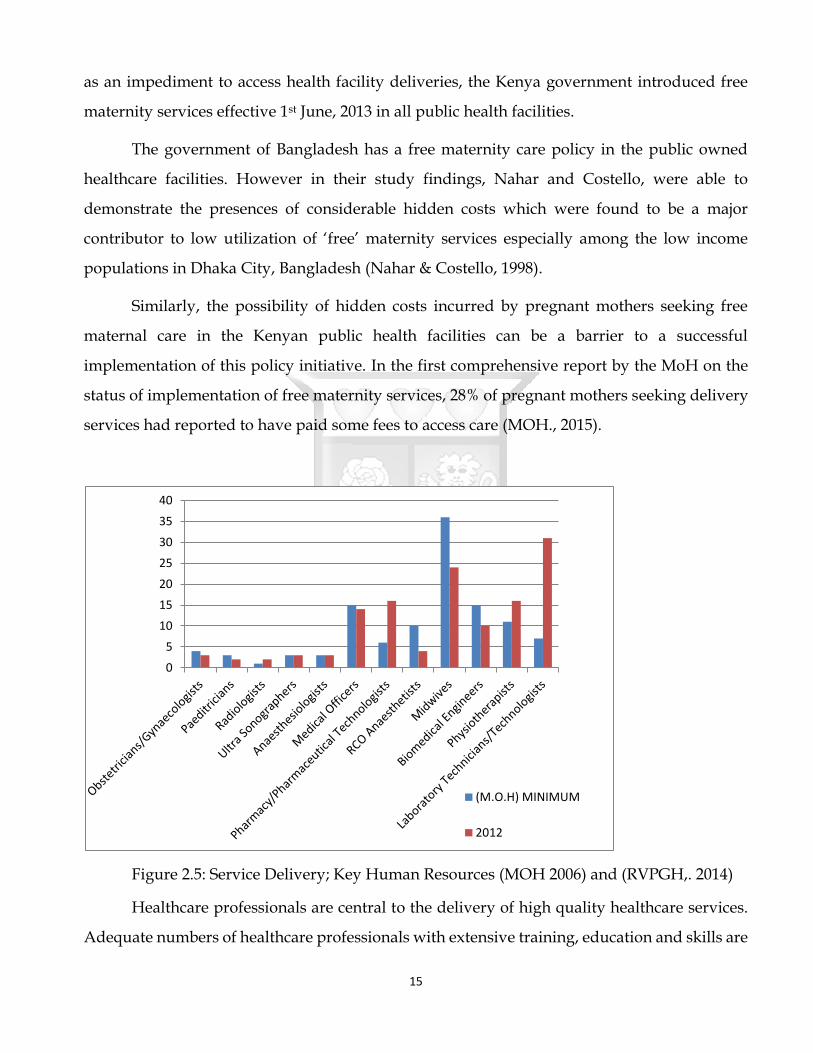
Figure 2.5: Service Delivery; Key Human Resources (MOH 2006) and (RVPGH,. 2014)
Healthcare professionals are central to the delivery of high quality healthcare services.
Adequate numbers of healthcare professionals with extensive training, education and skills are
0
5
10
15
20
25
30
35
40
(M.O.H) MINIMUM
2012
16
essential to meeting society’s needs for quality healthcare (Fried and Foller,. 2011). The Kenyan
healthcare system faces a variety of human resource problems primarily an overall lack of
personnel in key areas which is worsened by a large number leaving to work overseas. This
situation is worsened by inequitable distribution of health personnel between the urban and
rural areas (Ndetei, et al., 2008).
In response to this, the Kenyan Government has developed new standards to improve
working conditions in the health sector and retention of staff (Ndetei, et al., 2008). At NPGH
there is a clear shortage of key human resource available for maternal health services compared
against minimum standards of ministry of health for a level five hospital (MOH 2006 and
RVPGH, 2014). The Kenya government is currently pursuing the strategy of promoting facility
based deliveries through its policy of free maternal health services in the public facilities.
However, for this strategy to succeed the Kenya government needs to address the availability
of appropriate and equitable distribution of health personnel.
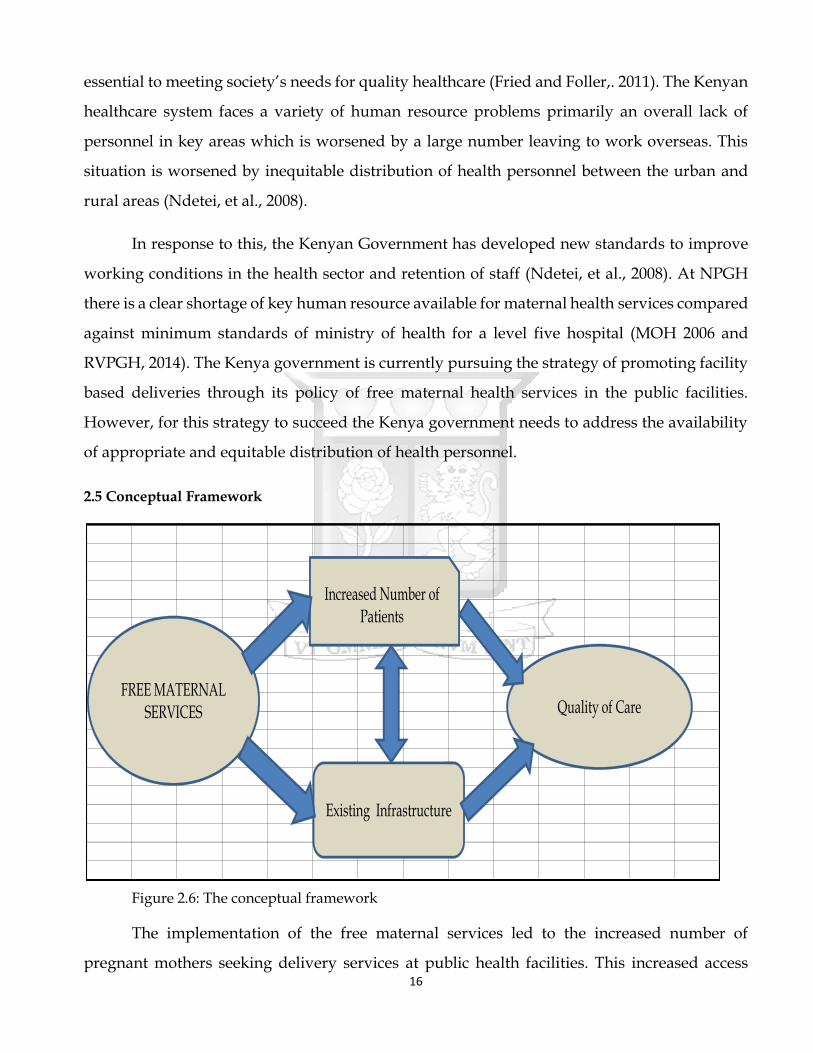
2.5 Conceptual Framework
Figure 2.6: The conceptual framework
The implementation of the free maternal services led to the increased number of
pregnant mothers seeking delivery services at public health facilities. This increased access
FREE MATERNAL SERVICES
Increased Number of Patients
Existing Infrastructure
Quality of Care

17
could have led to the straining of the existing infrastructure due to increased utilization. The
introduction of the free maternity services was a top-bottom policy directive by the government
which was meant to be implemented immediately. However, there was no immediate or prior
corresponding investment in both physical and organization resources by the government.
Consequently, the increased patient numbers and strained physical and organization resources
may have had an effect on the quality of maternal services being offered.
18
CHAPTER 3: STUDY METHODOLOGY
3.1 Study Site
This study was conducted at Nakuru Provincial General Hospital (NPGH) which a
teaching and referral hospital serving a primary catchment population of 1.6 million people. It
is a level five hospital and therefore a secondary referral facility. The maternal mortality rate in
Nakuru County is estimated at 374 per 100,000 live births (UNFPA,2014).
3.2 Study Design
This study was a quantitative research design whereby a questionnaire was
administered to the respective respondents. The respondents included pregnant mothers
visiting the hospital for delivery.
3.3 Sample Size Calculation
A representative sample/proportion of the large number of pregnant mothers seeking
delivery services at NPGH was calculated using the Cochran formulae.
n = Z2 pq
e2
Where;
n = sample size
Z2 = z – value for 95% confidence interval
e = is the desired level of precision (sampling error)
p = an attribute of the study population
q =1-P
= (1.96)2 (0.502) (1-0.502) = 384
(0.05)2
Where P = is the percentage of mothers delivering through skilled birth attendants. The
use of this attribute to maternal health is because of its relevance to the subject of study.
19
Documented value of the number of women in Kenya who utilize health facilities for delivery
currently stands at 50.2% (Liambila & Kuria, 2014).
The minimum sample size calculated was 384 patients at the point of discharge.
The study was a prospective study that used systematic sampling where samples were
picked on the Kth patient (5th patient) from the admission numbers at the point of discharge.
From the recent administrative data, an average of 1,100 deliveries per month was conducted
at NPGH. To achieve the representative sample and also due to the time constraint in the study,
the 5th patient was chosen to represent the Kth patient from the admission numbers at the
point of discharge. This approach only captured data on patient management processes and
outcome category of measures. It is imperative to note that the inpatient file numbering is
computer generated since the patient records were part of the electronic medical records. Data
on key human resource working and supporting the maternity services for year 2015 was the
administrative data as reported to the ministry of health. Data on key infrastructure resources
supporting the maternity services for the same years was also retrieved from the hospital
inventory.
3.4 Inclusion Criteria
3.4.1 Post natal mothers who had just delivered at the NPGH.
3.4.2 Post natal mothers who had agreed to give informed consent (annex 1)
3.5 Exclusion Criteria
3.4.3 Post natal mothers who had delivered elsewhere before coming to NPGH
3.4.4 Post natal mothers with mental incapacitation.
3.4.5 Post natal mothers who had declined to give informed consent (annex 1)
The study was undertaken between the months August and September of the year 2015
3.6 Data Collection and Analysis
Following informed consent (annex 1), the questionnaires (annex 2) were administered
to the 5th patient at the point of discharge after a careful selection of the number from the
computer generated admission numbers by the research assistants. The questionnaires were
administered by the research assistants. Due to the technicalities of certain information of which

20
the patient could not provide during the data collection, for example use of partographs for
labour management, the information was extracted from individual patient file. Once the data
had been collected the filled questionnaires were stored safely awaiting analysis. Structural and
process measures captured were compared against the National norms and standards of
maternal health care services (F. Health & Delivery, 2006) (annex 3).
The data analysis was done using SPSS and the data collected displayed using tables,
pie-charts and graphs. The data was quantitatively analyzed using descriptive statistics.
3.7 Ethical consideration
The research was approved by Strathmore University Ethical Review Committee (Annex
4). The patients participating in the study signed an informed consent before participating in
the study which clearly stipulated and outlined the benefits and challenges of the study.

21
CHAPTER 4: RESEARCH FINDINGS
The study was undertaken between August and September 2015. During this period a
total of 2,115 deliveries were conducted at Nakuru PGH. For the purposes of this study, 423
post natal mothers were enrolled into the study and interviewed.
4.1 Social-Demographic Characteristics
Table 4.1: Age Distribution of mothers delivering at NPGH
Age Group Frequency Percentage
15 - 19 61 14.4%
20 - 24 163 38.5%
25 - 29 103 24.3%
30 - 34 60 14.1%
35 - 39 30 7.1%
40 - 44 6 1.4% TOTAL 423 100.0%
Postnatal mothers within the age set 20 – 24 years constituted the highest proportion of
mothers (38.5%) enrolled in the study.
Table 4.2: Educational level of mothers delivering at NPGH
Education Level Frequency Percentage
No Education 9 2.1%
Primary 184 43.4%
Secondary 186 44.1%
College/University 44 10.4%
TOTAL 423 100.0%
Postnatal mothers who had attained at least the primary level of education of constituted
43.4% and those with secondary level of education and above constituted 54.5% of mothers
delivering at NPGH.
22
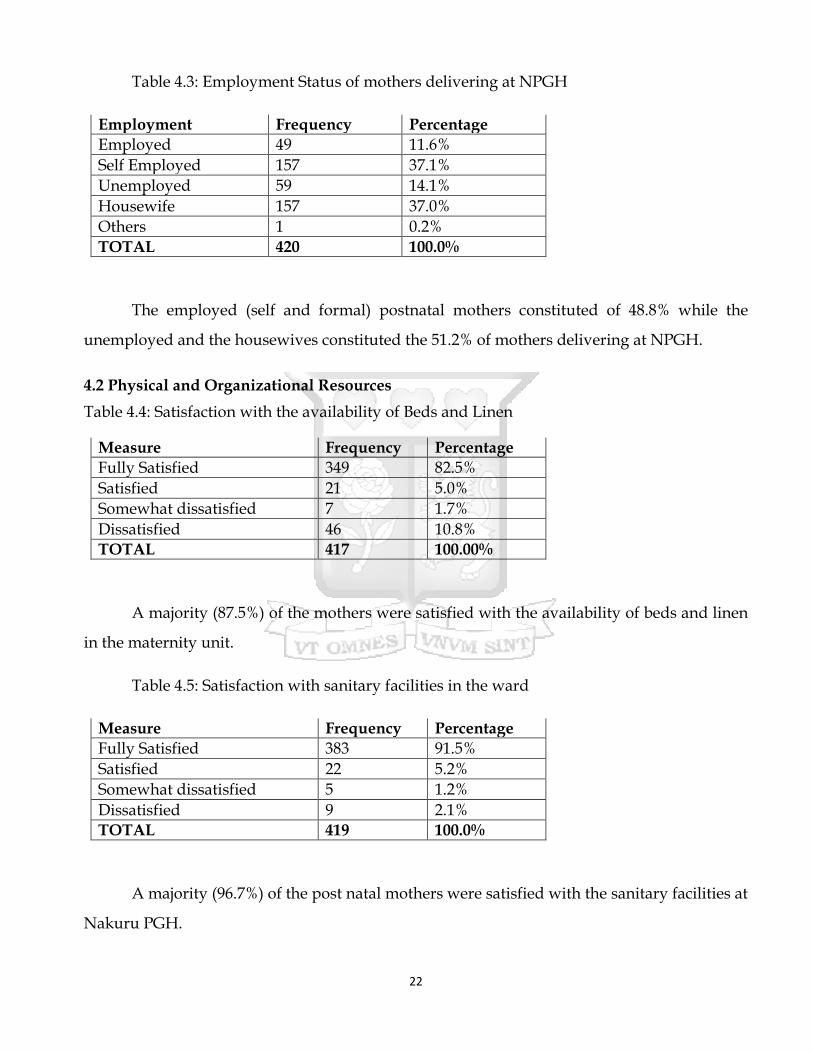
Table 4.3: Employment Status of mothers delivering at NPGH
Employment Frequency Percentage
Employed 49 11.6%
Self Employed 157 37.1%
Unemployed 59 14.1%
Housewife 157 37.0%
Others 1 0.2%
TOTAL 420 100.0%
The employed (self and formal) postnatal mothers constituted of 48.8% while the
unemployed and the housewives constituted the 51.2% of mothers delivering at NPGH.
4.2 Physical and Organizational Resources
Table 4.4: Satisfaction with the availability of Beds and Linen
Measure Frequency Percentage
Fully Satisfied 349 82.5%
Satisfied 21 5.0%
Somewhat dissatisfied 7 1.7%
Dissatisfied 46 10.8% TOTAL 417 100.00%
A majority (87.5%) of the mothers were satisfied with the availability of beds and linen
in the maternity unit.
Table 4.5: Satisfaction with sanitary facilities in the ward
Measure Frequency Percentage
Fully Satisfied 383 91.5%
Satisfied 22 5.2%
Somewhat dissatisfied 5 1.2%
Dissatisfied 9 2.1% TOTAL 419 100.0%
A majority (96.7%) of the post natal mothers were satisfied with the sanitary facilities at
Nakuru PGH.

23
Table 4.6: Satisfaction with privacy and confidentiality
Measure Frequency Percentage
Fully Satisfied 392 93.3%
Satisfied 20 4.8%
Somewhat dissatisfied 3 0.7%
Dissatisfied 5 1.2% TOTAL 420 100.0%
A majority (98.1%) of the post natal mothers felt that the hospital provided the much
needed privacy and confidentiality during the process of delivery.
Figure 4.1: Service delivery; Key Human Resource
In figure 4 above, shows the available key human resource involved in maternity
services in NPGH against the minimum staffing levels for a level five hospital. Midwives,
clinical officer anesthetists and obstetricians were below the minimum MOH standards. There
were no specialist radiologists and anesthetists. However, the number of medical officers,
physiotherapists and laboratory staff were above the minimum MOH requirement.
0
5
10
15
20
25
30
35
40
(M.O.H) MINIMUM
2015
24
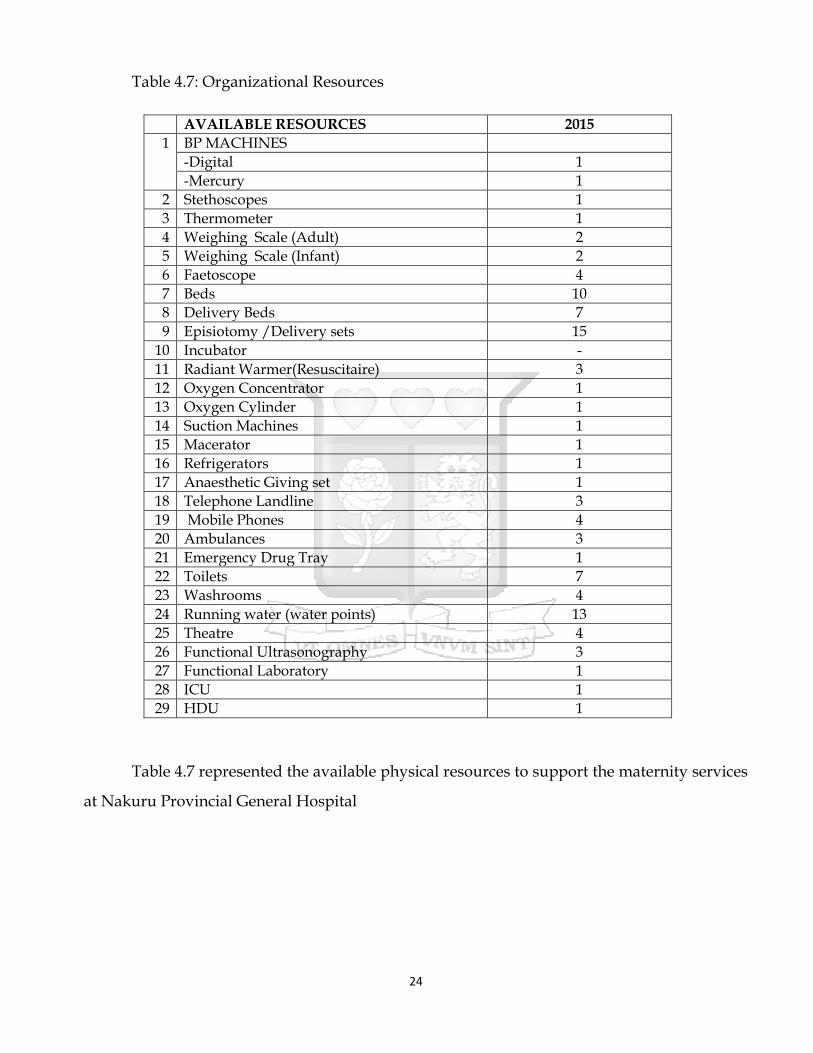
Table 4.7: Organizational Resources
AVAILABLE RESOURCES 2015
1 BP MACHINES
-Digital 1
-Mercury 1
2 Stethoscopes 1
3 Thermometer 1
4 Weighing Scale (Adult) 2
5 Weighing Scale (Infant) 2
6 Faetoscope 4
7 Beds 10
8 Delivery Beds 7
9 Episiotomy /Delivery sets 15
10 Incubator -
11 Radiant Warmer(Resuscitaire) 3
12 Oxygen Concentrator 1
13 Oxygen Cylinder 1
14 Suction Machines 1
15 Macerator 1
16 Refrigerators 1
17 Anaesthetic Giving set 1
18 Telephone Landline 3
19 Mobile Phones 4
20 Ambulances 3
21 Emergency Drug Tray 1
22 Toilets 7
23 Washrooms 4
24 Running water (water points) 13
25 Theatre 4
26 Functional Ultrasonography 3
27 Functional Laboratory 1
28 ICU 1
29 HDU 1
Table 4.7 represented the available physical resources to support the maternity services
at Nakuru Provincial General Hospital

25
4.3 Process Compliance
Figures 4.2 – 4.4 are signed medical or surgical consent, pain relief medication
prescribed, and the availability of partograph respectively. Tables 9 and 10 are summaries of
completeness of physical examination and availability of Rapid Response Initiative (RRI) sheets
respectively.
Figure 4.2: Signed Medical or Surgical Consent
A third of the admitted post natal mothers did not sign any consent form during their
maternity stay while the remaining two thirds signed which indicated non compliance of 33%
against the required 100%.
Table 4.8: Physical Examination Complete
Availability Frequency Percentage
Yes 101 23.9%
No 309 73.1%
Missing 13 3.1% TOTAL 423 100.0%
Only 23.9% of the post natal mothers had their physical examination complete compared
to 73% whose physical examination were incomplete which indicated a compliance of the same
percentage against the required 100%.

26
Figure 4.3: Pain Relief Medication Prescribed
Approximately half (46.6%) of the postnatal mothers admitted had pain relief
medications prescribed and given while 42.3% did not receive any pain relieving medication
with the latter representing the level of non-compliance against the required 100% compliance
Figure 4.4: Partograph
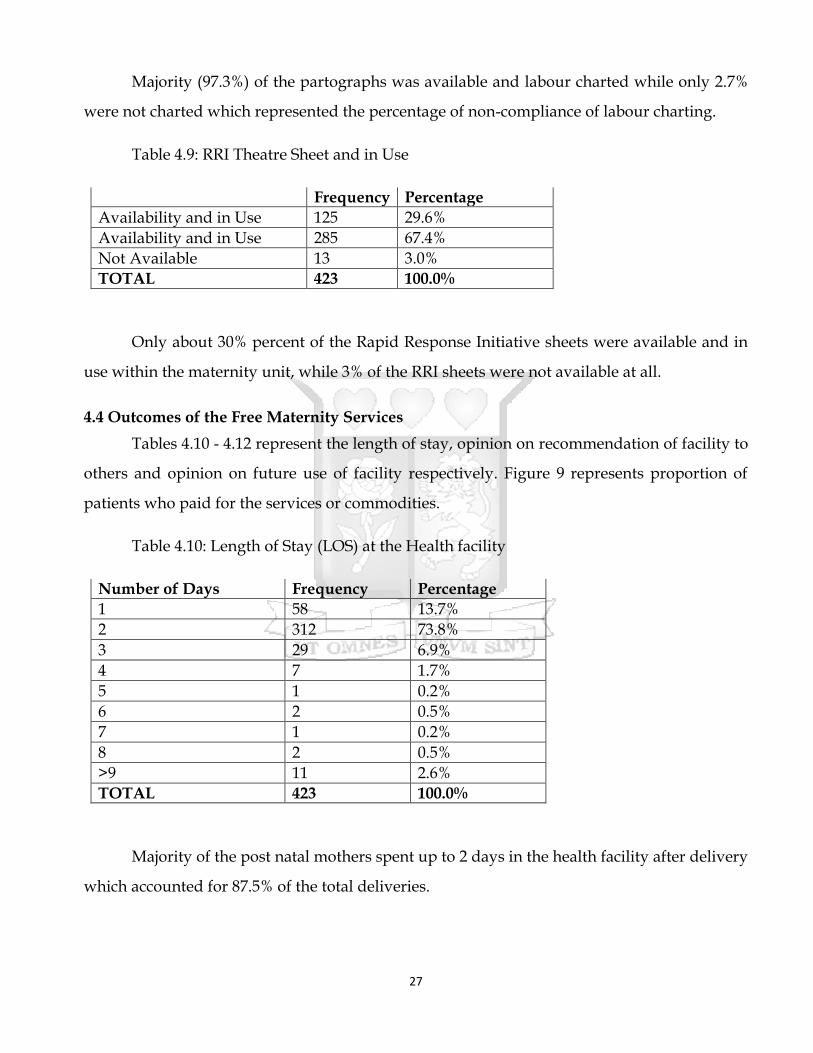
27
Majority (97.3%) of the partographs was available and labour charted while only 2.7%
were not charted which represented the percentage of non-compliance of labour charting.
Table 4.9: RRI Theatre Sheet and in Use
Frequency Percentage
Availability and in Use 125 29.6%
Availability and in Use 285 67.4%
Not Available 13 3.0%
TOTAL 423 100.0%
Only about 30% percent of the Rapid Response Initiative sheets were available and in
use within the maternity unit, while 3% of the RRI sheets were not available at all.
4.4 Outcomes of the Free Maternity Services
Tables 4.10 - 4.12 represent the length of stay, opinion on recommendation of facility to
others and opinion on future use of facility respectively. Figure 9 represents proportion of
patients who paid for the services or commodities.
Table 4.10: Length of Stay (LOS) at the Health facility
Number of Days Frequency Percentage
1 58 13.7%
2 312 73.8%
3 29 6.9%
4 7 1.7%
5 1 0.2%
6 2 0.5%
7 1 0.2%
8 2 0.5%
>9 11 2.6%
TOTAL 423 100.0%
Majority of the post natal mothers spent up to 2 days in the health facility after delivery
which accounted for 87.5% of the total deliveries.

28
Figure 4.5: Proportion of patients paying for services or commodities.
Majority (98.6%) of the post natal mothers did not pay for any services or commodity in the
facility.
Table 4.11: Recommendation of facility by the postnatal mothers
Recommend Frequency Percentage
Yes 413 97.6%
No 10 2.4% TOTAL 423 100.0%
Majority (97.6%) of the post natal mothers said that they would recommend and refer
the facility to someone else.
Table 4.12: Repeat facility use
Repeated Use Frequency Percentage
Completely Disagree 3 0.7%
Disagree 4 1.0%
Agree 283 66.9%
Completely Agree 132 31.2%
Do not Know 1 0.2%
TOTAL 423 100.0%

29
Only 1.7% of the post natal mothers said that they would not use the facility for the next
delivery while 98.1% would definitely come back for further services.

30
CHAPTER 5: DISCUSSION
5.1 Social Demographic Characteristics of Mothers delivering at NPGH
A total 2,115 pregnant mothers delivered at Nakuru PGH in the months of August and
September 2015 compared to 1,380 deliveries in the same period in 2012, reflecting a 53%
increase. A total of 423 mothers were interviewed for the same period for the purpose of this
study. Post natal mothers within the age set of 20 – 24 years comprised the majority (38.5%)
while those between 40 – 44 years comprised the least (1.42%).
These results are relatively comparable to those of the ministry of health while
evaluating the status of implementation of the free maternity services by the Government of
Kenya. It reported that 20 – 24 years age set comprised the majority (32.6%) and 40 – 44 years
had the least (1%) (MOH., 2015). In Kenya, women in the 20 – 24 years age set accounts for the
majority (20.2%) of all women within the reproductive age (15 – 49 years) (KDHS 2009). The
findings of this study are relatively comparable to those of the general demographic age
distribution.
An estimated 45.2% of the Kenyan population lives below the poverty line – less than
one dollar a day (KDHS, 2009). It is also important to note that house hold (out of pocket) has
over the last decade been the single largest (36.7% - 39.3%) source of healthcare financing in
Kenya (NHA, 2010). In a comprehensive assessment report on status of implementation of free
maternity services by the ministry of health, majority (42%) of post natal mothers had only
attained primary level of education (MOH., 2015). In this study majority (45.5%) of post natal
mothers had attained up to primary level of education while the largest proportion (51.2%)
were either unemployed or house wives. These findings corroborated the comprehensive
report by the MoH and therefore indicate how critical the FMS is among those pregnant
mothers seeking delivery services at NPGH.
31
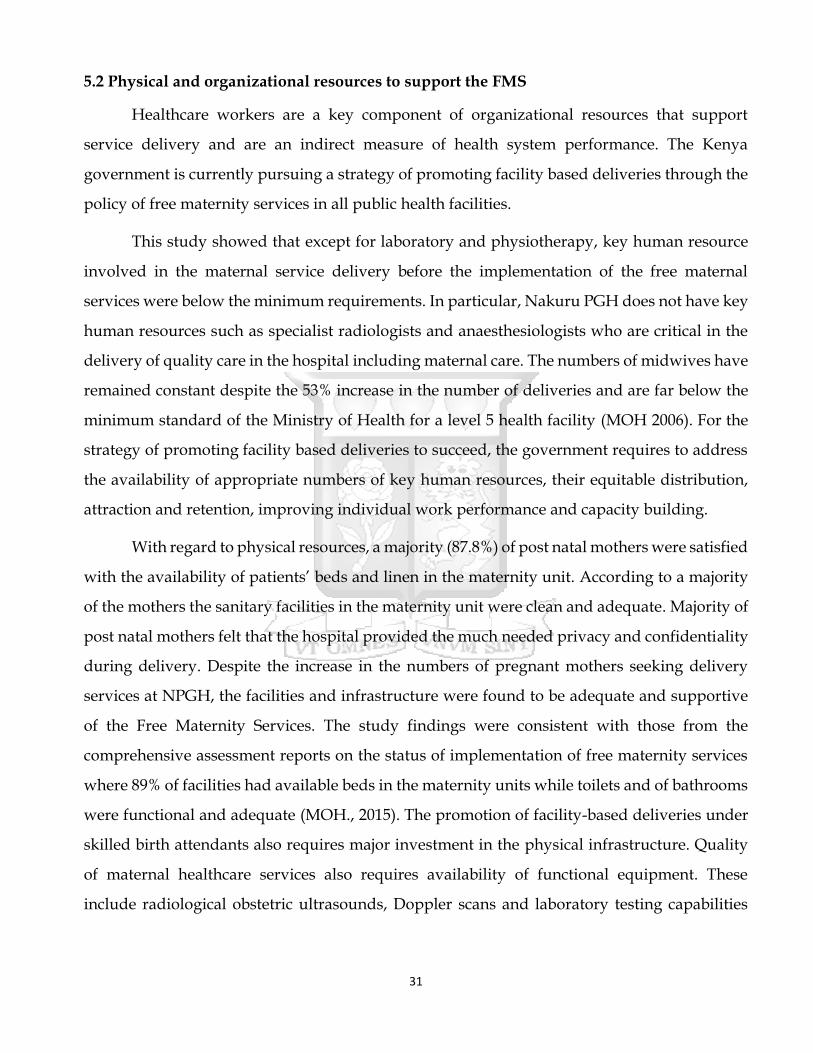
5.2 Physical and organizational resources to support the FMS
Healthcare workers are a key component of organizational resources that support
service delivery and are an indirect measure of health system performance. The Kenya
government is currently pursuing a strategy of promoting facility based deliveries through the
policy of free maternity services in all public health facilities.
This study showed that except for laboratory and physiotherapy, key human resource
involved in the maternal service delivery before the implementation of the free maternal
services were below the minimum requirements. In particular, Nakuru PGH does not have key
human resources such as specialist radiologists and anaesthesiologists who are critical in the
delivery of quality care in the hospital including maternal care. The numbers of midwives have
remained constant despite the 53% increase in the number of deliveries and are far below the
minimum standard of the Ministry of Health for a level 5 health facility (MOH 2006). For the
strategy of promoting facility based deliveries to succeed, the government requires to address
the availability of appropriate numbers of key human resources, their equitable distribution,
attraction and retention, improving individual work performance and capacity building.
With regard to physical resources, a majority (87.8%) of post natal mothers were satisfied
with the availability of patients’ beds and linen in the maternity unit. According to a majority
of the mothers the sanitary facilities in the maternity unit were clean and adequate. Majority of
post natal mothers felt that the hospital provided the much needed privacy and confidentiality
during delivery. Despite the increase in the numbers of pregnant mothers seeking delivery
services at NPGH, the facilities and infrastructure were found to be adequate and supportive
of the Free Maternity Services. The study findings were consistent with those from the
comprehensive assessment reports on the status of implementation of free maternity services
where 89% of facilities had available beds in the maternity units while toilets and of bathrooms
were functional and adequate (MOH., 2015). The promotion of facility-based deliveries under
skilled birth attendants also requires major investment in the physical infrastructure. Quality
of maternal healthcare services also requires availability of functional equipment. These
include radiological obstetric ultrasounds, Doppler scans and laboratory testing capabilities
32
including testing of blood for transfusion. Availability of operating theatres, wards to avoid
bed sharing and general clean environment will improve the quality of care.
The findings from this study, there was inadequate equipment required for a level five
facility. The available equipment were far below the minimum requirement according to the
norms and standards of the ministry of health. These findings were consistent with those in the
comprehensive report on the status of implementation of free maternity services (MOH., 2015).
Quality of maternal healthcare services require an effective and efficient referral system
with necessary logistical support provision such as mechanically sound and equipped
ambulances, drivers, fuel and communication channels. From this study, the hospital had 3
ambulances and mobile phones available to the key personnel involved in maternity services.
These resources can empower the referral system from both peripheral and tertiary hospitals,
and enhance consultations with medical specialists.
5.3 Process Compliance
Historically, medical error prevention was essentially entrusted to individual healthcare
workers who were expected to do the “right thing–correctly–every time”. While recognizing
the importance of competent workforce in preventing medical errors, the truth is that most
medical errors occurs due to faulty work systems’ design and processes (Spath, 2009). Patients
and caregivers’ safety is a key pillar of quality care and therefore work systems’ designs and
processes must be examined to identify changes that can reduce the chances of medical errors.
In this study, the majority (73.1%) of post natal mothers had incomplete physical
examination while a third (33.2%) had not signed medical or surgical consent. A significant
proportion (42%) of the pregnant mothers in labour did not receive the prescribed pain relief
medication. In contrast, 97.3% of the post natal mothers had their labour management plotted
on partographs. Patient management requires documentation of patient history (complains)
physical examination findings, treatments given or procedures performed, and any
complications encountered.

33
The study findings on partograph availability and use in the management of labour were
consistent with finding with the comprehensive assessment report on status of implementation
of free maternity services (MOH., 2015).
Although all healthcare professionals espouse the principle “first, do no harm”, patients
are occasional harmed by caregiver’s action or inaction. Despite the continued efforts by
healthcare organizations to improve patient safety, potentially avoidable safety problems still
exist. One of the broad quality improvement aims of every healthcare organization must be to
make care safer by reducing harm caused during the delivery of care (Spath, 2009). One of the
requirements of the National Quality Standards of healthcare delivery in Kenya is the use of
Rapid Response Initiative (RRI) template to fast track the patient movement and care points in
order to identify and mitigate care points and processes that require immediate attention and
improvement in the process of care delivery.
From this study, the RRI theatre sheet use, only 30.5% of the RRI sheets were available
and in use in the maternity unit. Therefore, there is a huge gap (69.5%) in complying with the
National Quality Standards on use of RRI sheet which might compromise the quality of
maternal care provided.
5.4 Main Outcomes of the FMS at NPGH
From this study, 87% of the postnatal mothers had a length of stay of upto two days,
with 13% of them leaving after one day of admission. Before the implementation of the free
maternity services the average length of stay was 6 days (RVPGH,. 2014). According to the
Health Sector Annual report 2009 by the Ministry of Health reported an average length of stay
of 5.4 days for rift valley province where NPGH is situated against a national average of 6.8
days (DHIS, 2010). Most postnatal mothers remained in the maternity wards after the delivery
and discharge or awaiting settlement of the medical bills. It is therefore apparent that
implementation of the free maternity services has significantly contributed to the reduction of
the average length of stay.
From a study findings in Bangladesh considerable hidden costs which were found to be
a major contributor to low utilization of ‘free’ maternity services especially among the low
income populations in Dhaka City, Bangladesh (Nahar & Costello, 1998). From the findings of
34
this study 98.5% of the post natal mothers reported to not having paid for any service or
commodity while in the facility. However 1.4% of the post natal mothers reported to have paid
for either a service or a commodity. A comprehensive assessment report by the ministry of
Health on status of implementation of free maternal services 28% of the postnatal mothers
reported to have paid for a service or commodity (MOH., 2015).
A majority (97.8%) of the postnatal mothers reported that they would recommend this
facility to somebody else seeking maternity and delivery services. A majority (98.1%) of post
natal mothers reported that they would use this facility for future deliveries. From this study,
the post natal mothers who delivered at NPGH derived value from the maternity services
offered. Value is defined as the quality of services against the costs incurred for the services,
Therefore, the fact that over 98% of the post natal mothers would themselves use the facility
again for future deliveries and also recommend others for the same services means that they
received good quality of care met or surpassed their expectations.
5.5 Study Limitations
Despite the possibility of introduction of bias by being a staff at the Nakuru Provincial
General Hospital, i recruited research assistants to collect the study data hence minimizing the
possibility of bias.
35
CHAPTER 6: CONCLUSION AND RECOMMENDATIONS
6.1 Conclusion
From the perspective of the postnatal mothers at the NPGH, the perceived quality of
service delivery was not affected by the implementation of the free maternal health care
services. However, this state of affairs may not be sustained unless the recommendations listed
below are acted upon
6.2 Recommendations
Based on the key conclusion of this study, the following are the key recommendations
to address the gaps identified:
1) The national quality standards of care that were last updated in 2006 need to be revised
and updated as a matter of urgency.
2) The County government needs to consider recruiting more health care workers involved
in the delivery of maternal care. There is a need to also invest in skills and capacity
building for the health care workers to improve on the processes performance in the
delivery of maternal care such as consent signing, providing prescribed medications
3) The County government needs to prioritize investment in equipment to efficiently and
effectively improve the provision of high quality maternal health care.
4) The County government of Nakuru needs to continuously safe guard and build on the
quality care gains and positive outcomes already realized from the implementation of
the free maternity services.

36
REFERENCES
Bosu, W., Bell, J. S., Armar-Klemesu, M., & Tornui, J. A. (2007). Effect of delivery care user fee
exemption policy on institutional maternal deaths in the central and volta regions of
ghana. Ghana Medical Journal, 41(3), 118–124. doi:10.4314/gmj.v41i3.55278
Bourbonnais, B. N. (2013). Implementing Free Maternal Health Care in Kenya, (November).
Brook, R. H., McGlynn, E. A., & Shekelle, P. G. (2000). Defining and measuring quality of care:
A perspective from US researchers. International Journal for Quality in Health Care, 12(4),
281–295. doi:10.1093/intqhc/12.4.281
Donabedian, A. (n.d.). The Quality of Care How Can It Be Assessed ?, (Fig 2).
Filippi, V., Ronsmans, C., Campbell, O. M., Graham, W. J., Mills, A., Borghi, J., … Osrin, D.
(2006). Maternal health in poor countries: the broader context and a call for action. Lancet,
368(9546), 1535–1541. doi:10.1016/S0140-6736(06)69384-7
Ginsburg, P. B., & Lesser, C. S. (2002). Healthcare Cost and Access Problems Intensify. Health
System Change, (3). Retrieved from http://www.hschange.org/CONTENT/559/
Haththotuwa, R., Senanayake, L., Senarath, U., & Attygalle, D. (2012). Models of care that
have reduced maternal mortality and morbidity in Sri Lanka. International Journal of
Gynecology and Obstetrics, 119(SUPPL.1), S45–S49. doi:10.1016/j.ijgo.2012.03.016
Health, F., & Delivery, S. (2006). Norms and.
Health, M. O. F. (2015). Ministry of Health Status of Implementation of Free Maternity
Services ( Fms ) Program in the Devolved Health System in Kenya.
Heaslip, W. G. (1946). National health. The Medical Journal of Australia, 2, 10–14.
Institute of Medicine. (1990). Clinical Practice Guidelines: Directions for a New Program. Przegla̧d
lekarski (Vol. 68). doi:10.1097/SPV.0b013e31828a2951
Kitui, J., Lewis, S., & Davey, G. (2013). Factors influencing place of delivery for women in
Kenya: an analysis of the Kenya demographic and health survey, 2008/2009. BMC
Pregnancy and Childbirth, 13(1), 40. doi:10.1186/1471-2393-13-40
Kohn, L. T., Corrigan, J., & Donaldson, M. S. (2000). To err is human: building a safer health

37
system, Vol. 6. Institute of Medicine (U.S.) Committee on Quality of Health Care in America.
doi:10.1017/S095026880100509X
Liambila, W. N., & Kuria, S. N. (2014). Birth attendance and magnitude of obstetric
complications in Western Kenya: a retrospective case–control study. BMC Pregnancy and
Childbirth, 14(1), 311. doi:10.1186/1471-2393-14-311
Macro, K. N. B. of S. (Knbs) and I. (2010). Kenya Demographic and Health Survey 2008-09.
Health (San Francisco), 1–314.
Marwa, B., Njau, B., Kessy, J., & Mushi, D. (2013). Feasibility of introducing compulsory
community health fund in low resource countries: views from the communities in Liwale
district of Tanzania. BMC Health Services Research, 13(1), 298. doi:10.1186/1472-6963-13-
298
Medicine, I. of. (1990). De finition of Medical Quality, 1, 2006.
Muga, R., Kizito, P., Mbayah, M., & Gakuruh, T. (2005). Overview of the Health System in
Kenya. Kenya Service Provision Assessment Survey 2004, (Kspa), 13–26.
Nahar, S., & Costello, a. (1998). Research report. The hidden cost of “free” maternity care in
Dhaka, Bangladesh. Health Policy and Planning, 13(4), 417. Retrieved from
http://heapol.oupjournals.org/cgi/content/abstract/13/4/417
Ndetei, D. M., Khasakhala, L., & Omolo, J. O. (2008). Incentives for health worker retention in
Kenya : An assessment of current practice. Africa Mental Health Foundation (AMHF),
Institute of Policy Analysis and Research (IPAR), Kenya, (MayNdetei, D. M., Khasakhala, L.,
& Omolo, J. O. (2008). Incentives for health worker retention in Kenya : An assessment
of current practice. Africa Mental Health Foundation (AMHF), Institute of Policy
Analysis and Research (IPAR), Kenya, (May).).
Ononokpono, D. N., Odimegwu, C. O., Imasiku, E., & Adedini, S. (2013). Contextual
determinants of maternal health care service utilization in Nigeria. Women & Health,
53(7), 647–68. doi:10.1080/03630242.2013.826319
Plan, C. (2008). Progress Assessment. Water Supply, 41–66.
Republic of Kenya. (2014). KENYA HEALTH SECTOR STRATEGIC AND INVESTMENT
38
PLAN ( KHSSP ) 2014-2018.
Sambo, L., & Kirigia, J. (2014). Investing in health systems for universal health coverage in
Africa. BMC International Health and Human Rights, 14(1), 28. doi:10.1186/s12914-014-
0028-5
Say, L., Chou, D., Gemmill, A., Tunçalp, Ö., Moller, A. B., Daniels, J., … Alkema, L. (2014).
Global causes of maternal death: A WHO systematic analysis. The Lancet Global Health,
2(6), 323–333. doi:10.1016/S2214-109X(14)70227-X
Spath, P. (2009). Introduction To Healthcare Quality Management. Retrieved from
http://file.zums.ac.ir/ebook/391-Introduction to Healthcare Quality Management-
Patrice Spath-1567933238-Health Administration .pdf
Summary Report of the Assessment of UNFPA ’ s Advocacy Campaign to End Preventable
Maternal and New-Born Mortality in Kenya List of Abbreviations. (n.d.), 1–20.
The World Health Report HEALTH SYSTEMS FINANCING. (n.d.).
Wesson, H. K. H., Bachani, A. M., Wekesa, J. M., Mburu, J., Hyder, A. a., & Stevens, K. a.
(2013). Assessing trauma care at the district and provincial hospital levels: A case study
of hospitals in Kenya. Injury, 44(SUPPL. 4), S75–S80. doi:10.1016/S0020-1383(13)70217-1

39
Annex 1: Participant Information and Consent From
Impact of free maternity health care services on perceived quality of service delivery at Nakuru
Provincial General Hospital
SECTION 1: INFORMATION SHEET–HEALTH PERSONNEL
Investigator: Dr. John Mwangi Murima
Institutional affiliation: Nakuru Provincial General Hospital
SECTION 2: INFORMATION SHEET–THE STUDY
2.1: Why is this study being carried out?
Information from this study will help us improve maternity healthcare services at Nakuru Provincial
General Hospital (NPGH) and similar facilities.
2.2: Do I have to take part?
Taking part in this study is entirely optional and the decision rests only with you. If you decide to take
part, you will be asked to complete a questionnaire to get information on the current quality of services at
the NPGH. If you are not able to answer all the questions successfully the first time, you may be asked to
sit through another informational session after which you may be asked to answer the questions a second
time. You are free to decline to take part in the study from this study at anytime without giving any
reasons.
2.3: Who is eligible to take part in this study?
Post natal mothers who have just delivered at the NPGH
Post natal mothers who have signed a written informed consent
2.4: Who is not eligible to take part in this study?
Post natal mothers who have delivered elsewhere (not at NPGH)
Post natal mothers who have delivered at the NPGH but have declined to give informed consent

40
2.5: What will taking part in this study involve for me?
You will be approached at the point of discharge and requested to take part in the study. If you are satisfied that you fully understand the goals behind this study, you will be asked to sign the informed consent form (this form) and then taken through a questionnaire to complete.
2.6: Are there any risks or dangers in taking part in this study?
There are no risks in taking part in this study. All the information you provide will be treated as confidential and will not be used in any way to penalize or victimize you.
2.7: Are there any benefits of taking part in this study?
The information will be used to improve maternal health services at NPGH that may benefit you and
other mothers in future.
2.8: What will happen to me if I refuse to take part in this study?
Participation in this study is entirely voluntary. Even if you decide to take part at first but later change
your mind, you are free to withdraw at any time without explanation.
2.9: Who will have access to my information during this research?
All research records will be stored in securely locked cabinets. That information may be transcribed
into our database but this will be sufficiently encrypted and password protected. Only the people who
are closely concerned with this study will have access to your information. All your information will be
kept confidential.
2.10: Who can I contact in case I have further questions?
You can contact me, Dr. John Mwangi Murima, at the NPGH, or by e-mail ([email protected]), or by phone (0722295178). You can also contact my supervisor, Professor Gilbert Kokwaro, at the Strathmore Business School, Nairobi, or by e-mail ([email protected]) or by phone (0722323651
I, __________________________, have had the study explained to me. I have understood all that I have read and have had explained to me and had my questions answered satisfactorily. I understand that I can change my mind at any stage.
Please tick the boxes that apply to you;
Participation in the research study
I AGREE to take part in this research
I DO NOT AGREE to take part in this research

41
Storage of information on the completed questionnaire
I AGREE to have my completed questionnaire stored for future data analysis
I DO NOT AGREE to have my completed questionnaire stored for future data analysis
Participant’s Signature: _____________________________________
Date: ______/_______/_________
DD / MM / YEAR
Participant’s Name: _________________________________________
Time: ______ /_______
(Please print name) HR / MN
I, ________________________ (Name of NPGH person taking consent) certify that I have followed the
SOP for this study and have explained the study information to the study participant named above, and
that she has understood the nature and the purpose of the study and consents to the participation in the
study. She has been given opportunity to ask questions which have been answered satisfactorily.
Investigator’s Signature: ___________________________________
Date: ______/_______/_________
DD / MM / YEAR
Investigator’s Name: _______________________________________
Time: ______ /_______
(Please print name) HR / MN

42
Annex 2: Questionnaire
A) Socio demographic and past obstetric history
1. Age (completed years)
2. Home area/Residence
3. Married
Single
Divorced/separated
Widowed
4. Level of education
None
Primary
Secondary
College/university
5. Employment status
Employed
Self employed
Unemployed
Housewife
Others
6. Parity
7. ANC attendance for current pregnancy
Yes No
8. Were you referred? Yes No
If yes from
Dispensary
Health Centre
Hospital
Reason for referral
9. Previous delivery
a) Site: Home
Health facility

43
Others (Specify)
b) Outcome
Baby – FSB
– SB
Alive with complications
Alive and normal
Mother – alive with complications
Normal
B) Current pregnancy
10. Outcome measures
a) Mother
Died Yes No
Cause of death
Complication Yes No
If yes what complication(s)
Length of hospital stay (in days)
b) Baby
Died Yes No
Cause of death
Alive with complications Yes No
If yes what complication(s)
Lengths of hospital stay (in days)

44
11. Patient Satisfaction
How would you rate the reception at the admission desk? Respondents will express their
opinion or experience on a four point Likert scale (1-4) where fully satisfied (4), Satisfied
(3), somewhat dissatisfied (2) and Dissatisfied (1). For each aspect please tick the
appropriate box on the right.
Rating Fully Satisfied Satisfied Somewhat
Dissatisfied
Dissatisfied
Initial Directions Given
Replies to Queries/Doubts
Courtesy of Healthcare Worker
How long did it take to be attended in the admission desk?
Rating 0 - 10 min 11- 20 min 21 - 30 min Over 30 min
Nurse
Doctor
How do would you rate the service in the labour ward?
Rating Fully Satisfied Satisfied Somewhat
Dissatisfied
Dissatisfied
During Labour
During Delivery
After Delivery

45
Physical Environment
Rating Fully Satisfied Satisfied Somewhat
Dissatisfied
Dissatisfied
Cleanliness of the Ward
Availability of beds and linen
State of the sanitary facilities in
the ward
Privacy
Confidentiality
12. Process measures
Signed medical/surgical consent Yes No
Physical examination
Complete Yes No
Incomplete Yes No
None Yes No
Clinical guidelines for obstetric
Emergencies present Yes No
Pain relief medication prescribed Yes No
If yes; medication given Yes No
Partograph available Yes No
If yes:
Complete Yes No
Incomplete Yes No
Nursing care plans present Yes No
RRI theatre sheet available Yes No
Is it in use Yes No
Post delivery observation chart present Yes No
If yes

46
Complete Yes No
Incomplete Yes No
Basic laboratory tests done Yes No
Basic ultra sound done Yes No
Did you pay for any service or commodities? Yes No
Did you buy a drug or a commodity (gloves, needles, bandage etc?)
Yes No
In future would you recommend this facility to somebody else?
Yes
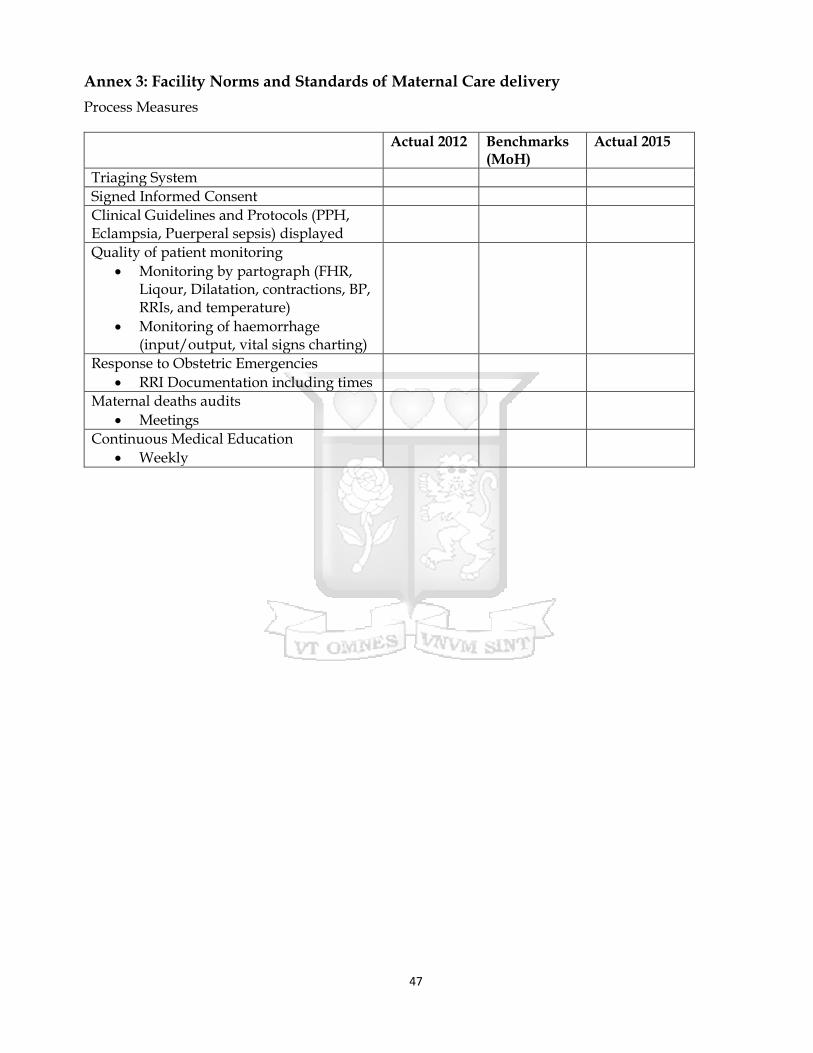
47
Annex 3: Facility Norms and Standards of Maternal Care delivery
Process Measures
Actual 2012 Benchmarks (MoH)
Actual 2015
Triaging System
Signed Informed Consent
Clinical Guidelines and Protocols (PPH, Eclampsia, Puerperal sepsis) displayed
Quality of patient monitoring
Monitoring by partograph (FHR, Liqour, Dilatation, contractions, BP, RRIs, and temperature)
Monitoring of haemorrhage (input/output, vital signs charting)
Response to Obstetric Emergencies
RRI Documentation including times
Maternal deaths audits
Meetings
Continuous Medical Education
Weekly

48
Structural Measures
Actual 2012 Benchmarks (MoH)
Actual 2015
Equipment: Thermometers
Blood pressure machines
stethoscopes
Foeto-scopes
Equipment to measure/estimate haemoglobin concentration
Equipment for testing blood – VDRL HIV & LFTS Blood group Blood sugars Uric acid
Manual Vacuum Aspiration
Vaginal speculums (cuscos/sims)
Vaginal examination packs
Delivery packs
Suture packs
Infection prevention equipment (buckets with lids)
Emergency tray (complete)
Oxygen cylinder and flowmeter
Ambu bag and mask
Vacuum extractor set
Ultra sound equipment
Doppler sonographic equipment
Anaesthetic machines
Operating tables
Delivery beds

49
Minimum Human Resources 2012 Benchmark (MoH)
2015
Service delivery staff
Anesthesiologist 2
Nursing staff 60
In-charge 1
Specialized outpatient clinics 8
Wards 30
Theatre 10
Nursery 3
Radiographer 1
Dental technologists 1
Laboratory technologist 1
Clinical officers (outpatient filtering) 4
Nursing staff 22
General outpatients 10
Delivery/MCH activities 12
Laboratory Technicians 4
Pharmaceutical technologist 4
Medical officers 15
Outpatients 4
Wards 8
Maternity 2
Management 1
Dentists 2
Pharmacists 2
Specialized clinical officers 12
Anesthesiologists RCO 4
Paediatric clinical officer 1
Psychiatrist clinical officer 2
Dermatology clinical officer 1
ENT clinical officer 1
Ophthalmology clinical officer 3
Nursing staff 178
Management 4
Specialized outpatient clinics 10
Wards 120
Theatre 40
Nursery 4
Radiographers 3
Dental technologist 4
Laboratory technologists 3
Medical specialists 24
Physicians 3
Obstetricians/Gynecologists 4
Paedatricians 3
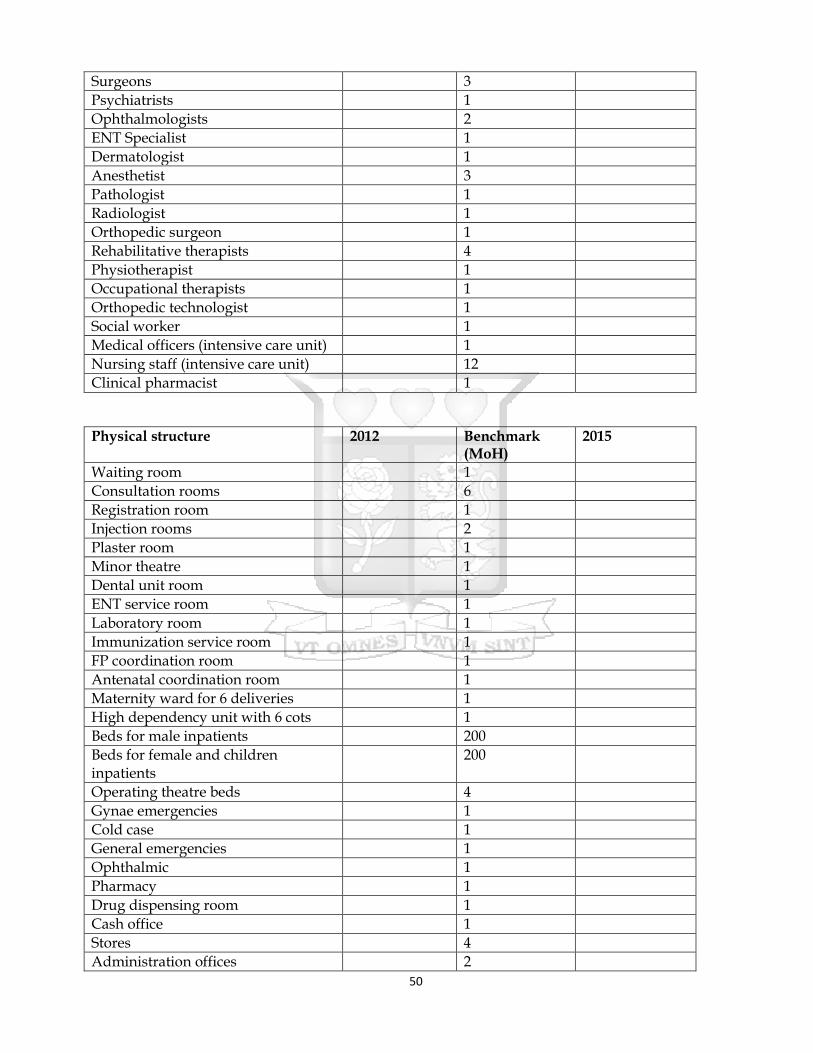
50
Surgeons 3
Psychiatrists 1
Ophthalmologists 2
ENT Specialist 1
Dermatologist 1
Anesthetist 3
Pathologist 1
Radiologist 1
Orthopedic surgeon 1
Rehabilitative therapists 4
Physiotherapist 1
Occupational therapists 1
Orthopedic technologist 1
Social worker 1
Medical officers (intensive care unit) 1
Nursing staff (intensive care unit) 12
Clinical pharmacist 1
Physical structure 2012 Benchmark (MoH)
2015
Waiting room 1
Consultation rooms 6
Registration room 1
Injection rooms 2
Plaster room 1
Minor theatre 1
Dental unit room 1
ENT service room 1
Laboratory room 1
Immunization service room 1
FP coordination room 1
Antenatal coordination room 1
Maternity ward for 6 deliveries 1
High dependency unit with 6 cots 1
Beds for male inpatients 200
Beds for female and children inpatients
200
Operating theatre beds 4
Gynae emergencies 1
Cold case 1
General emergencies 1
Ophthalmic 1
Pharmacy 1
Drug dispensing room 1
Cash office 1
Stores 4
Administration offices 2

51
Room for health records 1
Community service room 1
X-Ray room 1
USS room 1
Ambulance 1
Support Vehicle 1
Ultrasound for obstetric and other abdominal investigations

52
Annex 4: Ethical Approval
Copyright © 2022 FDOKUMEN