
The Effect of FDI on Indonesia's Jobs, Wages, and Structural ...
42
1 The effect of FDI on Indonesia’s jobs, wages and structural transformation Victor Steenbergen, Sarah Hebous, Maria Monica Wihardja and Abror Tegar Pradana 1 This version: December 15, 2020. Abstract Foreign direct investment (FDI) can provide important opportunities for middle-class jobs by stimulating employment growth, paying wage premiums and helping to shift workers out of less productive sectors. This analysis exploits regional variations in sales to examine the effect that multinational corporations (MNCs) in the manufacturing sector have on employment and wages in Indonesia between 2007 and 2015. Using interaction effects, it explores how these effects differ by workers’ education level, occupation and employment status. The study finds that manufacturing MNCs raise average wages in their sector. Yet, higher-educated workers benefit more, and white-collar workers see greater benefits than blue-collar workers. Women also appear to benefit more than men, as a result of the type of labor- intensive sectors MNCs engage in. The study finds evidence that manufacturing FDI can help to accelerate structural transformation, as workers move out of lower-productivity sectors (agriculture and low-skilled services) and into higher-productivity manufacturing. JEL Classification: F21, J23, J31, L16 Keywords: Foreign direct investment, labor demand, wage differentials, structural change 1 Authors and affiliations: Victor Steenbergen (World Bank, Investment and Competition Global Unit), Sarah Hebous (World Bank, Short Term Consultant), Maria Monica Wihardja (World Bank, Poverty and Equity Global Practice), and Abror Pradana (World Bank, Short Term Consultant). This paper is written as a background paper for Indonesia’s Jobs Report, Pathways to Middle-Class Jobs in Indonesia (2021). We would like to thank our peer reviewers, Bob Rijkers and Dino Merrotto, and Yasser El-Gammal and Achim Daniel Schmillen for comments. We also would like to thank Philip O’Keefe and Rinku Murgai for their guidance. The views expressed in this paper are of the authors only and should not be attributed to the World Bank, its Executive Directors or the countries they represent. Public Disclosure Authorized Public Disclosure Authorized Public Disclosure Authorized Public Disclosure Authorized
-
Upload
khangminh22 -
Category
Documents
-
view
0 -
download
0
Transcript of The Effect of FDI on Indonesia's Jobs, Wages, and Structural ...

1
The effect of FDI on Indonesia’s jobs, wages and structural
transformation
Victor Steenbergen, Sarah Hebous, Maria Monica Wihardja and Abror Tegar Pradana1
This version: December 15, 2020.
Abstract
Foreign direct investment (FDI) can provide important opportunities for middle-class jobs by stimulating
employment growth, paying wage premiums and helping to shift workers out of less productive sectors.
This analysis exploits regional variations in sales to examine the effect that multinational corporations
(MNCs) in the manufacturing sector have on employment and wages in Indonesia between 2007 and
2015. Using interaction effects, it explores how these effects differ by workers’ education level,
occupation and employment status. The study finds that manufacturing MNCs raise average wages in
their sector. Yet, higher-educated workers benefit more, and white-collar workers see greater benefits
than blue-collar workers. Women also appear to benefit more than men, as a result of the type of labor-
intensive sectors MNCs engage in. The study finds evidence that manufacturing FDI can help to accelerate
structural transformation, as workers move out of lower-productivity sectors (agriculture and low-skilled
services) and into higher-productivity manufacturing.
JEL Classification: F21, J23, J31, L16
Keywords: Foreign direct investment, labor demand, wage differentials, structural change
1 Authors and affiliations: Victor Steenbergen (World Bank, Investment and Competition Global Unit), Sarah Hebous (World Bank, Short Term Consultant), Maria Monica Wihardja (World Bank, Poverty and Equity Global Practice), and Abror Pradana (World Bank, Short Term Consultant). This paper is written as a background paper for Indonesia’s Jobs Report, Pathways to Middle-Class Jobs in Indonesia (2021). We would like to thank our peer reviewers, Bob Rijkers and Dino Merrotto, and Yasser El-Gammal and Achim Daniel Schmillen for comments. We also would like to thank Philip O’Keefe and Rinku Murgai for their guidance. The views expressed in this paper are of the authors only and should not be attributed to the World Bank, its Executive Directors or the countries they represent.
Pub
lic D
iscl
osur
e A
utho
rized
Pub
lic D
iscl
osur
e A
utho
rized
Pub
lic D
iscl
osur
e A
utho
rized
Pub
lic D
iscl
osur
e A
utho
rized

2
Table of Contents
1. INTRODUCTION ..................................................................................................................................... 3
2. FDI, STRUCTURAL TRANSFORMATION AND LABOR MARKET OUTCOMES ........................................... 4
3. DESCRIPTIVE STATISTICS ....................................................................................................................... 8
4. METHODOLOGY .................................................................................................................................. 13
5. THE EFFECT OF FDI ON WITHIN-SECTOR WAGE DYNAMICS ............................................................... 17
6. THE EFFECT OF FDI ON INTER-SECTORAL EMPLOYMENT AND OUTPUT ............................................ 22
7. CONCLUSION ....................................................................................................................................... 26
Annex 1: Additional graphs ......................................................................................................................... 29
Annex 2: Additional tables .......................................................................................................................... 31
Annex 3: Robustness, possible limitations and future improvements ....................................................... 38
References .................................................................................................................................................. 40

3
1. INTRODUCTION
The creation of middle-class jobs is a key priority for the government of Indonesia. While its overall
employment rate reached a two-decade record high in 2018, two-thirds of jobs created in the past two
decades are in low-productivity sectors, such as wholesale and retail trade, restaurants and hotels, while
also raising dependence on commodity-based industries (Alatas and Wihardja, forthcoming). In contrast,
there has been a relative decline in some jobs that command higher salaries (“middle-class jobs”), such as
in medium and large manufacturing industries. To improve its upward mobility and provide opportunities
for future generations, Indonesia needs to generate more high-paying jobs. As noted recently by the
World Bank (2019) “If the pathway to economic security of the middle class is not made available to all
citizens, there is a risk of a divided Indonesia.”
Attracting foreign direct investment (FDI) in manufacturing can provide important opportunities for
middle-class employment growth. This paper focuses on FDI as a key driver of labor demand. It will show
that foreign-owned manufacturing firms can be important for stimulating employment growth and also
pay wage premiums, therefore contributing to middle-class jobs. Yet, Indonesia is not as welcoming as it
can be to foreign investors. According to the OECD FDI Restrictiveness Index, Indonesia is the third-most
restrictive out of 68 rich and middle-income countries, with significant foreign equity restrictions, foreign
workers regulations, regulatory uncertainties, and high labor costs for employers (Basri, 2019; Lembong,
2019, Manning and Pratomo, 2019). This has limited foreign investment and hampered job creation,
including in the labor-intensive manufacturing sector. FDI as a share of GDP has averaged less than 2%
over the past three years, among the lowest in the region (Figure 2). However, a recent legal amendment
is seeking to reduce foreign investment restrictions. As noted by the World Bank: The Omnibus Law on
Job Creation (passed on October 5, 2020) is a major reform effort to make Indonesia more competitive
and support the country’s long-term aspiration of becoming a prosperous society“ (World Bank, 2020d).

4
To better understand what role FDI can play in future job creation, this paper will consider the historical
effect that manufacturing FDI has had on Indonesia’s labor market. In particular, it will focus on answering
three research questions:
1. What has been the effect of manufacturing FDI on job creation in Indonesia?
2. What has been the effect of manufacturing FDI on average wages in Indonesia?
3. What has been the effect of manufacturing FDI on structural transformation in Indonesia?
The paper is outlined as follows: Section 2 will briefly summarize the literature on FDI, structural
transformation and labor market outcomes in Indonesia. Section 3 presents descriptive statistics around
manufacturing FDI and employment in Indonesia. Section 4 provides details on the methodology used
throughout the paper. Section 5 focuses on the role of manufacturing FDI in inter-sectoral employment
dynamics (job creation and structural transformation). Section 6 considers the effect of manufacturing
FDI on within-sector wage dynamics. Section 7 concludes.
2. FDI, STRUCTURAL TRANSFORMATION AND LABOR MARKET OUTCOMES
FDI can be important for creating higher-paying jobs by stimulating productivity both within and across
sectors. There are two main ways to stimulate labor productivity growth in an economy. First, productivity
can grow within economic sectors through capital accumulation, technological change or reduction of
misallocation across plants. Second, labor can move across sectors, from low-productivity sectors to high-
productivity sectors (McMillan, Rodrik and Verduzco-Gallo, 2014). Jointly, these two components are
commonly referred to as structural transformation. FDI can play an important role in stimulating both of
these components.
There is considerable evidence of FDI’s beneficial impacts within its economic sector, raising overall
employment and average wages (Steenbergen and Tran, 2020). Much of existing evidence points to FDI

5
raising wage levels, driven primarily by new technology and increased labor productivity, a review by Hale
and Xu (2016) notes. In many cases, the literature also finds a positive effect of FDI on aggregate
employment. For example, FDI was found to increase the employment rate in China, the Czech Republic,
and Uruguay (Karlsson et al. 2009; Dinga and Mnich 2010; Peluffo 2015). FDI also had a strong positive
employment effect on Mexico’s manufacturing FDI, with stronger effects in export-oriented industries
(Waldkirch and Nunnenkamp 2009).
FDI has also raised Indonesia’s manufacturing employment2. Lipsey et al (2010) find that foreign
establishments have played a role in Indonesian growing manufacturing employment between 1975 and
2005. While plants with some foreign ownership, made up less than 10% of manufacturing employment
in 1975, they employed around 20% in 2005. They also find that employment in foreign-owned plants
grew about 5% faster than domestic-owned firms, while plants that were acquired by foreigners grew
about 10% faster. Considering that foreign plants are on average considerably larger than domestic plants,
the difference in the number of jobs created was large (Lipsey et al, 2010).
The increased employment associated with FDI inflows has also helped pull workers out of low-
productivity and into higher-productivity sectors. While the number of studies is scarce, there is a
growing body of evidence that finds important across-sector employment effects from FDI. Escobar and
Muhlen (2018) covers the period 2006-2016 and find that FDI flows to Mexico led to considerable
reallocation of labor between sectors. Using Mexican states are the unit of observation, they find that
direct investments in the industrial sector helped draw workers out of (low-productivity) agriculture and
increase the employment share of manufacturing. Interestingly, as an illustration of wider economic
spillovers, it also demonstrated a positive effect on the employment share in relatively productive service
sectors. As a result, labor reallocation was present for both low- and medium-skilled workers. To our
2 For additional studies on FDI in Indonesia see e.g. Blomström and Sjöholm (1999), Lipsey and Sjöholm (2004), Takii (2005), Blalock and Gertler (2008), and Arnold and Javorcik (2009).

6
knowledge, no studies have considered the effect of FDI on Indonesia’s intersectoral employment.
However, Steenbergen et al (forthcoming) does show a strong relationship between inflows in
manufacturing FDI from the United States to Indonesia, and Indonesia’s aggregate number of
manufacturing jobs (Figure 1).
Figure 1. Indonesian manufacturing employment and US manufacturing FDI inflows into Indonesia
Source: Steenbergen et al, forthcoming. Note: data on employment comes from the Groningen Growth and Development Centre (GGDC) and US FDI data comes from the Bureau of Economic Analysis.
Recent new firm-level evidence further confirms the importance of FDI, and the costs of foreign entry
restrictions for Indonesia’s productivity and investment. Cali et al (forthcoming) find that industries with
fewer foreign entry restrictions receive more foreign investment, which in turn leads to important
productivity effects for domestic firms. Around 60% of this impact comes from technology spillovers from
MNCs, while around 40% of this impact stems from stronger competitive pressure, inducing incumbents
to innovate to preserve market shares. Interestingly, they also find that the removal of FDI restrictions
positively affects both FDI and domestic investments, where the influx of the former crowds in the latter.

7
Such complementarity may be related to competitive pressure on domestic investors, positive technology
spillovers from FDI and/or the expansion of the sector following the FDI increase, all of which stimulate
increased investments by domestic firms (Cali et al, forthcoming).
However, FDI may also increase the wage gap between skilled and unskilled workers. FDI often
introduces new technologies that raise the demand for higher-skilled workers especially. There is
considerable empirical evidence confirming that FDI contributes to rising wage inequality in host
countries. In developing countries, wage inequality increases with stocks of inward FDI, cross-country
study by Figini and Görg (2011) shows. A rise in Japanese FDI in developing countries is associated with an
increase in nonproduction wages (for more skilled workers) relative to production wages (for less skilled
workers) (Head and Ries, 2002). Similar effects of foreign investments have been found for firms in
Indonesia and Mexico (Lee and Wie 2015; Feenstra and Hanson 1997). Yet, technological change is not
necessarily biased in favor of skilled workers, as it depends largely on the type of FDI attracted (Luo 2017).
FDI in some types of low-skilled sectors (such as textiles and food processing) could disproportionally
benefit unskilled workers (Leamer 1998; Cruz et al. 2018). For this reason, Cornia (2016) finds that FDI in
labor-intensive manufacturing and infrastructure is associated with declining inequality in Ethiopia,
Ghana, and Mozambique.
The effects of FDI are often local, at least in the short term. Overall employment in receiving industries
tend to increase with FDI. Yet, due to their greater reliance on technology that requires complementary
skills, a larger presence of foreign firms or affiliates in the region and industry also increases demand for
skilled labor. Because the supply of skilled labor is highly inelastic in the short and medium term, this
further pushes up the wages of skilled workers in the region and industry with higher FDI presence (Hale
and Xu, 2016). Given that most developing countries have considerable restrictions on worker mobility
between regions, the effects tend to be rather concentrated in local labor markets (Dix-Carneiro and
Kovak 2015; Pavcnik 2017). This also means that FDI can lead to another form of inequality—geographical

8
inequality—as have been found in Bolivia and Vietnam (Nunnenkamp, Schweickert, and Wiebelt 2007;
McLaren and Yoo 2016).
Overall, the literature suggests that FDI has positive but unequal effects on host countries' labor
markets. FDI is associated with higher aggregate employment and a rise in average wages. This can also
provide important benefits for structural transformation by helping draw workers out of low-productivity
and into higher-productivity sectors. Many of these benefits accrue more to higher-skilled workers, while
lower-skilled workers may experience adverse effects (Steenbergen and Tran, 2020).
3. DESCRIPTIVE STATISTICS
Indonesia’s FDI inflows
Indonesia’s overall FDI inflow as a percentage of GDP is relatively low, while the relative importance of
manufacturing FDI has increased. Figure 2, Panel A shows that the ratio of FDI inflows to GDP has been
stable but low at around 2%. This is considerably lower than all other countries in the region, including
Malaysia, Vietnam, Philippines, Cambodia or Thailand. However, the relative importance of
manufacturing FDI in overall FDI has increased immensely over time. The sectoral decomposition of
Greenfield FDI announcement data (using newspaper announcements aggregated by the Financial Times’
FDImarkets), shows a steady increase in the share of manufacturing FDI in total FDI from around 27% in
2003-2007 to almost 50% in 2013-2018 (Figure 2, panel b).
Figure 2. FDI inflows in GDP and sectoral decomposition Panel A: Total Inward FDI – Indonesia vs.
Comparators (2009-2018) Panel B: Sectoral Decomposition (2003-2018)

9
Source: Authors’ calculations using WDI and FDImarkets
Firm dynamics in Indonesia’s manufacturing sector
The presence of MNCs in Indonesia’s manufacturing sector has shown a slight increase over the sample
period. Over the period of our sample, around 9% of firms in manufacturing are foreign owned, masking
heterogenous shares of foreign firms across districts and sectors—ranging from 0% to 100%. The
unweighted average MNC employment share at the sector-district level is 11.5%, while the average output
and value added shares generated by MNCs are slightly higher at 12.5%. Figure A1 in the annex shows
that the district-sector share of MNCs in the total number of firms, employment, output and value added
has evolved over time. Despite some slow-down during 2011-2013, MNC activities rebounded in 2015.
The share of MNCs’ output in total output has risen from around 11% in 2007 to over 12% in 2015, with a
peak at 13% in 2010.
Manufacturing MNC activity across regions
There is critical geographical distribution of MNCs across Indonesia, with the largest number of firms in
Java. Figure 3 shows the number of MNCs per district in 2007 (panel a) and 2015 (panel b). In 2007, around
55% of districts have no MNC activity at all. In 2015, the share of districts with no MNC activity has fallen

10
below 50%. On the other side of the distribution, 5 districts have more than 100 MNCs. The district with
the highest number of MNCs (349 in 2007, 400 in 2015) is Bekasi in West Java.
Figure 3. Geographical distribution of MNCs in 2007 and 2015
Source: Authors’ calculations using Indonesia’s manufacturing survey
There is also considerable heterogeneity in the relative shares of MNC activity in manufacturing across
Indonesia’s districts. The average MNC output share in Java is the highest at 12.5%, while on the Lesser
Sunda Islands it is the lowest at 5.4%. In 2015, the highest average MNC output share can be seen in West
Papua (22%), while the Lesser Sunda Islands continue to be at the lower end of the distribution. Different
regions in Indonesia exhibit different patterns of MNC activity growth over time. While in districts in
Sumatera and Sulawesi MNC output share has declined on average between 2007 and 2015, it has gone
up in all other regions of Indonesia. The strongest growth of MNC activity share over time can be seen in

11
West Papua, where three districts have seen increases in MNC output share from below 12.5% in 2007 to
above 62.5% in 2015.
Sectors with highest manufacturing MNC activity
Most of the sectors in which manufacturing MNCs dominate are in lower-skilled sectors (see annex
table A1 for details of the sectoral classification). Figure 4 shows for each district the sector with the
highest MNC output. In almost 50% of districts, MNCs from food products manufacturing have generated
the highest output. About 19% of total MNC output comes from this sector. Other common activities
include beverages, textiles/apparel, wood products and rubber and plastics. Note that all of these are
lower-skilled sectors. There are only a small number of sectors that specialize in high-skilled
manufacturing, including production of chemical and motor vehicles. Java has the most heterogeneous
MNC landscape among Indonesian regions. Its districts show a higher presence of textiles and wearing
apparel industries, rubber, plastic and other non-metallic mineral products manufacturing, as well as
manufacturing of motor vehicles among the top output generators.
Figure 4. Dominant sectors of manufacturing MNCs (average 2007-2015)
Source: Authors’ calculations using Indonesia’s manufacturing survey

12
While there has been little change among the most dominant MNC sectors, some higher-skilled sectors
have exhibited high growth rates during 2007-2015. Error! Reference source not found.3 shows the
growth of the number of MNCs (panel a) and real MNC output (panel b) by sector, where the number
(output) of MNCs in 2007 is normalized to 1. Most notably, the number of MNCs in the manufacture of
coke and refined petroleum products sector has more than doubled and their output in subsequent years
is up to 20 times as high as in 2007. The number of MNCs in repair and installation of machinery and
equipment is 70% higher in 2015 than it was in 2007 and their output is around 35 times of their initial
level. While starting from a low base, it is encouraging to see that much growth was concentrated in
higher-skilled sectors.
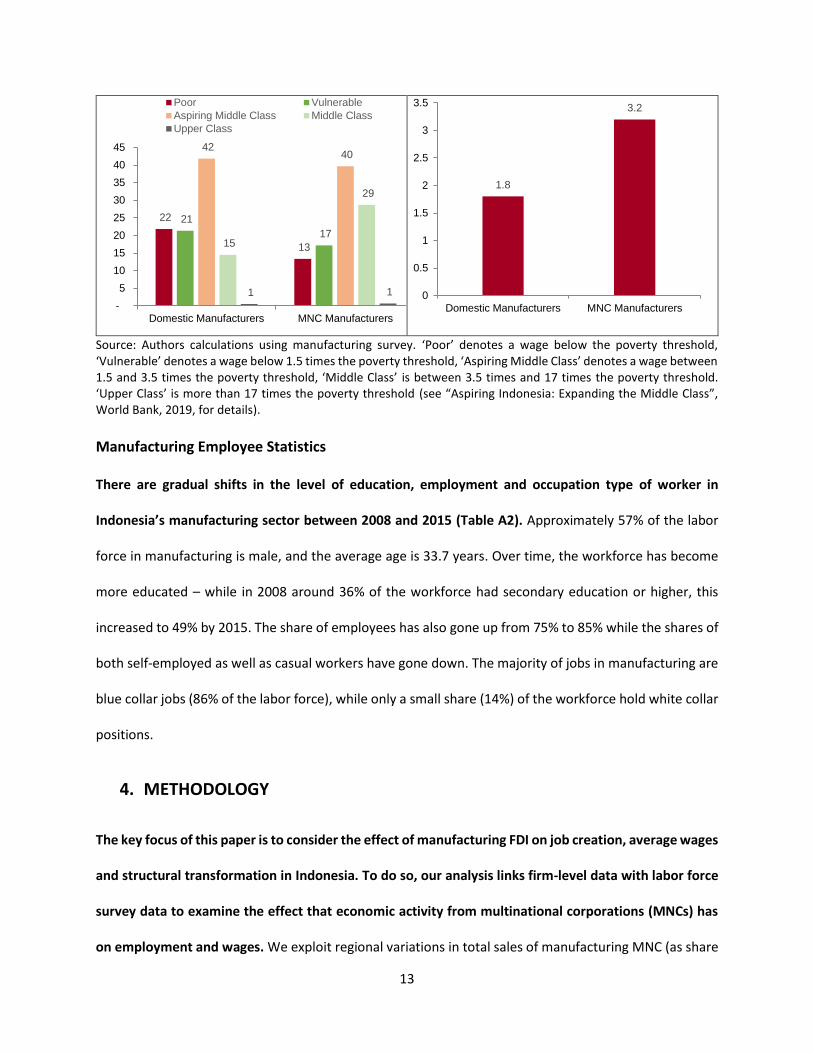
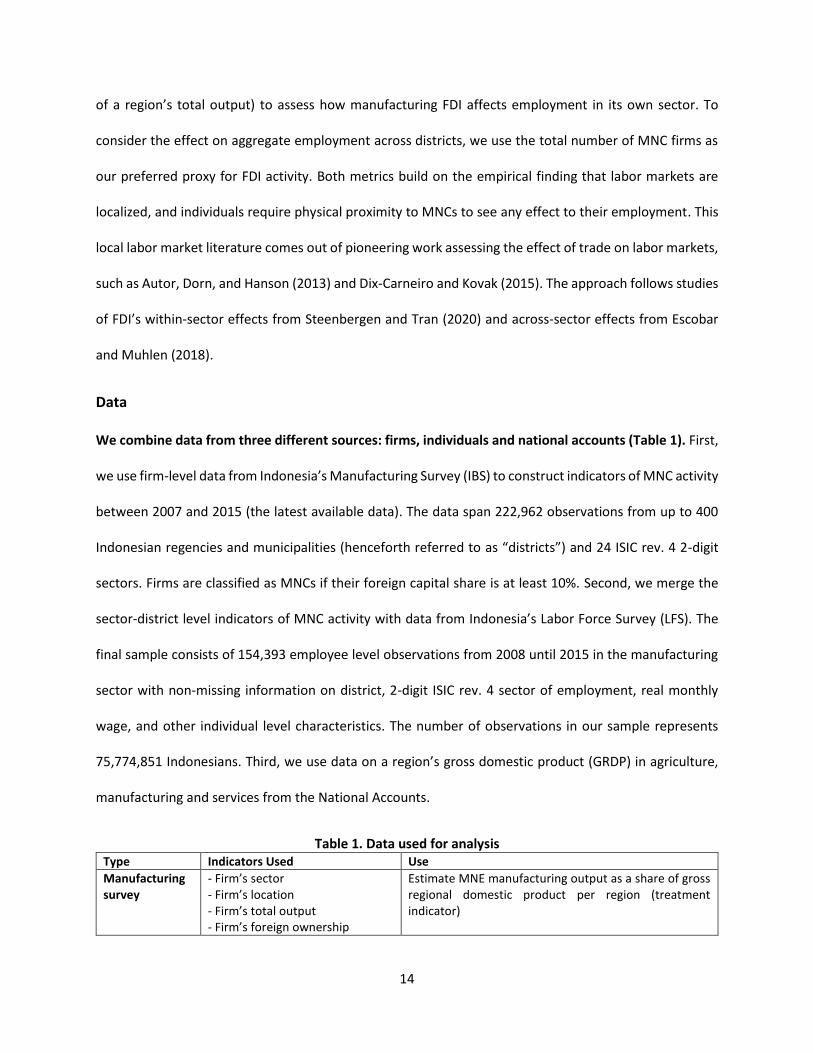
While both domestic and foreign manufacturing firms provide a good source of “middle-class jobs”,
average wages are considerably higher for foreign-owned firms. Using the income bracket classification
in “Aspiring Indonesia: Expanding the Middle Class” (World Bank, 2019a), we see that the manufacturing
sector could provide an important contribution for higher-paying employment. For domestic firms, an
average of 15% of all jobs have wages that are for the “middle class”, while the same is true for 29% of all
jobs for foreign-owned firms (Figure 5, Panel A). Yet, wages are higher on average in MNCs: 3.2 IDR million,
as compared to 1.8 IDR million per month, on average (Figure 5, Panel B).
Figure 5. Wage dynamics for production workers – domestic vs. MNC firms (average 2010-2015)
Panel A: Wage levels by firm type Panel B: Average monthly wages by firm type
13
Source: Authors calculations using manufacturing survey. ‘Poor’ denotes a wage below the poverty threshold, ‘Vulnerable’ denotes a wage below 1.5 times the poverty threshold, ‘Aspiring Middle Class’ denotes a wage between 1.5 and 3.5 times the poverty threshold, ‘Middle Class’ is between 3.5 times and 17 times the poverty threshold. ‘Upper Class’ is more than 17 times the poverty threshold (see “Aspiring Indonesia: Expanding the Middle Class”, World Bank, 2019, for details).
Manufacturing Employee Statistics
There are gradual shifts in the level of education, employment and occupation type of worker in
Indonesia’s manufacturing sector between 2008 and 2015 (Table A2). Approximately 57% of the labor
force in manufacturing is male, and the average age is 33.7 years. Over time, the workforce has become
more educated – while in 2008 around 36% of the workforce had secondary education or higher, this
increased to 49% by 2015. The share of employees has also gone up from 75% to 85% while the shares of
both self-employed as well as casual workers have gone down. The majority of jobs in manufacturing are
blue collar jobs (86% of the labor force), while only a small share (14%) of the workforce hold white collar
positions.
4. METHODOLOGY
The key focus of this paper is to consider the effect of manufacturing FDI on job creation, average wages
and structural transformation in Indonesia. To do so, our analysis links firm-level data with labor force
survey data to examine the effect that economic activity from multinational corporations (MNCs) has
on employment and wages. We exploit regional variations in total sales of manufacturing MNC (as share
22
13
21
17
42 40
15
29
1 1
-
5
10
15
20
25
30
35
40
45
Domestic Manufacturers MNC Manufacturers
Poor Vulnerable
Aspiring Middle Class Middle Class
Upper Class
1.8
3.2
0
0.5
1
1.5
2
2.5
3
3.5
Domestic Manufacturers MNC Manufacturers
14
of a region’s total output) to assess how manufacturing FDI affects employment in its own sector. To
consider the effect on aggregate employment across districts, we use the total number of MNC firms as
our preferred proxy for FDI activity. Both metrics build on the empirical finding that labor markets are
localized, and individuals require physical proximity to MNCs to see any effect to their employment. This
local labor market literature comes out of pioneering work assessing the effect of trade on labor markets,
such as Autor, Dorn, and Hanson (2013) and Dix-Carneiro and Kovak (2015). The approach follows studies
of FDI’s within-sector effects from Steenbergen and Tran (2020) and across-sector effects from Escobar
and Muhlen (2018).
Data
We combine data from three different sources: firms, individuals and national accounts (Table 1). First,
we use firm-level data from Indonesia’s Manufacturing Survey (IBS) to construct indicators of MNC activity
between 2007 and 2015 (the latest available data). The data span 222,962 observations from up to 400
Indonesian regencies and municipalities (henceforth referred to as “districts”) and 24 ISIC rev. 4 2-digit
sectors. Firms are classified as MNCs if their foreign capital share is at least 10%. Second, we merge the
sector-district level indicators of MNC activity with data from Indonesia’s Labor Force Survey (LFS). The
final sample consists of 154,393 employee level observations from 2008 until 2015 in the manufacturing
sector with non-missing information on district, 2-digit ISIC rev. 4 sector of employment, real monthly
wage, and other individual level characteristics. The number of observations in our sample represents
75,774,851 Indonesians. Third, we use data on a region’s gross domestic product (GRDP) in agriculture,
manufacturing and services from the National Accounts.
Table 1. Data used for analysis Type Indicators Used Use
Manufacturing survey
- Firm’s sector - Firm’s location - Firm’s total output - Firm’s foreign ownership
Estimate MNE manufacturing output as a share of gross regional domestic product per region (treatment indicator)

15
Labor force survey
- Individual sectoral employment - Individual location - Individual average wages
Estimate the total employment per region and broad sector Estimate the average wages per sector/region
National accounts
- Region’s gross regional domestic product (GRDP) - Region’s GRDP per sector
Estimate the total output per region and broad sector
For the empirical strategy, the within-sector and across-sector analysis are performed separately. We will
discuss each in turn.
Within-sector analysis
The baseline model (within-sector) is at the individual level, and estimates the following:
(1) 𝑦𝑖𝑠𝑟𝑡 = 𝛽 × 𝐹𝐷𝐼𝑠𝑟𝑡−1 + 𝛿𝑋𝑖𝑟𝑠𝑡 + 𝛾 × 𝑡𝑎𝑟𝑖𝑓𝑓𝑠𝑡 + 𝑑𝑠 + 𝑑𝑟𝑡 + 휀𝑖𝑟𝑠𝑡
Here, y denotes (log) wages; where i is the specific individual, s is the 2-digit sector, r is the region (Daerah
Tingkat II – level 2 regions), and t is the year. 𝐹𝐷𝐼𝑠𝑟𝑡−1 denotes lagged FDI activity, calculated as the share
of foreign firms’ revenue in the total output of a sector and region within a country. β is the main
coefficient of interest, which measures the percentage change in wages associated with a unit change FDI
activity. Implicitly, this specification assumes that the relevant labor market is within a sector and region.
There is adjustment cost to move between sectors and between regions so that there are differences in
individual employment and wages due to differences in FDI activities. We control for a set of individual
characteristics in 𝑋𝑖𝑟𝑠𝑡 , including age, gender, and education level to account for potential selection of
workers into regions and sectors with higher FDI. The sectoral fixed effects 𝑑𝑠 control for inherent
differences in sectoral labor demand that could be correlated with FDI attractiveness.
The main empirical challenge is to separate the impact of FDI from other unobserved changes in policies
or market trends that can affect the labor markets at the same time. For example, infrastructure spending
can attract FDI as well as other domestic investments that boost employment and wages. MNCs in certain
sectors can also choose to locate in low-wage regions because of cost considerations, in which case higher
FDI activity might appear to be associated with lower wages. As a result, a simple correlation between FDI

16
activity and labor market outcomes can either inflate or underestimate the true impact of FDI. To account
for this potential bias, lagged global FDI growth was used as an instrument to capture supply-side changes
that affect FDI inflows and eventually MNC presence but are unlikely to be correlated with other domestic
shocks.
We estimate (1) using Instrumental Variables, where 𝐹𝐷𝐼𝑠𝑟𝑡 is instrumented for by growth in global FDI
(greenfield and M&A) in sector s in year t-4, interacted with the original shares of FDI in region sector rs,
that is, the shares at the beginning of the sample period. We also include a quadratic term of the
instrument to capture potential non-linear effects of between the instrument and our variable of interest.
Global FDI captures supply shocks that are unlikely to be correlated with other domestic changes.
Nevertheless, this instrument is not exogenous if there are regional shocks that affect both the labor
markets and FDI shares. To account for this, we also control for a set of region-year fixed effects. Finally,
the model also controls for average tariff in the sector to separate out the potential impact of FDI from
trade liberalization, as FDI reforms are often accompanied by trade liberalization. To assess the
heterogenous treatment effects of FDI, we use a number of different interaction effects, including
education, employment status, occupation type and gender.
Across-sector analysis
The second model (across-sector) is at the regional level, and includes simultaneous regressions across
three broad sectors (primary goods, manufacturing and services) using three-staged least squares (3SLS)
with one joint instrument. It estimates the following:
(2) 𝑦𝑠𝑟𝑡 = 𝛽 × 𝐹𝐷𝐼𝑟𝑡 + 𝛿𝑋𝑟𝑡 + 𝑑𝑟 + 𝑑𝑡 + 휀𝑠𝑟𝑡
Here, y denotes (log) number of employees, employment shares or (log) gross regional domestic product;
s is the broad sector, r is the region, and t is the year. We also include the total number of a domestic
manufacturing firms as a district-level control in 𝑋𝑟𝑡. 𝐹𝐷𝐼𝑟𝑡 denotes manufacturing FDI activity, estimated
as the number of foreign manufacturing firms in the region. β is the main coefficient of interest, which

17
measures the change in formal employment associated with a unit change FDI activity. The region fixed
effects 𝑑𝑟 and year fixed effects 𝑑𝑡 control for inherent differences in regional make-up and yearly shocks
that may be correlated with FDI attractiveness. We again estimate (2) using Instrumental Variables, where
𝐹𝐷𝐼𝑟𝑡 is instrumented for by the global FDI (greenfield and M&A) in year t-4 in all manufacturing sectors
in the region (weighted based on ISIC2’s relative size in the region at the beginning of the sample period),
interacted with the original shares of manufacturing FDI in region at the beginning of the sample period.
To account for the fact that much of the overall variation in MNC activity generally takes place in larger
districts, we further weight the regression by each district’s total GDP.
Finally, the estimated average impact of FDI is used to calculate the aggregate impact on aggregate
employment and average sectoral output in a simple back-of-the-envelope counterfactual exercise. To
compare the actual employment numbers, employment distribution and output per sector to the
hypothetical case without FDI presence, the exercise assumes that there is a constant effect of FDI on all
districts that is equal to the estimated average effect. The counterfactual employment is then assumed
to be equal to the actual employment minus the estimated average employment gain (loss) due to FDI.
5. THE EFFECT OF FDI ON WITHIN-SECTOR WAGE DYNAMICS
There is a positive relationship between MNC activity and wages in Indonesia’s districts in the
manufacturing sector. Table 2 shows results from the second-stage IV regression of our baseline
specification for 2007-2015. The marginal effect of MNC output share on wages is positive and significant
at the 1% level. This suggests that, holding all other factors constant, when a sector-region sees a ten
percentage point increase in output share going to MNCs, the average wages in that sector-region are

18
likely to increase by 2.25%. The magnitude of this effect size is in line with other countries (see
Steenbergen and Tran (2020) for similar estimates for Turkey, Vietnam and Ethiopia).
Table 2. Average effect of MNC output share on wages (2nd stage IV) Outcome Variable Wage (ln)
MNCs Output Share (Lagged 1 Period) 0.225*** (0.0627) Controls Education, Gender, Age, Sectoral Tariffs Fixed effects Region-Year, Sector Observations 154,292
Source: Authors’ calculations. Note: Standard errors are clustered at the region*sector level. See annex 2 for details.
Effects on skills premium
FDI provides greater benefits to higher-skilled workers in Indonesia’s manufacturing sector, indicating
that FDI inflows are associated with a skill premium. The positive effect of MNC activity on wages
increases with an individual’s educational outcome. Interacting MNC output share with education levels
shows a negative but statistically insignificant effect for those with no education, but positive effects on
wages for all other education levels (Table 3). Relatedly, the effect is larger for white collar jobs than it is
for blue collar jobs (Table 4).
Breaking the sample down into low-skilled and high-skilled manufacturing (see annex table A1 for
details), the benefits of FDI are more widespread for the low-skilled than high-skilled manufacturing
sector. Increased MNC activity in low-skilled manufacturing is associated with benefits for workers with
primary and secondary education, but is especially pronounced in those with tertiary education. For high-
skilled manufacturing, the benefits are concentrated to workers with secondary education only (while
statistically insignificant for other groups). A similar findings holds for occupation type, where low-skilled
sectors benefits both blue and white-collar workers, but the benefits are restricted only to the latter for
high-skilled sectors. This result could be explained by the difference in overall skill requirement for these
types of sectors. Another reason may be that the results are more widespread for low-skilled

19
manufacturing, as they make up most of Indonesia’s manufacturing sector, and also sees greater
concentrations from MNCs (see section 3 for details).
Table 3. Within-sector effect of FDI by education level (2nd stage IV results) (1) (2) (3) Outcome Variable Wage (ln) Manufacturing Sector All Low-Skill Mf High-Skill Mf
MNCs Output Share (Lagged 1 Period) * No Education -0.0180 -0.00561 -0.377 (0.171) (0.181) (0.302) MNCs Output Share (Lagged 1 Period) * Primary Education 0.256*** 0.330*** -0.0167 (0.0771) (0.0843) (0.0424) MNCs Output Share (Lagged 1 Period) * Secondary Education 0.229*** 0.310*** 0.107** (0.0705) (0.0750) (0.0420) MNCs Output Share (Lagged 1 Period) * Tertiary Education 0.359*** 0.607*** 0.0762 (0.120) (0.158) (0.0920) Controls Education, Gender, Age, Sectoral Tariffs Fixed effects Region-Year, Sector Observations 154,292 138,153 15,928
Source: Authors calculations. See annex 2 for details. Note: Standard errors are clustered at the region*sector level. See annex 2 for details.
Table 4. Within-sector effect of FDI by occupation (2nd stage IV results) (1) (2) (3) Outcome Variable Wage (ln) Manufacturing Sector All Low-Skill Mf High-Skill Mf
Output MNCs (Lagged 1 Period) * Blue collar 0.0656*** 0.0820*** -0.00314 (0.0192) (0.0213) (0.00917) Output MNCs (Lagged 1 Period) * White collar 0.0823*** 0.0985*** 0.0359*** (0.0216) (0.0288) (0.0110) Controls Education, Gender, Age, Sectoral Tariffs Fixed effects Region-Year, Sector Observations 209,086 191,425 17,471
Source: Authors calculations. Note: Standard errors are clustered at the region*sector level. See annex 2 for details.
Effects by employment status
Most of the wage benefits of MNC activity in Indonesia’s manufacturing sector accrue to employees.
Table 5 shows results that interact MNC output share with different job types. For both casual workers
and self-employed, we see a negative effect on average wages. These results are in line with different
explanations. The most likely option is that FDI increases the demand for formal employees. As the most

20
skilled workers are absorbed by MNCs, average wages for casual workers and self-employed workers may
go down. An alternative, less likely scenario is that these other workers are self-employed or work for
small, informal firms, and face increased competition over prices of their products from manufacturing
MNCs and thus see downward pressure on their earnings. Interestingly, self-employed do appear to
benefit in high-skilled manufacturing, which could possibly indicate increased demand for producers of
inputs for high-skilled manufacturing.
Table 5. Within-sector effect of FDI by employment status (2nd stage IV results) (1) (2) (3) Outcome Variable Wage (ln) Manufacturing Sector All Low-Skill Mf High-Skill Mf
MNCs Output Share (Lagged 1 Period) * Self-Employed -0.246* -0.308*** 0.220** (0.126) (0.111) (0.0864) MNCs Output Share (Lagged 1 Period) * Employee 0.379*** 0.523*** 0.0753* (0.0831) (0.0877) (0.0433) MNCs Output Share (Lagged 1 Period) * Casual Worker -1.048*** -0.956*** -1.339*** (0.191) (0.192) (0.330) Controls Education, Gender, Age, Sectoral Tariffs Fixed effects Region-Year, Sector Observations 154292 138153 15928
Source: Authors’ calculations. Note: Standard errors are clustered at the region*sector level. See annex 2 for details.
Effects by gender
Female workers in low-skilled manufacturing are among the biggest beneficiaries of increased MNC
activity in Indonesian manufacturing. Table 6 shows the effect of the interaction between MNC output
share and gender on wages. The overall effect is positive but insignificant for males. For females, the
overall effect is positive and highly significant, especially in the low-skilled manufacturing subset. This may
be explained by the gender-bias in the types of industries dominated by MNCs (e.g. apparel, leather, and
food products) which employ a large number of females. Evidence for this is presented in Figure 6, which
shows a clear positive relationship between the share of employment from foreign-owned firms and the
share of female employment. An alternative or complementary explanation may be that FDI leads to a
rise in the total demand for labor, thus creating job opportunities for otherwise informally working women

21
(see, for instance, Ver Beek 2001). It might also point to wage discrimination against females by domestic
firms or a preference of (higher paying) MNCs for hiring women (Tang and Zhang 2007).
Table 6. Within-sector effect of FDI by gender (2nd stage IV results) (1) (2) (3) Outcome Variable Wage (ln) Manufacturing Sector All Low-Skill Mf High-Skill Mf
MNCs Output Share (Lagged 1 Period) * Female 0.622*** 0.685*** 0.161** (0.0956) (0.115) (0.0736) MNCs Output Share (Lagged 1 Period) * Male 0.00295 -0.00802 0.0120 (0.0750) (0.0955) (0.0350) Controls Education, Gender, Age, Sectoral Tariffs Fixed effects Region-Year, Sector Observations 154292 138153 15928
Source: Authors’ calculations. See annex 2 for details.
Figure 6. Share of Female Employment and Share of Foreign Firms’ Employment by Sector
Source: Authors’ calculations. Note: average from 2007-2015.

22
Overall, we find that manufacturing MNCs have important, but heterogenous effects on a sector’s
wages. FDI increases average wages, and benefits most workers who have at least primary education. Yet,
some workers are expected to benefit more than others. There is a skills premium, so that higher-
educated workers would benefit more, and white-collar workers see greater benefits than blue-collar
workers. Interestingly, women appear to benefit more than men (likely as a result of the type of sectors
MNCs engage in). Overall, the effects are more widespread for low-skilled than higher skilled
manufacturing sectors, so that such sectors may still need to be prioritized for promoting investment).
6. THE EFFECT OF FDI ON INTER-SECTORAL EMPLOYMENT AND OUTPUT
Across districts in Indonesia, we see that the total number of manufacturing MNCs is significantly
associated with their manufacturing employment and output. Figure A.3 provides a set of scatterplots
that show the descriptive relationships between the number of manufacturing MNCs (they key proxy
variable for FDI in this section), and manufacturing employment shares (Panel A) or manufacturing GDP
(Panel B). For each graph, the blue fitted line shows a clear, upward trend that is reasonably tightly fitted
(as indicated by the R-Squared of 35 and 60% respectively). A notable finding here is that the effect from
MNCs appears to be non-linear, and increases more for higher numbers of MNC firms. This may suggest
that aggregation of many MNCs may lead to agglomeration effects within districts (see Crozet, Mayer and
Muchielli, 2004; Wagner and Timmins, 2009).
Effects on employments
Our regression analysis suggests that manufacturing MNCs significantly affect aggregate employment,
as well as the relative employment shares of various sectors. Results on the second-stage IV for the
district-level regressions show that as a district’s gains a manufacturing MNC, its total employment in the
district increases by 0.4% (Table 7, regression 1). The overall employment share also changes when more
manufacturing MNCs come in. This raises the total manufacturing employment share (Table 7, regression

23
2), and lowers the services employment share by roughly the same amount (Table 7, regression 4). A small
negative effect on primary employment is observed, but this is not statistically significant (Table 7,
regression 3). Interestingly, when breaking down services employment in low- and high-skilled services
(see Annex table A2 for details), the whole shift towards manufacturing appears to come from low-skilled
services (Table 7, regression 5). In contrast, an increase in the number of manufacturing MNCs appears to
have no significant effect on high-skilled services’ employment shares (Table 7, regression 6).
Table 7. Effect of FDI on employment across sectors (2nd stage IV results) (1) (2) (3) (4) (5) (6)
VARIABLES Log(Total
Emp) Manu Emp
Share Primary
Emp Share Services
Emp Share
Low-Skilled Services
Emp Share
High-Skilled Services
Emp Share
MNC Count (Mfn) 0.00395*** 0.00152*** -0.000035 -0.00148*** -0.00152*** 0.000039 (0.000464) (0.000156) (0.000160) (0.000183) (0.000187) (0.000062) Controls Number of domestic manufacturing firms Fixed effects Region, Year Observations 2,218 2,218 2,205 2,205 2,205 2,205 R-squared 0.990 0.940 0.987 0.974 0.960 0.938
Note: Authors’ calculations. Note: Mfn = manufacturing. Standard errors are clustered at the region level. See annex 2 for details.
A simple counterfactual exercise shows that applied to Indonesia as a whole, the effects on
manufacturing employment are large. Using the findings in Table 7 suggests that manufacturing FDI
created a total of 3.1 million new manufacturing jobs in Indonesia between 2007 and 2015 (Figure 7). In
total, over 4.6 million new jobs were created in Indonesia due to manufacturing FDI. In aggregate this
raises the overall share of manufacturing jobs by around 3%, while lowering the employment share for
primary and service sectors by 1.3 and 1.5% respectively (Table 8).
Figure 7. Total manufacturing employment with- and without FDI (counterfactual results)

24
Source: Authors’ calculations.
Table 8. Effect of manufacturing FDI on national employment shares (%)
year Manufacturing Sector Primary Sector Service Sector
Current No FDI Effect Current No FDI Effect Current No FDI Effect
2007 14.5% 12.4% +2.2% 45.4% 46.0% -0.7% 40.0% 41.1% -1.1% 2008 14.5% 12.2% +2.3% 44.6% 45.4% -0.8% 40.8% 42.0% -1.2% 2009 14.7% 12.4% +2.3% 44.1% 45.1% -1.1% 41.3% 42.5% -1.2% 2010 15.6% 13.0% +2.7% 42.8% 44.1% -1.3% 41.5% 42.8% -1.3% 2011 17.0% 13.8% +3.2% 41.1% 42.7% -1.6% 41.9% 43.5% -1.6% 2012 17.7% 14.6% +3.2% 39.8% 41.0% -1.2% 42.4% 44.1% -1.7% 2013 17.2% 13.8% +3.4% 39.5% 41.0% -1.5% 43.3% 45.0% -1.8% 2014 17.0% 13.6% +3.4% 38.7% 40.2% -1.5% 44.3% 46.1% -1.9% 2015 16.7% 13.2% +3.4% 37.3% 38.9% -1.6% 46.0% 47.9% -1.8%
Average 16.1% 13.2% +2.9% 41.5% 42.7% -1.3% 42.4% 43.9% -1.5%
Source: Authors calculations using regression results from Table .
Effects on output and structural transformation
Manufacturing FDI also contributes to the overall district-level GDP, stimulating both the manufacturing
and services sector. Table 9 presents the 2nd stage-IV results when considering the effect of manufacturing
MNCs on GDP in the three broad sectors. This suggests that each additional MNC coming into a district
raises the real manufacturing GDP by 0.4 billion. Interestingly, it also has a positive spillover effect on the
real services GDP, with an effect size of 0.4 billion. However, we see that an increased focus on
manufacturing reduces a district’s primary GDP by 0.12 billion (possibly by diverting capital investment
away from agriculture and mining and into manufacturing and services).

25
Table 9. Effect of FDI on output across sectors (2nd stage IV) (1) (2) (3)
Outcome Variable Real GDP in Manufacturing
(IDR Billion) Real GDP in Primary
(IDR Billion) Real GDP in Services
IDR Billion)
MNC Count (Mfn) 0.397*** -0.115*** 0.434*** (0.0210) (0.0310) (0.0680) Controls Number of domestic manufacturing firms Fixed effects Region, Year Observations 2,218 2,218 2,218 R-squared 0.982 0.946 0.970
Note: Authors’ calculations. Mfn = manufacturing. Standard errors are clustered at the region level. See annex 2 for details.
Putting together the results, we find that manufacturing FDI has significant effects on inter-sectoral
employment and output dynamics, and helps bring about structural transformation. Table 10 presents
the current and counterfactual output per worker across the three main sectors, as estimated through
the regressions above (Table 7 and Table 9). This shows that increased manufacturing FDI is associated
with a significant increase in the output per worker in manufacturing, and an increase in output per worker
in services (likely because low-skilled workers moved out of the sector and towards manufacturing). Figure
8 provides the summary of these results, visualizing the effect of manufacturing FDI on each sector’s
output per worker and employment share in 2015. In line with expectations, the biggest effect from
manufacturing FDI comes from an increased output per worker in the manufacturing sector (the within-
sector effect). We also find evidence of structural transformation, where workers move out of lower-
productivity and into higher-productivity-sectors (the across-sector effect). Jointly, this suggests that
attracting more manufacturing FDI will be highly important for generating high-value jobs in Indonesia.
Table 10. Effect of manufacturing FDI on output per worker (IDR Million)
year Manufacturing Sector Primary Sector Service Sector
Current No FDI Effect Current No FDI Effect Current No FDI Effect
2007 121 80 +40 33 37 -4 86 69 +17 2008 128 88 +40 37 41 -4 88 70 +17 2009 129 89 +40 37 41 -4 91 74 +18 2010 126 90 +37 41 45 -4 96 79 +18 2011 122 83 +39 50 55 -5 103 83 +20 2012 118 81 +37 53 58 -6 105 85 +20

26
2013 129 91 +39 57 63 -6 113 93 +20 2014 136 97 +39 60 66 -6 116 96 +20 2015 143 102 +41 60 66 -6 117 98 +20
Average 128 89 +39 48 52 -5 102 83 +19
Source: Authors calculations using regression results from Table and Table .
Figure 8. Employment share & output per worker in 2015, with and without manufacturing FDI.
Source: Authors’ calculations.
7. CONCLUSION
The analysis in this report finds that manufacturing FDI are key for Indonesia’s middle-class job creation,
and bring significant benefits in terms of higher wages, new manufacturing employment and structural
transformation. The analysis links firm-level data with labor force survey data and exploits regional
variations in MNC activity to assess how manufacturing FDI affects employment and wages in its own
sector, and aggregate employment and output across sectors. From this, we find that FDI brings significant
benefits to Indonesia in terms of higher wages, new manufacturing employment and structural
transformation (intersectoral labor re-allocation and increased output-per-worker). The study finds that
manufacturing MNCs raise average wages in their sector. Yet, higher-educated workers benefit more, and

27
white-collar workers see greater benefits than blue-collar workers, indicating that FDI inflows are
associated with a skill premium. The benefits of FDI are more widespread for the low-skilled than high-
skilled manufacturing sector. Women also appear to benefit more than men, likely as a result of the type
of labor-intensive sectors MNCs engage in.
It is likely the case that the heterogeneity of sectors within manufacturing matters a lot to the
employment and wage effects and to the inequality effects observed for FDI. The analysis suggests that
employment and wage effects are more likely to arise for the low-skilled manufacturing sector, and for
women. Indeed, this paper suggests the gender effects are due to labor market sorting, with women being
more prevalent in sectors benefitting a lot from FDI. We find evidence of a clear positive relationship
between the share of employment from foreign-owned firms and the share of female employment. This
may suggest that foreign investment in specific low-skilled sectors such as garment manufacturing is
labor-augmenting and that in such a case, for example, the provision of a sewing machine dramatically
increases the marginal product per hour worked of a seamstress.
Indonesia can further raise the potential of FDI for its development by using more targeted foreign
investment promotion and by removing FDI restrictions. Targeting foreign investment promotion to a
select set of priority sectors can improve the overall effectiveness of investment promotion agencies
(Javorcik 2004). This report found that while there are significant benefits from all manufacturing FDI, the
aggregate labor market effects are most widespread for low-skilled manufacturing sectors (in line with its
wider skill base). Yet, on the strategic roadmap of the Indonesian Investment Coordinating Board (BKPM)
(BKPM (2020), there is no explicit focus on low-skilled manufacturing sectors. The BKPM may wish to
consider a more targeted approach to help the promotion and facilitation of foreign investors in low-
skilled manufacturing. Another priority lies with the removal of FDI restrictions. Firm-level evidence
suggests that removing such FDI restrictions will likely increase foreign investment, crowd in domestic
investment and increase technological spillovers and productivity growth in domestic firms (Cali et al,

28
forthcoming). As noted recently by the World Bank’s Indonesia country office: By removing heavy
restrictions on investment and signaling that Indonesia is open for business, the Omnibus Law on Job
Creation can help attract investors, create jobs and help Indonesia fight poverty” (World Bank, 2020d).
The evidence presented in this paper should reaffirm to policy makers the critical role of FDI for
development, however, further research is needed to better understand the policy levers that shape
the inflow of manufacturing FDI, and the transmission effects of such FDI on wage, employment and
structural transformation. This report sought out to identify the aggregate relationship between
manufacturing FDI and employment dynamics but could not directly observe the factors that shape this
dynamic. Future research would be warranted to directly explore the impacts of different policies (e.g.
investment regulations, labor laws and social protection) that may shape the inflow of FDI and its impact
on employment and wage dynamics in Indonesia. In addition, it should also consider the transmission
effects more explicitly. Possible questions include whether the employment and wage effects are driven
more by exporting FDI firms (tapping into external demand) or by domestic-market-supplying FDI firms
(tapping into the changing composition of domestic consumer demand as Indonesia grows). It would also
be worth considering to what extent some types of manufacturing FDI are preferable to policymakers
over others. This may depend in part on the expected productivity spillovers brought by different types
of manufacturing FDI. In addition, it also depends on whether investment is labor augmenting (e.g. a
sewing machine that require a worker to deploy it) or labor displacing (e.g. computerized robots in
Mexico’s car manufacturing plants). We leave such extensions to future researchers.

29
Annex 1: Additional graphs
Figure A1. MNC activity shares over time
Source: Authors’ calculations using Indonesia’s manufacturing survey
Figure A2. Growth of MNC activity by sector
Panel A. Number of MNCs (relative to 2007)
Panel B. Growth of MNC activity (relative to 2007)

30
Source: Authors’ calculations using Indonesia’s manufacturing survey
Figure A3: District scatterplots - MNC count and manufacturing employment numbers, shares and GDP
Panel A: MNC firms and manufacturing employment shares
Panel C: MNC firms and manufacturing GDP

31
Source: Authors’ calculations. Note: each dot represents a district per year. Scatterplots cover 2007-2015.
Annex 2: Additional tables Table A1 – Sector classification
Broad sector Subsectors
Low-skilled manufacturing
Food, beverages, and tobacco products
Wood and wood products
Other nonmetallic mineral products
Fabricated metal
Paper and paper products; printing and publishing
Rubber and plastics products
Basic metals
Textiles, wearing apparel, and leather products
Furniture; manufacturing n.e.c. (not specified)
High-skilled manufacturing
Coke and refined petroleum products
Chemicals and chemical products
Machinery and equipment n.e.c. (not specified)
Transport equipment
Electrical machinery and equipment
Computer, electronics, optical equipment
Pharmaceutical products
Low-skilled services
Construction
Wholesale and retail trade; repair of motor vehicles and motorcycles
Transportation and storage (land, warehousing)
Accommodation and food service activities
Security, landscape and employment activities
High-skilled services
Transportation and storage (water, air, postal)
Information and communication
Financial and insurance activities

32
Professional, scientific and technical activities
Travel agencies and tour operators
Office administration and other business support activities
Source: Authors’ elaborations following Steenbergen and Tran (2020) and Hallward-Driemeier and Nayyar (2017). Note: Based on the ISIC Rev4 classification. Low-skilled manufacturing is made up of ISIC 10-18, 22-24, 31-32. High-skilled manufacturing covers ISIC 19-21, 25-30, 33. Low-skilled services is defined by ISIC 41-49, 52, 55-56, 68, 77-78, 80, 81. High-skilled services covers ISIC 50-51, 53, 58-66, 69-75, 79, 82. n.e.c. = not elsewhere classified.
Table A2. Descriptive statistics of manufacturing labor force
Year General Level of Education Employment Type
Occupation Type
(% Male)
Av. Age
No education
Primary education
Secondary education
Tertiary education
Self-employed Employee
Casual Worker
Blue collar
White collar
2008 55% 33 9% 54% 32% 4% 16% 75% 9% 88% 12% 2009 54% 33 12% 49% 35% 5% 11% 78% 11% 87% 13% 2010 55% 33 10% 48% 38% 5% 21% 73% 6% 86% 14% 2011 57% 33 10% 49% 38% 3% 13% 81% 6% 87% 13% 2012 57% 34 9% 47% 39% 5% 10% 84% 6% 86% 14% 2013 58% 34 9% 46% 41% 5% 11% 85% 4% 84% 16% 2014 58% 34 8% 45% 42% 5% 11% 83% 6% 86% 14% 2015 58% 35 8% 43% 43% 6% 11% 83% 6% 84% 16%
Av. 57% 34 9% 48% 39% 5% 13% 80% 7% 86% 14%
Source: Authors calculations using labor force survey

33
Additional tables and robustness checks Table A.3 Within-sector effect of FDI – OLS results
(1) (2) (3) (4) (5) (6) (7) (8) (9) (10) (11) (12) (13)
Outcome Variable Wage (ln)
Manufacturing Sector All All Low-Skill Mf
High-Skill Mf All
Low-Skill Mf
High-Skill Mf All
Low-Skill Mf
High-Skill Mf All
Low-Skill Mf
High-Skill Mf
MNC Output Share (Lagged) 0.128***
(0.0269) MNC Output Share (Lagged) * No Education 0.00997 0.00735 -0.00503
(0.0574) (0.0634) (0.0837)
MNC Output Share (Lagged) * Primary 0.167*** 0.200*** -0.0378
(0.0381) (0.0411) (0.0364)
MNC Output Share (Lagged) * Secondary 0.107*** 0.139*** 0.0204
(0.0263) (0.0279) (0.0262)
MNC Output Share (Lagged) * Tertiary 0.132* 0.224** -0.0425
(0.0686) (0.0968) (0.0728)
MNC Output Share (Lagged) * Blue Collar 0.0923*** 0.132*** -0.0536*
(0.0303) (0.0321) (0.0315)
MNC Output Share (Lagged) * White Collar 0.309*** 0.365*** 0.128***
(0.0380) (0.0367) (0.0390) MNC Output Share (Lagged) * Self-employed
-0.249***
-0.286*** 0.122**
(0.0765) (0.0747) (0.0548)
MNC Output Share (Lagged) * Employee 0.214*** 0.278*** 0.00274
(0.0424) (0.0425) (0.0315) MNC Output Share (Lagged) * Casual Worker
-0.629***
-0.590*** -0.894***
(0.133) (0.131) (0.134)
MNC Output Share (Lagged) * Female 0.323*** 0.335*** 0.129***
(0.0351) (0.0408) (0.0414)
MNC Output Share (Lagged) * Male -0.0207 0.00321 -0.0475
(0.0256) (0.0290) (0.0338)
Controls Education, Gender, Age, Sectoral Tariffs
Fixed effects Region-Year, Sector
Observations 154292 154292 138153 15928 154283 138146 15926 154292 138153 15928 154292 138153 15928
Note: Robust standard errors in parentheses. * p<0.10 ** p<0.05 *** p<0.01"

34
Table A. 4 Within-sector effect of FDI – Robustness Check (Additional Controls) (1) (2) (3) (4) (5) (6) (7) (8) (9) (10) (11) (12) (13)
Outcome Variable Wage (ln)
Manufacturing Sector All All Low-Skill Mf
High-Skill Mf All
Low-Skill Mf
High-Skill Mf All
Low-Skill Mf
High-Skill Mf All
Low-Skill Mf
High-Skill Mf
MNC Output Share (Lagged) 0.197***
(0.0612) MNC Output Share (Lagged) * No Education 0.0219 0.0170 -0.296
(0.158) (0.162) (0.379)
MNC Output Share (Lagged) * Primary 0.257*** 0.322*** 0.0542
(0.0728) (0.0783) (0.0468)
MNC Output Share (Lagged) * Secondary 0.168** 0.230*** 0.107**
(0.0677) (0.0757) (0.0532)
MNC Output Share (Lagged) * Tertiary 0.239* 0.384** 0.0786
(0.126) (0.196) (0.0790)
MNC Output Share (Lagged) * Blue Collar 0.137** 0.213*** 0.00574
(0.0642) (0.0698) (0.0663)
MNC Output Share (Lagged) * White Collar 0.443*** 0.579*** 0.248***
(0.0812) (0.0890) (0.0542) MNC Output Share (Lagged) * Self-employed -0.262*
-0.332*** 0.171***
(0.136) (0.126) (0.0653)
MNC Output Share (Lagged) * Employee 0.354*** 0.485*** 0.0916*
(0.0822) (0.0881) (0.0490) MNC Output Share (Lagged) * Casual Worker
-1.182***
-1.088*** -1.518***
(0.189) (0.189) (0.435)
MNC Output Share (Lagged) * Female 0.600*** 0.640*** 0.192**
(0.0978) (0.114) (0.0888)
MNC Output Share (Lagged) * Male -0.0321 -0.0338 0.0128
(0.0745) (0.0947) (0.0518)
Controls Education, Gender, Age, Marital Status, Rural/Urban, Sectoral Tariffs
Fixed effects Region-Year, Sector
Observations 119858 119858 107235 12459 119850 107229 12457 119858 107235 12459 119858 107235 12459
Note: Robust standard errors in parentheses. * p<0.10 ** p<0.05 *** p<0.01"
Table A.5 Within-sector effect of FDI – Robustness Check (MNC Value Added Shares) (1) (2) (3) (4) (5) (6) (7) (8) (9) (10) (11) (12) (13)
Outcome Variable Wage (ln)
Manufacturing Sector All All Low-Skill Mf
High-Skill Mf All
Low-Skill Mf
High-Skill Mf All
Low-Skill Mf
High-Skill Mf All
Low-Skill Mf
High-Skill Mf
MNC Value Added Share (Lagged) 0.228***

35
(0.0607)
MNC Value Added Share (Lagged) * No Education -0.0179 -0.00808 -0.364
(0.171) (0.179) (0.306)
MNC Value Added Share (Lagged) * Primary
0.253*** 0.325*** 0.00931
(0.0753) (0.0810) (0.0387)
MNC Value Added Share (Lagged) * Secondary
0.233*** 0.309*** 0.105**
(0.0683) (0.0706) (0.0426)
MNC Value Added Share (Lagged) * Tertiary
0.369*** 0.620*** 0.0974
(0.119) (0.151) (0.0871)
MNC Value Added Share (Lagged) * Blue Collar 0.156** 0.241*** -0.0173
(0.0652) (0.0708) (0.0476)
MNC Value Added Share (Lagged) * White Collar
0.518*** 0.686*** 0.249***
(0.0851) (0.0756) (0.0547) MNC Value Added Share (Lagged) * Self-employed -0.238* -0.309*** 0.229**
(0.130) (0.114) (0.0963)
MNC Value Added Share (Lagged) * Employee 0.381*** 0.520*** 0.0828*
(0.0807) (0.0818) (0.0458) MNC Value Added Share (Lagged) * Casual Worker
-1.029*** -0.942*** -1.315***
(0.199) (0.198) (0.341)
MNC Value Added Share (Lagged) * Female
0.619*** 0.688*** 0.147*
(0.0924) (0.110) (0.0835)
MNC Value Added Share (Lagged) * Male 0.00906 -0.00818 0.0227
(0.0727) (0.0933) (0.0338)
Controls Education, Gender, Age, Sectoral Tariffs
Fixed effects Region-Year, Sector
Observations 154292 154292 138153 15928 154283 138146 15926 154292 138153 15928 154292 138153 15928
Note: Robust standard errors in parentheses. * p<0.10 ** p<0.05 *** p<0.01"
Table A.6 Within-sector effect of FDI – Robustness Check (Limited Information Maximum Likelihood)
(1) (2) (3) (4) (5) (6) (7) (8) (9) (10) (11) (12) (13)
Outcome Variable Wage (ln)
Manufacturing Sector All All Low-Skill Mf
High-Skill Mf All
Low-Skill Mf
High-Skill Mf All
Low-Skill Mf
High-Skill Mf All
Low-Skill Mf
High-Skill Mf
MNC Output Share (Lagged) 0.226***
(0.0629) MNC Output Share (Lagged) * No Education -0.0178 -0.00526 -0.377
(0.172) (0.182) (0.302)
MNC Output Share (Lagged) * Primary 0.256*** 0.331*** -0.0165

36
(0.0775) (0.0847) (0.0424)
MNC Output Share (Lagged) * Secondary 0.230*** 0.311*** 0.107**
(0.0709) (0.0753) (0.0421)
MNC Output Share (Lagged) * Tertiary 0.360*** 0.610*** 0.0764
(0.121) (0.159) (0.0921)
MNC Output Share (Lagged) * Blue Collar 0.153** 0.245*** -0.0246
(0.0675) (0.0756) (0.0436)
MNC Output Share (Lagged) * White Collar 0.514*** 0.680*** 0.246***
(0.0853) (0.0803) (0.0553) MNC Output Share (Lagged) * Self-employed -0.245*
-0.307*** 0.221**
(0.127) (0.112) (0.0867)
MNC Output Share (Lagged) * Employee 0.381*** 0.525*** 0.0757*
(0.0839) (0.0883) (0.0435) MNC Output Share (Lagged) * Casual Worker
-1.050***
-0.957*** -1.339***
(0.192) (0.193) (0.330)
MNC Output Share (Lagged) * Female 0.624*** 0.688*** 0.161**
(0.0962) (0.115) (0.0737)
MNC Output Share (Lagged) * Male 0.00372 -0.00765 0.0122
(0.0756) (0.0964) (0.0351)
Controls Education, Gender, Age, Sectoral Tariffs
Fixed effects Region-Year, Sector
Observations 154292 154292 138153 15928 154283 138146 15926 154292 138153 15928 154292 138153 15928
Note: Robust standard errors in parentheses. * p<0.10 ** p<0.05 *** p<0.01"
Table A.7 Intersectoral effect of FDI on employment – additional results (total emp, emp shares)
OLS IV-2SLS
(1) (2) (3) (4) (7) (8) (9) (10) VARIABLES Log(Total Emp) Manu Emp Share Primary Emp Share Services Emp Share Log(Total Emp) Manu Emp Share Primary Emp Share Services Emp Share
Number of MNC Manufacturing Firms 0.000648** 0.000550*** -0.000115* -0.000434*** 0.00395*** 0.00152*** -0.0000319 -0.00148***
(0.000308) (0.0000914) (0.0000699) (0.000104) (0.00102) (0.000366) (0.000228) (0.000417) Number of Domestic Manufacturing Firms 0.0000454 0.000115*** -0.0000831*** -0.0000317 -0.000390** -0.0000131 -0.0000941*** 0.000107*
(0.0000564) (0.0000322) (0.0000190) (0.0000362) (0.000152) (0.0000573) (0.0000338) (0.0000650) Fixed Effects Region, Year Region, Year Observations 2215 2215 2215 2201 2215 2215 2215 2201 N_clust r2_a -0.108 0.0615 -0.102 -0.0716 -0.531 -0.186 -0.103 -0.308 idstat 8.673 8.673 8.673 8.664 idp 0.0131 0.0131 0.0131 0.0131 widstat 5.822 5.822 5.822 5.814 j 0 0 0 0 0.0224 0.00220 1.117 0.353 jp 0.881 0.963 0.291 0.552
Note: Robust standard errors in parentheses. * p<0.10 ** p<0.05 *** p<0.01"
Table A.8 Intersectoral effect of FDI on employment – additional results (low- and high-skilled services)
OLS IV-2SLS

37
(1) (2) (3) (4) VARIABLES Low-Skilled Services Emp Share High-Skilled Services Emp Share Low-Skilled Services Emp Share High-Skilled Services Emp Share Number of MNC Manufacturing Firms -0.000420*** -0.0000151 -0.00152*** 0.0000390
(0.0000991) (0.0000204) (0.000406) (0.000166) Number of Domestic Manufacturing Firms 0.0000244 -0.0000559*** 0.000170*** -0.0000630**
(0.0000363) (0.0000121) (0.0000649) (0.0000268) Fixed Effects Region, Year Region, Year Observations 2215 2201 2215 2201 N_clust r2_a -0.0925 -0.0694 -0.351 -0.0739 idstat 8.673 8.664 idp 0.0131 0.0131 widstat 5.822 5.814 j 0 0 0.0121 1.502 jp 0.913 0.220
Note: Robust standard errors in parentheses. * p<0.10 ** p<0.05 *** p<0.01"
Table A.9 Effect on output across sectors – additional results
OLS IV-2SLS
(1) (2) (3) (4) (5) (6)
VARIABLES Real GDP Manu (IDR b)
Real GDP Prim (IDR b)
Real GDP Serv (IDR b)
Real GDP Manu (IDR b)
Real GDP Prim (IDR b)
Real GDP Serv (IDR b)
Number of MNC Manufacturing Firms 0.199*** -0.0475*** 0.0662** 0.397*** -0.115** 0.434*
(0.0202) (0.00940) (0.0319) (0.0718) (0.0541) (0.227) Number of Domestic Manufacturing Firms -0.00351 0.0144*** -0.0869*** -0.0298** 0.0234*** -0.135***
(0.00724) (0.00341) (0.0199) (0.0124) (0.00856) (0.0323) Fixed Effects Region, Year Region, Year Observations 2215 2215 2215 2215 2215 2215 N_clust r2_a 0.463 -0.112 -0.0190 -0.0517 -0.142 -0.214 idstat 8.673 8.673 8.673 idp 0.0131 0.0131 0.0131 widstat 5.822 5.822 5.822 j 0 0 0 0.541 0.0150 0.0000578 jp 0.462 0.902 0.994
Note: Robust standard errors in parentheses. * p<0.10 ** p<0.05 *** p<0.01"

38
Annex 3: Robustness, possible limitations and future improvements
The main empirical challenge is to separate the impact of FDI from other unobserved changes in policies
or market trends that can affect the labor markets at the same time. For example, infrastructure spending
can attract FDI as well as other domestic investments that boost employment and wages. MNCs in certain
sectors can also choose to locate in low-wage regions because of cost considerations, in which case higher
FDI activity might appear to be associated with lower wages. As a result, a simple correlation between FDI
activity and labor market outcomes can either inflate or underestimate the true impact of FDI. To account
for this potential bias, lagged global FDI growth was used as an instrument to capture supply-side changes
that affect FDI inflows and eventually MNC presence but are unlikely to be correlated with other domestic
shocks.
The overall validity of the analysis thus depends on the instrumental variable, which rests on two key
components: relevance and exogeneity.
To assess relevance (weak identification), we first consider the Kleibergen-Paap Wald F-statistic. This
metric is consistently significantly different from zero, and bigger than 10 for all regressions (suggesting
high relevance). A second check is to see if the instrument is significant in the first-stage. This is the case
for all across-sector regressions, and for the main within-sector regressions. Due to challenges of sample
size, we see that not all of the regressions with interactions (on education, gender and work status) are
significant, which suggests that the instrument is somewhat weak (a limitation of the analysis). This
challenge is exacerbated when considering interactions on a reduced sample (e.g. education for high-
skilled manufacturing) due to challenges of statistical power.
Global FDI in manufacturing appears a highly exogenous instrument (and in line with much of the
literature that uses global supply shocks to measure in-country economic dynamics). While exogeneity

39
can never be fully proven with statistical tests, one helpful metric comes from the Hansen J-statistic,
where the joint null hypothesis is that the instruments are valid, i.e., uncorrelated with the error term,
and that the excluded instruments are correctly excluded from the estimated equation. In all the
regressions on the across-sector analysis, the p-value much exceeds 10%, so that the null is not rejected
(indicating a valid instrument). In the case of the within-sector analysis, however, the results vary, with
some of the p-values around or just below 5% (especially for smaller samples, e.g. those interactions that
are restricted to higher-skilled manufacturing). This suggest that part of the within-sector analysis may be
over-identified, and that some of the regressions (especially the interactions and reduced samples) have
to be interpreted with caution. This is a second weakness of the analysis.
Going forward it would be important to continue to look for relevant instruments for FDI (beyond the
global sectoral inflow of FDI) that may be more relevant/specific to Indonesia, but still exogenous. For
now, we believe that the current results are relevant, intuitive and robust to a range of different
specifications. We also made sure to flag any irregularities throughout the report as weaknesses. A range
of additional tests were done for both the within-sector and across-sector analysis (incl. choosing different
proxies for MNCs, adding controls, and changing the time lag), and results were reasonably robust. These
findings are available upon request.

40
References
Abebe, G., S. Caria, M. Fafchamps, P. Falco, S. Franklin, and S. Quinn. 2016. “Anonymity or Distance? Experimental Evidence on Obstacles to Youth Employment Opportunities.” Stanford University. Unpublished.
Abebe, G., S. Caria, M. Fafchamps, P. Falco, S. Franklin, S. Quinn, and F. Shilpi. 2017. “Job Fairs: Matching Firms and Workers in a Field Experiment in Ethiopia.” World Bank, Washington, DC.
Alatas, Hamidah and Maria Monica Wihardja, “Firm-level Analysis of Job Creation Dynamics in the Medium and Large Manufacturing Industry in Indonesia,” forthcoming
Alfonsi, L., O. Bandiera, V. Bassi, R. Burgess, I. Rasul, M. Sulaiman and A. Vitali. 2017. “Tackling Youth Unemployment: Evidence from a Labour Market Experiment in Uganda.” STICERD-Development Economics Papers.
Amann, E., and V. Swati. 2014. “Foreign Direct Investment and Reverse Technology Spillovers: The Effect on Total Factor Productivity.” OECD Journal: Economic Studies, Vol. 2014, 129–53.
Arnold, J. M., B. Javorcik, M. Lipscomb, and A. Mattoo. 2016. ”Services Reform and Manufacturing Performance: Evidence from India.” The Economic Journal 126 (590): 1–39.
Arnold, J.M., Javorcik, B.S., 2009. Gifted Kids or Pushy Parents? Foreign Acquisitions and Plant Productivity in Indonesia. Journal of International Economics 79 (1), 42-53.
Autor, D., D. Dorn, and G. Hanson. 2013. “The China Syndrome: Local Labor Market Effects of Import Competition in the United States.” American Economic Review 103 (6): 2121–68.
Basri, 2019; Blalock, G., Gertler, P.J., 2008. Welfare Gains from Foreign Direct Investment Trough Technology Transfer to Local
Suppliers. Journal of International Economics 74 (2), 402-421. Blomström, M., Sjöholm, F., 1999. Technology Transfer and Spillovers: Does Local Participation with Multinationals
Matter? European Economic Review 43 (4-6), 915-923.Bloom, N., A. Mahajan, D. McKenzie and J.Roberts. 2018. “Do Management Interventions Last? Evidence from India”. World Bank Policy Research Paper 8339, February 2019.
_________2010. “Why Do Firms in Developing Countries Have Low Productivity?” American Economic Review: Papers & Proceedings 2010, 100:2, 619–623. http://www.aeaweb.org/articles.php?doi=10.1257/aer.100.2.619
Bryan, G., S. Chowdhury, and A. M. Mobarak. 2014. “Underinvestment in a Profitable Technology: The Case of Seasonal Migration in Bangladesh.” Econometrica 82 (5): 1671–1748.
BKPM (2020) Strategic Roadmap. Available on https://www2.bkpm.go.id/en/about-bkpm/strategic-roadmap Cali M. and Presidente, G., 2018, “Investment regulation and manufacturing performance: the case of Indonesia”.
World Bank, November 2018. Calì, Massimiliano, Taufik Hidayat, and Claire H. Hollweg. 2018. “Determinants of Labor Mobility Costs in Indonesia.” World Bank. Mimeo. Cali, M., M. Cicowiez, A. Doarest, T. Hidayat, and D. Sharma. Forthcoming. a “The economic impact of investment
provisions: Evidence from Indonesia”. World Bank document, mimeo. Calí, M., A. Doarest, G, Presidente. Forthcoming b. “Foreign entry and domestic performance: Evidence from
Indonesia.” World Bank document, mimeo. Caria, S. and T. Lessing. 2019. “Filling the Gap: How Information Can Help Jobseekers.” Growth Brief, International
Growth Centre. Castley, R.J. 1996. “The Role of Japanese Foreign Investment in South Korea's Manufacturing Sector”. ODI
Development Policy Review. Volume 14, Issue 1. March 1996. Cornia, G. A. 2016. “An Econometric Analysis of the Bifurcation of Within-country Inequality Trends in Sub-Saharan
Africa, 1990–2011.” UNDP Africa Report 267781, United Nations Development Programme (UNDP). Cruz, M., G. Nayyar, G. Toews, and P. Vézina. 2018. “FDI and the Skill Premium: Evidence from Emerging Economies.”
Policy Research Working Paper 8613, World Bank, Washington, DC. David H., David Dorn, and Gordon H. Hanson. 2013. "The China Syndrome: Local Labor Market Effects of Import
Competition in the United States." American Economic Review, 103 (6): 2121-68. Dinga, M., and D. Mnich. 2010. “The Impact of Territorially Concentrated FDI on Local Labor Markets: Evidence from
the Czech Republic.” Labour Economics 17 (2): 354–67.

41
Dix-Carneiro, R., and B. K. Kovak. 2015. “Trade Liberalization and the Skill Premium: A Local Labor Markets Approach.” American Economic Review 105 (5): 551–57.
Dix-Carneiro, Rafael, and Brian K. Kovak. 2015. "Trade Liberalization and the Skill Premium: A Local Labor Markets Approach." American Economic Review, 105 (5): 551-57.
Duggan, Victor, Sjamsu Rahardja and Gonzalo Varela. 2016. “Service Sector Reform and Manufacturing Productivity: Evidence from Indonesia.” World Bank Policy Research Working Paper No.6349
Escobar, Octavio and Mühlen, Henning, (2018) “The role of FDI in structural change: Evidence from Mexico”, No 22-2018, Hohenheim Discussion Papers in Business, Economics and Social Sciences, University of Hohenheim
Escobary, O. and Muhlenz, H. (2018) "The Role of FDI in Structural Change: Evidence from Mexico", September 2018 Feenstra, R., and G. Hanson. 1997. “Foreign Direct Investment and Relative Wages: Evidence from Mexico's
Maquiladoras.” Journal of International Economics 42 (3–4): 371–93. Figini, P., and H. Görg. 2011. “Does Foreign Direct Investment Affect Wage Inequality? An Empirical Investigation.”
The World Economy 34 (9): 1455–75. Franklin, Simon. 2015. “Location, Search Costs and Youth Unemployment: A Randomized Trial of Transport Subsidies
in Ethiopia.” CSAE Working Paper WPS/2015-11, Centre for the Study of African Economies, University of Oxford.
Hale, G., and M. Xu. 2016. “FDI Effects on the Labor Market of Host Countries.” Working Paper 2016-25,Federal Reserve Bank of San Francisco.
Hallward-Driemeier, M., and G. Nayyar. 2017. Trouble in the Making? The Future of Manufacturing-Led Development. Washington, DC: World Bank.
Head, K., and J. Ries. 2002. “Offshore Production and Skill Upgrading by Japanese Manufacturing Firms.” Journal of International Economics 58 (1): 81–105.
Jensen, R. 2012. “Do Labor Market Opportunities Affect Young Women’s Work and Family Decisions? Experimental Evidence from India.” The Quarterly Journal of Economics 127 (2): 753–92.
Karlsson, S., N. Lundin, F. Sjöholm, and P. He. 2009. “Foreign Firms and Chinese Employment.” World Economy 32 (1): 178–201.
Kokko, A. and Thang, T.T. 2014. “Foreign Direct Investment and the Survival of Domestic Private Firms in Viet Nam.” Asian Development Review, vol. 31, no. 1, pp. 53–91., Asian Development Bank.
Leamer, E. 1998. “In Search of Stolper-Samuelson Effects on U.S. Wages.” In Exports, Imports and the American Worker, edited by S. Collins, 141–214. Washington, DC: Brookings Institution Press.
Lee, J.-W., and D. Wie. 2015. “Technological Change, Skill Demand, and Wage Inequality: Evidence from Indonesia.” World Development 67 (C): 238–250.
Lembong, 2019, Lipsey, R. E. 2003. “Foreign Direct Investment, Growth, and Competitiveness in Developing Countries.” In The Global
Competitiveness Report 2002/2003, edited by P. K. Cornelius. New York: Oxford University Press. Lipsey, R.E., 2004. Home- and Host-Country Effects of Foreign Direct Investment. In: Baldwin, R.E., Winters, A. (Eds.),
Challenges to Globalization. University of Chicago Press, Chicago. Lipsey, R.E., Sjöholm, F., 2004. Foreign Direct Investment, Education, and Wages in Indonesian Manufacturing.
Journal of Development Economics 73 (1), 415-422. Sjöholm, Fredrik and Lipsey, Robert E. and Sun, Jing, Foreign Ownership and Employment Growth in Indonesian
Manufacturing (October 8, 2010). IFN Working Paper No. 831. Available at SSRN: https://ssrn.com/abstract=1689560 or http://dx.doi.org/10.2139/ssrn.1689560
Luo, R. 2017. “Skill Premium and Technological Change in the Very Long Run: 1300–1914.” Discussion Papers in Economics 17/09, University of Leicester.Manning, C. and H. Aswicahyono. 2012. Trade and employment in services: the case of Indonesia. ILO Employment working paper no. 132. Geneva: ILO.
McLaren, J., and M. Yoo. 2016. “FDI and Inequality in Vietnam: An Approach with Census Data.” NBER Working Paper 22930, National Bureau of Economic Research, Cambridge, MA.
McMillan, Rodrik and Verduzco-Gallo (2014) "Globalization, Structural Change, and Productivity Growth, with an Update on Africa". World Development Vol. 63, pp. 11–32, 2014 2014 Published by Elsevier Ltd.
Nunnenkamp, P., R. Schweickert, and M. Wiebelt. 2007. “Distributional Effects of FDI: How the Interaction of FDI and Economic Policy Affects Poor Households in Bolivia.” Development Policy Review 25 (4): 429–50.
Pavcnik, N. 2017. “The Impact of Trade on Inequality in Developing Countries.” NBER Working Paper 23878, National Bureau of Economic Research, Cambridge, MA.

42
Peluffo, A. 2015. “Foreign Direct Investment, Productivity, Demand for Skilled Labour and Wage Inequality: An Analysis of Uruguay.” World Economy 38 (6): 962–83.
Steenbergen, V. and Tran, T. (2020) “The distributional effects of FDI”, Chapter 3 in “Global Investment Competitiveness Report”, World Bank.
Takii, S., 2005. Productivity spillovers and characteristics of foreign multinational plants in Indonesian manufacturing 1990–1995. Journal of Development Economics 76 (2), 521-542.
Tang, Heiwai and Zhang, Yifan (2017) Do Multinationals Transfer Culture? Evidence on Female Employment in China. CESIFO Working Paper No. 6295, January 2017
The Economist, 2018 “Jokowi wants to improve the quality of Indonesia’s labour force”, The Economist Ver Beek, K.A., 2001. “Maquiladoras: Exploitation or emancipation? An overview of the situation of maquiladora
workers in Honduras.” World Development, 29 (9): 1553-1567. Waldkirch, A., and P. Nunnenkamp. 2009. “Employment Effects of FDI in Mexico's Non-Maquiladora Manufacturing.”
Journal of Development Studies 45 (7): 1165–83. Wihardja, M. M., and W. Cunningham. Forthcoming. Pathways to Middle-Class Jobs in Indonesia. World Bank.
Internal Document World Bank (2019a) “Development Policy Review 2019 - Indonesia 2030. Rich nation, prosperous people”. World Bank (2019b) “Global economic risks and implications for Indonesia”, World Bank Indonesia World Bank, 2020a “Aspiring Indonesia: Expanding the Middle Class”, World Bank Indonesia _________.2020b. Indonesia Systematic Country Diagnostic. Indonesia: Eliminating Poverty, Bringing Economic
Security to All. World Bank Internal Document _________.2020c. World Development Report 2020: Trading for Development in the Age of Global Value Chains.
Washington, DC: World Bank. doi:10.1596/978-1-4648-1457-0. License: Creative Commons Attribution CC BY 3.0 IGO
_________.2020d. World Bank Statement on Omnibus Law - Job Creation. Jakarta, October 16, 2020. Available on https://www.worldbank.org/en/news/statement/2020/10/16/world-bank-statement-on-omnibus-law-job-creation