The effect of drought and subsequent precipitation pulse on productivity, species composition, and...
40
The effect of drought and subsequent precipitation pulse on productivity, species composition, and carbon fluxes of the herbaceous understorey in a cork oak woodland Marjan Jongen Maria C. Caldeira João S. Pereira Centro de Estudos Florestais Grupo de Ecofisiologia e Melhoramento Florestal Nature Precedings : doi:10.1038/npre.2009.3706.1 : Posted 1 Sep 2009
Transcript of The effect of drought and subsequent precipitation pulse on productivity, species composition, and...
The effect of drought and subsequent precipitation pulse on productivity, species composition, and carbon fluxes of the herbaceous understorey
in a cork oak woodland
Marjan JongenMaria C. CaldeiraJoão S. Pereira
Centro de Estudos FlorestaisGrupo de Ecofisiologia e Melhoramento Florestal
Nat
ure
Pre
cedi
ngs
: doi
:10.
1038
/npr
e.20
09.3
706.
1 : P
oste
d 1
Sep
200
9

• In Mediterranean: 2.3 million hectares• In Portugal: 750.000 hectares
Source: Aronson J, Pereira JS, PausasJG (eds) (2009)
Field data from inventoriesDistribution areaIsolated populations
0 250 500 km
0 75 150 300 miles
MontadosDistribution of Quercus suber (cork oak)
Nat
ure
Pre
cedi
ngs
: doi
:10.
1038
/npr
e.20
09.3
706.
1 : P
oste
d 1
Sep
200
9
Info slide:• The work presented here was carried out in a montado in Portugal.
Montados are savanna-type ecosystems where Quercus suber, the cork oak, is the predominant species. These ecosystems cover nearly 2.3 million hectares in the western Mediterranean region. One can find them in Portugal and Spain, but also in Morocco, northern Algeria and Tunisia, the south of France, and Corsica and Sardinia.
• In Portugal, montados cover approx. 750,000 hectares, representing 23% of the Portuguese forests.
• Montados play an important ecological role in carbon sequestration, water retention and soil conservation, the latter being important for combating desertification.
Nat
ure
Pre
cedi
ngs
: doi
:10.
1038
/npr
e.20
09.3
706.
1 : P
oste
d 1
Sep
200
9
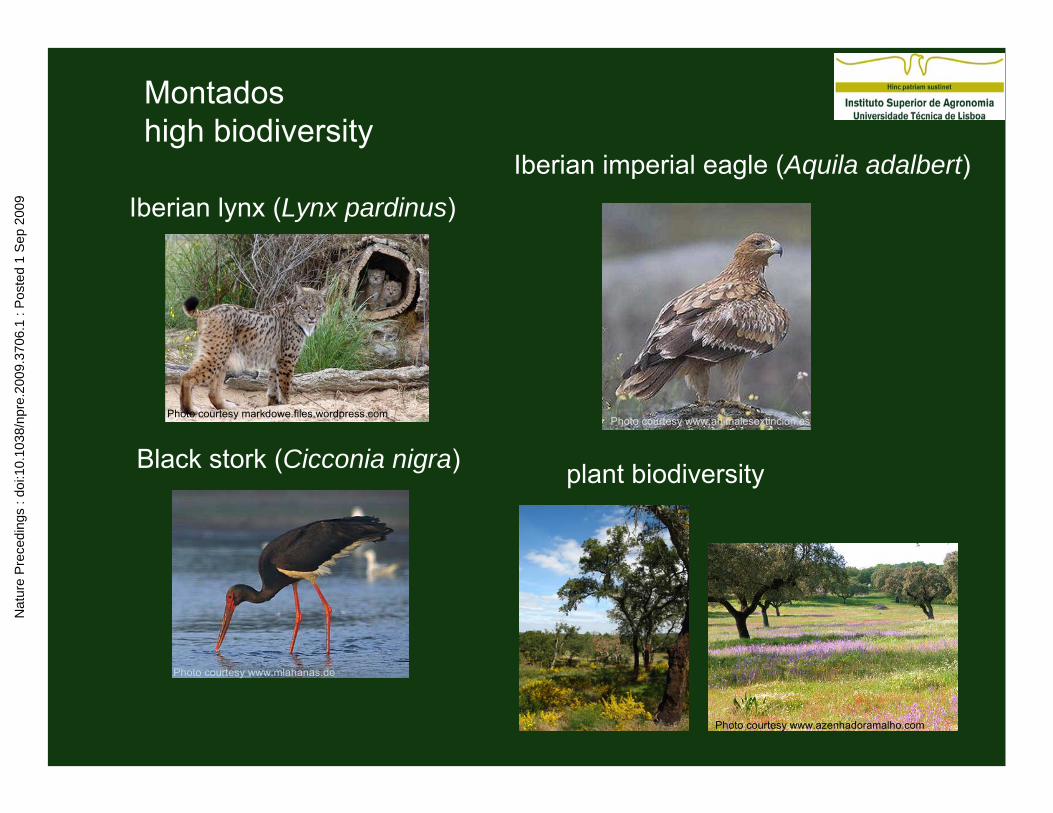
Iberian lynx (Lynx pardinus) Iberian imperial eagle (Aquila adalbert)
Montadoshigh biodiversity
Black stork (Cicconia nigra) plant biodiversity
Photo courtesy www.animalesextincion.esPhoto courtesy markdowe.files.wordpress.com
Photo courtesy www.mlahanas.de
Photo courtesy www.azenhadoramalho.com
Nat
ure
Pre
cedi
ngs
: doi
:10.
1038
/npr
e.20
09.3
706.
1 : P
oste
d 1
Sep
200
9
Info slide:• Biodiversity in montado ecosystems is high, in both flora and fauna.
Montados are habitats for several endangered species such as theIberian lynx (Lynx pardinus), the Iberian Imperial Eagle (Aquilaadalberti) and the Black stork (Cicconia nigra).
• Plant diversity can reach over 100 species in plots of 0.1 ha, many with aromatic, culinary or medicinal value, although plant diversity depends, among others, on agricultural practices.
Nat
ure
Pre
cedi
ngs
: doi
:10.
1038
/npr
e.20
09.3
706.
1 : P
oste
d 1
Sep
200
9
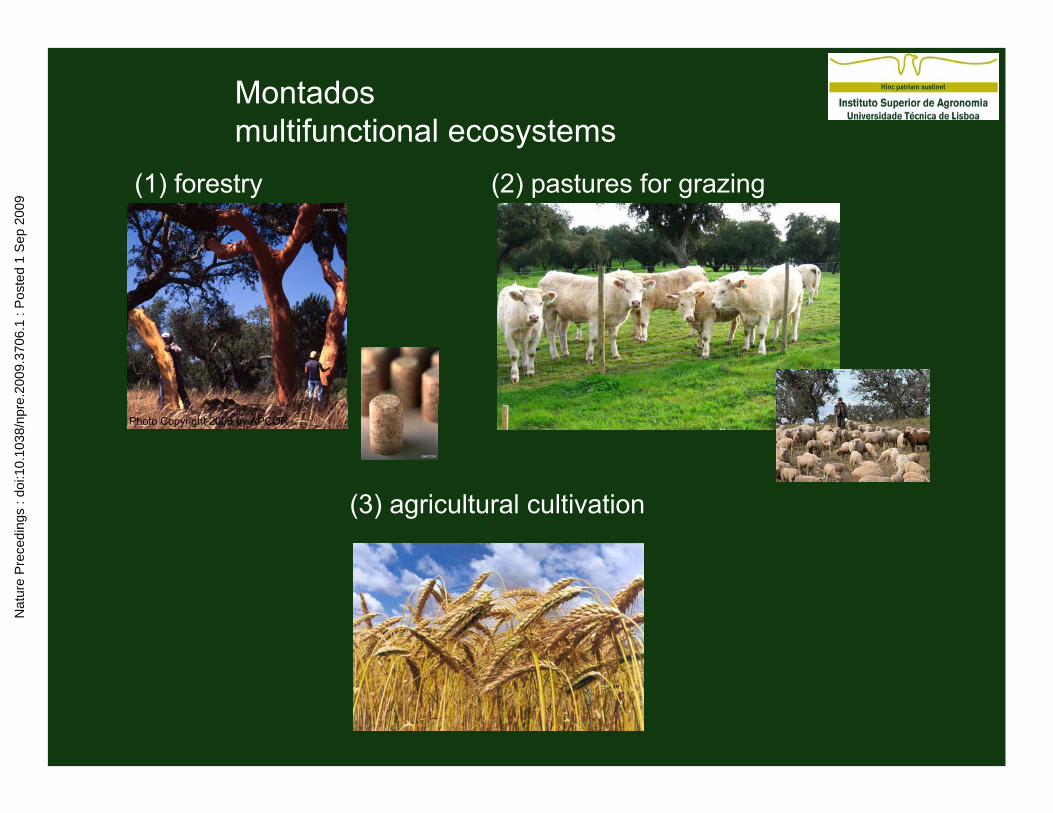
Montadosmultifunctional ecosystems
(1) forestry (2) pastures for grazing
(3) agricultural cultivation
Photo Copyright 2006 by APCOR
Nat
ure
Pre
cedi
ngs
: doi
:10.
1038
/npr
e.20
09.3
706.
1 : P
oste
d 1
Sep
200
9
Info slide:• Montados form an agro-silvo-pastoral system; they are multifunctional
ecosystems. Their main function is forestry, with the production of cork as the main objective. As well, the pastures provide grazing for sheep or cattle, or for both. They may also be used for agricultural cultivation, for example of wheat, barley or oats.
• Thus, this ecosystem is comprised of two distinct ecological niches; one located beneath the tree canopy, composed of the oak tree and its associated herbaceous stratum, and a second one located outside the tree canopy, composed of herbaceous plants alone.
• This herbaceous layer plays an important role in ecosystem functioning. For example, legumes are an important source of nitrogen for the ecosystem. Since soils are generally poor in nitrogen. It has also been shown that the herbaceous layer plays an important role in the carbon sequestration capacity of this ecosystem, as a result of its large leaf area index during the spring growth.
• Therefore our research interest is to study the impact of future climate change scenarios on the herbaceous understory.
Nat
ure
Pre
cedi
ngs
: doi
:10.
1038
/npr
e.20
09.3
706.
1 : P
oste
d 1
Sep
200
9
Climate change
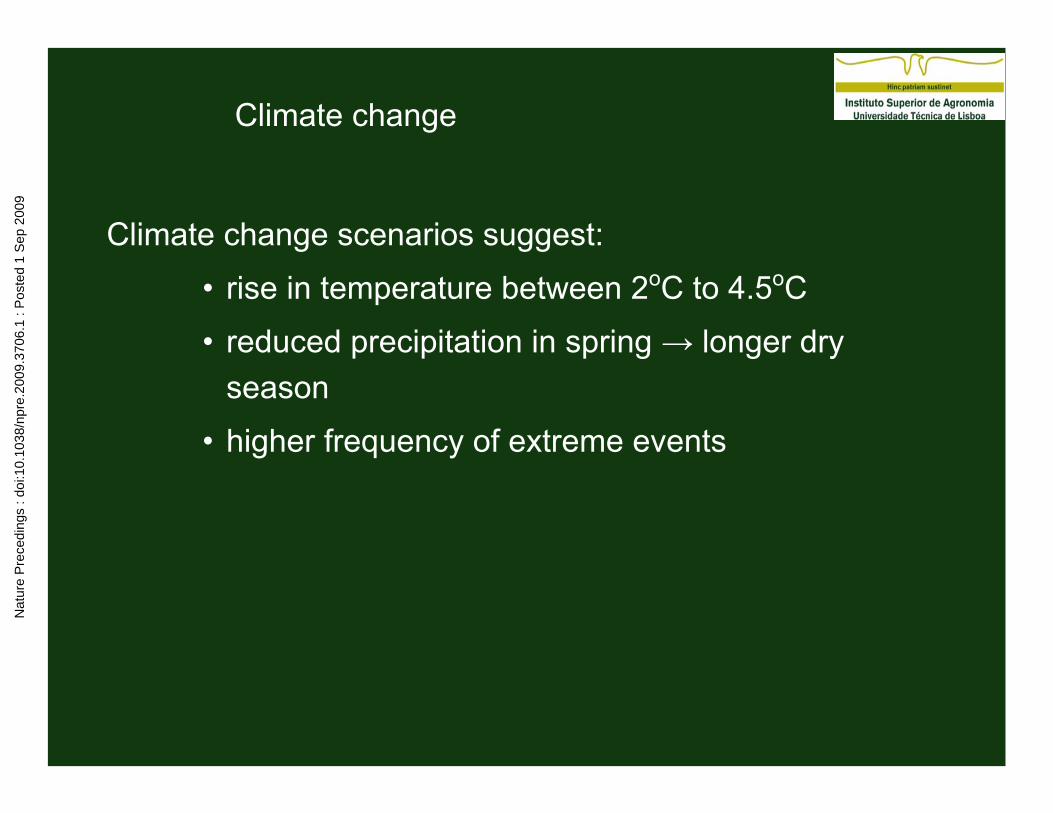
Climate change scenarios suggest:
• rise in temperature between 2oC to 4.5oC
• reduced precipitation in spring → longer dry season
• higher frequency of extreme events
Nat
ure
Pre
cedi
ngs
: doi
:10.
1038
/npr
e.20
09.3
706.
1 : P
oste
d 1
Sep
200
9
Info slide:• What do climate change scenarios say for the Mediterranean
region? First of all, the impact of climate change is expected to be high. Scenarios predict a rise in temperature, between 2 and 4.5˚C, and a decrease in spring precipitation. This will result in a longer dry season, which will affect the plant photosynthetic capacity, leading to reduced primary production. Also, senescence of annual plants, which constitute the majority of the herbaceous layer, could occur earlier.
• In addition, the frequency of extreme events is expected to increase, including drought events, heat waves and floods.
Nat
ure
Pre
cedi
ngs
: doi
:10.
1038
/npr
e.20
09.3
706.
1 : P
oste
d 1
Sep
200
9
Objectives
• Effect of induced drought during the growing periodon productivity and C and N dynamics
• Effect of extreme event (precipitation pulse) on soilrespiration and microbial activity
Nat
ure
Pre
cedi
ngs
: doi
:10.
1038
/npr
e.20
09.3
706.
1 : P
oste
d 1
Sep
200
9

Info slide:• The objectives of our study were twofold. First, we wanted to gather
data on the effects of an induced drought during the growing period on productivity and on carbon and nitrogen dynamics
• The induced drought was followed by an extreme event, a precipitation pulse. Our second objective was to study the effect of this precipitation pulse on soil respiration and microbial activity.
Nat
ure
Pre
cedi
ngs
: doi
:10.
1038
/npr
e.20
09.3
706.
1 : P
oste
d 1
Sep
200
9
Experimental set-up
• Improved pasture in montado
• Fenced area, excluding grazing since November 2006
• Mean annual temperature: 15.5˚C• Mean annual precipitation: 700 mm
Nat
ure
Pre
cedi
ngs
: doi
:10.
1038
/npr
e.20
09.3
706.
1 : P
oste
d 1
Sep
200
9
Info slide:• The experiment was conducted in a montado ecosystem in
Montemor, which is about 100 km east of Lisbon. The site is an improved montado, which means that a few years prior to the experiment the field was rotavated and reseeded with a legume-rich mixture. Subsequently, the montado was grazed by cattle and sheep. However, one year prior to the experiment, the site was fenced, to exclude grazing.
• The climate at the study site is Mediterranean, with hot summers and mild winters. Mean annual temperature is 15.5˚C, and average precipitation is approx. 700 mm, with most of the precipitation being confined to the period between October and May. The beginning ofthe growing season depends on the timing of the first precipitation in autumn, which is followed by rapid growth. The understoreyvegetation is thus active in winter and early spring, with senescence starting generally in May.N
atur
e P
rece
ding
s : d
oi:1
0.10
38/n
pre.
2009
.370
6.1
: Pos
ted
1 S
ep 2
009
Experimental set-up
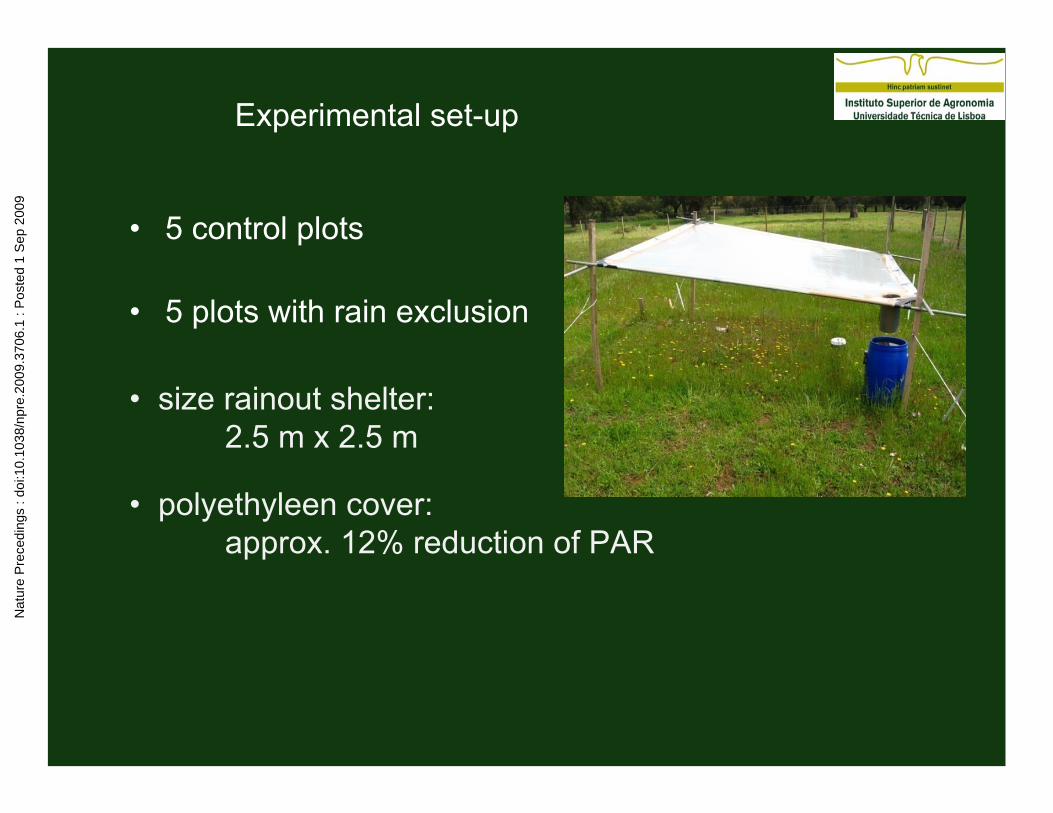
• 5 control plots
• size rainout shelter:2.5 m x 2.5 m
• 5 plots with rain exclusion
• polyethyleen cover: approx. 12% reduction of PAR
Nat
ure
Pre
cedi
ngs
: doi
:10.
1038
/npr
e.20
09.3
706.
1 : P
oste
d 1
Sep
200
9
Info slide:• The experimental set-up consists of 5 control plots and 5 exclusion
plots with a rainout shelter. The shelters were 2.5 by 2.5 m, and provide a means of controlling the input of water. They were fabricated using polyethylene material. The effect of the shelter on temperature was negligible. However, the shelters decreased PAR levels by approx. 12%.
Nat
ure
Pre
cedi
ngs
: doi
:10.
1038
/npr
e.20
09.3
706.
1 : P
oste
d 1
Sep
200
9
Experimental set-uppr
ecip
itatio
n (m
m d
ay-1
)
0
10
20
30
40
50
1 Fe
b
1 M
ar
1 Ap
r
1 M
ay
1 Ju
n
1 Ju
l 0
10
20
30
40
50
60
Control plots
Rain exclusion plots
Precipitationpulse
Start of rain exclusion
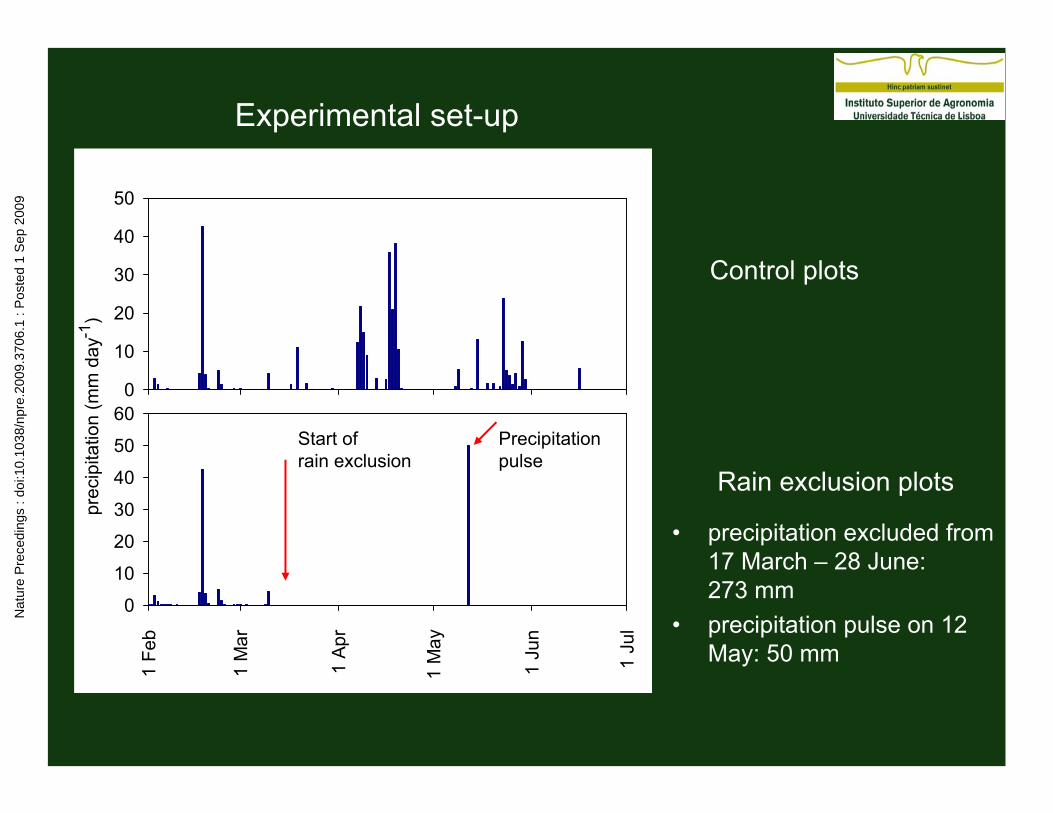
• precipitation excluded from 17 March – 28 June: 273 mm
• precipitation pulse on 12 May: 50 mm
Nat
ure
Pre
cedi
ngs
: doi
:10.
1038
/npr
e.20
09.3
706.
1 : P
oste
d 1
Sep
200
9
Info slide:• In the upper graph you see the pattern of natural precipitation over
the course of the study, this being the water received by the control plots. Up till the start of the rain exclusion, both control and exclusion plots received a total of 330 mm since the autumn of the previous year, which marks the beginning of the growth of this vegetation. Rain exclusion started on the 17th of March, and control plots received a total of 273 mm of precipitation until the end of June. Exclusion plots only received a precipitation pulse of 50 mm on the 12th of May.
• The rainout shelters were in place from the 17th of March until the 28th of June. During this period, natural precipitation was excluded from these plots, with the exception of the 12th of May, when these plots received a precipitation pulse of 50 mm.
Nat
ure
Pre
cedi
ngs
: doi
:10.
1038
/npr
e.20
09.3
706.
1 : P
oste
d 1
Sep
200
9
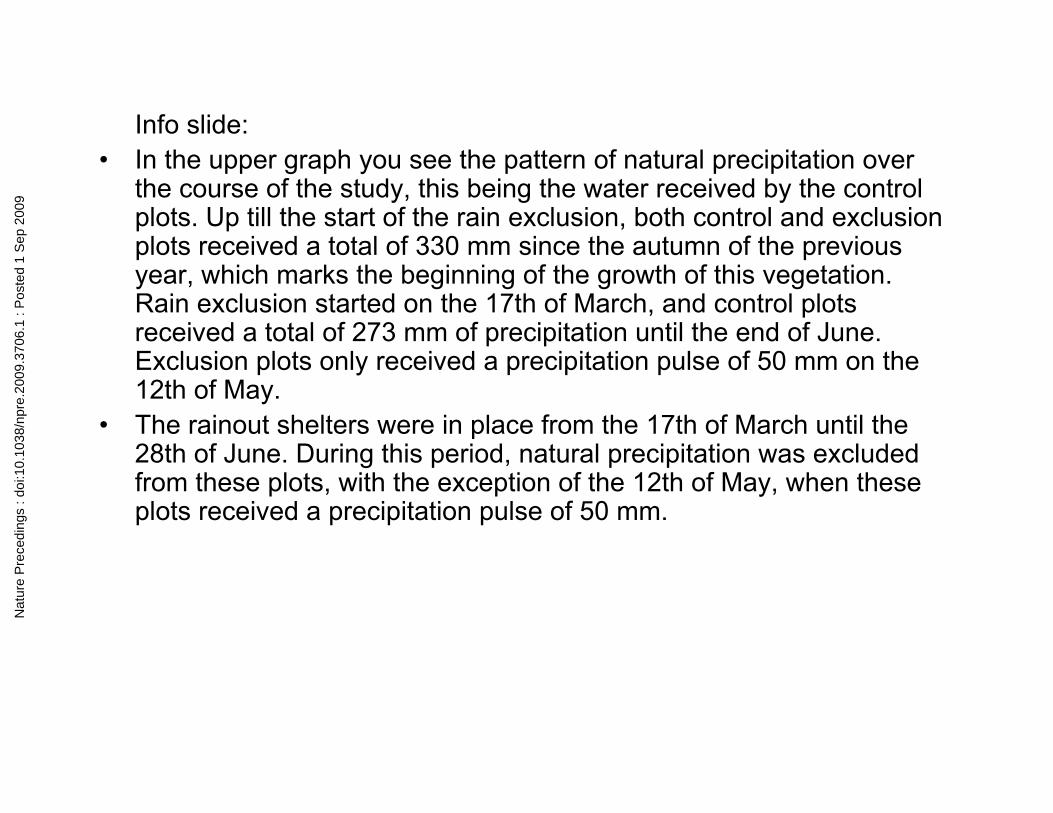
Measurements
• Soil water content
• Biomass
• Species composition
• Soil respiration
• Microbial activity (0-10 cm)
• Soil nitrogen content (0-10 cm)
Nat
ure
Pre
cedi
ngs
: doi
:10.
1038
/npr
e.20
09.3
706.
1 : P
oste
d 1
Sep
200
9
Info slide:What measurements did we take?
• Soil water content was measured at weekly intervals at several depths using a PR1 system.
• Biomass was measured within quadrats of 40 by 40 cm, taken at the beginning and at the end of the experiment. All aboveground biomass was harvested and separated into species, and green and senescent material. Belowground biomass was measured in May using a root corer.
• Point-quadrat measurements were taken for estimation of species composition.
• Soil respiration was measured at weekly intervals using PP systems equipment.
• Microbial activity was measured at several times. Soil was incubated for approx. 6 weeks at 25˚C, and microbial activity was calculated from the amount of CO2 taken up by a cylinder of NaOH, at weekly intervals.
• Soil nitrogen content was calculated using an extraction method in KCl.
Nat
ure
Pre
cedi
ngs
: doi
:10.
1038
/npr
e.20
09.3
706.
1 : P
oste
d 1
Sep
200
9
20 cm depth
soil
wat
er c
onte
nt (%
)
0102030405060
40 cm depth
1 Fe
b
1 M
ar
1 Ap
r
1 M
ay
1 Ju
n
1 Ju
l
01020304050
Soil water content
controlexclusion
Precipitationpulse
Results
10 cm depth1
Feb
1 M
ar
1 Ap
r
1 M
ay
1 Ju
n
1 Ju
l soil
wat
er c
onte
nt (%
)
0102030405060
Precipitationpulse
Nat
ure
Pre
cedi
ngs
: doi
:10.
1038
/npr
e.20
09.3
706.
1 : P
oste
d 1
Sep
200
9
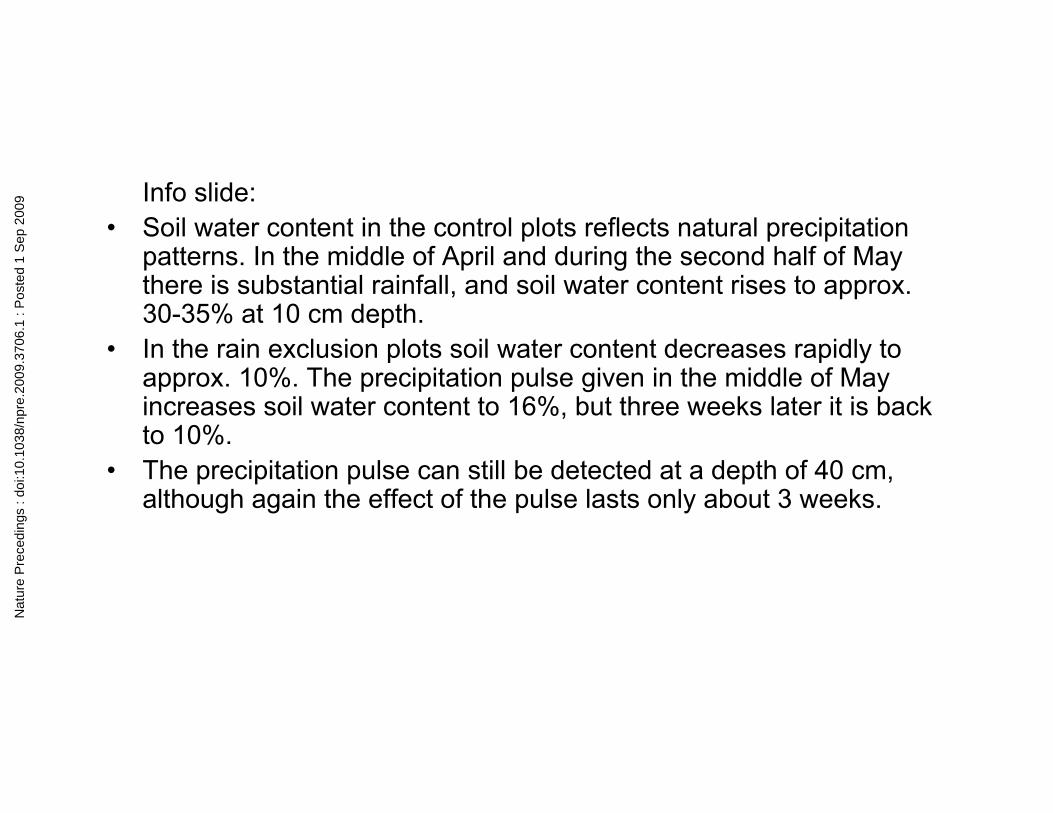
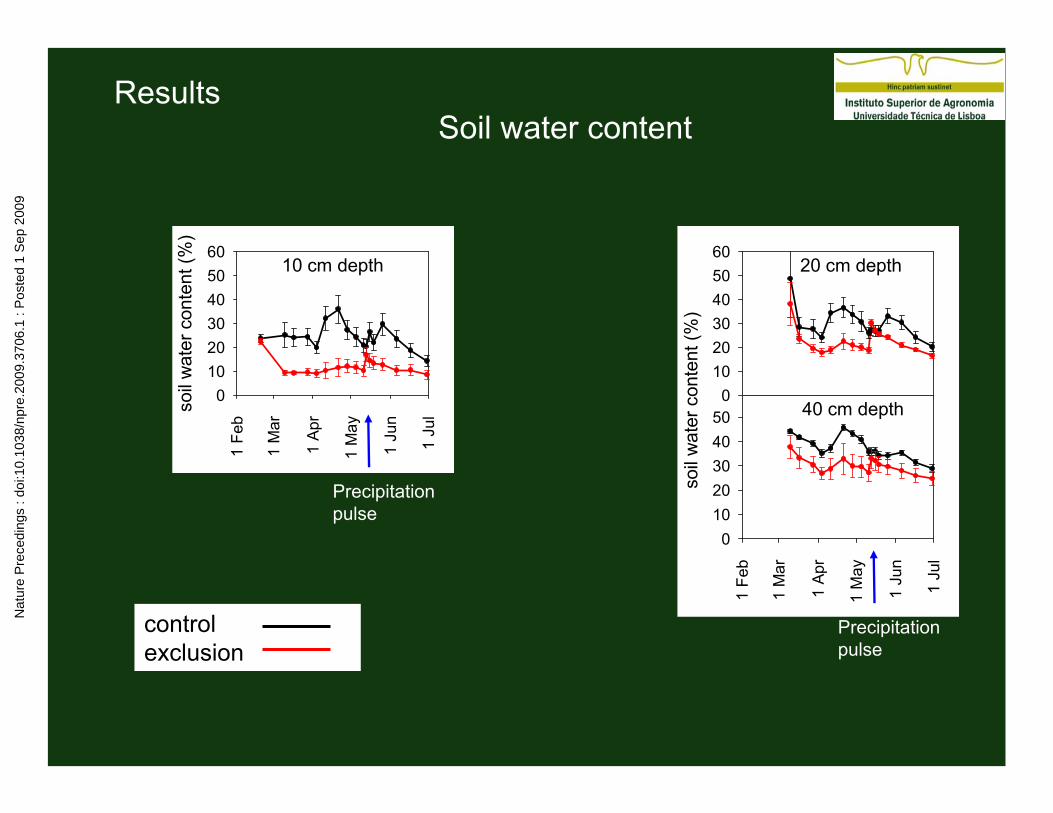
Info slide:• Soil water content in the control plots reflects natural precipitation
patterns. In the middle of April and during the second half of May there is substantial rainfall, and soil water content rises to approx. 30-35% at 10 cm depth.
• In the rain exclusion plots soil water content decreases rapidly to approx. 10%. The precipitation pulse given in the middle of May increases soil water content to 16%, but three weeks later it is back to 10%.
• The precipitation pulse can still be detected at a depth of 40 cm, although again the effect of the pulse lasts only about 3 weeks.
Nat
ure
Pre
cedi
ngs
: doi
:10.
1038
/npr
e.20
09.3
706.
1 : P
oste
d 1
Sep
200
9
Biomass
LEAF AREA INDEX
P=0.041
control exclusion
LAI (
m2 m
-2)
0.0
0.5
1.0
1.5
2.0
2.5 SPECIFIC LEAF AREA
P=0.003
control exclusion
SLA
(cm
2 g-1
)
0
50
100
150
200
250
300
SENESCENT BIOMASS
P=0.013
control exclusion
sene
scen
ce (%
)
0
20
40
60
80
100ABOVEGROUND BIOMASS
P=0.029
control exclusion
biom
ass
(kg/
ha)
0
2000
4000
6000
8000
Nat
ure
Pre
cedi
ngs
: doi
:10.
1038
/npr
e.20
09.3
706.
1 : P
oste
d 1
Sep
200
9
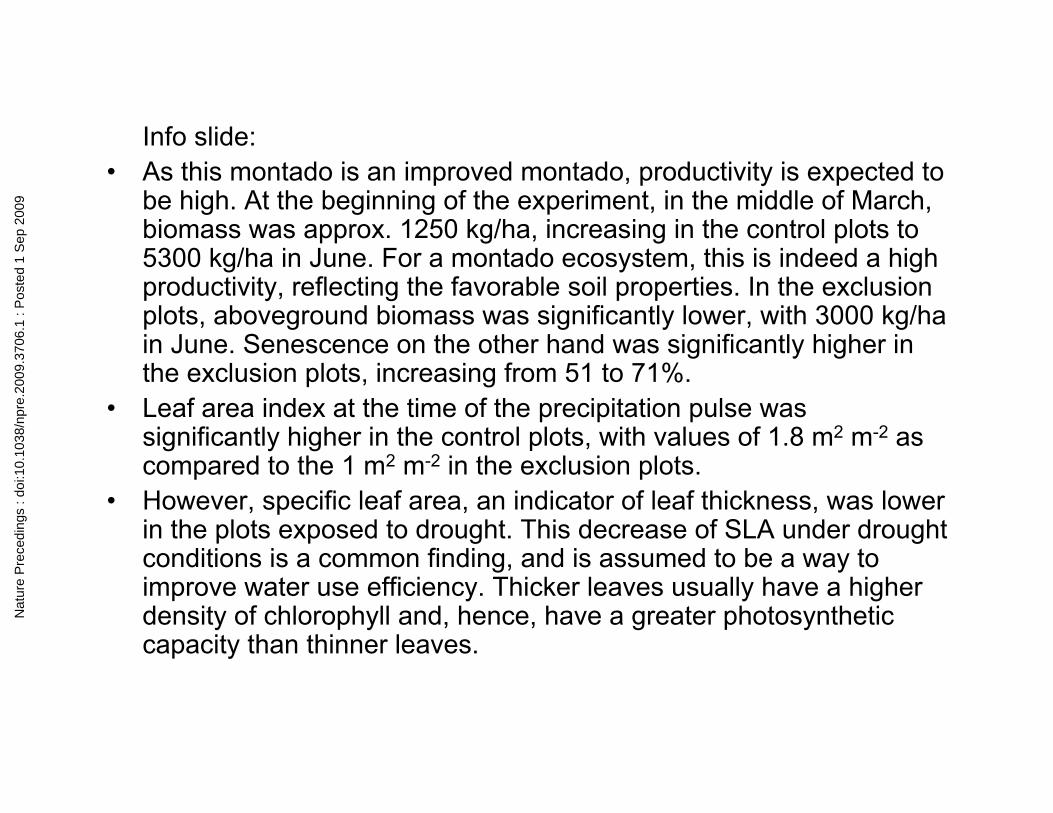
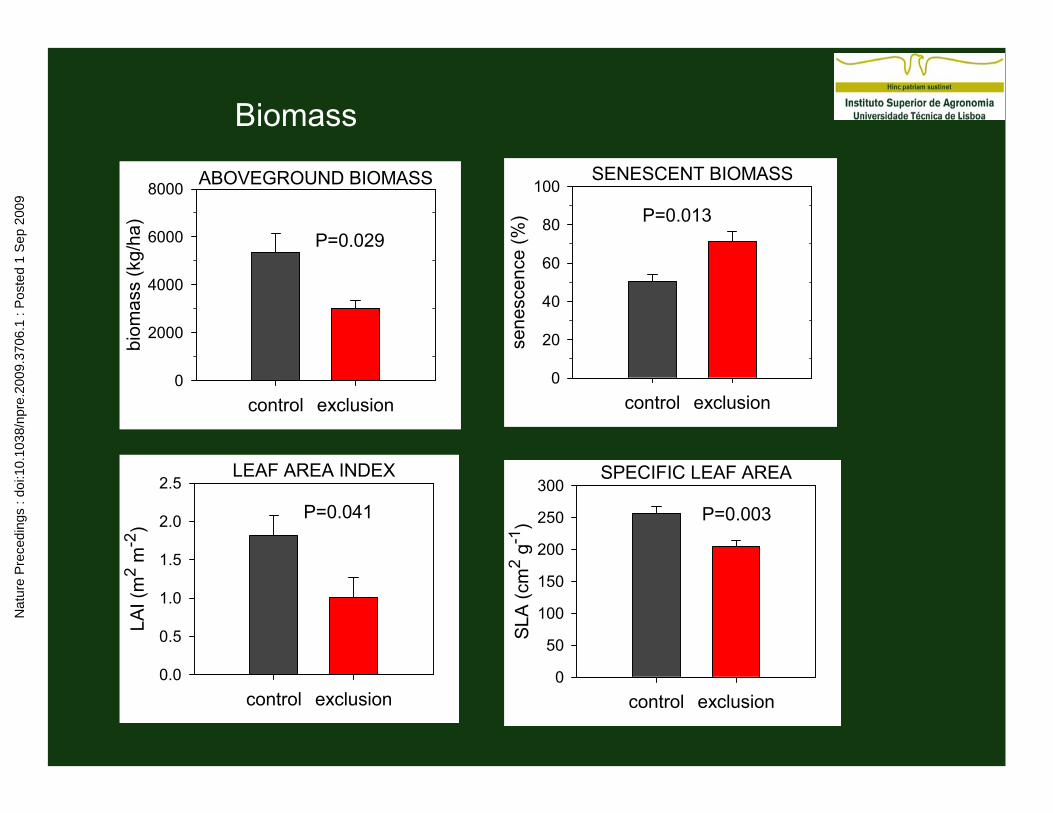
Info slide:• As this montado is an improved montado, productivity is expected to
be high. At the beginning of the experiment, in the middle of March, biomass was approx. 1250 kg/ha, increasing in the control plots to 5300 kg/ha in June. For a montado ecosystem, this is indeed a high productivity, reflecting the favorable soil properties. In the exclusion plots, aboveground biomass was significantly lower, with 3000 kg/ha in June. Senescence on the other hand was significantly higher in the exclusion plots, increasing from 51 to 71%.
• Leaf area index at the time of the precipitation pulse was significantly higher in the control plots, with values of 1.8 m2 m-2 as compared to the 1 m2 m-2 in the exclusion plots.
• However, specific leaf area, an indicator of leaf thickness, was lower in the plots exposed to drought. This decrease of SLA under drought conditions is a common finding, and is assumed to be a way to improve water use efficiency. Thicker leaves usually have a higher density of chlorophyll and, hence, have a greater photosyntheticcapacity than thinner leaves.
Nat
ure
Pre
cedi
ngs
: doi
:10.
1038
/npr
e.20
09.3
706.
1 : P
oste
d 1
Sep
200
9

Biomass
BELOWGROUND BIOMASS
control exclusion
biom
ass
(g m
-2)
0
50
100
150
200ROOT TO SHOOT RATIO
P=0.013
control exclusion
root
to s
hoot
ratio
0.0
0.1
0.2
0.3
0.4
0.5
0.6
0.7
Nat
ure
Pre
cedi
ngs
: doi
:10.
1038
/npr
e.20
09.3
706.
1 : P
oste
d 1
Sep
200
9

Info slide:• Belowground biomass was not affected by the drought treatment.
However, root to shoot ratio was significantly higher in the exclusion plots. This change in the allocation pattern - increasing root to shoot ratio under water limiting conditions - has been frequently observed and is involved in the adaptation of plants to drought stress.
Nat
ure
Pre
cedi
ngs
: doi
:10.
1038
/npr
e.20
09.3
706.
1 : P
oste
d 1
Sep
200
9
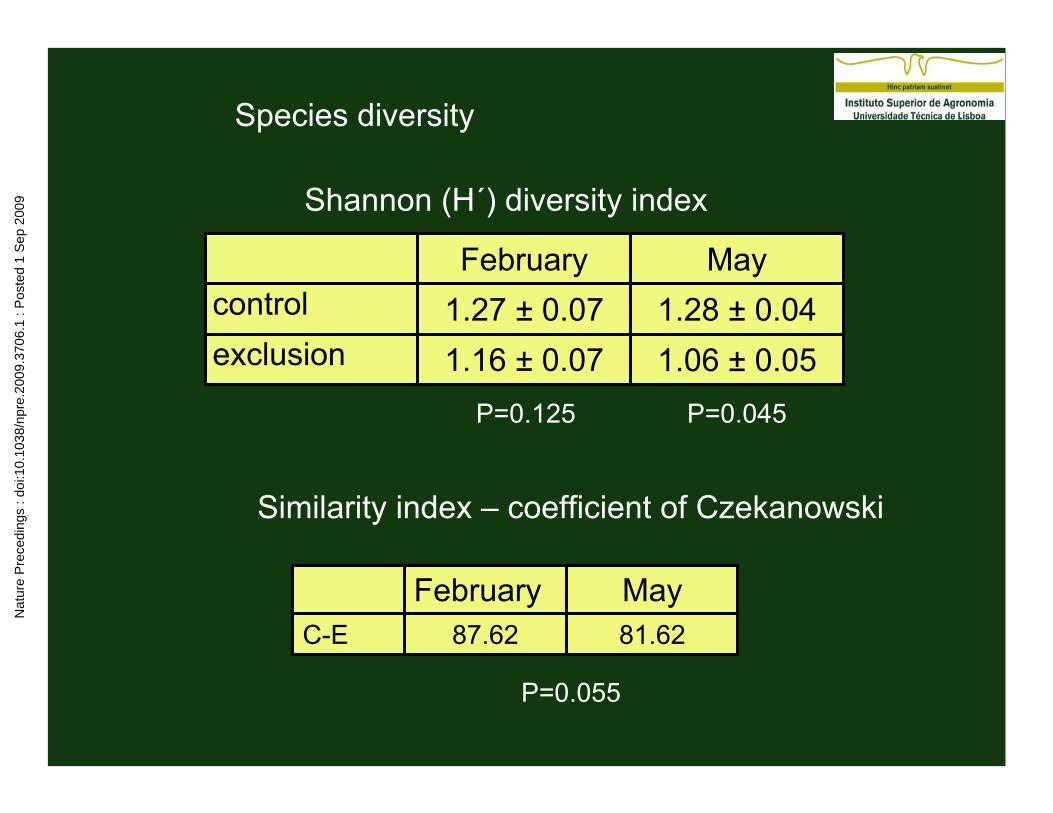
Species diversity
Shannon (H´) diversity index
Similarity index – coefficient of Czekanowski
February MayC-E 87.62 81.62
P=0.125 P=0.045
P=0.055
1.06 ± 0.051.16 ± 0.07exclusion1.28 ± 0.041.27 ± 0.07control
MayFebruary
Nat
ure
Pre
cedi
ngs
: doi
:10.
1038
/npr
e.20
09.3
706.
1 : P
oste
d 1
Sep
200
9
Info slide:• Species composition was assessed in February and May. In
February, the Shannon diversity index showed no significant difference between the control and the exclusion plots. However, in May diversity in the exclusion plots was significantly lower as compared to the control plots.
• The Czekanowski similarity index, which calculates similarity according to the abundance of species, was calculated in February and May. The results show that the control and exclusion plots are more similar to each other in February than they are in May. Thus, in May, there was a bigger difference between the vegetation in thecontrol and exclusion plots, as a result of the induced drought.
Nat
ure
Pre
cedi
ngs
: doi
:10.
1038
/npr
e.20
09.3
706.
1 : P
oste
d 1
Sep
200
9

Soil respiration
controlexclusion
1 M
ar
1 Ap
r
1 M
ay
1 Ju
n
1 Ju
l
soil
resp
iratio
n (m
mol
m-2
s-1
)
0
1
2
3
4
5
6Precipitationpulse
Nat
ure
Pre
cedi
ngs
: doi
:10.
1038
/npr
e.20
09.3
706.
1 : P
oste
d 1
Sep
200
9
Info slide:• This graph shows soil respiration over the course of the study.
Overall, soil respiration followed the course of available soil water and it was higher in the control plots as compared to the exclusion plots. During the first month, soil respiration increased in all plots as a result of increasing temperatures, as soil water was not limiting. However, in April, soil respiration in the exclusion plots was lower, as water was limiting. After the rain pulse in May, soil respiration in the exclusion plots increased and was higher than respiration in the control plots, although only for a few days. Towards the end of the study, soil respiration in all plots decreased as water became alimiting factor, also in the control plots.
Nat
ure
Pre
cedi
ngs
: doi
:10.
1038
/npr
e.20
09.3
706.
1 : P
oste
d 1
Sep
200
9
1 Fe
b
1 M
ar
1 Ap
r
1 M
ay
1 Ju
n
mic
robi
al a
ctiv
ity
(μm
ol C
/g-1
h-1
)
0.000.040.080.120.160.200.240.280.32
Precipitationpulse
Start of rain exclusion Microbial activity
controlexclusion
May
10
May
14
May
18
May
22
May
26
May
30
mic
robi
al a
ctiv
ity
(μm
ol C
/g-1
h-1
)
0.02
0.04
0.06
0.08
0.10
0.12
0.14
Precipitationpulse
Nat
ure
Pre
cedi
ngs
: doi
:10.
1038
/npr
e.20
09.3
706.
1 : P
oste
d 1
Sep
200
9
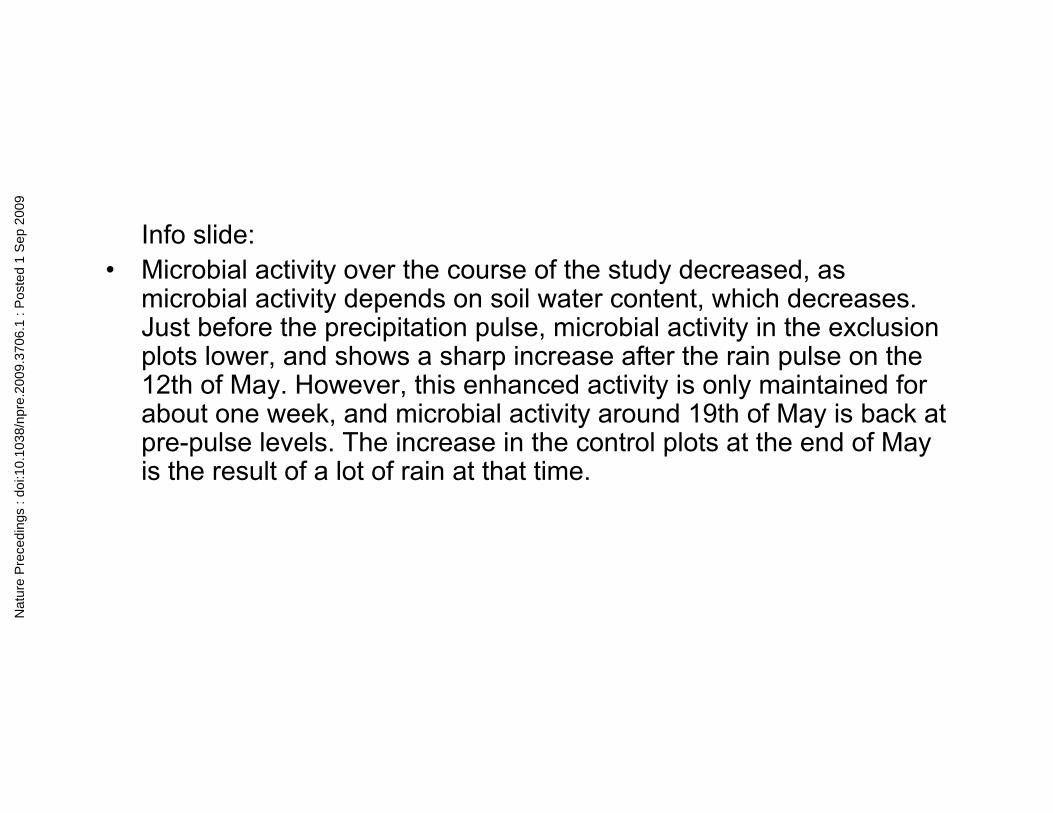
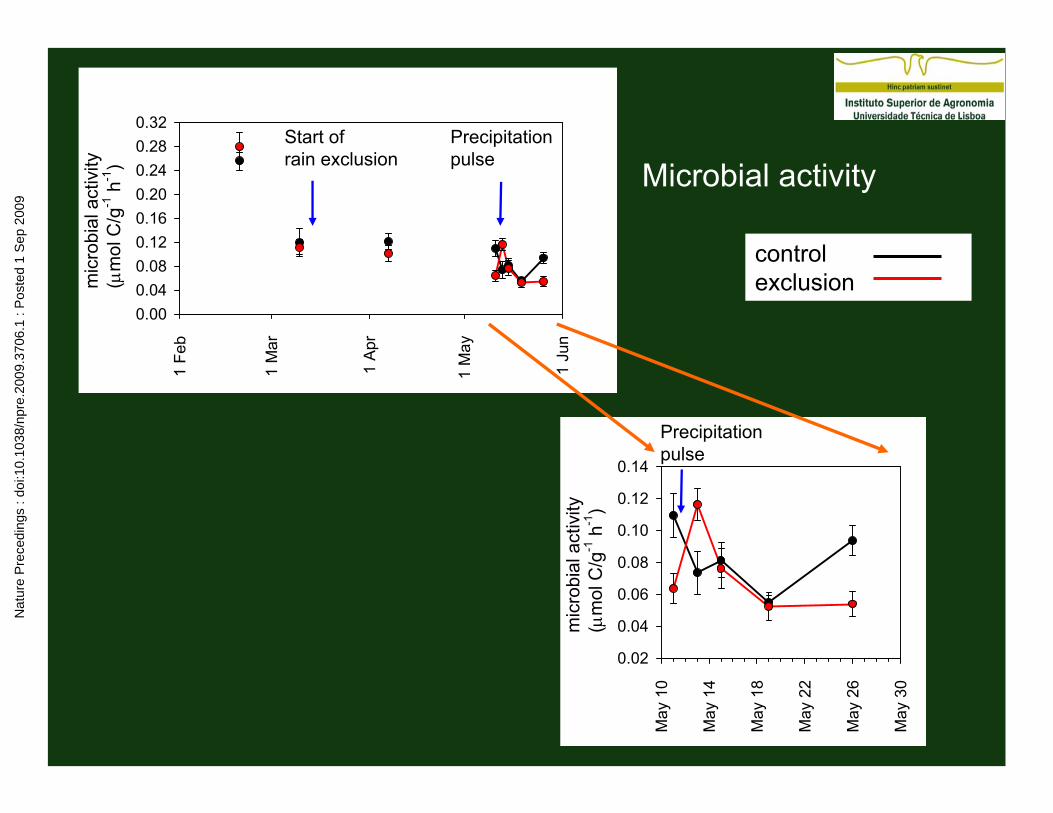
Info slide:• Microbial activity over the course of the study decreased, as
microbial activity depends on soil water content, which decreases. Just before the precipitation pulse, microbial activity in the exclusion plots lower, and shows a sharp increase after the rain pulse on the 12th of May. However, this enhanced activity is only maintained for about one week, and microbial activity around 19th of May is back at pre-pulse levels. The increase in the control plots at the end of May is the result of a lot of rain at that time.
Nat
ure
Pre
cedi
ngs
: doi
:10.
1038
/npr
e.20
09.3
706.
1 : P
oste
d 1
Sep
200
9
8 M
ay
12 M
ay
16 M
ay
20 M
ay
24 M
ay
28 M
ay
soil
nitro
gen
(mg
kg-1
)
0
2
4
6
8
10
12
14
Precipitationpulse
1 Fe
b
1 M
ar
1 A
pr
1 M
ay
1 Ju
n
soil
nitro
gen
(mg
kg-1
)
0
2
4
6
8
10
12
14
Precipitationpulse
Start of rain exclusion
Soil nitrogen
Nat
ure
Pre
cedi
ngs
: doi
:10.
1038
/npr
e.20
09.3
706.
1 : P
oste
d 1
Sep
200
9
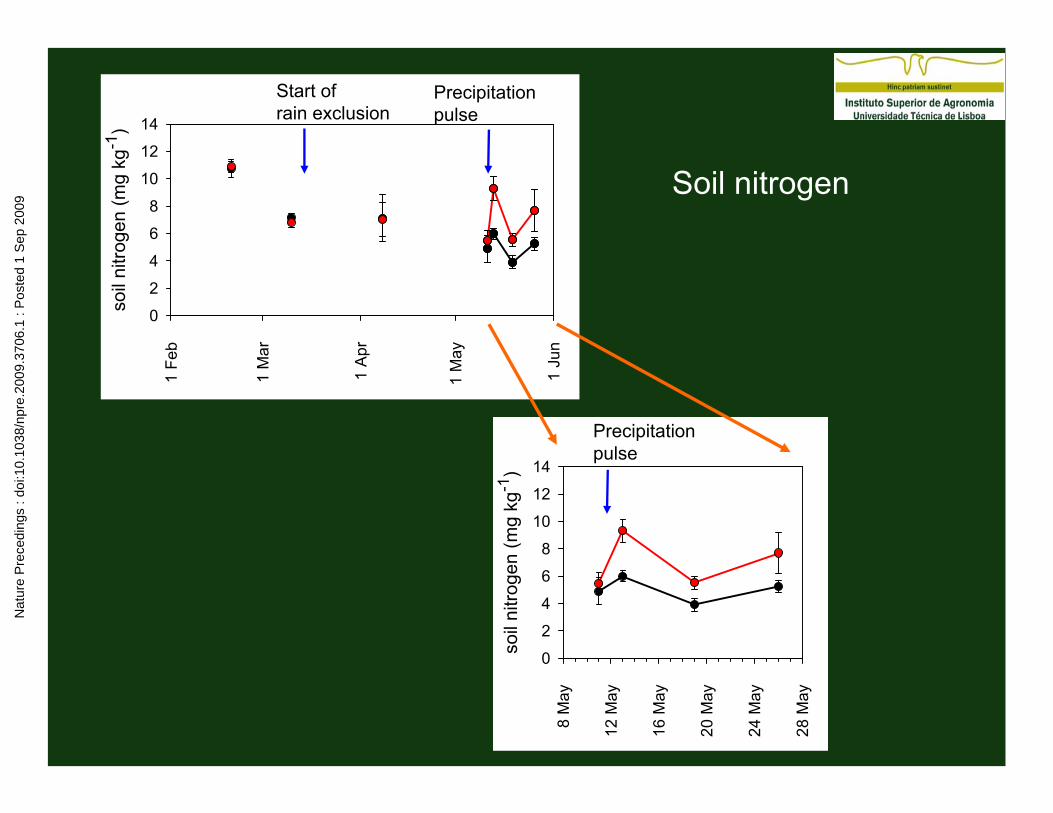
Info slide:• During the induced drought period, soil nitrogen in the control and
exclusion plots was not significantly different. Immediately after the rain pulse, soil nitrogen in the exclusion plots increases sharply. As with microbial activity, soil nitrogen is back at pre-pulse levels after a week.
Nat
ure
Pre
cedi
ngs
: doi
:10.
1038
/npr
e.20
09.3
706.
1 : P
oste
d 1
Sep
200
9
Conclusions
induced drought
biomass ↓
soil water availability ↓
N mobililization and availability ↓Nat
ure
Pre
cedi
ngs
: doi
:10.
1038
/npr
e.20
09.3
706.
1 : P
oste
d 1
Sep
200
9
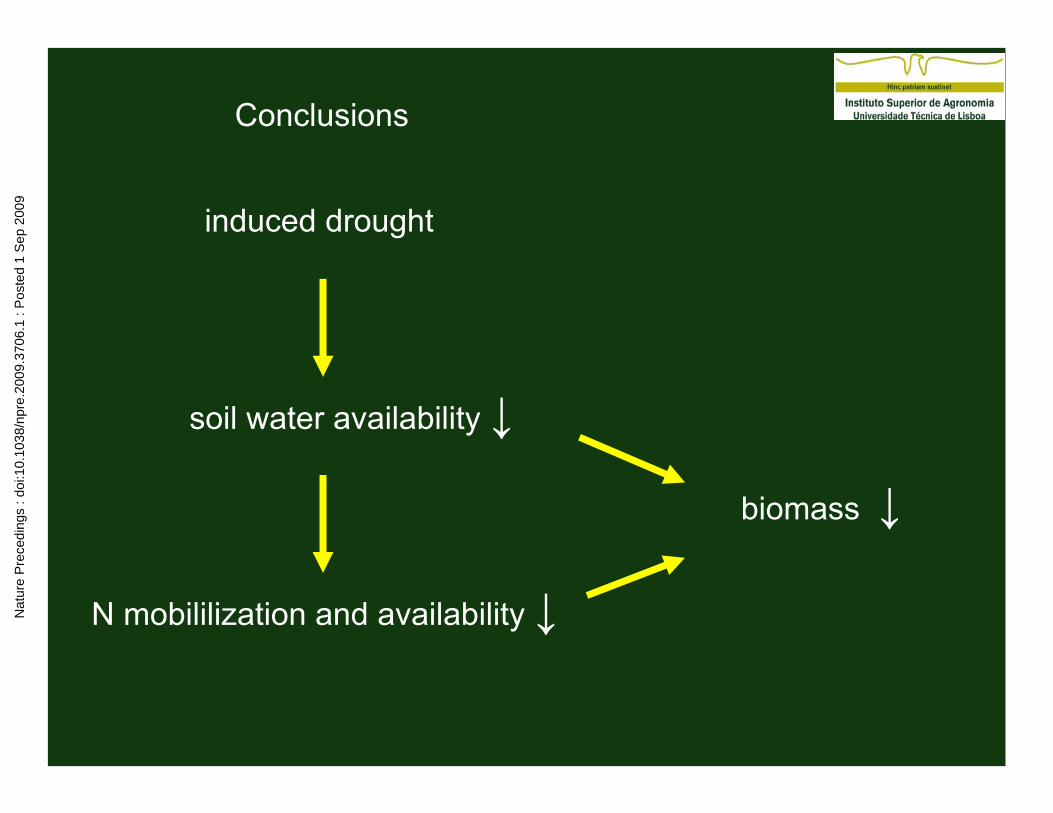
Info slide:• From this experiment we can conclude that an induced drought
reduces soil water content, which in turn directly affects aboveground productivity, with a decrease in biomass. In addition, the reduced soil water content affects nitrogen mobilization andavailability, thereby indirectly, and negatively affecting biomass
Nat
ure
Pre
cedi
ngs
: doi
:10.
1038
/npr
e.20
09.3
706.
1 : P
oste
d 1
Sep
200
9
Conclusions
precipitation pulse
pulse of N mobilization and availability
phenology too advanced for plants totake advantage of increased N
Nat
ure
Pre
cedi
ngs
: doi
:10.
1038
/npr
e.20
09.3
706.
1 : P
oste
d 1
Sep
200
9
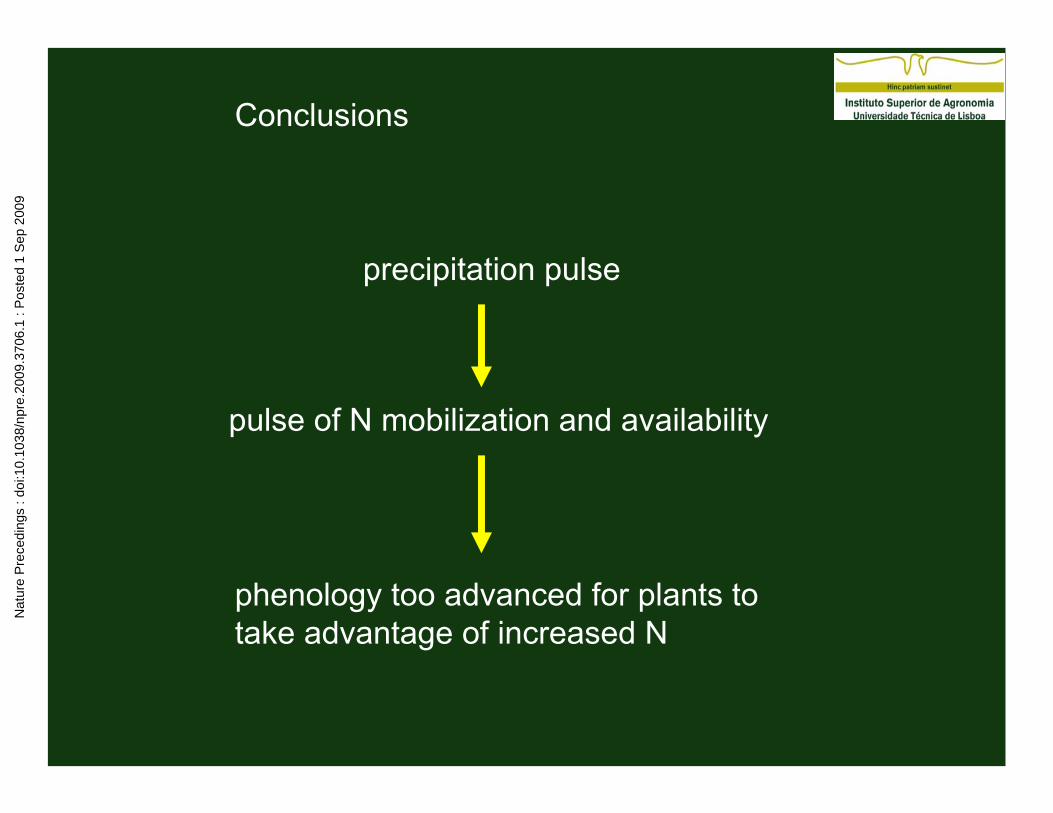
Info slide:• The precipitation pulse increased soil respiration, microbial activity
and soil nitrogen. There was a pulse of N mobilization and availability, often referred to as the Birch-effect. However, the plants could not take full advantage of the enhanced nitrogen availability, since phenology was at an advanced stage, with 38% of the biomass senescent at the time of the precipitation pulse.
Nat
ure
Pre
cedi
ngs
: doi
:10.
1038
/npr
e.20
09.3
706.
1 : P
oste
d 1
Sep
200
9
February 2004 February 2005
http://veimages.gsfc.nasa.gov
Nat
ure
Pre
cedi
ngs
: doi
:10.
1038
/npr
e.20
09.3
706.
1 : P
oste
d 1
Sep
200
9
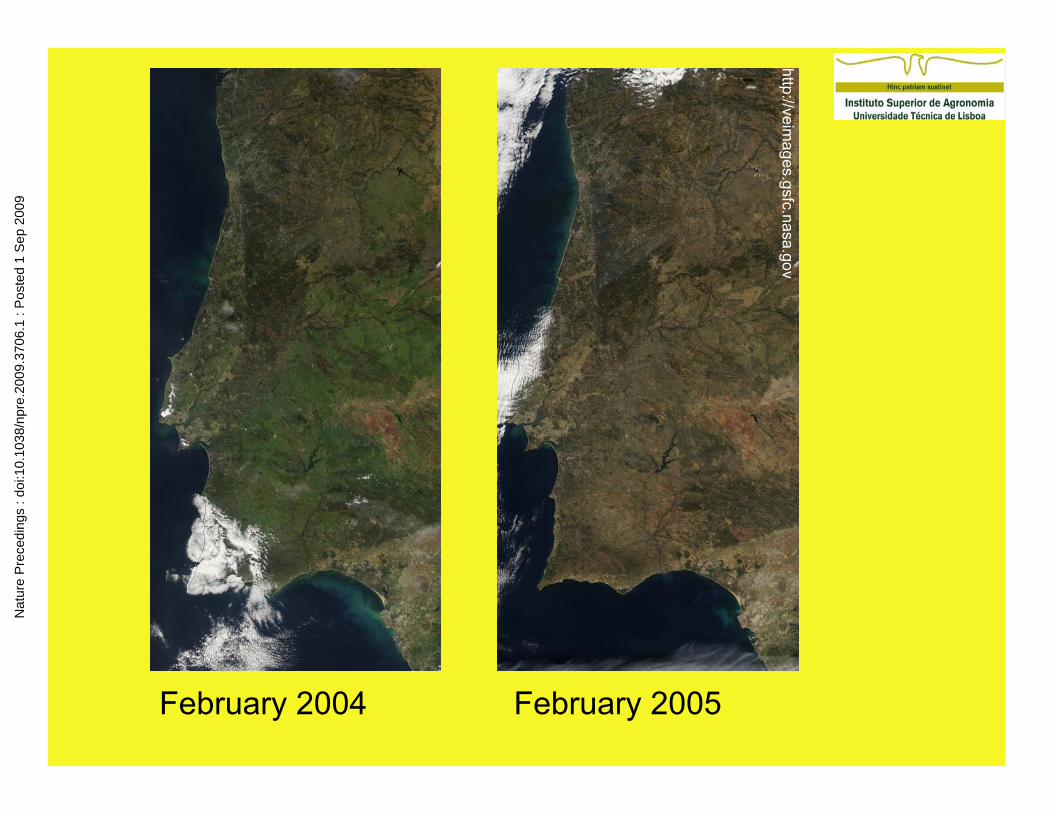
Info slide:• I want to finish off, with showing you these satellite images of
Portugal, taken in February of 2004 and February 2005, which clearly show the effect of the extreme drought that affected Europe in 2005. In 2004, the green of Portugal’s forests and fields can be clearly seen, but this is missing from an image in 2005, and thelivestock and agricultural losses were pretty devastating. Our results show that unfortunately, we might be able to see more images like this with future climate change.
Nat
ure
Pre
cedi
ngs
: doi
:10.
1038
/npr
e.20
09.3
706.
1 : P
oste
d 1
Sep
200
9

Acknowledgements
Maria CaldeiraJoão Pereira
Quim and MerceCentro de Estudos Florestais
Grupo de Ecofisiologia e Melhoramento Florestal
Nat
ure
Pre
cedi
ngs
: doi
:10.
1038
/npr
e.20
09.3
706.
1 : P
oste
d 1
Sep
200
9