The Effect of an Exercise and Diet Program on Fitness, Posture and Self Image in Women
12
Vol.10, No.1 , 2010 •The Journal of Applied Research. 40 KEY WORDS: women’s health, fitness, diet, maternity, exercise, stress ABSTRACT One hundred seventeen female research subjects were involved in a single blinded randomized control study to assess the benefits of an exercise and diet program in restoring posture and balance and fitness in women who have given birth to 1or more children in the last 18 years. The program lasted for 2 months. There were 3 groups of subjects, an exercise group (E), a control group (C), and a pre pregnancy group (P). E, followed a diet involving exchanges for breakfast, lunch and dinner. The exercise involved a 10 minute abdominal exercise program and a 20 minute aerobic and strength video. Abdominal strength, whole body posture and balance, body weight and girth were assessed at the beginning, and at 1 week, 2 weeks, 4 weeks and 2 months after the start of the exercise. The data on 37 subjects were compared to 2 other groups of subjects. One group of 40 subjects were matched for age and were mothers (C) and the other group of 40 subjects were younger women who never had children (P); in the former group subjects participated in all measurements while in the later group only posture and reach were measured. The research personnel taking the measurements were blinded as to which subject was in each group. The results of the study showed that control subjects had no change in any pa- rameter measured over the 2 month period. For the exercise group, body weight at the onset of the study was 79.6+/- 12.1 kg and, The Effect of an Exercise and Diet Program on Fitness, Posture and Self Image in Women Jerrold Petrofsky Jennifer Batt** Lee Berk Carol Schweichler** Daisuke Arai** Chelsea Conas** Jennifer Newell** Kelly Case** Krysten Keener** Gurinder Bains Dept. of Physical Therapy, School of Allied Health Professions Loma Linda University, Loma Linda, California And Dept. of Physical Therapy** Azusa Pacific University Azusa, California
-
Upload
independent -
Category
Documents
-
view
2 -
download
0
Transcript of The Effect of an Exercise and Diet Program on Fitness, Posture and Self Image in Women
Vol.10, No.1 , 2010 •The Journal of Applied Research.40
KEY WORDS: women’s health, fitness, diet, maternity, exercise, stress
ABSTRACTOne hundred seventeen female research subjects were involved in a single blinded randomized control study to assess the benefits of an exercise and diet program in restoring posture and balance and fitness in women who have given birth to 1or more children in the last 18 years. The program lasted for 2 months. There were 3 groups of subjects, an exercise group (E), a control group (C), and a pre pregnancy group (P). E, followed a diet involving exchanges for breakfast, lunch and dinner. The exercise involved a 10 minute abdominal exercise program and a 20 minute aerobic and strength video. Abdominal strength, whole
body posture and balance, body weight and girth were assessed at the beginning, and at 1 week, 2 weeks, 4 weeks and 2 months after the start of the exercise. The data on 37 subjects were compared to 2 other groups of subjects. One group of 40 subjects were matched for age and were mothers (C) and the other group of 40 subjects were younger women who never had children (P); in the former group subjects participated in all measurements while in the later group only posture and reach were measured. The research personnel taking the measurements were blinded as to which subject was in each group. The results of the study showed that control subjects had no change in any pa-rameter measured over the 2 month period. For the exercise group, body weight at the onset of the study was 79.6+/- 12.1 kg and,
The Effect of an Exercise and Diet Program on Fitness, Posture and Self Image in WomenJerrold PetrofskyJennifer Batt**Lee BerkCarol Schweichler**Daisuke Arai**Chelsea Conas**Jennifer Newell**Kelly Case**Krysten Keener**Gurinder Bains
Dept. of Physical Therapy, School of Allied Health Professions Loma Linda University, Loma Linda, CaliforniaAndDept. of Physical Therapy**Azusa Pacific UniversityAzusa, California
The Journal of Applied Research • Vol.10, No.1, 2010. 41
after 2 months was reduced to 75.2+/- 11.0 kg. While the average weight loss was 4.4 kg, this loss was significant at each measur-ing period (ANOVA p<0.05). The top 10% of the subjects lost, at 1 week, 2 weeks, 4 weeks and 8 weeks respectively 3.1, 4.8, 7.7 and 8.6kg while the top 20% lost 2.6, 3.5, 5.4 and 5.9 kg respectively. For the exer-cise group, girth at the waist started at 97.4 cm +/- 10.7 cm, was reduced to 94.2+/- 7.8 cm, a significant loss (p<0.01) and a loss amounting to 3.2 cm or about 2 dress sizes. But for the top 10 and 20% of the group, at 1 week, 2 weeks, 4 weeks and 8 weeks, the respective losses were 3.4, 4.1, 4.7 and 5.6 cm for the top 10 % and 2.6, 3.0, 3.5 and 4.1 cm for the top 20% respectively. Finally, posture and balance increased in the exercise group over the 2 month period. By the end of the diet program study the subjects’ perception of their life stresses decreased as measured by the Perceived Stress Scale; in all, showing the efficacy of this diet and exercise program for women’s health physi-cally and psychologically. When posture and reach were compared, E restored their posture and reach to the same as P.
INTRODUCTIONA number of physiological changes occur in women during pregnancy.Weight gain, in excess of that necessary for the delivery of the child, is common during pregnancy.1,2. The retention of weight gain during pregnancy can contribute to women being overweight or even obese following pregnancy 2,3,4,5. This increase in weight that lasts after pregnancy contributes to chronic diseases such as diabetes, heart disease, and hypertension 6,7. In addition to weight, there are a number of other physiological changes that occur including stretching of liga-ments and tendons and other physiological changes that can last generally up to 1 year post partum 8 . In a recent study of women six months post partum, 56.3 % of women who did not become overweight returned to within 1.5 kg of their pre pregnancy weight6. In comparison, of the 27.7 % of women who became overweight during pregnancy,
within 1 year, 34.6 % gained even more weight 2,3,4. In another study, women who lost all the weight they gained during preg-nancy within 6 months post partum were only 2.4 kg heavier 10 years after childbirth 5. Thus, the greatest predictor of postpartum weight retention is weight gain during pregnancy 4, 9, 10, 11. Part of the in-crease in postpartum weight might be related to increase food intake and also decreased physical activity 12, 13.
In addition to weight gain, there are changes in posture and the alignment of the skeleton during pregnancy that upsets postural equilibrium during and after pregnancy 14. Stance and balance both change during pregnancy 14, 15. Thus, in addition to the normal loss of posture and balance associated with ageing in both men and women 16, 17, 18 , women offer a unique problem different from men in that because of changes in posture associated with preg-nancy, there is a shift in gait and balance throughout life 14.
Maintaining balance during walking or standing is a fairly complex process involv-ing the somatosensory, vestibular, and visual systems 19. In a recent publication, balance was divided into 3 parts; steadiness, sym-metry and dynamic stability 20. Steadiness is the ability to maintain a given posture at minimal sway. Symmetry refers to the two sides of the body maintaining constant balance during maintenance of posture, standing or sitting and dynamic stability refers to the ability to move without losing balance 20. Thus, with changes in the center of gravity of the body due to changes in pos-ture, as might be accounted in postpartum in women, it is easy to predict as is normally is associated with ageing, that balance will be impaired 21, 22, 23.
The problem then in post partum women is twofold, relearning posture and balance and increasing muscle tone and losing weight. Various types of diets have been used for weight loss including soy based diets 24, 25, low fat diets and low carbohydrate diets 26, high fat diets 27, and a combination
Vol.10, No.1 , 2010 •The Journal of Applied Research.42
of surgical and diet programs 28. High fat diets can lead to increases in inflammation throughout the body 27. High carbohydrate diets have a high glycemic index and can lead to diabetes 29. The best diet is a com-bination of exercise and dietary restriction program since exercising increases body me-tabolism 30. An advantage of exercise also is the ability to change posture and increase core muscle strength 19, 30, 31, 32, 33. Weak core muscles in men and women are often associ-ated with back pain and poor balance 34, 35. Thus, to aid balance and increase fitness in women who have given birth to children, a total body muscle strengthening and dietary program are required. Such a specific pro-gram was investigated in the present study. Unlike generic exercise programs, this pro-gram was designed to rehabilitate muscles weakened during pregnancy to reestablish balance and posture. It was designed to allow a weight loss target in 2 months of the average of 2.4Kg weight gain seen in many women even 10 years after pregnancy. Finally, it is well established that exercise can increase self image and overall mood 36,
37, 38. Further, the increase in self image can further reduce food intake and help dieting 36, 37, 38. The present program was designed to help self image and mood in women who have had children. SubjectsThe subjects in this study were 117 women in the age range of 21-53 years old; 2 groups, the controls (40) and exercise group (37) have had a child within the last 18 years. Body fat was between 24.1 and 39.2%. The third group of 40 subjects (pre
pregnancy group) were younger women who did not have children (non moms) (n=40) and were only used for posture and reach measurements. The demographics of the subjects are listed in Table 1. They did not have cardio vascular disease, orthopedic injuries or back injuries that would prevent them from participating safely in an exer-cise program. All subjects were screened by questionnaire for cardiovascular disease and tested for high blood pressure. If the blood pressure was above 140/95, or below 90/60 they were excluded. No subjects were taking cardiovascular medications including beta blockers, beta agonists, beta antago-nists, alpha blockers, alpha agonists, or al-pha antagonists, or ace inhibitors. Subjects were excluded if they are on insulin but not excluded if they have diabetes as long as it is mild and being controlled by oral medica-tion. All procedures were approved by the Institutional Review Board of Azusa Pacific University and all subjects signed a state-ment of informed consent.
METHODSDietA mild caloric restriction diet was used in this study. The diet was balanced with ap-proximately 1/3 carbohydrates, 1/3 fats, and 1/3 proteins. The diet was established by a nutritionist such that a proper balance of vitamins and minerals were associated with the dietary restriction program. The aim of the diet was to have the subjects lose weight over a two month period, gradually. There were 45 selections in the diet. Subjects could choose for breakfast, lunch, or dinner, a single selection. Fifteen selections were
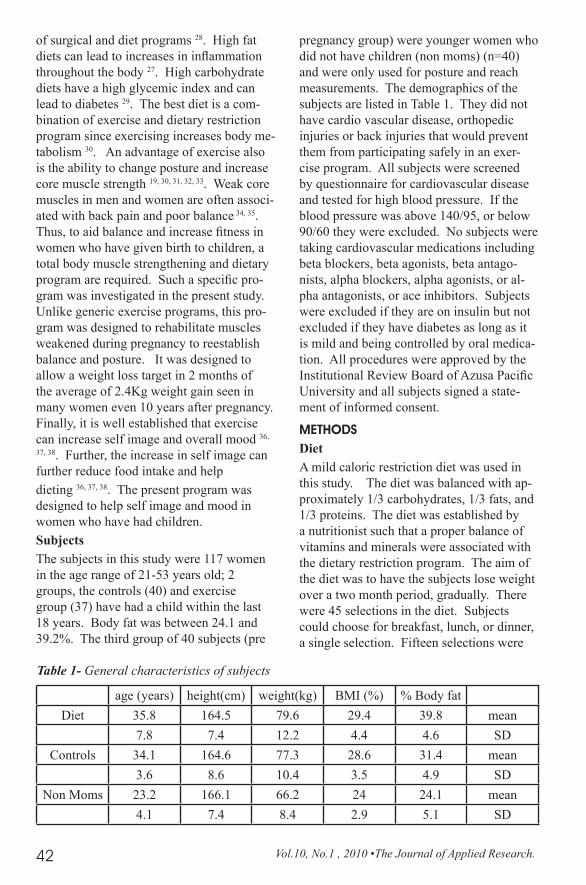
age (years) height(cm) weight(kg) BMI (%) % Body fat Diet 35.8 164.5 79.6 29.4 39.8 mean
7.8 7.4 12.2 4.4 4.6 SDControls 34.1 164.6 77.3 28.6 31.4 mean
3.6 8.6 10.4 3.5 4.9 SDNon Moms 23.2 166.1 66.2 24 24.1 mean
4.1 7.4 8.4 2.9 5.1 SD
Table 1- General characteristics of subjects
The Journal of Applied Research • Vol.10, No.1, 2010. 43
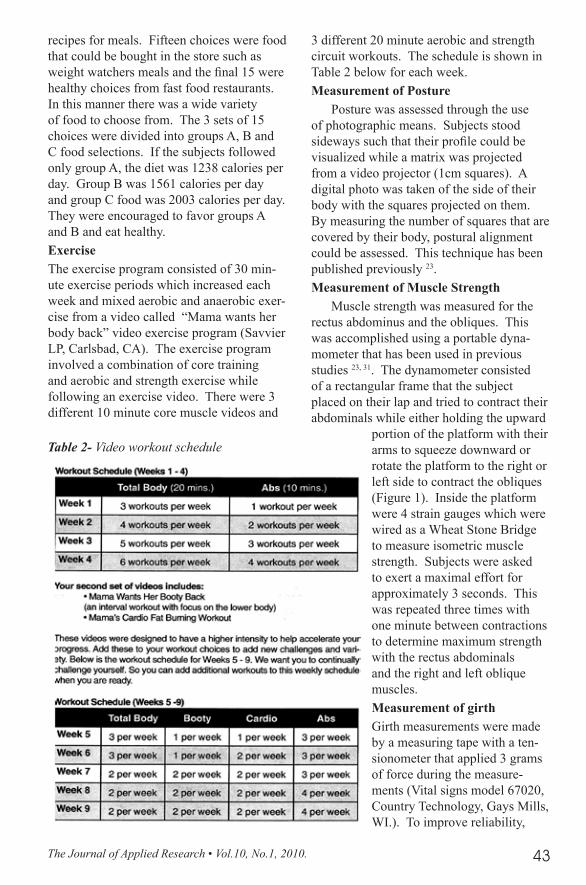
recipes for meals. Fifteen choices were food that could be bought in the store such as weight watchers meals and the final 15 were healthy choices from fast food restaurants. In this manner there was a wide variety of food to choose from. The 3 sets of 15 choices were divided into groups A, B and C food selections. If the subjects followed only group A, the diet was 1238 calories per day. Group B was 1561 calories per day and group C food was 2003 calories per day. They were encouraged to favor groups A and B and eat healthy.ExerciseThe exercise program consisted of 30 min-ute exercise periods which increased each week and mixed aerobic and anaerobic exer-cise from a video called “Mama wants her body back” video exercise program (Savvier LP, Carlsbad, CA). The exercise program involved a combination of core training and aerobic and strength exercise while following an exercise video. There were 3 different 10 minute core muscle videos and
3 different 20 minute aerobic and strength circuit workouts. The schedule is shown in Table 2 below for each week.Measurement of Posture
Posture was assessed through the use of photographic means. Subjects stood sideways such that their profile could be visualized while a matrix was projected from a video projector (1cm squares). A digital photo was taken of the side of their body with the squares projected on them. By measuring the number of squares that are covered by their body, postural alignment could be assessed. This technique has been published previously 23.Measurement of Muscle Strength
Muscle strength was measured for the rectus abdominus and the obliques. This was accomplished using a portable dyna-mometer that has been used in previous studies 23, 31. The dynamometer consisted of a rectangular frame that the subject placed on their lap and tried to contract their abdominals while either holding the upward
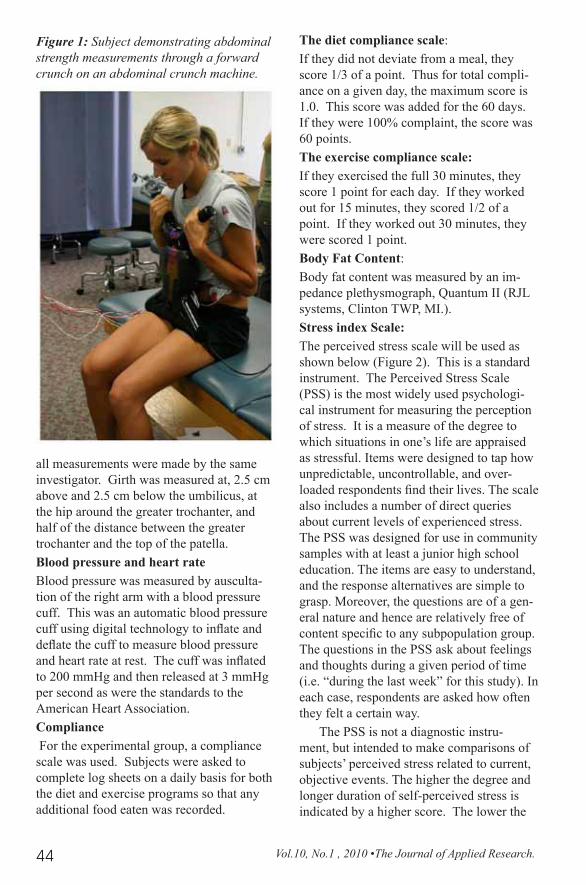
portion of the platform with their arms to squeeze downward or rotate the platform to the right or left side to contract the obliques (Figure 1). Inside the platform were 4 strain gauges which were wired as a Wheat Stone Bridge to measure isometric muscle strength. Subjects were asked to exert a maximal effort for approximately 3 seconds. This was repeated three times with one minute between contractions to determine maximum strength with the rectus abdominals and the right and left oblique muscles.Measurement of girthGirth measurements were made by a measuring tape with a ten-sionometer that applied 3 grams of force during the measure-ments (Vital signs model 67020, Country Technology, Gays Mills, WI.). To improve reliability,
Table 2- Video workout schedule
Vol.10, No.1 , 2010 •The Journal of Applied Research.44
all measurements were made by the same investigator. Girth was measured at, 2.5 cm above and 2.5 cm below the umbilicus, at the hip around the greater trochanter, and half of the distance between the greater trochanter and the top of the patella.Blood pressure and heart rateBlood pressure was measured by ausculta-tion of the right arm with a blood pressure cuff. This was an automatic blood pressure cuff using digital technology to inflate and deflate the cuff to measure blood pressure and heart rate at rest. The cuff was inflated to 200 mmHg and then released at 3 mmHg per second as were the standards to the American Heart Association.Compliance For the experimental group, a compliance scale was used. Subjects were asked to complete log sheets on a daily basis for both the diet and exercise programs so that any additional food eaten was recorded.
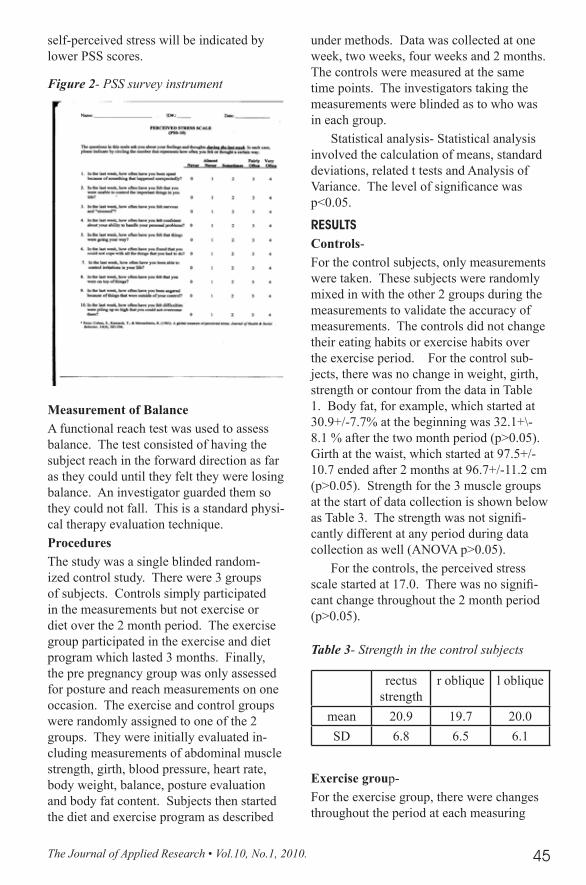
The diet compliance scale:If they did not deviate from a meal, they score 1/3 of a point. Thus for total compli-ance on a given day, the maximum score is 1.0. This score was added for the 60 days. If they were 100% complaint, the score was 60 points.The exercise compliance scale:If they exercised the full 30 minutes, they score 1 point for each day. If they worked out for 15 minutes, they scored 1/2 of a point. If they worked out 30 minutes, they were scored 1 point. Body Fat Content:Body fat content was measured by an im-pedance plethysmograph, Quantum II (RJL systems, Clinton TWP, MI.). Stress index Scale:The perceived stress scale will be used as shown below (Figure 2). This is a standard instrument. The Perceived Stress Scale (PSS) is the most widely used psychologi-cal instrument for measuring the perception of stress. It is a measure of the degree to which situations in one’s life are appraised as stressful. Items were designed to tap how unpredictable, uncontrollable, and over-loaded respondents find their lives. The scale also includes a number of direct queries about current levels of experienced stress. The PSS was designed for use in community samples with at least a junior high school education. The items are easy to understand, and the response alternatives are simple to grasp. Moreover, the questions are of a gen-eral nature and hence are relatively free of content specific to any subpopulation group. The questions in the PSS ask about feelings and thoughts during a given period of time (i.e. “during the last week” for this study). In each case, respondents are asked how often they felt a certain way.
The PSS is not a diagnostic instru-ment, but intended to make comparisons of subjects’ perceived stress related to current, objective events. The higher the degree and longer duration of self-perceived stress is indicated by a higher score. The lower the
Figure 1: Subject demonstrating abdominal strength measurements through a forward crunch on an abdominal crunch machine.
The Journal of Applied Research • Vol.10, No.1, 2010. 45
self-perceived stress will be indicated by lower PSS scores.
Measurement of BalanceA functional reach test was used to assess balance. The test consisted of having the subject reach in the forward direction as far as they could until they felt they were losing balance. An investigator guarded them so they could not fall. This is a standard physi-cal therapy evaluation technique.ProceduresThe study was a single blinded random-ized control study. There were 3 groups of subjects. Controls simply participated in the measurements but not exercise or diet over the 2 month period. The exercise group participated in the exercise and diet program which lasted 3 months. Finally, the pre pregnancy group was only assessed for posture and reach measurements on one occasion. The exercise and control groups were randomly assigned to one of the 2 groups. They were initially evaluated in-cluding measurements of abdominal muscle strength, girth, blood pressure, heart rate, body weight, balance, posture evaluation and body fat content. Subjects then started the diet and exercise program as described
under methods. Data was collected at one week, two weeks, four weeks and 2 months. The controls were measured at the same time points. The investigators taking the measurements were blinded as to who was in each group.
Statistical analysis- Statistical analysis involved the calculation of means, standard deviations, related t tests and Analysis of Variance. The level of significance was p<0.05.
RESUlTSControls-For the control subjects, only measurements were taken. These subjects were randomly mixed in with the other 2 groups during the measurements to validate the accuracy of measurements. The controls did not change their eating habits or exercise habits over the exercise period. For the control sub-jects, there was no change in weight, girth, strength or contour from the data in Table 1. Body fat, for example, which started at 30.9+/-7.7% at the beginning was 32.1+\-8.1 % after the two month period (p>0.05). Girth at the waist, which started at 97.5+/-10.7 ended after 2 months at 96.7+/-11.2 cm (p>0.05). Strength for the 3 muscle groups at the start of data collection is shown below as Table 3. The strength was not signifi-cantly different at any period during data collection as well (ANOVA p>0.05).
For the controls, the perceived stress scale started at 17.0. There was no signifi-cant change throughout the 2 month period (p>0.05).
Exercise group-For the exercise group, there were changes throughout the period at each measuring
Figure 2- PSS survey instrument
rectus strength
r oblique l oblique
mean 20.9 19.7 20.0SD 6.8 6.5 6.1
Table 3- Strength in the control subjects
Vol.10, No.1 , 2010 •The Journal of Applied Research.46
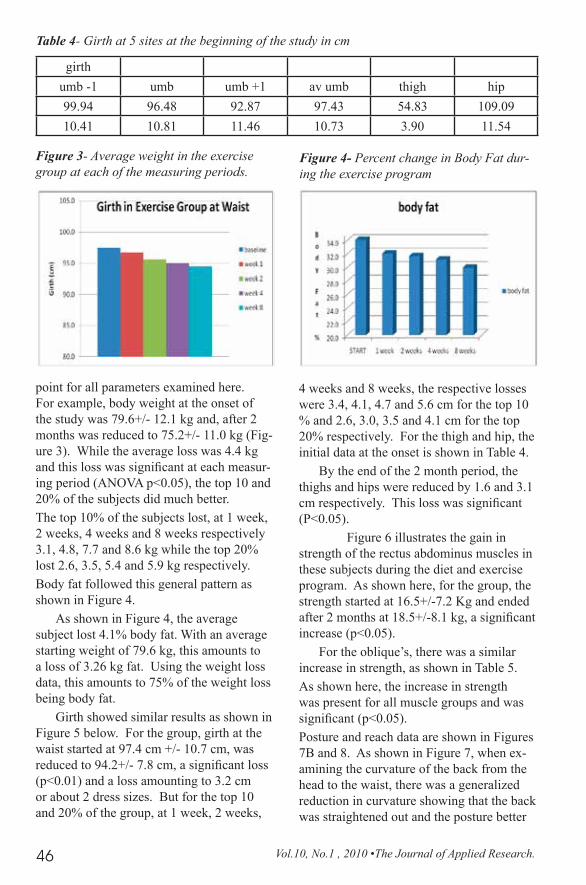
point for all parameters examined here. For example, body weight at the onset of the study was 79.6+/- 12.1 kg and, after 2 months was reduced to 75.2+/- 11.0 kg (Fig-ure 3). While the average loss was 4.4 kg and this loss was significant at each measur-ing period (ANOVA p<0.05), the top 10 and 20% of the subjects did much better.The top 10% of the subjects lost, at 1 week, 2 weeks, 4 weeks and 8 weeks respectively 3.1, 4.8, 7.7 and 8.6 kg while the top 20% lost 2.6, 3.5, 5.4 and 5.9 kg respectively.Body fat followed this general pattern as shown in Figure 4.
As shown in Figure 4, the average subject lost 4.1% body fat. With an average starting weight of 79.6 kg, this amounts to a loss of 3.26 kg fat. Using the weight loss data, this amounts to 75% of the weight loss being body fat.
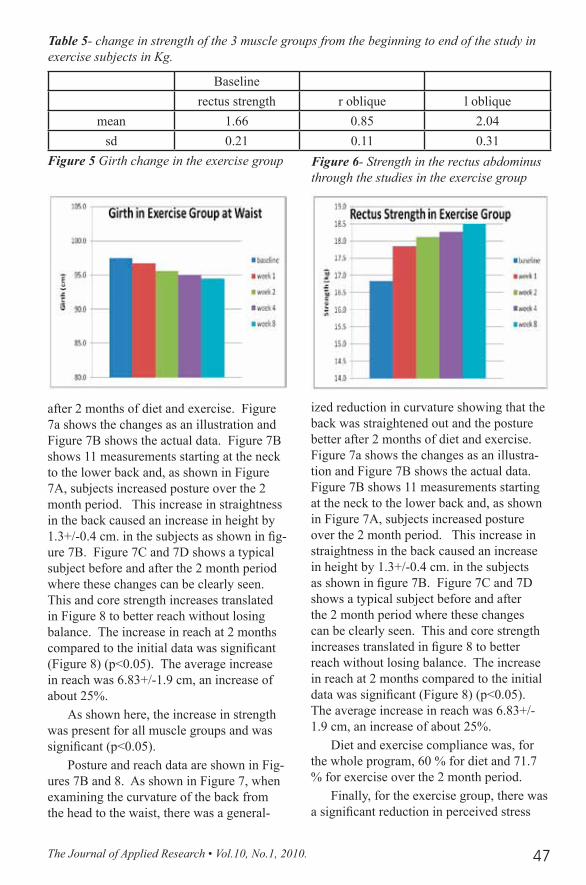
Girth showed similar results as shown in Figure 5 below. For the group, girth at the waist started at 97.4 cm +/- 10.7 cm, was reduced to 94.2+/- 7.8 cm, a significant loss (p<0.01) and a loss amounting to 3.2 cm or about 2 dress sizes. But for the top 10 and 20% of the group, at 1 week, 2 weeks,
4 weeks and 8 weeks, the respective losses were 3.4, 4.1, 4.7 and 5.6 cm for the top 10 % and 2.6, 3.0, 3.5 and 4.1 cm for the top 20% respectively. For the thigh and hip, the initial data at the onset is shown in Table 4.
By the end of the 2 month period, the thighs and hips were reduced by 1.6 and 3.1 cm respectively. This loss was significant (P<0.05).
Figure 6 illustrates the gain in strength of the rectus abdominus muscles in these subjects during the diet and exercise program. As shown here, for the group, the strength started at 16.5+/-7.2 Kg and ended after 2 months at 18.5+/-8.1 kg, a significant increase (p<0.05).
For the oblique’s, there was a similar increase in strength, as shown in Table 5.As shown here, the increase in strength was present for all muscle groups and was significant (p<0.05).Posture and reach data are shown in Figures 7B and 8. As shown in Figure 7, when ex-amining the curvature of the back from the head to the waist, there was a generalized reduction in curvature showing that the back was straightened out and the posture better
Figure 3- Average weight in the exercise group at each of the measuring periods.
Figure 4- Percent change in Body Fat dur-ing the exercise program
Table 4- Girth at 5 sites at the beginning of the study in cm
girth umb -1 umb umb +1 av umb thigh hip99.94 96.48 92.87 97.43 54.83 109.0910.41 10.81 11.46 10.73 3.90 11.54
The Journal of Applied Research • Vol.10, No.1, 2010. 47
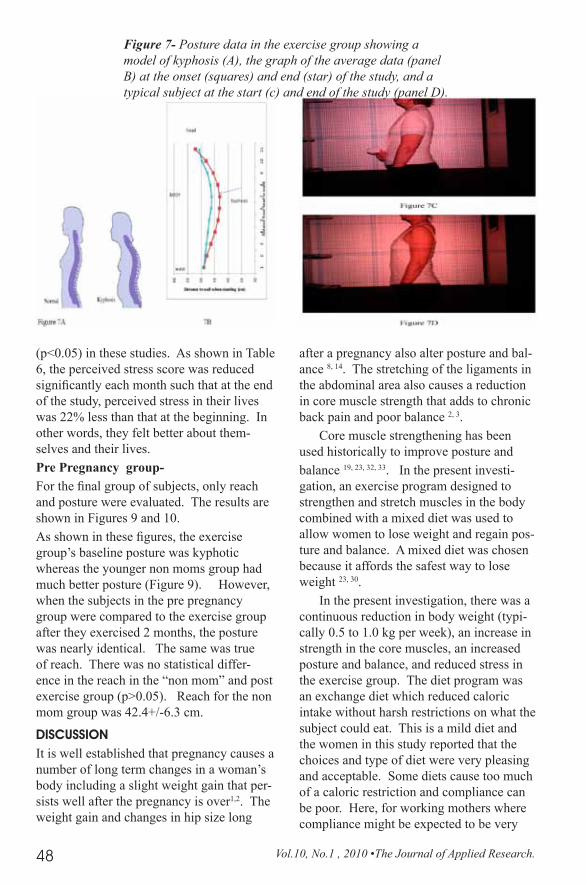
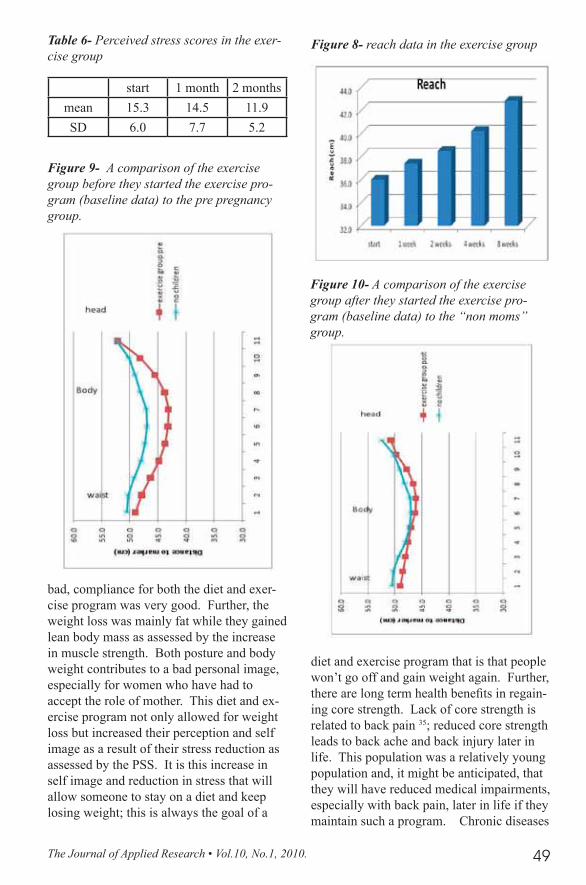
after 2 months of diet and exercise. Figure 7a shows the changes as an illustration and Figure 7B shows the actual data. Figure 7B shows 11 measurements starting at the neck to the lower back and, as shown in Figure 7A, subjects increased posture over the 2 month period. This increase in straightness in the back caused an increase in height by 1.3+/-0.4 cm. in the subjects as shown in fig-ure 7B. Figure 7C and 7D shows a typical subject before and after the 2 month period where these changes can be clearly seen. This and core strength increases translated in Figure 8 to better reach without losing balance. The increase in reach at 2 months compared to the initial data was significant (Figure 8) (p<0.05). The average increase in reach was 6.83+/-1.9 cm, an increase of about 25%.
As shown here, the increase in strength was present for all muscle groups and was significant (p<0.05).
Posture and reach data are shown in Fig-ures 7B and 8. As shown in Figure 7, when examining the curvature of the back from the head to the waist, there was a general-
ized reduction in curvature showing that the back was straightened out and the posture better after 2 months of diet and exercise. Figure 7a shows the changes as an illustra-tion and Figure 7B shows the actual data. Figure 7B shows 11 measurements starting at the neck to the lower back and, as shown in Figure 7A, subjects increased posture over the 2 month period. This increase in straightness in the back caused an increase in height by 1.3+/-0.4 cm. in the subjects as shown in figure 7B. Figure 7C and 7D shows a typical subject before and after the 2 month period where these changes can be clearly seen. This and core strength increases translated in figure 8 to better reach without losing balance. The increase in reach at 2 months compared to the initial data was significant (Figure 8) (p<0.05). The average increase in reach was 6.83+/-1.9 cm, an increase of about 25%.
Diet and exercise compliance was, for the whole program, 60 % for diet and 71.7 % for exercise over the 2 month period.
Finally, for the exercise group, there was a significant reduction in perceived stress
Figure 5 Girth change in the exercise group Figure 6- Strength in the rectus abdominus through the studies in the exercise group
Baseline rectus strength r oblique l oblique
mean 1.66 0.85 2.04sd 0.21 0.11 0.31
Table 5- change in strength of the 3 muscle groups from the beginning to end of the study in exercise subjects in Kg.
Vol.10, No.1 , 2010 •The Journal of Applied Research.48
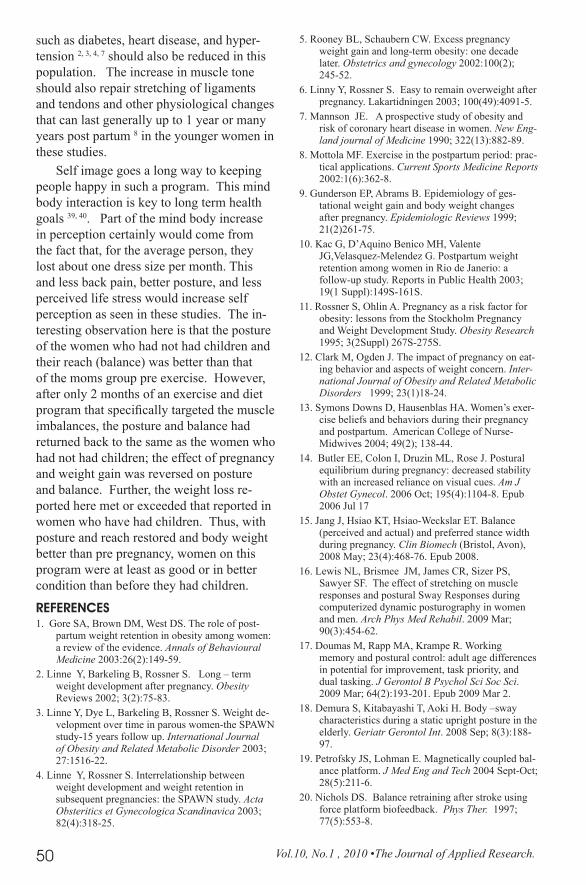
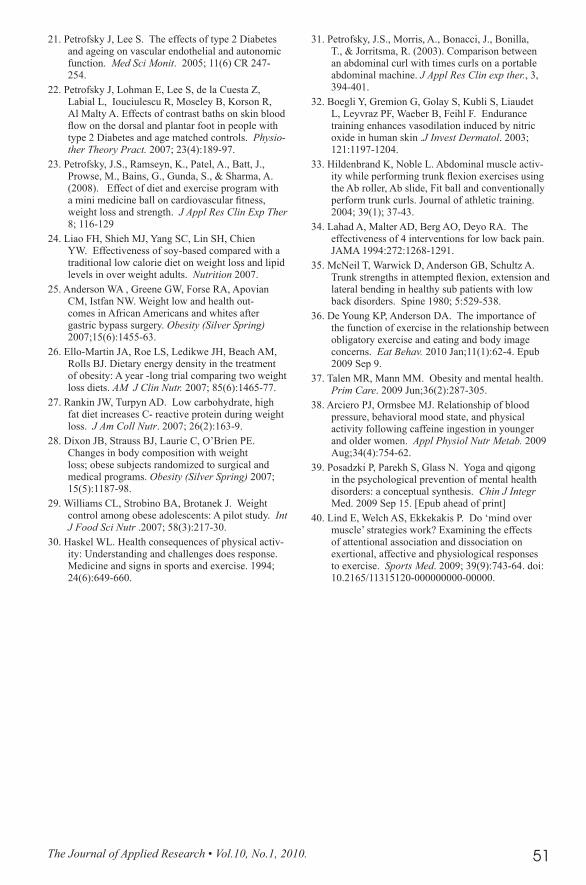
(p<0.05) in these studies. As shown in Table 6, the perceived stress score was reduced significantly each month such that at the end of the study, perceived stress in their lives was 22% less than that at the beginning. In other words, they felt better about them-selves and their lives.Pre Pregnancy group-For the final group of subjects, only reach and posture were evaluated. The results are shown in Figures 9 and 10. As shown in these figures, the exercise group’s baseline posture was kyphotic whereas the younger non moms group had much better posture (Figure 9). However, when the subjects in the pre pregnancy group were compared to the exercise group after they exercised 2 months, the posture was nearly identical. The same was true of reach. There was no statistical differ-ence in the reach in the “non mom” and post exercise group (p>0.05). Reach for the non mom group was 42.4+/-6.3 cm.
DISCUSSIONIt is well established that pregnancy causes a number of long term changes in a woman’s body including a slight weight gain that per-sists well after the pregnancy is over1,2. The weight gain and changes in hip size long
after a pregnancy also alter posture and bal-ance 8, 14. The stretching of the ligaments in the abdominal area also causes a reduction in core muscle strength that adds to chronic back pain and poor balance 2, 3.
Core muscle strengthening has been used historically to improve posture and balance 19, 23, 32, 33. In the present investi-gation, an exercise program designed to strengthen and stretch muscles in the body combined with a mixed diet was used to allow women to lose weight and regain pos-ture and balance. A mixed diet was chosen because it affords the safest way to lose weight 23, 30.
In the present investigation, there was a continuous reduction in body weight (typi-cally 0.5 to 1.0 kg per week), an increase in strength in the core muscles, an increased posture and balance, and reduced stress in the exercise group. The diet program was an exchange diet which reduced caloric intake without harsh restrictions on what the subject could eat. This is a mild diet and the women in this study reported that the choices and type of diet were very pleasing and acceptable. Some diets cause too much of a caloric restriction and compliance can be poor. Here, for working mothers where compliance might be expected to be very
Figure 7- Posture data in the exercise group showing a model of kyphosis (A), the graph of the average data (panel B) at the onset (squares) and end (star) of the study, and a typical subject at the start (c) and end of the study (panel D).
The Journal of Applied Research • Vol.10, No.1, 2010. 49
bad, compliance for both the diet and exer-cise program was very good. Further, the weight loss was mainly fat while they gained lean body mass as assessed by the increase in muscle strength. Both posture and body weight contributes to a bad personal image, especially for women who have had to accept the role of mother. This diet and ex-ercise program not only allowed for weight loss but increased their perception and self image as a result of their stress reduction as assessed by the PSS. It is this increase in self image and reduction in stress that will allow someone to stay on a diet and keep losing weight; this is always the goal of a
diet and exercise program that is that people won’t go off and gain weight again. Further, there are long term health benefits in regain-ing core strength. Lack of core strength is related to back pain 35; reduced core strength leads to back ache and back injury later in life. This population was a relatively young population and, it might be anticipated, that they will have reduced medical impairments, especially with back pain, later in life if they maintain such a program. Chronic diseases
Figure 8- reach data in the exercise group
start 1 month 2 monthsmean 15.3 14.5 11.9SD 6.0 7.7 5.2
Table 6- Perceived stress scores in the exer-cise group
Figure 9- A comparison of the exercise group before they started the exercise pro-gram (baseline data) to the pre pregnancy group.
Figure 10- A comparison of the exercise group after they started the exercise pro-gram (baseline data) to the “non moms” group.
Vol.10, No.1 , 2010 •The Journal of Applied Research.50
such as diabetes, heart disease, and hyper-tension 2, 3, 4, 7 should also be reduced in this population. The increase in muscle tone should also repair stretching of ligaments and tendons and other physiological changes that can last generally up to 1 year or many years post partum 8 in the younger women in these studies.
Self image goes a long way to keeping people happy in such a program. This mind body interaction is key to long term health goals 39, 40. Part of the mind body increase in perception certainly would come from the fact that, for the average person, they lost about one dress size per month. This and less back pain, better posture, and less perceived life stress would increase self perception as seen in these studies. The in-teresting observation here is that the posture of the women who had not had children and their reach (balance) was better than that of the moms group pre exercise. However, after only 2 months of an exercise and diet program that specifically targeted the muscle imbalances, the posture and balance had returned back to the same as the women who had not had children; the effect of pregnancy and weight gain was reversed on posture and balance. Further, the weight loss re-ported here met or exceeded that reported in women who have had children. Thus, with posture and reach restored and body weight better than pre pregnancy, women on this program were at least as good or in better condition than before they had children.
REfERENCES1. Gore SA, Brown DM, West DS. The role of post-
partum weight retention in obesity among women: a review of the evidence. Annals of Behavioural Medicine 2003:26(2):149-59.
2. Linne Y, Barkeling B, Rossner S. Long – term weight development after pregnancy. Obesity Reviews 2002; 3(2):75-83.
3. Linne Y, Dye L, Barkeling B, Rossner S. Weight de-velopment over time in parous women-the SPAWN study-15 years follow up. International Journal of Obesity and Related Metabolic Disorder 2003; 27:1516-22.
4. Linne Y, Rossner S. Interrelationship between weight development and weight retention in subsequent pregnancies: the SPAWN study. Acta Obsteritics et Gynecologica Scandinavica 2003; 82(4):318-25.
5. Rooney BL, Schaubern CW. Excess pregnancy weight gain and long-term obesity: one decade later. Obstetrics and gynecology 2002:100(2); 245-52.
6. Linny Y, Rossner S. Easy to remain overweight after pregnancy. Lakartidningen 2003; 100(49):4091-5.
7. Mannson JE. A prospective study of obesity and risk of coronary heart disease in women. New Eng-land journal of Medicine 1990; 322(13):882-89.
8. Mottola MF. Exercise in the postpartum period: prac-tical applications. Current Sports Medicine Reports 2002:1(6):362-8.
9. Gunderson EP, Abrams B. Epidemiology of ges-tational weight gain and body weight changes after pregnancy. Epidemiologic Reviews 1999; 21(2)261-75.
10. Kac G, D’Aquino Benico MH, Valente JG,Velasquez-Melendez G. Postpartum weight retention among women in Rio de Janerio: a follow-up study. Reports in Public Health 2003; 19(1 Suppl):149S-161S.
11. Rossner S, Ohlin A. Pregnancy as a risk factor for obesity: lessons from the Stockholm Pregnancy and Weight Development Study. Obesity Research 1995; 3(2Suppl) 267S-275S.
12. Clark M, Ogden J. The impact of pregnancy on eat-ing behavior and aspects of weight concern. Inter-national Journal of Obesity and Related Metabolic Disorders 1999; 23(1)18-24.
13. Symons Downs D, Hausenblas HA. Women’s exer-cise beliefs and behaviors during their pregnancy and postpartum. American College of Nurse-Midwives 2004; 49(2); 138-44.
14. Butler EE, Colon I, Druzin ML, Rose J. Postural equilibrium during pregnancy: decreased stability with an increased reliance on visual cues. Am J Obstet Gynecol. 2006 Oct; 195(4):1104-8. Epub 2006 Jul 17
15. Jang J, Hsiao KT, Hsiao-Weckslar ET. Balance (perceived and actual) and preferred stance width during pregnancy. Clin Biomech (Bristol, Avon), 2008 May; 23(4):468-76. Epub 2008.
16. Lewis NL, Brismee JM, James CR, Sizer PS, Sawyer SF. The effect of stretching on muscle responses and postural Sway Responses during computerized dynamic posturography in women and men. Arch Phys Med Rehabil. 2009 Mar; 90(3):454-62.
17. Doumas M, Rapp MA, Krampe R. Working memory and postural control: adult age differences in potential for improvement, task priority, and dual tasking. J Gerontol B Psychol Sci Soc Sci. 2009 Mar; 64(2):193-201. Epub 2009 Mar 2.
18. Demura S, Kitabayashi T, Aoki H. Body –sway characteristics during a static upright posture in the elderly. Geriatr Gerontol Int. 2008 Sep; 8(3):188-97.
19. Petrofsky JS, Lohman E. Magnetically coupled bal-ance platform. J Med Eng and Tech 2004 Sept-Oct; 28(5):211-6.
20. Nichols DS. Balance retraining after stroke using force platform biofeedback. Phys Ther. 1997; 77(5):553-8.
The Journal of Applied Research • Vol.10, No.1, 2010. 51
21. Petrofsky J, Lee S. The effects of type 2 Diabetes and ageing on vascular endothelial and autonomic function. Med Sci Monit. 2005; 11(6) CR 247-254.
22. Petrofsky J, Lohman E, Lee S, de la Cuesta Z, Labial L, Iouciulescu R, Moseley B, Korson R, Al Malty A. Effects of contrast baths on skin blood flow on the dorsal and plantar foot in people with type 2 Diabetes and age matched controls. Physio-ther Theory Pract. 2007; 23(4):189-97.
23. Petrofsky, J.S., Ramseyn, K., Patel, A., Batt, J., Prowse, M., Bains, G., Gunda, S., & Sharma, A. (2008). Effect of diet and exercise program with a mini medicine ball on cardiovascular fitness, weight loss and strength. J Appl Res Clin Exp Ther 8; 116-129
24. Liao FH, Shieh MJ, Yang SC, Lin SH, Chien YW. Effectiveness of soy-based compared with a traditional low calorie diet on weight loss and lipid levels in over weight adults. Nutrition 2007.
25. Anderson WA , Greene GW, Forse RA, Apovian CM, Istfan NW. Weight low and health out-comes in African Americans and whites after gastric bypass surgery. Obesity (Silver Spring) 2007;15(6):1455-63.
26. Ello-Martin JA, Roe LS, Ledikwe JH, Beach AM, Rolls BJ. Dietary energy density in the treatment of obesity: A year -long trial comparing two weight loss diets. AM J Clin Nutr. 2007; 85(6):1465-77.
27. Rankin JW, Turpyn AD. Low carbohydrate, high fat diet increases C- reactive protein during weight loss. J Am Coll Nutr. 2007; 26(2):163-9.
28. Dixon JB, Strauss BJ, Laurie C, O’Brien PE. Changes in body composition with weight loss; obese subjects randomized to surgical and medical programs. Obesity (Silver Spring) 2007; 15(5):1187-98.
29. Williams CL, Strobino BA, Brotanek J. Weight control among obese adolescents: A pilot study. Int J Food Sci Nutr .2007; 58(3):217-30.
30. Haskel WL. Health consequences of physical activ-ity: Understanding and challenges does response. Medicine and signs in sports and exercise. 1994; 24(6):649-660.
31. Petrofsky, J.S., Morris, A., Bonacci, J., Bonilla, T., & Jorritsma, R. (2003). Comparison between an abdominal curl with times curls on a portable abdominal machine. J Appl Res Clin exp ther., 3, 394-401.
32. Boegli Y, Gremion G, Golay S, Kubli S, Liaudet L, Leyvraz PF, Waeber B, Feihl F. Endurance training enhances vasodilation induced by nitric oxide in human skin .J Invest Dermatol. 2003; 121:1197-1204.
33. Hildenbrand K, Noble L. Abdominal muscle activ-ity while performing trunk flexion exercises using the Ab roller, Ab slide, Fit ball and conventionally perform trunk curls. Journal of athletic training. 2004; 39(1); 37-43.
34. Lahad A, Malter AD, Berg AO, Deyo RA. The effectiveness of 4 interventions for low back pain. JAMA 1994:272:1268-1291.
35. McNeil T, Warwick D, Anderson GB, Schultz A. Trunk strengths in attempted flexion, extension and lateral bending in healthy sub patients with low back disorders. Spine 1980; 5:529-538.
36. De Young KP, Anderson DA. The importance of the function of exercise in the relationship between obligatory exercise and eating and body image concerns. Eat Behav. 2010 Jan;11(1):62-4. Epub 2009 Sep 9.
37. Talen MR, Mann MM. Obesity and mental health. Prim Care. 2009 Jun;36(2):287-305.
38. Arciero PJ, Ormsbee MJ. Relationship of blood pressure, behavioral mood state, and physical activity following caffeine ingestion in younger and older women. Appl Physiol Nutr Metab. 2009 Aug;34(4):754-62.
39. Posadzki P, Parekh S, Glass N. Yoga and qigong in the psychological prevention of mental health disorders: a conceptual synthesis. Chin J Integr Med. 2009 Sep 15. [Epub ahead of print]
40. Lind E, Welch AS, Ekkekakis P. Do ‘mind over muscle’ strategies work? Examining the effects of attentional association and dissociation on exertional, affective and physiological responses to exercise. Sports Med. 2009; 39(9):743-64. doi: 10.2165/11315120-000000000-00000.