The effect of an ambidextrous supply chain strategy on combinative competitive capabilities and...
15
The effect of an ambidextrous supply chain strategy on combinative competitive capabilities and business performance Mehmet Murat Kristal a, *, Xiaowen Huang b,1 , Aleda V. Roth c,2 a Schulich School of Business, York University, Toronto, Ontario, Canada M3J 1P3 b Department of Management, The Richard T. Farmer School of Business, Miami University, Oxford, OH 45056, USA c College of Business and Behavioral Science, 124B Sirrine Hall, Clemson University, Clemson, SC 29634-1305, USA 1. Introduction This paper addresses the notion of an ambidextrous strategy within the context of a manufacturer’s supply chain strategy. The general concept of ambidexterity strategy – a simultaneous pursuit of both exploration and exploitation – has recently been advanced in other disciplines such as organizational theory, networks, innovation, and inter-organizational relationships (Gupta et al., 2006; Kauppila, 2007; He and Wong, 2004; Im and Rai, 2008). Following March (1991), Im and Rai (2008, p. 1281) propose that ‘‘exploitation refers to the use and refinement of existing knowledge, and exploration refers to the pursuit of new knowledge and opportunities.’’ Originally, because of the scarcity of firm resources and limitations of managerial scope, exploitation and exploration were considered to be substitutes (or trade-offs). In other words, conventional wisdom posits that organizations would be better off if they either honed and extended their existing supply chain competencies or focused on the acquisition of new ones. To the contrary, others suggest that exploitation and exploration are complementary competencies (Katila and Ahuja, 2002; Gupta et al., 2006; Im and Rai, 2008; Knott, 2002; Levinthal, 1997). This notion of complementarities is consistent with March’s (1991) assertion that organizational ‘‘adaptation requires both exploita- tion and exploration to achieve persistent success’’ (March, 1991, p. 205, italics added by the authors). To capture the complementary view of exploration and exploitation, Duncan (1976) proposes the construct of an ambidexterity strategy. The basic argument is this: exploitation and exploration alone are inadequate to support manufacturers competing in a hypercompetitive and dynamic environment. Likewise, we define an ambidextrous supply chain strategy (hereafter, ambidextrous SC strategy) from a manufacturer’s perspective, as a manufacturing firm’s strategic choice (i.e., managerial emphasis) to simultaneously pursue both supply chain exploitation and exploration (hereafter, SC exploitation/ exploration) practices. We operationalize exploitation within supply chain management as the set of practices that refine and extend existing skills and resources. In contrast, exploration pertains to practices that develop new supply chain competencies Journal of Operations Management 28 (2010) 415–429 ARTICLE INFO Article history: Received 15 October 2008 Received in revised form 17 December 2009 Accepted 28 December 2009 Available online 20 January 2010 Keywords: Supply chain management Ambidexterity Exploitation Exploration Combinative competitive capabilities Empirical research ABSTRACT This study investigates the influence of an ambidextrous supply chain strategy on manufacturers’ combinative competitive capabilities – the ability to excel simultaneously on competitive capabilities of quality, delivery, flexibility, and cost – and, in turn, on business performance. Drawing upon March’s (1991) notions of exploration and exploitation, an ambidextrous supply chain strategy is conceptualized as a simultaneous pursuit of both explorative and exploitative supply chain practices. We operationalize this concept as a second-order latent construct that captures the co-variation between exploration and exploitation within the context of a manufacturer’s supply chain management strategy. Using survey- based data gathered from 174 U.S. manufacturers, we find that an ambidextrous supply chain strategy coincides with combinative competitive capabilities and business performance. Our empirical finding contradicts conventional wisdom that argues for tradeoffs between exploration and exploitation. Instead, our empirical results are in line with an emerging complementarity view advocating that supply chain managers build practices to gain operational efficiency while simultaneously searching for opportunities to gain operational advantages. In addition, we provide insights regarding the role of combinative capabilities in mediating the relationship between an ambidextrous supply chain strategy and business performance. ß 2010 Elsevier B.V. All rights reserved. * Corresponding author. Tel.: +1 416 736 2100x44593; fax: +1 416 736 5687. E-mail addresses: [email protected] (M.M. Kristal), [email protected] (X. Huang), [email protected] (A.V. Roth). 1 Tel.: +1 513 529 2017; fax: +1 513 529 2342. 2 Tel.: +1 919 454 4707; fax: +1 864 656 2015. Contents lists available at ScienceDirect Journal of Operations Management journal homepage: www.elsevier.com/locate/jom 0272-6963/$ – see front matter ß 2010 Elsevier B.V. All rights reserved. doi:10.1016/j.jom.2009.12.002
-
Upload
independent -
Category
Documents
-
view
0 -
download
0
Transcript of The effect of an ambidextrous supply chain strategy on combinative competitive capabilities and...

Journal of Operations Management 28 (2010) 415–429
The effect of an ambidextrous supply chain strategy on combinative competitivecapabilities and business performance
Mehmet Murat Kristal a,*, Xiaowen Huang b,1, Aleda V. Roth c,2
a Schulich School of Business, York University, Toronto, Ontario, Canada M3J 1P3b Department of Management, The Richard T. Farmer School of Business, Miami University, Oxford, OH 45056, USAc College of Business and Behavioral Science, 124B Sirrine Hall, Clemson University, Clemson, SC 29634-1305, USA
A R T I C L E I N F O
Article history:
Received 15 October 2008
Received in revised form 17 December 2009
Accepted 28 December 2009
Available online 20 January 2010
Keywords:
Supply chain management
Ambidexterity
Exploitation
Exploration
Combinative competitive capabilities
Empirical research
A B S T R A C T
This study investigates the influence of an ambidextrous supply chain strategy on manufacturers’
combinative competitive capabilities – the ability to excel simultaneously on competitive capabilities of
quality, delivery, flexibility, and cost – and, in turn, on business performance. Drawing upon March’s
(1991) notions of exploration and exploitation, an ambidextrous supply chain strategy is conceptualized
as a simultaneous pursuit of both explorative and exploitative supply chain practices. We operationalize
this concept as a second-order latent construct that captures the co-variation between exploration and
exploitation within the context of a manufacturer’s supply chain management strategy. Using survey-
based data gathered from 174 U.S. manufacturers, we find that an ambidextrous supply chain strategy
coincides with combinative competitive capabilities and business performance. Our empirical finding
contradicts conventional wisdom that argues for tradeoffs between exploration and exploitation.
Instead, our empirical results are in line with an emerging complementarity view advocating that supply
chain managers build practices to gain operational efficiency while simultaneously searching for
opportunities to gain operational advantages. In addition, we provide insights regarding the role of
combinative capabilities in mediating the relationship between an ambidextrous supply chain strategy
and business performance.
� 2010 Elsevier B.V. All rights reserved.
Contents lists available at ScienceDirect
Journal of Operations Management
journa l homepage: www.e lsev ier .com/ locate / jom
1. Introduction
This paper addresses the notion of an ambidextrous strategywithin the context of a manufacturer’s supply chain strategy. Thegeneral concept of ambidexterity strategy – a simultaneous pursuitof both exploration and exploitation – has recently been advancedin other disciplines such as organizational theory, networks,innovation, and inter-organizational relationships (Gupta et al.,2006; Kauppila, 2007; He and Wong, 2004; Im and Rai, 2008).Following March (1991), Im and Rai (2008, p. 1281) propose that‘‘exploitation refers to the use and refinement of existingknowledge, and exploration refers to the pursuit of new knowledgeand opportunities.’’ Originally, because of the scarcity of firmresources and limitations of managerial scope, exploitation andexploration were considered to be substitutes (or trade-offs). Inother words, conventional wisdom posits that organizations would
* Corresponding author. Tel.: +1 416 736 2100x44593; fax: +1 416 736 5687.
E-mail addresses: [email protected] (M.M. Kristal),
[email protected] (X. Huang), [email protected] (A.V. Roth).1 Tel.: +1 513 529 2017; fax: +1 513 529 2342.2 Tel.: +1 919 454 4707; fax: +1 864 656 2015.
0272-6963/$ – see front matter � 2010 Elsevier B.V. All rights reserved.
doi:10.1016/j.jom.2009.12.002
be better off if they either honed and extended their existing supplychain competencies or focused on the acquisition of new ones. Tothe contrary, others suggest that exploitation and exploration arecomplementary competencies (Katila and Ahuja, 2002; Guptaet al., 2006; Im and Rai, 2008; Knott, 2002; Levinthal, 1997). Thisnotion of complementarities is consistent with March’s (1991)assertion that organizational ‘‘adaptation requires both exploita-tion and exploration to achieve persistent success’’ (March, 1991,p. 205, italics added by the authors).
To capture the complementary view of exploration andexploitation, Duncan (1976) proposes the construct of anambidexterity strategy. The basic argument is this: exploitationand exploration alone are inadequate to support manufacturerscompeting in a hypercompetitive and dynamic environment.Likewise, we define an ambidextrous supply chain strategy
(hereafter, ambidextrous SC strategy) from a manufacturer’sperspective, as a manufacturing firm’s strategic choice (i.e.,managerial emphasis) to simultaneously pursue both supplychain exploitation and exploration (hereafter, SC exploitation/exploration) practices. We operationalize exploitation withinsupply chain management as the set of practices that refine andextend existing skills and resources. In contrast, explorationpertains to practices that develop new supply chain competencies

M.M. Kristal et al. / Journal of Operations Management 28 (2010) 415–429416
through experimentation and acquisition of new knowledge andresources. For manufacturers, the supply chain exploitationpractices typically involve leveraging their current supply chaincompetencies to achieve lower costs and reliability; whereas withexploration, practitioners would continuously seek new knowl-edge and ideas within supply chain relationships. Take, forexample, the development of new advanced information andcommunications technologies (ICT) (Sanders, 2008). ICT hassignificantly expanded manufacturers’ operational resources intotheir supply chain. Illustrating a SC exploitation practice is the useof information technology to automate cross-organizational tasks(e.g., automated billing, report preparation, inventory manage-ment, and financial analysis) with the explicit goal of enhancingefficiency. In contrast, supply chain exploration may employsystems for cross-entity business intelligence information gath-ering that supports organizational decision-making and theexchange of new ideas, such as understanding the new trendsin sales and customer preferences as well as supply networkinnovations.
Drawing upon the complementarity premise versus trade-offs,manufacturers that prioritize supply chain exploitation are likely tobe trapped in suboptimal stable equilibrium, and therefore, wouldbe less able to adapt quickly to environmental changes. On the otherhand, manufacturers that rely on constant supply chain explorationpractices are prone to find themselves losing efficiency because theycannot garner the benefits of too many underdeveloped new ideas.These two divergent views – trade-off versus complementarity –lead to our first research question: In practice, can we classify agroup of manufacturers that follow an ambidextrous strategy in thecontext of supply chain management?
There is some anecdotal evidence that successful ambidextrousorganizations are more prosperous, lending the credence tocomplementary view of exploration and exploitation (Tushmanand O’Reilly, 1996; Kauppila, 2007). While empirical investigationsof ambidexterity strategy have attracted more attention, moststudies emanate from organizational theory and strategic manage-ment literatures (Gibson and Birkinshaw, 2004; Lubatkin et al.,2006; Holmqvist, 2004; Siggelkow and Levinthal, 2003). Yet, with afew exceptions (Adler et al., 1999; Lin et al., 2007; Im and Rai, 2008),empirical investigations of ambidexterity within operations and/orsupply chain management performance implications are scant. Toaddress this void in the literature, we empirically scrutinize a sampleof 174 manufacturers regarding their implementation of SCexploitation and exploration practices. Notably, support for ourevaluation of SC ambidexterity using a manufacturer’s perspective isgiven by Kauppila (2007, p. 3), who conceptualizes innovation in anetwork as follows: ‘‘Our main conclusion is that although thenetwork is a major driver and facilitator of ambidexterity, it is moreadvantageous to create ambidexterity in companies, not in thenetwork.’’ Kauppila (2007), however, provides no empirical tests ofhis assertions or conceptual framework.
Our second research question is: Given that ambidextrous SCstrategy is a viable approach, does an ambidextrous SC strategycoincide with combinative competitive capabilities and businessperformance? Drawing upon three theories—dynamic capabilities,the knowledge-based view (KBV), and the law of requisite variety,we hypothesize that ambidextrous SC strategy has a direct andpositive influence on combinative competitive capabilities, whichin turn, improve business performance, namely, market share andprofit level. Combinative competitive capabilities reflect anorganization’s ability to achieve low cost, high flexibility,dependability, and quality (Roth, 1996a,b; Giffi et al., 1990; Hayesand Wheelwright, 1984; Rosenzweig et al., 2003; Skinner, 1978;Menor et al., 2001).
Our empirical research, which extends ambidexterity researchinto supply chain management, generates three important
contributions. Our study is among the first to measure empiricallyambidextrous SC strategy by developing and validating multi-itemmeasurement scales, while tapping into SC exploration andexploitation constructs. We model ambidextrous supply chainstrategy as a second-order latent construct reflected by two first-order constructs—SC exploration and SC exploitation practices.Modeling co-variation in this way has been established as anappropriate statistical method for testing complementarity(Venkatraman, 1989). Our measurement model is a parsimoniousrepresentation of ambidextrous SC strategy because it reflects theco-variation (i.e., common variances) between supply chainexploration and exploitation. Thus, our measure directly capturesthe synchronous pursuit of supply chain exploration andexploitation as dictated by theory. Having metrics with goodpsychometric properties is highly valuable for testing andadvancing theory (Roth et al., 2008).
Second, we develop a numerical taxonomy using metricstapping into constructs of SC exploitation and SC exploration astaxons. Our empirical results show that over one-third of themanufacturers in the study follow an ambidextrous SC strategy(i.e., placing high emphasis in both SC exploration and exploita-tion). Counter to conventional wisdom, we find no evidence ofsignificant trade-offs in SC exploration and exploitation. Rather, weobserve a tendency towards high, medium, and low ambidextrousSC strategies. Arguably, finding a group of manufacturers withsignificant investment on both types of SC practices provides someempirical evidence for the existence of ambidextrous SC strategy inpractice, which is an important first step for advancing supplychain research in this emerging theoretical arena.
Third, our empirical findings highlight the theoretical andpractical benefits of applying an ambidextrous SC strategy. Thebenefits of simultaneous emphases on SC exploitation andexploration appear to be quite synergistic in that they influencethe manufacturer’s ability to achieve relatively high levels ofoperational combinative competitive capabilities (e.g. quality,delivery, flexibility and low cost) that are necessary for adaptingand competing in target markets. Moreover, the observedrelationship between ambidextrous SC strategy and businessperformance is better understood because of the moderating effectof combinative competitive capabilities (Giffi et al., 1990; Hayesand Wheelwright, 1984; Rosenzweig et al., 2003; Skinner, 1978;Menor et al., 2001; Roth, 1996a). The practical insight is that moresuccessful manufacturers take an increasingly holistic view byplacing relatively high levels of managerial emphasis on both SCexploitation and exploration practices. In turn, they can reapbenefits by exploiting current capabilities while simultaneouslybuild new competencies for future use. In effect, as in the classicaltheoretical sense of learning organizations (Senge, 1992), theholistic deployment of these SC practices are self-reinforcing andact to achieve economies of knowledge (Roth, 1996b) by whichoperational capabilities are enhanced dynamically.
The rest of the paper is structured as follows: Section 2 lays outthe theoretical foundations of our conceptual model and hypothe-ses based on a synthesis of literature associated with organiza-tional learning, dynamic capabilities, operations strategy, andsupply chain management. Section 3 presents the researchmethodology and analysis, and the results are given in Section4. Section 5 concludes with a discussion of the theoretical andmanagerial implications of our findings, the limitations of ourstudy, and a description of future research opportunities.
2. Theoretical framework and hypotheses
The concept of ambidexterity has recently become a subject ofdebate in organizational theory and strategic managementliterature, revolving around the question of whether both

M.M. Kristal et al. / Journal of Operations Management 28 (2010) 415–429 417
exploitation and exploration activities can be pursued at the sametime. Early literature suggests that exploitation and explorationare fundamentally incompatible (March, 1991; Gupta et al., 2006;Kauppila, 2007); therefore, trade-offs have to be made. Two keyassumptions are implicit in this general argument for manufactur-ing. First, a manufacturer’s SC exploitation and explorationpractices may compete for scarce resources. Second, the mindsets,organizational activities, and routines needed for these two typesof activities are different and often conflict with each other(Burgelman, 2002). Thus, extending a focused-factory (Skinner,1978) metaphor to supply chain strategies, the operationalcompetencies required should be incompatible.
Counter to conventional wisdom, a second school of thoughthas recently emerged, positing that ambidexterity is an attainablestrategy. Accordingly, exploitation and exploration are viewed ascomplementary rather than competing competencies (Katila andAhuja, 2002; Gupta et al., 2006; Schulze et al., 2008). While thisconcept seems appealing, there are few empirical studies onambidexterity within operations and supply chain management(Adler et al., 1999; He and Wong, 2004; Lin et al., 2007; Im and Rai,2008). By linking the concept of strategic supply chain practices forexploration and exploitation to operational capabilities, we furthersubject the influence of an ambidextrous SC strategy on businessperformance to rigorous empirical scrutiny (see Fig. 1). In thefollowing sections, the hypothesized relationships are discussed.The first two hypotheses pertain to the formal measurement ofambidextrous SC strategy and combinative capabilities constructs;and the subsequent hypotheses pertain to our theory as depictedby structure of the nomological net of relationships among theconstructs.
2.1. Ambidextrous supply chain strategy
In the supply chain management context, the development ofadvanced technologies, especially information and communica-tion technologies (ICT), has significantly expanded manufacturers’operational competencies and prowess. Sanders (2008) under-scores the potential of two complementary patterns of ICT usagewithin the supply chain management context—one for exploita-tion (i.e., improving current problem solving methods, such as thejoint adoption of an electronic data integration (EDI) system toreconcile inventory and payments), and the other for exploration(i.e., uncovering new problem solving methods and innovations byenabling buyer–supplier engagement and collaboration through acustom Internet portal). Manufacturers also often have access toexternal resources from their supply chain partners, such as addedproduction capacity, six sigma teams, and benchmarking. Severaltheoretical streams, including the resource-dependence theoryand organizational learning theory, have highlighted the impor-tance of offsetting resource dependence and introducing newknowledge through formation of supply chain alliances (Takeishi,2001). The opportunity of accessing external resources effectivelyeases the internal resource constraints needed for both explorationand exploitation. Finally, from a learning organization point ofview, Baum et al. (2000) and Benner and Tushman (2002) argue
Fig. 1. Conceptual model.
that exploitation and exploration are different parts of learning andinnovation; hence, they may require different types of resources.
Supply chain management generally deals with multiplediverse and loosely coupled subsystems; therefore, SC explorationand exploitation could coexist with a low degree of conflict amongmind-sets and organizational routines. For example, a manufactur-ing business unit with multiple various and loosely connectedsubsystems might be able to configure their processes differentlywith each pursuing either explorative or exploitative supply chainpractices. Thus, inherent tension between SC exploration andexploitation at the subsystem level is mitigated due to synergisticjoint effects at the system level (Duncan, 1976; Benner andTushman, 2002; Tushman and O’Reilly, 1996; Gupta et al., 2006).This view is consistent with the argument of Dyer et al. (1998) thateffective supply chain management should strategically segmentsuppliers and manage them differently in order to capturesimultaneously multiple benefits. The extant literature uses theterm, ‘‘structural separation,’’ to describe this approach as aneffective way to acquire ambidexterity (Gibson and Birkinshaw,2004; O’Reilly and Tushman, 2004).
In sum, an ambidextrous SC strategy is posited to be a viablestrategic response for manufacturing firms. To answer our firstresearch question, we hypothesize the existence of a group ofmanufacturers that can be characterized by their holisticmanagement focus and emphasis placed on the combination ofSC exploration and exploitation practices. More formally, in orderto directly capture the duality of emphases on both SC explorationand exploitation that connote an ambidextrous SC strategy, wepropose:
H1. Ambidextrous supply chain strategy is a multidimensional,second-order construct reflected by SC exploitation and explora-tion practices.
2.2. Combinative competitive capabilities
The concept of operational competitive capabilities is embodiedwithin the classical manufacturing strategy literature (Skinner,1978; Giffi et al., 1990; Miller and Roth, 1994; Hayes andWheelwright, 1984). Distinguished from ‘‘intended’’ capabilitiesor priorities in manufacturing, competitive capabilities capture amanufacturer’s ‘‘actual’’ or ‘‘realized’’ competitive strength relativeto its primary competitors in the target markets (Roth and Jackson,1995). Since the 1990s, the notion of combinative competitivecapabilities (hereafter combinative capabilities) has come to thelimelight (Ferdows and DeMeyer, 1990; Rosenzweig et al., 2003;Roth, 1996b; Flynn and Flynn, 2004; Corbett and van Wassenhove,1993). Combinative competitive capabilities are operationallydefined as a manufacturer’s ability to excel simultaneously onquality, delivery, flexibility, and low cost (Menor et al., 2001; Roth,1996a,b). The construct of combinative capabilities indicates aparadigmatic departure from the classical operations strategyliterature that contends firms should trade off their individualcompetitive capabilities (e.g., cost versus quality) to achievesuccess (Hayes et al., 2005; Skinner, 1978).
Proponents of combinative capabilities argue that firms withcombinative capabilities have the requisite internal competencies,which enable them to move smoothly from one short-termadvantage to another at any given point in time. In a hypercom-petitive environment characterized by continuous and unantici-pated changes, combinative capabilities emerge as a strategiccapability that allows firms, who are able to handle variability tocompete effectively (Yusuf et al., 1999; Menor et al., 2001).
More recent studies find the global development and dissemi-nation of advanced manufacturing technologies often extend theproduction frontier, which allows manufacturers to achieve

M.M. Kristal et al. / Journal of Operations Management 28 (2010) 415–429418
superior performance on multiple capabilities simultaneously(Flynn and Flynn, 2004; Corbett and van Wassenhove, 1993;Schmenner and Swink, 1998), and provide empirical support forthe notion of combinative capabilities. In addition, the theoreticalrationale underpinning combinative capabilities is also found inRoth’s (1996a) competitive progression theory (CPT). According toRoth’s CPT, the process variance and knowledge related to anysingle capability co-varies with the others. Due to the sharedvariances and the organizational knowledge created with theinterplay of competitive capabilities—quality, delivery, flexibility,and low cost, the resultant synergies create slack resources thatextend a manufacturer’s operational bandwidth (e.g. productionfrontier or innovation cycle) (Rosenzweig and Roth, 2004). Insummary, the theoretical notion of combinative capabilities can beviewed as the holistic combination of individual capabilities thatbuild on each other and are mutually reinforcing (Ferdows andDeMeyer, 1990; Boyer and Lewis, 2002; Noble, 1995; Roth andMiller, 1992). More formally,
H2. The construct of combinative capabilities is a multidimen-sional, second order construct reflected by first-order capabilitiesof quality, delivery speed, process flexibility, and low cost, ceteris
paribus.
2.3. Linking ambidextrous SC strategy to combinative competitive
capabilities
We conceptualize ambidextrous SC strategy as a strategicmanagerial emphasis on two different types of practices fororganizational learning (SC exploration and exploitation), andcombinative competitive capabilities as simultaneous excelling infour common manufacturing capabilities. We further argue thatambidextrous SC strategy facilitates the development of combina-tive capabilities because it adds to waste reduction and learning asposited by Roth’s (1996a) CPT. The posited performance implica-tions of ambidextrous SC strategy can be explained from threedistinct, but overlapping theoretical lenses—dynamic capabilities,knowledge-based view (KBV), and the law of requisite variety.
2.3.1. Dynamic capabilities
The notion of combinative capabilities is related to the dynamiccapabilities concept (Teece et al., 1997; Eisenhardt and Martin,2000). Anacona et al. (2001, p. 658) state that dynamic capabilities‘‘are rooted in the streams of innovation—in simultaneouslyexploiting and exploring.’’ This connection between combinativecapabilities and ambidexterity becomes clear when examining thetemporal orientations involved in combinative capabilities andambidextrous SC strategy. Combinative capabilities require amanufacturing firm to have two temporal orientations – thepresent and the future – and demand advancement on multiplecapabilities to prepare for today and tomorrow’s changingcompetitive landscapes (e.g., price wars, quality wars, flexibilitywars, etc.).
In the extant literature, exploitation has a temporal orientationof present (Im and Rai, 2008). In our context, SC exploitationfocuses managerial attention towards leveraging current manu-facturer’s capabilities by improving existing SC competenciesprocesses and technologies, as well as rationalizing and reducingsupply costs. As a result, SC exploitation will strengthen a firm’scurrent core competitive advantages. However, excessive exploi-tation is also likely to turn its internal competencies into corerigidities (Leonard-Barton, 1992). Numerous case studies haveprovided industry examples of large, fallen companies that wereonce very successful. They became entangled in the so-called‘‘competence traps,’’ and thus, were unable to adapt to changingcompetitive landscapes (Levitt and March, 1998; Lee, 2004;
O’Reilly and Tushman, 2004). Researchers have argued the needfor manufacturers to use exploration to counter-balance exploita-tion in order to stay out of ‘‘competence traps’’ (Lewin et al., 1999;Lewin and Volberda, 1999).
In contrast to exploitation, a temporal orientation towards thefuture dominates SC exploration, often with unpredictable returns(Im and Rai, 2008). SC exploration is typically involved withdeveloping new supply chain competencies and useable externalknowledge through complex searching, experimenting, andacquiring of new supply chain processes, resources, and technolo-gies. Taken together, exploration holds the promise of effectivelyincreasing a manufacturer’s operational bandwidth for adapting tochanging environments and creating new opportunities. Manu-facturers with an excessive focus on exploration, however, can becaught in a failure trap- ‘‘. . . failure leads to search and change,which lead to failure which leads to even more search, and so on’’(Levinthal and March, 1993 p.105). In this case, manufactures willincrease their vulnerability to the current competition.
In sum, an emerging school of thought advocates thecombinative pursuit of exploitation and exploration to break thedynamics of excessive exploration (e.g. failure traps) and excessiveexploitation (e.g. competence traps) (Lewin et al., 1999; Lewin andVolberda, 1999). The interplay between SC exploration andexploitation forms a dynamic path of absorptive capacity (Heand Wong, 2004; O’Reilly and Tushman, 2004), allowing anambidextrous manufacturer to avoid these entrapments, aspreviously described.
2.3.2. Knowledge-based View (KBV)
There is a growing need for utilizing organizational theories insupply chain management (Ketchen and Hult, 2007). From theknowledge-based view (KBV) perspective, exploitation and explo-ration entail two different knowledge creation processes (Floydand Lane, 2000; Im and Rai, 2008). On one hand, SC exploitationinvolves internalizing and combining the existing knowledgebases to refine current processes and technologies within supplychain management (Huang et al., 2007). On the other hand, SCexploration mainly facilitates the generation of tacit knowledgewithin supply chain management through externalization, combi-nation, and socialization (Huang et al., 2007). Other researcherstheorize that it is the dynamic interactions of these different kindsof organizational knowledge (e.g. tacit and explicit knowledge) andlearning processes (i.e., internalization, combination, externaliza-tion, and socialization) that foster knowledge creation withinorganizations (Grant, 1996; Nonaka, 1994; Spender, 1996). Forinstance, Katila and Ahuja (2002) contend that exploitation ofexisting capabilities is often needed to explore new capabilities,while exploration of new capabilities also enhances a firm’sexisting knowledge base.
Specifically, Hult et al. (2004) state that a knowledge-basedview enables manufacturers to create unique capabilities thatreflect on competitive capabilities. Similar to our concept of SCexploitation practices, Hult et al. (2004) use the concept oforganizational memory, which refers to the familiarity andexperience within current supply chain operations. Hult et al.(2004) assert that organizational memory forms the starting pointof manufacturers’ actions toward achieving higher levels ofcompetitive capabilities. On the other hand, similar to SCexploration practices, Hult et al. (2002) and Hult et al. (2003),use the concept of ‘‘cultural competitiveness’’, which is defined asthe degree to which supply chains detect the gaps between theirown operations and the changing competitive environment.Ketchen and Hult (2007) state that cultural competitivenessenables manufacturers to develop agile operations through‘‘cultural competitiveness’’ since they are more attuned to theneeds of their customers. In summary, ambidextrous SC strategy

M.M. Kristal et al. / Journal of Operations Management 28 (2010) 415–429 419
enables interaction of different learning processes and knowledgecreation as predicted by KBV, and thereby becomes embeddedwithin the manufacturers’ internal and external competencies andprocesses, which in turn, fosters the development of combinativecapabilities (Ketchen and Hult, 2007).
2.3.3. Law of requisite variety
Ashby’s (1958) ‘‘law of requisite variety’’ provides furthertheoretical argument highlighting the importance of ambidexterityin a competitive environment. According to the law of requisitevariety, manufacturers must keep sufficient diversity insideorganizations in order to sense the variety present in theenvironment and enable them to survive (Weick and Westley,1996). By applying this law to operations management, Menor et al.(2001) note that having sufficient diversity inside an organizationtranslates into having multiple and diverse competencies andresources (e.g., organizational slack). This diversity translates into abroader set of competitive capabilities while minimizing the risk ofbecoming obsolete. From this theory, an ambidextrous manufac-turer that invests in combinative SC exploitation and explorationpractices will normally evolve and generate expanded internalcompetences, as well as gain access to a broader set of externalsupply chain resources. Thus, manufacturers adopting an ambidex-trous SC strategy are posited to be better positioned for adaptation tohypercompetitive environments by contributing to the develop-ment of combinative capabilities.
Overall, the emerging paradigm indicates that SC explorationand exploitation are complementary, as the joint pursuit allowsdual temporal orientations deemed important by the dynamiccapabilities view, KBV, and the law of requisite variety. Theinteraction between SC exploration and exploitation createsdynamics in a manufacturer’s knowledge and resource bases,and enhances its absorptive capacity. This interaction ultimatelyprepares the manufacturer for a broad spectrum of competition.Despite the growing theoretical support for the positive relation-ship between ambidexterity and organizational performance(Gupta et al., 2006), empirical evidence is limited and largelyanecdotal. The empirical examination of the relationships betweenSC ambidexterity and combinative capabilities within the supplychain management context is nonexistent. To address the gap, weoffer the following hypothesis:
H3. Ambidextrous SC strategy has a direct and positive influenceon combinative competitive capabilities.
2.4. Linking combinative competitive capabilities to business
performance
Many studies empirically show that operational competitivecapabilities contribute to a competitive advantage due to theirpositive impact on business performance (Ferdows and DeMeyer,1990; Flynn et al., 1999; Roth, 1996a; Roth and Miller, 1992;Menor et al., 2001; Swamidass and Newell, 1987; Vickery et al.,1997; Ward et al., 1998). Operations strategists argue that thispositive impact of operational effectiveness on business perfor-mance can be explained by the resource-based view (RBV) of thefirm (Hayes et al., 2005). Moreover, RBV requires operationaleffectiveness to be deemed a valuable resource that is alsoinherently difficult to imitate. Combinative capabilities fit into thiscategory due to the resultant organizational knowledge thataccumulates through learning and waste reduction (Roth, 1996b;Rosenzweig and Roth, 2004). Combinative capabilities are builtupon the inherent synergies of organization-level operatingabilities that are embedded in operational competencies, routines,and processes; and therefore, making them difficult to develop orimitate. As both RBV and KBV predict, we posit that operationally-
based, combinative capabilities lead to the achievement ofsuperior business performance. Specifically, we propose:
H4a. Combinative competitive capabilities positively influenceprofit level.
H4b. Combinative competitive capabilities positively influencemarket share.
2.5. The mediating role of combinative competitive capabilities
Taken together, H3 and H4a–b imply that combinative capabili-ties mediate the relationship between an ambidextrous SC strategyand a manufacturer’s overall business performance. This mediationmodel is in accordance with the resources-capabilities-performancerelationship underlying both the RBV and the KBV (Menor et al.,2007; Eisenhardt and Santos, 2002; Garud, 1997; Kogut and Zander,1992). The logic behind the mediation argument is this: While weexpect an ambidextrous SC strategy to positively impact businessperformance, there are many difficulties associated with attainingand maintaining a proper balance between SC exploration andexploitation (March, 1991). A manufacturer must receive thebenefits of ambidextrous SC strategy in the form of competitivecapabilities to achieve superior performance (Roth, 1996a,b). Thus, itis through these combinative capabilities that the potential of SCambidexterity, which continuously expands the operational band-width and moves out the performance frontier, is realized inachieving business performance (Eisenhardt and Santos, 2002; Rothand Miller, 1992; Garud, 1997; Kogut and Zander, 1992; Rosenzweigand Roth, 2004). Therefore:
H5a. Combinative competitive capabilities mediate the relation-ship between an ambidextrous SC strategy and market share.
H5b. Combinative competitive capabilities mediate the relation-ship between an ambidextrous SC strategy and profit level.
3. Methods
3.1. Data collection and sample
This study is part of a larger research program to investigatefactors associated with supply chain adaptivity and learning (Kristalet al., 2008). The database and sample details are paraphrased here.The sampling frame of 3200 names was obtained from the Institutefor Supply Management (ISM) membership directory. For this paper,we focused on manufacturing-intense business units. Targetedrespondents were classified by ISM as having positions Titled 1 and 2with executive level titles of president, vice president, director,general manager, supply chain manager, and purchasing manager intheir respective organizations.
In order to increase the response rate, we followed a strategybased upon Dillman’s (2000) and Frohlich’s (2002) recommenda-tions. After pre-validating our measures with a separate Q-sort study(Stage 1), which will be detailed in the measurement section, thesurvey instrument was constructed using items deemed to havetentative reliability and validity from Stage 1. The sampling framewas randomly divided into two groups, 800 and 2400 names,respectively. The first set was used for pilot testing of the surveyinstrument, which employed 78 supply chain professional respon-dents (i.e., 10% return). Next, an initial invitation was emailed to thesecond set of 2,400 targeted ISM respondents requesting theirparticipation. After two days, the potential respondents were e-mailed with a link to our web-based survey. A week later, a remindere-mail with the survey link was sent; and followed up by anotherround of e-mails a week later. Lastly, 500 randomly chosen

M.M. Kristal et al. / Journal of Operations Management 28 (2010) 415–429420
individuals from the list of 2400 potential respondents weretelephoned in order to secure cooperation and representation. Outof these 500, 72 potential respondents could be reached for ourtelephone interview. In total, 214 responses were received, resultingin an effective response rate of 9%, which is consistent with othersusing a complex survey instrument (Hult et al., 2007, 10.7% responserate; Braunscheidel and Suresh, 2009, 7.4% response rate; Tan andVonderembse, 2006, 6.4% response rate). Of the total, 40 respondentsfrom nonmanufacturing businesses were deemed to be ineligible forthis study, resulting in a usable sample of 174.
We tested for non-response bias in two ways. First, weconducted intensive phone interviews with our 72 telephonerespondents after the fourth round of e-mails. We concluded thatthe main reason for the failure to reply was the length of the survey(18 web pages). Given that our survey took approximately 45 minto complete, the 9 percent response rate was not unusual (Dillman,2000) for this or other studies using the same ISM database. Wefound no differences between the web and telephone respondents,in terms of the following variables: number of employees, profitlevel, market share and environmental dynamism. Second, fromthe list of non-respondents, we sampled 50 firms whose data oncurrent assets, profit before taxes, and net sales were available onthe COMPUSTAT database. We compared this group to a group of50 firms that were randomly sampled from the list of 174responding companies whose company data were also available onCOMPUSTAT. There were no statistically significant differences oncurrent assets, profit level before taxes, and net sales, between thetwo groups. As a result, we conclude that our data does not showany evidence of non-respondent bias.
For purposes of this research, we analyzed the manufacturingsub-sample of 174 observations. Our respondents workedprimarily for medium to large sized manufacturing firms.Approximately 35% of these manufacturers had more than 1,000employees; and more than 57% of the manufacturers had a marketshare larger than 32%. The profile of respondents and theirrespective manufacturing business units are presented in Table 1.
Table 1Sample profile.
N Percentage (%)
Business unit represented
Entire Company 90 51.72
Division or Group Level 56 32.18
Plant Level 26 14.94
Other 2 1.15
Total 174 100.00
Respondent job title
President/Vice President 22 12.64
Director 37 21.26
General Manager 10 5.75
Supply Chain Manager 38 21.84
Purchasing Manager 59 33.91
Other 8 4.60
Total 100.00
Primary Industry
Automotive 14 8.05
High Tech 35 20.11
Chemical 27 15.52
Aerospace and Defence 10 5.75
Pharmaceutical 10 5.75
Consumer Goods 59 33.91
Food Manufacturing 5 2.87
Health Care Devices Manufacturing 3 1.72
Other* 11 6.32
Total 174 100.00%
* Includes industries such as appliance manufacturing; hydraulic valves
manufacturing; manufacturing of electrical distribution and automated products;
office equipment manufacturing; printing ink and cartridges; plastics moulding;
and food and beverage manufacturing.
By and large, our respondents were knowledgeable aboutoverall supply chain strategies, with 17% reported were ‘‘veryknowledgeable’’ about the survey; 38% had ‘‘above averageknowledge,’’ 35% were ‘‘knowledgeable.’’ None of the respondentsindicated that they were ‘‘not knowledgeable.’’
3.2. Measures
Since the constructs of SC exploration and exploitation arerelatively new within the context of supply chain literature, weapplied Menor and Roth’s (2007) rigorous, two-stage approach fornew multi-item measurement scale development (see Roth et al.,2008). Other OM examples that use this measurement approach aregiven in Stratman and Roth (2002), Froehle and Roth (2004),Rosenzweig and Roth (2007), and Menor and Roth (2007). In the firststage, theory-based operational definitions for the SC explorationand exploitation constructs, as well as the item pool tapping intoeach, were formed from literature and the structured executiveinterviews. While using the supply chain context, items werestrongly tied to the theoretical foundation laid by March (1991).Next, with independent panels of expert judges, we refined ourmeasures and constructs of SC exploration and exploitation throughan iterative Q-sorting process. Through this process, tentativereliability and validity of the SC exploration and exploitationmeasures were established prior to the field survey implementation.
For the Q-sorting exercises, we employed supply chainmanagement experts from companies such as IBM, DuPont, Johnsonand Johnson, and HP. Each judge had supply chain managementexperience, knowledge about the research topic, and moreimportantly, was a general representation of the respondent samplebeing asked to complete the Stage 2 field survey instrument. Tomeasure inter-rater reliability, we utilized Perrault and Leigh (1989)measure of interjudge agreement (Ir), and Cohen’s k statistic (Cohen,1960) Ir that captures the observed proportion of agreementbetween all possible judge pairs for each round of Q-sorts, whiletaking into account the number of construct categories. Its valuesrange between 0 and 1, where a score of 0 indicates that the observedagreement is by chance, and a score of 1 indicates perfect interjudgeagreement. Scores that are greater than 65% are generally consideredto demonstrate an acceptable level of agreement (Menor and Roth,2007; Stratman and Roth, 2002; Moore and Benbasat, 1991). ACohen’s k statistic that is greater than 0.65 also indicates adequateinterjudge agreement (Moore and Benbasat, 1991). Our stage 1results were 0.82 for Ir and 0.67 for Cohen’s k, indicating satisfactoryreliability results for the Q-sort analyses.
In the second stage, using responses from the ISM field surveydatabase, the psychometric properties of each multi-item mea-surement scale were confirmed. This included the items for thenewly developed SC exploitation and exploration scales obtainedin stage 1, as well as measures of all other constructs in ourhypothesized model that were based on prior literature. Theconstructs of SC exploitation and exploration practices werecaptured on self-anchored, five-point Likert-type scales, rangingfrom 1 = strongly disagree, 3 = neutral, to 5 = strongly agree (seeAppendix A for exact questions and item wording).
With respect to competitive capability measures, we employeditems that were used in prior research (Rosenzweig et al., 2003; Roth,1996a). We operationalized quality as conformance to specificationsand fitness for use, delivery speed as the capability to deliverproducts in a short time, and process flexibility as the ability toadjust or modify operational processes to speedily accommodatechanges (production volumes or product mix) (Miller and Roth,1994; Roth and Miller, 1992). Lastly, we defined low cost as themanufacturer’s ability to compete on cost (Miller and Roth, 1994;Roth, 1996a). Managers were asked to compare their manufacturingbusiness unit performance with their competitors’ performance on
M.M. Kristal et al. / Journal of Operations Management 28 (2010) 415–429 421
each competitive capability indicator for quality, cost, deliveryspeed, and process flexibility, using a 5-point Likert scale rangingfrom 1 = relatively weak, 3 = average, to 5 = market leader.
Business performance was captured in terms of two widelyadopted measures: profit level and market share (Rosenzweig et al.,2003). Respondents were asked to rate their business performance(i.e., market share and profitability) compared to their competition,using a self-anchored five-point Likert scale, ranging from 1 = rela-tively weak, 3 = average, to 5 = market leader (Prescott et al., 1986;Venkatraman and Prescott, 1990). Due to the difficulty of obtainingobjective data on business performance (Narasimhan and Das,2001), we relied on the senior managers’ perceptions of theirbusiness performance. Subjective measures of business perfor-mance have been adopted by various researchers in othermanagement disciplines (e.g., Venkatraman and Prescott, 1990;Prescott et al., 1986). We present the list of items used in the study inAppendix A; and in Section 3.4, their psychometric properties.
3.3. Control variables
Two control variables are employed in this study—manufactur-ing business unit size and environmental dynamism. Consistentwith Ward and Duray (2000), we define environmental dynamismas the degree of turbulence in products, technologies, and productdemand within a market. This dynamism arises when a decisionmaker cannot forecast future events based on the information heor she has on hand. A highly dynamic environment imposes greatchallenges to manufacturers. When the level of environmentaldynamism increases, it becomes more difficult for manufacturersto achieve superior performance. Several researchers, includingAnderson and Tushman (2001) regard environmental dynamismas the most important competitive environment variable affectingthe survival of business units. In light of its potential impact onperformance, we introduced it as a control variable in our analyses.We used existing measures from the management literature (Wardand Duray, 2000), and respondents rated the relative degree ofturbulence in products, technologies, and product demand withintheir respective markets (see Appendix A).
Our second control variable is manufacturing business unit(MBU) size. It is identified in a number of research streams as animportant organizational characteristic that can affect business unitperformance (Chen and Hambrick, 1995; Mintzberg, 1979). Usually,larger business units tend to have larger market size and greatercontrol over the competitive environment (Dean et al., 1998);however, they also tend to be more bureaucratic and contain moremanagement levels than smaller business units (Daft, 1995). Inaddition, business unit size is a commonly adopted proxy fororganization resources (Lin et al., 2007). Several researchers arguethat organization resources may affect its capability to achieve anambidextrous organization (Kyriakopoulos and Moorman, 2004;Venkatraman et al., 2007). Raisch and Birkinshaw (2008) state thatwealthier firms have resources that can be exploited and exploredsimultaneously; whereas firms with fewer resources may be unableto afford such strategies. In order to single out the effect ofambidexterity on business performance from the possible effects ofresource availability and manufacturers market power; we includethe MBU size as a control variable, measured as the number ofemployees working within the MBU.
3.4. Measurement properties
Little’s (1988) missing completely at random (MCAR) test pointsout that the missing data patterns for each item do not deviate from aMCAR pattern (x2 = 627.48, df = 623, p = .44); therefore, we utilizedthe Full Information Maximum Likelihood (FIML) approach tomissing values. This technique is particularly favourable, as it uses
all the available data to generate the maximum likelihood-basedstatistics (Arbuckle, 2005; Little and Rubin, 2002).
Confirmatory factor analysis (CFA) implemented in Amos 16was employed to evaluate construct reliability and validity(Anderson and Gerbing, 1988; see Appendix B). To assess thereliability of the study constructs, we used the statistics ofcomposite reliability and average variance extracted (AVE) (Fornelland Larcker, 1981; Hair et al., 1998; Williams et al., 2003). All of ourcomposite reliability values are greater than 0.70 and AVE valuesgreater than or at the level of 0.50 (see Appendix B), indicatingacceptable reliability levels (O’Leary-Kelly and Vokurka, 1998;Fornell and Larcker, 1981).
The overall fit of the CFA model is good (Bollen, 1989)(x2 = 507.63, df = 367; p = 0.01, x2/df = 1.38; IFI = 0.95; NNFI = 0.93;CFI = 0.95, RMSEA = 0.05). Each individual measure is significantlyassociated with its latent construct, with a coefficient greater thantwice of standard errors (see Appendix B). Hence, unidimensionalityand convergent validity are supported (Anderson and Gerbing,1988). Additionally, we used proportion of variance explained (R2) asanother indicator of reliability. Previous studies in the OM literature(e.g., Carr and Pearson, 1999) consider values of R2 greater than 0.40as acceptable. As shown in Appendix B, our CFA results indicate thatall these criteria are met, and thus, the indicator items within eachscale are significantly related to their underlying theoreticalconstructs.
In order to assess discriminant validity, we formed all possiblepairs of latent constructs and tested each pair first by allowing thepair to freely correlate, and then by setting the correlation betweenthem to 1.00. A significant chi-square difference between the twonested models indicates that the two constructs are distinct. In ourtests, all the chi-square differences are statistically significant(p < 0.001), indicating discriminant validity among the theoreticalconstructs (O’Leary-Kelly and Vokurka, 1998; Stratman and Roth,2002; Bagozzi et al., 1991).
We also assessed the criterion-related validity of the profitabilitymeasures. Prior studies demonstrate statistically significant corre-lations between perceptual and corresponding objective measuresof performance (Dess and Robinson, 1984; Vickery et al., 1997; Wardet al., 1998; Menor et al., 2001; Roth et al., 2008). Together thesestudies indicate that perceptual ratings of performance can beconsidered as reliable indicators. Our research finds the sameregarding the criterion-related validity of the subjective profitabilitymeasures. Following Bollen (1989), we identified 78 companiesfrom the list of respondents whose profit-related, survey data werealso available in COMPUSTAT database. We collected data for theprofit before taxes, which is calculated as the ratio of pre-tax income(COMPUSTAT Annual Data Item #170) to net sales (COMPUSTATAnnual Data Item #12) and current assets (COMPUSTAT Annual DataItem #4). We then divided the profit before taxes by current assets toobtain a measure of return on current assets. Finally, we correlatedthis measure with the composite measure of profitability used in oursurvey instrument (i.e., we averaged the three items of profitabilityused in our survey [see Appendix A]). This procedure is only a roughapproximation of an ideal assessment of criterion-related validity,because the COMPUSTAT measure is ‘absolute’ profits with noadjustment to industry and competition, and the subjective measureconnotes profits ‘relative to competitors.’ Nonetheless, the Pearsoncorrelation between the two measures is moderately significant(r = .26, p < .10), providing some evidence of criterion validity of theprofitability measures.
Finally, since common methods variance is typically a concernwhen collecting data from single respondents, we addressed thisissue in two ways. First, when implementing the survey, werandomized the sequence of items, sought knowledgeablerespondents, guaranteed respondents complete anonymity, whichwas required by our university’s Institutional Review Board, and
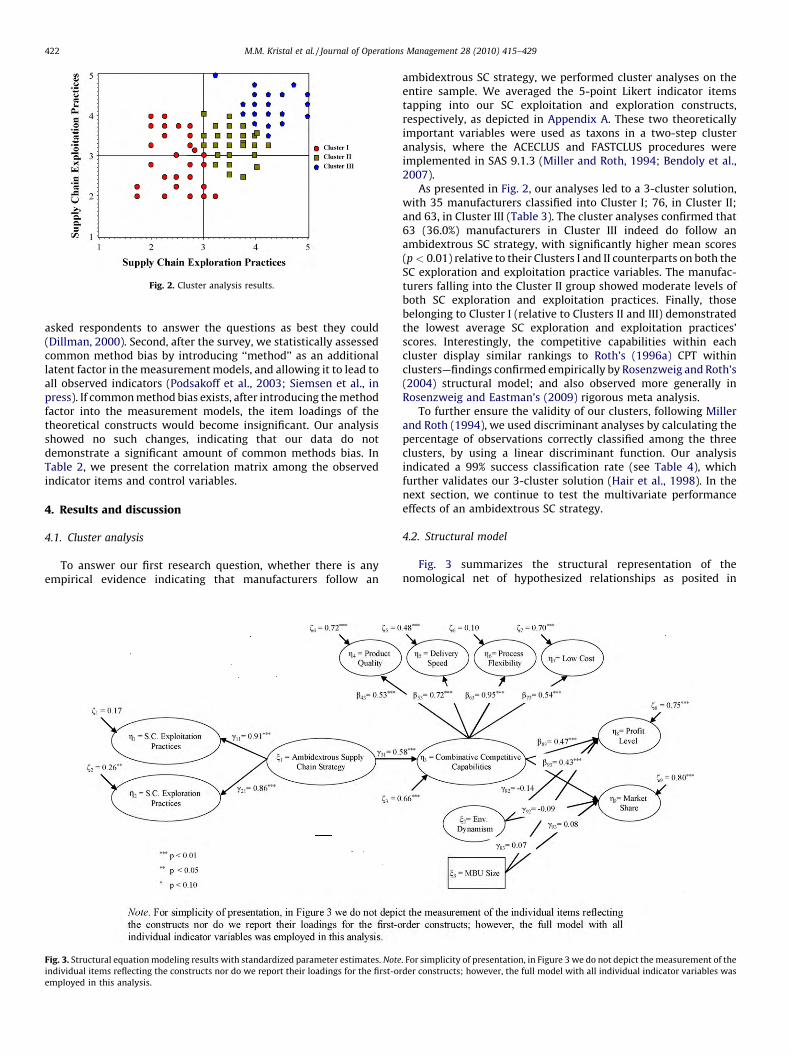
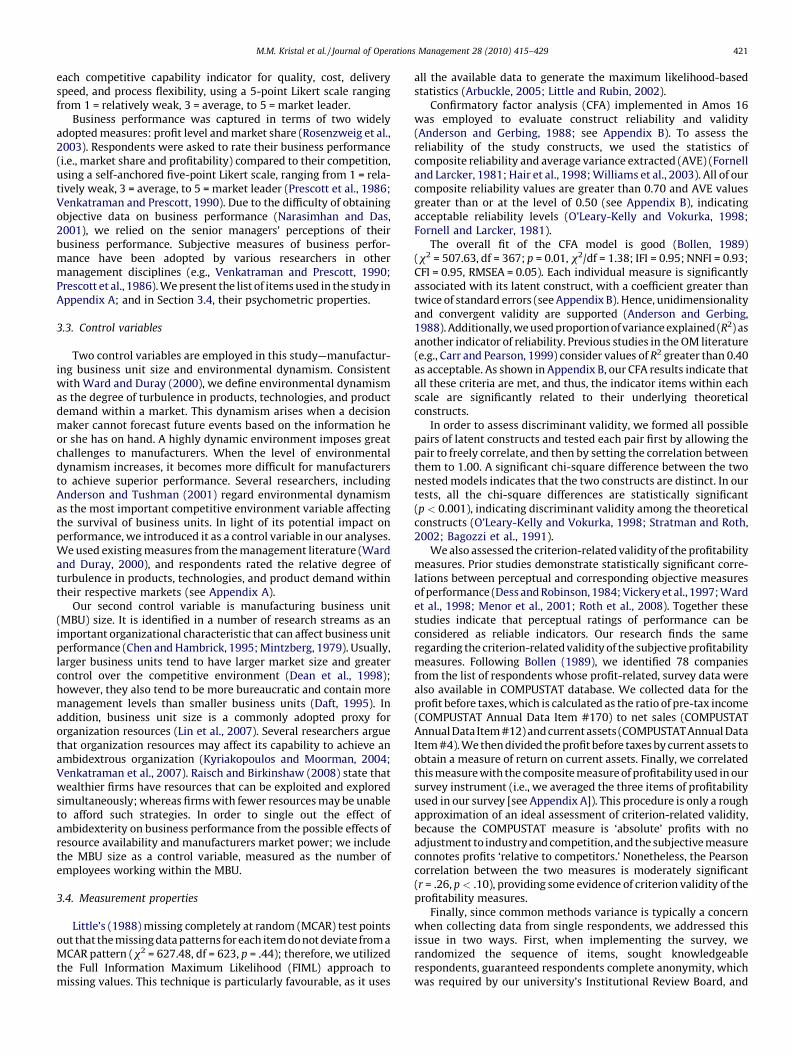
Fig. 2. Cluster analysis results.
M.M. Kristal et al. / Journal of Operations Management 28 (2010) 415–429422
asked respondents to answer the questions as best they could(Dillman, 2000). Second, after the survey, we statistically assessedcommon method bias by introducing ‘‘method’’ as an additionallatent factor in the measurement models, and allowing it to lead toall observed indicators (Podsakoff et al., 2003; Siemsen et al., inpress). If common method bias exists, after introducing the methodfactor into the measurement models, the item loadings of thetheoretical constructs would become insignificant. Our analysisshowed no such changes, indicating that our data do notdemonstrate a significant amount of common methods bias. InTable 2, we present the correlation matrix among the observedindicator items and control variables.
4. Results and discussion
4.1. Cluster analysis
To answer our first research question, whether there is anyempirical evidence indicating that manufacturers follow an
Fig. 3. Structural equation modeling results with standardized parameter estimates. Note
individual items reflecting the constructs nor do we report their loadings for the first-or
employed in this analysis.
ambidextrous SC strategy, we performed cluster analyses on theentire sample. We averaged the 5-point Likert indicator itemstapping into our SC exploitation and exploration constructs,respectively, as depicted in Appendix A. These two theoreticallyimportant variables were used as taxons in a two-step clusteranalysis, where the ACECLUS and FASTCLUS procedures wereimplemented in SAS 9.1.3 (Miller and Roth, 1994; Bendoly et al.,2007).
As presented in Fig. 2, our analyses led to a 3-cluster solution,with 35 manufacturers classified into Cluster I; 76, in Cluster II;and 63, in Cluster III (Table 3). The cluster analyses confirmed that63 (36.0%) manufacturers in Cluster III indeed do follow anambidextrous SC strategy, with significantly higher mean scores(p < 0.01) relative to their Clusters I and II counterparts on both theSC exploration and exploitation practice variables. The manufac-turers falling into the Cluster II group showed moderate levels ofboth SC exploration and exploitation practices. Finally, thosebelonging to Cluster I (relative to Clusters II and III) demonstratedthe lowest average SC exploration and exploitation practices’scores. Interestingly, the competitive capabilities within eachcluster display similar rankings to Roth’s (1996a) CPT withinclusters—findings confirmed empirically by Rosenzweig and Roth’s(2004) structural model; and also observed more generally inRosenzweig and Eastman’s (2009) rigorous meta analysis.
To further ensure the validity of our clusters, following Millerand Roth (1994), we used discriminant analyses by calculating thepercentage of observations correctly classified among the threeclusters, by using a linear discriminant function. Our analysisindicated a 99% success classification rate (see Table 4), whichfurther validates our 3-cluster solution (Hair et al., 1998). In thenext section, we continue to test the multivariate performanceeffects of an ambidextrous SC strategy.
4.2. Structural model
Fig. 3 summarizes the structural representation of thenomological net of hypothesized relationships as posited in
. For simplicity of presentation, in Figure 3 we do not depict the measurement of the
der constructs; however, the full model with all individual indicator variables was
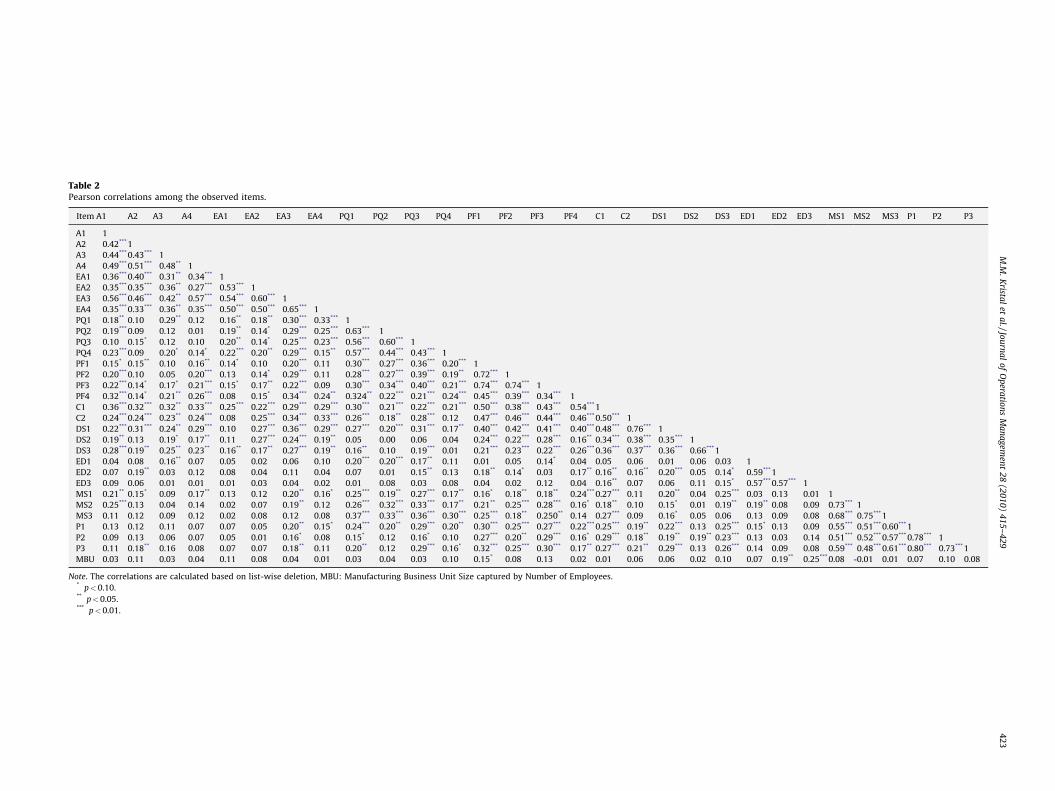
Table 2Pearson correlations among the observed items.
Item A1 A2 A3 A4 EA1 EA2 EA3 EA4 PQ1 PQ2 PQ3 PQ4 PF1 PF2 PF3 PF4 C1 C2 DS1 DS2 DS3 ED1 ED2 ED3 MS1 MS2 MS3 P1 P2 P3
A1 1
A2 0.42*** 1
A3 0.44*** 0.43*** 1
A4 0.49*** 0.51*** 0.48** 1
EA1 0.36*** 0.40*** 0.31** 0.34*** 1
EA2 0.35*** 0.35*** 0.36** 0.27*** 0.53*** 1
EA3 0.56*** 0.46*** 0.42** 0.57*** 0.54*** 0.60*** 1
EA4 0.35*** 0.33*** 0.36** 0.35*** 0.50*** 0.50*** 0.65*** 1
PQ1 0.18** 0.10 0.29** 0.12 0.16** 0.18** 0.30*** 0.33*** 1
PQ2 0.19*** 0.09 0.12 0.01 0.19** 0.14* 0.29*** 0.25*** 0.63*** 1
PQ3 0.10 0.15* 0.12 0.10 0.20** 0.14* 0.25*** 0.23*** 0.56*** 0.60*** 1
PQ4 0.23*** 0.09 0.20* 0.14* 0.22*** 0.20** 0.29*** 0.15** 0.57*** 0.44*** 0.43*** 1
PF1 0.15* 0.15** 0.10 0.16** 0.14* 0.10 0.20*** 0.11 0.30*** 0.27*** 0.36*** 0.20*** 1
PF2 0.20*** 0.10 0.05 0.20*** 0.13 0.14* 0.29*** 0.11 0.28*** 0.27*** 0.39*** 0.19** 0.72*** 1
PF3 0.22*** 0.14* 0.17* 0.21*** 0.15* 0.17** 0.22*** 0.09 0.30*** 0.34*** 0.40*** 0.21*** 0.74*** 0.74*** 1
PF4 0.32*** 0.14* 0.21** 0.26*** 0.08 0.15* 0.34*** 0.24** 0.324** 0.22*** 0.21*** 0.24*** 0.45*** 0.39*** 0.34*** 1
C1 0.36*** 0.32*** 0.32** 0.33*** 0.25*** 0.22*** 0.29*** 0.29*** 0.30*** 0.21*** 0.22*** 0.21*** 0.50*** 0.38*** 0.43*** 0.54*** 1
C2 0.24*** 0.24*** 0.23** 0.24*** 0.08 0.25*** 0.34*** 0.33*** 0.26*** 0.18** 0.28*** 0.12 0.47*** 0.46*** 0.44*** 0.46*** 0.50*** 1
DS1 0.22*** 0.31*** 0.24** 0.29*** 0.10 0.27*** 0.36*** 0.29*** 0.27*** 0.20*** 0.31*** 0.17** 0.40*** 0.42*** 0.41*** 0.40*** 0.48*** 0.76*** 1
DS2 0.19** 0.13 0.19* 0.17** 0.11 0.27*** 0.24*** 0.19** 0.05 0.00 0.06 �0.04 0.24*** 0.22*** 0.28*** 0.16** 0.34*** 0.38*** 0.35*** 1
DS3 0.28*** 0.19** 0.25** 0.23** 0.16** 0.17** 0.27*** 0.19** 0.16** 0.10 0.19*** 0.01 0.21*** 0.23*** 0.22*** 0.26*** 0.36*** 0.37*** 0.36*** 0.66*** 1
ED1 �0.04 0.08 �0.16** 0.07 0.05 �0.02 �0.06 �0.10 �0.20*** �0.20***�0.17** �0.11 �0.01 �0.05 �0.14* �0.04 0.05 �0.06 �0.01 0.06 0.03 1
ED2 0.07 0.19** �0.03 0.12 0.08 0.04 0.11 0.04 0.07 �0.01 0.15** 0.13 0.18** 0.14* �0.03 0.17** 0.16** 0.16** 0.20*** 0.05 0.14* 0.59*** 1
ED3 �0.09 0.06 0.01 0.01 �0.01 0.03 �0.04 �0.02 0.01 �0.08 �0.03 �0.08 0.04 �0.02 �0.12 0.04 0.16** 0.07 0.06 0.11 0.15* 0.57*** 0.57*** 1
MS1 0.21** 0.15* 0.09 0.17** 0.13 0.12 0.20** 0.16* 0.25*** 0.19** 0.27*** 0.17** 0.16* 0.18** 0.18** 0.24*** 0.27*** 0.11 0.20** 0.04 0.25***�0.03 0.13 0.01 1
MS2 0.25*** 0.13 0.04 0.14 0.02 0.07 0.19** 0.12 0.26*** 0.32*** 0.33*** 0.17** 0.21** 0.25*** 0.28*** 0.16* 0.18** 0.10 0.15* 0.01 0.19** �0.19** 0.08 �0.09 0.73*** 1
MS3 0.11 0.12 0.09 0.12 �0.02 0.08 0.12 0.08 0.37*** 0.33*** 0.36*** 0.30*** 0.25*** 0.18** 0.250** 0.14 0.27*** 0.09 0.16* �0.05 0.06 �0.13 0.09 �0.08 0.68*** 0.75*** 1
P1 0.13 0.12 0.11 0.07 0.07 0.05 0.20** 0.15* 0.24*** 0.20** 0.29*** 0.20** 0.30*** 0.25*** 0.27*** 0.22*** 0.25*** 0.19** 0.22*** 0.13 0.25***�0.15* 0.13 �0.09 0.55*** 0.51*** 0.60*** 1
P2 0.09 0.13 0.06 0.07 �0.05 �0.01 0.16* 0.08 0.15* 0.12 0.16* 0.10 0.27*** 0.20** 0.29*** 0.16* 0.29*** 0.18** 0.19** 0.19** 0.23***�0.13 0.03 �0.14 0.51*** 0.52*** 0.57*** 0.78*** 1
P3 0.11 0.18** 0.16 0.08 0.07 0.07 0.18** 0.11 0.20** 0.12 0.29*** 0.16* 0.32*** 0.25*** 0.30*** 0.17** 0.27*** 0.21** 0.29*** 0.13 0.26***�0.14 0.09 �0.08 0.59*** 0.48*** 0.61*** 0.80*** 0.73*** 1
MBU�0.03 0.11 �0.03 �0.04 0.11 �0.08 �0.04 �0.01 �0.03 �0.04 0.03 �0.10 �0.15* �0.08 �0.13 0.02 0.01 0.06 0.06 0.02 0.10 0.07 0.19** 0.25*** 0.08 -0.01 0.01 0.07 �0.10 0.08
Note. The correlations are calculated based on list-wise deletion, MBU: Manufacturing Business Unit Size captured by Number of Employees.* p<0.10.** p<0.05.*** p<0.01.
M.M
.K
ristal
eta
l./Jou
rna
lo
fO
pera
tion
sM
an
ag
emen
t2
8(2
01
0)
41
5–
42
94
23

Table 3Cluster Analysis results: comparison of competitive capabilities and supply chain practices means by cluster.
Cluster I (N = 35) Cluster II (N = 76) Cluster III (ambidextrous group) (N = 63) F-statistic
Supply chain practices
SC Exploration1 2.51 (II, III)2 3.55 (I, III) 4.23 (I, II) 282.11***
SC Exploitation1 2.90 (II, III) 3.37 (I, III) 4.06 (I, II) 103.52***
Competitive capabilities
Product Quality 3.68 (II, III) 4.05 (I) 4.22 (I) 11.08***
Delivery 3.55 (III) 3.78 3.97 (I) 3.97**
Process Flexibility 3.10 (II, III) 3.40 (I, III) 3.81 (I, II) 17.58***
Low Cost 2.61 (II, III) 3.07 (I) 3.33 (I) 9.24***
Combinative Competitive Capabilities 3.24 (II, III) 3.58 (I, III) 3.83 (I, II) 19.38***
1 These scales are used as taxons for the cluster analysis. See Appendix A.2 Numbers in the parentheses indicate the results of pairwise comparisons among the cluster means with Bonferonni correction (p<0.10).** p<0.05.*** p<0.01.
Table 4Percent of cluster classifications correctly classified and cross-validation.
Actual classification/predicted classification Cluster I Cluster II Cluster III (ambidextrous group) Cluster totals
Cluster I 35 (100%) 0 (0%) 0 (0%) 35 (100%)
Cluster II 1 (1.32%) 74 (97.37%) 1 (1.32%) 76 (100%)
Cluster III (ambidextrous group) 0 (0%) 0 (0%) 63 (100%) 63 (100%)
Error rates from Cross Validation 0.00 0.03 0.00 0.01
Posterior probabilities 20.69 42.53 36.78
Note. The numbers in parenthesis are the percentages of correctly classified ‘‘hits’’ as predicted by the discriminant analysis to the number of actual observations from the
cluster analysis (or cluster totals) (Example: 97.37% = 74/76).
Table 5Mediation model: direct, indirect and total effects of ambidextrous sc strategy on
combinative competitive capabilities and firm performance (N = 174).
Combinative
competitive capabilities
Profit
level
Market
share
Ambidextrous SC strategy
Total Effect (T.E) 0.59*** 0.20** 0.25***
Direct Effect (D.E) 0.59*** �0.13 �0.01
Indirect Effect (I.E) – 0.33*** 0.26***
Combinative Competitive Capabilities
Direct Effect (D.E) – 0.57*** 0.45***
Note. Statistical significance was calculated following the approaches of Sobel
(1982) and Goodman (1960). *p<0.10** p<0.05.*** p<0.01.
M.M. Kristal et al. / Journal of Operations Management 28 (2010) 415–429424
Section 2. To evaluate our hypotheses, we first analyzed the fit ofthe proposed model using structural equation modeling (SEM).Overall fit indices of the structural model indicate that ourtheoretical model fits the data well (Bollen, 1989) (x2 = 602.43;df = 419; p < 0.01; IFI = .93; NNFI = .91; CFI = .93; RMSEA = 0.05;see Appendix C). Along with the satisfactory overall fit of themodel, the positive and significant path loadings linking ambidex-trous SC strategy to SC exploitation practices (g11 = .91, p < 0.01)and to SC exploration practices (g21 = .86, p < 0.01) lend supportfor Hypothesis 1. Consistent with the literature on manufacturingstrategy (Ferdows and DeMeyer, 1990; Flynn and Flynn, 2004;Rosenzweig and Roth, 2004; Roth, 1996a) that contends a bundleof competitive capabilities can be acquired in a holistic sense, ourresults support Hypothesis 2 that links combinative capabilities toquality (b43 = .53, p < 0.01), delivery speed (b53 = .72, p < 0.01),process flexibility (b63 = .95, p < 0.01), and low cost (b73 = .54,p < 0.01). In addition, we find support for Hypothesis 3 that relatesambidextrous SC strategy to combinative capabilities (g31 = .58,p < 0.01), and Hypotheses 4a and b which relate combinativecapabilities to profit level (b83 = .47, p < 0.01) and market share(b93 = .43, p < 0.01). Notably, neither environmental dynamismnor MBU size was found to have significant effects on businessperformance, which suggests that the results are not driven byMBU size or environmental dynamism as we operationalizedthem.
We conducted an additional analysis to test Hypotheses 5a and5b, which indicates that combinative capabilities mediate therelationship between ambidextrous SC strategy and businessperformance. Mediation occurs when the dependent variable isregressed on both independent and mediating variables; as aresult, the direct effect of the independent variable on thedependent variable diminishes (i.e., indicating partial mediation),or disappears (i.e., indicating full mediation) (Judd and Kenny,1981). In order to test the effect of ambidextrous SC strategy onfirm business performance, we added two direct paths to our
original model—one linking ambidextrous SC strategy to marketshare; and one linking ambidextrous SC strategy to profit level. Werefer to this model as the mediation model. In order to analyze themediation model, we followed the approaches of Bollen (1987) andJames et al. (2006) to decompose the mediation model effects intodirect effects (i.e., D.E.: influence of a predictor variable on adependent variable that is unmediated by the interveningvariable), indirect effects (i.e., I.E.: the effect of a predictor variableon a dependent variable that is mediated by the interveningvariable), and total effects (i.e., T.E.). Table 5 gives the path loadingsrelevant for testing Hypotheses 5a and 5b.
The mediation model’s overall fit indices indicate that it isconsistent with the data (x2 = 600.97; df = 417; p < 0.01; IFI = .93;NNFI = .91; CFI = .93; RMSEA = 0.05). Ambidextrous SC strategyinfluences both profit level (T.E. = .20, p < 0.05) and market share(T.E. = .25, p < 0.01). It also indirectly affects profit level (I.E. = .33,p < 0.01) and market share (I.E. = .26, p < 0.01) via combinativecapabilities. Given that our hypothesized model (depicted in Fig. 3)and mediation model are nested models, we also tested the chi-
M.M. Kristal et al. / Journal of Operations Management 28 (2010) 415–429 425
square difference between these two models. The chi-squaredifference is 1.46 with 2 degrees of freedom, which is statisticallyinsignificant. Combined with insignificant direct effects ofambidextrous SC strategy on profit levels (D.E = �0.13, p > 0.10)and on market share (D.E. = �0.01, p > 0.10), as well as theinsignificant change in the fit statistics, the results indicatecombinative capabilities fully mediate the relationship betweenambidextrous SC strategy and business performance (James et al.,2006). This result highlights the important role as indicated bytheory that combinative capabilities play in the relationshipbetween ambidextrous SC strategy and business performance. Atest of the robustness of these results was performed by estimatingthe model paths using the two-stage least squares procedureimplemented in SAS 9.1.3, Proc 2SLS procedure. Two-stage leastsquares is a robust procedure in the sense that it is distributionfree, and that the asymptotic standard errors are appropriate forsignificance testing–even under conditions of nonnormality orexcessive multivariate kurtosis of the observed variables (Bollen,1996; Bollen and Biesanz, 2002). Only minor differences in effectsizes were observed; otherwise the conclusions are the same.
5. Conclusion
This study empirically investigates the value of ambidextrousSC strategy on a manufacturer’s combinative capabilities andbusiness performance. Specifically, we operationalize ambidex-trous SC strategy as a second-order latent construct in order tocapture the co-variation between SC exploitation and exploration.Building upon dynamic capabilities theory, the knowledge-basedview (KBV), and Ashby’s (1958) law of requisite variety, wedeveloped a mediation model where we formally hypothesizedthat an ambidextrous SC strategy would have a positive effect oncombinative capabilities. This in turn, contributes to high profitlevel and market share. Our empirical research confirms thisperspective: An ambidextrous SC strategy is a viable strategicchoice by which manufacturers can leverage sources of externalsupply chain knowledge to build internal competencies andcapabilities. Counter to the tradeoffs view of exploration andexploitation in the innovation literature, we provide empiricalevidence of the complementary view of exploration and exploita-tion within the supply chain management context. Importantly,the notion of complementarity supports the emerging theory inwhich a balance between SC exploration and SC exploitation isassociated with favourable performance effects. Thus, our modelconnotes a holistic view of ambidextrous SC strategy by examiningthe co-alignment (Venkatraman, 1989) of SC exploitation and SCexploration; and when taken separately, each is deemed insuffi-cient in describing an ambidextrous SC strategy.
The parallels in other literatures that also embrace a holisticview of operations strategy are noteworthy. Take for example, abody of quality management and operations strategy literaturethat emphasizes theoretically and shows empirically, the impor-tance of implementing a set of manufacturing practices simulta-neously to build operational competencies and capabilities (Giffiet al., 1990). Cua et al. (2001) illustrate this point when theyapplied a holistic view to the implementation of TQM, JIT and TPM.The authors found that the joint implementation of commonpractices and basic techniques of TQM, JIT and TPM leads toimproved manufacturing performance.
As in all research, this study has its limitations. One suchlimitation is the issue of single respondents. This issue – along withcommon method variance, a result of single-respondent research –has been discussed widely in various areas (Podsakoff and Organ,1986; Siemsen et al., in press). To overcome this problem, we usedthe help of the Institute for Supply Management and identifiedrespondents who are experts on the issues of interest. We also
performed statistical tests for common method bias and did notfind any significant effects. In future studies we will furtheraddress this limitation by using multiple knowledgeable respon-dents from each manufacturer.
We built our structural model on theoretical grounds and usedthe guidance of supply chain experts. However, future researchwould benefit from longitudinal data to capture the dynamics inthe evolution of the supply chains, and observe how these supplychains implement ambidexterity over time. This limitation alsopresents a new avenue for our future research by following themanufacturers that responded to our survey, and examine howthey learn and adapt to their competitive environments over time.We plan to continue working with our respondents to collectlongitudinal data that will enable us to draw an evolutiontrajectory of these manufacturers’ ambidextrous SC strategy.
Finally, our study analyzes ambidextrous strategy from a singlemanufacturer’s perspective. An interesting future research projectcould be to analyze the impact of an ambidextrous SC strategy inthe context of an entire supply chain network, such as proposed byKauppila (2007). Additional performance metrics, for instance,inter-organizational relationship performance can also be includedin future investigations to enrich understanding of the antecedentsand consequences of ambidextrous SC strategy from a networkperspective.
In conclusion, this research makes several major contributionsto the existing literature. First, although ambidexterity has beenstudied in other disciplines, its applicability to SCM and OM islargely missing. Leveraging theories from other disciplines allowsus to investigate the enablers of operations capabilities from afresh angle, that of an ambidextrous SC strategy. This research isone of the initial efforts to extend and empirically test the notionof ambidexterity in the supply chain management context, as wellas develop metrics with good psychometric properties for thisnotion.
Second, the confirmation of hypotheses pertaining to theperformance implications of an ambidextrous SC strategy enrichesour theoretical understanding of how operations capabilities canbe acquired through supply chain management. The finding thatcombinative capabilities act as a mediator between an ambidex-trous SC strategy and business performance offers a theoreticalexplanation of its observed total and positive joint effects.Potentially adding to the operations frontier notion (Schmennerand Swink, 1998) and Roth’s (1996a) CPT, an ambidextrousstrategy that draws upon supply chain knowledge and resourcesmay extend a manufacturer’s operational bandwidth; thus,creating slack resources that push the frontier and enablecombinative capabilities.
Third, the study provides insights into managerial practices.Specifically, the importance of an ambidextrous SC strategy formanagers implies that even under constant pressures to achieveshort-term performance and cost-cutting incentives, supply chainmanagers should not shirk from continuously exploring theirsupply chains for new ideas, processes, practices and technologies.Such exploration reinforces and fosters organizational learningneeded for building multiple, dynamic capabilities. As Lee (2004)notes in numerous examples, top performing supply chains allexhibit simultaneous mastering of combinative capabilities. Thus,supply chain managers should continuously leverage their existingsupply chain capabilities as well as search for new sources ofsupply chain competence.
Acknowledgments
The authors would like to acknowledge the Institute for SupplyManagement, the International Society of Logistics, and SAP AG fortheir support of this research.
M.M. Kristal et al. / Journal of Operations Management 28 (2010) 415–429426
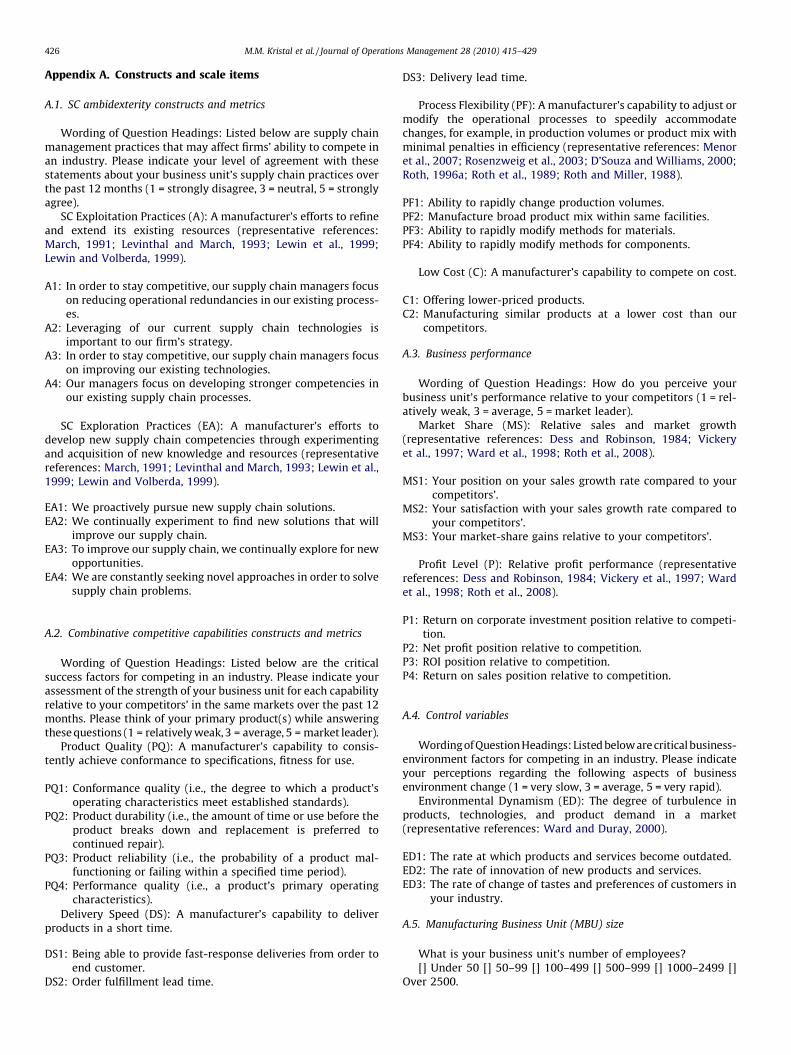
Appendix A. Constructs and scale items
A.1. SC ambidexterity constructs and metrics
Wording of Question Headings: Listed below are supply chainmanagement practices that may affect firms’ ability to compete inan industry. Please indicate your level of agreement with thesestatements about your business unit’s supply chain practices overthe past 12 months (1 = strongly disagree, 3 = neutral, 5 = stronglyagree).
SC Exploitation Practices (A): A manufacturer’s efforts to refineand extend its existing resources (representative references:March, 1991; Levinthal and March, 1993; Lewin et al., 1999;Lewin and Volberda, 1999).
A1: In order to stay competitive, our supply chain managers focuson reducing operational redundancies in our existing process-es.
A2: Leveraging of our current supply chain technologies isimportant to our firm’s strategy.
A3: In order to stay competitive, our supply chain managers focuson improving our existing technologies.
A4: Our managers focus on developing stronger competencies inour existing supply chain processes.
SC Exploration Practices (EA): A manufacturer’s efforts todevelop new supply chain competencies through experimentingand acquisition of new knowledge and resources (representativereferences: March, 1991; Levinthal and March, 1993; Lewin et al.,1999; Lewin and Volberda, 1999).
EA1: We proactively pursue new supply chain solutions.EA2: We continually experiment to find new solutions that will
improve our supply chain.EA3: To improve our supply chain, we continually explore for new
opportunities.EA4: We are constantly seeking novel approaches in order to solve
supply chain problems.
A.2. Combinative competitive capabilities constructs and metrics
Wording of Question Headings: Listed below are the criticalsuccess factors for competing in an industry. Please indicate yourassessment of the strength of your business unit for each capabilityrelative to your competitors’ in the same markets over the past 12months. Please think of your primary product(s) while answeringthese questions (1 = relatively weak, 3 = average, 5 = market leader).
Product Quality (PQ): A manufacturer’s capability to consis-tently achieve conformance to specifications, fitness for use.
PQ1: Conformance quality (i.e., the degree to which a product’soperating characteristics meet established standards).
PQ2: Product durability (i.e., the amount of time or use before theproduct breaks down and replacement is preferred tocontinued repair).
PQ3: Product reliability (i.e., the probability of a product mal-functioning or failing within a specified time period).
PQ4: Performance quality (i.e., a product’s primary operatingcharacteristics).
Delivery Speed (DS): A manufacturer’s capability to deliverproducts in a short time.
DS1: Being able to provide fast-response deliveries from order toend customer.
DS2: Order fulfillment lead time.
DS3: Delivery lead time.
Process Flexibility (PF): A manufacturer’s capability to adjust ormodify the operational processes to speedily accommodatechanges, for example, in production volumes or product mix withminimal penalties in efficiency (representative references: Menoret al., 2007; Rosenzweig et al., 2003; D’Souza and Williams, 2000;Roth, 1996a; Roth et al., 1989; Roth and Miller, 1988).
PF1: Ability to rapidly change production volumes.PF2: Manufacture broad product mix within same facilities.PF3: Ability to rapidly modify methods for materials.PF4: Ability to rapidly modify methods for components.
Low Cost (C): A manufacturer’s capability to compete on cost.
C1: Offering lower-priced products.C2: Manufacturing similar products at a lower cost than our
competitors.
A.3. Business performance
Wording of Question Headings: How do you perceive yourbusiness unit’s performance relative to your competitors (1 = rel-atively weak, 3 = average, 5 = market leader).
Market Share (MS): Relative sales and market growth(representative references: Dess and Robinson, 1984; Vickeryet al., 1997; Ward et al., 1998; Roth et al., 2008).
MS1: Your position on your sales growth rate compared to yourcompetitors’.
MS2: Your satisfaction with your sales growth rate compared toyour competitors’.
MS3: Your market-share gains relative to your competitors’.
Profit Level (P): Relative profit performance (representativereferences: Dess and Robinson, 1984; Vickery et al., 1997; Wardet al., 1998; Roth et al., 2008).
P1: Return on corporate investment position relative to competi-tion.
P2: Net profit position relative to competition.P3: ROI position relative to competition.P4: Return on sales position relative to competition.
A.4. Control variables
Wording of Question Headings: Listed below are critical business-environment factors for competing in an industry. Please indicateyour perceptions regarding the following aspects of businessenvironment change (1 = very slow, 3 = average, 5 = very rapid).
Environmental Dynamism (ED): The degree of turbulence inproducts, technologies, and product demand in a market(representative references: Ward and Duray, 2000).
ED1: The rate at which products and services become outdated.ED2: The rate of innovation of new products and services.ED3: The rate of change of tastes and preferences of customers in
your industry.
A.5. Manufacturing Business Unit (MBU) size
What is your business unit’s number of employees?[] Under 50 [] 50–99 [] 100–499 [] 500–999 [] 1000–2499 []
Over 2500.
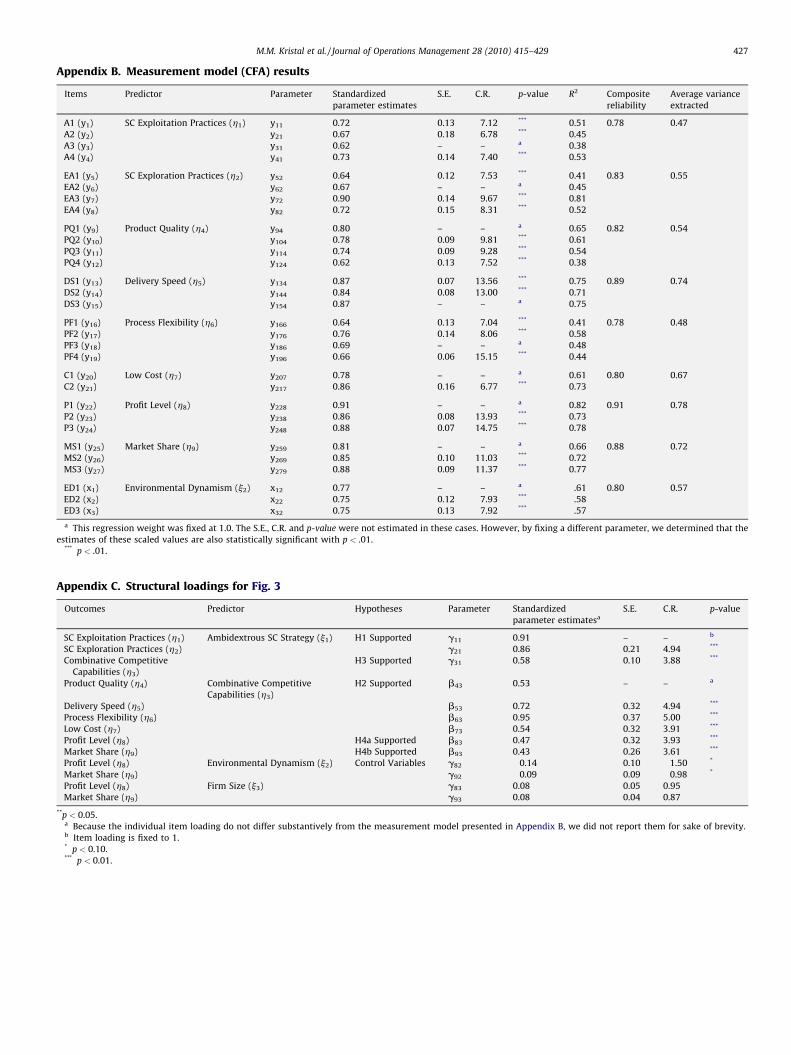
Appendix B. Measurement model (CFA) results
Items Predictor Parameter Standardized
parameter estimates
S.E. C.R. p-value R2 Composite
reliability
Average variance
extracted
A1 (y1) SC Exploitation Practices (h1) y11 0.72 0.13 7.12 *** 0.51 0.78 0.47
A2 (y2) y21 0.67 0.18 6.78 *** 0.45
A3 (y3) y31 0.62 – – a 0.38
A4 (y4) y41 0.73 0.14 7.40 *** 0.53
EA1 (y5) SC Exploration Practices (h2) y52 0.64 0.12 7.53 *** 0.41 0.83 0.55
EA2 (y6) y62 0.67 – – a 0.45
EA3 (y7) y72 0.90 0.14 9.67 *** 0.81
EA4 (y8) y82 0.72 0.15 8.31 *** 0.52
PQ1 (y9) Product Quality (h4) y94 0.80 – – a 0.65 0.82 0.54
PQ2 (y10) y104 0.78 0.09 9.81 *** 0.61
PQ3 (y11) y114 0.74 0.09 9.28 *** 0.54
PQ4 (y12) y124 0.62 0.13 7.52 *** 0.38
DS1 (y13) Delivery Speed (h5) y134 0.87 0.07 13.56 *** 0.75 0.89 0.74
DS2 (y14) y144 0.84 0.08 13.00 *** 0.71
DS3 (y15) y154 0.87 – – a 0.75
PF1 (y16) Process Flexibility (h6) y166 0.64 0.13 7.04 *** 0.41 0.78 0.48
PF2 (y17) y176 0.76 0.14 8.06 *** 0.58
PF3 (y18) y186 0.69 – – a 0.48
PF4 (y19) y196 0.66 0.06 15.15 *** 0.44
C1 (y20) Low Cost (h7) y207 0.78 – – a 0.61 0.80 0.67
C2 (y21) y217 0.86 0.16 6.77 *** 0.73
P1 (y22) Profit Level (h8) y228 0.91 – – a 0.82 0.91 0.78
P2 (y23) y238 0.86 0.08 13.93 *** 0.73
P3 (y24) y248 0.88 0.07 14.75 *** 0.78
MS1 (y25) Market Share (h9) y259 0.81 – – a 0.66 0.88 0.72
MS2 (y26) y269 0.85 0.10 11.03 *** 0.72
MS3 (y27) y279 0.88 0.09 11.37 *** 0.77
ED1 (x1) Environmental Dynamism (j2) x12 0.77 – – a .61 0.80 0.57
ED2 (x2) x22 0.75 0.12 7.93 *** .58
ED3 (x3) x32 0.75 0.13 7.92 *** .57
a This regression weight was fixed at 1.0. The S.E., C.R. and p-value were not estimated in these cases. However, by fixing a different parameter, we determined that the
estimates of these scaled values are also statistically significant with p < .01.*** p < .01.
Appendix C. Structural loadings for Fig. 3
Outcomes Predictor Hypotheses Parameter Standardized
parameter estimatesa
S.E. C.R. p-value
SC Exploitation Practices (h1) Ambidextrous SC Strategy (j1) H1 Supported g11 0.91 – – b
SC Exploration Practices (h2) g21 0.86 0.21 4.94 ***
Combinative Competitive
Capabilities (h3)
H3 Supported g31 0.58 0.10 3.88 ***
Product Quality (h4) Combinative Competitive
Capabilities (h3)
H2 Supported b43 0.53 – – a
Delivery Speed (h5) b53 0.72 0.32 4.94 ***
Process Flexibility (h6) b63 0.95 0.37 5.00 ***
Low Cost (h7) b73 0.54 0.32 3.91 ***
Profit Level (h8) H4a Supported b83 0.47 0.32 3.93 ***
Market Share (h9) H4b Supported b93 0.43 0.26 3.61 ***
Profit Level (h8) Environmental Dynamism (j2) Control Variables g82 �0.14 0.10 �1.50 *
Market Share (h9) g92 �0.09 0.09 �0.98 *
Profit Level (h8) Firm Size (j3) g83 0.08 0.05 0.95
Market Share (h9) g93 0.08 0.04 0.87
**p < 0.05.a Because the individual item loading do not differ substantively from the measurement model presented in Appendix B, we did not report them for sake of brevity.b Item loading is fixed to 1.* p < 0.10.*** p < 0.01.
M.M. Kristal et al. / Journal of Operations Management 28 (2010) 415–429 427

M.M. Kristal et al. / Journal of Operations Management 28 (2010) 415–429428
References
Adler, P.S., Goldoftas, B., Levine, D.I., 1999. Flexibility versus efficiency? A case studyof model changeovers in the Toyota production system. Organization Science10 (1), 43–67.
Anacona, D.G., Goodman, P.S., Lawrence, B.S., Tushman, M.L., 2001. Time: A newresearch lens. Academy of Management Review 26, 645–663.
Anderson, J.C., Gerbing, D.W., 1988. Structural equation modeling in practice: areview and recommended two-step approach. Psychological Bulletin 103 (3),411–423.
Anderson, P., Tushman, M.L., 2001. Organizational environments and industry exit:the effects of uncertainty, munificence and complexity. Industrial and Corpo-rate Change 10 (3), 675–711.
Arbuckle, J.L., 2005. AMOS Users’ Guide (Version 6.0) SmallWaters Corporation,Chicago, IL.
Ashby, W.R., 1958. Requisite variety and its implications for the control of complexsystems. Cybernetica 1, 83–99.
Bagozzi, R.P., Youjae, Y., Phillips, L.W., 1991. Assessing construct validity in organi-zational research. Administrative Science Quarterly 36, 421–458.
Baum, J.A.C., Li, S.X., Usher, J.M., 2000. Making the next move: How experiential andvicarious learning shape the locations of chains’ acquisitions. AdministrativeScience Quarterly 45, 766–801.
Bendoly, E., Rosenzweig, E.D., Stratman, J.K., 2007. Performance metric portfolios: Aframework and empirical analysis. Production and Operations Management 16(2), 257–276.
Benner, M.J., Tushman, M., 2002. Process management and technological innova-tion: a longitudinal study of the photography and paint industries. Adminis-trative Science Quarterly 47, 676–706.
Bollen, K.A., 1987. Total, direct, and indirect effects in structural equation models.Sociological Methodology 17, 37–69.
Bollen, K.A., 1989. Structural Equations with Latent Variables. John Wiley & Sons,New York, NY.
Bollen, K.A., 1996. An alternative two stage least squares (2SLS) estimator for latentvariable equations. Psychometrika 61 (1), 109–121.
Bollen, K.A., Biesanz, J.C., 2002. A note on a two-stage least squares estimator ofhigher-order factor analyses. Sociological Methods & Research 30 (4), 568–579.
Boyer, K.K., Lewis, M.W., 2002. Competitive priorities: investigating the need fortrade-offs in operations strategy. Production and Operations Management 11(1), 9–20.
Braunscheidel, M.J., Suresh, N.C., 2009. The organizational antecedents of a firm’ssupply chain agility for risk mitigation and response. Journal of OperationsManagement 27 (2), 119–140.
Burgelman, R.A., 2002. Strategy as vector and the inertia of co-evolutionary lock-in.Administrative Science Quarterly 47, 325–357.
Carr, A.S., Pearson, J.N., 1999. Strategically managed buyer-supplier relationshipsand performance outcomes. Journal of Operations Management 17 (5), 497–519.
Chen, M., Hambrick, D.C., 1995. Speed stealth, and selective attack: how small firmsdiffer from large firms in competitive behavior. Academy of ManagementJournal 38 (2), 453–582.
Cohen, J., 1960. A coefficient of agreement for nominal scales. Educational andPsychological Measurement 20 (1), 37–46.
Corbett, C., van Wassenhove, L., 1993. Trade-offs: what trade-offs? Competence andcompetitiveness in manufacturing strategy. California Management Review 35(4), 107–122.
Cua, K.O., McKone, K.E., Schroeder, R.G., 2001. Relationships between implementa-tion of TQM, JIT, and TPM and manufacturing performance. Journal of Opera-tions Management 19 (6), 675–694.
Daft, R.L., 1995. Organization Theory and Design, fifth ed. West Publishing Com-pany, Minneapolis/St. Paul, MN.
Dean, T.J., Robert, L.B., Banford, C.E., 1998. Differences in large and small firmresponses to environmental context: strategic implications from a comparativeanalysis of business formations. Strategic Management Journal 19, 709–728.
Dess, G.G., Robinson, R.B., 1984. Measuring organizational performance in theabsence of objective measures: the case of the privately-held firm and con-glomerate business unit. Strategic Management Journal 5 (3), 265–273.
Dillman, D.D., 2000. Mail and Internet Surveys: The Tailored Design Method. J.Wiley, New York.
D’Souza, D.E., Williams, F.P., 2000. Toward a taxonomy of manufacturing flexibilitydimensions. Journal of Operations Management 18, 577–593.
Duncan, R., 1976. The ambidextrous organization: Designing dual structures forinnovation. In: Killman, R.H., Pondy, L.R., Sleven, D. (Eds.), The Management ofOrganization I. North Holland, New York, NY, pp. 167–188.
Dyer, J.H., Cho, D.S., Chu, W., 1998. Strategic supplier segmentation: the next ‘‘bigpractice’’ in supply chain management. California Management Review 40 (2),57–77.
Eisenhardt, K.M., Martin, J.A., 2000. Dynamic capabilities: what are they? StrategicManagement Journal 21, 1105–1121.
Eisenhardt, K.M., Santos, F.M., 2002. Knowledge-based view: A new technology orstrategy? In: Pettigrew, A., Thomas, H., Whittington, R. (Eds.), Handbook ofStrategy and Management. Sage Publications, London, UK, pp. 139–164.
Ferdows, K., DeMeyer, A., 1990. Lasting improvements in manufacturing perfor-mance: in search of a new theory. Journal of Operations Management 9 (2),168–184.
Floyd, S., Lane, P., 2000. Strategizing throughout the organization: Managing roleconflict in strategic renewal. Academy of Management Review 25, 154–177.
Flynn, B.B., Flynn, E.J., 2004. An exploratory study of the nature of cumulativecapabilities. Journal of Operations Management 22 (5), 439–457.
Flynn, B.B., Schroeder, R.G., Flynn, E.J., 1999. World class manufacturing: an inves-tigation of Hayes and Wheelwright’s foundation. Journal of Operations Man-agement 17 (3), 249–269.
Fornell, C., Larcker, D.F., 1981. Evaluating structural equation models with unob-servable variables and measurement error. Journal of Marketing Research 18(1), 39–50.
Froehle, C.M., Roth, A.V., 2004. New measurement scales for evaluating perceptionsof the technology-mediated customer service experience. Journal of OperationsManagement 22, 1–21.
Frohlich, M.T., 2002. Techniques for improving response rates in OM surveyresearch. Journal of Operations Management 20 (6), 729–745.
Garud, R., 1997. On the distinction between know-how, know-why, and know-what. Advances in Strategic Management 14, 81–101.
Gibson, C.B., Birkinshaw, J., 2004. The antecedents, consequences, and mediatingrole of organizational ambidexterity. Academy of Management Journal 47 (2),209–226.
Giffi, C., Roth, A.V., Seal, G.M., 1990. Competing in World-Class Manufacturing:America’s 21st Century Challenge. Business One Irwin, Homewood, IL.
Goodman, L.A., 1960. On the exact variance of products. Journal of the AmericanStatistical Association 55, 708–713.
Grant, R., 1996. Toward a knowledge based theory of the firm. Strategic Manage-ment Journal 17 (Special Issue), 109–122.
Gupta, A.K., Smith, K.G., Shalley, C.E., 2006. The interplay between exploration andexploitation. Academy of Management Journal 49 (4), 693–706.
Hair, J.F., Anderson, R.E., Tatham, R.L., Black, W.C., 1998. Multivariate Data Analysis.Prentice Hall, Upper Saddle River, NJ.
Hayes, R., Pisano, G., Upton, D., Wheelwright, S., 2005. Operations, Strategy, andTechnology: Pursuing the Competitive Edge. John Wiley and Sons, Hoboken,NJ.
He, Z.L., Wong, P.K., 2004. Exploration vs. exploitation: an empirical test of theambidexterity hypothesis. Organization Science 15, 481–494.
Holmqvist, M., 2004. Experiential learning process of exploitation and explorationwithin and between organizations: an empirical study of product development.Organization Science 15, 70–81.
Huang, X., Kristal, M.M., Schroeder, R.G., 2007. Linking learning and effectiveprocess implementation to mass customization capabilities. Journal of Opera-tions Management 26 (6), 714–726.
Hult, G.T.M., Ketchen Jr., D.J., Arrfelt, M., 2007. Strategic supply chain management:Improving performance through a culture of competitiveness and knowledgedevelopment. Strategic Management Journal 28, 1035–1052.
Hult, G.T.M., Ketchen Jr., D.J., Nichols Jr., E.L., 2002. An examination of culturalcompetitiveness and order fulfillment cycle time within supply chains. Acade-my of Management Journal 45 (3), 577–586.
Hult, G.T.M., Ketchen Jr., D.J., Slater, S.F., 2004. Information processing, knowledgedevelopment, and strategic supply chain performance. Academy of Manage-ment Journal 47 (2), 241–253.
Hult, G.T.M., Snow, C.C., Kandemir, D., 2003. The role of entrepreneurship inbuilding cultural competitiveness in different organizational types. Journal ofManagement 29 (3), 401–426.
Im, G., Rai, A., 2008. Knowledge sharing ambidexterity in long-term interorganiza-tional relationships. Management Science 54 (7), 1281–1296.
James, L.R., Mulaik, S.A., Brett, J.M., 2006. A tale of two methods. OrganizationalResearch Methods 9 (2), 233–244.
Judd, C.M., Kenny, D.A., 1981. Process analysis: Estimating mediation in treatmentevaluations. Evaluation Review 5, 602–619.
Katila, R., Ahuja, G., 2002. Something old, something new: A longitudinal study ofsearch behavior and new product introduction. Academy of ManagementJournal 45, 1183–1194.
Ketchen Jr., D.J., Hult, G.T.M., 2007. Toward greater integration of insights fromorganization theory and supply chain management. Journal of OperationsManagement 25 (2), 455–458.
Kauppila, O., 2007. Towards a network model of ambidexterity. Helsinki School ofEconomics, Working paper.
Kyriakopoulos, K., Moorman, C., 2004. Tradeoffs in marketing exploitation andexploration strategies: The overlooked role of market orientation. InternationalJournal of Research in Marketing 21, 219–240.
Knott, A.M., 2002. Exploration and exploitation as complements. In: Bontis, N., Choo,C.W. (Eds.), The Strategic Management of Intellectual Capital and OrganizationalKnowledge: A Collection of Readings. Oxford University Press, New York, NY.
Kogut, B., Zander, U., 1992. Knowledge of the firm, combinative capabilities, and thereplication of technology. Organization Science 3 (3), 383–397.
Kristal, M.M., Roth, A.V., Choi, T., 2008. Achieving supply chain adaptivity formanufacturers. York University, working paper.
Lee, H.L., 2004. The triple—A supply chain. Harvard Business Review 82 (10), 102–112.
Leonard-Barton, D., 1992. Core capabilities and core rigidities: A paradox in man-aging new product development. Strategic Management Journal 13 (SpecialIssue), 111–125.
Levinthal, D.A., 1997. Adaptation on rugged landscapes. Management Science 43(7), 934–950.
Levinthal, D.A., March, J.G., 1993. The myopia of learning. Strategic ManagementJournal 14 (8), 95–112.
Levitt, B., March, J.G., 1998. Organizational learning. Annual Review of Sociology 14,319–340.

M.M. Kristal et al. / Journal of Operations Management 28 (2010) 415–429 429
Lewin, A.Y., Long, C.P., Carroll, T.N., 1999. The coevolution of new organizationalforms. Organization Science 10 (5), 535–550.
Lewin, A.Y., Volberda, H.W., 1999. Prolegomena on coevolution: a framework forresearch on strategy and new organizational forms. Organization Science 10 (5),519–534.
Lin, Z., Yang, H., Demirkan, I., 2007. The performance consequences of ambidexteri-ty in strategic alliance formations: Empirical investigation and computationaltheorizing. Management Science 53 (10), 1645–1658.
Little, R.J.A., 1988. A test of missing completely at random for multivariate data withmissing values. Journal of the American Statistical Association 83 (404), 1198–1202.
Lubatkin, M.H., Simsek, Z., Ling, Y., Veiga, J.F., 2006. Ambidexterity and performancein small- to medium size firms: The pivotal role of top management teambehavioral integration. Journal of Management 32 (5), 646–672.
Little, R.J.A., Rubin, D.B., 2002. Statistical Analysis with Missing Data. John Wiley &Sons, Inc, Hoboken, NJ.
March, J.G., 1991. Exploration and exploitation in organizational learning. Organi-zation Science 2 (1), 71–87.
Menor, L.J., Kristal, M.M., Rosenzweig, E.D., 2007. Examining the influence ofoperational intellectual capital on capabilities and performance. Manufacturing& Service Operations Management 9 (4), 559–578.
Menor, L.J., Roth, A.V., 2007. New service development competence in retailbanking: Construct development and measurement validation. Journal ofOperations Management 25 (4), 825–846.
Menor, L.J., Roth, A.V., Mason, C.H., 2001. Agility in retail banking: a numericaltaxonomy of strategic service groups. Manufacturing & Service OperationsManagement 3 (4), 273–292.
Miller, J.G., Roth, A.V., 1994. A taxonomy of manufacturing strategies. ManagementScience 40 (3), 285–304.
Mintzberg, H., 1979. The Structuring of Organizations: A Synthesis of the Research.Prentice-Hall, Englewood Cliffs, NJ.
Moore, G.C., Benbasat, I., 1991. Development of an instrument to measure theperceptions of adopting an information technology innovation. InformationSystems Research 2 (2), 192–222.
Narasimhan, R., Das, A., 2001. The impact of purchasing integration and practices onmanufacturing performance. Journal of Operations Management 19 (5), 593–609.
Noble, M.A., 1995. Manufacturing strategy: testing the cumulative model in amultiple country context. Decision Sciences 26 (5), 693–721.
Nonaka, I.H., 1994. Dynamic theory of organizational knowledge creation. Organi-zational Science 5, 14–37.
O’Leary-Kelly, S.W., Vokurka, R.J., 1998. The empirical assessment of constructvalidity. Journal of Operations Management 16 (4), 387–405.
O’Reilly, C.A., Tushman, M.L., 2004. The ambidextrous organization. Harvard Busi-ness Review 82 (4), 74–81.
Perrault, W.D., Leigh, L.E., 1989. Reliability of nominal data based on qualitativejudgments. Journal of Marketing Research 26 (2), 135–148.
Podsakoff, P.M., MacKenzie, S.B., Lee, J.Y., Podsakoff, N.P., 2003. Common methodbiases in behavioural research: A critical review of the literature and recom-mended strategies. Journal of Applied Psychology 88 (5), 879–903.
Podsakoff, P.M., Organ, D.W., 1986. Self-reports in organizational research: pro-blems and prospects. Journal of Management 12, 531–544.
Prescott, J.E., Kohli, A.K., Venkatraman, N., 1986. The market share–profitabilityrelationship: an empirical assessment of major assertions and contradictions.Strategic Management Journal 7, 377–394.
Raisch, S., Birkinshaw, J., 2008. Organizational ambidexterity: Antecedents, out-comes, and moderators. Journal of Management 34 (3), 375–409.
Rosenzweig, E.D., Easton, G.S. Tradeoffs in manufacturing? A meta-analysis andcritique of the literature. Production and Operations Management, in press.
Rosenzweig, E.D., Roth, A.V., 2004. Towards a theory of competitive progression:evidence from high-tech manufacturing. Production and Operations Manage-ment 13 (4), 354–368.
Rosenzweig, E.D., Roth, A.V., 2007. B2B seller competence: construct developmentand measurement using a supply chain strategy lens. Journal of OperationsManagement 25 (6), 1311–1331.
Rosenzweig, E.D., Roth, A.V., Dean Jr., J.W., 2003. The influence of an integrationstrategy on competitive capabilities and business performance: an exploratorystudy of consumer products manufacturers. Journal of Operations Management21 (4), 437–456.
Roth, A.V., 1996a. Neo-operations strategy: linking capabilities-based competitionto technology. In: Gaynor, G.H. (Ed.), Handbook of Technology Management.McGraw-Hill, New York, NY, pp. 38.1–38.44.
Roth, A.V., 1996b. Achieving strategic agility through economies of knowledge.Strategy & Leadership 24 (2), 30–36.
Roth, A.V., De Meyer, A., Amano, A., 1989. International manufacturing strategies: acomparative analysis. In: Ferdows, K. (Ed.), Managing InternationalManufacturing. Elsevier Science Publishers, Amsterdam, the Netherlands.
Roth, A.V., Jackson III, W.E., 1995. Strategic determinants of service quality andperformance: evidence from the banking industry. Management Science 41(11), 1720–1733.
Roth, A.V., Miller, J.G., 1988. Manufacturing Futures Survey Factbook. School ofManagement, Boston University, Manufacturing Roundtable Monograph Series,Boston, MA.
Roth, A.V., Miller, J.G., 1992. Success factors in manufacturing. Business Horizons 35(4), 73–81.
Roth, A.V., Schroeder, R.G., Huang, X., Kristal, M.M., 2008. Handbook of Multi-itemScales for Research in Operations Management. Sage Publications, ThousandOaks, CA.
Sanders, N., 2008. Pattern of information technology use: The impact on buyer-supplier coordination and performance. Journal of Operations Management 26(3), 349–367.
Schmenner, R.W., Swink, M.L., 1998. On theory in operations management. Journalof Operations Management 17 (1), 97–113.
Schulze, P., Heinemann, F., Abedin, A., 2008. Balancing exploitation and exploration.Academy of Management Proceedings 1–6.
Senge, P., 1992. Building learning organizations. The Journal for Quality andParticipation 15 (2), 30–38.
Siemsen, E., Roth, A.V., Oliveira, P. Common methods bias in regression models withcurvilinear, quadratic and interactional effects. Organizational Research Meth-ods, in press.
Siggelkow, N., Levinthal, D.A., 2003. Temporarily divide to conquer: Centralized,decentralized, and reintegrated organizational approaches to exploration andadaptation. Organization Science 14, 650–669.
Skinner, W., 1978. Manufacturing in the Corporate Strategy. Wiley, New York, NY.Sobel, M., 1982. Asymptotic confidence intervals for indirect effects in structural
equation models. In: Leinhardt, S. (Ed.), Sociological Methodology. pp. 290–312.
Spender, J.C., 1996. Making knowledge the basis of a dynamic theory of the firm.Strategic Management Journal 17 (Winter Special Issue), 45–62.
Stratman, J.F., Roth, A.V., 2002. Enterprise resource planning (ERP) competenceconstructs: two-stage multi-item scale development and validation. DecisionSciences 33 (4), 601–628.
Swamidass, P.M., Newell, W.T., 1987. Manufacturing strategy, uncertainty andperformance. Management Science 33 (4), 509–524.
Takeishi, A., 2001. Bridging inter- and intra-firm boundaries: management ofsupplier involvement in automotive product development. Strategic Manage-ment Journal 22 (5), 403–433.
Tan, C.L., Vonderembse, M.A., 2006. Mediating effects of computer aided designusage: From concurrent engineering to product development performance.Journal of Operations Management 24, 494–510.
Teece, D.J., Pisano, G., Shuen, A., 1997. Dynamic capabilities and strategic manage-ment. Strategic Management Journal 18 (7), 509–533.
Tushman, M.L., O’Reilly, C.A., 1996. Ambidextrous organizations: Managing evolu-tionary and revolutionary change. California Management Review 38, 8–30.
Venkatraman, N., 1989. The Concept of fit in strategy research: Toward verbal andstatistical correspondence. Academy of Management Review 14 (3), 423–444.
Venkatraman, N., Lee, C. H., Iyer, B., 2007. Strategic ambidexterity and sales growth:A longitudinal test in the software sector. Unpublished manuscript, BostonUniversity, Boston, http://www.softwareecosystems.com/SMJManuscript_revised.pdf (last reached on August 16, 2009).
Venkatraman, N., Prescott, J.E., 1990. The market share–profitability relationship:testing temporal stability across business cycles. Journal of Management 16 (4),783–805.
Vickery, S.K., Droge, C., Markland, R.E., 1997. Dimensions of manufacturing strengthin the furniture industry. Journal of Operations Management 15 (4), 317–330.
Ward, P.T., Duray, R., 2000. Manufacturing strategy in context: environment,competitive strategy and manufacturing strategy. Journal of Operations Man-agement 18 (2), 123–138.
Ward, P.T., McCreery, J.K., Ritzman, L., Sharma, D., 1998. Competitive priorities inoperations management. Decision Sciences 29 (4), 1035–1046.
Weick, K.E., Westley, F., 1996. Organizational learning: affirming an oxymoron. In:Clegg, S.R., Hardy, C., Nord, W.R. (Eds.), Handbook of Organization Studies. SagePublications, London, pp. 440–458.
Williams, L.J., Edwards, J.R., Vanderberg, R.J., 2003. Recent advances in causalmodeling methods for organizational and management research. Journal ofManagement 29 (6), 903–936.
Yusuf, Y.Y., Sarhadi, M., Gunasekaran, A., 1999. Agile manufacturing: the drivers,concepts and attributes. International Journal of Production Economics 62, 33–43.