The effect of ambient scent on affiliation behaviors and social ...
189
UNLV Retrospective Theses & Dissertations 1-1-2003 The effect of ambient scent on affiliation behaviors and social The effect of ambient scent on affiliation behaviors and social interactions interactions Dina Marie Victoria Zemke University of Nevada, Las Vegas Follow this and additional works at: https://digitalscholarship.unlv.edu/rtds Repository Citation Repository Citation Zemke, Dina Marie Victoria, "The effect of ambient scent on affiliation behaviors and social interactions" (2003). UNLV Retrospective Theses & Dissertations. 2540. http://dx.doi.org/10.25669/rgry-us4a This Dissertation is protected by copyright and/or related rights. It has been brought to you by Digital Scholarship@UNLV with permission from the rights-holder(s). You are free to use this Dissertation in any way that is permitted by the copyright and related rights legislation that applies to your use. For other uses you need to obtain permission from the rights-holder(s) directly, unless additional rights are indicated by a Creative Commons license in the record and/or on the work itself. This Dissertation has been accepted for inclusion in UNLV Retrospective Theses & Dissertations by an authorized administrator of Digital Scholarship@UNLV. For more information, please contact [email protected].
-
Upload
khangminh22 -
Category
Documents
-
view
2 -
download
0
Transcript of The effect of ambient scent on affiliation behaviors and social ...

UNLV Retrospective Theses & Dissertations
1-1-2003
The effect of ambient scent on affiliation behaviors and social The effect of ambient scent on affiliation behaviors and social
interactions interactions
Dina Marie Victoria Zemke University of Nevada, Las Vegas
Follow this and additional works at: https://digitalscholarship.unlv.edu/rtds
Repository Citation Repository Citation Zemke, Dina Marie Victoria, "The effect of ambient scent on affiliation behaviors and social interactions" (2003). UNLV Retrospective Theses & Dissertations. 2540. http://dx.doi.org/10.25669/rgry-us4a
This Dissertation is protected by copyright and/or related rights. It has been brought to you by Digital Scholarship@UNLV with permission from the rights-holder(s). You are free to use this Dissertation in any way that is permitted by the copyright and related rights legislation that applies to your use. For other uses you need to obtain permission from the rights-holder(s) directly, unless additional rights are indicated by a Creative Commons license in the record and/or on the work itself. This Dissertation has been accepted for inclusion in UNLV Retrospective Theses & Dissertations by an authorized administrator of Digital Scholarship@UNLV. For more information, please contact [email protected].

THE EFFECT OF AMBIENT SCENT ON AFFILIATION
BEHAVIORS AND SOCIAL INTERACTIONS
by
Dina Marie V. Zemke
Bachelor of Science Cornell University
1985
Master of Business Administration University of Minnesota
1990
A dissertation submitted in partial fulfillment of the requirements for the
Doctor of Philosophy in Hotel Administration William F. Harrah College of Hotel Administration
Graduate College University of Nevada, Las Vegas
August 2003
Reproduced with permission of the copyright owner. Further reproduction prohibited without permission.

UMI Number: 3102468
Copyright 2003 by
Zemke, Dina Marie Victoria
All rights reserved.
UMIUMI Microform 3102468
Copyright 2003 by ProQuest Information and Learning Company.
All rights reserved. This microform edition is protected against
unauthorized copying under Title 17, United States Code.
ProQuest Information and Learning Company 300 North Zeeb Road
P.O. Box 1346 Ann Arbor, Ml 48106-1346
Reproduced with permission of the copyright owner. Further reproduction prohibited without permission.

Copyright hy Dina Marie V. Zemke 2003 AU Rights Reserved
Reproduced with permission of the copyright owner. Further reproduction prohibited without permission.

I INTV Dissertation ApprovalThe Graduate College University of Nevada, Las Vegas
June 26 _,2Q03
The Dissertation prepared by
Dina Marie V. Zemke
Entitled
The E f fe c t o f Ambient Scent on A f f i l i a t i o n B eh aviors and S o c ia l
Interactions
is approved in partial fulfillment of the requirements for the degree of
Doctor of Philosophy in Hotel Administration
Examination Com m ittee M em ber
Examination Com m ittee Membe\
Graduate College E licuny R epresentati
Examination Committee Chair
Dean o f the Graduate College
P R /1 0 1 7 -5 2 /1 -0 0 11
Reproduced with permission of the copyright owner. Further reproduction prohibited without permission.

ABSTRACT
The Effect of Ambient Scent on Affiliation Behaviors and Social Interactions
by
Dina Marie V. Zemke
Dr. Stowe Shoemaker, Examination Committee Chair Associate Professor
William F. Harrah College of Hotel Administration University of Nevada, Las Vegas
The intent of the study was to explore if the focus group and the meetings industries
can provide meeting environments that would be more conducive to communication and
more productive. The concepts tested in this study are based in environmental
psychology, or the study of how the physical environment affects individual and group
behavior within the environment. Past studies have examined various ambient conditions
and other aspects of the physical environment and their effects on retail environments.
However, the characteristics that set services businesses apart from product marketing
and retail businesses require new techniques to evaluate the effect of the physical
environment on the people within the environment. This study proposed a new
methodology for examining the effect of one of the ambient conditions, scent, in a
services environment.
Ill
Reproduced with permission of the copyright owner. Further reproduction prohibited without permission.

The study was quasi-experimental, using a 2 x 2 factorial design. The two
independent variables under study were the presence or absence of a pleasant ambient
scent and the type of participant group, defined as either Tryer-Acceptors or Tryer-
Rejecters of a particular slot machine game, as defined by the sponsor of the study, a
gaming machine manufacturer. The experiment involved focus group participants
spending fifteen minutes in the experimental environment. The time spent in the
experimental environment was videotaped for content analysis of behaviors exhibited
while in the treated/untreated room.
Scent had a statistically significant effect on the social interaction behaviors
exhibited by the participants. Specifically, the addition of the scent to the waiting room
resulted in more social interaction behaviors than were exhibited in the unscented room.
In contrast, the participant group type had a statistically significant effect on the
Social Interaction and Affiliative Interactions behaviors exhibited and on the focus group
output. The study offers evidence that a pleasant ambient scent can have a positive
effect on the effectiveness of a meeting environment.
IV
Reproduced with permission of the copyright owner. Further reproduction prohibited without permission.
TABLE OF CONTENTS
ABSTRACT............................................................................................................................. iii
LIST OF TABLES..................................................................................................................vii
LIST OF FIGURES.............................................................................................................. viii
ACKNOWLEDGEMENTS i x
CHAPTER 1 INTRODUCTION.......................................................................................1Purpose of the Study.....................................................................................................1Research Questions.......................................................................................................1Significance of the Study.............................................................................................3
CHAPTER 2 REVIEW OF RELATED LITERATURE.................................................7Environmental Psychology..........................................................................................7Atmospherics and Marketing.................................................................................... 40Atmospherics in Services Marketing........................................................................52Theoretical Framework for the Study.......................................................................58
CHAPTER 3 METHODOLOGY .................................................................................. 64Overview of Research Questions.............................................................................. 65Research Design......................................................................................................... 68Collection of Data...................................................................................................... 72Sample Information................................................................................................... 81Validity....................................................................................................................... 82Treatment of D ata...................................................................................................... 83
CHAPTER 4 DATA ANALYSIS AND RESULTS.....................................................93Introduction.................................................................................................................93Sample Results...........................................................................................................93Inteijudge Agreement................................................................................................96Quantitative Screening Issues..................................................................................100Analysis of Variance (ANOVA)............................................................................. 106Proposition Testing.................................................................................................. 112
CHAPTER 5 SUMMARY, CONCLUSIONS, AND RECOMMENDATIONS 115Introduction............................................................................................................... 115Summary of the Study............................................................................................. 115
Reproduced with permission of the copyright owner. Further reproduction prohibited without permission.

CHAPTER 5 SUMMARY, CONCLUSIONS, AND RECOMMENDATIONS (cont.)Discussion of Results..............................................................................................118General Implications of the Study.......................................................................... 123Limitations.................................................................................................................... 133Recommendations for Future Research..................................................................135
APPENDICESAppendix A: Surveys............................................................................................... 139Appendix B: Informed Consent Package................................................................144Appendix C: Expert Judge Training Manual..........................................................150Appendix D: Raw Data for Inteijudge Agreement.................................................159
REFERENCES..................................................................................................................... 168
VITA...................................................................................................................................... 177
VI
Reproduced with permission of the copyright owner. Further reproduction prohibited without permission.

LIST OF TABLES
Table 1: Pleasure-Arousal-Dominance Scale Item s............................................................ 21
Table 2: Summary of Variables Included in Study...............................................................66
Table 3: Sample Characteristics and Comparison with Local Population..........................94
Table 4: Post-Test Survey of Environment..........................................................................95
Table 5: Inteijudge Reliability for Affiliation Behaviors, Social Interaction Behaviors, and Affiliative Interactions................................................................................. 97
Table 6: Sample Distribution.............................................................................................. 100
Table 7: Cronbach’s Alpha Values for Covariates............................................................104
Table 8: Analysis of Variance for Affiliation Behaviors.................................................. 107
Table 9: Analysis of Variance for Social Interaction Behaviors......................................108
Table 10: Analysis of Variance for Affiliative Interaction Behaviors............................. 109
Table 11: Analysis of Variance for Focus Group Output ...........................................110
Table 12: Analysis of Variance for Focus Group Session Word Count..........................112
Vll
Reproduced with permission of the copyright owner. Further reproduction prohibited without permission.

LIST OF FIGURES
Figure I: Factors Affecting the Physical Environment....................................................... 10
Figure 2; Model Under Study, Examining Affiliation Behaviors..................................... 59
Figure 3: Model Under Study, Examining Social Interactions......................................... 59
Figure 4: Model Under Study, Examining Affiliative Interactions..................................60
Figure 5: Model Under Study, Examining Focus Group Output...................................... 60
V lll
Reproduced with permission of the copyright owner. Further reproduction prohibited without permission.

ACKNOWLEDGEMENTS
I would first like to thank my committee, especially my chair, Stowe Shoemaker, for
their help in making this dissertation happen. Your assistance in finding funding and
helping to develop the study is appreciated more than you know.
I would also like to thank Mikohn Gaming for their support for this project,
particularly Olaf Vancura. My eternal thanks go to Becky Landmark and Ruth Moderhak
for their assistance with the casino intercepts, which is possibly the hardest work there is.
Most of all, I would like to thank my parents, David and Norma Zemke, my sister Jill,
and all the Rosenquists for their tireless support during the entire process. I also thank
my friends for their encouragement and support, particularly Carola Raab and Clark
Kincaid, who did not kill me while sharing office space with me.
IX
Reproduced with permission of the copyright owner. Further reproduction prohibited without permission.

CHAPTER 1
INTRODUCTION
Purpose
This study sought to test a factor of the physical environment that affects the
formation of social interactions. Two main areas were explored in this study;
1. Does the physical environment promote/create social interactions among strangers
under controlled conditions?
2. How do prior social interactions among strangers affect their
behavior/participation in a focus group session?
The study used Bitner’s (1992) “Servicescapes” framework to study the
relationships between the physical environment and social interactions.
Research Questions
Research questions in environmental psychology typically fall into one of two main
categories (Bonnes & Secchiaroli, 1995). The first category consists of questions that are
intended to address concerns about behaviors that people exhibit in a particular
environment. The second category of questions examines the way that individuals
“know” and “evaluate” an environment. The research questions posed in this study fall
into the former category. They were essentially designed to identify whether a specific
Reproduced with permission of the copyright owner. Further reproduction prohibited without permission.

component of the environment, in this case, ambient odor, would impede or facilitate the
behaviors and actions of individuals while in a particular environment.
Two primary research questions were posed in this study. These questions are:
Research Question 1 : Does the physical environment, specifically, the ambient scent,
impact the social interactions among strangers in a focus group waiting room
environment?
Research Question 2: Does the physical environment affect the contributions of
participants during a focus group session?
To answer these questions, four propositions are proposed in this study:
PI : The presence of a pleasant ambient scent in the focus group waiting room will
increase the number of affiliation behaviors exhibited by focus group participants.
P2: The presence of a pleasant ambient scent in the focus group waiting room will
increase the number of social interactions that will be initiated by focus group
participants.
P3: The presence of a pleasant ambient scent in the focus group waiting room will
increase the combined number of affiliation behaviors and social interactions, or
Affiliative Interactions, exhibited by focus group participants.
P4: The presence of a pleasant ambient scent in both the focus group waiting room
and in the focus group room itself will increase the number of contributions that will be
generated by focus group participants, i.e., focus group output, during the actual focus
group session.
Reproduced with permission of the copyright owner. Further reproduction prohibited without permission.

Significance
The results of this study provide value to the field of services marketing as the study
proposes a new methodology for testing an important environmental factor, ambient
scent, in an area not previously tested. First, the area of atmospherics, or the study of the
physical environment’s effect on the individuals within the environment, has been studied
in retail and consumer product marketing, but relatively little research has been
conducted in a services marketing context. The services industry is different from retail
and consumer marketing in that the customer who purchases a product usually has a
tangible item that can be evaluated and used or consumed at some point in the future
following the purchase of the item. The consumer who purchases a service both
purchases and consumes the product simultaneously, in the same environment.
Atmospherics, or the effect of the physical environment on the people within the
environment, becomes crucial to the successful operation of many services industry
because the simultaneous purchase and consumption characteristic, also known as
inseparability, results in the physical environment becoming a key element of the product
itself. The intangible characteristics of the services industry make it difficult for
researchers to develop a methodology to measure the effect of atmospheric variables on
the purchase, delivery, and consumption of services.
Second, the specific environmental variable of ambient scent has also had relatively
little research performed in a services marketing context. Various researchers (Gulas &
Bloch, 1995; Baron, 1990; Bitner, 1992; Spangenberg, Crowley, & Henderson, 1996)
have called for further research on ambient scent in the field of atmospherics research.
Gulas and Bloch (1995) examined past research in the area of ambient scent and
Reproduced with permission of the copyright owner. Further reproduction prohibited without permission.
proposed a model for studying it. However, their research continues to focus on
consumer product marketing and retail applications and does not mention the services
industry. Again, the special features that characterize the services industry have made it
difficult to identify a methodology for evaluating ambient scent’s effect on people in the
environment.
Third, there have been several calls for future research to test the effect of ambient
scent on social interactions and affiliation behaviors, as proposed by Bitner (1992).
However, very little research has been conducted in this area. Baron (1990) has
experimented with ambient scent and behavior in mock interviews, and has examined if a
pleasant scent can lead to a more positive affective state. He suggests future research to
examine the effect that a pleasant scent may have on increasing positive affect as a means
of overcoming confi-ontational situations.
Social interactions are a necessary factor in business and particularly in the services
delivery industry. The success of a services business often lies in the interactions
between the different people in the environment. There are three types of interactions
that can occur - 1) customer-employee, 2) customer-customer, and 3) employee-
employee. The services company that understands and manages these interactions well
will have a greater chance for success and profit through customer loyalty and repeat
business (Shoemaker & Lewis, 1999; Bowen & Shoemaker, 1998).
Focus group operators will find this information valuable because the quality and
quantity of information generated by focus groups will improve with very little
operational change or investment. This study will also assist virtually all lodging
property managers in developing a competitive advantage for their small meetings
Reproduced with permission of the copyright owner. Further reproduction prohibited without permission.

business. The implementation of the measures tested in this study would be easy to
manage at very little expense. Specifically, hospitality managers will be able to use the
results of this study to:
1) Enhance the use of meeting spaces in a way that will add value for meeting
customers, by providing a mediating factor that would increase the likelihood of meeting
participants connecting and developing social interactions and networking linkages more
effectively;
2) Generate new business and increase repeat business both at the property level and
company-wide by providing a benefit to meeting customers that will add value to their
meetings.
Delimitations
The proposed study specifically excludes the following conditions, factors, and
issues:
Recorded conversation. The recording of the participants included videotape only.
Sound was not recorded, due to technological and budgetary constraints.
Prior acquaintances. The focus group participants in the study were strangers to each
other, so prior experience or familiarity with others in the environment might have a
significant impact. This was outside the scope of this study.
Multiple environmental variables. The only environmental variable under study was
ambient scent. Other ambient variables, such as temperature, lighting, and seating
arrangements, were controlled in the quasi-experimental design, but manipulating these
Reproduced with permission of the copyright owner. Further reproduction prohibited without permission.

other variables might produce different results. They were outside the scope of this
study.
Seasonal conditions. The data were collected during a relatively short period of time.
Any seasonal factors that might have affected participation or participant characteristics
were not measured in this study.
Broad application. The use of focus group participants reduced the generalizability of
the results for several reasons. First, the sample for this study included demographic
characteristics that might not represent the total population. Second, the people who
agreed to participate in a focus group may have had a higher tendency to affiliate with
others, which might have influenced their willingness to interact and contribute during
the focus group. Finally, since the participants were given an incentive for participating
in the group, this reward may have introduced several types of bias, particularly social
desirability bias.
Reproduced with permission of the copyright owner. Further reproduction prohibited without permission.

CHAPTER 2
LITERATURE REVIEW
The purpose of this study was to examine how the physical environment contributes
to the formation of social interactions among strangers who are focus group participants.
A portion of Bitner’s (1992) Servicescapes framework for understanding environment-
user relationships in service organizations was tested. This literature review begins with
a discussion of the field of environmental psychology, which examines the effect of the
physical surroundings on human response. The work of Mehrabian and Russell, who
proposed the Pleasure-Arousal-Dominance dimensions of emotional response to
environmental stimuli, is then explored. Bitner’s Servicescapes model is then discussed,
followed by an overview of the application of atmospherics to the area of consumer
product marketing. A discussion of atmospherics research in the area of services
marketing, under which the hospitality industry is categorized, is presented, and the
chapter then concludes with an overview of the study.
Environmental Psychology
Bell, Fisher, and Loomis (1978) offer the following abbreviated definition of
environmental psychology: “the study of the interrelations between behavior and the built
or natural environment (p. 6).” The definition is abbreviated because of the
Reproduced with permission of the copyright owner. Further reproduction prohibited without permission.

8
interdisciplinary nature o f the field, with its elements o f various types o f psychology,
ecology, environmental and urban sociology, architecture and design, behavioral
geography, and natural resources management (Bonnes & Secchiaroli, 1995). It is highly
complex, as it includes not only the physical environment, both natural and built, but the
movement and actions of individuals within the environment as well. As Ittelson (1976a)
states, “the human environment is also transient and constantly undergoing fundamental
change. The subject matter which we study today is not the same as that which we
studied yesterday (p. 57).”
Environmental psychology emerged as a field of study as an offshoot of the European
Gestalt School of perceptual psychology in the 1940’s (Bonnes & Secchiaroli, 1995). It
branched out into the area of behavioral psychology when the so-called American “New
Look” school of psychology countered the strictly perceptual, phenomenological view of
the Gestalt school.
The most recent incarnation of environmental psychology is the “transactional”
school, which acknowledges the perception of the spatio-physical aspects of an
environment, the behaviors within the environment, and the individual’s motivations for
being in the environment (Bonnes & Secchiaroli, 1995). The complexity of individuals’
environmental behavior is well stated by Ittelson (1976a) when he writes, “While it may
be true that environments produce behaviors, it is certainly true that behaviors produce
environments (p. 53).” The transactional view attempts to examine the constant
interchange among the numerous variables in any given setting.
An example of these concepts can easily be found during a visit to a restaurant. If a
customer enters a typical casual-service restaurant, the first action is to perceive the
Reproduced with permission of the copyright owner. Further reproduction prohibited without permission.

physical environment, e.g., how it is decorated; the type and volume of music playing;
the odors emanating from the bar, kitchen, or dining room; the level and color rendition
of the lighting; and noise from the patrons inside the restaurant. The customer’s next
action is often a rapid cognitive assessment of this environmental data that leads to some
type of initial reaction to the environment. If the music is too loud or the lighting level is
too low, the customer might become irritated and exhibit behaviors that indicate
irritation.
The customer may then encounter a greeter (host or hostess). The greeter will
provide visual and aural information that must be processed and will also exhibit
behaviors that will be processed by the customer. If the greeter dresses in an appropriate
way and behaves as the customer expects, the customer will react and behave differently
than if the greeter had dressed or acted in an inappropriate or unexpected way.
Upon entering the dining area, the customer will perceive and process information
provided by other customers (or a lack of other customers) in the restaurant. If other
patrons are acting as the customer in question expected, the reactions and ensuing
behaviors may be very different than if the other patrons were acting in an unexpected or
unpleasant way. For example, if the other diners in the dining room were speaking very
loudly, the customer observing this might become dissatisfied and exhibit behaviors
indicating dissatisfaction such as frowning, complaining to the server, or leaving the
restaurant.
The customer’s motivations for choosing the restaurant may also influence his or her
perceptions of the physical space, the restaurant employees, and the other customers in
the restaurant. If the motivation is to grab a quick meal between business appointments
Reproduced with permission of the copyright owner. Further reproduction prohibited without permission.

10
and to review paperwork, dim lighting and noisy fellow diners might be irritating and
result in dissatisfaction behaviors. Environmental conditions and fellow diners might
provide a good environment for the person who is visiting the restaurant to celebrate a
family birthday and might result in the customer exhibiting behaviors that indicate
satisfaction, such as smiling, social interactions, laughing, and stating an intent to return
to the restaurant in the future.
On a final note, the customer in question in each of these examples will have an effect
on the environment, as other restaurant customers and restaurant employees will react to
or interact with this customer. Their behaviors will be influenced by their perceptions,
processing of the perceptions, and reactions to the customer. The diagram shown below
offers a brief representation of the overall concept of environmental psychology and how
the various components of the environment - the individual, other people, and the space
itself - influence each other.
INDIVIDUALPerceptions Cognitive processing Behaviors Motivations
OTHERS IN ENVIRONMENT
Perceptions Cognitive processing Behaviors Motivations
PHYSICAL ENVIRONMENT
Dimensions Objects in the space Ambientm n H i t m n c
Figure 1. Factors influencing the physical environment and the individual
Reproduced with permission of the copyright owner. Further reproduction prohibited without permission.

11
A Brief History o f Environmental Psychology
Four primary schools of psychology appear in the environmental psychology
literature: perceptual, cognitive, behavioral, and transactional. This is the approximate
order in which the field of environmental psychology evolved over the past 80 years.
Each school will be highlighted in the following section, followed by a brief discussion
on the role of environmental sciences in environmental psychology.
Perceptual Psychology
Perceptual psychology was the approach used for most of the first half of the 20**’
century. Perceptual psychology focuses on awareness of some form of physiological
stimulus. For example, a stimulus might consist of the level of lighting having a
physiological effect on the retina. The eye perceives the stimulus after the light hits the
retina, initiating a reaction of photoreceptors, which sends information to the brain.
Perceptual psychology, in combination with observing phenomena in an environment and
also acknowledging context, was the focus of the Gestalt School. The apparent
shortcomings of the perceptual approach are that the act of perception is limited to a
“single, unitary, and immediate response of a nervous system whose complete workings
could be elucidated in any specific example (Ittelson, 1976b, p. 141).” This rules out any
possibility of variation among individuals, since perceptual psychology focused on the
physiological act of perceiving objects and/or forms, and thus the physiological response
must be consistent among all individuals.
In the latter part of the 20*** century, perceptual psychologists acknowledged that there
is a difference between perception of a stimulus and the information provided by
perception of the stimulus (Ittelson, 1976b). In other words, the physical act of seeing.
Reproduced with permission of the copyright owner. Further reproduction prohibited without permission.

12
feeling, or hearing something is not the same thing as understanding what the sight,
sensation, or sound means. A gradual shift occurred and perceptual psychologists moved
to examine the linkage between perception and cognition, the next step in understanding
the information that an environmental stimulus provides.
Additionally, environmental psychologists acknowledged the difference between
perceiving an object and perceiving a space. An environmental space has four
characteristics that distinguish it from an object: 1) a space surrounds, while an object is
a unitary item, 2) environments are multimodal, i.e., they impact a variety of senses while
an object may only impact one sense, 3) environments are peripheral, meaning that they
are always present for an individual inside the environment (an object can be ignored by
shutting one’s eyes and no longer perceived), and 4) environments always provide more
information than an individual can consciously process (Ittelson, 1976b). A discussion of
cognitive psychology, as it is related to environmental psychology, is presented next.
Cognitive Psychology
If perceptual psychology provided the link between the external world and the
internal person (Bonnes & Secchiaroli, 1995), cognitive psychology focused on the
internal processes that help individuals to understand their environment. The focus of
cognitive psychology, as applied here, is on “knowledge” and “knowing” the
environment. The specific difference between perceptual and cognitive psychology is that
the first focuses on spatial perception, or how an individual sees/feels the environment,
while the second focuses on spatial cognition, or how the individual organizes
information perceived into coherent representations that facilitate location and movement
within the environment. The information is organized to provide a general frame of
Reproduced with permission of the copyright owner. Further reproduction prohibited without permission.

13
reference for relating to the environment (Hart & Moore, 1976). Spatial cognition is
developed over time and helps to provide a useful framework for organizing information
about that specific environment as well as for reference in future, similar environments.
Behavioral Psychology
Kurt Lewin was a pioneer in the environmental aspect of behavioral psychology. He
recognized the bridges between psychology and ecology. The common usage of ecology
refers to the natural, outdoor environment. However, ecology is considered to be the
same thing as the environment in this study (Barker, 1976). A famous equation proposed
by Lewin is B = f (P x E), where behavior (B) is a function of the interaction between the
environment (E) and the person in the environment (?) (Bonnes & Secchiaroli, 1995).
In 1947, Roger Barker, a student of Kurt Lewin, conducted groundbreaking research
in ecological psychology when he established the Midwest Psychological Field Station in
Oskaloosa, Kansas (Boimes & Secchiaroli, 1995). The intent was to develop new
methodologies for the study of ecological (or environmental) psychology in a “real
world” setting. The new methodologies were developed because Barker was unhappy
with the predominantly laboratory-based methodologies that existed at the time and the
attending problems with external validity from which laboratory research suffers. His
study introduced environmental psychology to the use of field observation and other
forms of fieldwork. Techniques such as observation and behavioral mapping, a method
of tracking observed behavior, are used in this study.
The methodologies introduced by Barker include observation techniques, identifying
and regulating behavior settings, and developing taxonomies from observed data (Barker,
Reproduced with permission of the copyright owner. Further reproduction prohibited without permission.

14
1976). Behavioral data can be obtained in both a natural setting as well as in a laboratory
setting (Altman, 1976).
One of the major theories resulting from behavioral psychology research is the
Stimulus-Response theory (Berry, 1976). The full model of the theory is the stimulus-
organism-response model, also known as “SOR”. The SOR theory suggests that a
stimulus that is introduced to an organism will be perceived by the organism (individual).
The individual will provide some sort of response and then exhibit a behavior. Different
stimuli elicit different types of responses. Responses to stimuli may be physical or
emotional responses. Mehrabian (1980) proposed three basic emotional responses to
stimuli: pleasure, arousal, and dominance. Mehrabian’s work and the concepts of
pleasure, arousal, and dominance will be discussed in greater detail in the next section of
this paper.
Just as the perceptual psychology approach began to integrate the cognitive approach
in recognition of the need to examine how humans organize information about an
environment, the use of cognitive methods gave way in favor of using behavioral
methods to obtain richer data for analysis of how humans function within a space
(Altman, 1976).
Transactional Psychology
The most recent shift in environmental psychology saw the behavioral approach
move into a transactional mode. Transactional psychology, as it is used in environmental
psychology, is a holistic approach to explain the continuous loop in which the individual
responds to the environment and, through the individual’s behavior within the
environment, the environment in turn responds to the individual (Ittelson, 1976a).
Reproduced with permission of the copyright owner. Further reproduction prohibited without permission.

15
Ittelson (1976b) suggests a transaction consists of five levels of analysis to form a
response to an environmental stimulus. The levels are affective, orientation,
categorization, systematization, and manipulation. The affective level is the direct
emotional impact of the stimulus. Orientation takes place when an individual performs
initial environmental cognitive mapping to identify locations of objects within the space,
escape routes, potential threats, and opportunities for further exploration. Categorization
involves organizing the information gathered so far and developing taxonomies to
facilitate quick and efficient information processing. The systematization level involves
deeper analysis of the information gathered to gain a sense of harmony and constancy to
set a pattern of solidity against which to gauge change within the environment. The final
level of analysis, manipulation, involves the individual changing the environment through
behavior, which may include action but may also include inaction as well. The very
presence of an individual in an environment changes the environment. These five steps
show the procession of perception of environmental stimuli through performance of
behaviors within the environment.
The restaurant customer in the example provided earlier may have experienced the
five levels of analysis in the following manner. First, the customer entered the restaurant
and had an immediate “gut” reaction to the interior space (affective level). Next, the
customer scanned the restaurant to obtain information to place herself in the space. She
used this information to understand where important objects, such as tables, doors, and
other people are placed (orientation). The customer next organized this information for
easy mental reference (categorization). She then mentally processed the information to
Reproduced with permission of the copyright owner. Further reproduction prohibited without permission.

16
see if it measured up to expectations, based on previous experience at that particular
restaurant or similar restaurants (systematization).
Finally, the customer moved further into the restaurant and interacted with the
host/hostess. The presence of the customer had a physical effect on the environment by
adding sound, humidity, heat, visual stimulus, and taking up space. She also affected the
other people in the restaurant through her actions and interactions with the restaurant staff
and possibly with the other restaurant patrons (manipulation).
Stokols (1978) proposed that the transactional approach focuses on the continual
“exchange and reciprocity which characterizes the relationship of the individual with
his/her environment” as well as the active and intentional role of the individual within the
environment (Bonnes & Secchiaroli, 1995, p. 65). The transactional approach
acknowledges the lack of stability in an environment, caused by the constant change that
occurs as people and objects move in and out of the environment over time.
Transactional perspectives are also often linked with the concept of contextual
perspectives since examining how individuals act within an environment should consider
the reason, or context, for which the individual is in the environment (Bonnes &
Secchiaroli, 1995). This aspect plays an important role in this study, as the participants
inhabited the subject environment, a focus group waiting room, under a relatively unusual
(i.e., not an everyday) context.
Environments
The physical environment is defined as the material surroundings of a place. For
example, the physical environment may be the lobby of a hotel or the swimming pool/spa
Reproduced with permission of the copyright owner. Further reproduction prohibited without permission.

17
area of a property. For this study’s purposes, it is considered to be a waiting area and a
meeting room used to conduct a focus group in a building on the University of Nevada,
Las Vegas campus.
Environmental Structure
Each environment is part of an environmental structure, proposed by Bronfenbrenner
in 1977 (Bonnes & Secchiaroli, 1995). The structure consists of the microsystem, the
mesosystem, the exosystem, and the macrosystem. The microsystem is the relationship
between an individual and a particular space, with emphasis placed on the individual’s
experience in and with the space. The mesosystem may be considered a “system of
microsystems”, which could be the various environments that an individual experiences
and their interrelationships. The exosystem refers to environments that an individual
does not enter but associated others may enter. An example of this might be a spouse’s
workplace, where the individual does not enter the space but may be influenced by his or
her spouse’s actions/experiences in the space. Finally, the macrosystem is a collection of
all the previously mentioned systems. For example, the United States might be the
macrosystem for the students at the University of Nevada, Las Vegas. Every
environment is a component of another environment, in a nesting arrangement (Barker,
1976). The system to be examined in this study, a focus group waiting room, is a
microsystem.
Environments are broken into three primary dimensions: spatial, temporal, and
environmental perception (Bonnes & Secchiaroli, 1995). The first two dimensions are
physical-biological dimensions and are directly measurable. The spatial dimension may
be measured in terms of the physical dimensions of the space, the objects within the
Reproduced with permission of the copyright owner. Further reproduction prohibited without permission.
18
space (each of which can be measured in a variety of ways), and the space’s relationship
to other spaces. The second dimension, the temporal dimension, relates to the changes in
a specific environment that occur at a specific point in time or over a period of elapsed
time (Barker, 1976).
The third dimension, environmental perception, is the human component (Bonnes &
Secchiaroli, 1995). Environmental perception is not directly measurable (outside pure
perceptual/cognitive research techniques used on targeted objects under laboratory
conditions) since each perception by an individual is processed and interpreted as
environmental knowledge. Two individuals standing side by side in an environment still
have slightly different conditions under which each perceives the environment. For
example, the individuals will be of different heights, have different viewing angles of the
space, and may perhaps have visual or hearing impairments that cause them to perceive
the space differently. Each individual may sense an odor in the environment, eliciting
different reactions. Ambient noise may be consciously audible or inaudible and may
cause physiological responses. Both individuals will also have different past histories in
similar or different types of places, which would also affect their perceptions of the
space. Each individual would develop different types of environmental knowledge based
on individual experience in the environment as well as accumulated past experience. As
stated by Proshansky, Ittelson, and Rivlin (1974), “Each individual interprets and gives
meaning to his environment, and to this extent the real differences among individuals and
groups lie not in how they behave but in how they perceive” (p. 171).
The environment performs a supporting role for behavior (Barker, 1976). The role
may be permissive, supportive, or resistive. Permissive means that the environment is
Reproduced with permission of the copyright owner. Further reproduction prohibited without permission.

19
not an impediment to a behavior; the behavior may occur freely. Supportive means that
the environment will facilitate or enhance a particular behavior. Resistive means that the
environment provides an impediment to a behavior or will create an unfriendly
environment for the behavior to occur. This study is supportive, as it examines the
hypothesized supporting role that a pleasant ambient scent plays in facilitating social
interactions and encouraging affiliative behaviors.
The specific behaviors examined in this study are affiliation behaviors, social
interactions, and the production of suggestions among focus group participants. The
study involves manipulation of an environmental variable, ambient odor, and
examination of the responses/behaviors of the focus group participants. The next section
of this paper will focus on the work in environmental psychology conducted by Albert
Mehrabian and James A. Russell, who proposed a framework for examining the
environment that is often used in marketing and consumer behavior studies.
Mehrabian and Russell
Extensive research has focused on the effect of the physical environment on human
beings. Early research in environmental psychology focused on workplace, educational,
and penal institutional/correctional settings (Mehrabian & Russell, 1974). Mehrabian
and Russell (1974) proposed a framework for studying the effect of the environment on
behavioral responses. They suggest the three emotional response dimensions of pleasure,
arousal, and dominance, or “PAD” in their framework. Dominance, in this instance,
refers to feelings of dominance, not to actual power in a particular situation. This three-
factor theory of emotional response to environmental stimuli suggests that a combination
Reproduced with permission of the copyright owner. Further reproduction prohibited without permission.

20
of environmental variables and personality characteristics will result in an individual’s
emotional response to the physical stimuli encountered in an environment. This
emotional response will influence the individual’s behavior in the environment, leading
the individual to approach, to avoid, to explore, to affiliate with others, or take other
actions.
Pleasure-Arousal-Dominance
The three dimensions of emotional response to an environmental stimulus are often
measured using a scale developed by Mehrabian and Russell (1974). These dimensions
will be measured as part of this study, as they have been used in numerous environmental
psychology studies since the 1970’s (Mehrabian, 1980; Mehrabian & Russell, 1974;
Bitner, 1992, Morrin & Ratneshwar; 2000, Machleit & Eroglu, 2000; Sherman, Mathur,
& Smith, 1997). Each dimension will be discussed, including the development of the
semantic differential scales that were developed to measure each dimension. Table 1,
lists the semantic differential pairs for each of the factors.
Pleasure
Dahl (1979) proposes as that emotions are a three-part integrated package, consisting
of “1) a distinctive perception', 2) an implicit wish and implied action (motive); and 3) a
typical expression (facial and/or postural) that is species-specific (and in man also
culturally adapted)” (p. 211, emphasis in text). Pleasure is a feeling state that is a
manifestation of a situation that produces a “positive me” feeling, meaning that the
situation has a positive outcome for the individual, leading to a pleasure feeling (Dahl,
1979).
Reproduced with permission of the copyright owner. Further reproduction prohibited without permission.

21
Table 1. Pleasure-Arousal-Dominance Scale Items
Dimension Semantic Differential Pair
Pleasure Happy-unhappyPleased-annoyedSatisfied-unsatisfiedContented-melancholicHopeful-despairingRelaxed-bored
Arousal Stimulated-relaxedExcited-calmFrenzied-sluggishJittery-dullWide awake-sleepyAroused-unaroused
Dominance Controlling-controlledDominant-submissiveInfluential-influencedfrnportant-awedAutonomous-guidedIn control-cared for
Note. From “An Approach to Environmental Psychology,” by A. Mehrabian and J. F. Russell, 1974, The MIT Press, Cambridge, MA, p. 26.
The pleasure dimension in the Mehrabian and Russell (1974) PAD model is measured
using a semantic differential scale with term pairings such as pleasure-displeasure, and
pleased-annoyed (Mehrabian & Russell, 1974; Mehrabian, 1980). The degree of pleasure
can also be observed in the form of smiling and frowning or laughing and crying.
Pleasure is not associated with preference, liking, or approach-avoidance in this model.
The scale proposed by Mehrabian and Russell to measure pleasure-displeasure is a
six-item, 9-point scale, ranging from -4 to +4 (Mehrabian & Russell, 1974; Mehrabian,
1980). The scale was developed over the course of three studies, each designed to
Reproduced with permission of the copyright owner. Further reproduction prohibited without permission.

22
identify the semantic differential terms that would most parsimoniously represent the
dimension. In the final factor analysis, Mehrabian and Russell (1974) found that the six
variables loaded on the Pleasure factor, with loadings ranging from .79 to .92, with an R ̂
of 27%. The Pleasure scale items are shown above in Table 1.
Arousal
Arousal is the state of alertness that an individual feels. It may be defined, in physical
terms, as the general state of central nervous system activity (Ashby, Valentin, & Turken,
2002). The semantic differential scale uses term pairings such as stimulated-relaxed,
excited-calm, and alert-peaceful. People can be aroused or not aroused, and active or
inactive. Arousal can be measured physiologically through measurement of galvanic skin
response, rises in blood pressure, dilation of pupils, and brainwave activity (Mehrabian &
Russell, 1974; Mehrabian, 1980). The Arousal scale items are shown above in Table 1.
Arousal is generated in the brain by electrical impulses to different parts of the brain
(Mehrabian & Russell, 1974). These impulses result in the release of chemicals that
create the aroused state (Ashby, et al., 2002). There are five basis neurotransmitters that
facilitate the brain’s reaction to a stimulus: norepinephrine, acetylcholine, serotonin,
histamine, and dopamine. Different stimuli result in the release of varying amounts of
these chemicals to different parts of the hrain. The area of the brain to which the
neurotransmitters are sent may affect physical responses, such as increased heart rate and
blood pressure, or different types of information processing and response formation, such
as increased awareness, attention, problem-solving ability, and creative ability (Ashby, et
al., 2002). The impulses that trigger the neurotransmitter release may be generated by a
Reproduced with permission of the copyright owner. Further reproduction prohibited without permission.

23
wide array of stimuli, such as an emotional situation, fatigue or hunger, physical exercise
or drugs (Mehrabian & Russell, 1974; Ashby, et al., 2002).
Arousal affects various activities, such as attention intensity, development of
attimdes, performance, working memory, and affiliation. Ashby et al. (2002) have found
that low to moderate doses of the neurotransmitters norepinephrine, acetylcholine, and
dopamine facilitate working memory tasks. However, higher doses actually impair
working memory tasks. Their work confirms that the relationship between these types of
activities and arousal follows an inverted U-shaped function, where the activities are
maximized at moderate levels of arousal (Kahneman, 1973; Kardes, 1999; Mehrabian
and Russell, 1974). This study was intended to test the participants’ affiliation, social
interaction, and focus group production by introducing an ambient scent that was
expected to raise arousal levels to increase these behaviors.
Human beings have an optimal level of physiological arousal that will make them
receptive and alert (Kardes, 1999). Humans can be too aroused, or physiologically
stimulated. Too high a level of arousal can lead to lack of attention, inability to focus on
issues, and extreme mood conditions. The highest levels of excitement can be
characterized by frantic excitement (Mehrabian & Russell, 1974). Low arousal states can
also result in lack of focus and attention. Low arousal may be characterized as a feeling
state closer or further away from being asleep (Mehrabian & Russell, 1974).
High arousal also lends transience to emotions (Kardes, 1999). For example, a high
state of arousal can result in a person being very fiightened one minute and then
extremely amused the next during a scary movie. Zillman discussed this phenomenon in
1978 and proposed the term “excitation transfer” (Kardes, 1999). The scale used to
Reproduced with permission of the copyright owner. Further reproduction prohibited without permission.

24
measure arousal-nonarousal is also a six-item, 9-point, semantic differential rating scale
ranging from —4 to +4 (Mehrabian & Russell, 1974; Mehrabian, 1980). In the final factor
analysis conducted, Mehrabian and Russell (1974) found that variables loaded on the
Arousal factor with loads ranging from .75 to .82, and an R ̂of 23%.
Dominance
The dominance-submissiveness dimension refers to the amount of perceived control
that an individual has in a given situation. The semantic differential scale used to
measure feelings of dominance-submissiveness includes descriptive pairs such as
controlling-controlled, important-awed, influential-influenced. Dominance can also be
observed through an individual’s postural relaxation (Mehrabian, 1980).
The scale used to measure dominance-submissiveness is also a six-item, 9-point,
semantic differential rating scale ranging from -4 to +4 (Mehrabian & Russell, 1974;
Mehrabian, 1980). In the final factor analysis conducted, Mehrabian and Russell (1974)
found that variables loadings on the Arousal factor ranged from .75 to .82, and an R ̂of
23%. The Dominance scale items are shown above in Table 1.
Researchers frequently propose revisions to these scales to adapt them for a particular
application. For example, James A. Russell, one of the original authors of this theory,
worked with Geraldine Pratt (Russell & Pratt, 1980) to modify the Pleasant-Unpleasant
scale for use in measuring the “unpleasant” quality of a place. Later, Baker, Levy, and
Grewal (1992) used Russell and Pratt’s adaptation and added an additional variable to
measure both the pleasantness and the unpleasantness of a place.
Reproduced with permission of the copyright owner. Further reproduction prohibited without permission.

25
Affiliation
The desire for affiliation refers to the increased desire to be with another person in a
space (Mehrabian & Russell, 1974) or the “need to be with people’’’ (McClelland, 1985,
emphasis in text). This study examined the individual’s tendency to affiliate as well as
the individual’s actual affiliation behaviors. Affiliation behaviors, or the physical
exhibition of affiliation, will be discussed first. Tendency to affiliate will then be
discussed.
Affiliation behaviors can be visually observed when individuals choose to be in closer
proximity to one another. Two types of affiliation behaviors can be considered, one
positive and the other negative (Mehrabian, 1976). The positive affiliation behaviors
may also be referred to as approach behaviors. The negative affiliation behaviors may be
referred to as avoidance behaviors. Positive affiliation or approach behavior leads to an
increase in “communication channels” (Mehrabian & Russell, 1974). Positive affiliation
is sometimes divided into two categories - affiliation and social interaction (Mehrabian &
Russell, 1974; Bitner, 1992). Mehrabian and Russell (1974) describe affiliation as
approaching another person, or increasing the physical immediacy with another. They
also suggest that affiliation is a primary factor in a social interaction. Bitner (1992)
describes affiliation as one of several approach behaviors that an individual may display
in an environment. While she does not provide further definition of affiliation, she does
mention it as a distinct part of approach behaviors and discusses it separately from social
interactions. Mehrabian and Russell (1974) describe social interaction as a set of verbal
and non-verbal behaviors or a series of personal exchanges. Bitner (1992) also describes
social interaction as a collection of behaviors, but she lists behaviors such as small group
Reproduced with permission of the copyright owner. Further reproduction prohibited without permission.

26
interaction, friendship formation, participation, aggression, withdrawal and helping. The
suggestion that positive affiliation behaviors may consist of the two distinct categories
directed the decision in this study to consider each category separately, and then as a
unified whole.
Positive affiliation behaviors include verbal or non-verbal exchanges (Campbell,
1997). Verbal exchange is one form of communication between people. Verbal
exchange is an outright sharing of spoken words between two or more individuals. In
addition to verbal exchange, the non-verbal aspects of communication play a great role in
how we interact with others. Campbell (1997) details three areas of non-verbal
communication that affect our interactions with each other: proxemics, paralanguage, and
kinesics.
The first area, proxemics, involves the concepts of crowding and personal space. The
level of crowding that is experienced can enhance or detract from an individual’s ability
to communicate. For example, Mehrabian and Russell (1974) suggest that if individuals
are in close proximity in a pleasant situation, affiliative behavior and mutual liking may
result. However, if two individuals are in close proximity in an unpleasant situation,
avoidance behaviors may result that could even become hostile behaviors, such as
complaining, shouting, and physical violence.
Paralanguage is the way that verbal communication is delivered. Paralanguage is not
the words themselves, but the pitch, tone, and rate at which the words are delivered
(Campbell, 1997). The paralanguage that is expressed can radically change the way a
message is received by another.
Reproduced with permission of the copyright owner. Further reproduction prohibited without permission.
27
Finally, kinesics refers to what is commonly referred to as “body language”. Kinesic
movements are non-verbal cues that may include posture, facial expression, and body
gestures (Birdwhistel, 1970). The kinesics displayed when communicating with another
person can affect the other person’s reception and interpretation of the message
(Campbell, 1997).
Positive affiliation behaviors in a space may be observed when two people sit closer
to one another, lean towards the other person, make eye contact, smile, greet the other
person, or initiate a conversation (Mehrabian, 1976). Increases in affiliation tend to lead
to increased liking for another person, which has been examined in numerous studies,
including work conducted by Festinger, Schachter, and Black (1963), who examined the
issue of geographic proximity and the formation of sociometric choices, or social
interactions. Mehrabian and Diamond (1971) found that differences in proximity and
body orientation between two strangers in a controlled environment affected the way that
the subjects affiliated and interacted with each other. Negative affiliation, or avoidance,
behaviors may include actions such as ignoring others, avoiding eye contact, increasing
the physical distance from other people, turning the body away from other people, and
rebuffing others’ attempts at conversation (Mehrabian, 1976).
Researchers who studied the phenomenon of affiliation have established a connection
between the need for affiliation as a response to a person’s fear of rejection (McClelland,
1985). People high in need for affiliation often excel on performance tasks in a manner
similar to people with a high need for achievement. McClelland (1985) cites several
studies including Atkinson and Raphelson (1956), French (1955), Atkinson and
O’Connor (1966), and McKeachie (1961) that compared the performance of people with
Reproduced with permission of the copyright owner. Further reproduction prohibited without permission.

28
a high need for achievement to people with a high need for affiliation. The participants
with a high need for achievement performed best when the goal of the performance was
the achievement itself. Participants with a high need for affiliation had the best
performance when the goal was pleasing the person conducting the experiment, rather
than the task completion itself.
McClelland (1985) also reported a study by Gallimore in 1985 that suggests that
motivation to obtain affiliative incentives has a cultural basis. The Gallimore study found
that students of Hawaiian ancestry are more likely to respond to affiliative incentives,
such as social approval or affection, than for individual achievement incentives such as
grades. The studies that suggest that people with a high need for affiliation are more
likely to work to please others confirm the relationship with the fear of rejection.
Mehrabian and Ksionzky’s (1974) Measure of Affiliative Tendency Scale
Mehrabian and Ksionzky (1974) attempted to develop a scale to measure an
individual’s tendency to affiliate with others that is separate from an individual’s fear of
rejection. They defined two attributes as “(1) a person’s tendency to perceive others and
expect them to be sources of positive reinforcement (affiliative tendency), and (2) his
tendency to perceive and expect others to be sources of negative reinforcement
(sensitivity to rejection)” (Mehrabian & Ksionzky, 1974, p. 24). While past test measures
existed at that time, the measures were usually thematic apperception tests, which are
difficult to administer and analyze. Mehrabian and Ksionzky, in an attempt to find a test
that would be economical and easy to administer, developed two separate scales for
tendency to affiliate and sensitivity to rejection. The resulting Measure of Affiliative
tendency scale is a twenty-six item scale that can be administered as a paper-and-pencil
Reproduced with permission of the copyright owner. Further reproduction prohibited without permission.

29
survey. The scale has relatively low correlation with sensitivity to rejection and social
desirability. It also has an internal reliability coefficient of 0.80, indicating relatively
consistent measurement of the scale items.
This research presented in this paper uses the Measure of Affiliative Tendency to
identify the affiliative tendency of the focus group participants. The framework proposed
by Mehrabian and Russell serves as a framework for the general environmental
psychology field. Mary Jo Bitner applied many of the principles from Mehrabian and
Russell’s framework to the business world, in the form of the “Servicescapes”
framework. Bitner’s framework is presented in the next section.
Bitner’s Servicescape Framework
Bitner (1992) proposed a framework for examining the effect of the physical
environment on human response in commercial settings, specifically, a services delivery
situation. The framework was developed using Mehrabian and Russell’s 1974 work in
environmental psychology.
The “Servicescapes” framework identifies several environmental variables, divided
into three general factors: ambient conditions, space/function, and signs, symbols, and
artifacts. Individuals perceive these variables, as well as other people, in the environment,
resulting in internal responses that lead to external behaviors. The individuals in the
environment include both customers and employees. Bitner proposes that further study
be conducted examining each of these factors and the variables within each factor to
develop knowledge on how each influences the customer’s experience and perception of
service quality.
Reproduced with permission of the copyright owner. Further reproduction prohibited without permission.

30
Servicescapes Model
The Servicescapes model consists of environmental dimensions, perceived
servicescape, response moderators for both employees and customers, internal responses
for both employees and customers, and finally, behavior. A discussion of each of these
components follows.
Environmental Dimensions. The physical environment consists of ambient
conditions, space/fimction, and signs, symbols, and artifacts. Ambient conditions are
conditions that affect the five senses; touch, taste, smell, vision, and sound (Bitner, 1992).
Ambient conditions include such factors as odor, lighting, color, background noise,
flavor, and texture.
Signs, symbols, and artifacts may include signage in a space, artwork, general style of
decoration, personal items belonging to individuals within a space, or the attire of people
within a space (Bitner, 1992). Due to the extreme variability of this dimension, which
changes constantly as a result of people entering and leaving a space, it is considered to
be outside the scope of this study.
The space/function dimension of the physical environment is the layout of an area, as
well as the equipment and fiuniture within the area (Bitner, 1992). Some of the
interesting aspects of the space/fimction dimension include spatial arrangements of
objects and/or fiuniture in the space and the presence of other people in the space. Our
interactions with others and with our environment may be influenced by the dimensions
(size, largeness, smallness) of the physical environment, by the placement of objects
within the physical environment, or by our proximity to other people in the enviromnent.
One interesting aspect of space/function that is particularly relevant to this study is
Reproduced with permission of the copyright owner. Further reproduction prohibited without permission.

31
the arrangement of furniture within a space and how the arrangement acts as a facilitator
for affiliative behaviors. An early study examining this was conducted first by Osmond
and then Sommer in 1959 (as reported by Hall, 1976). The study involved comparing the
interactions among female geriatric ward patients in a hospital in two different
environments within the hospital, the ward itself and the hospital’s cafeteria. The ward’s
arrangement consisted of chairs lined up on opposite walls. The cafeteria initially had
rectangular tables. Conversations between patients sitting in the ward and in the cafeteria
were observed and counted. The most significant result of the study was that people who
sit at the right angles of a table’s comer have six times the number of conversations as the
people who sat face-to-face across the table from one another. Comer conversations also
produced twice as many conversations between patients as when the patients sat side-by-
side.
The ward was rearranged, with the addition of small, square tables and the chairs
were moved from against the wall to table positions. After a period of adjustment to the
new fumiture arrangement, the patients were again observed and it was discovered that
the number of conversations had doubled.
The arrangement of fumiture or other features that encourage or discourage social
interactions are described as either “sociopetal” or “sociofugal”. These terms were
coined by Osmond (1959), with “socio-” meaning social; “-petal” referring to the Latin
verb petere, or to seek (The Merriam Webster Dictionary, 1997, p. 134); and “-fugal”
referring to the Latin verb fugere, or to flee (The Merriam Webster Dictionary, 1997, p.
134). Body orientation, as a display of affiliation, may have different meanings at
different proximal distances. It may also have different meanings when the individuals in
Reproduced with permission of the copyright owner. Further reproduction prohibited without permission.

32
the observation are seated, standing, or engaged in some type of movement (Mehrabian
& Russell, 1974). Mehrabian and Russell report the results of a study conducted by
Russo in 1967 that confirmed that in most cases closer distances between two individuals
indicated greater affiliation.
The research in the female geriatric ward, reported by Hall, was conducted to find a
way to reduce the withdrawal from society that often occurs in the elderly. Facilitating
social interactions is thought to have a healthy effect (Hall, 1976). While the study
presented in this paper will not focus on the elderly and socialization, the concepts of
using the semi-fixed objects, i.e., the furniture, in the focus group waiting area was
arranged and controlled based on these principles. The intent was to facilitate social
interactions among the focus group participants as well as to provide control over a
potential covariate, fumiture layout, in the study.
Perceived Servicescape. The next component of Bitner’s (1992) Servicescape model
is the perceived servicescape, or the perceived environment. Bitner does not explore this
in great detail other than to review some of the literature that has been conducted in
cognitive psychology. The perception of the servicescape results in an emotional
response and also helps to provide cues for the individual to form beliefs about the space
or the company whose space it is. The function of environmental perception is to
establish a link between the extemal world (i.e., the perceived environment) with the
“intemal” world of the individual (Bonnes & Secchiaroli, 1995).
Customer Response Moderators. The next component of the Servicescapes model is
customer response moderators (Bitner, 1992). Once the physical environment has been
perceived, an intemal response is formed. Examples of intemal response may include
Reproduced with permission of the copyright owner. Further reproduction prohibited without permission.

33
feelings of liking or disliking, or the desire to remain in or leave the space. However,
Bitner suggests that certain factors will moderate the formation of the intemal response.
Moderators may include personal and situational factors.
Personal factors. Bitner discusses personal factors in the form of individual
personality traits. Two such traits that Bitner discusses were proposed by Mehrabian and
Russell (1974) and Mehrabian (1976). The first trait is “arousal-seeking”, where arousal-
seekers look for stimulating, high load environments, while arousal-avoiders prefer
environments with lower levels of stimulation. An individual with high levels of the
arousal-seeking trait might seek out a high-risk, high-load environment for entertainment,
such as a trendy nightclub or a weekend of skydiving. An individual with preferences for
arousal-avoidance might seek out a quiet jazz club or a weekend of relaxation on the
beach.
The other trait proposed by Mehrabian (1976) is the level of environmental
“screening” that the individual does. Environmental stimulation is often referred to as the
“load” of the environment, or the amount of environmental information that is being
offered. For example, a high-energy disco is a high-load environment because
individuals in the environment experience a high rate of information to process in the
form of music, flashing lights, crowded conditions, multiple odors, and temperature
differences. A low-load environment offers fewer pieces of information to process. A
quiet den in an individual’s home probably provides a low-load environment because
there is relatively limited information, or at least new information, to be processed.
People who are “low screeners” have a more difficult time screening out large
amounts of environmental stimulation and may find high-load environments unpleasant
Reproduced with permission of the copyright owner. Further reproduction prohibited without permission.

34
(Mehrabian, 1976). High screeners “screen out” high amounts of environmental
stimulation. High screeners may find low-load environments to be boring and often seek
high-load environments to be stimulated. Mehrabian (1976) suggests that use of the
arousal-seeking tendency scale (Mehrabian & Russell, 1974) is useful in understanding
peoples’ screening abilities. However, the most reliable way to test one’s screening level
is to check a variety of biometric levels, such as pulse, brainwave activity, and
vasoconstriction. While tools to measure these variables are not readily available to the
public, Mehrabian offers a “fairly easy way to discover whether you are a screener or a
nonscreener” (Mehrabian, 1976, p. 28). Since physiological arousal is associated with
vasoconstriction (constriction of the capillaries) in the body’s extremities, a person who
is very aroused will have cold hands and feet. If a person takes the temperature of his or
her hands and feet in a variety of situations over time, he or she should be able to
determine if he or she is a screener or nonscreener. Additional indicators of screening
ability are measurements of empathy levels (low screeners are generally more empathetic
than high screeners). Mehrabian also says that research indicates that women tend to be
lower screeners than men.
The levels of screening and arousal preference are proposed to moderate the intemal
response to the environmental stimuli (Bitner, 1992; Mehrabian & Russell, 1974). A
high screener and arousal-seeker will not be affected by a high-load environment and
may not form strong intemal responses to the stimuli presented. However, a low
screener, who is probably an arousal-avoider, may have an extreme response to a high-
load environment.
Reproduced with permission of the copyright owner. Further reproduction prohibited without permission.

35
More recent research has focused on other aspects of personal factors. In 1985, Costa
and McCrae proposed a new personality inventory, the NEO Personality Inventory, as
part of an exploration of trait psychology (McCrae & Costa, 1996). Trait psychology
strives to determine how personality traits of humans are developed, particularly the
degree that traits can be inherited or acquired through nurture and if traits are static or
dynamic. The five factors in the this model are 1) Basic Tendencies, such as neuroticism,
extraversion, openness, agreeableness, and conscientiousness; 2) Characteristics
Adaptations, such as personal strivings, attitudes, and habits; 3) Objective Biography, or
reactions to situations that result in behaviors that, in turn, affect the situation; 4) Self-
Concept, or the development and maintenance of self-schemas, and 5) Extemal
Influences, or situational events that are outside the individual. While all five factors are
present in every person, the factor that would be of greatest interest in the context of this
study would be the Basic Tendencies factor. The dimensions such as extraversion,
openness, and agreeableness may clearly affect the reactions of study subjects in the
proposed experimental environment to the room and to others in the room. The NEO
Personality Inventory was not used in this study because it contains many scale items and
the length of this survey instmment needed to be limited, to guard against participant
fatigue. The instmment needed to be long enough to collect all data regarding pleasure,
arousal, dominance, affiliation, and mood while not overwhelming the study subjects,
who had already spent 15 minutes waiting (patiently) and were about to begin a focus
group. There was concem that a longer survey instrument would create frustration or
irritation among the study subjects that might negatively affect their participation in the
focus group. The decision was made to use, instead, the Affiliative Tendency scale that
Reproduced with permission of the copyright owner. Further reproduction prohibited without permission.

36
is discussed later in this paper, to reduce the participant fatigue. This scale will be
discussed later in this chapter.
Situational factors. Situational factors may also serve as response moderators.
Situational factors are the reasons or plans that an individual has for being in a particular
environment (Bitner, 1992). Unlike individual differences or personality traits, which are
relatively stable over time, situational factors may constantly change. The purpose for
being in the environment will affect what a person remembers about the environment and
how he or she behaves within the environment.
Similarly, mood may serve as a situational factor (Bitner, 1992). Again, personality
traits are relatively stable over time, but mood is transient. An individual may have a
completely different perception of a crowded store if he or she is tired and sad than he or
she would if he or she were relaxed and happy.
Expectations of the environment and having the expectations either confirmed or
disconfirmed will also affect perception of the environment (Bitner, 1992). Expectations
are situational, since expectations change from space to space, situation to situation, and
may be influenced by mood as well.
The discussion now turns to the different types of intemal responses to the
environmental stimuli.
Internal Responses. Bitner proposes three intemal responses to environmental stimuli
- emotional, cognitive, and physiological (1992). She follows roughly the same concepts
that were discussed in previous sections. For example, the emotion dimension draws
from Mehrabian and Russell’s (1974) pleasure-arousal-dominance factors. It should be
noted that arousal is non-specific to emotion. This means that arousal can intensify
Reproduced with permission of the copyright owner. Further reproduction prohibited without permission.

37
emotions, either positive or negative, according to Zillman’s theory of emotion (Kardes,
1999). For example, a horror-movie fan might watch a movie at home that is moderately
scary. The same movie, if viewed at the theatre, with its controlled environment that
eliminates most other distractions for the moviegoer and enhances many of the suspense-
building features of the movie such as sound volume, may create a more arousing
environment for the movie patron. The movie will probably be scarier and the viewer’s
physiological and emotional reactions to the movie will be more extreme at the theatre
than at home.
The cognitive dimension draws from cognitive psychology and includes steps such as
the formation of beliefs, categorizing information into heuristic devices, and attaching
symbolic meanings to stimuli presented in the environment. Bitner’s physiological
dimension includes somewhat general characteristics such as pain, comfort, movement,
and the physical fit of objects/persons in the environment. These intemal responses lead
the individual to perform behaviors, which will be considered next.
Behavior. The final component in the Servicescapes model is the behavior that is
exhibited by individuals in an environment. Bitner (1992) proposes two broad categories
of behavior - approach/avoidance and social interactions between and among customers
and employees.
Approach/Avoidance. Mehrabian and Russell (1974) classifed affiliative behaviors
into two categories - approach and avoidance. Bitner’s (1992) application of the
approach/avoidance principle focuses mainly on commercial goals. Approach behaviors
include such actions as increased time in an environment, increased liking for the
environment, increased spending on purchases in the environment, and increased
Reproduced with permission of the copyright owner. Further reproduction prohibited without permission.

38
interaction with others in the environment. Avoidance behaviors may include such
actions as leaving an environment, decreased interactions with others in the environment,
expressing little or no intent to return, or avoidance of a place altogether.
Approach behaviors, as applied by Bitner (1992) to employees, include exploration,
staying longer, commitment, and carrying out a plan. Avoidance behaviors of employees
include the opposites of approach - lack of exploration, leaving the environment more
quickly, lack of commitment, and failure to carry out plans.
Social Interactions. The social interactions in the Servicescapes model (Bitner, 1992)
are the result of the necessity of interpersonal interactions in a service delivery
environment. The interactions may happen between employees, between customers, or
between customers and employees. Bitner reviews much of the past research in
environmental psychology to discuss the effect of the servicescape on the act of
affiliation and the directly observable variables that are evidence of affiliation (i.e.,
proximity, seating arrangements, body orientation, etc.). Employees and customers may
have different needs and desires in a physical environment. The environment should be
conducive to efficient, successful performance of the tasks that each person expects to
perform in the space (Bitner, 1992; Berry, 1981). Berry (1981) discusses the physical
environment in a bank. The customer needs the space to be functional and pleasant for
business transactions. The employee of the bank may have different needs than the
customer, such as increased lighting, access to machines, storage space, and access to
supervisors or other tellers. The features that help the employee do his or her job may not
provide the customer with a pleasant environment. For example, the equipment that the
Reproduced with permission of the copyright owner. Further reproduction prohibited without permission.

39
employee uses might be noisy or the lighting might be harsh and unflattering to the
interior décor. The customer will perceive this negatively.
Bitner (1992) offers two propositions - first, the intemal response to the servicescape
will “enhance or detract fi'om the nature and quality of social interactions between and
among customers and employees (p. 61)”. The second proposition proposes that the
optimal design for encouraging approach or avoidance behavior might be unable to
facilitate both the needs of the employee or the customer in the space and positive social
interactions. The goal of every company should, of course, be to have a workspace that
is appropriate and pleasing to the customer but also fimctional and pleasing to the
employee as well.
Bitner's Extension o f Mehrabian and Russell’s Work
While Bitner uses Mehrabian and Russell’s model as a basis for the Servicescapes
framework, she also adds extemal elements to the framework that provide a more
comprehensive view of the service experience. For example;
Customers and Employees Interaction. The model integrates both customers and
employees and also acknowledges the influences that each has on the other in a service
environment.
Quality o f Interactions. Mehrabian and Russell acknowledge that the physical
environment and the proximity of others influence an individual’s response to the stimuli.
The responses are either approach or avoidance. Bitner draws from social research in
environmental psychology and extends the concept to consideration of the quality of
interaction between individuals within the environment in addition to the
approach/avoidance behaviors.
Reproduced with permission of the copyright owner. Further reproduction prohibited without permission.

40
Environmental Design Complexity. Bitner adds complexity to the model by including
the complexity in designing a service environment that is conducive to the needs of both
employees and customers, which may require environments that are vastly different to
achieve their separate goals.
Emotional Response Dimensions. Mehrabian and Russell focus on the behavioral
aspects of the stimulus-organism-response model but do not focus on the internal
response to the stimuli. They focus on the emotional dimension of response. Bitner
expands this to include cognitive, emotional, and physiological dimensions.
Bitner also proposed three dimensions for evaluating the environment in a
servicescape. They are ambient conditions, spatial layout and functionality, and signs,
symbols, and artifacts. While each element in a dimension may be experienced
separately, individuals usually perceive them simultaneously in a holistic package. Each
element may have a different effect on the individual’s response to the environment and
his or her subsequent behavior. A review of the research that has been conducted using
the three physical environment dimensions in marketing applications, primarily in the
retailing area but also in service delivery environments to a limited extent, will be
presented next.
Atmospherics and Marketing
Research on the effect of “atmospherics” in a consumer shopping experience is a
relatively recent phenomenon. The term “atmospherics” was first proposed by Kotler,
referring to the study of a store’s atmospheric effects on consumer behavior (Turley &
Milliman, 2000). The concept is that consumer behavior can be changed or controlled by
Reproduced with permission of the copyright owner. Further reproduction prohibited without permission.
41
manipulating elements in the physical environment. The vast majority of the research in
atmospherics has been conducted in retail settings, where the customer goes to a store to
purchase tangible products. The intent of this research is to determine the factors that
elicit an approach or avoidance behavior from potential store patrons. Once store patrons
enter the retail outlet, research is sometimes conducted to assess the effects of several
environmental variables on the customer’s behavior inside the store, including time spent
in the store and effects on store revenue.
Turley and Milliman (2000) classify atmospheric elements into five categories;
external variables (the store’s exterior appearance), general interior variables (music,
scent, color, lighting, temperature), layout and design variables, point-of-purchase and
decoration variables, and human variables. The more commonly studied variables are
music, ambient odor or aroma, interior color, point-of-purchase and decoration, and
human variables. There has been less research performed in the examination of exterior
variables, lighting, and layout and design. This may be due to the relative ease of
manipulation of the more commonly studied variables within an environment and the
difficulty in changing store layout, store design, and exterior appearance.
Ambient Music
Recent research in retail atmospherics includes studies that examine the effect of
different types of in-store music on shopping times (Yalch & Spangenberg, 2000),
revenue (Areni & Kim, 1993), and product selection (North, Hargreaves, & McKendrick,
1997). Yalch and Spangenberg (2000) measured shopping time for shoppers who were
exposed to background music of varying familiarity. The study participants
underestimated the amount of time that they spent shopping when unfamiliar music was
Reproduced with permission of the copyright owner. Further reproduction prohibited without permission.

42
played, whereas they overestimated the amoimt of time they spent shopping when
familiar music was played.
Areni and Kim (1993) report that playing background classical music in a wine cellar
resulted in a higher level of wine sales revenue than did playing Top-Forty music in the
background. The researchers hypothesized that the selection of classical music was more
congruent with a wine cellar patron’s lifestyle than was Top-Forty music. This
congruence resulted in greater persuasion in the sale which, interestingly, lead not to an
increase in the volume of wine sold but in the total cost of the purchase. The presence of
classical music resulted in patrons buying more expensive wine. The researchers
suspected that the wine store patrons used the music as an external cue for purchasing
behavior. The type of music was a proxy for product quality, so when a more
sophisticated genre of music was played, the buyer looked for a higher quality (and
higher priced) wine.
North, Hargreaves, and McKendrick (1997) report that sales of French wine exceeded
sales of German wine when French music was played in a retail outlet, whereas German
wine outsold French wine when German music was played. These researchers suggested
that the familiarity of the origin of the music had a subtle, subconscious influence on the
customer’s superordinate knowledge structures concerning the country of origin, which
influenced purchase behavior.
In another study, an experiment to determine the effects of types of ethnic music on
the sales of certain menu items found that playing ethnic music in a military dining
facility increased purchase of the special menu items of the same ethnicity (Feinstein,
Reproduced with permission of the copyright owner. Further reproduction prohibited without permission.

43
Hinkston, & Erdem, in press). The intensity of the music played also affected the
probability of purchase of ethnic menu items over non-ethnic menu items.
Store Image and Design
Sharma and Stafford (2000) examine the effect of the environmental atmosphere on
customer perceptions of a store’s sales people. They offer preliminary research that
suggests that stores with an upscale image facilitate the persuasive powers of their
salespeople. In addition, the upscale stores may have reduced levels of sales staff without
affecting the customer’s buying intentions. The study also finds that high salesperson
availability in discount-type stores has a significantly positive effect on shoppers’ buying
intentions over times when there is low salesperson availability. Buying intentions under
different levels of sales personnel availability are influenced by the store’s atmosphere
(upscale or discount).
The effect of ambient, design, and social factors on a shopper’s level of irritation in
the shopping experience is discussed by d’Astous (2000). His study examines 38
shopping irritants that fall into four categories — ambient, design, social, and none (i.e.,
other). Women are reported to be significantly more irritated than men by factors such as
“it is too hot inside the store”, “crowding”, and design factors that include “unable to find
what one needs” and the “store is too small”. Younger shoppers are significantly more
irritated by “bad smell in the store” and “store is not clean”, whereas older shoppers are
significantly more likely to be irritated by “music inside the store is too loud”.
Ambient Scent
Olfaction, or the sense of smell, is one of the least understood and most evocative of
the five senses. Olfactory memory has been found to last longer than visual memory and
Reproduced with permission of the copyright owner. Further reproduction prohibited without permission.

44
has been found to be an effective conditioning cue (Gulas & Bloch, 1995). Scent can
affect brain wave patterns and may affect the brain in cognitive as well as non-cognitive
ways (Gulas & Bloch, 1995).
The senses of smell and taste, along with a third component, chemical sensory
irritation, belong to a group called the “chemical senses” (Beauchamp, 1994). The other
senses - touch, sight, and hearing, and to a certain extent, taste - are excited and the
stimulus information is routed directly to the thalamus, the area of the brain where
cognitive processes occur (Nolte, 1999). The stimulus information is cognitively
processed and the body/mind reacts to the information. By contrast, olfaction bypasses
the thalamus initially.
Olfaction, or the action of smelling, occurs in the nose. The stimulus chemical is
transmitted to an area called the olfactory bulb, which is located immediately above the
nasal passages. The olfactory bulb is part of the telencephalon, a section of the brain that
resides in the limbic system. The chemical stimulus travels to the telencephalon and is
believed to affect the autonomic nervous system and the trigeminal systems, which are
the parts of the brain that control visceral reactions (Van Toller, 1994). The information
sent to this part of the brain results in a reaction that occurs without first undergoing some
type of cognitive process. It is believed that this is a vestigial remnant of the time when
humans relied more heavily on their sense of smell for survival, such as that of most
other mammals today, in obtaining nutrients and avoiding noxious substances
(Beauchamp, 1994). Olfactory cues have been found to affect the formation and retrieval
of memories (Levine, 2000).
Reproduced with permission of the copyright owner. Further reproduction prohibited without permission.

45
Little consumer research has been conducted that tests the olfactory senses and
consumer reactions to ambient scents. Morrin and Ratneshwar (2000) define ambient
scent as “scent that is not emanating from a particular object but is present in the
environment (p. 67).” Past research in marketing examining scent has focused in large
part on “localized” scent (Gulas & Bloch, 1995), or scented objects used as promotional
items (Morrin & Ratneshwar, 2000), such as scented perfume sample cards, inserts in
magazines, product scents such as scented household cleaners, and shampoos (Bone &
Jantranis, 1992). In contrast, little research on ambient, as opposed to object-based, odor
has been published. The following is a review of the empirical research on object-based
and ambient odor.
Psychological research. Early research in scent occurred in perceptual and cognitive
psychology. Hess conducted a study of the physiological response to odor in 1965, as
reported by Mehrabian and Russell (1974). This study found that arousal was positively
affected by pleasant and unpleasant odors when compared to the absence of an odor. The
novelty, or unexpectedness, of the odor seemed to be the trigger for arousal. In 1996, the
American Trucking Association was testing a new system in trucks that alerted truckers
who were exhibiting signs of sleepiness at the wheel (Bounds, 1996). The system
included a series of warning sounds and messages as well as a spray of peppermint scent
into the truck’s cab. A peppermint scent has been foimd to be effective in increasing
arousal.
The novelty of the odor triggering arousal is consistent with brain chemistry research.
A new, unfamiliar stimulus has been found to provide greater firing rates of the cells that
release norepinephrine into the frontal cortical areas of the brain (Ashby, et a l, 2002).
Reproduced with permission of the copyright owner. Further reproduction prohibited without permission.

46
This results in an increased state of physiological arousal. The chemical “cortical
norepinephrine (cortical NE)” specifically has been found to mediate vigilance reactions
in humans, which is most likely a precautionary biological response a novel, or
potentially dangerous, situation (Winkielman, Schwarz, & Nowak, 2002).
Ambient scent and social interaction. Baron (1990) conducted a study to evaluate the
effect of a pleasant ambient scent on affect while participants completed various tasks.
One task included two mock negotiations, where the participant negotiated with another
person who behaved in a relatively confrontational manner. The subjects were exposed
to scents that were determined to be either pleasant or neutral before entering the task
environment. The task environment was either unscented or scented using pleasantly
scented commercially available room air fresheners.
In a 1983 experiment, Baron found that in mock job interviews, “applicants” who
wore scent were evaluated higher on job related abilities than were the “applicants” who
did not wear scent (Gulas & Bloch, 1995). In another experiment, Baron (1990) found
that pleasant scents led to a more positive affective state than did neutral scents. In
addition, the subjects in the pleasantly scented environment reported weaker preferences
for confrontational styles that could be used if they were to have further interaction with
the confrontational negotiators. The subjects in the pleasantly scented environment also
reported higher expectations for goals and performance in the tasks assigned. This
generally positive affect trend suggests that individuals in a pleasantly scented
environment will have more positive approaches to task and other people in the
environment. This study examines whether a pleasantly-scented condition leads to
increased incidences of affiliation behaviors and social interactions.
Reproduced with permission of the copyright owner. Further reproduction prohibited without permission.

47
Ashby, et al. (2002) proposed the “dopaminergic theory of positive affect”. Affective
states are produced by the presence of neuromodulators in the brain (Ashby et al., 2002).
Again, one familiar, naturally occurring example of a neuromodulator is dopamine.
Artificial chemicals, such as amphetamines or cocaine, introduced into the body can also
induce an affective state similar to that of dopamine. The neuromodulators dopamine and
serotonin have been used to treat depression. Neuromodulators produce a state of arousal
in humans, which can be quite similar to affect. Studies of the two concepts associate
both dopamine release and positive affect with increased motor activity (Ashby, et al.,
2002). An intense positive state of arousal can be associated with an intense affective
state, while a negative state of arousal is often accompanied by a negative affective state.
Affective states are known to influence an individual’s memory, decision-making
processes, and problem-solving abilities. However, there are conflicting opinions in this
area. For example, Sinclair, Moore, Lavis, and Soldat (2002) report that studies show
that “sad” subjects completed analysis tasks more accurately than “happy” subjects did.
However, other researchers, including Isen, find that moderate positive affect (or
happiness) leads to increased problem-solving ability (Ashby, et al., 2002). Ashby, et al.
(2002) cite several studies by Isen that a moderate positive affective state, as opposed to a
neutral affective state, lead to greater diversity in word association exercises and greater
accuracy in remote association tests and creative thinking tasks. They believe that the
cause is an increase in the flexibility of the executive attention system that may be
present in a moderately positive affective state.
The role that affect plays, in relation to evaluation, is a factor that lends “fluency” to
the evaluation process (Winkielman et al., 2002). The evaluation process is part of a
Reproduced with permission of the copyright owner. Further reproduction prohibited without permission.

48
“metacognitive” process that occurs in an area of the brain that is very close,
geographically speaking, to the limbic system, where affect is induced. Affective states
lend perceptual fluency to an evaluative or decision-making process. This perceptual
fluency leads to a heuristic device that humans use to aid in decision-making.
Winkielman, et al. (2002) refer to the “mere-exposure” heuristic that indicates that
prior exposure to an object or person will ease processing information about the person.
This ease of processing will result in increased liking for the object or person. It has been
tested using neuroimaging techniques and electrophysiological techniques (Winkielman,
et al., 2002). The studies show that recognized stimuli lead to relatively small numbers
of neurons changing state in the brain, compared to larger numbers of neurons changing
state when encountering an unfamiliar stimulus. The patterns of the neurons firing follow
a more consistent pattern when the stimulus is familiar than when it is unfamiliar. Over
time, repetition of a stimulus that was initially unfamiliar will decrease the inconsistency
of the neuron firing patterns, and ultimately leads to a more selective firing of neurons.
Fluency, a result of the mere-exposure concept, may also lead to increased affect
because the brain is available to move on to other tasks if it recognizes the stimulus
(Winkielman, et al., 2002). This might result in an increase in the neuromodulators (e.g.,
dopamine, serotonin) that feel good and cause liking. Another explanation proposed by
Winkielman, et al. (2002) is that a familiar stimulus is consistent with the brain’s
expectations for a particular situation, leading to liking. The familiarity may be in
opposition to another process where violations in expectations trigger a negative affective
state.
Reproduced with permission of the copyright owner. Further reproduction prohibited without permission.

49
Affect may be cued by external environmental factors. In this study, the pleasant
scent was intended to cue the brain for positive arousal and positive affect towards the
physical environment and other participants in the group. The pleasant scent may have
also served as a proxy for positive qualities in the other people in the environment.
Ambient scent in consumer product marketing. Until recently, little published
empirical research in consumer product marketing examined ambient scent. Laird
experimented with consumer product evaluation in 1932, when he found that consumers
rated identical products more highly if they were scented (Gulas & Bloch, 1995).
More recently, Mitchell, Kahn, and Knasko (1995) studied the congruency of an
ambient odor and mediation of memory processes. The researchers looked specifically at
the use of congruent and incongruent scents in product decision-making tasks, selecting
either chocolate assortments or floral arrangements in environments that were either
scented with chocolate or floral odorants or were unscented. The presence or absence of
a scent did not result in a significant difference in the number of choices made. The
congment odor condition resulted in more time spent in decision-making and spreading
decisions across choice groups of products in each category.
Spangenberg, Crowley, and Henderson (1996) found that the presence of a pleasant
scent at a moderate intensity in a simulated shopping environment in a laboratory setting
resulted in significantly higher incidences of certain approach behaviors than did the
unscented control environment. The approach behaviors tested included such variables
as actual time spent in the environment, perceived time in the environment, intentions to
visit the (theoretical) store, purchase intentions of particular items in the experimental
environment, and number of price tags examined. The subjects in scented conditions
Reproduced with permission of the copyright owner. Further reproduction prohibited without permission.

50
reported spending less time in the environment than they actually did. Spangenberg, et
al. (1996) attribute this to the concept of an “optimal state of experience”, which explains
the distortion of self-evaluation of time spent in an environment that is influenced by the
“quality” of the subjective experience. They suggest that the ambient scent enhanced the
quality of the experience for the subjects, leading to the distorted perceptions of time in
the environment, thus operationalizing the old saying “time flies when you’re having
fun”.
Spangenberg, et al. (1996) study also evaluated the effects of the two treatment
conditions on the evaluation of the store environment. Virtually all of the variables in
evaluating the environment received significantly higher ratings in the scented condition
than in the unscented condition. In addition, the products that were displayed in the two
treatment conditions were evaluated. The researchers found that certain of the items
received higher evaluation ratings in the scented condition that did those same items in
the unscented condition, although many of the items were not evaluated significantly
differently. They acknowledge the effect of the scent condition but suggest future
research to determine the specific mechanism that explains it.
Morrin and Ratneshwar (2000) report that ambient scent affects study participants’
awareness and evaluation of product brands. Participants were exposed to a number of
familiar and unfamiliar product brand names in a laboratory setting that was either
pleasantly scented or unscented. Most participants in the pleasantly scented environment
reported that they were unaware of scent in the room. Participants in the pleasantly
scented environment gave significantly higher brand evaluations to both familiar and
unfamiliar brands than participants in the unscented environment. This is attributed to
Reproduced with permission of the copyright owner. Further reproduction prohibited without permission.

51
the effect that novelty has on attention. Morrin and Ratneshwar (2000) suggest that the
increased attention and effort spent evaluating the brands lead to greater attention in
evaluating the brands, resulting in more positive evaluations. They suggest that the
positive evaluations were responses to a spontaneous construction of the evaluation rather
than a retrieval of an evaluation from memory. Morrin and Ratneshwar (2000) do not
mention this, but the results seem consistent with the dopaminergic theory of positive
affect, where the release of the neurotransmitters that lead to increased arousal and affect
might increase the evaluation and recall of the brands (Ashby, et al., 2002; Winkielman et
al., 2002).
In addition, the participants in the pleasantly scented environment recalled unfamiliar
brands significantly more often than participants in the unscented environment (Morrin &
Ratneshwar, 2000). The researchers attribute this to a suspected “encoding effect” that
occurs when a pleasant scent is present. The scent caused participants to spend more
time evaluating unfamiliar brand names, and then the scent acted as an external cue
during the recall exercise, leading to increased recall in the scented conditions.
Gulas and Bloch (1995) propose a framework to understand the role of ambient scent
in consumer product response. The model begins with an ambient scent, which when
perceived by an individual is moderated by characteristics such as age and gender. After
the ambient scent is perceived, an affective response is formed. This affective response is
moderated by past experience, individual preferences, physiological predispositions,
other atmospheric elements, and the congruity of the scent to the situation. Finally, the
affective response leads to exhibition of approach or avoidance behaviors.
Reproduced with permission of the copyright owner. Further reproduction prohibited without permission.

52
Gulas and Bloch (1995) call for increased consumer research in the area of ambient
scent, the least understood and least studied of the ambient conditions in the physical
environment dimension of Bimer’s Servicescape model. However, they continue to
focus on consumer product marketing and retail applications and do not mention the
services industry.
Ambient Scent in Services Marketing. To date, no published literature has been found
that examines ambient scent in a services marketing environment.
Atmospherics in Services Marketing
Before the topic of atmospherics in services marketing is discussed, a brief overview
of marketing, in general, will be presented. The concepts of the “Four P’s”, services
characteristics, and the “Additional Three P’s” will be covered.
Overview o f Marketing
The “marketing mix” is defined as “the set of marketing tools that the firm uses to
pursue its marketing objectives in the target market” (Kotler, 1994, p. 98). The Four P’s
are the traditional elements of the marketing mix. They consist of product, price,
promotion, and distribution (place). McCarthy proposed the Four P ’s classification in
1981 (Kotler, 1994). Most marketing texts and courses rely heavily on these four
elements. A brief review of each element follows.
Product
The product is the actual good or service that is being produced for a customer. The
product variables in the Four P’s model include product variety, quality, design, features.
Reproduced with permission of the copyright owner. Further reproduction prohibited without permission.

53
brand name, packaging, sizes, services, warranties, and returns (Kotler, 1994). Products
in the hospitality industry include guest rooms, meals in a restaurant, slot machines in a
casino, and fitness centers in hotels.
Price
Price is the amount of money charged for a good or service (Kotler, Bowen, &
Makens, 1999). Pricing needs to be set high enough to maximize profits for the company
but not so high that too many potential customers are alienated. If the price is too low,
not only will profits not be maximized, but customers may be alienated as well since
price is often used as a proxy for quality when customers are making a purchase of a
good or service with which they have little other information for evaluation. If the price
is too low, the customer might think the quality is too low to make the purchase viable.
Variables in the price element may include list price (or rack rate, in hotels), discounts,
allowances, payment period, and credit terms (Kotler, 1994).
Promotion
The promotion element consists of advertising, sales promotion, public relations, and
personal selling (Kotler, Bowen, & Makens, 1999). A product or service’s promotion
strategy will vary based on the goals of the company and the needs and access to the
target market for the product or service. Variables in the promotion element include sales
promotion, advertising, sales force, public relations, and direct marketing (Kotler, 1994).
Distribution (Place)
Place is defined as the various activities that a company engages in to make its
product accessible and available to its target market (Kotler, 1994). Variables in the
Reproduced with permission of the copyright owner. Further reproduction prohibited without permission.
54
place element include distribution channels, coverage, assortments, locations, inventory,
and transport (Kotler, 1994).
Characteristics o f Services
While the place factors are still applicable in both product and services marketing,
they are incomplete in the services area. Services marketing requires consideration of
four additional characteristics of services - intangibility, inseparability, variability, and
perishability - that are not typical in product marketing. These characteristics lead to the
proposal for an additional “Three P’s”, which will be discussed in the next section.
Intangibility. When products are marketed and sold, the customer takes a tangible
item away. The item may be felt, seen, smelled, heard, handled, and tasted. However,
when a service is sold, the product is intangible, or does not have a physical mass for a
consumer to evaluate. This presents a challenge for marketers, since the product cannot
be presented through packaging or possession of an object. For example, hotel rooms,
per se, are not sold. It is the right to occupy the room’s space for a period of time that is
sold to hotel guests (Kotler, Bowen, & Makens, 1999).
Inseparability. When products are sold, there is often a temporal disconnect, or time
lag, between the purchase and the use or consumption of the product (Berry, 1980).
Services, however, are consumed at the same time as they are purchased. In addition, the
customer consumes the service inside the production facility. The customer becomes an
inseparable part of the product, being inside the service environment (Kotler, Bowen &
Makens, 1999).
Variability. Manufacturing a tangible good can be controlled so that a consistent
product, conforming to rigid standards, is produced. However, most services are
Reproduced with permission of the copyright owner. Further reproduction prohibited without permission.

55
delivered by people, and people are highly variable. The quality of service can vary from
day to day and hour to hour. Quality control becomes difficult not only because of the
variability of the service delivery personnel but also because the flow of production
changes, based on shifts in demand for the product (Kotler, Bowen, & Makens, 1999).
Perishability. Tangible products can be inventoried and sold over time. For example,
a can of com may have a shelf life of one year. If it is not purchased today, it may be
purchased tomorrow, or perhaps next week. Services cannot be stored. If the service is
not sold on one day, the inventory of that service is gone forever. For example, a hotel
room can be sold for one day at a time. If the room is not occupied tonight, we lose the
room’s potential revenue for today forever. This highly perishable, irretrievable quality
of services presents a challenge for marketers (Kotler, Bowen, & Makens, 1999).
Additional Three P ’s
Three additional P’s have been proposed for services marketing to accommodate
these four special characteristics. In 1981, Booms and Bitner proposed the additional
three P’s to supplement McCarthy’s Four P’s in the marketing mix (Booms & Bitner,
1992). The characteristics of intangibility, inseparability, variability, and perishability in
services mean that the final product will be influenced by the presence of other people,
the method of production and delivery, and the physical surroundings. The additional
Three P’s, participants, process, and physical evidence, have been proposed to help the
services marketer better manage his or her product.
Participants. Participants are the people who play a part in the service delivery
(Zeithaml & Bitner, 1996). The participants may include service company employees,
the customer purchasing the service, and other customers in the service environment.
Reproduced with permission of the copyright owner. Further reproduction prohibited without permission.

56
Participants will affect the customer’s perception of the service experience.
Employees will affect the customer’s perception through their attitudes, behaviors,
personal appearance, and manner of dress. The area of internal marketing studies the
way that companies market themselves to their own employees. The thought is that if the
employees feel good about working at the company, they will make a good impression on
the customer, thus providing a good service encounter. Other customers also affect the
customer’s perception of the service through their appearance and their behavior inside
the service delivery environment. Customers will feel comfortable in a service
environment if the other customers appear to belong there and act in an appropriate
manner. Customers will draw negative conclusions about the service experience if the
other customers create an unpleasant or negatively incongruous atmosphere.
Process. Process includes “the actual procedures, mechanisms, and flow of activities
by which the service is delivered” (Zeithaml & Bitner, 1996). The process is the series of
steps that the customer must take or negotiate to complete the pinchase and consumption
transaction. The customer is inside the production function and acts as one of the people
who help create the end experience. Processes may fall along a range from simple to
complex.
One basic example of the customer’s involvement in the production process is the
interaction between the customer and a server in a restaurant. The order-taking activity
takes place inside the production facility, as does consumption of the ordered product.
Another aspect, related to the next element, the physical environment, is the fact that in
many restaurants a display kitchen is prominently built into the dining room design. The
customer enters the manufacturing area when he or she enters the dining room. An
Reproduced with permission of the copyright owner. Further reproduction prohibited without permission.
57
example of the customer more actively participating in the production of a service in the
hospitality industry is the involvement of the customer in pouring his or her own
beverages at a fast food restaurant. A task that was once performed by a store employee
is now performed by the customer.
Physical Evidence. The lack of a tangible product results in the customer using cues
from the physical environment to evaluate the service encounter. Cues from the physical
environment include any tangible components inside the service environment such as the
physical facility itself, brochures and letterhead, invoices, repair trucks and employee
uniforms. Other cues include the attire of other customers in the environment. The
customer can use these cues to draw inferences about the company (Zeithaml & Bitner,
1996).
The hospitality industry is very capital intensive and thus relies heavily on the
physical environment to make a statement about what the business does, how it provides
service, the type of clientele that it caters to, and the like. The physical appearance of a
hotel or restaurant will provide an overt indicator of the type of customer it serves and
can either encourage the approach of the targeted customer or encourage avoidance by
the wrong type of customer. Entering a fine dining restaurant will send a different
message about the type of food, service, and pricing than entering a fast-food restaurant.
Services Marketing Research
The research that has predominantly focused on consumer marketing and retailing is
limiting because it focuses on the consumer’s behavior while purchasing tangible goods.
Little research has been conducted that focuses on a services delivery environment.
Reproduced with permission of the copyright owner. Further reproduction prohibited without permission.

58
Early research in examining atmospheric effects in a services environment was
conducted in the area of banking and financial services. Some of this work led to the
study of internal marketing, whereby a company markets itself to its employees (Berry,
1981). Other work examined sectors of the banking and financial services industry to
identify the determinants of perceived service quality (Parasuraman, Zeithaml, & Berry,
1985y
The services industry has been slow to gather empirical data to determine the true
effects of the physical environment on customer behavior. When purchasing goods and
products, the purchaser can touch, handle, taste, smell, or hear the product after leaving
the store environment and can continue to assess the quality of the product long after the
purchase experience is concluded (Parasuraman, Zeithaml, & Berry, 1985). However,
the lack of a physical product in the services industry results in the need for the physical
environment in which the service is delivered to become a “tangibilizing” element to lend
tangibility to the service (Kotler, Bowen, & Makens, 1999).
Theoretical Framework for the Study
The proposed study was developed based on Bitner’s (1992) Servicescapes
framework. The proposed models for this study may be found in Figures 2 through 5.
The study used an experimental design to test whether ambient odor had an effect in
facilitating affiliation behaviors, social interactions, affiliative interactions, and focus
group output. This study was designed in response to several calls by researchers such as
Bitner (1992), Aubert-Gamet and Cova (1999), D’Astous (2000), Mitchell, Kahn, and
Knasko (1995), Morrin and Ratneshwar (2000), Sharma and Stafford (2000),
Reproduced with permission of the copyright owner. Further reproduction prohibited without permission.
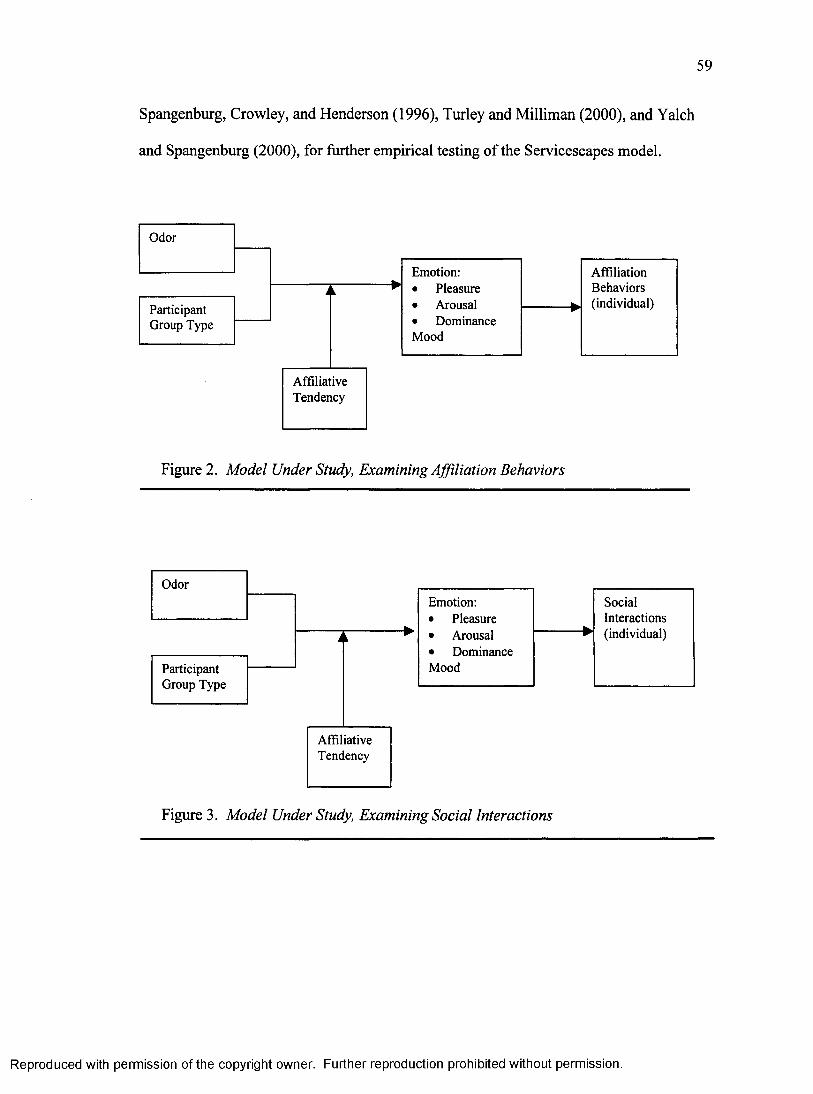
59
Spangenburg, Crowley, and Henderson (1996), Turley and Milliman (2000), and Yalch
and Spangenburg (2000), for further empirical testing of the Servicescapes model.
Participant Group Type
Odor
AffiliativeTendency
AffiliationBehaviors(individual)
Emotion:• Pleasure• Arousal• Dominance Mood
Figure 2. Model Under Study, Examining Affiliation Behaviors
Odor
Participant Group Type
AffiliativeTendency
SocialInteractions(individual)
Emotion:• Pleasure• Arousal• Dominance Mood
Figure 3. Model Under Study, Examining Social Interactions
Reproduced with permission of the copyrighf owner. Further reproduction prohibited without permission.

60
Odor
Participant Group Type
AffiliativeTendency
Emotion:• Pleasure• Arousal• Dominance Mood
Affiliative Interactions (Affiliation Behaviors + SocialInteractions)(individual)
Figure 4. Model Under Study, Examining Affiliative Interactions
Odor
Participant Group Type
Focus Group Output(number o f suggestions, per group)
Figure 5. Model Under Study, Examining Focus Group Output
Bitner (1992) and Aubert-Gamet and Cova (1999) call specifically for further study of
social interactions and approach/avoidance behaviors in a Servicescape environment.
Theoretical Bases
There are three theoretical bases for this study, all of which are rooted in brain
chemistry research, optimal arousal theory, the dopaminergic theory of positive affect,
and the effect of mere-exposure on cognitive fluency. First, the optimal arousal theory,
(as discussed by Kahneman, 1973; Kardes, 1999; and Mehrabian and Russell, 1974),
suggests that there is an optimal level of arousal, or neurological and physiological
Reproduced with permission of the copyright owner. Further reproduction prohibited without permission.

61
activity, to achieve a certain goal. The optimal arousal concept is graphically represented
following an inverted U-shaped curve function, where a state of moderate arousal will
increase attention (and then affect, as explained below as part of the dopaminergic theory
of positive affect) for other objects in an environment, including people. This represents
the top of the inverted U-shape. The two lower tails of the U-shape represent the reduced
level of attention that is present under very low and very high arousal conditions.
Optimal arousal theory plays a role in this study because the introduction of the
pleasant ambient scent was intended to stimulate positive arousal in the study’s
participants. The expected consequence of this positive arousal was that the participants
would exhibit more affiliation and social interaction behaviors.
The second theoretical basis for the study, the dopaminergic theory of positive affect
proposed by Ashby, et al. (2002), suggests that an increased positive arousal state leads to
neurotransmitters, particularly dopamine, being release to the frontal cortex. This area
activates neurons that create a “happy” or “liking” feeling. The intent of the introduction
of the pleasant ambient scent into the experimental environment in this study, then, was
to increase the positive arousal levels which would stimulate the brain chemical reaction
to create positive affect. Since feelings, such as affect, can be highly transient, or easily
transferred to other objects in the environment (Kardes, 1999), then it was expected that
the positive feelings would be transferred onto the other people in the waiting room and
would prompt affiliation and social interaction among the participants.
Finally, the mere-exposure effect, proposed by Zajonc in 1968 (as cited in
Winkielman, et al., 2002; Kardes, 1999) suggests that a prior exposure to some stimulus
increases liking for the stimulus. Winkielman, et al. (2002) conducted research that
Reproduced with permission of the copyright owner. Further reproduction prohibited without permission.

62
offers several possible explanations for this phenomenon. They believe that the brain
secretes neurotransmitters such as dopamine, serotonin, and acetylcholine to provide a
type of reward response to the cognitive processes when a person encounters a familiar
stimulus. The familiarity leads to cognitive “fluency”, or ease of processing the
information presented by the stimulus. It is thought that the reward response is a positive
response to recognizing something familiar, resulting in the brain not having to process
new information about a novel stimulus that might be potentially dangerous.
In this study, the intent was to provide a mere-exposure situation for the study’s
participants. As the participants had time to occupy the same space together, they were
exposed to each other and were able to become familiar with each other. This exposure
was intended to serve two purposes: 1) to increase the liking and then affiliative
interactions among the participants, and 2) to increase familiarity and liking with the
participants, thus allowing them to focus on other types of tasks when in the actual focus
group session that followed the waiting room period. If the addition of the scent to the
experimental environment increased affect for the situation and others in the situation,
then participants would produce more output in the focus group.
Dependent Variables
The four dependent variables that were selected to examine group differences are
affiliation behaviors, social interactions, affiliative interactions, and focus group output.
The first two variables are described as two distinct types of behaviors by such
researchers as Mehrabian and Russell (1974), Mehrabian and Diamond (1971), Bitner
(1992), and Birdwhistel (1970). However, because affiliation and social interaction
behaviors appear to be very closely related and are sometimes only placed in a particular
Reproduced with permission of the copyright owner. Further reproduction prohibited without permission.

63
category based on some measure of distance between the subjects (Hall, 1976), the third
dependent variable, “affiliative interactions”, was developed by combining the total
observed incidences of affiliation behaviors and social interactions for each study
participant.
The fourth variable, focus group output, was examined on a per-group basis. The
total number of suggestions generated by each focus group were compared for
differences between groups. While this results in a small sample size, reducing the
statistical power of the experiment, it seemed prudent to explore the production aspect of
the meeting to begin to understand the practical implications for the world of business
management.
In closing, greater familiarity and liking (affect) for others in a situation would be
beneficial to the hospitality industry that depends heavily the physical environment and
its employees to generate goodwill, loyalty, and repeat business from customers, which
should be the goals of all businesses (Shoemaker & Lewis, 1999; Bowen & Shoemaker,
1998). Chapter 3 discusses the methodology that was used to test the concepts discussed
above.
Reproduced with permission of the copyright owner. Further reproduction prohibited without permission.

CHAPTER 3
METHODOLOGY
Overview of Research Questions
Two primary questions were posed in this study.
Research Question 1 ; Does the physical environment, specifically, the ambient scent,
impact the social interactions between strangers in a focus group waiting room
environment?
Research Question 2: Does the physical environment affect the interactions and
contributions of participants during a focus group session?
To answer these questions, four propositions were proposed in this study.
PI : The presence of a pleasant ambient scent in the focus group waiting room will
increase the number of Affiliation behaviors exhibited by focus group participants.
P2: The presence of a pleasant ambient scent in the focus group waiting room will
increase the number of Social Interactions that will be initiated by focus group
participants.
P3: The presence of a pleasant ambient scent in the focus group waiting room will
increase the combined number of affiliation behaviors and social interactions, or
Affiliative Interactions, exhibited by focus group participants.
64
Reproduced with permission of the copyright owner. Further reproduction prohibited without permission.

65
P4: The presence of a pleasant ambient scent in both the focus group waiting room
and in the focus group room itself will increase the number of contributions that will be
generated by focus group participants, i.e., Focus Group Output, during the actual focus
group session.
Research Design
A quasi-experimental design was used in this study. The study tested a methodology
for examining behavior in an environment that has not been studied in the past. The
study examined the effects of two levels of ambient scent manipulation - the presence of
a pleasant ambient scent and the absence of the added ambient scent — on two types of
slot machine players.
Four dependent variables were under consideration in this study. The first was
number and type of observed affiliation behaviors. The second was the number and type
of social interactions that were observed. The third was the total quantity of affiliation
behaviors and social interactions combined, which will be henceforth referred to as
Affiliative Interactions. The fourth dependent variable was the number of
contributions/opinions that focus group participants made during the focus group session
that followed the observation period.
Several covariates were also under consideration as moderators or mediators of
observable behaviors. These covariates included the emotions of pleasure, arousal, and
dominance; the subjects’ need for affiliation; the subjects’ mood after exposure to the
treated/untreated environment; and three demographic measures. The dimensions
examined in this study are summarized below in Table 2.
Reproduced with permission of the copyright owner. Further reproduction prohibited without permission.
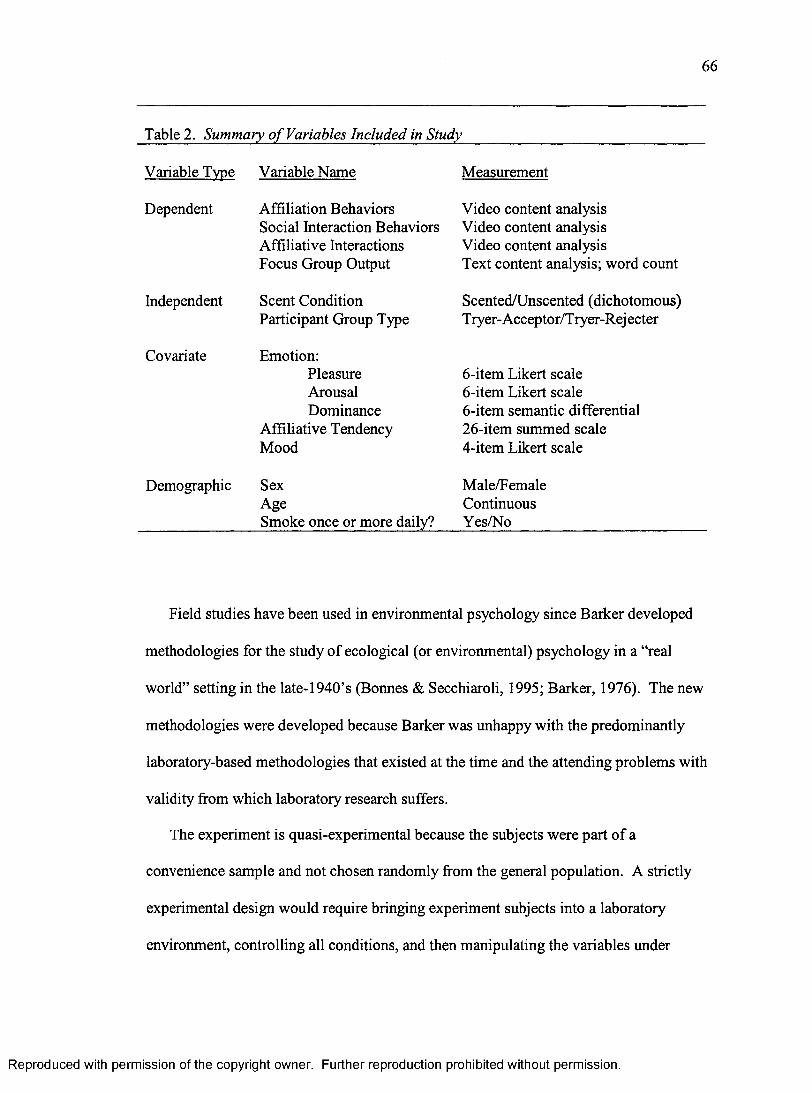
66
Table 2. Summary o f Variables Included in Study
Variable Tvne Variable Name Measurement
Dependent Affiliation Behaviors Social Interaction Behaviors Affiliative Interactions Focus Group Output
Video content analysis Video content analysis Video content analysis Text content analysis; word count
Independent Scent Condition Participant Group Type
Scented/Unscented (dichotomous) T ryer-Acceptor/T ryer-Rej ecter
Covariate Emotion:Pleasure Arousal Dominance
Affiliative Tendency Mood
6-item Likert scale 6-item Likert scale 6-item semantic differential 26-item summed scale 4-item Likert scale
Demographic SexAgeSmoke once or more daily?
Male/FemaleContinuousYes/No
Field studies have been used in environmental psychology since Barker developed
methodologies for the study of ecological (or environmental) psychology in a "real
world” setting in the late-1940’s (Bonnes & Secchiaroli, 1995; Barker, 1976). The new
methodologies were developed because Barker was unhappy with the predominantly
laboratory-based methodologies that existed at the time and the attending problems with
validity from which laboratory research suffers.
The experiment is quasi-experimental because the subjects were part of a
convenience sample and not chosen randomly from the general population. A strictly
experimental design would require bringing experiment subjects into a laboratory
environment, controlling all conditions, and then manipulating the variables under
Reproduced with permission of the copyright owner. Further reproduction prohibited without permission.

67
consideration (Cooper & Schindler, 1998). A true experimental design provides greater
reliability than a quasi-experimental design because the sample is a true random sample.
However, experimental studies conducted under laboratory conditions generally have
lower external validity, due to the artificiality of the laboratory environment. In addition,
budgetary constraints made obtaining a truly random sample prohibitively expensive in
this instance.
Each of the variables and covariates are discussed next.
Independent Variables
Two independent variables, ambient scent condition and participant group
membership, were under consideration in this study. The first variable was the ambient
scent condition of the room, a dichotomous independent variable. The treated-condition
groups met in a room with a pleasant scent added and the control groups met in an
unscented room. The selection of this variable, ambient scent, answers the call for
further research on ambient scent in the field of atmospherics research (Gulas & Bloch,
1995; Baron, 1990; Bitner, 1992; Spangenberg, Crowley, & Henderson, 1996). In
addition, this variable is interesting because most of the research done in the past has
examined ambient scent in a retail or consumer products environment or in a cognitive
psychology context. No past research was located that shows the effect of ambient scent
on a services environment or social interactions in meetings or focus group situations.
The selection of an ambient scent for the waiting room was affected by three factors -
pleasantness of the scent, the novelty of the scent, and the intensity of the scent. Most of
the literature reviewed indicated that floral scents are usually considered to be pleasant,
rather than neutral or unpleasant (Gulas & Bloch, 1995; Morrin & Ratneshwar, 2000).
Reproduced with permission of the copyright owner. Further reproduction prohibited without permission.

68
The novelty, or unfamiliarity or unexpectedness, of the scent assists in creating and
increased state of arousal. The increased arousal condition occurs because the novel
stimulus cues the individual that some environmental condition does not match
expectations. Attention is increased attention in the situation, as is brain activity to
process the novel data (Morrin & Ratneshwar, 2000; Ashby, et al., 2002, Winkielman, et
al., 2002). A positive arousal state can lead to increased positive affect, as Morrin and
Ratneshwar (2000) found in product evaluation in a pleasantly scented environment. The
intensity of ambient scent is crucial to control (Gulas & Bloch, 1995) because too light a
scent will not be noticed by the individuals in the environment, while too intense a scent
has been found to be negatively arousing (Mehrabian & Russell, 1974; Gulas & Bloch,
1995, Morrin & Ratneshwar, 2000). The procedure used to control the intensity of the
scent is discussed in the Procedures section of this chapter.
Morrin and Ratneshwar’s (2000) study on the effect of ambient scent on memory and
remembering familiar and unfamiliar brands found that a pleasant ambient scent might
improve memory, in part through an encoding effect. The scent found by study
participants to be the most pleasant was geranium, which was rated higher than lavender,
rosemary, or eucalyptus. Essential oil of geranium was used in this study.
The second independent variable was specified by the sponsor of this study. The
sample participants were casino patrons who have played a particular slot machine game
in the past. This variable was also dichotomous, the levels of which were determined by
frequency of use of the slot machine used as the topic of the focus groups. The first
group consisted of people who have played the game, like it, and continue to play it
Reproduced with permission of the copyright owner. Further reproduction prohibited without permission.

69
frequently. The second group consisted of those people who have played the slot
machine but either do not like it, or have decreased their frequency of play.
Dependent Variables
Four dependent variables were measured in this study: 1) the number of Affiliation
Behaviors observed; 2) the number of Social Interactions observed; 3) the combined total
affiliation behaviors and social interactions, i.e., Affiliative Interactions; and 4) the gross
number of contributions that each focus group generated during the focus group sessions,
referred to henceforth as Focus Group Output.
Affiliation Behaviors. Bitner’s (1992) Servicescapes model has two outcomes listed
for the Servicescape - approach/avoidance behaviors and social interactions among and
between employees and customers. Affiliation behaviors fall into the
approach/avoidance category as examples of approach behaviors (Mehrabian & Russell,
1974; Mehrabian, 1980; Bitner, 1992). Bitner and others call for further research into
how the environmental atmosphere or Servicescape affects behavior and this model tests
the effect of ambient scent on affiliation. The list of potential affiliation behaviors that
will be counted are included in Appendix C, the training manual used to train the expert
judges of the videotaped in this study.
Social Interactions. Social interactions are also an outcome of the Servicescapes
model (Bitner, 1992). This study examines the number and type of social interactions
that are visually observed during the focus group’s time in a waiting room to ascertain if
the ambient scent variable has a measurable effect on the propensity to initiate and
engage in social interaction. The list of social interaction behaviors that were counted is
Reproduced with permission of the copyright owner. Further reproduction prohibited without permission.

70
included in Appendix C, the training manual used to train the expert judges of the
videotaped in this study.
Affiliative Interactions. While Mehrabian and Russell (1974), Bitner (1992), and
Mehrabian and Diamond (1971) discuss affiliation behaviors and social interactions as
two distinct types of behavior, other researchers, such as Festinger, Schachter, and Black
(1963) and occasionally, Mehrabian (1970) himself, view both types as being the same.
The Affiliative Interactions measure used in this study is the sum of each participant’s
affiliation behaviors and social interaction behaviors, as observed and reported by the
expert judges used in this study.
Focus Group Output. This dependent variable study is the quantity of information
that each focus group generated during the focus group session following the observation
period in the waiting room. This examines whether the presence of the ambient scent had
a statistically significant effect on focus group output.
Covariates
There were three potential covariates in this study - emotion, affiliative tendency, and
mood. The purpose of covariate measurement is twofold: “to eliminate some systematic
error that is outside the control of the researcher that can bias results and to account for
differences in the responses due to unique characteristics of the respondents” (Hair,
Anderson, Tatham, & Black, 1998, p. 346). These covariates were measured through a
survey that was administered after the participants spent 15 minutes in the waiting room
environment. Each covariate will be discussed in turn.
Emotion. The emotion dimension of internal responses in Bitner’s (1992)
Servicescapes framework is under consideration as a covariate in this study because it has
Reproduced with permission of the copyright owner. Further reproduction prohibited without permission.

71
been used extensively in past research (Mehrabian, 1980; Mehrabian & Russell, 1974;
Bitner, 1992, Morrin & Ratneshwar; 2000, Machleit & Eroglu, 2000; Sherman, Mathur,
& Smith, 1997). The emotion dimension consists of three factors - pleasure, arousal, and
dominance. It has been used in the past to measure the emotional response to a physical
space. The three dimensions of emotion were used as covariates in this study because
group differences were examined and past research indicates that the subjects’ behaviors
can be affected by their emotional reactions to the treatment space. Morrin and
Ratneshwar (2000) examined their subjects’ current feelings of pleasure, arousal, and
dominance after the subjects entered the scented/unscented room but immediately before
beginning the experimental treatment conducted in their study. This study examined
these emotional responses to the waiting room for the participants in the focus group to
control for emotion while examining the behavior in the environment.
Affiliative Tendency. The need to examine affiliation and social interaction behaviors
led to the need to control for the subjects’ affiliative tendency. It is possible that the
people who agree to participate in the focus group have a greater tendency to engage in
social situations than the normal population. This situation also provides the opportunity
to determine if the presence of the pleasant ambient scent increased the actual affiliative
behaviors displayed by the participants.
Mood. Bitner (1992) proposes mood as a moderating variable for individuals in
forming emotional responses to the perceived Servicescape. Mood is a transient state and
affects the individual’s behavior within the environment. Mood is characterized by
Wessman (1979) as “shifting yet pervasive emotional feeling states of varying duration -
usually not as intense nor as clearly related to a specific provoking object or situation as
Reproduced with permission of the copyright owner. Further reproduction prohibited without permission.

72
is the case with a fully developed emotion” (Wessman, 1979, p. 74). According to
Ashby, et al.’s (2002) dopaminergic theory of positive affect, arousal conditions that
induce positive affect (or mood) are likely to increase positive arousal. The addition of
ambient scent in this study was intended to induce positive affect and arousal in the
participants. Mood is a part of the spectrum of emotions, but was examined separately in
this study. This study included questions about current mood to control for possible
covariation with behavior, to control for differences between groups.
Demographics
Three demographic variables are examined in this study. Sex is examined as a
covariate in this study because of prior research indicating that there is a significant
difference in odor identification between the sexes. The study also examines whether
participants smoke tobacco products once a day or more often and the participants’ ages.
Control Variables/Conditions
This study did not occur in a laboratory setting, but all care was taken to provide an
identical environment for all groups. Environmental variables that were controlled
include the layout of the semi-fixed objects (i.e., furniture) within the waiting room,
lighting levels, temperature, ambient sound, and the focus group moderator who was
blind to the treatment conditions.
Collection of Data
The experiment was conducted in the Stan Fulton Building on the campus of the
University of Nevada, Las Vegas. Two adjacent rooms were used, the first as a waiting
area and the second for the actual focus group session. The focus group participants
Reproduced with permission of the copyright owner. Further reproduction prohibited without permission.
73
entered the waiting room area that was either scented or not scented prior to the
participants’ arrival. The participants were then told that the focus group moderator was
running a few minutes late and they would have to wait for a few minutes. Their
behavior was observed via a camera that recorded visual information only.
When the fifteen-minute period ended, participants completed the preliminary survey
and then moved to the focus group room, where the focus group session commenced.
The fifteen-minute period was selected for this study because it was long enough for the
formation of social interactions but not so long that the participants became irritated and
then perform poorly in the actual focus group session. The participants completed a
second survey at the conclusion of the focus group session to determine whether the
ambient scent was detectable.
The topic of the focus group was the participants’ attitudes, beliefs, awareness, and
usage of a particular knowledge-based slot machine game. A local gaming machine
manufacturing company, the sponsor of the study, provided the topic and the participants’
incentives. The amount of data generated during the focus groups is the only information
relevant to this study. The actual information about the slot machines is proprietary and
confidential and, as such, will not be discussed in this study.
The survey data were entered into SPSS® 11.0, a computer application package for
statistical analysis, and analyzed. The data obtained via videotape were analyzed using
observational techniques from three judges, who tracked the participants’ behaviors
through the waiting period. The qualitative information was analyzed for intequdge
agreement and then quantified for use in the statistical analysis. In addition, the
videotaped focus group sessions were transcribed by a professional transcriptionist. The
Reproduced with permission of the copyright owner. Further reproduction prohibited without permission.

74
transcripts were content analyzed and the number of contributions was quantified for
each session. The data were analyzed using the analysis of variance (ANOVA)
technique. Each component of the procedure will now be discussed in detail.
Ambient Scent Condition
The waiting room was either scented or unscented. The scented condition was
created by applying two-to-three drops of essential oil of geranium to pieces of blotter
paper and fastened to the bottoms of the square tables in the waiting room. The same
procedure was conducted in the focus group room. The scented rooms were aired out for
a minimum of two days before the next unscented session took place.
In addition, the post-session survey completed by the focus group participants
consisted of questions asking if the participants noticed anything special about the
waiting room and the focus group room. Their answers were intended to determine if the
intensity of the scent was perceptible, imperceptible, or too strong.
Survey #1
A survey was used to gather demographic data and to measure the covariates in this
study. The survey was completed after the 15-minute period spent in the waiting room.
Informed Consent, as approved by the University of Nevada Las Vegas’ Office for the
Protection of Research Subjects, was provided during recruitment of the subjects. The
study participants provided their signed informed consent forms at the beginning of each
session. The participants then completed the preliminary survey.
The preliminary survey instrument was a fifty-one question, paper-and-pencil
questionnaire. The survey was divided into four sections that measured emotion
Reproduced with permission of the copyright owner. Further reproduction prohibited without permission.

75
(pleasure, arousal, and dominance), affiliative tendency, mood, and demographics. A
copy of the survey is located in Appendix A at the end of this document.
The survey questions are scales that have been used in the past to measure emotion,
affiliative tendency, mood, and demographics. The emotion covariates - pleasure,
arousal, and dominance - were measured using scales developed by Mehrabian and
Russell (1974) and Russell and Pratt (1980). The first two components. Pleasure and
Arousal, were measured using modified versions of Meharabian and Russell’s (1974)
scale. The first modifications were by Russell and Pratt (1980), still using a semantic
differential scale but identifying more specific semantic pairs. Baker, Levy, and Grewal
(1992) then converted the semantic differential scales to 6-point Likert-type scales. Their
modification involved selecting the half of the semantic pairs that indicated the
“unpleasant” and “sleepy” qualities of a place in a study that examined some of the
unpleasant characteristics of a retail environment. Baker et al. (1992) tested the two
scales and reported an alpha = .84 for the pleasure dimension and alpha = .80 for the
arousal dimension. These indicate a reasonable level of internal reliability in measuring
these factors.
Baker, et al. (1992) tested for internal validity of the two scales using confirmatory
factor analysis and found the two scales to have higher intra-item correlation than
correlation between the two scales. No further testing of validity was reported. This
study used the same 6-point scale proposed by Baker, et al. (1992), but changed the
unpleasant and sleepy terms into the pleasant and “awake” terms that were proposed by
Russell and Pratt (1980).
Reproduced with permission of the copyright owner. Further reproduction prohibited without permission.

76
The third component, dominance, was measured using the Dominance dimension
scale proposed by Mehrabian and Russell (1974). They tested and refined this scale
many times, and reported an alpha = .88. This again indicates that the items in the scale
are reasonably stable in their measurement. The scale is a semantic differential scale,
with verb descriptor pairs at either end of a continuum. A series of seven blank spaces is
provided where the respondent checked the point where he or she felt that he or she fell
within the range.
The three factors of emotion — pleasure, arousal, and dominance - were developed
by Mehrabian and Russell (1974), based on previous research in mood and perceptual
psychology. Mehrabian and Russell’s (1974) three factors were obtained through factor
analysis. Divergent validity of each factor was verified by the low intercorrelations
between each factor. For example, the factors pleasure and arousal were slightly
negatively correlated (-0.07). Pleasure and dominance were slightly positively correlated
(0.03). Dominance and arousal showed a low positive correlation (0.18). Construct
validity was not reported, possibly because the initial work was based on past research by
others.
The third section of the survey measured the participant’s affiliative tendency. The
scale used in this section was a 26-item scale developed by Mehrabian and Ksionzky
(1974). The instrument uses a 9-point scale, ranging from -4 through +4 and includes 0.
The respondent evaluates each statement presented and indicates his or her agreement
with the statement on the 9-point scale that ranges from very strong disagreement to very
strong agreement. The sum of the respondent’s answers is calculated to obtain a measure
of affiliative tendency. The population mean for the scale is reported, by Mehrabian and
Reproduced with permission of the copyright owner. Further reproduction prohibited without permission.

77
Ksionzky (1974), to be 28. The scores of this study’s participants were compared with
the population mean and then compared between participant groups for group
differences. This scale is reported to have internal reliability coefficient of .80.
Mehrabian and Ksionzky (1974) tested the construct validity of this scale by
administering a separate scale relating to the “flexibility of interpersonal cognitions”
(Mehrabian & Ksionzky, 1974, p. 29, quotations in text) where interpersonal cognitions
are determined by affect. This was essentially a test to insure that the affiliative tendency
scale did not simply report the same information as their sensitivity to rejection scale.
Their goal was to develop a scale that truly measured an individual’s affiliative tendency
aside fi'om his or her desire to avoid rejection. They report a moderately negative
correlation between the affiliative tendency and flexibility of interpersonal cognition
scale (-0.31), which indicates adequate construct validity.
The next dimension measured in the survey was current mood. This was measured
using a four-item scale tested by Boles and Burton in 1992 (Bruner & Hensel, 1992, p.
437-439) that Boles and Burton found to have alpha = .84. They administered the scale
prior to exposing sample subjects to advertising stimuli to test if mood was a predictor of
attitude towards the advertisements presented. It was found not be a significant predictor.
However, for the purposes of this study it was considered prudent to test this dimension
since the scent stimulus might stimulate the subject’s current mood. Again, this decision
was grounded in the dopaminergic theory of positive affect (Ashby, et al., 2002) where a
positive stimulus (here, the ambient scent) increases arousal. Increased states of positive
arousal are likely to stimulate positive affect and mood (Winkielman, et al., 2002). The
instrument uses a 5-point Likert-type scale.
Reproduced with permission of the copyright owner. Further reproduction prohibited without permission.

78
The demographic variables that were explored included gender, age, and whether the
individual smoked tobacco products one time or more per day. The smoking question
was included because smokers often have a decreased ability to perceive odors and this
may moderate their reaction to the pleasantly scented environment.
The results of the data collected in Survey #1 will be discussed in Chapter 4 - Data
Analysis and Results. However, it should be noted at this time that a flaw in the data
collection procedure was discovered after the data had been collected. This inadvertent
oversight in coding the surveys resulted in the inability to link the surveys completed by
the participants with their individual affiliation and social interaction behaviors and focus
group production. This inability to connect the covariate measures to the observed
dependent variables resulted in discarding the survey data for use in an analysis of
covariance. This changed the method of analysis of covariance to analysis of variance.
Survey #2
A second survey was administered at the conclusion of the actual focus group session.
Survey #2 consisted of five statements with which the participant either agreed or
disagreed. The statements are about various conditions of the rooms that the group
occupied. Statements included 1) The lighting was good; 2) The furniture was
comfortable; 3) The room temperature was comfortable; 4) I did not notice the presence
of a scent in the room(s); and 5) I did not notice the presence of any background noise in
the room(s). If the participant disagreed with a statement, they were asked to elaborate
on why they disagreed. The request for elaboration fi'om the “disagree” answers only
was intended to provide brevity in the survey, since it was believed that the participants
would, after two hours in the experimental environment, be fatigued and would also be
Reproduced with permission of the copyright owner. Further reproduction prohibited without permission.

79
eager to collect the $50 incentive and leave the focus group space. The intent of this
series of questions was to determine if the scent intensity in the scented conditions was
too strong.
Videotaped Data
The participants were led into the waiting room as a group and videotaping
commenced as soon as they entered. Participants were not made aware of the presence of
the video camera while in the waiting room. The video camera was positioned at the
ceiling level in a comer to maximize the viewing angle for full room coverage. This
method was used to collect the data in lieu of a human observer in the room. This was
intended to reduce the likelihood that the presence of an observer in the waiting room
would lead to abnormal behaviors by the subjects.
The camera was a tiny “spy” camera, embedded in a computer chip, mounted at the
ceiling of the room. Building conditions prevented running the camera’s cables through
the ceiling to a remote location. The cables were run down the wall and connected to the
VCR that recorded the visual data. The VCR was disguised as an array of audio-visual
equipment that bore a sign indicating that it was to be reserved and used for a training
session for a University group activity.
The participants were informed of the presence of the video camera in the Informed
Consent letter, but the specific presence of a camera in the waiting room was not made.
This was to reduce the likelihood of creating the Hawthorne Effect, identified by
Roethlisberger and Dickson in 1939 (Bechtel & Zeisel, 1979). The Hawthorne Effect
describes the improvement in production that was recorded by a control group that did
not receive the improved lighting treatment in a study in a factory. The control group
Reproduced with permission of the copyright owner. Further reproduction prohibited without permission.

80
knew that the experiment was being conducted and this knowledge, by itself, led to the
increased production rate. This result led the effect that the improved lighting had on the
treatment group to be called into question.
Another principle, the Heisenberg Uncertainty Principle, states that nothing in nature
can be measured without interfering with it in some way (Bechtel & Zeisel, 1979).
Videotaping this study’s subjects in as unobtrusive a manner as possible minimized the
effect that the observation technique had on the focus group participants’ behaviors.
Human Subjects Protocols
Human subjects protocols, as approved by the University of Nevada, Las Vegas’
Office for Sponsored Programs on February 13,2003 (GPRS# 600S0103-027), were
carefully followed. The nature of the observation portion of this experiment led to the
University’s requirement that the subjects be notified in advance that they would be
observed and videotaped. The subjects’ agreement to be videotaped was obtained as a
condition of participation when they were recruited to participate in the focus group
session itself.
The Office for Sponsored Programs also required that the subjects be informed that
they would be potentially subjected to an airborne chemical treatment. The Informed
Consent letter includes a list of chemicals that are used to clean the building, such as
floor wax, window cleaner, and hand soap. This list also includes a variety of air
fresheners. The essential oil of geranium odorant used in this study is listed in this
section.
The portion of the Informed Consent notification that the participant signed and
turned in at the beginning of the experiment required that the participant explicitly agree
Reproduced with permission of the copyright owner. Further reproduction prohibited without permission.

81
to be videotaped and that they had read the list of chemicals. The full Informed Consent
package is included in Appendix B.
Sample Information
The participants in this study were a convenience sample of adult individuals who
were recruited at various commercial casinos in the Las Vegas, Nevada area. The
recruitment process included obtaining permission to be videotaped and screening
potential participants for sensitivity to chemicals. Participants who knew each other
were not allowed to register for the same focus group session, to reduce the likelihood
that individuals in each session would know each other. The intent was to have groups
consisting of strangers, to avoid pre-existing relationships that could affect the
interactions within the group. Finally, the people who agreed to participate in the focus
group were told to not wear perfume, cologne, or other scents on the day of the focus
group. The recruiter explained that the focus group moderator was allergic to perfume
and cologne.
Sample Size Calculation
The original intent of the researcher was to conduct a multivariate analysis of
covariance (MANCOVA). When comparing groups in a cellular design. Hair, et al.
(1998) recommend a minimum of 20 cases per cell. The four-cell design (treatment vs.
non-treatment and participant group type) resulted in the need for at least 80 participants
to obtain the proper sample size for MANCOVA. Tabachnick and Fidell (2001) also
suggest that at least 20 cases per cell for MANOVA or MANCOVA are necessary. A
Reproduced with permission of the copyright owner. Further reproduction prohibited without permission.

82
typical focus group consists of 10-12 participants. A minimum of eight focus groups was
planned to obtain an adequate sample size.
The change in analysis technique from multivariate analysis of covariance to
univariate analysis of covariance does not negatively affect the sample size issue.
MANCOVA is, in fact, a more sensitive statistical method than ANCOVA. The 20 cases
per cell required in MANCOVA provide adequate power for an ANCOVA analysis. The
final analyses used in this study were a series of univariate ANOVA’s, which also had
sufficient statistical power with the 20 cases per cell.
Response rate. The response rate for the survey was 100%, since the participants
completed the survey instrument upon arrival at the focus group location.
Validity
Internal validity is a difficult issue to address when conducting qualitative research.
Research conducted in the field can be highly variable and contain a high degree of
uncertainty due to activities or factors that either are unforeseen or cannot be controlled
by the researcher (Winkel, 1985). The techniques that were used during this experiment
to address validity issues were the attempts to control the various environmental variables
in the waiting room, controlling for moderator differences in the focus group sessions by
using a single moderator for all eight sessions, holding focus group sessions on different
days of the week, and attempting to control the subjects by requesting that they not sign
up for the same focus group session in which a friend or fiiends will participate. Internal
validity in the analysis phase of the study was addressed through a systematic, objective
observation process and the use of three judges to evaluate the videotaped data.
Reproduced with permission of the copyright owner. Further reproduction prohibited without permission.
83
These efforts did not provide complete validity for the study. The inherent problem
of the artificiality of the laboratory setting, which affects external validity, the time of
year for data collection and the use of casino patrons, which effect internal validity,
cannot be overcome. However, the level of both internal and external validity should be
satisfactory for an exploratory study that can be reproduced at a later date in other field
settings and with subjects that fall into more diverse demographic categories.
Treatment of Data
Quantitative Data
The data obtained from the survey instrument were coded and entered into the
statistical analysis computer applications package, SPSS® 11.0. The data were screened
for outliers, and tested to ensure that it did not violate the assumptions of ANOVA:
observations must be independent, variance must be equal among groups, and
distributions are normal (Hair, et al., 1998).
Qualitative Data
The raw data from the videotaped part of the data collection is qualitative. The
treatment of the qualitative data converted it to quantitative data, through the observation
and tracking techniques that are described below. Categories of behaviors were
developed, following guidelines that are provided in Appendix C. The number of
occurrences for affiliation, social interaction, and affiliative interactions behaviors was
tabulated on an individual basis, and then entered into the SPSS® 11.0 database as
dependent variables.
Reproduced with permission of the copyright owner. Further reproduction prohibited without permission.

84
Analyzing the Videotape
The technique that was used to analyze the videotape data in this study was a tracking
technique called “behavioral mapping” (Bechtel & Zeisel, 1987). Behavioral mapping is
an observational method derived from early research conducted in a hospital psychiatric
ward (Rivlin & Wolfe, 1976). Winkel and Sasanoff (1976) recommend this “tracking”
technique for determining overall traffic patterns, measuring distances, and determining
differences between different time periods.
There are five essential elements in the behavioral mapping technique:
1. A graphic rendering of the space to be observed;
2. A clear definition of the human behaviors observed, counted, described, or
diagrammed;
3. A schedule of repeated times during which the observation and recording take
place;
4. A systematic procedure followed in observing;
5. A coding and counting system, which minimizes the effort required in recording
observations. (Bechtel & Zeisel, 1987).
Step One: Graphic Rendering. The first step in behavioral mapping is to create a map
that is drawn-to-scale of the space where the behavior will be observed (Bechtel &
Zeisel, 1987). The observer watches behavior in the space and makes notations on the
map of types and frequencies of behaviors, duration, and people involved in the behavior.
A scale drawing of the waiting room appears in Appendix C, the training guide for
the observers. The drawing includes the location of the furniture and any other semi
Reproduced with permission of the copyright owner. Further reproduction prohibited without permission.

85
fixed features present in the room. The drawing was provided to the observers to assist in
mapping the location of the behaviors and movement within the room.
Step Two: Definitions o f Behaviors. A critical point in behavioral mapping is to
generate, a priori, categories of behaviors that are to be specifically observed (Bechtel &
Zeisel, 1987). Ittelson, Rivlin, and Proshansky (1976) suggest that the behavior
categories “must be explicit, precise, and relatively narrow, and in addition, relevant to
the particular problem under consideration (p. 341).” However, no matter how precisely
the categories are defined, it is likely that they will change during the observation or will
have behaviors added or deleted. Ittelson, et al. (1976) refer to a study of a family’s
household bathroom where the normally expected behaviors occurred as well as
unexpected behaviors, such as using the bathroom as a “private telephone booth and as a
refuge from family quarrels”(p. 341). This extended the list of behaviors beyond what
was established a priori. The behavioral maps are empirical data, where data are obtained
through observation.
Three general categories of behaviors were set a priori for this study. The behaviors
that were tracked in the Waiting Room Environment were affiliation (for positive
affiliative behavior), avoidance (for negative affiliation behavior) and social interaction.
The two affiliative behaviors — affiliation and avoidance — were suggested by Mehrabian
and Ksionsky (1974). They indicate that affiliation includes initiation of conversation,
but do not suggest that continuing conversation is affiliation. There is reference to
continued conversation as a social interaction. The separate categories of affiliation and
social interaction were suggested by Bitner (1992). The behavior in the Focus Group
Reproduced with permission of the copyright owner. Further reproduction prohibited without permission.

86
Room did not require behavioral mapping and only involved counting contributions from
focus group members, as listed in the typed transcripts of the sessions.
Step Three: Schedule o f Behaviors. The observations were taped at approximately
the same time of day or evening. The videotape observers set their VCR’s to “0:00:00”
at the beginning of each taped session and recorded the elapsed time shown when
behaviors occurred. This provided a schedule to calculate the frequency and duration of
the exhibited behaviors.
Step Four: Systematic Procedure for Observing. A training manual, which appears in
Appendix C, was developed and used to train the videotape analysis judges. Each judge
was trained by reviewing the manual, then practicing identifying behaviors that were
shown on the videotapes. Eight judges were recruited and three different judges viewed
each tape.
Step Five: Coding System. This requires identification of the categories of behaviors
that are going to be observed. Two categories used in this study were derived from
Bitner’s (1992) Servicescapes framework - affiliation (positive and negative) and social
interaction. Examples of behaviors that might be exhibited by the study’s participants
are provided in the Training Manual in Appendix C. Whereas Step Two involved
defining categories of behaviors and examples of such behaviors. Step Five involves
assigning specific codes to the behaviors. A coding system to categorize behaviors that
were observed into the appropriate category was developed, using examples of behaviors
suggested by Mehrabian and Russell (1974), Bitner (1992), and Birdwhistel (1970). The
number of incidences of each behavior was counted, for use as dependent variables in the
statistical analysis.
Reproduced with permission of the copyright owner. Further reproduction prohibited without permission.

87
In addition, as a less subjective measure of focus group productivity, the focus group
transcripts were used to obtain a word count from each of the focus group sessions.
While this is not a measure of the quality of the focus group production or the actual
quantity of suggestions, it does indicate the amount of discussion that occurred.
Judges/Observers
The proposed study required a minimum of three judges (Malin, 2002; Personal
Communication, LeAnn Putney, December 3, 2002) to observe the videotaped data and
perform the behavioral mapping techniques. The judges were recruited among graduate
students in the University of Nevada, Las Vegas’ Educational Psychology and Sociology
departments. Each judge had previous coursework in qualitative analysis and content
analysis techniques. Although six judges were required, eight judges were recruited to
provide a buffer against incomplete work or poor analysis. Each judge viewed four
videotaped waiting room sessions, resulting in each session being analyzed by three
independent judges. The data provided by one judge were discarded due to low quality.
The data generated by three judges for each session were retained for analysis.
The judges were trained between April 5 and April 17,2003. The training manual
that is included in Appendix C of this document was used during training. A one-hour
training session was conducted, during which anywhere from one to four judges were
trained. The training included an overview of the training manual and procedures,
followed by analysis exercises where the judges viewed portions of videotaped sessions
and then practiced the content analysis to be performed. Question and answer periods
helped to clarify actions that were exhibited on the tapes and the procedures for recording
the actions.
Reproduced with permission of the copyright owner. Further reproduction prohibited without permission.

88
The training manual was developed to assist the expert judges in observing the types
of behaviors targeted in this study. Although each judge was recruited through two
academic departments at the University of Nevada, Las Vegas and had taken at least one
course in qualitative methodology that included experience in participant observation,
guidelines were provided to insure that the judges focused on the right categories of
behaviors. The procedures were developed using some of the guidelines recommended
by Spradley (1980), who offers a detailed, step-by-step procedure for organizing,
conducting, analyzing, and reporting ethnographic studies. Although Spradley
emphasizes the spoken communication aspects of the subjects under observation, as well
as the observer as a participant in the observation environment, there are numerous
techniques that he either recommends specifically for behavior observation or that can be
adopted from observations of speech.
While Spradley’s (1980) method generally leads to the construction of generated
categories or domains, this study is a focused observation, where the types of behaviors
to be observed and recorded are established a priori, based on previous research and
theory. The purpose of this study is not to examine all potential cultural aspects of a
group, but is limited to examining behaviors of positive affiliation. This study used non
participating observers. The manual and training sessions prepared the observers to
complete the videotape content analysis by providing guidance in four areas. First, the
observers were trained in exercising explicit awareness of each of the study subjects and
their actions. Second, the observers were offered guidance in introspection. In this
situation, the observers exercised care in interpreting the subjects’ behaviors without
making assumptions or inferences regarding the causes of the behaviors. Third, a
Reproduced with permission of the copyright owner. Further reproduction prohibited without permission.

89
detailed record-keeping system was provided and training was offered in how to comply
with the recording requirements. This is related to the fourth and final area, field notes.
The record-keeping system used in this study made use of a “condensed account” of
behaviors observed in the videotapes (Spradley, 1980, p. 69).
The training manual for the session was also developed in accordance with the five-
step guidelines suggested by Bechtel and Zeisel (1987), that were presented earlier. The
activities that delineated the affiliation and social interaction behaviors were adapted
from information provided by Mehrabian and Russell (1974), Bitner (1992), and
Birdwhistel (1970).
The development of a manual to train observers was also influenced by the
researcher’s own experience. The researcher has fifteen years of experience in facilities
management, service operations management, technical project sales, and other sales.
This past experience required training staff to observe the environment and its occupants
in a systematic, detailed manner.
The judges noted their observations on the forms provided, as shown in Appendix C.
The researcher reviewed the data provided by the judges and then coded each behavior
into an appropriate category. The form provides a space to calculate the total number of
incidences of each type of observed behavior for each focus group member.
The data obtained from the judges were analyzed for reliability. The formula for
inteijudge reliability used by Smith and Houston (1985) is:
\ + { N - \ ) * A
where A = average inteijudge agreement and N = the number of judges. Three judges
were used for each taped session. The inteijudge agreement calculation is as follows:
Reproduced with permission of the copyright owner. Further reproduction prohibited without permission.

si<j
90
2Mij m + nj
A = 1
N { N - \ ) / 2
where Mij = number of coding decisions upon which there is agreement between judges i andj
N = number of judges nj = number of coding decisions by judge i
^ 2 M i 2 2 M 23 2 M i 3 ^ + + _____Ml 4-M2 «2 + M3 Ml + M3y
[(3 * 2)12]
Two types of disagreement can occur between judges. The first is a clerical-type
error made by one of the judges when he or she coded the incident incorrectly. The
second type of error is a disagreement between two or more judges. The treatment of low
inteijudge agreement in this study will be discussed in the next chapter, Data Analysis
and Results.
Statistical Methods
This study involved two, dichotomous independent variables and four continuous
dependent variables. The study examined group differences between the treatment and
control groups, but did not attempt to predict group membership. Each dependent
variable was examined separately, due to an expected high correlation between three of
the variables. Affiliation Behaviors, Social Interactions, and the combined dependent
variable, Affiliative Interactions. The fourth dependent variable. Focus Group Output,
was measured at the group level rather than at the individual level and therefore was
tested separately.
Reproduced with permission of the copyright owner. Further reproduction prohibited without permission.

91
In addition, several covariates had been included to control for extraneous factors
when examining the dependent behavior variables. The use of two, dichotomous
treatment independent variables lends a factorial design to the study. However, as stated
earlier, it was necessary to discard the covariates from the analysis due to a data
collection error. The final method for analysis was a 2 x 2 factorial analysis of variance
(ANOVA).
According to Hinkle, Wiersma, and Jurs (1998), the general formula used to state
analysis of variance is;
= A + «y + A + W y * + ^ijk
where:
A p = the number of behaviors exhibited by the rth subject in the yth row and the
Ath column
p = the grand mean of the population
Oj = (p j. - p), the effect of being in a particular level of the first independent
variable
Pk = (pk. - p), the effect of being in a particular level of the second
independent variable
(ap)jk = {(p jk - p) - [(p j. - p) + (p k- - p)]} = (p jk - P j. - P k- + p), the interaction
effect of being in a particular j and k combination after the main effects have been
considered
eijk = random error associated with the number of behaviors exhibited
The data analysis first looked for interaction effects between the two control
variables, followed by an examination of main effects, when warranted by the interaction
Reproduced with permission of the copyright owner. Further reproduction prohibited without permission.
92
effects analysis. The results of these analyses will be discussed in the next chapter. Data
Analysis and Results.
Reproduced with permission of the copyright owner. Further reproduction prohibited without permission.

CHAPTER 4
DATA ANALYSIS AND RESULTS
Introduction
This chapter will discuss the processes used to analyze the data and the results. It
begins with an overview of the sample characteristics, then reviews the procedures used
to determine suitability of the data for inclusion in the analysis. The discussion then turns
to the analyses used to test the hypotheses proposed in this study. Before the discussion
of the analysis and results, the following is a review of the research questions posed in
this study:
Research Question 1 : Does the physical environment, specifically, the ambient scent,
impact the social interactions among strangers in a focus group waiting room
environment?
Research Question 2: Does the physical environment affect the contributions of
participants during a focus group session?
Sample Results
The intent for the study was to have an ultimate sample size of 80. However, to
compensate for possible cancellations and no-shows at the sessions, the focus groups
were over-recruited. The goal was to have a minimum of 13 people per session recruited.
93
Reproduced with permission of the copyright owner. Further reproduction prohibited without permission.

94
which included a 30% excess sample size to account for drop-outs. However, it was not
always possible to recruit 13 individuals for each group. In addition, the drop-out rate
occasionally exceeded 30%. A total of 101 signed up for focus groups and 77 people
actually participated, resulting in a 76.24% participation rate.
A summary of the three demographic variables that were measured appears below in
Table 3. The table also includes demographic data obtained from the Las Vegas
Perspective 2002, a survey of the population and business environment in the Las Vegas,
Nevada area that is conducted on a biennial basis. Information on smoking incidences
was also collected from the American Cancer Society (2003) for comparison reasons.
This information is presented in Table 3 to provide a comparison between the study
sample and the overall local population.
Table 3. Sample Characteristics and Comparison with Local Population
PopulationStudy Sample Comparison
Sex (m = 76)Male 34 44.7% 4T3%4*)Female 42 55.3% 52.7%
Age {n = 74)Mean 53.8 years N/AMedian 58.0 years 46.3 yearsRange 2 3 -8 1 years N/A
Smoke tobacco products once or more daily? {n = 76)19 25T^& IWnn:
Women: 21%No____________57_______ 75.0%___________________________
Notes: (a) Las Vegas Perspective 2002. (2002). Las Vegas, NY: Metropolitan Research Association.(h) Cancer fac ts and figures 2003. (2003). Atlanta, GA: American Cancer Society, Inc. Retrieved June 3, 2003, from http://www.cancer.org/downloads/STT/CAFF2003PWSecured.pdf
Reproduced with permission of the copyright owner. Further reproduction prohibited without permission.

95
Although this study had a higher percentage of women and fewer men than the overall
Las Vegas population, the difference was not statistically significant {'£ = .842). The
study’s sample was also somewhat older than the local resident population. The
percentage of participants who smoke once or more daily was similar to that of the
general population.
Table 4 below summarizes the results of the part of the survey administered to the
focus group participants at the conclusion of the actual focus group. The questions were
intended to determine if the scent levels were too intense in the experimental and focus
group environments.
Table 4. Post-Test Survey o f Environment
Question {n = 76) Agree Disagree If you disagree, why?
The lighting was good. 76 0
The furniture was comfortable. 76 0 “Could be better” (1)
The room temperature was comfortable. 74 2 “A little warm” (2)
I did not notice presence of a scent in the room(s). 74 2 “Not overpowering” (1)
1 did not notice the presence of any background noise in the room(s).
64 12 Noise from slot machines (7) Outdoor noise (3)Air handling fan (1)
Two respondents reported noticing the presence of a scent in the environment. One
respondent in one of the scented condition groups indicated that while he or she did
Reproduced with permission of the copyright owner. Further reproduction prohibited without permission.

96
notice a scent, it was “not overpowering”. The other respondent who reported noticing a
scent was in an unscented condition group.
Inteijudge Agreement
The reliability of the content analysis performed by the independent expert judges
was assessed using the formula shown previously in Chapter 3. The formula is
essentially a weighted-average type formula. The data used in the formulae were the
number of incidences of affiliation behaviors, social interaction behaviors, and the
combined variable, affiliative interactions, that were observed and recorded by each
judge. Avoidance behaviors data were also collected and appear in the raw data located
in Appendix D, but are not included in this analysis. An example of the calculation of the
calculation of the inteijudge reliability, using the formula discussed in Chapter 3, is
shown below:
R = A + { N - \ ) * A \ + { N - \ ) * A
where A, the average inteijudge agreement is:
,2MijIi<J m + rij
A = 1
N { N - \ ) I 2
For example, if the three judges observed and recorded 3, 5, and 6 behaviors respectively
for Participant 1, the inteijudge agreement is calculated as follows:
Step 1: A,,2 = (2*3)/(3 + 5) = .75
A2,3 = (2*5)/(5+6)= .91
A,,3 = (2*3)/(3+6)= .67
Reproduced with permission of the copyright owner. Further reproduction prohibited without permission.

97
Step 2:
A =(.75 + .91 + .67)/(3(3-l)/2)
= 2.33 *.333
- .78
After the average inteijudge agreements are calculated, the inteijudge reliability is
calculated. Using the above example, the reliability is then calculated as:
R = (.78 + (3-l))*.78) / (1 + (3-l))*.78)
= 2.17/2.34
= .93
Table 5 shows the inteijudge reliabilities for each of the 77 participants.
Table 5. Interjudge Reliability fo r Affiliation Behaviors, Social Interaction Behaviors, and Affiliative Interactions
Case # Affiliation Social Interaction Affiliai(n = 77) Behaviors Behaviors Interact;
1 .00 .80 .772 .89 .93 .943 .76 1.00 .954 .81 .93 .955 .77 .87 .966 .75 .94 .987 .88 .95 .918 .91 .80 .969 .75 .94 .8910 .90 .86 .8811 .89 .88 .9012 .89 .91 .9213 .85 .81 .8114 .95 .85 .8815 .83 .78 .8316 .76 .92 .8517 .74 .00 .73
Reproduced with permission of the copyright owner. Further reproduction prohibited without permission.

98
Table 5. Interjudge Reliability for Affiliation Behaviors, Social Interaction Behaviors, and Affiliative Interactions (cant.)
Case # Affiliation Social Interaction Affiliatiin = 77) Behaviors Behaviors Interactii
18 .00 .00 .0019 .77 .92 .9520 .81 .90 .9521 .89 .91 .9322 .91 .90 .9123 .93 .89 .9124 .81 .92 .8925 .86 .90 .9226 .80 .89 .8927 .78 .93 .9428 .81 .86 .9229 .89 .92 .9330 .80 .96 .9631 .00 .84 .8332 .00 .00 .0033 .85 .94 .9434 .84 .90 .9035 .73 .91 .9036 .83 .89 .8637 .90 .86 1.0038 .00 .00 .8939 .88 .98 .9140 .69 .94 .8841 .00 .78 .7842 .91 .00 .9143 1.00 .96 .9944 .86 .93 .9045 .85 .98 .9146 .93 .85 .8647 .00 .91 .8548 .79 .96 .9149 .88 .94 .9450 .78 .70 .7151 .70 .00 .7052 .88 .74 .9753 .89 .80 .9954 .88 .95 .9555 .91 .89 .9656 .72 .98 .9257 .77 .00 .75
Reproduced with permission of the copyright owner. Further reproduction prohibited without permission.

99
Table 5. Interjudge Reliability fo r Affiliation Behaviors, Social Interaction Behaviors, and Affiliative Interactions fcont.)
Case # Affiliation Social Interaction Affiliative(n = 771 Behaviors Behaviors Interactions
58 .93 .00 .9259 .78 .00 .7460 ^3 1.00 .9061 .90 .86 .9062 .00 .80 .8563 .00 .00 .0064 .74 .84 .8865 .89 .00 .8666 .79 .00 .7967 .82 ^8 .9168 .79 .92 .9369 .82 .91 .9270 .84 .90 .8971 .87 .94 .9472 .80 .97 .8973 .97 .90 .9374 .82 .96 .9175 .80 .00 .8076 .84 .94 .9677 .81 .97 .88
The total number of incidences for each behavior recorded by each of the three judges
evaluating the videotapes was used in the interjudge reliability calculation. The rule of
thumb used to determine if a proper level of interjudge reliability is a level of .90 or
greater (Bechtel & Zeisel, 1987). Examining the raw data from the expert judges showed
that the judges often disagreed on the difference between an affiliation behavior and a
social interaction behavior. However, the combined variable, Affiliative Interactions,
does not show significant improvement in reliability over the two separate variables. The
interjudge reliabilities displayed in Table 5 that resulted in a value of 0.00 are the result
Reproduced with permission of the copyright owner. Further reproduction prohibited without permission.

100
of one or more judges not recording any instance of the subject behavior. The calculation
for average inteijudge agreement will result in a 0 in either the numerator or the
denominator of the equation, providing an answer of 0, which in turn results in a
reliability value of 0 as well. However, when the cases were examined as agreement
between only two judges at a time, an acceptable level of inteijudge agreement was
achieved. This level of agreement was deemed to be acceptable for retaining the cases in
the analysis.
While the preferred level of .90 was not achieved in many cases, the inteijudge
reliability of these variables generally ranged from .80 to .95. While this is not ideal, it
was deemed acceptable for retention in the analysis phase for this exploratory study.
Quantitative Data Screening Issues
Unequal Sample Sizes and Missing Data
The distribution of the sample appears below in Table 6.
Table 6. Sample Distribution
Particinant Group
Trver-Accentor Trver-Reiecter Total
Scented Condition 18 22 40
Unscented Condition 17 20 37
Total 35 42
Reproduced with permission of the copyright owner. Further reproduction prohibited without permission.

101
Ideally, the sample would have had a minimum of twenty cases per cell. The
recmiters who enlisted participants for the focus groups over-recruited to proactively
address potential no-shows for each session. However, the rate of participants who did
not appear at the sessions was higher than expected, resulting in two of the cells in the
Tryer-Acceptor participant condition with fewer than twenty cases. Although the low
sample size is not ideal, the decision to stop data collection at this point was made due to
the high cost in both money and time of pursuing an additional five cases to balance out
the design. The distribution of the cases is still relatively balanced among the four cells
and did not profoundly affect the results of this exploratory study.
Missing data were examined in the survey results. However, as will be discussed
later in this chapter, the variables that had missing data were dropped from the analysis.
Normality o f Sampling Distributions
The sample size of 77 does not meet the requirement for 20 cases per cell in the 2 x 2
between subjects design. However, there are more cases in each cell than there are
variables under study in the final model. Normality was tested using histograms and box
plots for the three individual behavioral dependent variables. Affiliation Behaviors,
Social Interactions, and Affiliative Interactions. These three variables were found to have
roughly normal distributions. The dependent variable Focus Group Output had few
values, since each dependent variable was a summative number for each group,
preventing a true test of normality of the sampling distribution.
Reproduced with permission of the copyright owner. Further reproduction prohibited without permission.

102
Outliers
All data were tested for the presence of outliers. Three outliers were found in the
Affiliation Behaviors variable but were retained in the analysis for two reasons. First, the
observed cases that were flagged as outliers by SPSS 11.0 each had a reasonable level of
inteijudge agreement {R = .635, .696. and .59, respectively) for the numbers observed
behaviors. Second, the small sample size (n = 77) led to the decision to preserve as much
of the sample as possible. The remaining behavior variables were found to have no
outliers.
The data in the Focus Group Output variable were also examined for outliers. No
outliers were found with the exception of one focus group’s number of contributions in
the focus group. The focus group sessions were audio-taped and transcripts of each
session were generated. The audiotape ran out of tape on the first side of the tape during
each session and the tape had to be turned over to continue recording the remainder of the
session. The tape did not get turned over during Focus Group 3, resulting in the loss of
approximately 15 minutes of verbal information and a much lower incidence of focus
group contributions. It was decided that the value for the number of contributions for this
group would be replaced with the mean of the number of contributions from the
remaining seven focus groups, since the loss of one of the focus groups’ data would result
in a loss of participants and half of the information from one of the experimental cells.
Normality and Homogeneity o f Variance
The normality and the homogeneity of the variance for the dependent variables
Affiliation Behaviors, Social Interactions, and Affiliative Interactions were tested.
Reproduced with permission of the copyright owner. Further reproduction prohibited without permission.

103
Normality was tested using frequency analysis and generation of histograms. The
histograms for all three dependent variables showed that each variable was normally
distributed. The homogeneity of variance for each dependent variable was tested using
Levene’s test of homogeneity of variance. Again, each variable’s variance was
homoscedastistic.
The normality and homogeneity of variance were not tested for the Focus Group
Output variable. This is due to the method of calculating the variable’s values on a
suggestions-per-group basis, rather than on an individual participant’s contribution basis.
This results in the variable having only eight values, one for each focus group session.
Testing for normality and homogeneity of variance was not effective because of the small
sample size. This was determined to be acceptable for this exploratory study.
Covariate Issues
Analysis of the covariates was conducted to determine the appropriateness of
retaining each one in the overall analysis. The results of these tests are discussed below.
However, the covariates were removed from the analysis in this study because of the
inability to pair the participant responses to the covariate scales to their behaviors in the
dependent variables. In addition, some of the covariates discussed below were also
unsuitable for use in an analysis of covariance due to the nature of the scales used.
Linearity
A desirable covariate is one that is linearly related to the dependent variables.
However, it was not possible to test the linearity of the covariates because of the inability
Reproduced with permission of the copyright owner. Further reproduction prohibited without permission.
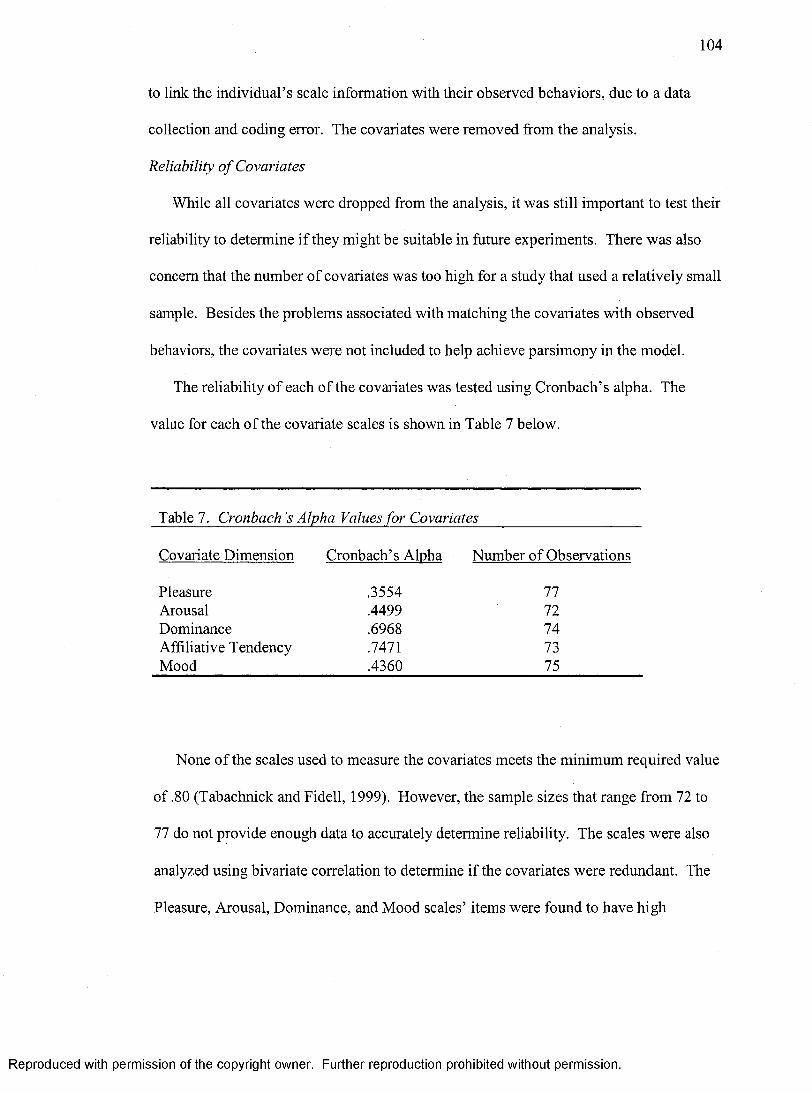
104
to link the individual’s scale information with their observed behaviors, due to a data
collection and coding error. The covariates were removed from the analysis.
Reliability o f Covariates
While all covariates were dropped from the analysis, it was still important to test their
reliability to determine if they might be suitable in future experiments. There was also
concern that the number of covariates was too high for a study that used a relatively small
sample. Besides the problems associated with matching the covariates with observed
behaviors, the covariates were not included to help achieve parsimony in the model.
The reliability of each of the covariates was tested using Cronbach’s alpha. The
value for each of the covariate scales is shown in Table 7 below.
Table 7. Cronbach’s Alpha Values for Covariates
Covariate Dimension Cronbach’s Alpha Number of Observations
Pleasure .3554 77Arousal .4499 72Dominance .6968 74Affiliative Tendency .7471 73Mood .4360 75
None of the scales used to measure the covariates meets the minimum required value
of .80 (Tabachnick and Fidell, 1999). However, the sample sizes that range from 72 to
77 do not provide enough data to accurately determine reliability. The scales were also
analyzed using bivariate correlation to determine if the covariates were redundant. The
Pleasure, Arousal, Dominance, and Mood scales’ items were found to have high
Reproduced with permission of the copyright owner. Further reproduction prohibited without permission.
105
intercorrelations within each scale, which is not desirable for covariate measures. For
example, the Dominance scale is a six-item semantic differential scale. Each of the items
should, ideally, be measuring roughly the same dimension of emotion. The result of
retaining the Dominance scale as a covariate would, in essence, measure the same thing
six times, which would skew the results. The Pleasure, Arousal, and Dominance scales
were developed for use as three separate factors in a factor analysis technique and are not
suitable for use as covariates. Mood is a separate four-item scale but is not summative,
meaning that the four scale items measure roughly the same thing (current mood) but are
not combined at the end to create an overall mood score. If an overall score for Mood,
Pleasure, Arousal, or Dominance were developed, it is possible that they might be
suitable for use in as covariates.
Affiliative Tendency, however, is a summative scale that would be suitable for use as
a covariate. To review, the scale consists of twenty-six items that are summed to create
an Affiliative Tendency score. In an effort to explore if Affiliative Tendency might be
suitable for use in future research, Cronbach’s alpha test for reliability was performed on
this covariate. The Cronbach’s alpha for the Affiliative Tendency scale did not meet the
traditionally acceptable cut-off point of .80 or greater in reliability. However, the value
of .7471 is close enough to the .80 point to consider using it in a future analysis,
particularly if the study utilizes a larger sample. One point of interest was the mean score
for the study sample on the Affiliative Tendency score. The population mean reported by
Mehrabian and Ksionzky (1974) was 28 (n = 916), which is a summative score for the
26-item scale. The participants in this study had a mean score of 61.89 (n = 77) on the
Affiliative Tendency scale, indicating a high tendency to affiliate with others.
Reproduced with permission of the copyright owner. Further reproduction prohibited without permission.

106
This high tendency to affiliate is consistent with the behaviors observed by the
researcher while in the casinos where the focus group participants were recruited. An
informant who is a representative of the company that sponsored this study and who has
extensive contact with the gamblers who play the slot machine under study was
discussing the progress of recruitment with the researcher. The researcher noted that the
people who play the game were surprisingly willing to talk to the recruiters, considering
how difficult it traditionally is to conduct intercept interviews and to recruit while slot
machine players are gambling. The informant responded that the people who play this
game “would affiliate with a rock if they could” (personal communication, Ruth
Moderhak, March 5,2003). No significant differences in the mean Affiliative Tendency
scores were found in either the different scent conditions or between the participant group
types.
Analysis of Variance (ANOVA)
A 2 X 2 factorial analysis of variance was performed for each of the four dependent
variables. The General Linear Model univariate option in SPSS 11.0 was used. The
independent variables used were Scent Condition (unscented or scented) and Participant
Group Type (Tryer-Acceptor or Tryer-Rejecter). This method enters all variables
simultaneously, therefore order of entry of the variable into the analysis does not affect
the results. The total sample size of 77 was used in the analysis, with no deletions.
The analyses for each of the four dependent variables - affiliation behaviors, social
interaction behaviors, affiliative interactions, and focus group output - will be presented.
The interactions effects will be discussed first, followed by main effects.
Reproduced with permission of the copyright owner. Further reproduction prohibited without permission.
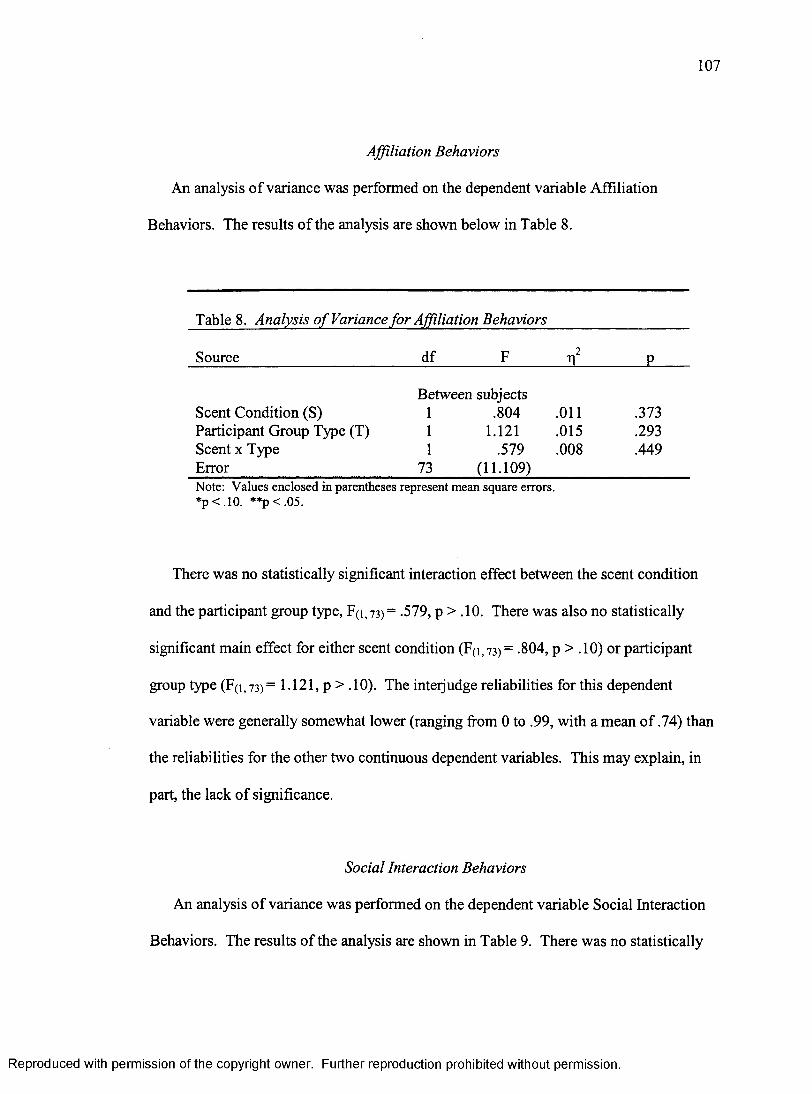
107
Affiliation Behaviors
An analysis of variance was performed on the dependent variable Affiliation
Behaviors. The results of the analysis are shown below in Table 8.
Table 8. Analysis o f Variance for Affiliation Behaviors
Source df F P
Between subjectsScent Condition (S) 1 .804 .011 .373Participant Group Type (T) 1 1.121 .015 .293Scent X Type 1 .579 .008 .449Error 73 (11.109)Note: Values enclosed in parentheses represent mean square errors. * p < .1 0 . **p < .05.
There was no statistically significant interaction effect between the scent condition
and the participant group type, F(i, 73) = .579, p > .10. There was also no statistically
significant main effect for either scent condition (F(i, 73) = .804, p > .10) or participant
group type (F(i, 73) = 1.121, p > . 10). The inteijudge reliabilities for this dependent
variable were generally somewhat lower (ranging from 0 to .99, with a mean of .74) than
the reliabilities for the other two continuous dependent variables. This may explain, in
part, the lack of significance.
Social Interaction Behaviors
An analysis of variance was performed on the dependent variable Social Interaction
Behaviors. The results of the analysis are shown in Table 9. There was no statistically
Reproduced with permission of the copyright owner. Further reproduction prohibited without permission.

108
significant interaction effect between the scent condition of the waiting room and the
participant group type F(i,73)= .316, p > .10. However, there was a statistically
significant difference in main effect in scent condition, F(i,73)= 3.911, p < .05, t|^= .051.
The scented condition (mean = 11.65, a = 8.12) resulted in more social interaction
behaviors exhibited by the study participants than did the unscented condition (mean =
8.60, a = 7.10). The value of .051, however, indicates that the strength of association
between the scent condition and the exhibition of social interaction behaviors is weak.
Table 9. Analysis o f Variance for Social Interaction Behaviors
Source df F n ' P
Between subjectsScent Condition (S) 1 3.911 .051 .052*Participant Group Type (T) 1 27.539 .274 .000**Scent X Type 1 1.019 .014 .316Error 73 (43.388)Note: Values enclosed in parentheses represent mean square errors. * p < .1 0 . * * p < .05.
In other words, only 5.1% of the variance in the number of social interactions is
attributable to the scent condition present in the room.
There was also a statistically significant main effect from the participant group type,
F(i, 73)= 27.539, p < .05, r| ̂= .274. The participant groups consisting of Tryer-Acceptors
exhibited significantly more social interaction behaviors (mean = 14.46, o = 7.66) than
did the groups consisting of Tryer-Rejecters (mean = 6.63, a = 5.85). The r f value of
.274 indicates a moderate level of strength of association between the participant group
type and the number of social interactions that the group exhibited. In other words.
Reproduced with permission of the copyright owner. Further reproduction prohibited without permission.

109
approximately 27.4% of the variation in the number of social interactions can be
explained by the type of participant group.
Affiliative Interactions
An analysis of variance was performed on the dependent variable Affiliative
Interactions. The results of the analysis are shown below in Table 10.
Table 10. Analysis o f Variance fo r Affliative Interaction Behaviors
Source df F P
Between subjectsScent Condition (S) 1 1.505 .020 .224Participant Group Type (T) 1 14.354 .164 .000**Scent X Type 1 .253 .003 .617Error 73 (67.078)Note: Values enclosed in parentheses represent mean square errors. *p < .10. **p < .05.
There was no statistically significant interaction effect between the scent condition of
the waiting room and the participant group type on the combined dependent variable,
Affiliative Interactions, F(i, 73) = .253, p > .10. There was also no statistically significant
difference in main effect in scent condition, F(i,73)= 1.5 05, p > .10.
There was, however, a statistically significant main effect from the participant group
type, F(i,73)= 14.354, p < .0001, r\= .164. The participant groups consisting o f Tryer-
Acceptors exhibited significantly more affiliative interaction behaviors (mean = 18.91, o
= 8.26) than did the groups consisting of Tryer-Rejecters (mean = 11.87, a = 8.12).
Although the participant group type has a statistically significant main effect, the
value of .164 indicates a weak level of strength of association between the participant
Reproduced with permission of the copyright owner. Further reproduction prohibited without permission.
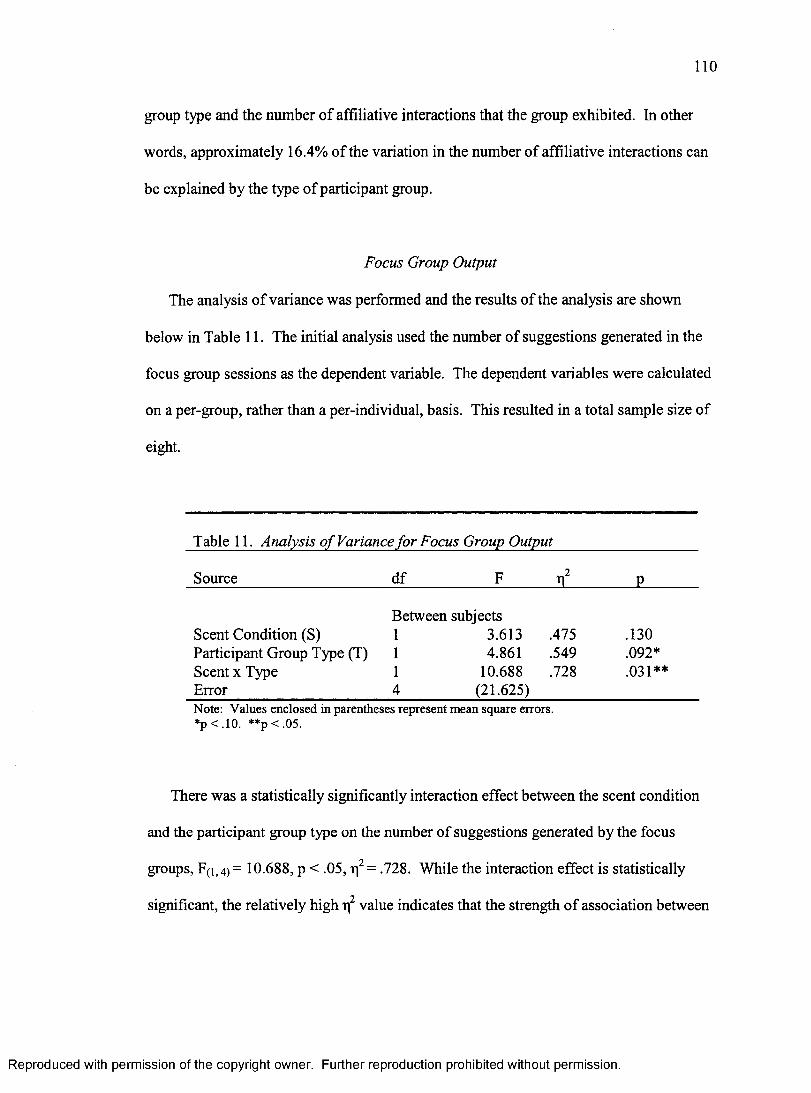
110
group type and the number of affiliative interactions that the group exhibited. In other
words, approximately 16.4% of the variation in the number of affiliative interactions can
be explained by the type of participant group.
Focus Group Output
The analysis of variance was performed and the results of the analysis are shown
below in Table 11. The initial analysis used the number of suggestions generated in the
focus group sessions as the dependent variable. The dependent variables were calculated
on a per-group, rather than a per-individual, basis. This resulted in a total sample size of
eight.
Table 11. Analysis o f Variance for Focus Group Output
Source df F P
Between subjectsScent Condition (S) 1 3.613 .475 .130Participant Group Type (T) 1 4.861 .549 .092*Scent X Type 1 10.688 .728 .031**Error 4 (21.625)Note: Values enclosed in parentheses represent mean square errors. *p < .10. **p < .05.
There was a statistically significantly interaction effect between the scent condition
and the participant group type on the number of suggestions generated by the focus
groups, F(i,4)= 10.688, p < .05, r^= .728. While the interaction effect is statistically
significant, the relatively high value indicates that the strength of association between
Reproduced with permission of the copyright owner. Further reproduction prohibited without permission.

I l l
the independent variables’ interaction effect and the number of focus group suggestions is
relatively strong.
There was no statistically significantly main effect from the scent condition, F(i, 4) =
3.613, p < .130. There was, however, a statistically significant main effect in the
participant group type, F(i,4)= 4.861, p < .10, p^= .092. The focus groups consisting of
Tryer-Acceptors generated significantly more suggestions during the focus group session
(mean = 79.75, a = 2.99) than did the groups consisting of Tryer-Rejecters (mean =
72.50,0= 11.09). The value of .092 indicates a relatively weak strength of association
between the participant group type and the number of suggestions generated by the focus
groups.
The significant interaction and participant group type main effects should be viewed
with caution. The sample consists of only eight observations, which diminish the
statistical power of the analysis. An additional analysis of variance was conducted in an
effort to use a less subjective evaluation of the focus group output measure. The
transcripts were analyzed for quantity of content by examining the total word count for
each session. This again resulted in only eight cases for the dependent variable (one
word count value per session), which reduced the statistical power of the analysis.
However, it provided insight into the effect of ambient scent, as well as participant group
type, on the focus group output. The results of this analysis are shown in Table 12.
There was no statistically significant interaction effect between the scent condition of
the waiting room and the participant group type on the word count for the focus group
sessions, F(i,4)= .3.340, p > .10.
Reproduced with permission of the copyright owner. Further reproduction prohibited without permission.

112
Table 12. Analysis o f Variance for Focus Group Session Word Count
Source df F P
Between subjectsScent Condition (S) 1 .539 .119 .504Participant Group Type (T) 1 1.872 .319 .243Scent X Type 1 3.340 .455 .142Error 4 (571,204.125)Note: Values enclosed in parentheses represent mean square errors. * p < . 1 0 . **p < .05.
There was also no statistically significant difference in main effect in either the scent
condition, F(i,4)= .539, p > .10 or in the participant group type, F(i,4)= .1.872, p > .10.
Post Hoc Tests
Post hoc tests, such as the Tukey or Scheffé tests, were not performed. These tests
are usually performed if any independent variable in a factorial design has three or more
levels of treatment. This study’s independent variables had two levels of treatment each.
Thus, post hoc testing was not required.
Proposition Testing
The four propositions investigated in this study are discussed next. All propositions
were tested at the .10 significance level, which was deemed to be appropriate for an
exploratory study.
PI: The presence o f a pleasant ambient scent in the focus group waiting room will
increase the number o f affiliation behaviors exhibited by focus group participants.
Reproduced with permission of the copyright owner. Further reproduction prohibited without permission.

113
There was no statistically significant interaction or main effects in the scent condition
on the number of affiliation behaviors exhibited by the study participants. Thus,
Proposition 1 was not supported.
P2: The presence o f a pleasant ambient scent in the focus group waiting room will
increase the number o f social interactions that will be initiated by focus group
participants.
Scent had a statistically significant main effect on the number of social interaction
behaviors exhibited by the study participants. However, the participant group type had
an even more significant effect on the number of social interactions. Proposition 2 was
supported in this study.
P3: The presence o f a pleasant ambient scent in the focus group waiting room will
increase the combined number o f affiliation behaviors and social interactions, or
Affiliative Interactions, exhibited by focus group participants.
The ambient scent condition in the study did not have a statistically significant main
effect on the number of affiliative interactions exhibited by the study participants, while
the participant group type had a significant effect. However, the lack of significance on
the part of the scent condition results in Proposition 3 not being supported.
P4: The presence o f a pleasant ambient scent in both the focus group waiting room
and in the focus group room itself will increase the number o f contributions that will be
generated by focus group participants, i.e., focus group output, during the actual focus
group session.
The ambient scent did not have a statistically significant main effect on the number of
suggestions contributed by the focus groups. However, the scent condition and the
Reproduced with permission of the copyright owner. Further reproduction prohibited without permission.

114
participant group type did have a significant interaction effect on the focus group output.
The participant group type did have a significant main effect. Since the main effect of
scent was not significant, Proposition 4 was not supported. However, the low power of
this analysis should be noted.
A detailed discussion of the study’s findings is presented in the next chapter. It will
be followed by a discussion of the limitations to the study and suggestions for future
research.
Reproduced with permission of the copyright owner. Further reproduction prohibited without permission.

CHAPTER 5
DISCUSSION AND CONCLUSION
Introduction
This chapter begins with a summary of the study, followed by a discussion of the
results that were reported in Chapter 4. The chapter concludes with a discussion of the
generalizability of results, limitations of the study, and suggestions for future research.
Summary of the Study
This study sought to test whether the presence of a pleasant ambient scent would have
a positive influence on focus group participants’ behaviors. The intent of the study was
to explore if the focus group and the meetings industries can provide meeting
environments that would be more conducive to communication and more productive.
The concepts tested in this study are based in environmental psychology, or the study of
how the physical environment affects individual and group behavior within the
environment.
Design. The study was quasi-experimental, using a 2 x 2 factorial design. The two
independent variables under study were the presence or absence of a pleasant ambient
scent and the type of participant group, defined as either Tryer-Acceptors or Tryer-
Rejecters of a particular slot machine game. The participant group categories were
115
Reproduced with permission of the copyright owner. Further reproduction prohibited without permission.

116
defined by the sponsor of the study, a gaming machine manufacturer. The experiment
involved focus group participants spending fifteen minutes in the experimental
environment, completing a survey, participating in the actual focus group session, then
completing a post-focus group survey. The time spent in the experimental environment
was videotaped for content analysis of behaviors exhibited while in the treated/untreated
room.
Covariates
Several potential covariates were measured using a test administered to the
participants immediately following the fifteen minutes in the waiting room. These
covariates included Pleasure, Arousal, Dominance, Affiliative Tendency, and Mood.
Pleasure, Arousal, Dominance, and Mood were ultimately discarded as covariates for two
primary reasons. First, an error in the data collection procedure prevented matching the
participants’ responses to the surveys to the observed behaviors that were used as the
dependent variables. This made it impossible to conduct an analysis of covariance.
In addition, these measures were discarded because they exhibited low reliability and
they could not be verified to have a linear relationship with the dependent variable. The
low reliability was possibly due to the small sample size (n - 77). The inability to verify
a linear relationship with the dependent variables was due to the data collection
procedure error.
These Pleasure, Arousal, Dominance, and Mood variables were also unsuitable for
use as covariates because they are intended as scale items used in factor analysis. A
covariate should be a single item measure that controls noise in the analysis from
influences that are not controlled in the experiment. For these variables to be effective
Reproduced with permission of the copyright owner. Further reproduction prohibited without permission.

117
covariates, the analysis would require that they be single indicant variables, rather than
several scale items that are part of a factor analysis.
The Affiliative Tendency measure was more suitable for use as a covariate. This is
because the measure is a summative scale, where the responses to the twenty-six scale
items are summed at the end of the survey to produce an Affiliative Tendency score for
each respondent. However, the data collection procedural error made it impossible to test
the linear relation with the dependent variables. Thus, it was also discarded in this study.
Dependent Variables
The study initially proposed four dependent variables; Affiliation Behaviors, Social
Interactions, Affiliative Interactions, and Focus Group Output. The Affiliation Behavior,
Social Interaction, and Affiliative Interactions variables were developed through
videotape content analysis conducted by expert judges. The content analysis had less
than optimal intequdge reliability, possibly due to the highly subjective process of
content analysis of movement viewed on videotape. However, this was an exploratory
study and the intequdge reliability values that generally fell into the .80 - .95 range
suggest that the technique used may be effective for use in the future with some
refinement of the types of behaviors and improved training of the expert judges.
The dependent variable Focus Group Suggestions was calculated by counting
suggestions made during the focus group sessions that occurred after the 15-minute
waiting room period. The counts were generated off the focus group transcripts. The
transcripts were also analyzed using the Word Count function in Microsoft Word to
Reproduced with permission of the copyright owner. Further reproduction prohibited without permission.

118
provide additional focus group production data for comparison purposes. This was done
to provide a less subjective basis for analysis.
The data were analyzed using a 2 x 2 factorial univariate analysis of variance
(ANOVA). The results of the analysis show that scent had no statistically significant
increase in the numbers of Affiliation Behaviors or Affiliative Interactions exhibited by
the participants in the study. However, scent had a statistically significant effect on the
social interaction behaviors exhibited by the participants. Specifically, the addition of the
scent to the waiting room resulted in more social interaction behaviors than were
exhibited in the unscented room.
In contrast, the participant group type had a statistically significant effect on the
Social Interaction and Affiliative Interactions behaviors exhibited and on the focus group
output. The Tryer-Acceptor participants exhibited more of these behaviors and made
more suggestions in the focus group sessions than did the Tryer-Rejecters.
Discussion of Results
The results of the study indicate that a pleasant ambient scent, in this case, essential
oil of geranium, has a positive effect on increasing social interaction behaviors of
participants in a meeting environment. The initial study design consisted of four
propositions that each tested one dependent variable. The original model proposed
several covariates in an analysis of covariance. The covariate measures were found to be
unsuitable for inclusion in the analysis and were dropped. The final analysis was a 2 x 2
factorial analysis of variance (ANOVA). Each proposition and its implications are
discussed next.
Reproduced with permission of the copyright owner. Further reproduction prohibited without permission.

119
PI: The presence o f a pleasant ambient scent in the focus group waiting room will
increase the number o f affiliation behaviors exhibited by focus group participants.
This proposition was not supported. The ambient scent condition did not appear to
have any effect on the affiliation behaviors exhibited by the study’s participants. It was
expected that the addition of the pleasant scent to the environment would induce the
participants’ levels of arousal to the correct levels that would lead to the formation of
feelings of positive affect/liking for the environment and other people in the environment.
The interjudge reliabilities for the Affiliation Behaviors were somewhat lower than
those for the Social Interactions and Affiliative Interactions dependent variables. The
lack of support for this proposition may be due, in part, to the reduced reliability of the
data. The lowered reliabilities seem to arise from a general lack of agreement among the
judges on what constituted an Affiliation Behavior. These behaviors include subtle body
movements and changes in eye contact duration. The lack of agreement may be the result
of inadequate training of the judges to identify these behaviors, less than optimal
videotape quality for the videotapes used to analyze the data, or differences in quality of
the judges’ personal VCR’s that were used to playback the tapes during the analysis.
P2: The presence o f a pleasant ambient scent in the focus group waiting room will
increase the number o f social interactions that will be initiated by focus group
participants.
Proposition 2 was supported in this study. Scent had a statistically significant main
effect on the number of social interaction behaviors exhibited by the study participants.
However, the participant group type had an even more significant effect on the number of
social interactions.
Reproduced with permission of the copyright owner. Further reproduction prohibited without permission.

120
The scent condition performed as expected in the exhibition of Social Interaction
behaviors by the participants in the waiting room area. However, the strength of
association between the scent condition and social interactions is relatively weak, where
approximately 5% of the variation in the number of social interactions can be attributed
to scent condition.
One interesting aspect of the analysis is that the discarded covariate measure
Affiliative Tendency, which was intended to the measure the general tendency of the
participants to affiliate with others, was analyzed using descriptive measures and the
study’s sample, as a whole, had a relatively high mean value for Affiliative Tendency.
When Mehrabian and Ksionzky (1974) developed the scale, they had a sample size of
916 that had a mean Affiliative Tendency score of 28. The sample in this study (n = 77)
had a mean score of 61.89, which is significantly higher. There were no statistically
significant differences in the Affiliative Tendency scores between the scented and
unscented groups or the Tryer-Acceptors and Tryer-Rejecters. This infers that the effect
of scent in this study may have been obscured by the fact that the participants in the study
all had a fairly high tendency to affiliate from the outset. The fact that scent had a
statistically significant effect indicates that the methodology proposed in this study may
be used again in the future on a more diverse group of people, possibly pre-screened for
high affiliative tendency. This might enable a researcher to obtain more precise
information about the real contribution of the scent condition to the exhibition of social
interaction behaviors.
The Social Interactions dependent variable was also significantly influenced by the
type of Participant Group. The Tryer-Acceptors of the slot machine under study
Reproduced with permission of the copyright owner. Further reproduction prohibited without permission.
121
exhibited significantly more social interaction behaviors than did the Tryer-Rejecters,
where approximately 27.4% of the variation in Social Interactions can be associated with
the type of participant group.
Again, the high mean score for Affiliative Tendency for the entire sample is
interesting. The subjects in both participant groups were 1) willing to speak to a stranger
(recruiter) while playing games in a casino, 2) were willing to sign up for a focus group,
and 3) actually showed up for the focus group at a later date and in a building located in a
different part of town from the casino’s location. These may indicate that this type of
person has a higher interest in interacting with other people. While this may have skewed
the number of social interaction behaviors exhibited upwards over what would be
exhibited by the general population, there was still a significantly higher number of
interactions displayed by the Tryer-Acceptors. While this was not tested in this study, it
is possible that the personality type of the Tryer-Acceptors may be skewed towards a
high level of agreeableness, if analyzed using the Big 5 personality inventory proposed
by McClelland (1985). One of the issues that concerned the sponsor of the study was
uncovering the behavior and attitudes of the frequent players of the game, particularly
what the players especially liked about the game. The social interaction component of
the game came up frequently as a highly desirable feature of the game for devoted
players.
P3: The presence o f a pleasant ambient scent in the focus group waiting room will
increase the combined number o f affiliation behaviors and social interactions, or
Affiliative Interactions, exhibited by focus group participants.
Reproduced with permission of the copyright owner. Further reproduction prohibited without permission.

122
Once again, scent had no statistically significant main effect on the dependent
variable. The Affiliative Interactions dependent variable was generated with the
combined number of affiliation and social interaction behaviors. As discussed earlier in
Proposition 1, the Affiliation Behaviors dependent variable was not significantly
influenced by the scent condition. However, the discussion of the relatively high value
for the sample’s mean Affiliative Tendency score may have obscured the results that
scent would have had on less affiliative subjects. Unfortunately, the data collected for
Affiliative Tendency, which could not be used in this analysis as a covariate, would have
controlled the influence that affiliative tendency had on the participants’ behaviors.
Participant Group Type once again had a statistically significant effect on the
exhibition of Affiliative Interactions. The Tryer-Acceptors displayed more combined
affiliation and social interaction behaviors than did the Tryer-Rejecters.
P4: The presence o f a pleasant ambient scent in both the focus group waiting room
and in the focus group room itself will increase the number o f contributions that will be
generated by focus group participants, i.e.. Focus Group Output, during the actual focus
group session.
Scent condition did not appear to have a statistically significant main effect on the
number of focus group suggestions generated that were used for Focus Group Output.
Participant group type did have a main effect, and there was a statistically significant
interaction effect between the scent condition and participant group type. However, the
results of this portion of the analysis appear to be somewhat perverse, as the values for
the measure of the strength of association between the independent variables and the
dependent variables, are quite high. The value for the main effect for the
Reproduced with permission of the copyright owner. Further reproduction prohibited without permission.

123
participant group type is .549 (p = .092) and the value for the interaction effect is .728
(p = .031). These are very high, especially considering the p-values. The perverseness of
this analysis is most likely due to the low power of the analysis. There are only eight
cases analyzed, one case for each focus group session. This suggests that future research
should consider the number of suggestions generated during the focus group on a per-
individual basis, rather than examining it on an aggregated per-group basis, to improve
the statistical power of the study. Output on a per-group basis could be considered as
well, but would require a sample size of at least 40 focus groups (2 treatment conditions x
20 cases per cell), which would be both time-consuming and very expensive to conduct
and analyze.
General Implications of the Study
Past studies have examined various ambient conditions and other aspects of the
physical environment and their effects on retail environments. However, the
characteristics that set services businesses apart from product marketing and retail
businesses require new techniques to evaluate the effect of the physical environment on
the people within the environment. This study proposed a new methodology for
examining the effect of one of the ambient conditions, scent, in a services environment.
While the methodology and the results of this study have many limitations that will be
discussed in the next section of this chapter, the study offers evidence that a pleasant
ambient scent can have a positive effect on the effectiveness of a meeting environment.
Reproduced with permission of the copyright owner. Further reproduction prohibited without permission.

124
Theoretical Implications
The Servicescapes Model
There are several theoretical implications arising from this study. First, Bitner (1992)
proposed the Servicescapes model, shown earlier in Figure 1 on page 10 of this study.
Her model provides a framework for examining the effect of the physical environment on
the people, both customers and employees, within the service environment. Bitner
proposed that the model be tested. Some of the components that are easily manipulated,
sueh as music, have been tested in a retail environment. However, Bitner recommends
examining the approach and avoidance and social interaction behaviors. The retail tests
have examined approach-type behaviors, such as time spent in the environment, gross
revenue, and sales per square foot. No study found to date has specifically examined the
affiliation or social interaction behaviors that Bitner recommended for study. This study
proposed a methodology for examining these behaviors that are so important for a non
retail services business.
Auhert-Gamet and Cova’s (1999) Post-Modern World
Aubert-Gamet and Cova (1999) discuss Bitner’s (1992) Servicescapes model. They
discuss it in the context that in today’s “post-modern” society, humans are beeoming
more isolated through the inerease in technology. The isolation arises from individuals
commuting in automobiles instead of on mass transportation, telecommuting for work
rather than going to an office and having face-to-face interactions with customers and co
workers, and through entertaining at home through televisions, computers, internet, and
video rentals, rather than out in the public arena. Aubert-Gamet and Cova (1999) suggest
that some, although not all, people crave the social interaction that this isolation is slowly
Reproduced with permission of the copyright owner. Further reproduction prohibited without permission.

125
decreasing. They point to examples such as “mall-walkers”, people who go to a shopping
mall to walk for exercise and to socialize. Aubert-Gamet and Cova suggest that the mall-
walkers use this as a way to connect with other people. Another example provided is the
typical traveler holed up in his or her “cocoon-prison”, or hotel room. They suggest that
some travelers who are very isolated from face-to-face contact while traveling on
business crave human social interaction and propose that hotel companies create public
spaces that provide opportunities for social interactions to occur. This is proposed as a
type of amenity or competitive advantage for the future.
This study was intended to test the effect of ambient scent on the social interaction
behaviors. If the presence of the scent was found to encourage more social interactions
among the participants, it might be possible to make use of ambient scent in a business
servicescape to facilitate the formation of the social interactions that are desired by the
type of people that Aubert-Gamet and Cova (1999) describe in a post-modern world. The
addition of a facilitating scent would be an amenity that could be offered to create a
competitive advantage for the business.
This study attempted to examine one of the ambient variables of the physical
environment, ambient scent, to determine if the introduction of a pleasant scent into the
physical surroundings would help facilitate affiliation and social interactions. The results
of this study are mixed, particularly because the results are probably confounded by the
high baseline level of Affiliative Tendency of the study’s subjects. However, the
methodology presented in this study is intended as an initial foray into studying the
human interaction component of Bitner’s (1992) Servicescapes model.
Reproduced with permission of the copyright owner. Further reproduction prohibited without permission.

126
Ambient Scent and Affect
The Mere-Exposure Theory suggests that the more exposure to a stimulus that a
person receives, the more that person is likely to feel positive affect, or liking, for that
stimulus (Winkielman, et al., 2002). The stimulus may include the overall environment,
objects within the environment, or other people in the environment. This study did not
measure the participants’ levels of affect for the environment or others in the
environment, per se. However, the study was based on the concepts of the Mere-
Exposure theory, where the exposure to the other focus group members before beginning
the focus group should have had a significant positive effect on the amount of interaction
and participation that occurred later in the focus group session itself.
Brain research and psychological studies have indicated that there is a positive
relationship between arousal and affect. The scent component of the study was intended
to stimulate arousal in the participants, which is closely associated with positive affect.
The results of this study were, again, confounded by the high Affiliative Tendency scores
of the study’s participants. Future research could focus specifically on the feelings of
liking for others that occur with or without a pleasant scent added to the environment.
Arousal could also be tested.
Ambient Scent and Behavior
The major concept tested in this study was the effect of the ambient variable “odor”,
specifically whether the introduction of a pleasant scent had an effect on the affiliation
and social interaction behaviors exhibited by the study’s participants. Past studies have
suggested that a pleasant scent might facilitate decision-making, cooperation, negotiation,
and purchasing behaviors (Baron, 1990; Spangenburg, et al., 1996). This study is a direct
Reproduced with permission of the copyright owner. Further reproduction prohibited without permission.

127
test of how ambient scent affects behavior in group interactions. The underlying
physiological theory is that an increase in positive arousal is closely associated with
increased motor activity. Increased motor activity means that an individual will engage
in more physical activity. The increased positive arousal state is also closely associated
with an increase in positive affect. Overall, the increase arousal and affect was expected
to prompt the study’s participants into more affiliation and social interactions with the
other people in the group.
The increased interaction within the group was also expected to result in more
production during the focus group session. Some researchers have found that an increase
in affect leads to increased skill in problem-solving and creative thinking (Ashby, et al.,
2002). The increase is attributed to different levels of neurotransmitters being released to
the parts of the brain that facilitate this function. In addition, the prior exposure during
the waiting room session should have allowed the subjects to become familiar with each
other, lending “fluency” in the cognitive processing of information when encountering
new people for the first time. This period of familiarization allowed the participants to be
more productive later in the focus group itself because they had already become familiar,
through mere-exposure, with the other participants. The brain had already processed
information about the novel stimulus (new people) and was able to move on to other
functions, such as discussing the slot machine under study.
The effect of scent on behavior was found to be significant only on social interactions
in this study. However, the effects of scent on the other behaviors studied may have been
confounded by the high Affiliative Tendency scores for the study’s participants. Future
Reproduced with permission of the copyright owner. Further reproduction prohibited without permission.

128
tests should control for Affiliative Tendency’s covariation to understand ambient scent’s
true effect on group interactions.
Retail Marketing vs. Services Marketing
The Servicescapes model (Bitner, 1992) has not been tested extensively. However,
limited tests of the model have been conducted primarily in the area of retail marketing.
While retail marketing shares many characteristics with services marketing, the world of
services has some characteristics that make the understanding and managing of the
physical environment all the more important. First, the products purchased in a retail
environment are usually (although not always) tangible, removed from the store after the
purchase is completed, and consumed at a later time by the customer. The product can be
evaluated at a later time, separate from the evaluation of the environment in which it was
purchased.
Services, on the other hand, are purchased and consumed simultaneously. The
customer becomes part of the service-creation environment and the physical surroundings
become part of the product itself. The product is evaluated while the customer is still in
the service environment, rather that at a later time as is often possible with a tangible
product. The employees and other customers at a restaurant or hotel also become part of
the product, as the customer interacts or is affected by them. Understanding the overt and
subtle effects of the environment and managing them properly is important to provide the
best product possible for the right customers.
The Servicescapes model has been tested most often in retail environments.
However, very little research has been conducted in a pure services environment. This
study offered a methodology to test the effect that one component of the physical
Reproduced with permission of the copyright owner. Further reproduction prohibited without permission.

129
environment had on the people in the study. This is closer to the type of situation present
in a services environment, such as a hotel meeting room or a restaurant, than the typical
retail study represents.
New Methodology for Testing the Servicescape
Most previous studies testing the Servicescapes model have used a laboratory setting
with college students as subjects. While this lends internal validity to the study, as
control over most variables is possible, external validity is reduced in these circumstances
because the setting is artificial and the subjects are not representative of the population as
a whole.
This study examined how scent affected individual and group behavior in a field
setting. Although the setting (meeting rooms in a classroom building on a university
campus) was not a typical environment that the participants would normally find
themselves in, it was an environment that more closely resembled a meeting room
environment that would be found in a business’ offices or a hotel or conference center.
Although the subjects were a convenience sample that had some very unique
characteristics - they had a high affiliative tendency, were casino gamblers who had
played a certain game, and were somewhat older than the local population - they were
more representative of the general population in many ways than would be a sample
consisting of college juniors and seniors. These factors did not provide perfect external
validity, but did move in the direction of improving the ability to generalize findings of
an atmospheric study across the population.
Reproduced with permission of the copyright owner. Further reproduction prohibited without permission.

130
Managerial Implications
This study also has managerial implications for the focus group and hotel meetings
industry, as well as for businesses in general.
Focus Group Industry
This study was conducted using eight focus groups on a single topic. The intent was
to determine if the addition of a pleasant scent would increase the amount of interaction
and then the amount of production that the focus groups would generate, represented by
the number of suggestions made by the group. The study had mixed results. While the
scent did not have a main effect on the number of suggestions generated, it did have an
interaction effect along with the participant group type on the number of suggestions
generated. The high tendency to affiliate among the study’s subjects should be of interest
to focus group companies, because people who are likely to agree to participate in a focus
group may be likely to have a high affiliative tendency. Care should be taken to control
for this tendency to ensure that the likes/dislikes, attitude, awareness, and usage of
products or services that are the topic of a focus group are not different from those
individuals with a lower affiliative tendency.
On the surface, the lack of effect on the focus group production attributable to scent
would suggest that scent would not have an important role to play. However, only one
scent, essential oil of geranium, was used in this study. The arousal- and affect- inducing
qualities of scent may still be useful to the focus group industry. One area that could be
particularly fruitful is using a scent that is congruent, or relevant, to the product or topic
being studied in the focus group. Scent congruence has been found to have a significant
effect on product evaluation and purchase intent (Mitchell, Kahn, & Knasko, 1995).
Reproduced with permission of the copyright owner. Further reproduction prohibited without permission.

131
Hotel Meetings Industry
This study was conducted in an environment that was similar to that of a meeting
room in a hotel or conference center. These businesses rely on providing a total
experience for their customers, who are the purchasers of the meeting space and the
accompanying services. The scent used in this study had a significant positive main
effect on the number of social interactions that occurred among the strangers in the
study’s sample. The introduction of a pleasant, novel scent into a hotel or conference
center meeting room environment could facilitate positive affiliation behaviors and social
interactions among meeting participants. This would be most useful if the meeting
attendees were not familiar with each other or needed to conduct networking, where
meeting new people and interacting is important. The results of the study suggest that a
hospitality company, be it a restaurant, a hotel with meeting rooms, or a conference
center, may be able to create a sustainable competitive advantage by offering a pleasant
scent to their meeting customers as a way to improve the effectiveness of meetings,
thereby increasing the return on the customer’s investment in the meeting.
General Business Implications
There are two primary business implications arising fi-om this study. First, services
businesses may be able to choose and use a distinctive “signature” scent for their service
locations. Many products are associated with a distinctive scent, such as food,
detergents, and personal hygiene products. However, most services are not associated
with a specific scent. Scent is the most evocative of the five senses because it is believed
to serve as a cue for memory-retrieval. If services companies could carefully choose and
use a specific scent that did not evoke recall of other products or competitors’ offerings, it
Reproduced with permission of the copyright owner. Further reproduction prohibited without permission.

132
would be an additional way to “tangibilize” the service. If a customer were to smell the
signature scent at a location away from the businesses premises, the scent might trigger a
recall function where the customer then would recall the business’ name and services.
For example, the researcher for this study worked for a large, American hotel company
for four years. This particular company uses a type of air freshener that has a scent
unique to the company. Although the researcher left this company 15 years prior to this
study, every location for this company still smells exactly the same and evokes memories
of working for the company and for the accommodations it offers.
The use of a signature scent in a services business could also lead to increased liking
for the business. The repetition of the scent should lend fluency to the cognitive
processes behind identifying and associating the scent with a specific source. The more a
customer smells the scent and identifies it as the company’s odor, the greater the
likelihood that the neurotransmitters that chemically “reward” the brain for recognizing a
familiar scent as a non-risk will lead to feelings of positive affect toward the
company/source of the scent.
According to Shoemaker and Lewis (1999), the goal of hotel firms should be to retain
loyal customers. Hotels are a prime example of a services business in which the physical
environment plays a uniquely important role, since a hotel’s customers remain in the
service environment for a relatively long period of time compared to many other service
businesses. Loyal customers in the hospitality industry are customers who have a higher
likelihood of returning to property and who are likely to behave as partners to the
organization (Bowen & Shoemaker, 1998; Shoemaker & Lewis, 1999). Increasing liking
for a company increases the degree of attachment to the company that a customer feels.
Reproduced with permission of the copyright owner. Further reproduction prohibited without permission.

133
Increased attachment and liking should lead to an increased proportion of business that is
given to the company by the customer, thereby increasing profits. If the introduction of a
pleasant, signature scent can facilitate recall, and if recall facilitates liking through the
mere-exposure effect, then the scent should increase the loyalty of a service company’s
customers.
Limitations of the Study
Although there were statistically significant results, supported by practical
significance measures, there are several limitations to the study’s design that prevent the
results from being generalizable across the whole population.
Convenience Sample
The study’s sample was a convenience sample of people who have played a particular
slot machine game, as specified by the sponsor of this study. These study subjects were
recruited inside various “locals” casinos in the Las Vegas, Nevada area. As such, the
characteristics of these subjects may not be typical of other gamblers who play different
types of machine games, gamblers who do not play machines but prefer table games,
tourist gamblers instead of local resident gamblers, or ultimate comparisons with non
gamblers.
In addition, these participants were willing to talk to the recruiters in the casino, while
gambling. This characteristic may set them apart in their willingness or need to affiliate
with other people. The Affiliative Tendency scale administered to the study participants
after the 15-minute waiting room period showed that the study group, as a whole, scored
Reproduced with permission of the copyright owner. Further reproduction prohibited without permission.

134
higher than the population groups reported in previous studies. The relatively high
affiliative tendency for this study’s participants could have skewed the amount of
interaction they exhibited and their willingness to cooperate in the focus group session.
Age
This study’s participants also had a higher mean age than the rest of the Las Vegas
population. There are anecdotal reports that older people, particularly retirees, are more
likely to affiliate with and initiate social interactions with new people. This tendency
may have skewed the results of this study.
Seasonal Effects
Another factor that may have influenced the participants’ behavior is a seasonal issue
in the Las Vegas area. The focus group sessions were held during the first two weeks of
March, 2003. This coincided with the beginning of an annual period with high pollen
counts in the air. Several participants reported suffering from allergies during the
experiment. It is possible that the results would have turned out differently if the
experiment were conducted during a season with fewer allergens in the environment.
Prior Exposure
Another factor that limits the generalizability of this study’s results is that some of the
participants may have had prior exposure to each other in the parking lot area of the
building in which the experiment was conducted. That small, accidental amount of
Reproduced with permission of the copyright owner. Further reproduction prohibited without permission.

135
exposure may result in prior affect for others before the participants ever reached the
experimental environment.
Deodorant Use
Another issue that may have affected participant response involves the use of
deodorant. While the participants were asked and reminded to not wear perfume or
cologne to the focus group session, most participants wore some type of underarm
deodorant. Many brands of deodorant have a wide variety of perfume-like scents added
to them. This scent may have confounded effects of the ambient scent in the waiting
room.
Disabled Olfaction
One final limitation to the study is the issue of screening for a participant’s ability to
smell. The participants were not screened for their ability to smell and a percentage of
the population has an inability to smell or a degraded ability to smell. The participants,
particularly those who suffer from allergies, may have had limited ability to smell the
scent present in the scented condition. Although there are significant positive results for
the participants in the scented condition, the results may have been affected by people
who could not detect the scent.
Suggestions for Future Research
The participants in this study were a convenience sample from a narrowly defined
group of people. They were generally older than the rest of the population and were
Reproduced with permission of the copyright owner. Further reproduction prohibited without permission.

136
gamblers who play a specific type of slot machine that has special characteristics and a
special target market (details on this machine and its market are proprietary and were
therefore not discussed in this study). Future study using the general methodology
suggested in this study should examine a more diverse group of subjects to determine if
the effects of ambient scent are generalizable across a wider array of people.
The dependent variable Focus Group Output in this study was calculated as a group
total instead of total contributions on an individual participant basis. Future research
using this methodology should include tracking the focus group output more closely on
an individual contribution basis, then linking it with the earlier behaviors exhibited in the
waiting room and the survey data in such a way that the subject’s privacy is protected.
This would increase the statistical power of the analysis, providing more meaningful
information.
The values for the behavioral dependent variables were calculated using content
analysis. While content analysis is considered to be a quantitative method, the
interpretation of the videotaped data was still highly subjective and depended on the
viewpoint of the observer. This resulted in lower than desired inteijudge reliability
measures. This study was intended as an exploratory foray into a new methodology for
studying ambient scent’s effect on interactions in an environment. Future research might
use the techniques proposed in this study with a refined list of the expected behaviors to
improve the reliability of the content analysis and thus the reliability of the overall study.
Improved training of the judges to provide more consistent, reliable observations should
also be explored.
Reproduced with permission of the copyright owner. Further reproduction prohibited without permission.

137
The four measures used in this study as covariates - Pleasure, Arousal, Dominance,
and Mood - were not suitable for use as covariates and were thus dropped from the
analysis. However, the Affiliative Tendency is suitable for use as a covariate if the
individual scores can be linked to the behaviors exhibited by each study subject. This
measure offered some important information and should be included in future research.
If this were to happen, the researcher should insure the ability to match the subjects’
behaviors with their Affiliative Tendency scores, to screen out any prior tendency to
affiliate with others that might skew the data.
Future study could also examine whether a different scent would have the same
effect. This study used essential oil of geranium in the scented condition. This particular
scent was chosen because it is considered pleasant but non-evocative, meaning it did not
immediately remind anyone of a particular scent, product, or environment. For example,
other floral scents such as rose or jasmine might remind people of common perfiimes and
perhaps of people they know who wear the perfiune. Citrus scents such as lemon
(detergent) or orange (cleaners, deodorizers) may remind people of specific products or
situations where these products were used. Pleasant scents other than essential oil of
geranium may have an even more pronounced effect on people’s behaviors in a meeting
or focus group environment. Perhaps a scent that is more congruent with the goals of a
particular meeting situation could be examined, such as using a “new car scent” while
training a group of new car sales representatives.
The study of ambient scent and its effect on human behavior by creating arousal and
generating affect for places and other people in the place is a field that is still in its
infancy. The implications of gaining a better understanding of how to manipulate this
Reproduced with permission of the copyright owner. Further reproduction prohibited without permission.
138
variable in the physical environment could be far-reaching for any services industry, but
particularly for the hospitality industry. Hotels and restaurants could, in effect, develop a
“signature scent” that, when experienced outside the company’s environment, evokes
memories of pleasant experiences in that environment and causes the consumer to think
about the company. As the old saying goes, “any publicity is good publicity”. The free
“publicity” offered when a special scent evokes pleasant memories could be part of the
next frontier in hospitality marketing.
Reproduced with permission of the copyright owner. Further reproduction prohibited without permission.

APPENDIX A
SURVEYS
139
Reproduced with permission of the copyright owner. Further reproduction prohibited without permission.

140
Preliminary Survey - administered after 15 minutes in the waiting room.
Below is a list o f words that can be used to describe places. We would like you to rate bow accurately each word below describes this room. Use the following rating scale for your answer, where a 1 means that the description is extremely inaccurate and a 6 means that the description is extremely accurate. You may use any number on this 1 to 6 scale.
ExtremelyInaccurate
ExtremelyAccurate
This room is:
Nice 1 2 3 4 5 6
Satisfying 1 2 3 4 5 6
Alive 1 2 3 4 5 6
Displeasing 1 2 3 4 5 6
Active 1 2 3 4 5 6
Repulsive 1 2 3 4 5 6
Drowsy 1 2 3 4 5 6
Pleasant 1 2 3 4 5 6
Idle 1 2 3 4 5 6
Comfortable 1 2 3 4 5 6
Lazy 1 2 3 4 5 6
Fast 1 2 3 4 5 6
The following six adjective pairs describe feelings in a particular situation. Some o f the pairs might seem unusual, but you probably feel more one way than the other. So, for each pair, put a check mark (Example: :__ :_V_ :__ J close to the adjective which you believe to describe your feelings better at this time.The more appropriate that adjective seems, the closer you put your check mark to it.
Controlling
Influential
In control
Important
Dominant
Autonomous
Controlled
Influenced
C ared fo r
Awed
Submissive
Guided
Reproduced with permission of the copyright owner. Further reproduction prohibited without permission.

141
Please use the following scale to indicate the degree o f your agreement or disagreement with each o f the statements. Record your answers in the spaces provided below.
+4 = Very strong agreement +3 = Strong agreement +2 = Moderate agreement +1 = Slight agreement
0 = Neither agreement nor disagreement -1 = Slight disagreement -2 = Moderate disagreement -3 = Strong disagreement -4 = Very strong disagreement
When I’m introduced to someone new, I don’t make much effort to be liked.
I prefer a leader who is friendly and easy to talk to over one who is more aloof and respected by his followers.
When I’m not feeling well, I would rather be with others than alone.
If I had to choose between the two, I would rather be considered intelligent than sociable.
Having friends is very important to me.
I would rather express open appreciation to others most o f the time than reserve such feelings for special occasions.
I enjoy a good movie more than a big party.
I like to make as many friends as I can.
I would rather travel abroad starting my trip alone than with one or two friends.
After I meet someone I did not get along with, I spend time thinking about arranging another, more pleasant meeting.
I think that fame is more rewarding than fnendship.
I prefer independent work to cooperative effort.
I think that any experience is more significant when shared with a friend.
When I see someone I know walking down the street, I am usually the first one to say hello.
I prefer the independence which comes from lack o f attachments to the good and warm feelings associated with close ties.
I join clubs because it is such a good way o f making friends.
I would rather serve in a position to which my friends nominated me than be appointed to an office by a distant national headquarters.
I don’t believe in showing overt affection toward friends.
Reproduced with permission of the copyright owner. Further reproduction prohibited without permission.

142
+4 = Very strong agreement +3 = Strong agreement +2 = Moderate agreement +1 = Slight agreement
0 = Neither agreement nor disagreement -1 = Slight disagreement -2 = Moderate disagreement -3 = Strong disagreement -4 = Very strong disagreement
I would rather go right to sleep at night than talk to someone else about the day’s activities.
I have very few close friends.
When I’m with people I don’t know, it doesn’t matter much to me if they like me or not.
If I had to choose, I would rather have strong attachments to my friends than have them regardme a witty and clever.
I prefer individual activities such as crossword puzzles to group ones such as bridge or canasta.
I am much more attracted to warm, open people than I am to standoffish ones.
I would rather read an interesting book or go to the movies than spend time with friends.
When traveling, I prefer meeting people to s in g ly enjoying the scenery or going places alone.
The following four statements ask about your current mood. Please indicate your answer using the 10- point scale, where a 1 means that you Strongly Disagree with the statement and a 5 means that you Strongly Agree with the statement.
StronglyDisagree
StronglyAgree
Currently, I am in a good1 2 3 4 5
mood.As I answer thesequestions I feel very cheerful
1 2 3 4 5
For some reason I am notvery comfortable right 1 2 3 4 5now. (r)At this moment I feel
1“edgy” or irritable, (r)
2 3 4 5
The last few questions will be used to group your answers with those o f others who complete this survey.
Gender (please circle one): Male Female
What is your current age (in years): _________________________________
Do you smoke tobacco products once or more per day? Yes No
Reproduced with permission of the copyright owner. Further reproduction prohibited without permission.

143
Post-Focus Group Survey - administered after the conclusion o f the focus group session.
Please indicate your agreement or disagreement with the following statements. U se the scale provided below, where a 1 means that you Strongly Agree with the statement and a 7 means that you Strongly Disagree with the statement. You may use any number on the 1 to 7 scale.
Strongly Strongly Agree Disagree
I felt:In harmony with others
2 3 4 5 6 7
I interacted well with others
1 2 3 4 5 6 7
I made new friends1 2 3 4 5 6 7
My skills were appreciated by others
1 2 3 4 5 6 7
Needed by the group2 3 4 5 6 7
I pulled my weight 1 2 3 4 5 6 7
Please indicate your agreement or disagreement with the following statements. You may elaborate in the space below each question i f you wish.
The lighting was good.
If you disagree, why?
Agree Disagree
The furniture was comfortable.
If you disagree, why? ________
Agree Disagree
The room temperature was comfortable.
If you disagree, why? _________________
Agree Disagree
I did not notice present o f a scent in the room(s).
I f you disagree, why? ________________________
Agree Disagree
I did not notice the presence o f any background noise in the room(s).
If you disagree, why? ___________________________________________
Agree Disagree
Thank you very much for your time. Please return this survey to the focus group moderator.
Reproduced with permission of the copyright owner. Further reproduction prohibited without permission.
APPENDIX B
INFORMED CONSENT NOTIFICATION
144
Reproduced with permission of the copyright owner. Further reproduction prohibited without permission.

145
University of Nevada, Las Vegas Department of Hotel Administration
INFORMED CONSENT
General Information:I am D ina Z em ke, a D octora l Student from the U N L V D epartm ent o f H otel A dm inistration . I am the researcher on th is project. Y ou are in vited to participate in a research study. T h e study is intended to h e lp casin o gam e m ach ine m anufacturers im prove their k n ow led ge-b ased casin o gam es and to d evelop n ew gam es that consum ers are in terested in p laying.
Procedure:I f you volu nteer to participate in this study, y o u w ill b e asked to do the fo llow in g:
1. Participate in a fo cu s group sess io n that w ill b e h e ld at the Stan F ulton B u ild in g on the U n ivers ity o f N evad a Las V eg a s cam pus.
2. T he fo cu s group se ss io n w ill last for around 2 hours.3. Y ou w ill be asked to com p lete tw o surveys, one b efore the fo cu s group b eg in s and one
fo llo w in g com p letion o f the focu s group. I f y ou n eed to use reading g la sses , p lea se bring them w ith y o u to the session .
4. A llo w y o u r se lf to be v id eo taped and audio taped during the entire tim e that y o u are in the Stan F ulton B u ild in g .
5. S om e o f the room s that you w ill b e in m ay h ave b een exp osed to c lean in g ch em ica ls or air fresheners. Y o u w ill b e exp osed to these ch em ica ls in the air i f th ey are present. A lis t o f the p otentia l ch em icals is attached - p lease exam ine this lis t and do n ot sign up for the fo cu s group i f you think you m ay have a n egative reaction to them .
Benefits of Participation:B y participating y o u w ill h elp in the d evelopm en t o f k n ow led ge-b ased casin o gam es. Y o u w ill a lso help m e to com p lete m y doctoral dissertation. I k n ow that y ou h ave a b u sy sch ed u le , so I w ou ld lik e to o ffer y o u $ 5 0 for your participation in the focu s group. Y o u w ill rece iv e the $50 after the fo cu s group se ss io n is fin ished .
Risks of Participation in this Study:• Y ou w ill n eed to provide your ow n transportation to and from the focu s group.• T he fo cu s group w ill require approxim ately tw o (2 ) hours o f your tim e.• Y o u w ill b e v id eotaped w h ile y ou are in the focu s group facility . I f y o u are
uncom fortable b e in g videotaped , p lease do n ot vo lu nteer to participate in th is study.• In addition, there m ay be som e airborne allergens present, su ch as cigarette sm ok e or air
freshener. I f y o u have allerg ies or a respiratory con d ition such as asthm a or reactive airw ay d isease , p lea se do n ot volunteer to participate in th is study.
• Y o u m ay a lso b e uncom fortable answ ering som e o f the q uestions asked. Y o u are en cou raged to d iscu ss this w ith m e either n o w or w h en y o u are at the Stan F ulton B u ild in g . I w ill exp la in the q uestions to you in m ore detail and i f y o u are uncom fortable an sw ering them , y o u m ay d eclin e to answ er them .
Reproduced with permission of the copyright owner. Further reproduction prohibited without permission.

146
Knowledge-Based Casino Games INFORMED CONSENT
Contact Information:If you have any questions about the study or if you believe you may have experienced harmful effects as a result of participation in this study, you please contact Stowe Shoemaker, my faculty advisor, at (702) 895-1794.
For questions regarding the rights of research subjects, you may contact the UNLV Office for the Protection of Research Subjects at 895-2794.
Voluntary Participation:Your participation in this study is voluntary. You may refuse to participate in this study or in any part of this study. You may withdraw at any time without prejudice to your relations with the university. You are encouraged to ask questions about this study at the beginning or any time during the research study.
Confidentiality:All information gathered in this study will be kept completely confidential. No reference will be made in written or oral materials that could link you to this study. All records will be stored in a locked facility at UNLV for at least 3 years after completion of the study. After the storage time the information gathered will be destroyed.
Reproduced with permission of the copyright owner. Further reproduction prohibited without permission.
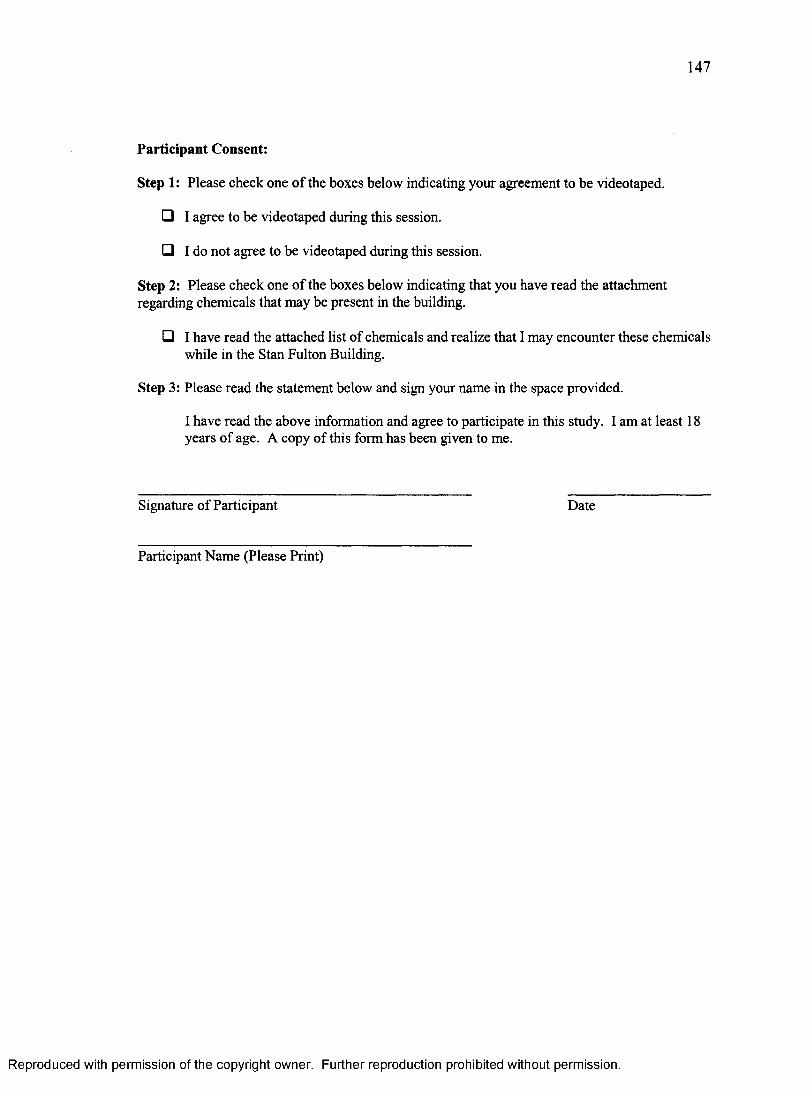
147
Participant Consent:
Step 1: Please check one of the boxes below indicating your agreement to be videotaped.
□ I agree to be videotaped during this session.
□ I do not agree to be videotaped during this session.
Step 2: Please check one of the boxes below indicating that you have read the attachment regarding chemicals that may be present in the building.
□ I have read the attached list of chemicals and realize that I may encounter these chemicals while in the Stan Fulton Building.
Step 3: Please read the statement below and sign your name in the space provided.
I have read the above information and agree to participate in this study. I am at least 18 years of age. A copy of this form has been given to me.
Signature of Participant Date
Participant Name (Please Print)
Reproduced with permission of the copyright owner. Further reproduction prohibited without permission.

148
Y our focu s group se ss io n is schedu led for:
, a t ______________ in the Stan Fulton B u ild in g , R oom 234 .D ay D ate T im e
N O T E : P lease do n ot w ear perfum e or co lo g n e or other scen ts to the se ssio n -- the m oderator is allergic to them!
The session sh ould last approxim ately 2 hours. P lease arrive 5 m inutes early. I f you w ill not be able to attend, p lea se contact D in a Z em ke v ia em ail at d m zem ke@ hotm ail.com or at 858 -6194 .
Thanks again for your participation!
Reproduced with permission of the copyright owner. Further reproduction prohibited without permission.
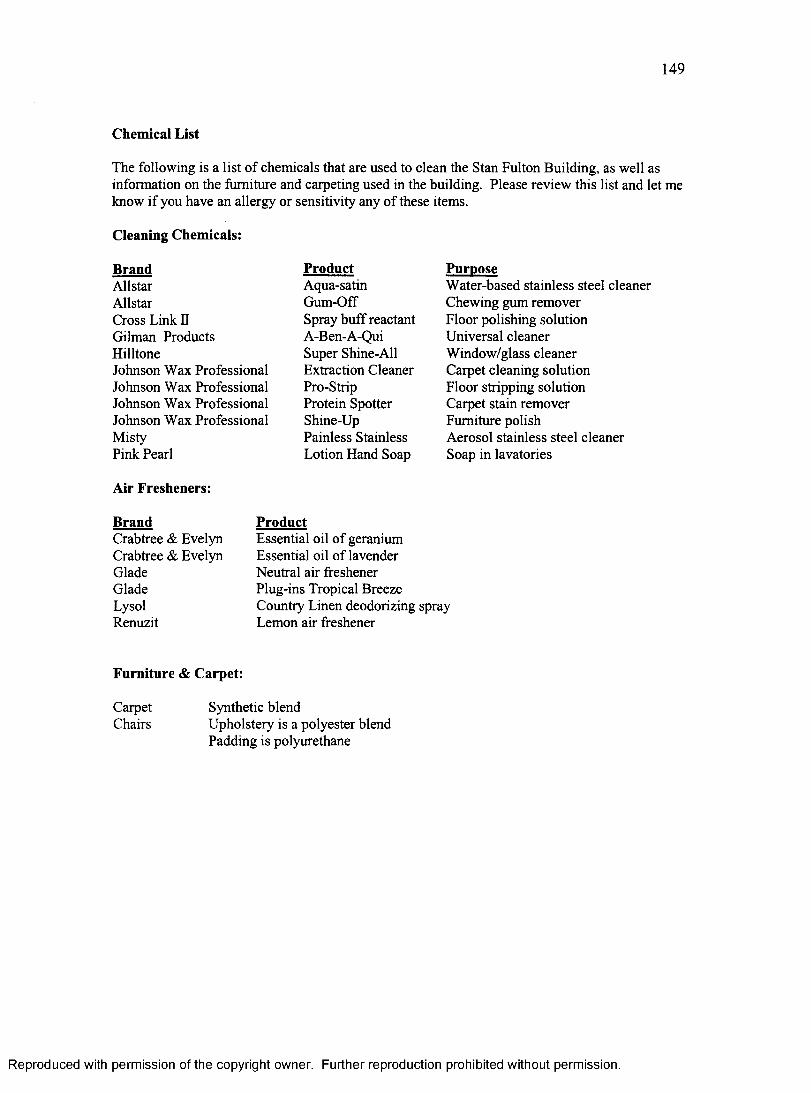
149
Chemical List
The following is a list of chemicals that are used to clean the Stan Fulton Building, as well as information on the furniture and carpeting used in the building. Please review this list and let me know if you have an allergy or sensitivity any of these items.
Cleaning Chemicals:
BrandAllstar Allstar Cross Link II Gilman Products HilltoneJohnson Wax Professional Johnson Wax Professional Johnson Wax Professional Johnson Wax Professional Misty Pink Pearl
ProductAqua-satinGum-OffSpray buff reactant A-Ben-A-Qui Super Shine-All Extraction Cleaner Pro-Strip Protein Spotter Shine-Up Painless Stainless Lotion Hand Soap
PurposeWater-based stainless steel cleaner Chewing gum remover Floor polishing solution Universal cleaner Window/glass cleaner Carpet cleaning solution Floor stripping solution Carpet stain remover Furniture polish Aerosol stainless steel cleaner Soap in lavatories
Air Fresheners:
BrandCrabtree & EvelynCrabtree & EvelynGladeGladeLysolRenuzit
ProductEssential oil of geranium Essential oil of lavender Neutral air freshener Plug-ins Tropical Breeze Country Linen deodorizing spray Lemon air freshener
Furniture & Carpet:
Carpet Synthetic blendChairs Upholstery is a polyester blend
Padding is polyurethane
Reproduced with permission of the copyright owner. Further reproduction prohibited without permission.

APPENDIX C
EXPERT JUDGE TRAINING MANUAL
150
Reproduced with permission of the copyright owner. Further reproduction prohibited without permission.

151
Waiting Room Environment - Interactions between Strangers
General Information:
Contact: Dina Zemke, Ph.D. Candidate, Hotel College555-5555 (8:00 a.m. to 9:00 p.m. daily) [email protected]
Completion Date: No later than April 30 (April 20 if possible)Work shall be performed at your convenience
Compensation:As a thank-you for your help with this project, I will pay you $ 15/hour of your time, including today’s training session. Please record the time you put into the project on the attached timesheet. Your participation in this project does not imply employment by me.
I do not anticipate that you will need to purchase materials or supplies for this project. However, if you need to make photocopies or need to purchase other supplies, please either get them from me or provide a receipt and I will reimburse you for your expenses.
Equipment you need to provide:You will need to have access to a television and VCR (VHS format). You will also need to provide your own pens, pencils, etc. I will provide copies of all forms that you will need to complete this project.
Project Overview
This study is my dissertation. In this section of the project, I am looking at the effects that ambient scent has on affiliation behaviors and social interactions among a group of strangers in a waiting room setting. There are two conditions that the people in the waiting room might have experienced - either the room was left unscented or it was scented with essential oil of geranium. You will not be notified which group had which condition.
The people you will observe in the videotapes are waiting to participate in a focus group that discussed a certain slot machine game. They did not know each other before they entered the waiting room.
The videotape you will analyze has the results for 4 different sessions. Each session lasted approximately 15 minutes, so you will analyze approximately 1 hour of data. Sound is not included in the video, so you will only analyze movements in the space.
Reproduced with permission of the copyright owner. Further reproduction prohibited without permission.

152
The data you will observe will have been collected at two different times during the day - at 4:00 p.m. and at 6:00 p.m. You will notice a difference in the appearance of the room because the late afternoon sun affects the appearance of the windows in the room. At the beginning of each session, I appear and provide the number of the session that you are about to observe. If it is not clear which session you are viewing while you are watching the tape, please contact me and I will help figure it out.
Reproduced with permission of the copyright owner. Further reproduction prohibited without permission.

153
Behavior Observation
We are looking at 3 basic types of behaviors in this study - affiliation, social interaction, and avoidance.
The people you will observe generally entered the room, sat in a chair, and remained in that spot for the duration of the time in the waiting room. Each chair is numbered on the diagram I have provided.
AffiliationIn this situation, we are looking for behavior that indicates that the person desires to affiliate with others in the room. This is not the same as actually interacting with the other people.
Examples of Affiliation behavior:• Eye contact
• Body Orientation
• Gestures
Increasing attempts at eye contact; increased looking in the direction of other people
Increasingly facing other people
Mirroring or parallel behaviors Mirroring: mirror image behaviors between people. For example, if one person scratches their chin with their left hand, the other person scratches their chin with their right hand.Parallel: two or more people move in parallel with each other.
• Facial Expressions
• Body Distance
Smiling; “questioning” expressions
Closing distance between themselves and others Leaning toward other(s)Moving chair closer to other(s)
Reproduced with permission of the copyright owner. Further reproduction prohibited without permission.
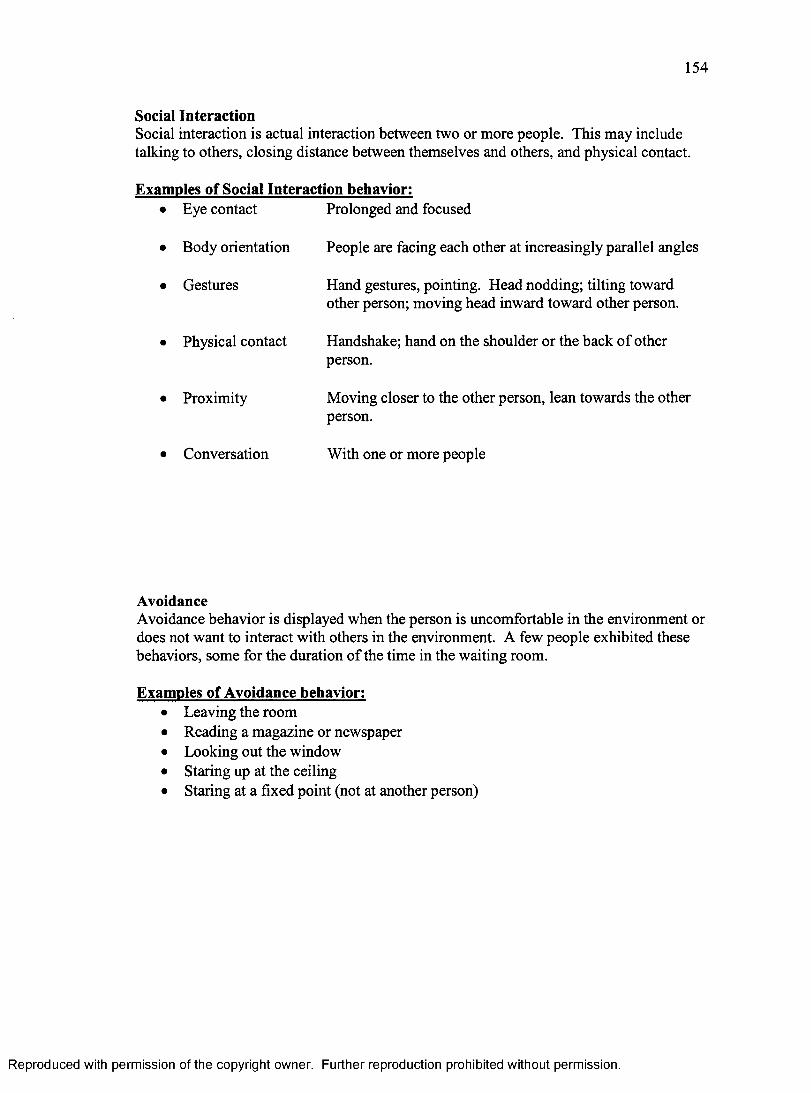
154
Social InteractionSocial interaction is actual interaction between two or more people. This may include talking to others, closing distance between themselves and others, and physical contact.
Examples of Social Interaction behavior:Prolonged and focused
People are facing each other at increasingly parallel angles
Hand gestures, pointing. Head nodding; tilting toward other person; moving head inward toward other person.
Handshake; hand on the shoulder or the back of other person.
Moving closer to the other person, lean towards the other person.
With one or more people
• Eye contact
• Body orientation
• Gestures
• Physical contact
• Proximity
• Conversation
AvoidanceAvoidance behavior is displayed when the person is uncomfortable in the environment or does not want to interact with others in the environment. A few people exhibited these behaviors, some for the duration of the time in the waiting room.
Examples of Avoidance behavior:• Leaving the room• Reading a magazine or newspaper• Looking out the window• Staring up at the ceiling• Staring at a fixed point (not at another person)
Reproduced with permission of the copyright owner. Further reproduction prohibited without permission.

155
How to Record the Observed Data
1. Fill out the cover sheet information for the group that you are about to observe.
2. Fill out one Tracking Form for each person in the waiting room. Identify the person by the seat number that they occupy (i.e., 1, 2, 5, or 12).
3. Watch the videotape and record the activities of each person in the room on their own sheet. Record who the person interacts with and approximately what time into the session it occurs (get the time off your VCR counter).
One way to approach recording the activities of each person is to group the people into clusters. A quick way to identify where clusters will occur is the watch the first few minutes of the session in Fast-Forward mode. This may help you to see larger grouping patterns emerge. Then Rewind the tape and begin watching the tape, focusing on one of the clusters at a time. If you spread out the tracking sheets in front of you, grouped by cluster participants, it will save time (and boredom).
Please try to write clearly (print, if possible). You may use more than one sheet for a participant if you run out of space on the first sheet. Make sure you record the participant number on each sheet.
IF YOU HAVE ANY QUESTIONS AT ALL, PLEASE CALL ME! ! ! My schedule is very flexible and I can meet you to provide more supplies or to go over the tapes or your data.
Reproduced with permission of the copyright owner. Further reproduction prohibited without permission.
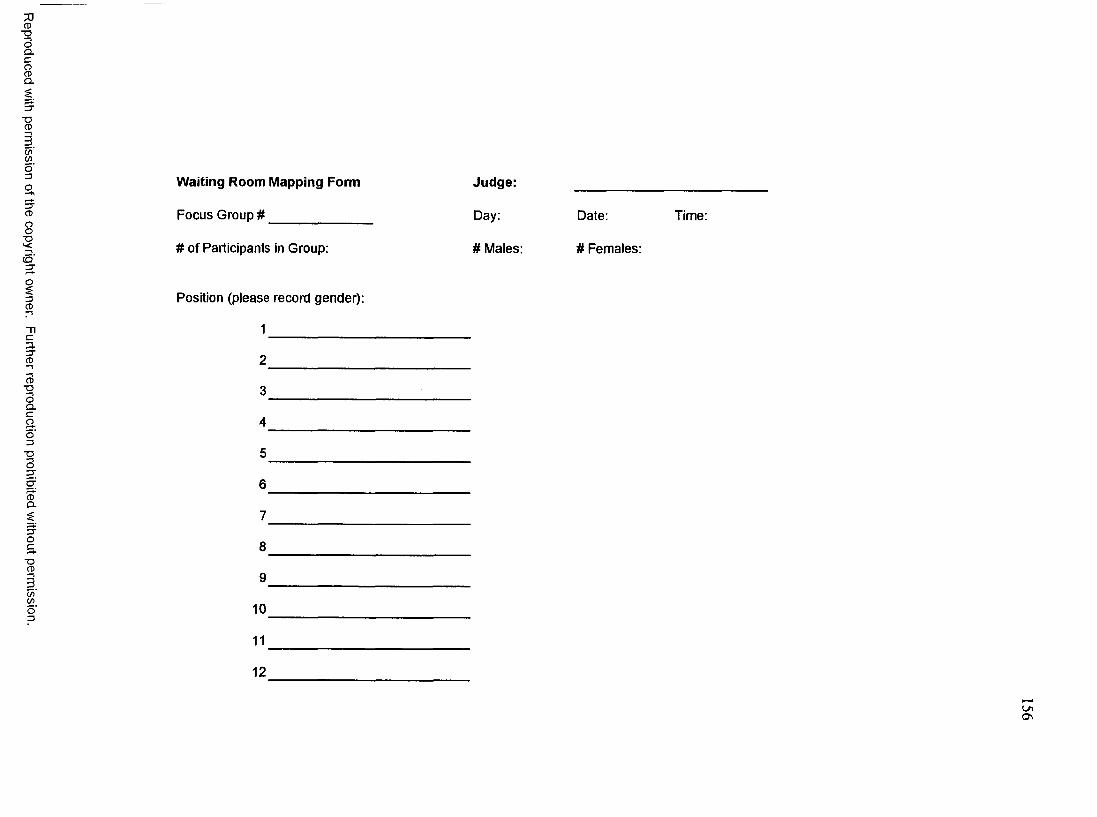
■oII
C/)
o'3
3CD
Cp.
&
(/)(£d3
Waiting Room Mapping Form Judge:
Focus Group # Day: Date: Time:8 ----------------■o
# of Participants In Group: # Males: # Females:CÛ
Position (please record gender):
1______________
2______________
3(D■oII 40
16
7
I 8■oCD
9
10
11_
12
a\

157
C A I ^ T
^ A-WcNfc ;
f^CiA5(^RoOP U)a I t 1 sJé̂ " R o o m
r
Z 1
Reproduced with permission of the copyright owner. Further reproduction prohibited without permission.

158
§OO)C
?CD
£
8C(0■o
I
EH
%
coe(0
I
CO
I
Reproduced with permission of the copyright owner. Further reproduction prohibited without permission.

APPENDIX D
R A W D A T A FO R IN T E R JU D G E A G R E E M E N T
159
Reproduced with permission of the copyright owner. Further reproduction prohibited without permission.

160
a.32O
SI
CO ç
u3 W
SI
CNJ Ç
nD CO-3
<
CO CM
O CM
CM O
CO If)T - CM
O O
^ CO
O O) 0> CO CM O
CO
h- O v - CO
III
ooO)
CDa:
00 G)
CM
O CO
CO CM
CO
O O T - T- O <0 CM
CM CM CD O 7— T— CO
M CO W) lA
CDCM
If) T—CO CD
E ZÜ H
I
CD
O) CO CM
CO CM
O O
CO CO
CD Kf)
O O
N CO
T - CM T " T—
CM 0> T j- 0> t— u>
CO -M"r- 00
c CO :SÜ0 F- CO1
CD01
C M C 0 ^ i f ) C D h - 0 0 0 ) O T ~ C M
Reproduced with permission of the copyright owner. Further reproduction prohibited without permission.
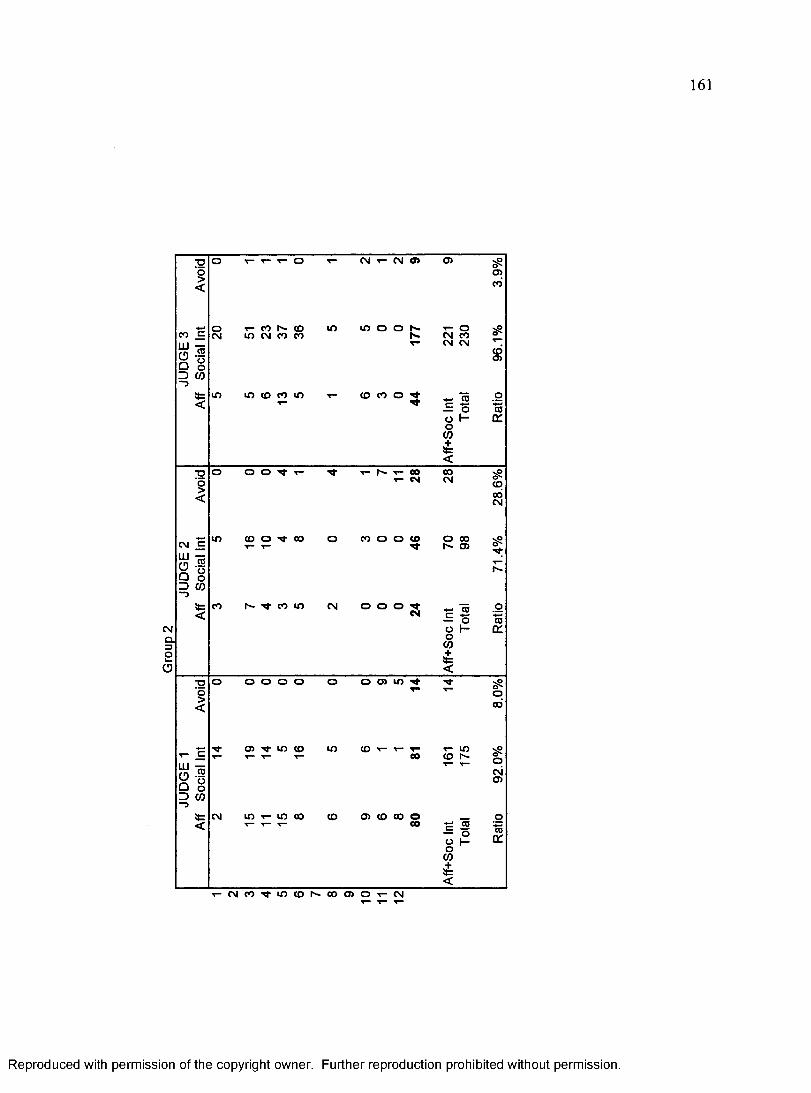
161
CüüW
T— T— o T—
m
^ co h - CD lO CM co co
in
m CD co If) T~
CM T- CM o
CD CO O
O)
^ OMR
co
0co1
coa:
CM Ç
8 lDCO
<
iO
O O -M* T-
CO o 'M' 00
h* ’M’ CO lO
CO
COCM
O O O
R
o 00 r» O)
CM o o o T tCM = 2 -.ë
CMcq32ü
II
ilD (0 -)
<
O O o o
G) ^ If) CD
CM lO en 00
If)
CD
o O) if) ^
co
O) CD 00 o 00
T- LOCD M-
%
__ o
o0 co1
I cea:
CMcO'M-incoi^ooojo (M
Reproduced with permission of the copyright owner. Further reproduction prohibited without permission.

162
O eg CO CO
(Oui
eg o ID eg CO o> o> eg 7— COeg eg
CM COCD o T-co CO egCO
o>
o COCM
o eg LOeg
o> 00CO CO CDeg CO 00O)00
COQ.
O CO CM eg5CO
O) T" M O )
T - LOeg T- O M 00
COO)
03 03 lO
egco^LO(oe~ooo30v-eg
Reproduced with permission of the copyright owner. Further reproduction prohibited without permission.
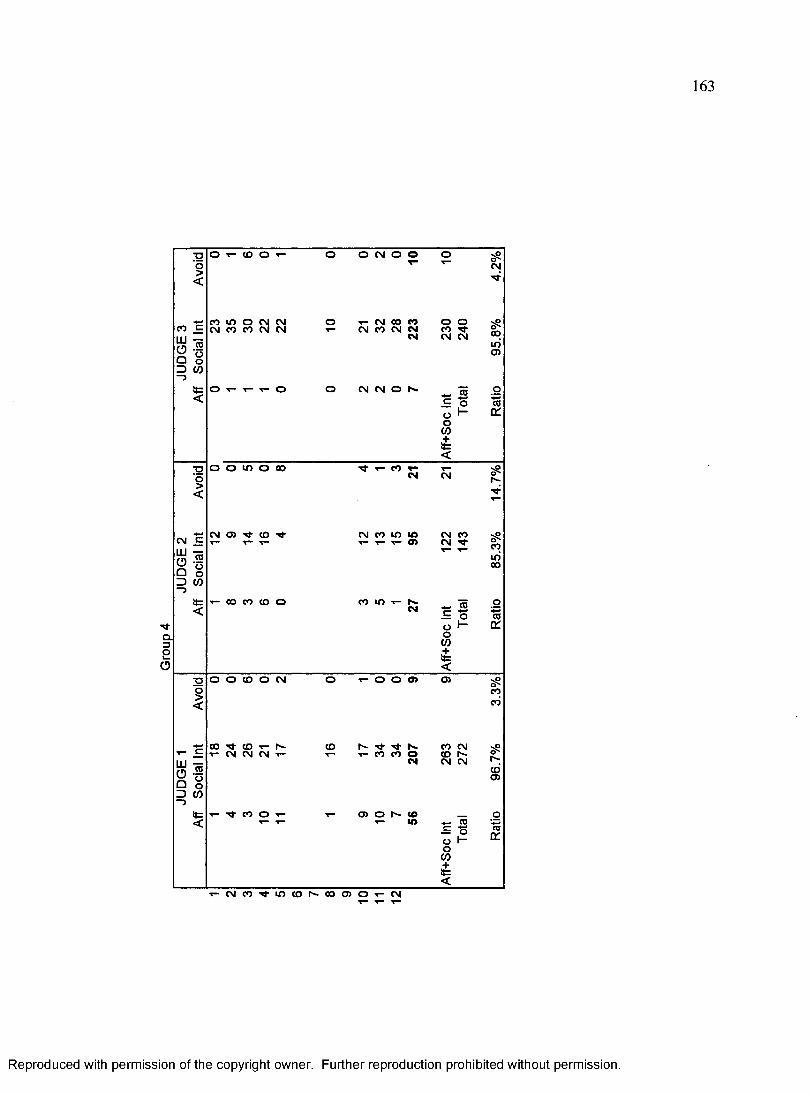
163
o CM o o Oo o
co I / ) o CM CM CM CO CO CM CM
O T - CM CO O CM CO CM CM
CMCO co M"
CM CM COiri
CM CM o
o kO o coCM
CM 0> "M* CD ^ CM CO m M)T— ^ T- o CM co CM 'M*CM CO
if)00
00 co CD oCM
O CD O CM o>3coco
oo co CM CDCM CM
CM CM CM T -CM
O)
o> O <oT— lf>
T - " C M C 0 M - k 0 C D r ^ 0 0 C 3 > O CM
Reproduced with permission of the copyright owner. Further reproduction prohibited without permission.

164
o N. CO to CsJ T- ( o CO CO m00 CO
CO
OCOO-^OCNOlOCOT— 7— X— h* in 00 ^ mCNJ COCO
R O CD o O) N. egCO
5 ID COCO
CO O CO CO CO Oi
eg CM
ina.
T— CO T— CO m h*“CO3 CO
N-CMCOOCMCOCOt- T— T- wo ■M-c\i
CM oo o
% H
T-CMCO'<tinCDI^OOO)OT-CM
Reproduced with permission of the copyright owner. Further reproduction prohibited without permission.

165
00 lO "4- 00CO T -
O ) CO h - 05 CO 05
COCO
OO
§
O CO CO CO o inLO
o H
O 0 0 ^ CNJ 0 0 lO o ir>
C O O '^O ’̂ CNJt-CDIOOT— T— (\j Tj-lO to 00 CO CM
00
ÛL
COT-CO-M-COTfN^inO)T— <DCOCD
o c o m o c M i o o o t O ’̂ colOCD
CMCO^lOCDh^OOO)Ov-(M
Reproduced with permission of the copyright owner. Further reproduction prohibited without permission.

166
CO in CO CO CO
O O CM CNl CN O CM O O) in COCO S ' a>
C O t- C O C O O O ' ^ C O C O C OCM
CO 1^ in o CO CM5CO
CO
in
CO
in
O C O C M C O C M t - i n c O O l O T— T— m in
CO CO
in
CO c o c o o o o c o o i n
C M C O - M - i n C O t ^ O O O î O
Reproduced with permission of the copyright owner. Further reproduction prohibited without permission.

167
■gîCD i
ii<
^m^^-CDh-OCO " S
0> CD CM co ■ M - C O 'S - O C D C D 'M ' jO
00 ^ o>
m
a o CD CM •«- CM
SI
s
CMCOCM
00
mCC
■go
codl32
CD
cM^-M-r-m^fcococM co R
s i3 CO “0<
O (D co 0> ^ CO t “ CM CM
CO O CO O
Tj-^r^OCMCMCOCO
o TJ- oT- ^
CD co i n
coco
LO co 00 CM T - CM
II
s?oN-'
co00
m Q
mCC
CM CM co
I-4- —u u m CD ü
’î - o m c M i n ^ ^ c o o
CM CM co CO CM O)
CM «O CM
O) CO CM 00
CM T - N CM
CDCM
(3) m o co
II
coO)
g
mCC
CMcor r i ncoN- oocDO CM
Reproduced with permission of the copyright owner. Further reproduction prohibited without permission.

REFERENCES
Altman, I. (1976). Some perspectives on the study of man-environment phenomena. In
H. M. Proshansky, W. H. Ittelson, & L. G. Rivlin (Eds.), Environmental
psychology: People and their physical settings (2" ̂ed.) (pp. 27 - 37). New York:
Holt, Rinehart and Winston.
Areni, C. S., & Kim, D. (1993). The influence of background music on shopping
behavior: classical versus top-forty music in a wine store. Advances in Consumer
Research, 20, 336-339.
Ashby, F. G., Valentin, V. V., & Turken, A. U. (2002). The effects of positive affect and
arousal on working memory and executive attention. In S. Moore & M. Oaksford
(Eds.), Emotional cognition: From brain to behaviour (pp. 245 - 287).
Philadelphia, PA: John Benjamins Publishing Co.
Aubert-Gamet, V., & Cova, B. (1999). Servicescapes: From modem non-places to
postmodern common places. Journal o f Business Research, 44, 37-45.
d’Astous, A. (2000). Irritating aspects of the shopping environment. Journal o f Business
Research, 4 9 ,149 - 156.
Baker, J., Levy, M., & Grewal, D. (1992). An experimental approach to making retail
store environmental decisions. Journal o f Retailing, 68, 445-60.
168
Reproduced with permission of the copyright owner. Further reproduction prohibited without permission.
169
Barker, R. G. (1976). On the nature of the environment. In H. M. Proshansky, W. H.
Ittelson, & L. G. Rivlin (Eds.), Environmental psychology: People and their
physical settings (2" ̂ed.) (pp. 12 - 26). New York: Holt, Rinehart and Winston.
Baron, R. A. (1990). Environmentally induced positive affect: Its impact on self-
efficacy, task performance, negotiation, and conflict. Journal o f Applied Social
Psychology, 20, 368-384.
Beauchamp, G. K. (1994). The chemical senses and pleasure. In D. M. Warburton (Ed.),
Pleasure: The politics and the reality (pp. 29 - 37). New York: John Wiley &
Sons.
Bechtel, R. B., & Zeisel, J. (1987). Observation: The world under a glass. In R. B.
Bechtel, R. W. Marans & W. Michelson (Eds.), Methods in environmental and
behavioral research (pp. 11 - 40). New York: Van Nostrand Reinhold Company.
Bell, P. A., Fisher, J. D., & Loomis, R .J. (1978). Environmental psychology.
Philadelphia: W. B. Saunders.
Berry, J. W. (1976). Ecological and cultural factors in spatial perceptual development.
In H. M. Proshansky, W. H. Ittelson, & L. G. Rivlin (Eds.), Environmental
psychology: People and their physical settings (2"*̂ ed.) (pp. 125 - 133). New
York: Holt, Rinehart and Winston.
Berry, L. L. (1981). The employee as customer. Journal o f Retail Banking, 111, 33-40.
Berry, L. L. (1980). Services marketing is different. In R. T. Rust, A. J. Zahorik, & T. L.
Keiningham (Eds.), Readings in service marketing (1996) (pp. 16-23). New
York: HarperCollins.
Reproduced with permission of the copyright owner. Further reproduction prohibited without permission.

170
Birdwhistel, R. L. (1970). Kinesics and context: Essays on body motion communication.
Philadelphia, PA: University of Pennsylvania Press.
Bitner, M. J. (1992). Servicescapes: The impact of physical surroundings on customers
and employees. Journal o f Marketing, 56,51-11.
Bone, P. F., & Jantranis, S. (1992). Olfaction as a cue for product quality. Marketing
Letters, 3, 289-296.
Bonnes, M., & Secchiaroli, G. (1995). Environmental psychology: A psycho-social
introduction. London: Sage Publications.
Booms, B. H., & Bitner, M. J. (1992). Marketing services by managing the
environment. Cornell Hotel and Restaurant Quarterly, 33, 35-39.
Bounds, W. (1996, May 6). Sounds and scents to jolt drowsy drivers. Wall Street
Journal, pp. B l, B5.
Bowen, J. T., & Shoemaker, S. (1998). Loyalty: A strategic commitment. Cornell Hotel
and Restaurant Administration Quarterly, 39, 12-25.
Bruner, G. C., & Hensel, P. J. (1992). Marketing scales handbook: A compilation o f
multi-item measures. Volume II. Chicago: American Marketing Association.
Campbell, J. (1997). The impact of videoconferenced meetings on the pattern and
structure of organizational communication. Singapore Management Review, 19,
77-93.
Cancer facts and figures 2003. (2003). Atlanta, GA: American Cancer Society, Inc.
Retrieved June 3,2003, from
http://www.cancer.org/downloads/STT/CAFF2003PWSecured.pdf.
Reproduced with permission of the copyright owner. Further reproduction prohibited without permission.
171
Cooper, D. R, & Schindler, P. S. (1998). Business research methods (6‘̂ ed). Boston:
Irwin McGraw-Hill.
Dahl, H. (1979). The appetite hypothesis of emotions: A new psychoanalytic model of
motivation. In C. E. Izard (Ed.), Emotions in personality and psychopathology,
(pp. 201 - 225). New York: Plenum Press.
Feinstein, A. H., Hinkston, T. S., & Erdem, M. (in press). A study of the effect of music
genre and intensity on ethnic menu item selection. Journal o f Foodservice
Business Research.
Festinger, L., Schachter, S., & Black, K. (1963). Social pressures in informal groups.
Stanford, CA: Stanford University Press.
Gulas, C. S., & Bloch, P. H. (1990). Right under our noses: Ambient scent and
consumer responses. Journal o f Business and Psychology, 70, 87 - 98.
Hair, J. F. Jr., Anderson, R. E., Tatham, R. L., & Black, W. C. (1998). Multivariate data
analysis (5* ed.). Upper Saddle River, NJ: Prenctice Hall.
Hall, E. T. (1976). The anthropology of space: An organizing model. In H. M.
Proshansky, W. H. Ittelson, & L. G. Rivlin (Eds.), Environmental psychology:
People and their physical settings (2"“̂ ed.) (pp. 158 - 169). New York: Holt,
Rinehart and Winston.
Hart, R. A., & Moore, G. T. (1976). Extracts from “The development of spatial cognition:
A review”. In H. M. Proshansky, W. H. Ittelson, & L. G. Rivlin (Eds.),
Environmental psychology: People and their physical settings (2" ̂ed.) (pp. 258 -
281). New York: Holt, Rinehart and Winston.
Reproduced with permission of the copyright owner. Further reproduction prohibited without permission.
172
Hinkle, D. E., Wiersma, W., & Jurs, S. G. (1998). Applied statistics for the behavioral
sciences (4‘̂ éd.). Boston: Houghton Mifflin Company.
Ittelson, W. H. (1976a). Some issues facing a theory of environment and behavior. In H.
M. Proshansky, W. H. Ittelson, & L. G. Rivlin (Eds.), Environmental psychology:
People and their physical settings (2"‘̂ ed.) (pp. 51 - 59). New York: Holt,
Rinehart and Winston.
Ittelson, W. H. (1976b). Environment perception and contemporary perceptual theory.
In H. M. Proshansky, W. H. Ittelson, & L. G. Rivlin (Eds.), Environmental
psychology: People and their physical settings (2""̂ ed.) (pp. 141 - 154). New
York: Holt, Rinehart and Winston.
Ittelson, W. H., Rivlin, L. G., & Proshansky, H. M. (1976). The use of behavioral maps
in environmental psychology. In H. M. Proshansky, W. H. Ittelson, & L. G.
Rivlin (Eds.), Environmental psychology: People and their physical settings (2"“*
ed.) (pp. 340 - 351). New York: Holt, Rinehart and Winston.
Kahneman, D. (1973). Attention and effort. Englewood Cliffs, NJ: Prentice-Hall.
Kardes, F. R. (1999). Consumer behavior and managerial decision making. Reading,
MA: Addison-Wesley.
Kotler, P. (1994). Marketing management: Analysis, planning, implementation, and
control (8*’’ ed.). Englewood Cliffs, NJ: Prentice Hall.
Kotler, P., Bowen, J., & Makens, J. (1999). Marketing for hospitality and tourism (2" ̂
Ed.). Upper Saddle River, N.J.: Prentice-Hall.
Las Vegas Perspective 2002. (2002). Las Vegas, NV: Metropolitan Research
Association.
Reproduced with permission of the copyright owner. Further reproduction prohibited without permission.

173
Levine, M. W. (2000). Levine & Shefner’s fundamentals o f sensation and perception
(3'̂ '̂ ed.). New York: Oxford University Press.
Machleit, K. A., & Eroglu, S. A. (2000). Describing and measuring emotional response
to shopping experience. Journal o f Business Research, VP, 101 - 111.
Malin, C. L. (2002). Traditional and nontraditional teacher perceptions and
applications o f DAP. Doctoral dissertation. University of Nevada, Las Vegas.
McClelland, D. C. (1985). Human motivation. Glenview, IL: Scott, Foresman and
Company.
McCrae, R. R., & Costa, P.T., Jr. (1996). Toward a new generation of personality
theories: Theoretical contexts for the Five-Factor Model. In J. S. Wiggins (Ed.),
The five factor model ofpersonality: Theoretical perspectives (pp. 51 - 87). New
York: The Guilford Press.
Mehrabian, A. (1976). Public places and private spaces. New York: Basic Books, Inc.
Mehrabian, A. (1980). Basic dimensions for a general psychological theory.
Cambridge, MA: Oelgeschlager, Gunn & Hain, Publishers, Inc.
Mehrabian, A., & Diamond, S. G. (1971). The effects of furniture arrangement, props,
and personality on social interaction. Journal o f Personality and Social
Psychology, 20, 18 - 30.
Mehrabian, A., & Ksionsky, S. (1974). A theory o f affiliation. Lexington, MA: DC.
Heath and Company.
Mehrabian, A., & Russell, J. A. (1974). An approach to environmental psychology.
Boston: Massachusetts Institute of Technology.
TheMerriam Webster Dictionary. (1997). Springfield, MA: Merriam-Webster, Inc.
Reproduced with permission of the copyright owner. Further reproduction prohibited without permission.
174
Mitchell, D. J., Kahn, B. E., & Knasko, S. C. (1995). There’s something in the air:
Effects of congruent or incongruent ambient odor on consumer decision making.
Journal o f Consumer Research, 22, 229-238.
Morrin, M., & Ratneshwar, S. (2000). The impact of ambient scent on evaluation,
attention, and memory for familiar and unfamiliar brands. Journal o f Business
Research, 49, 157 - 165.
Nolte, J. (1999). The human brain: An introduction to its functional anatomy (4*’’ ed.).
New York: Mosby.
North, A. C., Hargreaves, D. J., & McKendrick, J. (1997). In-store music affects product
choice. Nature, 390, 132.
Parasuraman, A., Zeithaml, V. A., & Berry, L. L. (1985). A conceptual model of service
quality and its implications for future research. Journal o f Marketing, 49, 41-50.
Proshansky, H. M., Ittelson, W. H., & Rivlin, L. G. (1974). Freedom of choice and
behavior in a physical setting. In H. M. Proshansky, W. H. Ittelson, & L. G.
Rivlin (Eds.), Environmental psychology: People and their physical settings (2"*̂
ed.) (pp. 170-181). New York: Holt, Rinehart and Winston.
Rivlin, L. G., & Wolfe, M. (1976). The early history of a psychiatric hospital for
children: Expectations and reality. In H. M. Proshansky, W. H. Ittelson, & L. G.
Rivlin (Eds.), Environmental psychology: People and their physical settings (2" ̂
ed.) (pp. 459 - 479). New York: Holt, Rinehart and Winston.
Russell, J. A., & Pratt, G. (1980). A description of affective quality attributed to
environments. Journal o f Personality and Social Psychology, 38, 311-22.
Reproduced with permission of the copyright owner. Further reproduction prohibited without permission.
175
Sharma, A., & Stafford, T. F. (2000). The effect of retail atmospherics on customers’
perceptions of salespeople and customer persuasion: an empirical investigation.
Journal o f Business Research, VP, 183 -191.
Sherman, E., Mathur, A., & Smith, R. B. (1997). Store environment and consumer
purchase behavior: Mediating role of consumer emotions. Psychology &
Marketing, 7V, 361-378.
Shoemaker, S., & Lewis, R. C. (1999). Customer loyalty: The future of hospitality
marketing. International Journal o f Hospitality Management, 18, 345 - 370.
Sinclair, R. C., Moore, S. E., Lavis, C. A., & Soldat, A. S. (2002). The influence of
affect on cognitive processes: Implications of the informative nature of affect in
the area of industrial and product design. In J. Frascara (Ed.), Design and the
social sciences (pp. 178 - 193). New York: Taylor & Francis.
Smith, R. A., & Houston, M. J. (1985). A psychometric assessment of measures of
scripts in consumer memory. Journal o f Consumer Research, 72,214-224.
Spangenburg, E. R., Crowley, A. E., & Henderson, P. W. (1996). Improving the store
environment: Do olfactory cues affect evaluations and behaviors? Journal o f
Marketing, 60, 67 - 80.
Spradley, J. P. (1980). Participant observation. New York: Holt, Rinehart, & Winston,
Inc.
Stokols, D. (1978). Environmental psychology. Annual Review o f Psychology, 29, 253-
95.
Tabachnick, B. G., & Fidell, L. S. (2001). Using multivariate statistics (4*’’ ed.).
Boston: Allyn and Bacon.
Reproduced with permission of the copyright owner. Further reproduction prohibited without permission.

176
Turley, L. W., & Milliman, R. E. (2000). Atmospheric effects on shopping behavior: A
review of the experimental evidence. Journal o f Business Research, 49, 193 -
211 .
Van Toller, S. (1994). The enjoyment of smells: Central, autonomic and trigeminal
interaction in odour perception. In D. M. Warburton (Ed.), Pleasure: The politics
and the reality, (pp. 15 - 21). New York: John Wiley & Sons.
Wessman, A. E. (1979). Moods: Their personal dynamics and significance. In C. E.
Izard (Ed.), Emotions in personality and psychopathology, (pp. 73 - 102). New
York: Plenum Press.
Winkel, G. H. (1985). Ecological validity issues in field research settings. In A. Baum &
J. E. Singer (Eds.), Advances in environmental psychology: Volume 5, Methods
and environmental psychology, (pp. 1 - 41). Hillsdale, NJ: Lawrence Erlbaum,
Associates, Publishers.
Winkel, G. H., & Sasanoff, R. (1976). An approach to an objective analysis of behavior
in architectural space. In H. M. Proshansky, W. H. Ittelson, & L. G. Rivlin (Eds.),
Environmental psychology: People and their physical settings (2" ̂ed.) (pp. 351 -
362). New York: Holt, Rinehart and Winston.
Winkielman, P., Schwarz, N., & Nowak, A. (2002). Affect and processing dynamics. In
S. Moore & M. Oaksford (Eds.), Emotional cognition: From brain to behaviour
(pp. I l l - 135). Philadelphia, PA: John Benjamins Publishing Co.
Yalch, R. F., & Spangenberg, E. R. (2000). The effects of music in a retail setting on
real and perceived shopping times. Journal o f Business Research, 49, 139-147.
Zeithaml, V. A., & Bitner, M. J. (1996). Services marketing. New York: McGraw-Hill.
Reproduced with permission of the copyright owner. Further reproduction prohibited without permission.

VITA
Graduate College University of Nevada, Las Vegas
Dina Marie V. Zemke
Local Address:4515 S. Durango Drive, #2052 Las Vegas, NV 89147
Degrees:Bachelor of Science, Hotel Administration, 1985 Cornell University
Master of Business Administration, Operations Management, 1990 University of Minnesota
Dissertation Title: The Effect of Ambient Scent on Affiliation Behaviors and Social Interactions
Dissertation Examination Committee:Chairperson, Stowe Shoemaker, Ph.D.Committee Member, John Bowen, Ph.D.Committee Member, Cheri Young, Ph.D.Graduate Faculty Representative, Le Ann Putney, Ph.D.
177
Reproduced with permission of the copyright owner. Further reproduction prohibited without permission.