.................... No.1 SINGLE No.1 ALBUM SINGLE PICK ALBUM ...
Upload
khangminh22Category
view
0download
0
THE EFFECT OF ALUMINA PICK-UP ON
MOULD FLUX BEHAVIOUR IN
CONTINUOUS CASTING
by
Gert Adrian Bezuidenhout, B ENG.
Dissertation submitted in partial fulfilment of the degree
Master of Engineering
in the
Department of Materials Science and Metallurgical Engineering,
Faculty of Engineering
at the
University of Pretoria
Leader: Prof. P.C. Pistorius
PRETORIA
1999
©© UUnniivveerrssiittyy ooff PPrreettoorriiaa

AbstractThe effect of alumina pick-up on mould flux behaviour in continuouscastingGert Adrian BezuidenhoutProf. P.C. PistoriusMaterials Science and Metallurgical EngineeringMaster of Engmeering
AuthorLeaderDepartmentDegree
The aim of this study was to determine the influence of alumina increase on the functionmg ofcasting powder durmg continuous castmg. Two aspects of the powder's performance wereexperimentally measured, namely the influence of alumina on the viscosity and thecrystallisation behaviour. These two aspects were then related to the in-mould functioning of thecasting powder with the aid of literature references.
Castmg slag must provide lubrication between the mould surface and the thin steel shell.Alumina mcrease will cause viscosity increase m castmg slags and will hinder lubrication whenthe inflow of casting slag mto the mould/strand gap deteriorates. Heat transfer across the gap isdetermined by the amount of solid casting slag and the form (glass or crystallme) thereof. Heattransfer across a crystalline material may be up to seven times lower than that across a glassphase. The increased alumina will serve to increase the ratio of glassy phase to crystalline phasein the gap, so mcreasing the heat transfer.
To determme the true extent of alumina increase with modem clean steel practice, samples weretaken from the moulds of both the VI and V2 continuous casters at ISCOR Vanderbijlpark. Theinfluence of this alumina mcrease on the viscosity and the crystallisation behaviour of the castingslag were experimentally measured. Viscosity measurements were done with a rotating bobviscometer (in a vertical tube furnace) on two commercial casting powders (with increasmgAh03 content). Viscosity prediction models were evaluated with the data from the measuredviscosity values. Crystallisation measurements were done by quench experiments with the aid ofthe hot thermocouple technique. Crystallisation behaviour after a specified heat cycle waspresented as the percentage opaque material (crystalline) to vitreous material (glassy) measuredwith an optical microscope.
For the seven sequence casts during which samples were collected from the mould, it was foundthat the alumina content of the casting slag reached a steady-state value within the first ladle(first 40 minutes) with an increase of 3 to 4 mass %. The influence of a 4 mass % aluminaincrease on the measured viscosity is small enough that proper lubrication function of the slagwill not be negatively affected. Viscosity prediction models vary in their accuracy and arelimited with respect to the composition range of the casting powder and the temperature rangefor which they are valid.

The increased alumina content was found to have a strong influence on the percentage crystallinematerial present. After the sample was heated to 1300·C, kept there for lOs, and then quenched,the crystalline material will decrease from 60 % to 30 % for 5 mass % alumina added. Thisdecreased crystalline material present may notably increase heat transfer. Full crystallisationdoes not occur at a single temperature, and crystallisation occurs over a temperature interval (ofup to 200·C). This means that crystallisation temperature values quoted by casting powdermanufacturers depend on the heat cycle and the technique used during crystallisationmeasurements. Several crystalline phases are usually present in solidified casting slag and thesecrystalline phases are strongly influenced by the alumina content: the stable crystalline phasesmay change as alumina content increases.
For the current alumina increase in casting powders the effect on viscosity is small, whilecrystallisation behaviour may be influenced to a greater extent.
Key terms: continuous casting, mould, casting powder, alumina, viscosity, viscosity predictionmodel, crystallisation, hot thermocouple technique, lubrication, heat transfer

SamevattingTitelOuteurStudieleierDepartementGraad
Die effek van aluminatoename op gietpoeiergedrag tydens stringgietingGert Adrian BezuidenhoutProf. P.e. PistoriusMateriaalkunde en Metallurgiese IngenieursweseMeester in Ingenieurswese
Die doel van hierdie studie was om die invloed van die toename in alumina op die funksioneringvan gietpoeier tydens stringgieting te bepaal. Twee aspekte van die poeiergedrag iseksperimenteel gemeet, naamlik die invloed van alumina op viskositeit en kristallisasiegedrag.Hierdie twee aspekte is daarna met die hulp van literatuurverwysings na die funksionering vandie gietpoeier in die gietvorm herlei.
Die gietslak moet smering bied tussen die wand van die gietvorm en die dun staalskil. Aluminatoename sal die viskositeit van 'n gietpoeier verhoog wat die smering sal benadeel sodra dit dieinvloei van gietslak in die gietvorm/staalskil gaping bemvloed. Hitte-oordrag oor die gapingword bepaal deur die hoeveelheid gestolde gietslak, asook die aard (glas of kristallyn) daarvan.Hitte-oordrag oor 'n kristallyne materiaal kan soveel as sewe keer laer wees as oor 'n glasfase.Die verhoogde aluminatoename sal tot gevolg he dat die verhouding van glas tot kristalfase indie gaping vergroot, wat die hitte-oordrag ooreenkomstig sal verhoog.
Om die ware omvang van alumina toename in 'n hedendaagse skoonstaal bedryf te bepaal, ismonsters uit die gietvorms van die VI en V2 strlnggietmasjiene te IseOR Vanderbijlparkversamel. Die invloed van hierdie aluminatoename op die viskositeit en kristallisasiegedrag vandie gietslak is eksperimenteel bepaal. Viskositeitsmetings is met 'n roterendesilinderviskometer(in 'n vertikale buisoond) op twee kommersiele gietpoeiers gedoen (met toenemende Ah03inhoud). Modelle wat viskositeit voorspel, is beoordeel aan die hand van die gemeteviskositeitwaardes. Kristallisasiemetings is gedoen deur afbluslopies met 'nwarmtermokoppeltegniek. Die kristallisasiegedrag na 'n gespesifiseerde hittesiklus is gevolgdeur die persentasie ondeursigtige materiaal (kristallyn) en die persentasie deursigtige materiaal
\ (glas) met 'n optiese mikroskoop te bepaal.
Vir die sewe reeks giete waarvan daar monsters uit die gietvorm versamel is, is gevind dat diealumina-inhoud van die gietslak binne die eerste pan (eerste 40 minute) 'n plafonwaarde bereikvan tussen 3 en 4 massa % toename. Die invloed van 4 massa % aluminatoename op gemeteviskositeitswaardes is van so 'n aard dat funksionering van die poeier nie negatief bernvloed salword nie. Viskositeitsvoorspellingsmodelle varieer in hul akkuraatheid, en is slegs geldig oorheperkte bereike van gietpoeiersamestelling en temperatuur.
lDie verhoogde alumina inhoud het 'n sterk invloed op die persentasie kristallyne materiaal. In 'nInonster wat verhit is tot l300oe, gehou is vir 10 sekondes, en afgeblus is, sal die kristallynernateriaal afneem van 60 % na 30 % as 5 massa % alumina toegevoeg word. Hierdie verlaagdekristallyne materiaal kan die hitte oordrag noemenswaardig verhoog. Totale kristallisasie vind

Die plaas by 'n enkele temperatuur nie, en kristallisasie kan plaasvind oor 'n temperatuur intervalvan tot 200
0
C. Hierdie bevinding beteken dat kristallisasie temperatuur waardes wat deurgietpoeier vervaardigers aangegee word, afhanklik moet wees van die hitte-siklus en die tegniekgebruik tydens die kristallisasiemetings. 'n Aantal kristalfases is teenwoordig in gestoldegietslakke en hierdie kristalfases word sterk beinvloed deur die alumina-inhoud. Die gevolg isdat die stabiele kristalfases verander soos die alumina toeneem.
Vir hedendaagse alumina toename in gietslak is die effek op viskositeit klein, tewyl die effek opkristallisasiegedrag meer beduidend m!;}gwees.
Sleutelterme: stringgieting, gietvorm, gietpoeier, alumina, viskositeit,viskositeitvoorspellingmodel, kristallisasie, warmtermokoppelmetode, smering, hitte-oordrag

Table of Contents
2. BACKGROUND (BROAD OVERVIEW)Function of mould powders
2.1. Chemical protection2.1.1. Slag layer above the meniscus2.1.2. Carbon content and the form of carbon2.1.3. Chemical protection of volatile constituents of the casting powder
2.2. Thermal insulation of the steel and molten powder2.2.1. Manufacturing method and characteristics of the powder2.2.2. Melting behaviour of the powder
2.3. Absorption of inclusions2.3.1. How inclusions are formed.2.3.2. Factors determining absorption rate.
Alumina saturationStart Al203 contentViscosityPowder consumption
2.4. Lubrication of the strandFriction force
2.4.1. Liquid lubrication2.4.2. Solid lubrication (Friction)
2.5. Heat transfer in the mould2.5.1. Heat transfer from steel shell to slag2.5.2. Heat transfer through the slag layer
2.5.2.1. Heat transfer through the liquid slag layer2.5.2.2. Heat transfer through the solid slag layer
2.5.3. Heat transfer from slag layer to mould
3.1. Effect of alumina on viscosity3.1.1. The pick-up during sequence casting3.1.2. Mathematical modelling of the influence of slag composition
3.2. Effect of alumina on crystallisation3.2.1. Presenting crystallisation in a usable form3.2.2. The influence of alumina on crystallisation
1010

4.1. Measurement of Alumina increase4.1.1. Sample collection4.1.2. Sample analyses
4.2. Viscosity measurements4.2.1. Apparatus employed
4.2.1.1. Viscometer4.2.1.2. Furnace
4.2.2. Sample preparation4.2.3. Description of test performed4.2.4. True sample analyses
4.2.4.1. Energy dispersive X-Ray analyses4.2.4.2. X-Ray diffraction (XRD) analyses
4.3. Crystallisation4.3.1. Hot Thermocouple Technique and apparatus used
4.3.1.1. Apparatus employed4.3.1.2. Sample preparation4.3.1.3. True sample analyses
4.3.2. Quench experiments4.3.2.2. Apparatus employed4.3.2.1. Description of tests performed4.3.2.3. Sample preparation4.3.2.4. Sample analyses
5.3. Crystallisation of mould powders5.3.1. Difficulties and drawbacks of the hot thermocouple technique
5.2. Viscosity of mould powders5.2.1. Composition
5.2.1.1. Composition of samples used in viscosity experiments5.2.1.2. Composition of samples used in crystallisation experiments
5.2.2. Viscosity - experimentally measuredNon-Newtonian behaviourImplication of a 4 mass % increase in alumina content of STC-89Implication of a 10 mass % increase in alumina content of STC-89
5.2.3. Test of model accuracyRiboudKoyamaKim
5.2.4. Stable mineral phase precipitating

5.3.2. Use of quench experiments5.3.2.1. Results

1. Introduction
Steel making technology and quality control of cast steel have improved greatly during the pastdecade. In continuous casting, mould powders gained a firm place in mould-related technology,due to their decisive effect on the surface quality of the continuously cast product. Castingpowders are added on top of the molten steel surface in the mould where they melt and are drawninto the mould/strand gap during oscillation. Casting powders are used to: protect the steel fromoxidation; provide thermal isolation to prevent partial solidification of the metal surface; absorbinclusions in the steel; lubricate the surface of the strand; and provide homogeneous heat transferbetween the strand and the mould. It is imperative that the powder should perform satisfactory ateach stage since failure to do so will result in inferior steel surface quality.
The chemical composition and physical properties of the in-mould slag are different from thestarting mould powder owing to the reactions at the steel-slag interface (including the absorptionof non-metallic inclusions rising from the steel). For aluminium killed carbon steel the castingpowder especially enriches in Ah03 (alumina), formed by the reaction of aluminium (added tothe steel for the purpose of de-oxidation) with oxygen (dissolved in the steel or from theatmosphere). Alumina enrichment takes place both through the reaction of dissolved aluminiumin the steel with reducible oxides in the casting slag, and by absorption of the alumina floatingfrom the steel. During sequence casting, the alumina content of the casting slag increases, butreaches a steady state value during the first ladle in the sequence [Nakano et al, 1984].
The ability of casting powder to perform its functions should be evaluated at the increasedalumina content during sequence casting. The reason for this is that especially two characteristicsof the powder are affected as the alumina content increases - viscosity and crystallisation. Thecurrent study examined the influence of increased alumina content on viscosity andcrystallisation behaviour of two commercial casting powders. The results of the separate studieswere then broadly put in the context of the in-mould situation, since the viscosity and thecrystallisation/solidification behaviour simultaneously influence lubrication capability of theslag. Heat transfer between the strand and the mould is strongly governed by thecrystallisation/solidification behaviour of the slag layer. Viscosity and crystallisation wereexamined because they are experimentally measurable and quantifiable, but their combinedinfluences on the related functions (lubrication and heat transfer) of the slag in the mould werenot directly measured.

2. Background (Broad overview)
II) They provide thennal insulation to prevent solidification of the steel surface and of thesintered powder layer
V) They control heat transfer by providing a unifonn heat transfer across the infiltrated slag layerin the mould.
2.1. Chemical protection
The presence of (I) a liquid slag pool above the meniscus and (II) carbon particles in the sinteredand powder layers prevent oxidation of the steel surface.
Powder is added continuously to the mould to fonn 3 layers: (I) a raw powder layer (II) asintered layer (III) a pool ofliquid slag (shown in Figure 2.1).

• • • • • • S'•• : •• :.. Int.,.~ powa.,• MuShy •• ag
carbon floats 10 surfac.Liquid slag
--.... ------.._ ..---------------------------------_ ..--------------------------_ ..-----------------------------------_ .._-------------_ ...----------------------------------------------------------------------------~------~:_£L;ftulg SIH' ~_ ..._--~-------.._----------------------------------_ ..---------------------------...... ---------------------------_ ..------------------------------------------------------------------------•..--SNlI ~::::::=:::~:
Glassystag film
CrystalliMslag film
Figure 2.1: Schematic representation of the various slag layers formed in the mould [Mills,1991aj.
The thickness of these different layers will affect the degree to which the slag can protect thesteel from oxidation. Thicker layers will provide more efficient chemical protection.
During operation, feed rates should be high enough to maintain a thick unmelted layer (at least25mm) for protection of oxidation and especially thermal insulation by reducing vertical heatflux. A thicker unmelted layer will limit upward heat loss and provide a melted slag layersufficient to provide lubrication of the strand. The melted layer should be maintained between atleast 10 and 20mm thickness in order to assure slag infiltration throughout the entire oscillationstroke length that is typically close to 10mm. The reason for this can be seen from Figure 2.1.The slag rim shown closely follows the movement of the mould. It is necessary for the liquidslag to flow into the mould-strand gap during the entire oscillation cycle without being blockedin the lowest position by the slag rim.
Chemical protection is compromised by:(i) excessive turbulence in the mould when there is a non-uniform flow through the
submerged entry nozzle (henceforth referred to as the SEN)(ii) the narrow face is disturbed by a standing wave (which arises because of steel flow
through SEN); this standing wave tends to expose the molten steel.Powder design can help to rectify this problem to a certain extent. If the powder consists ofspherical particles, the particles can roll down the slope of the standing wave exposing moltenslag or steel surface. Expanding granules on the other hand have reduced flowability and willkeep the molten metal from being exposed to the atmosphere [Diehl et al, 1995]. A sphericalgranule with an expanding agent is reported to provide the best thermal isolation together withchemical control and minimum flowability.
Transport of oxygen from an oxidising atmosphere (in this case the atmosphere above the mould)through a slag is strongly dependent upon the iron oxide content of the slag. It is well understood

that the use of powders rich in iron oxide is detrimental to the quality. Most commercial castingpowders contain less than 1% total iron. Therefore, a liquid layer of almost any of the castingpowders available today is sufficient to protect the molten steel surface from oxidation [Riboud& Larrecq, 1979].
Casting powders are a mixture of slag components and carbon (Typically 2 - 5 % of carbon). Thecarbon fulfils a twofold function: (I) it will protect the molten steel from oxidation by reactingwith oxygen from the atmosphere to form CO gas (II) more importantly, it controls the meltingrate of the powder.
Carbon in the form of carbon black, graphite or coke dust is added to the mould powder tocontrol its melting rate and to provide insulation to both the steel and the liquid slag. Thedisadvantage of using carbon for this purpose is carbon pick-up that is experienced during thecasting of steels (especially ultra-low carbon steels and stainless steels where very low carbonlevels are needed).
Two aspects of the carbon source are of particular importance: the typical particle size and thetemperature of ignition of the carbon source. A fine carbon black particle has high surface area,high reactivity and low ignition temperature so it can effectively protect the steel with CO gas.Simultaneously it is believed to coat each particle of the mould powder and delay coalescence ofindividual pools of molten flux, and thereby retards the melting rate of the powder. Fine carbonblack is limited to between 1 and 2 percent of the total mould powder [Bommaraju, 1991].
An alternative to the use of carbon is the use of carbonates in the raw materials. The use ofcarbonates holds the advantage of an increased melting rate that is needed for higher castingspeeds. Kawamoto [1994] found that melting rate increases as carbonate content increases due tothe increased specific conductivity which is caused by the dissociation of the carbonates(evolution of CO2 gas). The findings of Kawamoto [1994] are the opposite of what would beexpected; that carbonates would retard the meting rate by the endothermic decompositionreaction at temperatures between 400 and 500·C.
When the melting rate is too high, more of the casting powder on top of the mould will melt.This in turn can bring about the formation of a larger slag rim and partial solidification of themolten steel surface if the powder on top of the steel surface cannot reduce vertical heat fluxsufficiently. For this reason, carbonates are used together with other carbon sources. A secondadvantage to the use of carbonates is that carbon pick-up during casting cannot occur as is thecase with carbon particles. A disadvantage of carbonates from the chemical protection viewpointlies within the decomposition reaction that makes them otherwise favourable - Carbon dioxide isa product of this reaction that provides an oxidising atmosphere.
A sufficient thickness of unmelted powder layer will also provide chemical protection of thevolatile constituents of the casting powder. The vaporised species from the hot, melted part of

the casting slag will cool down in the cooler powder layer, precipitate and not be lost as fluoridevapour. These volatile fluoride vapours are hazardous to health and often carry heavy restrictionson their allowable amounts in the atmosphere. The pure fluorides of calcium, potassium, sodiumand lithium have significant vapour pressures at 1530·C [Zaitsev et al, 1994]. Thus, duringmelting of raw mixtures it is possible to evaporate significant amounts of these volatile fluorides.
Reactions such as:Na20 + CaF2 = 2NaF(g)+ CaO
are thermodynamically feasible. As indicated above, humidity also increases the fluorineevaporation problem by reacting with the fluorine constituents of the slag phase and the gasphase to form HF. All liberated fluorides will react with water to form hydrogen fluoride in theatmosphere.
Zaitsev et al [1994] found that the evolution of fluorides is strongly related to the mineralogicalconstituents present in the mould powder formulation. Powders containing F in the form ofcryolite (Na3AIF6) experienced F evaporation (as Sodium-Aluminium-Fluorides) at a rate ahundred times greater than if F were made up of CaF2. Pre-fusion of mould slag and increasingthe CaOI Si02 ratio of the powder will reduce the overall evolution of fluorine containing gases.The reason for this is the formation of a solution in which the activity of po is low. The Fluorideis thus bonded to a greater extent.
2.2. Thermal insulation of the steel and molten powder
Thermal insulation is accomplished mainly by maintaining an unmelted powder layer ofsufficient thickness above the molten powder layer. There are two ways to achieve this andthereby to minimise vertical heat flux in the mould. The first is to change the characteristics andthe method of manufacture of the powder and the second is to change the melting behaviour ofthe powder.
The principal factors affecting thermal flux through the powder are the bulk density of thepowder and the shape of the particles.
Casting powders can be pre-treated in order to improve their uniformity of chemicalcomposition, flowability, density and melting rates [Diehl et al, 1995]. The powders can be

mixed in water to form a slurry and then granulated or extruded to form spherical (granule size isaround 400 microns) or tubular particles.
The insulating ability of different powder types (as well as other attributes) is shown in Table2.1.
Table 2.1: Attributes of mould powder types [Diehl et al, 19951Item Powder Extruded Spherical granule
granule with expandinga2ent
Price Good Fair FairThermal insulation Good Poor FairCold Flowability (As Poor Fair Goodpertaining to automaticfeeding systems)Chemical Homogeneity Fair Good GoodEnvironmental Poor Good Goodfriendliness (Dust losses)
It is clear from Table 2.1 that the shape of the manufactured particles will determine the verticalheat flux. It must be noted that the thermal insulating ability of each type of flux will beimproved by lowering the bulk density of the powder.
As discussed in section 2.1.1 a critical depth of unmelted layer is needed to provide thermalinsulation so the molten steel surface will not freeze and to provide a sufficient liquid slag depthfor lubrication throughout the stroke length.
This can be accomplished by increasing the carbon black content of the powder to reduce themelting rate, or more simply by increasing the depth of the powder layer added in the top of themould. Carbon and its effect on melting behaviour have already been dealt with. The addition ofa thicker unmelted powder layer in the mould is advantageous in every respect and should bestandard practice if poor thermal insulation is a problem. About 25mm thickness appears to be agood measure. A thicker unmelted layer will reduce vertical heat flux to very low values and soassure high temperatures in the meniscus region of the molten steel. The meniscus region issuggested to be the most critical part to effectively control since it will determine how the steelshell forms and what form it will have. Heat control in the meniscus region will also determinethe ease and the temperature of slag inflow into the gap.

Figure 2.2 Schematic representation o/the steel shell in the meniscus region during a) excellentvertical thermal insulation, b) poor vertical thermal insulation [Neumann et aI, 1996].
Figure 2.2 shows that slag and gas bubble entrapment is easier during poor thermal insulation ontop of the meniscus. Oscillation mark formation can also be pronounced under these conditions.The reason for this is found in the mechanism of oscillation mark formation that will bediscussed briefly for the sake of completeness.
Riboud & Larrecq [1979] identified two mechanisms of oscillation mark formation. They usedradioactive gold to monitor the solid shell formation. Traces of solid meniscus were visible insome of the samples, protruding into the liquid metal and corresponding to the oscillation marks.In other samples the solid overflow marks could not be noticed, and it is accepted that themeniscus shell could be bent backward against the mould wall in these instances.
The two mechanisms can be seen in Figure 2.3 (Marked as I and II respectively). The first occurswhen a nail structure is produced under the surface of the steel meniscus when the mould levelvaries to a large extent (shown in Figure 2.3-1). Figure 2.3-1 bis shows that the nail-like steelstructure re-melts, but an oscillation mark is left behind as the new steel shell forms above it[Anzai et al, 1987]. The second mechanism occurs when a depression of the steel shell is formedas the solidifying steel shell is deformed under pressure at the meniscus with stable mould levelconditions.

·liquidSteel
IOverflow
.I bisO"erflow + remelting
.uSolid meniscusbent backward s
2.3. Absorption of inclusions
The principal non-metallic inclusion in continuous casting of aluminium-killed steel is Ah03(alumina). Alumina is formed during deoxidation of the steel by aluminium. It can also form asthe result of the reaction between dissolved aluminium in the steel and reducible oxides (Si02,FeO and MnO) in the slag, or by contact with air.
(Al)Fe+ MxOx= Ah03 + X(M)Fewith: MxOx = Oxide in slag
Under normal conditions about half of the alumina increase in the mould slag comes fromdissolving alumina formed by oxidation of the aluminium in the metal by oxygen in the metal(during de-oxidation of the steel). The other half of alumina in the mould slag is formed byreaction with Si02, FeO and MnO in the slag [Skoczylas, 1996; Kyoden et al, 1987]. Aluminacan also form during poor or unstable operation of the casting process where molten steel isexposed to air. Alumina forms a non-metallic highly refractory oxide that can build up in theSEN or on stopper rods and form agglomerates. When these agglomerates are released they canhave detrimental effects on the steel performance or create problems during the casting processitself. It increases the mould slag viscosity greatly in two ways:(i) Some of the alumina dissolves in the molten powder and increases the viscosity by acting
as a network former (as discussed later in more detail)(ii) The portion of the alumina that does not have time to dissolve in the molten powder will
be present as a second solid phase in the molten powder and can even be trapped in thestrand/metal gap resulting in poor lubrication.
Inclusions can be either solid or liquid. Liquid inclusions will just dilute themselves in the liquidslag. As for solid inclusions such as alumina clusters, the partly immersed position is always anintermediate step. (In general, the slag formed from casting powders wet alumina with a contact

angle of about 1600
, suggesting almost complete wetting of the slag to alumina [Feldbauer et al,1995]). Failure of the slag to dissolve these solid particles leads to a heterogeneous slag and theinterface may become congested with solids. This will prevent further dissolution of inclusionsinto the slag and seriously hamper the flow of liquid slag into the mould/shell gap. The slag mustdissolve these solid inclusions.
Mould powders should be so designed as to absorb the maximum amount of aluminates from theliquid steel in the mould, since the alumina inclusions in the steel matrix reduce cast steelquality. At higher casting speeds contact time between metal and slag reduces and a higherabsorption rate into the mould slag is necessary.
For inclusions to be absorbed by the casting powder from the molten steel, the inclusions have toreach the meniscus area. Only after they arrive, can they be absorbed. Inclusion removal isessentially a mass transfer controlled process in the steel to the slag/metal interface. The possibleaction of the slag on inclusions concerns only those that have reached this slag/metal interface.The movement of the steel in the mould will determine the mass transfer kinetics. This will notbe discussed in this section, and the discussion will centre on the ability of the casting powderslag to absorb inclusions that already reached the interface area.
Two factors seem to primarily determine the rate of alumina dissolution into the slag:(i) slag viscosity and(ii) basicity (Figure 2.4).For higher casting speeds a more basic slag with a low viscosity will remove inclusions thefastest [Riboud & Larrecq, 1979; Nakano et al, 1984]. Viscosity of the slag is the most importantparameter for the rate of dissolution of solid inclusions. In a more basic slag, and therefore alower viscosity slag, complete dissolution of up to 15% alumina was measured [Riboud &Larrecq, 1979; Riboud et al, 1983]
TT. • CaOyraflO=--
8i02Or the Basicity index (Bi) that is based on the oxygen-ion attractive force as parameter for moredetailed description and complex slags:
B. = 1,53(CaO+MgO+CaF2)+1,94Na20+3.55Li20I 1,48i02 + 0.IA/203
Where: Oxides given in weight percentage

1.5 2.0BASICITY Bl
Figure 2.4: Relationship between alumina absorption rate o/the molten powder and basicity B][Nakano et ai, 19841.
As can be seen from Figure 2.4 the rate of alumina absorption depends strongly on the basicityindex of the molten powder, and rises exponentially as the basicity index rises.
Alumina saturationArise in alumina increases the viscosity of the powder, provided that the alumina is absorbedand melted by the molten powder pool. When alumina exists suspended in the molten powderpool, the apparent viscosity of the powder greatly increases according to the volume fraction ofsuspended solid alumina clusters. [True viscosity measurements are not feasible, as a secondphase (solid alumina phase) is present in the molten powder. As these solid alumina clusters passby each other, as happens during flow, their shape, size, and cohesiveness will determine howmuch force is required to move them.] If alumina is present in very large clusters, it is notabsorbed by the molten powder (due to insufficient time to dissolve the alumina, or less oftensaturation of the powder) and is entrapped by the steel during mould level fluctuations or the liketo cause defects [Nakano et al, 1984]. Practical alumina saturation levels of industrial mouldpowders could not be found in literature, but is above 25 mass %, since this amount was addedby various authors [Nakano et al, 1984; Kim et al, 1992; Koyama et al, 1987] without reachingsaturation. Since alumina increase found in practice today is on the order of 3 mass percentage[Bommaraju, 1991] alumina saturation will not be achieved in the slag during casting andviscosity will not be affected by a second phase formed by saturation of the mould slag.
Start All0J contentMould powders contain some alumina in the start concentration, normally between 2 and 5 %,coming from the feed material. Nakano et al [1984] found that the amount of alumina absorbedby the molten powder pool depends on the alumina absorption rate and is not limited by aluminasaturation of the molten slag (in line with the high saturation level, as indicated above). Higherstart alumina content in the powder will not cause danger of alumina saturation of the liquidpool, but rather lower alumina dissolution by decreasing the dissolution rate.

VIScosityThe effect of alumina on the viscosity of the slag will be discussed in section 2.1. The paragraphbelow is only to provide a basis for the factors that influence absorption rate.
In slag, silica forms Si04 -4 tetrahedrons. Alumina can fit into the silicate chain as for instanceNaAI04 -4. When alumina is dissolved into a casting slag, Al04-S is formed. AI04-s requires acation to be located near it (for instance Na) to provide a charge balance, form NaAl04 -4 and fitinto the silicate chain. Because of the fact that alumina not only acts as a network former, butalso requires a cation that would have acted as a network breaker, it is the most potent oxide inraising the viscosity of the mould slag. As alumina is absorbed, the viscosity rises and theabsorption rate becomes lower. Proper design must allow for a viscosity and absorption ratechange and still assure adequate lubrication and absorption as time progresses during the castingprocess.
In a good clean steel practice, the alumina rise in mould slag should not exceed about 3 mass %[Bommaraju, 1991]. For a 3 mass % rise in alumina a small viscosity increase will occur that isof no great concern and this ought not to alter the slag to a degree of endangering its properfunction in the mould. In the early seventies alumina pick-up in the order of 10 mass % was stillreported to be common [Mills & Bhat, 1973]. Operational problems however, like open pouring,clogging of the SEN that suddenly releases clusters, the ladle sliding gate that is burnt open andvortex formation in which tundish slag is drawn into the mould, will oxidise the steel to a similarextent and create more alumina inclusions that must be dissolved. Detrimental rises in viscositymay occur under these conditions.
Powder consumptionPowder consumption together with casting speed provides a crude measure of the time that thesteel is in contact with the same liquid slag, and therefore the time that specific slag has to absorbinclusions. (High powder consumption means a greater throughput of slag in the mould and ashorter residence time of slag in the mould. Higher casting speeds on the other hand willdecrease the residence time of steel in the mould and limit inclusion absorption.) This period thatthe steel is in contact with the slag and the amount of slag it is exposed to, will determine thefinal alumina content of the slag. Liquid flux consumption should be optimised to avoidexcessive alumina content of the flux to restrict the rise in viscosity. Powder consumption can beexpressed as kilogram of mould flux added per ton of steel cast (Qt in kg/ton, useful forcalculating running cost) or it can be expressed in terms of surface area dimensions of the strand(Qs in kg/m2, useful as a measure oflubrication). Typical reported values for Qt (on slab castingmachines) are between 0.3 and 0.7 kg/ton and the calculated consumption in kg/m2 strandsurface between 0.3 and 0.6 [Neumann et al, 1996; Wolf, 1987]. Since the consumption dependsupon the size of the cast slab and is proportional to the strand surface, the amount of powderconsumed in kg/m2 strand surface is more suitable for evaluating the lubrication capability of themould slag. (Since the mould powder consumption is related to mould surface area, the values ofQs given above for slab casting machines are comparable or in the same range as both billet andbloom casting machines). Qs can be related to Qt in the following manner:
Q = 7.6QS R t

R = 2{w+t)wt
Where: w = width of the mould (m)t = thickness of the mould (m)
The trend today is to continually move towards higher casting speeds. For higher casting speeds,powder consumption decreases due to a thinner slag layer being dragged down the mould. Thismeans greater alumina pick-up in less mould slag and places increasing pressure on the design,since the scenario described will work to sharply increase the viscosity. The designed viscosityhas to be decreased to provide easier flow of slag down the mould and thereby to allow higherpowder consumption rates.
Two papers illustrated that there is an optimum range of viscosity (T\) and casting speed 01c)which coincides with minimum heat transfer variations, frictional forces and surface defects.Ogibayashi et al [1987] found the uniformity of powder infiltration greatly varies with thepowder viscosity while studying slab casting at casting speeds between 1.1 and 2 m/min. Theoptimum viscosity changes with the casting speed and these two variables can be arranged in anintegrated manner by the term T\.Vc, where T\ is the powder viscosity in poise at 1300·C and Vc isthe casting speed in m/min. In the T\.Vc range of 2 to 3.5, the variations in the mouldtemperature, mould heat transfer and thickness of powder film at the mould exit are small,indicating uniform powder infiltration between the mould and the strand (Figure 2.5). Heconsidered the optimum powder consumption (where fewest defects occur) to be given by:
Wolf [1987] defined the 'relative viscosity' of the slag in the mould with the term T\.Vc2 as he
studied the influence of mould oscillation on lubrication (T\ is again the viscosity of the powderin Poise and Vc is the casting speed in m/min). The relative viscosity T\.Vc
2 must be around 5 forthe optimum powder consumption that is to be maintained around 0.3kg/m2 for casting speedsbetween 1 and 2 m/min. Wolf aimed to show that ultra-low viscosity powders would be requiredfor high-frequency mould oscillation in order to maintain the above consumption levels, byrelating the higher casting speeds with the high mould speeds during higher-frequency mouldoscillation. He considered the optimum powder consumption (where fewest defects occur) to begiven by:
Wolf regarded the influence of the casting speed to be greater (squared) compared to Ogibayashi.The reason for this could have to do with his initial aim to show the effect of oscillationfrequency on lubrication. None of these two authors studied casting speeds greater than 2m/minand the use of these equations is limited in this respect. Especially the 'relative viscosity' ofWolf predicts unrealistically low viscosities to be used in modem thin-slab casting that can castat up to 5m/min. Typical values of viscosities of casting powders used for casting speeds of

5m/min are in the order of 0.8 Poise at 1300°C [Neumann et al, 1996]. In comparison, theparameter of Ogibayashi predicts around 0.5 Poise to be optimal and that of Wolf predictsaround 0.2 Poise to be optimal.
oo 2 4 6llVc (poIlf[m mlnol))
oo 2 " 6
1lVc (poi •• [m minol J )
_0.4E"E"'-011I
-;- III 0.3~.g~10._D: 0.2e.- Ee-gO:'0 ~ 0.1gj>8.
10
" lS (b)
~10-
oo 2 " 6
llVc (pois.lm mlnol))
Figure 2.5: Frictional/orce and slag infiltration as a/unction o/the parameter 17Vc [Ogibayashiet aI, 1987}.
2.4. Lubrication of the strand
Before this topic is discussed, it is necessary to go into some detail regarding the nomenclatureabout the solidification behaviour that will be used from here on forward.
Mould fluxes are very complicated oxyfluorides, which have a strong tendency towards glassformation upon cooling, even though the crystal phase is stable. As composition is varied, thefluxes can form either a glass or precipitate crystals upon cooling. Precipitation can result in atwo-phase structure consisting of crystals surrounded by a residual glass phase. Glasses can beobtained by cooling a liquid below its equilibrium freezing point without the generation of asolid crystalline material. Most liquids can be supercooled below their equilibrium meltingtemperature before spontaneous nucleation and growth of their thermodynamically stable crystalform; however, glasses can be supercooled without crystallisation and are thus metastable. Time-Transformation diagrams are useful to provide insight into glass formation. Each Time-Transformation curve has a critical cooling rate for glass formation due to the competition withthe driving force for crystallisation. Time-Transformation diagrams will be discussed later inmore detail.
The temperature dependence of viscosity over a given temperature range is often represented bythe Arrhenius equation:" = A exp (E / RT )Or
21
\ /5 11 Ob~ )L
b \t?"Z.:z. G> 4 0 C>

In TJ = In A + E/RTWhere:TJ = viscosityA = Arrhenius constantE = activation energy for viscous flowR = gas constantT = absolute temperature (K)
As such, by plotting Iff versus In TJ, a line with a constant slope E/R with intercept In A can beexpected over a given temperature range. Figure 2.6 shows a typical flux viscosity-versus-temperature curve [Branion, 1987]. There is no sudden slope change in this curve, but rather atemperature range where crystals and/or supercooled glass can start forming. The solidificationtemperature (Ts) for a powder like this will be defmed as the temperature where the viscosityreaches 100 Poise. It is clear that this temperature has no significance at all to the crystallisationtemperature (Te or temperature at which the slag starts to form crystals) of the slag, since crystalscould be precipitating over a temperature interval already.
The dashed line in Figure 2.6 shows a sudden change in the slope of the curve that will be calledthe Break Point Temperature (Tbp) of the slag. The break point temperature does not coincidewith the temperature of the first crystals that formed. They can differ remarkably [Kim et al,1992]. The viscosity breakpoint temperature (Tbp) does have practical significance since it givesthe temperature at which the rate of viscosity rise markedly increases with decreasingtemperature and it will have a large effect on the lubrication of the strand. The temperaturemarked as Tt (Transition temperature) in Figure 2.6 marks the temperature where the viscosity ofthe slag increases above the expected Arrhenius equation. This temperature is of no realsignificance, and is not generally noted, since it may markedly differ from the Tbp,Ts, and the Te(as shown in Figure 2.6).
The term solidification temperature has little significance for the flux viscosity behaviour since itis not clearly reflected in the viscosity-temperature graphs. The solidification temperature (Ts)
will henceforth be used to define that temperature at which the slag becomes solid (that beingglass, crystalline or both). Ts cannot be related to Te in any respect since it contains noinformation on where crystals start forming. Tbp and Ts on the other hand should be close incasting powders that exhibit a temperature where the viscosity will start to increase rapidly sincethe viscosity will reach 100 Poise near the sharp increase (Tbp)of the viscosity.

1000800
VISCOSITY, centipoise 600
1008060
Crystaline orSuper CooledLiquid Slale
40 .,~14p0 13,00
(2552) (2372)20
5.8
1000 °C(1832) OF
Figure 2.6: Curve of viscosity (on a logarithmic scale) vs. lIT for a typical casting powder[Branion, 1987}.
Friction forceThe frictional force (Ftot) the steel strand experiences as it is drawn through the mould is ameasure of the lubrication the strand enjoys. In the upper part of the mould, where thetemperature is high, the frictional force is due to liquid slag lubrication (Fliq). If the temperatureof the slag in contact with the steel shell in the lower part of the mould is below the temperaturewhere the slag has solidified (either as glass, crystal or both), a solid slag layer will exist. Thiswill cause solid slag I solid steel shell frictional forces (F sol). During a poor slag feed situation,steel shell I copper mould friction can occur. The total frictional force consists of both thefrictions due to liquid as well as solid lubrication.
Ftot = Fliq + Fso1With: Ftot = Total friction force
Fliq = Liquid friction forceF sol = Solid friction force
In work conducted by Nakato et al [1984] was concluded that over 90% of Ftot is contributed byFliq, and the effect of Fsol is small for stable operation conditions. He also found that the frictionalforce measured increased gradually as the casting proceeded to a value of approximately 1.6times the initial value after two hours of casting. He considered the change to be caused by theincrease of the viscosity of the slag owing to enrichment of alumina.

This finding seems to be contradictory to that of work conducted by Hering et al [1992]; in thatwork, clear differences in terms of the amount of frictional force and of its dependence onalumina content have been established in the casting of various steel grades with casting powdersof different origin. The simple explanation that the viscosity increases due to the increase inalumina content of the slag and that this leads to higher values of the liquid lubrication part of thefrictional force proves inadequate. They found a sharp drop in the friction force of some powdersat a certain increase in alumina that corresponds to a change in the mineral phase precipitating.The variation in friction force has therefore been attributed to the crystallisation of differentmineral phases of the slag in the lubrication gap.
Figure 2.7 shows that the dominant mineral phase fractions of the casting powder changes as thepercentage alumina increases. The conclusion of this study is shown in Figure 2.8 and shows thatthe increase in alumina influences both the viscosity and the crystallisation of the slag. If thedesirable phase (gehlenite) is precipitated, the frictional force does not increase with the viscosityof the flux.
10o~Z 8
';Ie
~ 6 ::.:..:'::.::. Pulver A
4 ;'\~\{~~~:~:~{:}~~.:;'~'::.",: .:•..•
2 ::::~~i~·ii~~iiY/:\.\::·, :\:.:::.~.);.~.:.:«.;.:~.o .,. ~.......o 6 8·'. 10 12 14
Mass % Ah03
Figure 2.7: Dominant mineral phase precipitating from the slag vs. content of A12OJ and Na20[Hering et ai, 1992}.

° ° 0,03 0,06 0,09 0,12 0,15 0,18 0,21. '.-..':"
Viscosity of the slag (pa.s)Figure 2.8: Frictional force vs. viscosity of the liquid slag and the mineral phase fractions of theslag [Hering et aI, 1992].
Figures 2.7 and 2.8 show that alumina enrichment should so be controlled as to avoid theformation of nepheline crystals. Analysis of the crystalline composition [Fonseca et al, 1997] ofsolidified slag films indicates the presence of cuspidine, a calcium fluorosilicate with the formula3CaO. 2Si02. CaF2. This phase is frequently present when the fluorine contents of slag is in the 4% to 10% range. Some other crystalline phases capable of being developed through thermaltreatment of films of casting slag are: wollastonite [CaO . Si02], gehlenite [2CaO . Ah03 . Si02],nepheline [Na20 . Ah03 . 2Si02], and pectolite [Na20 . 4CaO . 6Si02 . H20].
The liquid frictional force Fliq is composed of the shear stress in the liquid slag film caused byrelative motion between the shell and the mould.
~ _ 17(Vm - VJAliq - d
I
Where: Tl = viscosity of the slag filmVm = velocity of the mould itself (at any given moment, positive or negative)Vc = casting speedA = area of the strand-mould contactd) = thickness of the slag film
Decreasing the viscosity of the slag and increasing the thickness of the slag film can thereforedecrease the friction force due to liquid lubrication. As the casting speed is increased, the

increase of Fliqis mainly based on the increase in the relative velocity between shell and mould.The thickness of the slag film between the shell and the mould also gets thinner with increasingwithdrawal speed. At the same time, the slab surface temperature in the mould rises and theviscosity of the slag decreases, so that the net effect is very small. Lowering viscosity will resultin higher powder consumption, but lower slag film thickness. The above two requirementsshould therefore be simultaneously considered to obtain the optimum powder consumption raterelated to a viscosity that also yields the lowest frictional force. As discussed earlier, Figure 2.5shows that the viscosity and casting speed can be arranged as T).Vc (T) = viscosity; Vc = castingspeed) in order to assure sufficient powder consumption that corresponds to a minimum incasting problems.
To minimise the liquid friction, it is desirable to use a casting powder that has a low meltingtemperature, since the viscosity decreases with increasing temperature above its meltingtemperature. A low melting temperature will also assure a liquid slag film at relative lowtemperatures lower in the mould, and so minimise solid friction.
According to Imai et al [1986] many types of gas bubbles such as argon and hydrogen areconsidered to pass through the powder pool until they are diffused toward the surface close to themeniscus. They found that the crystallisation of the mould powder is increased with anincreasing amount of gas bubbles present in the slag (Figure 2.9). The index of crystallisation ina higher basicity (CaO/Si02 = 1) powder greatly increased. The index of crystallisation remainedconstant in a lower basicity (CaO/Si02 = 0.9) powder. The viscosity also sharply rises withincreasing gas bubbles in the slag, which deteriorates the lubrication properties between themould and shell (Figure 2.10). The use of an appropriate mould powder that is not so greatlyaffected by gas bubbles will maintain lubrication effective to prevent breakout caused bysticking .
.8-a 1.0:Sg••• QS~u••> 0.6 • Ar0;:;a • COae a Air- o· "ao0
x••"'2

1600 I' IW"" I""'''~ll" Ar.OOIlAr. 0.'
~:~:I:I•
/ 0 A. / // 0 ~
• 0/ 14/
/0/ 1/Lo;" _._ ..u-'II~O 1100 I~O ICOO Q50 QOO
Temp. (OCI
Figure 2.10: Influence of argon gas on lubrication of mould powder rImai et ai, 1986].
E 1200uIQI
u,CT~ 400
When somewhere in the mould the entire gap between the copper mould and the steel shell isfilled with solid slag, whether this solid is glass or crystalline, no viscous fluid lubrication cantake place. Frictional forces at least ten times higher than that for a flux that maintains liquidlubrication can be expected to arise in this part of the mould [Bramon, 1987]. The picture ofassuring liquid lubrication throughout the mould is not as simple as it may seem; namely thatonly the melting temperature and the viscosity need to be lowered. The problem arises inperitectic steel grades (medium carbon between 0.08 and 0.15 %) where heat transfer across theslag layer has to be controlled in order to minimise heat flux fluctuations that cause longitudinalcracking in these grades. Two parameters need to be adjusted to achieve both lower heat transferand maintain liquid lubrication. The first is to control heat transfer by increasing the temperatureat which the flux solidifies, and to increase the Tc by increasing the CaO/Si02 ration to 1.2. Thesecond is to maintain a low viscosity of the flux by adjusting the flux composition - increasingthe Na20 and F- content [Kawamoto et al, 1997].
Heat transfer and fluctuations in the meniscus area are minimised by a thicker and morecrystalline slag film in this area. The problem arises that a slag that has a crystallisationtemperature high enough to start crystallising in the meniscus region can form a 100 % solid slaglower in the mould.
Work conducted by Brimacombe & Samarasekera [1979] has allowed calculation of the mouldhot face temperature and strand surface temperature in the mould during casting (Illustrated inFigure 2.11).

900TEMP, "C
Figure 2.11: Thermal boundary conditions of infiltrated flux film between the strand and themould [Brimacombe & Samarasekera, 1979J.
The mould wall temperature for the conditions modelled for low carbon steels decreased from260· C slightly below the meniscus to 110·C at the bottom of the mould. The shell temperaturedecreases from 1538·C at the meniscus to about 1150·C one third of the way down the mouldand then stays relatively constant for the remaining two thirds of the way. The Tc of the flux willdetermine how much of the gap is filled with solid crystalline slag near the cold mould wall andthe Ts will determine the liquid film thickness that is left for viscous fluid lubrication against thesteel shell. If, for instance, for the above mentioned low carbon steel, the Ts is higher than thesteel shell surface temperature at any point, liquid flux will not be present for lubrication, but thewhole slag film will be solidified. Figure 2.11 shows flux B with Ts of 1170oC. For this situation,two-thirds of the mould length would enjoy a 100% solid slag layer and poor lubrication.
2.5. Heat transfer in the mould
In addition to controlling hydrodynamic lubrication, slag film conditions also affect heat transferbetween the solidifying shell and the mould wall. Heat transfer is controlled in three steps :(I) steel shell to slag layer(II) through the slag layer(III) slag to mould wall.
A liquid slag film provides maximum heat flux in this area and temperature drop across thisinterface is small compared to the other two areas of heat transfer mentioned above. The momenta 100% solid layer slag forms against the steel shell frictional forces at least ten times higherthan for viscous fluid lubrication can be expected according to Branion [1987]. The heat transferfrom the steel shell to the slag becomes very low under these conditions due to air gaps that formand cannot be filled with liquid slag. The temperature drop across this interface then risessharply. Investigations into the liquid slag contact resistance against the wall of a graphitecrucible have been conducted by Jenkins [1995]. These measurements suggest that the liquid

slag contact resistance is at least one or two orders of magnitude smaller than the solid slagcontact resistance.
Kyoden et al [1987] suggested that part of the effect of viscosity on heat transfer across thissection is due to the ability or inability of the mould slag to eliminate air gaps in the shell/mouldinterface. Figure 2.12 shows an enlarged view of the film with calculated temperature profiles fora liquid-solid slag (50mm below meniscus) and a 100% solid slag (300mm below the meniscus).
. Solid Liquid" Flux "' _.E!,uLMold Wall z ~ ~ Steel Shell
<=P (Ferrostatic'Pressure)V~O-Fh.,-;VeIOClty (V)
Temperature Profile, "C1375"C
I...·---tl ---IX-O X-t
Mold Wall X--.o,5 t Stee' Shellts--.o.5 t
Figure 2.12A: Enlarged view of the flux film with temperature profiles for a liquid-solid slag(50mm below meniscus)[Branion, 1987].
:-.Sleel Shell
<= P (Ferrostatic Pressure)V:::.o-Flux Velocity (V.)V. of Solid
O<V.<V ••••V..-. = V•••,
Temperature Profile. "C1150"C
-I'".----tl 0X•••O X-I
Mold Wall t,ovl Sleel Shell
Figure 2.12B: Enlarged view of the flux film with temperature profiles for a 100% solid slag(300mm below the meniscus) [Branion, 1987].
Taking into account that the slag layer consists of liquid part and of a solid part (or only a solidpart), the heat flux through the slag layer will be separated into heat flux through the viscousliquid and through the solid part.
Viscosity seems to be the main parameter determining the heat flux through the liquid layer. Thisis especially true in the upper part of the mould were a very thin solid layer exists and theviscosity at 1500·C is very important. High viscosity slag will form thicker insulating layers andconsumption will decrease. If the viscosity is low, the heat flux will be high through the thinlayer [Riboud & Larrecq, 1979]. Furthermore, Branion [1987] referred to work conducted byAlbemy et al who also showed that heat flux increases as slag viscosity decreases. It wassuggested that the viscosity of the slag determine the flowability of the slag that is a measure ofthe ability of the liquid to eliminate air gaps between the steel shell and slag layer. (This will bediscussed in more detail in the next section.)
Increasing hydrogen content in steel has been found to greatly reduce the heat transfer throughthe mould. Hydrogen solubility in steel is greatly reduced upon solidification in the steel shell.Some hydrogen diffuses to the casting slag/steel interface as the steel rejects it where itsubsequently enters the liquid mould powder layer. Gaseous hydrogen is virtually insoluble inliquid slag, but the physical entrapment of H2 bubbles is possible [Turkdogan, 1996]. Anincreasing volume of hydrogen being evolved from the steel should lead to a correspondingincrease in hydrogen entrapment in the mould powder. This in turn will manifest itself asporosity and cause an increased resistance to heat transfer and therefore a reduction in the rate ofheat removal. With increased crystallisation temperature, the effect of hydrogen on heat removalis much less pronounced than in the case of lower crystallisation temperature powders. This islikely due to the lower volume fraction of liquid powder into which the hydrogen can penetrateas the crystallisation temperature is increased [Zasowski & Sosinski, 1990].
Steels that are continuously cast can be divided into two main groups according to operationaldifficulties. The first is 'crack sensitive' or peritectic steel grades (carbon content between 0.08and 0.15%). For these steels the heat flux between strand and mould should be reduced by:(i) developing a thicker solid layer and(ii) developing a more crystalline layer.
The second group is 'sticker sensitive' steel grades with carbon content > 0.4%, or at highercasting speeds carbon content < 0.08 %. For these steels good lubrication must be achieved whilecreating a thinner and glassier slag layer between the shell and mould. The reason for this is thatthe thinner glassy layer allows a high heat flux for a thicker steel shell. This will lessen thepossibility of sticker breakouts occurring in these grades.

content between 0.08 to 0.15%, leading to longitudinal cracking. Figure 2.13 shows thedifference in thermal contraction experienced when a peritectic steel grade cools and undergoesthe delta-ferrite to austenite transformation.
~.,:
11400
1300
1200
0.000
-0.001.,.-I-0.002
l -0.003
.. -0.004
-0.0050.0 0.2 0.4 0.6 0.8 1.0 1.2
QI'boa CIIIIteIIL, :a:c
Figure 2.13: Influence of carbon content on thermal contraction of iron-carbon alloys atdifferent temperatures [Jablonka et ai, 1991j.
Longitudinal cracking arises because of the difference in thermal contraction coefficientsbetween delta ferrite and austenite. Strain can be developed when the steel cools through thishigh temperature delta ferrite region to austenite. This transformation takes place in thetemperature area of the meniscus. Strain that develops in this meniscus area can be relieved bysurface cracking (longitudinal cracks). In order to minimise these strains it is important that theshell in the meniscus region should be as thin and as uniform as possible. The heat transfer ratemust be low to assure a thin shell. A slag layer in the mould/shell gap that has a sufficient solidthickness and/or crystallises more readily best does this.
A short discussion will now follow about the principles of heat transfer and the reason why acrystalline slag is more efficient to reduce the heat transfer:Generally, conduction, radiation and convection transfer heat. The thickness of the flux filmbetween the mould and the strand is generally estimated to be about 0.2mm. As convectioncannot be developed in such a narrow space, the obtained effective thermal conductivity (kefi')will be the sum of thermal conductivity by radiation (kr) and lattice conduction (kl).
radiant heat by the crystals. The flow of heat due to radiation conductivity through a film ofvitreous (glassy) slag present at the shell/mould interface may be twice the rate of flowestablished by lattice conduction. In a glassy slag, the primary heat transfer will therefore bethrough radiation conduction. However, scattering of radiant heat by the crystalline material inthe slag film may reduce the radiation conduction contribution to between 0.1 and 0.2 times thelattice conductive flow [Fonseca et al, 1997]. Lattice conduction now becomes the principalmechanism controlling heat transfer.
Another reason is given by Pinheiro et al [1995] as an explanation for the reduced heat transferthrough a crystalline slag. Small pores exist in the crystalline layer that present a great resistanceto heat transfer. These small pores were noted in all the studied precipitated crystals, but theirfrequency and size varied in each crystalline phase. The authors concluded that these pores mightbe the result of some small contraction as crystals grow in the solid glassy layer.
Susa et al [1994] studied five different types of slag samples taken from a mould and obtainedthermal conductivities in the order of 2 W/m.K at 600· C. This conductivity increases slightly asthe temperature increases to about 2.5 W/m.K at 1000·C. These are typical values for partlycrystalline and glassy phases, since slag films taken from the mould consist of both crystallineand glassy parts.
An .air gap forms due to the solidification of the slag being in contact with the mould. Theinterfacial thermal resistance in the mould was measured by Yamauchi et al [1992] and found tobe around 0.4 - 0.8 m2K1kW, corresponding to an air gap in the order of 30 J.1m,for the surfacetemperature of the copper mould to be approximately 300·C under usual casting conditions.
There is always a solid slag layer closest to the mould wall and this part of the slag remains moreor less intact during the casting operation. Heat transfer from the slag to the copper mould is lowand Branion [1987] calculated a temperature drop in the order of 500·C. This temperature dropcorresponds to the value of the interface resistance determined by Yamauchi [1992], given above(for a typical heat flux of 1000 kW/m2).
It has been proposed that the lower heat transfer caused by crystalline material are due to a largerair gap between the mould and the slag, formed by greater contraction of crystalline material.
The presence of different gases in the gap between the slag and the mould has an effect on heattransfer across this gap. Hydrogen gas formed by decomposition of the spray water on the strandjust under the mould can fill this gap and increase heat transfer across the gap.

3. Research problem and objectives
The principal non-metallic inclusion in continuous casting of carbon steel is Ah03 (alumina).Alumina is fonned during deoxidation of the steel by aluminium. It can also fonn as the result ofthe reaction between dissolved aluminium in the steel and oxides in the slag. Alumina is a non-metallic highly refractory oxide that can build up in the SEN (submerged entry nozzle) orstopper rods and fonn agglomerates. When these agglomerates are released they can havedetrimental effects on the steel quality or create problems during the casting process itself if theyare not dissolved in the slag. Mould powders should be so designed as to absorb the maximumamount of aluminates from the liquid steel in the mould. When the alumina content of the castingslag rises, the in-mould characteristics change with respect to the viscosity and the crystallisationof the casting slag .• ) A rise in the alumina content of the casting slag will cause the viscosity of the powder to
increase through the following mechanism: In slag, silica fonns Si04 -4tetrahedrons. Aluminacan fit into the silicate chain as for instance NaAI04-4. When alumina is dissolved into acasting slag, Al04-s is fonned. AI04-s requires a cation to be located near it (for instance Na)to provide a charge balance, fonn NaAI04-4, and fit into the silicate chain. Because of the factthat alumina not only acts as a network fonner, but also requires a cation that would haveacted as a network breaker, it is the most potent oxide in raising the viscosity of the mouldslag. (For further discussion, refer to section 3.1.2)
.) Alumina will affect the crystallisation behaviour of the slag in two respects. Firstly, since itacts as a network fonner in the slag, it will suppress crystallisation and lower the temperatureat which the slag starts to crystallise. Secondly, the equilibrium crystal phase that fonnsduring cooling will also change.
As both the viscosity and the crystallisation change simultaneously, the slag will be affected inthe way it is able to fulfil its functions during casting. The two functions that will be affected theseverest are the ability of the slag to lubricate the strand during casting and to control the heattransfer in the mould area [Carli & Ghilardi, 1998] .• ) The lubrication depends both on the viscosity of the liquid slag during liquid lubrication in the
upper part of the mould, and on the length of the mould that enjoys liquid lubrication (whichwill in turn be detennined by the temperature that the slag solidifies as glass or crystal) .
• ) Heat transfer of the powder is influenced through the fraction of solid to liquid slag in the gap(the Ts of the powder) and the amounts of crystals present (the Tc of the powder).Crystallisation restricts radiation conductivity to almost zero by the crystals scattering theradiant heat.
It is necessary to understand the exact thennal conditions for precipitation and growth of acrystalline phase from a slag to understand the heat flux encountered in the mould of acontinuous caster. At the same time it is necessary to understand the crystal morphology and thetemporal development of the fraction of solid to understand lubrication.
The following discussion on both the viscosity and the crystallisation behaviour of a mould slagwill be based on some aspects that still await clarification in the literature, concerning theinfluence of alumina. This discussion is by no means exhaustive and acts only as a more detailedfonnulation to address some areas that were studied experimentally by the author.

In the past when clean steel production was not practised as it is today, the increase of alumina inthe casting powder during casting was in the order of 5 - 10%. In modem times aluminaincreases in the order of 3% are generally found, even during a sequence cast that can last severalhours. Scenarios exist that can increase this amount of alumina absorbed by the casting powderby oxidation of more of the aluminium in the steel. Open pouring of the steel without a nozzleand slag carry over in the mould when the tundish is drained too low are examples of suchscenarios. It is necessary to know what the actual magnitude of the alumina increase is in orderto design the mould powder to function properly, especially concerning its viscosity and abilityto absorb alumina.
It is empirically known that when aluminium-killed steel is continuously cast, the amount ofalumina in the molten powder pool in the mould remains at an almost constant level during thecasting operation. To illustrate this, the mass balance in the molten powder pool during castingcan be considered as described below.
A powder with initial alumina concentration Co is added to the mould and forms a moltenpowder pool. The molten powder pool absorbs alumina rising through the liquid steel or carriedby the nozzle stream and reaches alumina concentration C. The molten powder with aluminaconcentration C flows out of the pool. The mass balance of alumina in the molten powder pool isgiven by:
alumina coming frompowder feed on mould
I Molten powder pool
alumina absorbedfrom steel
alumina consumed withslag during casting
Change of mass in Ah03 in powder = Mass flow of Ah03 to slag (1+2) - Mass flow of Ah03out of slag (3)
dMc =1+2-3dt
dMc w.m,.d.pc dC--=----dt 100· dt
M1 0 10-4 A/203 V a= ppm.. .w.m,. c.Ps.-
3Mo 100
2= Co .~.w.m,.Vc.ps100 1000
3=~.~.w.m,.Vc.ps100 1000
Where: C = concentration of Ah03 in the molten powder pool (mass %)Co = concentration of Ah03 in the original powder (mass %)t = time (min)a = fraction (percentage) ofOppm (as Ah03) in steel that reports to mould slagOppm = Oxygen content of the steel (ppm)MAl203= Molar mass of Ah03 (kg/mole)Mo = Molar mass of oxygen (kg/mole)Vc = casting speed (m/min)Qt = powder consumption rate (kg/ton of steel)mt = thickness of the casting mould (= thickness of molten powder pool) (m)w = width of the casting mould (=width of molten powder pool) (m)d = depth of the molten powder pool (m)Ps = density of the steel (kg/m3)Pc = density of the molten powder (kg/m3)
Figure 3.1 presents the change with time of the content of alumina in the molten powder, ascalculated by equations given above. The values used in this calculation are as follows:Mould size (w.mt) = 210*1200 (mm2)Casting speed (Vc) = 1.5 (m/min)Powder consumption (Qt) = 0.45 (kg/t)Density of steel (Ps) = 7800 (kg/m3)Thickness of molten powder pool (d) = 10 (mm)Density of casting powder (Pc) = 2500 (kg/m3)Oxygen in steel (Oppm) = 20 ppmOriginal alumina concentration (Co) = 4.8 mass%

--_ ..__ .- ..--_.----.-oO-·--'#.fI) 7.500fI)«IE 7.000«I.5 6.500
E.2 6.000ce
.• -oO _oO _ •.•oO.·-"oO"·"-.~...'
~~
4.5000.0
Figure 3.1 shows that the alumina content in the molten powder pool increases with time andgradually approaches a steady-state value that depends on a. (the fraction of the alumina in theliquid steel that reports to the mould slag). The alumina concentration in the molten powder poolis practically at steady state after 20 minutes of casting, according to this calculation. This agreeswith the work conducted by Nakano et al [1984].
The ability of an oxide to form a network can be expressed in terms of its local field strength,given by:
F = Zcl a2
With:F= the field strength,Zc = the valence of the cation anda = the distance between the centres of the radii of the cation and oxygen ions (in A).
A cation with a higher field strength (F= 1.5) is more able to attract oxygen anions to achieve adenser packing and become a glass former. Field strengths of 0.1 - 0.4 characterise networkmodifiers that tend to lose oxygen anions when dissolved in a slag, for example CaO and MgO.Network modifiers break up the silicate network by adding oxygen anions to the network ofsilicate tetrahedra. This causes the network of silica tetrahedra to separate as each tetrahedronhas its own complement of oxygen ions. The cation will be accommodated at the breaks in thesilicate structure. This results in the formation of discrete molecules that decrease steadily in sizeas more basic oxides are added to the melt. The addition of fluorine reduces viscosity very

effectively. As the radius of F" (1.31 A) is similar to that of 02- (1.38 A) in a tetrahedral bondedSi-O network structure, F" can easily replace the divalent oxygen ion resulting in breakdown ofthe Si-O network [Johnston & Brooks, 1997].
In a multi-component slag, Al3+ (F=O.96) assumes a co-ordination number of 4 and formstetrahedra of [Al04]5- which are similar in size to the silica tetrahedron [Si04t, so that in suchsystems aluminium is a glass former. In order to substitute At3+ for Si4+ in the silica chain andmaintain electrical neutrality, the presence of monovalent or divalent cations such as Na+ or Ca2+is required. Thus the ability of alumina to increase the silica chain length is dependent upon thebasic oxides. Alumina forms networks in the molten slag, increasing the molecular size anddecreasing the molecular mobility. Johnston & Brooks [1997] found that a 6% increase inalumina increased the molar volume more than three times the original value. A 14% increasegave a 300-fold increase in molar volume. This increases the molecular size and the viscosityaccordingly. Of all the elements that can be added to the slag, alumina is the element thatincreases the viscosity the strongest.
The dependency of viscosity (Tl) on temperature could be approximated by eitheran Arrhenius's relationship:
~=AAex~:T )
With:AA = frequency factorE = activation energy for viscous flowR = gas constantT = absolute temperature
It has become apparent from recent literature [Fox & Mills, 1999] that at least ten mathematicalmodels are available for the prediction of the viscosity of slag from their chemical composition.The groups responsible for each of the models have pursued their own models, apparentlyindependently of the others. Consequently, it is difficult for industrial laboratories to know whichmodel best suits their needs without trying them first and even then, not knowing the probableuncertainty of the predicted values.
Viscosity measurements are an expensive and time-consuming exercise. It would be beneficialfor both manufacturer and consumer if models would be available to provide reliable viscosityvalues from chemical composition, which could be determined for every batch, but are muchquicker and easier to derive than viscosity measurements. For the purpose of this study, onlythree of the most widely used equations will be referred to for the basis of comparison. The three

models evaluated divide the components of the slag into different categories, (network breakers,network formers and amphoterics).
Kim et al [1992] carried out linear least square regression analyses on several chemicalcomposition variables to predict the viscosity. The results were obtained as an Arrheniusrelationship:
Log (TJ)= log A + B / TLog A = -2.307 - 0.046 Si02 - 0.07 CaO - 0.041 MgO - 0.185 Ah03 + 0.035 CaF2 - 0.095 B203B = 6807.2 + 70.68 Si02 + 32.58 CaO + 312.65 Ah03 - 34.77 Na20 - 176.1 CaF2 - 167.4 LhO +
59.7 B203
Where all the components are accounted as mole %, T = temperature (K) and TJ= Viscosity(pa.s).
Riboud & Larrecq [1979] measured viscosity for a number of compositions in the system CaO-Si02-Na20-CaF 2-Ah03
For the range of composition:33 < Si02 < 56%12 <CaO<45%o < Ah03 < 11%o < Na20 <20%0<CaF2 <20%
An interpolation formula has been derived for the parameters In A and B as a function of themole fraction of the constituents. They used a Weymann temperature relationship:
In (TJ)= In A + In T + B / TIn A = -19.81 - 35.75 Ah03 + 1.73 CaO + 5.82 CaF2 + 7.02 Na20B = 31140 + 68833 Ah03 - 23896 CaO - 46351 CaF2 - 39519 Na20.
This formula can be extended to slag containing small amounts of MgO and MnO, byconsidering the sum (CaO + MgO + MnO) instead of CaO alone. It would appear that the majordisadvantage of this model might be that it fails to differentiate between the various cations, e.g.MgO on a mole fraction basis is treated as if it were CaO.
Koyama et al [1987] measured viscosity in the Si02 - Ah03 - CaO - CaF2 - Na20 - LhO system.A viscosity equation was derived from analysis of 483 data points relating the composition to theviscosity of the powder system.
InTJ=lnA+B/TIn A = -0.242 Ah03 - 0.061 CaO - 0.121 MgO + 0.063 CaF2 - 0.19 Na20 - 4.8160B = -92.59 Si02 + 283.186 Ah03 - 165.635 CaO - 413.646 CaF2 - 455.103 Li02 + 29012.564Where all the components are accounted as mole % and T = temperature (K).
For a discussion on the accuracy of the models (compared to actual measured values), refer tothe discussion in section 5.2.3.
3.2. Effect of alumina on crystallisation
The following discussion will attempt to provide an overview of the situation of phase change ofa casting powder upon cooling as it is currently found in the literature. The reason for this is toshow what the latest experimental work in the world is aiming at in order to establish a sensibleway of describing crystallisation, since at this time there is no standard technique for itsevaluation. The result of this could be to present crystallisation data alongside solidification datain such a manner that it will give a clearer understanding of what the true slag characteristics isprogressively down the mould length. After this the specific influence of alumina increase willbe discussed as it affects crystallisation.
Crystallisation in the mould occurs in a matter of tens of seconds as the slag moves through themould. The cooling rate of a powder initially on top of the molten steel surface (at 1550°C)moving down the mould at 1m/min (with the steel shell) to the bottom of the mould (at 1150°C)is around fc/s. Kashiwaya et al [1998b] referred to work done by Ho & Thomas [1992] whoestimated actual cooling rates between the steel shell and the mould of a continuous caster torange from less than 1°C per second to 20
0
C per second depending upon position in the mould. Itis difficult to present crystallisation in a sensible manner for these high cooling rates. The mostaccurate way will be to present data in the form of a Continuous Cooling Transformation (CCT)diagram and/or with a Time Temperature Transformation (TTT) diagram. A short description ofand motivation for the techniques to obtain these diagrams will now follow.
Quantification of mould slag solidification phenomena is normally conducted using differentialthermal analysis (DTA) or slag casting in a chill mould: however, these techniques are limited asthere is no direct observation of the solidification phenomena and only effects which liberatesignificant quantities of heat can be measured. The DTA technique records the temperature lag(or advance) when a specimen undergoes an endothermic (or exothermic) transformation uponbeing heated (or cooled) at a fixed rate. Crystallisation gives an exothermic peak. In DTA, thepowder and alumina (reference) are placed in identical crucibles in a furnace. The temperaturedifference between the sample and the reference is monitored continuously, as the furnace isheated at a fixed rate. Any thermal event, such as a transformation, is revealed as a departurefrom the base line. The highest temperature associated with an exothermic peak gives thetemperature of crystallisation (Tc). In general, a higher 'Crystallisation Temperature' is related toa higher fraction of crystalline phase in the mould slag layer between the mould and the strand.However, a unique criterion to establish the cooling rate of the sample has not been establishedin these studies and only a few studies have considered the effect of cooling rate oncrystallisation behaviour [Watanabe et al, 1996; Sakai et al, 1997] and even fewer attempted toconstruct TTT or CCT diagrams [Sakai et al, 1997]. Furthermore, the term 'CrystallisationTemperature' is sometimes confused with the so-called 'Solidification Temperature' of the slagwhich is determined from viscosity tests where a rapid rate of viscosity increase with decreasingtemperature is incorrectly used as an indication of the onset of crystallisation within the slag.

Another technique that is frequently employed to determine the crystallisation behaviour of amould slag consists of melting the mould slag sample before quenching in a metallic mould[Hering et aI, 1992; Sakai et al, 1997]. After quenching, the sample can be inspected at roomtemperature by different techniques. For example, the proportion of crystalline and glassy phasescan be evaluated using microscopy, and X-Ray diffraction can determine the crystalline phasepresent. Another method consisted of fusion of the slag sample in a high temperature microscopeand observation if its behaviour during cooling [Kishi et al, 1987]. The temperature at which theslag lost transparency was considered to be the crystallisation temperature. Obviously, thesemethods are useful to defme a 'crystallisation index' which compares, qualitatively, the tendencyof different slag to give glassy or crystalline phases; however, these indices do not provide aquantitative measurement that can characterise the slag behaviour in the mould.
To properly characterise the precipitation of a second solid phase from a liquid, it is necessary todefme the thermal field, phase diagram and the nucleation and growth behaviour of the solid. Inmould slags, that are liquid oxides and easily transform to a glass at high cooling rates, it isnecessary to be able to describe the conditions under which glass transformation is possible.These include conditions for the initiation of solidification, the crystal morphology, chemistryand growth rate and the time evolution of the fraction of solid. Knowing these at differentcooling rates are important in the determination of the effect of crystallisation of the slag on heattransfer and rheology. Thus a technique, whereby the thermal field can be determined as thesolidification process is observed, was developed by Kashiwaya et al [1998a; 1998b]. Thistechnique combines the hot thermocouple technique with video observation and image analysisthat allows crystal growth rates, morphologies and solidification fractions to be determined underdefined thermal conditions.
The absorption of alumina will tend to make the slag glassier since it increases thepolymerisation and commandeers cations for charge balancing (As discussed in Section 3.1.2).Thus the increase in alumina content during the casting sequence results in the formation ofglassier slag toward the end of the cast.
Kim et al [1992] found that an increase of 10 mass percentage alumina decreased thecrystallisation temperature of the studied slag by approximately 60·C. It must be noted that whathe termed 'Crystallisation Temperature' has been defmed as the solidification temperature of theslag in this discussion. However, it is expected that an increase in alumina content will work todecrease both the solidification temperature (as Kim et al [1992] found) and the crystallisationtemperature. No information could be found in literature about the effect of increasing aluminacontent at different cooling rates on the crystallisation temperature.

4. Experimental Procedure
Three separate areas of the behaviour of casting powders were experimentally investigated inorder to evaluate their performance in practice when their alumina content increases.
The aim of the data collected was to clarify two areas of alumina increase in practical continuouscasting:I) To determine true practical levels of alumina increase in modem clean steel manufacture. Put
more distinctly, what alumina values different powders attain under different castingconditions.
II) To investigate the time taken to reach this upper alumina value.
Samples of different commercial casting powders were gathered. The names of the powders andthe chemical analyses as provided by the manufacturers are given in table 4.1. The analysesprovided were normalised to a carbon-free basis.
Table 4.1: Chemical analyses of casting powders studied (Mass percentages).Powder Si02 eao MgO AIzOJ Na20 K20 LizO Fe20J F
nameScorliat 40.1 33 1.49 5.7 9.39 0.82 - 1.88 7.23SPH-401IPS2Teemix HS 41.48 37.3 6.5 1.96 3.48 - - 0.42 8.8315GTeemix 41.4 41.2 - 6.82 7.87 - - 2.7 5.37CNS-15NEAccutherm 34.9 30.8 1.78 5.36 12.7 0.9 - 2 10STC 89Accutherm 37.6 37.6 0.72 5.88 8.04 0.12 0.96 1.32 6.24STSP-232-BA
Samples were collected from the moulds of the V2 and VI continuous casting machines atISCOR Vanderbijlpark. At timed intervals of between 5 and 10 minutes during a sequence cast,small samples were collected from the same position in the mould (Between the SEN and thenarrow face of the mould). Sampling continued across ladle changes as long as circumstancesallowed safety and continuity. Casting conditions and possible irregularities were noted to aiddata interpretation.
Sampling was done by means of a small (6mm outside diameter * 150mm length) silica tube thatwas designed with a thin part at the bottom. The tube was under vacuum and was therefore able

to aspirate some of the molten powder as soon as the thinner bottom part melted. The tube washeld in position for sampling with a simple steel arm that held the tube at the end by means of anelastic. The thin bottom part of the tube was pushed through the unmelted and sintered powderlayers into the molten powder layer where melting of the thin part of the tube occurred within asecond or two.
Energy Dispersive X-Ray analyses (EDX), also called Energy Dispersive Spectrometry (EDS)was performed on all the samples for chemical analyses by means of a lEOL 5800 LV scanningelectron microscope fitted with a NOKAN EDS Voyager 4 detector. An acceleration voltage of25 kV and an analysis time of 100 seconds were used throughout the experiments.
To establish the validity and accuracy of this technique to obtain chemical analyses of thesamples from the mould, the following questions need to be addressed.
• Does the silica in the tube used for measurements react with the molten powder duringsampling?
To test this, the silicon content was monitored over the width of a cross section of the tube withpowder inside. The silicon content analysed assumed the value of silicon in the bulk of thecasting slag directly next to the silica tube surface. No reaction of the silica tube with the castingslag was found. The reason for this is due to the quenching of the powder as it enters the tube.All of the slag that was aspirated into the tube quenched as glass. Since glass breaks into smoothsurfaces, samples were not polished, but only mounted and coated with carbon by means of anE6000 BIO RAD Carbon-damper machine. Carbon coating was performed to ensure electricalconductivity of the sample and prevent it from charging, due to the electrons it was bombardedwith in the electron microscope when the sample was visually assessed with secondary electrons.
• Is EDX representative of the true analysis of the sample?As already mentioned, the powder samples obtained quenched as glass and not as the stablecrystalline phases. This implies that the composition will not vary with crystal phases and will bemore homogeneous. Furthermore, five measurements were made at different positions in thesample to test for homogeneity and a confidence interval was obtained to evaluate the datagathered. The lowest possible magnification was used (100*) in order to analyse as large asurface as possible.
• What is the effect of the different oxidation states that elements may be present in?Since the aim of this experiment was only to monitor the alumina contents of the casting slag(the molten casting powder can also be referred to as the casting slag or slag) as it changes withtime, oxidation states of minor elements (like Fe and Ti) do not playa role in the resultsobtained. The chemical analyses retrieved from EDX were compared to the initial constitution ofthe powder (as provided by the manufacturers) to check validity. Table 4.2 gives a comparison ofthe manufacturer-supplied analysis and the EDX analysis of the casting powder STC 89 after 40minutes of casting. The results from EDX compared quite favourably, with lower Fluorine andSodium values; as would be expected due to vaporisation of especially NaP. Higher aluminavalues were measured due to alumina inclusion removal by the powder. ISCOR Vanderbijlpark

does not add calcium to modify and facilitate alumina inclusion removal, and hence the CaOvalue is not expected to increase with that of alumina.
a e . : emlca analyses etermme ly an Iven )y man acturers.Accutherm STC 89 Si02 CaO MI!O AiIOJ Na20 K20 Fe20J FManufacture details 34.9 30.8 1.78 5.36 12.7 0.9 2 10EDX analysis 36.7 35.8 1.69 6.2 9.3 0.9 2.2 4.2
4.2. Viscosity measurements
High temperature viscosity measurements are performed with commercial viscometers normallyemployed for room temperature measurements. These viscometers are mounted on top of afurnace and employ a modified extended "arm" to position the spindle used by the viscositymeter within the furnace where the specimen is heated. High temperature viscositymeasurements are well established and quite common around the world, but remain in lack of astandardisation or calibration technique. There are many laboratories measuring viscosity, butresults differ greatly from one to another (as is evident from Figure 4.1). Values of viscosity athigh temperatures (1400°Cto 1200°C)provided with casting powders are often a function of thelaboratory where it is tested.
A Brookfield Programmable DVII+ Viscometer with electronic display was utilised in thedetermining of the casting powder viscosity. The concentric cylinder method was employedwhere a fluid (molten casting powder) is contained in the annular gap between the two cylinders(sample crucible and the spindle). The spindle is rotated at constant speed, the fluid rotates and atorque is transmitted to the spindle. Viscosity is calculated from the measured torsionalresistance. (Viscosity is the measure of the internal friction of a fluid. The friction becomesapparent when a layer of liquid is made to move in relation to another layer. The greater thefriction, the greater the amount of force required to cause this movement). The followingequations apply to cylindrical spindles only:
Shear stress (dyne/cm2): F = M
2trR2Lb
FViscosity (poise): 17 =-S
The integrated version of equations 1 - 3, with the torque as constant, gives the viscosityrelationship as follows:

The above equation applies to infinitely long cylinders and it is normal practice to calibrateviscometers with viscosity reference materials. Viscosities are usually calculated by the equationgiven below:
D'1=-G
Where: co = angular velocity of spindleRc = radius of crucibleRb = radius of spindleX = radius at which shear rate is being calculatedM = torque input by instrumentL = effective length of spindleD = scale deflection of the viscometerG = apparatus constant determined by calibration experiments
Calibration of the meter using the special molybdenum spindle can be performed at roomtemperature with the aid of standard viscosity oils that have viscosities in the range of typicalcasting powders. In order to use the spindle in the tube furnace used to heat the sample, thespindle must be made of carbon, molybdenum or platinum. Molybdenum was employed sinceplatinum is too expensive and carbon proves to yield vastly varying results from run to run [Mills& Machingawata, 1991]. During a study conducted by NPL (National Physics Laboratory inEngland) on a global scale, it was found that carbon that reacts with the melt was responsible forthe data variation.
In order to establish the accuracy of the viscosity data obtained at high temperatures in thefurnace, a program launched by NPL was joined to evaluate the same slag data with some of themost respected laboratories in the world. Viscosities of two synthetic reference slags weremeasured one year apart and sent away for comparison to the other laboratories. The resultsreceived appear to be valid and consistent, as shown in Figure 4.1.

t= +Univofr-- Pretoria ..•.•.r--
-NPL •• '0'"
r-- .-- • •..•..
••••
Ii'III'0Q.-~ 10'8u.1>
Figure 4.1: Results from two global round robins launched a year apart indicating accuracy ofthe calibrated viscosity meter [Mills, 1991bj.
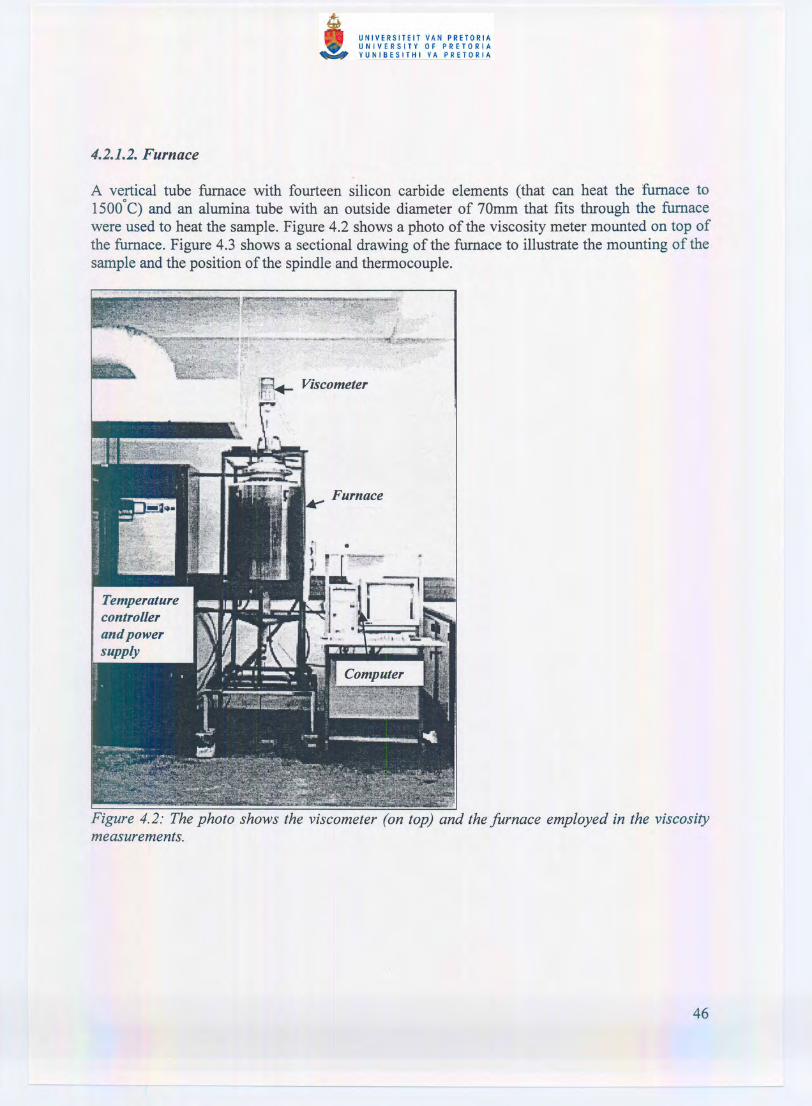
A vertical tube furnace with fourteen silicon carbide elements (that can heat the furnace to1500
0
C) and an alumina tube with an outside diameter of 70mm that fits through the furnacewere used to heat the sample. Figure 4.2 shows a photo of the viscosity meter mounted on top ofthe furnace. Figure 4.3 shows a sectional drawing of the furnace to illustrate the mounting of thesample and the position of the spindle and thermocouple.
Figure 4.2: The photo shows the viscometer (on top) and the furnace employed in the viscositymeasurements.

SICelement
Mo arm andspindle
Aluminatube
(ID=6Omm)
Aluminatube
(1D=23mm)
MeasureThermocouple
Figure 4.3: A schematic representation of the inside of the furnace to illustrate the mounting ofthe sample and position of the spindle and thermocouple.
Simple description of constituents of furnaceThe ends of the alumina tube fitting through the furnace were sealed with water-cooled copperheads. Through a small hole in the top copper head the spindle extension hung and the cruciblesupport extended through the bottom copper head.
The crucible used to contain the casting slag sample was machined out of 304 stainless steel. Thecrucible had an outside diameter of 32mm, an inside diameter of 28mm and was 60mm high.This crucible was supported on an alumina tube (with outside diameter of 26 mm) passingthrough the bottom copper head. Fitting into this tube was placed a mullite crucible holder.Fitting into this again was a calcium oxide - alumina based crucible holder for the purpose ofacting as a reservoir for slag that crept out of the stainless steel crucible. On occasion slag creptout of the stainless steel crucible due to surface tension effects during the final cooling of thesample. It was discovered that the slag crept during the final cooling at low temperatures justbefore freezing during a run in which the reservoir crucible had not yet been employed. In thiscase, the thermocouple was exposed to the slag that crept out of the sample crucible and ceasedworking properly.
Temperature measurementsThe furnace is controlled by an S-type thermocouple that is situated between the elements. Thistemperature will not be representative of the true temperature of the sample at a given moment.For this reason another S-type thermocouple was situated right beneath the crucible thatcontained the sample. The thermocouple was enclosed in an alumina sheath (outside diameter of4 mm) that fitted in the smaller alumina tube sticking through the bottom copper head. The

thermocouple tip passed through both the crucible holders and was situated right under thestainless steel crucible (as shown in Figure 4.3). In this way the time for the crucible to reach asteady-state temperature could be determined more precisely. The steady-state temperature of thecrucible was measured at 3fc lower than the temperature of the furnace at the furnacethermocouple position for the entire temperature range studied. During the cooling intervals thistemperature difference was smaller depending on the rate of cooling. The hot zone length of thefurnace was defined as the length in which the temperature was measured within ± 1·C of the setcontrol temperature and was determined beforehand as 6 centimetres.
Gas atmosphereSince the spindle and its extension from the viscosity meter were made of molybdenum, and thesample crucible was made from 304 stainless steel, the oxygen partial pressure in the furnace hadto be kept at low levels. Above the top copper head was a small chamber with an argon gas feed(shown in Figure 4.4). Gas flow rates for the small gas compartment above the top copper headwas in the order of 0.02 litres per minute. This design prevented air from entering the furnacethrough the hole for the spindle in the top copper head.
Argon outlet
~L Argon inlet.,.- W.:rter outlet
!Copper head
7\Argon flow sc~w tap SS plate
to clamp O-ring
Mo arm extensionFigure 4.4: Schematic representation a/the top copper head showing the water cooling channeland the gas compartment on top.
Argon gas was also blown through the furnace tube at rates of 2 litres per minute. The gasentered at two places in the lower copper head and escaped through the hole for the spindle in thetop copper head (shown in figure 4.5).

Fumacewithtubes andsample inposition
Drieritecolumn Flowmeter
(O.02Umin)
Tubefumacewith copperclippings
Flowmeter(2Umin)
Argon Argon inletbottle
Figure 4.5: Schematic representation of the path of gas flow.
The argon gas was purified in respect to oxygen and water content to aid in keeping the oxygenpartial pressure low. The argon gas passed through a Drierite tube (outside diameter 35mm,length 350mm filled with drierite) at room temperature to strip the gas of water before it enteredthe furnace. The drierite used was self-indicating by changing colour from blue to pink when itdid react with water.The argon gas then passed through a tube furnace that contained copper fillin~s in a silica tube(outside diameter 40mm, length 300mm in the tube furnace) at 600 C. At 600 C any oxygen inthe argon gas passing through the tube will react with the copper to form CuO. The copper thatoxidised to CuO can easily be observed by its dull appearance in contrast to the metallic lustre ofthe copper fillings. The CuO can be regenerated (reduced) to copper by hydrogen gas passingthrough the silica tube at 200·C.
Samples used in viscosity experiments were prepared by mixing different amounts of pure Ah03powder with a commercial casting powder. Only two powders were chosen to perform the studyon. Stollberg in Germany produces them both; Accutherm STC 89 is designed for casting lowcarbon steels, and Accutherm STSP-232-BA is designed for casting medium carbon steels. Themanufacturer's analyses are given in table 3.3. The analysis for powder CNS-IOb-2E is includedsince its viscosity-temperature relationship is given in Figure 5.8 to demonstrate the breakpointtemperature effect.
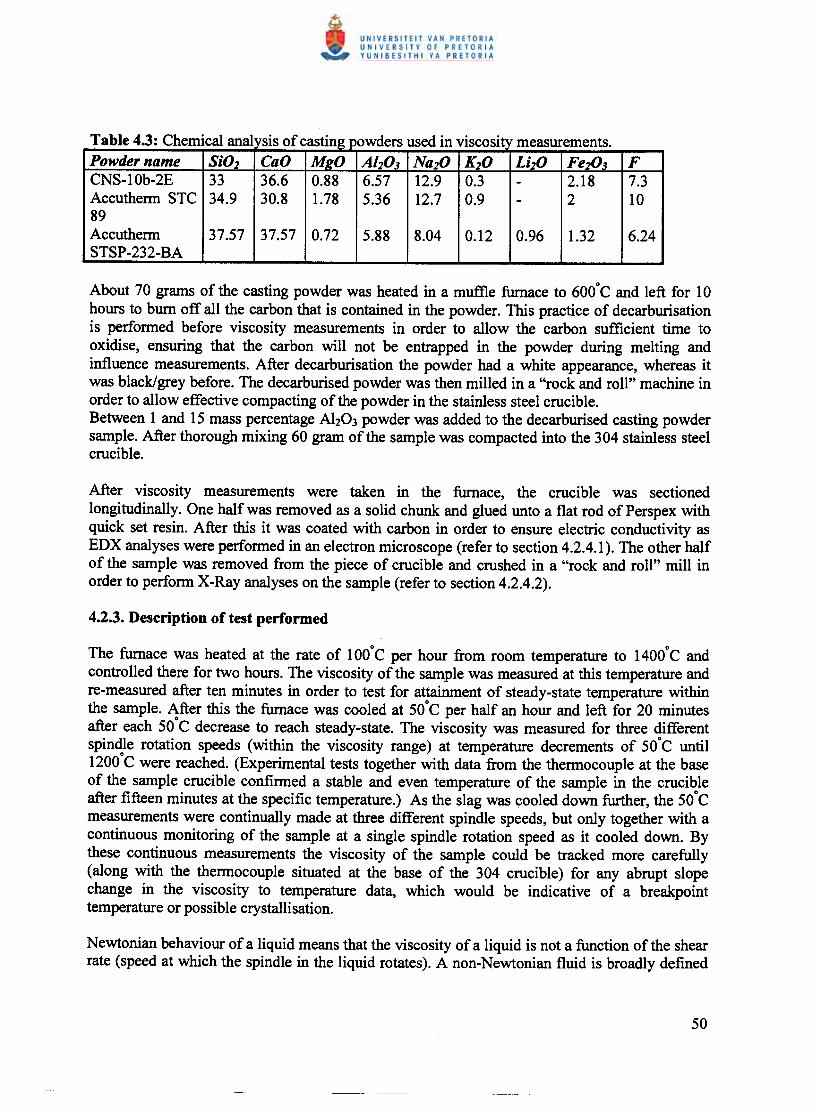
a Ie4.3: emlcal an VSIS 0 casting powders use m vlscosi~ measurements.Powder name Si01 CaO MilO A1J03 Na20 KJO LiJO FeJ03 FCNS-10b-2E 33 36.6 0.88 6.57 12.9 0.3 - 2.18 7.3Accutherm STC 34.9 30.8 1.78 5.36 12.7 0.9 - 2 1089Accutherm 37.57 37.57 0.72 5.88 8.04 0.12 0.96 1.32 6.24STSP-232-BA
About 70 grams of the casting powder was heated in a muftle furnace to 600· C and left for 10hours to burn off all the carbon that is contained in the powder. This practice of decarburisationis performed before viscosity measurements in order to allow the carbon sufficient time tooxidise, ensuring that the carbon will not be entrapped in the powder during melting andinfluence measurements. After decarburisation the powder had a white appearance, whereas itwas black/grey before. The decarburised powder was then milled in a "rock and roll" machine inorder to allow effective compacting of the powder in the stainless steel crucible.Between 1 and 15 mass percentage Ah03 powder was added to the decarburised casting powdersample. After thorough mixing 60 gram of the sample was compacted into the 304 stainless steelcrucible.
After viscosity measurements were taken in the furnace, the crucible was sectionedlongitudinally. One half was removed as a solid chunk and glued unto a flat rod ofPerspex withquick set resin. After this it was coated with carbon in order to ensure electric conductivity asEDX analyses were performed in an electron microscope (refer to section 4.2.4.1). The other halfof the sample was removed from the piece of crucible and crushed in a "rock and roll" mill inorder to perform X-Ray analyses on the sample (refer to section 4.2.4.2).
The furnace was heated at the rate of 100·C per hour from room temperature to 1400·C andcontrolled there for two hours. The viscosity of the sample was measured at this temperature andre-measured after ten minutes in order to test for attainment of steady-state temperature withinthe sample. After this the furnace was cooled at 50·C per half an hour and left for 20 minutesafter each 50·C decrease to reach steady-state. The viscosity was measured for three differentspindle rotation speeds (within the viscosity range) at temperature decrements of 50·C until1200·C were reached. (Experimental tests together with data from the thermocouple at the baseof the sample crucible confirmed a stable and even temperature of the sample in the crucibleafter fifteen minutes at the specific temperature.) As the slag was cooled down further, the 50·Cmeasurements were continually made at three different spindle speeds, but only together with acontinuous monitoring of the sample at a single spindle rotation speed as it cooled down. Bythese continuous measurements the viscosity of the sample could be tracked more carefully(along with the thermocouple situated at the base of the 304 crucible) for any abrupt slopechange in the viscosity to temperature data, which would be indicative of a breakpointtemperature or possible crystallisation.
Newtonian behaviour ofa liquid means that the viscosity ofa liquid is not a function of the shearrate (speed at which the spindle in the liquid rotates). A non-Newtonian fluid is broadly defmed

as one for which the relationship F/S (described in equation 3, section 4.2.1.1) is not a constant.For a non-Newtonian fluid the experimental parameters of viscometer model, spindle and speedall have an effect on the measured viscosity. This measured viscosity is called the "apparentviscosity" of the fluid and is accurate only when explicit experimental parameters are furnishedand adhered to. Non-Newtonian flow is probably of mechanical origin [Brookfield, 1996]. Assolid objects pass by each other, as happens during flow, their shape, size, and cohesiveness willdetermine how much force is required to move them. At another rate of shear, the alignment ofthe objects may be different and more or less force may be required to maintain motion. Thesolid objects can be large molecules, colloidal particles or suspended materials such as crystals.This behaviour is common to some slags, especially when partial solidification starts in thesample and crystals are present in the sample [Brookfield, 1996]. Dilatant non-Newtonianbehaviour means an increase in viscosity with an increase in shear rate. The casting slags studieddisplayed dilatant behaviour at lower temperatures. This is commonly observed in fluidscontaining high levels of solids.
The first temperature (encountered during one of the 50°e decrements) where the slag displayednon-Newtonian behaviour was sought, if such a defInite point existed. This was done to test theidea that the temperature where non-Newtonian behaviour of the slag begins to be noticed mightbe an indication of the temperature where crystals start to form in the sample. This of course willonly hold if crystals form in a narrow temperature range. Obtaining such a temperature proved tobe ineffective due to a gradual change in the flow behaviour.
Viscosity measurements were stopped when the viscosity of the sample reached 30 Poise. Thespindle was then lifted out of the crucible. Two experimental viscosity runs were performed upto 120 Poise to check for non-Newtonian behaviour and possibly a break point temperature.Where these higher viscosity measurements were done (lower temperatures), the sample had tobe heated again to 1350
0e in order to lift the spindle from the sample. After the spindle waslifted from the sample, the furnace was programmed to cool down at 100°e per hour to roomtemperature.
During the cooling of a single run, the temperature that the thermocouple at the bottom of thesample crucible measures, was plotted against time for a fixed furnace cooling rate of sooe perhour from 1400
0e to room temperature. The idea was to test whether the crystallisation of thesample would register as an arrest in the cooling curve. Due to the size and thermal inertia of thesystem no such observation could be made.
Due to high temperatures in the furnace during viscosity measurements, fluoride evaporationtakes place, especially in the form ofNaF. In addition, nominal analyses provided by the powdermanufacturers are not necessarily accurate due to variations from batch to batch of the castingpowder. For these reasons the true sample analyses of the slag in the crucible were essential toefficiently test the viscosity models that use the actual composition of the slag, and to know thetrue amount of alumina increase in the casting slag. Actual sample composition was also neededto evaluate the stable crystal phases forming during cooling to room temperature, since the Na20and Ah03 contents of the slag primarily control crystallisation.

Energy Dispersive X-Ray analysis (EDX), also called Energy Dispersive Spectrometry (EDS)was performed by means of a JEOL 5800 LV scanning electron microscope fitted with aNOKAN EDS Voyager 4 detector. The acceleration voltage was 25kV and the analysis time was100 seconds. The same composition analysis method was employed as with the mould samples,but with some adaptations', which are justified below.
The casting slag from the furnace cools slowly enough for the stable mineral phase(s) toprecipitate. The result is that areas of different composition exist within the sample.
• Is EDX representative of the true analyses of the sample?Eight measurements were made at different positions in the sample to calculate a confidenceinterval over the areas analysed. The lowest possible magnification was used (100*) in order toanalyse as large as surface as possible. Crystals appeared to have a very fine grain size (in theorder of 60 Jlm) when imaged with back-scattered electrons. The confidence interval (as %) ofthe data for calcium (the element that analysed with the least consistency - refer to section5.2.1.1) was typically ± 5%.
X-Ray Fluorescence Analysis (XRF) was performed with an ARL8420 XRF model on two of thesamples from the furnace to compare with data from the EDX. Fluorine was regarded as theunanalysed element required summing the XRF analyses to a hundred percent, as well asaccounting for the loss on ignition (since no other volatile specie was present and fluorine cannotbe analysed by the XRF). Data obtained from the XRF fell within the range of the confidenceinterval from EDX data, supporting the accuracy of the EDX analyses.
As the alumina content of the slag increases during casting, it is expected that the equilibriummineral phase that precipitates will also change. This in turn can have implications for thetemperature at which crystals precipitate and on lubrication in the mould, as suggested in a paperby Hering et al [1992]. In order to test the suitability and relevance of data published by Heringet al [1992] on the stable mineral phase (as the stable phase is influenced by Ah03 and Na20content), mineral phase analyses were performed by XRD. Half of every sample coming fromthe furnace after viscosity measurements was crushed in a "rock and roll" mill and subsequentlytaken for XRD analyses. XRD tests were done on a SIEMENS D501 X-Ray Diffractometer witha secondary monocromator. CUlCll radiation was used with a 28 of 3 - 70°, a step width of 0.05°(28) at 1.5 seconds/ step.
4.3. Crystallisation
The hot thermocouple technique was evaluated to study the temperature of crystallisation. Athermocouple heater was developed with some unique modifications to measure the exothermiccrystallisation reaction temperature. The data obtained from these original experiments provided
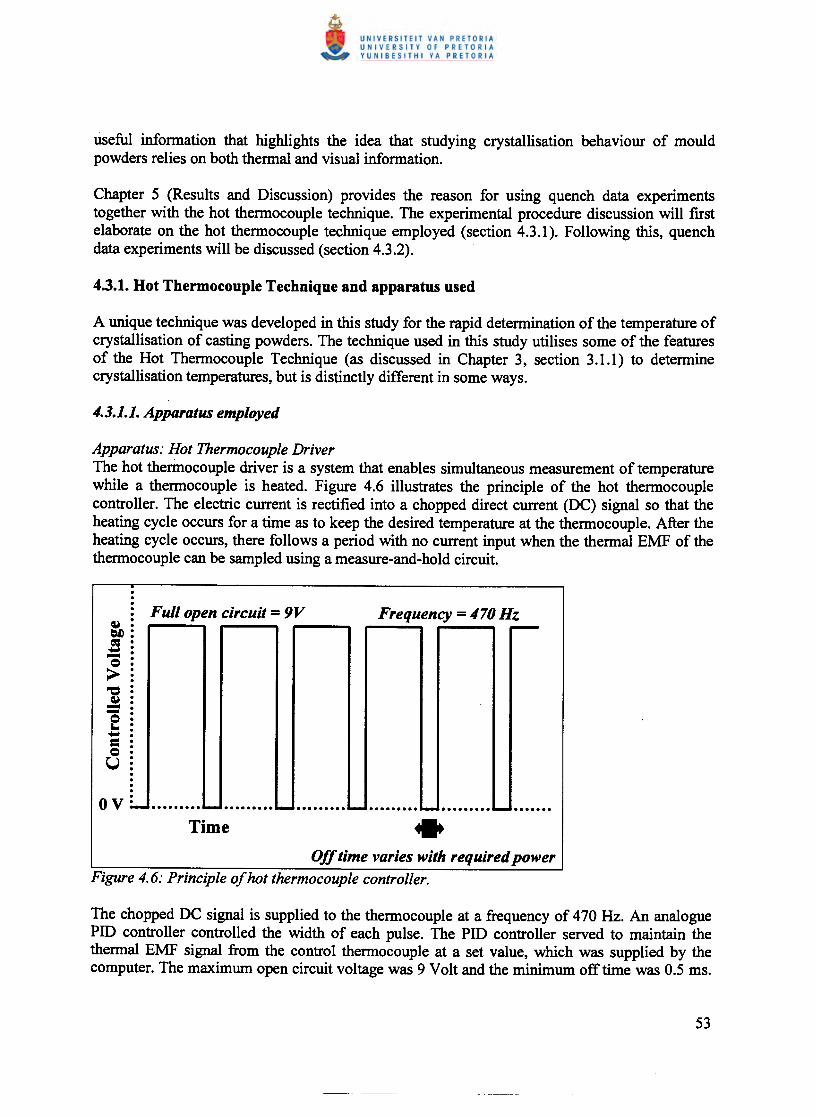
useful information that highlights the idea that studying crystallisation behaviour of mouldpowders relies on both thermal and visual information.
Chapter 5 (Results and Discussion) provides the reason for using quench data experimentstogether with the hot thermocouple technique. The experimental procedure discussion will firstelaborate on the hot thermocouple technique employed (section 4.3.1). Following this, quenchdata experiments will be discussed (section 4.3.2).
A unique technique was developed in this study for the rapid determination of the temperature ofcrystallisation of casting powders. The technique used in this study utilises some of the featuresof the Hot Thermocouple Technique (as discussed in Chapter 3, section 3.1.1) to determinecrystallisation temperatures, but is distinctly different in some ways.
Apparatus: Hot Thermocouple DriverThe hot thermocouple driver is a system that enables simultaneous measurement of temperaturewhile a thermocouple is heated. Figure 4.6 illustrates the principle of the hot thermocouplecontroller. The electric current is rectified into a chopped direct current (DC) signal so that theheating cycle occurs for a time as to keep the desired temperature at the thermocouple. After theheating cycle occurs, there follows a period with no current input when the thermal EMF of thethermocouple can be sampled using a measure-and-hold circuit.
-
··············:.... ......•.. - ......... - ......... - ......... - ......... .... .....•Off time varies with required powerFigure 4.6: Principle of hot thermocouple controller.
The chopped DC signal is supplied to the thermocouple at a frequency of 470 Hz. An analoguePID controller controlled the width of each pulse. The PID controller served to maintain thethermal EMF signal from the control thermocouple at a set value, which was supplied by thecomputer. The maximum open circuit voltage was 9 Volt and the minimum off time was 0.5 ms.

Electrical noise experienced by the circuit was in the order of 4°C on the control thermocouple(that also manifested in the temperatures measured by the measure thermocouple). Heating andcooling rates in excess of 300°C/s could easily be achieved. The casting powders were heated at2S0°C/s and cooled at between O.SoC/s and 30 Cis for crystallisation measurements.
Apparatus: ThermocouplesIn essence, the technique makes use of two thermocouples simultaneously. One thermocouplecontrols the temperature of the wire through the hot thermocouple driver circuit discussed above.The other measures the true temperature of the sample, as shown in Figure 4.7.
Pt·13Rh wire(O.05mm)
Figure 4. 7: Schematic representation of the two thermocouples used in the heating wire of thesample.
MeasllreThermocollple
ControlThermocollple
The thermocouples shown in Figure 4.7 are of type R and consist of a 0.38 mm diameter pureplatinum wire to contain the sample (represented by the thicker wire) and a O.OS mm diameterplatinum-13 rhodium wire (represented by the thinner wire). The loop indicated by 'castingpowder' represents the area where the casting powder sample is melted and its true temperatureis measured by the 'measure thermocouple'. The control thermocouple is situated in a looprepresented by 'Reference' to give similar radiative heat loss to the casting powder loop. Thisallows the temperature measured by the measure thermocouple to be close to that of the controlthermocouple. Nonetheless, the temperature is controlled only at the position in the controlthermocouple where the wires touch, while the temperature along the rest of the wire has agradient relative to the cooled contact points. The practical implication of this is that thetemperature measured in the measure thermocouple may be up to 200°C less, due to the radiationand thermal inertia of the casting powder in the measure thermocouple loop. For this reason it isdifficult to program the control thermocouple temperature in order to obtain the desiredtemperature for the casting slag in the measure thermocouple loop. To restrict the temperaturedifference between the loops and promote predictability of the measure thermocoupletemperature, both loops need to be similarly (consistently) positioned between the water-cooledcontact points (see Figure 4.8) and have a similar geometry.

The open ends of the thermocouples had to be controlled at room temperature. In the case of thethin Pt-13Rh wire this was easily achieved because of the small heat conduction capacity of thewire. The connection of the wire to the circuit was simply placed at least 5cm from thethermocouple's closed end. In the case of the thicker Pt wire that can transfer more heat, 5cm Ptwire length was allowed after which compensation wire for platinum was used to assure the coldconnection was sufficiently removed from the closed thermocouple end to be at roomtemperature. The connection of the Pt-wire to the circuit was done by two crocodile clampswhich were water cooled by a continuous water flow through a thin copper tube to which theclamps were soldered (The system is shown in Figure 4.8).
Figure 4.8 is a photo of the two thermocouples as employed in the experiments. It also shows aPerspex box covering the system to minimise airflow over the thermocouples and avoid suddentemperature disturbances.
Figure 4.8: Photo of the experimental set-up showing the two thermocouples used fordetermining the crystallisation temperatures.
Apparatus: ComputerA computer was run with a program written in Turbo Pascal to supply the set value of the sampletemperature to the PID controller. In this way the heating and cooling rate of the sample could bespecified before each run. The computer both supplied the voltage needed by the hotthermocouple driver and recorded the thermal EMF from the two thermocouples.
Test of accuracyThe technique was tested for accuracy by measuring the crystallisation temperature of a purecomponent with known thermo-physical properties, such as calcium fluoride (CaF2). Pure CaF2crystallises at 1418
0
C. Accuracy was determined to be in the order of ± 100
C, as illustrated by theresults shown in Figures 4.9 and 4.10. Figure 4.10 shows the influence of the cooling rate on themeasured crystallisation temperature of pure CaF2.

0'~ 1490
"~ 1470••IIII 1450a.E 1430~
1390o 50
Time (8)
Figure 4.9: Example of exothermic crystallisation peak displayed by the cooling of chemicallypure CaF2 (2°C/s).
1440
U 1420~a 1400:;J~ 1380
:e 1360~u 1340'0g" 1320E~ 1300
1280o 20 25 30
Cooling rate (DC/s)
Figure 4.10: Crystallisation data on CaF2 obtained revealing the influence of cooling rate oncrystallisation temperature.
4.3.1.2. Sample preparation
The casting powder was decarburised in a muffle furnace at 600°C for a period of 10 hoW'S.Additions were made to the powder in the form of sodium oxide (Na20) and alumina (Ah03)' Asdiscussed in chapter 2, section 2.1.3, NaP has a significant vapour pressure at the temperaturesattained during the heat cycle, with the result that only trace amounts ofNa and F were analysedafter a heat cycle was undergone. Na20 was added to the powder in order to compensate for thesodium (Na) losses as sodium fluoride (NaP) during the thermal cycle in the measurethermocouple loop. The extent ofNa and F losses during the heat cycle and the implication for

results obtained are discussed in chapter 5, section 5.3.1. Since Na20 (together with Ah03) arethe principal constituents determining the crystallisation of the sample, Na20 was added in orderto simulate the original composition of the powder and alumina powder was added to simulatethe effect of alumina pick-up during casting. Following these additions, the powder was pressedinto a pellet and sintered in a muffle furnace at 900°C for 24 hours. The sintering step was doneto achieve a more homogeneous composition of the powder since very small samples (2 - 4milligrams) were loaded into the platinum wire loop for the crystallisation temperaturedetermination. The sintered pill was then crushed in a "rock and roll" mill. After thoroughmixing of the powder, acetone was added to a small amount of the powder. Acetone wets thepowder enough to keep it in position when the powder is applied to the loop in the thermocouplewire. Acetone quickly evaporates and leaves the powder suspended in the loop. Water is not usedbecause it would bind with the powder and cause the formation of HF during heating.
After the completion of the experiment the small piece of crystallised slag was removed from thethermocouple wire mechanically~ First, this crystallised slag was mounted on an aluminiumsupport to be carbon coated and analysed for its composition with EDX. Secondly, this smallsample was crushed and XRD was performed on it in order to know the mineral phases present(refer to section 5.3.1).
4.3.1.3.1. Energy Dispersive X-Ray analysesThe samples coming from the thermocouple were exposed to temperatures in the range of1400°C. Losses ofNa, K, Ca, F, occur during the heat cycle. In order to establish the influence ofthese losses and the true Ah03 and Na20 content of the sample, EDX analyses were performedon the sample. A sample of the size as was studied with the thermocouple technique, is complexto analyse accurately, due to its limited surface area. The danger exists that the portion of thesurface analysed may not be representative of the true average composition, when for instance anarea is analysed that crystallised a mineral phase with a fixed composition. It must be noted thatthe EDX analyses technique (especially given the small size of the sample and the crystallinenature of the sample) provides at best only a rough idea of the true composition of the sample.The small area available for analyses does not provide the opportunity for a better averagecomposition, while several crystal phases may be present in the sample and manifest as a definitecomposition.
4.3.1.3.1. X-Ray diffractionX-ray diffraction analyses give an idea of the main crystalline phases present in the sample as thecomposition changes and different cooling rates are experienced by the same composition. Thesize of the sample made X-Ray diffraction difficult and sensible data was obtained on only someof the samples.
This leg of the experimental work was added due to the lack of accurate data obtained from thehot thermocouple technique (because of the wide crystallisation range).

Hot Thermocouple driverThe thermocouple driver discussed in section 4.3.1.1 was used to simulate classic quenchingexperiments to visually determine the true extent of crystallisation. Using the thermocoupledriver enables the high heating and cooling rates (about 300°C/s) to be utilised for rapidquenching data determination.
Optical microscopeDue to the opaque nature of the crystalline material opposed to the transparent nature of glassymaterial, visual assessment of the percentage crystalline material present in the sample could bemade with the aid of an optical microscope. An optical stereo microscope with a magnificationof 16* was used for this purpose.
The samples used were similar in weight and dimensions as with the hot thermocouple techniquefor crystallisation temperature determination (refer to section 4.3.1.2). Approximately 2 - 4milligrams of powder was loaded into the Pt-wire loop and heated within 10 seconds to the PeakTemperature. The peak temperature referred to is defined as the maximum temperature to whichthe sample is heated and left to require uniformity for different lengths of time (referred to asTime at Peak Temperature). After maintaining the sample at peak temperature for the specifiedtime, it was continuously cooled at a fixed rate to the quench temperature of the experiment. Atthe quench temperature the electric current was terminated and the sample was allowed to cool.Measurements of the sample-temperature in the Pt-wire loop after the current was cut showedthat cooling rates of the order of300 ·C/s were achieved.
Quench data results are affected by a number of experimental variables. Especially four variablesin the current experiment affect the results. They are:i) composition - in this instance only alumina content was variedii) Peak Temperatureiii) Time at Peak Temperatureiv) Cooling rate from peak temperature to quench temperature.
Each of these variables was studied separately (while maintaining the other three at constantvalues).
The same powder was used that was prepared for the experiments in the hot thermocouple driverin section 4.3.1.
After charging the powder in the Pt-wire loop, the sample was allowed to completely crystalliseby allowing it to cool at 3·C/s from l300°C to 800°C. Different heat treatments were performedon the sample only after this step. The initial condition of the sample was therefore 100%crystalline, and the formation of the % glass could be distinguished by the % transparent material

noted under the optical microscope. Each sample was used in only one sequence of coolingtreatments, from the lower to the higher temperatures, while the % glass increased accordingly(For example, all things being constant, the quench temperature would be increased at 50°Cintervals causing the % crystalline material to decrease). Figure 4.11 schematically shows theheat treatment cycle that the samples were exposed to. After the sample was subjected to thequench temperature equal to the peak temperature, it was removed from the measurethermocouple loop in the wire. The loop in the Pt wire was then loaded with fresh powder, heattreated to obtain 100% crystalline material, and the sequence of heat cycles was repeated. Onesuch a sequence yielded around 5 data points. Every sequence was repeated three times to obtainreproducibility. The % crystalline and glassy material was determined by the optical microscopeobservation of the ratio of opaque to vitreous area at room temperature, with the sample stillsuspended in the thermocouple loop.
Quench teJTl)el'ature increases, coolingrate and peak t~ure constant
-o~ Initial! aystaIlisation:s••• .&. oL .&.
l!8-E{!!
Figure 4.11: Schematic illustration of a single sequence of heat treatments that a sample wasexposed to.

5. Results and discussion
Figure 5.1 is a summary of the alumina increase versus the time for a whole range of differentpowder types studied (each during a sequence cast). The data shows the trend of reaching asteady state alumina concentration after a certain period of time in accordance with theoreticalcalculations (see Figure 3.1 in section 3.1.1). With the current casting process under normaloperating conditions at ISCOR-Vanderbijlpark, between 2 and 4 mass percentage of alumina isabsorbed by the casting powder when casting different grades of aluminium killed steel. Thealumina content of the different powders reaches the steady-state value within the ftrst ladle ofthe sequence (the ftrst 40 minutes of casting) and remains constant for the rest of the castingprocess. The efficiency of casting powder operation in fulftlling its functions must be evaluatedat these increased alumina levels.
CIS 5c·e 4=ii
?f!. 3II)
= 2E<:]1
,--.X
% *O+--------r-----.....,------,------......,..-~--_____,
o
Figure 5.1: Combined data on the increase in alumina content of the powder in four castingsequences (datafrom each sequence presented by different symbols. with the confidence intervalof analyses presented with vertical error bars).
Figure 5.2 and 5.3 each show data obtained for a single casting sequence. The casting powderSTC-89 was used in the current study of the effect of alumina on viscosity. It appears fromFigure 5.2 that about 3.5 mass % alumina was absorbed by the casting powder. The effect of thisincrease will be discussed with the aid of measured viscosity data in section 5.2.

98.5
ftI 8.~ 7.5= 7'iiO 6.5
~(I) 6:: 5.5 ••• -.:=========-:IE 5
4.54+----+----t----+-----+----+-----If------1
35 65 75
Casting Time (min)
Figure 5.2: Alumina content of casting powder STC-89.
t I I
I t
I I! • Alumina measured
___ Initial alumina
Figure 5.3 shows the decrease in alumina content of the powder as a new powder type was usedfor the casting of a different steel grade during a sequence cast. In order to keep the continuity ofthe casting sequence, medium carbon steel was cast directly after the low carbon steel; this beingthe reason for the powder change. During this powder change most of the "old" casting slag wasscooped out of the mould prior to replacement with the new powder that was used. (It is notnecessary to scoop off the old casting powder, and in some cases the new powder is simplyadded to the old one, since this causes less disturbance at the meniscus area and assurescontinuous molten powder supply since there is no delay in waiting for the fresh powder tomelt). The effect is clearly seen where the new casting powder with low alumina content isadded. As can be seen, the new powder absorbs almost 5% alumina during the twenty minutesrecorded. The reasons for this may include:• the dilution with the previous powder that was left with higher alumina level• the fact that this change followed in the sixth ladle in the sequence. The question is whether
the tundish slag is still removing inclusions at the same rate as on the earlier ladles.• Since a large amount of fresh powder is added to the mould that still need time to melt, there
might be less molten powder available in the meniscus area that could cause poor lubricationand higher alumina levels in the smaller volume of molten flux.
Just before the last sample was taken from the mould, the SEN started clogging. This isindicative of alumina passing through the SEN; in other words before it reaches the casting slag.The source of this alumina might be the poorer function of the tundish slag in absorbing thealumina, a 'dirtier' ladle, alumina clusters coming loose from the shoot nozzle in the tundish, ora combination of all of the above. The only deduction to be made from this observation is thepossible dangerous situation resulting from a fresh casting slag with insufficient molten powderto absorb this alumina, and if it can absorb it, to posses adequate viscosity to assure inflow forlubrication.

Alumina pick-up (STC-89,Ferro)
10
9 fto Ic !E 8:s
I'ii 7 !';/!.II) • Alumina measuredII) 6to ___ Initial alumina (Src-89)=s • •5 ""-Initial alumina (Ferro)
4200 210 220 230 240 250
Casting Time(min)
Figure 5.3: Alumina content of casting powder STC-89, replaced with Ferro after 222 minutes ofcasting.
Models used for the prediction of viscosity are very sensitive to the composition of the slag.Figure 5.4 and 5.5 graphically show the major constituents (with the confidence interval ofanalyses) of the two powders used in this study - as analysed by EDX after viscositymeasurements. The composition provided by the manufacturer and the alumina additions madeto the powder are also shown - composition normalised to 100 mass % (excluding carbon).Table 5.1 and 5.2 provide all the components analysed as used in the evaluation of the viscositymodels. Analyses of the casting slag after viscosity measurements revealed that on average about1.1 mass % of chromium oxide (regarded as Cr203) and less than 0.1 mass % of nickel oxide(regarded as NiO) was present in the slag due to absorption of these elements from the 304stainless steel sample crucible. Chromium and Nickel could not be included in the viscositymodels since no provision was made for them.Figure 5.4 and 5.5 show that constituents analysed close to the expected values according to themanufacturers specifications, except CaO for both powder types. (CaO values from the samebatch of powder coming from different crucibles after viscosity measurements varied over a 10%range, and were on average considerably higher than manufacture specifications.) CaO values ofthe same order as reported here were analysed for identical powder types obtained from themould in section 5.1. Higher CaO values used in the equations will have a noticeable impact ontheir predicted viscosity. No apparent reason for the somewhat higher CaO values was found, butthe analysed values were used in preference in order to compare the predicted viscosity values.
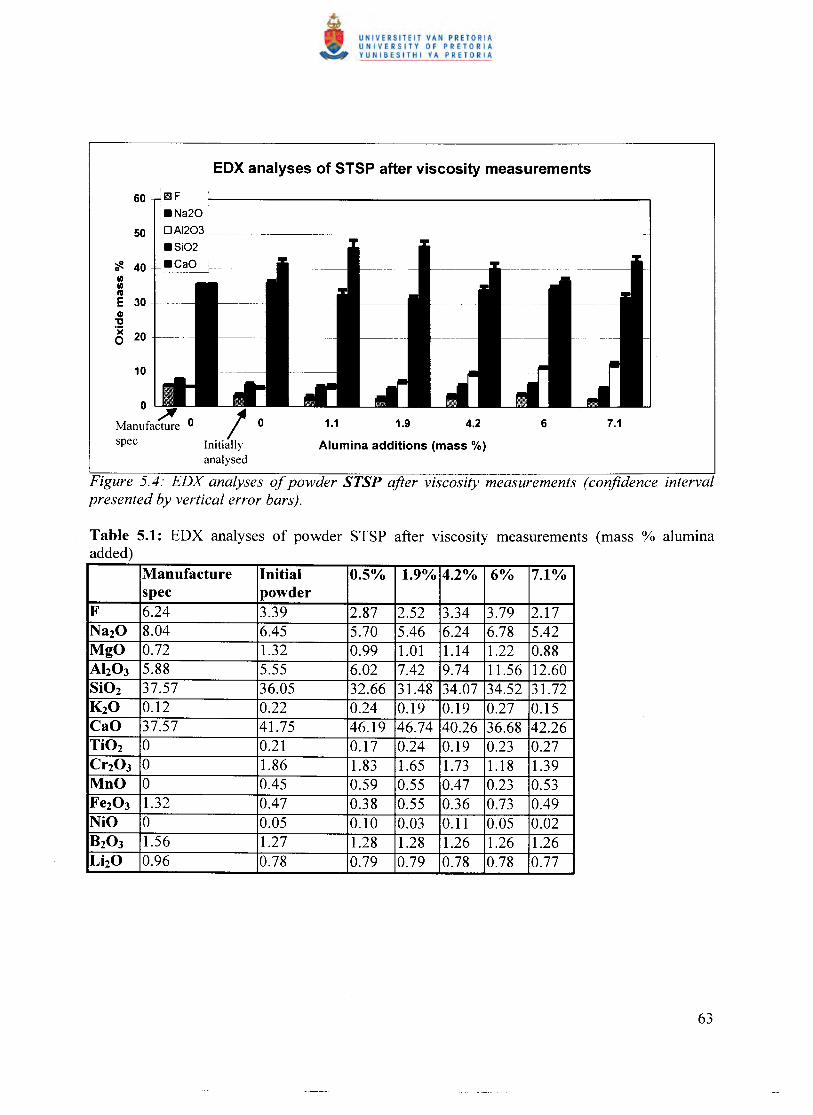
60
50
~ 400
UlUlIII
E 30 -Ql'tl.;( 200
'IlIlF
.Na20OAI203 _.Si02.CaO
/0Initiallyanalysed
Figure 5.4: EDX analyses of powder STSP after viscosity measurements (confidence intervalpresented by vertical error bars).
Table 5.1: EDX analyses of powder STSP after viscosity measurements (mass % aluminaadded)
Manufacture Initial 0.5% 1.9% 4.2% 6% 7.1%spec powder
F 6.24 3.39 2.87 2.52 3.34 3.79 2.17Na20 8.04 6.45 5.70 5.46 6.24 6.78 5.42MgO 0.72 1.32 0.99 1.01 1.14 1.22 0.88Ah03 5.88 5.55 6.02 7.42 9.74 11.56 12.60Si02 37.57 36.05 32.66 31.48 34.07 34.52 31.72K20 0.12 0.22 0.24 0.19 0.19 0.27 0.15CaO 37.57 41.75 46.19 46.74 40.26 36.68 42.26Ti02 0 0.21 0.17 0.24 0.19 0.23 0.27Cr203 0 1.86 1.83 1.65 1.73 1.18 1.39MnO 0 0.45 0.59 0.55 0.47 0.23 0.53Fe203 1.32 0.47 0.38 0.55 0.36 0.73 0.49NiO 0 0.05 0.10 0.03 0.11 0.05 0.02B203 1.56 1.27 1.28 1.28 1.26 1.26 1.26LhO 0.96 0.78 0.79 0.79 0.78 0.78 0.77

Ii1IF.Na20OAI203
45·.Si02 40.CaO 35
~ 300
IIIIII 25III
EGl 20'C.;c 150
105o ,xO /0
Manufacturespec Initially
analysed
Figure 5.5: EDX analyses of powder STC after viscosity measurements (confidence intervalpresented by vertical error bars).
Manufacture Initial 1.3% 4.1% 4.5% 6.4% 8% 10.4%spec powder
F 10 6.15 6.10 2.60 4.93 6.45 5.16 5.74Na20 12.7 9.28 9.22 7.58 9.44 9.82 8.48 9.01MgO 1.78 1.55 1.34 1.32 1.55 1.35 1.28 2.78Ah03 5.36 4.47 5.76 8.60 8.99 10.85 12.46 14.91Si02 34.9 33.82 33.75 36.29 33.97 33.64 31.93 30.23K20 0.9 0.75 0.72 0.82 0.73 0.68 0.66 0.55CaO 30.8 40.84 38.65 39.01 36.76 34.16 36.39 33.79Ti02 0.2 0.43 0.41 0.31 0.38 0.36 0.29 0.48Cr203 0 1.71 2.37 1.72 1.87 1.51 1.81 0.96MnO 0 0.49 0.31 0.24 0.29 0.27 0.52 0.26Fe203 2 0.32 0.98 1.30 0.88 0.65 0.80 1.00NiO 0 0.11 0.22 0.09 0.06 0.08 0.10 0.11
It is necessary to convert the weight fraction of fluorine (as obtained from EDX analysis) tocalcium fluoride so that the models can be applied. The method selected here was to:
• Multiply the wt % F by ( ~:) - which is the molar mass of ( c;;, J• Subtract 1.47 (wt % F) from the wt % ofeaO
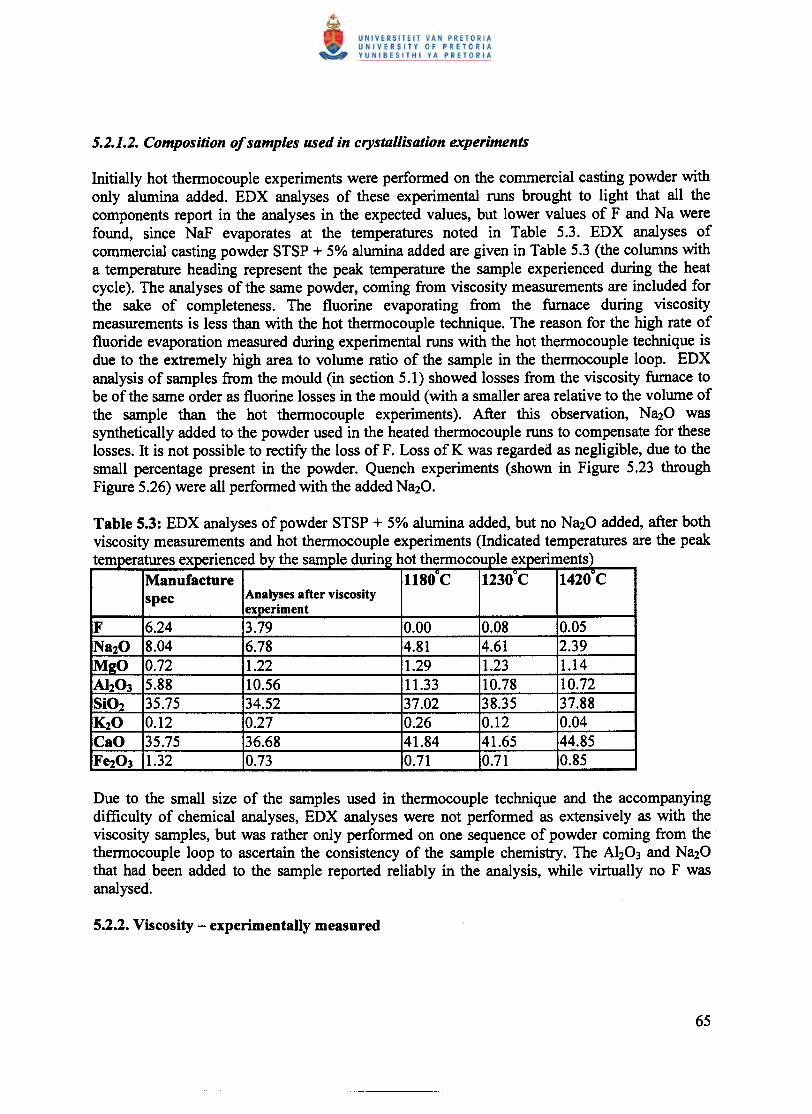
Initially hot thermocouple experiments were performed on the commercial casting powder withonly alumina added. EDX analyses of these experimental runs brought to light that all thecomponents report in the analyses in the expected values, but lower values of F and Na werefound, since NaP evaporates at the temperatures noted in Table 5.3. EDX analyses ofcommercial casting powder STSP + 5% alumina added are given in Table 5.3 (the columns witha temperature heading represent the peak temperature the sample experienced during the heatcycle). The analyses of the same powder, coming from viscosity measurements are included forthe sake of completeness. The fluorine evaporating from the furnace during viscositymeasurements is less than with the hot thermocouple technique. The reason for the high rate offluoride evaporation measured during experimental runs with the hot thermocouple technique isdue to the extremely high area to volume ratio of the sample in the thermocouple loop. EDXanalysis of samples from the mould (in section 5.1) showed losses from the viscosity furnace tobe of the same order as fluorine losses in the mould (with a smaller area relative to the volume ofthe sample than the hot thermocouple experiments). After this observation, Na20 wassynthetically added to the powder used in the heated thermocouple runs to compensate for theselosses. It is not possible to rectify the loss of F. Loss of K was regarded as negligible, due to thesmall percentage present in the powder. Quench experiments (shown in Figure 5.23 throughFigure 5.26) were all performed with the added Na20.
Table 5.3: EDX analyses of powder STSP + 5% alumina added, but no Na20 added, after bothviscosity measurements and hot thermocouple experiments (Indicated temperatures are the peak
. db th 1 d . h th 1 . )temperatures expenence )y e sampJe unng ot ermocoupJe expenmentsManufacture 1180
Q
C 1230Q
C 1420°Cspec Analyses after viscosity
experimentF 6.24 3.79 0.00 0.08 0.05Na20 8.04 6.78 4.81 4.61 2.39M20 0.72 1.22 1.29 1.23 1.14Al203 5.88 10.56 11.33 10.78 10.72Si02 35.75 34.52 37.02 38.35 37.88K20 0.12 0.27 0.26 0.12 0.04CaO 35.75 36.68 41.84 41.65 44.85Fe203 1.32 0.73 0.71 0.71 0.85
Due to the small size of the samples used in thermocouple technique and the accompanyingdifficulty of chemical analyses, EDX analyses were not performed as extensively as with theviscosity samples, but was rather only performed on one sequence of powder coming from thethermocouple loop to ascertain the consistency of the sample chemistry. The Ah03 and Na20that had. been added to the sample reported reliably in the analysis, while virtually no F wasanalysed.

Figure 5.6 and 5.7 show the effect of temperature on viscosity with increasing alumina contentfor respectively STSP and STC (the two commercial casting powders used in this study - theiranalyses is given in Table 4.3, section 4.2.2). Alumina increase shows a similar effect on bothpowder types.
6.8
1lt/T (K'1)
Figure 5.6: Viscosity change of STSP with temperature and increasing alumina content.
1.4
i 1.2'0E!:. 1
~! 0.8u~ 0.6
.9G.40.2
i 1.2'0E!:.1~.; 0.8ou~ 0.6Q.9 0.4
0.2
o5.8
-+-0%--0.5%
1.9%~4.2%--6%-'-7.1%
--1.3%
~4.1%
·_",·--4.5%__ 6.4%
-'-8%
-+-10.4%o~ u u u U
1041 T (K·1)
Figure 5. 7: Viscosity change of STC with temperature and increasing alumina content.

When the shear rate is varied in a non-Newtonian fluid, the shear stress does not vary in the sameproportion. The viscosity of such fluids will therefore change as the shear rate is varied. Theshear rate can be simplified as a function of the rotation speed of the spindle (Equation 1 insection 4.2.1.1).
Some indication of possible non-Newtonian behaviour is visible in Figure 5.8, which shows thetemperature dependence of the viscosity to depart from the expected Weymann and Arrheniusrelationships, showing positive deviations at lower temperatures (to the right in the graph). Theequation coefficients were calculated to give a good fit at the high temperatures by using theleast squares technique. With this fitting technique there is no visible difference between thecalculated Arrhenius and Weymann equations.
1.4
_ 1.2
i!!:.l:' 0.8'8u 0.658' 0.4..I 0.2
o5.8 6.6 6.8
1041 T ( 1('1)
Figure 5.8: Log viscosity (TJJ vs. lIT for the powder STSP (with no alumina added). The dottedlines show the results of fitting the higher-temperature data to the Arrhenius and Weymannrelationships.
A common method for characterising and quantifying non-Newtonian flow is to calculate theratio of the fluid viscosity as measured at two different spindle speeds. In constructing the ratio,the viscosity value at the lower speed should be placed as the numerator, the one at the higherspeed as the denominator. These measurements are usually made at speeds that differ by aconstant factor (for example, 2 and 20 RPM, 10 and 100 RPM, etc.). For dilatant (shearthickening) fluids, the ratio will be less than 1 as the degree of dilatancy increases. Figure 5.9shows this tendency for the casting powder STSP at low temperatures.

1.06 ..,.....-------------------------------,+
1.041.02
o 1;:;l'!0.98~'i 0.96o~ 0.94:; 0.92
0.90.880.86 +---...,..----..,..-----r---...----...,....--....,...-----,.---,---~
900
+..........--~..._--_ .._ .._-----_._----_ .._------_._--........ +// + +
/+2 < co ratio < 3i
/ii +
950 1000 1050 1100 1150 1200 1250 1300 1350T (OC)
Figure 5.9: Viscosity ratio for different .temperatures for the powder STSP (with no aluminaadded). The dotted line shows the trend of the data at lower temperatures. The ratio of rotationspeeds (w) is between 2 and 3.
The most basic graphic method of analysing non-Newtonian flow is constructing a plot ofviscosity vs. spindle rotation speed. Figure 5.10 shows an example of the apparent viscosityincrease as the spindle rotation speed increases. This kind of data should preferably be usedtogether with Figure 5.9 (since it does not prove non-Newtonian behaviour by itself; theconfidence interval band of viscosity measurements must be taken into account).
430042804260
a: 4240.!!. 4220
f 4200~ 4180:> 4160
414041204100
1 456Spindle rotation (RPM)
Figure 5.10: Viscosity for different spindle rotation speeds for the powder STSP (with noalumina added). Dilatancy is clearly seen in this single data series, but is not as clear at alltemperatures.

The phenomenon of a sharp increase of the viscosity at a certain temperature (Break pointtemperature) was not found in powder STSP, even for viscosity of up to 100 Poise, as shown inFigure 5.11. STSP is a medium carbon steel grade powder and is designed to crystallise at hightemperatures near the meniscus area in the mould (CaO/Si02 ratio of 1). CNS has a higherCaO/Si02 ratio of 1.11, which favours crystallisation and should yield a highly crystalline slag inthe mould area. The existence of a Break point temperature appears to be as variable as viscositytest results and is a function of the laboratory studying the slag. Viscosity measurements weredone on three other commercial powder types, of which only one displayed this phenomenon.Figure 5.11 is included only for an example of the phenomenon. Note that powder CNS-IOb-2Ehas an average viscosity lower than that of STSP before this breakpoint temperature is reached atabout 1090°C. (The manufacturers quoted this value to be 1140°C).
2.5
.- 2I) --STSP'0 1.5!!;. ...•..•eNS~I)0u.!!> 0.5
8'..J0
-0.55.5 6 6.5 7 7.5 8 8.5
104/ T ( K·1)
Figure 5.11: Log viscosity change of STSP and CNS with temperature measured showingbreakpoint behaviour ofpowder CNS.
If, as shown in Figure 5.2, a 4 mass % alumina increase occurs during casting, the viscosity ofthe powder STC-89 at 1300°C will be affected by about 0.3 Poise, a 15 % viscosity increase, andeven less at higher temperatures. Anzai et al [1987] conducted a study on the relationship of thepressure and flow rate of the powder film 20mm below the meniscus during the oscillation cycle.They found that, when the powder viscosity reaches around 4 Poise, the pressure distributionreverses and the molten powder flows not down, but up in the mould-strand gap. There is thus amaximum limit to the viscosity of the powder at the meniscus temperature so that the slag canstably infiltrate the mould-strand gap. STC-89 has a viscosity of2 Poise at 1300°C, which can beregarded as a low viscosity powder, according to present manufacturing practice. If the viscosityis raised to 2.3 Poise by 4 % alumina increase, infiltration will not be affected if the 4 Poise limitof Anzai et al [1987] is taken as measure (The temperature 20mm below the meniscus should behigher than 1300°C, and the viscosity therefore lower. Only at low temperatures less than 1200°Cwill the viscosity be raised to above 4 Poise with 4 % alumina increase). It is concluded that the

rise in alumina content of the sla~ will not affect the ability of the casting slag to flow into themould-strand gap (at around 1500 C).
In the same study, Anzai et al [1987] plotted the effect of viscosity at 1300°C on the oscillationmark depth, as shown in Figure 5.12. If the viscosity rises from 2 Poise to 2.3 Poise, the depth ofthe oscillation mark increases from 0.9mm to 0.92 mm. If the viscosity is raised to 4 Poise, theoscillation mark depth will be increased from 0.9mm to 1.1mm .
. V-l.Om/mins-amm. f-l2Sc:pm1.2
/Ii 1.1 /'
! /' .ii1- 1.0c ,J hut-0.2 /
4 0.9 /e'0 '!0.8 ,/
I0.1
. Viscosity of molten powder." <at 1300°C)
Figure 5.12: Influence of viscosity of molten powder (at 1300°C) on the observed oscillationmark depth [Anzai et ai, 1987].
The surface of the steel strand that is in contact with the powder at the bottom of the mould,according to Branion [1987], is calculated to be at around 1150°C. Note that there is nobreakpoint temperature measured for powder STC-89, as low as 1025°C, therefore no sudden risein viscosity is expected in the mould. A viscosity of about 7 Poise is expected at the bottom ofthe mould at 1150°C if 4% alumina is absorbed (23 % viscosity increase from 5.6 Poise for initialpowder at 1150°C), and the bottom of the mould should enjoy liquid lubrication. The impact onthe lubrication in the mould due to the viscosity increase can be quantified through the influenceon the liquid friction force. If the viscosity is 7 Poise at the bottom of the mould, it is notexpected that there would be a partly crystalline mushy zone extending up to the steel strandsurface, and by implication no possible solid friction with the steel strand is expected. (The forcedue to solid friction will be at least an order of magnitude greater than that of liquid friction,according to Branion [1987]). As discussed in section 2.4.1 the liquid frictional force Fliq is

composed of the shear stress in the liquid slag film caused by relative motion between the shelland the mould.
~ _ 77(Vm - VJAliq - d
I
Where: 11 = viscosity of the slag filmVm = velocity of the mould itself (at any given moment, positive or negative)Vc = casting speedA = area of the strand mould contactd) = thickness of the slag film
It can be seen that viscosity has a linear first order influence, and the liquid friction forceexperienced at a definite position in the mould will double if the viscosity doubles. Thissimplification is by no means absolute in its prediction capability and serves only for illustrativepurposes since it does not take into account that the thickness of the slag film should increasealong with an increase in viscosity. The viscosity increases if 4 mass % alumina is absorbed bybetween 10% and 25% (as the temperature changes) throughout the mould. If an assumption ismade that an average increase in viscosity of 20% exist through the mould when 4% alumina isabsorbed, a 20% rise in liquid friction force will be experienced (which should even be less dueto the thicker slag film). Since this increase in liquid friction is not expected to be coupled withsolid lubrication, the total impact on friction should be of no concern.
Hering & Fenzke [1992] plotted the influence of the viscosity of different casting powders at1300°C on the integral heat flow density across the broad face of a slab caster (shown in Figure5.13, for a casting speed of 1 m/min). Figure 5.13 must be understood in the light of the entireslag behaviour in the mould area. The higher heat flux with lower viscosities can be expectedfrom a slag that solidifies (as glass or crystal) at a lower temperature and is not merely the effectof the heat transfer in the mould area where there is only liquid slag present at 1300°C.

- 1,8('II
v=1m/minE~ 1,6::E-~ 1,4It:
m~ 1,2Q)C)~ '0~« I 08,
o 0,1 0.2 q3 0/+Mould flux viscosity (Pa.s)
Figure 5.13: Variation of the integral heat flow density in the mould of a slab caster with theviscosity of the casting powder slag. Viscosities were measured with a rotating spindleviscometer at 1300°C and the letters A to G refer to different castingpowders [Hering & Fenzke,1992].
For a 4 mass % alumina increase, the viscosity will be raised from 0.2 to 0.23 Pa.s, and the heatflux (according to Figure 5.13) will only be lowered marginally (by less than 0.IMW/m2).
Before clean steel practice became as paramount as it is today, alumina increase in castingpowders of up to ten percent was common, since alumina was not removed at secondarymetallurgy or in the tundish as effectively as today. When problems occur in current castingpractice, this same scenario may be encountered; whether it be the aluminium in the steel that re-oxidises, or the alumina formed during de-oxidation that is not effectively removed. An aluminaincrease of 10% for powder STC-89 at 1300°C will cause a viscosity increase from 2 Poise to 5.7Poise, a 185% increase. A viscosity of 5.7 Poise at 1300°C is higher than any commercialpowder displays today (typical 1300°C viscosity range from 1 to 3 Poise) and poor feeding(especially at higher casting speeds) can be expected, especially if the 4 Poise limit of Anzai et al[1987] is used as measure. STC-89 is a low carbon-steel casting powder and is designed toaccommodate sticker-sensitive steel grades by its lowered viscosity with associated excellentinfiltration and lubrication. It is clear that the infiltration ability will be severely hampered if10% alumina is absorbed, and sticking of the steel shell to the mould wall can be expected.
The oscillation mark depth according to the study of Anzai et al [1987] will increase from0.9mm to 1.2mm, a 33% depth increase, for the viscosity increase from 2 Poise to 5.7 Poise.
At 1150°C the viscosity will have increased from 5.6 Poise to 22.7 Poise, a 305% viscosityincrease. The effect on friction experienced by the steel strand may at the same time lookcompletely different than that of a 4% alumina increase. With the slag's viscosity being 22.7Poise near the exit of the mould next to the steel strand surface, a partly crystalline mushy zonemay be present in the slow moving viscous slag. It is even possible that solid lubrication may be

experienced at the bottom of the mould, depending on the heat cycle in that area. To effectivelyevaluate the extent on the total friction (solid friction + liquid friction) force experience by thesteel strand, the effect of the higher viscosity near the bottom of the mould must be consideredtogether with the effect of crystal growth in the slower moving, thin liquid layer.
An alumina increase of 10% for powder STC-89 at 1300°C will cause a viscosity increase from0.2 Pa.s to 0.57 Pa.s. According to Figure 5.13, the heat flux will be drastically lowered to lessthan 0.8MW/m2). It must be noted that alumina that is responsible for the increase in viscosity,undermines crystallisation, which in turn will raise the heat transfer relative to a more crystallineslag. Nevertheless, it is expected that the slag will increase the solid to liquid ratio (lower in themould area) for the higher viscosities, and the heat transfer will decrease because of this.
It is concluded that a 10 mass % alumina increase can be expected to seriously hamper stableoperation of the casting slag, and surface slab defects (or even a breakout due to poorlubrication) may occur.
For a more complete description of the models mentioned here, refer to section 3.1.2, Chapter 3.Models predicting the viscosity with the temperature and the composition of the slag as variableshave developed to the extent of approximating the influence of a constituent or temperaturechange in the system. As Figure 5.14 and 5.15 show, their accuracy may vary from highlyaccurate to yielding a 10 Poise under-prediction. Several models should be applied to a powdertype in order to evaluate them and to choose one that predicts the trend for the specified situationthe best, since there are a multitude of variables changing and influencing each other as chemicalanalyses or temperatures change. One model may approximate the influence of a certain elementmore accurately than another model, but may prove less accurate for a different element. This isalso true for temperature changes.
The most extensive evaluation of viscosity prediction models yet was done in a recent paper byFox & Mills [1999], based on a round robin study in which 22 laboratories from around theworld participated. Five models were evaluated on their predicting accuracy, compared to themeasurement values of the laboratories. The models evaluated were those of Kim, Koyama,Riboud, Iida and NPL. The findings are summarised below, since they bear direct impact on thecurrent study.In the overall rankings, the model of Riboud performed the best while the model of Kim wasrated fourth out of five, and Koyama last (least accurate). A short discussion of the shortcomingsand weaknesses of each model will follow:
RiboudA disadvantage of this model might be that it fails to differentiate between the various cations,e.g. MgO on a mole fraction is treated as if it were CaO. Furthermore, the Riboud model doesnot account for MnO or LhO. If the slag composition contains significant amounts of theseoxides, the actual viscosity may change markedly, while the value of the predicted viscosityremains the same. In practice, the mole fractions of MnO should be added to CaO and the molefraction of LhO to Na2D. The powder STSP that was used in the current study contains 0.8%

LhO, but the model predicted the viscosity more accurately for this powder than STC, that doesnot contain LhO at all (as shown in Figure 5.14 and 5.15).
KoyamaKoyama makes no allowance for B203, FeO or MnO, and only partially for LhO. Again, it mightbe expected that slag compositions that contain significant quantities of these components wouldresult in the model prediction having a poor fit to experimental values. Fox & Mills [1999] foundthat the Koyama model consistently overestimates the viscosity, and corrections can be made tocompensate for this. In the current study, Koyama consistently predicted the highest viscosity ofthe three models, but the predicted viscosity was not greater than the measured viscosity (asshown in Figure 5.14 and 5.15).
KimThis model also excludes some components, namely FeO, MnO and Ti02, and only partiallyaccounts (contains terms in only one constant) for LhO, Na20 and MgO. The Kim modelproved inconsistent in its prediction ability, while generally underestimating viscosity, so nocorrection was attempted. In the current study, Kim was indeed found to consistentlyunderestimate the viscosity (shown in Figures 5.14 and 5.15).
The Riboud model is based on a Weymann relation, and it is thought that this is partly the reasonfor its greater accuracy in predicting slag viscosity. The Kim and Koyama models make use ofan Arrhenius relation, that was felt to be less accurate with respect to temperature changes andmay reflect the poorer performance of these models relative to the Riboud model (refer to section3.1.2 for the definitions of the relations). Furthermore, if those slag compositions containingcomponents that are not considered by some models, are removed, it is likely that these modelpredictions would fit the experimental values better. This would be fairer for these models asthey do not claim to be able to predict the viscosity of slag compositions containing thesecomponents. This recognises the limited range of compositions over which these models canaccurately predict.
Figure 5.14 shows how three models predict the viscosity of STSP, a more crystalline powderthan STC-89. Both Riboud and Koyama predict the viscosity within 2 Poise of the measuredvalues over the whole alumina range at 1200·C, 1300·C and 1400·C. Koyama proves closer atthe lower alumina values, up to about 5% alumina added. At the higher alumina values, Riboudis closer. Kim should not be used to predict the viscosity with powder STSP, since it under-predicts the viscosity, even with 0% alumina added. Note again that a model cannot be evaluatedfor only one casting powder type, or a limited temperature range. Furthermore, this studyconsidered only the influence of alumina - the accuracy of the models cannot be judged forvariations in other constituents. At lower temperatures than 1200·C, all three models loseaccuracy by under-predicting the viscosity. The reason for this appears to be that these models donot take crystallisation or solid particles in the liquid (that will raise the apparent viscosity) intoaccount. Their use is restricted to temperature ranges where a pure liquid is present. Viscositymeasurements themselves could not provide evidence of the existence of solid phase particles inthe melt, and the above statement is aided by data obtained from quench data experiments whencrystallisation was studied separately. Since neither the heat cycle nor the experimentaltechnique was the same during the viscosity and crystallisation measurements, the only

conclusive deduction to be made is the possibility of the existence of crystals at temperatures ashigh as 1200°C (according to the consistency of a crystal fraction present at 1300°C in Figure5.23 to Figure 5.28). Another contribution to the possibility of the presence of crystals in theliquid is the time duration of the viscosity measurements. Altogether 50 minutes passed duringevery 50°C temperature interval that provided adequate time fot crystal growth.
Figure 5.15 shows how the three models predict the viscosity ofSTC, a low carbon steel castingpowder with an aimed low viscosity. Koyama proves overall closest, but under-predicts theviscosity at alumina levels higher than 5% added. The varying ability of these equations can beseen by the fact that Kim performs best at 1300°C at the more than 5% alumina added, whileproving altogether unsatisfactory at the other temperatures. To successfully predict the viscosityof the powder STC, other models must be evaluated in addition to the three mentioned here, tofind a more suitable one.

12
---Mea.ured10 --Rlboud•• --Koyama
.II 8 --Kim0e::.~ 8!u~ 4
2
0
0 2
I
I
I 40e::.~ 3
!u2.II
>
00
3
2.5
a;-lii 2"0!:.~ 1.5
!u.!!>
0.5
00
---Mea.ured--Rlboud--Koyama--Kim
---Mea.ured--Rlboud--Koyama--Kim
Alumina increase (mass%)
Figure 5.14: Predicted viscosity according to viscosity models compared to measured viscosityo/powder STSP at 1200·C, 1300·e, 1400·C.

Viscosity Incr.as. vs. alumina pick-up (STC, 1200DC)
18
14---" •••ur.d
•• 12 --Rlboud.!l --Koy.m •0 10 --Kime:.~ 8
!Il,t :::~ 4 ~. •2
00 2 4 I 8 10
Alumina Incr.as. (mass%)
Viscosity Incr•••• va. alumina pick-up (STC, 1300DC)
7
I ---" •••ur.d--Rlboud.- 5 --Koy.m ••'0 --Kim!!:. 4
~! 3l,t
~ 2
00 2 4 8 8 10
Alumina Incr•• s. (m.ss%)
Viscosity Incr•••• vs. alumina pick-up (STC, 1400DC)
3.5
3 ---" •••ur.d--Rlboud•• 2.5 --Koy.m.
JI0 --Kime:. 2~! 1.5 ~. ----.l,t •~ ..
• • • ..0.5 -
00 2 3 4 5 I 7 8 II 10
Alumina Incr•••• (m•• s%)
Figure 5.15: Predicted viscosity according to viscosity models compared to measured viscosityo/powder STC at 1200·C, 1300·C, 1400·C.

Section 2.4 in chapter 2 refers to work conducted by Hering et al [1992] that shows how thedominant mineral phase fractions of the casting powder change as the percentage aluminaincreases. Figure 5.16 shows the compositions of both STC and STSP superimposed unto thispredicted mineral phase map. Figure 5.17 and 5.18 respectively show the mineral phases ofSTSP and STC as analysed with XRD - Cuspidine being always present as the most prominentmineral phase. Figure 5.17 and 5.18 were combined by taking the value of the strongestCuspidine peak as 100% intensity. The value of the strongest peak analysed of the other phaseswhere then presented as a relative intensity to that of Cuspidine. The fmdings of these figurescompare quite favourably with Figure 5.16. From the viscosity measurements it is clear thatincreasing alumina content of both powders steadily increases the viscosity. STSP is a mediumcarbon steel powder with enhanced crystallisation behaviour. The result of the crystallisation ofthe powder may result in poorer lubrication (due to the liquid slag crystallising) and cause solid-solid friction between the mould and the strand. If the fmdings of Hering et al [1992] in Figure2.8 prove accurate, the friction force of STSP will not increase in the mould as about 10%alumina is absorbed, despite the viscosity increase. The reason for this according to Figure 2.8 isthe precipitation of the mineral phase Gehlenite. This phenomenon can be viewed with the aid ofthe following observation:It may be possible that one mineral phase crystallises over a narrower temperature range thananother. This in turn will influence the liquid arrangement in respect to the amount of solids(crystals) it contains and their morphology - the size and form of the mushy zone. To evaluatethe above observation, both friction force data and crystal growth data need to be collected.Friction force was not studied by the author (this would require load cells beneath the mould orequivalent laboratory tests). Section 5.3 will discuss why only the use of the hot thermocoupletechnique together with high temperature microscope analyses can give an accuratedescription of the crystal growth and temperature dependence of crystallisation.

o~z~v.l~
:;; 4 r:~il~::V+~hT;<:.::...2 :::=W~~l~·~i~~ii:::·.:~.::~·.\:'0' ':\:~:.:.:~:\':J.~..'~:<.:~..:~).
o 6 8· '. 10 12
Mass%Ah03
Figure 5.16: True mass % Na20 and Ah03 as analysed by EDX after viscosity measurements ofboth STSP and STC superimposed upon the stable mineral phase map measured by Hering et al[1992].
:12Pulver C
10
+ STC8 Nephel
* STSP
6
100
908070605040302010o
Cuspidine (Ca4Si207F2)Nepheline (NaAISi04)
Gehlenite (Ca2AI2Si07)Fluorite (CaF2)
Figure 5.17: Stable mineral phase precipitating from the slag with increasing alumina contentfor powder STSP.

o->. -==';1:.Ill_s:: CII~ s::s:: .-._ 'C
CII 'is.> III;:; :;,~()CIIIt:
100
908070
605040302010o
Cuspidine (Ca4Si207F2)Nepheline (NaAISi04)
Fluorite (CaF2)Gehlenite (Ca2AI2Si07)
Figure 5.18: Stable mineral phase precipitating from the slag with increasing alumina contentfor powder STC.
Experimental work conducted brought this study right back to the fundamentals of thecrystallisation process and provided valuable information as to why crystallisation is so hard toevaluate for the in-mould situation. The situation in the mould gap is of course a mixture oftemperatures and times at these temperatures. There is no single and simple way to viewcrystallisation of mould powders in the mould, except if the whole thermal condition in themould is known and full data is available for all possible time-temperature scenarios. Thetechnique employed in this study is useful for the test of the influence of certain composition orthermal changes in the mould and may facilitate the design considerations of powders.
Several areas were encountered that posed difficulties to interpreting the data obtained fromusage of the thermocouple technique (without concurrent microscope analyses). The currentdiscussion will elaborate on these difficulties as background to the reason for the use of quenchexperiments.
The size of the sample used in each run differed to small extents, due to variability of applyingthe powder to the loop in the wire (as discussed in section 4.3.2). With small samples such asthese, the amount of heat generated by crystallisation is extremely small and difficult to preciselyinterpret. A deviation from the set cooling curve may be small or indistinct enough so thatdiscernment from electrical noise becomes ambiguous and irreproducible. The reason for the

small temperature arrests is the wide temperature range of crystallisation, as discussed below andshown in Figure 5.19.
1600_ 1500.e 1400
"l!! 1300~:: 1200•E 1100Q,
!1000••. 900
80090 490
Time (s)
Figure 5.19: Example of the extended exothermic crystallisation range displayed by the coolingof the commercial casting powder at l Cis.
Imposed constant cooling of a sample that exhibits no phase transformation tendency will resultin a linear cooling pattern. Any deviation from linearity is caused by endothermic or exothermicreactions. Figure 4.9 in chapter 4 shows an example of the single exothermic reaction of CaF2.The deviation in the cooling curve of CaF2 is clear due to the isothermal exothermiccrystallisation reaction of CaF2 at 1418·C (CaF2 is a pure material with a congruent meltingpoint). In real mould slag, crystallisation may occur over a wider range of temperature, making adeviation from the cooling curve indistinct. This was indeed found to be the case for real mouldpowders. The cooling curves on the temperature-time diagrams displayed some thermal activitythat could be identified as an exothermic reaction, but with a number of small and indistinctpeaks over a temperature range, even up to 200·C, as shown in Figure 5.19. Determining of asingle temperature of crystallisation was by no means regarded as accurate or reproducible, for adeviation from the cooling curve was sometimes pronounced at a certain temperature for a fixedcooling rate, and on other occasions not. In a complex system like mould powders, it is necessaryto incorporate the visual aspect of opaque crystal growth from the transparent liquid/glass tovalidate data.
Crystallisation in a mould powder occurs by the emergence and growth of crystals in the liquidpool. As the temperature of the sample is raised to above the melting point of the slag, thecrystals that are present in the slag will dissolve into the liquid. If the time above the meltingtemperature is short enough, some crystals will still be present in the liquid and act as aheterogeneous site for new crystals to grow out of the liquid as the temperature is lowered. Theseheterogeneous sites require less initiation energy for a new crystal to form than doeshomogeneous nucleation in the liquid itself. On the other hand, if the cooling rate is low enoughfrom very high temperature (I500·C), crystals will nucleate in the liquid and grow. The above-mentioned mechanism was observed in the collection of data. Both the peak temperature of the

sample and the length of time that the sample is maintained at that temperature will determinethe mechanism of crystal formation in the liquid pool. In the case of complete melting of thesample and dissolution of all crystalline matter in the liquid at higher temperatures, new crystalnucleation was necessary for crystallisation. In the case of incomplete melting of the samplewhere there was still some undissolved crystalline matter present in the slag at lowertemperatures and shorter times, crystallisation proceeded through growth of the existing crystals.In other words, it is possible to cool the sample as crystalline material at higher cooling ratesfrom the lower temperatures where dissolution is incomplete, than would yield crystallinematerial from higher temperatures where crystals are completely dissolved. The above discussionpredicts that the use of the same sample will yield different time, temperatures and fraction ofcrystallisation due to the elimination/addition or characteristic change of the nucleation sites inthe sample.
Experiments done beforehand showed through EDX analyses that sodium and fluorinecompletely disappear from the powder when it is heated in the thermocouple loop. The powderoften cooled as glass despite low cooling rates (as low as 1°C per second) due the lack ofNa20and F in the matrix. Sodium Fluoride (together with potassium fluoride) has a high vapourpressure at high temperatures (as discussed in chapter 2, section 2.1.3). X-Ray Diffraction of thecooled sample after crystallisation revealed that the predominate crystalline phase, namelyCuspidine (3CaO.2Si02.CaF2) that contains F, was absent as was a prominent phase likeNepheline (Na20.Ah03.2Si02) that contains Na; and Gehlenite (2CaO.Ah03.Si02) was the onlyphase present. In order to compensate for the lack ofNa20, it was added along with Ah03 to thepowder as described in section 4.3.1.2, Chapter 4. Cuspidine is formed when the F content istypically between 4 and 10 mass percentage. Even though the Na20 loss can be rectified throughadditions, the lack of fluoride remains a problem to be solved. The implication of the absence ofthe predominant crystal phase (Cuspidine) due to the absence of fluoride on the data obtained bythe Hot Thermocouple Technique remains to be determined (in regard to the true crystallisationin the mould, where Fluorine is available).
It is well known from classical nucleation theory that the onset of crystallisation in slag must bea function of the cooling rate, and that to determine the solidification behaviour of a liquid slagone must construct either isothermal time temperature transformation diagrams (TIT curves) orcontinuous cooling transformation diagrams (CCT curves). In addition, the growth rate,morphology and solidified fraction of the slag under varying cooling rates are important in thedetermination of the effect of crystallisation of the slag on heat transfer and rheology. The visualassessment of the crystallisation process at the high temperatures holds great promise in yieldingunderstanding the temperature and time dependence of crystal formation and growth duringcooling. Thermal data rather acts as an aid to visual observation to confirm the onset ofcrystallisation in the sample.
To compensate for the failure of the current technique to identify the temperature at which theslag crystallises, because of the temperature range of crystallisation, and the lack of hightemperature microscopic video facilities, use was made of the conventional and established wayof determining cooling diagrams together with time-temperature observations. The sample was

"quenched" by cutting the power supply to the platinum wire at different temperatures of thecooling cycle to construct a Continuous Cooling Transformation (CCT) diagram (keeping theinitial cooling rate constant from a specified peak temperature). Cooling rates in excess of300°C/s were achieved in the sample after the electric power was cut. The sample could then bevisually studied at room temperature for the extent of crystallisation, if any.
It would also be possible (but was not performed) to construct TTT -diagrams in addition to theCCT diagrams mentioned above by heating the sample to 1500°C and keeping it there for 1minute in order for the sample to achieve homogeneous composition and temperature and for allcrystals to dissolve. After this the sample is "quenched" to the test temperature and kept there fora variable time. After each time the sample can be quenched and microscopically examined atroom temperature for crystallisation. The test temperature will vary in order to obtain a classicalTTT diagram
Figure 5.20 shows crystals growing dentritically along the surface of a sample removed from thethermocouple wire, and is included to show the morphology of the crystalline material as seenunder the optical stereo microscope (Figure 5.21 and 5.22).
TYPE JSM-5800 ACCV 10kVWIDTH 132um MAG xl,OOOFigure 5.20: Electron microscope picture showing crystals growing dendritically on the surfaceof the sample removed after a quench experiment - backscatter electrons was used to obtain theimage.
To provide an example of the image obtained at room temperature under the stereo microscopefor the determination of the extent of crystallisation, Figure 5.21 and 5.22 are included. Thedistinction between the vitreous and opaque parts in the photo provides the estimated percentage

crystallisation. Figure 5.21 shows crystals suspended in glass in the approximate ratio of 3 to 7.The crystals nucleating throughout the glass serve as an example of the nucleation and growthmechanism at work in the samples. The right part in this figure is more crystalline due to theslower cooling it was exposed to - which is a function of the geometry of the design of thethermocouple loop (see Figure 4.7 and 4.8, section 4.3.1.1). The design of the sample loop(measure thermocouple) was arranged such that the sample was exposed to a hotter side (righthand side of the measure thermocouple in Figure 4.7), adjacent to the control thermocouple, anda colder side (left hand side of the measure thermocouple in Figure 4.7). The colder side willcool faster due to the absence of heat input from the control thermocouple side, together with thecooling effect from the cooled side (in contact with water cooled clamp) of the thermocouplewire. The thermal inertia is small in this comer due to the small amount of molten slag in contactwith this area. The faster cooling rate experienced in this top section in turn aids the super-cooling of glass. The consequence of this could be distinguished in some of the samples thatwere studied visually. The thermocouple is situated in the base of the loop (on the top right sideof Figure 5.21) and the temperature measured strictly represents only the area adjacent to thiscontact point. The effect of this on the results could not be determined, but would be limited bythe small size of the loop (less than 1mm in diameter). Figure 5.22 is a picture of a differentsample that crystallised to a larger extent - 50 % crystalline material. It can be seen from thispicture that the effect of non-uniform temperature distribution in the loop had less effect of thecrystal distribution than Figure 5.21 (measure thermocouple situated at bottom of Figure 5.22).
Figure 5.21: Example of optical stereo microscope picture showing crystals growing in the glassin the sample removed after a quench experiment (30% crystalline material, 70% glass).

Figure 5.22: Example of optical stereo microscope picture showing around 50% crystal and50% glass phase present in the sample removed after a quench experiment.
Before a detailed discussion of the influence of the heat cycle on crystallisation behaviour ispresented, the influence of alumina on crystallisation will be discussed. Figure 5.23 shows howthe crystallisation behaviour of the powder STSP changes as 5 and 10 percent alumina are addedto the powder. Increasing alumina content decreases the percentage crystal present in the sampleat the same quench temperature. This implies that the temperature at which crystals startprecipitating in the sample is lowered as the alumina is increased. Let us consider the scenario inwhich powder STSP is enriched with respectively 5 and 10 mass percentage alumina during asequence cast - considering the effect on both viscosity and crystallisation at the isothermalcondition of 1300
oe. According to Figure 5.6 the viscosity will rise from 2.5 Poise at 13000e to 4
Poise when 5% alumina has been absorbed. 4 Poise viscosity of the slag moving next to the steelstrand will not discernibly increase lubrication/friction (for a detailed discussion onlubrication/friction, refer to section 5.2.2). Sla~ feed at the meniscus area will remain sufficientwith a viscosity of less than 2 Poise at 1550 e. Since STSP is a medium carbon steel gradepowder, the crystallisation characteristic of the powder is especially important. In the 1300
0eregion of the mould, a powder that enriches with 5% alumina should consist of only 30% crystal,opposed to the 60% crystalline material of the original powder. The ability of the powder torestrict heat flux through the slag layer should significantly be influenced by 5% aluminaincrease, more significant than the viscosity increase the powder experiences. Since heatextraction is most critical in the high temperature area of the mould (1300
oe and higher) toreduce cracking, the influence of alumina is considered to be significant to the process.
It must be emphasised that the percentage crystal that is depicted in Figure 5.23 results from aspecific temperature cycle. The influence of changes in the temperature cycle will be discussedfrom Figure 5.24 to Figure 5.26. Every piece of slag in the mould area experiences a unique heatcycle and will crystallise accordingly. (Ho and Thomas [1992] estimated actual coolin~ ratesbetween the steel shell and the mould of a continuous caster to range from less than 1 e persecond to 20°e per second depending upon position in the mould. Furthermore, slag can move

down the mould length at the speed of the steel strand, or be almost stagnant in the partlysolidified portion of the slag). At best this discussion does provide insight into the importance ofconsidering the effect of alumina on the crystallisation behaviour of the powder, together withviscosity experiments.
Through following the trend of the viscosity rise in Figure 5.6, a viscosity increase (of the 10%added alumina sample) should be in the order of 2.5 Poise to 7 Poise. This influence is moresubstantial that the 5% and could restrict slag infiltration. For a 10% alumina increase, thepercentage crystal present at 1300°C will decrease from 60% to approximately 15%(predominantly crystalline to almost pure glass phase). Clearly heat transfer in the mould islikely to be greatly increased and this may result in longitudinal cracking.
Influence of alumina on % Crystal (STSP. 1300oC. 105. 30C/s)
100 •90 • •ii 80 •1:S 70lISE 60CII:5 50! 40 .STSP + 0%III~ 30 .STSP + 5%(,) •~ 20 ASTSP+ 10%
10 •01000 1050 1100 1150 1200 1250 1300
Quench temp (oC)
Figure 5.23: Influence of alumina content of the slag on the % crystalline material present afterinterrupted crystallisation - Powder STSP + indicated alumina (Heat cycle: Held at 1300°CforlOs, cooled at 3°C/s and quenchedfrom temperatures shown).
We will now consider the strong effect of changes in the heat cycle on the crystal-forming abilityof essentially the same sample. Figure 5.24 suggests how the peak temperature influences theresidual crystals in the liquid before cooling progresses. The sample held at 1250°C for 10seconds was still 85% crystalline. The amount increases and reaches 100% as the sample isallowed to cool to 1150°C at fc/s. When the sample was heated to 1400°C, all crystallinematerial dissolves. New crystal precipitation commenced only after the sample had cooled from1400°C to around 1260°C at fc/s. The higher peak temperatures consistently yield lesscrystalline material at the same quench temperature and cooling rate.

Influence of Peak Temp. on % Crystal (STSP. 10s. 30C/s)
100 . -- • - •••• •90 "" - - ..•.- .- - ..•.ii 80 -'C -.s 70 • --ClI --e 60CD:S 50B 40 .1250 CIn .1300 C~ 30(J 20 .1400 C~ -10
0 .-950 1000 1050 1100 1150 1200 1250 1300Quench Temp (DC)
Figure 5.24: Influence of peak temperature of heat cycle on the % crystalline material presentafter interrupted crystallisation - STSP + 0% alumina (Heat cycle: Heldfor lOs, cooled at 3°C/sand quenched from temperatures shown).
From Figure 5.23 through 5.26 it can be seen that when the sample was quenched from 1300°C(after holding at 1300°C for 10s), it contained around 60% crystalline material. This value provedreproducible - as can be seen by the consistent values in Figure 5.23 through Figure 5.26, thatwere all obtained in separate experimental runs. Figure 5.25 suggests that crystalline material issomewhat less if the sample is kept for 30s relative to the 10s holding time. The explanationprovided is continued dissolution of the crystals as the sample is kept at 1300°C for the longerperiod.
An interesting phenomenon is noted, as the holding time at the peak temperature is even longer.When the sample was controlled for 50s at 1300°C and then quenched at 1300°C, morecrystalline material (70%) is reported. The value of 70% crystal remains constant when quenchtemperature is lowered - even up to 1200°C. No explanation can be offered for this documentedbehaviour. Reference is made to Figure 5.27 where the sample held for 50s of STSP+ 10%alumina exhibit the same behaviour.

Influence of Time at Peak Temp. to % Crystal (STSP. 1300oC. 30C/s)
100'ii 901: 80
~ 70lD 60:S 50i 40~- 30u 20~ 10
o1050
. - ~__ •••• "0' • ~ ~- •• I.. T T ...- •• • •. •. ..•. ..•.- - - - T _
-- •• 105 •.305.505
1150 1200
Quench Temp (oC)
Figure 5.25: Influence of time held peak temperature on the % crystalline ma!erial present afterinterrupted crystallisation - STSP + 0% alumina (Heat cycle: Held at 1300 C, cooled at 3 Cisand quenchedfrom temperatures shown).
Figure 5.26 at first glance serves to contradict the whole argument regarding the necessity ofdistinct well-documented cooling rates for crystallisation data, as discussed in the literature.Generally, cooling rate influences the undercooling (relative to equilibrium values) that a systemwill require for solidification to proceed. The lower cooling rates provide more time for crystalgrowth or nucleation than the higher cooling rates. In Figure 5.26, a marginal amount ofincreased crystal growth is reported at low quench temperatures (lower than 1200°C) for thelower cooling rates. Since the fraction of crystalline material is similar for the different coolingrates, it could be argued that the nucleation and growth rate of crystals remain constant and is nota strong function of the cooling rate. The only way to clarify the true reason for the documentedbehaviour will be to visually monitor crystal nucleation and growth as cooling proceeds bymeans of a hot stage microscope. (Since the number and morphology of the similar crystallinefractions in the samples may very well differ, the documented influence of cooling rate cannot beeffectively evaluated without the aid of visual data).

Influence of Cooling Rate on % Crystal (STSP, 1300oC, 10s)
10090 • •
ii 801: •S 70IIIE 60•:§ 50! 40 .3 CIsIII .10 CIs~ 30(,) .20 CIs':/. 20
1001050 1100 1150 1200 1250 1300
Quench Temp (oC)
Figure 5.26: Influence of cooling rate on the % crystalline material present after interruptedcrystallisation - STSP + 0% alumina (Heat cycle: Held at 1300
Ge for lOs, cooled at differentrates and quenchedfrom temperatures shown).
For interest's sake, similar data as Figure 5.25 and 5.26 have been included for the powder STSPwith 10% alumina added. Figure 5.27 shows the influence of time at peak temperature andFigure 5.28 the influence of cooling rate on crystallisation of STSP + 10% alumina. Theprinciples for the discussion of Figure 5.27 are the same as for Figure 5.25, and that of Figure5.28 are the same as Figure 5.26. The percentage crystalline material is consistently less at thesame quench temperature (for STSP + 10 % alumina) compared to the plain STSP powder.
From Figure 5.27 it can be seen that the sample held for 30s crystallises less than the sample heldonly for 1Os. The reason is again the dissolution of some of the crystals still present. The sampleheld for 50s in this case display consistently more crystalline material than even the 10s sample.
In the case of STSP + 10% alumina, cooling rate appears to play even less of a role (Figure 5.28compared to Figure 5.26).

Influence of Time at Peak on % Crystal (STSP+1 O%,3C/s, 1300oC)
10090
~ 80"S: 70
60CD:§ 50
I 40"'- 30(,)
;ft. 2010o950
• •••
.10s
.30s
.••50 s
1100 1150 1200Quench Temp (DC)
Figure 5.27: Influence of time held peak temperature on the % crystalline material present afterinterrupted crystallisation - STSP + 10% alumina (Heat cycle: Held at 1300 C, cooled at 3 Cisand quenched from temperatures shown).
Influence of cooling rate on % Crystal (STSP+10%,10s,1300oC)
100 •90'ii 80 •'CS 70ftI •S 60CD:§ 50
.3 Cisj 40If) .10 Cis~ 30(,) .•.20 Cis;ft. 20
10 •01000 1050 1100 1150 1200 1250 1300 1350
Quench Temp (DC)
Figure 5.28: Influence of cooling rate on the % crystalline material present after interruptedcrystallisation for STSP + 10% alumina (Heat cycle: Held at 1300°Cfor 10s, cooled at differentrates and quenched at temperatures shown).

6. Conclusion
During the continuous casting of aluminium killed carbon steel, the molten casting powder ontop of the liquid steel in the mould enriches in alumina to a steady-state value. With modem dayclean steel practice between 2 and 4 mass % alumina are absorbed by the casting powder. Thealumina content of the molten casting slag reaches the increased steady-state value within thefirst ladle of the sequence (the first 40 minutes of casting) and remains constant for the rest of thecasting process.
As the alumina content of the slag increases, so the viscosity increases. The viscosity of thepowder STC-89 (the low carbon powder used in this study and designed with low viscosity toreduce sticking in the mould) at BOO°C will be affected by a change in viscosity of about 0.3Poise (raised from 2 Poise to 2.3 Poise) for a 4 mass % alumina increase. This constitutes a 15 %viscosity increase, and even less at higher temperatures. Neither infiltration into the mould-strandgap, nor liquid friction force (as a measure of lubrication), nor oscillation mark depth will benotably influenced by a 4 mass % alumina increase.
When problems occur in casting practice and alumina is not removed from the steel beforecasting, or re-oxidation takes place, the alumina increase of the casting slag may be pronounced.An alumina increase of 10% for powder STC-89 at 1300°C will cause a viscosity increase from 2Poise to 5.7 Poise, a 185% increase, and poor feeding (especially at higher casting speeds) can beexpected. At U50°C (strand surface temperature at the bottom of the mould) the viscosity willhave increased from 5.6 Poise to 22.7 Poise, a 305% viscosity increase. A partly crystallinemushy zone may be present in the slow moving viscous slag in this area. It is even possible thatsolid lubrication may be experienced at the bottom of the mould, depending on the heat cycle.
Models that predict viscosity vary in their predictive capability; their accuracy may vary fromhighly accurate to yielding a 10 Poise under-prediction. They are specifically sensitive totemperature and composition changes. Unfortunately, not one of the models used today forprediction of casting powder viscosity incorporates all the compositional elements found incasting powders. There is not a single model that always performs well, and the choice of amodel should take account of the limitations of the model regarding the composition of thepowder and the temperature (considering the possibility of partial crystallisation at differenttemperatures for different casting slags).
The crystallisation temperature of a casting slag is lowered as the alumina content increases andthe stable mineral phases that precipitate change. Quench experiments used to determine the %crystalline material showed the sensitivity of crystallisation to the heat cycle that the sample hadexperienced. Heterogeneous nucleation sites (typically found in a mushy zone lower down themould) promote crystallisation. Time at a temperature also has a strong effect (longer timesincreasing crystal growth). Cooling rate was found to have virtually no effect on the %crystalline material.
Casting powder STSP-232-BA (a medium carbon casting powder designed to crystallise in themould area and reduce cracking) was used in quench experiments. A sample heated to 1300°C,held there for ten seconds and then quenched from 1300°C, should consist of only 30%

crystalline material if 5 mass % alumina is added to it, and only 10% crystalline material if 10mass % alwnina is added to it, opposed to 60% crystalline material of the original powder. Sinceheat extraction is most critical in the high temperature area of the mould (1300°C and higher) toreduce cracking, the influence of alwnina is considered to be significant to the process - evenmore so than the viscosity influence.
The data from attempts to measure the crystallisation temperature of casting slag with DTA andHot Thermocouple related techniques is difficult to interpret since the slag crystallises over atemperature range of up to 200°C. A further shortcoming to the use of the Hot ThermocoupleTechnique is the loss of fluorine from the sample, which excludes some of the stable mineralphases expected to crystallise.

7. References
Anzai E., Ando T., Shigezumi T., Ikeda M. & Nakano T., (July 1987), Hydrodynamic Behaviorof Molten Powder in Meniscus Zone of Continuous Casting Mold, Nippon Steel TechnologyReport, no.34, 31-40.
Bommaraju R., (1991), Optimum Selection and Application of Mold Fluxes for Carbon Steels,1991 Steelmaking Conference Proceedings, 131 - 146.
Branion R.V., (1987), Mould Fluxes for Continuous Casting, Mould Powders for ContinuousCasting & Bottom Pour Teeming, Iron and Steel Society, 3-13.
Brimacombe J.K. & Samasekera LV., (September 1979), The Thermal Field in ContinuousCasting Moulds, Canadian Metallurgical Quarterly, VoL 18, no. 3,251 - 256.
Carli R. & Ghilardi V., (June 1998), Managing Technological Properties of Mold Fluxes, Ironand Steelmaker, VoL 25, no. 6, 43 - 46.
Diehl S., Moore J.A. & Phillips R.J., (April 1995), Improved spherical granule moldjIux, 78thSteelmaking Conference, Nashville, Tennesee, U.S.A.
Feldbauer S., Jumbo I., Sharan A., Shimizu K., King W., Stepanek J., Harman J. & Cramb,A.W., (1995), Physical Properties of Mold Slags that are Relevant to Clean Steel Manufacture,1995 Steelmaking Conference Proceedings.
Fonseca V.A., Afrange O.D.C., Lavinas A.O., Ramos A.A. & Valadares C.A.G., (1997),Evaluation of Solidified Slag Films from Mould Powders Used in C. C, Taken From Shell/ MoldInterface, Carboox.
Fox A. & Mills K. C., (June 1999), Modelling the Viscosities of Slags in Steelmaking, Results ofglobal round robin compiled by NPL.
Hering L. & Fenzke H.W., (July 1992), On-line Monitoring of Heat Flow Density in SlabContinuous Casting, Stahl u. Eisen, VoL 112, no.7, 61 - 65.
Hering L., Heller H.P. & Fenzke H.W., (August 1992), Investigation of Flux Powder Selection inSlab Continuous Casting, Stahl u. Eisen, Vol 112, no.8, 61 - 65.
Ho B. & Thomas, (1992), Characterization of Interfacial Heat Transfer in the Continuous SlabCasting Process, Masters Thesis, University of Illinois-Champagne.
Imai T., Kurose Y., Omiya S., Sorimachi K. & Suzuki K., (1986), InjIuence of Gas onLubrication of Mould Powder, Transactions ISIJ, VoL 26, 95.

Jablonka A., Harste K. & Schwerdtfeger K., (1991), Thermodynamical Properties of Iron andIron - Carbon Alloys: Density and Thermal Contraction, Steel Research 62, no. 1, 28 - 33.
Jenkins M.S., (1995), Characterisation and Modification of the Heat Transfer Performance ofMold Powders, 1995 Steelmaking Conference Proceedings, 669 - 677.
Johnston W. & Brooks G., (1997), Effect of Al203 and Ti02 Additions on the LubricationCharacteristics of Mould Fluxes, Molten Slags, Fluxes and Salts' 97 Conference, 845 - 850.
Kashiwaya Y., Cicutti C.E., Cramb A.W. & Ishi K., (1998a), An Investigation of theCrystallisation of a Continuous Casting Mold Slag Using the Single Hot ThermocoupleTechnique, ISIJ International, Vol. 38, no. 4, 357 - 365.
Kashiwaya Y., Cicutti C.E. Cramb A.W. & Ishi K., (1998b), Development of Double and SingleHot Thermocouple Technique for In Situ Observation and Measurement of Mold SlagCrysta/lisation, ISIJ International, Vol. 38, no. 4, 348 - 356.
Kawamoto M., Kanazawa T., Hiraki S. & Kumakura S., (1997), Mold Flux for High SpeedContinuous Casting, Molten Slags, Fluxes and Salts '97 Conference, 777 - 780.
Kawamoto M., Nakajima K., Kanazawa T. & Nakai K., (1994), Design Principles of MouldPowder for High Speed Continuous Casting, ISIJ International, Vol. 34, no. 7, 593 - 598.
Kim J.W., Choi J., Kwon a.H., Lee LR., Shin Y.K. & Park lS., (1992), Viscous Characteristicsof Synthetic Mold Powder for High Speed Continuous Casting, 4th International Conference onMolten Slags and Fluxes, 1992, Sendai, ISIJ, 468 - 473.
Kishi T., Tsuboi H., Takeuchi H., Nakano T., Yamamiya M. & Ando T., (July 1987), MoldPowder Technology for Continuous Casting of Titanium-Stabilized Stainless Steel, Nippon SteelTechnical Report, no. 34, 11 - 20.
Koyama K., Nagano Y., Nagano K. & Nakano T., (July 1987), Design for Chemical andPhysical Properties of Continuous Casting Powders, Nippon Steel Technical Report, no.34, 41 -47.
Kyoden H., Diohara T. & Nomura a., (1987), Development of Mould Powders for High SPeedContinuous Casting of Steel, Mould Powders for Continuous Casting and Bottom Pour Teeming,Iron and Steel Society, 45 - 51.
Mills K. C., (1991a), The Performance of Casting Powders and Their Effect on Surface Quality,1991 Steelmaking Conference Proceedings, 121 - 129.
Mills K. C., (August 1991b), Commission Report on Standard Reference Material (SRM) ForHigh Temperature Viscosity Measurements, NPL Report DMM(A) 30.

Mills K. C. & Machingawuta N., (August 1991), SRM for High Temperature ViscosityMeasurements: Results for Phase Two of Interlaboratory Comparison Program, NPL ReportDMM(A) 29.
Mills T.N. & Bhat B.N., (October 1973), Development of Continuous Casting Mold Powders,Iron and Steelmaker, Vol. 5, no. 10, 18 - 24.
Nakano T., Kishi T., Koyama K., Komai T. & Naitoh S., (1984), Mould powder technology forcontinuous casting of aluminium-killed steels, Transactions ISU, Vol. 24, 950 - 956.
Nakato H., Omiya S., Habu Y., Emi T., Hamagami K. & Koshikawa T., (March 1984),Optimizing Mold Lubricationfor High-Speed Continuous Casting of Slabs, Journal of Metals, 44-49.
Neumann F., Neal J., Pedroza M.A., Castillejos E.A.H. & Acosta G., F.A., (1996), Mold Fluxesin High Speed Thin Slab Casting, 1996 Steelmaking Conference Proceedings, 249 - 257.
Ogibayashi S., Mukai T., Mimura Y., Nagano Y., Yamaguchi K., Takahashi T., Koyama K. &Nakano T., (July 1987), Mold Powder Technology for Continuous Casting of Low-CarbonAluminium-Killed Steel, Nippon Steel Technical Report, no.34, 1 - 10.
Pinheiro C.A., Samarasekera LV., & Brimacombe J.K., (February 1995), Mould Flux forContinuous Casting of Steel, Iron and Steelmaker, 37 - 39.
Riboud P.V. & Larrecq M., (1979), Lubrication and Heat Transfer in a Continuous CastingMold, Steelmaking Proceedings 1979, Vol. 62, ISS-AIME, 54 - 62.
Riboud P.V., Olette M., Leclerc J. & Pollak W., (1983), Continuous Casting Slags: TheoreticalAnalyses of Their Behaviour and Industrial Performance, The Theory and Practise of MoldFluxes Used in Continuous Casting, Iron and Steel Society, 13 - 19.
Sakai H., Kawashima T., Shiomi T., Watanabe K. & Iida T., (1997), Crystallisation Behaviour ofMolten Fluxes for High-Speed Continuous Casting of Middle Carbon Steel, Molten Slags, Fluxesand Salts '97 Conference, 787 - 790.
Skoczylas G., (1996), Recent Developments in High Viscosity Mold Powders for TiSULC SteelGrades, 1996 Steelmaking Conference Proceedings, 269 - 275.
Susa M., Mills K.C., Richardson R., Taylor R. & Steward D., (1994), Thermal Properties of SlagFilms Taken From Continuous Casting Mould, Ironmaking and Steelmaking, Vol. 21, no. 4,279-286.

Watanabe K., Suzuki M., Murakami K., Kondo H. & Shiomi T., (1996), Development of MouldPowder for High Speed Casting of Middle Carbon Steel, 1996 Steelmaking ConferenceProceedings, 265 - 268.
Wolf M.M., (1987), On the Interaction Between Mould Oscillation and Mould Lubrication,Mould Powders for Continuous Casting and Bottom Pour Teeming, Iron and Steel Society, 33 -44.
Yamauchi A., Sorimachi K. & Sakuraya T., (1992), Heat Transfer Between Mold and StrandThrough Mold Flux Film in Continuous Casting of Steel, 4th International Conference on MoltenSlags and Fluxes, 1992, Sendai, ISIJ, 415 -420.
zaitsev A., Leites A., Litvina A. & Mogutnov B., (1994), Investigation of the Mould PowderVolatilesDuring Continuous Casting, Steel Research, Vol. 65, no. 9, 368 -374.
Zasowski P.J. & Sosinski D.J., (1990), Control of Heat Removal in the Continuous CastingMould, 1990 Steelmaking Conference Proceedings, 253 - 259.
Copyright © 2022 FDOKUMEN