Appraisal of acute oral toxicity of glucuronoxylan hydrogel ...
Upload
khangminh22Category
view
0download
0
COPYRIGHT AND CITATION CONSIDERATIONS FOR THIS THESIS/ DISSERTATION
o Attribution — You must give appropriate credit, provide a link to the license, and indicate ifchanges were made. You may do so in any reasonable manner, but not in any way thatsuggests the licensor endorses you or your use.
o NonCommercial — You may not use the material for commercial purposes.
o ShareAlike — If you remix, transform, or build upon the material, you must distribute yourcontributions under the same license as the original.
How to cite this thesis
Surname, Initial(s). (2012) Title of the thesis or dissertation. PhD. (Chemistry)/ M.Sc. (Physics)/ M.A. (Philosophy)/M.Com. (Finance) etc. [Unpublished]: University of Johannesburg. Retrieved from: https://ujcontent.uj.ac.za/vital/access/manager/Index?site_name=Research%20Output (Accessed: Date).

The effect of Allium cepa 12% hydrogel on the appearance of Caesarean Section scars
A research dissertation presented to the
Faculty of Health Sciences, University of Johannesburg,
as partial fulfilment for the
Master‟s Degree in Technology: Homoeopathy
by:
Alicia Gerber
200912559
Supervisor: _____________________________ Date: _________________
Dr Neil Gower
MTech Hom (UJ) CML (UNISA)
Co-supervisor: ______________________________ Date: _________________
Dr TebogoTsele-Tebekang
MTech Hom (UJ)

i
DECLARATION
I, Alicia Gerber declare that this is my own unaided work. This research dissertation is being
submitted for the degree of Master‟s in Technology: Homoeopathy at the University of
Johannesburg. It has not been previously submitted at any degree or examination at any other
Technikon or University.
_____________________________ _________________
Alicia Gerber Date

ii

iii
ABSTRACT
A scar is a replacement of normal structures by fibrous tissue at the site of injury. Scarring
following surgery or injury is difficult to predict and both physicians and their patients are highly
concerned with minimizing scar appearances, even small improvements in scarring would add
value. A total of 100 million patients develop scars in the developed countries alone each year as
a result of 55 million elective operations and 45 million operations after trauma. In South Africa
the Caesarean Sections (CS) delivery rate is 20.6%, substantially above the accepted WHO of
10-15%. Conventional clinical treatments of scars are often associated with a need for multiple
therapeutic sessions as well as a number of side effects.
The study aimed to assess the effect of 12% (v/v) Allium cepa Mother Tincture (MT) in a
hydrogel solution on the appearance of caesarean section scars using the Patient and Observer
Scar Assessment scale (POSAS) and digital photographical evidence. A group of 40 females
completed the study and were between the ages of 18 and 50. Participants were divided into 2
groups of 20 participants each. The study followed a controlled study format and was conducted
over four consultations, four weeks apart, over a twelve week period (W0; W4; W8 and W12).
Participants were evaluated at each consultation with the POSAS as well as photographic
documentation. It has been demonstrated that the POSAS scale is a reliable and valid scale and
provides a unidimensional measure for scar quality. It appears to be the most comprehensive
assessment scale by taking into account the patient‟s assessment of their own scar.
The results of the POSAS showed that both hydrogel (control) and hydrogel medicated by
Allium cepa (12%) (treatment) were able to improve the general appearance of scars in all
parameters measured except for sensations of pain and itching. Allium cepa (12%) compared to
the control hydrogel, appeared to significantly improve the patient‟s own perception of scar
stiffness, thickness and overall opinion thereof. Even thought there was a lack of significant
difference between groups, Allium cepa (12%) appears to improve the vascularity, thickness,
relief, pliability, surface area and colour of scars to a greater extent than the control hydrogel and
it is evident that more research over a longer period of time is required.
It was concluded from this study that 12% Allium cepa in hydrogel was found to be effective on
the appearance of Caesarean Section scars and may be used in the construction of further
research studies.

iv
The conclusion or results of this study may not be quoted for use or proof of efficacy nor
substantiation of any context without the express permission of the Department of Homoeopathy,
University of Johannesburg.

v
DEDICATION
“And whatever you do, whether in word or deed, do it all in the name of the Lord Jesus, giving
thanks to God.” Colossians 3:17
I dedicate this work to my inspiring parents, Louis and Amori Gerber, who has provided me with
all the love and encouragement needed to complete this, although the support sometimes needed
a passport. To my fiancé: Liam Smit, thank you for your inspiration, support and encouragement
along the way.

vi
ACKNOWLEDGEMENTS
There are a number of people without whom this dissertation might not have been written, and to
whom I am greatly indebted:
Dr Neil Gower Thank you for always finding time in your very busy schedule and
for the effort and patience spent on this dissertation. It was a
privilege to have you supervise this study.
Dr Tebogo Tsele Tebokang Thank you for all your kindness, time, quick responses and
understanding throughout this time.
Juliana van Staden For providing all the statistical guidance for the analysis of this
study.
Fusion Homoeopathics For manufacturing the medication used in the implementation of
the study.
All study participants This study could never have been completed without your
dedicated participation, belief and patience.

vii
TABLE OF CONTENTS
TITLE PAGE
DECLARATION
ABSTRACT
DEDICATION
ACKNOWLEDGEMENTS
TABLE OF CONTENTS
LIST OF APPENDICES
LIST OF FIGURES
LIST OF TABLES
CHAPTER ONE
Page
i
iii
v
vi
vii
xi
xii
xiii
INTRODUCTION 1
1.1 Problem statement
1.2 Aim of study
1.3 Benefits of study
1.4 Hypothesis
1.5 Null Hypothesis
CHAPTER TWO
LITERATURE REVIEW
1
1
1
2
2
3
2.1 Introduction
2.2 Anatomy of skin
2.3 Formation of scars
2.3.1 Wound healing
2.3.1.1 Haemostatic, inflammatory and migratory phase
2.3.1.2 Proliferation phase
2.3.1.3 Maturation phase
2.3.2 Primary and secondary wound healing
2.4 Factors that influence wound healing
2.4.1 Age
2.4.2 Oestrogen
2.4.3 Infection
3
4
6
6
7
7
8
8
9
9
9
10

viii
2.4.4 Diabetes Mellitus
2.4.5 Nutritional deficiencies
2.4.6 Obesity
2.4.7 Alcohol
2.4.8 Defective collagen synthesis
2.4.9 Genetic predisposition
2.5 Classification of scars
2.5.1 Non hypertrophic scars (NHS)
2.5.2 Fibro proliferative scars (FPS)
2.5.3 Facial atrophic post acne scars (FAPS)
2.5.4 Burn scars
2.6 Scars of Caesarean delivery
2.6.1 Subumbilical midline
2.6.2 Pfannenstiel
2.7 Assessment of scars
2.7.1 Appearance
2.7.2 Physical characteristics
2.7.3 Patient‟s symptoms
2.8 Conventional and current treatment of scars
2.8.1 Pressure therapy
2.8.2 Silicone gel sheeting
2.8.3 Intralesional corticosteroid treatment
2.8.4 Cryotherapy
2.8.5 Laser therapy
2.8.6 Radiotherapy
2.8.7 Vitamin A
2.8.8 Vitamin E
2.8.9 Bio-oil®
2.9 Homoeopathy
2.9.1 Homoeopathic mother tinctures
2.9.2 Allium cepa mother tincture
2.10 Hydrogel
2.11 Related research
10
10
11
11
11
11
12
12
12
12
13
13
13
14
14
14
15
15
16
16
16
17
17
17
17
18
18
18
19
19
19
21
21

ix
CHAPTER THREE
METHODOLOGY
3.1 Introduction
3.2 Research design
3.3 Research sample size
3.3.1 Inclusion criteria
3.3.2 Exclusion criteria
3.4 Research procedure
3.5 Medication administration
3.6 Reliability and validity
3.7 Data collection and analysis
CHAPTER FOUR
RESULTS
4.1 Introduction
4.2 Participant recruitment
4.3 Demographic data analysis
4.3.1 Age distribution
4.3.2 Number of previous CS
4.4 POSAS Observer scale
4.4.1 Vascularity
4.4.2 Pigmentation
4.4.3 Thickness
4.4.4 Relief
4.4.5 Pliability
4.4.6 Surface area
4.4.7 Overall opinion of Observer
4.5 POSAS Patient scale
4.5.1 Pain
4.5.2 Itching
4.5.3 Colour
4.5.4 Stiffness
4.5.5 Thickness
4.5.6 Irregularity
24
24
24
24
24
24
25
25
25
26
27
27
28
29
29
30
32
32
34
36
38
40
41
43
45
45
46
48
49
51
53

x
4.5.7 Overall opinion of participant
4.6 Digimizer®
4.6.1 Surface area of scar
4.6.2 Length
4.6.3 Width
CHAPTER FIVE
DISCUSSION
5.1 Introduction
5.2 Demographic data discussions
5.2.1 Age distribution
5.2.2 Number of previous CS
5.3 POSAS Observer scale
5.3.1 Vascularity, pigmentation, thickness, relief and surface area
5.3.2 Pliability
5.3.3 Overall opinion
5.4 POSAS Patient scale
5.4.1 Pain
5.4.2 Itching
5.4.3 Colour
5.4.4 Stiffness
5.4.5 Thickness
5.4.6 Irregularity
5.4.7 Overall opinion
5.5 Digimizer®
5.5.1 Surface area and Length
5.5.2 Width
5.6 Summary of results
5.6.1 POSAS Observer scale
5.6.2 POSAS Patient scale
5.6.3 Digimizer®
54
56
56
58
60
62
62
62
62
62
63
63
64
64
65
65
66
66
67
68
68
69
69
69
70
71
71
72
72

xi
CHAPTER SIX
CONCLUSION AND RECOMMENDATIONS
6.1 Conclusion
6.2 Recommendations
REFERENCES
LIST OF APPENDICES
APPENDIX A
Advertisement
APPENDIX B
Participant information form
APPENDIX C
Consent Form
APPENDIX D
Case Taking Form
APPENDIX E
POSAS Observer and Patient Scale
APPENDIX F
STATKON statistics tables
74
74
75
76
85
86
89
91
92
94

xii
LIST OF FIGURES
Figure Title Page
Figure 2.1 Anatomy of skin 4
Figure 2.2 Layers of epidermis 5
Figure 2.3 Wound healing 7
Figure 4.1 CONSORT flow diagram 29
Figure 4.2 Number of previous CS in control group 31
Figure 4.3 Number of CS in treatment group 32
Figure 4.4 POPAS observer scale - Vascularity 33
Figure 4.5 POSAS observer scale – Pigmentation 35
Figure 4.6 POSAS observer scale – Thickness 37
Figure 4.7 POSAS observer scale – Relief 38
Figure 4.8 POSAS observer scale – Pliability 40
Figure 4.9 POSAS observer scale – Surface area 42
Figure 4.10 POSAS observer scale – Overall opinion 43
Figure 4.11 POSAS patient scale – Pain 45
Figure 4.12 POSAS patient scale – Itching 47
Figure 4.13 POSAS patient scale – Colour 48
Figure 4.14 POSAS patient scale – Stiffness 50
Figure 4.15 POSAS patient scale – Thickness 51
Figure 4.16 POSAS patient scale – Irregularity 53
Figure 4.17 POSAS patient scale – Overall opinion 55
Figure 4.18 Digimizer® - Surface area 57
Figure 4.19 Digimizer® - Length 58
Figure 4.20 Digimizer® - Width 60
Figure 5.1 Percentage improvements in POSAS Observer scale 71
Figure 5.2 Percentage improvements in the POSAS Patient scale 72
Figure 5.3 Digimizer® percentage improvements 73

xiii
LIST OF TABLES
Table Title Page
Table 4.1 Age distribution 30
Table 4.2 Number of previous CS 31
Table 4.3 Friedman test – Vascularity 33
Table 4.4 Wilcoxon Signed Ranks test – Vascularity 34
Table 4.5 Mann-Whitney U test – Vascularity 33
Table 4.6 Friedman test – Pigmentation 35
Table 4.7 Wilcoxon Signed Ranks test – Pigmentation 35
Table 4.8 Mann-Whitney U test – Pigmentation 36
Table 4.9 Friedman test – Thickness 37
Table 4.10 Wilcoxon Signed Ranks test – Thickness 37
Table 4.11 Mann-Whitney U test – Thickness 38
Table 4.12 Friedman test –Relief 39
Table 4.13 Wilcoxon Signed Ranks test – Relief 39
Table 4.14 The Mann-Whitney U test – Relief 39
Table 4.15 Friedman test - Pliability 40
Table 4.16 Wilcoxon Signed Ranks test – Pliability 40
Table 4.17 Mann-Whitney U test – Pliability 41
Table 4.18 Friedman test – Surface area 42
Table 4.19 Wilcoxon Signed Ranks test – Surface area 42
Table 4.20 Mann-Whitney U test – Surface area 43
Table 4.21 Friedman test – Overall opinion 44
Table 4.22 Wilcoxon Signed Ranks test – Overall opinion 44
Table 4.23 Mann-Whiney U test – Overall opinion 44
Table 4.24 Friedman test – Pain 45
Table 4.25 Mann-Whitney U test – Pain 45
Table 4.26 Friedman test – Itching 47

xiv
Table 4.27 Mann-Whitney U test – Itching 47
Table 4.28 Friedman test – Colour 48
Table 4.29 Wilcoxon Signed Ranks test – Colour 49
Table 4.30 Mann-Whitney U test – Colour 49
Table 4.31 Friedman test – Stiffness 50
Table 4.32 Wilcoxon Signed Ranks test – Stiffness 50
Table 4.33 Mann-Whitney U test – Stiffness 51
Table 4.34 Friedman test – Thickness 52
Table 4.35 Wilcoxon Signed Ranks test – Thickness 52
Table 4.36 Mann-Whitney U test – Thickness 52
Table 4.37 Friedman test – Irregularity 53
Table 4.38 Wilcoxon Signed Ranks test – Irregularity 54
Table 4.39 Mann-Whitney U test – Irregularity 54
Table 4.40 Friedman test – Overall opinion 55
Table 4.41 Wilcoxon Signed Ranks test – Overall opinion 55
Table 4.42 Mann-Whitney U test – Overall opinion 55
Table 4.43 Friedman test – Surface area 57
Table 4.44 Wilcoxon Signed Ranks test – Surface area 57
Table 4.45 Mann-Whitney U test – Surface area 58
Table 4.46 Friedman test – Length 59
Table 4.47 Wilcoxon Signed Ranks test – Length 59
Table 4.48 Mann-Whitney U test – Length 59
Table 4.49 Friedman test – Width 60
Table 4.50 Wilcoxon Signed Ranks test – Width 61
Table 4.51 Mann-Whitney U test – Width 61

1
CHAPTER ONE
INTRODUCTION
1.1 Problem statement
In South Africa the Caesarean Sections (CS) delivery rate is 20.6%, substantially above the
accepted WHO rate of 10-15% (Gibbons et al., 2012). These surgical wounds can result in
normal asymptomatic scars or scars that are cosmetically dysfunctional, causing pain, itching,
discomfort, contracture, stigmatisation and loss of self-esteem leading to diminished quality of
life and other functional impairment (Zurada et al., 2006). A survey has shown that patients are
dissatisfied with scars on both visible and non-visible body sites and would value any
opportunity to improve or minimise scarring following surgery (Young and Hutchison 2009).
Various conventional clinical treatments of scars are often associated with a need for multiple
therapeutic sessions as well as a number of side effects such as an increased risk of infection,
potential pigmentation alterations, epidermal thickening, epidermal erythema and a lengthy
recovery period (Chapas et al., 2008).
A pilot research study in Thailand has been conducted on the effectiveness of onion extract gel
on surgical scars and yielded positive results with regards to scar height and associated
symptoms (Chanprapaph et al., 2012). There is no clinical evidence as yet for the use of topical
application of homoeopathically prepared 12% Allium cepa MT in a Hydrogel preparation on CS
using the Patient and Observer Scar Assessment Scale (POSAS) and photographic
documentation (van der Kar et al., 2005).
1.2 Aim of study
The aim of the study is to determine the effect of 12% (v/v) Allium cepa MT in a hydrogel
solution on the appearance of caesarean section scars using the POSAS and digital
photographical evidence.
1.3 Benefits of study
This study may show that the homoeopathic tincture and hydrogel combination is effective in
improving the appearance of CS scars. If positive results are obtained, it might yield the
availability of an effective topical application for CS scars and may later contribute to further
research in the treatment of other forms of skin scarring.

2
1.4 Hypothesis
The hypothesis is that homoeopathic Allium cepa MT mixed in a hydrogel solution will improve
appearance of CS scars.
1.5 Null Hypothesis
The null hypothesis states that homoeopathic Allium cepa MT mixed in a hydrogel solution will
show no statistical significance between the control group and the treatment group.

3
CHAPTER TWO
LITERATURE REVIEW
2.1 Introduction
Healthy and attractive skin plays a major role in most individual‟s self-esteem, and it is the key
component of the image they present to the outside world. The appearance, texture and physical
qualities of the skin play a substantial role in most grooming behaviours. People with skin
conditions are often stigmatised and population prevalence studies reveal a vast burden of
undiagnosed, untreated skin conditions (Colledge et al., 2010).
A scar is a replacement of normal skin structures by fibrous tissue at the site of injury (Colledge
et al., 2010). Scarring following surgery or injury is difficult to predict. Both physicians and their
patients are very concerned with minimizing scar appearance and value even small
improvements in scarring (Gaulgitz et al., 2011). A total of 100 million patients develop scars in
the developed countries alone each year as a result of 55 million elective operations and 45
million operations after trauma (Sund, 2000).
Dermal wounds that lead to scars can occur intentionally as a result of surgical measures or
accidentally from skin injury. In either case, both patient and physician desire to see wound
healing with insignificant scar formation. Accordingly, any scientifically pharmacological or
physical intervention that can improve scar appearance is of significant value (Draelos et al.,
2012).
While scars are considered less important than other types of life-threatening diseases, these
treatment resistant scars can have a significant impact on quality of life and are sometimes are
life-threatening by making the patient suicidal (Cotterelli and Cunliffe, 1997). Although many
different treatments have been utilized to improve the negative impact of scars on individuals,
degrees of success have not been consistent (Alster et al., 2007)
Studies of scar treatments to date are limited for a number of reasons. Studies that do not apply
different methods of scar assessment are making it difficult to evaluate the precise effects of each
topical treatment, whereas other studies use different control protocols, such as no treatment or
palliative massage. Another long-standing issue has been the difficulty to quantitatively measure
certain subjective scar parameters, such as colour, induration or pruritus.

4
Given the long-term duration and nature of scar treatment, patient compliance has also been
problematic (Zurada, 2006).
Based on the recently published German guidelines on scarring, onion extract containing scar
creams can be considered as additional therapy for active hypertrophic scars and for post-
surgical prophylaxis of excessive scarring (Nast et al., 2012).
2.2 Anatomy of skin
The skin is the largest organ in the human body and covers a surface area of about two square
metres in an average adult. The major functions of the skin are: protecting underlying organs or
tissues; assisting in the excretion of waste and maintaining normal body temperature;
synthesising vitamin D; storing nutrients; detecting pressure, pain, touch and temperature
(Colledge et al., 2010; Martini and Nath, 2009). The skin is composed of three layers: the
epidermis, the dermis and the subcutaneous tissue layer (hypodermis) (Colledge et al., 2010):
Figure 2.1 Anatomy of skin (Martini and Nath, 2009)
Epidermis: The epidermis is composed of superficial stratified squamous epithelium; it is the
outmost layer of the skin and is primarily composed of keratinocytes. Keratinocytes
synthesise a variety of structural proteins that play the main role in maintaining normal
cutaneous functioning. The epidermis is continually replacing itself and this is even more
evidential in the event of injury (Colledge et al., 2010).
5
The epidermis is attached to, but separated from, the dermis by the basal layer (Colledge et
al., 2010). This is an avascular layer that is nourished by the vascularised dermis (Moore et
al., 2010). Three other cell types that make up the remaining epidermal cells are langerhans
cells, melanocytes and merkel cells. Langerhans cells circulate between the epidermis and
local lymph nodes. Their main function is to present foreign pathogens to lymphocytes.
Melanocytes are primarily found in the basal layer, synthesizing melanin and transferring
them to surrounding keratinocytes. Merkel cells are also found in the basal layer and play a
role in sensation of fine touch (Colledge et al., 2010).
The structure of the epidermis is made up of five less distinct sub-layers namely: the stratum
corneum, the stratum lucidum, the stratum granulosum, the stratum spinosum and the stratum
basale (Hill, 2006).
Figure 2.2 Layers of Epidermis (Brannon, 2007)
The stratum corneum is the most superficial layer and the thickness varies throughout the
body. The stratum lucidum is a band of thin, clear, closely packed cells which is more
prominent in areas of thick skin. The stratum granulosum has cells that are granular and
becomes flatter when moving up to the stratum corneum. Cells in the stratum spinosum are
intertwined with tiny structures called desmosomes. Desmosomes allow for materials to
move through the interspaces. The stratum basale is the basement of the epidermis anchoring
the epidermis to the dermis. Cells of regeneration for all the sub layers of the epidermis are
contained within this layer (Hill, 2006).
Dermis: The dermis is a vascular layer that supports the epidermis nutritionally and
structurally. It is supplied by arteries that enter a deep cutaneous plexus of anastomosis,
6
while afferent nerve endings supply the skin with sensations of pain, temperature and
pressure. Most nerve endings are in the dermis, while few penetrate the epidermis (Moore et
al., 2010).
The dermis is a dense layer of interweaving collagen and elastic fibres, providing skin tone,
elasticity and account for the strength and toughness of skin. The bundles of collagen fibres
in the dermis run in all directions to a produce a tough felt-like tissue, in any specific location
most fibres run in the same direction. The predominant pattern of collagen fibres determines
the characteristic tension lines of the skin; therefore the skin is always in tension. Collagen I
and II, elastin and reticulin are synthesised by the major cell-type namely fibroblasts. Other
cells in the dermis include mast cells, mononuclear phagocytes, T-lymphocytes, dendritic
cells, nerves and blood vessels (Moore et al., 2010).
Subcutaneous tissue: Located between the dermis and underlying deep fascia, the
subcutaneous tissue is composed of loose connective tissue, stored fat, superficial blood
vessels, lymphatic vessels and sweat glands. The subcutaneous tissue‟s main function is
thermoregulation, providing insulation of heat (Moore et al., 2010).
2.3 Formation of scars
Medical terminology defines a scar as non-regenerative wound healing (Sarabahi and Tiwari,
2012).
2.3.1 Wound healing
Wound healing is a dynamic and complex physiological cascade with overlapping but distinct
phases to promote tissue repair. Clinically wound healing disorders result in hypertrophic scars
or non-healing wounds (ulcers). The phases of wound healing entail the haemostatic
inflammatory phase, the migratory phase, the proliferation phase and the maturation phase
(Martini and Nath, 2009).

7
Figure 2.3 Wound healing (Leaper and Haring, 1998)
2.3.1.1 Haemostatic, inflammatory and migratory phase
The inflammatory phase is the body‟s natural response to injury. Immediately after a wound has
formed platelet degranulation starts with the activation of the complement and clotting cascade
and a fibrin clot is formed (Slemp and Kirschner, 2006). Once haemostasis has been achieved,
vessels then dilate to allow essential cells including antibodies, white blood cells, growth factors,
enzymes and nutrients to reach the wounded area. Mast cells in the region trigger an
inflammatory response and leads to exudative oedema in the area. It is at this stage that the
characteristic signs of inflammation can be seen: erythema, heat, oedema, pain and functional
disturbance (Martini and Nath, 2009).
2.3.1.2 Proliferation phase
The proliferation phase of wound healing includes new blood vessel formation (angiogenesis),
collagen deposition, formation of granulation tissue, epithelisation and wound contraction
(Midwood et al., 2004). During the proliferation phase new granulation tissue is formed which is
comprised of collagen and extracellular matrix (ECM). The fibroblasts are responsible for
recruiting and producing a framework of ECM which leads to the structural outline of the wound
and allows vascular support to the area (Slemp and Kirschner, 2006). Healthy granulation tissue
is dependent upon the fibroblast receiving sufficient levels of oxygen and nutrients supplied by
the blood vessels. Granulation tissue is granular and uneven in texture; it does not bleed easily
and is pink or red in colour. The presence of granulation tissue is an indicator of wound healing.
During the healing of a surgical wound, epithelial cells migrate across the wound and form a
protective barrier within 24 hours, resembling the regular epidermis layer within 5 days.

8
The repair of skin continues for three to 14 days depending on the size and / or type of wound
(Martini and Nath, 2009).
2.3.1.3 Maturation phase
Maturation is the final phase and occurs once the wound has closed. This phase involves
remodelling of collagen from type III to type I. Cellular activity reduces and the number of blood
vessels in the wounded area decrease. Myofibroblasts initiate wound contracture. Once the
wound is closed, the immature scar transitions into the final maturation phase - this is where
excess ECM is broken down and immature type III collagen is matured and modified into type I
collagen (Slemp and Kirschner, 2006).
Throughout the repair of skin tissue after an injury, the epidermis is the first to heal and form a
protective cell layer under the scab while fibroblasts in the dermis continue to create granulation
and scar tissue that will gradually elevate the overlying epidermis (Martini and Nath, 2009).
Scars remain red and prominent for up to 8 weeks after trauma and only during the collagen
remodelling phase will the erythema and thickness begin to decrease (Porter and Kaplan, 2011).
As stated before, most bundles of collagen fibres in the specific area run in the same direction.
Lacerations or incisions that parallel the tension lines usually heal well with little scarring due to
minimal disruption of fibres. However, a laceration or incision across the tension lines disrupts
more collagen fibres. The disrupted lines of force cause the wound to part and it may heal with
excessive scarring (Moore et al., 2010).
Due to the skin‟s natural elasticity and underlying muscles, there are static forces on the skin.
When scar tissue forms it is not as strong as adjacent unharmed skin; these static forces tend to
widen the scar resulting in a cosmetically undesirable appearance after apparently satisfactory
wound closure (Porter and Kaplan, 2011).
2.3.2 Primary and secondary wound healing
By definition, primary wound healing involves a non-infected wound and uncomplicated healing
in a wound with clean edges and no loss of tissue. In this type of wound the three phases of
wound healing are completed without interruption and with minimal need for granulation tissue
formation. Secondary wound healing takes place in a wound with more severe tissue loss. This
type of healing involves generation of granulation tissue with epithelialisation over it.

9
Given the fact that angiogenesis and epithelialization take longer to form, these wounds are more
prone to infection, poor healing and scarring (Slemp and Kirschner, 2006).
2.4 Factors that influence wound healing/scar formation
Wound healing is a complex and highly coordinated process that results after injury. It is aimed
at restoring the integrity and function of the skin. Wound healing disorders present as
hypertrophic scars or non-healing wounds (Slemp and Kirschner, 2006). Scars can occur from
any dermal injury, taking into account these factors:
2.4.1 Age
Human skin like all other organs undergoes chronological aging and aging as a consequence of
environmental damage. Aging skin has a marked susceptibility to dermatologic disorders due to
the structural and physiologic changes that occur, leading to a decline in normal functions of the
skin and some inevitable changes (Durai et al., 2012). As skin ages, the vasculature
progressively atrophies and the supporting dermis also deteriorates, with collagen and elastin
fibers becoming sparse and increasingly disordered. With age the epidermal dermal junction
flattens and the interdigitations decrease leaving the skin thin with a decreased elasticity. There
is also a decrease in epidermal filaggrin resulting in dry and flaky skin, and the epidermal
turnover rate decreases by 50% with age. These changes, and a steadily decreasing ability to
effect skin repair, leave the elderly increasingly susceptible to skin injuries such as pressure
ulcers and skin lacerations (Farage et al., 2009).
2.4.2 Oestrogen
Many of the effects of oestrogen on the human skin have been described based on the changes
that are seen following menopause. The skin appears to act as the end-target for oestrogenic
action, therefore marked structural and functional changes to the skin occur postmenopausally.
Reduced oestrogen levels have significant negative effects on cellular and tissue responses to
injury (Ashcroft and Ashworth, 2003).The primary modulatory effects of oestrogen on wound
healing may occur during the inflammatory phase of healing. Although the manner by which
oestrogen exerts its anti-inflammatory effect is not well understood, it is hypothesized that it
mainly affects chemotaxis of polymorphonuclear leukocytes (PMN) via a receptor-mediated
mechanism. Beta-estradiol has been shown to suppress chemotaxis of PMN in a dose-dependent
manner and this suppressive effect on PMN chemotaxis has been shown to be inhibited by use of
anti-oestrogens. During the remodelling phase of wound healing, oestrogen can affect collagen
content, tensile strength, and macroscopic appearance of scar tissue (Oh and Phillips, 2006).

10
2.4.3 Infection
About 2-3% of surgical wounds are complicated by infection; the risk of infection is greatest
during the first 48 to 72 hours after injury. Persistent infection 2 weeks after injury results in
delayed epidermal maturation and is linked to increase scarring. Wound infection significantly
impairs and delays epidermal regeneration and maturation, resulting in greater dermal injury and
a deeper scar (Singer and McClain, 2002).
2.4.4 Diabetes mellitus
Diabetes mellitus increases the risk for major complications in wounds. Diabetes decreases
angiogenesis in the inflammatory wound healing phase resulting in impaired circulation to
tissues and subsequent reduced tissue oxygen perfusion. Diabetes has been shown to affect
immune system functions. Together with peripheral neuropathy, which predisposes the patient
to tissue trauma, an increased risk for infection arises. Collagen synthesis and accumulation
declines which diminishes the tensile strength of wounds and indicates a high risk of wound
dehiscence (Coursin et al., 2004).
2.4.5 Nutritional deficiencies
Protein, amino acids, fatty acids, minerals and vitamins are required for normal wound healing
(Meghan and Barbul, 2006). Deficiencies in the following nutritional substances may lead to
poor wound healing:
Protein: protein deficiency is one of the most important nutritional elements distressing
wound healing. A shortage of protein can impair capillary formation, fibroblast proliferation,
collagen synthesis, and wound remodelling which predisposes one to impaired wound
healing. A deficiency in protein affects the immune system, with a resultant increased
susceptibility to infection (Campos et al., 2008).
Vitamin C: vitamin C deficiencies result in impaired healing, and have been linked to
decreased collagen synthesis and fibroblast proliferation, decreased angiogenesis, and
increased capillary fragility. Also, vitamin C deficiency leads to an impaired immune
response and increased susceptibility to wound infection (Campos et al., 2008).
Vitamin A: the biological properties of vitamin A include anti-oxidant activity, increased
fibroblast proliferation and increased collagen synthesis. A deficiency in Vitamin A leads to
impaired wound healing (Burgess, 2008).
Glutamine: glutamine has a crucial role in stimulating the inflammatory phase in wound
healing. Oral glutamine supplementation has been shown to improve wound breaking
strength and to increase levels of mature collagen (da Costa et al., 2003).

11
2.4.6 Obesity
In obesity, an increase in complicated surgical site infections has been detected. This can be
explained by a relative hypo-perfusion in subcutaneous adipose tissue and a decreased delivery
of antibiotics as well. Wound tension increases tissue pressure, reducing micro-perfusion and the
availability of oxygen to the wound. In surgical wounds, the increased tension on the wound
edges that is frequently seen in obese patients also contributes to wound dehiscence (Radek et
al., 2007).
2.4.7 Alcohol
Exposure to ethanol influences the proliferative phase of wound healing. The most significant
impairment seems to be in wound angiogenesis, which is reduced by up to 61% following a
single ethanol exposure. The ethanol-mediated decrease in wound vascularity causes an oxygen
deprived state in wounds (hypoxia). Hypoxic wounds are prone to infections, impaired
angiogenesis, decreased keratinocyte differentiation, reduction in fibroblast proliferation,
collagen synthesis and have difficulty with wound contraction resulting in a bigger or deeper
scar (Radek et al., 2007).
2.4.8 Defective collagen synthesis
Ehlers-Danlos syndrome is due to a genetic defect in collagen and connective tissue synthesis
and structure. Affected individuals have velvety and soft skin that is highly elastic and delicate.
They tend to bruise easily and this condition also causes abnormal scarring. Ehlers-Danlos
syndrome causes wounds that split open with little bleeding and leave scars that widen over time
to create characteristic shallow "cigarette paper" scars (Eder et al., 2013).
2.4.9 Genetic predisposition
Current data propose a genetic susceptibility with a resilient immunogenic component to dermal
fibrosis together with major histocompatibility complex genes being associated could link
genetics to excessive skin scarring. According to data it appears unlikely that a single gene is
responsible for the development of raised dermal scars. A likely scenario may involve the
interaction of several gene pathways in addition to environmental factors (Brown and Bayat,
2009).

12
2.5 Classification of scars
Scars that arise from surgical wounds or any other dermal injury can be divided into four main
classes: non-hypertrophic (NHS), fibro-proliferative (FPS), facial atrophic post-acne scars
(FAPS) and burn scars (Lee, 2010):
2.5.1 Non-hypertrophic scars (NHS)
Non hypertrophic scarring includes scars that are not protruding such as atrophic scars and
textural scars; textural scars are flat or insignificantly elevated (Lee, 2010).
2.5.2 Fibro-proliferative scars (FPS)
Fibro-proliferative scars include protruding scars according to elevation of tissue which involves
hypertrophic scars and keloids (Lee, 2010). Hypertrophic scarring usually occurs within 4 to 8
weeks following wound infection, wound closure with excess tension or other distressing skin
injury. Hypertrophic scars have a rapid growth phase for up to 6 months, and then gradually
lapses over a few years, finally leading to flat scars with no additional symptoms. Hypertrophic
scars are usually linear. If following a surgical scar it can be papular or nodular with
inflammatory and ulcerating lesions (Hawkins, 2007).
Keloids, in contrast, may develop up to several years after minor injuries and may even form
unexpectedly without any known injury. Keloids appear as firm, mildly tender nodules with a
shiny surface and sometimes telangiectasia. The epithelium is thinned and there may be focal
areas of ulceration. The colour is pink to purple and may be accompanied by hyperpigmentation.
Both lesions are commonly pruritic, but keloids may even be the source of significant pain and
hyperesthesia (Hawkins, 2007).
2.5.3 Facial atrophic post-acne scars (FAPS)
This class of scars have a unique characteristic making it a separate entity; it consists of a cluster
of small pleomorphic atrophic scars congregated closely (Lee, 2010).

13
2.5.4 Burn scars
These have significantly different depth and areas, setting it apart from the rest of the groups
(Lee, 2010).
2.6 Scars of caesarean delivery
Caesarean Section (CS) delivery is defined as a surgical delivery by incision into the uterus
(Porter and Kaplan, 2011). CS delivery was introduced in clinical practice as a life-saving
procedure both for the mother and baby (Betrán et al., 2007).
The Caesarean delivery rate is increasing globally beyond the recommended accepted WHO
level of 10-15% (World Health Organisation, 2007). District hospitals in South Africa have a CS
rate of 16.1% (Day et al., 2011) while in 2008 the CS delivery rate for South Africa as whole
was reported to be 20.6% (Gibbons et al., 2012).
The type of CS incision is surgeon dependent and motivated by a variety of indications,
circumstances and the surgeon‟s level of skill (Mathai and Hofmeyer, 2007). CS uterine
incisions can be subumbilical midline (vertical) or Pfannenstiel (lower transverse/suprapubic).
Each surgical incision results in a dermal injury and a scar (Porter and Kaplan, 2011):
2.6.1 Subumbilical midline incision
Traditionally CS was performed by a midline vertical skin incision from the pubic symphysis to
umbilicus. The rectus muscle and peritoneum are then incised in the avascular midline.
Advantages of this method include speed and the ability to extend the incision upwards if
needed, and if local anaesthesia is to be used. The main disadvantage is the degree of post-
surgical scarring (Mathai and Hofmeyr, 2007).
In the National Guidelines for Maternity Care in South Africa, numerous indications for
subumbilical midline incisions are given. These include increased risk of intraoperative
haemorrhage such as eclampsia or anticipated difficult delivery, and prolonged labour or rupture
of membranes which could lead to an increased risk of postoperative infection. While the global
trend is towards transverse incisions, vertical incisions are still commonly performed in
developing countries (National Guidelines for Maternity Care in South Africa, 2002).

14
2.6.2 Pfannenstiel incision
The skin incision is a low transverse type, gently upward curving, following the natural skin fold
and located two finger breadths above the pubic symphysis. The underlying muscle is then
separated by blunt or sharp dissection from the fascia, ensuring haemostasis of the perforating
vessels. The rectus muscles are separated bluntly, before the peritoneum is entered sharply in the
midline exposing the uterus. Pfannenstiel incisions are associated with less post-operative pain
and earlier ambulation. The closure is more secured, there is less adipose tissue to incise and a
better cosmetic effect is also noted (Mathai and Hofmeyr, 2007).
South African patient and clinician preferences were recently evaluated by Rwakyendela and
Buchmann (2006). The study commenced in three state hospitals in Johannesburg, 400 patients
were interviewed in a cohort in whom 38% of women had vertical CS incisions and 62%
Pfannenstiel incisions. It was found that a majority of women would have chosen transverse
incisions if given the choice, thus preferring the cosmetically more acceptable Pfannenstiel type.
Clinicians who were interviewed trended towards the Pfannenstiel incision for elective CS
delivery (96%) and marginally favoured a midline incision for emergency CS.
Suturing plays an important role in primary wound healing and the tissue is held in proximity
until enough healing has occurred to withstand the stress without the mechanical support
provided by the sutures. Most common methods for mechanical wound closure in CSs involve
non-absorbable staples and absorbable subcutaneous sutures. Absorbable sutures provide
temporary wound support, until the wound heals to withstand the normal stress (Islam and
Ehsan, 2011). Non-absorbable staples are associated with an increased risk of skin separation,
potentially worsening the scar and the need for reclosure when compared with subcutaneous
absorbable sutures (Mackeen et al., 2012).
2.7 Assessment of scars
Accurate scar assessment is essential for diagnosing, managing and evaluating a therapeutic
strategy for scar management. Any comprehensive evaluation of scars involves measuring it on
three different dimensions, namely appearance, physical characteristics and patient symptoms.
2.7.1 Appearance
The anatomical location of the scar should be taken into account. Scar colour is determined by
the pigmentation and vascularity of the skin. Vascularity is defined as the presence of vessels in
scar tissue assessed by the amount of redness. Vascularity is tested by the amount of blood return

15
after blanching with a piece of Plexiglas. Scar pigmentation is the brownish colouration of the
scar caused by melanin and may be evaluated by applying Plexiglas to the skin with moderate
pressure to eliminate the effect of vascularity (Vercelli et al., 2009).
2.7.2 Physical characteristics
Scar thickness is defined as the average distance between the subcutical-dermal border and
the epidermal surface of the scar itself. The most accurate and reproducible method to
measure the overall scar thickness is through ultrasonography, while the protruding part can
be measured with a ruler (Van de Kar et al., 2005).
Relief signifies the extent of surface irregularities compared to adjacent normal skin. The
degree of irregularity can be reliably evaluated with subjective scales (Bloemen et al., 2011).
Pliability can be defined as the suppleness of the scar tested by wrinkling the scar between
the thumb and index finger (Van de Kar et al., 2005).
Surface area defines the area of the scar in relation to original wound area. The most
common method of measuring the surface area is planimetry through photography and
computer software analysis which can also be used to measure scar length and width.
Dizimizer®
software calculates length, width and surface area if calibration is provided (Van
de Kar et al., 2005).
2.7.3 Patient’s symptoms
Pain is the most common symptoms of scar healing. Commonly used terms in the description of
pain may include: „tender‟, „shooting‟, „sharp‟, „aching‟ and „heavy‟. Other symptoms like
stiffness and itching are also common. These assessments are performed with numerical rating
scales (Van Loey et al., 2007).
The Patient and Observer Scar Assessment Scale (POSAS) includes assessment of all three of
these dimensions and consists of both an Observer and a Patient Scale and includes a
comprehensive list of items, based on clinically relevant scar assessments. The observer scores
six items: vascularization, pigmentation, thickness, surface roughness, pliability, and surface
area. Each item is scored from 0-10, where 0 is “normal skin” and 10 is “worst scar imaginable”.
The patient scores six items: pain, pruritus, colour, thickness, relief, and pliability. Each item is
scored from 0-10 where 0 is “no / not at all‟ and 10 is yes / very much”. The scores for each
assessment are then totalled where a minimum score of 6 (normal skin) and maximum score of
60 (worst assessment) may be achieved (Vercelli et al., 2009).

16
The POSAS is a recognised, valid and reliable tool used for assessing scars. POSAS is
demonstrated with The Rasch model that it is a reliable and valid scale and provides an inclusive
measure for scar quality (Van der Wal et al., 2012). The POSAS appears the most
comprehensive taking into account the aspect of the patient‟s perspective (Vercelli et al., 2009).
POSAS have been recently validated for application on linear postsurgical scars and found that
both the Observer and Patient Scar Assessment Scale have good internal consistency
(Cronbach‟s alpha 0.74–0.90) (Truong et al.,2007; Van der Kar et al.,2005).
2.8 Conventional and current treatment of scars
Clinical interventions such as pressure therapy, silicone gel sheeting, intralesional corticosteroid
injection, cryotherapy, laser therapy and radiotherapy are associated with a number of side
effects such as an increased risk of infection, as well as potential pigmentation alterations,
epidermal thickness, epidermal erythema and a lengthy recovery period. These interventions
have limited accessibility, are not affordable to everyone and are also associated with a need for
multiple therapeutic sessions (Saray and Gulee, 2005; Chapas et al., 2008). Several over-the-
counter and prescription topical treatments are also used, including vitamin A, vitamin E and
Bio-oil ®
.
2.8.1 Pressure therapy
Pressure treatment is believed to quicken wound healing by numerous mechanisms, namely;
thinning of the dermis, decreasing oedema, and a reduction of blood flow and oxygen. The
garments are usually made from an elastic material with a high spandex content and are intended
to be worn over the area of injury for approximately 1 year until the scar completely heals.
Disadvantages of pressure therapy include its limited use in anatomic depressions, flexures, or
areas of high movement; patient discomfort; the need to be worn at all times; and occasional skin
ulceration from uneven pressure distribution. For these reasons, patient compliance can be a
major problem (Puzey, 2012).
2.8.2 Silicone gel sheeting
Silicone, a soft, semi-occlusive scar cover, is composed of cross-linked polydimethylsiloxone
polymer that is comparable to normal skin composition. Silicone gel sheeting is widely used to
minimize the size, induration, erythema, pruritus, and extensibility of pre-existing scars and to
prevent the formation of new scars (Gold et al., 2001). The mechanism of silicone gel sheeting
remains uncertain; studies have shown that silicone sheets do not change the pressure,
temperature, or oxygen level at the wound site. It is also believed that silicone sheets create a

17
hydrated, occluded environment that decreases capillary activity, thereby reducing fibroblast-
induced collagen deposition and scar hypertrophy. Most researchers believe that silicone sheets
decrease hyperaemia and lessen fibroblast production of collagen, thereby promoting wound
flattening (Chang and Ries, 2001).
2.8.3 Intralesional corticosteroid treatment
The effects of corticosteroids result primarily from their suppressive effects on the inflammatory
process in the wound and secondarily from reduced collagen and glycosaminoglycan synthesis,
inhibition of fibroblast growth as well as enhanced collagen and fibroblast degeneration (Reish
and Eriksson, 2008). To date, the use of intralesional triamcinolone acetonide (TAC) signifies
the therapy of choice for scars and effectively offers symptomatic relief by reducing pruritus.
Three to four injections of TAC (10–40 mg/mL) every 3–4 weeks are generally sufficient,
although occasionally injections continue for 6 months. Adverse events include dermal atrophy,
telangiectasia, and pain at the injection site (Nast et al., 2012).
2.8.4 Cryotherapy
Cryotherapy involves a probe that is connected to a cylinder of liquid nitrogen. A cryoneedle is
inserted into the scar and the liquid nitrogen causes the cryoneedle to freeze thereby freezing the
scar tissue from the inside out (Chanprapaph et al., 2012). Although cryotherapy is relatively
costly, it appears comparatively cost-effective, since frequently a single cryo-session is sufficient
to significantly improve scar tissue. Adverse effects are minimal with no worsening or infection
and only limited hypopigmentation was evident (Tziotzios et al., 2012)
2.8.5 Laser therapy
The most encouraging results have been demonstrated with the 585-nm pulsed dye laser (PDL).
PDL is believed to improve scar formation by inducing capillary destruction generating
hypoxaemia which in turn modifies local collagen production (Alster, 2003). Depending on the
energy density employed, vesicles and crusts may occur, purpura‟s can persist for 7-14 days and
longer persisting hyperpigmentation occurs particularly in darker skin types. Side effects such as
prickling sensations during treatment and post-treatment erythema may also occur (Leventhal et
al., 2006).
2.8.6 Radiotherapy
Radiotherapy gets its benefits through inhibition of neovascular buds and proliferating
fibroblasts, resulting in decreased collagen production. Superficial X-rays, electron beam and

18
low- or high-dose-rate brachytherapy have been employed primarily as an addition to surgical
removal of hypertrophic scars, with overall good results in terms of reduced recurrence
(Ragoowansi et al., 2003). Side effects include hypo- and hyperpigmentation, erythema,
telangiectasia and atrophy. Radiotherapy signifies some risks in terms of carcinogens, especially
in areas such as the breasts and thyroid; therefore it should be used with caution (Leventhal et
al., 2006).
2.8.7 Vitamin A
Vitamin A also known as retinoic acid is required to maintain healthy integrity of epithelial and
mucosal surfaces. A study observing daily application of 0.05% retinoic acid on hypertrophic
and keloid scars showed a reduction in the size of the scar, pruritus and caused scar softening,
flattening, and fading of hyperpigmentation or erythema of scar (Zurada et al., 2006). The
downside of vitamin A treatment involves the systemic absorption of topical retinoids.
Hypervitaminosis and teratogenicity are potential complications of this therapy, therefore
limiting its use, especially in pregnant females and people taking oral vitamin supplements
(Zurada et al., 2006).
2.8.8 Vitamin E
Vitamin E is a lipid-soluble antioxidant and has complex effects on wound healing. It has been
shown to penetrate into the dermis and reduce the formation of oxygen radicals that inhibit
healing and destruction to the DNA, cellular membranes, and lipids. Vitamin E also alters
collagen and glycosaminoglycan production and inhibits the spread of peroxidation of lipids in
cellular membranes, thereby acting as a membrane-stabilizing agent (Zurada et al., 2006).
However a high incidence (33%) of contact dermatitis is noted with Vitamin E usage (Baumann
and Spencer, 1999). The use of vitamin E in scar management has other theoretic limitations,
because of its ability to inhibit collagen synthesis. The use of vitamin E early in scar therapy may
reduce scar tensile strength and, thereby, lead to the development of widened scars and even
wound dehiscence (Widgerow et al., 2010).
2.8.9 Bio-oil®
Bio-Oil®
is the well-known golden standard skincare oil and claims to improve the appearance of
scars, stretch marks and uneven skin tone. It is the number one selling scar and stretch mark
product in 18 countries since its global launch in 2002. Bio-oil® contains the following
ingredients: Calendula officinalis, Lavandula angustifolia, Rosmarinus officinalis, Chamomile
oil, PurCellin, Vitamin A and Vitamin E combined together in a variety of oil bases. In 2010 the

19
efficacy of Bio-Oil® was assessed using the POSAS scar assessment scale on the improvement
of the appearance of scars. 36 participants between the ages of 18-65 were recruited in the study.
Results showed a statistically significant result after only 2 weeks (day 15), evident in 66% of
the subjects. After 8 weeks (day 57) 92% of subjects showed an improvement, with the extent of
the improvement almost triple that seen at 2 weeks (Zacher et al., 2013). The only obstacles to
the ingredients of Bio-oil are vitamin A due to potential hypervitaminosis (dosage dependant)
(Zurada et al., 2006).
2.9 Homoeopathy
The term homoeopathy is derived from two Greek words: homoios meaning similar and pathos
meaning suffering. The basic principle of Homoeopathy is similia similibus curentur or „Like
cures Like” – an illness should be treated by a substance capable of producing similar symptoms
to those being suffered by the patient (Ullman 2007). The method of homoeopathic preparation
involves a series of precise dilutions and succusions known as potentization (Aziz, 2010).
2.9.1 Homoeopathic mother tinctures
A homoeopathic MT is pharmaceutically prepared from a drug substance of the plant kingdom,
using alcohol as the solvent by the process of maceration and percolation. The drug to solvent
ratio quantity is a 1:10 v/v dilution (1D potency). A MT is the starting point for any
homoeopathic remedy (Owen, 2007).
2.9.2 Allium cepa mother tincture
Allium cepa is commonly known as the red onion and belongs to the Alliaceae family. In order
to make a homoeopathic mother tincture of Allium cepa, the bulb of the red onion is prepared
according to the method stipulated by the German homoeopathic pharmacoepeia (HAB 2A). In
this method the Allium cepa is cut up finely and added to 86% alcohol. This is left to stand for a
minimum of 10 days in a temperature not exceeding 20˚C (Owen, 2007).
Allium cepa as a tincture exhibits anti-inflammatory, bacteriostatic and collagen down-regulatory
properties. Quercetin, a bioflavonoid from Allium cepa, has shown antiproliferative effects on
both normal and malignant cells. In recent studies,quercetin has been shown to have an
inhibitory effect on the release of histamine, thereby relieving itching ofscars, as well as a noted
colour fade seen in scars (Hosnuter et al., 2007). These properties could theoretically prove
beneficial in reversing the inflammatory and proliferative responses (Bombaro et al., 2003;
Widgerow et al., 2010).

20
It is believed that the flavonoids (quercetin and kaempferol) in Allium cepa play a role in
reducing scar formation through inhibition of fibroblast activities (Phan et al., 2003). In 2010 an
in-vivo and in-vitro study was conducted in order to investigate the effect of Allium cepa and
quercetin on the proliferation of fibroblasts, the expression of type I collagen and matrix
metalloproteinase-1 (MMP-1). The data of the study show that proliferation rates of fibroblasts
were decreased in a dose-dependent manner with Allium cepa and quercetin. However the
expression of type I collagen was not markedly changed by the Allium cepa and quercetin.
Interestingly, the expression of MMP-1 was markedly increased by both Allium cepa and
quercetin in vitro and in vivo. Thus it can be concluded that the data indicate that Allium cepa
and quercetin play a role in the anti-scar effect in skin through up-regulation of MMP-1
expression, implying that that Allium cepa is a promising remedy for reducing of scar formation
(Cho et al., 2010).
Allium cepa is scientifically classed as a transforming growth factor beta 1(TGF ß1) antagonist is
the most important counteracting agonist in two wound healing phases. TGF ß1 plays a
significant role in the inflammatory phase and in the remodelling phase; the expression of TGF
ß1 causes increased fibroblast growth and excessive collagen synthesis which results in an
abnormal proliferation process. However, it is possible to prevent excessive fibroblast growth
through antagonizing PGF ß1. Therefore an effective anti-scarring agent has to have the essential
capacity to inhibit TGF ß1-activity in the late stage of wound healing. This effect can be used to
explain the efficacy of Allium cepa in the regulation of scarring processes (Ralf, 2007). Allium
cepa MT has been shown to improve collagen organization in the ears of rabbits (Saulis et al.,
2002).
Allium cepa is useful in reducing neoangiogenesis in hypertrophic scars and keloids, resulting in
the clinical improvement of skin vascularity (Draelos, 2008). It shows an anti-inflammatory
effect by inhibiting lipopolysaccharide-induced tumor-necrosis factor-alpha (TNF-α) production
(Hostner, 2013).
Based on the recently published German guidelines on scarring, onion extract-containing scar
creams can be considered as additional therapy for active hypertrophic scars and for post-
surgical prophylaxis of excessive scarring (Nast et al., 2012).

21
2.10 Hydrogel
As a route of administration, topical drug treatments generally allow for a direct and localised
effect of the active ingredient and therefore have fewer side effects compared to parenteral or
oral drug administration (Chen et al., 2012). The vehicle of topical treatments has other roles
besides containing the active ingredient; the vehicle can hydrate or soothe the skin and has
antimicrobial qualities (Colledge et al., 2010).
Hydrogel is a form of topical treatment. The term hydrogel defines a network of three-
dimensional structures capable of absorbing and retaining a significant amount of water (Gulrez
et al., 2011). Due to the significant content of water in hydrogel it retains a degree of flexibility
comparable to natural tissue. Hydrogel is mainly used in tissue engineering and in the
pharmaceutical and biomedical fields (Hoare and Kohane, 2008).
The standard thickness of skin is 2mm. When scar thickness reaches more than 4.91mm it is
classified as a hypertrophic scar. This makes the penetration of active compounds challenging.
With topical drug delivery systems (TDDS) the active compound must make contact with the
desired target area; however the thickness of the scar forms a strong barrier that prevents
penetration of the active compound to the target area (Tsang et al., 2007).
Due to the big differences in skin thickness, current treatment protocols for anti-scar treatment
are based on the standard vehicles such as creams, gels and ointments. The biggest challenge for
TDDS is to ensure effective penetration of drugs across the scar skin. Various formulations such
as microemulsions, liposomes, dendrimers, micro-sponges, solid lipid nanoparticles and
hydrogels have been reported for the advantages of biocompatibility (Chen et al., 2012).
These specific formulations are not only used as a vehicle but also play a role in drug reservoirs
that leads to a prolonged release of the active ingredient. A sustained release of the active
ingredient enhances the penetration across the scar skin (Chen et al., 2012). Gels have
hydrophilic and hydrophobic bases, used on specific sites like hair-bearing areas it is
cosmetically acceptable, reaching deeper layers more effectively and has a low risk of contact
sensitisation (Colledge et al., 2010).
2.11 Related research
A double-blind, randomised, split scar study was conducted in Thailand to determine the
effectiveness of onion extract gel on surgical scars in Asians (Chanprapaph et al., 2012).

22
Each half of the scar was randomly assigned to receive either unmedicated gel or gel medicated
with 12% Allium cepa. The results of the study showed a significantly improved difference in
mean scar height and mean scar symptoms between the control side and the treatment side at
week 4 and 12. Two limitations identified by the study included the small sample size and
absence of subjective measurement of the patient‟s overall satisfaction, improvement of social
participation and quality of life.
In North-Carolina a randomized, controlled, single-blinded study evaluated the appearance of 44
female participants with dermal scars after eight weeks of once-daily application of a onion
extract gel formulation compared to control (no application scars) in a dermatological surgical
setting. In 2012 the study concluded and published that once-daily application of the onion
extract gel improved their overall appearance, redness, softness, and smoothness of the scar
compared to control scars. In the majority of subjects, these benefits are apparent within 2 to 4
weeks of daily application and are fully defined after eight weeks (Draelos et al., 2012).
A clinical study in 2002 recruited 60 participants in order to evaluate the efficacy of topical
silicone derived onion extract gel on post-surgical sternotomy scars using the Vancouver scale.
The study was a randomized, placebo controlled, double-blinded study which took place over a
period of 12 treatment weeks in Bangkok. In both groups, application was carried out twice daily
and topical application was initiated at day 7 after surgery. During follow-up consultation (2
weeks) pain and itch was lower in the silicone derived Allium cepa extract gel group compared
to the control group. All parameters of Vancouver scar score assessment improved in the
treatment group, especially pigmentation. Hyperpigmentation faded significantly at all the time
points. A limitation to the study was that the faded colour change was observed visually but due
to subjective assessment (Vancouver scale) only, no definite conclusion could be made. Overall,
a plausible effect was observed for silicone derived onion extract gel in the prevention and
treatment of scar formation (Jenwitheesuk et al., 2012).
A comparative prospective study assigned 60 participants to three groups to assess the efficacy
of onion extract on hypertrophic and keloid scars. Group 1 was treated with onion extract alone,
group 2 with silicone gel sheet alone and group 3 with a combination of onion extract and
silicone gel sheet. In the group comparisons, a significant difference was observed at the end of
six months in the colour parameter between group 1 and group 2 and in the height parameter
between group 1 and group 3. The onion extract was more effective in relation to scar colour,
while the silicone gel sheet was superior in decreasing the height of scar. In addition, the most

23
effective therapeutic results were obtained when the silicone gel sheet treatment was combined
with onion extract in group 3. Onion extract improved hypertrophic and keloids scars via
multiple mechanisms. However, it was statistically ineffective in improving scar height and
itching (Hosnuter et al., 2007).
Jackson and Shelton evaluated the effectiveness of topical onion extract gel in improving the
appearance and symptoms of postsurgical scars compared to topical emollient in 17 subjects who
had undergone Mohs surgery, a precise surgery used in the treatment of skin cancer. Subjects
were divided into 2 groups: onion extract group and emollient group. Each group applied a
designated topical product 3 times a day for 4 weeks. No statistically significant difference was
found between pre and post-treatment evaluations of scar erythema and pruritus in patients using
topical onion extract gel. However, limitations included the small sample size, short treatment
duration and follow-up period (Jackson and Shelton, 2001).
Over the past decade, several studies have shown that onion extract applied 2 to 3 times a day for
periods of 3 to 6 months significantly improves the appearance of postsurgical scars, adhesions,
stretch marks, and hypertrophic scars in vitro and in vivo (Draelos, 2008; Viera et al., 2010). The
weight of evidence from these studies and the present data support the claim that onion extract is
beneficial in reducing the appearance of dermal scars when used as directed (Draelos et al.,
2012).

24
CHAPTER THREE
METHODOLOGY
3.1 Introduction
This chapter is used to explain the study design, participant recruitment, sample size and
treatment protocols.
3.2 Research design
This was a controlled study conducted over a period of 12 weeks utilising 40 participants. Due to
the nature of the associated odour of the medicated hydrogel it was not possible to guarantee
blinding of the researcher during the study. Participants were divided into 2 groups of 20
participants each.
3.3 Research sample size
The research sample consisted of 40 female participants that presented with a CS scar.
Participants were included regardless of the type of surgical scar (vertical or transverse).
Participants were recruited by way of advertisements (Appendix A) placed at UJ and various
medical facilities (paediatricians, gynaecologists, general practitioners and dermatologists) with
relevant permission granted.
3.3.1 Inclusion criteria
Individuals were included in the study if they:
Were female;
Were between the ages of 18-50 years;
Has had either a vertical or transverse surgical scar which was completed with subcutaneous
absorbable suturing; and
Were at least 8 weeks post-surgery.
3.3.2 Exclusion criteria
Individuals were excluded from participation in the study if they:
Had a history of onion allergy;
Used any other topical treatments for the CS scarring;
Had general surgical complications such as a fever, pain, increased perspiration, fatigue, or
signs of post-operative infections, or

25
Reported local surgical complications such as inflammation, infection, wound dehiscence,
sepsis, keloid scar formation and atrophic/hypertrophic scars.
3.4 Research procedure
This 12-week study was conducted at the Homoeopathy Health Centre, Doornfontein Campus,
UJ. At the first consultation (week 0) the study was explained thoroughly to all participants, the
researcher read through the information sheet including directions for medication use (Appendix
B) and the participant was requested to sign the consent form (Appendix C). A case taking form
(Appendix D) was then completed including an assessment of the impact of the scar on quality
of life. A brief physical exam (including Vital signs and CAJCOLD) was then conducted as for
follow up visits at week 4, 8 and 12, followed by the POSAS used to analyse the scar as well as
photographic documentation. Standardised photographs were taken under the same conditions at
each consultation. The images were stored electronically and a computer programme
(Digimizer®
) was used to accurately measure the scar and track any changes throughout the 12
week period.
3.5 Medication administration
Each participant received a 150ml container at monthly intervals of either unmedicated hydrogel
solution as the control medication or 12% (v/v) Allium cepa MT hydrogel solution as the
treatment. The 12% (v/v) Allium cepa MT hydrogel solution was prepared by Fusion
Homoeopathics, an independent homoeopathic medicine supplier where 18ml of Allium cepa
MT was mixed with 132ml of hydrogel and produced a 12% (v/v) Allium cepa MT hydrogel
solution. Participants were requested to apply 2ml of the provided medication topically (using
provided medicating spoons) on the targeted area twice daily for twelve weeks. No other topical
treatment was to be used by participants during this period.
3.6 Reliability and validity
The active and control medication was manufactured, packaged and randomised (using
medication codes assigned to treatment group and control groups) by Fusion Homoeopathics.
As a registered independent homoeopathic medicine supplier, Fusion Homeopathics, was able to
assure quality control of medication. Upon completion of the study, the manufacturer informed
the researcher as to which group of medications were medicated or unmedicated. The physical
evaluation of each caesarean scar was only performed by the researcher that ensured reliability.
The photographs were standardised by using consistent participant positioning, lighting, the
camera angle and setting. By ensuring standardised positioning of photographs, participants were

26
requested to lie supine on the examination bed; the camera was placed above the participant so
that the borders of the abdomen were contained within the periphery of the photograph. For
measuring purposes the Digimizer® software was used and a standard measuring apparatus was
included in the photographic field for purposes of calibration.
The POSAS (Appendix E) is a recognised, valid and reliable tool used for assessing scars.
According to the POSAS website (www.posas.org.za) the POSAS is free to use at any time as
long as it was not modified. It has been demonstrated that the POSAS is a reliable and valid
scale and provides a unidimensional measure for scar quality (Van der Wal et al., 2012). The
POSAS appears to be the most comprehensive assessment scale by taking into account the
patient‟s assessment of their own scar (Vercelli et al., 2009).
3.7 Data collection and analysis
Data was compiled and collated from all completed POSAS evaluation forms. A size comparison
(area, length and width) of the participant‟s caesarean section scar was completed using
photographs and Digimizer® software analysis. All data was collected by the researcher and
provided to Statkon for EDA (Exploratory Data Analysis). Parametric intergroup analysis
included the independent T-sample test, followed by intragroup analysis using the ANOVA
measurement. Non-parametric intergroup analysis included the Mann-Whitney U test, while
intragroup analysis involved the Friedman and the Wilcoxon signed-rank test (Van Staden,
2014).

27
CHAPTER FOUR
RESULTS
4.1 Introduction
The results obtained in the study are presented in this chapter. The data obtained during the study
was statistically analyzed with the assistance of a statistician at STATKON (Appendix F).
The aim of this study is to determine the efficacy of 12% (v/v) Allium cepa MT in a hydrogel
solution on the appearance of CS scars using the POSAS and digital photographical evidence.
Treatment started at baseline which was week 0 (W0). Both groups were supplied with either un-
medicated hydrogel or hydrogel medicated with Allium cepa 12% MT. Participants were
instructed to apply the gel to their CS scar twice a day for 12 weeks. Follow up consultations
were at week 4 (W4), week 8 (W8) and week 12 (W12). During these consultations the POSAS
(Appendix A) was completed to analyse the scar by the observer and patient separately. The
analysis also included demographic data and objective assessments with photographical
documentation.
The data captured during the study was statistically analysed with the assistance of a statistician
from STATKON using Non-parametric tests which included the Mann-Whitney U test, the
Friedman test and the Wilcoxon Signed Ranks test (van Staden, 2015). Descriptive and cross
tabulation was done for the demographic information between the groups. These non-parametric
tests were conducted as there was a lack of normality across the distribution of variables (Van
Staden, 2014).
Shapiro-Wilk Test
The Shapiro-Wilk test is a statistical test for normality of data (intra-group analysis). A p value
greater than 0.05 (p>0.05) indicated that parametric tests should be used, and a p value less than
0.05 (p<0.05) designates that there is a lack of normality, which indicates the use of non-
parametric tests (Pallant, 2007).
Mann-Whitney U test
The Mann-Whitney U test is a non-parametric test for an independent sample group that
indicated the difference between the control and treatment groups (inter-group analysis). On a

28
consistent variable, a p value < 0.05 shows statistical significant change between the groups
(Pallant, 2007).
Friedman Test
The Friedman test helps with intra-group analysis and is used to determine if there is a
statistically significant difference in severity of symptoms over different time periods, for the
control and treatment groups. The Friedman test is a non-parametric test that indicates change
over time and evaluates normality between the two groups. A p value less than 0.05 (p<0.05)
indicated statistical significant change over time (Pallant, 2007).
Wilcoxon Signed Ranks test
The Wilcoxon Signed Ranks is a non-parametric test which gives an indication of a statistically
significant difference existing between the two groups. A p value less than 0.05 (p<0.05) shows
a statistically significant difference between the two groups. However when there is a
comparison of more than one set of two points, the Bonferroni adjustment must be taken into
account (Pallant, 2007).
The Bonferroni adjustment is a post hoc test that follows the Wilcoxon Signed Ranks test where
an adjustment to the original p value is applied. The use of the Bonferroni adjustment can be
seen in this study, where there are three comparisons; W0-W4, W0-W8, W0-W12. The p value
of 0.05 is divided by 3 therefore if the p value is less than 0.02 (p<0.02) there was a statistically
significant difference (Van Staden, 2015).
4.2 Participant recruitment
Forty two female participants between the ages of 18-50 years were recruited in this study and
assessed for eligibility. As illustrated in Figure 4.1, 42 participants were randomized into a
treatment and control group: 22 participants were allocated to the control group and 20
participants to the treatment group. Two participants withdrew themselves from the study within
the first follow up of treatment: one participant gave no reason for withdrawing, while the other
participant found out she was pregnant and felt that it was unnecessary to continue as she chose
to have an elective CS. At the end of the twelve week period, 20 participants were analysed in
the control and the treatment group.

29
Figure 4.1 CONSORT flow diagram
4.3 Demographic data analysis
4.3.1 Age distribution
Female participants between the ages of 18-50 were recruited in the study. In order to assess
even distribution of ages between and within the group a cross tabulation was used.
Table 4.1 indicates that the mean age in the control group is 33.41 years of age, and treatment
group is 32.7 years of age. The standard deviation from the mean age in the control group is
4.973 years and in the treatment group it is 6.165 years. The youngest person in the control
group was 27 years old and in the treatment group she was 22 year of age. The oldest person in
the control group was 47 years old and in the treatment group she was 45 years of age. The age
distribution within and between the two sample groups were comparable.

30
Conferring to the age normality distribution statistics in Table 4.1 the p-value from Shapiro-
Wilk test for the control group was p=0.012 and for the treatment group p=0.063. This indicates
that the treatment group has a p-value greater than 0.05 showing that it has an age distribution
that is normal. However, the control group has a p-value less than 0.05 and does not have a
normal age distribution.
Table 4.1 Age distribution
Control group Treatment group
N Valid 22 20
Missing 0% 0%
Mean 33.41 32.70
Median 32.00 32.00
Std.dev 4.973 6.165
Minimum 27 22
Maximum 47 45
Shapiro-Wilk sig. 0.012 0.063
4.3.2 Number of previous CS
Participants were recruited regardless of the number of CS they had previously. A cross
tabulation was used to determine the number and percentage of previous CS that participants
have undergone.
As per Table 4.2 a majority of 23 participants (54.8%) had reported only one CS previously.
These were evenly divided across the control group (11) and the treatment group (12). The
remaining number of participants had reported two CS previously (17) and was split between the
control group (10) and the treatment group (7). Two participants (4.8%) reported to have had
three CS previously, one in the control group and the other one in the treatment group. The
numbers of previous CS are represented in Figure 4.2 (control) and Figure 4.3 (treatment) for
both groups.
31
Table 4.2 Number of previous CS
Number of previous CS 1 2 3 Total
Control group
Number of participants 11 10 1 22
Percentage 50% 45.50% 4.50% 100%
Treatment group
Number of participants 12 7 1 20
Percentage 60% 35.00% 5.00% 100%
Total
Number of participants 23 17 2 42
Percentage 54.80% 40.50% 4.80% 100%
Figure 4.2 Number of Previous CS in Control group
11
10
1
1
2
3

32
Figure 4.3 Number of CS in Treatment group
4.4 POSAS Observer Scale
The Observer scale of the POSAS (Appendix E) consists of six items (vascularity, pigmentation,
thickness, relief, pliability, surface area and overall opinion). All items are scored on a scale
ranging from 1 (“like normal skin”) to 10 (“worst scar imaginable”). The parameters were
matched to normal skin on the comparable anatomical location by the Observer.
4.4.1 Vascularity
Vascularity is the presence of vessels in scar tissue assessed by the amount of erythema. This
was tested by the amount of blood returned after blanching the scar with a piece of Plexiglas.
The vascularity of the scar was then associated towards a category (pale, purple, pink or mixed)
presented on the POSAS Observer scale.
Figure 4.4 illustrates the mean value on the POSAS Observer scale for vascularity between the
control group and the treatment group. A decrease in the mean value indicates a decrease /
improvement in vascularity. The mean value for vascularity of the control group at W0 was 4.27,
which then decreased (improved) to 3.55 at W4, and then further decreased to 2.65 at W8 and to
2.50 at W12. This represents an overall improvement of 1.77 (41.45%). The mean value for
vascularity of the treatment group at W0 was 3.90, which then reduced (improved) to 3.50 at
12
7
1
1
2
3

33
W4, and then further decreased to 2.55 at W8 and to 2.15 at W12. This represents an overall
improvement of 1.75 (44.87%).
Figure 4.4 POSAS Observer scale – Vascularity
Intra-group analysis
As per Table 4.3 the Friedman test illustrates that there is a statistically significant difference for
the control group (p=0.000) and the treatment group (p=0.000) over time regarding vascularity
of the scar.
Table 4.3 Friedman test – Vascularity
Friedman test N Chi Square Df Asymp Sig.
Control group 20 29.975 3 0.000
Treatment group 20 36.936 3 0.000
As seen in Table 4.4 there was a statistical significance for the control group between W0-W4
(p=0.007), W0-W8 (p=0.001) and between W0-W12 (p=0.001). However for the treatment
group there was no statistically significant difference between W0-W4 (p=0.174). There was
however a statistically significant difference between W0-W8 (p=0.000) and W0-W12 (p=0.000)
in the treatment group.
0
0.5
1
1.5
2
2.5
3
3.5
4
4.5
W0 W4 W8 W12
Mea
n v
alue
POSAS Observer Scale - Vascularity
Control group
Treatment group

34
Table 4. 4 Wilcoxon Signed Ranks test – Vascularity
Wilcoxon Signed Ranks Test Vasc.W0-W4 Vasc.W0-W8 Vasc.W0-W12
Control group Asymp. Sig 0.007 0.001 0.001
Treatment group 0.174 0.000 0.000
Inter-group analysis
When comparing the results of each group (Table 4.5) by way of inter-group analysis (Mann-
Whitney U test), there was no significant difference found between the control and the treatment
group at W0 (p=0.858); W4 (p=0.641); W8 (p=0.900) and W12 (p=0.498). The two groups
showed no statistical difference at W0 which made them comparable to each other; however the
statistical insignificance at W12 also demonstrates comparability of results by the end of the
study.
Table 4.5 Mann-Whitney U test – Vascularity
Mann-Whitney U test W0 W4 W8 W12
Asym-sig. (2-tailed) 0.858 0.641 0.9 0.498
4.4.2 Pigmentation
Pigmentation is the brownish discolouration of the scar due to pigment (melanin). Pigmentation
was evaluated by applying Plexiglas to the skin with moderate pressure to eliminate the effect of
vascularity.
Figure 4.5 illustrates the mean value on the POSAS Observer scale for pigmentation between
the control group and the treatment group. The mean value for pigmentation of the control group
improved by 1.64 (39.61%) over the course of the 12 weeks from 4.14 to 2.50.However the
treatment group improved by 1.80 (45%) over the course of the 12 weeks from 4.00 to 2.20.

35
Figure 4.5 POSAS Observer scale – Pigmentation
Intra-group analysis
As per Table 4.6 the Friedman test illustrates that there is a statistically significant difference for
the control group (p=0.000) and the treatment group (p=0.000) over time regarding pigmentation
of the scar.
Table 4. 6 Friedman test – Pigmentation
Friedman test N Chi Square Df Asymp Sig.
Control group 20 26.097 3 0.000
Treatment group 20 31.091 3 0.000
According to Table 4.7 there is a statistical significance for the control group between W0-W4
(p=0.007), W0-W8 (p=0.002) and between W0-W12 (p=0.001). However for the treatment
group there was no statistical significant difference between W0-W4 (p=0.088). There was
however a statistically significant difference between W0-W8 (p=0.001) and W0-W12 (p=0.000)
relevant to the treatment group.
Table 4.7 Wilcoxon Signed Ranks test – Pigmentation
Wilcoxon Signed Ranks Pig. W0-W4 Pig. W0-W8 Pig. W0-W12
Control group Asymp. Sig 0.007 0.002 0.001
Treatment group 0.088 0.001 0.000
0
0.5
1
1.5
2
2.5
3
3.5
4
4.5
W0 W4 W8 W12
Mea
n v
alue
POSAS Observer scale - Pigmentation
Control group
Treatment group

36
Inter-group analysis
When comparing the results of each group by way of inter-group analysis (Mann-Whitney U
test), there was no significant difference (Table 4.8) found between the control and the treatment
group at W0 (p=0.54); W4 (p=0.353); W8 (p=0.331) and W12 (p=0.682). The two groups
showed no statistical difference at W0 which made them comparable to each other; however the
statistical insignificance at W12 also demonstrates comparability of results by the end of the
study.
Table 4. 8 Mann-Whitney U test – Pigmentation
Mann-Whitney U test W0 W4 W8 W12
Asym-sig. (2-tailed) 0.54 0.353 0.331 0.682
4.4.3 Thickness
Thickness of the scar is determined as the average distance between the subcutical-border and
the epidermal surface of the scar.
Figure 4.6 illustrates the mean value on the POSAS Observer scale for scar thickness between
the control group and the treatment group. The mean value for thickness of the control group at
W0 was 4.36, which then decreased (improved) to 3.75 at W4, and then further decreased to 3.30
at W8 and to 3.20 at W12. This indicates an overall improvement of 1.16 (26.60%). The mean
value for thickness of the treatment group at W0 was 4.15, which then reduced (improved) to
3.60 at W4, and then further decreased to 2.85 at W8 and to 2.45 at W12, representing an overall
improvement of 1.70 (40.96%).

37
Figure 4.6 POSAS Observer scale – Thickness
Intra-group analysis
As per Table 4.9 the Friedman test illustrates that there is a statistically significant difference for
the control group (p=0.000) and the treatment group (p=0.000) over time regarding thickness of
the scar.
Table 4. 9 Friedman test – Thickness
Friedman test N Chi Square df Asymp Sig.
Control group 20 24.239 3 0.000
Treatment group 20 41.408 3 0.000
According to Table 4.10 there is a statistically significance for the control group between W0-
W4 (p=0.006), W0-W8 (p=0.001) and between W0-W12 (p=0.001). However for the treatment
group there was no statistically significant difference between W0-W4 (p=0.026). There was
however a statistically significant difference between W0-W8 (p=0.000) and W0-W12 (p=0.000)
relevant to the treatment group.
Table 4.10 Wilcoxon Signed Ranks test – Thickness
Wilcoxon Signed Ranks Thick.W0-W4 Thick.W0-W8 Thick.W12
Control group Asymp. Sig 0.006 0.001 0.001
Treatment group 0.026 0.000 0.000
0
0.5
1
1.5
2
2.5
3
3.5
4
4.5
5
W0 W4 W8 W12
Mea
n v
alue
POSAS Observer scale - Thickness
Control group
Treatment group

38
Inter-group analysis
When comparing the results of each group by way of inter-group analysis (Mann-Whitney U
test), there were no significant differences (Table 4.11) found between the control and the
treatment group at W0 (p=0.599); W4 (p=0.544); W8 (p=0.615) and W12 (p=0.779). The two
groups showed no statistical difference at W0 which made them comparable to each other;
however the statistical insignificance at W12 also demonstrates comparability of results by the
end of the study.
Table 4.11 Mann-Whitney U test – Thickness
Mann-Whitney U test W0 W4 W8 W12
Asym-sig. (2-tailed) 0.599 0.544 0.615 0.779
4.4.4 Relief
Relief signifies the extent to which surface irregularities are present, compared to adjacent skin.
The change in the POSAS Observer scale for Relief from W0-W12 all decreased within the
control and treatment group (Figure 4.7). At W0 the mean value for the control group was 4.32.
The mean value decreased in W4 to 3.75 and 3.15 in W8. By W12 the mean value dropped by
1.32 to 3, representing an overall improvement of 30.55%. At W0 the mean value for the
treatment group was 3.95. The mean value decreased in W4 to 3.65 and 2.90 in W8. By W12 the
mean value dropped by 1.65 to 2.3, representing an overall improvement of 41.77%.
Figure 4. 7 POSAS Observer scale – Relief
0
0.5
1
1.5
2
2.5
3
3.5
4
4.5
5
W0 W4 W8 W12
Mea
n v
alue
POSAS Observer scale - Relief
Control group
Treatment group

39
Intra-group analysis
The Friedman test results in Table 4.12 illustrates that there is a statistically significant
difference for the control group (p=0.000) and the treatment group (p=0.000) over time
regarding relief of the scar.
Table 4.12 Friedman test – Relief
Friedman test N Chi Square df Asymp Sig.
Control group 20 32.980 3 0.000
Treatment group 20 39.735 3 0.000
According to Table 4.13 there is a statistical significance for the control group between W0-W4
(p=0.003), W0-W8 (p=0.000) and between W0-W12 (p=0.000) as seen in the results of the
Wilcoxon Signed Ranks test. However for the treatment group there was no statistically
significant difference between W0-W4 (p=0.083). There was however a statistically significant
difference between W0-W8 (p=0.001) and W0-W12 (p=0.000) for the treatment group.
Table 4.12 Wilcoxon Signed Ranks test– Relief
Wilcoxon Signed Ranks Relief W0-W4 Relief W0-W8 Relief W0-W12
Control group Asymp. Sig 0.003 0.000 0.000
Treatment group 0.083 0.001 0.000
Inter-group analysis
When comparing the results of each group by way of inter-group analysis (Mann-Whitney U
test), there was no significant difference (Table 4.14) found between the control and the
treatment group at W0 (p=0.718); W4 (p=0.560); W8 (p=0.656) and W12 (p=0.449). The two
groups showed no statistical difference at W0 which made them comparable to each other;
however the statistical insignificance at W12 also demonstrates comparability of results by the
end of the study.
Table 4.13 The Mann-Whitney U test – Relief
Mann-Whitney U test W0 W4 W8 W12
Asym-sig. (2-tailed) 0.718 0.560 0.656 0.449

40
4.4.5 Pliability
Pliability refers to the suppleness of the scar, tested by wrinkling the scar between the thumb and
index finger.
Figure 4.8 illustrates the mean value on the POSAS Observer scale for pliability between the
control group and the treatment group. The mean value for pliability of the control group
improved by 1.50 (33.70%) over the course of the 12 weeks from 4.45 to 2.95 (Figure 4.8).
However the treatment group improved by 2.2 (48.35%) over the course of the 12 weeks from
4.55 to 2.15 (Figure 4.8).
Figure 4.8 POSAS Observer scale – Pliability
Intra-group analysis
As per Table 4.15 the Friedman test illustrates that there is a statistically significant difference
for the control group (p=0.000) and the treatment group (p=0.000) over time regarding pliability
of the scar.
Table 4.14 Friedman test – Pliability
Friedman test N Chi Square Df Asymp Sig.
Control group 20 33.090 3 0.000
Treatment group 20 41.180 3 0.000
According to Table 4.16 there is a statistical significance for the control group between W0-W4
(p=0.003), W0-W8 (p=0.001) and between W0-W12 (p=0.000).
0
0.5
1
1.5
2
2.5
3
3.5
4
4.5
5
W0 W4 W8 W12
Mea
n v
alue
POSAS Observer scale - Pliability
Control group
Treatment group

41
There was a statistically significant difference for the treatment group between W0-W4
(p=0.010); W0-W8 (p=0.001) and W0-W12 (p=0.000).
Table 4.15 Wilcoxon Signed Ranks test – Pliability
Wilcoxon Signed Ranks Plia.W0-W4 Plia. W0-W8 Plia. W0-W12
Control group Asymp. Sig 0.003 0.001 0.000
Treatment group 0.010 0.001 0.000
Inter-group analysis
When comparing the results of each group by way of inter-group analysis (Mann-Whitney U
test), there was no significant difference (Table 4.17) found between the control and the
treatment group at W0 (p=0.452); W4 (p=0.400); W8 (p=0.561) and W12 (p=0.575). The two
groups showed no statistical difference at W0 which made them comparable to each other;
however the statistical insignificance at W12 also demonstrates comparability of results by the
end of the study.
Table 4.16 Mann-Whitney U test – Pliability
Mann-Whitney U test W0 W4 W8 W12
Asym-sig. (2-tailed) 0.452 0.400 0.561 0.575
4.4.6 Surface area
Surface area of the scar is measured in relation to the original wound area.
Figure 4.9 illustrates the mean value on the POSAS Observer scale for surface area between the
control group and the treatment group. The mean value for surface area of the control group at
W0 was 4.23, which then decreased (improved) to 3.55 at W4 and then further decreased to 3.20
at W8 and to 3.05 at W12, representing an overall improvement of 1.18 (27.9%). The mean
value for surface area of the treatment group at W0 was 4.80, which then reduced (improved) to
4.30 at W4, and then further decreased to 3.20 at W8 and to 2.80 at W12. This represents an
overall improvement of 2 (46.511%).

42
Figure 4.9 POSAS Observer scale – Surface area
Intra-group analysis
As per Table 4.18 the Friedman test illustrates that there is a statistical significant difference for
the control group (p=0.000) and the treatment group (p=0.000) over time regarding surface area
of the scar.
Table 4.17 Friedman test – Surface area
Friedman test N Chi Square df Asymp Sig.
Control group 20 18.714 3 0.000
Treatment group 20 38.098 3 0.000
According to Table 4.19 there is a statistical significance for the control group between W0-W4
(p=0.009), W0-W8 (p=0.005) and between W0-W12 (p=0.002). Conversely for the treatment
group there was no statistically significant difference between W0-W4 (p=0.032). There was
however a statistically significant difference between W0-W8 (p=0.001) and W0-W12 (p=0.000)
relevant to the treatment group.
Table 4.18 Wilcoxon Signed Ranks test – Surface area
Wilcoxon Signed Ranks AreaW0-W4 AreaW0-W8 AreaW0-W12
Control group Asymp. Sig 0.009 0.005 0.002
Treatment group 0.032 0.001 0.000
0
1
2
3
4
5
6
W0 W4 W8 W12
Mea
n v
alue
POSAS Observer scale - Surface area
Control group
Treatment group

43
Inter-group analysis
When comparing the results of each group (Table 4.20) by way of inter-group analysis (Mann-
Whitney U test), there was no significant difference found between the control and the treatment
group at W0 (p=0.323); W4 (p=0.217); W8 (p=0.716) and W12 (p=0.945). The two groups
showed no statistical difference at W0 which made them comparable to each other; however the
statistical insignificance at W12 also demonstrates comparability of results by the end of the
study.
Table 4.19 Mann-Whitney U test – Surface area
Mann-Whitney U test W0 W4 W8 W12
Asym-sig. (2-tailed) 0.323 0.217 0.716 0.945
4.4.7 Overall opinion of Observer
Figure 4.10 illustrates the mean value on the POSAS Observer scale for the overall opinion of
the Observer between the control group and the treatment group. The mean value for the overall
opinion of the control group improved by 1.34 (29.19%) over the course of the 12 weeks from
4.59 to 3.25 (Figure 4.10). The treatment group improved by 1.65 (37.08%) over the course of
the 12 weeks from 4.45 to 2.80 (Figure 4.10).
Figure 4.10 POSAS Observer scale – Overall opinion
0
0.5
1
1.5
2
2.5
3
3.5
4
4.5
5
W0 W4 W8 W12
Mea
n v
alue
POSAS Observer scale - Overall opinion
Control group
Treatment group

44
Intra-group analysis
As per Table 4.21 the Friedman test illustrates that there is a statistically significant difference
for the control group (p=0.000) and the treatment group (p=0.000) over time regarding the
overall opinion of the scar.
Table 4.20 Friedman test – Overall opinion
Friedman test N Chi Square df Asymp Sig.
Control group 20 36.737 3 0.000
Treatment group 20 44.018 3 0.000
According to Table 4.22 there is a statistical significance for the control group between W0-W4
(p=0.002), W0-W8 (p=0.000) and between W0-W12 (p=0.000). There was a statistically
significant difference for the treatment group between W0-W4 (p=0.001); W0-W8 (p=0.001) and
W0-W12 (p=0.000). This shows that a significant change occurred over time, for both groups
(p<0.02), throughout the 12 week period.
Table 4.21 Wilcoxon Signed Ranks test – Overall opinion
Wilcoxon Signed Ranks Opin. W0-W4 Opin. W0-W8 Opin. W0-W12
Control group Asymp. Sig 0.002 0.000 0.000
Treatment group 0.001 0.001 0.000
Inter-group analysis
When comparing the results of each group by way of inter-group analysis (Mann-Whitney U
test), there was no significant difference (Table 4.23) found between the control and the
treatment group at W0 (p=0.634); W4 (p=0.334); W8 (p=0.879) and W12 (p=0.397). The two
groups showed no statistical difference at W0 which made them comparable to each other;
however the statistical insignificance at W12 also demonstrates comparability of results by the
end of the study.
Table 4. 22 Mann-Whitney U test – Overall opinion
Mann-Whitney U test W0 W4 W8 W12
Asym-sig. (2-tailed) 0.634 0.334 0.879 0.397

45
4.5 POSAS Patient scale
The Patient scale of the POSAS (Appendix E) consists of six questions regarding the scar (pain,
itching, colour, stiffness, thickness and regularity). All items are scored on a scale ranging from
1 (“no, not at all”) to 10 (“yes, very much”) by the patient. All parameters were compared to
normal skin on the comparable anatomical location.
4.5.1 Pain
Figure 4.11 illustrates the mean value on the POSAS Patient scale for pain between the control
group and the treatment group. The mean value for pain of the control group at W0 was 2.40.
This value increased to 2.45 at W4, then decreased (improved) to 2.40 at W8, and increased at
W12 to 2.45. The mean value for pain of the treatment group at W0 was 1.45, which then
increased slightly to 1.85 at W4, and then decreased to 1.50 at W8. IT remained steady on 1.50 at
W12. No improvements were observed for the control group and treatment group with regards to
scar pain.
Figure 4.11 illustrates that after the gel was applied between W0-W4 there was an increase in
pain for both groups. The treatment group‟s mean value evened out after W4 and stayed steady
thereafter. The control group on the other hand, had a slight increase and slight decrease of pain
throughout the entire 12 week period.
Figure 4.11 POSAS Patient scale – Pain
0
0.5
1
1.5
2
2.5
3
W0 W4 W8 W12
Mea
n v
alue
POSAS Patient scale - Pain
Control group
Treatment group

46
Intra-group analysis
As per Table 4.24 there was no statistically significant difference for the control group
(p=0.945) and the treatment group (p=0.733) over time regarding the pain of the scar.
Table 4.23 Friedman test – Pain
Friedman test N Chi Square Df Asymp Sig.
Control group 20 0.375 3 0.945
Treatment group 20 1.286 3 0.733
Inter-group analysis
When comparing the results of each group by way of inter-group analysis (Mann-Whitney U
test), there was a statistically significant difference (Table 4.25) found between the control and
the treatment group at W0 (p=0.037). The two groups showed a statistically significant
difference at W0 which made them non-comparable to each other to start off with. However no
statistical significance was observed at W4 (p=0.085); W8 (p=0.266) and at W12 (p=0.116).
Table 4.24 Mann-Whitney U test – Pain
Mann-Whitney U test W0 W4 W8 W12
Asym-sig. (2-tailed) 0.037 0.085 0.266 0.116
4.5.2 Itching
The change in the POSAS Patient scale for itching from W0-W12 all decreased within the
control and treatment group (Figure 4.12). At W0 the mean value for the control group was
3.60. The mean value decreased in W4 to 2.95, and to 2.85 in W8. By W12 the mean value
increased slightly to 2.90, however there was still an overall improvement of 0.7 (19.44%). At
W0 the mean value for the treatment group was 2.25. The mean value increased in W4 to 2.30
and then decreased (improved) to 2.05 in W8. By W12 the mean value dropped to 1.85,
representing an overall improvement of 0.4 (17.77%).

47
Figure 4.12 POSAS Patient scale – Itching
Intra-group analysis
As per Table 4.26 the Friedman test illustrates that there is no statistical significant difference
for the control group (p=0.073) and the treatment group (p=0.452) over time regarding itchiness
of the scar.
Table 4. 25 Friedman test – Itching
Friedman test N Chi Square Df Asymp Sig.
Control group 20 7.010 3 0.073
Treatment group 20 2.630 3 0.452
Inter-group analysis
When comparing the results of each group by way of inter-group analysis (Mann-Whitney U
test) there was no statistically significant difference found between the control and the treatment
group at W0 (p=0.314); W4 (p=0.328); W8 (p=0.533) and W12 (p=0.218). The two groups
showed no statistical difference at W0 which made them comparable to each other; however the
statistical insignificance at W12 also demonstrates comparability of results by the end of the
study (Table 4.27).
Table 4. 26 Mann-Whitney U test – Itching
Mann-Whitney U test W0 W4 W8 W12
Asym-sig. (2-tailed) 0.314 0.328 0.533 0.218
0
0.5
1
1.5
2
2.5
3
3.5
4
W0 W4 W8 W12
Mea
n v
alue
POSAS Patient scale - Itching
Control group
Treatment group

48
4.5.3 Colour
Figure 4.13 illustrates the mean value on the POSAS Patient scale for the colour of the scar
between the control group and the treatment group. The mean value for colour of the control
group improved by 0.95 (18.73%) over the course of the 12 weeks from 5.23 to 4.25. However,
the treatment group improved significantly by 2.95 (45.38%) over the course of the 12 weeks
from 6.50 to 3.55 (Figure 4.13).
Figure 4.13 POSAS Patient scale – Colour
Intra-group analysis
As per Table 4.28 the Friedman test illustrates that there is a statistically significant difference
for the treatment group (p=0.000) only. The control group showed no statistical significance
(p=0.205).
Table 4.27 Friedman test – Colour
Friedman test N Chi Square df Asymp Sig.
Control group 20 4.579 3 0.205
Treatment group 20 31.817 3 0.000
According to Table 4.29 there is no statistically significant difference for the control group
between W0-W4 (p=0.131), W0-W8 (p=0.075) and between W0-W12 (p=0.091). However for
the treatment group there was a statistically significant difference between W0-W4 (p=0.013);
W0-W8 (p=0.002) and W0-W12 (p=0.000).
0
1
2
3
4
5
6
7
W0 W4 W8 W12
Mea
n v
alue
POSAS Patient scale - Colour
Control group
Treatment group

49
Table 4.28 Wilcoxon Signed Ranks test – Colour
Wilcoxon Signed Ranks Colr.W0-W4 Colr.W0-W8 Colr.W0-W12
Control group Asymp. Sig 0.131 0.075 0.091
Treatment group 0.013 0.002 0.000
Inter-group analysis
When comparing the results of each group by way of inter-group analysis (Mann-Whitney U
test), there was no significant difference (Table 4.30) found between the control and the
treatment group at W0 (p=0.157); W4 (p=0.279); W8 (p=0.870) and W12 (p=0.302). The two
groups showed no statistical difference at W0 which made them comparable to each other;
however the statistical insignificance at W12 also demonstrates comparability of results by the
end of the study.
Table 4.29 Mann-Whitney U test – Colour
Mann-Whitney U test W0 W4 W8 W12
Asym-sig. (2-tailed) 0.157 0.279 0.870 0.302
4.5.4 Stiffness
Figure 4.14 illustrates the mean value on the POSAS Patient scale for stiffness between the
control group and the treatment group. At W0 the mean value for the control group was 5.55.
The mean value decreased in W4 to 4.95, and to 4.50 in W8. By W12 the mean value slightly
increased to 4.55, however still representing an overall improvement of 1 (18.01%). At W0 the
mean value for the treatment group was 5.85. The mean value decreased in W4 to 4.15 and to
3.75 in W8. By W12 the mean value dropped (improved) by 2.60, representing an overall
significant improvement of 3.25 (55.55%) for the treatment group.

50
Figure 4.14 POSAS Patient scale – Stiffness
Intra-group analysis
As per Table 4.31 the Friedman test illustrates that there is a statistically significant difference
for the control group (p=0.011) and the treatment group (p=0.000) over time regarding stiffness
of the scar.
Table 4.30 Friedman test – Stiffness
Friedman test N Chi Square df Asymp Sig.
Control group 20 11.197 3 0.011
Treatment group 20 30.054 3 0.000
According to Table 4.32 there is a statistical significance for the control group between W0-W4
(p=0.042), W0-W8 (p=0.014) and between W0-W12 (p=0.011). There was a statistically
significant difference for the treatment group between W0-W4 (p=0.012), W0-W8 (p=0.010) and
W0-W12 (p=0.000). This shows that a change occurred over time for both groups (p<0.02)
throughout the 12 week period.
Table 4.31 Wilcoxon Signed Ranks test – Stiffness
Wilcoxon Signed Ranks Stiff.W0-W4 Stiff.W0-W8 Stiff.W0-W12
Control group Asymp. Sig 0.042 0.014 0.011
Treatment group 0.012 0.010 0.000
0
1
2
3
4
5
6
7
W0 W4 W8 W12
Mea
n v
alue
POSAS Patient scale - Stiffness
Control group
Treatment group

51
Inter-group analysis
When comparing the results of each group by way of inter-group analysis (Mann-Whitney U
test), there was no significant difference (Table 4.33) found between the control and the
treatment group at W0 (p=0.601); W4 (p=0.268) and at W8 (p=0.184). There was however a
statistical significance at W12 (p=0.008). The two groups showed no statistical difference at W0
which made them comparable to each other; however the statistically significant results at W12
demonstrates incomparability between the control (18.01% improvement) and the treatment
(55.55% improvement) group at the end of the study.
Table 4.32 Mann-Whitney U test – Stiffness
Mann-Whitney U test W0 W4 W8 W12
Asym-sig. (2-tailed) 0.601 0.268 0.184 0.008
4.5.5 Thickness
Figure 4.15 illustrates the mean value on the POSAS Patient scale for scar thickness between the
control group and the treatment group. The mean value for thickness of the control group
improved by 2.94 (47.88%) over the course of the 12 weeks from 6.14 to 3.20. However, the
treatment group improved by 4.05 (60%) over the course of the 12 weeks from 6.75 to 2.70
(Figure 4.15).
Figure 4.15 POSAS Patient scale – Thickness
0
1
2
3
4
5
6
7
8
W0 W4 W8 W12
Mea
n v
alue
POSAS Patient scale - Thickness
Control group
Treatment group

52
Intra-group analysis
As per Table 4.34 the Friedman test illustrates that there is a statistically significant difference
for the control group (p=0.001) and the treatment group (p=0.000) over time regarding thickness
of the scar.
Table 4.33 Friedman test – thickness
Friedman test N Chi Square df Asymp Sig.
Control group 20 16.921 3 0.001
Treatment group 20 33.468 3 0.000
According to Table 4.35 there is a statistical significance for the control group between W0-W4
(p=0.012), W0-W8 (p=0.002) and between W0-W12 (p=0.007). There was a statistically
significant difference for the treatment group between W0-W4 (p=0.001), W0-W8 (p=0.003) and
between W0-W12 (p=0.000). This shows that a significant change occurred over time, for both
groups, throughout the 12 week period.
Table 4.34 Wilcoxon Signed Ranks test – Thickness
Wilcoxon Signed Ranks Thick.W0-W4 Thick.W0-W8 Thick.W0-W12
Control group Asymp. Sig 0.012 0.002 0.007
Treatment group 0.001 0.003 0.000
Inter-group analysis
When comparing the results of each group by way of inter-group analysis (Mann-Whitney U
test). There was no significant difference (Table 4.36) found between the control and the
treatment group at W0 (p=0.445); W4 (p=0.405); W8 (p=0.452) and W12 (p=0.008). The two
groups showed no statistical difference at W0 which made them comparable to each other;
however the statistically significant results at W12 demonstrates incomparability between the
control (47.8% improvement) and the treatment (60% improvement) group at the end of the
study.
Table 4.35 Mann- Whitney U test – Thickness
Mann-Whitney U test W0 W4 W8 W12
Asym-sig. (2-tailed) 0.445 0.405 0.452 0.008

53
4.5.6 Irregularity
Figure 4.16 illustrates the mean value on the POSAS Patient scale for scar regularity between
the control group and the treatment group. The mean value for regularity of the control group
improved by 1.55 (25.61%) over the course of the 12 weeks from 6.05 to 4.50 (Figure 4.16).
However the treatment group improved by 3.35 (51.53%) over the course of the 12 weeks from
6.50 to 3.15 (Figure 4.16).
Figure 4.16 POSAS Patient scale – Irregularity
Intra-group analysis
As per Table 4.37 the Friedman test illustrates that there is a statistical significant difference for
the control group (p=0.000) and the treatment group (p=0.000) over time regarding irregularities
of the scar.
Table 4.36 Friedman test – Irregularity
Friedman test N Chi Square df Asymp Sig.
Control group 20 21.152 3 0.000
Treatment group 20 28.724 3 0.000
According to Table 4.38 there was no statistical significance for the control group between W0-
W4 (p=0.028), however there was a statistically significant difference between W0-W8
(p=0.002) and W0-W12 (p=0.001). The treatment group illustrated a statistically significant
difference between W0-W4 (p=0.005); W0-W8 (p=0.003) and W0-W12 (p=0.000).
0
1
2
3
4
5
6
7
W0 W4 W8 W12
Mea
n v
alue
POSAS Patient scale - Irregularity
Control group
Treatment group

54
Table 4.37 Wilcoxon Signed Ranks test – Irregularity
Wilcoxon Signed Ranks Test Reg.W0-W4 Reg.W0-W8 Reg.W0-W12
Control group Asymp. Sig 0.028 0.002 0.001
Treatment group 0.005 0.003 0.000
Inter-group analysis
When comparing the results of each group (Table 4.39) by way of inter-group analysis (Mann-
Whitney U test), there was no significant difference found between the control and the treatment
group at W0 (p=0.575); W4 (p=0.604); W8 (p=0.913) and W12 (p=0.080). The two groups
showed no statistical difference at W0 which made them comparable to each other; however the
statistical insignificance at W12 also demonstrates comparability of results by the end of the
study.
Table 4.38 Mann-Whitney U test – Irregularities
Mann-Whitney U test W0 W4 W8 W12
Asym-sig. (2-tailed) 0.575 0.604 0.913 0.080
4.5.7 Overall opinion
Figure 4.17 illustrates the mean value on the POSAS Patient scale for overall opinion between
the control group and the treatment group. At W0 the mean value for the control group was 5.95.
The mean value decreased in W4 to 4.85 and 4.50 in W8. By W12 the mean stayed at 4.50,
representing an overall improvement of 1.45 (24.36%). At W0 the mean value for the treatment
group was 7.05. The mean value decreased in W4 to 5.60 and 4.10 in W8. By W12 the mean
value dropped (improved) to 3.20, representing an overall significant improvement of 3.85
(54.61%).

55
Figure 4.17 POSAS Patient scale – Overall opinion
Intra-group analysis
As per Table 4.40 the Friedman test illustrates that there is a statistically significant difference
for the control group (p=0.000) and the treatment group (p=0.000) over time regarding the
participant‟s overall opinion of their scar.
Table 4.39 Friedman test – Overall opinion
Friedman test N Chi Square df Asymp Sig.
Control group 20 24.902 3 0.000
Treatment group 20 45.568 3 0.000
According to Table 4.41 there is a statistical significance for the control group between W0-W4
(p=0.004); W0-W8 (p=0.001) and between W0-W12 (p=0.001). There was also a statistically
significant difference for the treatment group between W0-W4 (p=0.004); W0-W8 (p=0.000) and
W0-W12 (p=0.000).
Table 4.40 Wilcoxon Signed Ranks test – Overall opinion
Wilcoxon Signed Ranks Test Opin.W0-W4 Opin.W0-W8 Opin.W0-W12
Control group Asymp. Sig 0.004 0.001 0.001
Treatment group 0.004 0.000 0.000
0
1
2
3
4
5
6
7
8
W0 W4 W8 W12
Mea
n v
alue
POSAS Patient scale - Overall opinion
Control group
Treatment group

56
Inter-group analysis
When comparing the results of each group by way of inter-group analysis (Mann-Whitney U
test), there was no significant difference (Table 4.42) found between the control and the
treatment group at W0 (p=0.168); W4 (p=0.292); W8 (p=0.495) and W12 (p=0.036). The two
groups showed no statistical difference at W0 which made them comparable to each other;
however the statistically significant results at W12 demonstrates incomparability between the
control (24.36% improvement) and the treatment (54.61% improvement) group at the end of the
study.
Table 4. 41 Mann-Whitney U test – Overall opinion
Mann-Whitney U test W0 W4 W8 W12
Asym-sig. (2-tailed) 0.168 0.292 0.495 0.036
4.6 Digimizer®
4.6.1 Surface area of scar
Figure 4.18 illustrates the mean value on the Digimizer® programme for surface area of the scar
between the control group and the treatment group. The mean value for surface area of the
control group at W0 was 4.227, which then decreased (improved) to 3.274 at W4, and then
further decreased to 2.644 at W8 and to 2.331 at W12. This represents an overall improvement of
1.896 (44.85%). The mean value for surface area of the treatment group at W0 was 5.667, which
then slightly increased to 5.818 at W4 and then further decreased to 3.633 at W8 and to 2.922 at
W12, representing an overall improvement of 2.745 (48.43%).

57
Figure 4.18 Digimizer® - Surface area
Intra-group analysis
As per Table 4.43 the Friedman test illustrates that there is a statistically significant difference
for the control group (p=0.00) and the treatment group (p=0.00) over time regarding surface area
of the scar.
Table 4.42 Friedman test – Surface area
Friedman test N Chi Square Df Asymp Sig.
Control group 20 29.040 3 0.000
Treatment group 20 39.420 3 0.000
According to Table 4.44 there is a statistical significance for the control group between W0-W4
(p=0.012), W0-W8 (p=0.000) and between W0-W12 (p=0.000). However for the treatment
group there was no statistical significant difference between W0-W4 (p=0.025). There was
however a statistically significant difference between W0-W8 (p=0.000) and W0-W12 (p=0.000)
relevant to the treatment group.
Table 4.43 Wilcoxon Signed Ranks test – Surface area
Wilcoxon Signed Ranks Sur W0-W4 Sur W0-W8 Sur W0-W12
Control group Asymp. Sig 0.012 0.000 0.000
Treatment group 0.025 0.000 0.000
0
1
2
3
4
5
6
7
W0 W4 W8 W12
Mea
n v
alue
Digimizer - Surface area
Control group
Treatment group

58
Inter-group analysis
When comparing the results of each group by way of inter-group analysis (Mann-Whitney U
test), there was no significant difference (Table 4.45) found between the control and the
treatment group at W0 (p=0.257); W4 (p=0.402); W8 (p=0.185) and W12 (p=0.229). The two
groups showed no statistical difference at W0 which made them comparable to each other;
however the statistical insignificance at W12 also demonstrates comparability of results by the
end of the study.
Table 4.44 Mann-Whitney U test – Surface area
Mann-Whitney U test W0 W4 W8 W12
Asym-sig. (2-tailed) 0.257 0.402 0.185 0.229
4.6.2 Length
Figure 4.19 illustrates the mean value on the Digimizer® programme for length of the scar
between the control group and the treatment group. The mean value for length of the scar in the
control group at W0 was 11.875cm. This decreased (improved) to 10.82cm at W4 and then
further decreased to 10.253cm at W8, and to 9.833cm at W12, representing an overall
improvement of 2.042cm (17.19%). The mean value for length of the scar in the treatment group
at W0 was 13.622cm, which then decreased (improved) to 13.329cm at W4, to 12.319cm at W8,
and to 12.153cm at W12, representing an overall improvement of 1.469cm (10.78%).
Figure 4.19 Digimizer®
- Length
0
2
4
6
8
10
12
14
16
W0 W4 W8 W12
Mea
n v
alue
(cm
)
Digimizer - Length
Control group
Treatment group

59
Intra-group analysis
As per Table 4.46 the Friedman test illustrates that there was a statistically significant difference
for the control group (p=0.023) and the treatment group (p=0.006) over time regarding length of
the scar.
Table 4.45 Friedman test – Length
Friedman test N Chi Square Df Asymp Sig.
Control group 20 9.540 3 0.023
Treatment group 20 12.540 3 0.006
According to Table 4.47 there is no statistically significant difference for the control group
between W0-W4 (p=0.232). There was however a statistical significance for the control group
between W0-W8 (p=0.004) and between W0-W12 (p=0.008). There was also no statistical
significance for the treatment group between W0-W4 (p=0.086). There was a statistically
significant difference between W0-W8 (p=0.006) and W0-W12 (p=0.004) relevant to the
treatment group.
Table 4.46 Wilcoxon Signed Ranks test – Length
Wilcoxon Signed Ranks Len.W0-W4 Len.W0-W8 Len.W0-W12
Control group Asymp. Sig 0.232 0.004 0.008
Treatment group 0.086 0.006 0.004
Inter-group analysis
When comparing the results of each group by way of inter-group analysis (Mann-Whitney U
test). There was no significant difference (Table 4.48) found between the control and the
treatment group at W0 (p=0.279); W4 (p=0.245); W8 (p=0.123) and W12 (p=0.256). The two
groups showed no statistical difference at W0 which made them comparable to each other;
however they ended incomparable at W12.
Table 4.47 Mann-Whitney U test – Length
Mann-Whitney U test W0 W4 W8 W12
Asym-sig. (2-tailed) 0.279 0.245 0.123 0.256
60
4.6.3 Width
Figure 4.20 illustrates the mean value on the Digimizer® programme for width of the scar
between the control group and the treatment group. The mean value for width of the scar for the
control group at W0 was 2.08. This increased slightly to 2.385 at W4, and then decreased
(improved) to 2.063 at W8, followed by another slight increase of 2.19 at W12. There was no
improvement for scar width in the control group. The mean value for width of the treatment
group at W0 was 3.474, which then decreased (improved) to 3.139 at W4, and then further
decreased to 2.602 at W8. There was however a slight increase of 2.863 at W12, representing an
overall improvement of 0.611 (17.587%).
Figure 4.20 Digimizer®
- Width
Intra-group analysis
As per Table 4.49 the Friedman test illustrates that there is a statistically significant difference
for the control group (p=0.019) over time regarding width of the scar. There was no statistical
significance for the treatment group (p=0.115).
Table 4.48 Friedman test – Width
Friedman test N Chi Square Df Asymp Sig.
Control group 20 9.960 3 0.019
Treatment group 20 5.940 3 0.115
According to Table 4.50 there was no statistical significance for the control group between W0-
W4 (p=0.681), W0-W8 (p=0.023) and between W0-W12 (p=0.037).
0
0.5
1
1.5
2
2.5
3
3.5
4
W0 W4 W8 W12
Mea
n v
alue
Digimizer - Width
Control group
Treatment group

61
However there was no statistically significance for the treatment group between W0-W4
(p=0.167) and between W0-W12 (p=0.263), but a statistically significant difference was
observed between and W0-W04 (p=0.008) relevant to the treatment group.
Table 4.49 Wilcoxon Signed Ranks test – Width
Wilcoxon Signed Ranks Width W0-W4 Width W0-W8 Width W0-W12
Control group Asymp. Sig 0.681 0.023 0.037
Treatment group 0.167 0.008 0.263
Inter-group analysis
When comparing the results of each group by way of inter-group analysis (Mann-Whitney U
test), there was no significant difference found (Table 4.51) between the control and the
treatment group at W0 (p=0.099); W4 (p=0.449); W8 (p=0.279) and W12 (p=0.168). The two
groups showed no statistical difference at W0 which made them comparable to each other;
however the statistical insignificance at W12 also demonstrates comparability of results by the
end of the study.
Table 4.50 Mann-Whitney U test – Width
Mann-Whitney U test W0 W4 W8 W12
Asym-sig. (2-tailed) 0.099 0.449 0.279 0.168

62
CHAPTER FIVE
DISCUSSION
5.1 Introduction
This chapter is used to discuss the results obtained from chapter four.
Non-parametric analyses made use of the Friedman test, post hoc-Wilcoxon signed ranks test
and the Mann Whitney U test. Non-parametric testing tools are most accurate in larger sample
sizes, but may indicate more relatively accurate p-values in smaller sample groups compared to
parametric testing. The Wilcoxon signed ranks test made use of Bonferonni adjustments as a
post-test to determine the specific time frame in the study in which changes occurred given that
they reflected statistical significance in the Friedman test. The final sample size was 40 female
participants and it was observed by the statistician of this study that the sample sizes may have
been too small for analysis of variance in terms of parametric analyses, but was not too small to
facilitate non-parametric analyses (Van Staden, 2014).
5.2 Demographic data discussions
5.2.1 Age distribution
The study was open to women between the ages of 18 – 50 years; this allowed a wider range of
women with CS‟s in the surrounding local community to participate. The approximate mean age
of participants that partook in this study in the control group (33.41) and treatment group (32.70)
was 33 years old. Statistically the control group had a p-value less than 0.05 and does not have
normal distribution of age within the group (p=0.012). Furthermore the p-value for the treatment
group is greater than 0.05 and the age distribution is normal within the group (p=0.063). The lack
of a matching up technique at the beginning of the study may have caused the control group to
have presented with an age distribution that is not even. Future studies might consider matching
participants according to age in each group.
5.2.2 Number of previous CS
Participants were recruited regardless of the number of previous CS they have had. 4.5% of
participants in the control group and 5% of participants in the treatment group had three CS
previously. Furthermore, 45.5% of participants in the control group and 35% of the treatment
group had two CS previously. 50% of participants in the control group and 60% of participants

63
in the treatment group had one CS previously. This indicates that majority of participants in this
study have only undergone one surgical procedure.
5.3 POSAS Observer scale
The POSAS Observer scale consists of six items (vascularity, pigmentation, relief, pliability,
thickness, surface area and overall opinion) that are evaluated to assess a scar by the researcher /
observer. Depending on the degree of the scar, the researcher/observer gave a score between 1
(“like normal skin) and 10 (“worst scar imaginable”) throughout the 12 week period (W0-W12).
The Friedman test illustrated that there was a statistically significant change for both groups
regarding every criteria of the POSAS Observer scale. This confirms that there was an
improvement or change of symptoms over time regarding all parameters of the scar conferring to
the observer.
5.3.1 Vascularity, pigmentation, thickness, relief and surface area
According to the Wilcoxon Signed Ranks test the following parameters: vascularity,
pigmentation, thickness, relief and surface area of the scar, obtained similar significance relevant
to appearance and change in scar healing. A statistical significance was obtained for the control
group between every time frame throughout the twelve weeks (W0-W4, W0-W8 and W0-W12).
However the treatment group had no statistically significant results relevant to these parameters
at the beginning of the study (W0-W4) and started showing statically significant results between
W0-W8 and W0-W12 only.
A study showed that in the majority of subjects the benefits of Allium cepa are only fully defined
from eight weeks of application and onwards (Draelos, 2008). Another possible explanation
could be that inflammation has been recognized as an early participant in wound healing,
therefore parameters like vascularity, thickness (swelling), relief and surface area are found
increasingly at early stages (W0-W4) and would subside after the inflammatory phase (Henry
and Garner, 2003). Although hydrogel has shown to improve appearance of scarring, Allium
cepa also improves scarring but have a “delayed” healing affect and therefore signs of change
was only picked up after W4. Interestingly, according to Figure 5.1 percentage improvements by
W12 was greater in the treatment group for most of these parameters except for pigmentation.
Future studies may need to increase the study period in order to fully establish the healing
properties of Allium cepa due to “delayed” healing.

64
In 2001 a study was conducted to determine the effectiveness of topical Allium cepa applied
three times daily for 4 weeks, on the appearance and symptomatology of post-surgical scars. The
results were then compared to the results of participants using a topical emollient ointment. No
statistically significant difference was seen in the Allium cepa treatment group, between pre- and
post-treatment evaluations at week 4. However a statistically significant reduction in scar
appearance and symptomatology was found in patients using a petrolatum based ointment
(Jackson and Shelton, 2001).
Despite widespread pigment cell research the melanocyte remains a mysterious cell with
numerous roles controlled by various interlinking factors (Chadwick et al., 2012). Efforts to
promote rapid wound healing and minimize the inflammatory response (W4) within the wound
may prevent abnormalities of pigmentation within the resulting scar. Pigmentation usually
improves at late stages of wound healing and this may suggest why improvement is only
expected after the inflammatory phase, W4 (Baek et al., 2009).
Another possible explanation was that the Cross tabulation method was not used in the study and
participants were randomly assigned to either group. The mentioned parameters were not
comparable between the control and treatment group and this is a factor that may influence the
outcome of the study.
5.3.2 Pliability
Changes in the ratings of the pliability of the scar showed statistically significant differences for
the control and the treatment group throughout the entire study (W0-W4, W0-W8 and W0-W12).
The control group applied only hydrogel to their scar and due to the hydrating, soothing and
antimicrobial qualities of the vehicle; pliability of the scar may have improved (Colledge et al.,
2010). The local application of Allium Cepa to a healed sutured wound could significantly
induce the breaking strength of the wound so it might reduce hardness of the scar (Dunkin et al.,
2007).
5.3.3 Overall opinion
According to the Wilcoxon Signed ranks test the Observer‟s overall opinion of the scar for the
control and treatment group showed statistically significant results through out every set point of
the study at W0-W4, W0-W8 and W0-W12.

65
The p-value for the Mann-Whitney U test showed that there was no statistically significant
difference between the control and treatment group regarding all parameters of the POSAS
Observer scale (vascularity, pigmentation, thickness, relief, pliability, surface area and overall
opinion). No significant difference implies that the treatment group did no better than the control
group. Studies with larger sample sizes and longer follow-up consultation might be needed to
confirm the benefits of Allium cepa according to the Observer scale.
It can be concluded that the results obtained from the POSAS Observer scale illustrates that
Allium cepa did not improve symptoms such as vascularity, pigmentation, thickness, relief and
surface area in the first four weeks (W4) better than hydrogel alone. However, bearing in mind
the late improvement and reaction of Allium cepa which should lend to a longer study period for
more comparative results. Similar results were achieved between Allium cepa and hydrogel with
regards to overall opinion and pliability of the scar.
5.4 POSAS Patient scale
The Patient scale of the POSAS (Appendix E) consists of six questions that the
patient/participant answered in regards to their scar (pain, itching, colour, stiffness, thickness and
regularity and overall opinion). All items were scored on a scale ranging from 1 (“no, not at all”)
to 10 (“yes, very much”).
5.4.1 Pain
Pain is the most common symptom of scar healing. The Friedman test indicated an overall lack
of change within the control (p=0.945) and the treatment group (p=0.733). The mean values for
scar pain within both groups were low at W0, consequently the Friedman test indicates that no
significant change occurred and this illustrates that the degree of pain did not worsen from where
it started at W0. Pain is an early sign of inflammation, and it could take up to 3-6 months for a
new dermal scar to reduce pain (Henry and Garner, 2003). Another possibility may well be that
participants enrolled in the study had an increase in awareness of scar pain and may have
contributed to a psychological effect of increased pain. A longer study period could direct
positive benefits towards scar pain after the inflammatory phase has subsided.
The Mann-Whitney U test illustrated that there was a statistically significant difference between
the control and treatment group at week 0, where mean values recorded were 2.4 for the control
group and 1.45 for the treatment group (Figure 4.12). These values confirm that the control and
treatment group were not comparable to start off with. This may be that the two groups were not

66
being matched up according to pain (Cross tabulation method), but were randomly assigned to
either group. The rest of the results showed no statistically significant difference between the two
groups throughout the 12 week period. These findings might also contribute to the lack of
specification in the inclusion criteria of the age of the dermal scar. Scar treatment differs in terms
of wound healing phases, new and older scars (length of study, number of daily application etc.).
This may influence the outcome of the study and it is therefore suggested that future studies
should consider distinguishing between new and old dermal scars.
5.4.2 Itching
Within the control group the percentage improvement was 19.44%, however there was no
statistically significant change over time for itching in the control group (p=0.073). The results
from the treatment group illustrated a 17.77% improvement, yet there was also no statistically
significant change over time (p=0.452). According to the Mann-Whitney U test, no significant
difference was observed between the two groups at W0 (p=0.314); W4 (p=0.328); W8 (p=0.533)
and W12 (p=0.218). There was no significant improvement which can be attributed to itching
only occurring at later stages of wound healing, and therefore future studies might need a longer
study period to show improvement (Henry and Garner, 2003). Similar results were found by
other studies, where Allium cepa failed to alleviate scar pruritis within 12 weeks of treatment
(Chanprapaph et al., 2012; Draelos et al., 2012; Jackson and Shelton, 2001). Differentiation
between new and old dermal scars might also contribute to the phases of wound healing and
therefore may play a role in the degree of scar itching.
5.4.3 Colour
The results from the control group demonstrated an improvement of 18.73% - this change was
not statistically significant (p=0.205). However within the treatment group an overall
improvement of 45.38% which was astatistically significant change over time (p=0.00). The post
hoc Wilcoxon signed ranks analyses showed that for the treatment group there was statistical
significance throughout every time frame of the study (W0-W4, W0-W8 and W0-W12) however
the control group had no significanct change. According to the Mann-Whitney U test the p-value
was more than 0.05, which indicates that there was no significant difference between the two
groups. Despite the lack of significant difference, the results showed a distinguishable trend of
greater improvement for Allium cepa against hydrogel.
A possible reason for this finding could include that Allium cepa is useful in reducing
neoangiogenesis in scars, resulting in the clinical improvement of skin vascularity

67
(Draelos, 2008). Another possibility could be that the quercetin in Allium cepa causes an anti-
inflammatory effect by inhibiting lipopolysaccharide-induced tumor-necrosis factor-alpha (TNF-
α) production which could result in faded scar colour (Boots et al., 2008).
According to Taylor (2008), these results might perhaps be due to the fact that the significance of
quercetin‟s cellular effects seems to reside in its anti-histamine properties. The theory behind this
is that a compound that blocks histamine release may normalise or decrease collagen production
by fibroblasts, subsequently resulting in reduced dermal scar volume and relative normalisation
of the scar maturation process. The cosmetic result is a decrease in scar erythema (Taylor, 2008).
5.4.4 Stiffness
The control group showed an improvement of 18.01% and illustrated a statistically significant
change over time for scar stiffness (p=0.011). In the treatment group there was an overall
substantial improvement of 55.5% and a statistically significant change was attained (p=0.00)
regarding the stiffness of the scar. Both the control and treatment groups numerical mean value
were similar at W0 (5.55 in the control group and 5.85 in the treatment group). According to the
post-hoc Wilcoxon signed ranks analyses there was no statistically significance achieved for the
control group between W0-W4 The rest of the time frames were statistically significant (W0-
W8, W0-W12). The treatment group on the other hand, demonstrated statistically significant
improvement in scar thickness according to the Wilcoxon signed ranks test (W0-W4, W0-W8
and W0-W12).
The control group applied only hydrogel to their scar and due to the hydrating, soothing and
antimicrobial qualities of the vehicle, stiffness of the scar improved according to the participant
but took longer to show improvement and improvement was only seen between W0-W8 onwards
(Colledge et al., 2010). The local application of Allium Cepa to a healed sutured wound could
reduce the breaking strength of the wound so it might reduce hardness of the scar (Dunkin et al.,
2007).
The Mann-Whitney U test illustrated that there was no statistically significant difference
between the control and treatment group at week 0, week 4 or week 8, which indicates that the
two groups were comparable to start off with (Table 4.26). However by week 12 there was a
statistically significant difference between the treatment and control group, which means that
they ended off non-comparable.

68
5.4.5 Thickness
The results from the control group demonstrated an improvement of 47.88% and there was
statistically significant change with regards to scar thickness (p=0.001). Within the treatment
group an improvement of 60% was achieved and a statistically significant change happened over
time (p=0.000). The Mann-Whitney U analysis demonstrated that the groups started off
comparable and ended off non-comparable at the end of the study (W0 (p=0.445); W4
(p=0.405); W8 (p=0.452) and W12 (p=0.008)). Due to the significant difference at W12, the
results showed a greater improvement for Allium cepa compared to hydrogel in scar thickness
(Figure 5.2).
Allium cepa is classed as a PGF ß1 antagonist. This can help explain the results obtained for scar
thickness. In 2007, rat skin-biopsy models were exposed to different topical scar treatments and
assessed for immunohistochemical and ultrastructural changes in scar formation after treatment.
The Allium cepa group had the thinnest (normal epidermis) and the appearance of keratinocytes
forming the epidermis was close to normal. Due to the PGF ß1 antagonist properties of Allium
cepa scar thickness was affected and improved by 60% (Ralf, 2007).
5.4.6 Irregularity
Within the control group an improvement of 25.61% was achieved for scar irregularity and a
statistically significant change occurred over time (p=0.000). According to the Wilcoxon signed
ranks analyses for the control group, no statistically significant difference was found at the
beginning of the study or between W0-W4, and significant results were only achieved between
W0-W8 and W0-W12. The treatment group on the other hand, demonstrated an improvement of
51.53% as well as statistically significant change (p=0.000). The Wilcoxon signed ranks test for
the treatment group was shown to change irregularity of the scar between every consultation of
the study (W0-W4; W0-W8; W0-W12). This result indicates that for the treatment group there
was felt to be a change in surface irregularities according the participant throughout every time
frame of the study.
Allium cepa induces MMP-1 expression which has a key role in ECM remodeling and could
result in reduced scar irregularity (Cho et al., 2010). The vehicle (hydrogel) in both groups might
have played a role in soothing and hydrating the scar leading to reduced scar irregularities.
The Mann-Whitney U test showed a p-value greater than 0.05 at every consultation of the study,
which indicates that there was no difference between the two groups.

69
Objectivity and validity of subject self-rating scales for assessing improvement differences
between groups in this type of study is questionable since the participants were not completely
blinded to treatment due to the smell and colour of Allium cepa and might therefore have been
biased. Despite this the POSAS Patient scale is an useful tool for providing meaningful
information from the viewpoint of the participant‟s satisfaction, even though it may not be totally
reliable (Draelos, 2008).
5.4.7 Overall opinion
The overall opinion for the control group improved by 25.36% and illustrated a statistically
significant change over time (p=0.000). Within the treatment group an improvement of 54.61%
was achieved and statistically significant change occurred over time (p=0.000). Results of the
Wilcoxon Signed Ranks test showed that the change in the overall opinion for the control and
treatment group started from the beginning of the study throughout (W0-W4; W0-W8; W0-
W12). The Mann Whitney U analysis illustrated that the p-value at W12 was less than 0.05,
therefore a statistically significant difference was achieved between the control and treatment
group by week 12 only (W0 (p=0.168); W4 (p=0.292); W8 (p=0.495) and W12 (p=0.036)).
From these results we can assume that in general, participants in either treatment or control
group felt satisfied with their scar‟s overall appearance at week 12. Due to the significant
difference at W12, the results showed a greater improvement for Allium cepa compared to
hydrogel in participant‟s overall opinion of their scar.
It can be concluded that the results obtained from the POSAS Patient scale illustrates that Allium
cepa improved stiffness, thickness and the patient‟s overall opinion better than hydrogel. Other
areas that demonstrated improvement was scar colour and scar irregularities. Symptoms such as
scar pain and itching did not show to improve at all, in either group.
5.5 Digimizer®
5.5.1 Surface area and length
With regards to surface area the control group had an overall improvement of 44.85% and
showed a statistically significant change over time (p=0.000). Within the treatment group an
improvement of 48.43% was achieved and a statistically significant change occurred (p=0.000).
These results indicate that there was a change or improvement for both groups in surface area of
the scar. The Wilcoxon signed ranks test showed that the change for the control group occurred
between every follow up consultation (W0-W4, W0-W8, and W0-W12). The treatment group on

70
the other hand, was shown to improve or change the surface area of the scar only between W0-
W8 and W0-W12 . In majority of subjects the benefits of Allium cepa are only fully defined
from eight weeks of application and onwards (Draelos, 2008).
When measuring the length of the scar, the control group had an overall improvement of 17.19%
and there was a statistically significant change over time (p=0.023). The treatment group
improved by 10.78% and demonstrated a positive change over time (p=0.006). The change in the
length of the scar, for both the control and treatment group according to the Wilcoxon Signed
ranks test was shown to have occurred between week 8 and week 12 (W0-W8; W0-W12). There
was no change found from the start of the study until week four (W0-W4). A likelihood for this
outcome could be explained by Arem and Madden‟s tension theory, which was given validity
when the results of their study confirmed that a physical change of scar length could be achieved
through the application of local and topical mobilization (topical application of gel) (Arem and
Madden, 1976).
The Mann Whitney U test illustrated that in scar length and surface area there was no statistically
significant difference between the control and treatment group. Despite positive results there was
no statistically significant difference between hydrogel and Allium cepa with regards to scar
length and surface area.
5.5.2 Width
The control group showed statistically significant change (p=0.019), however there was no
percentage improvement with regards to mean value measurements (0%). Interestingly the
treatment group had no statistically significant change (p=0.115), but illustrated an overall
improvement of 17.587%. The Wilcoxon signed ranks test showed that there was no statistically
significant change between time frames for the control group (W0-W4, W0-W8 and W0-W12).
However the treatment group showed significant change between W0-W8, the rest was
insignificant. The Mann Whitney U test illustrated that there was no statistically significant
difference between the control and treatment group. Measuring scar width with Digimizer®
may
not be a reliable tool because if 0.1mm measuring accuracy is missed it could influence the
results and possible outcomes. Future studies may lend to a different measuring tool with regards
to scar width.
A scar is formed through a highly organized sequence of physiologic events. Many factors can
contribute to scar formation including ethnicity, genetic influences, anatomical region affected,

71
wound depth, injury type, the presence of infection and prolonged immune responses (Singer and
McClain, 2002). Despite these factors, 12% Allium cepa MT in hydrogel has shown to improve
scar stiffness, thickness and the overall opinion of participants better than hydrogel. However
scar colour and irregularity also demonstrated improvement with Allium cepa more than with
hydrogel.
5.6 Summary of Results
5.6.1 POSAS Observer scale
Relevant to parameters measured using the POSAS Observer Scale, each parameter measured
was found to yield significant improvement for each group, rendering both the treatment and
control interventions effective in improvement of appearance criteria as assessed by the observer.
With respect to average percentage improvements (Figure 5.1), only the measure related to
pigmentation was found to have a greater average degree of improvement for the control
(hydrogel) group versus the treatment (hydrogel and Allium cepa) group. All other parameters
demonstrated a greater degree of average percentage score improvement relevant to the
treatment group. There was, however, found to be no statistically significant difference between
the treatment and control group for any of these parameters.
Although there is no significant difference in the results, there is a distinguishable trend of
greater average percentage improvement for the treatment group (43.50%) compared to that of
the control group (34.89%).
Figure 5. 1 Percentage improvements in POSAS Observer Scale
0
10
20
30
40
50
60
Percentage improvements in POSAS Observer scale
Control Group
Treatment Group

72
5.6.2 POSAS Patient scale
In terms of measures associated with the POSAS Patient scale, participants in the control and
treatment group both experienced significant improvements in the stiffness, thickness,
irregularity and overall opinion related to their scarring (p<0.05). No improvement was
registered for the parameter of pain at the end of 12 weeks for either group. Neither group
experienced any significant improvement in itching, while the control group appeared to show
no improvement in colour of the scar (p=0.205) versus the treatment group which did (0.000),
however with no significant differences found between the two groups after 12 weeks.
According to Figure 5.2 the treatment group tends to show a greater average percentage score
improvement per parameter of the POSAS Patient scale. With the significant improvements
demonstrated between the two groups in stiffness, thickness and overall opinion, there is also a
distinguishable trend of greater average percentage improvement for the treatment group
(40.69%) compared to that of the control group (19.43%).
Figure 5.2 Percentage improvements in the POSAS Patient scale
5.6.3 Digimizer®
During measurement, statistically significant change occurred for both the treatment and control
group in length and surface area of the scar. Relative to these parameters the Wilcoxon signed
ranks test only started showing improvement from W0-W8 and W0-W12, and no change was
observed at the beginning of the study W0-W4.
0
10
20
30
40
50
60
70
Percentage improvements in POSAS Patient scale
Control Group
Treatment Group

73
Figure 5.3 represents the average percentage improvement for each Digimizer® parameter in
each group.
Figure 5.3 Digimizer® percentage improvements
0
10
20
30
40
50
60
Surface area Length Width
Percentage improvements for Digimizer®
Control group
Treatment group

74
CHAPTER SIX
CONCLUSION AND RECOMMENDATIONS
6.1 Conclusion
The study aimed to ascertain the effect of hydrogel medicated with Allium cepa mother tincture
(12%) on the appearance of CS scars. It was found that both hydrogel (control) and hydrogel
medicated with Allium cepa (12%) (treatment) were able to improve the general appearance of
scars in all parameters measured except for sensations of pain and itching. When compared to
the control hydrogel, Allium cepa (12%) appeared to significantly improve the patient‟s own
perception of scar stiffness (p=0.008), thickness (p=0.008) and overall opinion thereof
(p=0.036). Despite the lack of significant difference between groups, Allium cepa (12%) appears
to improve the vascularity, thickness, relief, pliability, surface area and colour of scars to a
greater extent than the control hydrogel and it is evident that more research over a longer period
of time is required.
Using the POSAS Observer scale it was determined that both the control and treatment groups
improved significantly in all measured parameters but that in all but one parameter
(pigmentation) the treatment group tended to show greater degrees of improvement than the
control by the end of the study. The average improvement of the treatment group as measured by
the observer for all parameters was however found not to be statistically different when
compared to that of the control group.
The POSAS Patient scale demonstrated a significant difference in improvement for both groups
with respect to stiffness, thickness and overall opinion (p<0.05). Colour of scars was found to
improve significantly for the treatment group but not for the control. In addition, the treatment
group was found to have a significantly higher improvement than the control group in all other
parameters of this scale.
Allium cepa (12%) was found not to have any effect on pain or itching of the scar, likely due
tolower levels of pain and itching experienced by participants at the onset of the study. . The
total surface area of the scars improved for both groups, however acknowledged inaccuracies
associated with this means of measurement relative to the actual size of the scars should be
noted.

75
Due to the hydrating, soothing and anti-microbial nature of hydrogel, improvement in the
appearance of CS was noted in this study for the control group. Illustrating that hydrogel on its
own has therapeutic effects on scar tissue. It is however evident that Allium cepa (12%) may
yield a safe additive option for the additional potential improvement of scars when combined
with hydrogel. The treatment had no unwanted side effects.
This study arrived at potentially useful findings that may be used in the construction of further
research studies and may lead to a body of knowledge for the homoeopathic MT, Allium cepa on
the appearance of CS.
6.2 Recommendations
Should a further study be conducted these are the following recommendations to be made as a
result of the experience of the study:
The duration of the study period should be extended given that in certain variables of this
study, statistically significant improvement only occurred by week 4. In order to ascertain a
more complete assessment of the effect of treatment a longer study period should be required
given the phases of wound healing and factors contributing to scarring and the time period
required to evaluate the effect of Allium cepa.
The sample size should be increased in order for the results to gain statistical significance in
terms of parametric analyses.
Due to the size of the scars, measurement procedures and tools need to be carefully
considered such that slight changes of measure by the researcher do not interfere with the
significance of results obtained.
It was noted that scar treatment is determined by various phases of wound healing and thus
the age of the scar play a contributing role. An age criteria of scars should be included in this
study, for example if it is a new dermal scar (12 weeks post-surgery) or an old scar (12 years
post-surgery).
Future researchers may want to limit or stratify their study sample groups according to
specific age groups, e.g. 20-30 years old or 31-40 years for standardisation for age of the
dermal scar and severity of the scar.

76
REFERENCES
Alster, T (2003). Laser scar revision: comparison study of 585-nm pulsed dye laser with and
without intralesional corticosteroids. Dermatology and Surgery; 29 (1); Pp. 25–29.
Alster T, Tanzi E, Lazarus M (2007). The use of laser photophermolysis for the treatment of
atrophic scars. Dermatology and Surgery; 33 (3); Pp. 295-299.
Arem AJ and Madden JW (1976). Effects of stress on healing wounds: I. Intermittent
noncyclical tension. Journal of Surgical Residence; 20 (93); Pp.102.
Ashcroft G and Ashworth JJ (2003). Potential role of estrogens in wound healing. American
Journal of Clinical Dermatology; 4 (11); Pp. 737-743.
Aziz, A (2010). The law of similar and potentization. Available at
http://www.aliclinic.com/2010/11thelawofsimilarsandpotentization Accessed: 30/01/2013
Baek YS, Ryu YB, Curtis-Long MJ, Ha TJ, Rengasamy R, Yang MS, Park KH (2009).
Tyrosinase inhibitory effects of 1,3-diphenylpropanes from Broussonetia kazinoki. Bioorganic
Medical Journal of Chemistry; 17; Pp. 35-41.
Baumann L and Spencer J (1999). The effects of topical vitamin E on the cosmetic appearance
of scars. Dermatology and Surgery; 25; Pp. 311-315.
Betrán AP, Merialdi M, Lauer JA, Bing-Shun W, Thomas J, Van Look P, Wagner M (2007).
Rates of caesarean section: analysis of global, regional and national estimates. Paediatric
Perinatal Epidemiology; 21 (2); Pp. 98-113.
Bloemen M, Gerven M, van der Wal M, Verghaegen P, Middelkoop E (2011). An objective
device for measuring surface roughness of skin and scars. Journal of the American Academy of
Dermatology; 64 (4); Pp. 105-107.
Bombaro KM, Engrav LH, Carrougher GJ, Wiechman SA, Faucher L, Costa BA, Heimbach
DM, Rivara FP, Honari S (2003). What is the prevalence of hypertrophic scarring following
burns? Burns; 29 (6) Pp. 299 -302.

77
Boots AW, Wilms LC, Swennen ELR, Kleinjans JCS, Bast A, Haenen GRMM (2008). In vitro
and ex vivo anti-inflammatory activity of quercetin in healthy volunteers. Nutrition; 24 (10);
Pp. 703–710.
Brannon H (2007). Skin Anatomy. Accessed 01/02/2015.
www.about.com: http://dermatology.about.com/cs/skinanatomy/a/anatomy.htm
Brown J and Bayat A (2009).Genetic Susceptibility to Raised Dermal Scarring. The British
Journal of Dermatology; 161 (1); Pp.8-18.
Burgess (2008).Topical vitamins. Journal of Drugs and Dermatology; 7; Pp. 2-6.
Campos A, Groth A, Branco A (2008). Curative opinion in clinical nutritional metabolic care.
Wound Repair and Regeneration; 11 (3); Pp.281-288.
Chadwick S, Heath R, Shah M (2012). Abnormal pigmentation within cutaneous scars: A
complication of wound healing. Indian Journal of Plastic Surgery; 45 (2) Pp.403-411.
Chang C and Ries W (2001). Nonoperative techniques for scar management and revision. Facial
Plastic Surgery; 17; Pp. 283-288.
Chanprapaph K, Tanrattanakorn S, Wattanakrai P, Wongkitisophon P, Vachiramon V (2012).
Effectiveness of onion extract gel on surgical scars in Asians. Dermatology Research and
Practice; 10 (3); Pp. 1-6.
Chapas A, Brightman L, Sukal S, Hale E, Daniel D, Bernstein L (2008). Successful treatment of
acneiform scarring with CO2 ablative fractional resurfacing. Surgery and Medicine; 40 (6); Pp.
381-386.
Chen X, Peng L, Gao J (2012). Novel topical drug delivery systems and their potential use in
scar treatment. Asian Journal of Pharmaceutical Sciences; 7 (3); Pp. 155-167.
Cho JW, Cho SY, Lee SR, Lee KS (2010). Onion extract and quercetin induce matrix
metalloproteinase-1 in vitro and in vivo. International Journal of Molecular Medicine; 25 (3);
Pp. 347-52.

78
Colledge N, Walker B, Ralston S (2010). Davidson’s Principles and Practice of Medicine. 21st
ed. Saunders Elsevier, London, Pp.1240, 1239, 1241.
Cotterilli J and Cunliffe W (1997). Suicide in dermatological patients, The British Journal of
Dermatology; 137 (2); Pp. 246-250.
Coursin D, Connery L, Ketzler T (2004). Perioperative diabetic and hyperglycemic management
issues. Critical Care Medicine; 32; Pp.116-125.
Day C, Barron P, Massyn N, Padarath A, English R (2011). District health barometer. Available
at: http://www.hst.org.za/publications/district-health-barometer-201011. Accessed: 5/03/2014.
Da Costa M, Campos AC, Coelho JC, de Barros A, Matsumoto HM (2003) Oral glutamine and
the healing of colonic anastomoses in rats. Journal of Parenteral and Enteral Nutrition; 27 (3);
Pp.182-185.
Draelos Z (2008). The ability of onion extract gel to improve the cosmetic appearance of
postsurgical scars. Journal of Cosmetic Dermatology; 7 (2); Pp. 101–104.
Draelos Z, Baunmann L, Fleischer A, Plaum S, Avaikain E, Hardas B (2012). A New Proprietary
Onion Extract Gel Improves the Appearance of New Scars. Journal of Clinical and Aesthetic
Dermatology; 5 (6); Pp.18-24.
Durai P, Thappa D, Kumari R, Malathi M (2012). Aging in Elderly: Chronological Versus
Photoaging. Indian Journal of Dermatology; 57(5); Pp. 343–352.
Dunkin CS, Pleat JM, Gillespie PH, Tyler MP, Roberts AH, McGrouther DA (2007). Scarring
occurs at a critical depth of skin injury: precise measurement in a graduated dermal scratch in
human volunteers. Plastic Reconstructive Surgery; 119 (7) Pp.1722-1732.
Eder J, Laccone F, Rohrbach M, Giunta C, Aumayr K, Reichel1 C, Trautinger F (2013). A
new COL3A1 mutation in Ehlers–Danlos syndrome type IV. Journal of Experimental
Dermatology; 22 (3); Pp.231-234.

79
Farage M, Miller K, Berardesca E, Maibach H (2009). Clinical implications of aging skin:
cutaneous disorders in the elderly. American Journal of Clinical Dermatology; 10 (2); Pp.73-86.
Gauglitz G, Korting C, Pavicic T, Ruzicka T, Jescke G (2011). Hypertrophic scarring and
keloids: pathomechanisms and current emerging treatment strategies. Molecular Medicine; 17
(2); Pp. 113-125.
Gibbons L, Belizan JM, Lauer JA (2012). Inequities in the use of caesarean section deliveries in
the world. American Journal of Obstetrics & Gynaecological; 206 (331); Pp.1-19.
Gold M, Foster T.D, Adair M.A, Burlison K, Lewis T (2001). Prevention of hypertrophic scars
and keloids by the prophylactic use of topical silicone gel sheets following a surgical procedure
in an office setting. Dermatology and Surgery; 27; Pp. 641-644.
Gulrez S, Al-Assaf S, Phillips G (2011). Hydrogels: Methods of preparation, characterisation
and applications. Progress in Molecular and Environmental Bioengineering - From Analysis and
Modeling to Technology Applications; 128 (6); Pp.118-125.
Hawkins H (2007). Pathophysiology of the burn scar. Total Burn Care. Saunders Elsevier,
Philadelphia, Pp. 608–619.
Henry G and Garner WL (2003). Inflammatory mediators in wound healing. Surgical Clinical
Journal of North America; 83; Pp. 483-507.
Hoare T and Kohane DS (2008). Hydrogels in drug delivery: Progress and challenges. Polymer;
49 (6); Pp. 199-200.
Hosnuter M, Payasli C, Isikdemir A, Tekerekoglu B (2007). The effects of onion extract on
hypertrophic and keloid scars. Journal of Wound Care; 16; Pp.251–254.
Hostner M, Payasli C, Isikdemir A, Tekerekoglu B (2013). The effects of onion extract on
hypertrophic and keloid scars. Journal of Wound Care; 16 (6); Pp 524.
Hill P (2006). Peels and peeling agents, Thomas Delmar Learning: New York, Pp. 2108.

80
Islam A and Ehsan A (2011). Comparison of suture material and technique of closure of
subcutaneous fat and skin in caesarean section. North American Journal of Medical Science; 3
(2); Pp. 85-88.
Jackson B and Shelton A (2001). Pilot Study Evaluating Topical Onion Extract as Treatment for
Postsurgical Scars. Dermatological surgery; 25 (4) Pp. 267–269.
Jenwitheesuk K, Surakunprapha P, Jenwitheesuk K, Kuptarnond C, Prathanee S, Intanoo W
(2012). Role of silicone derivative plus onion extract gel in presternal hypertrophic scar
protection: a prospective randomized, double blinded, controlled trial. International Wound
Journal; 9; Pp. 397–402.
Lee Y (2010). Combination Treatments and Classification of Scars. Journal of US-China
Medical Science; 8 (6); Pp. 321-334.
Leventhal D, Furr M, Reiter D (2006). Treatment of keloids and hypertrophic scars: a meta-
analysis and review of the literature. Archive of Facial Plastic Surgery; 8 (6); Pp. 362–368.
Martini F and Nath J (2009). Fundamentals of Anatomy and Physiology. 8th ed. San Fransisco:
Pearson. Pp. 176-177.
Mackeen AD, Berghella V, Larsen ML (2012). Techniques and materials for skin closure in
caesarean section. Cochrane Database Systemic Reviews; 14 (11); Pp.60-68.
Mathai M and Hofmeyr GJ (2007). Abdominal surgical incisions for caesarean section.
Cochrane Pregnancy and Childbirth Group. 3 (1); Pp. 2.
Meghan A and Barbul A (2006). Nutrition and Wound Healing. Plastic and Reconstructive
surgery.117 (75); Pp.425-585.
Midwood KS, Williams LV, Schwarzbaurer JE (2004). Tisse repair and the dynamics of the
extra-cellular matrix. The international journal of biochemical and cellular biology. 36 (6): pp.
1031-1037.

81
Moore K, Dalley A, Agur A (2010). Clinically Orientated Anatomy. Wolters Kluwer. 6th
ed.
Philadelphia. Pp.12.
Nast A, Eming S, Fluhr J (2012). German S2k guidelines for the therapy of pathological scars
(hypertrophic scars and keloids). Journal of Deutsche Dermatolology Gesellschaft; 10 (10); Pp.
747–762.
National Guidelines for Maternity care in South Africa. (2002). Department of Health. 2nd
Edition. Pp. 45.
Oh D and Phillips T (2006). Sex hormones and wound healing. WOUNDS a compendium of
clinical research and practice; 18 (1); Pp.8-15
Owen D (2007). Principle and Practices of Homoeopathy: The Therapeutic and Healing
Process. Washington: Elsevier . Pp. 226-228.
Pallant J (2007). SPSS Survival Manual: A step by step guide to data analysis SPSS for
windows. 3rd
edition. Berkshire: Open University press. Pp. 53-77.
Phan T, Lun I, Sun L (2003). Quercetin inhibits fibronectin production by keloid-derived
fibroblasts. Implication for the treatment of excessive scars. Journal of Dermatology & Science;
33 (3); pp. 192-194.
Porter R and Kaplan J (2011). The Merck Manual. 19th
edition. USA. Merck Sharp & Dohme
Corp. Pp. 3193-3194; p2678
Puzey G (2012). The use of pressure garments on hypertrophic scars. Journal of Tissue Viability;
12; Pp. 11-15.
Radek K, Kovacs E, DiPietro L (2007). Matrix proteolytic activity during wound healing:
modulation by acute ethanol exposure. Alcohol Clinical Experimental Research; 31 (6);
Pp.1045-1052.
Ralf, PU. (2007). About scars, scarring and treatment options. Blackwell Dermatology News; 8
(1) Pp.3.

82
Rwakyendela O and Buchmann E (2006). Which skin incision for caesarean section?
Experiences of patients and doctors at three South African public hospitals. South African
Journal of Obstetrics and Gynaecology; 12 (2); Pp. 77-80.
Ragoowansi R, Cornes PG, Moss AL, Glees JP (2003). Treatment of keloids by surgical excision
and immediate postoperative single-fraction radiotherapy. Plastic Reconstructive Surgery; 111
(6); Pp. 1853–1859.
Reish RG and Eriksson E (2008). Scar treatments: preclinical and clinical studies. American
Journal of Surgery; 206 (4); Pp. 719–730.
Sarabahi S and Tiwari K (2012). Principle and Practices of Wound Care. India: Journal of
Practoical Medical; Pp 31.
Saray Y and Gulee AT (2005). Treatment of Keloids and hypertrophic scars with dermogel
injections of bleomycin: a preliminary study. International Journal of Dermatology; 44; Pp. 777-
784.
Saulis A, Mogford J, Mustoe A (2002). Effect of Mederma on hypertrophic scarring in the
rabbit ear model. Journal of Plastic, Reconstructive & Aesthetic Surgery;110; Pp.177-183.
Singer A and Mcclain S (2002).Persistent wound infection delays epidermal maturation and
increases scarring in thermal burns. Wound Repair & Regeneration; 10 (6); Pp.372-7.
Slemp AE and Kirschner RE (2006). Keloids and scars: a review of keloids and scars, their
pathogenesis, risk factors, and management. Current Opinion in Paediatrics; 18 (4); Pp.396–
402.
Sund B (2000). New developments in wound care. PJB Publications, London; 6 Pp. 1–255.
Taylor SL (2008). Onion extract. Alternative treatment for scars.16 (6); Pp. 16-20

83
Truong P, Lee JC, Soer B, Gaul CA, Olivotto IA (2007). Reliability and validity testing of the
Patient and Observer Scar Assessment Scale in evaluating linear scars after breast cancer
surgery. Journal of Plastic Reconstructive Surgery; 119; Pp. 87–494.
Tsang V, Chen A, Cho L, Jadin K, Sah R, De Long S (2007). Fabrication of 3D hepatic tissues
by additive photopatterning of cellular hydrogels. FASEB; 21; Pp. 790-801.
Tziotzios C, Profyris C, Sterling J (2012). Cutaneous scarring: pathophysiology, molecular
mechanisms, and scar reduction therapeutics Part II. Strategies to reduce scar formation after
dermatologic procedures. Journal of American Academy of Dermatology; 66 (1); Pp. 13–24.
Ullman D (2007). The homoeopathic Revolution. North Atlantic book. California. Pp.24.
Van der Kar A, Corion L, Smeulders U, Draaijers M, van der Horst C, van Zuijlen P (2005).
Reliable and feasible evaluation of linear scars by the patient and observer scar assessment scale.
Journal of Plastic, Reconstructive & Aesthetic Surgery; 116; Pp. 514-522.
Van der Wal M, Tuinebreijer W, Bloemen M, Verhaegen P, Middelkoop E, van Zuijlen M
(2012). Rasch analysis of the Patient and Observer Scar Assessment Scale (POSAS) in burn
scars. Quality of Life Research; 21 (1); Pp. 13-23
Van Loey NE, Bremer M, Faber AW, Middelkoop, E., Nieuwenhuis, MK. (2007). Itching
following burns: epidemiology and predictors. British Journal of Dermatology; 158; Pp. 95–100.
Van Staden, J. (2014). STATKON. Email address: [email protected]. Auckland Park Campus,
University of Johannesburg, South Africa. Tel: 0115592851.
Vercelli S, Ferriero G, Sartorio F, Stissi V, Franchignoni (2009). How to assess postsurgical
scars: A review of outcome measures. Disability and Rehablitation; 31 (25); Pp. 2055-2063.
Viera M, Patel J, Konda S (2010). A comparative study evaluating the tolerability and efficacy
of two topical therapies for the treatment of keloids and hypertrophic scars. Journal of Drugs in
Dermatology; 9 (5); Pp. 514–518.

84
Widgerow A, Chait LA, Stals R, Stals P (2010). New innovations in scar management. Aesthetic
Plastic Surgergy; 24; Pp. 227-234.
World Health Organization (WHO). (2007). Appropriate technology for birth. Lancet; 85;
Pp.733-820.
Zacher A, Olarte M, Santosa D, Elliott D, Jones S (2013). A review and perspective of recent
bio-oil hydrotreating research. Green Chemistry; (16); Pp. 491-515.
Young VL and Hutchison J (2009). Insights into patient and clinician concerns about scar
appearance: semiquantitative structured surveys. Plastic Reconstructive Surgery. 124; Pp. 256–
265.
Zurada J, Kriegel D, Davis I (2006). Topical treatments of hypertrophic scars. Journal of
Amercian Academy of Dermatology; 55 (6); Pp. 15-80.

85
APPENDIX A
Advertisement
o Do you have a caesarean section scar that has been there for more than 8 weeks?
o Are you between the ages of 18-50?
If you answered YES to the above, then you may qualify to participate in a research study
being conducted by the Department of Homoeopathy at the University of Johannesburg
Health Centre.
The study is entiled:
“The efficacy of Allium cepa 12% hydrogel on caesarean section scars”
Ethical clearance number: HDC 01-66-2014
Researchers‟s name: Alicia Gerber
Contact number: 07102083515
DO YOU HAVE A
CAESAREAN SECTION SCAR?

86
APPENDIX B
Participant information form
Dear Participant
My name is Alicia Gerber. I am in my final year of my studies in homoeopathy at the University
of Johannesburg. A requirement for the completion of my Masters Degree in homoeopathy
(MTech Homoeopathy) is to conduct a research study. The purpose of the study is to determine
the efficacy of Allium cepa on the appearance of Caesarean section scars.
The aim of the study is to determine the efficacy of 12% (v/v) Allium cepa MT in a hydrogel
solution on the appearance of caesarean section scars for 12 weeks. The POSAS will be used to
analyse any improvement on the appearance of your caesarean scar together with digital
photographical evidence.
Allium cepa is a homoeopathic remedy prepared from the red onion bulb; research has shown a
possible positive effect of this remedy on the appearance of scars. Allium cepa will be prepared
homoeopathically, therefore there are no undesirable side effects known with its application.
I invite you to participate in my research study if you:
Are female;
Between the ages of 18-50 years;
Have a vertical or transverse surgical scar which was completed with absorbable suturing,
and
Are at least 8 weeks post-surgery.
You will not be able to participate if you:
Have a history of onion allergy;
Use any other topical treatments to the area;
Have general surgical complications such as high temperature (fever), pain, increased
perspiration, tiredness (fatigue) and signs of post-operative infections, and/or
Report of local surgical complications such as redness, heat, infection, sepsis, keloid scar
formation and strophic or hypertrophic scars.

87
Forty female participants will be divided into two groups of twenty each. The one group will
receive unmedicated hydrogel and the other group will receive hydrogel medicated with Allium
cepa MT. Either group will not be identified to you or the researcher before or during the time of
the study. You will therefore not know whether the homoeopathic remedy is incorporated into
the gel that you are using. We refer to this design as a double blinded study which ensures that
the data gathered by the researcher will not be biased. If you are in the control group and the
study has shown to be beneficial, you will also receive Allium cepa MT hydrogel.
This 12 week study will be conducted at the University of Johannesburg, Health Centre,
Doornfontein. At the first consultation (week 0) the information and consent form will be
explained and read to you, after the study is fully understood you will be requested to sign the
consent form. On the first consultation (week 0) a case taking form will also be completed by the
researcher, with measuring of Vital signs (Blood pressure, Pulse rate, Respiratory rate and
Temperature) together with a general examination and a quick questionnaire to assess the impact
of the scar on your life. Another form will be completed by both the researcher and you, called
the Patient and Observer Scar Assessment Scale (POSAS). This scale will measure the degree of
pain, itching, stiffness, thickness, regularity and colour experienced by you and signs like
pigmentation, thickness, pliability, surface area, relief and vascularity by the researcher. A
photograph will then be taken by the researcher of your scar; this will be stored electronically on
a programme called Digimizer® and used to analyse and compare study outcome. There will be
three follow-up appointments in the 12 week period; these will be at week 4, week 8 and week
12, at these consults you will also receive your 150ml Hydrogel containers with a 5ml
medicating spoon. 5ml of treatment needs to be applied twice a day for twelve weeks. At these
follow up appointments a brief physical exam will be done together with the completion of the
POSAS assessment scale and a photograph will be taken and loaded onto Digimizer®.
Directions for use
1. You are advised not to apply any other cream/lotion/oil/ointment to the treatment area, as it
could affect the outcome of the results, if so you will be excluded.
2. You should apply the gel on the demarcated treatment area twice a day for 12 weeks.
3. You are requested to keep the 150ml gel container lid closed after usage, out of sun exposure
and in a cool dark cupboard.
4. You should inform the researcher if any of the following occurs:

88
Unfavourable changes to the skin
Discomfort attributed to the gel.

89
APPENDIX C
Consent form
I, _________________________________________________, hereby confirm that I understand
and consent to the following (please tick):
1. Involvement in a research study and have no presumption about the result.
2. I will apply the gel as explained in the directions of use.
3. I am aware that my caesarean section scar may or may not show any improvement at the
end of the research study.
4. I am free to withdraw from the study at any time without prejudicing any treatment that is
required for existing or future medical conditions.
5. My caesarean scar may be physically measured and I hereby consent to photographs
being taken of my scars that will only include the borders of the abdomen which will be
contained within the periphery of the photograph. I understand that these photographs
will be stored appropriately, treated with the utmost confidentiality and be part of my
research participation record. I understand that all efforts will be made to conceal my
identity but that full confidentiality cannot be guaranteed.
6. I understand that I will be given an opportunity to view any photographs that will be used
for any publication at any time and can request changes or agree / disagree to their
publication.
7. I hereby give consent for the photographs to be used for (please initial):
Approved research purposes & publication [Initial:________]
This may involve the photographic images being used in the dissertation associated with
this research study or in subsequent medical publications, journals, textbooks, conference
material, e-publications and on the internet. Images will be seen by readers and
examiners of the dissertation including health professionals and researchers who use any
publications in their professional education. The images may be seen by the general
public. Images will not be used with identifying information such as name, however, full
confidentiality is not guaranteed.

90
By signing the form below you indicate that you are satisfied with the intention of the study and
that the researcher has explained all matters contained to you so that you are satisfied with the
process of the study. All data collected from you will be kept confidential and none of your
identifying data will be used in any publication related to this research. To maintain privacy, all
other documents apart from this one will be labelled using a participant number. If you are
uncertain about any aspect please feel free to discuss it with me or the supervisor (contact details
below).
____________________ ________________________
Participant Signature Date
I, the researcher, have fully explained the methods and purpose of the treatment in the study. I
will answer any questions that may arise during the course of the study to the best of my
abilities.
____________________ ________________________
Signature (Researcher) Date
Alicia Gerber – Phone: 0712083515
Supervisor: Dr Neil Gower - Phone: 0115596779
Participant Number: _________

91
APPENDIX D
Case taking form
Participant Number: Date:
Race: A B I W C Age:
Information sheet
Date of Surgery:
Type of incision:
Type of suturing:
Number of previous CS:
Scar Appearance:
Normal Hypertrophic Atrophic
History of onion allergy? Yes No
Physical examination
VITALS:
Blood pressure:
Heart rate:
Respiratory rate:
Temperature:
GENERAL
INSPECTION:
CAJCOLD C A J C O L D
Subjective quality of life assessment
Are you constantly conscious about your caesarean section scar? YES NO
Is the scar affecting your choice of your social activities? YES NO
Are you avoiding certain situations to prevent exposure of your
scar?
YES NO
Do you feel less confident about your body due to the scar? YES NO
Is the scar uncomfortable and preventing you from enjoying daily
activities?
YES NO
Does the scar affect your sex life? YES NO

92
APPENDIX E
POSAS Observer and Patient scale

93

94
APPENDIX F
STATKON statistics tables
1. POSAS Observer scale
1.1 Vascularity
Table F. 1 POSAS Observer scale vascularity mean values
Observer scale -Vascularity- consultation1
Mean Min Max Std.Dev
A 4.27 1 9 2.492
B 3.9 1 7 1.651
Observer scale -Vascularity- consultation 2
A 3.55 1 9 2.523
B 3.5 2 6 1.504
Observer scale -Vascularity- consultation 3
A 2.65 1 7 1.694
B 2.55 1 5 1.276
Observer scale -Vascularity- consultation 4
A 2.5 1 6 1.433
B 2.15 1 5 1.04
Table F. 2 POSAS Observer scale vascularity test for normality-Shapiro Wilk
Group Group
Sig.
Observer scale -Vascularity- consultation1 A .045
B .377
Observer scale -Vascularity- consultation 2 A .014
B .004
Observer scale -Vascularity- consultation 3 A .006
B .017
Observer scale -Vascularity- consultation 4 A .019
B .002
Table F. 3 POSAS Observer scale Vascularity Mann Whitney U test
Obs_Vas1
Observer
scale
Obs_Vas2
Observer
scale
Obs_Vas3
Observer
scale
Obs_Vas4
Observer
scale
Asymp.
Sig. (2-
tailed)
.858 .641 .900 .498

95
Table F. 4 POSAS Observer scale Vascularity Friedman test
A N 20
Chi-Square 29.975
df 3
Asymp. Sig. .000
B N 20
Chi-Square 36.939
df 3
Asymp. Sig. .000
Table F. 5 POSAS Observer scale vascularity Wilcoxon signed ranks test
Group Group W0-W4 W0-W8 W0-W12
A Z -2.684b -3.330
b -3.330
b
Asymp. Sig. (2-tailed) .007 .001 .001
B Z -1.358b -3.703
b -3.559
b
Asymp. Sig. (2-tailed) .174 .000 .000
1.2 Pigmentation
Table F. 6 POSAS Observer scale pigmentation Mean values
Observer scale -Pigmentation- consultation1
Mean Min Max Std.Dev
A 4.14 1 10 2.8
B 4 2 7 1.522
Observer scale -Pigmentation-consultation 2
A 3.35 1 9 2.641
B 3.45 1 6 1.538
Observer scale -Pigmentation-consultation 3
A 2.5 1 7 1.762
B 2.7 1 5 1.218
Observer scale -Pigmentation-consultation 4
A 2.3 1 6 1.652
B 2.2 1 5 1.056
Table F. 7 POSAS Observer scale pigmentation test for normality Shapiro Wilk test
Group Group
Sig.
Observer scale -Pigmentation- consultation1 A .008
B .065
Observer scale -Pigmentation- consultation 2 A .001
B .060
Observer scale -Pigmentation- consultation 3 A .002
B .062
Observer scale -Pigmentation- consultation 4 A .001
B .006

96
Table F. 8 POSAS Observer scale pigmentation Mann Whitney U test
Obs_Pig1
Observer
scale
Obs_Pig2
Observer
scale
Obs_Pig3
Observer
scale
Obs_Pig4
Observer
scale
Asymp.
Sig. (2-
tailed)
.540 .353 .331 .682
Table F. 9 POSAS Observer scale Pigmentation Friedman test
A N 20
Chi-Square 26.097
df 3
Asymp. Sig. .000
B N 20
Chi-Square 31.091
df 3
Asymp. Sig. .000
Table F. 10 POSAS Observer scale pigmentation Wilcoxon signed ranks test
Group Group W0-W4 W0-W8 W0-W12
A Z -2.694b -3.132
b -3.255
b
Asymp. Sig. (2-
tailed) .007 .002 .001
B Z -1.707b -3.345
b -3.671
b
Asymp. Sig. (2-
tailed) .088 .001 .000
1.3 Thickness
Table F. 11 POSAS Observer scale thickness mean values
Observer scale -Thickness- consultation1
Mean Min Max Std.Dev
A 4.36 1 10 2.871
B 4.15 2 8 1.663
Obs_Vas2 Observer scale -Thickness- consultation 2
A 3.75 1 9 2.653
B 3.6 2 6 1.465
Obs_Vas3 Observer scale -Thickness- consultation 3
A 3.3 1 9 2.577
B 2.85 2 6 1.089
Obs_Vas4 Observer scale -Thickness- consultation 4
A 3.2 1 9 2.587
B 2.45 1 6 1.191

97
Table F. 12 POSAS Observer scale thickness test for normality Shapiro Wilk test
Group Group
Sig.
Observer scale -Thickness- consultation1 A .002
B .024
Observer scale -Thickness- consultation 2 A .002
B .011
Observer scale-Thickness- consultation 3 A .002
B .000
Observer scale -Thickness- consultation 4 A .001
B .000
Table F. 13 POSAS Observer scale thickness Mann Whitney U test
Obs_Thick1
Observer scale
Obs_Thick2
Observer scale
Obs_Thick3
Observer scale
Obs_Thick4
Observer scale
Asymp. Sig.
(2-tailed) .599 .544 .615 .779
Table F. 14 POSAS Observer scale thickness Friedman test
A N 20
Chi-Square 24.239
df 3
Asymp. Sig. .000
B N 20
Chi-Square 41.408
df 3
Asymp. Sig. .000
Table F. 15 POSAS Observer scale thickness Wilcoxon signed ranks test
Group Group W0-W4 W0-W8 W0-W12
A Z -2.725b -3.331
b -3.179
b
Asymp. Sig. (2-tailed) .006 .001 .001
B Z -2.230b -3.621
b -3.893
b
Asymp. Sig. (2-tailed) .026 .000 .000

98
1.4 Relief
Table F. 16 POSAS Observer scale relief mean values
Observer scale -Relief- consultation1
Mean Min Max Std.Dev
A 4.32 2 10 2.662
B 3.95 2 10 1.791
Observer scale -Relief- consultation 2
A 3.75 1 10 2.693
B 3.65 2 9 1.814
Observer scale –Relief- consultation 3
A 3.15 1 10 2.54
B 2.9 1 8 1.518
Observer scale -Relief- consultation 4
A 3 1 9 2.428
B 2.3 1 7 1.49
Table F. 17 POSAS Observer scale relief test for normality Shapiro Wilk test
Group Group
Sig.
Observer scale -Relief- consultation1 A .000
B .001
Observer scale -Relief - consultation 2 A .001
B .002
Observer scale-Relief - consultation 3 A .000
B .001
Observer scale -Relief- consultation 4 A .000
B .000
Table F. 18 POSAS Observer scale relief Mann Whitney U test
Obs_Rel1
Observer
scale
Obs_Rel2
Observer
scale
Obs_Rel3
Observer
scale
Obs_Rel4
Observer
scale
Asymp.
Sig. (2-
tailed) .718 .560 .656 .449
Table F. 19 POSAS Observer scale Friedman test
A N 20
Chi-Square 32.980
df 3
Asymp. Sig. .000
B N 20
Chi-Square 39.735
df 3
Asymp. Sig. .000

99
Table F. 20 POSAS Observer scale Wilcoxon signed ranks test
Group Group W0-W4 W0-W8 W0-W12
A Z -2.970b -3.654
b -3.697
b
Asymp. Sig.
(2-tailed) .003 .000 .000
B Z -1.732b -3.231
b -3.912
b
Asymp. Sig.
(2-tailed) .083 .001 .000
1.5 Pliability
Table F. 21 POSAS Observer scale pliability mean values
Observer scale -Pliability- consultation1
Mean Min Max Std.Dev
A 4.45 2 10 2.483
B 4.55 2 10 1.932
Observer scale -Pliability- consultation 2
A 3.75 1 10 2.693
B 3.8 1 9 1.881
Observer scale -Pliability- consultation 3
A 3.1 1 10 2.573
B 3 1 8 1.686
Observer scale -Pliability- consultation 4
A 2.95 1 9 2.46
B 2.35 1 8 1.663
Table F. 22 POSAS Observer Scale pliability normality test Shapiro Wilk
Group Group
Sig.
Observer scale -Pliability- consultation1 A .003
B .001
Observer scale -Pliability- consultation 2 A .001
B .026
Observer scale-Pliability- consultation 3 A .000
B .004
Observer scale -Pliability- consultation 4 A .000
B .000
Table F. 23 POSAS Observer scale pliability Mann Whitney U test
Obs_Pliab1
Observer
scale
Obs_Pliab2
Observer
scale
Obs_Pliab3
Observer
scale
Obs_Pliab4
Observer
scale
Asymp.
Sig. (2-
tailed)
.452 .400 .561 .575
100
Table F. 24 POSAS Observer scale pliability Friedman test
A N 20
Chi-Square 33.090
df 3
Asymp. Sig. .000
B N 20
Chi-Square 41.180
df 3
Asymp. Sig. .000
Table F. 25 POSAS Observer scale pliability Wilcoxon signed ranks test
Group Group W0-W4 W0-W8 W0-W12
A Z -2.944b -3.450
b -3.580
b
Asymp.
Sig. (2-
tailed)
.003 .001 .000
B Z -2.585b -3.580
b -3.894
b
Asymp.
Sig. (2-
tailed)
.010 .000 .000
1.6 Surface area
Table F. 26 POSAS Observer scale surface area mean values
Observer scale -Surf- consultation1
Mean Min Max Std.Dev
A 4.23 1 10 2.743
B 4.8 2 10 2.419
Observer scale -Surf- consultation 2
A 3.55 1 10 2.819
B 4.3 1 9 2.473
Observer scale -Surf- consultation 3
A 3.2 1 10 2.505
B 3.2 1 8 1.989
Observer scale -Surf- consultation 4
A 3.05 1 9 2.481
B 2.8 1 8 1.824
101
Table F. 27 POSAS Observer scale surface area test for normality Shapiro Wilk test
Group Group
Sig.
Observer scale -Surf- consultation1 A .004
B .008
Observer scale -Surf- consultation 2 A .001
B .035
Observer scale-Surf- consultation 3 A .000
B .001
Observer scale -Surf- consultation 4 A .001
B .002
Table F. 28 POSAS Observer scale surface area Mann Whitney U test
Obs_Surf1
Observer
scale
Obs_Surf2
Observer
scale
Obs_Surf3
Observer
scale
Obs_Surf4
Observer
scale
Asymp.
Sig. (2-
tailed)
.323 .217 .716 .945
Table F. 28 POSAS Observer scale surface area Friedman test
A N 20
Chi-Square 18.714
df 3
Asymp. Sig. .000
B N 20
Chi-Square 38.098
df 3
Asymp. Sig. .000
Table F. 29 POSAS Observer scale surface area Wilcoxon signed ranks test
Group Group W0-W4 W0-W8 W0-W12
A Z -2.623b -2.793
b -3.092
b
Asymp.
Sig. (2-
tailed)
.009 .005 .002
B Z -2.140b -3.447
b -3.551
b
Asymp.
Sig. (2-
tailed)
.032 .001 .000

102
1.7 Overall opinion
Table F. 30 POSAS Observer scale Overall opinion mean values
Observer scale -Overall- consultation1
Mean Min Max Std.Dev
A 4.559 1 10 2.702
B 4.45 2 10 1.791
Observer scale -Overall consultation 2
A 3.75 1 9 2.552
B 3.85 2 9 1.694
Observer scale -Overall- consultation 3
A 3.35 1 9 2.346
B 3.1 1 8 1.619
Observer scale -Overall- consultation 4
A 3.25 1 9 2.381
B 2.45 1 6 1.234
Table F. 31 POSAS Observer scale overall opinion test for normality Shapiro Wilk
Group Group
Sig.
Observer scale -Overal- consultation1 A .009
B .004
Observer scale -Overal- consultation 2 A .001
B .006
Observer scale-Overal- consultation 3 A .001
B .009
Observer scale -Overal- consultation 4 A .001
B .001
Table F. 32 POSAS Observer scale overall opinion Mann Whitney U test
Obs_Over1
Observer
scale
Obs_Over2
Observer
scale
Obs_Over3
Observer
scale
Obs_Over4
Observer
scale
Asymp.
Sig. (2-
tailed)
.634 .334 .879 .397
Table F. 33 POSAS Observer scale overall opinion Wilcoxon signed ranks test
A N 20
Chi-Square 36.737
df 3
Asymp. Sig. .000
B N 20
Chi-Square 44.018
df 3
Asymp. Sig. .000

103
2. POSAS Patient scale
2.1 Pain
Table F. 34 POSAS Patient scale pain mean values
Pat_Pain1- consultation1
Mean Min Max Std.Dev
A 2.4 1 6 1.875
B 1.45 1 7 1.468
Pat_Pain2 -Overall consultation 2
A 2.45 1 6 1.638
B 1.85 1 9 2.033
Pat_Pain3consultation 3
A 2.4 1 8 2.088
B 1.5 1 5 1
Pat_Pain4- consultation 4
A 2.45 1 8 2.164
B 1.5 1 8 1.573
Table F. 35 POSAS Patient scale pain test for normality Shapiro Wilk
Group Group
Sig.
Pat_Pain1 Patient scale -Pain- consultation1 A .000
B .000
Pat_Pain2 Patient scale -Pain- consultation 2 A .000
B .000
Pat_Pain3 Patient scale -Pain- consultation 3 A .000
B .000
Pat_Pain4 Patient scale -Pain- consultation 4 A .000
B .000
Table F. 36 POSAS Patient scale pain Mann Whitney U test
Pat_Pain1
Patient
scale
Pat_Pain2
Patient
scale
Pat_Pain3
Patient
scale
Pat_Pain4
Patient
scale
Asymp.
Sig. (2-
tailed)
.037 .085 .266 .116
Table F. 37 POSAS Patient scale pain Friedman test
A N 20

104
Chi-Square .375
df 3
Asymp. Sig. .945
B N 20
Chi-Square 1.286
df 3
Asymp. Sig. .733
2.2 Itching
Table F. 38 POSAS Patient scale Itching mean values
Pat_Itch1- consultation1
Mean Min Max Std.Dev
A 3.6 1 10 3.218
B 2.25 1 10 2.425
Pat_Itch2 -Overall consultation 2
A 2.95 1 7 2.212
B 2.3 1 8 2.386
Pat_Itch3consultation 3
A 2.85 1 8 2.455
B 2.05 1 7 1.572
Pat_Itch4- consultation 4
A 2.9 1 8 2.553
B 1.85 1 7 1.843
Table F. 39 POSAS Patient scale Itching test for normality Shapiro Wilk
Table F. 40 POSAS Patient scale Mann Whitney U test
Pat_Itch1
Patient scale
Pat_Itch2
Patient scale
Pat_Itch3
Patient scale
Pat_Itch4
Patient scale
Asymp.
Sig. (2-
tailed)
.314 .328 .533 .218
Group Group
Sig.
Pat_Itch1 Patient scale -Itching- consultation1 A .000
B .000
Pat_Itch2 Patient scale -Itching- consultation 2 A .001
B .000
Pat_Itch3 Patient scale -Itching- consultation 3 A .000
B .000
Pat_Itch4 Patient scale -Itching- consultation 4 A .000
B .000

105
Table F. 41 POSAS Patient scale itching Friedman test
A N 20
Chi-Square 7.010
df 3
Asymp. Sig. .072
B N 20
Chi-Square 2.630
df 3
Asymp. Sig. .452
Table F. 42 POSAS Patient scale itching Wilcoxon signed ranks test
Group Group W0-W4 W0-W8 W0-W12
A Z -1.136b -2.007
b -1.711
b
Asymp.
Sig. (2-
tailed)
.256 .045 .087
B Z -.086c -.239
b -.933
b
Asymp.
Sig. (2-
tailed)
.931 .811 .351
2.3 Colour
Table F. 43 POSAS Patient scale colour mean values
Pat_Col1- consultation1
Mean Min Max Std.Dev
A 5.23 1 10 2.742
B 6.5 2 10 2.482
Pat_Col2 -consultation 2
A 4.45 1 8 2.259
B 5.15 1 8 1.843
Pat_Col3consultation 3
A 4.15 1 8 2.207
B 4.2 1 9 2.067
Pat_Col4- consultation 4
A 4.25 1 8 2.197
B 3.55 1 9 2.064
Table F. 44 POSAS Patient scale colour test for normality Shapiro Wilk test
Group Group
Sig.
Pat_Col1 Patient scale -Colour- consultation1 A .000
B .000
Pat_Col2 Patient scale -Colour- consultation 2 A .001
B .000
Pat_Col3 Patient scale -Colour- consultation 3 A .000
B .000

106
Pat_Col4 Patient scale -Colour- consultation 4 A .000
B .000
Table F. 45 POSAS Patient scale colour Mann Whitney U test
Pat_Col1
Patient
scale
Pat_Col2
Patient
scale
Pat_Col3
Patient
scale
Pat_Col4
Patient
scale
Asymp.
Sig. (2-
tailed)
.157 .279 .870 .302
Table F. 46 POSAS Patient scale colour Friedman test
A N 20
Chi-Square 4.579
df 3
Asymp. Sig. .205
B N 20
Chi-Square 31.817
df 3
Asymp. Sig. .000
Table F. 47 POSAS Patient scale colour Wilcoxon signed ranks test
Group Group W0-W4 W0-W8 W0-W12
A Z -1.512b -1.779
b -1.690
b
Asymp.
Sig. (2-
tailed)
.131 .075 .091
B Z -2.475b -3.132
b -3.678
b
Asymp.
Sig. (2-
tailed)
.013 .002 .000

107
2.4 Stiffness
Table F. 48 POSAS Patient scale stiffness mean values
Pat_Stiff1- consultation1
Mean Min Max Std.Dev
A 5.55 1 10 2.365
B 5.85 1 10 2.368
Pat_Stiff2 -consultation 2
A 4.95 1 8 2.259
B 4.15 1 8 2.11
Pat_Stiff3consultation 3
A 4.5 1 8 2.164
B 3.75 1 10 2.291
Pat_Stiffl4- consultation 4
A 4.55 1 8 2.35
B 2.6 1 6 1.392
Table F. 49 POSAS Patient scale stiffness test for normality Shapiro Wilk test
Group Group
Sig.
Pat_Stiff1 Patient scale -Stiffness- consultation1 A .547
B .536
Pat_Stiff2 Patient scale -Stiffness- consultation 2 A .089
B .227
Pat_Stiff3 Patient scale -Stiffness- consultation 3 A .223
B .021
Pat_Stiff4 Patient scale -Stiffness- consultation 4 A .109
B .036
Table F. 50 POSAS Patient scale stiffness Mann Whitney U test
Pat_Stiff1
Patient
scale
Pat_Stiff2
Patient
scale
Pat_Stiff3
Patient
scale
Pat_Stiff4
Patient
scale
Asymp.
Sig. (2-
tailed)
.601 .268 .184 .008
Table F. 51 POSAS Patient scale stiffness Friedman test
A N 20
Chi-Square 11.197
df 3
Asymp. Sig. .011
B N 20
Chi-Square 30.054
df 3
Asymp. Sig. .000

108
Table F. 52 POSAS Patient scale stiffness Wilcoxon signed ranks test
Group Group W0-W4 W0-W8 W0-W12
A Z -2.038b -2.447
b -2.553
b
Asymp.
Sig. (2-
tailed)
.042 .014 .011
B Z -2.521b -2.588
b -3.526
b
Asymp.
Sig. (2-
tailed)
.012 .010 .000
2.5 Thickness
Table F. 53 POSAS Patient scale thickness mean values
Pat_Thick1- consultation1
Mean Min Max Std.Dev
A 6.14 2 10 2.532
B 6.75 2 10 2.511
Pat_Thick2 -consultation 2
A 5.2 1 8 2.375
B 4.7 1 9 2.179
Pat_Thick3consultation 3
A 4.65 1 8 2.412
B 4.2 1 10 2.167
Pat_Thick4- consultation 4
A 4.85 1 9 2.56
B 2.7 1 6 1.418
Table F. 54 POSAS Patient scale thickness test for normality Shapiro Wilk
Group Group
Sig.
Pat_Thick1 Patient scale -Thickness-
consultation1
A .170
B .165
Pat_Thick2 Patient scale -Thickness-
consultation 2
A .034
B .839
Pat_Thick3 Patient scale -Thickness-
consultation 3
A .046
B .157
Pat_Thick4 Patient scale -Thickness-
consultation 4
A .192
B .028

109
Table F. 55 POSAS Patient scale thickness Mann Whitney U test
Pat_Thick1
Patient
scale
Pat_Thick2
Patient
scale
Pat_Thick3
Patient
scale
Pat_Thick4
Patient
scale
Asymp.
Sig. (2-
tailed)
.445 .405 .452 .008
Table F. 56 POSAS Patient scale thickness Friedman
A N 20
Chi-Square 16.921
df 3
Asymp. Sig. .001
B N 20
Chi-Square 33.468
df 3
Asymp. Sig. .000
Table F. 57 POSAS Patient scale thickness Wilcoxon signed ranks test
Group Group W0-W4 W0-W8 W0-W12
A Z -2.527b -3.034
b -2.700
b
Asymp.
Sig. (2-
tailed)
.012 .002 .007
B Z -3.194b -3.010
b -3.779
b
Asymp.
Sig. (2-
tailed)
.001 .003 .000
2.6 Regularity
Table F. 58 POSAS Patient scale regularity mean values
Pat_Reg1- consultation1
Mean Min Max Std.Dev
A 6.05 1 10 2.8201
B 6.5 1 10 2.743
Pat_Reg2 -consultation 2
A 5.05 1 8 2.502
B 4.7 1 9 2.452
Pat_Reg3consultation 3
A 4.45 1 8 2.373
B 4.4 1 9 2.088
Pat_Reg4- consultation 4
A 4.5 1 9 2.503
B 3.15 1 8 2.084
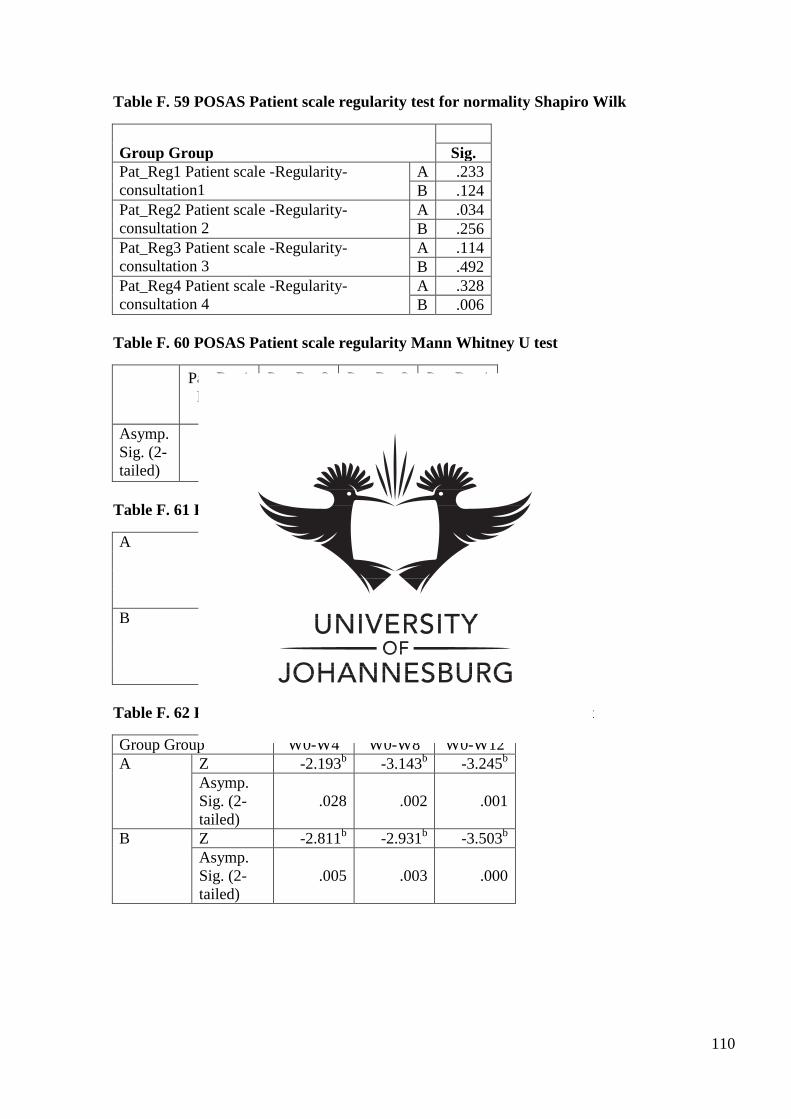
110
Table F. 59 POSAS Patient scale regularity test for normality Shapiro Wilk
Group Group
Sig.
Pat_Reg1 Patient scale -Regularity-
consultation1
A .233
B .124
Pat_Reg2 Patient scale -Regularity-
consultation 2
A .034
B .256
Pat_Reg3 Patient scale -Regularity-
consultation 3
A .114
B .492
Pat_Reg4 Patient scale -Regularity-
consultation 4
A .328
B .006
Table F. 60 POSAS Patient scale regularity Mann Whitney U test
Pat_Reg1
Patient
scale
Pat_Reg2
Patient
scale
Pat_Reg3
Patient
scale
Pat_Reg4
Patient
scale
Asymp.
Sig. (2-
tailed) .575 .604 .913 .080
Table F. 61 POSAS Patient scale Regularity
A N 20
Chi-Square 21.152
df 3
Asymp. Sig. .000
B N 20
Chi-Square 28.724
df 3
Asymp. Sig. .000
Table F. 62 POSAS Patient scale regularity Wilcoxon signed ranks test
Group Group W0-W4 W0-W8 W0-W12
A Z -2.193b -3.143
b -3.245
b
Asymp.
Sig. (2-
tailed)
.028 .002 .001
B Z -2.811b -2.931
b -3.503
b
Asymp.
Sig. (2-
tailed)
.005 .003 .000

111
2.7 Overall opinion
Table F. 63 POSAS Patient scale overall opinion mean values
Pat_Over1- consultation1
Mean Min Max Std.Dev
A 5.95 2 10 2.236
B 7.05 2 10 2.305
Pat_Over2 -consultation 2
A 4.85 1 8 1.927
B 5.6 2 10 2.088
Pat_Over3consultation 3
A 4.5 2 8 2.065
B 4.1 2 9 2.15
Pat_Over4- consultation 4
A 4.5 1 8 1.96
B 3.2 1 7 1.765
Table F. 64 POSAS Patient scale overall opinion test for normality Shapiro Wilk
Group Group
Sig.
Pat_Tot1 Patient scale -Total- consultation1 A .225
B .130
Pat_Tot2 Patient scale -Total- consultation 2 A .219
B .809
Pat_Tot3 Patient scale -Total- consultation 3 A .262
B .455
Pat_Tot4 Patient scale -Total- consultation 4 A .487
B .008
Table F. 65 POSAS Patient scale overall opinion Mann Whitney U test
Pat_Over1
Patient
scale
Pat_Over2
Patient
scale
Pat_Over3
Patient
scale
Pat_Over4
Patient
scale
Asymp.
Sig. (2-
tailed)
.168 .292 .495 .036
Table F. 66 POSAS Patient scale overall opinion Friedman test
A N 20
Chi-Square 24.902
df 3
Asymp. Sig. .000
B N 20
Chi-Square 45.568
df 3
Asymp. Sig. .000

112
Table F. 67 POSAS Patient scale overall opinion Wilcoxon signed ranks test
Group Group W0-W4 W0-W8 W0-W12
A Z -2.882b -3.331
b -3.461
b
Asymp.
Sig. (2-
tailed)
.004 .001 .001
B Z -2.908b -3.643
b -3.840
b
Asymp.
Sig. (2-
tailed)
.004 .000 .000
3. Digimizer®
3.1 Area of scar
Table F. 68 Digimizer area of scar mean values
Dig1- consultation1
Mean Min Max Std.Dev
A 4.227 1.138 7.773 1.812
B 5.667 2.036 17.474 3.690
Dig2 -consultation 2
A 3.274 0.780 9.832 2.126
B 5.818 1.814 37.968 8.3899
Dig3consultation 3
A 2.644 0.350 6.189 1.519
B 3.633 1.331 11.539 2.453
Dig4- consultation 4
A 2.331 0.166 6.855 1.730
B 2.922 0.982 8.453 2.040
Table F. 69 Digimizer test for normality Shapiro Wilk
Group Group
Sig.
Dig_consultation1 A .873
B .001
Dig_consultation 2 A .010
B .000
Dig_Total- consultation 3 A .344
B .001
Dig_Total- consultation 4 A .012
B .000

113
Table F. 70 Digimizer area of scar Mann Whitney U test
Dig_1 Dig_2 Dig_3 Dig_4
Asymp.
Sig. (2-
tailed)
.257 .402 .185 .229
Table F. 71 Digimizer area of scar Friedman test
A N 20
Chi-Square 29.040
df 3
Asymp. Sig. .000
B N 20
Chi-Square 39.420
df 3
Asymp. Sig. .000
Table F. 72 Digimizer area of scar Wilcoxon signed ranks test
Group Group W0-W4 W0-W8 W0-W12
A Z -2.501b -3.845
b -3.808
b
Asymp.
Sig. (2-
tailed)
.012 .000 .000
B Z -2.240b -3.883
b -3.920
b
Asymp.
Sig. (2-
tailed)
.025 .000 .000
3.2 Width of scar
Table F. 73 Digimizer width mean values
Dig1- consultation1
Mean Min Max Std.Dev
A 2.081 0.704 3.749 0.916
B 3.474 0.601 10.378 2.661
Dig2 -consultation 2
A 2.385 0.529 9.121 1.845
B 3.139 0.568 13.842 3.184
Dig3consultation 3
A 2.063 0.509 8.584 1.762
B 2.602 0.729 7.480 1.911
Dig4- consultation 4
A 2.190 0.455 12.693 2.642
B 2.863 0.459 8.490 2.422

114
Table F. 74 Digimizer width of scar test of normality Shapiro Wilk
Group Group
Sig.
Dig_consultation1 A .056
B .004
Dig_consultation 2 A .000
B .000
Dig_Total- consultation 3 A .000
B .003
Dig_Total- consultation 4 A .000
B .000
Table F. 75 Digimizer width of scar Mann Whitney U test
Dig_1 Dig_2 Dig_3 Dig_4
Asymp.
Sig. (2-
tailed)
.099 .449 .279 .168
Table F. 76 Digimizer width Friedman test
A N 20
Chi-Square 9.960
df 3
Asymp. Sig. .019
B N 20
Chi-Square 5.940
df 3
Asymp. Sig. .115
Table F. 77 Digimizer width Wilcoxon signed ranks test
Group Group W0-W4 W0-W8 W0-W12
A Z -.411b -2.277
c -2.091
c
Asymp.
Sig. (2-
tailed)
.681 .023 .037
B Z -1.381c -2.670
c -1.120
c
Asymp.
Sig. (2-
tailed)
.167 .008 .263

115
3.3 Length of scar
Table F. 78 Digimizer length mean values
Dig1- consultation1
Mean Min Max Std.Dev
A 11.875 6.785
16.655 2.556
B 13.622 8.766 22.222 4.139
Dig2 -consultation 2
A 10.820 0.834 18.906 3.816
B 13.290 7.836 38.719 6.756
Dig3consultation 3
A 10.253 2.218 13.158 2.352
B 12.319 8.696 22.313 3.478
Dig4- consultation 4
A 9.833 2.049 13.140 2.715
B 12.153 8.067
23.714 4.187
Table F. 79 Digimizer Length test for normality Shapiro Wilk
Group Group
Sig.
Dig_consultation1 A .252
B .006
Dig_consultation 2 A .035
B .000
Dig_consultation 3 A .001
B .001
Dig_ consultation 4 A .037
B .001
Table F. 80 Digimizer length Mann Whitney U test
Dig_1 Dig_2 Dig_3 Dig_4
Asymp.
Sig. (2-
tailed)
.279 .245 .123 .256

116
Table F. 81 Digimizer length Friedman test
A N 20
Chi-Square 9.540
df 3
Asymp. Sig. .023
B N 20
Chi-Square 12.540
df 3
Asymp. Sig. .006
Table F. 82 Digimizer length Wilcoxon Signed Ranks test
Group Group W0-W4 W0-W8 W0-W12
A Z -1.195b -2.912
b -2.651
b
Asymp.
Sig. (2-
tailed)
.232 .004 .008
B Z -1.717b -2.725
b -2.875
b
Asymp.
Sig. (2-
tailed)
.086 .006 .004
Copyright © 2022 FDOKUMEN