The Effect of a Small Ruminant Farm Operation and Sustainable Farm Practices: Soil Quality and...
12
Professional Agricultural Workers Journal Volume 2 Number 1 Professional Agricultural Workers Journal Article 3 9-4-2014 e Effect of a Small Ruminant Farm Operation and Sustainable Farm Practices: Soil Quality and Run-Off at the University Hickory Hill Farm, Delaware Gulnihal Ozbay Dr. [email protected] Akida J. Ferguson Delaware State University Raju Khatiwada University of Arizona Lathadevi K. Chintapenta Delaware State University Follow this and additional works at: hp://tuspubs.tuskegee.edu/pawj Part of the Agribusiness Commons , Agriculture Commons , Agronomy and Crop Sciences Commons , Animal Sciences Commons , Other Plant Sciences Commons , and the Water Resource Management Commons is Article is brought to you for free and open access by Tuskegee Scholarly Publications. It has been accepted for inclusion in Professional Agricultural Workers Journal by an authorized administrator of Tuskegee Scholarly Publications. For more information, please contact [email protected]. Recommended Citation Ozbay, Gulnihal Dr.; Ferguson, Akida J.; Khatiwada, Raju; and Chintapenta, Lathadevi K. (2014) "e Effect of a Small Ruminant Farm Operation and Sustainable Farm Practices: Soil Quality and Run-Off at the University Hickory Hill Farm, Delaware," Professional Agricultural Workers Journal: Vol. 2: No. 1, Article 3. Available at: hp://tuspubs.tuskegee.edu/pawj/vol2/iss1/3
Transcript of The Effect of a Small Ruminant Farm Operation and Sustainable Farm Practices: Soil Quality and...

Professional Agricultural Workers JournalVolume 2Number 1 Professional Agricultural Workers Journal Article 3
9-4-2014
The Effect of a Small Ruminant Farm Operationand Sustainable Farm Practices: Soil Quality andRun-Off at the University Hickory Hill Farm,DelawareGulnihal Ozbay [email protected]
Akida J. FergusonDelaware State University
Raju KhatiwadaUniversity of Arizona
Lathadevi K. ChintapentaDelaware State University
Follow this and additional works at: http://tuspubs.tuskegee.edu/pawjPart of the Agribusiness Commons, Agriculture Commons, Agronomy and Crop Sciences
Commons, Animal Sciences Commons, Other Plant Sciences Commons, and the Water ResourceManagement Commons
This Article is brought to you for free and open access by Tuskegee Scholarly Publications. It has been accepted for inclusion in ProfessionalAgricultural Workers Journal by an authorized administrator of Tuskegee Scholarly Publications. For more information, please [email protected].
Recommended CitationOzbay, Gulnihal Dr.; Ferguson, Akida J.; Khatiwada, Raju; and Chintapenta, Lathadevi K. (2014) "The Effect of a Small RuminantFarm Operation and Sustainable Farm Practices: Soil Quality and Run-Off at the University Hickory Hill Farm, Delaware," ProfessionalAgricultural Workers Journal: Vol. 2: No. 1, Article 3.Available at: http://tuspubs.tuskegee.edu/pawj/vol2/iss1/3
1
THE EFFECT OF A SMALL RUMINANT FARM OPERATION AND SUSTAINABLE
FARM PRACTICES: SOIL QUALITY AND RUN-OFF AT THE UNIVERSITY HICKORY HILL FARM, DELAWARE
*Gulnihal Ozbay1, Akida J. Ferguson1, Raju Khatiwada1,2, and Lathadevi K. Chintapenta1
1Delaware State University, Dover, DE and 2University of Arizona, Tucson, AZ *Email for lead author: [email protected]
Abstract
This project was designed to evaluate the effect of ruminant grazing practices at Hickory Hill Farm on the surrounding environment by measuring soil nutrients and runoff chemistry. Three pastures on the farm (Goat, Cattle and Control) were selected for soil sampling and nutrient analyses were recorded. Physical water quality parameters were conducted on the runoff collected from the farm after Hurricane Sandy. The sites with animal activity had higher levels of sulfate, phosphate, nitrate, Mehlich 3 phosphorus and conductivity when compared to control site. However, the control site had slightly higher pH and chloride levels. Nitrogen and phosphorous levels were very low at the control site when compared with the cattle and goat sites. Overall, soil quality was not found to be severely degraded from ruminant grazing activities. It will be vital to continue monitoring the farm to ensure its management practices are allowing optimal farm profitability and environmental health. Keywords: Farm Management, Nutrients, Ruminant Grazing, Run-off
Introduction Crop yields have been drastically improved by technological advancements and animal operation
efficiency; however, some farming practices continue to threaten the environment’s health. Thus, implementation of sustainable agricultural practices is necessary to protect soil, water, and air quality as well as to insure long-term farm productivity. Continuous crop production depletes soil nutrients and organic matter in the topsoil decreasing crop yields. Animal operations can also lead to overgrazing of pastures and excess nutrient accumulation in soil due to animal excrements (Kee, 2010). Therefore, improper management of organic and inorganic fertilizers can become detrimental to soil health. Unsound farm management practices can also threaten the profitability of a farm thereby affecting the economy of a largely agricultural state such as Delaware. Agriculture contributes nearly eight billion dollars to the economy of Delaware, and 39% of all land is used for farming (Kee, 2010). Agricultural land is the largest non-point source pollution, as it is inadequately located and the animal feeding operations allow overgrazing or neglect nutrient management practices. Agricultural operations such as ploughing, irrigation practices, incorrect use of pesticides and fertilizers also contribute to pollution (U.S. Environmental Protection Agency, 2005). Pollution leads to precipitation of nutrients which travels across the land carrying pesticides and nutrients from the runoff into local surface water. The state of Delaware occupies 1.1% of the total Chesapeake Bay watershed by acreage but contributes to 1.8% of the nitrogen and 1.9% of the phosphorus pollution (Chesapeake Executive Council, 2009). Nitrogen and phosphorus are the
2
limiting nutrients in water bodies; their overabundance can cause eutrophication and kill aquatic life. Farm runoff may be monitored and tested to insure that it does not contain any contaminants that will pollute a watershed.
Delaware State University is dedicated to use environmental friendly practices and strives to
manage and implement the practices at its Hickory Hill Farm. At the Hickory Hill Farm station cattle, sheep, and goat were rotated after several months from one pasture to another in order to reduce their impact on the land as one of the nutrient management practices. During the sampling period, animals were rotated into other pastures for some time, but were not crossed onto each other’s pastures. Animal excrement left on the pastures serves as a fertilizer and in areas where the excrement was accumulated may be scattered across the land for even distribution. When animals are held on concrete surfaces such as the corrals, their excrement is removed and used for fertilizer elsewhere. This project was designed to evaluate the effect of managed ruminant grazing on the chemistry of soil and runoff water at Hickory Hill Farm, Cheswold, Delaware. The primary objective for environmental testing was to ensure that no excess nutrients were present in the farm run-off and there was no significant damage to soil quality. Soil quality was not expected to be severely degraded at any site due to the small herd of animals present and active nutrient management practices. Our first null hypothesis in this study was that the soil nutrients conditions do not vary in different study seasons. Our second null hypothesis was that the soil nutrients conditions do not vary in different study sites. The purpose of this study is to improve soil health by continuously evaluating the management practices implemented in the farm.
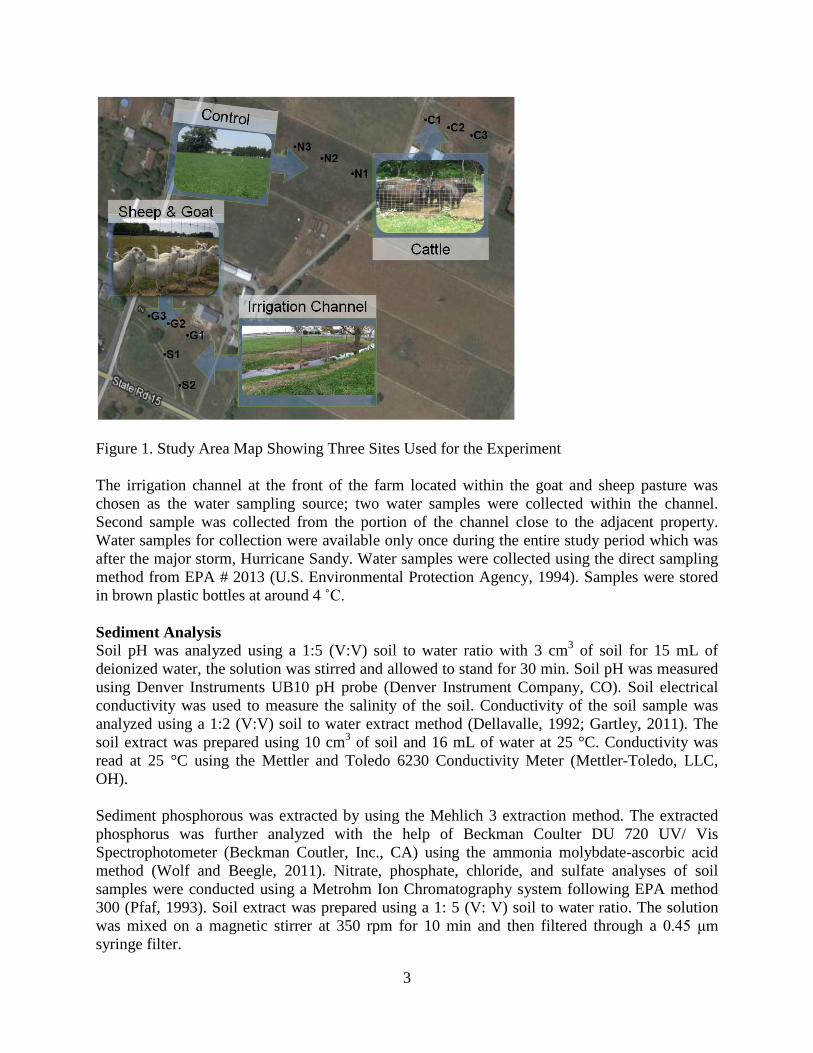
Materials and Methods Study Site Hickory Hill Farm is Delaware State University’s 77 acre ruminant farm located in Kent County, Delaware. It currently houses about 70 goats, 10 sheep and 40 registered Angus cattle. This farm is situated in the Leipsic River section of the Delaware Bay drainage watershed. Soil at this site is primarily Sassafras loam with a 2 to 5% slope. Landscape of Kent County is upland coastal plains with an elevation of 1.0 to 8.4 m and the mean annual precipitation is between 106.7 cm and 121.9 cm while the mean annual air temperature is 11.1 to 14.4 ˚C (USDA NRCS, 2012). Sample Collection Three pastures (Sites G, C, and N) on the farm were selected for soil sampling, site G was housed with goats and sheep whereas site C was housed with cattle. Site N did not have any animal activity and was used as the control. During the sampling times three soil samples were collected from separate locations within each of the three sites as shown in Figure 1. Samples were collected monthly from June to November, 2012. The topsoil was extracted using a small metal digging tool; about 15 cm diameter hole was created and enough soil was collected to fill the quart size plastic storage bag and sealed tightly. The samples were then dried in the greenhouse for 48 to 72 h and sieved to 2 mm. After sieving, the samples were stored in air tight plastic containers and kept in a dark at room temperature.
3
Figure 1. Study Area Map Showing Three Sites Used for the Experiment
The irrigation channel at the front of the farm located within the goat and sheep pasture was chosen as the water sampling source; two water samples were collected within the channel. Second sample was collected from the portion of the channel close to the adjacent property. Water samples for collection were available only once during the entire study period which was after the major storm, Hurricane Sandy. Water samples were collected using the direct sampling method from EPA # 2013 (U.S. Environmental Protection Agency, 1994). Samples were stored in brown plastic bottles at around 4 ˚C. Sediment Analysis Soil pH was analyzed using a 1:5 (V:V) soil to water ratio with 3 cm3 of soil for 15 mL of deionized water, the solution was stirred and allowed to stand for 30 min. Soil pH was measured using Denver Instruments UB10 pH probe (Denver Instrument Company, CO). Soil electrical conductivity was used to measure the salinity of the soil. Conductivity of the soil sample was analyzed using a 1:2 (V:V) soil to water extract method (Dellavalle, 1992; Gartley, 2011). The soil extract was prepared using 10 cm3 of soil and 16 mL of water at 25 °C. Conductivity was read at 25 °C using the Mettler and Toledo 6230 Conductivity Meter (Mettler-Toledo, LLC, OH). Sediment phosphorous was extracted by using the Mehlich 3 extraction method. The extracted phosphorus was further analyzed with the help of Beckman Coulter DU 720 UV/ Vis Spectrophotometer (Beckman Coutler, Inc., CA) using the ammonia molybdate-ascorbic acid method (Wolf and Beegle, 2011). Nitrate, phosphate, chloride, and sulfate analyses of soil samples were conducted using a Metrohm Ion Chromatography system following EPA method 300 (Pfaf, 1993). Soil extract was prepared using a 1: 5 (V: V) soil to water ratio. The solution was mixed on a magnetic stirrer at 350 rpm for 10 min and then filtered through a 0.45 μm syringe filter.

4
Water Sample Analysis Water samples were analyzed in triplicates and average values were used for data analysis. Total suspended solid analysis was conducted via the glass fiber filter method from (Boyd and Tucker, 1993). The pH of water samples was analyzed directly using Denver Instruments UB10 pH probe (Denver Instrument Company, CO). Conductivity was measured at 25 °C using the Mettler and Toledo 6230 Conductivity meter (Mettler-Toledo, LLC, OH). The nutrient parameters analyzed for water quality were reactive phosphorus, ammonia, nitrite, nitrate, total phosphorus and total nitrogen using HACH methods. The premeasured HACH reagent packets were used according to the HACH methods (8171, 8155, 8048, 8190, and 10071). Readings were measured using HACH Spectrophotometer DR/ 2500 and Digital Reactor Block 200 (HACH Company, CO, 2013). Statistical Analysis Statistical analyses were conducted on the sediment nutrient data and the water quality using the multivariate software program PRIMER (PRIMER-E Ltd, Plymouth, UK). Principal Component Analysis (PCA) was conducted to identify the environmental variables that have a major effect on the research sites. Null hypotheses generated for this study states that “soil chemistry would vary among the study seasons and sites based on ruminant grazing activities.”
Results and Discussion The physical and nutrient parameters of the farm soil and water samples studied were discussed in the previous section. The sites with animal activity have higher levels of sulfate, phosphate, nitrate, Mehlich 3 phosphorus and conductivity when compared to the control site, however, the control site had a higher pH and chloride concentration. According to the scale set by USDA SCS (1993), pH of the Hickory Hill Farm soil ranged from slightly acidic to slightly alkaline (5.5 to 7.6) (Figure 2).
Figure 2. Soil pH Analysis of Study Sites at Hickory Hill Farm, Cheswold, Delaware

5
The pH values for the goat and cattle sites were 5.5 to 6.3 and 6.7 to 7.7, respectively; whereas, the pH of the control site was around 6.4 to 7.4 and is periodically used to grow Alfalfa. According to USDA NRCS (2011) the pH for optimal yield of Alfalfa is 6.8 to 7.5. A pH range of 6 to 7 is generally considered as the most favorable pH for plant growth because nutrients are readily available for plant absorption. A pH range of 6.6 to 7.3 is favorable for microbial activities that contribute to the availability of nitrogen, sulfur, and phosphorus in soils. Soils with pH values below 5.5 generally have a low availability of calcium, magnesium, and phosphorus (USDA NRCS, 1998). Table 1 displays the results of the soil nutrient analyses. Electrical conductivity of the soil samples ranged from 0.06-0.36 mmhos/cm and samples with conductivity values less than 0.40 mmhos/cm were categorized as non-saline (Gartley, 2011). Table 1. Soil Nutrient Analysis of Study Sites at Hickory Hill Farm, Cheswold, Delaware
Month Conductivity M3P Chloride Nitrate Phosphate Sulfate Site pH (mmhos/cm) (mg/kg) (ppm) (ppm) (ppm) (ppm)
June Goat 6.31 0.07 22.92 302.14 0.27 1.73 35.51
Cattle 7.56 0.24 12.40 236.82 0.43 8.46 12.01 N (Control) 7.41 0.09 25.82 544.04 0.00 2.10 2.72
July Goat 5.98 0.16 26.60 3.48 17.18 18.32 91.03 Cattle 7.49 0.30 14.03 6.15 47.58 17.37 9.21 N (Control) 7.14 0.16 20.75 17.50 18.33 5.01 4.82
August Goat 5.50 0.19 17.37 5.80 59.24 14.77 84.59 Cattle 6.65 0.16 20.72 0.80 21.12 21.40 5.26 N (Control) 6.89 0.11 11.32 0.67 13.16 4.95 3.58
September Goat 5.72 0.13 24.10 2.92 33.62 23.93 48.93 Cattle 6.78 0.20 27.23 7.12 19.90 25.53 11.19 N (Control) 6.40 0.07 12.72 0.80 4.56 5.00 2.70
October Goat 5.74 0.08 24.57 2.56 7.84 17.76 39.16 Cattle 6.68 0.36 29.80 32.60 71.17 26.02 26.75 N (Control) 7.28 0.06 11.38 1.86 3.83 3.39 2.47
November Goat 6.52 0.09 20.43 1.80 7.46 6.79 9.47 Cattle 6.92 0.10 24.82 0.84 3.80 12.86 1.27 N (Control) 7.22 0.07 13.53 1.16 5.65 3.32 1.01
Soil phosphate was measured in the soluble orthophosphate form that is most accessible to plants and prone to leaching. Mehlich 3 Phosphorus levels at study sites ranged from 11.3 mg/kg to 29.8 mg/kg (Figure 3). Optimum phosphorus concentrations for wheat or Alfalfa crops is 21-25 mg/kg, phosphorous concentrations more than 31 mg/kg are considered to be very high, and 0 to 15 mg/kg are very low (Sawyer and Mallarino, 1999). Phosphorus moves from agricultural land to surface water bodies in sediment-bound and dissolved forms. Sediment-bound phosphorus is associated with minerals and organic matter. The Mehlich 3 Phosphorus test is suitable for extracting phosphorus and other elements in acidic and neutral soils (Elrashidi, 2001).

6
Figure 3. Soil Mehlich 3 Phosphorus Analysis of Study Sites at Hickory Hill Farm, Cheswold, Delaware The soil nitrate levels at our study sites ranged from 0 ppm to 71.2 ppm (Figure 4). Nitrate levels at cattle and goat sites were comparatively higher than the control site. Nitrogen can readily leach out of the root zone in the form of nitrate; typically 20 ppm of nitrate from topsoil is sufficient for good yield for high nitrogen crops. In soils where animal manure is applied as a fertilizer, nitrate levels at 14 ppm concentrations are sufficient for the crops. Soil nitrate values above 40 ppm in topsoil will turn off the ability of bacteria and legumes to fix nitrogen (USDA NRCS, 2011). Nitrogen fixation occurs through the roots of leguminous plants which contain root nodules that convert atmospheric nitrogen to ammonia (Chiras and Reganold, 2013). Alfalfa, a leguminous plant is grown at the control site because of its contribution to nitrogen cycling. According to the PCA of all the parameters monitored, phosphate and nitrate levels had the most effect on the study sites. PCA plot nutrient variables were compared with respect to seasons (Figure 5). The PCA plot was interpreted as considering the distance of the samples from Eigene vectors. When all the variables were considered in the analysis, Mehlich 3 phosphate and sulfate were on the positive scale of PC2. In the summer, sites with goats were closer to the M3 phosphate vector indicating that their levels were high, whereas in the fall, cattle sites were near the total phosphorous vector. The nitrite levels were high at the control site and low at the goat and cattle sites in the summer and fall. Therefore, considering all the vectors and their distance to the study sites based on seasons, the null hypothesis “the soil nutrients conditions do not vary in different study seasons” was rejected.

7
Figure 4. Soil Nitrate Analysis of Study Sites at Hickory Hill Farm
Figure 4. Nitrate Analysis of Study Sites at Hickory Hill Farm, Cheswold, Delaware
-4 -2 0 2 4PC1
-4
-2
0
2
4
PC2
seasonsummerfallGoat
Cattle
Control
Goat
Cattle
Control
Goat
CattleControl
Goat
CattleControl
Goat
CattleControl
Goat
Cattle
Control
pHConductivity (mmhos/cm)
M3P(mg/kg)
Flouride(ppm)
Chloride(ppm)
Nitrite(ppm)
Bromide(ppm)
Nitrate(ppm)Phosphate(ppm)
Sulfate(ppm)
Figure 5. Principle Component Analysis for Soil Nutrient Parameters
PCA plot compared the effect of nutrient variables between the study sites (Figure 6). The soil conductivity, nitrate and phosphate levels were maximum at the cattle site, moderate at the goat site, and low at the control site. Whereas, soil Mehlich 3 phosphorus and sulfate were high at the goat site, moderate at the cattle site, and low at the control site. The irrigation channel is closer to the goat site and this might have influenced the Mehlich 3 phosphorous levels at the goat site. Unexpectedly, the pH and chloride levels in the soil were high at the control sites than the cattle

8
and goat sites. From the PCA plot, differences in the nutrient conditions for the study sites were observed. Therefore, the null hypothesis which states: “the soil nutrients conditions do not vary in different study sites” was rejected.
Figure 6. Principle Component Analysis for Soil Nutrient Parameters
Water quality results were evaluated by comparing the results to standards set by Delaware’s Department of Natural Resources and Environmental Control (DNREC) (Table 2). The pH values for samples 1 and 2 were 6.8 and 7.4, respectively, and both lie within the pH range of 6.5-8.5 set by DNREC. Conductivity for both samples was 1.28 x 10⁻³ ppt and was considered to be desired, because salinity values less than 5 ppt are appropriate for a freshwater system. Total suspended solids for samples 1 and 2 were 31.67 mg/L and 17.33 mg/L, respectively. The threshold set by DNREC for total suspended solids is 20 mg/L and sample 2 was under the threshold, while sample 1 exceeded the threshold. Total phosphorus from samples 1 and 2 were 0.60 mg/L and 1.18 mg/L both exceeded the 0.2 mg/L threshold for total phosphorus. The total nitrogen for samples 1 and 2 were 1.40 mg/L and 4.37 mg/L, respectively. The threshold for total nitrogen is 3.0 mg/L. The threshold was exceeded by sample 2, but not by sample 1 (DNREC, 2006). DNREC has not set numerical thresholds for reactive phosphorus, nitrate, ammonia, or nitrite and so they were not separately discussed. These results show that the run off contains excess levels of phosphorous, nitrogen, and total suspended solids. As a result of limited run-off accumulation, water samples were collected only once after the storm. Efficient management practices have not been suggested due to lack of optimal number of water samples for analysis. Detailed studies would help to improve the farm management practices.

9
Table 2. Nutrient Analysis of Run-off Water at Hickory Hill Farm, Cheswold, Delaware
Samples pH Conductivity (ppt)
TSS (mg/L)
Reactive Phosphorous (mg/L)
Nitrate (mg/L)
Ammonia (mg/L)
Nitrite (mg/L)
Total P (mg/L)
Total N (mg/L)
1 6.84 1.28 x 10⁻³ 31.67 0.11 0.37 0.03 0.00 0.60 1.40 2 7.41 1.28 x 10⁻³ 17.33 0.35 2.00 0.10 0.01 1.18 4.37
Conclusion The absence of repeat data on water quality limits the ability to make any conclusion as to the overall impact of farm water run-off as a non-point source of pollution. Although the water samples had nitrogen and phosphorus levels more than the limits suggested by DNREC; they may not be considered as sources of pollution. This channel does not directly connect to a permanent body of water, and the run-off is being absorbed into the land and looses more of these nutrients before converging with a permanent water body. The two null hypotheses generated for this study were rejected because the soil nutrient quality differed with the type of sites studied and also with seasonal changes. The difference in nutrient quality may be due to the location of study sites and the grazing activities of the animals. Overall, soil quality was not found to be severely degraded from ruminant grazing activities. At the site containing goats, pH was around 6.0, which was slightly more acidic than preferred. Both the cattle and goat sites experienced peaks in nitrate (above 40 mg/L) at different study periods. The control site had an average nitrate level of 7.59 mg/L which is considered low and a Mehlich 3 phosphorus level of 15.9 mg/kg which is also very low. The crop (Alfalfa) activities at the control site are likely to be responsible for the nutrient depletion. Long-term soil quality monitoring would be necessary to conclusively link ruminant grazing or crop cultivation to any trend in soil chemistry. However, the soil quality evaluation revealed in the study that soil chemical nature is suitable for the long-term sustainability of the land.
Acknowledgements The authors would like to acknowledge Dr. Stacy Smith for her intellectual contribution in determining the key quality parameters for soil and water testing. We also thank Dr. Dahlia Jackson O’Brien for her assistance in implementation of our research. We would like to thank the Hickory Hill Farm crew for their assistance and support throughout our study. This research was funded by NSF SMILE HRD0928404 and USDA NRCS and USDA NIFA.
References Chesapeake Executive Council. (2009). “2011 Milestones for Reducing Nitrogen and Phosphorus.” http://www.chesapeakebay.net/publications/title/2011_milestones_to_reduc e_nitrogen_and_phosphorus) [Retrieved June 6, 2012]. Chiras, D.D., and J.P. Reganold (2013). Natural Resource Conservation: Management for a
Sustainable Future, 9th ed. Upper Saddle River, NJ: Prentice Hall. Dellavalle, N.B. (1992). “Determination of Specific Conductance in Supernatant 1:2 Soil: Water Solution.” In Handbook on Reference Methods for Soil Analysis. Athens, GA: Soil and
Plant Analysis Council, Inc.

10
DNREC. (2006). “Leipsic River Watershed Proposed TMDLs.” http://www.dnrec.delaware.gov/swc/wa/Documents/TMDL_TechnicalAnalysisDocume
nts/7_LeipsicTMDLAnalysis.pdf) [Retrieved January 17, 2013]. Elrashidi, M.A. (2001). Selection of an Appropriate Phosphorus Test for Soils. USDA NRCS,
National Soil Survey Center, Lincoln, NE. Gartley, K. (2011). “Recommended Soluble Salts Test.” In The North Coordinating Committee for Soil Testing, Recommended Soil Testing Procedures for the Northeastern United States. Northeastern Regional Publication No. 493 3rd Edition. http://extension.udel.edu/lawngarden/1864-2/lawn-garden/soil -health- composting/recommended-soil-testing-procedures-for-the-northeastern-united-states/
[Retrieved June 30, 2012]. HACH Company. (2013).“EPA Complaint Methods.” http://www.hach.com/epa [Retrieved
June 30, 2013]. Kee, E. (2010). “Delaware Agriculture.” http://www.nass.usda.gov/Statistics_by_State/Delaware/Publications/DE%20Ag%20Bro chure_web.pdf [Retrieved August 8, 2012]. Pfaff, J.D. (1993). EPA Method 300.0 Determination of Inorganic Anions by Ion Chromatography. Revision 2.1, Environmental Monitoring Systems Laboratory, Office of Research and Development, U.S. Environmental Protection Agency. Cincinnati, OH. Sawyer, J.E., and A.P. Mallarino. (1999). “Differentiating and Understanding the Mehlich 3,
Bray, and Olsen Soil Phosphorus Tests.” Paper Presented at the 19th Annual Crop Pest Management Short Course, University of Minnesota, St. Paul, MN.
U.S. Department of Agriculture Soil Conservation Service [USDA SCS] (1993). “Soil Survey Manual.” Soil Conservation Service. Handbook 18. http://soils.usda.gov/technical/manual/ [Retrieved June 30, 2012].
U.S. Department of Agriculture Natural Resources and Conservation Service [USDA NRCS]. (2011). “Soil Quality Indicators: Soil pH.” http://soils.usda.gov/sqi/assessment/files/pH_sq_chemical_indicator_sheet.pdf [Retrieved August 8, 2012].
U.S. Department of Agriculture, Natural Resource Conservation Service [USDA NRCS]. (1998). “Soil Quality Indicators: pH.”
http://www.nrcs.usda.gov/Internet/FSE_DOCUMENTS/nrcs142p2_052208.pdf [Retrieved January 17, 2013]. U.S. Department of Agriculture, Natural Resource Conservation Service [USDA NRCS]. (2012).
Soil Survey Geographic Database for Kent County, Delaware. USDA NRCS, Fort Worth, TX.
U.S. Environmental Protection Agency. (2005). “Agriculture Non-Point Source Fact Sheet.” http://water.epa.gov/polwaste/nps/agriculture_facts.cfm [Retrieved January 17, 2013]. U.S. Environmental Protection Agency Environmental Response Team. (1994). “Surface Water Sampling SOP.” http://www.ert.org/products/2013.PDF [Retrieved June 30, 2012].

11
Wolf, A., and D. Beegle. (2011). Recommended Soil Tests for Macro and Micronutrients.” In The North Coordinating Committee for Soil Testing. Recommended Soil Testing Procedures for the Northeastern United States. Northeastern Regional Publication No. 493 3rd Edition. http://extension.udel.edu/lawngarden/1864-2/lawn-garden/soil-health-composting/recommended-soil-testing-procedures-for-the-northeastern-united-states/ [Retrieved June 30, 2012].