The effect of 3D hydrogel scaffold modulus on osteoblast differentiation and mineralization revealed...
12
The effect of 3D hydrogel scaffold modulus on osteoblast differentiation and mineralization revealed by combinatorial screening Kaushik Chatterjee a, b , Sheng Lin-Gibson a , William E. Wallace a , Sapun H. Parekh a , Young Jong Lee a , Marcus T. Cicerone a , Marian F. Young b , Carl G. Simon Jr. a, * a Polymers Division, National Institute of Standards and Technology, Gaithersburg, MD, USA b Craniofacial and Skeletal Diseases Branch, National Institute of Dental and Craniofacial Research, National Institutes of Health, Bethesda, MD, USA article info Article history: Received 14 January 2010 Accepted 9 March 2010 Available online 7 April 2010 Keywords: Tissue engineering Hydrogels Osteoblast Combinatorial methods Matrix stiffness Graded tissues abstract Cells are known to sense and respond to the physical properties of their environment and those of tissue scaffolds. Optimizing these cellematerial interactions is critical in tissue engineering. In this work, a simple and inexpensive combinatorial platform was developed to rapidly screen three-dimensional (3D) tissue scaffolds and was applied to screen the effect of scaffold properties for tissue engineering of bone. Differentiation of osteoblasts was examined in poly(ethylene glycol) hydrogel gradients spanning a 30-fold range in compressive modulus (z10 kPa to z300 kPa). Results demonstrate that material properties (gel stiffness) of scaffolds can be leveraged to induce cell differentiation in 3D culture as an alternative to biochemical cues such as soluble supplements, immobilized biomolecules and vectors, which are often expensive, labile and potentially carcinogenic. Gel moduli of z225 kPa and higher enhanced osteogenesis. Furthermore, it is proposed that material-induced cell differentiation can be modulated to engineer seamless tissue interfaces between mineralized bone tissue and softer tissues such as ligaments and tendons. This work presents a combinatorial method to screen biological response to 3D hydrogel scaffolds that more closely mimics the 3D environment experienced by cells in vivo. Published by Elsevier Ltd. 1. Introduction Regenerative medicine offers hope to millions of patients suffering from a wide variety of debilitating diseases. Engineered tissues and organs can bridge the ever-increasing gap between the demand and availability of donor organs [1]. Over the past decade, billions of dollars have been invested in the development of tissue-engineered products and yet the industry is only just beginning to become profitable [2]. A key challenge in this field is identifying optimal scaffold properties that promote desired tissue regeneration [1]. Combinatorial methods applied successfully by the pharma- ceuticals industry for drug discovery are being adapted towards accelerating the pace of tissue engineering research [3e10]. These methods have typically utilized two-dimensional (2D) culture formats where cells were cultured on material surfaces. However, it has become well-accepted that cells cultured in a three-dimen- sional (3D) environment behave more like cells in native tissue than those cultured in 2D formats [11]. The objective of this work was to develop a simple combinatorial technique to enable rapid screening of 3D tissue scaffolds. The combinatorial platform was applied herein to systematically screen the effect of mechanical properties of poly(ethylene glycol) dimethacrylate (PEGDM) hydrogels on differentiation of encapsulated osteoblasts. Photopolymerizable poly(ethylene glycol) (PEG) hydrogels have emerged as promising 3D scaffolds for tissue engineering [12e17]. They have the advantage of being injectable for curing in situ [13]. Though the effects of PEG-based hydrogel chemical/physical properties (functionality, stiffness, and degradation) and biological properties (release of soluble proteins and growth factors, presence of cross-linked peptides or other bioactive moieties) on cell response have been demonstrated [12e17], these parameters have not been optimized to maximize tissue regeneration in 3D. The fabrication approach utilized in this work yielded hydrogel scaffold gradients containing a 30-fold range (z10 kPa to z300 kPa) in compressive modulus variation and contained oste- oblasts in situ. The MC3T3-E1 murine cell line, a classic osteoblast model, was used to study differentiation and mineralization after encapsulation in hydrogel gradients. The results herein demon- strate that scaffold stiffness can be used to direct osteogenesis in 3D culture towards generation of mineralized tissue. In addition, the hydrogel modulus gradients induced formation of mineralized tissue gradients. Gradients are prevalent in biology, and gradients in molecules, composition and properties exist at the * Corresponding author. Tel.: þ1 301 975 8574; fax: þ1 301 975 4977. E-mail address: [email protected] (C.G. Simon Jr.). Contents lists available at ScienceDirect Biomaterials journal homepage: www.elsevier.com/locate/biomaterials 0142-9612/$ e see front matter Published by Elsevier Ltd. doi:10.1016/j.biomaterials.2010.03.024 Biomaterials 31 (2010) 5051e5062
-
Upload
independent -
Category
Documents
-
view
1 -
download
0
Transcript of The effect of 3D hydrogel scaffold modulus on osteoblast differentiation and mineralization revealed...
lable at ScienceDirect
Biomaterials 31 (2010) 5051e5062
Contents lists avai
Biomaterials
journal homepage: www.elsevier .com/locate/biomater ia ls
The effect of 3D hydrogel scaffold modulus on osteoblast differentiation andmineralization revealed by combinatorial screening
Kaushik Chatterjee a,b, Sheng Lin-Gibson a, William E. Wallace a, Sapun H. Parekh a, Young Jong Lee a,Marcus T. Cicerone a, Marian F. Young b, Carl G. Simon Jr. a,*a Polymers Division, National Institute of Standards and Technology, Gaithersburg, MD, USAbCraniofacial and Skeletal Diseases Branch, National Institute of Dental and Craniofacial Research, National Institutes of Health, Bethesda, MD, USA
a r t i c l e i n f o
Article history:Received 14 January 2010Accepted 9 March 2010Available online 7 April 2010
Keywords:Tissue engineeringHydrogelsOsteoblastCombinatorial methodsMatrix stiffnessGraded tissues
* Corresponding author. Tel.: þ1 301 975 8574; faxE-mail address: [email protected] (C.G. Simon Jr
0142-9612/$ e see front matter Published by Elsevierdoi:10.1016/j.biomaterials.2010.03.024
a b s t r a c t
Cells are known to sense and respond to the physical properties of their environment and those of tissuescaffolds. Optimizing these cellematerial interactions is critical in tissue engineering. In this work,a simple and inexpensive combinatorial platform was developed to rapidly screen three-dimensional(3D) tissue scaffolds and was applied to screen the effect of scaffold properties for tissue engineering ofbone. Differentiation of osteoblasts was examined in poly(ethylene glycol) hydrogel gradients spanninga 30-fold range in compressive modulus (z10 kPa to z300 kPa). Results demonstrate that materialproperties (gel stiffness) of scaffolds can be leveraged to induce cell differentiation in 3D culture as analternative to biochemical cues such as soluble supplements, immobilized biomolecules and vectors,which are often expensive, labile and potentially carcinogenic. Gel moduli of z225 kPa and higherenhanced osteogenesis. Furthermore, it is proposed that material-induced cell differentiation can bemodulated to engineer seamless tissue interfaces between mineralized bone tissue and softer tissuessuch as ligaments and tendons. This work presents a combinatorial method to screen biological responseto 3D hydrogel scaffolds that more closely mimics the 3D environment experienced by cells in vivo.
Published by Elsevier Ltd.
1. Introduction
Regenerativemedicineoffershope tomillionsofpatients sufferingfrom a wide variety of debilitating diseases. Engineered tissues andorgans can bridge the ever-increasing gap between the demand andavailability of donor organs [1]. Over the past decade, billions ofdollars have been invested in the development of tissue-engineeredproducts and yet the industry is only just beginning to becomeprofitable [2]. A key challenge in this field is identifying optimalscaffold properties that promote desired tissue regeneration [1].
Combinatorial methods applied successfully by the pharma-ceuticals industry for drug discovery are being adapted towardsaccelerating the pace of tissue engineering research [3e10]. Thesemethods have typically utilized two-dimensional (2D) cultureformats where cells were cultured onmaterial surfaces. However, ithas become well-accepted that cells cultured in a three-dimen-sional (3D) environment behave more like cells in native tissuethan those cultured in 2D formats [11]. The objective of this workwas to develop a simple combinatorial technique to enable rapidscreening of 3D tissue scaffolds. The combinatorial platform was
: þ1 301 975 4977..).
Ltd.
applied herein to systematically screen the effect of mechanicalproperties of poly(ethylene glycol) dimethacrylate (PEGDM)hydrogels on differentiation of encapsulated osteoblasts.
Photopolymerizable poly(ethylene glycol) (PEG) hydrogels haveemerged as promising 3D scaffolds for tissue engineering [12e17].They have the advantage of being injectable for curing in situ [13].Though the effects of PEG-based hydrogel chemical/physicalproperties (functionality, stiffness, and degradation) and biologicalproperties (release of soluble proteins and growth factors, presenceof cross-linked peptides or other bioactive moieties) on cellresponse have been demonstrated [12e17], these parameters havenot been optimized to maximize tissue regeneration in 3D.
The fabrication approach utilized in this work yielded hydrogelscaffold gradients containing a 30-fold range (z10 kPa toz300 kPa) in compressive modulus variation and contained oste-oblasts in situ. The MC3T3-E1 murine cell line, a classic osteoblastmodel, was used to study differentiation and mineralization afterencapsulation in hydrogel gradients. The results herein demon-strate that scaffold stiffness can be used to direct osteogenesis in 3Dculture towards generation of mineralized tissue.
In addition, the hydrogel modulus gradients induced formationof mineralized tissue gradients. Gradients are prevalent in biology,and gradients in molecules, composition and properties exist at the
K. Chatterjee et al. / Biomaterials 31 (2010) 5051e50625052
interfacial regions of many tissues such as ligaments [18], teeth [19]and intestine [20]. During organismal development, morphogengradients are a primary mechanism used to drive pattern formationand organogenesis [21]. Thus, approaches for engineering gradedtissues are critical in regenerative medicine. The mineralizationgradients presented herein are unique because they were fabri-cated from a single material (PEGDM), did not require the additionof osteogenic supplements, were fabricated with osteoblasts in situ,were induced by varying only a material property (compressivemodulus) and did not require expensive, labile or potentiallycarcinogenic factors (peptides, proteins, growth factors, vectors)[22]. Furthermore, mineralization gradients obtained frommodulus gradients in this study offer an approach for engineeringseamless tissue interfaces for integration of hard and soft tissues asis found in ligaments and tendons.
2. Materials and methods
2.1. Preparation and characterization of poly(ethylene glycol) dimethacrylate
PEGDM was prepared following a previously-reported microwave-assistedreaction [17]. Briefly, PEG (MW ¼ relative molecular mass 4000 g/mol, Sigma-eAldrich) was reacted with 10-fold molar excess of methacrylic anhydride (Sig-maeAldrich) in a standardmicrowave (GE 1100W, atmaximumpower) in five 1minintervals interspersed with 1 min cooling periods. The solid was dissolved ina minimal volume of methanol (Mallinckrodt Chemicals) and precipitated in excessether (SigmaeAldrich) in order to separate unreacted components. The precipitatewas collected by vacuum filtration. Approximately 10 g of PEGDM monomer wasused for the work described in the current report.
The functionalized product was characterized by matrix-assisted laser deposi-tion/ionization time-of-flight mass spectrometry (MALDI-ToF MS) performed ona Bruker REFLEX II in reflectron mode using two-stage ion extraction [17]. Ablationwas performed with a nitrogen gas laser having a 337 nm wavelength. The ionacceleration used was 25 kV. The precipitated product (6 mg) was dissolved in 1 mLof a water:acetonitrile solution (2:1 by volume) with approximately 0.1% by volumeof trifluoroacetic acid added. The MALDI matrix, all-trans retinoic acid (5 mg), wasdissolved in 1 mL tetrahydrofuran. The cationizing agent, sodium trifluoroacetate(6 mg), was dissolved in 1 mL of the water:acetonitrile solution. These solutionswere mixed in a 10:25:10 ratio. This mixture was electrosprayed onto the MALDItarget at 5 kV with a flow rate of 5 mL/min and at distance of approximately 2 cmthrough a steel needle with an inner diameter of 0.2 mm. The spectrum presented isthe sum of 250 discrete laser shots (Fig. 1). The digitization was at 1 ns intervals.
2.2. Cell culture
The MC3T3-E1 cell line was selected to characterize the combinatorial platformbecause it is a well-characterized murine osteoblast cell line [23] that has been usedextensively as a model for osteoblasts yielding a detailed understanding of itsbehavior in vitro [24]. During culture, MC3T3-E1 cells follow well-characterizedstages of osteogenesis [25] where they first adhere and proliferate, followed bydifferentiation and mineralization [26]. Thus, MC3T3-E1 cells are an establishedmodel for osteoblasts that can be used to study bone tissue generation in vitro.
500
600
700PEGDM
PEGMM
200
300
4004000 4050 4100
0
100
3000 3500 4000 4500 5000
Io
n in
te
ns
ity
(A
rb
itra
ry
U
nits
)
Mass (g/mol)
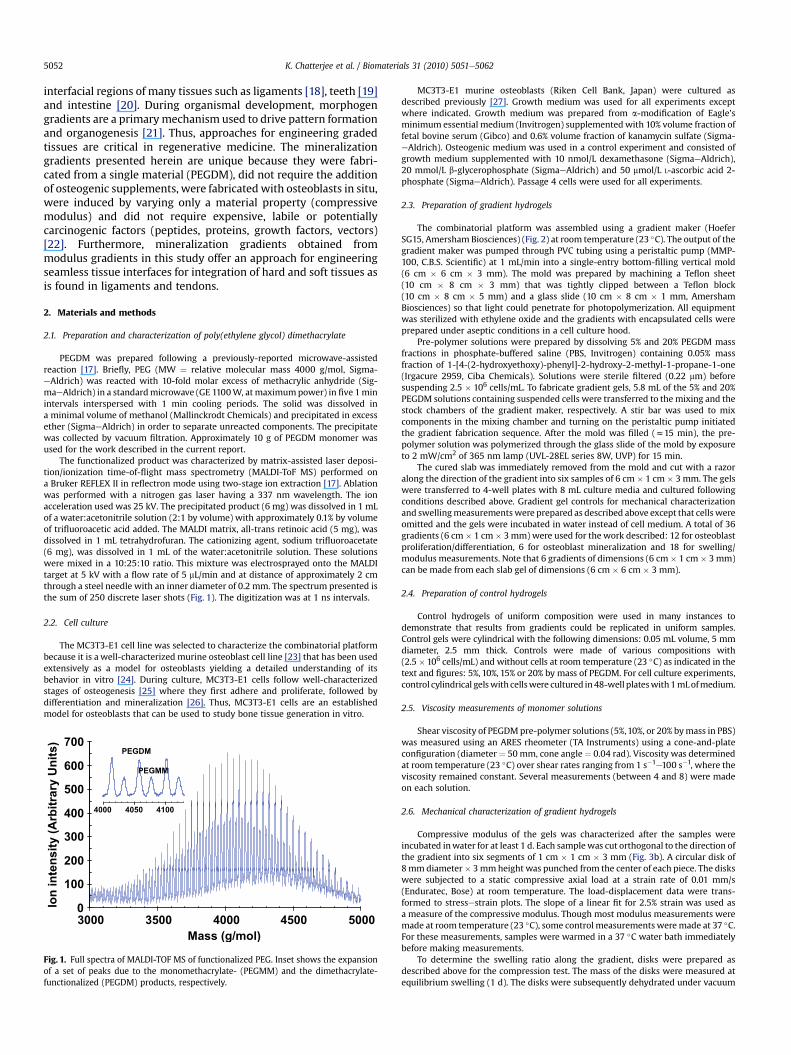
Fig. 1. Full spectra of MALDI-TOF MS of functionalized PEG. Inset shows the expansionof a set of peaks due to the monomethacrylate- (PEGMM) and the dimethacrylate-functionalized (PEGDM) products, respectively.
MC3T3-E1 murine osteoblasts (Riken Cell Bank, Japan) were cultured asdescribed previously [27]. Growth medium was used for all experiments exceptwhere indicated. Growth medium was prepared from a-modification of Eagle’sminimum essential medium (Invitrogen) supplementedwith 10% volume fraction offetal bovine serum (Gibco) and 0.6% volume fraction of kanamycin sulfate (Sigma-eAldrich). Osteogenic medium was used in a control experiment and consisted ofgrowth medium supplemented with 10 nmol/L dexamethasone (SigmaeAldrich),20 mmol/L b-glycerophosphate (SigmaeAldrich) and 50 mmol/L L-ascorbic acid 2-phosphate (SigmaeAldrich). Passage 4 cells were used for all experiments.
2.3. Preparation of gradient hydrogels
The combinatorial platform was assembled using a gradient maker (HoeferSG15, Amersham Biosciences) (Fig. 2) at room temperature (23 �C). The output of thegradient maker was pumped through PVC tubing using a peristaltic pump (MMP-100, C.B.S. Scientific) at 1 mL/min into a single-entry bottom-filling vertical mold(6 cm � 6 cm � 3 mm). The mold was prepared by machining a Teflon sheet(10 cm � 8 cm � 3 mm) that was tightly clipped between a Teflon block(10 cm � 8 cm � 5 mm) and a glass slide (10 cm � 8 cm � 1 mm, AmershamBiosciences) so that light could penetrate for photopolymerization. All equipmentwas sterilized with ethylene oxide and the gradients with encapsulated cells wereprepared under aseptic conditions in a cell culture hood.
Pre-polymer solutions were prepared by dissolving 5% and 20% PEGDM massfractions in phosphate-buffered saline (PBS, Invitrogen) containing 0.05% massfraction of 1-[4-(2-hydroxyethoxy)-phenyl]-2-hydroxy-2-methyl-1-propane-1-one(Irgacure 2959, Ciba Chemicals). Solutions were sterile filtered (0.22 mm) beforesuspending 2.5 � 106 cells/mL. To fabricate gradient gels, 5.8 mL of the 5% and 20%PEGDM solutions containing suspended cells were transferred to the mixing and thestock chambers of the gradient maker, respectively. A stir bar was used to mixcomponents in the mixing chamber and turning on the peristaltic pump initiatedthe gradient fabrication sequence. After the mold was filled (z15 min), the pre-polymer solution was polymerized through the glass slide of the mold by exposureto 2 mW/cm2 of 365 nm lamp (UVL-28EL series 8W, UVP) for 15 min.
The cured slab was immediately removed from the mold and cut with a razoralong the direction of the gradient into six samples of 6 cm � 1 cm � 3mm. The gelswere transferred to 4-well plates with 8 mL culture media and cultured followingconditions described above. Gradient gel controls for mechanical characterizationand swellingmeasurementswere prepared as described above except that cells wereomitted and the gels were incubated in water instead of cell medium. A total of 36gradients (6 cm� 1 cm� 3mm) were used for the work described: 12 for osteoblastproliferation/differentiation, 6 for osteoblast mineralization and 18 for swelling/modulus measurements. Note that 6 gradients of dimensions (6 cm� 1 cm � 3mm)can be made from each slab gel of dimensions (6 cm � 6 cm � 3 mm).
2.4. Preparation of control hydrogels
Control hydrogels of uniform composition were used in many instances todemonstrate that results from gradients could be replicated in uniform samples.Control gels were cylindrical with the following dimensions: 0.05 mL volume, 5 mmdiameter, 2.5 mm thick. Controls were made of various compositions with(2.5� 106 cells/mL) and without cells at room temperature (23 �C) as indicated in thetext and figures: 5%, 10%, 15% or 20% by mass of PEGDM. For cell culture experiments,control cylindrical gelswith cellswere cultured in48-well plateswith1mLofmedium.
2.5. Viscosity measurements of monomer solutions
Shear viscosity of PEGDMpre-polymer solutions (5%,10%, or 20% bymass in PBS)was measured using an ARES rheometer (TA Instruments) using a cone-and-plateconfiguration (diameter¼ 50 mm, cone angle¼ 0.04 rad). Viscosity was determinedat room temperature (23 �C) over shear rates ranging from 1 s�1e100 s�1, where theviscosity remained constant. Several measurements (between 4 and 8) were madeon each solution.
2.6. Mechanical characterization of gradient hydrogels
Compressive modulus of the gels was characterized after the samples wereincubated inwater for at least 1 d. Each samplewas cut orthogonal to the direction ofthe gradient into six segments of 1 cm � 1 cm � 3 mm (Fig. 3b). A circular disk of8mm diameter� 3mmheight was punched from the center of each piece. The diskswere subjected to a static compressive axial load at a strain rate of 0.01 mm/s(Enduratec, Bose) at room temperature. The load-displacement data were trans-formed to stressestrain plots. The slope of a linear fit for 2.5% strain was used asa measure of the compressive modulus. Though most modulus measurements weremade at room temperature (23 �C), some control measurements weremade at 37 �C.For these measurements, samples were warmed in a 37 �C water bath immediatelybefore making measurements.
To determine the swelling ratio along the gradient, disks were prepared asdescribed above for the compression test. The mass of the disks were measured atequilibrium swelling (1 d). The disks were subsequently dehydrated under vacuum
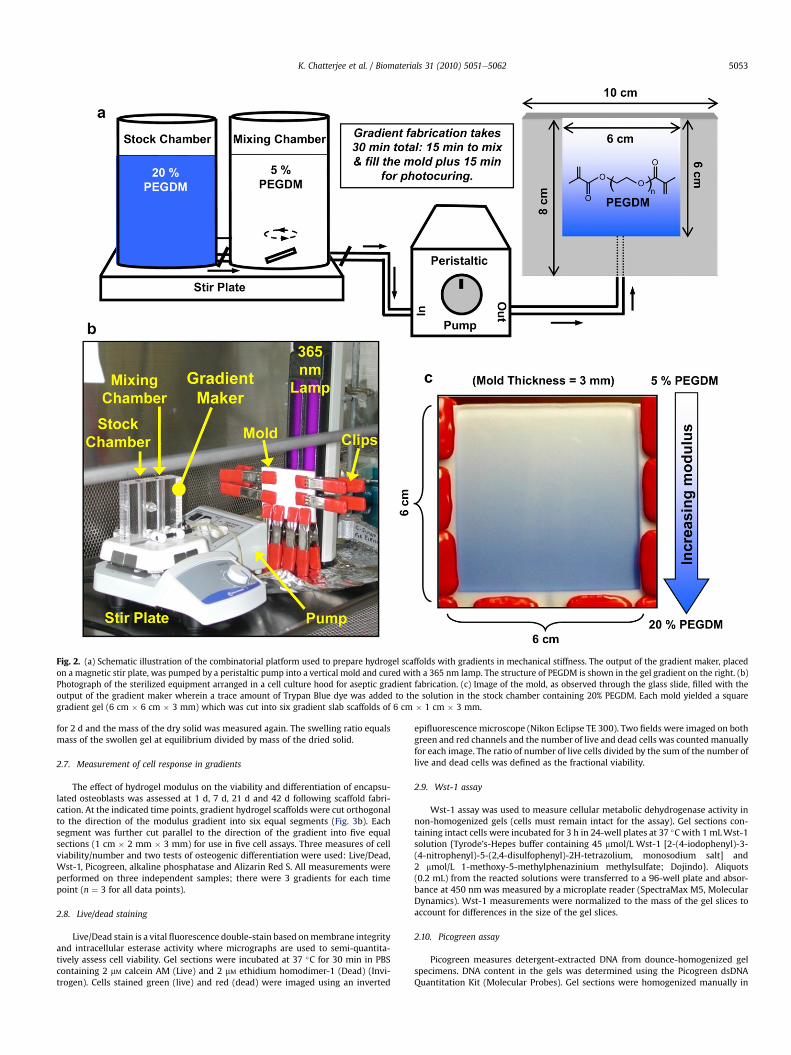
Fig. 2. (a) Schematic illustration of the combinatorial platform used to prepare hydrogel scaffolds with gradients in mechanical stiffness. The output of the gradient maker, placedon a magnetic stir plate, was pumped by a peristaltic pump into a vertical mold and cured with a 365 nm lamp. The structure of PEGDM is shown in the gel gradient on the right. (b)Photograph of the sterilized equipment arranged in a cell culture hood for aseptic gradient fabrication. (c) Image of the mold, as observed through the glass slide, filled with theoutput of the gradient maker wherein a trace amount of Trypan Blue dye was added to the solution in the stock chamber containing 20% PEGDM. Each mold yielded a squaregradient gel (6 cm � 6 cm � 3 mm) which was cut into six gradient slab scaffolds of 6 cm � 1 cm � 3 mm.
K. Chatterjee et al. / Biomaterials 31 (2010) 5051e5062 5053
for 2 d and the mass of the dry solid was measured again. The swelling ratio equalsmass of the swollen gel at equilibrium divided by mass of the dried solid.
2.7. Measurement of cell response in gradients
The effect of hydrogel modulus on the viability and differentiation of encapsu-lated osteoblasts was assessed at 1 d, 7 d, 21 d and 42 d following scaffold fabri-cation. At the indicated time points, gradient hydrogel scaffolds were cut orthogonalto the direction of the modulus gradient into six equal segments (Fig. 3b). Eachsegment was further cut parallel to the direction of the gradient into five equalsections (1 cm � 2 mm � 3 mm) for use in five cell assays. Three measures of cellviability/number and two tests of osteogenic differentiation were used: Live/Dead,Wst-1, Picogreen, alkaline phosphatase and Alizarin Red S. All measurements wereperformed on three independent samples; there were 3 gradients for each timepoint (n ¼ 3 for all data points).
2.8. Live/dead staining
Live/Dead stain is a vital fluorescence double-stain based onmembrane integrityand intracellular esterase activity where micrographs are used to semi-quantita-tively assess cell viability. Gel sections were incubated at 37 �C for 30 min in PBScontaining 2 mM calcein AM (Live) and 2 mM ethidium homodimer-1 (Dead) (Invi-trogen). Cells stained green (live) and red (dead) were imaged using an inverted
epifluorescence microscope (Nikon Eclipse TE 300). Two fields were imaged on bothgreen and red channels and the number of live and dead cells was countedmanuallyfor each image. The ratio of number of live cells divided by the sum of the number oflive and dead cells was defined as the fractional viability.
2.9. Wst-1 assay
Wst-1 assay was used to measure cellular metabolic dehydrogenase activity innon-homogenized gels (cells must remain intact for the assay). Gel sections con-taining intact cells were incubated for 3 h in 24-well plates at 37 �C with 1 mLWst-1solution {Tyrode’s-Hepes buffer containing 45 mmol/L Wst-1 [2-(4-iodophenyl)-3-(4-nitrophenyl)-5-(2,4-disulfophenyl)-2H-tetrazolium, monosodium salt] and2 mmol/L 1-methoxy-5-methylphenazinium methylsulfate; Dojindo}. Aliquots(0.2 mL) from the reacted solutions were transferred to a 96-well plate and absor-bance at 450 nm was measured by a microplate reader (SpectraMax M5, MolecularDynamics). Wst-1 measurements were normalized to the mass of the gel slices toaccount for differences in the size of the gel slices.
2.10. Picogreen assay
Picogreen measures detergent-extracted DNA from dounce-homogenized gelspecimens. DNA content in the gels was determined using the Picogreen dsDNAQuantitation Kit (Molecular Probes). Gel sections were homogenized manually in
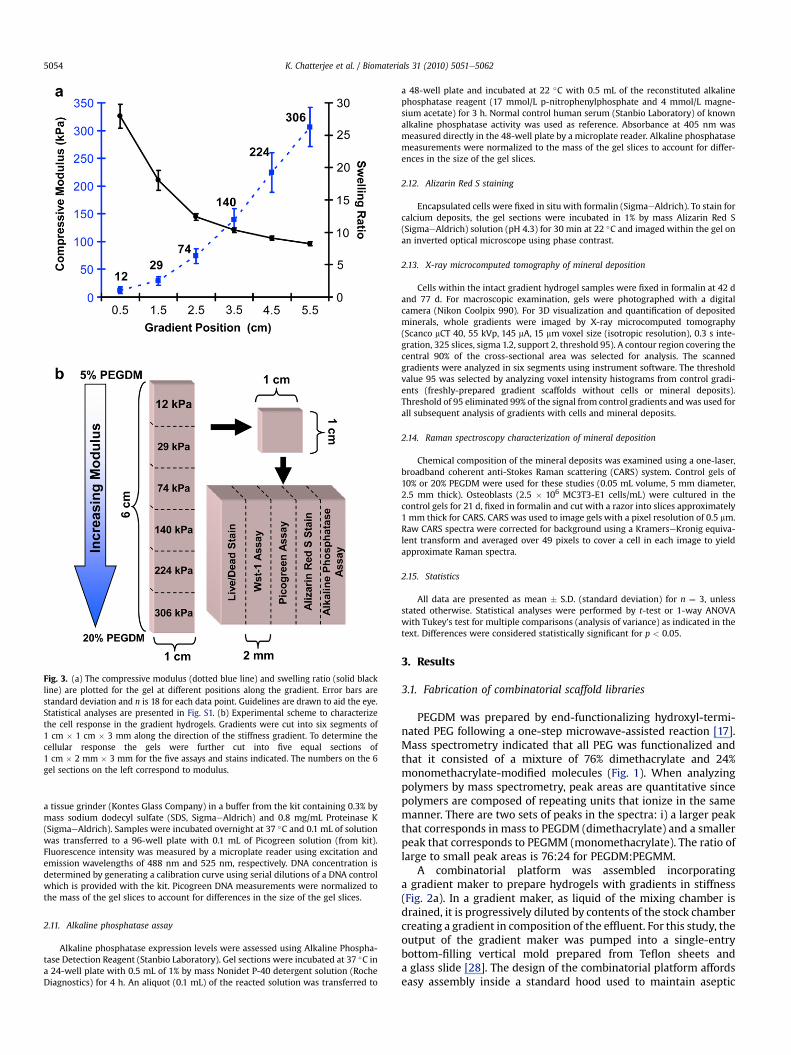
Fig. 3. (a) The compressive modulus (dotted blue line) and swelling ratio (solid blackline) are plotted for the gel at different positions along the gradient. Error bars arestandard deviation and n is 18 for each data point. Guidelines are drawn to aid the eye.Statistical analyses are presented in Fig. S1. (b) Experimental scheme to characterizethe cell response in the gradient hydrogels. Gradients were cut into six segments of1 cm � 1 cm � 3 mm along the direction of the stiffness gradient. To determine thecellular response the gels were further cut into five equal sections of1 cm � 2 mm � 3 mm for the five assays and stains indicated. The numbers on the 6gel sections on the left correspond to modulus.
K. Chatterjee et al. / Biomaterials 31 (2010) 5051e50625054
a tissue grinder (Kontes Glass Company) in a buffer from the kit containing 0.3% bymass sodium dodecyl sulfate (SDS, SigmaeAldrich) and 0.8 mg/mL Proteinase K(SigmaeAldrich). Samples were incubated overnight at 37 �C and 0.1 mL of solutionwas transferred to a 96-well plate with 0.1 mL of Picogreen solution (from kit).Fluorescence intensity was measured by a microplate reader using excitation andemission wavelengths of 488 nm and 525 nm, respectively. DNA concentration isdetermined by generating a calibration curve using serial dilutions of a DNA controlwhich is provided with the kit. Picogreen DNA measurements were normalized tothe mass of the gel slices to account for differences in the size of the gel slices.
2.11. Alkaline phosphatase assay
Alkaline phosphatase expression levels were assessed using Alkaline Phospha-tase Detection Reagent (Stanbio Laboratory). Gel sections were incubated at 37 �C ina 24-well plate with 0.5 mL of 1% by mass Nonidet P-40 detergent solution (RocheDiagnostics) for 4 h. An aliquot (0.1 mL) of the reacted solution was transferred to
a 48-well plate and incubated at 22 �C with 0.5 mL of the reconstituted alkalinephosphatase reagent (17 mmol/L p-nitrophenylphosphate and 4 mmol/L magne-sium acetate) for 3 h. Normal control human serum (Stanbio Laboratory) of knownalkaline phosphatase activity was used as reference. Absorbance at 405 nm wasmeasured directly in the 48-well plate by a microplate reader. Alkaline phosphatasemeasurements were normalized to the mass of the gel slices to account for differ-ences in the size of the gel slices.
2.12. Alizarin Red S staining
Encapsulated cells were fixed in situ with formalin (SigmaeAldrich). To stain forcalcium deposits, the gel sections were incubated in 1% by mass Alizarin Red S(SigmaeAldrich) solution (pH 4.3) for 30 min at 22 �C and imaged within the gel onan inverted optical microscope using phase contrast.
2.13. X-ray microcomputed tomography of mineral deposition
Cells within the intact gradient hydrogel samples were fixed in formalin at 42 dand 77 d. For macroscopic examination, gels were photographed with a digitalcamera (Nikon Coolpix 990). For 3D visualization and quantification of depositedminerals, whole gradients were imaged by X-ray microcomputed tomography(Scanco mCT 40, 55 kVp, 145 mA, 15 mm voxel size (isotropic resolution), 0.3 s inte-gration, 325 slices, sigma 1.2, support 2, threshold 95). A contour region covering thecentral 90% of the cross-sectional area was selected for analysis. The scannedgradients were analyzed in six segments using instrument software. The thresholdvalue 95 was selected by analyzing voxel intensity histograms from control gradi-ents (freshly-prepared gradient scaffolds without cells or mineral deposits).Threshold of 95 eliminated 99% of the signal from control gradients andwas used forall subsequent analysis of gradients with cells and mineral deposits.
2.14. Raman spectroscopy characterization of mineral deposition
Chemical composition of the mineral deposits was examined using a one-laser,broadband coherent anti-Stokes Raman scattering (CARS) system. Control gels of10% or 20% PEGDM were used for these studies (0.05 mL volume, 5 mm diameter,2.5 mm thick). Osteoblasts (2.5 � 106 MC3T3-E1 cells/mL) were cultured in thecontrol gels for 21 d, fixed in formalin and cut with a razor into slices approximately1 mm thick for CARS. CARS was used to image gels with a pixel resolution of 0.5 mm.Raw CARS spectra were corrected for background using a KramerseKronig equiva-lent transform and averaged over 49 pixels to cover a cell in each image to yieldapproximate Raman spectra.
2.15. Statistics
All data are presented as mean � S.D. (standard deviation) for n ¼ 3, unlessstated otherwise. Statistical analyses were performed by t-test or 1-way ANOVAwith Tukey’s test for multiple comparisons (analysis of variance) as indicated in thetext. Differences were considered statistically significant for p < 0.05.
3. Results
3.1. Fabrication of combinatorial scaffold libraries
PEGDM was prepared by end-functionalizing hydroxyl-termi-nated PEG following a one-step microwave-assisted reaction [17].Mass spectrometry indicated that all PEG was functionalized andthat it consisted of a mixture of 76% dimethacrylate and 24%monomethacrylate-modified molecules (Fig. 1). When analyzingpolymers by mass spectrometry, peak areas are quantitative sincepolymers are composed of repeating units that ionize in the samemanner. There are two sets of peaks in the spectra: i) a larger peakthat corresponds in mass to PEGDM (dimethacrylate) and a smallerpeak that corresponds to PEGMM (monomethacrylate). The ratio oflarge to small peak areas is 76:24 for PEGDM:PEGMM.
A combinatorial platform was assembled incorporatinga gradient maker to prepare hydrogels with gradients in stiffness(Fig. 2a). In a gradient maker, as liquid of the mixing chamber isdrained, it is progressively diluted by contents of the stock chambercreating a gradient in composition of the effluent. For this study, theoutput of the gradient maker was pumped into a single-entrybottom-filling vertical mold prepared from Teflon sheets anda glass slide [28]. The design of the combinatorial platform affordseasy assembly inside a standard hood used to maintain aseptic
K. Chatterjee et al. / Biomaterials 31 (2010) 5051e5062 5055
conditions for cell culture (Fig. 2b) and is thus well-suited forencapsulating cells within hydrogel scaffolds in situ.
Gradient scaffolds for cell studies were prepared from cells sus-pended in PEGDM solutions such that the cells were encapsulatedwithin the 3D hydrogel scaffolds. This photopolymerization processhas been optimized to minimize cytotoxicity [14]. Althoughbiochemical modification of the polymer network can significantlyimprove cell survival, no such techniques were applied herein inorder to focus on the effect ofmatrix stiffness. Stiffnesswas variedbymodulating the fraction of PEGDM from 5% to 20% (by mass insolution). Fig. 2c shows a gradient cast in themold seen through theglass slide wherein trace amounts of a blue dye were added to the20% solution to make the gradient visible. The cast solution wascured through the glass slide using a 365 nm lamp to obtain gradientgels. For maximal throughput, a mold of 6 cm � 6 cm � 3 mmwasdesigned to cast six gradient samples (6 cm � 1 cm � 3 mm)simultaneously, limited by the minimal and maximal usablevolumes for the gradient maker and the dimensions of the lampwindow that would ensure uniform curing. Fabrication of gradienthydrogels required approximately 30 min: 15 min to mix thegradient and fill the mold, and another 15 min for photocuring.
3.2. Mechanical characterization of gradient scaffolds
Fig. 3a compiles change in compressive modulus and swellingratio along the gradient scaffold (statistical analyses in Fig. S1).Modulus increased with increasing fraction of PEGDM and spannednearly a 30-fold range fromz10 kPa toz300 kPa. The slope of themodulus change increases from 12 kPa through 74 kPa and thenremains constant (linear increase in modulus) through the end ofthe gradients at 306 kPa. Since the size of a cell (20 mm) is muchsmaller than the length scale of the changing modulus (centime-ters), the changing slope should not affect cell response (eachindividual cell should sense the same modulus on all of itssurfaces). The swelling ratio exhibited a concomitant decreaseindicating that softer gels absorbed more water than stiffer gels.Note that Fig. 3a compiles data for 18 samples prepared from threecasts. Measurements were repeatable between samples from singleand multiple casts.
Moduli and swelling ratios for control gels of uniform compo-sition (Table 1) compared favorably with the measurements on thegradient hydrogels (Fig. 3a) and with previous studies [15]. Thoughmodulus data shown in Fig. 3a and in Table 1 was collected at roomtemperature (23 �C), themoduli of control 10% and 20% PEGDMgelsof uniform composition were measured at 37 �C. Changingtemperature from 23 �C to 37 �C did not affect the modulusmeasurements for 10% or 20% control gels (t-test, n ¼ 3, p > 0.05)indicating that the modulus at room temperature was the same asthat experienced by the cells at 37 �C.
Consistent with previous reports [15], the compressive moduliof PEGDMhydrogels soaked inwater up to 30 d did not changewith
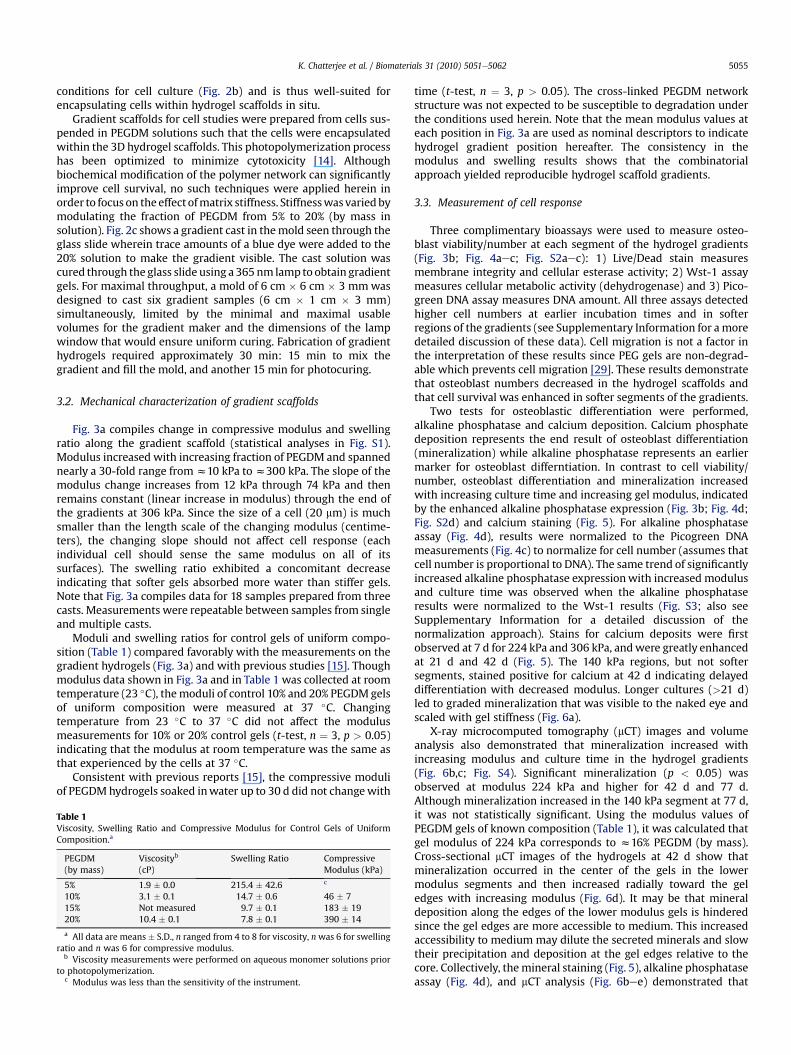
Table 1Viscosity, Swelling Ratio and Compressive Modulus for Control Gels of UniformComposition.a
PEGDM(by mass)
Viscosityb
(cP)Swelling Ratio Compressive
Modulus (kPa)
5% 1.9 � 0.0 215.4 � 42.6 c
10% 3.1 � 0.1 14.7 � 0.6 46 � 715% Not measured 9.7 � 0.1 183 � 1920% 10.4 � 0.1 7.8 � 0.1 390 � 14
a All data are means� S.D., n ranged from 4 to 8 for viscosity, nwas 6 for swellingratio and n was 6 for compressive modulus.
b Viscosity measurements were performed on aqueous monomer solutions priorto photopolymerization.
c Modulus was less than the sensitivity of the instrument.
time (t-test, n ¼ 3, p > 0.05). The cross-linked PEGDM networkstructure was not expected to be susceptible to degradation underthe conditions used herein. Note that the mean modulus values ateach position in Fig. 3a are used as nominal descriptors to indicatehydrogel gradient position hereafter. The consistency in themodulus and swelling results shows that the combinatorialapproach yielded reproducible hydrogel scaffold gradients.
3.3. Measurement of cell response
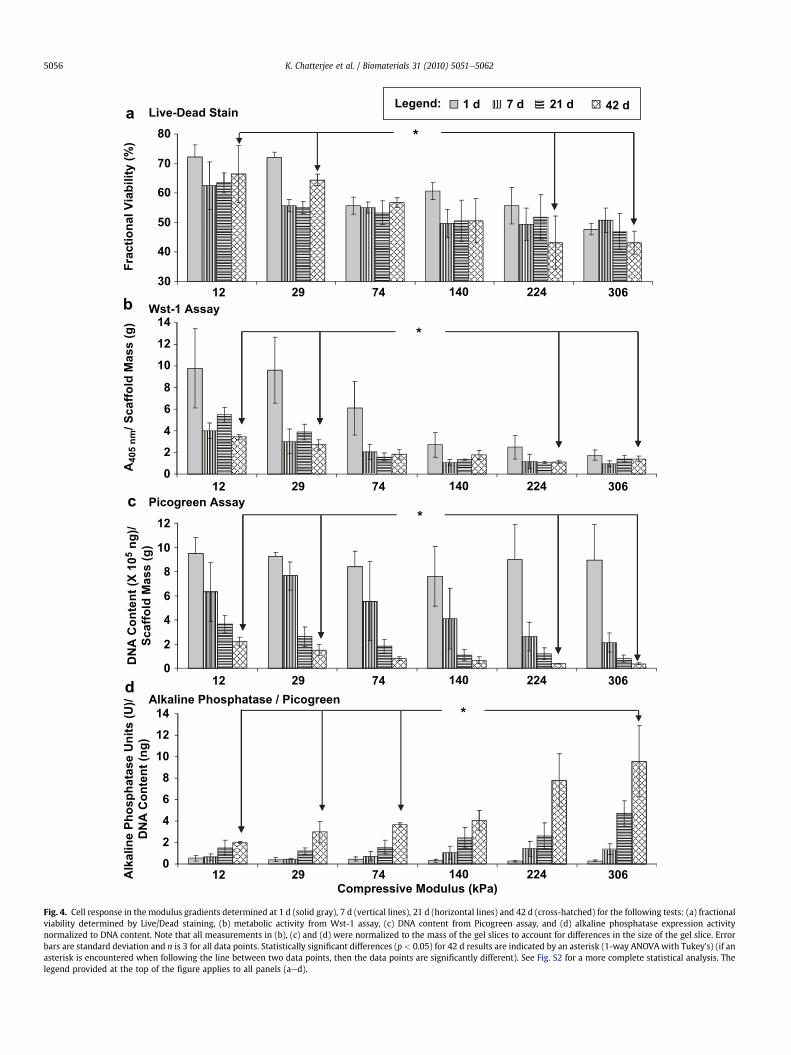
Three complimentary bioassays were used to measure osteo-blast viability/number at each segment of the hydrogel gradients(Fig. 3b; Fig. 4aec; Fig. S2aec): 1) Live/Dead stain measuresmembrane integrity and cellular esterase activity; 2) Wst-1 assaymeasures cellular metabolic activity (dehydrogenase) and 3) Pico-green DNA assay measures DNA amount. All three assays detectedhigher cell numbers at earlier incubation times and in softerregions of the gradients (see Supplementary Information for amoredetailed discussion of these data). Cell migration is not a factor inthe interpretation of these results since PEG gels are non-degrad-able which prevents cell migration [29]. These results demonstratethat osteoblast numbers decreased in the hydrogel scaffolds andthat cell survival was enhanced in softer segments of the gradients.
Two tests for osteoblastic differentiation were performed,alkaline phosphatase and calcium deposition. Calcium phosphatedeposition represents the end result of osteoblast differentiation(mineralization) while alkaline phosphatase represents an earliermarker for osteoblast differntiation. In contrast to cell viability/number, osteoblast differentiation and mineralization increasedwith increasing culture time and increasing gel modulus, indicatedby the enhanced alkaline phosphatase expression (Fig. 3b; Fig. 4d;Fig. S2d) and calcium staining (Fig. 5). For alkaline phosphataseassay (Fig. 4d), results were normalized to the Picogreen DNAmeasurements (Fig. 4c) to normalize for cell number (assumes thatcell number is proportional to DNA). The same trend of significantlyincreased alkaline phosphatase expressionwith increased modulusand culture time was observed when the alkaline phosphataseresults were normalized to the Wst-1 results (Fig. S3; also seeSupplementary Information for a detailed discussion of thenormalization approach). Stains for calcium deposits were firstobserved at 7 d for 224 kPa and 306 kPa, andwere greatly enhancedat 21 d and 42 d (Fig. 5). The 140 kPa regions, but not softersegments, stained positive for calcium at 42 d indicating delayeddifferentiation with decreased modulus. Longer cultures (>21 d)led to graded mineralization that was visible to the naked eye andscaled with gel stiffness (Fig. 6a).
X-ray microcomputed tomography (mCT) images and volumeanalysis also demonstrated that mineralization increased withincreasing modulus and culture time in the hydrogel gradients(Fig. 6b,c; Fig. S4). Significant mineralization (p < 0.05) wasobserved at modulus 224 kPa and higher for 42 d and 77 d.Although mineralization increased in the 140 kPa segment at 77 d,it was not statistically significant. Using the modulus values ofPEGDM gels of known composition (Table 1), it was calculated thatgel modulus of 224 kPa corresponds to z16% PEGDM (by mass).Cross-sectional mCT images of the hydrogels at 42 d show thatmineralization occurred in the center of the gels in the lowermodulus segments and then increased radially toward the geledges with increasing modulus (Fig. 6d). It may be that mineraldeposition along the edges of the lower modulus gels is hinderedsince the gel edges are more accessible to medium. This increasedaccessibility to medium may dilute the secreted minerals and slowtheir precipitation and deposition at the gel edges relative to thecore. Collectively, themineral staining (Fig. 5), alkaline phosphataseassay (Fig. 4d), and mCT analysis (Fig. 6bee) demonstrated that
70
80
a Live-Dead Stain
1 d 7 d 21 d 42 dLegend:
*
30
40
50
60
10
12
14
bWst-1 Assay
*
0
2
4
6
8
6
8
10
12
c Picogreen Assay
*
0
2
4
d
Alkaline Phosphatase / Picogreen
6
8
10
12
14 *
0
2
4
12 29 74 140 224 306
12 29 74 140 224 306
12 29 74 140 224 306
12 29 74 140 224 306
Compressive Modulus (kPa)
Fra
ctio
na
l V
ia
bility
(%
)A
40
5 n
m/ S
ca
ffo
ld
M
as
s (g
)D
NA
C
on
te
nt (X
1
05 n
g)/
Sc
affo
ld
M
as
s (g
)
Alkalin
e P
ho
sp
hatase U
nits (U
)/
DN
A C
on
ten
t (n
g)
Fig. 4. Cell response in the modulus gradients determined at 1 d (solid gray), 7 d (vertical lines), 21 d (horizontal lines) and 42 d (cross-hatched) for the following tests: (a) fractionalviability determined by Live/Dead staining, (b) metabolic activity from Wst-1 assay, (c) DNA content from Picogreen assay, and (d) alkaline phosphatase expression activitynormalized to DNA content. Note that all measurements in (b), (c) and (d) were normalized to the mass of the gel slices to account for differences in the size of the gel slice. Errorbars are standard deviation and n is 3 for all data points. Statistically significant differences (p < 0.05) for 42 d results are indicated by an asterisk (1-way ANOVAwith Tukey’s) (if anasterisk is encountered when following the line between two data points, then the data points are significantly different). See Fig. S2 for a more complete statistical analysis. Thelegend provided at the top of the figure applies to all panels (aed).
K. Chatterjee et al. / Biomaterials 31 (2010) 5051e50625056
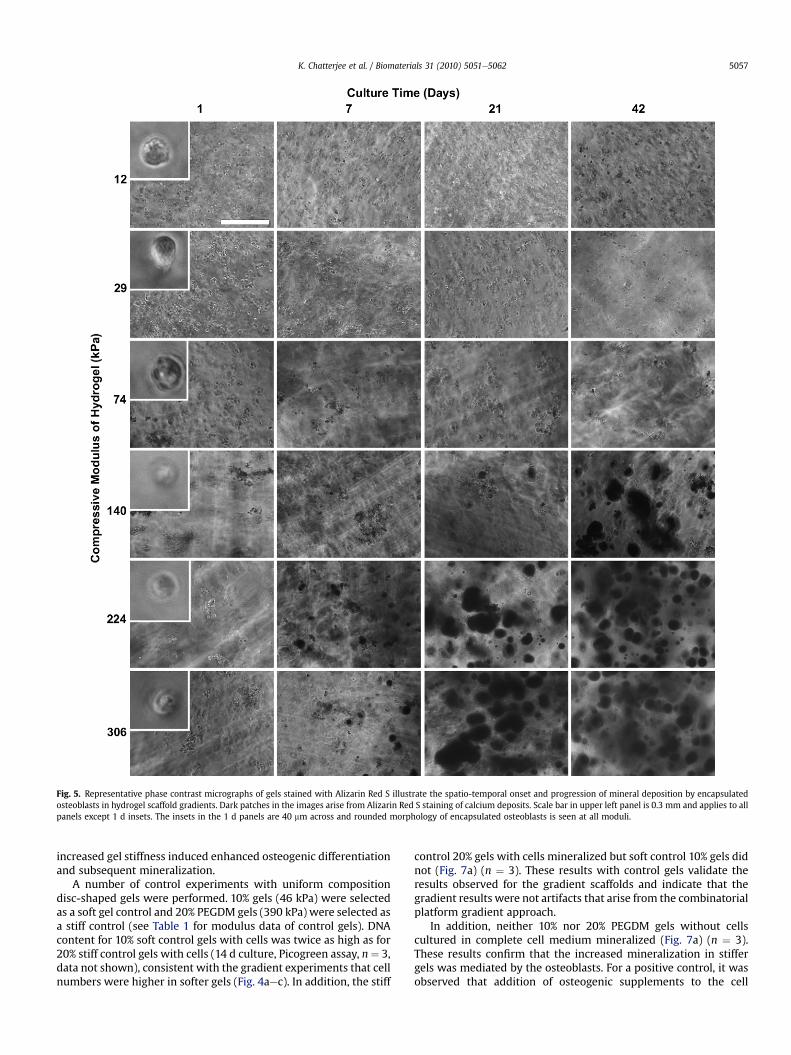
Fig. 5. Representative phase contrast micrographs of gels stained with Alizarin Red S illustrate the spatio-temporal onset and progression of mineral deposition by encapsulatedosteoblasts in hydrogel scaffold gradients. Dark patches in the images arise from Alizarin Red S staining of calcium deposits. Scale bar in upper left panel is 0.3 mm and applies to allpanels except 1 d insets. The insets in the 1 d panels are 40 mm across and rounded morphology of encapsulated osteoblasts is seen at all moduli.
K. Chatterjee et al. / Biomaterials 31 (2010) 5051e5062 5057
increased gel stiffness induced enhanced osteogenic differentiationand subsequent mineralization.
A number of control experiments with uniform compositiondisc-shaped gels were performed. 10% gels (46 kPa) were selectedas a soft gel control and 20% PEGDM gels (390 kPa) were selected asa stiff control (see Table 1 for modulus data of control gels). DNAcontent for 10% soft control gels with cells was twice as high as for20% stiff control gels with cells (14 d culture, Picogreen assay, n¼ 3,data not shown), consistent with the gradient experiments that cellnumbers were higher in softer gels (Fig. 4aec). In addition, the stiff
control 20% gels with cells mineralized but soft control 10% gels didnot (Fig. 7a) (n ¼ 3). These results with control gels validate theresults observed for the gradient scaffolds and indicate that thegradient results were not artifacts that arise from the combinatorialplatform gradient approach.
In addition, neither 10% nor 20% PEGDM gels without cellscultured in complete cell medium mineralized (Fig. 7a) (n ¼ 3).These results confirm that the increased mineralization in stiffergels was mediated by the osteoblasts. For a positive control, it wasobserved that addition of osteogenic supplements to the cell
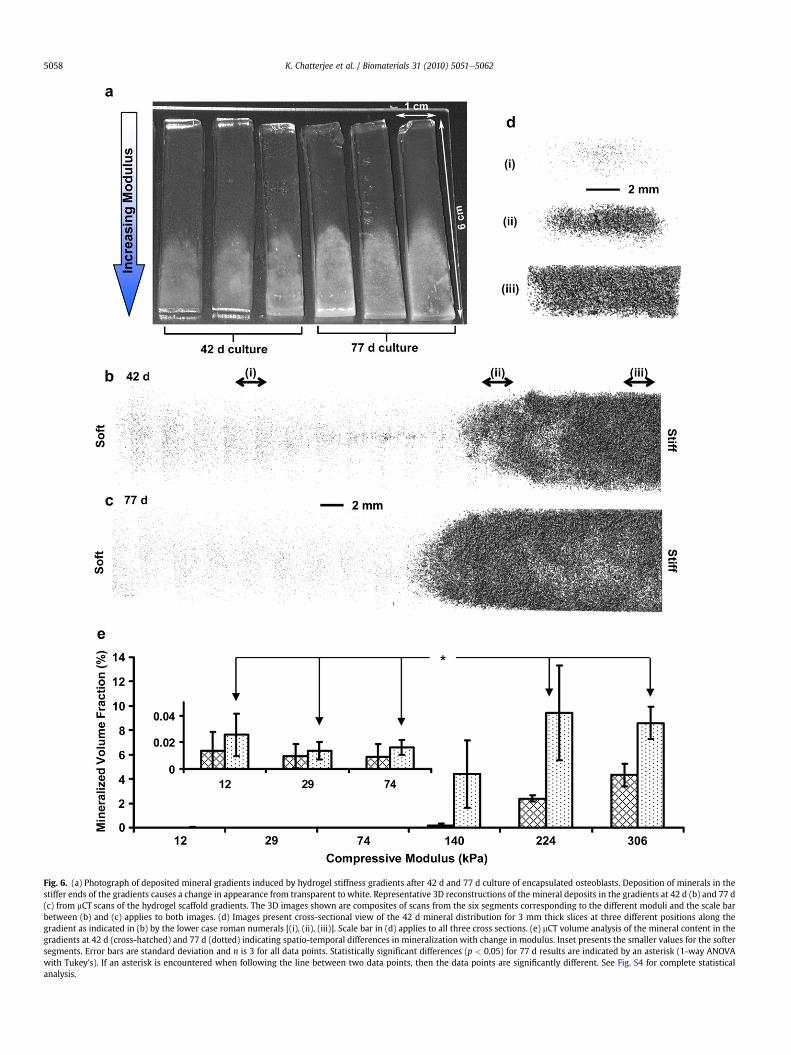
Fig. 6. (a) Photograph of deposited mineral gradients induced by hydrogel stiffness gradients after 42 d and 77 d culture of encapsulated osteoblasts. Deposition of minerals in thestiffer ends of the gradients causes a change in appearance from transparent to white. Representative 3D reconstructions of the mineral deposits in the gradients at 42 d (b) and 77 d(c) from mCT scans of the hydrogel scaffold gradients. The 3D images shown are composites of scans from the six segments corresponding to the different moduli and the scale barbetween (b) and (c) applies to both images. (d) Images present cross-sectional view of the 42 d mineral distribution for 3 mm thick slices at three different positions along thegradient as indicated in (b) by the lower case roman numerals [(i), (ii), (iii)]. Scale bar in (d) applies to all three cross sections. (e) mCT volume analysis of the mineral content in thegradients at 42 d (cross-hatched) and 77 d (dotted) indicating spatio-temporal differences in mineralization with change in modulus. Inset presents the smaller values for the softersegments. Error bars are standard deviation and n is 3 for all data points. Statistically significant differences (p < 0.05) for 77 d results are indicated by an asterisk (1-way ANOVAwith Tukey’s). If an asterisk is encountered when following the line between two data points, then the data points are significantly different. See Fig. S4 for complete statisticalanalysis.
K. Chatterjee et al. / Biomaterials 31 (2010) 5051e50625058
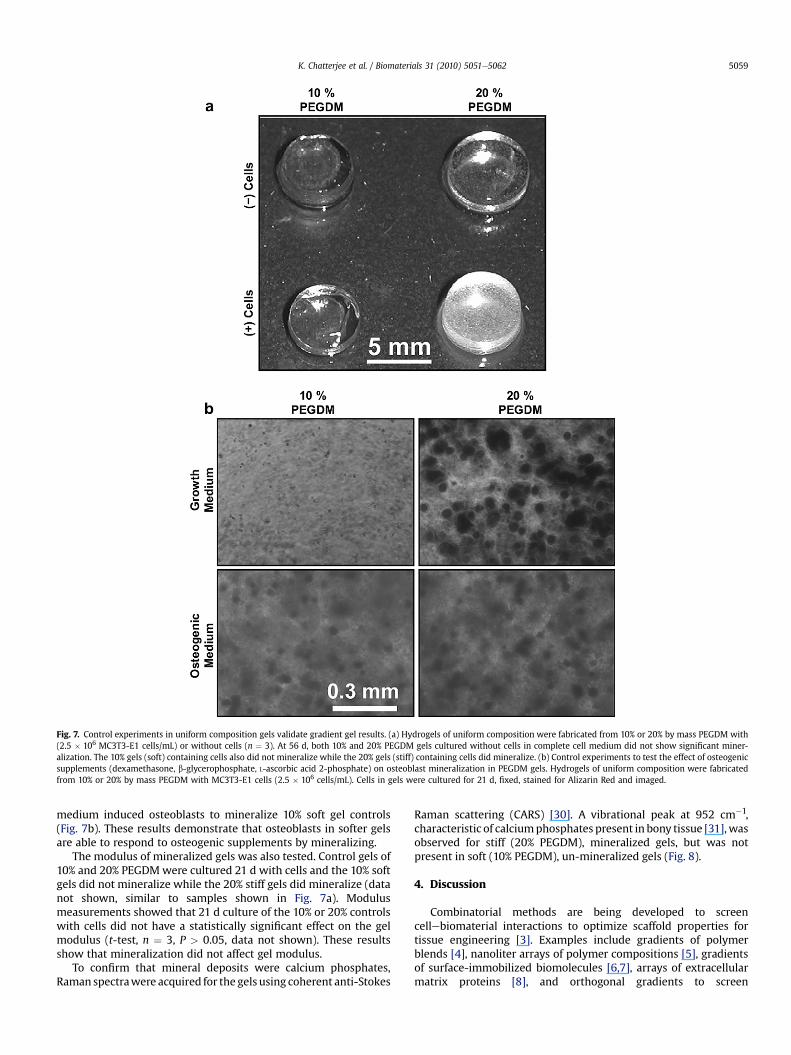
Fig. 7. Control experiments in uniform composition gels validate gradient gel results. (a) Hydrogels of uniform composition were fabricated from 10% or 20% by mass PEGDM with(2.5 � 106 MC3T3-E1 cells/mL) or without cells (n ¼ 3). At 56 d, both 10% and 20% PEGDM gels cultured without cells in complete cell medium did not show significant miner-alization. The 10% gels (soft) containing cells also did not mineralize while the 20% gels (stiff) containing cells did mineralize. (b) Control experiments to test the effect of osteogenicsupplements (dexamethasone, b-glycerophosphate, L-ascorbic acid 2-phosphate) on osteoblast mineralization in PEGDM gels. Hydrogels of uniform composition were fabricatedfrom 10% or 20% by mass PEGDM with MC3T3-E1 cells (2.5 � 106 cells/mL). Cells in gels were cultured for 21 d, fixed, stained for Alizarin Red and imaged.
K. Chatterjee et al. / Biomaterials 31 (2010) 5051e5062 5059
medium induced osteoblasts to mineralize 10% soft gel controls(Fig. 7b). These results demonstrate that osteoblasts in softer gelsare able to respond to osteogenic supplements by mineralizing.
The modulus of mineralized gels was also tested. Control gels of10% and 20% PEGDMwere cultured 21 d with cells and the 10% softgels did not mineralize while the 20% stiff gels did mineralize (datanot shown, similar to samples shown in Fig. 7a). Modulusmeasurements showed that 21 d culture of the 10% or 20% controlswith cells did not have a statistically significant effect on the gelmodulus (t-test, n ¼ 3, P > 0.05, data not shown). These resultsshow that mineralization did not affect gel modulus.
To confirm that mineral deposits were calcium phosphates,Raman spectrawere acquired for the gels using coherent anti-Stokes
Raman scattering (CARS) [30]. A vibrational peak at 952 cm�1,characteristic of calciumphosphates present in bony tissue [31],wasobserved for stiff (20% PEGDM), mineralized gels, but was notpresent in soft (10% PEGDM), un-mineralized gels (Fig. 8).
4. Discussion
Combinatorial methods are being developed to screencellebiomaterial interactions to optimize scaffold properties fortissue engineering [3]. Examples include gradients of polymerblends [4], nanoliter arrays of polymer compositions [5], gradientsof surface-immobilized biomolecules [6,7], arrays of extracellularmatrix proteins [8], and orthogonal gradients to screen
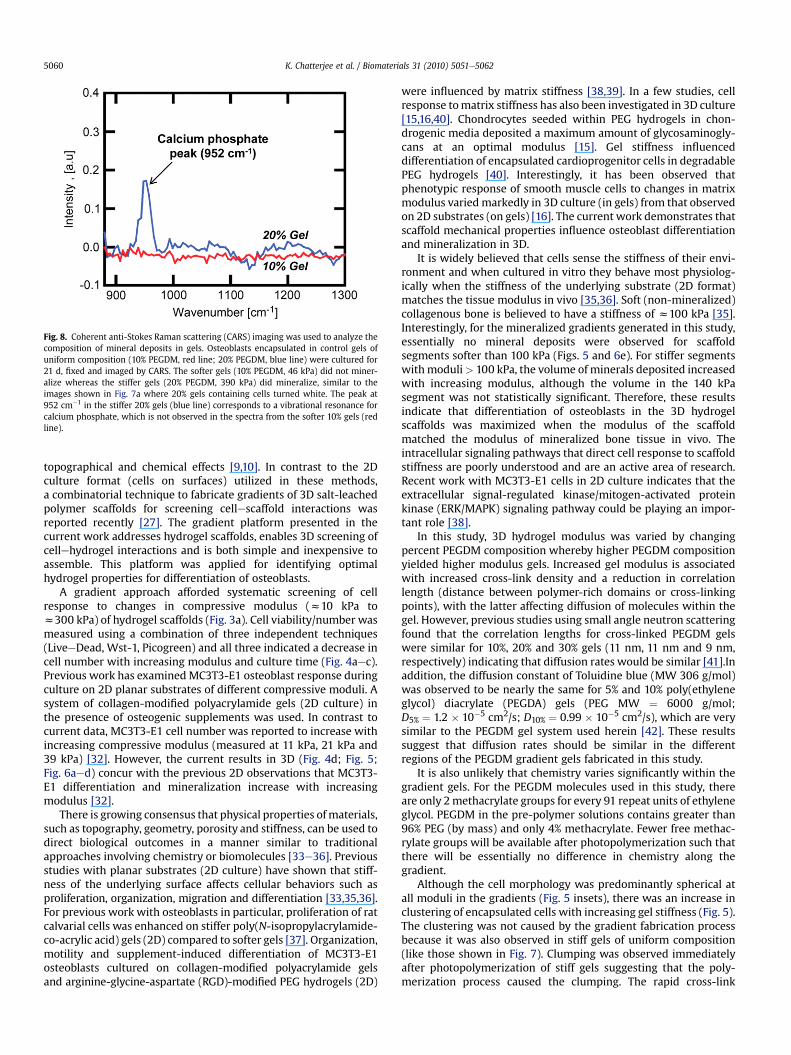
Fig. 8. Coherent anti-Stokes Raman scattering (CARS) imaging was used to analyze thecomposition of mineral deposits in gels. Osteoblasts encapsulated in control gels ofuniform composition (10% PEGDM, red line; 20% PEGDM, blue line) were cultured for21 d, fixed and imaged by CARS. The softer gels (10% PEGDM, 46 kPa) did not miner-alize whereas the stiffer gels (20% PEGDM, 390 kPa) did mineralize, similar to theimages shown in Fig. 7a where 20% gels containing cells turned white. The peak at952 cm�1 in the stiffer 20% gels (blue line) corresponds to a vibrational resonance forcalcium phosphate, which is not observed in the spectra from the softer 10% gels (redline).
K. Chatterjee et al. / Biomaterials 31 (2010) 5051e50625060
topographical and chemical effects [9,10]. In contrast to the 2Dculture format (cells on surfaces) utilized in these methods,a combinatorial technique to fabricate gradients of 3D salt-leachedpolymer scaffolds for screening cellescaffold interactions wasreported recently [27]. The gradient platform presented in thecurrent work addresses hydrogel scaffolds, enables 3D screening ofcellehydrogel interactions and is both simple and inexpensive toassemble. This platform was applied for identifying optimalhydrogel properties for differentiation of osteoblasts.
A gradient approach afforded systematic screening of cellresponse to changes in compressive modulus (z10 kPa toz300 kPa) of hydrogel scaffolds (Fig. 3a). Cell viability/number wasmeasured using a combination of three independent techniques(LiveeDead, Wst-1, Picogreen) and all three indicated a decrease incell number with increasing modulus and culture time (Fig. 4aec).Previous work has examinedMC3T3-E1 osteoblast response duringculture on 2D planar substrates of different compressive moduli. Asystem of collagen-modified polyacrylamide gels (2D culture) inthe presence of osteogenic supplements was used. In contrast tocurrent data, MC3T3-E1 cell number was reported to increase withincreasing compressive modulus (measured at 11 kPa, 21 kPa and39 kPa) [32]. However, the current results in 3D (Fig. 4d; Fig. 5;Fig. 6aed) concur with the previous 2D observations that MC3T3-E1 differentiation and mineralization increase with increasingmodulus [32].
There is growing consensus that physical properties ofmaterials,such as topography, geometry, porosity and stiffness, can be used todirect biological outcomes in a manner similar to traditionalapproaches involving chemistry or biomolecules [33e36]. Previousstudies with planar substrates (2D culture) have shown that stiff-ness of the underlying surface affects cellular behaviors such asproliferation, organization, migration and differentiation [33,35,36].For previous work with osteoblasts in particular, proliferation of ratcalvarial cells was enhanced on stiffer poly(N-isopropylacrylamide-co-acrylic acid) gels (2D) compared to softer gels [37]. Organization,motility and supplement-induced differentiation of MC3T3-E1osteoblasts cultured on collagen-modified polyacrylamide gelsand arginine-glycine-aspartate (RGD)-modified PEG hydrogels (2D)
were influenced by matrix stiffness [38,39]. In a few studies, cellresponse tomatrix stiffness has also been investigated in 3D culture[15,16,40]. Chondrocytes seeded within PEG hydrogels in chon-drogenic media deposited a maximum amount of glycosaminogly-cans at an optimal modulus [15]. Gel stiffness influenceddifferentiation of encapsulated cardioprogenitor cells in degradablePEG hydrogels [40]. Interestingly, it has been observed thatphenotypic response of smooth muscle cells to changes in matrixmodulus varied markedly in 3D culture (in gels) from that observedon 2D substrates (on gels) [16]. The current work demonstrates thatscaffold mechanical properties influence osteoblast differentiationand mineralization in 3D.
It is widely believed that cells sense the stiffness of their envi-ronment and when cultured in vitro they behave most physiolog-ically when the stiffness of the underlying substrate (2D format)matches the tissue modulus in vivo [35,36]. Soft (non-mineralized)collagenous bone is believed to have a stiffness of z100 kPa [35].Interestingly, for the mineralized gradients generated in this study,essentially no mineral deposits were observed for scaffoldsegments softer than 100 kPa (Figs. 5 and 6e). For stiffer segmentswithmoduli> 100 kPa, the volume of minerals deposited increasedwith increasing modulus, although the volume in the 140 kPasegment was not statistically significant. Therefore, these resultsindicate that differentiation of osteoblasts in the 3D hydrogelscaffolds was maximized when the modulus of the scaffoldmatched the modulus of mineralized bone tissue in vivo. Theintracellular signaling pathways that direct cell response to scaffoldstiffness are poorly understood and are an active area of research.Recent work with MC3T3-E1 cells in 2D culture indicates that theextracellular signal-regulated kinase/mitogen-activated proteinkinase (ERK/MAPK) signaling pathway could be playing an impor-tant role [38].
In this study, 3D hydrogel modulus was varied by changingpercent PEGDM composition whereby higher PEGDM compositionyielded higher modulus gels. Increased gel modulus is associatedwith increased cross-link density and a reduction in correlationlength (distance between polymer-rich domains or cross-linkingpoints), with the latter affecting diffusion of molecules within thegel. However, previous studies using small angle neutron scatteringfound that the correlation lengths for cross-linked PEGDM gelswere similar for 10%, 20% and 30% gels (11 nm, 11 nm and 9 nm,respectively) indicating that diffusion rates would be similar [41].Inaddition, the diffusion constant of Toluidine blue (MW 306 g/mol)was observed to be nearly the same for 5% and 10% poly(ethyleneglycol) diacrylate (PEGDA) gels (PEG MW ¼ 6000 g/mol;D5% ¼ 1.2 � 10�5 cm2/s; D10% ¼ 0.99 � 10�5 cm2/s), which are verysimilar to the PEGDM gel system used herein [42]. These resultssuggest that diffusion rates should be similar in the differentregions of the PEGDM gradient gels fabricated in this study.
It is also unlikely that chemistry varies significantly within thegradient gels. For the PEGDM molecules used in this study, thereare only 2methacrylate groups for every 91 repeat units of ethyleneglycol. PEGDM in the pre-polymer solutions contains greater than96% PEG (by mass) and only 4% methacrylate. Fewer free methac-rylate groups will be available after photopolymerization such thatthere will be essentially no difference in chemistry along thegradient.
Although the cell morphology was predominantly spherical atall moduli in the gradients (Fig. 5 insets), there was an increase inclustering of encapsulated cells with increasing gel stiffness (Fig. 5).The clustering was not caused by the gradient fabrication processbecause it was also observed in stiff gels of uniform composition(like those shown in Fig. 7). Clumping was observed immediatelyafter photopolymerization of stiff gels suggesting that the poly-merization process caused the clumping. The rapid cross-link
K. Chatterjee et al. / Biomaterials 31 (2010) 5051e5062 5061
reaction in the more concentrated solutions likely excludes cellsleading to areas where cells are closer together.
Ligaments transition from soft, non-mineralized connectivetissue into harder, mineralized bone tissue spanning a compressivemodulus range of z100 kPa to z1000 kPa [18], comparable to therange afforded by the graded scaffolds herein (z10 kPa toz300 kPa). Studies to generate continuous interfaces with engi-neered bone have been reported previously [43e45]. Triphasicscaffolds have been fabricated from two polymers and a bioglassand used to co-culture fibroblasts and osteoblasts towards engi-neering the boneeligament interface [43]. More recently, gradedretroviral delivery of an osteoblast transcription factor (Runx2)from a collagen scaffold to seeded fibroblasts was used to generatea gradient construct for ligament engineering [44]. Others havefabricated graded osteochondral constructs by culturing mesen-chymal stem cells seeded on scaffolds containing opposing gradi-ents in growth factors: bone morphogenic protein (BMP-2) forinducing osteogenesis and insulin-like growth factor (IGF-1) forinducing chondrogenesis [45].
The gradients constructed herein were designed for combina-torial screening and were 6 cm in length. The point of insertion foranterior cruciate ligament has a gradient from ligament to fibro-cartilage to bone that spans several mm [43]. Thus, the length scaleof the current gradient system could be reduced from cm to mm inorder to match the length scale of the gradients found in ligamentin vivo.
Results presented in this study indicate that gradients in scaffoldstiffness (compressive modulus) can be leveraged towards engi-neering seamless tissue interfaces between bone and soft tissues.The current approach for fabricating a mineralized tissue gradientis unique because only a single material (PEGDM) was used andonly a physical property (modulus) of the scaffold was varied.Graded osteogenesis was induced without the use of expensive,labile or potentially carcinogenic bioactive factors (proteins,peptides, growth factors, vectors) [22]. Moreover, the graded tissuegenerated herein did not require the addition of osteogenicsupplements to the medium and was fabricated with osteoblasts insitu. It may, therefore, be possible to augment tissue regeneration insitu by modulation of the mechanical properties of these injectablehydrogels without use of bioactive factors.
5. Conclusion
This work presents a combinatorial method for screeningcellematerial interactions in a 3D cell culture format that mimicsthe 3D environment of cells in vivo. This platform was utilized tofabricate gradient hydrogel scaffolds with osteoblasts encapsulatedin situ containing a 30-fold range in compressive modulus withina single specimen (z10 kPa toz300 kPa). Results presented hereindemonstrate that mechanical properties of the matrix influencedifferentiation of osteoblasts in 3D in the absence of biochemicalcues in the form of supplements, immobilized biomolecules orvectors. The gradients enabled systematic screening of osteoblastdifferentiation and demonstrated that hydrogels of modulusz225 kPa (z16% PEGDM by mass) or higher were required forinducing significant mineralization. In addition, these resultsdemonstrate that variation of only amaterial property, compressivemodulus, can be used to induce graded osteogenesis and genera-tion of a mineralized tissue gradient that could be applied tointegrate hard and soft tissues such as a tendon or a ligament.
Acknowledgements
Authors gratefully acknowledge technical assistance from KathyFlynn (NIST) and Ed Parry (ADA-NIST) and insightful discussions
with Kathryn L. Beers (NIST). This research was performed whileK.C. and S.H.P. held Research Associateship Awards from theNational Research Council of the National Academy of Sciences inthe Joint NIH-NIBIB/NIST and the NIST Postdoctoral Programs,respectively (National Institutes of Health-National Institute ofBiomedical Imaging and Bioengineering/National Institute ofStandards and Technology). This work was supported by NIST, NIH/NIBIB R21 EB006497-01 and the Intramural Program of the NIH/NIDCR (National Institute of Dental and Craniofacial Research). The“standard deviation” (S.D.) is the same as the “combined standarduncertainty of the mean” for the purposes of this work. The contentis solely the responsibility of the authors and does not necessarilyrepresent the official views of NIH, NIBIB, NIDCR or NIST. Thisarticle, a contribution of NIST, is not subject to US copyright. Certainequipment and instruments or materials are identified in the paperto adequately specify the experimental details. Such identificationdoes not imply recommendation by NIST, nor does it imply thematerials are necessarily the best available for the purpose.
Appendix. Supplementary data
Supplementary data associated with this article can be found inthe on-line version, at doi:10.1016/j.biomaterials.2010.03.024.
Appendix
Figures with essential colour discrimination. Most of the figuresin this article may be difficult to interpret in black and white. Thefull colour images can be found in the on-line version, at doi:10.1016/j.biomaterials.2010.03.024.
References
[1] Place ES, Evans ND, Stevens MM. Complexity in biomaterials for tissue engi-neering. Nat Mater 2009;8(6):457e70.
[2] Lysaght MJ, Jaklenec A, Deweerd E. Great expectations: private sector activityin tissue engineering, regenerative medicine, and stem cell therapeutics.Tissue Eng A 2008;14(2):305e15.
[3] Simon CG, Yang Y, Thomas V, Dorsey SM, Morgan AW. Cell interactions withbiomaterials gradients and arrays. Comb Chem High Throughput Screen2009;12(6):544e53.
[4] Meredith JC, Sormana JL, Keselowsky BG, Garcia AJ, Tona A, Karim A, et al.Combinatorial characterization of cell interactions with polymer surfaces.J Biomed Mater Res A 2003;66(3):483e90.
[5] Anderson DG, Levenberg S, Langer R. Nanoliter-scale synthesis of arrayedbiomaterials and application to human embryonic stem cells. Nat Biotechnol2004;22(7):863e6.
[6] Gallant ND, Lavery KA, Amis EJ, Becker ML. Universal gradient substrates for“click” biofunctionalization. Adv Mater 2007;19:965e9.
[7] DeLong SA, Gobin AS, West JL. Covalent immobilization of RGDS on hydrogelsurfaces to direct cell alignment and migration. J Control Release 2005;109(1e3):139e48.
[8] Flaim CJ, Chien S, Bhatia SN. An extracellular matrix microarray for probingcellular differentiation. Nat Methods 2005;2(2):119e25.
[9] Yang J, Rose FRAJ, Gadegaard N, Alexander MR. A high-throughput assay ofcell-surface interactions using topographical and chemical gradients. AdvMater 2009;21(3):300e4.
[10] Lovmand J, Justesen J, Foss M, Lauridsen RH, Lovmand M, Modin C, et al. Theuse of combinatorial topographical libraries for the screening of enhancedosteogenic expression and mineralization. Biomaterials 2009;30(11):2015e22.
[11] Fischbach C, Chen R, Matsumoto T, Schmelzle T, Brugge JS, Polverini PJ, et al.Engineering tumors with 3D scaffolds. Nat Methods 2007;4(10):855e60.
[12] Cushing MC, Anseth KS. Material science: hydrogel cell cultures. Science2007;316(5828):1133e4.
[13] Elisseeff J, Anseth KS, Sims D, McIntosh W, Randolph M, Yaremchuk M, et al.Transdermal photopolymerization of poly (ethylene oxide)-based injectablehydrogels for tissue-engineered cartilage. Plast Reconstr Surg 1999;104(4):1014e22.
[14] Williams CG, Malik AN, Kim TK, Manson PN, Elisseeff JH. Variable cyto-compatibility of six cell lines with photoinitiators used for polymerizinghydrogels and cell encapsulation. Biomaterials 2005;26(11):1211e8.
[15] Bryant SJ, Anseth KS. Hydrogel properties influence ECM production bychondrocytes photoencapsulated in poly(ethylene glycol) hydrogels. J BiomedMater Res 2002;59(1):63e72.
K. Chatterjee et al. / Biomaterials 31 (2010) 5051e50625062
[16] Peyton SR, Kim PD, Ghajar CM, Seliktar D, Putnam AJ. The effects of matrixstiffness and RhoA on the phenotypic plasticity of smooth muscle cells in a3-D biosynthetic hydrogel system. Biomaterials 2008;29(17):2597e607.
[17] Lin-Gibson S, Bencherif S, Cooper JA, Wetzel SJ, Antonucci JM, Vogel BM, et al.Synthesis and characterization of PEG dimethacrylates and their hydrogels.Biomacromolecules 2004;5(4):1280e7.
[18] Moffat KL, Sun W-HS, Pena PE, Chahine NO, Doty SB, Ateshian GA, et al.Characterization of the structure-function relationship at the ligament-to-bone interface. Proc Natl Acad Sci U S A 2008;105(23):7947e52.
[19] KishenA,RamamurtyU,AsundiA. Experimental studiesonthenatureofpropertygradients in the human dentine. J BiomedMater Res 2000;51(4):650e9.
[20] Beaulieu JF. Integrins and human intestinal cell functions. Front Biosci1999;4:310e21.
[21] Lander AD. Morpheus unbound: reimagining the morphogen gradient. Cell2007;128(2):245e56.
[22] Katsuno Y, Hanyu A, Kanda H, Ishikawa Y, Akiyama F, Iwase T, et al. Bonemorphogenetic protein signaling enhances invasion and bone metastasis ofbreast cancer cells through Smad pathway. Oncogene 2008;27(49):6322e33.
[23] Sudo H, Kodama H, Amagai Y, Yamamoto S, Kasai S. In vitro differentiation andcalcification in a new clonal osteogenic cell line derived from newborn mousecalvaria. J Cell Biol 1983;96(1):191e8.
[24] Powell K, Leslie M. Dishing up bone formation. J Cell Biol 2005;171:409.[25] Stein GS, Lian JB, Owen TA. Relationship of cell-growth to the regulation of
tissue-specific gene-expression during osteoblast differentiation. FASEB J1990;4(13):3111e23.
[26] Choi JY, Lee BH, Song KB, Park RW, Kim IS, Sohn KY, et al. Expression patternsof bone-related proteins during osteoblastic differentiation in MC3T3-E1 cells.J Cell Biochem 1996;61(4):609e18.
[27] Yang Y, Bolikal D, Becker ML, Kohn J, Zeiger D, Simon Jr CG. Combinatorialpolymer scaffold libraries for screening cell-biomaterial interactions in 3D.Adv Mater 2008;20(11):2037e43.
[28] Xu C, Barnes SE, Wu T, Fischer DA, DeLongchamp DM, Batteas JD, et al.Solution and surface composition gradients via microfluidic confinement:fabrication of a statistical-copolymer-brush composition gradient. Adv Mater2006;18:1427e30.
[29] Kloxin AM, Kasko AM, Salinas CN, Anseth KS. Photodegradable hydrogels fordynamic tuning of physical and chemical properties. Science 2009;324(5923):59e63.
[30] Lee YJ, Cicerone MT. Single-shot interferometric approach to background freebroadband coherent anti-stokes Raman scattering spectroscopy. Opt Express2009;17(1):123e35.
[31] Sauer GR, Zunic WB, Durig JR, Wuthier RE. Fourier-transform Raman-spec-troscopy of synthetic and biological calcium phosphates. Calcif Tissue Int1994;54(5):414e20.
[32] Khatiwala CB, Peyton SR, Putnam AJ. Intrinsic mechanical properties of theextracellular matrix affect the behavior of pre-osteoblastic MC3T3-E1 cells.Am J Physiol-Cell Physiol 2006;290(6):C1640e50.
[33] Mitragotri S, Lahann J. Physical approaches to biomaterial design. Nat Mater2009;8(1):15e23.
[34] Dalby MJ, Gadegaard N, Tare R, Andar A, Riehle MO, Herzyk P, et al. The controlof human mesenchymal cell differentiation using nanoscale symmetry anddisorder. Nat Mater 2007;6(12):997e1003.
[35] Engler AJ, Sen S, Sweeney HL, Discher DE. Matrix elasticity directs stem celllineage specification. Cell 2006;126(4):677e89.
[36] Saha K, Keung AJ, Irwin EF, Li Y, Little L, Schaffer DV, et al. Substrate modulusdirects neural stem cell behavior. Biophys J 2008;95(9):4426e38.
[37] Chung EH, Gilbert M, Virdi AS, Sena K, Sumner DR, Healy KE. Biomimeticartificial ECMs stimulate bone regeneration. J Biomed Mater Res A 2006;79A(4):815e26.
[38] Khatiwala CB, Kim PD, Peyton SR, Putnam AJ. ECM compliance regulatesosteogenesis by influencing MAPK signaling downstream of RhoA and ROCK.J Bone Miner Res 2009;24(5):886e98.
[39] Hsiong SX, Carampin P, Kong H-J, Lee K-Y, Mooney DJ. Differentiation stagealters matrix control of stem cells. J Biomed Mater Res A 2008;85A(1):145e56.
[40] Kraehenbuehl TP, Zammaretti P, Van der Vlies AJ, Schoenmakers RG, Lutolf MP,Jaconi ME, et al. Three-dimensional extracellular matrix-directed car-dioprogenitor differentiation: systematic modulation of a synthetic cell-responsive PEG-hydrogel. Biomaterials 2008;29(18):2757e66.
[41] Lin-Gibson S, Jones RL, Washburn NR, Horkay F. Structure-property relation-ships of photopolymerizable poly(ethylene glycol) dimethacrylate hydrogels.Macromolecules 2005;38(7):2897e902.
[42] Cuchiara MP, Miller JS, West JL. Perfusable cell laden microchannel networksin poly(ethylene glycol) hydrogels. Transactions of the 33rd Annual Meeting ofthe Society for Biomaterials 2010;31:254.
[43] Spalazzi JP, Doty SB, Moffat KL, Levine WN, Lu HH. Development of controlledmatrix heterogeneity on a triphasic scaffold for orthopedic interface tissueengineering. Tissue Eng 2006;12(12):3497e508.
[44] Phillips JE, Burns KL, Le Doux JM, Guldberg RE, Garcia AJ. Engineering gradedtissue interfaces. Proc Natl Acad Sci U S A 2008;105(34):12170e5.
[45] Wang X, Wenk E, Zhang X, Meinel L, Vunjak-Novakovic G, Kaplan DL. Growthfactor gradients via microsphere delivery in biopolymer scaffolds for osteo-chondral tissue engineering. J Control Release 2009;134(2):81e90.