The effect of 12C 12C rate uncertainties on the evolution and ...
24
Mon. Not. R. Astron. Soc. 420, 3047–3070 (2012) doi:10.1111/j.1365-2966.2012.20193.x The effect of 12 C + 12 C rate uncertainties on the evolution and nucleosynthesis of massive stars M. E. Bennett, 1 † R. Hirschi, 1,2 † M. Pignatari, 3 † S. Diehl, 4 † C. Fryer, 5 † F. Herwig, 6 † A. Hungerford, 5 † K. Nomoto, 7 G. Rockefeller, 5 † F. X. Timmes 8,9 † and M. Wiescher 8 1 Astrophysics Group, Keele University, Staffordshire ST5 5BG 2 IPMU, University of Tokyo, Kashiwa, Chiba 277-8582, Japan 3 Department of Physics, Basel University, Klingelbergstrasse 82, 4056 Basel, Switzerland 4 Theoretical Astrophysics (T-6), LANL, Los Alamos, NM 87545, USA 5 Computational Physics and Methods (CCS-2), LANL, Los Alamos, NM 87545, USA 6 Department of Physics and Astronomy, Victoria, BC V8W 3P6, Canada 7 Institute for Physics and Mathematics of the Universe, University of Tokyo, Kashiwa, Chiba 277-8583, Japan 8 Joint Institute for Nuclear Astrophysics, University of Notre Dame, IN 46556, USA 9 School of Earth and Space Exploration, University of Arizona, Tempe, AZ 85287, USA Accepted 2011 November 13. Received 2011 November 11; in original form 2011 August 19 ABSTRACT Over the last 40 years, the 12 C + 12 C fusion reaction has been the subject of considerable experimental efforts to constrain uncertainties at temperatures relevant for stellar nucleosyn- thesis. Recent studies have indicated that the reaction rate may be higher than that currently used in stellar models. In order to investigate the effect of an enhanced carbon-burning rate on massive star structure and nucleosynthesis, new stellar evolution models and their yields are presented exploring the impact of three different 12 C + 12 C reaction rates. Non-rotating stellar models considering five different initial masses, 15, 20, 25, 32 and 60 M , at solar metallicity, were generated using the Geneva Stellar Evolution Code (GENEC) and were later post-processed with the NuGrid Multi-zone Post-Processing Network tool (MPPNP). A dynamic nuclear reaction network of ∼1100 isotopes was used to track the s-process nucleosynthesis. An enhanced 12 C + 12 C reaction rate causes core carbon burning to be ignited more promptly and at lower temperature. This reduces the neutrino losses, which increases the core carbon- burning lifetime. An increased carbon-burning rate also increases the upper initial mass limit for which a star exhibits a convective carbon core (rather than a radiative one). Carbon-shell burning is also affected, with fewer convective-shell episodes and convection zones that tend to be larger in mass. Consequently, the chance of an overlap between the ashes of carbon-core burning and the following carbon shell convection zones is increased, which can cause a por- tion of the ashes of carbon-core burning to be included in the carbon shell. Therefore, during the supernova explosion, the ejecta will be enriched by s-process nuclides synthesized from the carbon-core s-process. The yields were used to estimate the weak s-process component in order to compare with the Solar system abundance distribution. The enhanced rate models were found to produce a significant proportion of Kr, Sr, Y, Zr, Mo, Ru, Pd and Cd in the weak component, which is primarily the signature of the carbon-core s-process. Consequently, it is shown that the production of isotopes in the Kr–Sr region can be used to constrain the 12 C + 12 C rate using the current branching ratio for α- and p-exit channels. Key words: nuclear reactions, nucleosynthesis, abundances – stars: abundances – stars: evolution. E-mail: [email protected] †The NuGrid collaboration. 1 INTRODUCTION Despite the limitations of one-dimensional (1D) stellar models, their capability to reproduce several observables makes them a funda- mental tool to understand stellar nucleosynthesis sites in the Galaxy. C 2012 The Authors Monthly Notices of the Royal Astronomical Society C 2012 RAS Downloaded from https://academic.oup.com/mnras/article/420/4/3047/972505 by guest on 01 August 2022
-
Upload
khangminh22 -
Category
Documents
-
view
0 -
download
0
Transcript of The effect of 12C 12C rate uncertainties on the evolution and ...
Mon. Not. R. Astron. Soc. 420, 3047–3070 (2012) doi:10.1111/j.1365-2966.2012.20193.x
The effect of 12C + 12C rate uncertainties on the evolution andnucleosynthesis of massive stars
M. E. Bennett,1�† R. Hirschi,1,2† M. Pignatari,3† S. Diehl,4† C. Fryer,5† F. Herwig,6†A. Hungerford,5† K. Nomoto,7 G. Rockefeller,5† F. X. Timmes8,9† and M. Wiescher8
1Astrophysics Group, Keele University, Staffordshire ST5 5BG2IPMU, University of Tokyo, Kashiwa, Chiba 277-8582, Japan3Department of Physics, Basel University, Klingelbergstrasse 82, 4056 Basel, Switzerland4Theoretical Astrophysics (T-6), LANL, Los Alamos, NM 87545, USA5Computational Physics and Methods (CCS-2), LANL, Los Alamos, NM 87545, USA6Department of Physics and Astronomy, Victoria, BC V8W 3P6, Canada7Institute for Physics and Mathematics of the Universe, University of Tokyo, Kashiwa, Chiba 277-8583, Japan8Joint Institute for Nuclear Astrophysics, University of Notre Dame, IN 46556, USA9School of Earth and Space Exploration, University of Arizona, Tempe, AZ 85287, USA
Accepted 2011 November 13. Received 2011 November 11; in original form 2011 August 19
ABSTRACTOver the last 40 years, the 12C + 12C fusion reaction has been the subject of considerableexperimental efforts to constrain uncertainties at temperatures relevant for stellar nucleosyn-thesis. Recent studies have indicated that the reaction rate may be higher than that currentlyused in stellar models. In order to investigate the effect of an enhanced carbon-burning rateon massive star structure and nucleosynthesis, new stellar evolution models and their yieldsare presented exploring the impact of three different 12C + 12C reaction rates. Non-rotatingstellar models considering five different initial masses, 15, 20, 25, 32 and 60 M�, at solarmetallicity, were generated using the Geneva Stellar Evolution Code (GENEC) and were laterpost-processed with the NuGrid Multi-zone Post-Processing Network tool (MPPNP). A dynamicnuclear reaction network of ∼1100 isotopes was used to track the s-process nucleosynthesis.An enhanced 12C + 12C reaction rate causes core carbon burning to be ignited more promptlyand at lower temperature. This reduces the neutrino losses, which increases the core carbon-burning lifetime. An increased carbon-burning rate also increases the upper initial mass limitfor which a star exhibits a convective carbon core (rather than a radiative one). Carbon-shellburning is also affected, with fewer convective-shell episodes and convection zones that tendto be larger in mass. Consequently, the chance of an overlap between the ashes of carbon-coreburning and the following carbon shell convection zones is increased, which can cause a por-tion of the ashes of carbon-core burning to be included in the carbon shell. Therefore, duringthe supernova explosion, the ejecta will be enriched by s-process nuclides synthesized fromthe carbon-core s-process. The yields were used to estimate the weak s-process componentin order to compare with the Solar system abundance distribution. The enhanced rate modelswere found to produce a significant proportion of Kr, Sr, Y, Zr, Mo, Ru, Pd and Cd in the weakcomponent, which is primarily the signature of the carbon-core s-process. Consequently, it isshown that the production of isotopes in the Kr–Sr region can be used to constrain the 12C +12C rate using the current branching ratio for α- and p-exit channels.
Key words: nuclear reactions, nucleosynthesis, abundances – stars: abundances – stars:evolution.
�E-mail: [email protected]†The NuGrid collaboration.
1 IN T RO D U C T I O N
Despite the limitations of one-dimensional (1D) stellar models, theircapability to reproduce several observables makes them a funda-mental tool to understand stellar nucleosynthesis sites in the Galaxy.
C© 2012 The AuthorsMonthly Notices of the Royal Astronomical Society C© 2012 RAS
Dow
nloaded from https://academ
ic.oup.com/m
nras/article/420/4/3047/972505 by guest on 01 August 2022
3048 M. E. Bennett et al.
Calculated stellar abundances can be compared with observed abun-dances from meteoritic data or stellar spectra. In massive stars (M >
8 M�) the presence of advanced burning stages during their evolu-tion and their final fate as a supernova explosion provides a usefultest-bed for many sensitivity studies, which are important to con-strain uncertainties in input physics. In particular, nuclear reactionrates are often found to be sources of uncertainty as the task of ex-perimentally determining precise cross-sections at astrophysicallyrelevant energies is often difficult. The 12C + 12C reaction is a goodexample where, despite over four decades of research, the reac-tion rate still carries substantial uncertainties because of the nuclearstructure and reaction dynamics governing the low-energy cross-section of the fusion process (Strieder 2010). The extrapolation ofthe laboratory data into the stellar energy range – Gamow peakenergies (E0 � 1.5 MeV or T � 0.5 GK) – depends critically ona reliable theoretical treatment of the reaction mechanism. Presentmodel extrapolations differ by orders of magnitude; this affects di-rectly the reaction rate with significant impact on a number of stellarburning scenarios (Gasques et al. 2007).
The 12C + 12C reaction cross-section is characterized by a com-plex resonance structure, associated either with scattering statesin the nucleon–nucleon potential or with quasi-molecular states ofthe compound nucleus 24Mg (Imanishi 1968), which at low energiescan be described by a resonant-part superimposed on a non-resonantpart, where the latter is also rather uncertain (Yakovlev et al. 2010).A theory that predicts the location and strength of the resonant-parthas not yet been proposed (Strieder 2008), but resonance charac-teristics can be determined either by coupled-channel calculationsor by optical model potentials based on, for example, α-particlecondensates or cluster structures (Betts & Wuosmaa 1997; Xu et al.2010, and references therein). Resonances have consequently beenpredicted by both approaches at energies ∼2 MeV (Michaud & Vogt1972; Perez-Torres, Belyaeva & Aguilera 2006) and it was shownthat the experimentally observed data could be reasonably well re-produced in the framework of these models (Kondo, Matsuse & Abe1978). Yet, none of these models provides the quantitative accuracyin resonance parameter predictions required for a reliable extrap-olation of the data into the stellar energy range. Complementaryto the classical potential model approach, dynamic reaction theo-ries are being developed. They have been tested successfully forfusion of spherical nuclei like 16O + 16O (Diaz-Torres, Gasques &Wiescher 2007), but the theoretical treatment of fusion reactions oftwo deformed 12C nuclei requires a non-axial symmetric formalismfor a fully reliable treatment (Diaz-Torres 2008).
Taking a phenomenological approach, a resonance with strength(ωγ ) � 3.4 × 10⁻⁷ eV has been invoked to correct the ignition depthof neutron star superbursts (Cooper, Steiner & Brown 2009), whichare believed to be caused by ignition of carbon-burning reactions,triggering a thermonuclear runaway in the crust of a neutron star.Type Ia supernovae should also exhibit changes to the ignitioncharacteristics, but these conditions (other than central density) areless sensitive to an enhancement in the carbon-burning rate (Cooperet al. 2009; Iapichino & Lesaffre 2010). The possible existence ofsuch a resonance, associated with a pronounced 12C + 12C clusterstructure of the compound nucleus 24Mg, represents a source ofuncertainty.
Alternatively, the reaction rate may not be dominated by res-onances at lower energies because of predictions that the cross-section drops much steeper than usually anticipated due to a fusionhindrance reported in heavy-ion reactions (see for example Jianget al. 2004, 2007). The consequences of the hindrance phenomenonfor the 12C+ 12C reaction in astrophysical scenarios were examined
by Gasques et al. (2007), where it was demonstrated that hindranceis much more significant in the pycnonuclear regime than the ther-monuclear regime, but does exhibit a noticeable effect on the yieldsof massive stars. The reduced rate, by approximately a factor of10–100 at carbon-burning temperatures (see their fig. 1), increasesthe temperature with which carbon burning occurs and thereforeaffects the nucleosynthesis. Changes in the yields were generallyrather small, but some specific isotopes, such as 26Al, 40Ca, 46Ca,46Ti, 50Cr, 60Fe, 74Se, 78Kr and 84Sr, exhibited larger changes mostlikely due to the increased neutron density exhibited by the burningof neutron sources at higher temperatures.
The wide range of presently discussed model predictions requiresnew experimental effort to reduce the uncertainty range. However,the measurements towards low energies are extremely difficult, be-cause the low cross-section (σ � 1 nbarn) limits the experimentalyield to an event rate below the natural and beam-induced back-ground events in the detectors. Particle measurements are difficultbecause of the limited energy resolution of the particle detectorswhich makes a separation of the particle groups extremely difficultat the low count rate conditions. Beam-induced background from re-actions on target impurities is therefore difficult to distinguish fromthe actual reaction products (Zickefoose et al. 2010). The measure-ment of secondary gamma radiation associated with the particledecay is also handicapped by natural and cosmic ray-induced back-ground radiation (Strieder 2010). While recent experiments suggestan increase in the low-energy S-factor indicating the possibility ofnarrow resonances at lower energies (Aguilera et al. 2006; Barron-Palos et al. 2006; Spillane et al. 2007), the confirmation of the resultsand the experimental pursuit towards lower energies is stalled dueto the present inability to differentiate the reaction data from the dif-ferent background components (Zickefoose et al. 2010). Improvedexperimental conditions require the preparation of ultra-pure targetmaterials for experiments in a cosmic ray shielded undergroundenvironment (Strieder 2010).
The three dominant carbon-burning reactions, with Q-values, are
12C(12C, α)20Ne, Q = +4.617, (1.1)
12C(12C, p)23Na, Q = +2.240, (1.2)
12C(12C, n)23Mg, Q = −2.599. (1.3)
During carbon burning, the α- and p-channels dominate withthe n-channel, making up less than 1 per cent of all 12C + 12Creactions (Dayras, Switkowski & Woosley 1977). At this stage,the composition of the star is largely 12C and 16O, with the initialratio of 12C to 16O at this stage largely governed by the 12C(α,γ )16O reactions occurring during helium-core burning. Carbon-coreburning occurs at a central temperature of ∼0.7 GK and producesmainly 20Ne and 24Mg, since ∼99 per cent of 23Na synthesizedthrough the p-channel is destroyed via efficient 23Na(p, α)20Ne and23Na(p, γ )24Mg reactions (Arnett & Thielemann 1985). Carbon-core burning, which is convective for stars with initial mass M �20 M� and radiative for M � 20 M� (see for example Hirschi,Meynet & Maeder 2005), is followed by convective carbon-shellburning episodes at temperatures of ∼0.8–1.4 GK. The numberof episodes and the spatial extent of each shell differs betweenmassive stars of different initial mass as the development of thecarbon shells is sensitive to the spatial 12C profile at the end ofhelium-core burning; the formation of a convective carbon shelloften lies at the same spatial coordinate as the top of the previousconvective shell (Arnett 1972; El Eid, Meyer & The 2004). Thepresence of a convective carbon core depends on the CO core mass
C© 2012 The Authors, MNRAS 420, 3047–3070Monthly Notices of the Royal Astronomical Society C© 2012 RAS
Dow
nloaded from https://academ
ic.oup.com/m
nras/article/420/4/3047/972505 by guest on 01 August 2022
The effect of 12C + 12C rate uncertainties 3049
as both the neutrino losses and energy generation rate depend onthe density, which decreases with increasing CO core mass (Arnett1972; Woosley & Weaver 1986; Limongi, Straniero & Chieffi 2000).Consequently, mechanisms that affect the CO core mass or thecarbon-burning energy budget, such as rotation (Hirschi, Meynet& Maeder 2004) and the 12C abundance following helium burning(Imbriani et al. 2001; El Eid, The & Meyer 2009), will affect thelimiting mass for the presence of a convective core.
Massive stars are a site for the s-process, which starts duringhelium-core burning and also occurs during the following carbon-burning stages. The s-process nucleosynthesis also occurs in the he-lium shell via the 22Ne neutron source, but this process is marginalcompared to the s-process operating in the helium core or the carbonshells (see for example The, El Eid & Meyer 2007). Beyond car-bon burning, the temperature becomes high enough in the interior(∼2 GK) for photodisintegration reactions to destroy heavy nu-clides. Because the s-process can probably occur during both cen-tral and shell carbon burning, one can expect that changes in the12C + 12C rate affect the stellar structure and nucleosynthesis andtherefore also the s-process.
The 22Ne neutron source, which is formed during helium burningvia the 14N(α, γ )18F(β+)18O(α, γ )22Ne reaction chain is the mainneutron source (Peters 1968; Couch, Schmiedekamp & Arnett 1974;Lamb et al. 1977). As the temperature approaches 0.25 GK near theend of helium burning, 22Ne(α, n)25Mg reactions become efficient(Busso & Gallino 1985; Raiteri et al. 1991a). During this phase, a25–M� star, for example, has a neutron density nn ∼ 106 cm−3 anda neutron exposure τn ∼ 0.2 mb−1 (see for instance Pignatari et al.2010, and references therein). The 22Ne source becomes efficientin a convective environment and heavy elements formed throughneutron captures are mixed out from the centre of the star. Some ofthese abundances will be modified by further explosive nucleosyn-thesis later in the evolution, but will otherwise survive long enoughto be present in the supernova ejecta and contribute to the totalyields of the star. Consequently, 22Ne in massive stars is the dom-inant neutron source responsible for the classical weak s-processcomponent (Truran & Iben 1977; Prantzos, Arnould & Arcoragi1987; Kappeler, Beer & Wisshak 1989; Raiteri et al. 1991b).
Any remaining 22Ne present at the end of helium-core burningis later reignited during carbon-shell burning, resulting in an s-process with a higher neutron density and a lower neutron exposure(nn ∼ 1011−12 cm−3 and τn ∼ 0.06 mb−1; Raiteri et al. 1991b). Theincreased neutron density is responsible for changing the branch-ing ratios of unstable isotopes, which is particularly important forbranching isotopes, such as 69Zn, 79Se and 85Kr, since they inhabitpositions in the isotope chart of nuclides where different s-processpaths across the valley of stability are available (Kappeler et al.1989). The increase in neutron density is responsible for openingthe s-process path so that the carbon-shell burning contribution tospecific isotopes, such as 70Zn, 86Kr and 80Se, may be relevant (seefor example Raiteri et al. 1991b; The et al. 2007).
Another potential neutron source is 13C, which is formedthrough the 12C(p,γ )13N(β+)13C reaction chain (Arnett & Truran1969). During carbon-core burning, this neutron source, via the13C(α, n)16O reaction, becomes efficient, which results in an s-process in the carbon core with a typical neutron density ofnn = 107 cm−3 (Arnett & Thielemann 1985; Chieffi, Limongi& Straniero 1998). The abundance of 13C is dependent on the13N(γ , p)12C reaction, which dominates the depletion of 13N at tem-peratures above 0.8 GK. The 22Ne neutron source is the dominantneutron source when the temperature rises above such a tempera-ture, although the 13C neutron source may also provide an important
contribution to the total neutron exposure (Clayton 1968; Arcoragi,Langer & Arnould 1991). In any case, the carbon-core s-process oc-curs primarily in radiative conditions with a relatively small neutronexposure and any heavy elements synthesized via the ensuing neu-tron captures usually remain in the core (see however the discussionon overlapping convection zones in Section 4); photodisintegrationand the supernova explosion process will ensure that these elementsare not present in the final ejecta and do not contribute to the finalyields of the star (see for example Chieffi et al. 1998).
A preliminary study (Bennett et al. 2010a) found that changes tothe total 12C + 12C rates within a factor of 10 affect the convectionzone structure and nucleosynthesis of a 25-M� star at solar metal-licity. The main conclusions were an increase in the carbon-burningshell contribution to the s-process abundances by two different sce-narios. The first, applicable to the case where the rate was increasedby a factor of 10, was due to the presence of large carbon-burningshells that ‘overlapped’. In this situation, the second carbon-burningshell was polluted with ashes from the first carbon-burning shell,modifying the overall composition. The second scenario, applica-ble to the case where the rate was reduced by a factor of 10, wasan increase in neutron density associated with the neutron source,22Ne, burning at a higher temperature in the convective shell. Theoverall increase in the abundances of most isotopes with 60 < A <
90 was approximately 0.1–0.4 dex. Strongly enhanced rates werealso investigated (Bennett et al. 2010b), which show that the pres-ence of a larger convective core has a significant impact on the totalyields, since the convective core adds an additional neutron expo-sure towards the total contribution of s-process yields; abundancesof many heavy nuclides increased by up to ∼2 dex. However, nocomparison could be made with observations as a 25-M� stellarmodel (at solar metallicity) was the only one considered.
In this paper, a sensitivity study is made over a set of massivestar models, at solar metallicity, to determine whether a comparisonbetween the yields and the Solar system abundances can constrainthe 12C + 12C rate. Section 2 explains the models and the choice ofinput physics in the simulations. In Section 3, the changes in stel-lar structure are analysed. Section 4 describes the nucleosynthesis,focusing on the s-process during carbon-core and carbon-shell burn-ing. Section 5 presents the yields. The discussion and conclusionscan be found in Sections 6 and 7, respectively.
2 C O M P U TAT I O NA L A P P ROAC H
2.1 The 12C + 12C reaction rates
We build on the previous work (Bennett et al. 2010b) where threecarbon-burning rates in a 25–M� star were considered. These are theCaughlan & Fowler (1988) ‘standard’ rate (ST) and two enhancedrates: an ‘upper limit’ rate (CU) and an intermediate rate (CI), thelatter of which is a geometric mean of the ST and CU rates. The CUrate is the ST rate including a resonance of strength (ωγ ) = 6.8 ×10⁻⁵ eV at a centre-of-mass energy Ecom = 1.5 MeV. This choiceof resonance originates from a preliminary particle spectroscopyexperiment on 12C + 12C obtained at the CIRCE radioactive beamfacility in Caserta/Napoli, Italy (Terrasi et al. 2007). Although theCI rate was determined via a geometric mean, a resonance thatwould replicate the peak at 1.5 MeV for this rate would have amagnitude of (ωγ ) � 3.4 × 10⁻⁷ eV. The top panel of Fig. 1 showsthe Maxwellian-averaged cross-sections of the reaction rates as afunction of temperature. The bottom panel shows the reaction ratesrelative to the ST rate. As indicated by Fig. 1, the peak of the CU andCI rates is at ∼0.5 GK and is a factor of approximately 50 000 and
C© 2012 The Authors, MNRAS 420, 3047–3070Monthly Notices of the Royal Astronomical Society C© 2012 RAS
Dow
nloaded from https://academ
ic.oup.com/m
nras/article/420/4/3047/972505 by guest on 01 August 2022

3050 M. E. Bennett et al.
Figure 1. Top panel: Maxwellian-averaged cross-sections for 12C + 12Crates used in Bennett et al. (2010b) and also in this study. The three rates arethe Caughlan & Fowler (1988) ‘standard’ rate (ST), an upper limit rate (CU)and an intermediate rate (CI). The CI rate is a geometric mean of the ST andCU rates. Bottom panel: the Maxwellian-averaged cross-sections relative tothe ST rate.
250 times the ST rate at that temperature, respectively. The choiceof branching ratio for the α- and p-exit channels is 13:7, which isvalid within the energy range 4.42 < Ecom < 6.48 MeV (Aguileraet al. 2006). It is assumed in this work that the branching ratio ispreserved to lower centre-of-mass energies. For the n-exit channel,we use the branching ratio from Dayras et al. (1977).
2.2 Stellar models
Non-rotating stellar models at solar metallicity (Z = 0.02) weregenerated using the Geneva Stellar Evolution Code (GENEC), with asmall nuclear reaction network that takes into account the reactionsimportant for energy generation. Five masses were considered foreach carbon-burning rate, which are 15, 20, 25, 32 and 60 M�, for atotal of 15 stellar models. These will be referred to as XXYY, whereXX is the initial mass of the star in solar masses and YY denotesthe rate and is ‘ST’, ‘CI’ or ‘CU’ for the standard, intermediateand upper limit rates, respectively. The reason for this choice ofinitial masses is to provide yields data over a range of masses withapproximately even spacing in log space.
GENEC is described in detail in Eggenberger et al. (2008), butsome important features are recalled here for convenience. TheSchwarzschild criterion for convection is used and convective mix-ing is treated as a diffusive process from oxygen burning onwards.No overshooting is included except for hydrogen- and helium-
burning cores, where an overshooting parameter of α = 0.2HP
is used. Neutrino loss rates are calculated using fitting formulaefrom Itoh et al. (1989), which are the same as those of the morerecent evaluation from Itoh et al. (1996) for pair and photoneutrinoprocesses. The initial abundances used were those of Grevesse &Noels (1993), which correspond directly to the OPAL opacity tablesused (Rogers, Swenson & Iglesias 1996). For lower temperatures,opacities from Ferguson et al. (2005) are used.
Several mass-loss rates are used depending on the effective tem-perature, Teff , and the evolutionary stage of the star. For main-sequence massive stars, where log Teff > 3.9, mass-loss rates aretaken from Vink, de Koter & Lamers (2001). Otherwise the ratesare taken from de Jager, Nieuwenhuijzen & van der Hucht (1988).However, for lower temperatures (log Teff < 3.7), a scaling law ofthe form
M = −1.479 × 10⁻¹⁴ ×(
L
L�
)1.7
(2.1)
is used, where M is the mass-loss rate in solar masses per year,L is the total luminosity and L� is the solar luminosity. For arecent discussion on mass-loss rates in the red-supergiant phase,see Mauron & Josselin (2011). During the Wolf–Rayet (WR) phase,mass-loss rates by Nugis & Lamers (2000) are used.
In GENEC, the reaction rates are chosen to be those of the NACREcompilation; Angulo et al. (1999) for the experimental rates andfrom their website1 for theoretical rates. However, there are a fewexceptions. The rate of Mukhamedzhanov et al. (2003) was usedfor 14N(p, γ )15O below 0.1 GK and the lower limit NACRE ratewas used for temperatures above 0.1 GK. This combined rate isvery similar to the more recent LUNA rate (Imbriani et al. 2005) atrelevant temperatures. The Fynbo (2005) rate was used for the 3α
reaction and the Kunz et al. (2002) rate was used for 12C(α, γ )16O.The 22Ne(α,n)25Mg rate was taken from Jaeger et al. (2001) andused for the available temperature range (T ≤ 1 GK). Above thisrange, the NACRE rate was used. The 22Ne(α,n)25Mg rate competeswith 22Ne(α, γ )26Mg for α–particles. For this rate, the NACRE ratewas used. The 16O neutron poison is effective at capturing neutrons,forming 17O, which can either resupply the ‘recycled’ neutrons viathe 17O(α,n)20Ne reaction or undergo the competing reaction 17O(α,γ )21Ne. For 17O(α, n)20Ne the NACRE reaction is used and for the17O(α, γ )21Ne reaction the correction of the Caughlan & Fowler(1988) rate by Descouvemont (1993) is applied.
The models were calculated for as far into the evolution as pos-sible, which for most models is after or during the silicon-burningstage. The models that ceased before silicon burning were the 15CI,15CU, 60CI and 60CU models, which proceeded to oxygen-shellburning, and the 20CI and 20CU models, which proceeded to justafter the oxygen-shell burning stage. The s-process yields are notsignificantly affected by hydrostatic burning stages following oxy-gen burning because most of the isotopes produced via the s-processwill be destroyed by photodisintegration and the choice of remnantmass for the supernova explosion, which defines the boundary be-tween matter that falls back on to the remnant and matter that formssupernova ejecta, reduces the impact of nucleosynthesis that neon-,oxygen- and silicon-burning stages would have on the total yields(see also Section 5.1). However, it must be noted that there willbe explosive burning processes during the supernova explosion andphotodisintegration occurring at the bottom of the convective car-bon, neon and oxygen shells during the advanced stages, which will
1 http://pntpm3.ulb.ac.be/Nacre/nacre.htm
C© 2012 The Authors, MNRAS 420, 3047–3070Monthly Notices of the Royal Astronomical Society C© 2012 RAS
Dow
nloaded from https://academ
ic.oup.com/m
nras/article/420/4/3047/972505 by guest on 01 August 2022
The effect of 12C + 12C rate uncertainties 3051
affect the abundances (see for example Rauscher et al. 2002; Tur,Heger & Austin 2009). In this work, the contribution of explosiveburning and photodisintegration to the total yields is not considered.
Since the 12C + 12C reactions do not become efficient until afterhelium-core burning, the CU and CI models for a particular choice ofinitial mass were started just before the end of helium-core burningusing the ST model data as initial conditions, reducing some of thecomputational expense.
2.3 Post-processing
The NuGrid2 Multi-Zone Post-Processing tool (the parallel variant;MPPNP) is described in Herwig et al. (2008) and Pignatari et al. (inpreparation). See also Appendix A for details of the parallel im-plementation. The system of equations for the rate of change ofabundances of isotopes is solved using an implicit finite differenc-ing method combined with the Newton–Raphson scheme, with theoutput temperature, density and the distribution of convection (andradiation) zones from GENEC as input. Additional features have beenincluded to enhance the calculations or save on unnecessary com-putations. Sub-timesteps are inserted where appropriate to improveconvergence in the case where the time-scale of reactions is smallerthan the stellar evolution timestep. Also, the nuclear network isdynamic, adding or removing isotopes from the network depend-ing on the stellar conditions (up to the maximal network definedin Table 1). This is useful in reducing the number of computationsassociated with nuclear reactions where the change in abundance iszero or negligible. The same (adaptive) mesh as used in GENEC wasused for the post-processing calculations.
The nuclear networks used are shown in Fig. 2. The isotopes usedin each network are discriminated depending on whether they areinvolved in reactions important for energy generation (featured inboth the stellar model and the post-processing tool) or not (featuredonly in the post-processing tool). GENEC uses a skeleton networkof 31 isotopes, which is the same network as used in previousGENEC models (see for example Hirschi et al. 2004, 2005). Thisnetwork is a combination of fundamental isotopes relevant for pp-chain reactions, the CNO tricycle and helium burning and a networksimilar to the α7 network of Hix et al. (1998), enacted during theadvanced burning stages, which reduces the computational expenseassociated with a larger network without causing significant errorsin energy generation rates. The isotopes included in the networkfor MPPNP are specified in Table 1 and are shown in Fig. 2. Fiveisomeric states are also included, which are treated as separatenuclei from their ground state equivalents. These are 26Alm, 85Krm,115Cdm, 176Lum and 180Tam.
The reaction rates in MPPNP were set to those used in the skele-ton network of GENEC, as specified in Section 2.2, for the samereactions. Additional reactions are taken from the default set-upof MPPNP and are specified as follows. Charged particle reactionsare from Angulo et al. (1999) and Iliadis et al. (2001). β-decaysand electron captures are from Oda et al. (1994), Fuller, Fowler &Newman (1985) and Aikawa et al. (2005). Neutron captures arefrom the Karlsruhe astrophysical data base of nucleosynthesis instars (KADoNiS) (Dillmann et al. 2006). For reactions not foundin these references, reaction rates from the REACLIB data base3 wereused, which incorporates a compilation of experimental rates andtheoretical rates from NON-SMOKER (Rauscher & Thielemann 2000,2001).
2 http://forum.astro.keele.ac.uk:8080/nugrid3 http://nucastro.org/reaclib.html
Table 1. Nuclides included in the nuclear reaction net-work used for the post-processing calculations.
Element Amin Amax Element Amin Amax
n 1 1 Tc 93 105H 1 2 Ru 94 106He 3 4 Rh 98 108Li 7 7 Pd 99 112Be 7 8 Ag 101 113Ba 8 11 Cd 102 118C 11 14 In 106 119N 13 15 Sn 108 130O 14 18 Sb 112 133F 17 20 Te 114 134Ne 19 22 I 117 135Na 21 24 Xe 118 138Mg 23 28 Cs 123 139Al 25 29 Ba 124 142Si 27 32 La 127 143P 29 35 Ce 130 146S 31 38 Pr 133 149Cl 34 40 Nd 134 152Ar 35 44 Pm 137 154K 38 46 Sm 140 158Ca 39 49 Eu 143 159Sc 43 50 Gd 144 162Ti 44 52 Tb 147 165V 47 53 Dy 148 168Cr 48 56 Ho 153 169Mn 51 57 Er 154 175Fe 52 61 Tm 159 176Co 55 63 Yb 160 180Ni 56 68 Lu 165 182Cu 60 71 Hf 166 185Zn 62 74 Ta 169 186Ga 65 75 W 172 190Ge 66 78 Re 175 191As 69 81 Os 179 196Se 72 84 Ir 181 197Br 74 87 Pt 184 202Kr 76 90 Au 185 203Rb 79 91 Hg 189 208Sr 80 94 Tl 192 210Y 85 96 Pb 193 211Zr 86 98 Bi 202 211Nb 89 99 Po 204 210Mo 90 102
a 9B is not included.
3 ST E L L A R ST RU C T U R E A N D E VO L U T I O N
3.1 Hydrogen and helium burning
The evolution of each stellar model during hydrogen and heliumburning is given entirely by the ST models, as the CI and CU modelswere started using the profile just before the end of helium burning.Fig. 3 shows the Hertzsprung–Russell (HR) diagram for all mod-els, which shows that the evolutionary tracks for all models followtheir course in the HR diagram primarily during the hydrogen- andhelium-burning phases and are not modified by enhanced rates. Thereason for this is that the surface evolution of the stellar models isunaffected by changes in the carbon-burning rate, which is a conse-quence of the small time-scale for burning associated with advancedburning stages in massive stars; the envelope has insufficient timeto react significantly to changes in core properties.
C© 2012 The Authors, MNRAS 420, 3047–3070Monthly Notices of the Royal Astronomical Society C© 2012 RAS
Dow
nloaded from https://academ
ic.oup.com/m
nras/article/420/4/3047/972505 by guest on 01 August 2022
3052 M. E. Bennett et al.
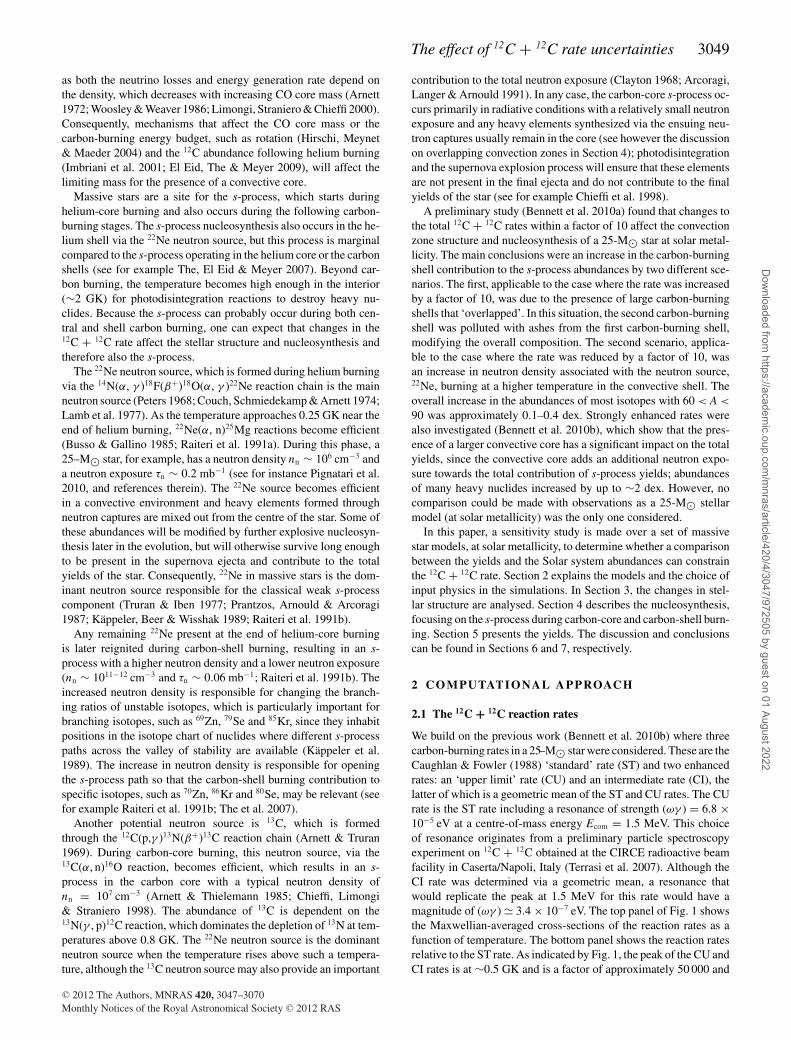
Figure 2. Chart of isotopes indicating the nuclear reaction networks used in this work: GENEC (blue squares) and MPPNP (pale red squares). The network usedby MPPNP includes all stable isotopes, which are indicated by black squares. The outer boundary to each side of the valley of stability indicates the position ofall currently known isotopes, including heavy transuranic isotopes. Parallel grid lines indicate values of Z or N that are magic as specified in the nuclear shellmodel (2, 8, 20, 28, 50, 82, 126).
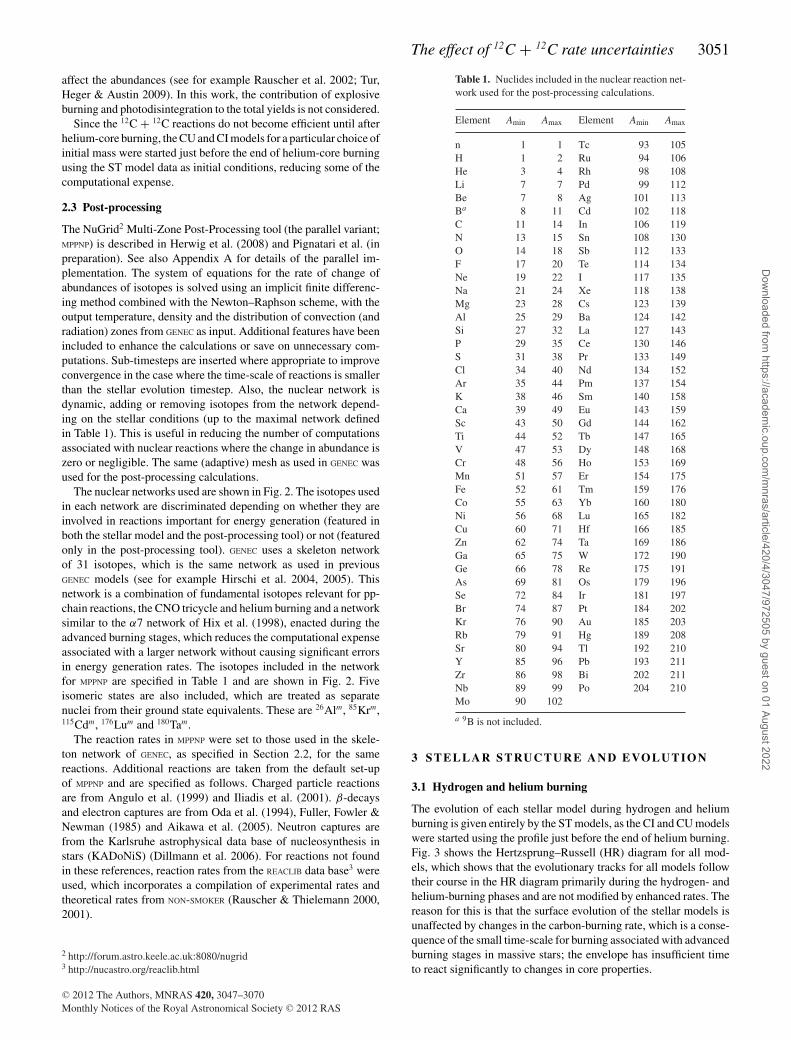
Figure 3. The HR diagram for all models. Solid black lines refer to ST model tracks, dashed blue lines refer to CI model tracks and the dotted red lines referto the CU model tracks. The tracks indicate that the enhanced rates do not affect the surface evolution, since changes in the carbon-burning rate do not affectthe surface properties. The tracks exhibited by the 32-M� and 60-M� models show evolution into the WR phase, which is explained by mass-loss.
Overall, the ST models are very similar to those previously pub-lished by the Geneva group, such as the non-rotating stars of Meynet& Maeder (2003) and Hirschi et al. (2004). The 15-, 20- and 25-M� model stars evolve towards the red and remain as red super-giants (RSGs) during the advanced stages of evolution. The 32- and
60-M� model stars evolve towards the Humphreys–Davidson limitat log Teff ∼ 3.8 before becoming WR stars.
The 32-M� model star proceeds to the WR phase during heliumburning. This is because the mass-loss is strong enough for thestar to expel the entire hydrogen envelope during helium burning,
C© 2012 The Authors, MNRAS 420, 3047–3070Monthly Notices of the Royal Astronomical Society C© 2012 RAS
Dow
nloaded from https://academ
ic.oup.com/m
nras/article/420/4/3047/972505 by guest on 01 August 2022

The effect of 12C + 12C rate uncertainties 3053
with the composition of the remaining envelope rich in helium. Thelower opacity of the helium-rich envelope lowers the radius andfavours evolution towards the blue (Maeder 2009, section 27.3.2).The deviations from the ST track for the CI or CU tracks for thismass are slightly larger than those for other masses. These deviationsare generally of the order of 0.1 per cent with a maximum deviationof 0.01 in log Teff (�2 per cent), which occurs during the rapidtransit to the blue after helium burning.
The 60-M� star becomes a WR star just after hydrogen burning.At the end of the hydrogen-burning phase, the star enters the first‘loop’ towards the blue (at log Teff � 4.4), which occurs because ofmass-loss being high enough to expose the helium-rich outer layer.Following the first loop to the blue, helium burning is ignited. Duringthis phase the core shrinks, lowering the core fraction, q, favouringevolution to the red (Maeder 2009, section 27.3.2). However, thestar approaches the Humphreys–Davidson limit in the HR diagramduring the evolution and the mass-loss becomes high enough to,eventually, peel away the envelope, exposing the helium-burningcore (q � 75 per cent during helium burning). The star consequentlyevolves towards the blue (at log Teff � 5.0).
3.2 Carbon burning
Unlike the surface evolution, the interior evolution of the star ismodified significantly by the enhanced carbon-burning rates andchanges to the central evolution of the star are important in order toassess changes to the main burning regimes.
Fig. 4 shows Tc–ρc diagrams for the 15-, 20- and 25-M� models,separated into panels by initial mass. The enhanced rate modelsin all cases (including the 32- and 60-M� models) ignite carbon
Figure 4. The Tc–ρc diagram for all 15 (top panel), 20 (middle panel) and25 M� (bottom panel) models. The straight line in each panel indicatesthe location in the diagram where the ideal gas pressure is equal to theelectron degeneracy pressure; Pgas = Pe,deg. Ignition points for convectivecore carbon burning are indicated by the annotation.
burning at lower temperatures and densities, which consequentlyaffects the evolution of the central properties of the star. This isseen, for example, in the top and middle panels of Fig. 4, wherethe curves for the CI and CU cases deviate away from that of theST case towards the higher temperature (at a given density) side ofthe curve (see also column 7 in Table 2). The tendency to deviatein this direction is caused by the presence of a convective core.This is verified in the bottom panel for the case of the 25CU modelwhereby the ‘kink’ at carbon ignition is larger than that of the 25STand 25CI models, since the CU model is the only 25-M� model tohave a convective core (see also Fig. 7).
Fig. 4 shows the impact that the enhanced carbon-burning rateshave on the central evolution during carbon burning. However, de-spite the deviations, many of the models at a particular mass aresimilar, especially the 25-M� models. Fig. 5 shows Tc–ρc dia-grams for the 32- and 60-M� models, which are also quite similar.In the case of Fig. 5, the 32- and 60-M� models exhibit significantmass-loss during the hydrogen- and helium-burning stages such thatthe total mass during the advanced burning stages is very similar(∼13 M�). Combined with the fact that the helium cores at thisstage are qualitatively similar, the models from this point onwardsevolve similarly, with the 32CI and 60CI models entering the moredegenerate region of the diagram. Consequently, the tracks followsimilar paths dependent on the choice of 12C + 12C reaction rate.
Kippenhahn diagrams for all models are presented in Figs 6–8, with the shaded regions corresponding to convection zones andthe intermediate regions corresponding to radiative zones. The totalmass is given by the thin black line at the top of each diagram.Overall, Figs 6–8 show that the convection zone structure of thecarbon-burning stage is heavily modified by the increased rates,particularly for the CU cases where a convective carbon core ispresent over the entire mass range considered. The presence ofa convective carbon core is important for nucleosynthesis as theconvective mixing provides more fuel for carbon burning and thecarbon-core s-process. The mass-loss increases significantly withinitial mass, but does not change much with the 12C + 12C rate.Small deviations in the mass-loss, which are less than 1 per cent,are due to the increased lifetime of the core carbon-burning stagein the CI and CU models (see Table 4).
Model data complementary to Figs 6–8 are presented in Table 2,which specify properties pertaining to convection zones during car-bon burning. Column 2 (‘core/shell’) identifies the presence, ornot, of a convective core or shell and labels the shells in chrono-logical order during the evolution. The other columns specify thelifetime of the convection zone4 (τC) in years, the lower and upperlimits in mass coordinate of the convection zone (Mlow and Mupp,respectively, in M�), the size of the convection zone in mass (M,in M�) and the temperature (T , in GK), density (ρ, in g cm−3)and the mass-fraction abundances of 12C and 16O (X12C and X16O,respectively) at the onset of convection at position Mlow.
The ST models indicate an upper mass limit for the presence of aconvective carbon core with a value between 20 and 25 M�, whichis consistent with previous models (Heger, Langer & Woosley 2000;
4 Many of the convective shells persist until the pre-supernova stage. Inmodels 15CI, 20CI, 25ST, 25CI, 25CU, 32CI, 32CU and 60CU, however,the carbon shell shrinks because of the influence of another burning stage(such as neon or oxygen burning). The convective carbon shell can thereforefeature a rather complicated structure through the following advanced stages.In these cases, the lifetime is calculated from the onset of convection to thepoint where the convective shell shrinks significantly in size.
C© 2012 The Authors, MNRAS 420, 3047–3070Monthly Notices of the Royal Astronomical Society C© 2012 RAS
Dow
nloaded from https://academ
ic.oup.com/m
nras/article/420/4/3047/972505 by guest on 01 August 2022

3054 M. E. Bennett et al.
Table 2. Stellar structure properties for carbon-burning cores and shells at the onset of convection. Shellsare labelled in chronological order. τ conv is the lifetime of the convection zone, Mlow and Mupp are lowerand upper mass coordinates for the location of the zone. M is the size of the zone in mass, T and ρ arethe temperature and density of the zone at Mlow, and X12C and X16O are the 12C and 16O mass-fractionabundances within the convection zone, respectively.
Model Core/shell τ conv Mlow Mupp M T ρ X12C X16O(yr) (M�) (M�) (M�) (GK) (g cm−3)
15ST Core 1458 0 0.588 0.588 0.717 2.367 × 10⁵ 0.2947 0.62961 187.2 0.604 1.293 0.689 0.773 1.816 × 10⁵ 0.3002 0.63322 17.92 1.302 2.435 1.134 0.904 1.936 × 10⁵ 0.0862 0.5041
15CI Core 15 720 0 1.381 1.381 0.589 7.409 × 10⁴ 0.3104 0.64001 150.1 1.396 2.907 1.511 0.758 1.139 × 10⁵ 0.0472 0.4883
15CU Core 51 890 0 1.517 1.517 0.486 3.011 × 10⁴ 0.3192 0.64581 594.2 1.536 3.270 1.734 0.531 3.557 × 10⁴ 0.3185 0.6453
20ST Core 219 0 0.466 0.466 0.783 1.587 × 10⁵ 0.2320 0.64411 41.55 0.507 1.157 0.650 0.843 1.390 × 10⁵ 0.2150 0.63322 13.40 1.024 3.088 1.884 0.873 1.109 × 10⁵ 0.2438 0.65163 0.228 2.021 3.319 1.298 1.132 1.447 × 10⁵ 0.0469 0.5350
20CI Core 5418 0 1.921 1.921 0.626 4.155 × 10⁴ 0.2636 0.66471 290.9 1.047 3.631 2.584 0.781 7.203 × 10⁴ 0.0675 0.54812 1.985 1.784 4.137 2.354 0.872 6.615 × 10⁴ 0.0488 0.5380
20CU Core 32 280 0 2.771 2.771 0.498 1.553 × 10⁴ 0.2861 0.67941 10.05 2.158 2.609 0.450 0.712 4.792 × 10⁴ 0.0147 0.52752 3.714 2.815 4.696 1.880 0.592 2.706 × 10⁴ 0.2861 0.6794
25ST 1 3.734 1.819 5.928 4.109 0.946 1.017 × 10⁵ 0.1449 0.630625CI 1 925.4 0.436 2.075 1.640 0.718 3.656 × 10⁴ 0.1830 0.6554
2 12.69 2.111 6.208 4.097 0.516 3.893 × 10⁴ 0.2492 0.697525CU Core 22 520 0 4.452 4.452 0.510 1.191 × 10⁴ 0.2586 0.7038
1 34.77 1.954 6.429 4.475 0.735 3.622 × 10⁴ 0.0191 0.565632ST 1 0.373 2.586 8.948 6.361 1.059 7.925 × 10⁴ 0.1346 0.686932CI 1 33.06 1.869 8.789 6.920 0.773 3.290 × 10⁴ 0.1507 0.697332CU Core 13 780 0 6.897 6.897 0.539 1.001 × 10⁴ 0.2164 0.7399
1 5.679 2.774 9.077 6.303 0.710 2.390 × 10⁴ 0.0269 0.626560ST 1 0.260 2.900 10.12 7.221 1.073 7.159 × 10⁴ 0.1360 0.679460CI 1 15.04 2.171 10.04 7.866 0.793 3.080 × 10⁴ 0.1541 0.691160CU Core 12 900 0 8.326 8.326 0.542 9.210 × 10³ 0.2205 0.7341
1 4.276 2.975 10.39 7.412 0.721 2.207 × 10⁴ 0.0309 0.6207
Figure 5. The Tc–ρc diagram for all 32- and 60-M� models. The straightline indicates the location in the diagram where the ideal gas pressure isequal to the electron degeneracy pressure; Pgas = Pe,deg.
Hirschi et al. 2004). For model 25CI, a strong convective shell isignited slightly off-centre (at a mass coordinate of 0.436 M�), andmodel 25CU exhibits a large convective carbon core. In all CU mod-els, the carbon-core burning stage is convective, which, in models25CU, 32CU and 60CU, replaces the radiative cores. In model 25CIthe first carbon shell ignites close to the centre and models 20CIand 15CI have larger convective cores. Considering these facts andthe presence of a convective core in every CU model, one can hy-pothesize that the limiting mass for the presence of a convectivecarbon core increases with the carbon-burning rate, which will con-sequently represent a source of uncertainty for the presence of aconvective core near to the limiting mass of ∼22 M�. A firm veri-fication of the limiting mass for the CI case would however requirea finer grid of stellar models between 20 and 25 M�.
The sizes, in mass, of the carbon-burning zones (column 6 inTable 2) are generally larger in the CI and CU models. This affectsthe 12C abundance profile within the star and consequently the num-ber of carbon-burning shells during the evolution. The Kippenhahndiagrams for the 15- and 20-M� models (Fig. 6) demonstrate thiseffect fairly well; the 15ST and 20ST models have many carbon-burning shells where the ignition of a successive shell lies at a
C© 2012 The Authors, MNRAS 420, 3047–3070Monthly Notices of the Royal Astronomical Society C© 2012 RAS
Dow
nloaded from https://academ
ic.oup.com/m
nras/article/420/4/3047/972505 by guest on 01 August 2022
The effect of 12C + 12C rate uncertainties 3055
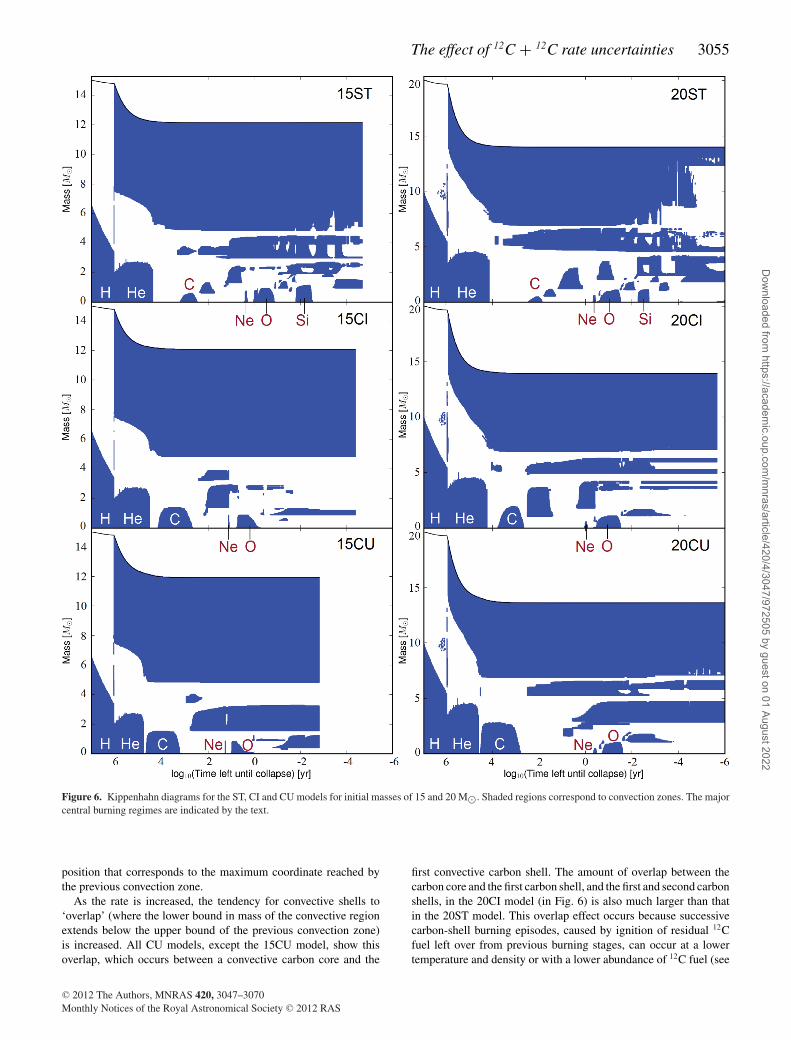
Figure 6. Kippenhahn diagrams for the ST, CI and CU models for initial masses of 15 and 20 M�. Shaded regions correspond to convection zones. The majorcentral burning regimes are indicated by the text.
position that corresponds to the maximum coordinate reached bythe previous convection zone.
As the rate is increased, the tendency for convective shells to‘overlap’ (where the lower bound in mass of the convective regionextends below the upper bound of the previous convection zone)is increased. All CU models, except the 15CU model, show thisoverlap, which occurs between a convective carbon core and the
first convective carbon shell. The amount of overlap between thecarbon core and the first carbon shell, and the first and second carbonshells, in the 20CI model (in Fig. 6) is also much larger than thatin the 20ST model. This overlap effect occurs because successivecarbon-shell burning episodes, caused by ignition of residual 12Cfuel left over from previous burning stages, can occur at a lowertemperature and density or with a lower abundance of 12C fuel (see
C© 2012 The Authors, MNRAS 420, 3047–3070Monthly Notices of the Royal Astronomical Society C© 2012 RAS
Dow
nloaded from https://academ
ic.oup.com/m
nras/article/420/4/3047/972505 by guest on 01 August 2022
3056 M. E. Bennett et al.
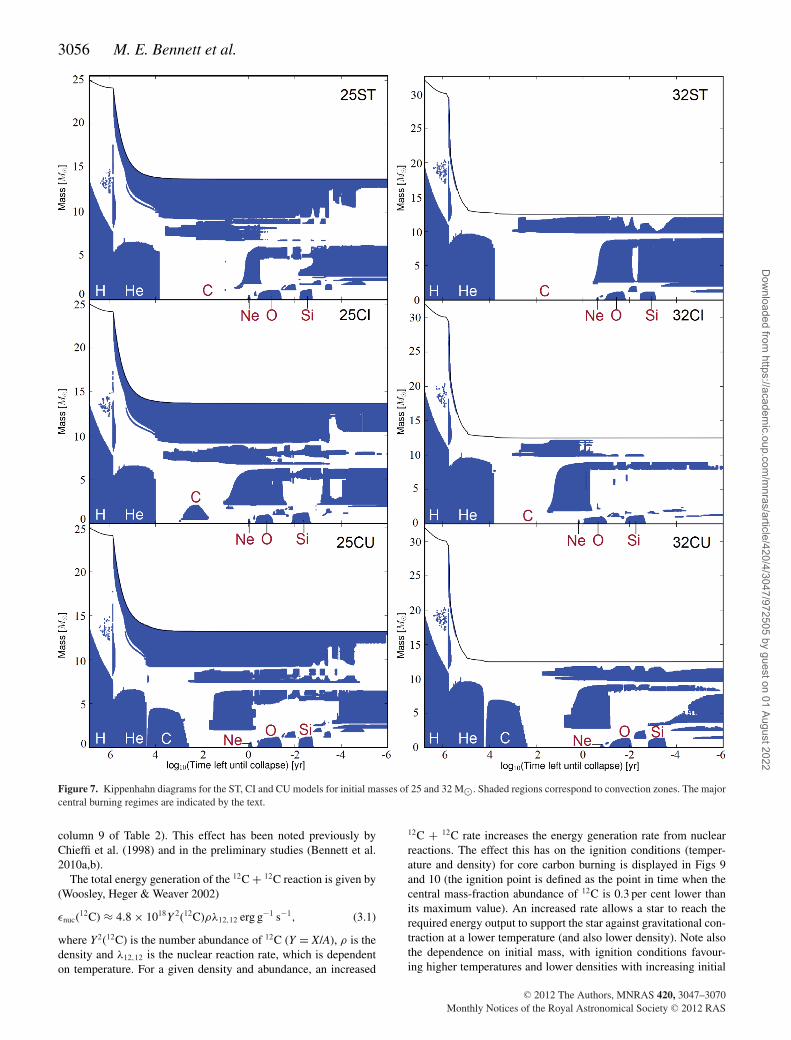
Figure 7. Kippenhahn diagrams for the ST, CI and CU models for initial masses of 25 and 32 M�. Shaded regions correspond to convection zones. The majorcentral burning regimes are indicated by the text.
column 9 of Table 2). This effect has been noted previously byChieffi et al. (1998) and in the preliminary studies (Bennett et al.2010a,b).
The total energy generation of the 12C + 12C reaction is given by(Woosley, Heger & Weaver 2002)
εnuc(12C) ≈ 4.8 × 10¹⁸Y 2(12C)ρλ12,12 erg g−1 s−1, (3.1)
where Y2(12C) is the number abundance of 12C (Y = X/A), ρ is thedensity and λ12,12 is the nuclear reaction rate, which is dependenton temperature. For a given density and abundance, an increased
12C + 12C rate increases the energy generation rate from nuclearreactions. The effect this has on the ignition conditions (temper-ature and density) for core carbon burning is displayed in Figs 9and 10 (the ignition point is defined as the point in time when thecentral mass-fraction abundance of 12C is 0.3 per cent lower thanits maximum value). An increased rate allows a star to reach therequired energy output to support the star against gravitational con-traction at a lower temperature (and also lower density). Note alsothe dependence on initial mass, with ignition conditions favour-ing higher temperatures and lower densities with increasing initial
C© 2012 The Authors, MNRAS 420, 3047–3070Monthly Notices of the Royal Astronomical Society C© 2012 RAS
Dow
nloaded from https://academ
ic.oup.com/m
nras/article/420/4/3047/972505 by guest on 01 August 2022

The effect of 12C + 12C rate uncertainties 3057
Figure 8. Kippenhahn diagrams for the ST, CI and CU models for initialmasses of 15 and 20 M�. Shaded regions correspond to convection zones.The major central burning regimes are indicated by the text.
mass. In the case of lower ignition temperatures and densities, theconvective core ignites more promptly in the CI and CU models.Changes to the ignition conditions and the 12C abundance at the startof core carbon burning are responsible for the increased likelihoodof having overlapping convection zones.
The lifetime of convection zones is generally longer in the CIand CU models. This could be perceived as counterintuitive, sincewith an enhanced rate one would expect that the 12C fuel would beexpended more rapidly. However, the burning takes place in lowertemperature and density conditions, which affect the neutrino losses.Table 3 shows the energy generation terms for nuclear reactions(εnuc) and neutrino losses (εν) at the centre of the star when the massfraction of 12C is half the amount available just prior to carbon-coreburning. The proportion of neutrinos formed by various neutrinoprocesses is also specified in Table 3, which are given as fractions,
Figure 9. Ignition temperatures for core carbon burning for all models.
Figure 10. Ignition densities for core carbon burning for all models.
f , of the total neutrino losses (in per cent). These processes arepair production (f pair), photoneutrino interactions (f phot) and the rest(f rest), which are bremsstrahlung, recombination and plasmon decayprocesses (Itoh et al. 1996). Neutrino formation through these lastthree processes is negligibly small at carbon-burning temperatures.
As shown in Table 3, the energy generation rate from nuclearreactions and the neutrino losses is reduced in the CI and CU models,although an increase in energy generation rate is seen in models25CU, 32CU and 60CU from their CI counterparts. This increaseis due to the presence of the convective carbon core, where thereis an increased availability of the 12C fuel from mixing. Duringcarbon burning, the time-scale for burning is governed primarilyby the neutrino losses (as is true for all advanced burning stages)and these losses generally increase monotonically with increasingtemperature. In fact, massive star evolution during the advancedstages of evolution can be described as a neutrino-mediated Kelvin–Helmholtz contraction of a carbon–oxygen core (Woosley et al.2002; El Eid et al. 2009). Therefore, a reduction in the neutrinolosses has the consequence of increasing the lifetime of carbon-burning stages. Only the carbon shells in models 32CU and 60CU do
C© 2012 The Authors, MNRAS 420, 3047–3070Monthly Notices of the Royal Astronomical Society C© 2012 RAS
Dow
nloaded from https://academ
ic.oup.com/m
nras/article/420/4/3047/972505 by guest on 01 August 2022

3058 M. E. Bennett et al.
Table 3. Energy generation and neutrino parameters during core carbon burning. For each model,the central values of temperature, T , density, ρ, energy generation rates for nuclear burning, εnuc,and neutrino losses, εν , and percentage fractions of the total neutrinos formed by pair production(f pair), photoneutrino interactions (f phot) and other processes (f rest) are specified. These parametersare determined at the time when the mass fraction of 12C is half of the value just prior to carbonburning.
Model T ρ εnuc εν f pair f phot f rest
(GK) (g cm−3) (erg g−1 s−1) (erg g−1 s−1)
15ST 0.830 2.141 × 10⁵ 4.762 × 10⁷ −1.542 × 10⁷ 89.665 10.253 0.08215CI 0.686 7.659 × 10⁴ 6.822 × 10⁶ −1.454 × 10⁶ 70.007 29.861 0.13215CU 0.566 3.772 × 10⁴ 2.277 × 10⁶ −1.448 × 10⁵ 19.800 79.902 0.29820ST 0.883 1.679 × 10⁵ 1.663 × 10⁸ −5.910 × 10⁷ 95.651 4.327 0.02220CI 0.723 5.356 × 10⁴ 1.529 × 10⁷ −5.260 × 10⁶ 87.461 12.508 0.03120CU 0.588 2.477 × 10⁴ 3.727 × 10⁶ −2.643 × 10⁵ 41.935 57.943 0.12225ST 0.859 1.439 × 10⁵ 5.176 × 10⁷ −4.435 × 10⁷ 95.061 4.917 0.02225CI 0.690 3.942 × 10⁴ 2.603 × 10⁶ −2.975 × 10⁶ 83.475 16.490 0.03525CU 0.603 1.889 × 10⁴ 4.975 × 10⁶ −4.533 × 10⁵ 58.913 41.026 0.06132ST 0.904 1.313 × 10⁵ 1.360 × 10⁸ −1.234 × 10⁸ 97.310 2.680 0.01032CI 0.711 3.532 × 10⁴ 3.682 × 10⁶ −5.995 × 10⁶ 89.439 10.543 0.01832CU 0.621 1.510 × 10⁴ 5.725 × 10⁶ −9.148 × 10⁵ 74.347 25.625 0.02860ST 0.919 1.106 × 10⁵ 1.900 × 10⁸ −1.954 × 10⁸ 98.053 1.941 0.00660CI 0.725 3.260 × 10⁴ 5.863 × 10⁶ −9.442 × 10⁶ 92.247 7.741 0.01260CU 0.625 1.375 × 10⁴ 6.244 × 10⁶ −1.096 × 10⁶ 77.670 22.309 0.021
not show this behaviour (see Figs 7 and 8). This can be explained bythe presence of a previous convective carbon core in those models,which reduces the abundance of carbon fuel available for burningin these shells. Systematic trends during shell burning are less clearbecause of the rather complicated evolution of the shell structure,but convective shells often form at lower temperatures in CI and CUmodels (see column 7 in Table 2), similar to the situation in the core.For carbon-core burning, on the other hand, there is a clear increasein the lifetime with increasing rate, which is shown in Fig. 11.
The main neutrino processes during carbon burning are thosecaused by pair production and photoneutrino interactions (Itoh et al.
Figure 11. Carbon-core burning lifetimes for all models. Note that forsome models, the core carbon burning is radiative rather than convective.The carbon-burning lifetime is defined as the time for the mass-fractionabundance of 12C to reduce from 0.3 per cent of its maximum value to avalue of 10−3.
1996; Woosley et al. 2002). It is worth noting that the decrease intemperature in the CI and CU models is responsible for a larger pro-portion of neutrinos formed by the photoneutrino process rather thanpair production. This trend at larger carbon-burning rates is oppositeto the trend with initial mass, which favours higher temperatures andproduction of neutrinos by pair production with increasing initialmass.
These effects on the central evolution are responsible for thedifferent tracks exhibited by the CI and CU models with respect tothe ST models in Figs 4 and 5. For the 15- and 20-M� models, thelarger cores cause the CI and CU tracks to tend towards the highertemperature, lower density side of the ST track, but only for theduration the convective core is present. When the star moves onto carbon-shell burning, the core cools and the track returns to thestandard curve.
As explained above, the overlap exhibited by convective shellsover the ashes of convective carbon cores is due to the ignitionof carbon that represents the unburnt remainder from carbon-coreburning. The presence of this remainder is caused by the gradualshrinking of the carbon core near the end of the burning stage. Thisoccurs in the 20CI model and all CU models, except model 15CUwhere the shell is located at the top of the previous convectivecarbon core. The convective carbon shell in the 20CU model (seeFig. 6), however, shows an interesting structure. In this case a carbonshell is ignited at a position that overlaps with the core and thenshortly after an additional shell is ignited at the point correspondingto the top of the previous core. Because of the unusual structure,the lifetime given in Table 2 for the 20CU model, shell 1, is definedfrom the onset of convection to the time it shrinks back up into thesecond shell.
The presence of overlap with a carbon core has a significantimpact on the composition of the shell at the onset of convec-tion. Indeed, carbon-core burning ashes, including s-process nu-clides, will mix out to a position above the remnant mass andbe present in the supernova ejecta. As mentioned above, overlap-ping shells have previously been noted in the literature, but the
C© 2012 The Authors, MNRAS 420, 3047–3070Monthly Notices of the Royal Astronomical Society C© 2012 RAS
Dow
nloaded from https://academ
ic.oup.com/m
nras/article/420/4/3047/972505 by guest on 01 August 2022
The effect of 12C + 12C rate uncertainties 3059
consequences of overlapping shells of this nature are not well stud-ied. The nucleosynthetic consequences of overlap will be discussedin Section 4.
3.3 Advanced stages beyond carbon burning
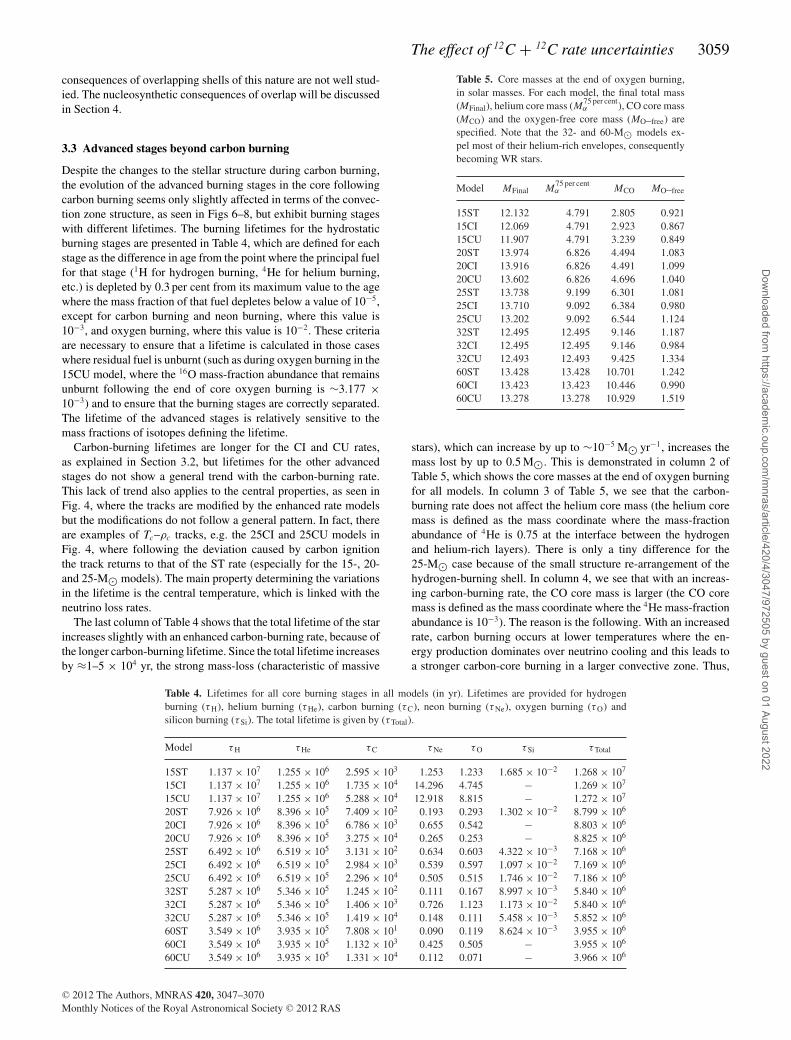
Despite the changes to the stellar structure during carbon burning,the evolution of the advanced burning stages in the core followingcarbon burning seems only slightly affected in terms of the convec-tion zone structure, as seen in Figs 6–8, but exhibit burning stageswith different lifetimes. The burning lifetimes for the hydrostaticburning stages are presented in Table 4, which are defined for eachstage as the difference in age from the point where the principal fuelfor that stage (1H for hydrogen burning, 4He for helium burning,etc.) is depleted by 0.3 per cent from its maximum value to the agewhere the mass fraction of that fuel depletes below a value of 10−5,except for carbon burning and neon burning, where this value is10−3, and oxygen burning, where this value is 10−2. These criteriaare necessary to ensure that a lifetime is calculated in those caseswhere residual fuel is unburnt (such as during oxygen burning in the15CU model, where the 16O mass-fraction abundance that remainsunburnt following the end of core oxygen burning is ∼3.177 ×10⁻³) and to ensure that the burning stages are correctly separated.The lifetime of the advanced stages is relatively sensitive to themass fractions of isotopes defining the lifetime.
Carbon-burning lifetimes are longer for the CI and CU rates,as explained in Section 3.2, but lifetimes for the other advancedstages do not show a general trend with the carbon-burning rate.This lack of trend also applies to the central properties, as seen inFig. 4, where the tracks are modified by the enhanced rate modelsbut the modifications do not follow a general pattern. In fact, thereare examples of Tc–ρc tracks, e.g. the 25CI and 25CU models inFig. 4, where following the deviation caused by carbon ignitionthe track returns to that of the ST rate (especially for the 15-, 20-and 25-M� models). The main property determining the variationsin the lifetime is the central temperature, which is linked with theneutrino loss rates.
The last column of Table 4 shows that the total lifetime of the starincreases slightly with an enhanced carbon-burning rate, because ofthe longer carbon-burning lifetime. Since the total lifetime increasesby ≈1–5 × 10⁴ yr, the strong mass-loss (characteristic of massive
Table 5. Core masses at the end of oxygen burning,in solar masses. For each model, the final total mass(MFinal), helium core mass (M75 per cent
α ), CO core mass(MCO) and the oxygen-free core mass (MO–free) arespecified. Note that the 32- and 60-M� models ex-pel most of their helium-rich envelopes, consequentlybecoming WR stars.
Model MFinal M75 per centα MCO MO–free
15ST 12.132 4.791 2.805 0.92115CI 12.069 4.791 2.923 0.86715CU 11.907 4.791 3.239 0.84920ST 13.974 6.826 4.494 1.08320CI 13.916 6.826 4.491 1.09920CU 13.602 6.826 4.696 1.04025ST 13.738 9.199 6.301 1.08125CI 13.710 9.092 6.384 0.98025CU 13.202 9.092 6.544 1.12432ST 12.495 12.495 9.146 1.18732CI 12.495 12.495 9.146 0.98432CU 12.493 12.493 9.425 1.33460ST 13.428 13.428 10.701 1.24260CI 13.423 13.423 10.446 0.99060CU 13.278 13.278 10.929 1.519
stars), which can increase by up to ∼10−5 M� yr−1, increases themass lost by up to 0.5 M�. This is demonstrated in column 2 ofTable 5, which shows the core masses at the end of oxygen burningfor all models. In column 3 of Table 5, we see that the carbon-burning rate does not affect the helium core mass (the helium coremass is defined as the mass coordinate where the mass-fractionabundance of 4He is 0.75 at the interface between the hydrogenand helium-rich layers). There is only a tiny difference for the25-M� case because of the small structure re-arrangement of thehydrogen-burning shell. In column 4, we see that with an increas-ing carbon-burning rate, the CO core mass is larger (the CO coremass is defined as the mass coordinate where the 4He mass-fractionabundance is 10−3). The reason is the following. With an increasedrate, carbon burning occurs at lower temperatures where the en-ergy production dominates over neutrino cooling and this leads toa stronger carbon-core burning in a larger convective zone. Thus,
Table 4. Lifetimes for all core burning stages in all models (in yr). Lifetimes are provided for hydrogenburning (τH), helium burning (τHe), carbon burning (τC), neon burning (τNe), oxygen burning (τO) andsilicon burning (τSi). The total lifetime is given by (τTotal).
Model τH τHe τC τNe τO τSi τTotal
15ST 1.137 × 10⁷ 1.255 × 10⁶ 2.595 × 10³ 1.253 1.233 1.685 × 10⁻² 1.268 × 10⁷
15CI 1.137 × 10⁷ 1.255 × 10⁶ 1.735 × 10⁴ 14.296 4.745 − 1.269 × 10⁷
15CU 1.137 × 10⁷ 1.255 × 10⁶ 5.288 × 10⁴ 12.918 8.815 − 1.272 × 10⁷
20ST 7.926 × 10⁶ 8.396 × 10⁵ 7.409 × 10² 0.193 0.293 1.302 × 10⁻² 8.799 × 10⁶
20CI 7.926 × 10⁶ 8.396 × 10⁵ 6.786 × 10³ 0.655 0.542 − 8.803 × 10⁶
20CU 7.926 × 10⁶ 8.396 × 10⁵ 3.275 × 10⁴ 0.265 0.253 − 8.825 × 10⁶
25ST 6.492 × 10⁶ 6.519 × 10⁵ 3.131 × 10² 0.634 0.603 4.322 × 10⁻³ 7.168 × 10⁶
25CI 6.492 × 10⁶ 6.519 × 10⁵ 2.984 × 10³ 0.539 0.597 1.097 × 10⁻² 7.169 × 10⁶
25CU 6.492 × 10⁶ 6.519 × 10⁵ 2.296 × 10⁴ 0.505 0.515 1.746 × 10⁻² 7.186 × 10⁶
32ST 5.287 × 10⁶ 5.346 × 10⁵ 1.245 × 10² 0.111 0.167 8.997 × 10⁻³ 5.840 × 10⁶
32CI 5.287 × 10⁶ 5.346 × 10⁵ 1.406 × 10³ 0.726 1.123 1.173 × 10⁻² 5.840 × 10⁶
32CU 5.287 × 10⁶ 5.346 × 10⁵ 1.419 × 10⁴ 0.148 0.111 5.458 × 10⁻³ 5.852 × 10⁶
60ST 3.549 × 10⁶ 3.935 × 10⁵ 7.808 × 101 0.090 0.119 8.624 × 10⁻³ 3.955 × 10⁶
60CI 3.549 × 10⁶ 3.935 × 10⁵ 1.132 × 10³ 0.425 0.505 − 3.955 × 10⁶
60CU 3.549 × 10⁶ 3.935 × 10⁵ 1.331 × 10⁴ 0.112 0.071 − 3.966 × 10⁶
C© 2012 The Authors, MNRAS 420, 3047–3070Monthly Notices of the Royal Astronomical Society C© 2012 RAS
Dow
nloaded from https://academ
ic.oup.com/m
nras/article/420/4/3047/972505 by guest on 01 August 2022
3060 M. E. Bennett et al.
the carbon-burning core produces more energy and this leads to aless energetic helium-burning shell that is radiative rather than con-vective, which is the case for the ST models. When the He shell isradiative, the burning front depletes completely the helium availableat one mass coordinate and then moves upwards leading to a moremassive CO core, whereas with a convective He shell, the bottomof the shell stays at the same mass coordinate since the helium inthe convective shell is never completely exhausted due to mixing.Note also that the 32- and 60-M� models do not exhibit a value forM75 per cent
α . This is because the mass-loss is strong enough in theseWR stars to expel the majority of their helium-rich envelopes andthe 4He abundance is not high enough to satisfy the criterion forM75 per cent
α . In these cases, the helium core mass is taken as the finalmass, MFinal (see column 2 of Table 5).
As mentioned above, the size of the convective cores during neon,oxygen and silicon burnings is only slightly affected by changes inthe carbon-burning rate, as can be seen in the last column of Table 5for the oxygen-free core, MO−free, calculated at the end of coreoxygen burning. The changes in MO−free with the carbon-burningrate are because of changes in the position of the lower boundaryof the last convective carbon shell. Generally, the magnitude of thechanges in MO−free is small and does not present a clear pattern.
4 N U C L E O S Y N T H E S I S
4.1 Neutron sources
The main effects on the nucleosynthesis in the stellar models are dueto the lower central temperature of the star and the increased life-time. In particular, the lower central temperature will affect the effi-ciency of neutron source reactions. We recall that the main neutronsources for the s-process are 13C, which is important during carbon-core burning, and 22Ne, which is important during helium-coreburning and carbon-shell burning. The 13C neutron source is mainlyproduced during carbon-core burning by the 12C(p,γ )13N(β+)13Creaction chain. Neutrons are then produced by 13C(α,n)16O reac-tions. The protons and α-particles originate directly from the 12C +12C fusion reactions. There is competition between the 13N(β+)13Cand 13N(γ ,p)12C reactions, where at temperatures above 0.8 GK, the(γ ,p) reaction dominates over the β-decay. The 13C neutron sourceis thus an efficient neutron producer only at lower temperatures.During carbon-shell burning, where the temperatures are higher,the 22Ne source is the dominant neutron source. One can thereforeexpect that as the carbon-burning rate is increased and the interiortemperature is lowered, the efficiency of the 13C neutron sourcewill increase. This efficiency will also be higher given the increasedlifetimes.
A non-negligible fraction of neutrons are also present from the17O and 21Ne neutron sources, but these nuclei are mainly pro-duced by neutron captures on 16O and 20Ne [and 17O(α, γ )21Ne]and therefore only act as mediators of the neutron irradiance. The25Mg(α,n)28Si and 12C(12C,n)23Mg neutron sources are marginalfor all models considered here, despite the increases to the carbon-burning rate. We refer to Pignatari et al. (in preparation) for a moredetailed discussion about the 12C(12C,n)23Mg reaction.
4.2 s-process parameters
Several indicators for the neutron-capture nucleosynthesis are con-sidered. The s-process is typically characterized by the neutrondensity, nn, the neutron captures per iron seed, nc, and the neutron
exposure, τn. Here, nc is defined as follows:
nc =∑n
i (Ai − 56)(Xi − X0
i
)X56Fe
, (4.1)
where X0i is the initial mass-fraction abundance of isotope Xi with
atomic mass Ai and X56Fe is the initial mass-fraction abundance of56Fe, which is the dominant seed isotope for the s-process nucle-osynthesis. τn is defined as τn = ∫
vT nndt (Clayton 1968). However,these definitions are of limited use in the multi-zone calculationsused here. The reason for this is that in the multi-zone stellar mod-els, convective mixing affects the neutron irradiance experiencedby a given mass element (The et al. 2007). Stellar matter, includingthe neutron sources, seeds and poisons, is mixed into and out of thebottom of the convection zone, where the temperature is highest andwhere the majority of the s-process occurs. Consequently, an eval-uation of nc or τn at a particular mass coordinate will be differentfrom that experienced by a given mass element.
Therefore, in order to evaluate relevant parameters to describethe neutron irradiance, convective mixing needs to be taken intoaccount in the evaluation of the parameter. This can be achieved forthe neutron exposure by considering the initial and final abundancesof 54Fe, an isotope that is slowly destroyed by neutron capturesin the s-process sites considered here. It cannot be used duringor after oxygen burning where temperatures are high enough tophotodisintegrate heavy elements (Woosley & Weaver 1995). Anestimate of the neutron exposure using 54Fe can be made using thefollowing formula (Woosley & Weaver 1995; The, El Eid & Meyer2000):
τ54 = − 1
σ[ln Xi(
54Fe) − ln Xf (54Fe)], (4.2)
where σ is the 54Fe(n,γ )55Fe reaction rate (σ = 29.6 ± 1.3 mb;Dillmann et al. 2006) and Xi(54Fe) and Xf (54Fe) are the mass-fraction abundances of 54Fe before and after the neutron exposure,respectively. A better estimate of nc can be obtained by using mass-averaged abundances for Xi, X0
i and X56Fe over the maximum sizeof the convective region,
nc,av =∑n
i (Ai − 56)(〈Xi〉 − 〈X0i 〉)
〈X56Fe〉. (4.3)
This takes into account any changes to the size of the convectiveregion during the burning stage where the s-process nucleosynthesisoccurs.
Table 6 lists, for all models, the neutron exposure, τ 54, the neutroncaptures per iron seed, nc,av, the mass-fraction abundances of theisotopes 54Fe and 88Sr and the isobaric ratios 70Ge/70Zn, 80Kr/80Seand 86Sr/86Kr. 88Sr, like 54Fe, is also a useful s-process indicatoras it has a neutron-magic nucleus (N = 50) and is slowly builtup over the course of the s-process. The isobaric ratios are alsospecified, because changes to the ratios demonstrate deviations tothe s-process path at branching point nuclides (69Zn, 79Se and 85Krfor 70Ge/70Zn, 80Kr/80Se and 86Sr/86Kr, respectively). Indeed, if theneutron density increases, the s-process path opens to allow theproduction of more neutron-rich isotopes, lowering these ratios.
4.3 Core carbon burning
According to Table 6, all CI and CU models show a depletion of54Fe and production of 88Sr relative to the ST case, indicating that ahigher neutron exposure is present in the convective carbon core. Forall CI and CU models, irrespective of mass, the neutron exposure is
C© 2012 The Authors, MNRAS 420, 3047–3070Monthly Notices of the Royal Astronomical Society C© 2012 RAS
Dow
nloaded from https://academ
ic.oup.com/m
nras/article/420/4/3047/972505 by guest on 01 August 2022

The effect of 12C + 12C rate uncertainties 3061
Table 6. s-process tracers, neutron-capture parameters and isotopic ratios at the end of helium-core burning, carbon-coreburning and convective carbon-shell burning. nc,av is the neutron capture per iron seed averaged over the convectiveregion and τ 54 is the neutron exposure calculated using equation (4.2). The 88Sr and 54Fe abundances are specified asaverage mass-fraction abundances, X88Sr and X54Fe, respectively, at the end of the burning stage over the convective region,except for radiative burning where the central values are taken. The s-process parameters for a shell that persists to thepre-supernova stage use final abundances that are evaluated at start of oxygen burning, which removes the effects ofphotodisintegration occurring during the late evolutionary stages from the evaluation of the s-process parameters.
Model Shell 88Sr 54Fe nc,av τ 54 (mb−1) 70Ge/70Zn 80Kr/80Se 86Sr/86Kr
15ST He-core 2.005 × 10⁻⁷ 5.750 × 10⁻⁶ 1.641 0.088 115.913 2.690 4.24715ST C-core 1.556 × 10⁻⁶ 7.721 × 10⁻⁷ 6.601 0.062 1165.633 5.107 46.00115ST 1 1.000 × 10⁻⁶ 1.089 × 10⁻⁶ 4.740 0.048 1036.915 3.668 20.17815ST 2 6.629 × 10⁻⁷ 1.266 × 10⁻⁶ 3.903 0.042 335.818 0.701 2.70815CI C-core 1.009 × 10⁻⁴ 9.137 × 10⁻⁸ 29.270 0.134 901.882 4.284 45.04815CI 1 2.803 × 10⁻⁵ 6.958 × 10⁻⁷ 6.005 0.059 862.687 3.172 23.26815CU C-core 2.182 × 10⁻⁴ 3.716 × 10⁻⁸ 46.293 0.165 743.822 4.080 44.06515CU 1 5.046 × 10⁻⁵ 2.163 × 10⁻⁶ 19.423 0.055 638.189 0.765 1.72620ST He-core 3.817 × 10⁻⁷ 1.070 × 10⁻⁶ 3.069 0.143 928.859 3.588 7.50320ST C-core 1.286 × 10⁻⁶ 1.615 × 10⁻⁷ 8.080 0.062 1315.250 4.012 30.74120ST 1 1.064 × 10⁻⁶ 2.303 × 10⁻⁷ 6.605 0.043 1245.114 2.605 17.58320ST 2 9.403 × 10⁻⁷ 3.382 × 10⁻⁷ 4.934 0.033 518.314 0.774 4.20520ST 3 8.762 × 10⁻⁷ 4.292 × 10⁻⁷ 0.119 0.001 487.403 0.696 3.80220CI C-core 5.197 × 10⁻⁵ 8.818 × 10⁻⁸ 27.796 0.084 970.039 4.200 41.85320CI 1 2.424 × 10⁻⁵ 3.828 × 10⁻⁷ 5.920 0.023 975.182 2.873 20.45020CI 2 2.160 × 10⁻⁵ 3.869 × 10⁻⁷ 2.737 0.012 347.183 0.366 3.35220CU C-core 1.727 × 10⁻⁴ 4.802 × 10⁻⁹ 60.722 0.182 779.749 4.104 36.64820CU 1 7.074 × 10⁻⁵ 5.484 × 10⁻⁷ 4.073 0.019 494.139 2.019 22.56720CU 2 1.194 × 10⁻⁵ 6.573 × 10⁻⁷ 4.651 0.027 151.579 0.348 4.04825ST He-core 6.153 × 10⁻⁷ 3.539 × 10⁻⁷ 4.280 0.180 2220.036 3.755 11.32925ST C-core 1.472 × 10⁻⁶ 7.918 × 10⁻⁸ 8.271 0.045 1432.597 4.385 35.55425ST 1 9.499 × 10⁻⁷ 1.482 × 10⁻⁷ 5.632 0.028 87.609 0.109 0.51525CI C-core 4.092 × 10⁻⁵ 1.411 × 10⁻⁹ 48.421 0.179 970.416 4.576 59.42625CI 1 1.772 × 10⁻⁵ 6.313 × 10⁻⁸ 23.538 0.045 1063.729 4.066 38.99025CI 2 1.111 × 10⁻⁶ 1.564 × 10⁻⁷ 5.543 0.028 315.357 0.280 1.40125CU C-core 1.475 × 10⁻⁴ 1.509 × 10⁻⁹ 73.339 0.184 804.018 4.072 36.41925CU 1 9.824 × 10⁻⁵ 1.347 × 10⁻⁷ 15.755 0.015 698.157 1.283 10.09432ST He-core 1.097 × 10⁻⁶ 1.192 × 10⁻⁷ 5.623 0.217 3380.614 3.900 16.34032ST C-core 1.788 × 10⁻⁶ 5.333 × 10⁻⁸ 6.239 0.024 1640.445 3.640 28.44932ST 1 1.315 × 10⁻⁶ 8.625 × 10⁻⁸ 3.016 0.010 75.996 0.130 1.01432CI C-core 1.825 × 10⁻⁵ 3.955 × 10⁻⁹ 38.296 0.110 1042.993 4.740 60.12632CI 1 2.045 × 10⁻⁶ 6.562 × 10⁻⁸ 5.220 0.017 1021.836 1.646 9.94432CU C-core 1.007 × 10⁻⁴ 8.498 × 10⁻¹⁰ 77.718 0.167 837.791 3.949 39.03232CU 1 7.633 × 10⁻⁵ 3.346 × 10⁻⁸ 16.738 0.011 509.651 0.428 4.91160ST He-core 1.524 × 10⁻⁶ 6.404 × 10⁻⁸ 6.489 0.238 1741.270 1.125 12.26760ST C-core 1.701 × 10⁻⁶ 5.297 × 10⁻⁸ 5.862 0.023 1743.568 3.246 25.86560ST 1 1.335 × 10⁻⁶ 7.814 × 10⁻⁸ 2.779 0.009 69.670 0.146 1.13660CI C-core 1.491 × 10⁻⁵ 4.808 × 10⁻⁹ 33.897 0.104 1072.384 4.619 52.63760CI 1 1.622 × 10⁻⁶ 5.837 × 10⁻⁷ 3.800 0.029 871.777 0.921 5.67660CU C-core 1.076 × 10⁻⁴ 6.551 × 10⁻¹⁰ 81.743 0.172 837.512 3.877 36.86560CU 1 8.908 × 10⁻⁵ 2.512 × 10⁻⁸ 17.940 0.010 455.999 0.370 4.862
high enough to allow an increasing production of isotopes beyondthe Sr–Y–Zr peak, which is quantified in a higher neutron captureper iron seed. An example of this nucleosynthesis for the 15-M�model is seen in Fig. 12, which shows the central overproductionfactors for heavy, stable isotopes in the star at the end of carbonburning. The distribution of synthesized isotopes is extended, withincreasing rate, beyond the Sr–Y–Zr peak to include isotopes upto the Ba–La peak at A ≈ 140. This is an anomalous distributioncompared to the weak s-process component.
The neutron density in the carbon core decreases from a typicalvalue of ∼108 cm−3, which is maintained throughout the burning,to ∼107 cm−3 in the models with an increasing carbon-burning rate.
In the 25CU, 32CU and 60CU models, the neutron density is en-hanced over the CI cases because of the presence of the convectivecore; the mixing into and out of the centre acts to maintain a sup-ply of neutron sources at the centre. Concerning the ST case, theneutron exposures for the cores are similar in magnitude to that ofthe helium-burning core (∼0.06 mb−1), but are lower for the mostmassive stars considered here (∼0.02 mb−1 for the 32ST and 60STmodels). For the CI and CU rates, the neutron exposures are signif-icantly enhanced, typically exceeding 0.1 mb−1. This is mainly dueto the rising efficiency of the 13C neutron source at lower tempera-tures, coupled with the increased lifetime of the core carbon-burningstage.
C© 2012 The Authors, MNRAS 420, 3047–3070Monthly Notices of the Royal Astronomical Society C© 2012 RAS
Dow
nloaded from https://academ
ic.oup.com/m
nras/article/420/4/3047/972505 by guest on 01 August 2022

3062 M. E. Bennett et al.
Figure 12. Central overproduction factors for most stable isotopes at the end of central carbon burning for the 15-M� models. The plot shows a significantincrease in nucleosynthesis of isotopes for 60 < A < 140 in the CI and CU models, which is beyond the Sr–Y–Zr peak at an atomic mass of ≈90.
4.4 Carbon-shell burning
Nucleosynthesis in the carbon shells is characterized by thes-process with a high neutron density but lower neutron expo-sure compared to carbon core, with 22Ne being the dominant neu-tron source. In the ST models, the neutron densities vary from∼108 cm−3 for early convective shells (models 15ST and 20ST),and increase to a typical value of ∼1010 cm−3 in the final carbon-burning shell. In the CI and CU models, the neutron density is∼107 cm−3 in early shells, similar to the values obtained duringcore carbon burning, and then rises to ∼108−9 cm−3. The lifetimesfor the carbon-shell burning stages vary quite differently from modelto model, but are generally increasing with increasing rate. For ex-ample, in the 15CU case, the lifetimes of the last carbon shell inTable 2 for the 15ST, CI and CU models are 17.92, 150.1 and 594.2years, respectively. The carbon shell in model 15CU consequentlyexhibits a strong neutron exposure of similar magnitude as to thecarbon core (see Table 6). It should be noted however that in almostevery instance of a carbon-burning shell, the neutron exposure issmaller than that of the carbon core in the same model. This assertsthe fact that carbon shells are characterized by a lower neutron ex-posure and higher neutron density (with 22Ne as the main neutronsource), although the degree with which this is true is reduced withan increasing carbon-burning rate. That is, the general trend withincreasing rate is a decrease in the neutron density and an increasein the neutron exposure in the carbon shells.
The above can be verified by considering the ratios of isotopesinvolved at branching points, since the lower neutron density willclose the s-process path to the synthesis of more neutron-rich iso-topes at branching points. The last three columns of Table 6 show theisobaric ratios at the end of the core and shell carbon-burning stagesfor 70Ge/70Zn, 80Kr/80Se and 86Sr/86Kr, with values for the endof helium-core burning specified for reference. For most models,the ratios increase in the last carbon shell with increasing carbon-burning rate, favouring production of the s-only isotopes 70Ge, 80Krand 86Sr, due to the lower neutron density in the carbon shells in theCI and CU models. However, the ratios are sensitive to convection,
since shell overlap causes the shells to be polluted with carbon-cores-process ashes. Consequently, the 25CU, 32CU and 60CU modelsinstead show a decrease in the ratios. Considering that the ratios inthe initial composition are 3.271, 6.124 and 0.036 for 70Ge/70Zn,80Kr/80Se and 86Sr/86Kr, respectively, the presence of lower isobaricratios than those in the shells indicates that the branching is indeedaffected during the carbon shell s-process and that the decrease isnot associated purely with the mixing of carbon-core matter withhelium-burning ashes.
5 Y I ELDS
5.1 Calculations
The yields calculations were made in the same manner as thatof Hirschi et al. (2005), which considers two contributions to theyields: the stellar wind and the supernova explosion. The wind yieldfor nuclide i for a star with initial mass m (in M�) is calculatedusing
mpwindim =
∫ τ (m)
0M(m, t)
[XS
i (m, t) − X0i
]dt, (5.1)
where τ (m) is the final age of the star, M(m, t) is the mass-lossrate, XS
i is the surface mass-fraction abundance and X0i is the initial
mass-fraction abundance. The majority of the matter lost throughthe stellar wind occurs during hydrogen and helium burning. Thecomposition of the wind is similar to that of the initial composition,except for the 32-M� and 60-M� models where the mass-loss issignificant enough to include some of the hydrogen-burning ashes.Table 5 shows that the total mass lost over the stellar evolution dueto the stellar wind increases significantly with initial mass (≈20 percent lost for the 15-M� models to ≈80 per cent lost for the 60-M�models).
The pre-supernova yields are calculated using
mppreSNim =
∫ mτ
Mrem,m
[Xi(mr ) − X0
i
]dmr, (5.2)
C© 2012 The Authors, MNRAS 420, 3047–3070Monthly Notices of the Royal Astronomical Society C© 2012 RAS
Dow
nloaded from https://academ
ic.oup.com/m
nras/article/420/4/3047/972505 by guest on 01 August 2022
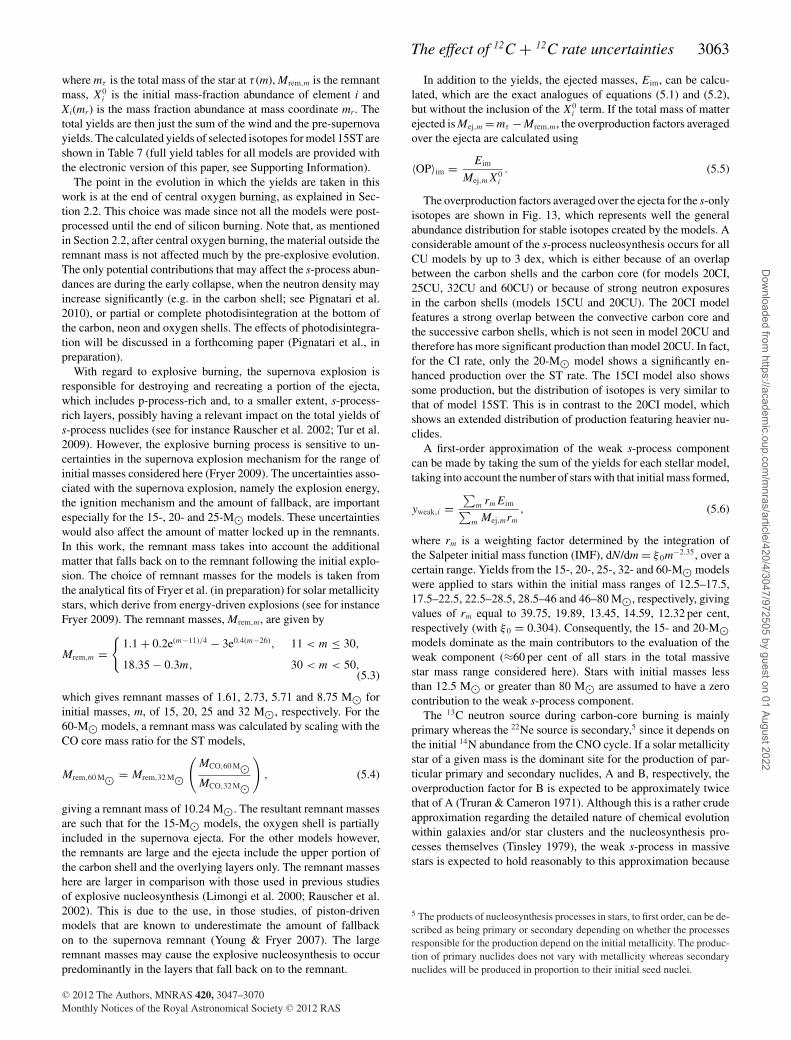
The effect of 12C + 12C rate uncertainties 3063
where mτ is the total mass of the star at τ (m), Mrem,m is the remnantmass, X0
i is the initial mass-fraction abundance of element i andXi(mr) is the mass fraction abundance at mass coordinate mr. Thetotal yields are then just the sum of the wind and the pre-supernovayields. The calculated yields of selected isotopes for model 15ST areshown in Table 7 (full yield tables for all models are provided withthe electronic version of this paper, see Supporting Information).
The point in the evolution in which the yields are taken in thiswork is at the end of central oxygen burning, as explained in Sec-tion 2.2. This choice was made since not all the models were post-processed until the end of silicon burning. Note that, as mentionedin Section 2.2, after central oxygen burning, the material outside theremnant mass is not affected much by the pre-explosive evolution.The only potential contributions that may affect the s-process abun-dances are during the early collapse, when the neutron density mayincrease significantly (e.g. in the carbon shell; see Pignatari et al.2010), or partial or complete photodisintegration at the bottom ofthe carbon, neon and oxygen shells. The effects of photodisintegra-tion will be discussed in a forthcoming paper (Pignatari et al., inpreparation).
With regard to explosive burning, the supernova explosion isresponsible for destroying and recreating a portion of the ejecta,which includes p-process-rich and, to a smaller extent, s-process-rich layers, possibly having a relevant impact on the total yields ofs-process nuclides (see for instance Rauscher et al. 2002; Tur et al.2009). However, the explosive burning process is sensitive to un-certainties in the supernova explosion mechanism for the range ofinitial masses considered here (Fryer 2009). The uncertainties asso-ciated with the supernova explosion, namely the explosion energy,the ignition mechanism and the amount of fallback, are importantespecially for the 15-, 20- and 25-M� models. These uncertaintieswould also affect the amount of matter locked up in the remnants.In this work, the remnant mass takes into account the additionalmatter that falls back on to the remnant following the initial explo-sion. The choice of remnant masses for the models is taken fromthe analytical fits of Fryer et al. (in preparation) for solar metallicitystars, which derive from energy-driven explosions (see for instanceFryer 2009). The remnant masses, Mrem,m, are given by
Mrem,m ={
1.1 + 0.2e(m−11)/4 − 3e0.4(m−26), 11 < m ≤ 30,
18.35 − 0.3m, 30 < m < 50,(5.3)
which gives remnant masses of 1.61, 2.73, 5.71 and 8.75 M� forinitial masses, m, of 15, 20, 25 and 32 M�, respectively. For the60-M� models, a remnant mass was calculated by scaling with theCO core mass ratio for the ST models,
Mrem,60 M� = Mrem,32 M�
(MCO,60 M�MCO,32 M�
), (5.4)
giving a remnant mass of 10.24 M�. The resultant remnant massesare such that for the 15-M� models, the oxygen shell is partiallyincluded in the supernova ejecta. For the other models however,the remnants are large and the ejecta include the upper portion ofthe carbon shell and the overlying layers only. The remnant masseshere are larger in comparison with those used in previous studiesof explosive nucleosynthesis (Limongi et al. 2000; Rauscher et al.2002). This is due to the use, in those studies, of piston-drivenmodels that are known to underestimate the amount of fallbackon to the supernova remnant (Young & Fryer 2007). The largeremnant masses may cause the explosive nucleosynthesis to occurpredominantly in the layers that fall back on to the remnant.
In addition to the yields, the ejected masses, Eim, can be calcu-lated, which are the exact analogues of equations (5.1) and (5.2),but without the inclusion of the X0
i term. If the total mass of matterejected is Mej,m = mτ − Mrem,m, the overproduction factors averagedover the ejecta are calculated using
〈OP〉im = Eim
Mej,mX0i
. (5.5)
The overproduction factors averaged over the ejecta for the s-onlyisotopes are shown in Fig. 13, which represents well the generalabundance distribution for stable isotopes created by the models. Aconsiderable amount of the s-process nucleosynthesis occurs for allCU models by up to 3 dex, which is either because of an overlapbetween the carbon shells and the carbon core (for models 20CI,25CU, 32CU and 60CU) or because of strong neutron exposuresin the carbon shells (models 15CU and 20CU). The 20CI modelfeatures a strong overlap between the convective carbon core andthe successive carbon shells, which is not seen in model 20CU andtherefore has more significant production than model 20CU. In fact,for the CI rate, only the 20-M� model shows a significantly en-hanced production over the ST rate. The 15CI model also showssome production, but the distribution of isotopes is very similar tothat of model 15ST. This is in contrast to the 20CI model, whichshows an extended distribution of production featuring heavier nu-clides.
A first-order approximation of the weak s-process componentcan be made by taking the sum of the yields for each stellar model,taking into account the number of stars with that initial mass formed,
yweak,i =∑
m rmEim∑m Mej,mrm
, (5.6)
where rm is a weighting factor determined by the integration ofthe Salpeter initial mass function (IMF), dN/dm = ξ 0m−2.35, over acertain range. Yields from the 15-, 20-, 25-, 32- and 60-M� modelswere applied to stars within the initial mass ranges of 12.5–17.5,17.5–22.5, 22.5–28.5, 28.5–46 and 46–80 M�, respectively, givingvalues of rm equal to 39.75, 19.89, 13.45, 14.59, 12.32 per cent,respectively (with ξ 0 = 0.304). Consequently, the 15- and 20-M�models dominate as the main contributors to the evaluation of theweak component (≈60 per cent of all stars in the total massivestar mass range considered here). Stars with initial masses lessthan 12.5 M� or greater than 80 M� are assumed to have a zerocontribution to the weak s-process component.
The 13C neutron source during carbon-core burning is mainlyprimary whereas the 22Ne source is secondary,5 since it depends onthe initial 14N abundance from the CNO cycle. If a solar metallicitystar of a given mass is the dominant site for the production of par-ticular primary and secondary nuclides, A and B, respectively, theoverproduction factor for B is expected to be approximately twicethat of A (Truran & Cameron 1971). Although this is a rather crudeapproximation regarding the detailed nature of chemical evolutionwithin galaxies and/or star clusters and the nucleosynthesis pro-cesses themselves (Tinsley 1979), the weak s-process in massivestars is expected to hold reasonably to this approximation because
5 The products of nucleosynthesis processes in stars, to first order, can be de-scribed as being primary or secondary depending on whether the processesresponsible for the production depend on the initial metallicity. The produc-tion of primary nuclides does not vary with metallicity whereas secondarynuclides will be produced in proportion to their initial seed nuclei.
C© 2012 The Authors, MNRAS 420, 3047–3070Monthly Notices of the Royal Astronomical Society C© 2012 RAS
Dow
nloaded from https://academ
ic.oup.com/m
nras/article/420/4/3047/972505 by guest on 01 August 2022

3064 M. E. Bennett et al.
Table 7. Yields for model 15ST. For each isotope, i, the atomic mass (A), atomic number (Z), initial mass-fraction abundance (X0i ),
wind yield (mpwind, in M�), pre-supernova yield (mppreSN, in M�), total yield (mptotal, in M�), total ejected mass (Eim, in M�)and average overproduction factor (〈OP〉) are specified. The decays of unstable species to their stable isobars are taken into account.Full yield tables for all models are provided with the electronic version of this paper, see Supporting Information.
Isotope A Z X0i mpwind mppreSN mptotal Eim 〈OP〉
1H 1 1 7.064E−01 −4.366E−02 −2.933E+00 −2.977E+00 6.485E+00 0.6854He 4 2 2.735E−01 4.345E−02 1.435E+00 1.479E+00 5.142E+00 1.40412C 12 6 3.425E−03 −2.639E−03 3.101E−01 3.074E−01 3.533E−01 7.70313C 13 6 4.156E−05 2.302E−04 2.276E−04 4.577E−04 1.014E−03 1.82214N 14 7 1.059E−03 4.132E−03 3.401E−02 3.814E−02 5.232E−02 3.68916O 16 8 9.624E−03 −1.474E−03 7.579E−01 7.564E−01 8.853E−01 6.86819F 19 9 5.611E−07 −9.796E−08 −2.190E−06 −2.288E−06 5.227E−06 0.69620Ne 20 10 1.818E−03 −2.514E−06 3.238E−01 3.238E−01 3.482E−01 14.30223Na 23 11 4.000E−05 3.023E−05 1.337E−02 1.340E−02 1.394E−02 26.02124Mg 24 12 5.862E−04 −1.079E−08 2.747E−02 2.747E−02 3.532E−02 4.49827Al 27 13 6.481E−05 4.579E−08 3.142E−03 3.142E−03 4.010E−03 4.62028Si 28 14 7.453E−04 −1.752E−08 1.844E−03 1.844E−03 1.183E−02 1.18531P 31 15 7.106E−06 1.394E−09 7.106E−05 7.106E−05 1.662E−04 1.74732S 32 16 4.011E−04 −9.512E−09 −1.897E−04 −1.897E−04 5.182E−03 0.96536Ar 36 18 8.202E−05 −1.944E−09 −7.472E−05 −7.472E−05 1.024E−03 0.93239K 39 19 3.900E−06 −9.244E−11 7.466E−06 7.466E−06 5.970E−05 1.14340Ca 40 20 7.225E−05 −1.706E−09 −5.212E−05 −5.212E−05 9.156E−04 0.94645Sc 45 21 5.414E−08 −1.283E−12 8.303E−07 8.303E−07 1.555E−06 2.14550Ti 50 22 2.208E−07 −5.234E−12 3.801E−06 3.801E−06 6.758E−06 2.28551V 51 23 4.138E−07 −9.808E−12 −6.535E−08 −6.536E−08 5.476E−06 0.98852Cr 52 24 1.658E−05 −3.929E−10 −1.282E−05 −1.282E−05 2.092E−04 0.94255Mn 55 25 1.098E−05 −2.603E−10 3.666E−06 3.666E−06 1.507E−04 1.02554Fe 54 26 8.118E−05 −1.924E−09 −1.208E−04 −1.208E−04 9.665E−04 0.88956Fe 56 26 1.322E−03 −3.133E−08 −1.213E−03 −1.213E−03 1.649E−02 0.93159Co 59 27 3.991E−06 −9.461E−11 2.580E−04 2.580E−04 3.114E−04 5.82560Ni 60 28 2.276E−05 −5.394E−10 1.437E−04 1.437E−04 4.485E−04 1.47263Cu 63 29 6.600E−07 −1.564E−11 5.493E−05 5.493E−05 6.376E−05 7.21365Cu 65 29 3.035E−07 −7.193E−12 3.249E−05 3.249E−05 3.655E−05 8.99364Zn 64 30 1.131E−06 −2.680E−11 1.792E−05 1.792E−05 3.306E−05 2.18366Zn 66 30 6.690E−07 −1.586E−11 1.856E−05 1.856E−05 2.752E−05 3.07270Zn 70 30 1.577E−08 −3.737E−13 −1.160E−08 −1.160E−08 1.996E−07 0.94569Ga 69 31 4.551E−08 −1.079E−12 2.367E−06 2.367E−06 2.977E−06 4.88471Ga 71 31 3.108E−08 −7.366E−13 2.012E−06 2.012E−06 2.428E−06 5.83470Ge 70 32 5.157E−08 −1.222E−12 3.185E−06 3.185E−06 3.876E−06 5.61172Ge 72 32 6.910E−08 −1.638E−12 2.614E−06 2.614E−06 3.539E−06 3.82475As 75 33 1.430E−08 −3.390E−13 4.113E−07 4.113E−07 6.028E−07 3.14776Se 76 34 1.296E−08 −3.072E−13 6.260E−07 6.260E−07 7.995E−07 4.60678Se 78 34 3.376E−08 −8.003E−13 1.441E−06 1.441E−06 1.894E−06 4.18880Se 80 34 7.226E−08 −1.713E−12 2.985E−07 2.985E−07 1.266E−06 1.30879Br 79 35 1.389E−08 −3.293E−13 1.867E−07 1.867E−07 3.728E−07 2.00381Br 81 35 1.386E−08 −3.285E−13 2.041E−07 2.041E−07 3.897E−07 2.10080Kr 80 36 2.575E−09 −6.103E−14 2.610E−07 2.610E−07 2.955E−07 8.56982Kr 82 36 1.320E−08 −3.128E−13 7.028E−07 7.028E−07 8.795E−07 4.97784Kr 84 36 6.602E−08 −1.565E−12 1.031E−06 1.031E−06 1.915E−06 2.16686Kr 86 36 2.044E−08 −4.846E−13 1.289E−07 1.289E−07 4.027E−07 1.47185Rb 85 37 1.282E−08 −3.040E−13 1.721E−07 1.721E−07 3.438E−07 2.00287Rb 87 37 5.063E−09 −2.025E−12 6.776E−08 6.776E−08 1.356E−07 1.99984Sr 84 38 3.228E−10 −7.651E−15 −6.777E−10 −6.777E−10 3.646E−09 0.84386Sr 86 38 5.845E−09 −1.385E−13 3.642E−07 3.642E−07 4.424E−07 5.65287Sr 87 38 4.443E−09 1.800E−12 1.858E−07 1.858E−07 2.453E−07 4.12388Sr 88 38 5.011E−08 −1.188E−12 5.602E−07 5.602E−07 1.231E−06 1.83589Y 89 39 1.229E−08 −2.914E−13 9.875E−08 9.875E−08 2.634E−07 1.60090Zr 90 40 1.534E−08 −3.637E−13 4.445E−08 4.445E−08 2.500E−07 1.21692Zr 92 40 5.227E−09 −1.239E−13 1.871E−08 1.871E−08 8.872E−08 1.26794Zr 94 40 5.413E−09 −1.283E−13 6.178E−09 6.178E−09 7.868E−08 1.08593Nb 93 41 1.900E−09 −4.504E−14 7.083E−09 7.082E−09 3.253E−08 1.27892Mo 92 42 1.012E−09 −2.400E−14 −1.687E−09 −1.687E−09 1.187E−08 0.87694Mo 94 42 6.448E−10 −1.528E−14 2.073E−11 2.072E−11 8.656E−09 1.00296Mo 96 42 1.188E−09 −2.815E−14 3.811E−09 3.811E−09 1.972E−08 1.24098Mo 98 42 1.754E−09 −4.158E−14 3.213E−09 3.213E−09 2.671E−08 1.137100Mo 100 42 7.146E−10 −1.694E−14 −1.219E−09 −1.219E−09 8.352E−09 0.873
C© 2012 The Authors, MNRAS 420, 3047–3070Monthly Notices of the Royal Astronomical Society C© 2012 RAS
Dow
nloaded from https://academ
ic.oup.com/m
nras/article/420/4/3047/972505 by guest on 01 August 2022
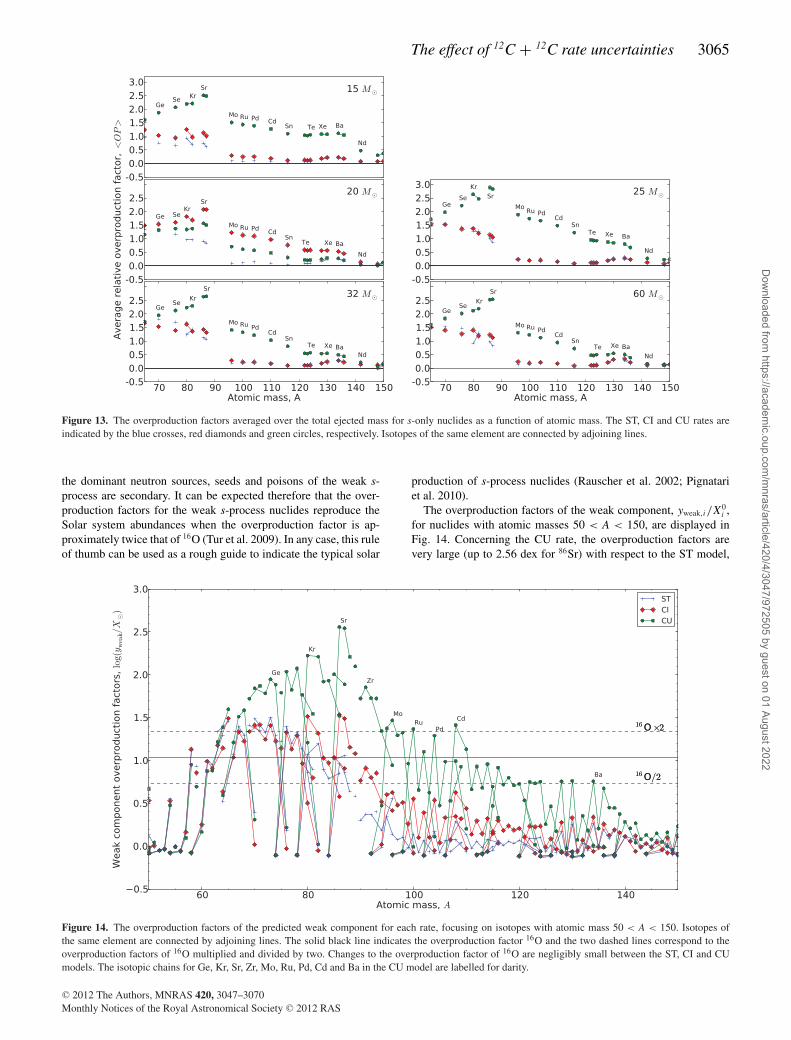
The effect of 12C + 12C rate uncertainties 3065
Figure 13. The overproduction factors averaged over the total ejected mass for s-only nuclides as a function of atomic mass. The ST, CI and CU rates areindicated by the blue crosses, red diamonds and green circles, respectively. Isotopes of the same element are connected by adjoining lines.
the dominant neutron sources, seeds and poisons of the weak s-process are secondary. It can be expected therefore that the over-production factors for the weak s-process nuclides reproduce theSolar system abundances when the overproduction factor is ap-proximately twice that of 16O (Tur et al. 2009). In any case, this ruleof thumb can be used as a rough guide to indicate the typical solar
production of s-process nuclides (Rauscher et al. 2002; Pignatariet al. 2010).
The overproduction factors of the weak component, yweak,i/X0i ,
for nuclides with atomic masses 50 < A < 150, are displayed inFig. 14. Concerning the CU rate, the overproduction factors arevery large (up to 2.56 dex for 86Sr) with respect to the ST model,
Figure 14. The overproduction factors of the predicted weak component for each rate, focusing on isotopes with atomic mass 50 < A < 150. Isotopes ofthe same element are connected by adjoining lines. The solid black line indicates the overproduction factor 16O and the two dashed lines correspond to theoverproduction factors of 16O multiplied and divided by two. Changes to the overproduction factor of 16O are negligibly small between the ST, CI and CUmodels. The isotopic chains for Ge, Kr, Sr, Zr, Mo, Ru, Pd, Cd and Ba in the CU model are labelled for darity.
C© 2012 The Authors, MNRAS 420, 3047–3070Monthly Notices of the Royal Astronomical Society C© 2012 RAS
Dow
nloaded from https://academ
ic.oup.com/m
nras/article/420/4/3047/972505 by guest on 01 August 2022

3066 M. E. Bennett et al.
Figure 15. The overproduction factors of the predicted weak component for the CI and CU rates relative to the ST rate. Isotopes are connected by adjoininglines. The isotopic chains for Kr, Sr, Zr, Mo, Ru, Pd, Cd and Ba in the CU model are labelled for clarity.
with a significant s-process production of nuclides up to the Ba–Lapeak at A ≈ 140. The resulting s-process distribution, peaked at theSr–Y–Zr, is not characteristic of the weak s-process component,stopping at A ≈ 90. The s-process nuclides with 90 < A < 110have overproduction factors that are comparable to 16O multipliedby two. Such differences for the CU case compared to the classicalweak s-process component occur because of the 13C neutron source.
For the CI case, the overabundances of many nuclides are similarto the ST case, except for nuclides that are close to the Sr–Y–Zrpeak or with higher atomic mass (Mo, Ru, Cd and Pd for example).Note that s-process isotopes of Kr and Sr have overproduction fac-tors that are higher than 16O multiplied by two. The abundances ofthe heavier nuclides Y, Zr, Mo, Ru, Cd and Pd show an enhancedproduction, which is 0.5–1.0 dex lower than the Kr–Sr peak. Over-all, the resulting s-process distribution is approximately flat fromNi to Sr.
Fig. 15 shows the overproduction factors for the weak compo-nents of the CI and CU cases plotted relative to the ST case. Thepeak of the relative production of s-process nuclides lies at 87Sr inboth cases and declines smoothly with increasing mass number, al-though the overproduction factor for 86Sr is slightly larger than the87Sr for all cases (see Fig. 14). For the CU case, the overabundanceof 87Sr is 1.7 dex larger than that for the ST case. The enhancementstops at Ba, with 0.5 dex more production and declines steeply, witha production of heavier nuclides similar to that of the ST case. Forthe CI case however, the peak production at 87Sr is 0.6 dex largerthan the ST case and tends to 0.0 at Ba.
The overproduction factors of Sr, Y, Zr, Mo, Ru, Pd and Cd areenhanced in the carbon-core s-process (for example see Fig. 12).In the CU case, this occurs for all models other than model 15CU.In the CI case, the overlap between the convective carbon coreand the carbon shell only occurs for model 20CI. Removing the20-M� models from the evaluation of the weak component allowsfor a comparison between the predicted weak component with andwithout the occurrence of an overlap. Fig. 16 shows the predicted
weak component (CI-no20) using the 15-, 25-, 32- and 60-M�models using initial mass ranges of 12.5–20.0, 20.0–28.5, 28.5–46and 46–80 M� in the IMF calculation. The overproduction factorsfor the CI-no20 case show a reduction in Sr isotopes to values justless than the 16O×2 line and a significant reduction in Y, Zr, Mo,Ru, Pd and Cd isotopes to values similar to the ST case and areduction in Br and Rb isotopes to values close to the 16O/2 line.The branching at 95Zr is also affected, which mainly affects therelative overproduction factors of 96Zr and 95Mo.
6 D I SCUSSI ON
The results in the previous section show that with an increasedcarbon-burning rate, the contribution of the neutron-capture pro-cesses during hydrostatic burning stages to the yields of massivestars is modified significantly.
The CU case exhibits a strong production of isotopes betweenthe iron-group nuclides and the Ba-peak nuclides with regard tocurrent massive star models (see Fig. 14). This production originatesfrom the s-process production in a convective carbon core in whichmixing has caused the ashes of carbon burning to be transported outfrom the centre of the star where it will be present in the supernovaejecta. This overlap was found in all but one of the CU models(15CU). Fig. 14 shows that the yields of the CU case are inconsistentwith the weak s-process contribution to the Solar system abundances(see for example the anomalously high abundance of Sr–Y–Zr peakand Ba–La peak nuclides compared to those with 60 < A < 90).Therefore, a strong resonance with (ωγ ) � 6.8 × 10⁻⁵ eV at acentre-of-mass energy Ecom = 1.5 MeV in the 12C + 12C reactionrate is unlikely to be present in the reaction rate, according to themodels used in the present analysis.
For the CI case, an extended distribution is found but the over-production factors are not as high as the CU case (see Fig. 15). Themain nucleosynthesis differences occur at the Sr–Y–Zr peak and be-yond, which is a signature dominated by the presence of an overlap
C© 2012 The Authors, MNRAS 420, 3047–3070Monthly Notices of the Royal Astronomical Society C© 2012 RAS
Dow
nloaded from https://academ
ic.oup.com/m
nras/article/420/4/3047/972505 by guest on 01 August 2022

The effect of 12C + 12C rate uncertainties 3067
Figure 16. The overproduction factors of the predicted weak component relative to the Solar system abundances with the 20–M� models removed from thecalculation (CI-no20). The weak components for the ST and CI cases including the 20-M� models are included for comparison. Isotopes of a given elementare connected by adjoining lines. The isotopic chains for Cu, Zn, Ge, Se, Kr, Sr, Y, Zr, Mo, Ru, Pd, Cd and Ba in the CU model are labelled for clarity.
of a carbon shell with the convective carbon core. The large over-production of Kr and Sr could suggest that the CI carbon-burningrate is too high. In any case, it is unlikely that a solar metallicitymodel should demonstrate a strong overlap between the convectivecarbon core and the carbon shell of the kind experienced in model20CI. However, considering the present uncertainties in the stellarmodels such as the reaction rates [for example, the critical reactions12C(α, γ )16O and 22Ne(α,n)25Mg], the initial composition and thetreatment of convective–radiative boundaries, the abundance of Sris not a significant enough constraint to assert that the CI rate wouldbe inconsistent with the Solar system abundance distribution.
The production of Sr, Y, Zr and other heavier nuclides has beenstudied extensively as galactic chemical evolution models and ob-servations have suggested the existence of an additional primary nu-cleosynthesis process, the lighter element primary process (LEPP)(Travaglio et al. 2004; Montes et al. 2007). The carbon-core s-process and the mixing of heavy nuclei out from the centre couldprovide an alternative nucleosynthesis scenario for the LEPP. It istempting to underline the similarity between the LEPP signatureand the anomalous carbon-burning s-process component present inthe CU models and partly in the CI models. However, we recallthat the LEPP process should be primary if the solar LEPP and(low metallicity) stellar LEPP are indeed the same process (see forexample Montes et al. 2007). Although the carbon-core s-processfeatures a primary neutron source, 13C, the seed nuclei, 56Fe, aresecondary. Consequently, an s-process component using iron seedsin these conditions cannot reproduce the stellar LEPP abundancesat low metallicity. Therefore, the carbon-core s-process componentis unlikely to represent the site for the stellar LEPP componentat low metallicity. In addition, when the number of seeds is low-ered, the neutron capture per iron seed increases (see equation 4.1)and the distribution of s-process nuclides extends to higher atomicmass. However, if the solar and stellar LEPPs differ in origin, thecarbon-core s-process may provide a solution to the solar LEPP.
7 SU M M A RY A N D C O N C L U S I O N S
In order to investigate the sensitivity of massive star evolution to thepotentially large uncertainties in the carbon-burning rate, 15 stellarmodels with five initial masses of 15, 20, 25, 32 and 60 M� andthree different carbon-burning rates were generated with GENEC andpost-processed with the parallel post-processing code MPPNP. Theyields for each model were then calculated and the consequencesof the different rates on stellar evolution and nucleosynthesis wereexamined. The main results are summarized as follows.
An enhanced carbon-burning rate directly affects the ignitionconditions for carbon burning, which move to lower temperaturesand densities. The reduced temperature lowers the neutrino losses,causing the carbon-burning stage to occur for a longer lifetime. Anincreasing dominance of neutrinos formed through photoneutrinointeractions is seen, rather than formation by pair production. Thechange in temperature and the neutrino losses affects the convectionzone structure. In the models using the CI rate, the maximum initialmass for the formation of a convective carbon core increases by afew solar masses from its current value of ≈22 M�. In models usingthe CU rate, carbon-core burning occurs in a convective core in theentire mass range. The increased carbon-burning rates generallyreduce the number of carbon-burning shells (because they have alarger mass extent) and increase the probability of overlap betweendifferent convective zones. Although the increased carbon-burningrates used in this study strongly affect carbon burning, the impact onfurther burning stages (neon, oxygen and silicon) is small and doesnot present any clear trend. Therefore, no constraint can be appliedto the 12C + 12C rate directly from stellar evolution considerations.
The presence of a significant overlap between the convectivecarbon core and the convective carbon shell, as seen in most ofthe CU models and in model 20CI, may present a further nucle-osynthesis site worthy of investigation. This is especially true con-sidering the present uncertainties in stellar models with regard to
C© 2012 The Authors, MNRAS 420, 3047–3070Monthly Notices of the Royal Astronomical Society C© 2012 RAS
Dow
nloaded from https://academ
ic.oup.com/m
nras/article/420/4/3047/972505 by guest on 01 August 2022
3068 M. E. Bennett et al.
convective–radiative boundaries and the abundance distribution ex-hibited by the carbon-core s-process. In particular, the carbon-cores-process bears similarities to the solar LEPP. However, because ofthe secondary nature of the iron seeds, it cannot provide a solutionto the stellar LEPP at low metallicity. Further studies into the un-certainties relevant for low-metallicity massive stars are required toconfirm this statement.
According to the present models, a strongly enhanced rate (theCU rate) due to the presence of a low-energy resonance (near tothe Gamow peak) causes a large convective carbon core to existin every stellar model. The large convective core will mix isotopesa considerable distance away from the centre of the star, causingthe ejecta to be polluted with matter rich in s-process isotopes. Theoverabundance distribution obtained with the CU rate is too high andhas a vastly different shape. The yields are therefore incompatiblewith the weak s-process contribution to the Solar system and theCU rate is therefore ruled out.
A moderately enhanced rate (the CI rate), like the strongly en-hanced rate, also affects the interior convection zones and conse-quently the structure of the star. With the CI rate, an overlap is onlypresent in the 20–M� case, which enriches the ejecta with prod-ucts of the carbon-core s-process. This enrichment predominantlyinvolves nuclides at the Sr–Y–Zr peak and the heavier elementsMo, Ru, Pd and Cd. With this additional nucleosynthesis compo-nent, the overproduction factor for Kr and Sr seems to be too highto be consistent with the Solar system abundances since it wouldimply that the majority, if not all, of the solar Kr and Sr comes frommassive stars, with only a smaller contribution from asymptotic gi-ant branch (AGB) stars at the Sr peak. For all the other masses, thechanges in nucleosynthesis occur only from changes to carbon-shellburning, which are more subtle and involve isotopes primarily atbranching points. If the contribution from the 20-M� model is notincluded (CI-no20), the yields obtained are very similar to the stan-dard yields. Consequently, the CI rate is probably very close to the‘upper limit’ for the carbon-burning rate to lead to a weak s-processproduction compatible with the Solar system composition.
Given that an overlap between the convective carbon core andshells has such a strong impact on the yields and that 1D stel-lar models use the mixing-length theory (MLT), which might notexactly represent the complex 3D nature of convective–radiativeinterfaces, it will be crucial to study such potential shell overlaps aswell as overlap between burning shells of different burning stages(Arnett & Meakin 2011) in 3D hydrodynamic simulations. It shouldalso be acknowledged that the present conclusions are built on theassumption that the ratio of the α- and p-exit channels of the 12C +12C (13:7) reaction is preserved to lower energies. Further studiesof this uncertainty, including also an analysis of the p-process inmassive stars, will be discussed in a forthcoming paper (Pignatariet al., in preparation).
The effects of the carbon-burning rate on the stellar evolution andnucleosynthesis of massive stars demonstrates that nuclear physicsexperiments investigating 12C + 12C continue to remain relevantfor the understanding of stars and further nuclear physics experi-ments, particularly at energies close to the Gamow peak for hydro-static carbon fusion, are highly desirable in order to improve stellarmodels.
AC K N OW L E D G M E N T S
NuGrid acknowledges significant support from NSF grantPHY0922648 (Joint Institute for Nuclear Astrophysics, JINA) andEU MIRG-CT-2006-046520. KN and RH acknowledge support
from the World Premier International Research Center Initiative(WPI Initiative), MEXT, Japan. RH acknowledges support from theSTFC (UK). MP acknowledges support from the Ambizione grantof the SNSF (Switzerland). RH and MP also acknowledge supportfrom the EUROCORE Eurogenesis programme. FH acknowledgesNSERC Discovery Grant funding. The work of CF and GR wasfunded in part under the auspices of the National Nuclear SecurityAdministration of the U.S. Department of Energy at Los AlamosNational Laboratory and supported by Contract No. DE-AC52-06NA25396. Computations were performed at the Arizona StateUniversity’s Fulton High-performance Computing Center (USA),the high-performance computer KHAOS at EPSAM Institute atKeele University (UK) and the CFI (Canada) funded computingresources at the Department of Physics and Astronomy at the Uni-versity of Victoria. This work used the SE library (LA-CC-08-057)developed at Los Alamos National Laboratory as part of the Nu-Grid collaboration; the SE library makes use of the HDF5 library,which was developed by The HDF Group and by the National Cen-ter for Supercomputing Applications at the University of Illinois atUrbana-Champaign.
R E F E R E N C E S
Aguilera E. F. et al., 2006, Phys. Rev. C, 73, 064601Aikawa M., Arnould M., Goriely S., Jorissen A., Takahashi K., 2005, A&A,
441, 1195Angulo C. et al., 1999, Nuclear Phys. A, 656, 3Arcoragi J., Langer N., Arnould M., 1991, A&A, 249, 134Arnett W. D., 1972, ApJ, 176, 699Arnett W. D., Meakin C., 2011, ApJ, 733, 78Arnett W. D., Thielemann F., 1985, ApJ, 295, 589Arnett W. D., Truran J. W., 1969, ApJ, 157, 339Barron-Palos et al., 2006, Nuclear Phys. A, 779, 318Bennett M. E. et al., 2010a, J. Phys. Conf. Ser., 202, 012023Bennett M. E. et al., 2010b, Proc. 11th Symp. on Nuclei in the Cosmos,
Heidelberg, GermanyBetts R. R., Wuosmaa A. H., 1997, Rep. Prog. Phys., 60, 819Busso M., Gallino R., 1985, A&A, 151, 205Caughlan G. R., Fowler W. A., 1988, At. Data Nucl. Data Tables, 40, 283Chieffi A., Limongi M., Straniero O., 1998, ApJ, 502, 737Clayton D. D., 1968, Principles of Stellar Evolution and Nucleosynthesis:
Univ. Chicago Press, ChicagoCooper R. L., Steiner A. W., Brown E. F., 2009, ApJ, 702, 660Couch R. G., Schmiedekamp A. B., Arnett W. D., 1974, ApJ, 190, 95Dayras R., Switkowski Z. E., Woosley S. E., 1977, Nuclear Phys. A, 279,
70de Jager C., Nieuwenhuijzen H., van der Hucht K. A., 1988, A&AS, 72, 259Descouvemont P., 1993, Phys. Rev. C, 48, 2746Diaz-Torres A., 2008, Phys. Rev. Lett., 101, 122501Diaz-Torres A., Gasques L. R., Wiescher M., 2007, Phys. Lett. B, 652, 255Dillmann I., Heil M., Kappeler F., Plag R., Rauscher T., Thielemann F., 2006,
in Woehr A., Aprahamian A., eds, AIP Conf. Ser. Vol. 819, CaptureGamma-Ray Spectroscopy and Related Topics. Am. Inst. Phys., NewYork, p. 123
Eggenberger P., Meynet G., Maeder A., Hirschi R., Charbonnel C., TalonS., Ekstrom S., 2008, Ap&SS, 316, 43
El Eid M. F., Meyer B. S., The L., 2004, ApJ, 611, 452El Eid M. F., The L.-S., Meyer B. S., 2009, Space Sci. Rev., 147, 1Ferguson J. W., Alexander D. R., Allard F., Barman T., Bodnarik J. G.,
Hauschildt P. H., Heffner-Wong A., Tamanai A., 2005, ApJ, 623, 585Fryer C., 2009, APS April Meeting Abstract, p. B4001Fuller G. M., Fowler W. A., Newman M. J., 1985, ApJ, 293, 1Fynbo H. O. U. et al., 2005, Nat, 433, 136Gasques L. R., Brown E. F., Chieffi A., Jiang C. L., Limongi M., Rolfs C.,
Wiescher M., Yakovlev D. G., 2007, Phys. Rev. C, 76, 035802
C© 2012 The Authors, MNRAS 420, 3047–3070Monthly Notices of the Royal Astronomical Society C© 2012 RAS
Dow
nloaded from https://academ
ic.oup.com/m
nras/article/420/4/3047/972505 by guest on 01 August 2022

The effect of 12C + 12C rate uncertainties 3069
Grevesse N., Noels A., 1993, in Prantzos N., Vangioni-Flam E., Casse M.,eds, Origin and Evolution of the Elements. Cambridge Univ. Press,Cambridge, p. 15
Gropp W., Lusk E., Skjellum A., 1999, Using MPI: Portable Parallel Pro-gramming with the Message-Passing Interface, 2nd edn. MIT Press,Cambridge, MA
Heger A., Langer N., Woosley S. E., 2000, ApJ, 528, 368Herwig F. et al., 2008, in Nuclei in the Cosmos (NIC X), Proceedings of
Science, 023Hirschi R., Meynet G., Maeder A., 2004, A&A, 425, 649Hirschi R., Meynet G., Maeder A., 2005, A&A, 433, 1013Hix W. R., Khokhlov A. M., Wheeler J. C., Thielemann F., 1998, ApJ, 503,
332Iapichino L., Lesaffre P., 2010, A&A, 512, A27Iliadis C., D’Auria J. M., Starrfield S., Thompson W. J., Wiescher M., 2001,
ApJS, 134, 151Imanishi B., 1968, Phys. Lett. B, 27, 267Imbriani G., Limongi M., Gialanella L., Terrasi F., Straniero O., Chieffi A.,
2001, ApJ, 558, 903Imbriani G. et al., 2005, Eur. Phys. J. A, 25, 455Itoh N., Adachi T., Nakagawa M., Kohyama Y., Munakata H., 1989, ApJ,
339, 354Itoh N., Hayashi H., Nishikawa A., Kohyama Y., 1996, ApJS, 102, 411Jaeger M., Kunz R., Mayer A., Hammer J. W., Staudt G., Kratz K. L.,
Pfeiffer B., 2001, Phys. Rev. Lett., 87, 202501Jiang C. L., Esbensen H., Back B. B., Janssens R. V., Rehm K. E., 2004,
Phys. Rev. C, 69, 014604Jiang C. L., Rehm K. E., Back B. B., Janssens R. V. F., 2007, Phys. Rev. C,
75, 015803Kappeler F., Beer H., Wisshak K., 1989, Rep. Prog. Phys., 52, 945Kondo Y., Matsuse T., Abe Y., 1978, Prog. Theor. Phys, 59, 465Kunz R., Fey M., Jaeger M., Mayer A., Hammer J. W., Staudt G., Harissop-
ulos S., Paradellis T., 2002, ApJ, 567, 643Lamb S. A., Howard W. M., Truran J. W., Iben I., Jr, 1977, ApJ, 217, 213Limongi M., Straniero O., Chieffi A., 2000, ApJS, 129, 625Maeder A., 2009, Physics, Formation and Evolution of Rotating Stars.
Springer-Verlag, BerlinMauron N., Josselin E., 2011, A&A, 526, A156Meynet G., Maeder A., 2003, A&A, 404, 975Michaud G. J., Vogt E. W., 1972, Phys. Rev. C, 5, 350Montes F. et al., 2007, ApJ, 671, 1685Mukhamedzhanov A. M. et al., 2003, Phys. Rev. C, 67, 065804Nugis T., Lamers H. J. G. L. M., 2000, A&A, 360, 227Oda T., Hino M., Muto K., Takahara M., Sato K., 1994, At. Data Nucl. Data
Tables, 56, 231Perez-Torres R., Belyaeva T. L., Aguilera E. F., 2006, Phys. Atomic Nuclei,
69, 1372Peters J. G., 1968, ApJ, 154, 225Pignatari M., Gallino R., Heil M., Wiescher M., Kappeler F., Herwig F.,
Bisterzo S., 2010, ApJ, 710, 1557Prantzos N., Arnould M., Arcoragi J., 1987, ApJ, 315, 209Raiteri C. M., Busso M., Picchio G., Gallino R., Pulone L., 1991a, ApJ, 367,
228Raiteri C. M., Busso M., Picchio G., Gallino R., 1991b, ApJ, 371, 665Rauscher T., Thielemann F., 2000, At. Data Nucl. Data Tables, 75, 1Rauscher T., Thielemann F., 2001, At. Data Nucl. Data Tables, 79, 47Rauscher T., Heger A., Hoffman R. D., Woosley S. E., 2002, ApJ, 576, 323Rogers F. J., Swenson F. J., Iglesias C. A., 1996, ApJ, 456, 902Spillane T. et al., 2007, Phys. Rev. Lett., 98, 122501Strieder F., 2008, J. Phys. G: Nuclear Phys., 35, 014009Strieder F., 2010, J. Phys. Conf. Ser., 202, 012025Terrasi F. et al., 2007, Nucl. Instrum. Methods Phys. Res. B, 259, 14The L.-S., El Eid M. F., Meyer B. S., 2000, ApJ, 533, 998The L., El Eid M. F., Meyer B. S., 2007, ApJ, 655, 1058Tinsley B. M., 1979, ApJ, 229, 1046Travaglio C., Gallino R., Arnone E., Cowan J., Jordan F., Sneden C., 2004,
ApJ, 601, 864Truran J. W., Cameron A. G. W., 1971, Ap&SS, 14, 179
Truran J. W., Iben I., Jr, 1977, ApJ, 216, 797Tur C., Heger A., Austin S. M., 2009, ApJ, 702, 1068Vink J. S., de Koter A., Lamers H. J. G. L. M., 2001, A&A, 369, 574Woosley S. E., Weaver T. A., 1986, ARA&A, 24, 205Woosley S. E., Weaver T. A., 1995, ApJS, 101, 181Woosley S. E., Heger A., Weaver T. A., 2002, Rev. Mod. Phys., 74, 1015Xu C., Qi C., Liotta R. J., Wyss R., Wang S. M., Xu F. R., Jiang D. X., 2010,
Phys. Rev. C, 81, 054319Yakovlev D. G., Beard M., Gasques L. R., Wiescher M., 2010, Phys. Rev.
C, 82, 044609Young P. A., Fryer C. L., 2007, ApJ, 664, 1033Zickefoose J. et al., 2010, Proc. 11th Symp. on Nuclei in the Cosmos,
Heidelberg, Germany
A P P E N D I X A : PA R A L L E L - P RO G R A M M I N GI M P L E M E N TAT I O N
At a particular timestep, the parameters for a 1D spherical shell (orzone) are loaded into memory and a nuclear reaction network is cal-culated for that zone. This requires the inverse of a square matrix tobe calculated, which has dimensions equal to the number of isotopesincluded in the network. For each timestep there are typically 103
zones, dependent on the stellar model and the evolutionary stageof the model, and there are ∼106 timesteps per model. Therefore,the post-processing of a single stellar model requires ∼109 nuclearnetwork calculations. With the nuclear reaction network specified inTable 1 including �1.3 × 10⁴ reactions, the computational expenseinvolved becomes significant; the typical duration of a single MPPNP
run on a uniprocessor is approximately 10–12 months with currentserial technology. Therefore, the application of parallel program-ming is an absolute necessity to allow the calculations to completeover a reasonable time-scale.
The choice of parallelism is a simple master–slave (orWORKQUEUE) strategy where a single, master, processor allocateswork to a number of slave processors, which is implemented usingthe Message Passing Interface (MPI) library routines in FORTRAN
(Gropp, Lusk & Skjellum 1999). This is an implementation ofparallelism where processors communicate information by pass-ing ‘messages’ to each other with each processor having access toa local, private memory. The advantage of message passing is theability to operate on distributed memory resources (such as clusternetworks), as well as shared memory resources, and the ability tocontrol explicitly how communications are handled and the parallelbehaviour of the program. It is an embarrassingly parallel program,6
which allows for an efficient parallelization and reduces dramati-cally the potential communication overhead. This was achieved bydistributing ‘work’ over mass zones for each timestep, which are cal-culated independently from each other during the post-processingcalculations. Here, a single unit of ‘work’ is defined as the nuclearreaction network calculation (in flops) for all involved species for asingle zone at a particular timestep.
The operation of the parallel program is as follows. First, thenuclear reaction rates and other global parameters are broadcastedto each slave so that each processor has the required data availablein local memory. Then a loop over timesteps is entered. For eachiteration of the loop, a simple first-in first-out (FIFO) scheduler isinvoked, which assigns work (in the form of a message containing
6 An embarrassingly parallel program is one where slave processors arenot required to communicate information to each other during the run; theproblem can simply be split and allocated in parts to a large number ofprocessors.
C© 2012 The Authors, MNRAS 420, 3047–3070Monthly Notices of the Royal Astronomical Society C© 2012 RAS
Dow
nloaded from https://academ
ic.oup.com/m
nras/article/420/4/3047/972505 by guest on 01 August 2022

3070 M. E. Bennett et al.
the temperature, density and abundances) zone by zone (from thecentre to the surface), first to all assigned processors and then toidle processors as they become available for further work.
Load balancing is important to reduce the impact of idle proces-sors on the performance. In MPPNP, a simple load balancing schemeis specified, where the zones are allocated in order from the centre tothe surface. This choice is made in lieu with the typical distributionof work over the interior of the star at any particular timestep. Thedistribution is set by the dynamic network implemented in MPPNP,which adds or removes isotopes from the network calculation de-pending on the nucleosynthesis flux limits (negligible changes inabundances are ignored to save on unnecessary computation). Ingeneral, the dynamic network assigns more isotopes to zones thathave higher temperatures (since higher temperatures increase thenuclear reaction rates) and are convective (since the resultant mix-ing can cause an increase in the abundance of fuel). Therefore, thedistribution has a maximum in the centre and decreases with masscoordinate towards the surface, affected by the presence of convec-tion zones. However, this is a general case; it is not unusual to havea non-monotonic distribution of work at particular steps through-out the model evolution, especially at the boundaries of convectionzones and where neutron sources are efficient.
The parallel burning step is followed by a serial mixing step. Thechange in mass-fraction abundance of species i, Xi, over time, t, iscalculated using the diffusion equation
∂Xi
∂t= ∂
∂mr
[D(4πr2ρ)2 ∂Xi
∂mr
], (A1)
where mr is the mass coordinate (at radius r), ρ is the density andD is the diffusion coefficient calculated from MLT. The diffusioncoefficient is normally large enough (∼1016 cm2 s−1 for hydrogenand helium burning) so that all convection zones, over a timestept, act to smooth out immediately any sharp changes in abundanceassociated with concentrated nuclear burning.
Fig. A1 shows the speed-up factor of MPPNP for a small test run(with 250 zones and 2000 timesteps; a typical stellar model uses≈103 zones and ∼106 timesteps) compared to the theoretical lawspredicted by Amdahl’s and Gustafson’s law for a program with aserial fraction of 1 per cent. Amdahl’s law,
S(p) = ts
tp= ts
f ts + (1 − f )ts/p= p
1 + p − 1f, (A2)
gives the maximum speed-up, S(p), possible for a program with afixed amount of work, i.e. the time spent running serial computa-tions is constant. In equation (A2), ts is the duration of the programwith a serial fraction, f , on a uniprocessor and tp is the parallel du-ration on a system with p processors. The close fit of this law withMPPNP suggests that the parallelization is close to the ideal case andis not hampered by communication overhead or excessive initial-ization. However, it would be preferable to achieve a parallelizationcomparable to Gustafson’s law,
Figure A1. Speed-up factor for MPPNP with respect to those of Gustafson’slaw and Amdahl’s law with a serial fraction of 1 per cent.
S(p) = ts
tp= f tp + p(1 − f )tp
tp= p + f (1 − p), (A3)
which is the maximum speed-up possible with a constraint on theparallel time, i.e. the time spent running parallel computations isconstant. This could be achieved by including more zones (for ex-ample, with the adaptive mesh refinement routine), but the improvedscaling would come at the expense of an increased workload. In anycase, only 250 zones were used in the test case; as the number ofslave processors approaches 250, the total number of jobs allocatedto each processor approaches unity. In this regime, the time spentby idle processors is likely to increase significantly and the speed-up factor will plateau. The post-processing calculations for eachmodel, using 60 slave processors, took approximately 5–10 d each,depending on the model.
S U P P O RT I N G IN F O R M AT I O N
Additional Supporting Information may be found in the online ver-sion of this article.
Table 7. Yields for all models.
Please note: Wiley-Blackwell are not responsible for the content orfunctionality of any supporting materials supplied by the authors.Any queries (other than missing material) should be directed to thecorresponding author for the article.
This paper has been typeset from a TEX/LATEX file prepared by the author.
C© 2012 The Authors, MNRAS 420, 3047–3070Monthly Notices of the Royal Astronomical Society C© 2012 RAS
Dow
nloaded from https://academ
ic.oup.com/m
nras/article/420/4/3047/972505 by guest on 01 August 2022