The ecosystem of the Mid-Atlantic Ridge at the sub-polar front and Charlie–Gibbs Fracture Zone;...
11
The ecosystem of the Mid-Atlantic Ridge at the sub-polar front and Charlie–Gibbs Fracture Zone; ECO-MAR project strategy and description of the sampling programme 2007–2010 $ Imants G. Priede a,n , David S.M. Billett b , Andrew S. Brierley c , A. Rus Hoelzel d , Mark Inall e , Peter I. Miller f , Nicola J. Cousins a , Mark A. Shields a , Toyonobu Fujii a a Oceanlab, University of Aberdeen, Main Street, Newburgh, Aberdeen AB41 6AA, UK b National Oceanography Centre, European Way, Southampton SO14 3 ZH, UK c Pelagic Ecology Research Group, Gatty Marine Laboratory, University of St Andrews, St Andrews KY16 8LB, UK d School of Biological and Biomedical Sciences, University of Durham, South Road, Durham DH1 3LE, UK e Scottish Association for Marine Science, Dunstaffnage Marine Laboratory, Oban, Argyll PA371QA, UK f Plymouth Marine Laboratory, Prospect Place, The Hoe, Plymouth PL1 3DH, UK article info Available online 26 June 2013 Keywords: Mid-ocean ridge Marine protected area North Atlantic Benthic Pelagic Trawling Bathymetry Remotely operated vehicle Charlie–Gibbs abstract The ECOMAR project investigated photosynthetically-supported life on the North Mid-Atlantic Ridge (MAR) between the Azores and Iceland focussing on the Charlie–Gibbs Fracture Zone area in the vicinity of the sub-polar front where the North Atlantic Current crosses the MAR. Repeat visits were made to four stations at 2500 m depth on the flanks of the MAR in the years 2007–2010; a pair of northern stations at 541N in cold water north of the sub-polar front and southern stations at 491N in warmer water influenced by eddies from the North Atlantic Current. At each station an instrumented mooring was deployed with current meters and sediment traps (100 and 1000 m above the sea floor) to sample downward flux of particulate matter. The patterns of water flow, fronts, primary production and export flux in the region were studied by a combination of remote sensing and in situ measurements. Sonar, tow nets and profilers sampled pelagic fauna over the MAR. Swath bathymetry surveys across the ridge revealed sediment-covered flat terraces parallel to the axis of the MAR with intervening steep rocky slopes. Otter trawls, megacores, baited traps and a suite of tools carried by the R.O.V. Isis including push cores, grabs and a suction device collected benthic fauna. Video and photo surveys were also conducted using the SHRIMP towed vehicle and the R.O.V. Isis. Additional surveying and sampling by landers and R.O.V. focussed on the summit of a seamount (48144′N, 28110′W) on the western crest of the MAR between the two southern stations. & 2013 The Authors. Published by Elsevier Ltd. All rights reserved. 1. Introduction The Mid-Atlantic Ridge (MAR) was described by Murray and Hjort (1912) as dividing the ocean into eastern and western deep basins from Iceland to at least 531S. During their voyage on board R.V. Michael Sars in 1910 they discovered abundant and diverse fish and invertebrate faunas on these mid-ocean shallow areas of the North Atlantic. Information on the geographical extent of the ridge emerged over subsequent decades. Tolstoy and Ewing (1949) produced con- tinuous echograms traversing the MAR revealing topographical details. More comprehensive mapping during the 1950 and 1960s (Doel et al., 2006) showed that the MAR forms part of a continuous chain of ridges circumscribing the planet (Heezen, 1969). Biological research on mid ocean ridge systems was greatly stimulated by the discovery of chemosynthetically-supported life around hydrothermal vent sites, first in Pacific Ocean (Corliss and Ballard, 1977), subse- quently on the MAR (Rona et al., 1986) and later at numerous locations around the global ocean ridge system (Van Dover, 2000; Baker et al., 2010). However, despite their wide-spread occurrence, vent fields are small in area and contribute a minor fraction of the total biological productivity on mid ocean ridges. Export from photosynthesis in the surface layers of the ocean provides the bulk of food resources to the benthos (Priede et al., 2013a). From 1973 in the North Atlantic, fishery fleets of several nations began to exploit Contents lists available at ScienceDirect journal homepage: www.elsevier.com/locate/dsr2 Deep-Sea Research II 0967-0645/$ - see front matter & 2013 The Authors. Published by Elsevier Ltd. All rights reserved. http://dx.doi.org/10.1016/j.dsr2.2013.06.012 ☆ This is an open-access article distributed under the terms of the Creative Commons Attribution License, which permits unrestricted use, distribution, and reproduction in any medium, provided the original author and source are credited. n Corresponding author. E-mail addresses: [email protected] (I.G. Priede), [email protected] (D.S.M. Billett), [email protected] (A.S. Brierley), [email protected] (A.R. Hoelzel), [email protected] (M. Inall), [email protected] (P.I. Miller), [email protected] (N.J. Cousins), [email protected] (M.A. Shields), [email protected] (T. Fujii). Deep-Sea Research II 98 (2013) 220–230
-
Upload
independent -
Category
Documents
-
view
2 -
download
0
Transcript of The ecosystem of the Mid-Atlantic Ridge at the sub-polar front and Charlie–Gibbs Fracture Zone;...

Deep-Sea Research II 98 (2013) 220–230
Contents lists available at ScienceDirect
Deep-Sea Research II
0967-06http://d
☆ThisCommoreprodu
n CorrE-m
[email protected]@pmm.a.shie
journal homepage: www.elsevier.com/locate/dsr2
The ecosystem of the Mid-Atlantic Ridge at the sub-polar front andCharlie–Gibbs Fracture Zone; ECO-MAR project strategy anddescription of the sampling programme 2007–2010$
Imants G. Priede a,n, David S.M. Billett b, Andrew S. Brierley c, A. Rus Hoelzel d, Mark Inall e,Peter I. Miller f, Nicola J. Cousins a, Mark A. Shields a, Toyonobu Fujii a
a Oceanlab, University of Aberdeen, Main Street, Newburgh, Aberdeen AB41 6AA, UKb National Oceanography Centre, European Way, Southampton SO14 3 ZH, UKc Pelagic Ecology Research Group, Gatty Marine Laboratory, University of St Andrews, St Andrews KY16 8LB, UKd School of Biological and Biomedical Sciences, University of Durham, South Road, Durham DH1 3LE, UKe Scottish Association for Marine Science, Dunstaffnage Marine Laboratory, Oban, Argyll PA371QA, UKf Plymouth Marine Laboratory, Prospect Place, The Hoe, Plymouth PL1 3DH, UK
a r t i c l e i n f o
Available online 26 June 2013
Keywords:Mid-ocean ridgeMarine protected areaNorth AtlanticBenthicPelagicTrawlingBathymetryRemotely operated vehicleCharlie–Gibbs
45/$ - see front matter & 2013 The Authors. Px.doi.org/10.1016/j.dsr2.2013.06.012
is an open-access article distributed undens Attribution License, which permits unresction in any medium, provided the original auesponding author.ail addresses: [email protected] (I.G. Priedoc.ac.uk (D.S.M. Billett), [email protected]@durham.ac.uk (A.R. Hoelzel), [email protected] (P.I. Miller), [email protected] ([email protected] (M.A. Shields), [email protected]
a b s t r a c t
The ECOMAR project investigated photosynthetically-supported life on the North Mid-Atlantic Ridge(MAR) between the Azores and Iceland focussing on the Charlie–Gibbs Fracture Zone area in the vicinityof the sub-polar front where the North Atlantic Current crosses the MAR. Repeat visits were made to fourstations at 2500 m depth on the flanks of the MAR in the years 2007–2010; a pair of northern stations at541N in cold water north of the sub-polar front and southern stations at 491N in warmer waterinfluenced by eddies from the North Atlantic Current. At each station an instrumented mooring wasdeployed with current meters and sediment traps (100 and 1000 m above the sea floor) to sampledownward flux of particulate matter. The patterns of water flow, fronts, primary production and exportflux in the regionwere studied by a combination of remote sensing and in situ measurements. Sonar, townets and profilers sampled pelagic fauna over the MAR. Swath bathymetry surveys across the ridgerevealed sediment-covered flat terraces parallel to the axis of the MAR with intervening steep rockyslopes. Otter trawls, megacores, baited traps and a suite of tools carried by the R.O.V. Isis including pushcores, grabs and a suction device collected benthic fauna. Video and photo surveys were also conductedusing the SHRIMP towed vehicle and the R.O.V. Isis. Additional surveying and sampling by landers andR.O.V. focussed on the summit of a seamount (48144′N, 28110′W) on the western crest of the MARbetween the two southern stations.
& 2013 The Authors. Published by Elsevier Ltd. All rights reserved.
1. Introduction
The Mid-Atlantic Ridge (MAR) was described by Murray and Hjort(1912) as dividing the ocean into eastern and western deep basinsfrom Iceland to at least 531S. During their voyage on board R.V.Michael Sars in 1910 they discovered abundant and diverse fish andinvertebrate faunas on these mid-ocean shallow areas of the North
ublished by Elsevier Ltd. All rights
r the terms of the Creativetricted use, distribution, andthor and source are credited.
e),uk (A.S. Brierley),ams.ac.uk (M. Inall),J. Cousins),.uk (T. Fujii).
Atlantic. Information on the geographical extent of the ridge emergedover subsequent decades. Tolstoy and Ewing (1949) produced con-tinuous echograms traversing the MAR revealing topographicaldetails. More comprehensive mapping during the 1950 and 1960s(Doel et al., 2006) showed that the MAR forms part of a continuouschain of ridges circumscribing the planet (Heezen, 1969). Biologicalresearch on mid ocean ridge systems was greatly stimulated by thediscovery of chemosynthetically-supported life around hydrothermalvent sites, first in Pacific Ocean (Corliss and Ballard, 1977), subse-quently on the MAR (Rona et al., 1986) and later at numerouslocations around the global ocean ridge system (Van Dover, 2000;Baker et al., 2010). However, despite their wide-spread occurrence,vent fields are small in area and contribute a minor fraction of thetotal biological productivity on mid ocean ridges. Export fromphotosynthesis in the surface layers of the ocean provides the bulkof food resources to the benthos (Priede et al., 2013a). From 1973 inthe North Atlantic, fishery fleets of several nations began to exploit
reserved.
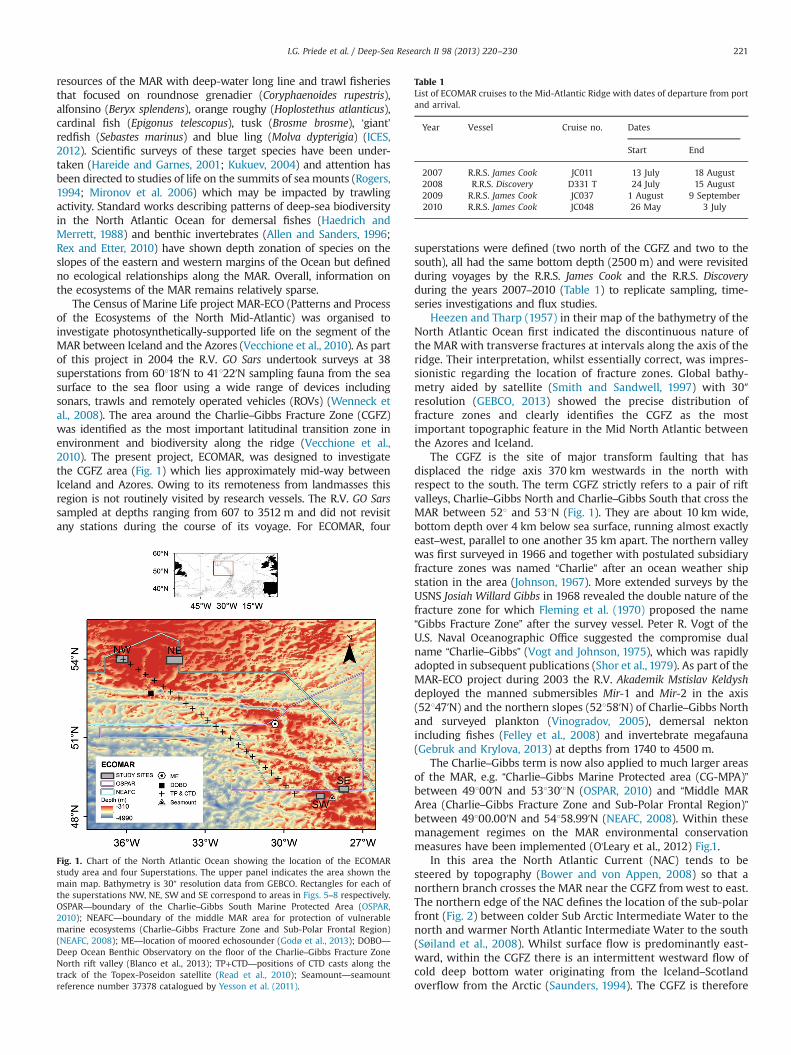
Table 1List of ECOMAR cruises to the Mid-Atlantic Ridge with dates of departure from portand arrival.
Year Vessel Cruise no. Dates
Start End
2007 R.R.S. James Cook JC011 13 July 18 August2008 R.R.S. Discovery D331 T 24 July 15 August2009 R.R.S. James Cook JC037 1 August 9 September2010 R.R.S. James Cook JC048 26 May 3 July
I.G. Priede et al. / Deep-Sea Research II 98 (2013) 220–230 221
resources of the MAR with deep-water long line and trawl fisheriesthat focused on roundnose grenadier (Coryphaenoides rupestris),alfonsino (Beryx splendens), orange roughy (Hoplostethus atlanticus),cardinal fish (Epigonus telescopus), tusk (Brosme brosme), ‘giant’redfish (Sebastes marinus) and blue ling (Molva dypterigia) (ICES,2012). Scientific surveys of these target species have been under-taken (Hareide and Garnes, 2001; Kukuev, 2004) and attention hasbeen directed to studies of life on the summits of sea mounts (Rogers,1994; Mironov et al. 2006) which may be impacted by trawlingactivity. Standard works describing patterns of deep-sea biodiversityin the North Atlantic Ocean for demersal fishes (Haedrich andMerrett, 1988) and benthic invertebrates (Allen and Sanders, 1996;Rex and Etter, 2010) have shown depth zonation of species on theslopes of the eastern and western margins of the Ocean but definedno ecological relationships along the MAR. Overall, information onthe ecosystems of the MAR remains relatively sparse.
The Census of Marine Life project MAR-ECO (Patterns and Processof the Ecosystems of the North Mid-Atlantic) was organised toinvestigate photosynthetically-supported life on the segment of theMAR between Iceland and the Azores (Vecchione et al., 2010). As partof this project in 2004 the R.V. GO Sars undertook surveys at 38superstations from 60118′N to 41122′N sampling fauna from the seasurface to the sea floor using a wide range of devices includingsonars, trawls and remotely operated vehicles (ROVs) (Wenneck etal., 2008). The area around the Charlie–Gibbs Fracture Zone (CGFZ)was identified as the most important latitudinal transition zone inenvironment and biodiversity along the ridge (Vecchione et al.,2010). The present project, ECOMAR, was designed to investigatethe CGFZ area (Fig. 1) which lies approximately mid-way betweenIceland and Azores. Owing to its remoteness from landmasses thisregion is not routinely visited by research vessels. The R.V. GO Sarssampled at depths ranging from 607 to 3512 m and did not revisitany stations during the course of its voyage. For ECOMAR, four
Fig. 1. Chart of the North Atlantic Ocean showing the location of the ECOMARstudy area and four Superstations. The upper panel indicates the area shown themain map. Bathymetry is 30″ resolution data from GEBCO. Rectangles for each ofthe superstations NW, NE, SW and SE correspond to areas in Figs. 5–8 respectively.OSPAR—boundary of the Charlie–Gibbs South Marine Protected Area (OSPAR,2010); NEAFC—boundary of the middle MAR area for protection of vulnerablemarine ecosystems (Charlie–Gibbs Fracture Zone and Sub-Polar Frontal Region)(NEAFC, 2008); ME—location of moored echosounder (Godø et al., 2013); DOBO—Deep Ocean Benthic Observatory on the floor of the Charlie–Gibbs Fracture ZoneNorth rift valley (Blanco et al., 2013); TP+CTD—positions of CTD casts along thetrack of the Topex-Poseidon satellite (Read et al., 2010); Seamount—seamountreference number 37378 catalogued by Yesson et al. (2011).
superstations were defined (two north of the CGFZ and two to thesouth), all had the same bottom depth (2500 m) and were revisitedduring voyages by the R.R.S. James Cook and the R.R.S. Discoveryduring the years 2007–2010 (Table 1) to replicate sampling, time-series investigations and flux studies.
Heezen and Tharp (1957) in their map of the bathymetry of theNorth Atlantic Ocean first indicated the discontinuous nature ofthe MAR with transverse fractures at intervals along the axis of theridge. Their interpretation, whilst essentially correct, was impres-sionistic regarding the location of fracture zones. Global bathy-metry aided by satellite (Smith and Sandwell, 1997) with 30″resolution (GEBCO, 2013) showed the precise distribution offracture zones and clearly identifies the CGFZ as the mostimportant topographic feature in the Mid North Atlantic betweenthe Azores and Iceland.
The CGFZ is the site of major transform faulting that hasdisplaced the ridge axis 370 km westwards in the north withrespect to the south. The term CGFZ strictly refers to a pair of riftvalleys, Charlie–Gibbs North and Charlie–Gibbs South that cross theMAR between 521 and 531N (Fig. 1). They are about 10 km wide,bottom depth over 4 km below sea surface, running almost exactlyeast–west, parallel to one another 35 km apart. The northern valleywas first surveyed in 1966 and together with postulated subsidiaryfracture zones was named “Charlie” after an ocean weather shipstation in the area (Johnson, 1967). More extended surveys by theUSNS Josiah Willard Gibbs in 1968 revealed the double nature of thefracture zone for which Fleming et al. (1970) proposed the name“Gibbs Fracture Zone” after the survey vessel. Peter R. Vogt of theU.S. Naval Oceanographic Office suggested the compromise dualname “Charlie–Gibbs” (Vogt and Johnson, 1975), which was rapidlyadopted in subsequent publications (Shor et al., 1979). As part of theMAR-ECO project during 2003 the R.V. Akademik Mstislav Keldyshdeployed the manned submersibles Mir-1 and Mir-2 in the axis(52147′N) and the northern slopes (52158′N) of Charlie–Gibbs Northand surveyed plankton (Vinogradov, 2005), demersal nektonincluding fishes (Felley et al., 2008) and invertebrate megafauna(Gebruk and Krylova, 2013) at depths from 1740 to 4500 m.
The Charlie–Gibbs term is now also applied to much larger areasof the MAR, e.g. “Charlie–Gibbs Marine Protected area (CG-MPA)”between 49100′N and 53130′1N (OSPAR, 2010) and “Middle MARArea (Charlie–Gibbs Fracture Zone and Sub-Polar Frontal Region)”between 49100.00′N and 54158.99′N (NEAFC, 2008). Within thesemanagement regimes on the MAR environmental conservationmeasures have been implemented (O'Leary et al., 2012) Fig.1.
In this area the North Atlantic Current (NAC) tends to besteered by topography (Bower and von Appen, 2008) so that anorthern branch crosses the MAR near the CGFZ fromwest to east.The northern edge of the NAC defines the location of the sub-polarfront (Fig. 2) between colder Sub Arctic Intermediate Water to thenorth and warmer North Atlantic Intermediate Water to the south(Søiland et al., 2008). Whilst surface flow is predominantly east-ward, within the CGFZ there is an intermittent westward flow ofcold deep bottom water originating from the Iceland–Scotlandoverflow from the Arctic (Saunders, 1994). The CGFZ is therefore

35° 30° 25° W
50°
N 55°
SESW
NENW
SESW
NENW
Fig. 2. Sea surface temperature (SST) image transmitted to the R.R.S. James Cookprior to cruise JC048, NOAA–AVHRR, 7 day median temperature 14–20 May 2010.
I.G. Priede et al. / Deep-Sea Research II 98 (2013) 220–230222
not simply a topographic discontinuity in the MAR but is anoceanographic transition zone between waters of different tem-peratures and flow regimes. Biogeographically the CGFZ is withinthe North Atlantic Drift Province (NADR) defined by Longhurst(1989) as lying between 43130′N and 55130′N with the AtlanticArctic (ARCT) and Atlantic Sub Arctic (SARC) provinces to the northand North Atlantic Subtropical Gyre Province (NAST) to the south.UNESCO (2009) reviewed the biogeographic classification of theoceans and in the pelagic realm defined the area north of theCGFZ-sub-polar front as the Subarctic Atlantic Province with a seasurface temperature (SST) range of 2.06–14.00 1C and the area tothe south as the North Atlantic Current Province with SST 7.49–25.52 1C. In the benthic realm UNESCO (2009) recognised thelower bathyal zone (800–3500 m depth) as consisting of threemain physiographic categories: lower continental margins, sea-mounts together with oceanic island slopes, and mid-ocean ridges.Whilst the ocean margins are dominated by sedimentary depositsfrom continental run-off, UNESCO (2009) postulated that mid-ocean features are more likely to be free of sediment, offering largeexpanses of hard substrate for settlement of invertebrates andhabitat for bathyal fishes. In the UNESCO (2009) classification ofLower Bathyal Provinces, the ECOMAR study area lies approxi-mately on the boundary between the Northern North AtlanticProvince and the North Atlantic Province. Superimposed on thesebenthic provinces are the hydrothermal vent provinces in which aMAR Azores Province is recognised but it is suggested there maybe no extension northward towards to Iceland owing to deepeningof the ridge crest and absence of venting activity (UNESCO, 2009).
The aims of ECOMAR were to evaluate mid-ocean biologicalproductivity and biomass in comparison with the surroundingocean, and to identify differences between north and south of thesub-polar front/CGFZ and differences between east and west of theridge axis.
1.1. The effect of the Mid-Atlantic Ridge
Many arguments regarding the biology of the seamounts(Rowden et al., 2010; Clark et al., 2010) are also applicable tomid-ocean ridges which can be considered as complex aggrega-tions of sea mounts.
1.
The primary effect of the presence of a ridge compared to ahypothetical ocean with a continuous abyssal plain is simpleelevation of the sea floor providing habitats for bathyal speciesthat are otherwise confined to narrow preferred depth zonesaround the ocean margins (Rex and Etter, 2010; Priedeet al.,2010). Remoteness of the MAR may also provide sufficientisolation for speciation and development of endemism (Wilsonand Kaufman, 1987; Stocks and Hart, 2007). Elevation of the seafloor reduces the vertical distance over which export produc-tion is transported downwards, resulting in increased organiccarbon reaching the sea floor thus sustaining a greater benthicbiomass than would otherwise be possible on an abyssal plain(Wei et al., 2010; Duineveld et al., 2004). The crest of the ridgealso may be sufficiently near the surface so that pelagic faunaexecuting night-time downward vertical migrations impingeon the slopes of the ridge delivering additional food to organ-isms living there. Some pelagic species may spontaneouslycongregate around slopes or features of the MAR thus import-ing biomass from the surrounding ocean. Genin (2004) identi-fied five distinct behavioural and physical mechanisms bywhich sea bed topography creates biomass concentrations inoverlying waters, upwelling, topographic blockage of descend-ing zooplankton, counter-upwelling depth retention, counter-downwelling depth retention and enhanced horizontal flux. Allof these may be applicable to parts of the MAR.
2.
A secondary effect of presence of a ridge is that currents (Bowerand von Appen, 2008), tides (Egbert and Ray, 2000) andinternal waves (van Haren et al., 2005) dissipate energy onthe ridge topography. This dissipation may have the effect ofupwelling nutrients towards the surface thus stimulatingprimary production over the summit. Several studies havedetected enhanced concentrations of phytoplankton abovesea mounts (Mouriño et al., 2001). Iron leached from volcanicrocks of the Crozet islands enhanced primary production andorganic carbon export to the adjacent deep sea areas of thesouthern Indian Ocean (Pollard et al., 2009; Wolff et al., 2011).Flow effects such as Taylor cones (Mohn et al., 2009) aroundtopography may help retain and concentrate pelagic biomassthat would otherwise be widely dispersed in the ocean.1.2. The effect of the sub-polar front and CGFZ
1.
The width of the two transverse valleys, Charlie–Gibbs Northand Charlie–Gibbs South, plus the displacement of the axis ofthe MAR by 270 km may constitute a physical barrier prevent-ing or reducing latitudinal dispersal of some bathyal fauna.2.
The presence of fronts and water circulation through the CGFZmay act as a barrier to movement of pelagic fauna, eggs andlarvae between north and south (Woodson et al., 2012;McManus and Woodson, 2012).3.
Different water masses and oceanographic regimes to the northand south of the sub-polar front are likely to result indifferences in timing, quality and amount of primary produc-tion. These differences in primary production will in turnentrain differences in export flux from the surface, leading todifferences in biomass and species composition in the tworegions.4.
The frontal region itself is likely to support distinctive patternsproductivity (Taylor and Ferrari, 2011) that can influencebiomass and biodiversity.1.3. East–west differences across the axis of the MAR
1.
The axis of the MAR may be a barrier to dispersal of organismsliving on the flanks of the MAR at lower bathyal depths. Speciesdifferences might be expected between the east and west.
Fig. 3. Conceptual diagram of a cross section of the Mid-Atlantic Ridge. (a) Theentire ridge showing the axial rift valley with the crest of the ridge and series ofterraces on the flanks on either side. Between the ridges of the terraces there areflat sediment-filled basins. The ECOMAR superstations with moorings are located at2500 m depth on either flank of the ridge. Prevailing surface flow is indicated fromwest to east. (b) Detail of terraced structure and habitat types. Bare rock only occursnear the summits of the terraces on steep faces with cliffs. The steep faces areoriented towards the ridge axis.
Table 2Locations of the moorings at the four ECOMAR super-stations with first deploy-ment dates (start) and final recovery dates (end) indicating approximately theduration of data collection by sediment traps and current meters.
Location Latitude N Longitude W Start End
SE 49102.60′ 27143.48′ 19 July 2007 23 June 2010SW 48146.80′ 28138.43′ 26 July 2007 16 June 2010NW 53159.33′ 36107.39′ 1 August 2007 2 June 2010NE 54100.05′ 34110.61′ 9 August 2007 8 June 2010
I.G. Priede et al. / Deep-Sea Research II 98 (2013) 220–230 223
2.
The North Atlantic basin has been colonised by fauna originat-ing from the eastern and western ocean margins (Mironovet al., 2006) and in mid ocean there is likely a transition zonebetween eastern and western faunas, which may manifest itselfon the MAR.3.
Although the MAR topographically shows east–west symmetrythe hydrography is asymmetrical with predominant surface flowfrom west to east so that on the western side of the MAR flowimpinges on the slopes and summits whereas in the east thesefeatures lie in the lee of the flow (Fig. 3). Such hydrographicasymmetry may create subtle differences in micro-habitats with apredominant dispersal of material, towards the east.2. Materials and methods
2.1. Strategy. ECOMAR was organised in six work packages
1.
Water circulation. Studies were based on a combination ofremote sensing, ship-borne measurements, floats and mooredinstruments. Remote sensing utilised SST data from the AVHRR(advanced very high resolution radiometer) and satellite alti-metry to derive sea surface height and surface geostrophicvelocities. On board ship full depth CTD profiles with a loweredacoustic current profiler (LADCP) were conducted on transectsacross the MAR between the superstations and along a transectwest of the MAR along the Topex/Poseidon/Jason-1 altimetertrack to resolve regional flow patterns. Argo float data weredownloaded from the project website (Read et al., 2010).Moorings at each of the ECOMAR superstations were equippedwith an array of current meters and ADCPs providing contin-uous data over the periods indicated in Table 2.2.
Remote sensing and primary production. The distribution ofthermal fronts over the MAR was investigated using compositefront maps derived from microwave (AMSR-E, TMI, WindSAT)and infrared SST (AVHRR, MODIS) data. Primary productionestimates were derived from a wavelength resolving modelusing mean monthly 9 km NASA SeaWiFS OC4v4 Chla andPathfinder v2009 AVHRR SST data. Primary production wasestimated using satellite remote sensing calibrated by shipborne incubations and in situ measurements at different depthsthroughout the photic zone using methods such as describedby Tilstone et al. (2009). From these data, calculations weremade of export flux to the sea floor.
3.
Pelagic biomass and biodiversity. The distribution of pelagiczooplankton and nekton biomass down to 800 m depth wasinvestigated using vertically-oriented, multi-frequency scienti-fic echo sounders (Simmonds and MacLennan, 2005; Cutteret al., 2009; Cox et al., 2011) validated by net tows. Arectangular mid-water trawl (RMT) was used (Baker et al.,1973) with two opening and closing nets, mouth areas of 1 and8 m2 and mesh size of 330 mm and 4.5 mm, respectively.Vertical profiles of abundance of bioluminescent nekton andzooplankton were obtained with a low-light camera andimpact screen mounted on the CTD rosette (Priede et al.,2006; Heger et al., 2008). These measurements extended downto the sea floor beyond the depth range of sonar and RMT.Pelagic gelatinous plankton were also observed using the R.O.V.Isis and sampled using the suction sampler and a “D” samplerthat encloses a 6.5 l volume of water in a cylinder usinghydraulically operated doors (Youngbluth, 1984). The abun-dance of pelagic fauna in the benthic boundary layer was alsoinvestigated by mounting a low light camera and particle-recording camera on the tool tray of the R.O.V. Isis.4.
Export flux. Two sediment traps were mounted on each of thefour ECOMAR moorings at 100 m and 1000 m above the seafloor to quantify export flux from the surface for comparisonwith stations at similar latitudes in the North-east Atlantic(Lampitt et al., 2001, 2010) and globally (Honjo et al., 2008).5.
Benthic biomass and biodiversity. Benthic fauna weresampled and imaged using a suite of techniques described indetail by Priede et al. (2013b). Video and still image transectswere conducted with the SHRIMP (Seafloor High ResolutionImaging Platform towed vehicle) operated at 2–3 m above thesea floor during cruise JC011in 2007. (Table 1). In 2010 on cruiseJC048 systematic line transects, using the suite of cameras onboard the R.O.V. Isis, provided quantitative estimates of faunaper unit area. This sea floor imaging also provided contextualinformation on habitat type such as substrate type and dis-tribution of sessile fauna. Mobile fauna attracted to bait wereimaged by digital camera on board PAL (Photo Acoustic Lander)using methods described by King et al. (2006) and Priede andBagley (2000). Some studies were done using a low lightcamera on a bioluminescence lander to detect the presence ofbioluminescent fauna attracted to bait (Priede et al., 2006;Heger et al., 2007). Demersal fishes and benthic invertebratemegafauna were collected using a 45 ft (13.7 m) semi-balloonotter trawl (OTSB, Marinovich Trawl Co., Biloxi, USA) fished on asingle warp (Merrett et al., 1991). This gear is identical to thatused for sampling fish (Gordon et al., 1996; Priede et al., 2010)
I.G. Priede et al. / Deep-Sea Research II 98 (2013) 220–230224
and invertebrates (Howell et al., 2002; Billett et al., 2009) onthe abyssal plains and continental rise and slopes of the NEAtlantic, thus providing directly comparable data. An acoustictransmitter on one of the trawl doors provided bottom contactinformation enabling the area of sea floor swept by the trawl tobe determined, allowing results to be expressed quantitativelyin terms of numbers and biomass per unit area. The soft-bottom macrofauna were sampled using a megacorer (Bowersand Connelly) equipped with 100 mm internal diameter coretubes. Smaller 59 mm internal diameter tubes on some deploy-ments allowed sampling of meiofauna. This gear was deployedat a designated coring site at each of the ECOMAR superstationsusing a vertical Kevlar cable and provided quantitative infor-mation on abundance and biomass. Small mobile necrophagousfauna were captured using a baited amphipod trap mounted ona free-fall lander frame. Sessile and slow-moving megafaunawere collected by the R.O.V. Isis using the manipulator claws,suction sampler and box corer. Push cores operated by themanipulator arms were used to obtain targeted samples of softsediment for megafauna and meiofauna. The topography of theMAR (Fig. 2) determined the sampling method used. Themegacorer and the bottom trawl were confined to flat sedi-mentary plains with absence of hard obstructions and anappropriate depth of soft sediment. The baited landers, PAL,amphipod trap and bioluminescence lander were deployed onflat areas, slopes, summits and outcrops but not on steep slopesand cliffs. The SHRIMP could be operated to obtain imageryover all terrains and indeed provided the first information onsediment cover and the nature of the flat plains and slopes ofthe flanks of the MAR. The R.O.V. Isis was capable of imagingand sampling over all bottom types. For working on verticalcliff faces the main cameras on the ROV were mounted facinghorizontally. Sampling on unstable tallus sediment slopes wasvery difficult owing to triggering of frequent avalanches andturbidite flows, which clouded the view from the cameras.
6.
Population genetics. This study determined population con-nectivity between the four ECOMAR superstations and otherareas of the Atlantic Ocean. Samples were obtained from thetrawls and baited traps as well as comparative material fromother expeditions.2.2. Cruises
A series of four cruises was undertaken in the summer monthsof 2007–2010 (Bagley, 2008; Priede, 2007, 2009, 2010) (Table 1).Taking advantage of the sonar and dynamic positioning capabil-ities of the recently commission research vessel R.R.S. James Cookduring the first cruise (JC011), the study area was mapped usingswath bathymetry and locations of the four ECOMAR superstationswhere the depth was 2500 m were identified. An instrumentedmooring with current meters and sediments traps was deployed ateach station. Biological sampling was undertaken at all stationsand CTD (conductivity temperature depth) casts were conductedfrom the south-west to north-west stations across the frontalregion following the track of the TOPEX-POSEIDON satellite orbit(Fig. 1) to gather data on the water masses and flow regimes overthe MAR (Read et al., 2010). In 2008 the R.R.S. Discovery servicedthe moorings, collecting sediment trap samples and current meterdata but no other sampling or survey work was done. The 2009cruise (JC037) undertook a full biological sampling programme ateach of the four stations as well as servicing the moorings. Thearea around the CGFZ was also visited by the NOAA FSV HenryB. Bigelow during 12 June–17 July 2009 to sample pelagic faunaaround the sub-polar front and to repeat-sample some of theR.V. G.O. Sars bottom trawl stations. Results of that work are
reported by Cook et al. (2013) and Sweetman et al. (2013). On thefinal cruise by the R.R.S. James Cook in 2010 (JC048), the remotelyoperated vehicle (ROV) Isis conducted video surveys and samplecollections at all stations. All the moorings were recovered duringthis final cruise resulting in almost 3 years of continuous environ-mental data from all of the stations.
2.3. Station locations
Despite reference to the Charlie–Gibbs Fracture Zone in the titleof the project little sampling was conducted within the fracturezone valleys. A long-term platform, DOBO, deep ocean benthicobservatory (Kemp et al., 2008), was deployed in 2007 on the floorof Charlie–Gibbs North at 3690 m depth (52141.35′N, 35104.17′W)near the location previously instrumented and reported bySaunders (1994) to be representative of average flow throughthe CGFZ (Priede, 2007). DOBO failed and was recovered in 2010having accumulated an assemblage of fouling organisms which arereported by Blanco et al. (2013). In 2010 R.O.V. Isis made videotransects and observations megafauna on the sea floor of Charlie–Gibbs North in the vicinity of the DOBO location.
Most effort in ECOMAR was directed at the four ECOMARsuperstations. A depth of 2500 m was targeted for all four stationsto ensure comparability in view of the well-known zonation ofbottom-living species with depth (Rex and Etter, 2010; Howellet al., 2002). This depth is near the middle of the lower bathyalzone (800–3500 m) as defined by UNESCO (2009) and at a depthstratum that is representative of the largest area of the flanks ofthe MAR. This depth also gave sufficient distance between east andwest to be able to resolve ecological differences between the twosides of the ridge which might not be apparent at stations closertogether on the crest of the ridge. The moorings deployed at eachstation were designed two sediment traps, one at 1000 m abovethe sea floor (1500 m below surface) and a second trap 100 mabove the sea floor. Finding the correct depth defined the exactlocations of the stations. It was pre-determined that the northernstations should be at 541N, 142 km north of the northern rift valleyof the CGFZ and away from the influence of the sub-polar front.The southern stations had to avoid tracks of submarine cablestraversing the MAR. Consequently ca. 491N was chosen. Thisresulted in a distance of 430 nautical miles between the northernand southern stations, which can be travelled by a research vesselwithin 48 h avoiding excessive cruise durations.
Prior to 2007, the GEBCO charts had a resolution of 1′ (IOC, IHO,BODC, 2003). The best available bathymetry for the MAR had beencompiled by Murton (2003) from which charts down to 0.25′resolution could be accessed. This resolution resulted in a297�463 m grid on planning charts but higher resolution wasnecessary to plan sampling and deployments of equipment on thesea floor. During the first cruise, JC011, surveys were conductedfrom the R.R.S. James Cook with the Kongsberg EM120 multibeamswath bathymetry system. Data were displayed in real-time usingOLEX 3D chart system software, (Olex AS, Trondheim, Norway).The multibeam system produced a grid of soundings at 40–50 mintervals over a swath width of 7 km at 2500 m depth which wereinterpolated by OLEX onto 14�14 m grid displayed in real time ona chart plotter. The flanks of the MAR consisted of alternating flatsedimentary plains and sloping terraces. Suitable locations for themoorings at 2500 m depth were found on either side of the ridgeaxis as shown conceptually in Fig. 3. The positions of the southernstations were adjusted so that a straight line between them wasperpendicular to the local axis of the MAR. The surveys alsorevealed a sea mount summit on the western crest of the MARbetween the SE and SW stations (Fig. 1). The minimum depthrecorded was 741 m at 48143.2′N, 28110.0′W. Some sampling was

NW NE
SW SE
Fig. 4. Transects across the Mid-Atlantic ridge taken from swath bathymetrysurveys by the R.R.S. James Cook in 2007 (Cruise JC011) sampled at 0.1′ longitudeintervals. Horizontal bars—the areas covered by charts of the superstations (Figs.5–8). Arrows—locations of the moorings placed at 2500 m depth at each of thesuperstations. (a) Northern transect at 541N between 36124′W and 33151.3′W.The NW mooring is offset 1200 m south of the transect, the NE mooring is on thetransect. (b) The southern transect between 48145.696′N 28141.348′W, 4914.847′N27151.000′W (indicated by vertical dashed line) and 49101.984′N 27141.000′W.
Fig. 5. The north-west superstation showing the mooring location and areassampled. Bathymetry from multibeam swath surveys during cruise JC011 in 2007processed by OLEX software and displayed using ArcGIS. Mooring—location of thesediment trap mooring on sea floor at 2500 m depth; ISIS—starting points of R.O.V.Isis dives during cruise JC048; PAL—locations of baited lander (Photo AcousticLander) for fish studies (Cousins et al., 2013-b); BIOLUM—locations of biolumines-cence lander with high sensitivity camera (Craig, 2012); Amphipod trap—traplocations (Horton et al., 2013); Megacorer—Multi-corer location (Shields et al., inpress); Bathysnap—long term time lapse camera location (Priede, 2007); ROVtransect—500 m long video line transects of the sea floor during cruise JC048 (Bellet al., 2013; Jones et al., 2013). Shrimp track—sea floor video survey line by SHRIMPduring cruise JC011 (Priede, 2007); Trawl box—flat area of sea floor within whichbottom trawling was done for invertebrate megafauna (Alt et al., 2013) and fishes(Cousins et al., 2013-b).
Fig. 6. The north-east superstation showing the mooring location and areassampled. Key as for Fig. 5.
I.G. Priede et al. / Deep-Sea Research II 98 (2013) 220–230 225
also conducted at this location identified as number 37,378 in theglobal catalogue of seamounts (Yesson et al., 2011).
2.3.1. The northern stationsAt latitude 541N the MAR is approximately 980 km wide
between the 3500 m depth contours on either side of ridge axis.The selected mooring locations (Table 2) are 127 km apart. Theaxial rift valley descends to a maximum depth 2814 m and thecrest of the ridge is higher on the eastern side with a summit at1179 m (Fig. 4a).
2.3.2. North-west superstationThe north-west mooring was deployed on the SE edge of a
sedimentary plain (Fig. 5). A flat area to the north at around2610 m depth was designated for trawling. To avoid rough ground,trawling had to be conducted in a “trawl box” along the middle ofthe plain in a North to South or South to North direction parallel tothe MAR axis. This direction was generally perpendicular to theprevailing westerly winds and seas requiring use of the trackingcapabilities of the R.R.S. James Cook dynamic-positioning systemand thrusters to maintain the correct course for trawling. Theposition for coring was at 2620 m depth in the centre of the flatplain avoiding the trawl box. Baited landers were placed at depthsclose to 2500 m to the south and west of the mooring location butwere spaced at least 1500 m apart to avoid mutual interference ofodour plumes from adjacent stations. During cruise JC011 SHRIMPwas deployed twice on transects across contrasting steep and flatterrain to observe the sea floor. During cruise JC048 five diveswere conducted with R.O.V. Isis to the SW of the mooring location.The range of depths sampled at the NW station was from 2210 mon the summit of the terraces to 2620 m on deepest parts of thetrawling areas.
2.3.3. The north-east superstationThe north-east mooring was located on a sedimentary plain at
541N with the site chosen for coring in the centre 1130 m to thenorth (Fig. 6). A large expanse suitable for trawling was found15 km towards the east with an average depth of 2440 m. SHRIMP
was used for surveys across the trawl area and steep terraces andthe plain near the mooring site. Three R.O.V. Isis dives were locatednear the mooring location in areas of contrasting slopes. Baited
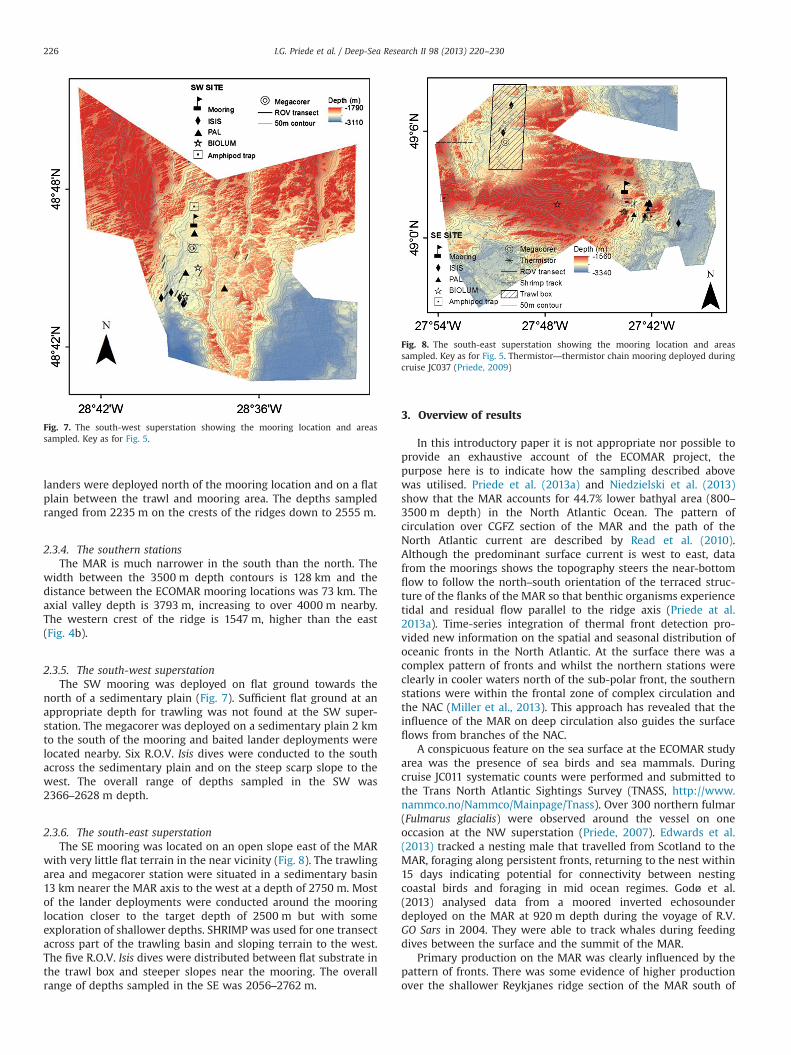
Fig. 7. The south-west superstation showing the mooring location and areassampled. Key as for Fig. 5.
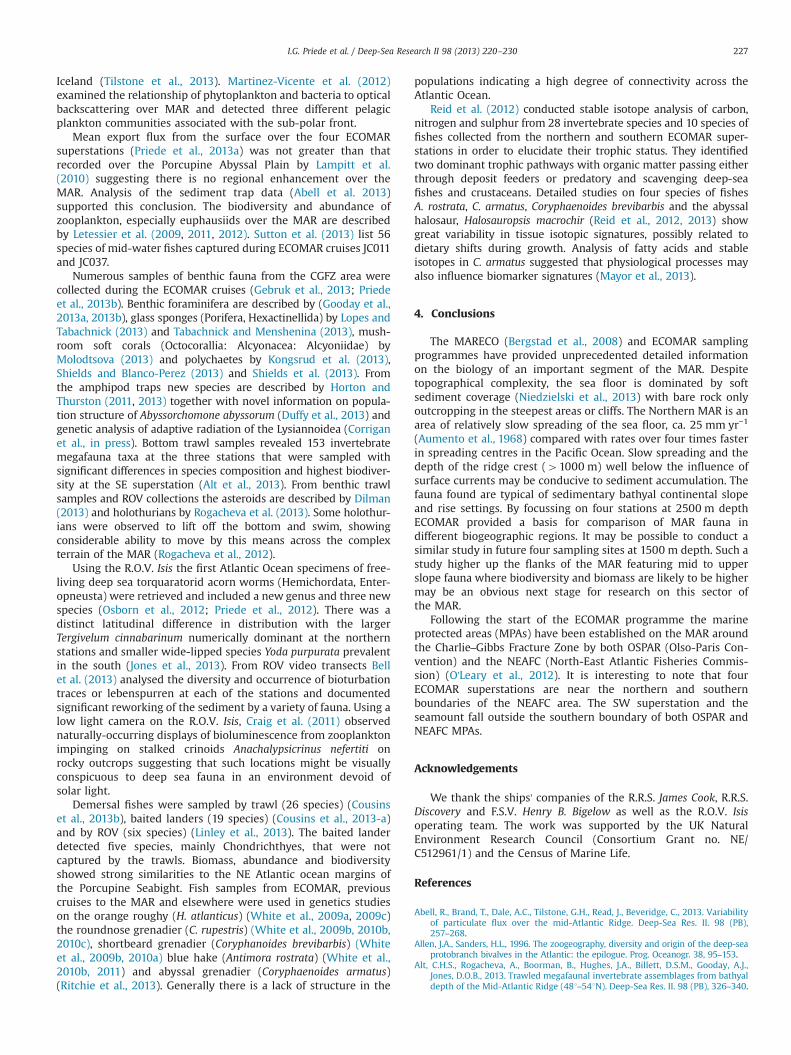
Fig. 8. The south-east superstation showing the mooring location and areassampled. Key as for Fig. 5. Thermistor—thermistor chain mooring deployed duringcruise JC037 (Priede, 2009)
I.G. Priede et al. / Deep-Sea Research II 98 (2013) 220–230226
landers were deployed north of the mooring location and on a flatplain between the trawl and mooring area. The depths sampledranged from 2235 m on the crests of the ridges down to 2555 m.
2.3.4. The southern stationsThe MAR is much narrower in the south than the north. The
width between the 3500 m depth contours is 128 km and thedistance between the ECOMAR mooring locations was 73 km. Theaxial valley depth is 3793 m, increasing to over 4000 m nearby.The western crest of the ridge is 1547 m, higher than the east(Fig. 4b).
2.3.5. The south-west superstationThe SW mooring was deployed on flat ground towards the
north of a sedimentary plain (Fig. 7). Sufficient flat ground at anappropriate depth for trawling was not found at the SW super-station. The megacorer was deployed on a sedimentary plain 2 kmto the south of the mooring and baited lander deployments werelocated nearby. Six R.O.V. Isis dives were conducted to the southacross the sedimentary plain and on the steep scarp slope to thewest. The overall range of depths sampled in the SW was2366–2628 m depth.
2.3.6. The south-east superstationThe SE mooring was located on an open slope east of the MAR
with very little flat terrain in the near vicinity (Fig. 8). The trawlingarea and megacorer station were situated in a sedimentary basin13 km nearer the MAR axis to the west at a depth of 2750 m. Mostof the lander deployments were conducted around the mooringlocation closer to the target depth of 2500 m but with someexploration of shallower depths. SHRIMP was used for one transectacross part of the trawling basin and sloping terrain to the west.The five R.O.V. Isis dives were distributed between flat substrate inthe trawl box and steeper slopes near the mooring. The overallrange of depths sampled in the SE was 2056–2762 m.
3. Overview of results
In this introductory paper it is not appropriate nor possible toprovide an exhaustive account of the ECOMAR project, thepurpose here is to indicate how the sampling described abovewas utilised. Priede et al. (2013a) and Niedzielski et al. (2013)show that the MAR accounts for 44.7% lower bathyal area (800–3500 m depth) in the North Atlantic Ocean. The pattern ofcirculation over CGFZ section of the MAR and the path of theNorth Atlantic current are described by Read et al. (2010).Although the predominant surface current is west to east, datafrom the moorings shows the topography steers the near-bottomflow to follow the north–south orientation of the terraced struc-ture of the flanks of the MAR so that benthic organisms experiencetidal and residual flow parallel to the ridge axis (Priede at al.2013a). Time-series integration of thermal front detection pro-vided new information on the spatial and seasonal distribution ofoceanic fronts in the North Atlantic. At the surface there was acomplex pattern of fronts and whilst the northern stations wereclearly in cooler waters north of the sub-polar front, the southernstations were within the frontal zone of complex circulation andthe NAC (Miller et al., 2013). This approach has revealed that theinfluence of the MAR on deep circulation also guides the surfaceflows from branches of the NAC.
A conspicuous feature on the sea surface at the ECOMAR studyarea was the presence of sea birds and sea mammals. Duringcruise JC011 systematic counts were performed and submitted tothe Trans North Atlantic Sightings Survey (TNASS, http://www.nammco.no/Nammco/Mainpage/Tnass). Over 300 northern fulmar(Fulmarus glacialis) were observed around the vessel on oneoccasion at the NW superstation (Priede, 2007). Edwards et al.(2013) tracked a nesting male that travelled from Scotland to theMAR, foraging along persistent fronts, returning to the nest within15 days indicating potential for connectivity between nestingcoastal birds and foraging in mid ocean regimes. Godø et al.(2013) analysed data from a moored inverted echosounderdeployed on the MAR at 920 m depth during the voyage of R.V.GO Sars in 2004. They were able to track whales during feedingdives between the surface and the summit of the MAR.
Primary production on the MAR was clearly influenced by thepattern of fronts. There was some evidence of higher productionover the shallower Reykjanes ridge section of the MAR south of
I.G. Priede et al. / Deep-Sea Research II 98 (2013) 220–230 227
Iceland (Tilstone et al., 2013). Martinez-Vicente et al. (2012)examined the relationship of phytoplankton and bacteria to opticalbackscattering over MAR and detected three different pelagicplankton communities associated with the sub-polar front.
Mean export flux from the surface over the four ECOMARsuperstations (Priede et al., 2013a) was not greater than thatrecorded over the Porcupine Abyssal Plain by Lampitt et al.(2010) suggesting there is no regional enhancement over theMAR. Analysis of the sediment trap data (Abell et al. 2013)supported this conclusion. The biodiversity and abundance ofzooplankton, especially euphausiids over the MAR are describedby Letessier et al. (2009, 2011, 2012). Sutton et al. (2013) list 56species of mid-water fishes captured during ECOMAR cruises JC011and JC037.
Numerous samples of benthic fauna from the CGFZ area werecollected during the ECOMAR cruises (Gebruk et al., 2013; Priedeet al., 2013b). Benthic foraminifera are described by (Gooday et al.,2013a, 2013b), glass sponges (Porifera, Hexactinellida) by Lopes andTabachnick (2013) and Tabachnick and Menshenina (2013), mush-room soft corals (Octocorallia: Alcyonacea: Alcyoniidae) byMolodtsova (2013) and polychaetes by Kongsrud et al. (2013),Shields and Blanco-Perez (2013) and Shields et al. (2013). Fromthe amphipod traps new species are described by Horton andThurston (2011, 2013) together with novel information on popula-tion structure of Abyssorchomone abyssorum (Duffy et al., 2013) andgenetic analysis of adaptive radiation of the Lysiannoidea (Corriganet al., in press). Bottom trawl samples revealed 153 invertebratemegafauna taxa at the three stations that were sampled withsignificant differences in species composition and highest biodiver-sity at the SE superstation (Alt et al., 2013). From benthic trawlsamples and ROV collections the asteroids are described by Dilman(2013) and holothurians by Rogacheva et al. (2013). Some holothur-ians were observed to lift off the bottom and swim, showingconsiderable ability to move by this means across the complexterrain of the MAR (Rogacheva et al., 2012).
Using the R.O.V. Isis the first Atlantic Ocean specimens of free-living deep sea torquaratorid acorn worms (Hemichordata, Enter-opneusta) were retrieved and included a new genus and three newspecies (Osborn et al., 2012; Priede et al., 2012). There was adistinct latitudinal difference in distribution with the largerTergivelum cinnabarinum numerically dominant at the northernstations and smaller wide-lipped species Yoda purpurata prevalentin the south (Jones et al., 2013). From ROV video transects Bellet al. (2013) analysed the diversity and occurrence of bioturbationtraces or lebenspurren at each of the stations and documentedsignificant reworking of the sediment by a variety of fauna. Using alow light camera on the R.O.V. Isis, Craig et al. (2011) observednaturally-occurring displays of bioluminescence from zooplanktonimpinging on stalked crinoids Anachalypsicrinus nefertiti onrocky outcrops suggesting that such locations might be visuallyconspicuous to deep sea fauna in an environment devoid ofsolar light.
Demersal fishes were sampled by trawl (26 species) (Cousinset al., 2013b), baited landers (19 species) (Cousins et al., 2013-a)and by ROV (six species) (Linley et al., 2013). The baited landerdetected five species, mainly Chondrichthyes, that were notcaptured by the trawls. Biomass, abundance and biodiversityshowed strong similarities to the NE Atlantic ocean margins ofthe Porcupine Seabight. Fish samples from ECOMAR, previouscruises to the MAR and elsewhere were used in genetics studieson the orange roughy (H. atlanticus) (White et al., 2009a, 2009c)the roundnose grenadier (C. rupestris) (White et al., 2009b, 2010b,2010c), shortbeard grenadier (Coryphanoides brevibarbis) (Whiteet al., 2009b, 2010a) blue hake (Antimora rostrata) (White et al.,2010b, 2011) and abyssal grenadier (Coryphaenoides armatus)(Ritchie et al., 2013). Generally there is a lack of structure in the
populations indicating a high degree of connectivity across theAtlantic Ocean.
Reid et al. (2012) conducted stable isotope analysis of carbon,nitrogen and sulphur from 28 invertebrate species and 10 species offishes collected from the northern and southern ECOMAR super-stations in order to elucidate their trophic status. They identifiedtwo dominant trophic pathways with organic matter passing eitherthrough deposit feeders or predatory and scavenging deep-seafishes and crustaceans. Detailed studies on four species of fishesA. rostrata, C. armatus, Coryphaenoides brevibarbis and the abyssalhalosaur, Halosauropsis macrochir (Reid et al., 2012, 2013) showgreat variability in tissue isotopic signatures, possibly related todietary shifts during growth. Analysis of fatty acids and stableisotopes in C. armatus suggested that physiological processes mayalso influence biomarker signatures (Mayor et al., 2013).
4. Conclusions
The MARECO (Bergstad et al., 2008) and ECOMAR samplingprogrammes have provided unprecedented detailed informationon the biology of an important segment of the MAR. Despitetopographical complexity, the sea floor is dominated by softsediment coverage (Niedzielski et al., 2013) with bare rock onlyoutcropping in the steepest areas or cliffs. The Northern MAR is anarea of relatively slow spreading of the sea floor, ca. 25 mm yr−1
(Aumento et al., 1968) compared with rates over four times fasterin spreading centres in the Pacific Ocean. Slow spreading and thedepth of the ridge crest (41000 m) well below the influence ofsurface currents may be conducive to sediment accumulation. Thefauna found are typical of sedimentary bathyal continental slopeand rise settings. By focussing on four stations at 2500 m depthECOMAR provided a basis for comparison of MAR fauna indifferent biogeographic regions. It may be possible to conduct asimilar study in future four sampling sites at 1500 m depth. Such astudy higher up the flanks of the MAR featuring mid to upperslope fauna where biodiversity and biomass are likely to be highermay be an obvious next stage for research on this sector ofthe MAR.
Following the start of the ECOMAR programme the marineprotected areas (MPAs) have been established on the MAR aroundthe Charlie–Gibbs Fracture Zone by both OSPAR (Olso-Paris Con-vention) and the NEAFC (North-East Atlantic Fisheries Commis-sion) (O'Leary et al., 2012). It is interesting to note that fourECOMAR superstations are near the northern and southernboundaries of the NEAFC area. The SW superstation and theseamount fall outside the southern boundary of both OSPAR andNEAFC MPAs.
Acknowledgements
We thank the ships' companies of the R.R.S. James Cook, R.R.S.Discovery and F.S.V. Henry B. Bigelow as well as the R.O.V. Isisoperating team. The work was supported by the UK NaturalEnvironment Research Council (Consortium Grant no. NE/C512961/1) and the Census of Marine Life.
References
Abell, R., Brand, T., Dale, A.C., Tilstone, G.H., Read, J., Beveridge, C., 2013. Variabilityof particulate flux over the mid-Atlantic Ridge. Deep-Sea Res. II. 98 (PB),257–268.
Allen, J.A., Sanders, H.L., 1996. The zoogeography, diversity and origin of the deep-seaprotobranch bivalves in the Atlantic: the epilogue. Prog. Oceanogr. 38, 95–153.
Alt, C.H.S., Rogacheva, A., Boorman, B., Hughes, J.A., Billett, D.S.M., Gooday, A.J.,Jones, D.O.B., 2013. Trawled megafaunal invertebrate assemblages from bathyaldepth of the Mid-Atlantic Ridge (481–541N). Deep-Sea Res. II. 98 (PB), 326–340.

I.G. Priede et al. / Deep-Sea Research II 98 (2013) 220–230228
Aumento, F., Wanless, R.K., Stevens, R.D., 1968. Potassium–argon ages and spreadingrates on the Mid-Atlantic Ridge at 451 North. Science 161, 1338–1339.
Bagley, P., 2008. Cruise Report RRS Discovery D331T. ECOMAR Ecosystem of theMid-Atlantic Ridge at the Sub-Polar Front and Charlie–Gibbs Fracture Zone.University of Aberdeen, 67 pp., ⟨http://www.oceanlab.abdn.ac.uk/ecomar/cruises.php⟩ (accessed 12.02.13).
Baker, A. de C., Clarke, M.R., Harris, M.J., 1973. The N.I.O. combination net(RMT 1+8)and further developments of rectangular midwater trawls. J. Mar. Biol. Assoc.UK 53, 167–184.
Baker, M.C., Ramirez-Llodra, E.Z., Tyler, P.A., German, C.R., Boetius, A., Cordes, E.E.,Dubilier, N., Fisher, C.R., Levin, L.A., Metaxas A., Rowden, A.A., Santos, R.S., Shank, T.M., Van Dover, C.L., Young C.M., Warén, A., 2010. Biogeography, ecology, andvulnerability of chemosynthetic ecosystems in the deep sea. In: Alasdair D.McIntyre (Ed.), Life in the World's Oceans. Blackwell, London, pp. 161–182.
Bell, J.B., Jones, D.O.B., Alt, C.H.S., 2013. Lebensspuren of the Bathyal Mid-AtlanticRidge. Deep-Sea Res. II. 98 (PB), 341–351.
Bergstad, O.A., Falkenhaug, T., Astthorsson, O.S., Byrkjedal, I., Gebruk, A.V., Piat-kowski, U., Priede, I.G., Santos, R.A., Vecchione, M., Lorance, P., Gordon, J.D.M.,2008. Towards improved understanding of the diversity and abundancepatterns of the mid-ocean ridge macro- and megafauna. Deep-Sea Res. II:Top. Stud. Oceanogr. 55, 1–5.
Billett, D.S.M., Bett, B.J., Reid, W.D.K., Boorman, B., Priede, I.G., 2009. Long-termchange in the abyssal NE Atlantic: the ‘Amperima Event’ revisited. Deep-SeaRes. II 57, 1406–1417, http://dx.doi.org/10.1016/j.dsr2.2009.02.001.
Blanco, R., Shields, M.A., Jamieson, A.J., 2013. Macrofouling of deep-sea instrumen-tation after three years at 3690 m depth in the Charlie–Gibbs Fracture Zone,Mid-Atlantic Ridge, with emphasis on hydroids (Cnidaria: Hydrozoa). Deep-SeaRes. II. 98 (PB), 370–373.
Bower, A.S., von Appen, W.-J., 2008. Interannual variability in the pathways of theNorth Atlantic Current over the Mid-Atlantic Ridge and theimpact of topogra-phy. J. Phys. Oceanogr. 38, 103–120, http://dx.doi.org/10.1175/2007JPO3686.1.
Clark, M.R., Rowden, A.A., Schlacher, T., Williams, A., Consalvey, M., Stocks, K.I.,Rogers, A.D., O'Hara, T.D., White, M., Shank, T.M., Hall-Spencer, J.M., 2010. Theecology of seamounts: structure, function, and human impacts. Annu. Rev. Mar.Sci. 2, 253–278.
Cook, A.B., Sutton, T.T., Galbraith, J.K., Vecchione, M., 2013. Deep-pelagic (0–3000 m) fishassemblage structure over the mid-atlantic ridge in the area of the Charlie–GibbsFracture Zone. Deep-Sea Res. II. 98 (PB), 279–291.
Corliss, J.B., Ballard, R.D., 1977. Oases of life in the cold abyss. Natl. Geogr. Mag. 152,441–453.
Corrigan, L., Horton, T., Fotherby, H., White, T., Hoelzel, A.R . Adaptive Radiation ofDeep-Sea Amphipods from the Superfamily Lysiassanoidea in the NorthAtlantic. Evol. Biol., in press.
Cousins, N.J., Linley, T., Jamieson, A.J., Bagley, P.M., Blades, H., Box, T., Chambers, R.,Ford, A., Shields, M.A., Priede, I.G., 2013a. Bathyal demersal fishes of Charlie–Gibbs Fracture Zone region (491–541N) of the Mid Atlantic Ridge: II. Baitedcamera lander observations. Deep-Sea Res. II. 98 (PB), 397–406.
Cousins, N.J., Shields, M.A., Crockard, D., Priede, I.G., 2013b. Bathyal demersal fishesof Charlie–Gibbs Fracture Zone region (491-541N) of the Mid Atlantic Ridge: I.Observations from bottom trawl samples. Deep-Sea Res. II. 98 (PB), 388–396.
Cox, M.J., Borchers, D.L., Demer, D.A., Cutter, G.R., Brierley, A.S., 2011. EstimatingAntarctic krill (Ephausia superba) density from multibeamechosounder obser-vations using distance sampling methods. J. R. Stat. Soc.: Ser. C (Appl. Stat.) 60,301–316.
Craig, J., 2012. Distribution of Bioluminescence Across the Mid-Atlantic Ridge andMediterranean Sea: Relationships with Surface Productivity, Topography andHydrorgaphy, (Ph.D. Thesis). University of Aberdeen 188 pp.
Craig, J., Jamieson, A.J., Bagley, P.M., Priede, I.G., 2011. Naturally occurring biolumi-nescence on the deep-seafloor. J. Mar. Syst. 88, 563–567.
Cutter, G.R., Renfree, J.S., Cox, M.J., Brierley, A.S., Demer, D.A., 2009. Modellingthree-dimensional directivity of sound scattering by Antarctic krill: progresstowards biomass estimation using multibeam sonar. ICES J. Mar. Sci. 66,1245–1251.
Dilman, A., 2013. Asteroid fauna of the northern Mid-Atlantic Ridge: additionalrecords. Mar. Biol. Res.
Doel, R.E., Levin, T.J., Marker, M.K., 2006. Extending modern cartography to theocean depths: military patronage, Cold War priorities, and the Heezen-Tharpmapping project, 1952–1959. J. Hist. Geogr. 32, 605–626.
Duineveld, G.C.A., Lavaleye, M.S.S., Berghuis, E.M., 2004. Particle flux and foodsupply to a seamount cold-water coralcommunity (Galicia Bank, NW Spain).Mar. Ecol. Prog. Ser. 277, 13–23.
Duffy, G., Horton, T., Sheader, M., Thurston, M., 2013. Population structure ofAbyssorchomene abyssorum (Stebbing, 1888) (Amphipoda: Lysianassoidea), ascavenging amphipod from the Mid-Atlantic Ridge in the vicinity of theCharlie–Gibbs Fracture Zone. Deep-Sea Res. II. 98 (PB), 360–369.
Edwards, E.W.J., Quinn, L.R., Wakefield, E.D., Miller, P.I., Thompson, P.M., 2013. Fine-scale linkage between coastally breeding seabirds and Mid‐Atlantic Ridge preycommunities. Deep-Sea Res. II. 98 (PB), 438–444.
Egbert, G.D., Ray, R.D., 2000. Significant dissipation of tidal energy in the deepocean inferred from satellite altimeter data. Nature 405, 775–778, http://dx.doi.org/10.1038/35015531.
Felley, J.D., Vecchione, M., Wilson, R.R., 2008. Small-scale distribution of deep-seademersal nekton and other megafauna in the Charlie–Gibbs Fracture Zone ofthe Mid-Atlantic Ridge. Deep-Sea Res. 55, 153–160.
Fleming, H.S., Cherkis, N.Z., Heirtzler, J.R., 1970. The Gibbs fracture zone: a doublefracture zone at 52130′N in the Atlantic Ocean. Mar. Geophys. Res. 1, 37–45.
GEBCO, 2013. General Bathymetric Chart of the Oceans. ⟨http://www.gebco.net/⟩(accessed 12.02.13).
Gebruk, A.V., Krylova, E.M., 2013. Megafauna of the Charlie–Gibbs FractureZone(northern Mid-Atlantic Ridge) based on video observations. J. Mar. Biol. Assoc.UK.
Gebruk, A.V., Priede, I.G., Fenchel, T., Uiblein, F., 2013. Benthos of the sub-polar frontarea on the Mid-Atlantic Ridge: results of the ECOMAR project. Mar. Biol. Res. 9,443–446, http://dx.doi.org/10.1080/17451000.2012.749999.
Genin, A., 2004. Bio-physical coupling in the formation of zooplankton and fishaggregations over abrupt topographies. J. Mar. Syst. 50, 3–20.
Godø, O.R., DoksæterSivle, L., Patel, R., Torkelsen, T., 2013. Synchronous hunting ofwhales as observed with active acoustics. Deep-Sea Res. II. 98 (PB), 445–451.
Gooday, A.J., Alt, C., Jones, D.O.B., Shale, D., Marsden, K., Brasier, M.D., 2013. Theecology and biogeography of Discospirina tenuissima (Foraminifera) in theAtlantic and Indian Oceans. Deep-Sea Res. II. 98 (PB), 301–314.
Gooday, A.J., Rothe, N., Pearce, R., 2013. New and poorly-known benthic foramini-fera (Protista, Rhizaria) inhabiting planktonic foraminiferan shells from thebathyal Mid-Atlantic Ridge. Mar. Biol. Res. 9, 447–461, http://dx.doi.org/10.1080/17451000.2012.750365.
Gordon, J.D.M., Merrett, N.R., Bergstad, O.A., Swan, S.C., 1996. A comparison of the deep-water fish assemblages of the Rockall Trough and Porcupine Seabight, eastern NorthAtlantic: continental slope to rise. J. Fish. Biol. 49 (Suppl. A), 217–238.
Haedrich, R.L., Merrett, N.R., 1988. Summary atlas of deep-living fishes in the NorthAtlantic. J. Nat. Hist. 22, 1325–1362.
Hareide, N.-R., Garnes, G., 2001. The distribution and catch rates of deep water fishalong the Mid-Atlantic Ridge from 431 to 611 N. Fish. Res. 51, 297–310.
Heezen, B.C., 1969. The world rift system: an introduction to the symposium.Technophysics 8, 269–279.
Heezen, B.C., Tharp, M., 1957. Physiographic Diagram of the North Atlantic.Geological Society of America, New York.
Heger, A., King, N., Wigham, B.D., Jamieson, A.J., Bagley, P.M., Allan, L., Pfannkuche, O.,Priede, I.G., 2007. Benthic bioluminescence in the bathyal North East Atlantic:luminescent responses of Vargula norvegica (Ostracoda: Myodocopida) to preda-tion by the deep water eel (Synaphobranchus kaupii). Mar. Biol. 151 (4), 1471–1478,http://dx.doi.org/10.1007/s00227-006-0587-7.
Heger, A., Ieno, E.N., King, N.J., Morris, K.J., Bagley, P.M., Priede, I.G., 2008. Deep-seapelagic bioluminescence over the Mid-Atlantic Ridge. Deep-Sea Res. II: Top.Stud. Oceanogr. 55, 126–136.
Honjo, S., Manganini, S.J., Krishfield, R.A., Francois, R., 2008. Particulate organiccarbon fluxes to the ocean interior and factors controlling the biological pump:A synthesis of global sediment trap programs since 1983. Prog. Oceanogr. 76,217–285.
Horton, T., Thurston, M., 2011. Centromedonzoe (Crustacea: Amphipoda: Lysianas-soidea), a new deep-water scavenger species from the North Atlantic, with akey to the genus Centromedon. Zootaxa 2869, 54–62.
Horton, T., Thurston, M., 2013. Hirondellea namarensis (Crustacea: Amphipoda:Lysianassoidea: Hirondelleidae), a new deep-water scavenger species from theMid-Atlantic Ridge. Mar. Biol. Res. 9, 554–562, http://dx.doi.org/10.1080/17451000.2012.749994.
Horton, T., Thurston, M., Duffy, G., 2013. Community composition of scavengingamphipods at bathyal depths on the Mid-Atlantic Ridge. Deep-Sea Res. II. 98(PB), 352–359.
Howell, K.L., Billett, D.S.M., Tyler, P.A., 2002. Depth-related distribution andabundance of seastars (Echinodermata: Asteroidea) in the Porcupine Seabightand Porcupine Abyssal Plain, NE Atlantic. Deep-Sea Res. I 49, 1901–1902.
ICES, 2012. Report of the Working Group on the Biology and Assessment of Deep-sea Fisheries Resources (WGDEEP), 28 March–5 April, Copenhagen, Denmark.ICES CM 2012/ACOM:17, 929 pp.
IOC, IHO, BODC, 2003. Centenary Edition of the GEBCO Digital Atlas, published onCD-ROM on behalf of the Intergovernmental Oceanographic Commission andthe International Hydrographic Organization as part of the General BathymetricChart of the Oceans, British Oceanographic Data Centre, Liverpool, UK.
Johnson, G.L., 1967. North Atlantic fracture zones near 531. Earth Planet. Sci. Lett. 2,445–447, http://dx.doi.org/10.1016/0012-821X(67)90187-2.
Jones, D.O.B., Alt, C.H.S., Priede, I.G., Reid, W., Wigham, B.D., Billett, D.S.M., Gebruk,A., Rogacheva, A., Gooday, A.J., 2013. Deep-sea surface-dwelling enteropneustsfrom the Mid-Atlantic Ridge: their ecology, distribution and mode of life. Deep-Sea Res. II. 98 (PB), 374–387.
Kemp, K.M., Jamieson, A.J., Bagley, P.M., Collins, M.A., Priede, I.G., 2008. A newtechnique for sequential periodic bait-release at a camera platform in the deepsea; trial at 3664m depth in the Charlie–Gibbs Fracture Zone, Mid-AtlanticRidge. Deep-Sea Res. II: Top. Stud.Oceanogr. 55, 218–228.
King, N., Bagley, P.M., Priede, I.G., 2006. Depth zonation and latitudinal distributionof deep sea scavenging demersal fishes of the Mid-Atlantic Ridge, 421-531N.Mar. Ecol. Prog. Ser. 319, 263–274.
Kongsrud, J.A., Budaeva, N., Barnich, R., Oug, E., Bakken, T., 2013. Benthic poly-chaetes from the northern Mid-Atlantic Ridge between the Azores and theReykjanes Ridge. Mar. Biol. Res 9, 516–546, http://dx.doi.org/10.1080/17451000.2012.749997.
Kukuev, E.I., 2004. 20 years of ichthyofauna research on seamounts of the NorthAtlantic Ridge and adjacent areas. A review. Arch. Fish. Mar. Res. 51, 215–232.
Lampitt, R.S., Bett, B.J., Kiriakoulis, K., Popova, E.E., Ragueneau, O., Vangriesheim, A.,Wolff, G.A., 2001. Material supply to the abyssal sea floor in the NortheastAtlantic. Prog. Oceanogr. 50, 27–63.

I.G. Priede et al. / Deep-Sea Research II 98 (2013) 220–230 229
Lampitt, R.S., Salter, I., deCuevas, B.A., Hartman, S., Larkin, K.E., et al., 2010. Long-term variability of downward particle flux in the deep north east Atlantic:causes and trends. Deep-Sea Res. II Top. Stud. Oceanogr. 57, 1346–1361.
Letessier, T.B., Cox, M.J., Brierley, A.S., 2009. Drivers of euphausiid species abun-dance and numerical abundance in the Atlantic Ocean. Mar. Biol. 156,2539–2553.
Letessier, T.B., Falkenhaug, T., Debes, H., Bergstad, O.A., Brierley, A.S., 2011.Abundance patterns and species assemblages of euphausiids associated withthe Mid-Atlantic ridge, North Atlantic. J. Plankton Res. 33 (10), 1510–1525.
Letessier, T.B., Pond, D.W., McGill, R.A.R., Reid, W.D.K., Brierley, A.S., 2012. Trophicinteraction of invertebrate zooplankton on either side of the Charlie–GibbsFracture Zone/Subpolar Front of the Mid-Atlantic Ridge. J. Mar. Syst. 94,174–184.
Linley, T.D., Alt, C.H.S., Jones, D.O.B., Priede, I.G., 2013. Bathyal demersal fishes ofCharlie–Gibbs Fracture Zone region (491–541N) of the Mid-Atlantic Ridge: III.Results from remotely operated vehicle (ROV) video transects. Deep-Sea Res. II.98 (PB), 407–411.
Longhurst, A., 1989. Ecological Geography of the Sea. Academic Press, New York.Lopes, D.A., Tabachnick, K.R., 2013. New data on Glass sponges (Porifera, Hexacti-
nellida) of the northern Mid-Atlantic Ridge. Part 1. Farreidae. Mar. Biol. Res. 9,462–468, http://dx.doi.org/10.1080/17451000.2012.749995.
Martinez-Vicente, V., Tilstone, G.H., Sathyendranath, S., Miller, P., Groom, S., 2012.Contributions of phytoplankton and bacteria to the optical backscatteringcoefficient over the mid-Atlantic Ridge. Mar. Ecol. Prog. Ser. 445, 37–51http://dx.doi.org/10.3354/meps09388.
Mayor, D.J., Sharples, C.J., Webster, L., Walsham, P., Lacaze, J.-P., Cousins, N.J., 2013.Tissue- and size-related changes in the fatty acid and stable isotope signaturesof Coryphaenoides armatus from different regions of the Charlie–Gibbs FractureZone, NE Atlantic. Deep-Sea Res. II. 98 (PB), 421–430.
McManus, M.A., Woodson, C.B., 2012. Plankton distribution and ocean dispersalJ. Exp. Biol. 215, 1008–1016.
Merrett, N.R., Gordon, J.D.M., Stehmann, M., Haedrich, R.L., 1991. Deep demersalfish assemblage structure in the Porcupine Seabight (eastern North Atlantic):results of single warp trawling at lower slope to abyssal soundings. J. Mar. Biol.Assoc. UK 71, 359–373.
Miller, P.I., Read, J.F., Dale, A.C., 2013. Thermal front variability along the NorthAtlantic Current observed using microwave and infrared satellite data. Deep-Sea Res. II. 98 (PB), 244–256.
Mironov, A.N., Gebruk, A.V., Southward, A.J. (Eds.), 2006. The Biogeography of theNorth Atlantic Sea Mounts. KMK Scientific Press, Moscow, pp.
Mohn, C., White, M., Bashmachnikov, I., José, F., Pelegrí, J.L., 2009. Dynamics at anelongated, intermediate depth seamount in the North Atlantic (Sedlo sea-mount, 40120′N, 26140′W). Deep-Sea Res. II 56, 2582–2592.
Molodtsova, T.N., 2013. Deep-sea mushroom soft corals (Octocorallia: Alcyonacea:Alcyoniidae) of the Northern Mid-Atlantic Ridge. Mar. Biol. Res 9, 488–515,http://dx.doi.org/10.1080/17451000.2012.750427.
Mouriño, B., Fernadez, E., Serret, P., Harbor, D., Sinha, B., Pingree, R., 2001.Variability and seasonality of physical and biological fields at the Great MeteorTablemount (subtropical NE Atlantic). Oceanol. Acta 24, 1–20.
Murray, J., Hjort, J., 1912. The Depths of the Ocean. Macmillan, London 821, pp.Murton, B.J., 2003. Mar-Eco bathymetry compilation: Northern Mid-Atlantic Ridge
Crest: 371N (Azores) to 631N (Iceland). Regional Bathymetry for the MAR.⟨http://www.mar-eco.no/sci/bibliographies_and_background_papers⟩(accessed 21.01.13).
NEAFC, 2008. Recommendation by the North East Atlantic Fisheries Commission inAccordance with article 5 of the Convention on Future Multilateral cooperationin North East Atlantic Fisheries on the Protection of Vulnerable MarineEcosystems from Significant Adverse Impacts in the NEAFC Regulatory Area.NEAFC, London. 3 pp.
Niedzielski, T., Høines, Å., Shields, M.A., Linley, T., Priede, I.G., 2013. A multi-scaleinvestigation on sea floor topography of the northern Mid-Atlantic Ridge basedon Geographic Information System analysis. Deep-Sea Res. II. 98 (PB), 231–243.
O'Leary, B.C., Brown, R.L., Johnson, D.E., vonNordheim, H., Ardron, J., Packeiser, T.,Roberts, C.M., 2012. The first network of marine protected areas (MPAs) in thehigh seas: The process, the challenges and where next. Mar. Policy 36, 598–605.
Osborn, K.J., Kuhnz, L.A., Priede, I.G., Urata, M., Gebruk, A.V., Holland, N.D., 2012.Diversification of acorn worms (Hemichordata, Enteropneusta) revealed in thedeep sea. Proc. R. Soc. B 279, 1646–1654, http://dx.doi.org/10.1098/rspb.2011.1916.
OSPAR, 2010. Decision 2010/2 on the establishment of the Charlie–Gibbs SouthMarine Protected Area. OSPAR Commission, London. OSPAR 10/23/1-E, Annex36, 3 pp.
Pollard, R.T., Salter, I., Sanders, R.J., Lucas, M.I., Moore, C.M., et al., 2009. SouthernOcean deep-water carbon export enhanced by natural iron fertilization. Nature457, U577–U581.
Priede, I.G., Bagley, P.M., 2000. In situ studies on deep-sea demersal fishes usingautonomous unmanned lander platforms. Oceanogr. Mar. Biol. Annu. Rev. 38,357–392.
Priede, I.G., Bergstad, O.A., Miller, P.I., Vecchione, M., Gebruk, A., Falkenhaug, T.,Billett, D.S.M., Craig, J., Dale, A.C., Shields, M.A., Tilstone, G.H., Sutton, T.T.,Gooday, A.J., Inall, M.E., Jones, D.O.B., Martinez-Vicente, V., Menezes, G.M.,Niedzielski, T., Sigurðsson, Þ., Rothe, N., Rogacheva, A., Alt, C.H.S., Brand, T.,Abell, R., Brierley, A.S., Cousins, N.J., Crockard, D., Hoelzel, A.R., Høines, Å.,Letessier, T.B., Read, J.F., Shimmield, T., Cox, M.J., Galbraith, J.K., Gordon, J.D.M.,Horton, T., Neat, F., Lorance, P., 2013a. Does presence of a Mid Ocean Ridge
enhance biomass and biodiversity? PLoS ONE 8 (5), e61550, http://dx.doi.org/10.1371/journal.pone.0061550.
Priede, I.G., Billett, D.S.M., Brierley, A.S., Hoelzel, A.R., Inall, M., Miller, P.I., 2013b.The ECO-MAR (Ecosystem of the Mid-Atlantic Ridge at the Sub-Polar Front andCharlie–Gibbs Fracture Zone) project: description of the benthic samplingprogramme 2007–2010. Mar. Biol. Res. 9 (5–6), 624–628, http://dx.doi.org/10.1080/17451000.2012.749998.
Priede, I.G., 2007. Cruise Report RRS JAMES COOK CRUISE 011, ECOMAR, Ecosystemsof the Mid-Atlantic Ridge at the Sub-Polar Front and Charlie–Gibbs FractureZone.⟨http://www.oceanlab.abdn.ac.uk/ecomar/cruises.php⟩(accessed12.02.13). Oceanlab, University of Aberdeen, 154 pp.
Priede, I.G., 2009. Cruise Report RRS JAMES COOK CRUISE 037, ECOMAR, Ecosystemsof the Mid-Atlantic Ridge at the Sub-Polar Front and Charlie–Gibbs FractureZone. ⟨http://www.oceanlab.abdn.ac.uk/ecomar/cruises.php⟩ (accessed12.02.13). Oceanlab, University of Aberdeen, 144 pp.
Priede, I.G., 2010. Cruise Report RRS JAMES COOK CRUISE 048, ECOMAR, Ecosystemsof the Mid-Atlantic Ridge at the Sub-Polar Front and Charlie–Gibbs FractureZone. ⟨http://www.oceanlab.abdn.ac.uk/ecomar/cruises.php⟩ (accessed12.02.13). Oceanlab, University of Aberdeen, 136 pp.
Priede, I.G., Bagley, P.M., Way, S., Herring, P.J., Partridge, J.C., 2006. Bioluminescencein the deep sea: free-fall lander observations in the Atlantic Ocean off CapeVerde. Deep-Sea Res. I 53, 1272–1283, http://dx.doi.org/10.1016/j.dsr.2006.05.004.
Priede, I.G., Godbold, J.A., King, N.J., Collins, M.A., Bailey, D.M., Gordon, J.D.M., 2010.Deep-sea demersal fish species richness in the Porcupine Seabight, NE AtlanticOcean: global and regional patterns. Mar. Ecol. 31, 247–260, http://dx.doi.org/10.1111/j.1439-0485.2009.00330.x.
Priede, I.G., Osborn, K.J., Gebruk, A.V., Jones, D., Shale, D., Rogacheva, A., Holland, N.D.,2012. Observations on torquaratorid acorn worms (Hemichordata, Enteropneusta)from the North Atlantic with descriptions of a new genus and three new species.Invertebr. Biol. 131, 244–257.
Reid, W.K.D., Sweeting, C.J., Wigham, B.D., McGill, R.A.R., Polunin, N.V.C., 2013. Highvariability in spatial and temporal size-based trophodynamics of deep-seafishes from the Mid-Atlantic Ridge elucidated by stable isotopes. Deep-Sea Res.II. 98 (PB), 412–420.
Reid, W.D.K., Wigham, B.D., McGill, R.A.R., Polunin, N.V.C., 2012. Elucidating benthicand pelagic trophic pathways in deep-sea benthic assemblages of the Mid-Atlantic Ridge north and south of the Charlie–Gibbs Fracture Zone. Mar. Ecol.Prog. Ser. 463, 89–103.
Rex, M.A., Etter, R.J., 2010. Deep-Sea Biodiversity, Pattern & Scale. HarvardUniversity Press, Cambridge, MA p. 354.
Rogacheva, A., Gebruk, A., Alt, C.H.S., 2012. Swimming deep-sea holothurians(Echinodermata: Holothuroidea) on the northern Mid-Atlantic Ridge. In: Kroh,A., Reich, M. (Eds.), Echinoderm Research 2010: Proceedings of the SeventhEuropean Conference on Echinoderms, Göttingen, Germany, 2–9 October 2010,Zoosymposia, vol. 7, pp. 213–224.
Rogacheva, A., Gebruk, A., Alt, C.H.S., 2013. Deep-sea holothurians of the Charlie–Gibbs Fracture Zone area, the northern Mid-Atlantic Ridge. Mar. Biol. Res9, 587–623, http://dx.doi.org/10.1080/17451000.2012.750428.
Rogers, A.D., 1994. The biology of seamounts. Adv. Mar. Biol. 30, 305–350.Rona, P.A., Klinkhammer, G., Nelsen, T.A., Trefry, J.H., Elderfield, H., 1986. Black
smokers, massive sulphides and vent biota at the Mid-Atlantic Ridge. Nature321, 33–37, http://dx.doi.org/10.1038/321033a0.
Rowden, A.A., Dower, J.F., Schlacher, T.A., Consalvey, M., Clark, M.R., 2010.Paradigms in seamount ecology: fact, fiction and future. Mar. Ecol. 31 (Suppl.1), 226–241.
Read, J.F., Pollard, R.T., Miller, P.I., Dale, A.C., 2010. Circulation and variability of theNorth Atlantic Current in the vicinity of the Mid-Atlantic Ridge. Deep-Sea Res. I:Oceanogr. Res. Pap. 57 (3), 307–318, http://dx.doi.org/10.1016/j.dsr.2009.11.010.
Ritchie, H., Cousins, N.J., Cregeen, S.J., Piertney, S.B., 2013. Population geneticstructure of the abyssal grenadier (Coryphaenoides armatus) around the mid-Atlantic ridge. Deep-Sea Res. II. 98 (PB), 431–437.
Saunders, P.M., 1994. The flux of overflow water through th eCharlie–Gibbs FractureZone. J. Geophys. Res. 99 (C6), 12343–12355.
Shields, M.A., Blanco-Perez, R., 2013. Polychaete abundance, biomass and diversitypatterns at the Mid-Atlantic Ridge, North Atlantic Ocean. Deep-Sea Res. 98 (PB),315–325.
Shields, M., Wiklund, H., Glover, A., 2013. Polynoidpolychaetes of the Mid-AtlanticRidge and a new holothurian association. Mar. Biol. Res 9, 547–553, http://dx.doi.org/10.1080/17451000.2012.749992.
Shor, A., Lonsdale, P., Hollister, C.D., Spencer, D., 1979. Charlie–Gibbs fracture zone:bottom water transport and its geological effects. Deep-Sea Res. 27, 325–345.
Simmonds, J.E., MacLennan, D.N., 2005. Fisheries Acoustics: Theory and Practice,second ed. Blackwell, Oxford.
Smith, W.H.F., Sandwell, D.T., 1997. Global seafloor topography from satellitealtimetry and ship depth soundings. Science 277, 1956–1962.
Søiland, H., Budgell, W.P., Knutsen, Ø., 2008. The physical oceanographic conditionsalong the Mid-Atlantic Ridge north of the Azores in June–July 2004. Deep-SeaRes. II 55, 29–44.
Stocks, K.I., Hart, P.J.B., 2007. Biogeography and biodiversityof seamounts. In:Pitcher, T.J., Morato, T., Hart, P.J.B., Clark, M.R., Haggan, N., Santos, R.S. (Eds.),Seamounts: Ecology, Fisheries, and Conservation. Blackwell Publishing, Oxford,pp. 255–281.
Sutton, T.T., Letessier, T.B., Bardarson, B., 2013. Midwater fishes collected in thevicinity of the Sub-Polar Front, mid-North Atlantic Ocean, during ECOMARpelagic sampling. Deep-Sea Res. II. 98 (PB), 292–300.

I.G. Priede et al. / Deep-Sea Research II 98 (2013) 220–230230
Sweetman, C.J., Sutton, T.T., Vecchione, M., Latour, R.J., 2013. Distribution of thebiomass-dominant pelagic fish, Bathylagus euryops (Argentiniformes: Micro-stomatidae), along the northern Mid-Atlantic Ridge. Deep-Sea Res. I 78, 16–23,http://dx.doi.org/10.1016/j.dsr.2013.03.004.
Tabachnick, K.R., Menshenina, L.L., 2013. New data on Glass sponges (Porifera,Hexactinellida) of the northern Mid-Atlantic Ridge. Part 2. Aphrocallistidae,Euretidae, Euplectellidae and Rossellidae (with descriptions of two newspecies of Sympagella). Mar. Biol. Res 9, 469–487, http://dx.doi.org/10.1080/17451000.2012.749996.
Taylor, J.R., Ferrari, R., 2011. Ocean fronts trigger high latitude phytoplanktonblooms. Geophys. Res. Lett. 38, L23601.
Tilstone, G.H., Miller, P.I., Brewin, R.J.W., Priede, I.G., 2013. Enhancement of primaryproduction in the North Atlantic outside of the spring bloom. Remote SensingEnviron.
Tilstone, G., Smyth, T., Poulton, A., Hutson, R., 2009. Measured and remotely sensedestimates of primary production in the Atlantic Ocean from 1998 to 2005.Deep-Sea Res. II –Top. Stud. Oceanogr. 56, 918–930.
Tolstoy, I., Ewing, M., 1949. North Atlantic hydrography and the Mid-Atlantic Ridge.Bull. Geol. Soc. Am. 80, 1627–1640.
UNESCO, 2009. Global Open Oceans and Deep Seabed (GOODS) – BiogeographicClassification. UNESCO-IOC, Paris (IOC Technical Series, 84).
Van Dover, C.L., 2000. The Ecology of Hydrothermal Vents. Princeton UniversityPress, Princeton p. 424.
van Haren, H., Groenewegen, R., Laan, M., Koster, B., 2005. High sampling ratethermistor string observations at the slope of Great Meteor Seamount. OceanSci. 1 (17–28), 2005.
Vecchione, M., Bergstad, O.A., Byrkjedal, I., Falkenhaug, T., Gebruk, A.V.,Godø, A.R.,Gislason, A., Heino M., Høines, Å.S., Menezes, G.M.M., Piatkowski, U., Priede, I.G.,Skov, H., Søiland, H., Sutton, T., WenneckT, d.e.L., 2010. Biodiversity patterns andprocesses on the Mid-Atlantic Ridge. In: McIntyre, A. (Ed.), Life in the World'sOceans. Wiley-Blackwell, Oxford. pp. 103–121.
Vinogradov, G.M., 2005. Vertical distribution of macroplankton at the Charlie–GibbsFracture Zone (North Atlantic), as observed from the manned submersible ‘Mir-1’. Mar. Biol. 146, 325–331.
Vogt, P.R., Johnson, G.L., 1975. Transform faults and longitudinal flow below the MidOceanic Ridge. J. Geophys. Res. 80, 1399–1428.
Wei, C.-L., Rowe, G.T., Escobar-Briones, E., Boetius, A., Soltwedel, T., Caley, M.J.,Soliman, Y., Huettmann, F., Qu, F., Yu, Z., Pitcher, C.R., Haedrich, R.L., Wicksten,M.K., Rex, M.A., Baguley, J.G., Sharma, J., Danovaro, R., MacDonald, I.R., Nunnally,C.C., Deming, J.W., Montagna, P., Lévesque, M., Weslawski, J.M., Wlodarska-Kowalczuk, M., Ingole, B.S., Bett, B.J., Billett, D.S.M., Yool, A., Bluhm, B.A., Iken, K.,Narayanaswamy, B.E., 2010. Global patterns and predictions of seafloor biomass
using random forests. PLoS ONE 5, e15323, http://dx.doi.org/10.1371/journal.pone.0015323.
Wenneck, T., de, L., Falkenhaug, T., 2008. Strategies, methods, and technologiesadopted on the R.V. G.O. Sars MAR-ECO expedition to the Mid-Atlantic Ridge in2004.Deep-Sea Research II 55, 6–28.
White, T.A., Stamford, J., Hoelzel, A.R., 2009a. Nine new microsatellite loci for theorange roughy (Hoplostethus atlanticus). Conserv. Genet. 10, 601–603.
White, T.A., Stamford, J., Hoelzel, A.R., 2009b. Nine new microsatellite loci for theroundnose grenadier (Coryphaenoides rupestris) with four showing cross-amplification in the shortbeard grenadier (C. brevibarbis). Conserv. Genet. 10,1421–1424.
White, T.A., Stefanni, S., Stamford, J., Hoelzel, A.R., 2009c. Unexpected panmixia in along-lived, deep-sea fish with well-defined spawning habitat and relatively lowfecundity. Mol. Ecol. 18, 2563–2573.
White, T.A., Fotherby, H.A., Hoelzel, A.R., 2010a. Twelve new microsatellite loci forthe shortbeard grenadier (Coryphaenoides brevibarbis). Conserv. Genet. Resour.2, 189–191.
White, T.A., Fotherby, H.A., Hoelzel, A.R., 2010b. Nineteen newmicrosatellite loci forthe blue hake (Antimora rostrata). Conserv. Genet. Resour. 2, 249–251.
White, T.A., Stamford, J., Hoelzel, A.R., 2010c. Local selection and populationstructure in a deep-sea fish, the roundnose grenadier (Coryphaenoides rupes-tris). Mol. Ecol. 19, 216–226.
White, T.A., Fotherby, H.A., Stephens, P.A., Hoelzel, A.R., 2011. Genetic panmixia anddemographic dependence across the North Atlantic in the deep-sea fish, bluehake (Antimora rostrata). Heredity 106, 690–699.
Wilson, R.R., Kaufman, R.S., 1987. Seamount biota and biogeography. Geophys.Monogr. 43, 355–377.
Wolff, G.A., Billett, D.S.M., Bett, B.J., Holtvoeth, J., FitzGeorge-Balfour, T., et al., 2011.The effects of natural iron fertilisation on deep-sea ecology: The Crozet Plateau,Southern Indian Ocean. PLoS ONE 6 (6), e20697, http://dx.doi.org/10.1371/journal.pone.0020697.
Woodson, C.B., McManus, M.A., Tyburczy, J.A., Barth, J.A., Washburn, L., Caselle, J.E.,Carr, M.H., Malone, D.P., Raimondi, P.T., Menge, B.A., Palumbi, S.R., 2012. Coastalfronts set recruitment and connectivity patterns across multiple taxa. Limnol.Oceanogr. 57 (2), 582–596.
Yesson, C., Clark, M.R., Taylor, M., Rogers, A.D., 2011. The global distribution ofseamounts based on 30-second bathymetry data. Deep Sea Research Part I:Oceanographic Research Papers, 58(4), 442-453, http://dx.doi.org/10.1016/j.dsr.2011.02.004.
Youngbluth, M.J., 1984. Manned submersibles and sophisticated instrumentation:tools for oceanographic research. In: Proceedings of SUBTECH 1983, Society ofUnderwater Technology, London, pp. 335–344.
![Effect of polyol osmolytes on [Delta] GD, the Gibbs energy of stabilisation of proteins at different pH values](https://static.fdokumen.com/doc/165x107/6328b51f22b4e7a2f30f063a/effect-of-polyol-osmolytes-on-delta-gd-the-gibbs-energy-of-stabilisation-of-proteins.jpg)