
Upstream Service Solutions for Water Injection - VWS Westgarth

JOURNAL OF COMPUTATIONAL BIOLOGYVolume 9 Number 2 2002copy Mary Ann Liebert IncPp 447ndash464
A Gibbs Sampling Method to DetectOverrepresented Motifs in the Upstream
Regions of Coexpressed Genes
GERT THIJS1 KATHLEEN MARCHAL1 MAGALI LESCOT1 STEPHANE ROMBAUTS2
BART DE MOOR1 PIERRE ROUZEacute3 and YVES MOREAU1
ABSTRACT
Microarray experiments can reveal important information about transcriptional regulationIn our case we look for potential promoter regulatory elements in the upstream region ofcoexpressed genes Here we present two modi cations of the original Gibbs sampling algo-rithm for motif nding (Lawrence et al 1993) First we introduce the use of a probabilitydistribution to estimate the number of copies of the motif in a sequence Second we describethe technical aspects of the incorporation of a higher-order background model whose ap-plication we discussed in Thijs et al (2001) Our implementation is referred to as the MotifSampler We successfully validate our algorithm on several data sets First we show resultsfor three sets of upstream sequences containing known motifs 1) the G-box light-responseelement in plants 2) elements involved in methionine response in Saccharomyces cerevisiaeand 3) the FNR O2-responsive element in bacteria We use these data sets to explain thein uence of the parameters on the performance of our algorithm Second we show resultsfor upstream sequences from four clusters of coexpressed genes identi ed in a microar-ray experiment on wounding in Arabidopsis thaliana Several motifs could be matched toregulatory elements from plant defence pathways in our database of plant cis-acting regu-latory elements (PlantCARE) Some other strong motifs do not have corresponding motifsin PlantCARE but are promising candidates for further analysis
Key words motif nding Cribbs sampling regulatory elements gene expression microarray
1 INTRODUCTION
Microarrays let biologists monitor the mRNA expression levels of several thousands of genesin one experiment (for a review see Lockhart and Winzeler [2000]) An interesting application of
this microarray technology is to measure the evolution of mRNA levels at consecutive time points during
1 ESAT-SCD KULeuven Kasteelpark Arenberg 10 3001 Leuven Belgium2 Plant Genetics VIB University Gent Ledeganckstraat 35 9000 Gent Belgium3 INRA associated laboratory VIB University Gent Ledeganckstraat 35 9000 Gent Belgium
447
448 THIJS ET AL
a biological experiment This way we can construct a temporal expression pro le for the thousands ofgenes present on the array Such large-scale microarray experiments have opened new research directionsin transcript pro ling (Sherlock 2000 Szallasi 1999 Wen et al 1998 Zhang 1999) For instance aprimary goal in the analysis of such large data sets is to nd genes that have similar behavior under thesame experimental conditions Several clustering algorithms are available to group genes that have a similarexpression pro le (Altman and Raychaudhuri 2001 De Smet et al 2002 Eisen et al 1998 Heyer et al1999 Mjolsness et al 2000 Tavazoie et al 1999) Given a cluster of genes with highly similar expressionpro les we can search for the mechanism that is responsible for their coordinated behavior We basicallyassume that coexpression frequently arises from transcriptional coregulation As coregulated genes areknown to share some similarities in their regulatory mechanism possibly at transcriptional level theirpromoter regions might contain some common motifs that are binding sites for transcription regulators Asensible approach to detect these regulatory elements is to search for statistically overrepresented motifsin the promoter region of such a set of coexpressed genes (Bucher 1999 Ohler and Niemann 2001 Rothet al 1998 Tavazoie et al 1999 Zhu and Zhang 2000)
Algorithms to nd regulatory elements can be divided into two major classes 1) methods based onword counting (Jensen and Knudsen 2000 van Helden et al 1998 2000a Sinha and Tompa 2000Tompa 1999 Vanet et al 2000) and 2) methods based on probabilistic sequence models (Bailey andElkan 1995 Hughes et al 2000 Lawrence et al 1993 Liu et al 2002 Roth et al 1998 Workmanand Stormo 2000) The word-counting methods analyze the frequency of oligonucleotides in the upstreamregion and use intelligent strategies to speed up counting and to detect signi cantly overrepresented motifsThese methods then compile a common motif by grouping similar words Word counting methods leadto a global solution as compared to the probabilistic methods The probabilistic methods represent themotif by a position probability matrix and the remainder of the sequence is modeled by a backgroundmodel To nd the parameters of this model these methods use maximum likelihood estimation in theform of Expectation Maximization (EM) and Gibbs samplingmdashEM is a deterministic algorithm and GibbsSampling is a stochastic equivalent of EM
In this paper we present two modi cations of the original Gibbs sampling algorithm by Lawrence et al(1993) First a probabilistic framework is used to estimate the expected number of copies of a motif ina sequence The proposed method resembles the method used in MEME (Bailey and Elkan 1995) WhileBailey and Elkan use a global variable to estimate the number of copies of the motif in the whole dataset we propose to estimate the number of copies of the motif in each sequence individually For instancewhen using AlignACE (Roth et al 1998) the user should estimate the total number of motif occurrencesin the complete data set while in our approach there is only a maximum number per sequence to beset Second we introduce the use of a higher-order background model based on an Markov chain Herewe comment on the technical details of the incorporation of the background model in the algorithm Theconstruction and in uence of the background on the performance of the Motif Sampler has been describedelsewhere (Thijs et al 2001) We showed that the use of a higher-order background model has a profoundimpact on the performance of the motif nding algorithm In this manuscript we focus on the details ofthe incorporation of these modi cations in the Gibbs sampling algorithm to nd the parameters of theextended probabilistic sequence model
Our implementation of the Gibbs sampler was successfully tested on different data sets of inter-genic sequences We used data sets of upstream regions with known regulatory elements in Arabidop-sis thaliana in Saccharomyces cerevisiae and in bacteria to demonstrate the performance of the MotifSampler In this manuscript we discuss these results in detail and show how the different parametersettings in uence the detection performance of the motif nding Finally we show some results for theupstream sequences of coexpressed genes identi ed in a microarray experiment on wounding in A thaliana(Reymond et al 2000)
2 MODEL DESCRIPTION
In this section we start with the basic description of the sequence model Then we discuss the higher-order background model and we introduce the probabilistic framework to estimate the number of copiesof the motif in the sequence
A GIBBS SAMPLING METHOD 449
21 Basic sequence model
To start we introduce the basic model that we use to represent a DNA sequence The basic modelassumes that one or more motifs are hidden in a noisy background sequence On the one hand the motifmodel is based on a frequency residue model (Lawrence et al 1993 Bailey and Elkan 1995) and isrepresented by a position probability matrix microW
Motif microW D
0
BBBB
qA1 qA
2 cent cent cent qAW
qC1 qC
2 cent cent cent qCW
qG1 qG
2 cent cent cent qGW
qT1 qT
2 cent cent cent qTW
1
CCCCA
with W the xed length of the motif Each entry qbi in the matrix microW gives the probability of nding
nucleotide b at position i in the motif On the other hand the background model is represented bya transition matrix Bm with m the order of the model (see Section 22) The probability P0 that thesequence S is generated by the background model Bm is given by
P0 D P SjBm D P b1
LY
lD1
P bljbliexcl1 b1 Bm
where bl is the nucleotide at position l in the sequence S and P bl jbliexcl1 b1 Bm is the probability of nding the nucleotide bl at that position l in the sequence according to the background model and thesequence content If the order of the background model is set to zero the background model is representedby the single nucleotide model Psnf or the residue frequencies in the data set
Psnf D [qA0 qC
0 qG0 qT
0 ]T
Now that we have de ned the parameters of the models we can use these parameters to compute theprobability of the sequence when the position of the motif is known If the start position a of a motif microW
is known then the probability that the sequence is generated given the model parameters is
P Sja microW B0 Daiexcl1Y
lD1
qbl
0
aCW iexcl1Y
lDa
qbl
liexclaC1
LY
lDaCW
qbl
0 (1)
where qbl
liexclaC1 is the corresponding entry bl l iexcl a C 1 in the motif model microW
22 Higher-order background model
The rst extension to the original Gibbs sampling algorithm for motif nding (Lawrence et al 1993)we implemented is the use of a higher-order background model An elaborate evaluation and discussion onthe in uence of a higher-order background model on motif detection has been described elsewhere (Thijset al 2001) Here we will only summarize the issues relevant to the remainder of the article
The most frequently cited algorithms using the probabilistic motif model AlignACE (Hughes et al2000) and MEME (Bailey and Elkan 1995) use the single nucleotide frequency distribution of the inputsequences to describe the background model However if we look more closely at state-of-the-art gene de-tection software Glimmer (Delcher et al 1999) HMMgene (Krogh 1997) and GeneMarkhmm (Lukashinand Borodowsky 1998) all of them use higher-order Markov processes to model coding and noncoding se-quences Markov models have been introduced to predict eukaryotic promoter regions (Audic and Claverie1997) and recently this method was re ned to interpolated Markov chains (Ohler et al 1999) Recentlyhigher-order background models have also been introduced in word-counting methods (Sinha and Tompa2000) In parallel with our research others (Liu et al 2001 McCue et al 2001 Workman and Stormo2000) have suggested the use of related higher-order background models to improve their motif-detectionalgorithms
450 THIJS ET AL
Starting from the ideas incorporated in these gene and promoter prediction algorithms we developeda background model based on a Markov process of order m This means that the probability of thenucleotide bl at position l in the sequence depends on the m previous bases in the sequence and the factorP bliexcl1 b1 bl jBm simpli es to P bljbliexcl1 bliexclm Bm Such a model is described by a transitionmatrix Given a background model of order m we write the probability of the sequence S being generatedby the background model as
P SjBm D P b1 bmjBm
LY
lDmC1
P bljbliexcl1 bliexclm Bm
The probability P b1 bmjBm accounts for the rst m bases in the sequences while P bljbliexcl1
bliexclm Bm corresponds to an entry in the transition matrix that comes with the background model BmImportant to know is that the background model can be constructed either from the original sequence data
or from an independent data set The latter approach is more sensible if the independent data set is carefullycreated which means that the sequences in the training set come from only the intergenic region and thusdo not overlap with coding sequences Currently we have constructed an independent background modelfor Arabidopsis thaliana (based on the sequences in Araset [Pavy et al 1999] and PlantGene [Thijs et al2001]) and also for Saccharomyces cerevisiae (wwwucmbulbacbebioinformaticsrsa-tools) Backgroundmodels for other organism are under construction Nevertheless the algorithm can also be used for otherorganisms by building the background model from the input sequences
23 Finding the number of occurrences of a motif
The clustering of gene expression pro les of a microarray experiment gives several groups of coexpressedgenes The basic assumption states that coexpression indicates coregulation but we expect that only a subsetof the coexpressed genes are actually coregulated When searching for possible regulatory elements in sucha set of sequences we should take into account that the motif will appear only in a subset of the originaldata set We therefore want to develop an algorithm that distinguishes between the sequences in whichthe motif is present and those in which it is absent Furthermore in higher organisms regulatory elementscan have several copies to increase the effect of the transcriptional binding factor in the transcriptionalregulation Figure 1 gives a schematic representation of this kind of data set To incorporate these factswe reformulate the probabilistic sequence model in such a way that we can estimate the number of copiesof the motif in each sequence
First we introduce a new variable Qk which is the number of copies of the motif microW in the sequenceSk and which is missing from our observations Together with this variable Qk we also introduce theprobability degkc of nding c copies of the motif microW in the sequence Sk with
degkc D P Qk D cjSk microW Bm (2)
FIG 1 Schematic representation of the upstream region of a set of co-expressed genes
A GIBBS SAMPLING METHOD 451
Equation 2 can be further expanded by applying Bayesrsquo theorem
degkc DP Sk jQk D c microW BmP Qk D cjmicroW Bm
P Sk jmicroW Bm (3)
We can distinguish three different parts in Equation 3 The rst part P Sk jQk D c microW Bm is the prob-ability that the sequence is generated by the motif model microW the background model Bm and the givennumber of copies c This probability can be calculated by summing over all possible combinations ofc motifs
P Sk jQk D c microW Bm
DX
a1
cent cent centX
ac
P Sk ja1 ac Qk D c microW BmP a1 acjQk D c microW Bm (4)
where a1 ac are the start positions of the different copies of the motif We assume that the priorP a1 acjQk D c microW Bm is independent of the motif model and of the background model and that itis therefore a constant inverse proportional to the total number of possible combinations The probabilityP Sk ja1 ac Qk D c microW Bm can be easily calculated with Equation 1 Note however that thecomplexity of the computations depends on the number of copies c since all possible combinations ofc motifs in the sequence have to be taken into account
The second part in Equation 3 is the prior P Qk D cjmicroW Bm the probability of nding c copiesgiven the motif model and the background model For simplicity reasons we assume that this probabilityis independent of microW and Bm and therefore it can be estimated as P Qk D c To ef ciently calculateEquation 4 an adapted version of the forward algorithm can be used
The nal part is the probability P Sk jmicroW Bm This probability can be calculated by taking the sumover all possible numbers of copies
P Sk jmicroW Bm D1X
cD0
P Sk jQk D c microW BmP Qk D cjmicroW Bm (5)
From a more practical point of view this equation is not workable Taking the sum over all possiblenumbers of copies is impractical Therefore we introduced a new parameter Cmax to set the maximalnumber of copies expected in each sequence The sum in Equation 5 is substituted with a sum going from0 to Cmax The in uence of this parameter Cmax on the performance of the algorithm will be discussedin detail in Section 5 If we have computed degkc for c D 1 Cmax this probability can be used toestimate the expected number of copies Qk of the motif in the given sequence Sk
ESk microW BmQk DCmaxX
cD0
cP Qk D cjSk microW Bm
DCmaxX
cD1
cdegkc (6)
3 ALGORITHM AND IMPLEMENTATION
In the previous section we discussed the technicalities of the higher-order background model and theestimation of the number of copies of a motif in the sequences In this section we describe the incorporationof the presented modi cations in the iterative procedure of the Gibbs sampling algorithm First we describethe algorithm in detail We do not give a general description of the Gibbs sampling methodology as itis available elsewhere (Lawrence et al 1993 Liu et al 2002) but we focus on the description of ourimplementation
452 THIJS ET AL
In the following paragraph we brie y address the problem of nding different motifs Then we give anoverview of the output returned by the Motif Sampler and the different motif scores Finally we discussthe web interface to the Motif Sampler and we give a brief description of all the parameters that the userhas to de ne
31 Algorithm
The input of the Motif Sampler is a set of upstream sequences In the rst step of the algorithmthe higher-order background model is chosen The background model can be pre-compiled or it can becalculated from the input sequences The algorithm then uses this background model Bm to compute foreach segment x D fbl blC1 blCWiexcl1g of length W in every sequence the probability
Pbgx D P xjS Bm DWY
iD0
P blCijblCiiexcl1 blCiiexclm Bm
that the segment was generated by the background model These values are stored and there is no need toupdate them during the rest of the algorithm
In the second step for each sequence Sk k D 1 N the alignment vector Ak D fakcjc D 1
Cmaxg is initialized from a uniform distribution The number of copies Qk is sampled according to theinitial distribution 0k with
0k D fdegkcjc D 0 Cmaxg
In the next step the algorithm loops over all sequences and the alignment vector for each sequence isupdated First the motif model QmicroW is calculated based on the current alignment vector This estimatedmotif model is used to compute the probability distribution Wzx over the possible motif positions insequence Sz The calculation of Wzx is similar to the predictive update formula as described by Liuet al (1995) but we substituted the single nucleotide background model with a higher-order backgroundmodel which leads to the following equation
Wzx DP xj QmicroW
P xjS BmD
Wiexcl1Y
iD0
QmicroW i C 1 blCi
P blCijblCiiexcl1 blCiiexclm Bm (7)
Next a new alignment vector is selected by taking Cmax samples from the normalized distribution WzxGiven the estimated motif model QmicroW the algorithm reestimates the distribution 0 Although we sampledCmax positions only the rst Qk positions will be selected to form the nal motif This procedure is endedwhen there is no more improvement in the motif model or we exceed a maximum number of iterations
1 Select or compute the background model Bm2 Compute the probability Pbgx for all segments x of length W in every sequence3 Initialize of the alignment vectors A D fAk jk D 1 Ng and the weighting factors 0 D f0k jk D
1 Ng4 Sample Qk for each sequence Sk from the corresponding distribution 0k 5 For each sequence Sz z D 1 N
a Create subsets QS D fSi ji 6D zg and QA D f QAiji 6D zg with QAi D fai1 aiQig
b Calculate QmicroW from the segments indicated by the alignment vectors QAc Assign to each segment x in Sz the weight Wzx conforming to Equation 7d Sample Cmax alignment positions to create the new vector Az from the normalized distribution Wz e Update the distribution 0z
6 Repeat from Step 4 until convergence or for a maximal number of iterations
32 Inclusion of the complementary strand
Often it is also useful to include the complementary strand into the analysis procedure since transcriptionbinding factors are known to bind on both strands of the DNA The straightforward way to tackle this
A GIBBS SAMPLING METHOD 453
problem is to double the size of the data set by including the reverse complement of each individualsequence However with this approach the noise present in the data set will also be doubled Thereforewe suggest a more careful approach In Step 5 of the algorithm the predictive update distribution ofboth the sequence Sz and its reverse complement is computed Next the alignment positions are sampledfrom Sz these positions are masked on the opposite strand and the alignment positions on the reversecomplementary sequence are sampled Finally the distribution 0z is calculated and updated for both thestrands
33 Finding multiple motifs
So far we discussed only the issue of nding one motif that can have multiple copies but we would likealso to nd multiple motifs To nd more than one motif we will run the Motif Sampler several times andin each run we will mask the positions of the motifs previously found By masking the positions it willbe impossible to nd the same motif twice Masking a certain position in the sequence can be achieved byforcing the weights Wzx to be 0 for all segments x that overlap with the previous motifs The allowedoverlap is a parameter that the user of the algorithm has to de ne
34 Motif scores
The nal result of the Motif Sampler consists of three parts the position probability matrix microW thealignment vector A and the weighting factors 0 Based upon these values different scores with their owncharacteristics can be calculated consensus score information content and log-likelihood
The consensus score is a measure for the conservation of the motif A perfectly conserved motif has ascore equal to 2 while a motif with a uniform distribution has a score equal to 0
Consensus Score D 2 iexcl 1W
WX
lD1
X
b2fACGTgqb
l logqbl (8)
The information content or Kullback-Leiber distance between the motif and the single nucleotide fre-quency tells how much the motif differs from the single nucleotide distribution This score is maximal ifthe motif is well conserved and differs considerably from the background distribution
Information Content D 1W
WX
lD1
X
b2fACGTgqb
l logplusmnqb
l
qb0
sup2 (9)
As a nal score we consider the likelihood P S AjmicroW Bm or the corresponding log-likelihood Themotif and alignment positions are the results of maximum likelihood estimation and therefore the log-likelihood is a good measure for the quality of the motif In this case we are especially interested in thepositive contribution of the motif to the global log-likelihood If we write the probability of the sequencebeing generated by the background model P SjBm as P0 the log-likelihood can be calculated as
logiexclfrac14S AjmicroW Bm
centD log
plusmn CmaxX
cD0
degcP SjAc microW BmP AcjmicroW Bmsup2
D logC C logplusmn CmaxX
cD0
degcP SjAc microW Bmsup2
where Ac refers to the rst c positions in the alignment vector A which contains Cmax positions and C isa constant representing the prior probability of the alignment vector which is assumed to be uniform Thelog-likelihood depends on the strength of the motif and also on the total number of instances of the motifEach of these scores accounts for a speci c aspect of the motif Together with these scores the numberof occurrences of a motif in the input sequences can be computed We can use Equation 6 to estimate thenumber of occurrences of a motif in the data set
454 THIJS ET AL
35 Web interface
The implementation of our motif- nding algorithm is part of our INCLUSive web site (Thijs et al2002) and is accessible through a web interface wwwesatkuleuvenacberaquodnaBioISoftwarehtml Onthis web interface the user can either paste the sequence in FASTA format or upload a le to enter thesequences The user also has to de ne ve parameters Here is a short description of these parameters
sup2 Background model Bm Selects one of the precompiled models (A thaliana or S cerevisiae) as thebackground model or compute the background model from the sequence data themselves
sup2 Length W Determines the length of the motif which is xed during the sampling Reasonable valuesrange from 5 to 15
sup2 Motifs N Sets the number of different motifs to be searched for The motifs will be searched for inconsecutive runs while the positions of the previously found motifs are masked
sup2 Copies Cmax Sets the maximum number of copies of a motif in every sequence If this number is settoo high noise will be introduced in the motif model and the performance will degrade
sup2 Overlap O De nes the overlap allowed between the different motifs This parameter is used only inthe masking procedure
4 DATA
41 G-box sequences
To validate our motif- nding algorithm we rst constructed two data sets of gene upstream regions1) sequences with a known regulatory element G-box involved in light regulation in plants and 2) aselection of upstream sequences from A thaliana in which no G-box is reported (random data set) TheG-box data set consists of 33 sequences selected from PlantCARE (Lescot et al 2002) containing 500bpupstream of the translation start and in which the position of the G-box is reported This data set is wellsuited to give a proof of concept and to test the performance of the Motif Sampler since we exactly knowthe consensus of the motif CACGTG and also the known occurrences of the motif in the sequences Thedata can be found at wwwplantgeneticsrugacbebioinformaticslescotDatasetsListG-boxeshtml
The random set consists of 87 sequences of 500bp upstream of translation start in genes from A thalianaThe genes in this set are supposed to contain no G-box binding site This set is used to introduce noiseinto the test sets and to evaluate the performance of the Motif Sampler under noisy conditions
42 MET sequences
A set of upstream sequences from 11 genes in S Cerevisiae that are regulated by the Cb -Met4p-Met28pcomplex and Met31p or Met32p in response to methionine (van Helden et al 1998) were obtained fromwwwucmbulbacbebioinformaticsrsa-tools Upstream regions between iexcl800 and iexcl1 are selected Theconsensus of both binding sites is given by TCACGTG for the Cb -Met4p-Met28p complex and AAAACTGTGG
for Met31p or Met32p (van Helden et al 1998) Figure 2 shows the putative locations based on sequencehomology of the two binding sites These locations are used to validate the motifs retrieved with the MotifSampler
43 Bacterial sequences
As a third test set we created a data set with intergenic sequences from bacteria The data set containsa subset of bacterial genes regulated by the O2-responsive transcriptional regulator FNR (Marchal 1999)The genes were selected from several bacterial species Azospirillum brasilense Paracoccus denitri cansRhodobacter sphaeroides Rhodobacter capsulatus Sinorhizobium meliloti and Escherichia coli The dataset contains 10 intergenic sequences of varying length The FNR motif is described in the literature as aninterrupted palindrome of 14bp and the consensus TTGACnnnnATCAA consists of two conserved blocks of5bp separated by a xed spacer of 4bp (as will be shown later in Figure 6) The presence of the spacerwill make the nal motif model more degenerate and will have an in uence on the performance of theMotif Sampler
A GIBBS SAMPLING METHOD 455
FIG 2 Representation of the putative location of TCACGTG and AAACTGTGG in the MET sequence set
44 Plant wounding data
As a last test set we selected sequences from clusters of coexpressed genes As a test case we selectedthe data from Reymond et al (2000) who measured the gene expression in response to mechanicalwounding in A thaliana The mRNA was extracted from leaves at 30 minutes 1 hour 90 minutes and3 6 9 and 24 hours after wounding (7 time-points) and the expression level was measured on a cDNAmicroarray of 138 genes related to the plant defence mechanism To nd the groups of coexpressed geneswe use an adaptive quality-based clustering which we developed in our group (De Smet et al 2002) toidentify groups of tightly coexpressed genes This resulted in eight small clusters of coexpressed genes
From the eight clusters found four of them contained only three genes These sets were not considered forfurther analysis The remaining clusters contained respectively 11 6 5 and 5 sequences The pro les of theclusters and the genes belonging to the clusters can be found at wwwplantgeneticsrugacbebioinformaticslescotDatasetsWoundingClustershtml The automated upstream sequence retrieval of INCLUSive (Thijset al 2002) was used to nd the upstream sequences of the genes in each of the selected clusters Finallywe truncated each retrieved sequence to 500bp upstream of the annotated translation start
5 RESULTS
51 G-box sequences
We exhaustively tested the performance of our implementation of the Motif Sampler At rst we set upa test with only the 33 G-box sequences In this test we looked only at the positive strand We searched forsix different motifs of 8bp and the maximal number of copies is varied between 1 and 4 and the allowedoverlap was xed on 1bp Each test was repeated 20 times Table 1 gives an overview of the differentscores The rst column indicates the maximal number of copies of the motif The second column givesthe number of runs in which the G-box consensus CACGTG was found The next three columns give theaverage of the different scores consensus score information content and log-likelihood (see Section 34)The last column shows the average number of sites in the data set that the algorithm identi es as beingrepresentatives of the motif
Table 1 Average and Variance of the Scores of the Motif Found in the G-Box Data Set
Number of G-box found Consensus Information Totalcopies in 20 runs score content Loglikelihood occurrences
1 1820 156 sect 008 175 sect 011 26802 sect 4103 262 sect 312 1520 134 sect 006 149 sect 009 26098 sect 2765 432 sect 433 1820 130 sect 008 145 sect 008 24975 sect 2509 490 sect 894 1520 130 sect 007 144 sect 007 25576 sect 1608 519 sect 92
456 THIJS ET AL
FIG 3 Total number of times the G-box consensus is found in 10 repeated runs of the tests for three differentbackground models The data set consists of the 33 G-box sequences and a xed number of added noisy sequences
When the number of copies is set to 1 a more conserved motif is found but a number of true occurrencesis missed Increasing the number of copies allows one to estimate better the true number of copies of themotif but more noise is introduced into the initial model and the nal model is more degenerate This isclearly indicated by the consensus score and the information content Both scores decrease as the maximalnumber of copies increases The number of representatives of the motifs detected by the algorithm increaseswith the number of copies We can also see that the difference is most pronounced when increasing thenumber of copies from 1 to 2 but that there is not much difference between 3 and 4 copies The trade-offbetween the number of occurrences and the degeneracy of the motif has to be taken into account whentrying to nd the optimal parameters For instance when searching for 1 copy the algorithm returns asconsensus sequences mCACGTGG or CCACGTGk When allowing up to 4 copies the algorithm will returnmore degenerate consensus sequences as nnCACGTG or mCArGTGk
Another important issue is the in uence of noise on the performance of the Motif Sampler Noise isdue to the presence of upstream sequences that do not contain the motif To introduce noise in the dataset we added in several consecutive tests each time 10 extra sequences in which no G-box is reportedto the G-box data set We exhaustively tested several con gurations to see how the noise in uences theperformance of the Motif Sampler In this extensive test we limited the number of repeats to 10 for eachtest corresponding to a different set of parameters Figure 3 shows the total number of times the G-boxconsensus was detected in ten runs for three different background models and an increasing number ofadded sequences when searching for a motif of length 8bp and the maximal number of copies set to 1 Ascan be expected the number of times the G-box is detected decreases when more noise is added to theoriginal set of 33 G-box sequences This in uence is more dramatic for the single nucleotide backgroundmodel than for the third-order background model More details on the use of the higher-order backgroundmodels are given elsewhere (Thijs et al 2001)
52 MET sequences
In a subsequent set of tests we experimented with the MET sequence set (in this case both strands areanalyzed) In these tests we used the higher-order background models compiled from the upstream regionsof all the annotated genes in the yeast genome (van Helden et al 2000b) With this data set we further
A GIBBS SAMPLING METHOD 457
explored the in uence of the different parameters on the performance of the algorithm Preliminary testsshowed that using a third-order background model was the best choice (data not shown) and we thereforeused only the third-order background model in these tests As in the G-box example we ran our MotifSampler with different combinations of parameters In this case we looked at the motif length W themaximal number of copies Cmax and the in uence of the total number of motifs N Three different motiflengths W were tested 8 10 and 12bp The maximal number of copies Cmax could vary between 1 and 4
First N was set to 1 and each test with a given set of parameters was repeated 100 times Since thereare two different binding sites present in this data set the algorithm should be able to pick up both of themWhen searching for only one motif the algorithm is surely not able to capture both in one run Thereforethe algorithm was tested with the number of different motifs N also set to 2 3 and 4 Again each testwith a particular set of parameters was repeated 100 times This means that in each test an additional 100motifs are found
To analyze these results we rst looked at the information content of the all motifs found (Equa-tion 9) Figure 4 shows how the information content changes when Cmax is increased from 1 to 4 On thex-axis the motifs are ranked with increasing information content and the y-axis indicates the informationcontent Figure 4 clearly shows that when the maximal number of copies is increased the informationcontent decreases This is logical since more instances can be selected and the motif models become moredegenerate The effect is most pronounced when going from maximal 1 copy to 2 copies Figure 5 showshow the information content changes when Cmax is xed at 1 but the motif length is set to 8 10 or 12bpAgain the plot clearly shows that on average the information content decreases when the length of themotif grows This can be explained by the fact that the given information content is the average over allpositions (see Equation 9) When the length of the motif is increased noninformative positions can beadded to the motif model and therefore the information content decreases on average This effect has tobe taken into account when comparing the results of tests with different parameter settings
Next the found motifs are further analyzed Since prior knowledge about the binding sites was availableit was possible to compare the alignment vector of each retrieved motif with the putative location of thebinding site For each motif the positions of all instances of the motif were compared with these putativepositions If at least 50 of the alignment positions correspond with one of the two known sites themotif was considered as a good representative A threshold of 50 corresponds to the number of instancesneeded to create a motif that resembles the consensus of a true motif Table 2 gives an overview of theresults when looking for the motifs that suf ciently overlap with the putative motifs This table shows the
FIG 4 Comparison of the information content of all motifs retrieved when searching for motifs of length 8bp andvarying the number of maximal copies from 1 to 4
458 THIJS ET AL
FIG 5 Comparison of the information content of all motifs retrieved when searching for motifs of length 8 10and 12bp and the number of maximal copies xed to 1
number of motifs found that overlap for three different motif lengths and four different values of CmaxThe top part shows the result when we look at only one motif per run (100 motifs) the bottom part showsthe results when we searched for four different motifs per run (400 motifs) When looking at the knownmotif TCACGTG we can clearly see that the algorithm performed best when we searched for a motif oflength 8bp and maximum 1 copy This motif is only found in a few runs as the rst motif when searchingfor motifs of length 12 however the performance improves when the number of motifs is increased tofour per run If we look at the motif AAACTGTGG the overall performance is rather similar for all parametersettings There is almost no increase of correct motifs as the number of motifs increases to four per run
Another way to analyze the results is by looking at the retrieved motifs with the highest scores Thisapproach allowed us to check whether the best motifs found corresponded to the true motifs In this partic-ular case we looked at the information content (Equation 9) First the motif with the highest informationcontent was selected Next we removed all motifs in the list that were similar to the selected motif Twomotifs micro1 and micro2 are considered similar if the mutual information of both motifs was smaller than 07 To
Table 2 Number of Times a Known Motif is Found in theMET Sequence in 100 Motifs (Top) and 400 Motifs (Bottom)
Cmax W D 8 W D 10 W D 12 W D 8 W D 10 W D 12
1 33 10 4 16 14 82 12 4 6 17 19 153 14 3 2 17 24 84 11 1 3 11 11 12
1 59 58 49 19 16 112 50 59 35 17 20 153 26 23 8 17 25 84 26 10 9 11 11 12
TCACGTG AAAACTGTGG
A GIBBS SAMPLING METHOD 459
Table 3 The Six Best Scoring Motifs of Length 8bp WhenSearching for 1 2 3 and 4 Different Motifs in 100 Tests
100 motifs 200 motifs
1 AACTGTGG 22 174 AACTGTGG 27 1722 kCACGTGA 34 167 kCACGTGA 56 1653 CGAAACCG 4 167 CGAAACCG 5 1654 CGGsACCC 2 168 CGGsACCC 7 1545 CTCCGGGT 3 169 AmGCCACA 4 1666 CmGTCAAG 2 166 CTCCGGGT 5 167
300 motifs 400 motifs
1 AACTGTGG 28 171 AACTGTGG 35 1662 kCACGTGA 62 164 kCACGTGA 64 1633 CGAAACCG 7 161 CGAAACCG 7 1614 CGGsACCC 10 154 CGGsACCC 15 1505 AmGCCACA 7 161 AmGCCACA 7 1606 CTCCGGGT 7 161 CTCCGGGT 7 161
calculate the mutual information a shifted version of the motif is taken into account To compensate for thelength of the shifted motif a normalizing factor was introduced in the formula of the mutual informationwhich leads to the following equation
mutual information D 1W
WX
jD1
4X
iD1
micro1i j curren log2
plusmn micro1i j
micro2i j
sup2 (10)
After removal of the similar motifs the same procedure was repeated six times on the reduced set ofmotifs We applied this methodology on all different tests but here we show the results for two particularparameter settings Table 3 and Table 4 give an overview of the six best motifs found when searchingfor motifs of respectively 8bp and 12bp that can have maximum one copy The tables are split in four
Table 4 The Six Best Scoring Motifs of Length 12bp WhenSearching for 1 2 3 and 4 Different Motifs in 100 Tests
100 motifs 200 motifs
1 GAGGGCGTGTGC 4 148 GAGGGCGTGTGC 6 1452 AAACTGTGGyGk 6 149 AAACTGTGGyGk 6 1493 kAGTCAAGGsGC 2 138 kAGTCAAGGsGC 3 1344 TGGTAGTCATCG 4 141 TGGTAGTCATCG 5 1385 TrTGkrTGkGwG 5 136 TrTGkrTGkGwG 9 1356 ACwGTGGCkTyn 4 135 ACwGTGGCkTyn 5 135
300 motifs 400 motifs
1 GAGGGCGTGTGC 7 142 GAGGGCGTGTGC 7 1422 TGCTsCCAACnG 2 139 TGCTsCCAACnG 2 1393 AAACTGTGGyGk 7 146 AAACTGTGGyGk 7 1464 kAGTCAAGGsGC 3 134 kAGTCAAGGsGC 5 1265 CCGGAGTCAGGG 2 136 CCGGAGTCAGGG 2 1366 TGGTAGTCATCG 5 138 TGGTAGTCATCG 6 135
460 THIJS ET AL
FIG 6 FNR binding site logo
parts with respect to the total number of motifs per run in each set1 For each of the sets the consensussequences together with the number of similar motifs in the list and the average information content of thebest six motifs are shown Table 3 clearly shows that the two true motifs are found as the two top-scoringmotifs in this test The other motifs have a low number of occurrences These numbers deteriorate asshown in Table 4 In this example we looked for motifs of length 12bp As was described previously thescores of the motifs are on average much lower than in the case of motifs of length 8bp Now only theconsensus of the second motifs is found but only in 6 out of 100 motifs If we compare Table 4 withTable 2 we see that 49 motifs are found to overlap with TCACGTG but this motif is not found as one ofthe top-scoring motifs since a large part of the motif of length 12bp contains noninformative positionsand has a low information content
53 Bacterial sequences
Since no precompiled background model was available a background model of order 1 was compiledfrom the sequence data The order of the background model is limited by the number of nucleotides in thedata set We tested several parameters settings Varying the motif length from 5bp to 14bp had a profoundimpact on the motif detection When searching for a short motif 5ndash6bp the Motif Sampler found bothconsecutive parts but when the length was increased only one of the two parts was found due to themasking of the site after an iteration When the motif length was set to 14bp the Motif Sampler retrievedthe consensus sequence of the described motif The motif logo is shown in Fig 6 Table 5 gives a moredescriptive overview of the results when we searched for a motif of length 14bp that can have 1 copy The rst two columns identify the genes by their accession number and gene name The third column gives theposition of the retrieved site in the input sequence The fourth column gives the site In the next columnthere is the probability of nding this motif in the sequence It is clear that all the motifs are found witha high probability score This means that the Motif Sampler is very con dent on nding the motif in thesequences
The last column in Table 5 indicates whether the site found by the Motif Sampler corresponds to thesite described in the annotation of the corresponding sequences There are six sequences for which theannotated site matches exactly the site retrieved by the Motif Sampler In one case the sequence upstreamof the gene ccoN the Motif Sampler retrieves a site TTGACGCAGATCAA that matches the consensus but thatis located at another position than the one in the GenBank annotation The site found in the annotationAGTTTCACCTGCATC differs strongly from the consensus In three other sequences there is no elementannotated in the GenBank entry but the Motif Sampler nds a motif occurrence
1A smaller set is contained in the larger sets The set of 200 motifs contains the set of the rst 100 motifs togetherwith the set of 100 motifs found as the second motif in an a given test
A GIBBS SAMPLING METHOD 461
Table 5 Detection of the FNR O2-Responsive Element
Accn Gene Position Site Prob Annotation
af016223 ccoN 60 TTGACGCGGATCAA 10000 mdashaf054871 cytN 255 TTGACGTAGATCAA 10000 matchpdu34353 ccoN 131 TTGACGCAGATCAA 10000 pdu34353 ccoG 210 TTGACGCAGATCAA 10000 matchaf195122 bchE 82 TTGACATGCATCAA 09998 mdashaf016236 dorS 8 TTGACGTCAATCAA 10000 mdashae000220 narK 267 TTGATTTACATCAA 09986 matchz80340 xNc 104 TTGATGTAGATCAA 10000 matchz80339 xNd 240 TTGACGCAGATCAA 10000 matchpdu34353 fnr 36 TTGACCCAAATCAA 09999 match
54 Plant wounding data
The previous examples can be seen as proof-of-concept tests to illustrate the performance of the MotifSampler To analyze a real life problem the Motif Sampler was run on four sets of upstream regions fromcoexpressed genes In these tests we looked for six different motifs of length 8 and 12bp which can have 1copy To distinguish stable motifs from motifs found by chance we repeated each experiment 10 times andonly those motifs were selected that occur in at least ve runs The results with the A thaliana backgroundmodel of order 3 are shown in Table 6 since they gave the most promising results We repeated the sametests with the single nucleotide background model but these results were not as promising as the onesshown in Table 6 In the rst column we give the cluster number and the number of sequences in thecluster The second column shows the consensus sequences which are a compilation of the consensussequences of length 8 and 12bp Only the relevant part of the consensus is displayed Together with theconsensus the number of times the consensus was found in 10 runs is indicated The most frequent motifsare shown here
Table 6 Results of the Motif Search in 4 Clusters for the Third Order Background Modela
Cluster Consensus Runs PlantCARE Descriptor
1 (11 seq) TAArTAAGTCAC 710 TGAGTCA tissue speci c GCN4-motifCGTCA MeJA-responsive element
ATTCAAATTT 810 ATACAAAT element associated to GCN4-motifCTTCTTCGATCT 510 TTCGACC elicitor responsive element
2 (6 seq) TTGACyCGy 510 TGACG MeJa responsive element(T)TGAC(C) Box-W1 elicitor responsive element
mACGTCACCT 710 CGTCA MeJA responsive elementACGT Abscisic acid response element
3 (5 seq) wATATATATmTT 510 TATATA TATA-box like elementTCTwCnTC 910 TCTCCCT TCCC-motif light response elementATAAATAkGCnT 710 mdash mdash
4 (5 seq) yTGACCGTCCsA 910 CCGTCC meristem speci c activation of H4 geneCCGTCC A-box light or elicitor responsive elementTGACG MeJA responsive elementCGTCA MeJA responsive element
CACGTGG 510 CACGTG G-box light responsive elementACGT Abscisic acid response element
GCCTymTT 810 mdash mdashAGAATCAAT 610 mdash mdash
a In the second column the consensus of the found motif is given together with the number of times this motif was found in the10 runs Finally the corresponding motif in PlantCARE and a short explanation of the described motif is given
462 THIJS ET AL
To assign a potential functional interpretation to the motifs the consensus of the motifs was comparedwith the entries described in PlantCARE (Lescot et al 2002) We found several interesting motifs methyljasmonate (MeJa) responsive elements elicitor-responsive elements and the abscisic acid response element(ABRE) It is not surprising to nd these elements in gene promoters induced by wounding because thereis a clear cross-talk between the different signal pathways leading to the expression of inducible defencegenes (Birkenmeier and Ryan 1998 Reymond and Farmer 1998 Rouster et al 1997 Pena-Cortes et al1989) Depending on the nature of a particular aggressor (woundinginsects fungi bacteria virus) the plant ne-tunes the induction of defence genes either by employing a single signal molecule or by a combinationof the three regulators jasmonic acid ethylene and salicylic acid In the third and fourth cluster there arealso some strong motifs found that do not have a corresponding motif in PlantCARE These motifs lookpromising but need some further investigation
6 CONCLUSION
We have introduced a modi ed version of the original Gibbs Sampler algorithm to detect regulatoryelements in the upstream region of DNA sequences and we have presented two speci c modi cationsThe rst change is the use of a probability distribution to estimate the number of copies of a motif in eachsequence The second contribution is the inclusion of a higher-order background model instead of usingsingle nucleotide frequencies as the background model These two modi cations are incorporated in theiterative scheme of the algorithm that is presented in this paper
In this manuscript we showed that our implementation of the Gibbs sampling algorithm for motif nding is able to nd overrepresented motifs in several well-described test sets of upstream sequencesWe focused on the in uence of the different parameters on the performance of the algorithm We exploreddifferent methodologies to analyze the motifs retrieved with our motif- nding algorithm We tested ourimplementation on three sets of upstream sequences in which one or more known regulatory elements arepresent These data sets allowed us to quantify up to a certain level of con dence the performance ofour Motif Sampler The tests showed that the performance increases if the parameters better match thetrue motif occurrence Finally to test the biological relevance of our algorithm we also used our MotifSampler to nd motifs in sets of coexpressed genes from a microarray experiment Here we selected thosemotifs that regularly occur in the repeated tests done on the sets of upstream sequences of each selectedcluster By comparing the selected motifs with the known motifs in PlantCARE we could identify someinteresting motifs among those selected motifs which are involved in plant defense and stress response
The algorithm is accessible through a web interface where only a limited number of parameters has tobe set by the user These parameters are simply de ned and easy to interpret Users do not need to gothrough the details of the implementation to understand how to choose reasonable parameter settings
Furthermore we will extend the implementation to improve the usability and performance First we willimplement a method to automatically detect the optimal length of the motif Currently the length of themotif is de ned by the user and kept xed during sampling Second we will further optimize the procedureto nd the number of copies of the motif in the sequence which is closely related to the improvement ofthe motif scores The ultimate goal is to develop a robust algorithm with as few user-de ned parametersas possible When the parameters are handled well we will focus on the development of more-speci cmotif models such as short palindromic motifs separated by a small variable gap Also the combinedoccurrence of motifs is of greater importance In the current setup of the algorithm we will nd onlyindividual motifs in consecutive iterations and there is no clear connection between these motifs From abiological point of view it will be very interesting to nd signi cant combinations of motifs in those setsof coexpressed genes Moreover the probabilistic framework in which the Motif Sampler is implementedis well suited to incorporate prior biological knowledge in the sequence model (such as when we alreadyknow a few examples of the motif but there is not yet enough information to build a complete model)
ACKNOWLEDGMENTS
Gert Thijs is research assistant with the IWT (Institute for the Promotion of Innovation by Science andTechnology in Flanders) Kathleen Marchal and Yves Moreau are postdoctoral researchers of the FWO
A GIBBS SAMPLING METHOD 463
(Fund for Scienti c ResearchmdashFlanders) Prof Bart De Moor is full time professor at the KULeuvenPierre Rouzeacute is Research Director of INRA (Institut National de la Recherche Agronomique France)This work is partially supported by IWT projects STWW-980396 Research Council KULeuven GOAMe sto-666 FWO project G011501 IUAP P4-02 (1997-2001) The scienti c responsibility is assumedby its authors We like to thank the reviewers of this manuscript for their valuable comments
REFERENCES
Altman RB and Raychaudhuri S 2001 Whole-genome expression analysis Challenges beyond clustering CurrOpin Struct Biol 11 340ndash347
Audic S and Claverie J-M 1997 Detection of eukaryotic promoters using Markov transition matrices ComputChem 21(4) 223ndash227
Bailey T L and Elkan C 1995 Unsupervised learning of multiple motifs in biopolymers using expectation maxi-mization Machine Learning 21 51ndash80
Birkenmeier GF and Ryan CA 1998 Wound signaling in tomato plants Evidence that aba is not a primary signalfor defense gene activation Plant Physiol 117(2) 687ndash693
Bucher P 1999 Regulatory elements and expression pro les Curr Opin Struct Biol 9 400ndash407De Smet F Marchal K Mathys J Thijs G De Moor B and Moreau Y 2002 Adaptive Quality-Based Clustering
of Gene Expression Pro les Bioinformatics in pressDelcher AL Harman D Kasif S White O and Salzberg SL 1999 Improved microbial gene identi cation with
glimmer Nucl Acids Res 27(23) 4636ndash4641Eisen MB Spellman PT Brown PO and Botstein D 1998 Cluster analysis and display of genome-wide expres-
sion patterns Proc Natl Acad Sci USA 95 14863ndash14868Heyer LJ Kruglyak S and Yooseph S 1999 Exploring expression data Identi cation and analysis of coexpressed
genes Genome Res 9 1106ndash1115Hughes JD Estep PW Tavazoie S and Church GM 2000 Computational identi cation of cis-regulatory ele-
ments associated with groups of functionally related genes in Saccharomyces cerevisiae J Mol Biol 296 1205ndash1214
Jensen LJ and Knudsen S 2000 Automatic discovery of regulatory patterns in promoter regions based on wholecell expression data and functional annotation Bioinformatics 16(4) 326ndash333
Krogh A 1997 Two methods for improving performance of an HMM and their application for gene nding 5th IntlConf Intelligent Systems in Molecular Biology 179ndash186
Lawrence CE Altschul SF Boguski MS Liu JS Neuwald AF and Wootton JC 1993 Detecting subbtlesequence signals A Gibbs sampling strategy for multiple alignment Science 262 208ndash214
Lescot M Deacutehais P Thijs G Marchal K Moreau Y de Peer Y Van Rouzeacute P and Rombauts S 2002PlantCARE a database of plant cis-acting regulatory elements and a portal to tools for in silico analysis of promotersequences Nucl Acids Res 30 325ndash327
Liu JS Neuwald AF and Lawrence CE 1995 Bayesian models for multiple local sequence alignment and gibbssampling strategies J Am Stat Assoc 90(432) 1156ndash1170
Liu X Brutlag DL and Liu JS 2001 Bioprospector Discovering conserved DNA motifs in upstream regulatoryregions of co-expressed genes Proc Paci c Symposium on Biocomputing vol 6 127ndash138
Lockhart DJ and Winzeler EA 2000 Genomics gene expression and DNA arrays Nature 405 827ndash836Lukashin AV and Borodowsky M 1998 GeneMarkhmm New solutions for gene nding Nucl Acids Res 26
1107ndash1115Marchal Kathleen 1999 The O2 paradox of Azospirillum brasilense under diazotrophic conditions PhD Thesis
FLTBW KULeuvenMcCue LA Thompson W Carmack CS Ryan MP Liu JS Derbyshire V and Lawrence CE 2001 Phylo-
genetic footprinting of transcription factor binding sites in proteobacterial genomes Nucl Acids Res 29 774ndash782Mjolsness E Mann T Castantildeo R and Wold B 2000 From coexpression to coregulation An approach to inferring
transcriptional regulation among gene classes from large-scale expression data SA Solla TK Leen and KRMuller eds Advances in Neural Information Processing Systems vol 12
Ohler U Harbeck S Niemann H Noumlth E and Reese MG 1999 Interpolated Markov chains for eukaryoticpromotor recognition Bioinformatics 15(5) 362ndash369
Ohler U and Niemann H 2001 Identi cation and analysis of eukaryotic promoters Recent computational ap-proaches Trends Genet 17(2) 56ndash60
Pavy N Rombauts S Deacutehais P Matheacute C Ramana DVV Leroy P and Rouzeacute P 1999 Evaluation of geneprediction software using a genomic data set Application to Arabidopsis thaliana sequences Bioinformatics 15887ndash899
464 THIJS ET AL
Pena-Cortes H Sanchez-Serrano JJ Mertens R Willmitzer L and Prat S 1989 Abscisic acid is involved inthe wound-induced expression of the proteinase inhibitor II gene potato and tomato Proc Natl Acad Sci USA 869851ndash9855
Reymond P and Farmer EE 1998 Jasmonate and salicylate as global signals for defense gene expression CurrOpin Plant Biol 1(5) 404ndash411
Reymond P Weber H Damond M and Farmer EE 2000 Differential gene expression in response to mechanicalwounding and insect feeding in Arabidopsis Plant Cell 12 707ndash719
Roth FP Hughes JD Estep PW and Church GM 1998 Finding DNA regulatory motifs within unalignednoncoding sequences clustered by whole genome mRNA quantitation Nature Biotech 16 939ndash945
Rouster J Leah R Mundy J and Cameron-Mills V 1997 Identi cation of a methyl jasmonate-responsive regionin the promoter of a lipoxygenase-1 gene expressed in barley grain Plant J 11(3) 513ndash523
Sherlock G 2000 Analysis of large-scale gene expression data Curr Opin Immunol 12 201ndash205Sinha S and Tompa M 2000 A statistical method for nding transcription factor binding sites 8th Intl Conf
Intelligent Systems for Molecular Biology vol 8 37ndash45Szallasi Z 1999 Genetic network analysis in light of massively parallel biological data acquisition Proc Paci c
Symposium on Biocomputing 99 vol 4 5ndash16Tavazoie S Hughes JD Campbell MJ Cho RJ and Church GM 1999 Systematic determination of genetic
network architecture Nature Genet 22(7) 281ndash285Thijs G Lescot M Marchal K Rombauts S De Moor B Rouzeacute P and Moreau Y 2001 A higher order
background model improves the detection of promoter regulatory elements by Gibbs sampling Bioinformatics17(12) 1113ndash1122
Thijs G Moreau Y Smet F De Mathys J Lescot M Rombauts S Rouzeacute P De Moor B and Marchal K2002 INCLUSive INtegrated CLustering Upstream sequence retrieval and motif Sampling Bioinformatics 18(2)331ndash332
Tompa M 1999 (August) An exact method for nding short motifs in sequences with application to the ribosomebinding site problem 7th Intl Conf Intelligent Systems for Molecular Biology vol 7 262ndash271
van Helden J Andreacute B and Collado-Vides L 1998 Extracting regulatory sites from upstream region of yeast genesby computational analysis of oligonucleotide frequencies J Mol Biol 281 827ndash842
van Helden J Rios AF and Collado-Vides J 2000a Discovering regulatory elements in non-coding sequences byanalysis of spaced dyads Nucleic Acids Res 28(8) 1808ndash1818
van Helden J Andreacute B and Collado-Vides L 2000b A web site for the computational analysis of yeast regulatorysequences Yeast 16 177ndash187
Vanet A Marsan L Labigne A and Sagot MF 2000 Inferring regulatory elements from a whole genome Ananalysis of Helicobacter pylori sigma80 family of promoter signals J Mol Biol 297(2) 335ndash353
Wen X Fuhrman S Michaels G S Carr D B Smith S Barker J L and Somogyi R 1998 Large-scaletemporal gene expression mapping of central nervous system development Proc Natl Acad Sci USA 95 334ndash339
Workman CT and Stormo GD 2000 ANN-SPEC A method for discovering transcription binding sites withimproved speci city Proc Paci c Symposium on Biocomputing vol 5 464ndash475
Zhang MQ 1999 Large-scale gene expression data analysis A new challenge to computational biologists GenomeRes 9 681ndash688
Zhu J and Zhang MQ 2000 Cluster function and promoter analysis of yeast expression array Proc Paci cSymposium on Biocomputing vol 5 467-486
Address correspondence toGert Thijs
KU LeuvenESAT-SCD
Kasteelpark Arenberg 103001 Leuven Belgium
E-mail GertThijsesatkuleuvenacbe
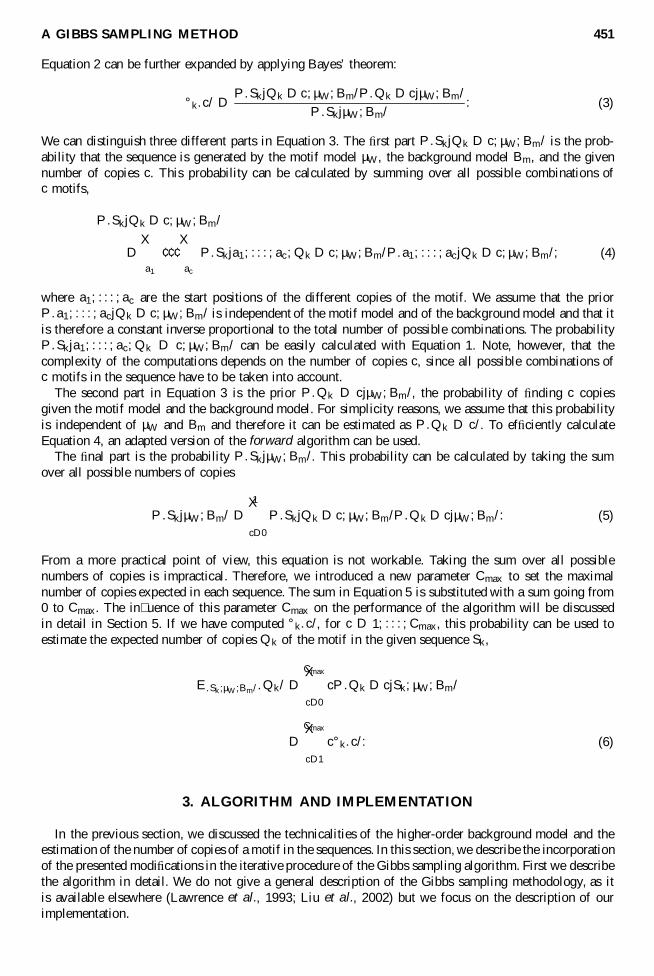
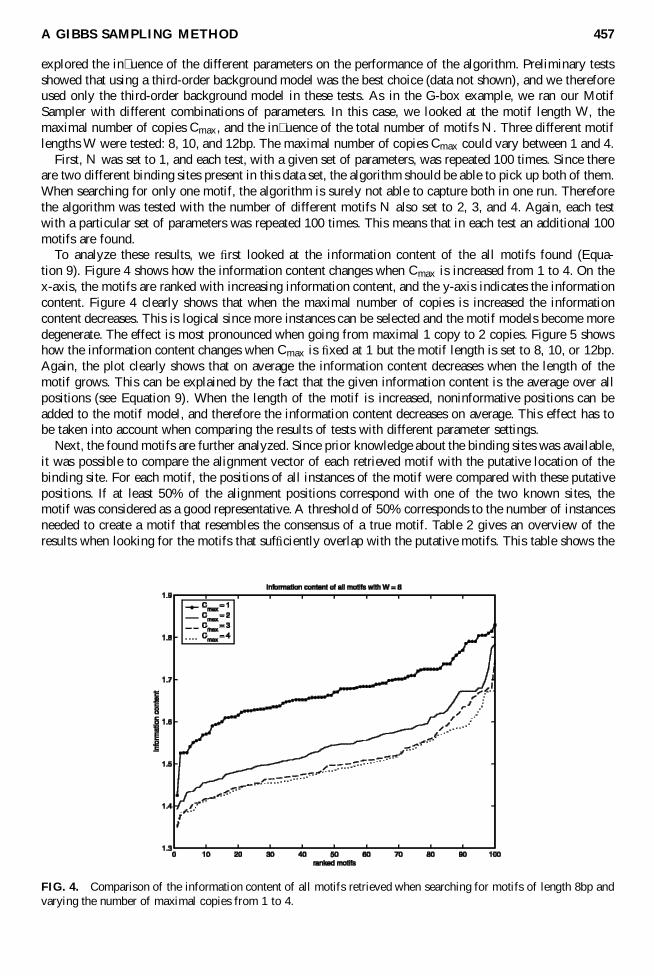
Copyright © 2022 FDOKUMEN