Cathodic protection of reinforced concrete bridges in the ...
Upload
khangminh22Category
view
7download
0
Syracuse University Syracuse University
SURFACE SURFACE
Dissertations - ALL SURFACE
December 2016
The Economy of Preventive Maintenance of Concrete Bridges Due The Economy of Preventive Maintenance of Concrete Bridges Due
to Corrosion to Corrosion
Haotian Zhang Syracuse University
Follow this and additional works at: https://surface.syr.edu/etd
Part of the Engineering Commons
Recommended Citation Recommended Citation Zhang, Haotian, "The Economy of Preventive Maintenance of Concrete Bridges Due to Corrosion" (2016). Dissertations - ALL. 603. https://surface.syr.edu/etd/603
This Dissertation is brought to you for free and open access by the SURFACE at SURFACE. It has been accepted for inclusion in Dissertations - ALL by an authorized administrator of SURFACE. For more information, please contact [email protected].
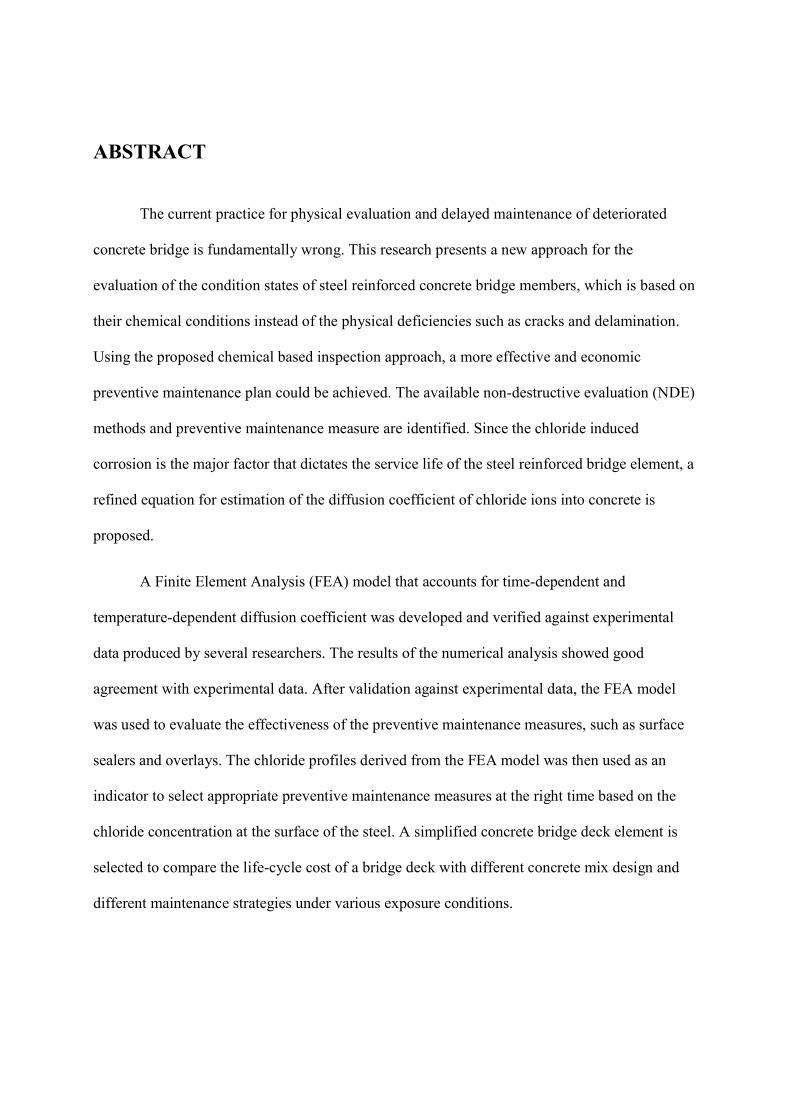
ABSTRACT
The current practice for physical evaluation and delayed maintenance of deteriorated
concrete bridge is fundamentally wrong. This research presents a new approach for the
evaluation of the condition states of steel reinforced concrete bridge members, which is based on
their chemical conditions instead of the physical deficiencies such as cracks and delamination.
Using the proposed chemical based inspection approach, a more effective and economic
preventive maintenance plan could be achieved. The available non-destructive evaluation (NDE)
methods and preventive maintenance measure are identified. Since the chloride induced
corrosion is the major factor that dictates the service life of the steel reinforced bridge element, a
refined equation for estimation of the diffusion coefficient of chloride ions into concrete is
proposed.
A Finite Element Analysis (FEA) model that accounts for time-dependent and
temperature-dependent diffusion coefficient was developed and verified against experimental
data produced by several researchers. The results of the numerical analysis showed good
agreement with experimental data. After validation against experimental data, the FEA model
was used to evaluate the effectiveness of the preventive maintenance measures, such as surface
sealers and overlays. The chloride profiles derived from the FEA model was then used as an
indicator to select appropriate preventive maintenance measures at the right time based on the
chloride concentration at the surface of the steel. A simplified concrete bridge deck element is
selected to compare the life-cycle cost of a bridge deck with different concrete mix design and
different maintenance strategies under various exposure conditions.

For cost-effective management of concrete highway bridges, the following measures
should be taken, depending on the exposure conditions:
1. For severe exposure conditions, such as coastal area or cold regions that require a
large amount of deicing salt, carbon steel reinforced bridge decks have a short service
life. Therefore, a well-planned preventive maintenance strategy needs to be
implemented in order to postpone or eliminate the needs of major rehabilitation and
replacement. In such case, the use of stainless steel could be the most economical
solution for the long run. In addition, the use of integrated overlay made of high
performance concrete or cathodic protection systems may reduce the life-cycle cost
based on a 75-year expected service life.
2. For moderate exposures, the use of overlays and surface sealers has been deemed
cost-effective. However, the life-cycle cost is very sensitive for sealer application
since it needs to be reapplied frequently. Thus, the effectiveness of the sealer should
be closely monitored by the Non-destructive Evaluation (NDE) methods.
3. For mild exposures, the corrosion may not be the most critical deterioration
mechanism for the bridge deck element. The riding surface of the bridge deck needs
to be replaced periodically due to other deterioration mechanisms such as erosion,
fatigue cracks, etc.
In conclusion, this research shows that it is not only economical, but also necessary to
allocate more funds to perform in-depth, chemical oriented non-destructive tests and active
preventive maintenance.
THE ECONOMY OF PREVENTIVE MAINTENANCE OF CONCRETE BRIDGES DUE TO CORROSION
by
Haotian Zhang
BS., Tianjin University, China, 2010 MS., Syracuse University, 2013
Dissertation
Submitted in partial fulfillment of the requirements for the degree of
Doctor of Philosophy in Civil Engineering.
Syracuse University
December 2016

© Copyright 2016 Haotian Zhang
All rights reserved

V
ACKNOWLEDGMENTS
I wish to express my truthful gratitude towards my advisor, Professor Riyad S. Aboutaha.
Prof. Aboutaha is the most knowledgeable, kind and sincere professor I have ever worked with.
He has walked me through all the stages of the research. His willingness to give me his time so
generously has been much appreciated. Without his consistent guidance, instructions, and
friendly encouragement, this dissertation would have never reached its present form.
My sincere thanks should also go to my dissertation committee members, Professors:
Utpal Roy, Eric M. Lui, Dawit Negussey, Hossein Ataei and Baris Salman.
I would also love to express my gratitude to my parents and my wife for all the support,
understanding, encouragement and love throughout this research.

VI
TABLE OF CONTENTS
ABSTRACT ...................................................................................... I
ACKNOWLEDGMENTS ............................................................... V
TABLE OF CONTENTS ............................................................... VI
LIST OF TABLES ........................................................................... X
LIST OF FIGURES ....................................................................... XI
1. INTRODUCTION ......................................................................... 1 1.1. Background .......................................................................................................1
1.2. Objectives ..........................................................................................................2
1.3. Research Plan ...................................................................................................2
1.4. Outline of the Dissertation ...............................................................................3
2. LITERATURE REVIEW ............................................................. 5 2.1. Introduction ......................................................................................................5
2.2. Current Inspection and Maintenance Practices ............................................6
Current Inspection Practices ............................................................................6
Current Maintenance Practices ......................................................................10
2.3. Deterioration of Steel Reinforced Concrete Members ................................13
Corrosion of Reinforcing Steel Bars in Concrete ..........................................14
Carbonation of Concrete ................................................................................15
Deterioration of Concrete Due to Freeze-and-thaw effect .............................16
Deterioration of Concrete Due to Alkali-silica Reaction ...............................16
Combined Effect of Different Deterioration Mechanisms .............................18
2.4. Chloride Diffusion ..........................................................................................19
Background Information ................................................................................19
Derivation of the Ion Diffusion Equation ......................................................20
Thresholds for Chloride Content ....................................................................21
Chloride Surface Concentration .....................................................................23
Chloride Diffusion Coefficient ......................................................................24
2.5. Summary .........................................................................................................25
3. CHLORIDE DIFFUSION VARIABLES ................................... 28
VII
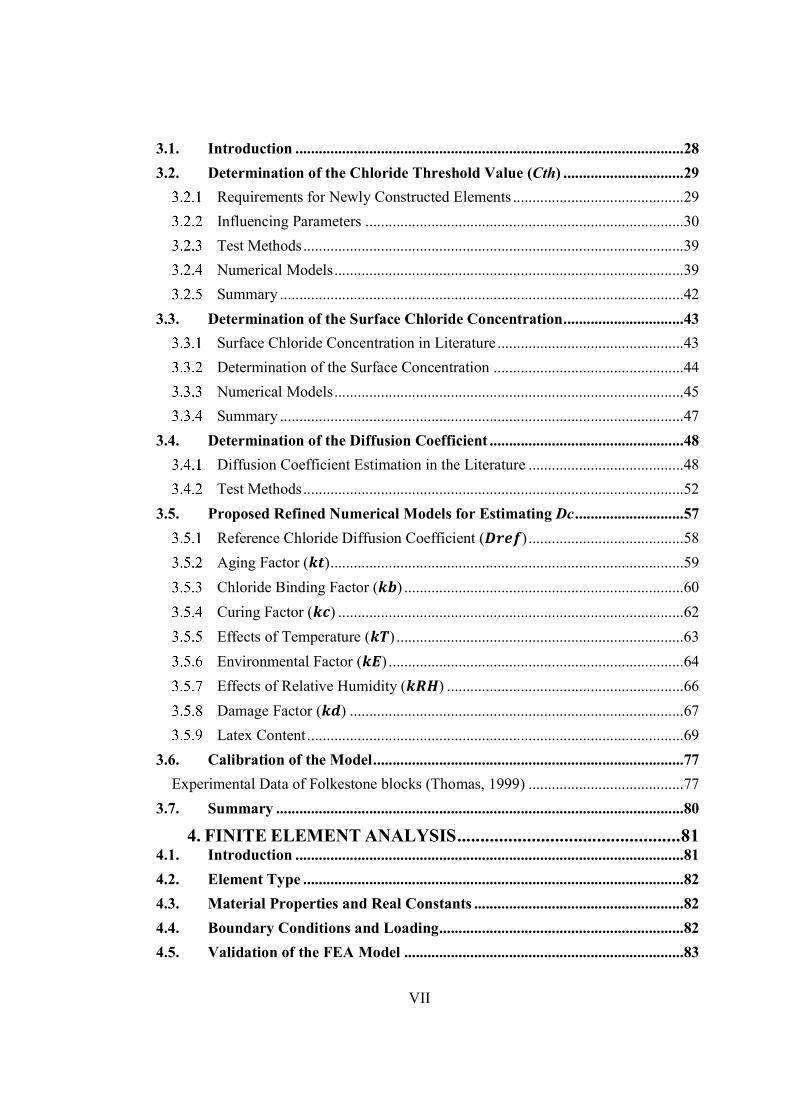
3.1. Introduction ....................................................................................................28
3.2. Determination of the Chloride Threshold Value (Cth) ...............................29
Requirements for Newly Constructed Elements ............................................29
Influencing Parameters ..................................................................................30
Test Methods ..................................................................................................39
Numerical Models ..........................................................................................39
Summary ........................................................................................................42
3.3. Determination of the Surface Chloride Concentration ...............................43
Surface Chloride Concentration in Literature ................................................43
Determination of the Surface Concentration .................................................44
Numerical Models ..........................................................................................45
Summary ........................................................................................................47
3.4. Determination of the Diffusion Coefficient ..................................................48
Diffusion Coefficient Estimation in the Literature ........................................48
Test Methods ..................................................................................................52
3.5. Proposed Refined Numerical Models for Estimating Dc ............................57
Reference Chloride Diffusion Coefficient ( ) ........................................58
Aging Factor ( ) ...........................................................................................59
Chloride Binding Factor ( ) ........................................................................60
Curing Factor ( ) .........................................................................................62
Effects of Temperature ( ) ..........................................................................63
Environmental Factor ( ) ............................................................................64
Effects of Relative Humidity ( ) .............................................................66
Damage Factor ( ) ......................................................................................67
Latex Content .................................................................................................69
3.6. Calibration of the Model ................................................................................77
Experimental Data of Folkestone blocks (Thomas, 1999) ........................................77
3.7. Summary .........................................................................................................80
4. FINITE ELEMENT ANALYSIS ................................................ 81 4.1. Introduction ....................................................................................................81
4.2. Element Type ..................................................................................................82
4.3. Material Properties and Real Constants ......................................................82
4.4. Boundary Conditions and Loading ...............................................................82
4.5. Validation of the FEA Model ........................................................................83
VIII
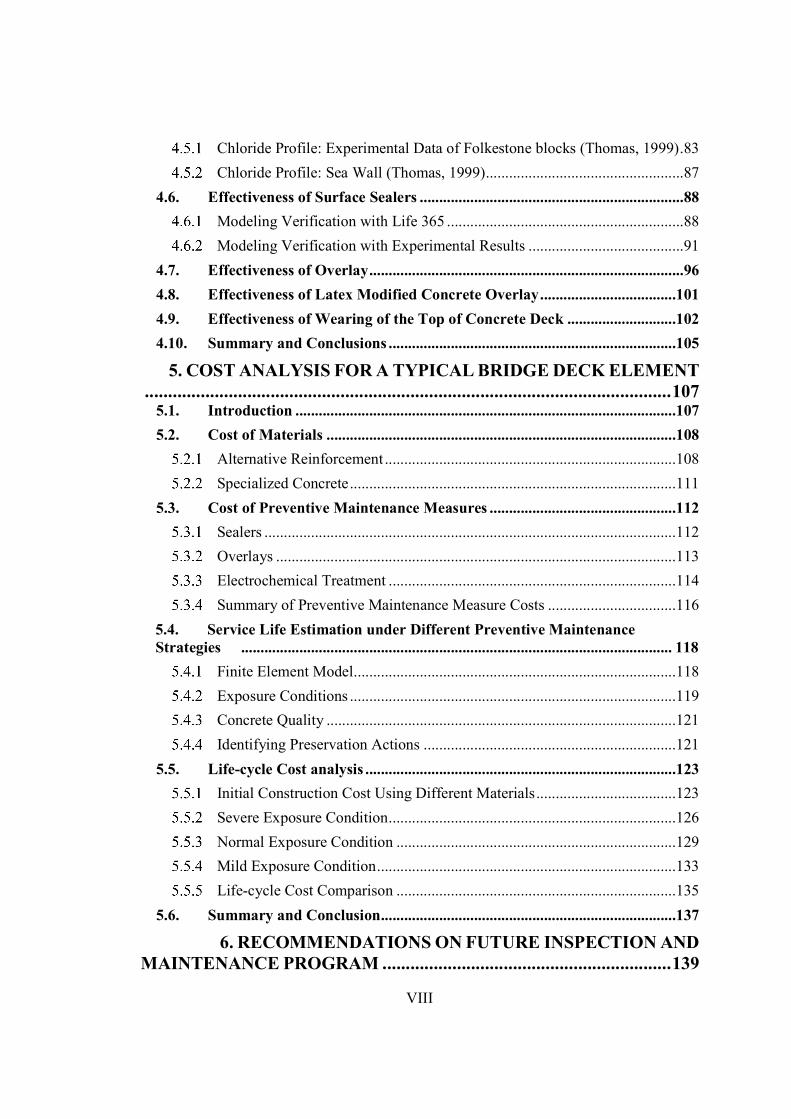
Chloride Profile: Experimental Data of Folkestone blocks (Thomas, 1999) .83
Chloride Profile: Sea Wall (Thomas, 1999) ...................................................87
4.6. Effectiveness of Surface Sealers ....................................................................88
Modeling Verification with Life 365 .............................................................88
Modeling Verification with Experimental Results ........................................91
4.7. Effectiveness of Overlay .................................................................................96
4.8. Effectiveness of Latex Modified Concrete Overlay ...................................101
4.9. Effectiveness of Wearing of the Top of Concrete Deck ............................102
4.10. Summary and Conclusions ..........................................................................105
5. COST ANALYSIS FOR A TYPICAL BRIDGE DECK ELEMENT ................................................................................................................. 107
5.1. Introduction ..................................................................................................107
5.2. Cost of Materials ..........................................................................................108
Alternative Reinforcement ...........................................................................108
Specialized Concrete ....................................................................................111
5.3. Cost of Preventive Maintenance Measures ................................................112
Sealers ..........................................................................................................112
Overlays .......................................................................................................113
Electrochemical Treatment ..........................................................................114
Summary of Preventive Maintenance Measure Costs .................................116
5.4. Service Life Estimation under Different Preventive Maintenance Strategies ............................................................................................................... 118
Finite Element Model ...................................................................................118
Exposure Conditions ....................................................................................119
Concrete Quality ..........................................................................................121
Identifying Preservation Actions .................................................................121
5.5. Life-cycle Cost analysis ................................................................................123
Initial Construction Cost Using Different Materials ....................................123
Severe Exposure Condition ..........................................................................126
Normal Exposure Condition ........................................................................129
Mild Exposure Condition .............................................................................133
Life-cycle Cost Comparison ........................................................................135
5.6. Summary and Conclusion ............................................................................137
6. RECOMMENDATIONS ON FUTURE INSPECTION AND
MAINTENANCE PROGRAM .............................................................. 139
IX
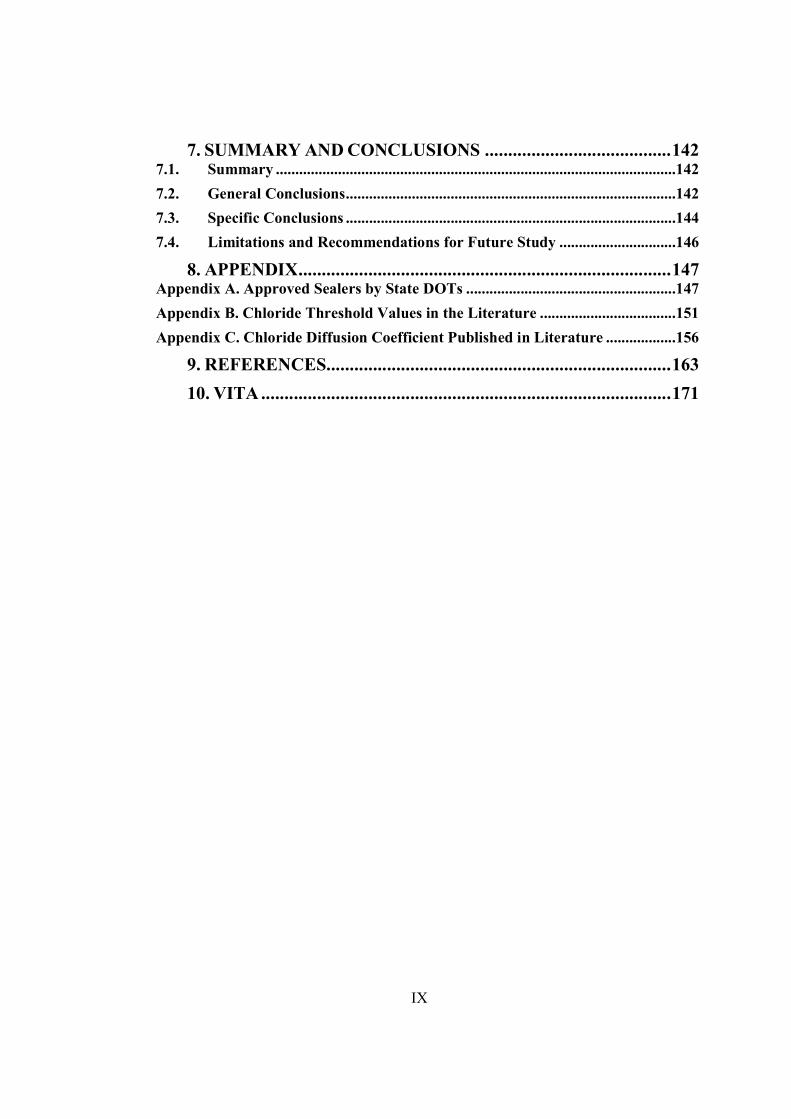
7. SUMMARY AND CONCLUSIONS ........................................ 142 7.1. Summary .......................................................................................................142
7.2. General Conclusions .....................................................................................142
7.3. Specific Conclusions .....................................................................................144
7.4. Limitations and Recommendations for Future Study ..............................146
8. APPENDIX ................................................................................ 147 Appendix A. Approved Sealers by State DOTs ......................................................147
Appendix B. Chloride Threshold Values in the Literature ...................................151
Appendix C. Chloride Diffusion Coefficient Published in Literature ..................156
9. REFERENCES .......................................................................... 163
10. VITA ........................................................................................ 171
X
LIST OF TABLES
Table 2-1 Condition State Definitions for Reinforced Concrete Deck (AASHTO, 2013) 7 Table 2-2 Typical types of Maintenance for Various Concrete Bridge Elements ............ 11 Table 2-3 Mean Diffusion Constants for Various States (Ward-Waller, 2004) ............... 25 Table 3-1 Chloride Limits for New construction (ACI 318-14, 2014) ............................. 30 Table 3-2 The constant , for the road environment (Frederiksen, 1997) ............ 40 Table 3-3 The constant , for the marine environment (Frederiksen, 1997) ........ 40 Table 3-4 The activity factors for corrosion initiation in the road environment to be used
when calculating the ( ) (Frederiksen, 1997) ................................................................ 40 Table 3-5 Suggested design chloride threshold level (Frederiksen, 1997) ....................... 41 Table 3-6 Curing Factor for Different Curing Time ......................................................... 62 Table 3-7 U/R for different water cement ratios for OPC and concrete with Fly Ash (So,
2014) ............................................................................................................................................. 63 Table 3-8 Environmental Factor Range (Wang, 2008) ..................................................... 65 Table 3-9 Value of 1 (Duracrete, 2000) ....................................................................... 65 Table 3-10 Value of 1 (Duracrete, 2000) ..................................................................... 65 Table 3-11 Effects of Relative Humidity .......................................................................... 66 Table 3-12 Concrete Mix Table of Different water-cement ratio, latex content (Won,
2008) ............................................................................................................................................. 69 Table 3-13 Average Diffusion Coefficient of Different Concrete Mix (Won, 2008) ....... 70 Table 3-14 Comparison of Predicated Diffusion Coefficient of HPC with Latex and SF 74 Table 3-15 Details of concrete mix (Thomas, 1999) ........................................................ 77 Table 4-1 Concrete Mix and estimated Reference Diffusion Coefficient ........................ 99 Table 4-2 Field Data from Virginia Pilot Bridge .............................................................. 99 Table 5-1 Rating Value for Different Types of Reinforcement (SHRP2, 2014) ............ 108 Table 5-2 Unit Cost of Different Types of Reinforcement ............................................. 111 Table 5-3 Rehabilitation Method Summaries (Krauss, 2009) ........................................ 113 Table 5-4 Cost for CP and ECE Application (Clemeña, 2000) ...................................... 115 Table 5-5 Equivalent Annual Costs for Anode System Per Unit Area ........................... 115 Table 5-6 Cost Estimation for Preservation Actions (NCHRP 14-23, 2014) ................. 116 Table 5-7 Estimated Cost for Preservation Actions ........................................................ 117 Table 5-8 Average Monthly Temperature for NY, VA, NC ........................................... 120 Table 5-9 Assumed Cost for Each Activity .................................................................... 122 Table 5-10 Construction Cost ......................................................................................... 124 Table 5-11 Service Life of Concrete Bridge Decks with Different Reinforcement ....... 125 Table 5-12 Overlay Schedule for Severe Exposure ........................................................ 128 Table 5-13 Overlay Schedule for Normal Exposure and w/c=0.45 ................................ 129 Table 5-14 Overlay Schedule for Normal Exposure and w/c=0.35 ................................ 131 Table 5-15 Overlay and Sealing Schedule for Normal Exposure and w/c=0.35 ............ 131 Table 5-16 Overlay Schedule for Normal Exposure and Good Quality Concrete ......... 132 Table 5-17 Overlay and Sealing Schedule for Normal Exposure and Good Quality
Concrete ...................................................................................................................................... 133 Table 5-18 Life Cycle Cost Comparison ........................................................................ 137
XI
LIST OF FIGURES
Figure 2-1 Chain drag and hammer testing (SHRP2, 2015) ............................................... 8 Figure 2-2 Qualitative cost of maintenance versus type of maintenance method ............ 10 Figure 2-3 Corrosion cell in reinforced concrete member (Hime & Erlin, 1987) ............ 14 Figure 2-4 Simplifies deterioration mechanism, (Aboutaha, 2004) ................................. 18 Figure 2-5 Definition of Chloride Threshold Value (Angst, 2009) .................................. 21 Figure 2-6 Skin Effect of the Concrete (Ann, 2009) ........................................................ 24 Figure 3-1 Chloride threshold as function of interfacial voids (Ann, 2007) .................... 31 Figure 3-2 Probability of Corrosion vs. −/ −ratio (Angst, 2009) ......................... 32 Figure 3-3 Steel potential versus chloride content in concrete (Bertolini, 2009) ............. 33 Figure 3-4 Chloride threshold value for Carbon steel and Stainless Steel (Hurley, 2008)34 Figure 3-5 Chloride Threshold Values for Different Binder Type (Poulsen, 2012) ......... 35 Figure 3-6 Relative humidity Vs. Chloride Threshold Value (Frederiksen, 2002) .......... 36 Figure 3-7 Water-cement Ratio vs. Chloride threshold Value (Poulsen, 2012) ............... 37 Figure 3-8 Polarization resistance of a) as-received rebar samples b) polished rebar
samples (Ghods, 2009).................................................................................................................. 38 Figure 3-9 Relation between free and bound chloride in OPC (Tang, 1996) ................... 42 Figure 3-10 Exposure tab from Life-365 (Life-365, 2014) .............................................. 47 Figure 3-11 Time of moist curing Vs. Chloride Ion Permeability (Suprenant, 1991) ...... 51 Figure 3-12 Tang and Nilsson migration cell (Stanish, 1997) .......................................... 55 Figure 3-13 Bulk Diffusion Test (Stanish, 1997) ............................................................. 56 Figure 3-14 Chloride Binding Factor ................................................................................ 62 Figure 3-15 Diffusion Coefficient Ratio Vs. Latex Cement Ratio (Won, 2008) .............. 70 Figure 3-16 Diffusion Coefficient Ratio Vs. Latex Cement Ratio (Yang, 2009) ............. 71 Figure 3-17 Diffusion Coefficient Ratio Vs. Latex Cement Ratio ................................... 72 Figure 3-18 Effect of Silica Fume on Dc (Bentz, 2014) ................................................... 73 Figure 3-19 Effective Diffusion Coefficient for Concrete with Latex and SF (Gao, 2002)
....................................................................................................................................................... 74 Figure 3-20 Prediction of Reference Diffusion Coefficient of LMC with 0% Silica Fume
....................................................................................................................................................... 75 Figure 3-21 Prediction of Reference Diffusion Coefficient of LMC with 5% Silica Fume
....................................................................................................................................................... 76 Figure 3-22 Prediction of Reference Diffusion Coefficient of LMC with 10% Silica Fume
....................................................................................................................................................... 76 Figure 3-23 Predicted and Reported Chloride Diffusion Coefficient OPC ...................... 78 Figure 3-24 Predicted and Reported Chloride Diffusion Coefficient HPC with Fly Ash 79 Figure 3-25 Predicted and Reported Chloride Diffusion Coefficient for High Performance
Concrete with Slag ........................................................................................................................ 79 Figure 4-1 Sketch of the Bridge Deck Section ................................................................. 84 Figure 4-2 Comparison of the Simulated and measured chloride Profile for OPC .......... 85 Figure 4-3 Comparison of the Simulated and measured chloride Profile for HPC with FA
....................................................................................................................................................... 85 Figure 4-4 Comparison of the Simulated and measured chloride Profile for HPC with
Slag ............................................................................................................................................... 86
XII
Figure 4-5 Chloride Profile of Sea Wall after 30 years of Exposure ................................ 87 Figure 4-6 Model Sketch .................................................................................................. 88 Figure 4-7 Surface Concentration with time ..................................................................... 89 Figure 4-8 Chloride Concentration at Depth=6.4 cm ....................................................... 90 Figure 4-9 Chloride Concentration at the depth of Steel .................................................. 91 Figure 4-10 Average Monthly Temperature of Bandar Abbas ......................................... 92 Figure 4-11 Estimated Diffusion Coefficient ................................................................... 93 Figure 4-12 Model Sketch ................................................................................................ 93 Figure 4-13 Surface Concentration ................................................................................... 94 Figure 4-14 Chloride Concentration after 5 years of Exposure ........................................ 95 Figure 4-15 Chloride Profile after 5 years of exposure with AA ..................................... 95 Figure 4-16 Chloride Profile after 5 years of exposure with PU ...................................... 96 Figure 4-17 Chloride Concentration at Year 29 In Bridge Deck ...................................... 98 Figure 4-18 Chloride Profile of OPC with w/c=0.5 after 10 years of Treatment ........... 100 Figure 4-19 Chloride Profile of HPC with w/c=0.4 and 7% Silica Fume after 10 years of
Treatment .................................................................................................................................... 100 Figure 4-20 Chloride Profile of HPC with w/c=0.4 and 5% Silica Fume and 35% Slag
after 10 years of Treatment ......................................................................................................... 101 Figure 4-21 Chloride Profile of HPC with w/c=0.25 and 15% Fly Ash and 13% Silica
Fume after 10 years of Treatment ............................................................................................... 101 Figure 4-22 Chloride Profile of 15% Latex Modified Concrete after 10 years of
Treatment .................................................................................................................................... 102 Figure 4-23 Moving Boundary Conditions to represent Erosion.................................... 103 Figure 4-24 Comparison of Chloride Profile of FEM with or without Considering
Wearing ....................................................................................................................................... 104 Figure 4-25 Chloride Profile of the original bridge deck at 29 years ............................. 104 Figure 4-26 Chloride Profile after 10 years of treatment with 15% Latex Modified
Concrete ...................................................................................................................................... 105 Figure 5-1 Sketch of the Finite Element Model.............................................................. 119 Figure 5-2 Surface Chloride Concentration for Different Exposure Condition ............. 120 Figure 5-3 Chloride Concentration @ Steel Surface ...................................................... 127 Figure 5-4 Chloride Concentration @ Steel Surface with Different Quality Concrete .. 128 Figure 5-5 Chloride Concentration @ Steel Surface ...................................................... 129 Figure 5-6 Chloride Concentration @ Steel Surface ...................................................... 130 Figure 5-7 Chloride Concentration for Different Maintenance Strategy ........................ 131 Figure 5-8 Chloride Concentration for Different Maintenance Strategy ........................ 132 Figure 5-9 Chloride Concentration @ Steel Surface ...................................................... 133 Figure 5-10 Chloride Concentration for Different Maintenance Strategies ................... 134 Figure 5-11 Deterioration Curve for Bare Concrete Bridge Deck (Johnston, 2014) ...... 136 Figure 6-1 Flowchart for Chemical NDT Based Inspection and Preventive Maintenance
Strategies ..................................................................................................................................... 141
1
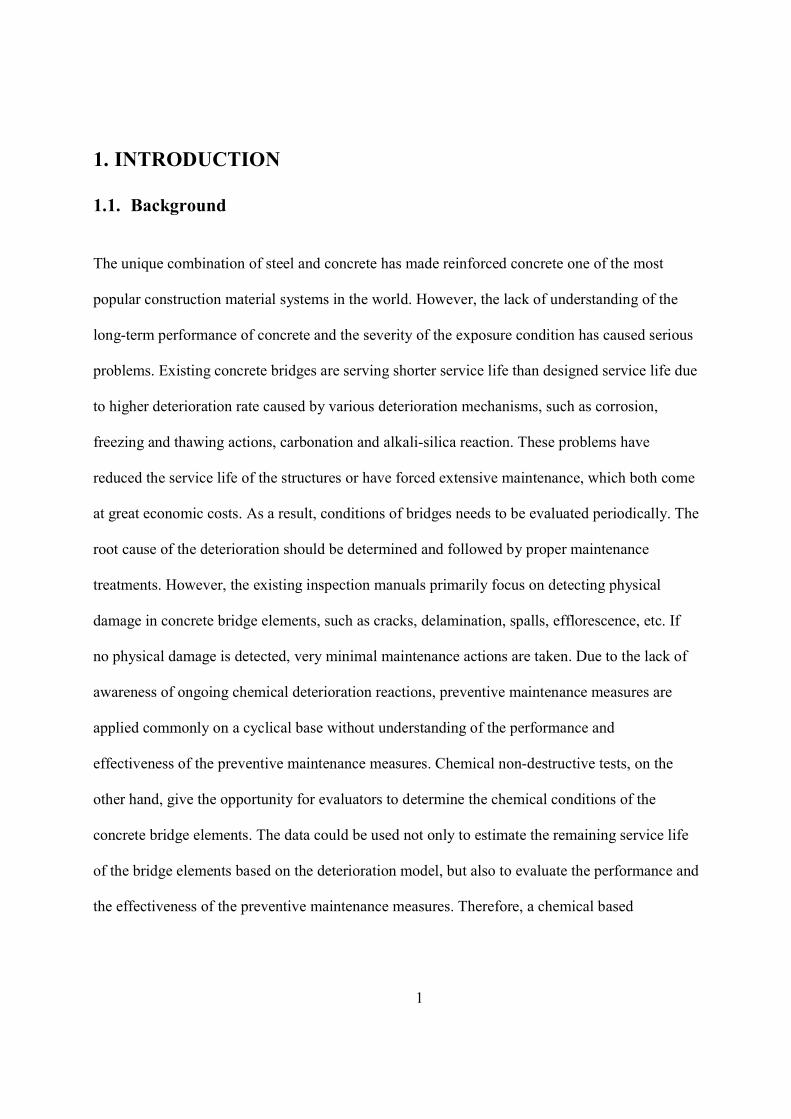
1. INTRODUCTION
1.1. Background
The unique combination of steel and concrete has made reinforced concrete one of the most
popular construction material systems in the world. However, the lack of understanding of the
long-term performance of concrete and the severity of the exposure condition has caused serious
problems. Existing concrete bridges are serving shorter service life than designed service life due
to higher deterioration rate caused by various deterioration mechanisms, such as corrosion,
freezing and thawing actions, carbonation and alkali-silica reaction. These problems have
reduced the service life of the structures or have forced extensive maintenance, which both come
at great economic costs. As a result, conditions of bridges needs to be evaluated periodically. The
root cause of the deterioration should be determined and followed by proper maintenance
treatments. However, the existing inspection manuals primarily focus on detecting physical
damage in concrete bridge elements, such as cracks, delamination, spalls, efflorescence, etc. If
no physical damage is detected, very minimal maintenance actions are taken. Due to the lack of
awareness of ongoing chemical deterioration reactions, preventive maintenance measures are
applied commonly on a cyclical base without understanding of the performance and
effectiveness of the preventive maintenance measures. Chemical non-destructive tests, on the
other hand, give the opportunity for evaluators to determine the chemical conditions of the
concrete bridge elements. The data could be used not only to estimate the remaining service life
of the bridge elements based on the deterioration model, but also to evaluate the performance and
the effectiveness of the preventive maintenance measures. Therefore, a chemical based
2
inspection method should be incorporated into the current inspection manuals for routine
inspection.
1.2. Objectives
The primary objective of this study is to demonstrate the economy of preventive
maintenance that is based on the chemical condition assessment of concrete bridges. This study
involves investigations for better understanding of the deterioration of concrete bridges under
combined effects of harmful compounds and environmental exposure, and to develop a new
mathematical model for corrosion initiation estimation. The proposed model is validated
comparing the published experimental/field data and further calibrated using finite element
analysis. The new developed model will be used in the life cycle cost analysis to optimize the
preventive maintenance activities, which would result in better inspection and preventive
maintenance scheduling for concrete bridges in the U.S.
1.3. Research Plan
The main tasks of this research is shown as follows:
1. Review of literature on effect of different concrete deterioration mechanisms,
especially chloride induced corrosion;
2. Review of the numerical models for expression of chloride concentration threshold
(Cth), chloride diffusion coefficient (Dc) and the surface concentration of chloride
(Cs);
3. Propose a refined model to estimate those factors by linking parameters that represent
the durability of the concrete, such as moisture content, permeability, porosity,
3
cracks, binder capacity, binder type, compressive strength, density, presence of the
cracks, freeze-thaw effect;
4. Perform finite element analysis (FEA) for chloride diffusion process to analyze the
impact of different factors. Rule out the factors that not have a significant impact on
the Cth, Dc, Cs;
5. Perform cost analysis for preventive maintenance measures. The unit cost, service life
and the effectiveness will be analyzed.
6. For different exposure conditions, conduct life cycle analyses for a typical bridge
deck element under current maintenance practices as well as the proposed preventive
maintenance measures.
7. Develop a guideline for inspection and preventive maintenance based on the
numerical threshold values for chemical compounds obtained from NDT tests.
1.4. Outline of the Dissertation
Chapter 1 presents an introduction to the research. The background of the research,
objectives and the scope of the dissertation is illustrated.
Chapter 2 provides a brief overview of the current inspection and maintenance practice
and an introduction on deterioration mechanisms for reinforced concrete bridge members. In
addition, it provides a more detailed literature review on deterioration caused by chloride
induced corrosion.

4
Chapter 3 presents the development of the refined analytical model for predicting
chloride diffusion coefficients. The experimental data that were obtained by other researchers are
used to validate the model.
In Chapter 4, finite element analysis is performed to analyze the impact of different
variables: material properties, exposure conditions, and the application of preventive
maintenance activities. Also the effectiveness of preventive maintenance measures such as
overlays and surface sealers are evaluated. The simulated chloride profiles are also compared
with the experimental data in order to validate the model.
Chapter 5 discusses the cost analysis of a typical concrete bridge deck element under
different maintenance strategies while facing different exposure conditions over a 75-year
expected service life.
Chapter 6 provides brief recommendations on future inspection and maintenance
programs. A chemical based NDE inspection method is proposed to better evaluate the chemical
conditions of the concrete bridge elements. Using this approach, more economical maintenance
strategies involving active preventive maintenance could be achieved for a longer service life
and a lower life-cycle cost.
Chapter 7 presents the summary and conclusion, as well as recommendations for future
studies.
5
2. LITERATURE REVIEW
2.1. Introduction
A cost-effective bridge is a bridge whose maintenance is based on its chemical condition
over its entire service life. If deterioration mechanisms are prevented, a bridge would cost
considerably less to maintain and it would safely serve its full design service life, if not longer.
The practice of physical evaluation and delayed maintenance of deteriorated concrete bridges has
resulted in large number of bridges in need of repair. The current inspection manuals are
primarily focused on detecting physical damage in concrete bridge elements. If no physical
damage is detected, very minimal maintenance actions are taken. This is the main reason why the
number of US bridges that are classified as structurally deficient is on the rise. Given the need
for future expansion of the US transportation network and increase in number of new bridges,
there is a need for cost-effective maintenance process that prevents deterioration mechanism
from start, or at least stops it at a very early stage.
The most economical approach to maintain existing concrete bridges is by adopting an
active preventive maintenance approach. An in-depth investigation of the combined deterioration
effects of various deterioration mechanisms is needed to establish sound thresholds for harmful
chemicals in concrete bridge elements. Such established thresholds are critical for cost-effective
maintenance decision making, in a timely fashion, before any deterioration starts.

6
2.2. Current Inspection and Maintenance Practices
Current Inspection Practices
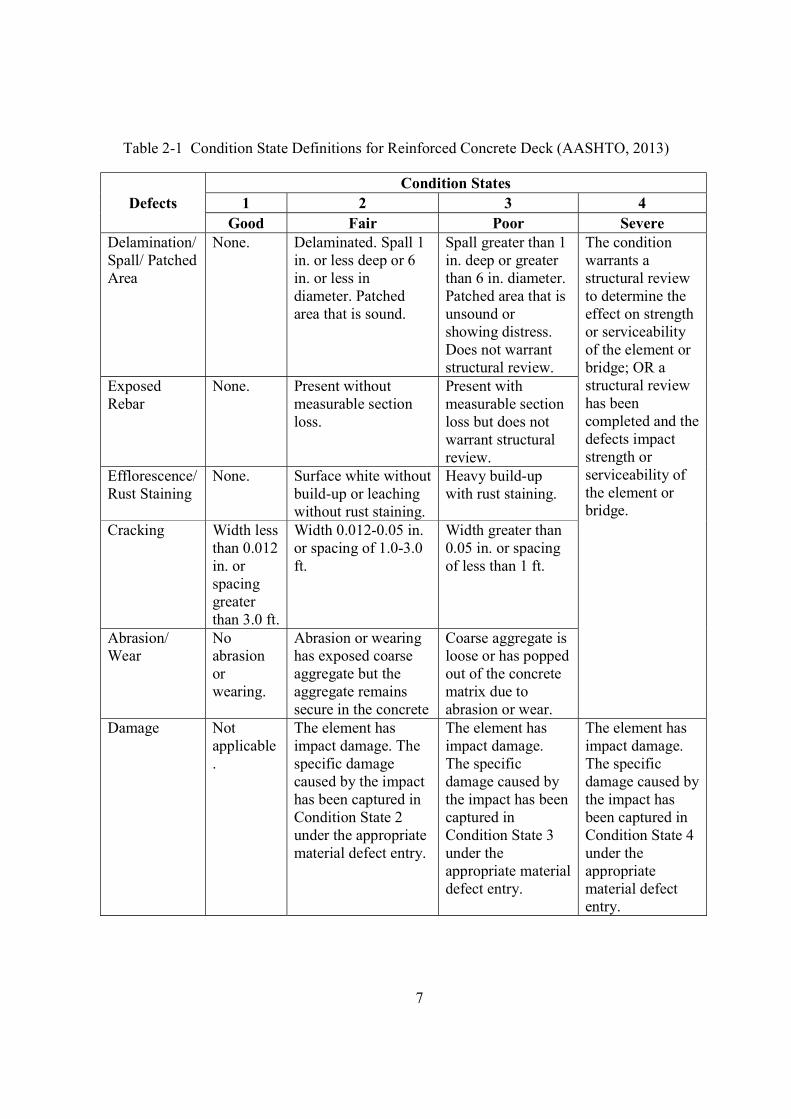
The manual for bridge element inspection (AASHTO, 2013) illustrates the condition
assessment philosophy as multipath and defect concepts. The condition of the elements is
described by using multipath distress language within the defined condition state. The multipath
distress language provides the means to fully incorporate all possible defects within the overall
condition assessment of the element. The overall condition of an element can be utilized in an
aggregate form, or broken down into specific defects present as desired by the agency for bridge
maintenance system use. There are four condition states represented by 1 to 4 scale where the
element state is good, fair, poor or severe respectively. The condition is evaluated by the defects
on the element, which are generally delamination, spall, cracks and exposed rebar for concrete
components. An example of the condition description for a typical reinforced concrete deck
element is shown in Table 2-1.
It can be seen that the current condition rating system mostly depends on the physical
defects, such as cracks, scaling, spalling, delamination, exposed rebar, which can only reflect the
condition of the concrete bridge element after it experienced a certain degree of deterioration.
Although, this condition rating system gives straightforward condition assessment for the
concrete bridge structures, it does not reveal the ongoing chemical reactions within the
components. Therefore, it is hard for the inspectors to determine the actual chemical condition of
the concrete and it is also difficult for the inspectors to predict the future deterioration if the
element is still in a good or fair condition.
7
Table 2-1 Condition State Definitions for Reinforced Concrete Deck (AASHTO, 2013)
Defects Condition States
1 2 3 4 Good Fair Poor Severe
Delamination/ Spall/ Patched Area
None. Delaminated. Spall 1 in. or less deep or 6 in. or less in diameter. Patched area that is sound.
Spall greater than 1 in. deep or greater than 6 in. diameter. Patched area that is unsound or showing distress. Does not warrant structural review.
The condition warrants a structural review to determine the effect on strength or serviceability of the element or bridge; OR a structural review has been completed and the defects impact strength or serviceability of the element or bridge.
Exposed Rebar
None. Present without measurable section loss.
Present with measurable section loss but does not warrant structural review.
Efflorescence/ Rust Staining
None. Surface white without build-up or leaching without rust staining.
Heavy build-up with rust staining.
Cracking Width less than 0.012 in. or spacing greater than 3.0 ft.
Width 0.012-0.05 in. or spacing of 1.0-3.0 ft.
Width greater than 0.05 in. or spacing of less than 1 ft.
Abrasion/ Wear
No abrasion or wearing.
Abrasion or wearing has exposed coarse aggregate but the aggregate remains secure in the concrete
Coarse aggregate is loose or has popped out of the concrete matrix due to abrasion or wear.
Damage Not applicable.
The element has impact damage. The specific damage caused by the impact has been captured in Condition State 2 under the appropriate material defect entry.
The element has impact damage. The specific damage caused by the impact has been captured in Condition State 3 under the appropriate material defect entry.
The element has impact damage. The specific damage caused by the impact has been captured in Condition State 4 under the appropriate material defect entry.
8
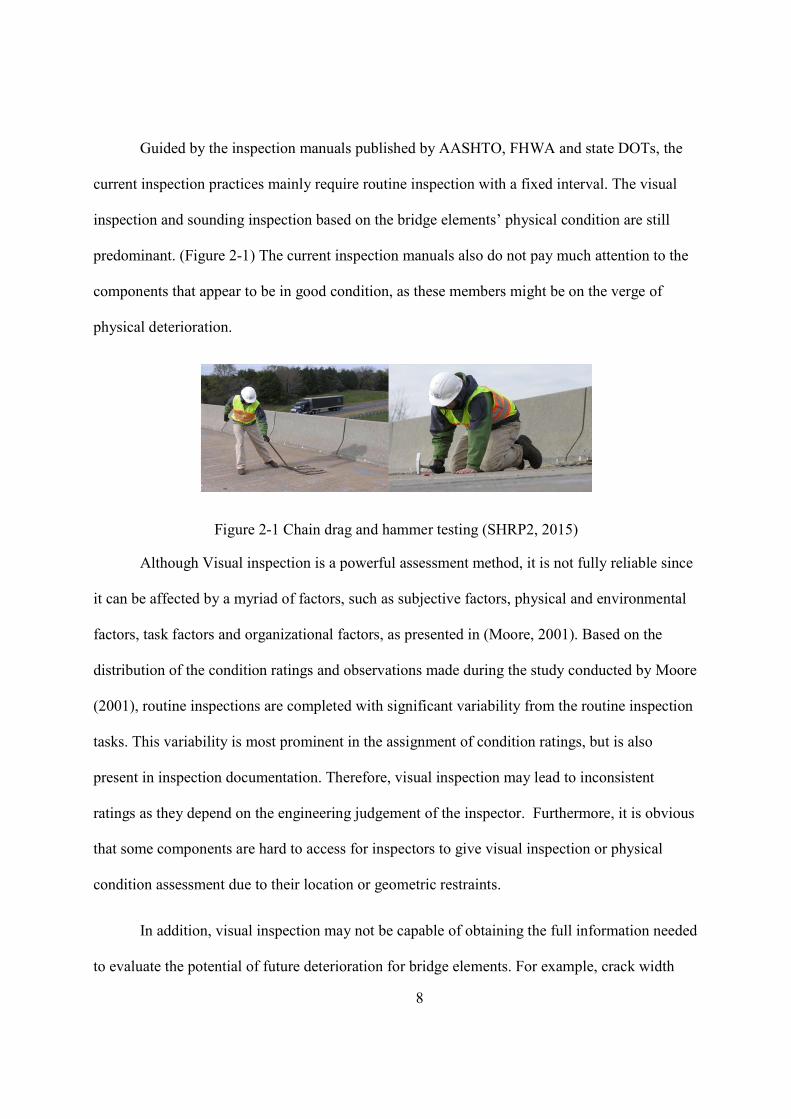
Guided by the inspection manuals published by AASHTO, FHWA and state DOTs, the
current inspection practices mainly require routine inspection with a fixed interval. The visual
inspection and sounding inspection based on the bridge elements’ physical condition are still
predominant. (Figure 2-1) The current inspection manuals also do not pay much attention to the
components that appear to be in good condition, as these members might be on the verge of
physical deterioration.
Figure 2-1 Chain drag and hammer testing (SHRP2, 2015)
Although Visual inspection is a powerful assessment method, it is not fully reliable since
it can be affected by a myriad of factors, such as subjective factors, physical and environmental
factors, task factors and organizational factors, as presented in (Moore, 2001). Based on the
distribution of the condition ratings and observations made during the study conducted by Moore
(2001), routine inspections are completed with significant variability from the routine inspection
tasks. This variability is most prominent in the assignment of condition ratings, but is also
present in inspection documentation. Therefore, visual inspection may lead to inconsistent
ratings as they depend on the engineering judgement of the inspector. Furthermore, it is obvious
that some components are hard to access for inspectors to give visual inspection or physical
condition assessment due to their location or geometric restraints.
In addition, visual inspection may not be capable of obtaining the full information needed
to evaluate the potential of future deterioration for bridge elements. For example, crack width

9
and depth are two essential parameters used to estimate chloride penetration into the concrete.
Unlike crack width, the crack depth is often not recorded by the inspectors since it is hard to
determine the actual crack depth by visual inspection alone. However, the crack depth, in some
cases, dictates the remaining service life of the element since the external contamination can
reach the surface of the reinforcing steel directly if the crack is deep enough. In this case, a non-
destructive test such as Surface Wave Transmission can be selected to complement the visual
inspection.
Despite the fact that advanced inspection methods are widely adopted by states DOTs in
their bridge inspection practices, these methods are only recommended and granted under
restricted circumstances:
1. Alternative methods to get inspection done while it is hard to get access for routine
inspection including visual and conventional physical inspection methods.
2. Complimentary methods to get accurate condition assessment while routine
inspection cannot give conclusion about the deterioration condition about area,
severity and progressing status.
3. Helping to make decisions regarding major rehabilitation, repair or replacement of
deteriorated bridge components.
However, the NDT methods should not be limited as a complementary method or a
decision making tool for major rehabilitation works, although they performed well on those
tasks. The NDT tests are capable of giving the inspector full range of parameters that describes
the reinforced concrete, such as the compressive strength, porosity, permeability, density, elastic
modulus, diffusion coefficient, chloride concentration, carbonation depth, etc. By adopting these
parameters, a scientific deterioration model could be derived. The model could be used to predict
10
the future deterioration level for a bridge if enough data are collected. Therefore, the advanced
NDT methods, including Chemical NDTs, should not be limited as in-depth inspection methods.
It needs to be regulated into the routine inspection process in order to achieve a more cost-
effective bridge life-cycle management strategy.
Current Maintenance Practices
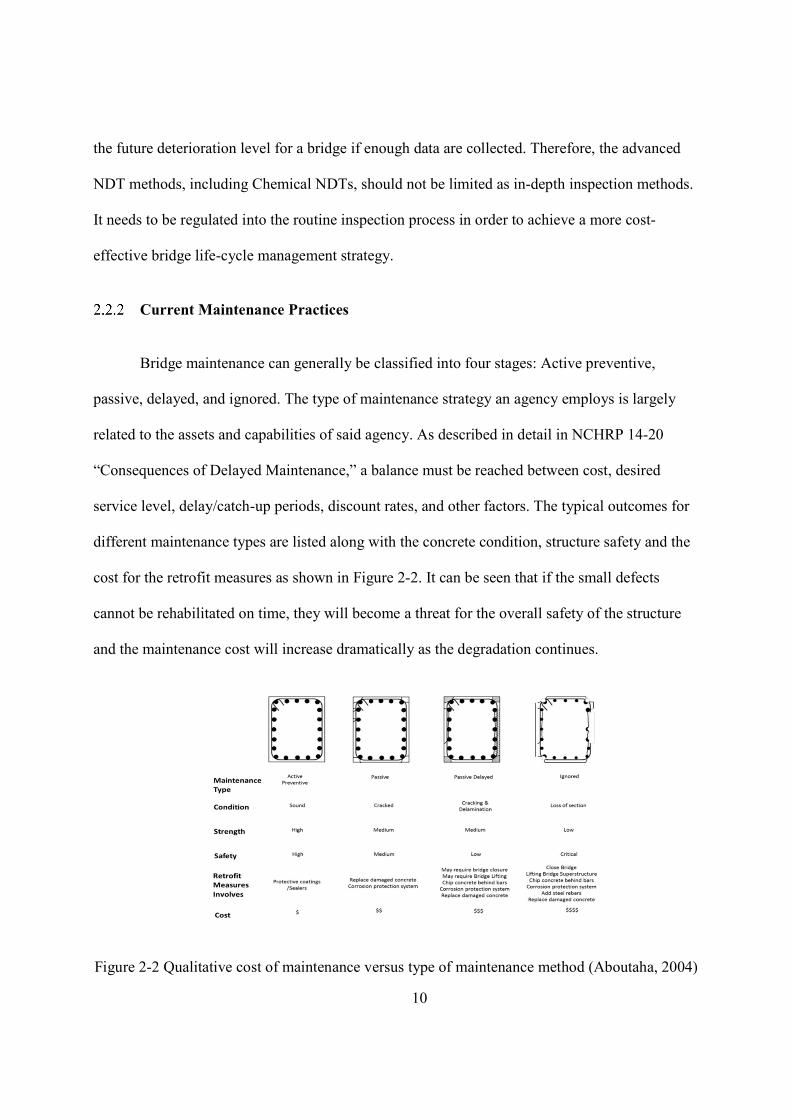
Bridge maintenance can generally be classified into four stages: Active preventive,
passive, delayed, and ignored. The type of maintenance strategy an agency employs is largely
related to the assets and capabilities of said agency. As described in detail in NCHRP 14-20
“Consequences of Delayed Maintenance,” a balance must be reached between cost, desired
service level, delay/catch-up periods, discount rates, and other factors. The typical outcomes for
different maintenance types are listed along with the concrete condition, structure safety and the
cost for the retrofit measures as shown in Figure 2-2. It can be seen that if the small defects
cannot be rehabilitated on time, they will become a threat for the overall safety of the structure
and the maintenance cost will increase dramatically as the degradation continues.
Figure 2-2 Qualitative cost of maintenance versus type of maintenance method (Aboutaha, 2004)
11
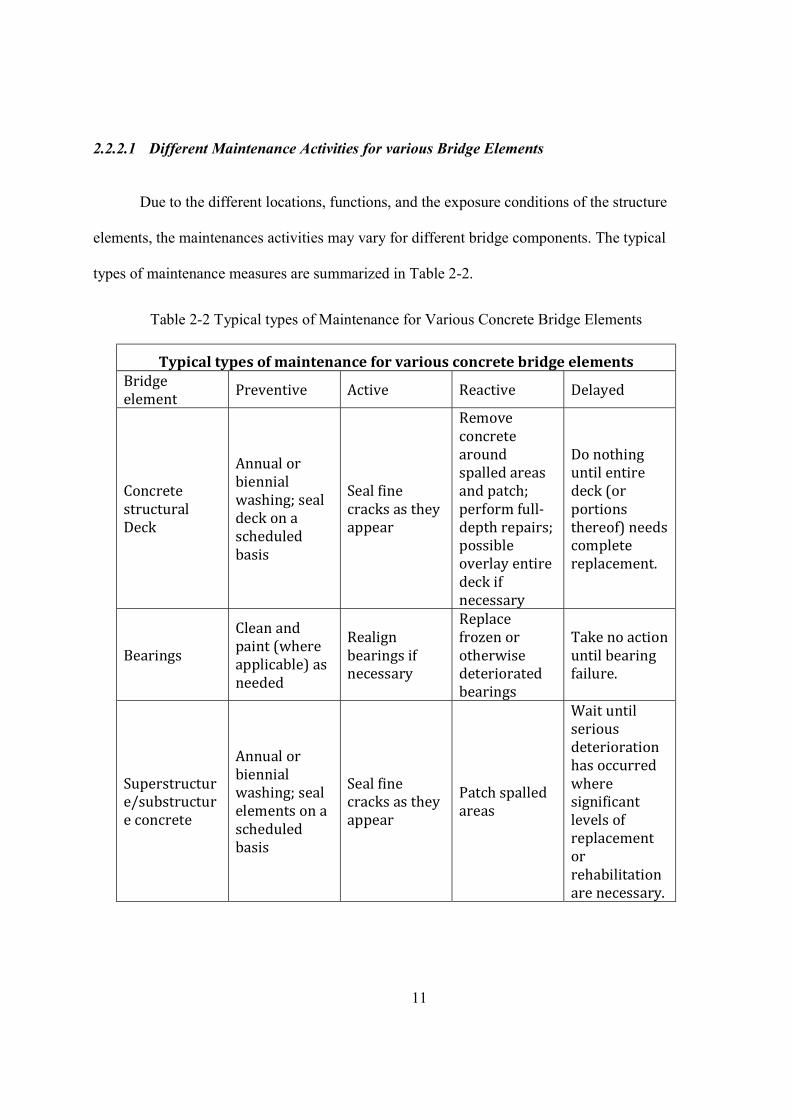
2.2.2.1 Different Maintenance Activities for various Bridge Elements
Due to the different locations, functions, and the exposure conditions of the structure
elements, the maintenances activities may vary for different bridge components. The typical
types of maintenance measures are summarized in Table 2-2.
Table 2-2 Typical types of Maintenance for Various Concrete Bridge Elements
Typical types of maintenance for various concrete bridge elements Bridge element
Preventive Active Reactive Delayed
Concrete structural Deck
Annual or biennial washing; seal deck on a scheduled basis
Seal fine cracks as they appear
Remove concrete around spalled areas and patch; perform full-depth repairs; possible overlay entire deck if necessary
Do nothing until entire deck (or portions thereof) needs complete replacement.
Bearings
Clean and paint (where applicable) as needed
Realign bearings if necessary
Replace frozen or otherwise deteriorated bearings
Take no action until bearing failure.
Superstructure/substructure concrete
Annual or biennial washing; seal elements on a scheduled basis
Seal fine cracks as they appear
Patch spalled areas
Wait until serious deterioration has occurred where significant levels of replacement or rehabilitation are necessary.
12
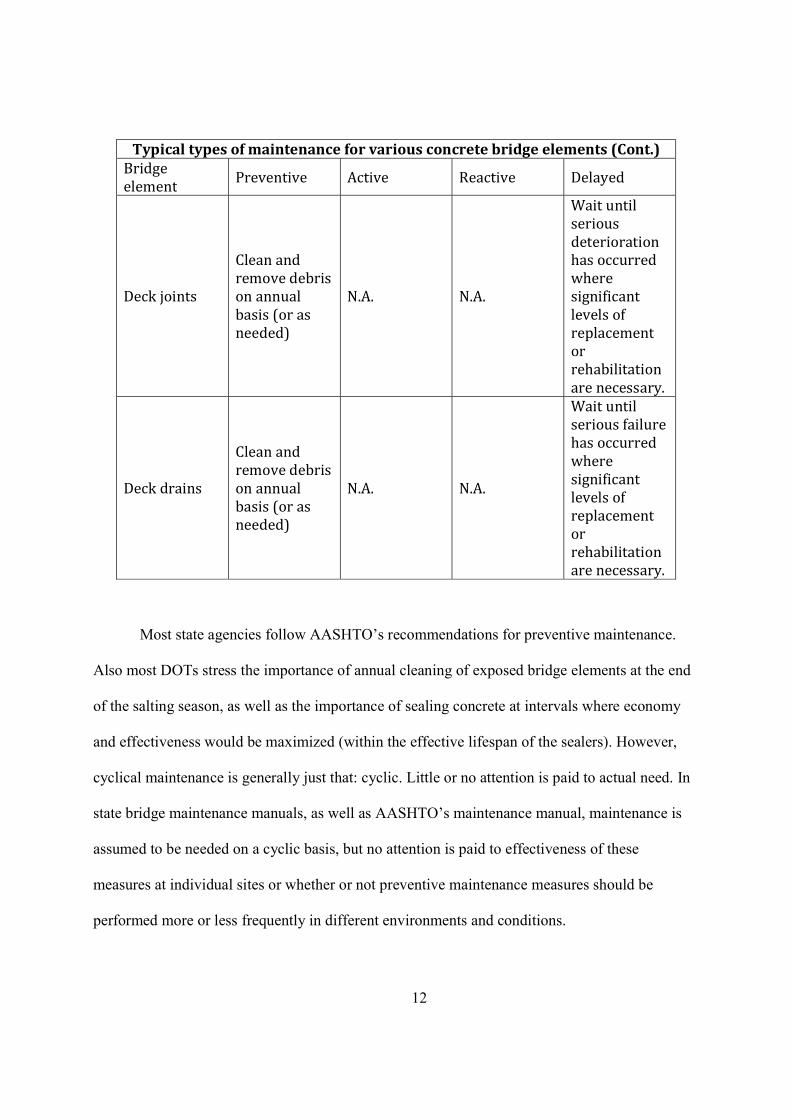
Typical types of maintenance for various concrete bridge elements (Cont.) Bridge element Preventive Active Reactive Delayed
Deck joints
Clean and remove debris on annual basis (or as needed)
N.A. N.A.
Wait until serious deterioration has occurred where significant levels of replacement or rehabilitation are necessary.
Deck drains
Clean and remove debris on annual basis (or as needed)
N.A. N.A.
Wait until serious failure has occurred where significant levels of replacement or rehabilitation are necessary.
Most state agencies follow AASHTO’s recommendations for preventive maintenance.
Also most DOTs stress the importance of annual cleaning of exposed bridge elements at the end
of the salting season, as well as the importance of sealing concrete at intervals where economy
and effectiveness would be maximized (within the effective lifespan of the sealers). However,
cyclical maintenance is generally just that: cyclic. Little or no attention is paid to actual need. In
state bridge maintenance manuals, as well as AASHTO’s maintenance manual, maintenance is
assumed to be needed on a cyclic basis, but no attention is paid to effectiveness of these
measures at individual sites or whether or not preventive maintenance measures should be
performed more or less frequently in different environments and conditions.
13
On the other hand, preventive maintenance actions need to be applied based on the actual
chemical condition of the elements. It needs not only the advanced inspection techniques or
structure monitoring systems to detect the potential threats to the concrete bridge, but also an
innovative mathematical model to anticipate the deterioration states of the structure that accounts
for different variables.
2.3. Deterioration of Steel Reinforced Concrete Members
The unique combination of steel and concrete has made reinforced concrete one of the
most popular construction materials in the world. However, the lack of understanding of the
long-term performance of concrete and the severity of environmental impacts has caused serious
problems. Existing concrete structures are experiencing higher deterioration rates and lasting for
shorter service life due to different causes of deterioration of reinforced concrete structures such
as corrosion, freezing and thawing action, carbonation and alkali-silica reaction. Durability
issues are greatly ignored in design, construction, and maintenance during the service life of
structures. These problems have reduced the service life of the structures or have forced
extensive repairs, which both come with great economic costs. As a result, a basic understanding
of the deterioration mechanisms for concrete subjected to chemical attacks by the surrounding
environment is essential to conduct meaningful evaluation and selecting a successful
maintenance strategy.
14
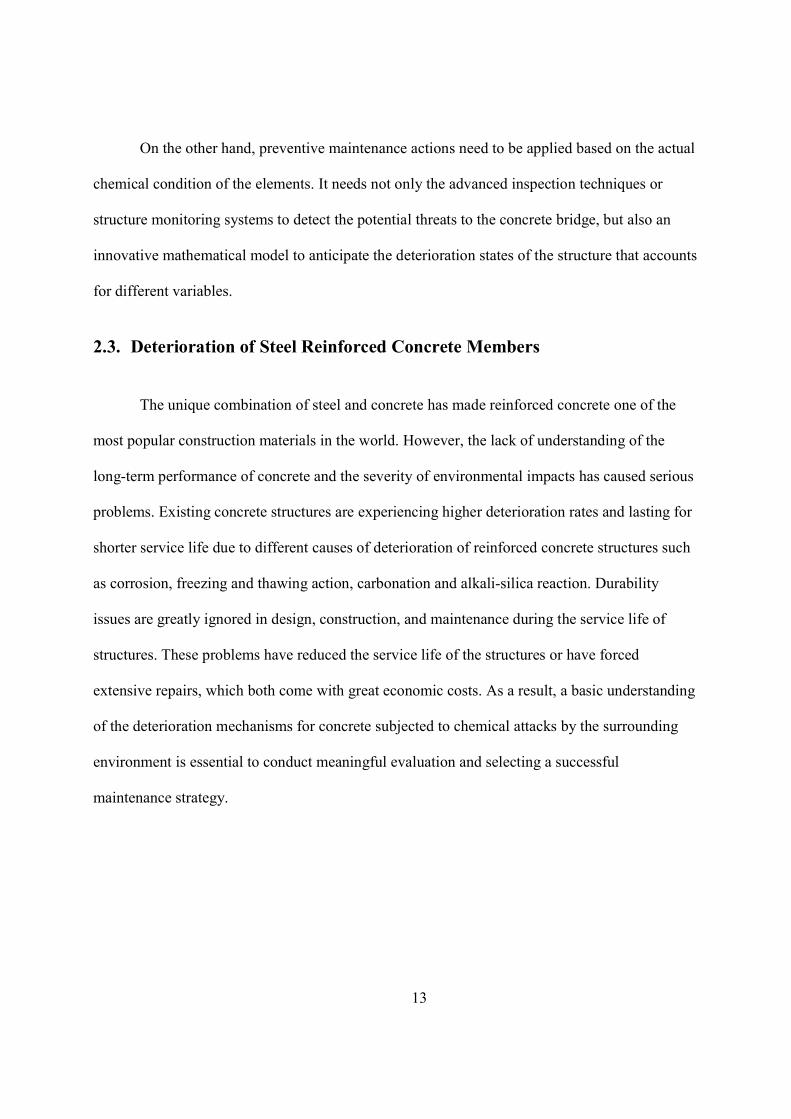
Corrosion of Reinforcing Steel Bars in Concrete
Corrosion, in the context of steel reinforcement in concrete, is a self-generated
electrochemical activity. It requires the simultaneous presence of moisture and oxygen and
resulting from differences in potentials.
An electrochemical cell is formed when an anode and a cathode are connected within a
conductor. In the case of steel, the anodic reaction occurs as following:
↔ + 2 (2.1)
As this process occurs, a cathodic reaction is needed to consume the free electrons
released form the anodic reaction, and this reaction is typically:
+ 2 + 4 ↔ 4 (2.2)
The concrete serves as the electrolyte for the corrosion of steel as it conducts the current
by means of ionic diffusion. The process is illustrated in the Figure 2-3.
Figure 2-3 Corrosion cell in reinforced concrete member (Hime & Erlin, 1987)
However, in some special case, the cathodic reaction may be in the form of hydrogen
evolution. This might occur in two cases:
1. At a very negative potential or a very high cathodic current density;
Fe++OH- O2+H2O
Reinforcing Steel Bar
Concrete
ANODE CATHODE
e-rust
Fe++OH- O2+H2O
Reinforcing Steel Bar
Concrete
ANODE CATHODE
e-rust
15
2. In a carbonated concrete in which the pH value of the pore solution has become
very low.
The intermediate corrosion product, , could be further transformed into and be
accumulated at the surface of steel reinforcement. (Song, 1998)
Normally, the pore solution is rich in oxygen with a high pH value. So can stay in
the form of ( ) or ( ) , forming a thin passive film on the steel surface, which
consequently retards the corrosion reaction. However, under some conditions the protective film
may not be formed or the formed passive film would break down. This may be caused by the
invasion of carbon dioxide ions, chloride ions, and other chemical elements. Once the alkalinity
of the concrete drops down, the corrosion rate of the steel increases dramatically.
Carbonation of Concrete
The carbonation of cementitious materials is a neutralization reaction of the basic
compounds of hydrated cement (essentially Ca(OH) and C – S – H) by carbonic acid. CO2,
present in non-polluted air at 0.035% by volume, is dissolved in the aqueous pore solution and
forms carbonic acid. (Houst, 2002)
The pore solution of hardened cementitious materials like mortar or concrete contains
essentially sodium and potassium hydroxides. Indeed, the solubility of Ca(OH) strongly
decreases when the concentration of hydroxyl ions increases. Carbonation reactions can be
written as follows:
2NaOH + CO → Na CO + H O (2.3)
Na CO + Ca(OH) → CaCO + 2NaOH (2.4)
16
3Na CO + 3CaO ∙ SiO ∙ 4H → 3CaCO + 2SiO + 6NaOH + H O (2.5)
This process continues as long as Ca(OH) and C – S – H are present, and the pH of the
pore solution keeps dropping as a result.
Deterioration of Concrete Due to Freeze-and-thaw effect
There are two types of Freeze-thaw damages: surface scaling and internal cracking. The
former may occur on both horizontal and vertical surfaces, but mainly where water or snow can
naturally deposit and the surface remains wet for long periods. The susceptibility to surface
scaling will increase significantly in the presence of de-icing chemicals (Jana, 2007). Internal
cracking under field conditions is less commonly observed or recognized. Sampling for
structural analyses by plane sections or thin sections will provide valuable information for the
identification and elimination of other causes. The phenomenon may be observed on parts of
structures in direct contact with free water and subjected to capillary suction, such as the lower
parts of supporting walls and dam structures above the water surface. It is also believed that
freeze-thaw cracking may combine with or start after deterioration initiated by other detrimental
mechanisms, such as alkali aggregate reactions. (Ronning, 2001)
Deterioration of Concrete Due to Alkali-silica Reaction
The Alkali-silica Reaction in concrete is a chemical reaction between reactive forms of
silica present in the aggregates and the high alkaline pore solution. Two main mechanisms
constitute the ASR. Firstly, silica is dissolved from the aggregates, whereby a gel is formed and
secondly, the swelling of the gel by imbibition of water, which results in the expansion and
deterioration of the affected concrete. (Bangert, 2004)

17
The reaction begins with an attack of the alkaline hydroxides present in the cement on the
reactive silica particles in the aggregate. When poorly crystalline hydrous silica is exposed to a
highly alkaline solution, there is an acid-base reaction between the OH ions in solution and the
Si − OH groups:
≡ Si − OH + →≡ Si − O + (2.6)
As additional OH- ions penetrate into the structure, some of the siloxane (Si-O-Si)
linkages are also attacked, following the equations shown below (Dent-Glasser, 1981):
≡ Si − OH − Si ≡ +2 →≡ 2(Si − O ) + (2.7)
To maintain charge equilibrium, positive ions (Na+ and K+) diffuse into the structure to
balance the negative charges present on the terminal oxygen atoms. The disruption of the
siloxane linkages ultimately weakens the structure. Provided that sufficient amounts of alkali-
hydroxides are available, this process continues, producing an alkaline-silicate solution.
Due to the absorption of water, the gel may have a volume significantly larger than the
silica particles originally attacked or consumed. In saturated concrete, the amount of water
available in the reaction is abundant. Therefore, the rate of gel growth depends on the rate of the
alkali-silica reaction. However, in the case of an unsaturated member, the rate of expansion or
growth of the gel does not occur simultaneously with the reaction. It is prolonged over a longer
period of time since the expansion rate is dependent on the ability of water vapor to diffuse
through the surface of the concrete (Hobbs, 1988).
18
Combined Effect of Different Deterioration Mechanisms
As discussed above, the deterioration mechanism of concrete bridge components
subjected to chemical attacks may include but are not limited to: corrosion of reinforcing bars in
concrete, freezing and thawing cycles, carbonation of concrete, and alkali-silica reaction.
In many cases, the root cause of a deterioration problem is the corrosion of the concrete
structures. The corrosion process is an electrochemical mechanism in which metal is reduced to a
lesser state of energy, that being its natural ore. Various causes exist; the most predominate being
chlorides, carbonization, and oxygen. Aside from the previously mentioned elements, there are
other chemicals known to cause a reduction in the pH of concrete.
Figure 2-4 Simplifies deterioration mechanism, (Aboutaha, 2004)
Figure above shows simplified deterioration mechanism in severe environments. The
combined effects of these mechanisms are more damaging, which may start at time zero and
increasing with a greater slope. The carbonation process will affect the pH value of the pore
solution in the concrete, which may lead to the depassivation of the steel. However, on the other
19
hand, it may also change the binding capacity of the concrete as well as slow the chloride ingress
velocity. So the overall impact may be controversial and depends highly on the engineering
judgment and the experimental work. The impact on corrosion caused by ASR and freeze-and-
thaw effect is also hard to evaluate. The fine cracks caused by these deterioration mechanisms
may dramatically affect the chloride diffusion coefficient, and the surface cracks will lead to a
higher chloride concentration at the crack tips.
2.4. Chloride Diffusion
Background Information
Chloride ions and other aggressive particles penetrate through concrete via different
mechanisms depending on the driving force involved. The most well-known chloride transport
mechanisms are diffusion, permeability and absorption. Other phenomena such as chloride
binding can also influence chloride ingress.
The moisture content of concrete and the surrounding environment determine the driving
force and the mechanisms by which chloride penetrates into concrete. In saturated concrete,
chloride transport occurs by diffusion through the pore solution. However, under unsaturated
condition, which is a common state for concrete with exposed surfaces, the movement of
chloride ions is largely controlled by absorption through the capillary pore system and diffusion
of chlorides through pore solution.
In bridges, concrete experiences wet and dry circles due to rain or condensation. Liquid
in the pores evaporates progressively from the surface. Under this circumstance, the chloride will
most likely enter the concrete surface initially by absorption and then diffuse into inner portions.
A reservoir will be generated and topped up by periodic absorption events. If the concrete dries
20
out to a greater depth, subsequent wettings carry the chlorides deeper into the concrete. Thus it
would appear that absorption and diffusion are important transport mechanism associated with
chloride ingress in bridges. (Hong, 1999)
Since the chloride diffusion is the most dominating mechanism for chloride ingression
into the concrete and it is suitable for long-term modeling, the chloride diffusion is the only
transportation mechanism that we adopt in our model.
Derivation of the Ion Diffusion Equation
When concrete is saturated such as in submerged conditions, diffusion is the dominant
mechanism for chloride transportation. Also, it is suitable for long-term performance evaluation.
For non-steady-state conditions, the concentration gradient changes with time, the flux can be
simply described according to Fick’s second law:
D = (2.8)
Where,
C= Chloride concentration
D= Diffusion coefficient
= Time
= Depth
Assuming constant D, the equation can be solved by applying the error function solution:
C( , ) = C + (C − C )(1 − erf√
) (2.9)

21
Where,
C = Initial chloride content in concrete
C = Surface Chloride Concentration
C( , )= Chloride concentration at depth x on time t
erf (∗)= Error function from mathematic equation chart
Thresholds for Chloride Content
Reinforcement corrosion in non-carbonated, alkaline concrete can only start once the
chloride content at the steel surface has reached a certain threshold value. This value is often referred
to as critical chloride content or chloride threshold value, as shown in Figure 2-5. (Angst, 2009)
Figure 2-5 Definition of Chloride Threshold Value (Angst, 2009)
The threshold value for chloride concentration can be defined in two different ways: from
a scientific point of view, the critical chloride content can be defined as the chloride
22
concentration required for corrosion initiation; whereas from a practical point of view, the
chloride threshold value can be defined with visible or physical deterioration of the reinforced
concrete structure.
The critical chloride concentration is commonly expressed as total chloride, free chloride
and Cl /OH .
The main reason for using total chloride as the measurement of chloride threshold value
is that the test is relatively simple and well documented in standards. The value is quantified by
the weight ratio of chloride ions and the cement/binder. While the binder content is hard to
determine, the total chloride concentration can be also expressed relative to the weight of the
concrete.
By assuming the bound chloride has no contribution to the corrosion process, it is
reasonable to remove all the bounded chloride from the total chloride concentration and using the
free chloride as an indicator to the potential of corrosion initiation. This value could be related to
either the weight of the cement or the weight of the concrete.
Also, critical threshold values could be also expressed in the terms of Cl /OH .
Publication often cited in this regard are those by Hausmann (1967). A conservative value of
Cl /OH is set as 0.6 as the critical value for corrosion initiation.
The critical values for chloride contents in the literature has been summarized and
attached in Appendix B. The critical values are either estimated by the numerical model or
determined from the experiments directly. Due to the numerous factors affecting the corrosion
process, the critical values show a large variance under different circumstances.
23
The ranges of chloride thresholds span through the following limitations based on the
literature reviewed:
(% by weight of concrete): 0.05 to 0.1. (2-4 lb/cu.yd.) Total chloride (% by weight of cement): 0.02 to 3.08. (Typically 0.4-0.6) Free chloride: 0.045 to 3.22 (mole/l) or 0.07 to 1.16 % by weight of cement. [Cl-]/[OH-] ratio: 0.01 to 20.
Chloride Surface Concentration
Chloride surface concentration is another vital input parameter for chloride induced
corrosion models. As discussed before, the apparent surface concentration could be adopted by
curve fitting using Equation 2.9 while assuming the diffusion coefficient and surface
concentration are both constant. This simplified method is extremely suitable for old marine
concrete structures. However, for younger structures, this approach may overestimate the
diffusion penetration by a large margin so that the result may not coincide with what is now
found in practice. The surface concentration estimated by this approach will also deviate from
the experimental result if fly ash and silica fume are used in the binder.
Another problem that arises with the curve fitting approach is that the actual chloride
content profile has a maximum chloride concentration few millimeters below the actual surface
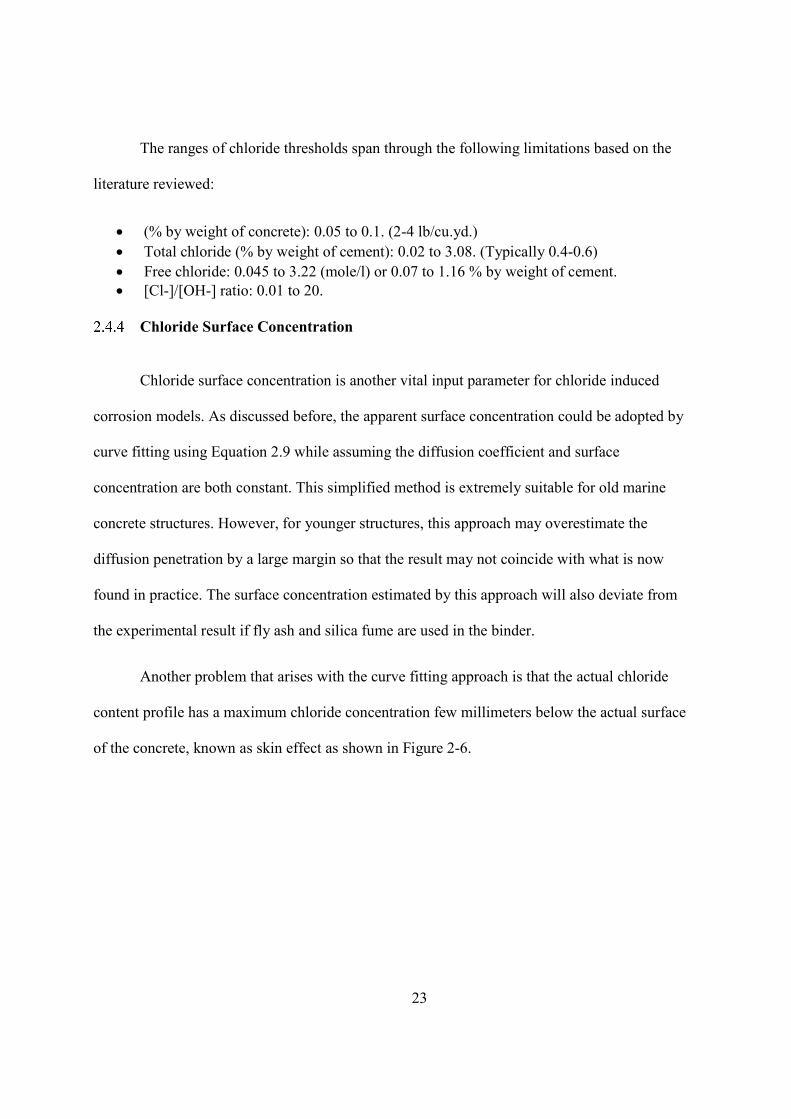
of the concrete, known as skin effect as shown in Figure 2-6.
24
Figure 2-6 Skin Effect of the Concrete (Ann, 2009)
The skin effect is caused by various reasons. The degree of contact of chloride
environment contributes to this surface chloride content decrease. If the concrete surface is
submerged in sea water, the surface concentration may not be changed with time. However, for
tidal zones and concrete exposed to aerial marine atmosphere, or seasonally applied deicing
agents, the surface concentration may fluctuate since the chloride ions may be washed out during
wet and dry cycles. Another reason that causes the skin effect is that the “skin” of the concrete
usually has a different composition than the inner portions of concrete. This different skin
composition may be the result of wall effect introduced during casting, carbonation or the
precipitation of brucite formed by contact of hydrated cement with sea water. Therefore, the real
surface chloride concentration is usually measured by taking the average chloride content on a
thin surface layer, e.g., the chloride concentration in the layer within 1 inch below the surface is
averaged.
Chloride Diffusion Coefficient
In order to apply the chloride diffusion model based on Fick’s law, the diffusion constant
needs to be specified. The diffusion constant is a function of the permeability and condition of
25
the concrete, environmental factors such as exposure and climate, quality of workmanship, and
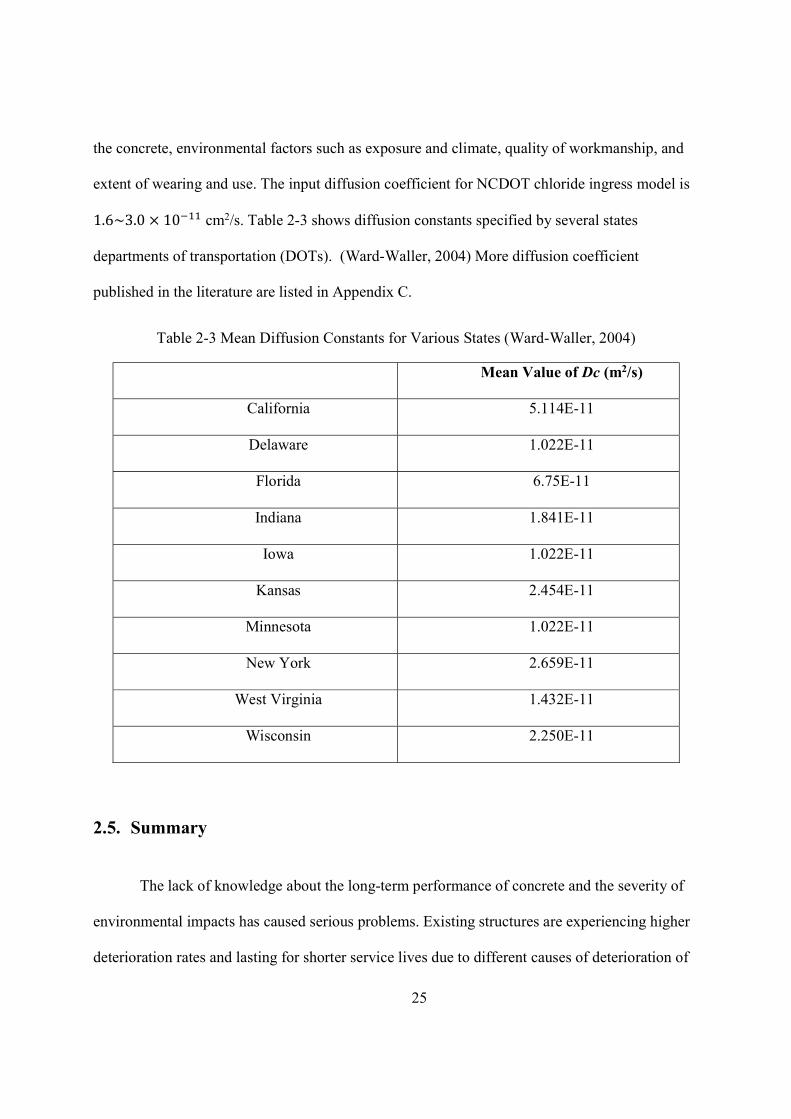
extent of wearing and use. The input diffusion coefficient for NCDOT chloride ingress model is
1.6~3.0 × 10 cm2/s. Table 2-3 shows diffusion constants specified by several states
departments of transportation (DOTs). (Ward-Waller, 2004) More diffusion coefficient
published in the literature are listed in Appendix C.
Table 2-3 Mean Diffusion Constants for Various States (Ward-Waller, 2004)
Mean Value of Dc (m2/s)
California 5.114E-11
Delaware 1.022E-11
Florida 6.75E-11
Indiana 1.841E-11
Iowa 1.022E-11
Kansas 2.454E-11
Minnesota 1.022E-11
New York 2.659E-11
West Virginia 1.432E-11
Wisconsin 2.250E-11
2.5. Summary
The lack of knowledge about the long-term performance of concrete and the severity of
environmental impacts has caused serious problems. Existing structures are experiencing higher
deterioration rates and lasting for shorter service lives due to different causes of deterioration of
26
reinforced concrete structures such as corrosion, freezing and thawing action, carbonation and
alkali-silica reaction, in which corrosion is the most dominating factor.
Chloride induced corrosion is the most common root cause for concrete bridge
deterioration. Once the chloride content reaches a certain threshold value, the passive layer
formed on the surface of reinforcement rebar dissolves and corrosion initiates. Due to the manner
of chloride transportation mechanism, diffusion is used to model the long-term chloride
ingression in our research.
The typical values of diffusion coefficient for normal concrete were reported between 10-
12 m2/s and 10-11 m2/s. If silica fume, fly ash or other alternative cementitious materials are used,
the diffusion coefficient may reduce to 10-13 m2/s.
Chloride diffusion coefficient is affected by the freeze and thaw cycles dramatically. The
value may increase to 3 times of the original chloride diffusion coefficient after 75 freeze and
thaw cycles. Furthermore, once the freeze and thaw cycles exceeds 300 to 500, the concrete may
experience weight loss larger than 5%. The average annual freeze and thaw cycle for New York
City, Syracuse, and Buffalo are 39, 61 and 59 times respectively. Therefore, for unprotected
bridge components, the structures are prone to freeze and thaw damage and the bridge may
deteriorate more rapidly due to the combined effect of chloride induced corrosion and freeze and
thaw.
The chloride threshold value could be assumed as a constant of 1.97 lb/cu.yd. by weight
of the concrete for ordinary Portland cement with black steel as a conservative estimation from
the literature reviewed. The use of stainless steel will increase the chloride threshold value as
much as 20 times of the threshold value for carbon steel. MMFX steel has also presented a

27
higher chloride threshold value. As far as epoxy coated rebar, it exhibits similar chloride
threshold value as black steel, but requires more time to initiate corrosion due to the barrier
effect of the epoxy coating.
The chloride diffusion process can be determined by knowing the value of diffusion
coefficient, exposure condition and the chloride threshold value. Therefore, the methods for
testing and estimating these time-dependent variables are discussed in the following chapter.
28
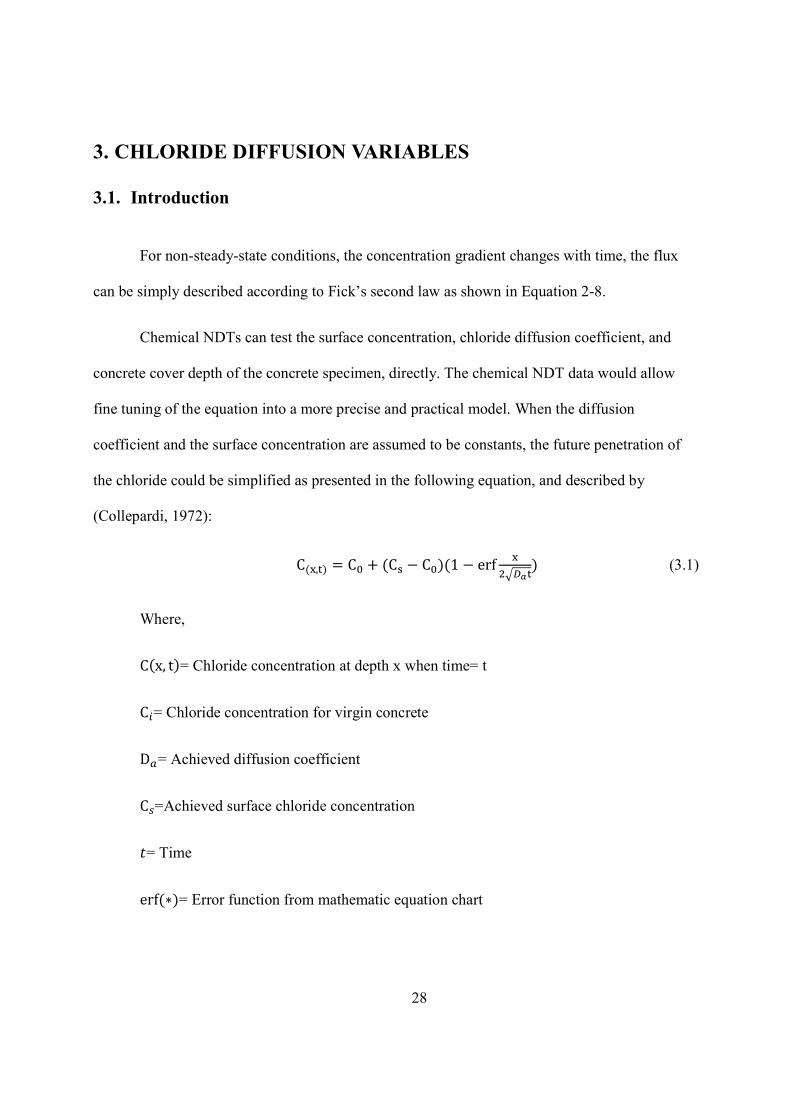
3. CHLORIDE DIFFUSION VARIABLES
3.1. Introduction
For non-steady-state conditions, the concentration gradient changes with time, the flux
can be simply described according to Fick’s second law as shown in Equation 2-8.
Chemical NDTs can test the surface concentration, chloride diffusion coefficient, and
concrete cover depth of the concrete specimen, directly. The chemical NDT data would allow
fine tuning of the equation into a more precise and practical model. When the diffusion
coefficient and the surface concentration are assumed to be constants, the future penetration of
the chloride could be simplified as presented in the following equation, and described by
(Collepardi, 1972):
C( , ) = C + (C − C )(1 − erf ) (3.1)
Where,
C(x, t)= Chloride concentration at depth x when time= t
C = Chloride concentration for virgin concrete
D = Achieved diffusion coefficient
C =Achieved surface chloride concentration
= Time
erf (∗)= Error function from mathematic equation chart
29
The achieved diffusion coefficient and the achieved surface chloride concentration are
determined from in-situ concrete exposed to the environment by curve-fitting. The chloride
profile of the element could be obtained by chloride content tests. There are many lab techniques
and field measurements for measuring chloride content in reinforced concrete structures, such as
potentiometric and Volhard methods, ion selective electrodes, electrical resistivity and optical
fiber sensor. (AASHTO-T 260, NT Build 208)
This simplified method is extremely suitable for old marine concrete structures.
However, for younger structures, this approach may overestimate the diffusion penetration by a
large margin, such the result may not coincide with what is now found in practice. In this case,
numerical models should be used to determine the diffusion parameters.
3.2. Determination of the Chloride Threshold Value (Cth)
Requirements for Newly Constructed Elements
With reference to critical chloride content, also standards and regulations are occasionally
cited, as they often present limits on the tolerable chloride content in concrete.
According to the AASHTO LRFD bridge construction specification (AASHTO, 2010),
water used in mixing and curing of concrete shall be subject to approval and shall be reasonably
clean and free of oil, salt, acid, alkali, sugar, vegetable, or other damaging substances. Mixing
water for concrete in which steel is embedded shall not contain a chloride ion concentration in
excess of 1,000 ppm or sulfates as SO4 in excess of 1,300 ppm. Admixtures containing chloride
ion in excess of one percent by weight (mass) of the admixture shall not be used in reinforced
concrete. Admixtures in excess of 0.1 percent shall not be used in prestressed concrete.
30
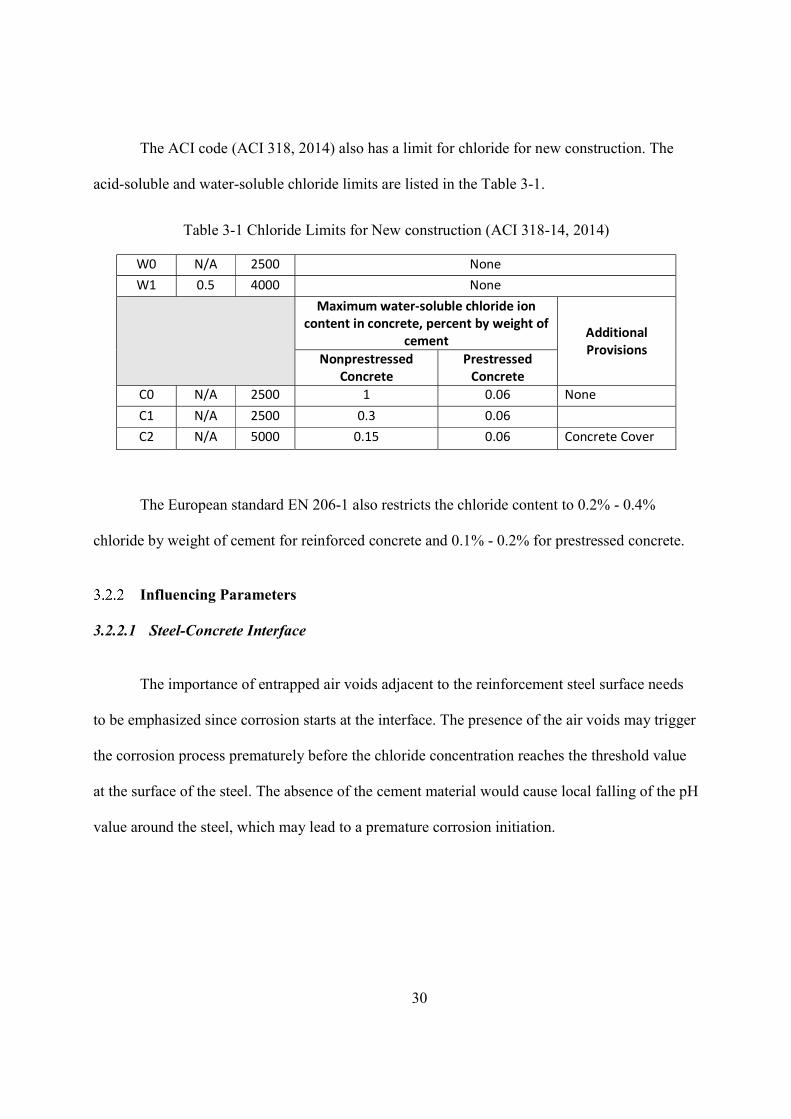
The ACI code (ACI 318, 2014) also has a limit for chloride for new construction. The
acid-soluble and water-soluble chloride limits are listed in the Table 3-1.
Table 3-1 Chloride Limits for New construction (ACI 318-14, 2014)
W0 N/A 2500 None W1 0.5 4000 None
Maximum water-soluble chloride ion content in concrete, percent by weight of
cement Additional Provisions
Nonprestressed Concrete
Prestressed Concrete
C0 N/A 2500 1 0.06 None C1 N/A 2500 0.3 0.06 C2 N/A 5000 0.15 0.06 Concrete Cover
The European standard EN 206-1 also restricts the chloride content to 0.2% - 0.4%
chloride by weight of cement for reinforced concrete and 0.1% - 0.2% for prestressed concrete.
Influencing Parameters
3.2.2.1 Steel-Concrete Interface
The importance of entrapped air voids adjacent to the reinforcement steel surface needs
to be emphasized since corrosion starts at the interface. The presence of the air voids may trigger
the corrosion process prematurely before the chloride concentration reaches the threshold value
at the surface of the steel. The absence of the cement material would cause local falling of the pH
value around the steel, which may lead to a premature corrosion initiation.
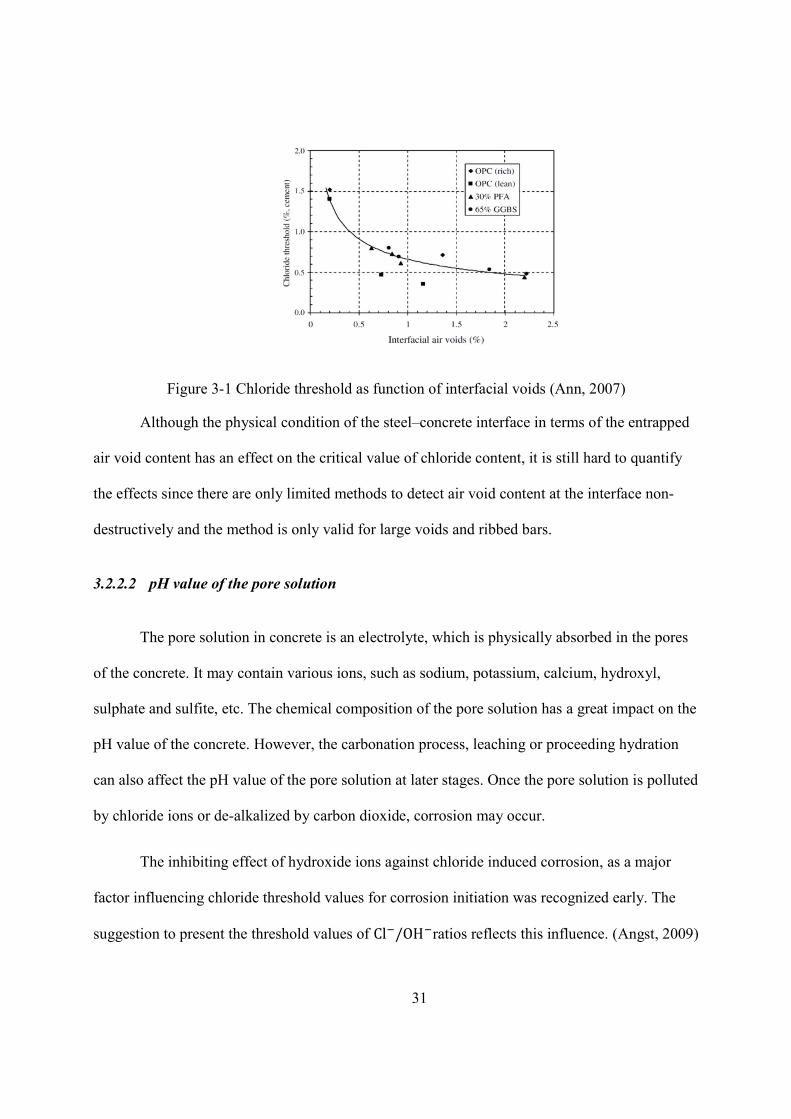
31
Figure 3-1 Chloride threshold as function of interfacial voids (Ann, 2007)
Although the physical condition of the steel–concrete interface in terms of the entrapped
air void content has an effect on the critical value of chloride content, it is still hard to quantify
the effects since there are only limited methods to detect air void content at the interface non-
destructively and the method is only valid for large voids and ribbed bars.
3.2.2.2 pH value of the pore solution
The pore solution in concrete is an electrolyte, which is physically absorbed in the pores
of the concrete. It may contain various ions, such as sodium, potassium, calcium, hydroxyl,
sulphate and sulfite, etc. The chemical composition of the pore solution has a great impact on the
pH value of the concrete. However, the carbonation process, leaching or proceeding hydration
can also affect the pH value of the pore solution at later stages. Once the pore solution is polluted
by chloride ions or de-alkalized by carbon dioxide, corrosion may occur.
The inhibiting effect of hydroxide ions against chloride induced corrosion, as a major
factor influencing chloride threshold values for corrosion initiation was recognized early. The
suggestion to present the threshold values of Cl /OH ratios reflects this influence. (Angst, 2009)
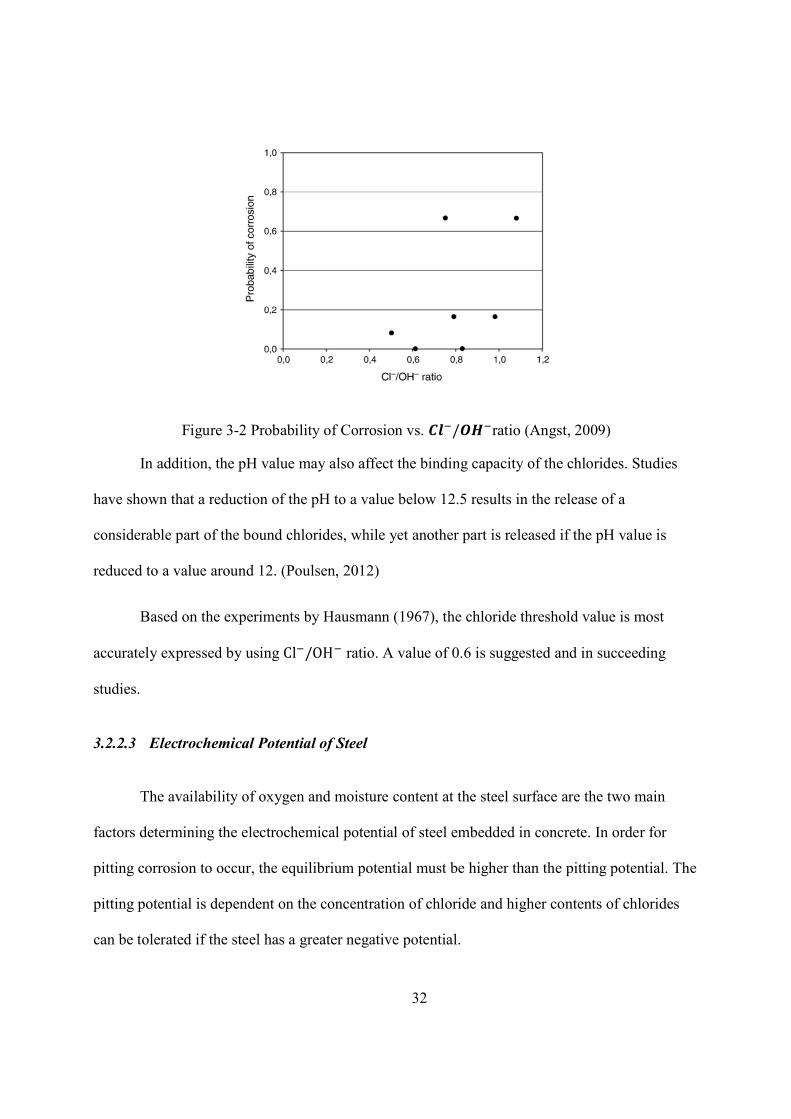
32
Figure 3-2 Probability of Corrosion vs. / ratio (Angst, 2009)
In addition, the pH value may also affect the binding capacity of the chlorides. Studies
have shown that a reduction of the pH to a value below 12.5 results in the release of a
considerable part of the bound chlorides, while yet another part is released if the pH value is
reduced to a value around 12. (Poulsen, 2012)
Based on the experiments by Hausmann (1967), the chloride threshold value is most
accurately expressed by using Cl /OH ratio. A value of 0.6 is suggested and in succeeding
studies.
3.2.2.3 Electrochemical Potential of Steel
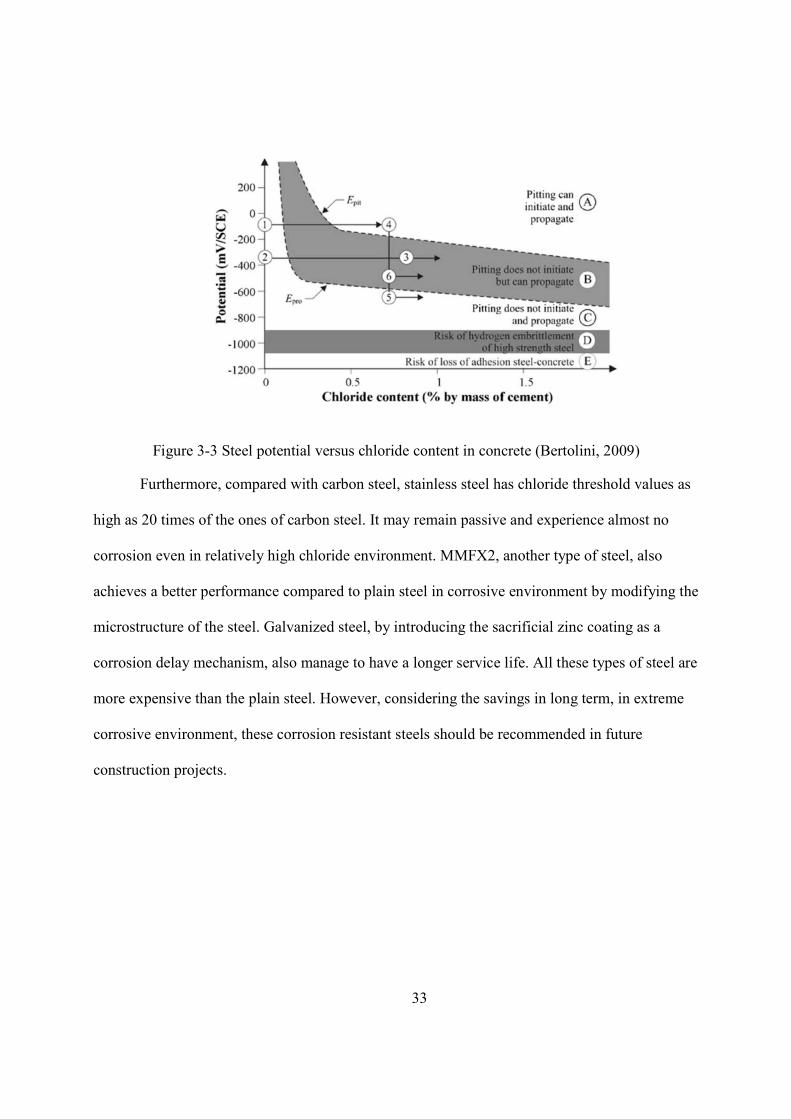
The availability of oxygen and moisture content at the steel surface are the two main
factors determining the electrochemical potential of steel embedded in concrete. In order for
pitting corrosion to occur, the equilibrium potential must be higher than the pitting potential. The
pitting potential is dependent on the concentration of chloride and higher contents of chlorides
can be tolerated if the steel has a greater negative potential.
33
Figure 3-3 Steel potential versus chloride content in concrete (Bertolini, 2009)
Furthermore, compared with carbon steel, stainless steel has chloride threshold values as
high as 20 times of the ones of carbon steel. It may remain passive and experience almost no
corrosion even in relatively high chloride environment. MMFX2, another type of steel, also
achieves a better performance compared to plain steel in corrosive environment by modifying the
microstructure of the steel. Galvanized steel, by introducing the sacrificial zinc coating as a
corrosion delay mechanism, also manage to have a longer service life. All these types of steel are
more expensive than the plain steel. However, considering the savings in long term, in extreme
corrosive environment, these corrosion resistant steels should be recommended in future
construction projects.
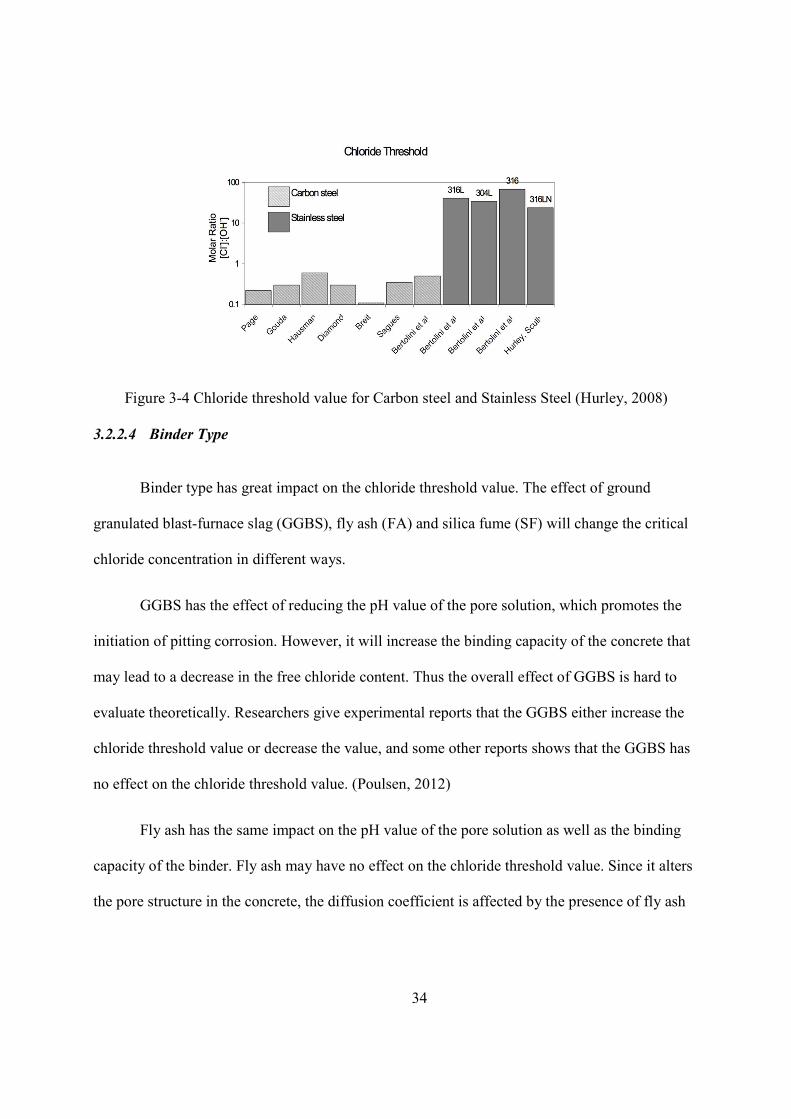
34
Figure 3-4 Chloride threshold value for Carbon steel and Stainless Steel (Hurley, 2008)
3.2.2.4 Binder Type
Binder type has great impact on the chloride threshold value. The effect of ground
granulated blast-furnace slag (GGBS), fly ash (FA) and silica fume (SF) will change the critical
chloride concentration in different ways.
GGBS has the effect of reducing the pH value of the pore solution, which promotes the
initiation of pitting corrosion. However, it will increase the binding capacity of the concrete that
may lead to a decrease in the free chloride content. Thus the overall effect of GGBS is hard to
evaluate theoretically. Researchers give experimental reports that the GGBS either increase the
chloride threshold value or decrease the value, and some other reports shows that the GGBS has
no effect on the chloride threshold value. (Poulsen, 2012)
Fly ash has the same impact on the pH value of the pore solution as well as the binding
capacity of the binder. Fly ash may have no effect on the chloride threshold value. Since it alters
the pore structure in the concrete, the diffusion coefficient is affected by the presence of fly ash
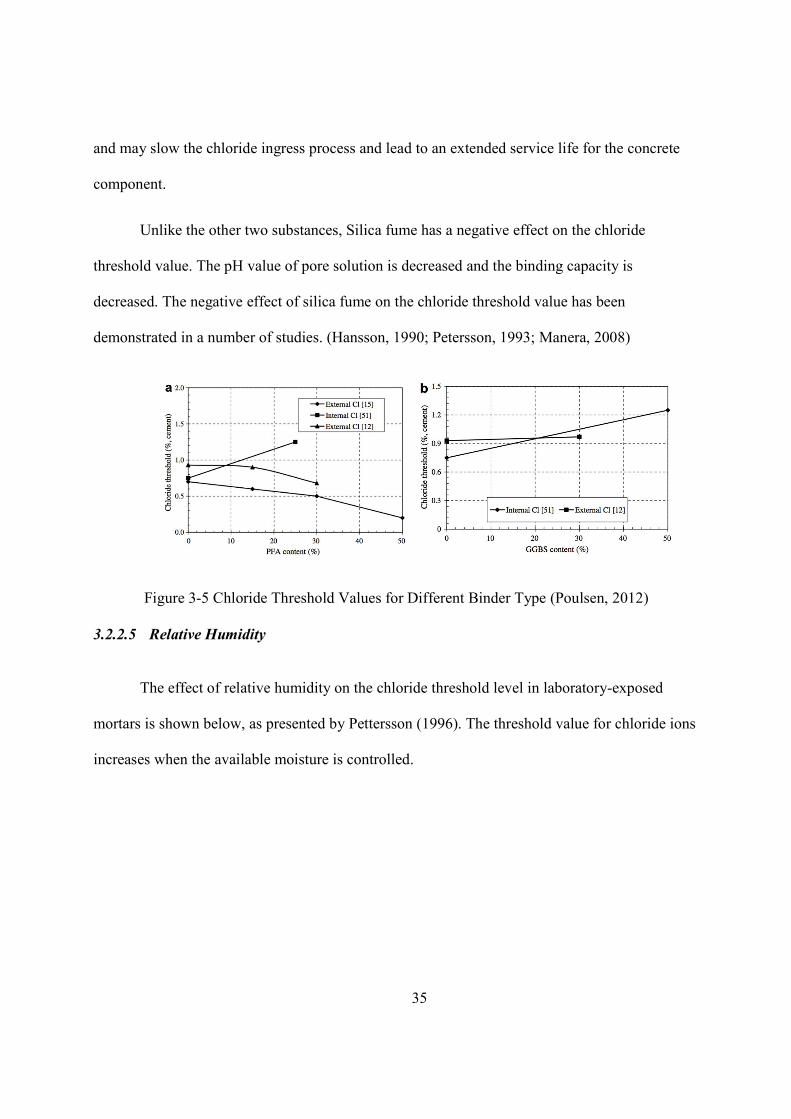
35
and may slow the chloride ingress process and lead to an extended service life for the concrete
component.
Unlike the other two substances, Silica fume has a negative effect on the chloride
threshold value. The pH value of pore solution is decreased and the binding capacity is
decreased. The negative effect of silica fume on the chloride threshold value has been
demonstrated in a number of studies. (Hansson, 1990; Petersson, 1993; Manera, 2008)
Figure 3-5 Chloride Threshold Values for Different Binder Type (Poulsen, 2012)
3.2.2.5 Relative Humidity
The effect of relative humidity on the chloride threshold level in laboratory-exposed
mortars is shown below, as presented by Pettersson (1996). The threshold value for chloride ions
increases when the available moisture is controlled.
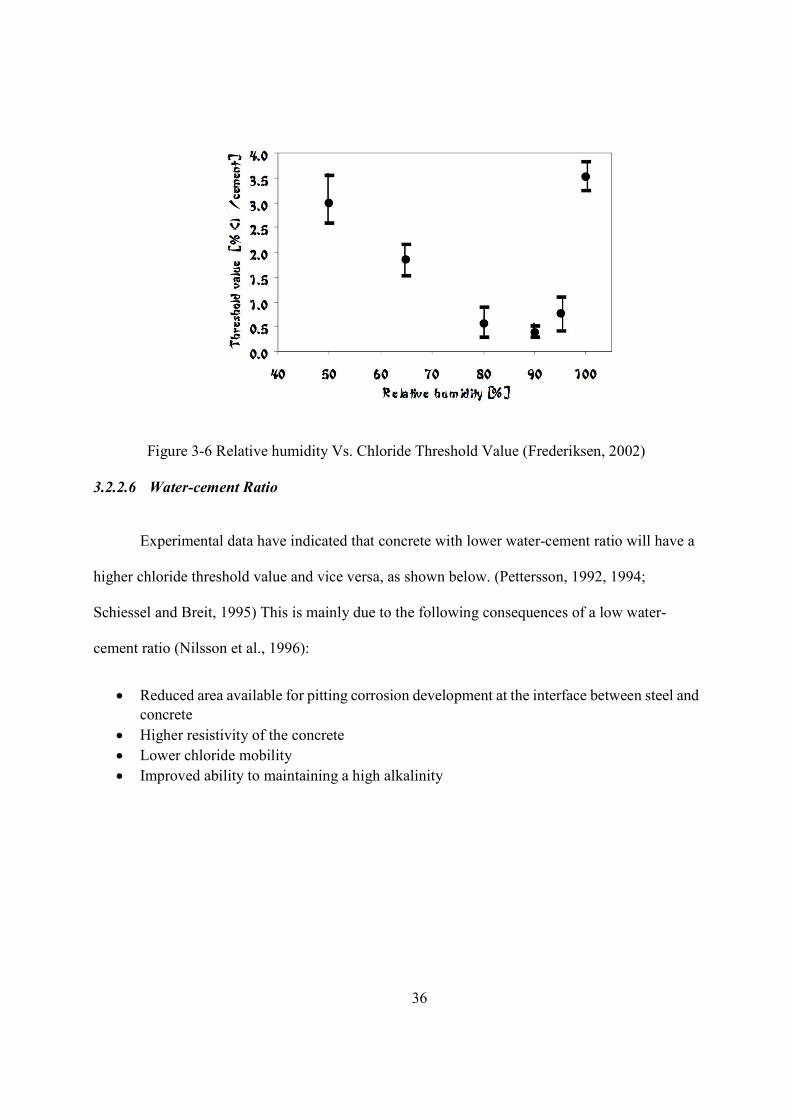
36
Figure 3-6 Relative humidity Vs. Chloride Threshold Value (Frederiksen, 2002)
3.2.2.6 Water-cement Ratio
Experimental data have indicated that concrete with lower water-cement ratio will have a
higher chloride threshold value and vice versa, as shown below. (Pettersson, 1992, 1994;
Schiessel and Breit, 1995) This is mainly due to the following consequences of a low water-
cement ratio (Nilsson et al., 1996):
Reduced area available for pitting corrosion development at the interface between steel and concrete
Higher resistivity of the concrete Lower chloride mobility Improved ability to maintaining a high alkalinity
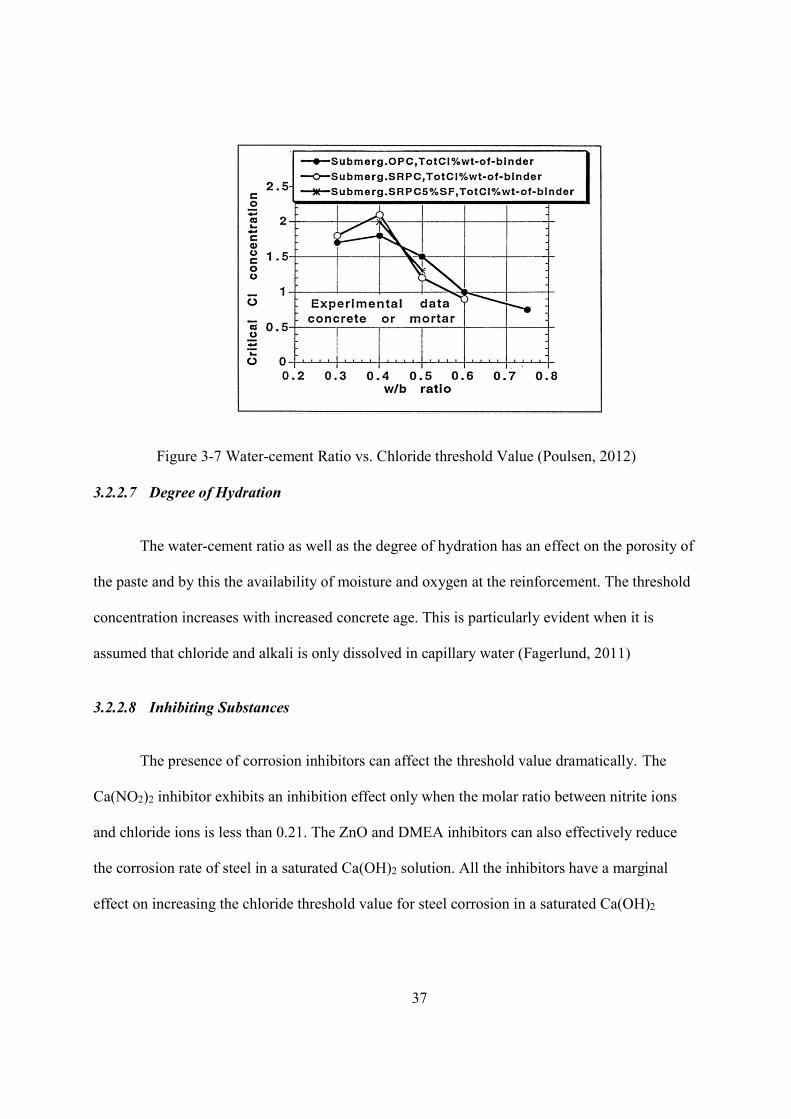
37
Figure 3-7 Water-cement Ratio vs. Chloride threshold Value (Poulsen, 2012)
3.2.2.7 Degree of Hydration
The water-cement ratio as well as the degree of hydration has an effect on the porosity of
the paste and by this the availability of moisture and oxygen at the reinforcement. The threshold
concentration increases with increased concrete age. This is particularly evident when it is
assumed that chloride and alkali is only dissolved in capillary water (Fagerlund, 2011)
3.2.2.8 Inhibiting Substances
The presence of corrosion inhibitors can affect the threshold value dramatically. The
Ca(NO2)2 inhibitor exhibits an inhibition effect only when the molar ratio between nitrite ions
and chloride ions is less than 0.21. The ZnO and DMEA inhibitors can also effectively reduce
the corrosion rate of steel in a saturated Ca(OH)2 solution. All the inhibitors have a marginal
effect on increasing the chloride threshold value for steel corrosion in a saturated Ca(OH)2
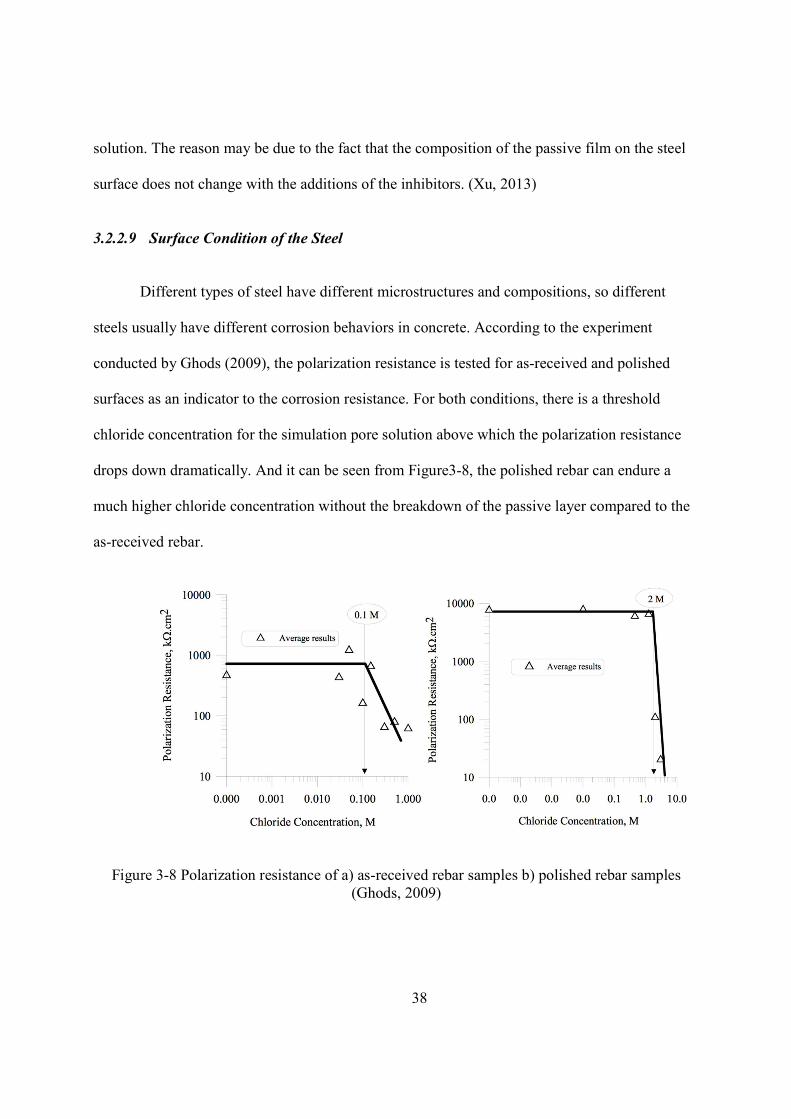
38
solution. The reason may be due to the fact that the composition of the passive film on the steel
surface does not change with the additions of the inhibitors. (Xu, 2013)
3.2.2.9 Surface Condition of the Steel
Different types of steel have different microstructures and compositions, so different
steels usually have different corrosion behaviors in concrete. According to the experiment
conducted by Ghods (2009), the polarization resistance is tested for as-received and polished
surfaces as an indicator to the corrosion resistance. For both conditions, there is a threshold
chloride concentration for the simulation pore solution above which the polarization resistance
drops down dramatically. And it can be seen from Figure3-8, the polished rebar can endure a
much higher chloride concentration without the breakdown of the passive layer compared to the
as-received rebar.
Figure 3-8 Polarization resistance of a) as-received rebar samples b) polished rebar samples (Ghods, 2009)
39
Test Methods
Generally, the experimental determination of the chloride threshold value must include
the following four steps:
Placing a reinforcement bar into a cement-based material or submerging it in a solution. Introducing chloride into the system. Detecting the corrosion initiation. Quantifying the chloride concentration at the time of corrosion initiation.
In order to quantify the chloride concentration at the time of corrosion initiation, the
chloride content tests could be used. The chloride threshold value is usually expressed as either
total chloride, free chloride or free chloride ion concentration.
The following test methods could be used to determine the corrosion initiation:
Potential Shift Linear Polarization Resistance Macrocell Current Electrochemical Impedance Spectroscopy Galvanostatic Pulse Method Visual Examination
Except visual examination, all the other methods use an electrical approach to detect
corrosion initiation, which gives a more accurate result compared to visual examination.
Numerical Models
Frederiksen (1997) proposed an equation to make semi-objective estimates for the
threshold concentrations. The values could be obtained by:
= , × exp(−1.5 × ( ⁄ ) ) [% ] (3.2)
, is arbitrary to represent the environment factor. Suggested design values for
threshold levels for black steel could be derived, as shown in Table 3-2, 3-3 and 3-4.
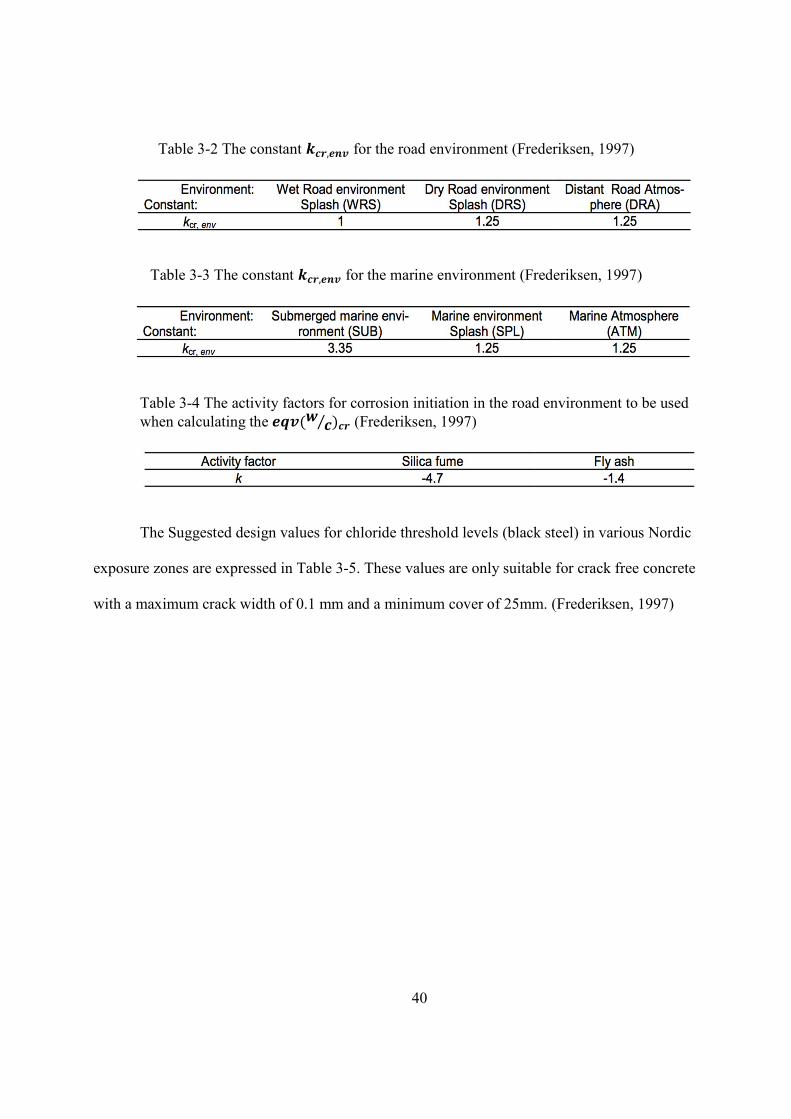
40
Table 3-2 The constant , for the road environment (Frederiksen, 1997)
Table 3-3 The constant , for the marine environment (Frederiksen, 1997)
Table 3-4 The activity factors for corrosion initiation in the road environment to be used when calculating the ( ⁄ ) (Frederiksen, 1997)
The Suggested design values for chloride threshold levels (black steel) in various Nordic
exposure zones are expressed in Table 3-5. These values are only suitable for crack free concrete
with a maximum crack width of 0.1 mm and a minimum cover of 25mm. (Frederiksen, 1997)
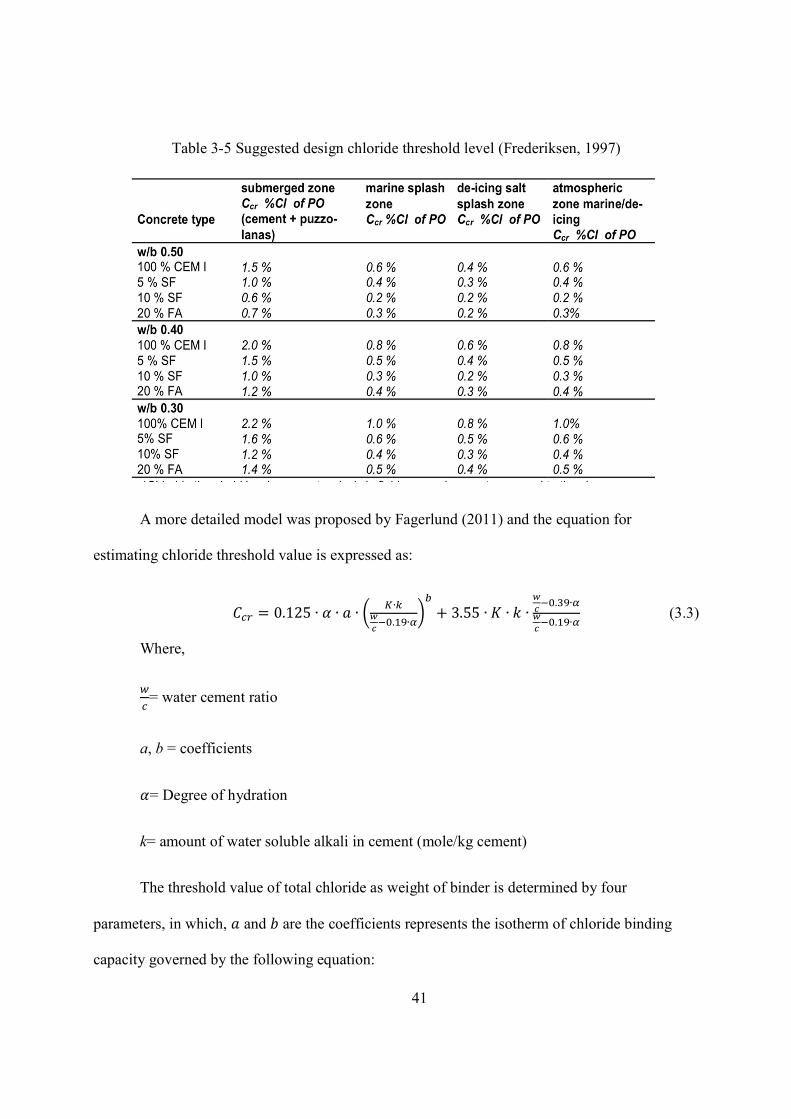
41
Table 3-5 Suggested design chloride threshold level (Frederiksen, 1997)
A more detailed model was proposed by Fagerlund (2011) and the equation for
estimating chloride threshold value is expressed as:
= 0.125 ∙ ∙ ∙∙
. ∙+ 3.55 ∙ ∙ ∙
. ∙
. ∙ (3.3)
Where,
= water cement ratio
a, b = coefficients
= Degree of hydration
k= amount of water soluble alkali in cement (mole/kg cement)
The threshold value of total chloride as weight of binder is determined by four
parameters, in which, and are the coefficients represents the isotherm of chloride binding
capacity governed by the following equation:
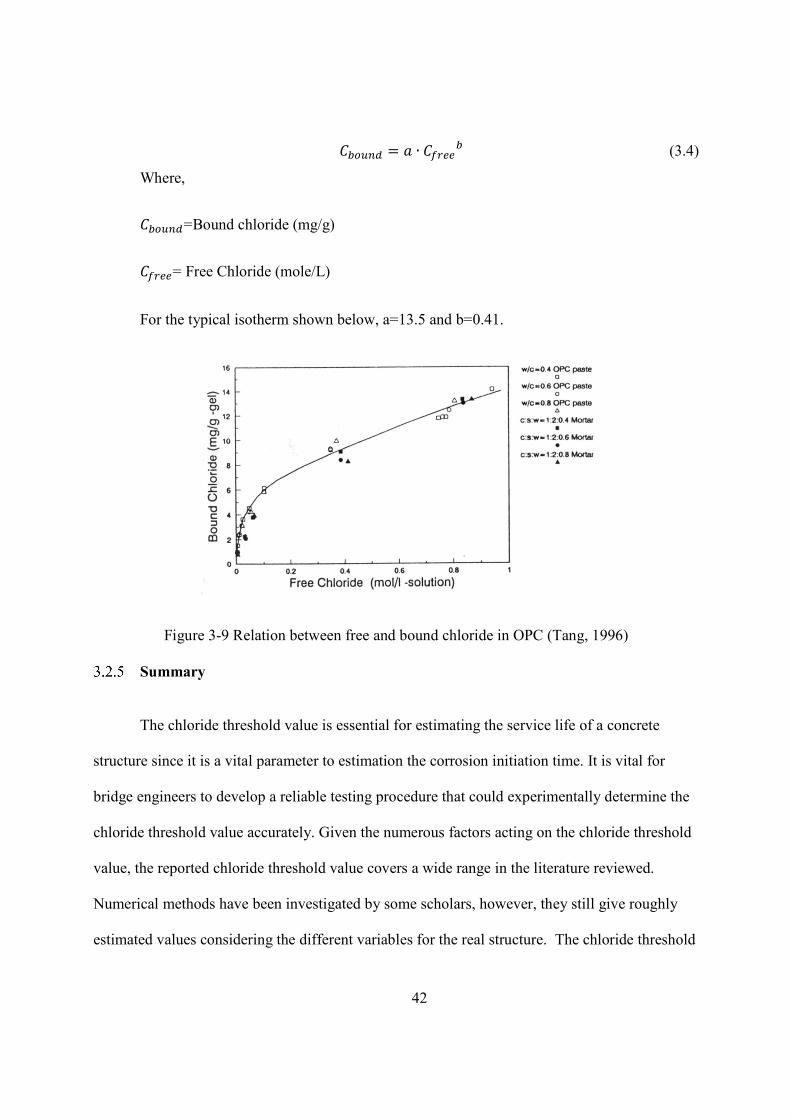
42
= ∙ (3.4)
Where,
=Bound chloride (mg/g)
= Free Chloride (mole/L)
For the typical isotherm shown below, a=13.5 and b=0.41.
Figure 3-9 Relation between free and bound chloride in OPC (Tang, 1996)
Summary
The chloride threshold value is essential for estimating the service life of a concrete
structure since it is a vital parameter to estimation the corrosion initiation time. It is vital for
bridge engineers to develop a reliable testing procedure that could experimentally determine the
chloride threshold value accurately. Given the numerous factors acting on the chloride threshold
value, the reported chloride threshold value covers a wide range in the literature reviewed.
Numerical methods have been investigated by some scholars, however, they still give roughly
estimated values considering the different variables for the real structure. The chloride threshold

43
value should be tested using one of the tests methods after completion of the construction in
order to give a base value of the threshold value. If the tests are not performed and sufficient data
is not available for the researcher, Fagerlund’s model could be used to obtain a rough estimate
for the chloride threshold value.
3.3. Determination of the Surface Chloride Concentration
Surface Chloride Concentration in Literature
Models for predicting chloride surface concentration have been proposed by many
researchers. The surface concentration will increase with exposure time which makes it a
function of time.
= ∅( ) (3.5)
Linear relation and square root relations are generally used to describe the surface
chloride build up process, and are described as ∅( ) = and ∅( ) = √ respectively.
McGee (1999) has investigated the relations between the surface concentration and the
distance between the structure and the coastline d. When d is smaller than 0.1 km, =
2.85 / concrete; while d is between 0.1 km and 2.84 km, = 1.15 −
1.81lg ( ) / concrete; when d is greater than 2.84 km, = 0.03 / concrete.
While Bamforth (1998) suggested an estimated value for surface chloride concentration between
0.25% to 0.30% by weight of the concrete.
Ann (2009) states that the surface concentration is not zero even at the early stages of
exposure. The initial surface concentration ranges between 2.0 to 2.5% right after the concrete is
exposed to the environment. A modified square root build-up equation is developed and
described as:

44
= + √ (3.6)
Where k is the constant, t is the time of exposure and is the initial build-up of surface
chloride.
Life 365 (Bentz, 2014) uses the linear model to demonstrate the build-up process for
surface chloride concentration. The maximum surface chloride concentration is assumed to be
1.0%, 0.8%, 0.6% for marine splash zone, tidal zone and 800m away from the coast line
respectively.
Determination of the Surface Concentration
The surface chloride concentration could be determined by averaging the chloride content
with the thin surface layer. The depth of the layer should be selected carefully in order to rule out
the skin effect while getting the relatively constant chloride concentration for further modelling.
Life-365 introduced a module that uses measurements obtained using ASTM C1556 for
estimating the maximum surface chloride concentration. Once the concrete chloride
concentration at different depth of a concrete sample is detected following ASTM C1556, the
maximum surface concentration could be estimated by combining parameters including initial
chloride concentration and exposure duration.
The estimation is done by fitting the laboratory data to a diffusion equation:
( , ) = + ( − )√
(3.7)
Where, C(x,t) is chloride concentration at depth x when time= t; Ci is the chloride
concentration for virgin concrete; D and Cs represents the constant diffusion coefficient and
constant surface chloride concentration respectively; t is exposure time and erf(*) is the error
function from mathematic equation chart.
45
The values of D and Cs are determined by minimizing the following function:
∑[ − ( , )] (3.8)
By using a Levenberg-Marquardt nonlinear squares algorithm (Life-365,2014), the values
of D and Cs could be determined. The ranges of initial guess for these two parameters are ∈
[0.01, 2.0] and ∈ [1 × 10 , 1 × 10 ].
As discussed previously, this method is valid for estimating maximum surface
concentration for old structures. The surface concentration is an average which does not reflect
the seasoning changes. It is useful in calibrating the maximum surface concentration of a
concrete structure after years of service.
Numerical Models
In order to better estimate the surface chloride concentration for concrete structures, a
number of models are developed by scholars. Since the increase of chloride concentration will
slow down with the aging of the concrete, the linear time depended model will overestimate the
chloride concentration for long term exposure and underestimate the value for the initial stage.
The square root model has the same problem. Therefore, Zhao (2010) have proposed a modified
model to estimate the surface chloride concentration:
( ) = + (1 − ) (3.9)
In which, is the initial surface concentration by percent of the weight of the concrete;
is the stable value of the surface chloride concentration; is the accumulation constant;
and could be estimated by the Duarte’s model (Duarte, 2000):
= × ⁄ + (3.10)
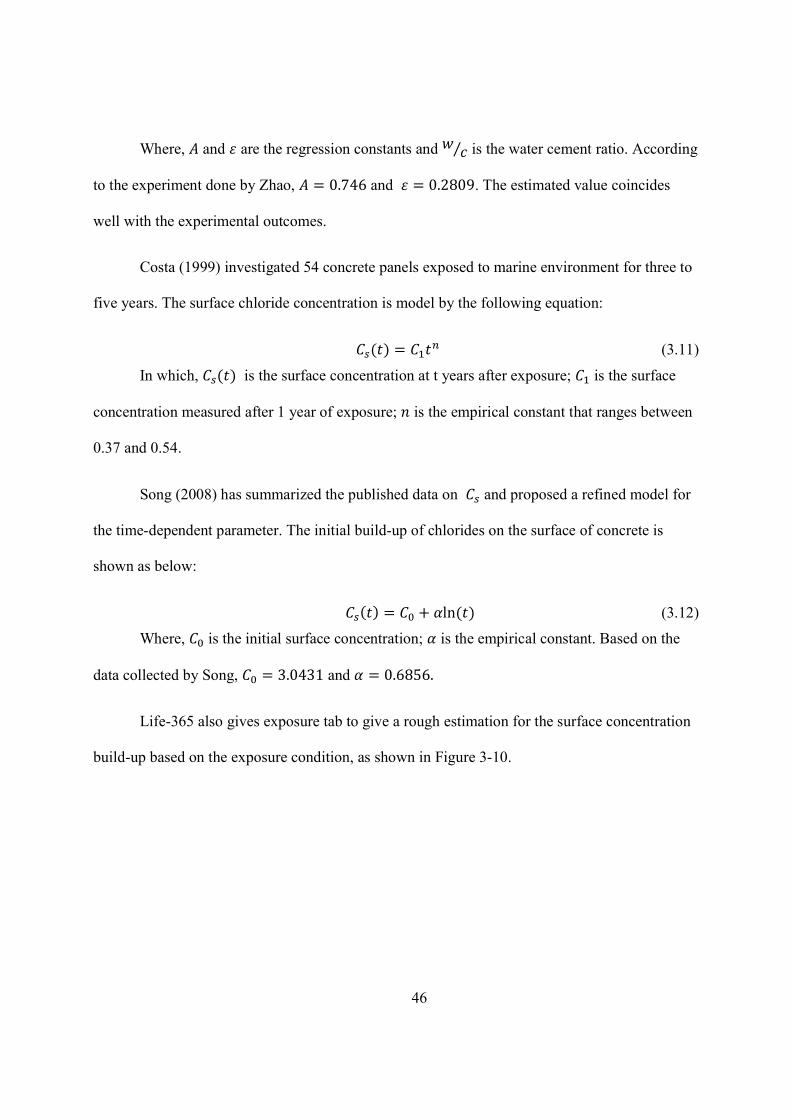
46
Where, and are the regression constants and ⁄ is the water cement ratio. According
to the experiment done by Zhao, = 0.746 and = 0.2809. The estimated value coincides
well with the experimental outcomes.
Costa (1999) investigated 54 concrete panels exposed to marine environment for three to
five years. The surface chloride concentration is model by the following equation:
( ) = (3.11)
In which, ( ) is the surface concentration at t years after exposure; is the surface
concentration measured after 1 year of exposure; is the empirical constant that ranges between
0.37 and 0.54.
Song (2008) has summarized the published data on and proposed a refined model for
the time-dependent parameter. The initial build-up of chlorides on the surface of concrete is
shown as below:
( ) = + ln ( ) (3.12)
Where, is the initial surface concentration; is the empirical constant. Based on the
data collected by Song, = 3.0431 and = 0.6856.
Life-365 also gives exposure tab to give a rough estimation for the surface concentration
build-up based on the exposure condition, as shown in Figure 3-10.
47
Figure 3-10 Exposure tab from Life-365 (Life-365, 2014)
Summary
Chloride surface concentration (Cs) is a vital parameter for estimating the corrosion
initiation time. Chloride surface concentration has a great impact on the rate of chloride
ingression, thereby influencing the prediction of chloride profile and corrosion risk.
Chloride surface concentration should be detected following the ASTM 1556 procedure.
Nominal surface concentration could be estimated by numerical regression. It can also be
estimated by averaging the chloride content for the top layer of the concrete. In practice, the
chloride content within the top 1 in of the concrete could be calculated and treated as the surface
chloride concentration at 1in below the actual surface of the concrete in order to rule out the skin
effect of the concrete.
The experimental data for surface concentration of a newly constructed bridge tend to
show scattered values that fluctuate and cover a wide range. Song’s and Bentz’s models are
48
considered most favorable scientific models to predict surface chloride concentration as a time
depended variable. In this research, the model proposed by E. C. Bentz is used since it is adopted
by the widely used software Life-365.
3.4. Determination of the Diffusion Coefficient
Diffusion Coefficient Estimation in the Literature
Due to the importance of determination of the chloride diffusion coefficient (Dc),
numerous scholars devoted their studies to this area through experimenting and numerical
modeling.
JSCE (2002) proposed the following equations to estimate chloride diffusion coefficient
by:
D = −3.9 + 7.2 − 2.5 (3.13)
D = −3.0 + 7.2 − 2.5 ℎ (3.14)
Boulfiz et al. (2003) investigated mathematical models and numerical simulations for
water movement and chloride ions ingress by diffusion and advection in cracked and uncracked
concrete under saturated or unsaturated conditions and derived the following equations:
D = −3.9 + 7.2 − 14 ℎ (3.15)
D = −3.0 + 5.4 − 13.7 (3.16)
The initial diffusion coefficient (Dref), known as the reference diffusion coefficient of the
concrete element is primarily correlated with the water cement ratio and the composition of the
cementitious materials.

49
Ehlen’s Life-365TM Life Prediction Models and computer program also provide an
approach to estimate the diffusion coefficient. The base case concrete mixture is plain Portland
cement concrete with no special corrosion protection strategy. For this case, the following values
are assumed:
D = ( ) D (3.17)
D = 1 × 10( . . ) (3.18)
In which, D is the diffusion coefficient after 28 days of curing. stands for the aging
factor that represents the decaying of diffusion coefficient in time due to effect of concrete aging.
The addition of silica fume is known to produce significant reductions in the permeability
and diffusivity of concrete. In Ehlen’s model, the presence of the silica fume affects the diffusion
coefficient as shown below:
D = D ∙ . ∙ (3.19)
Neither fly ash nor slag are assumed to affect the early-age diffusion coefficient, D28, or
the chloride threshold, Ct. However, both materials impact the rate of reduction in diffusivity and
hence the value of m. The presence of the silica fume is affecting the diffusion coefficient decay
factor as shown below. (Life-365, 2014)
= 0.2 + 0.4(% / % / ) < 0.6 (3.20)
(Only valid up to replacement levels of 50% of fly ash or 70% of slag)
Ferreira (2010) provide a model suitable for concrete with high-performance Portland
cement, silica fume, fly ash and slag. And the influence of temperature has been addressed in his
models as shown below:
D(t) = D , Kf(t)f(T) (3.21)
f(T) = ( 294) ∙ exp [ ∙ 1294 − 1 ] (3.22)
50
f(t) = (3.23)
Where,
= Activation energy of diffusion process (J mol-1)
R = Gas constant (8.314 J mol-1 K-1)
In addition, a more detailed diffusion coefficient estimation model was presented by
Saetta (1993) for silica fume concrete that also incorporates the influence of relative humidity as
shown below;
D = D f (T)f (t)f (h) (3.24)
f (T) = exp ∙ 1 − 1 (3.25)
f (t) = + (1 − ).
(3.26)
f (h) = [1 + (1 − ℎ)1 − ℎ
] (3.27)
Where,
= Constant from 0 to 1
ℎ = Current humidity (%)
ℎ = Critical humidity level at which the diffusion coefficient drops halfway between the
maximum and minimum value (%)
Besides the parameters included in the scientific models introduced above, such as
temperature, water cement ratio, binder type and hydration process, the chloride diffusion
coefficient is also affected by other parameters. Various experiments are designed and conducted
by researchers to investigate these influencing parameters.
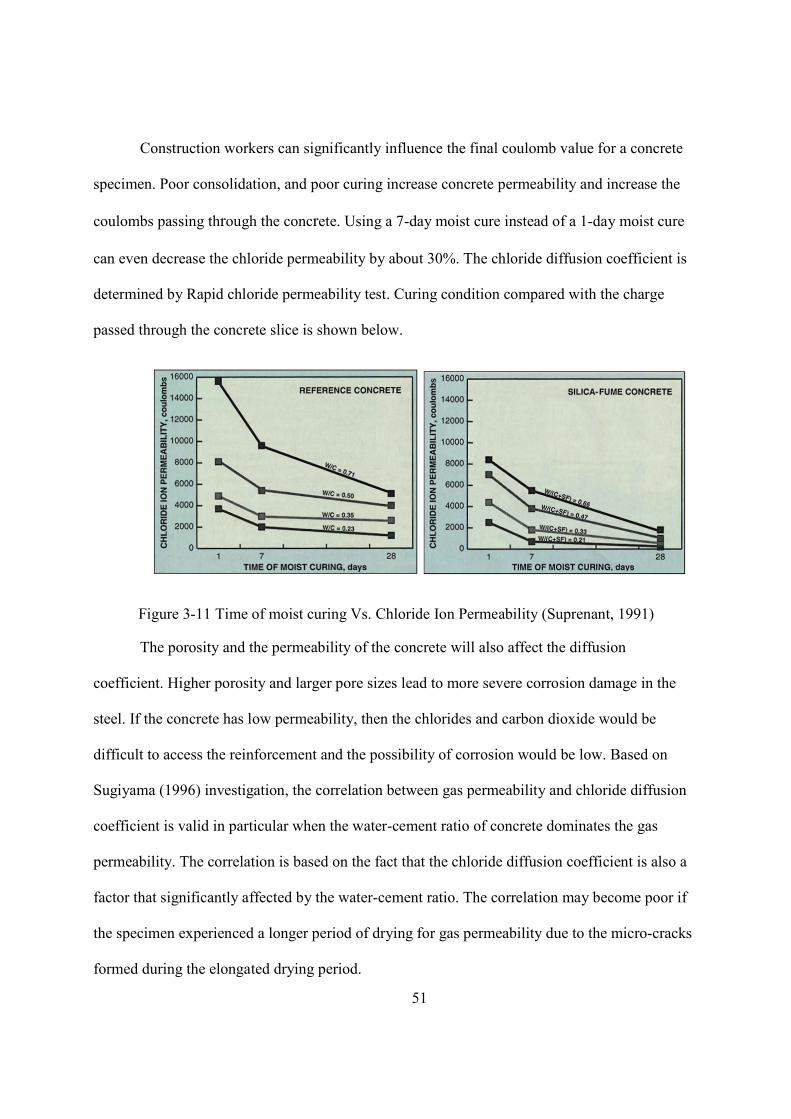
51
Construction workers can significantly influence the final coulomb value for a concrete
specimen. Poor consolidation, and poor curing increase concrete permeability and increase the
coulombs passing through the concrete. Using a 7-day moist cure instead of a 1-day moist cure
can even decrease the chloride permeability by about 30%. The chloride diffusion coefficient is
determined by Rapid chloride permeability test. Curing condition compared with the charge
passed through the concrete slice is shown below.
Figure 3-11 Time of moist curing Vs. Chloride Ion Permeability (Suprenant, 1991)
The porosity and the permeability of the concrete will also affect the diffusion
coefficient. Higher porosity and larger pore sizes lead to more severe corrosion damage in the
steel. If the concrete has low permeability, then the chlorides and carbon dioxide would be
difficult to access the reinforcement and the possibility of corrosion would be low. Based on
Sugiyama (1996) investigation, the correlation between gas permeability and chloride diffusion
coefficient is valid in particular when the water-cement ratio of concrete dominates the gas
permeability. The correlation is based on the fact that the chloride diffusion coefficient is also a
factor that significantly affected by the water-cement ratio. The correlation may become poor if
the specimen experienced a longer period of drying for gas permeability due to the micro-cracks
formed during the elongated drying period.
52
The presence of cracks will also have a great impact on the chloride diffusion coefficient.
Gerard (2000) states that for Ordinary Portland Cement with a water cement ratio of 0.45, the
chloride diffusion coefficient jumped from 9.7 × 10 / for the virgin concrete to 76.52 ×
10 / after experiencing 95 freeze and thaw cycles. Relations regarding to the ratio
between the chloride diffusion coefficients for undamaged and damaged concrete specimen have
been correlated with the ratio of effective elastic modulus of concrete under these two different
conditions. Jang (2011) also conducted research on the effect of crack width on chloride
diffusion coefficients of concrete. Zhang (2011) also investigated the relation between cracks
and the diffusion coefficient.
Care (2003) and Liu (2011) studied the impact of different types of aggregates on the
diffusion coefficient of the concrete.
In addition, the influence of deterioration during service, exposure conditions and the
impact of chloride binding are also investigated by different scholars. The chloride diffusion
coefficient reported from published data is given in Appendix C, which includes the diffusion
information on the type of sample and the exposure condition from which that data was obtained.
Test Methods
Diffusion coefficient is defined as the rate of transfer of the diffusing substance across a
unit area of a section divided by the space gradient of concentration at the section.
Two types of diffusion coefficients can be tested by different tests: steady-stated
diffusion coefficient refers to the pore solution concentration and non-steady-state diffusion
coefficient, measured by the units of percentage of the mass of cement.
53
The commonly used tests are the rapid chloride permeability test (RCPT), salt ponding
test, rapid migration test and bulk diffusion test.
3.4.2.1 RCPT
The rapid chloride permeability test (RCPT) was developed in 1981 by David Whiting
for the Federal Highway Administration, FHWA (Gergely, 2006). It was developed to provide an
alternative to the salt ponding test, which is a long-term test.
The basic principle behind the RCPT is the applied voltage technique. This technique is
based on the principle that a charged ion, such as chloride ions, will migrate in an electric field in
the direction of the pole of the opposite charge.
Although the test shows good correlation for Portland cement concrete, it does not
provide high correlations with concretes with admixtures or supplementary cementitious
materials. The presence of silica fume and fly ash will change the pore fluid conductivity and
the micro-structural characteristics of the concrete, and it will cause an increase in the amount of
charge passed during the RCPT test, which may lead to an overestimated value for the chloride
permeability.
Mineral admixtures are not the only concrete additives that disrupt the RCPT. Nitrite-
based corrosion inhibitors also cause unduly high RCPT values. These inhibitors are used to fend
off corrosion of rebars due to chemical attacks.
3.4.2.2 Salt Ponding Test
The salt ponding test is the most widely accepted test method for determining the
chloride permeability of concrete. There are two versions of this test: AASHTO T259 and
54
ASTM C1543 (AASHTO & ASTM, 2002). The AASHTO test consists of 42 days of preparation
and 90 days of ponding. The ASTM method lasts for a subjective length of time determined by
the concrete type. Both tests require a 3% salt solution to be ponded on concrete slabs measuring
12” square by 3” thick. This solution is changed every two months for the ASTM method, while
it is not changed for AASHTO. The chloride concentration is determined for 0.5-inch slices of
the slab. (Gergely, 2006)
There are some criticisms for the salt ponding test. The first one is that due to the nature
of the test, the method gives an average chloride concentration over a 0.5” section instead of a
real chloride profile. This difference will introduce error during the curve fitting process.
Another issue is that the salt ponding test allows chloride ingression by other chloride
transpiration mechanisms. This test allows for other transport mechanisms including sorption and
wicking. The concrete should be dried for 28 days before the solution is added. When the
solution is added, there will be suction of the chloride solution due to the wetting effect.
3.4.2.3 Rapid Migration Test
Tang and Nilsson proposed a variation on the conventional migration cell unique enough
to be mentioned separately. A migration cell is set up with a specimen 50 mm thick and 100 mm
in diameter, and an applied voltage of 30 V, as shown in Figure 3-12. (Stanish, 1997)
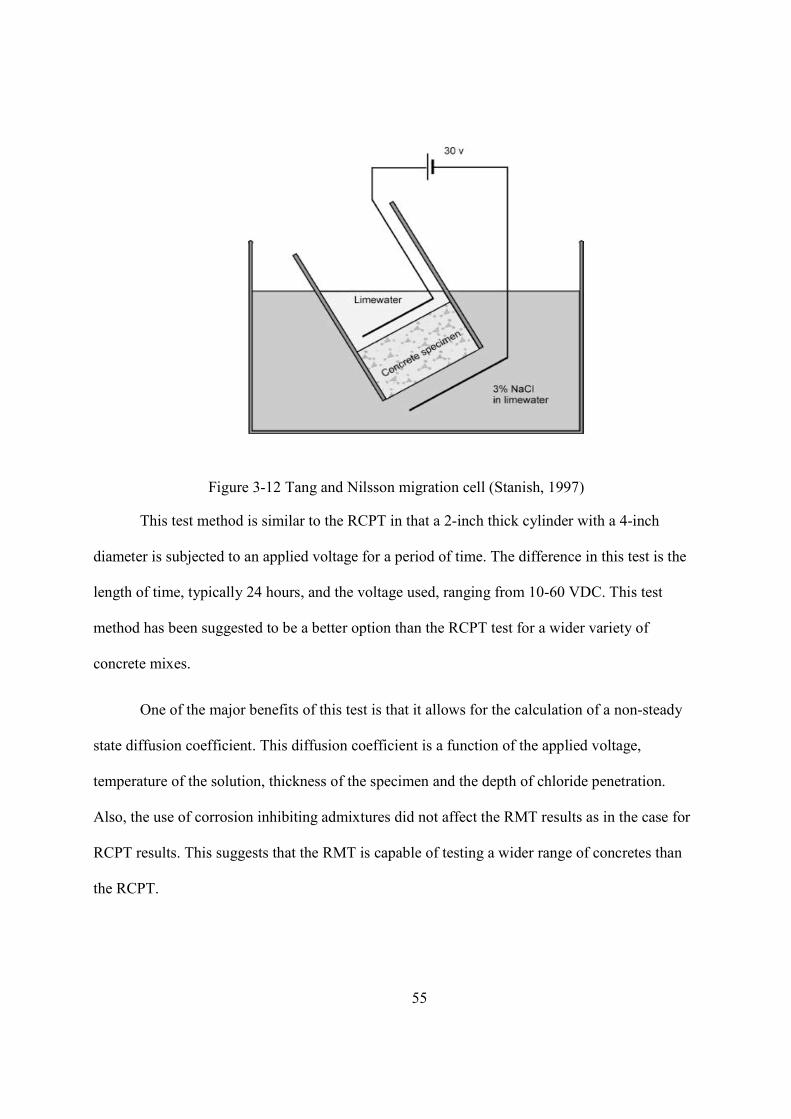
55
Figure 3-12 Tang and Nilsson migration cell (Stanish, 1997)
This test method is similar to the RCPT in that a 2-inch thick cylinder with a 4-inch
diameter is subjected to an applied voltage for a period of time. The difference in this test is the
length of time, typically 24 hours, and the voltage used, ranging from 10-60 VDC. This test
method has been suggested to be a better option than the RCPT test for a wider variety of
concrete mixes.
One of the major benefits of this test is that it allows for the calculation of a non-steady
state diffusion coefficient. This diffusion coefficient is a function of the applied voltage,
temperature of the solution, thickness of the specimen and the depth of chloride penetration.
Also, the use of corrosion inhibiting admixtures did not affect the RMT results as in the case for
RCPT results. This suggests that the RMT is capable of testing a wider range of concretes than
the RCPT.
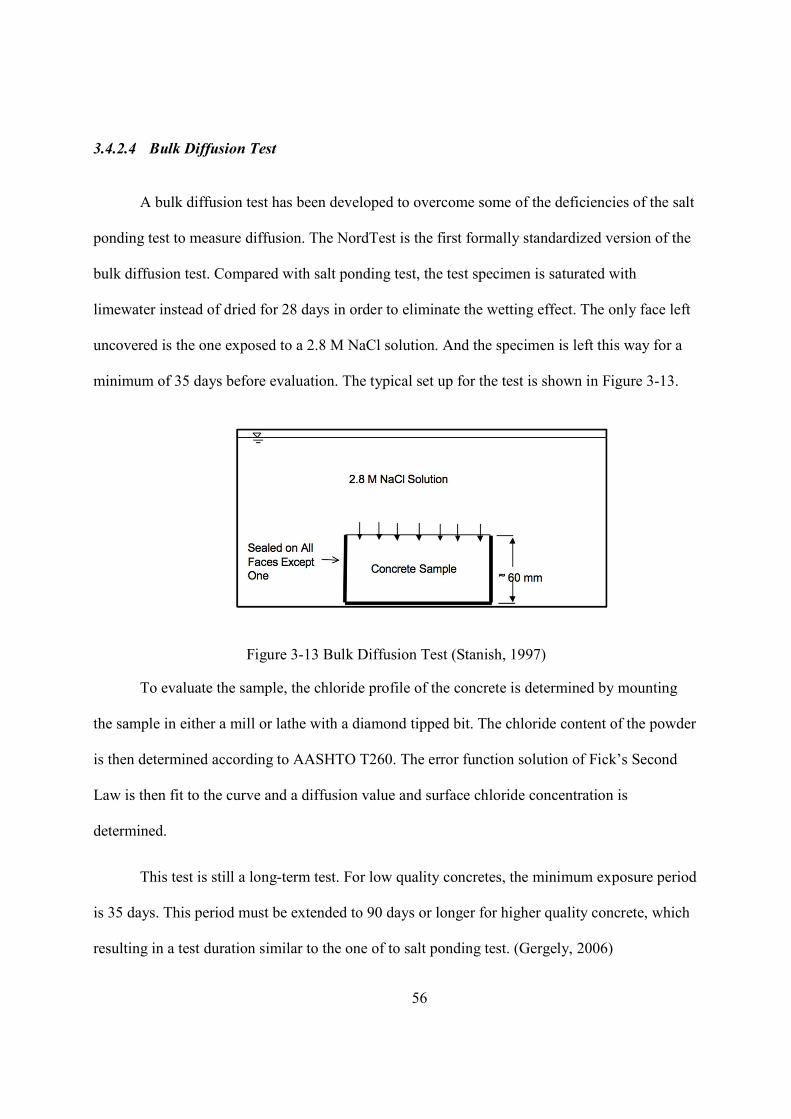
56
3.4.2.4 Bulk Diffusion Test
A bulk diffusion test has been developed to overcome some of the deficiencies of the salt
ponding test to measure diffusion. The NordTest is the first formally standardized version of the
bulk diffusion test. Compared with salt ponding test, the test specimen is saturated with
limewater instead of dried for 28 days in order to eliminate the wetting effect. The only face left
uncovered is the one exposed to a 2.8 M NaCl solution. And the specimen is left this way for a
minimum of 35 days before evaluation. The typical set up for the test is shown in Figure 3-13.
Figure 3-13 Bulk Diffusion Test (Stanish, 1997)
To evaluate the sample, the chloride profile of the concrete is determined by mounting
the sample in either a mill or lathe with a diamond tipped bit. The chloride content of the powder
is then determined according to AASHTO T260. The error function solution of Fick’s Second
Law is then fit to the curve and a diffusion value and surface chloride concentration is
determined.
This test is still a long-term test. For low quality concretes, the minimum exposure period
is 35 days. This period must be extended to 90 days or longer for higher quality concrete, which
resulting in a test duration similar to the one of to salt ponding test. (Gergely, 2006)

57
3.5. Proposed Refined Numerical Models for Estimating Dc
Chloride diffusion coefficient is a vital parameter in estimating the chloride-induced
corrosion for reinforced concrete. The chloride diffusion coefficients can be classified as:
The real but unknown chloride diffusion coefficient. The apparent chloride diffusion coefficient obtained by curve fitting to a chloride
profile. The instant chloride diffusion coefficient as measured by RCP test, etc.
The derivation of chloride diffusion coefficient is usually based on the curve fitting of the
chloride profile extracted from the field data using Fick’s law. The chloride profile of the
element could be obtained by chloride content tests. There are many lab techniques and field
measurements for measuring chloride content in reinforced concrete structures, such as
potentiometric and Volhard methods, ion selective electrodes, electrical resistivity and optical
fiber sensor.
The curve fitting method yields to the apparent chloride diffusion coefficient over a
period of time, which is extremely suitable for estimating the chloride profile for old marine
concrete structures. However, due to time-dependent nature of chloride diffusion coefficient, this
method gives unreliable estimation of the chloride profile for younger structures since it
overestimates the diffusion penetration by a large margin. In such cases, the time-dependent
diffusion coefficient should be predicted by scientific method.
In this study, a revised equation for estimating time-dependent chloride diffusion
coefficient is proposed. In order to do so, the decisive parameters governing the chloride
diffusion coefficient have been identified and evaluated. The major factors incorporated in the
scientific model that dominate the diffusion coefficient are the water cement ratio of the
58
concrete, the type and proportion of cementitious materials. Factors reflect the aging of the
concrete, presence of cracks, exposure conditions, curing conditions and stress level are also
investigated.
The proposed equation is expressed as:
( , ) = (3.28)
Where,
D = Reference chloride diffusion coefficient
= Effects of aging of the concrete
= Effects of chloride binding capacity
= Curing conditions
= Effects of temperature
= Environmental factor
= Effects of relative humidity
= Effects of cracking
= Content of Latex
Reference Chloride Diffusion Coefficient ( )
The reference chloride diffusion coefficient is usually measured by CTH or similar tests,
usually at a maturity age of 28 days. It is the base chloride diffusion coefficient that is measured
59
in the lab, under controlled environment conditions. The concrete specimen should be well cured
and stored at a constant temperature while fully saturated.
The reference chloride diffusion coefficient reflects the initial resistance of the concrete
to chloride penetration. It is mainly affected by the water cement ratio and the type of the binder,
which controls the micro structure in the concrete.
If the experimental data is not available, the chloride diffusion coefficient could be
estimated by the following equation used in Life-365 (2014):
= 1 × 10( . . ⁄ )
· −0.165· (3.29)
Where, SF= the percentage of silica fume (%)
Aging Factor ( )
Time dependency of chloride diffusion coefficient plays a vital role in the service life
prediction of concrete structure. In general, chloride diffusion coefficient often decreases with
time due to the process of hydration. The commonly used equation to quantify the time
dependency is as follows:
=t
t (3.30)
In which, is the time corresponding to the reference chloride diffusion coefficient,
is the exposure time and is a constant.
This exponential equation is widely used by researchers. The age factor, , is important
for service life prediction. It depends on the concrete mixture proportions, especially on the
water cement ratio of various mixes. (Song, 2013) The exposure condition may also affect the
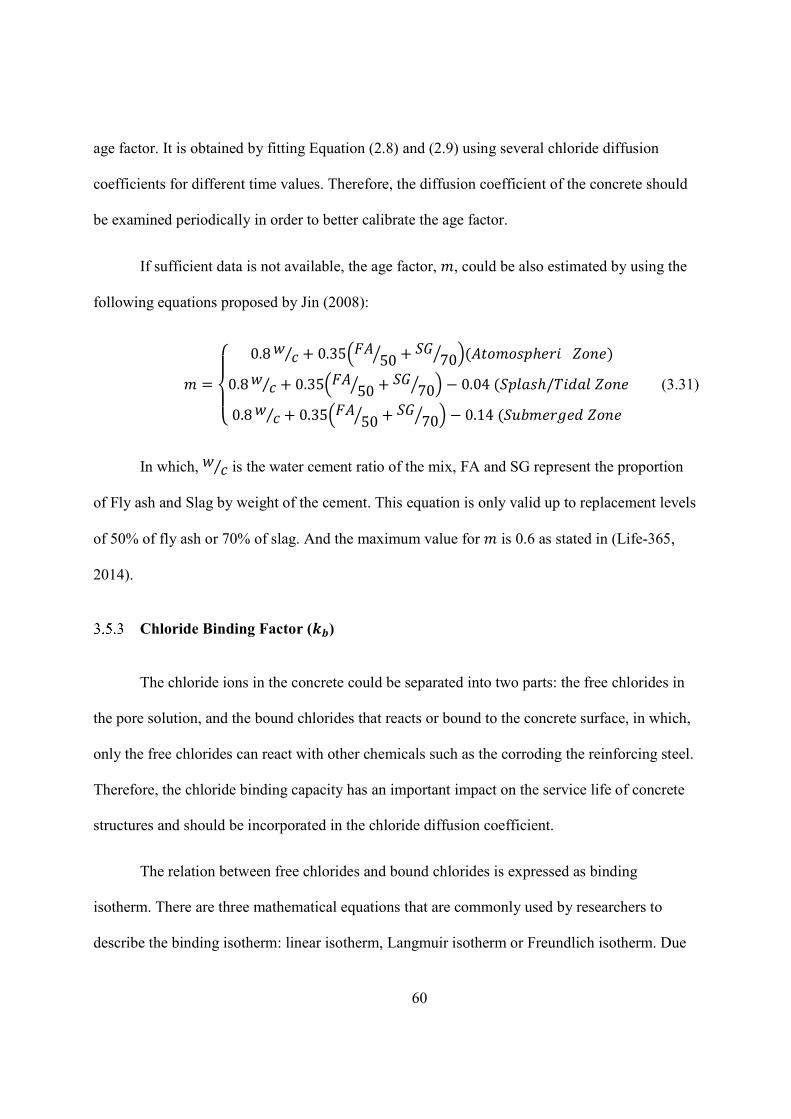
60
age factor. It is obtained by fitting Equation (2.8) and (2.9) using several chloride diffusion
coefficients for different time values. Therefore, the diffusion coefficient of the concrete should
be examined periodically in order to better calibrate the age factor.
If sufficient data is not available, the age factor, , could be also estimated by using the
following equations proposed by Jin (2008):
=
0.8 ⁄ + 0.35 50 + 70 ( ℎ )
0.8 ⁄ + 0.35 50 + 70 − 0.04 ( ℎ/
0.8 ⁄ + 0.35 50 + 70 − 0.14 (
(3.31)
In which, ⁄ is the water cement ratio of the mix, FA and SG represent the proportion
of Fly ash and Slag by weight of the cement. This equation is only valid up to replacement levels
of 50% of fly ash or 70% of slag. And the maximum value for is 0.6 as stated in (Life-365,
2014).
Chloride Binding Factor ( )
The chloride ions in the concrete could be separated into two parts: the free chlorides in
the pore solution, and the bound chlorides that reacts or bound to the concrete surface, in which,
only the free chlorides can react with other chemicals such as the corroding the reinforcing steel.
Therefore, the chloride binding capacity has an important impact on the service life of concrete
structures and should be incorporated in the chloride diffusion coefficient.
The relation between free chlorides and bound chlorides is expressed as binding
isotherm. There are three mathematical equations that are commonly used by researchers to
describe the binding isotherm: linear isotherm, Langmuir isotherm or Freundlich isotherm. Due
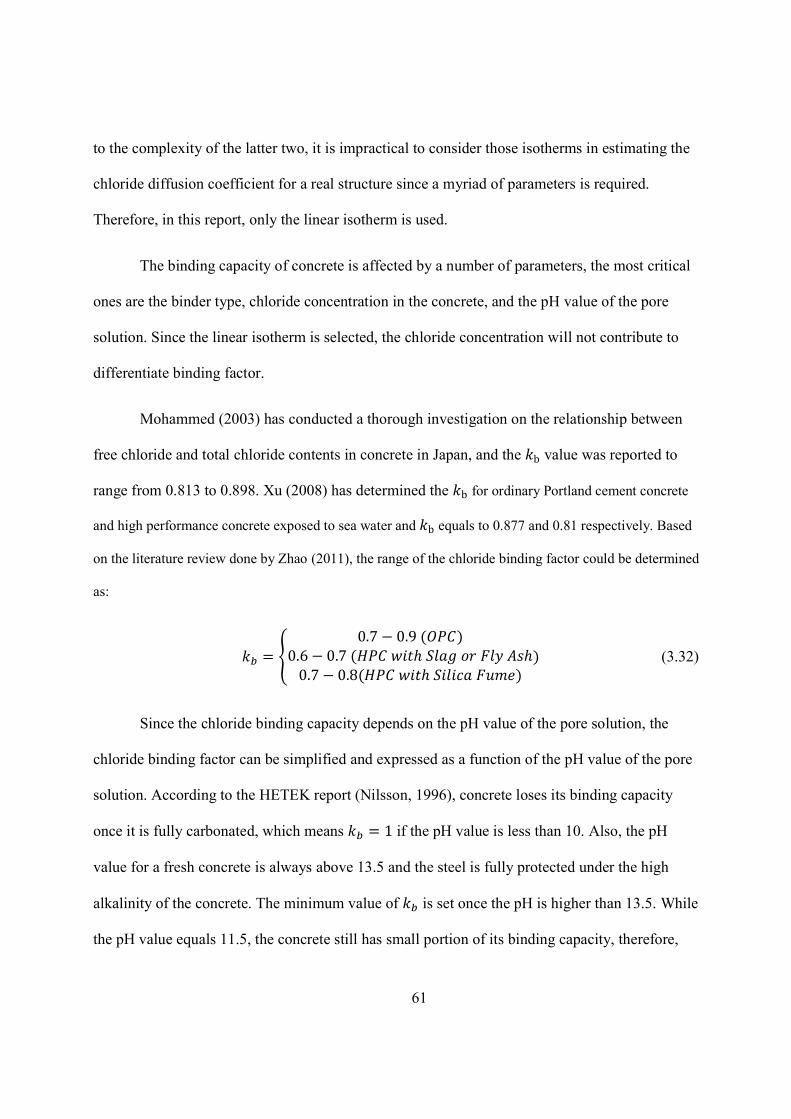
61
to the complexity of the latter two, it is impractical to consider those isotherms in estimating the
chloride diffusion coefficient for a real structure since a myriad of parameters is required.
Therefore, in this report, only the linear isotherm is used.
The binding capacity of concrete is affected by a number of parameters, the most critical
ones are the binder type, chloride concentration in the concrete, and the pH value of the pore
solution. Since the linear isotherm is selected, the chloride concentration will not contribute to
differentiate binding factor.
Mohammed (2003) has conducted a thorough investigation on the relationship between
free chloride and total chloride contents in concrete in Japan, and the b value was reported to
range from 0.813 to 0.898. Xu (2008) has determined the b for ordinary Portland cement concrete
and high performance concrete exposed to sea water and b equals to 0.877 and 0.81 respectively. Based
on the literature review done by Zhao (2011), the range of the chloride binding factor could be determined
as:
=0.7 − 0.9 ( )
0.6 − 0.7 ( ℎ ℎ0.7 − 0.8( ℎ )
) (3.32)
Since the chloride binding capacity depends on the pH value of the pore solution, the
chloride binding factor can be simplified and expressed as a function of the pH value of the pore
solution. According to the HETEK report (Nilsson, 1996), concrete loses its binding capacity
once it is fully carbonated, which means = 1 if the pH value is less than 10. Also, the pH
value for a fresh concrete is always above 13.5 and the steel is fully protected under the high
alkalinity of the concrete. The minimum value of is set once the pH is higher than 13.5. While
the pH value equals 11.5, the concrete still has small portion of its binding capacity, therefore,

62
the minimum value from the literature is assigned at pH value of 11.5. A linear relationship is
assumed between the pH value and the chloride binding factor. The chloride binding factor could
be determined from Figure 3-14.
Figure 3-14 Chloride Binding Factor
Curing Factor ( )
Initial curing has a vital impact on the chloride diffusion coefficient. Concrete will show
a higher chloride diffusion coefficient under a short curing period due to the micro cracks formed
inside the concrete. Based on the research done by Alizadeh (2008), Costa (1999) and the
Duracrete (2000), a chart has been created to estimate the curing factor under various curing
regimes.
Table 3-6 Curing Factor for Different Curing Time
Curing time (days) 1 3 7 28
kc 2.7 1.8 1.4 1
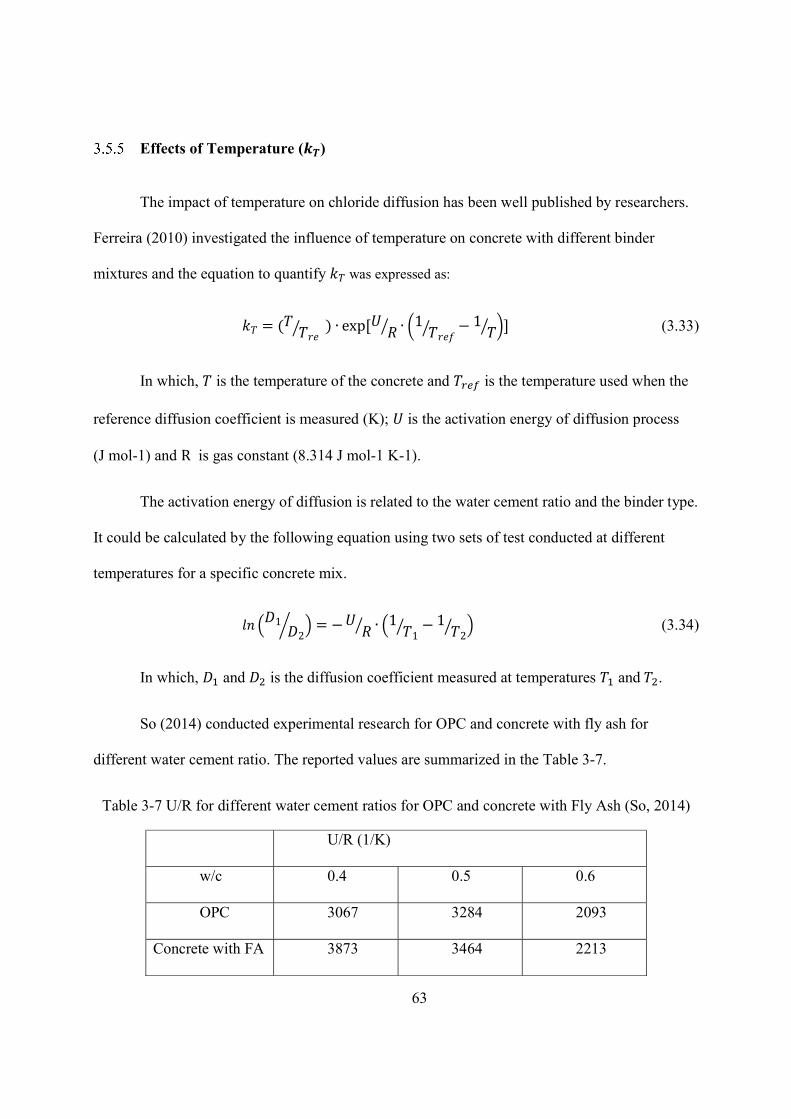
63
Effects of Temperature ( )
The impact of temperature on chloride diffusion has been well published by researchers.
Ferreira (2010) investigated the influence of temperature on concrete with different binder
mixtures and the equation to quantify was expressed as:
= ( ) ∙ exp [ ∙ 1 − 1 ] (3.33)
In which, is the temperature of the concrete and is the temperature used when the
reference diffusion coefficient is measured (K); is the activation energy of diffusion process
(J mol-1) and R is gas constant (8.314 J mol-1 K-1).
The activation energy of diffusion is related to the water cement ratio and the binder type.
It could be calculated by the following equation using two sets of test conducted at different
temperatures for a specific concrete mix.
12
= − ∙ 11
− 12
(3.34)
In which, and is the diffusion coefficient measured at temperatures and .
So (2014) conducted experimental research for OPC and concrete with fly ash for
different water cement ratio. The reported values are summarized in the Table 3-7.
Table 3-7 U/R for different water cement ratios for OPC and concrete with Fly Ash (So, 2014)
U/R (1/K)
w/c 0.4 0.5 0.6
OPC 3067 3284 2093
Concrete with FA 3873 3464 2213
64
Interpolation of the values in the chart could be used for simplification if the
experimental tests data is lacking.
Environmental Factor ( )
Exposure condition of the concrete element exhibits a great impact on the chloride
diffusion coefficient. For marine structures, chloride diffusion coefficient shows a great
difference for bridge elements exposed in submerged zone, tidal zone, splash zone and
atmospheric zone. It is obvious that the impact is due to the amount of chloride available in the
surrounding environment, the temperature, relative humidity, mechanism of chloride
transportation. Since the temperature and relative humidity is discussed by another factor, this
environmental factor mainly counts for the chloride transportation mechanism as well as the
amount of chloride available.
Unlike the concrete in the submerged zone, the concrete in splash and tidal zone is
constantly experiencing wet and dry cycle, the surface chloride concentration is much higher due
to the crystallization of salt in the pore structure. Also, the chloride ions will transport into the
concrete by capillary suction besides diffusion which result in a higher diffusion coefficient
compared to submerged zone. The atmospheric zone is exposed to chlorides in the air and it also
yields to a different value.
Wang (2008) has reviewed the environmental factor published by various researchers and
the range for environmental factor has been listed in the following table.
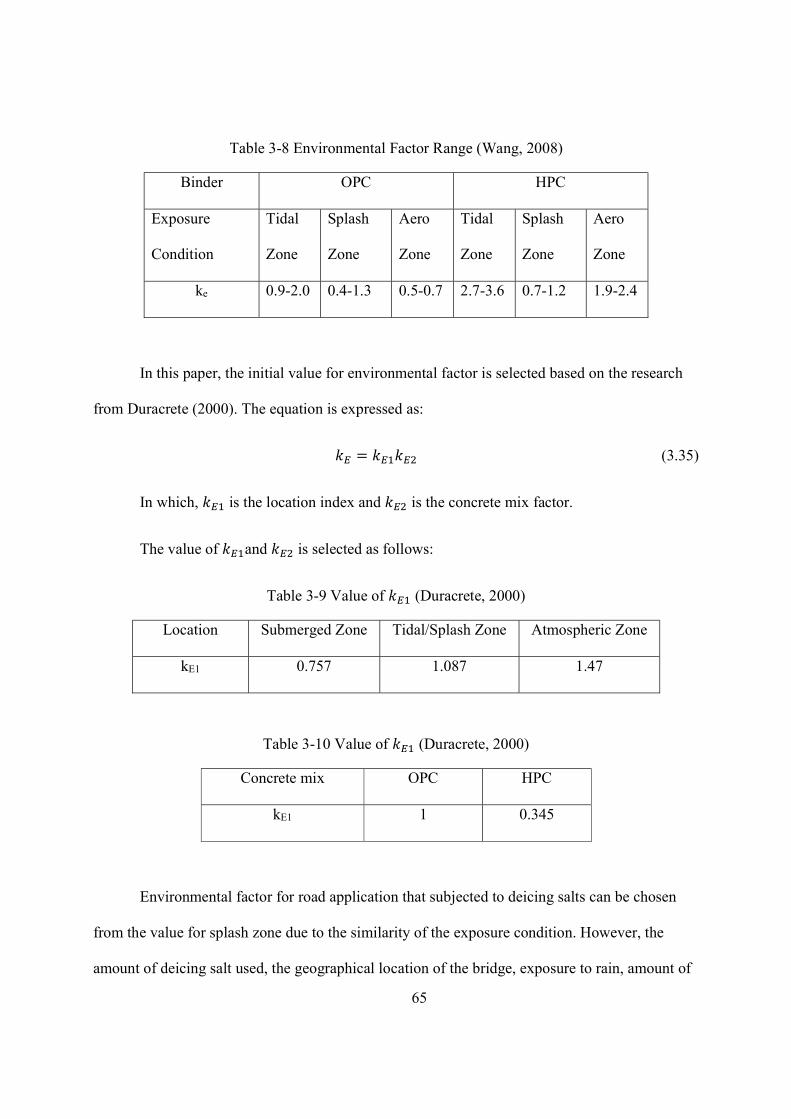
65
Table 3-8 Environmental Factor Range (Wang, 2008)
Binder OPC HPC
Exposure
Condition
Tidal
Zone
Splash
Zone
Aero
Zone
Tidal
Zone
Splash
Zone
Aero
Zone
ke 0.9-2.0 0.4-1.3 0.5-0.7 2.7-3.6 0.7-1.2 1.9-2.4
In this paper, the initial value for environmental factor is selected based on the research
from Duracrete (2000). The equation is expressed as:
= (3.35)
In which, is the location index and is the concrete mix factor.
The value of and is selected as follows:
Table 3-9 Value of (Duracrete, 2000)
Location Submerged Zone Tidal/Splash Zone Atmospheric Zone
kE1 0.757 1.087 1.47
Table 3-10 Value of (Duracrete, 2000)
Concrete mix OPC HPC
kE1 1 0.345
Environmental factor for road application that subjected to deicing salts can be chosen
from the value for splash zone due to the similarity of the exposure condition. However, the
amount of deicing salt used, the geographical location of the bridge, exposure to rain, amount of
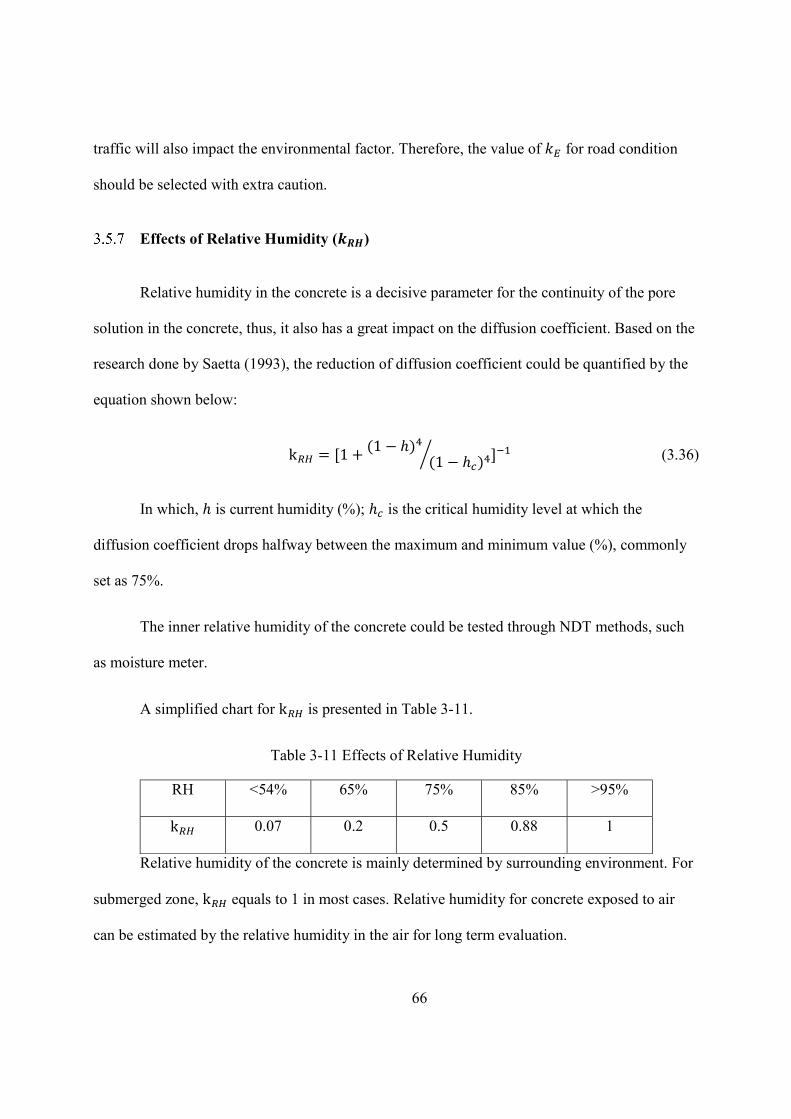
66
traffic will also impact the environmental factor. Therefore, the value of for road condition
should be selected with extra caution.
Effects of Relative Humidity ( )
Relative humidity in the concrete is a decisive parameter for the continuity of the pore
solution in the concrete, thus, it also has a great impact on the diffusion coefficient. Based on the
research done by Saetta (1993), the reduction of diffusion coefficient could be quantified by the
equation shown below:
k = [1 + (1 − ℎ)(1 − ℎ ) ] (3.36)
In which, ℎ is current humidity (%); ℎ is the critical humidity level at which the
diffusion coefficient drops halfway between the maximum and minimum value (%), commonly
set as 75%.
The inner relative humidity of the concrete could be tested through NDT methods, such
as moisture meter.
A simplified chart for k is presented in Table 3-11.
Table 3-11 Effects of Relative Humidity
RH <54% 65% 75% 85% >95%
k 0.07 0.2 0.5 0.88 1
Relative humidity of the concrete is mainly determined by surrounding environment. For
submerged zone, k equals to 1 in most cases. Relative humidity for concrete exposed to air
can be estimated by the relative humidity in the air for long term evaluation.
67
Damage Factor ( )
Reference chloride diffusion coefficient is always measured on a specimen that is cast
and cured in a controlled environment which makes the specimen crack free. At the same time,
the specimens are often left stress free in both laboratory and field exposure tests. However, it is
not always true for the concrete from a real structure. Cracks may form at the surface of concrete
due to plastic shrinkage at early age. Through years of service, other reasons, such as
temperature, loading, excessive settlement, freeze-thaw cycling, may also cause cracks. Besides,
the bridges elements are subjected to various loading through its service life, the concrete
property will be greatly affected by the load conditions as well.
Chloride diffusion coefficients in the damaged concrete is much higher than the ones in
virgin concrete since the chloride ions may move more freely in the micro cracks within the
concrete. Researchers have stated that the crack width has a vital impact on the diffusion
coefficient for crack width greater than 0.1mm. For crack width smaller than 0.1mm, the impact
is negligible since it does not have significant impact on the diffusion coefficient. The maximum
diffusion coefficient of chloride in the crack is limited as the diffusion coefficient for pore
solution. Also, if the crack is wide enough, the surface of crack could be treated as surface
directly subjected to the exposure environment.
In order to investigate the internal damage caused chloride diffusion variation, Rahman
(2012) and Teggure (2013) has conducted several experiments. The impact of the damage is
quantified through a damage index, which is evaluated based on the differences of dynamic
modulus of elasticity of cracked and uncracked concrete. The equation used to evaluate the
damage factor is expressed as follow:
68
=. ( )
+ 1 (3.37)
In which, and are the dynamic modulus of elasticity of uncracked and cracked
concrete, respectively.
The dynamic modulus of elasticity of concrete can be determined nondestructively using
resonance tests based on measuring the fundamental flexural and torsional frequencies of
concrete specimens using a Grindosonic apparatus (Teggure, 2013). The tests should be carried
out for new structures in order to achieve a base understanding of the dynamic modulus of
elasticity of the concrete.
Another advantage of using damage index to quantify cracking impact is that the change
of modulus also relates to the freeze-thaw effect. If the concrete experiences severe freeze-thaw
cycles, micro cracks will form in the concrete which will also affect the diffusion coefficient. By
using the damage index, which is the difference of moduli of concrete, the impact of freeze-thaw
cycles on the diffusion coefficient is also evaluated.
Depending on the point in the service life of the bridge, the dynamic modulus of elasticity
is calculated as (Salman and Al-Amawee, 2006):
( ) = 7.3[ ( )] . (3.38)
In which, ( ) is the dynamic modulus of elasticity at time t in GPa, and ( ) is the
concrete compressive strength at time t in MPa; t is the time of evaluation. By adopting this
equation, the dynamic modulus of elasticity can be estimated based on the compressive strength
of the concrete.
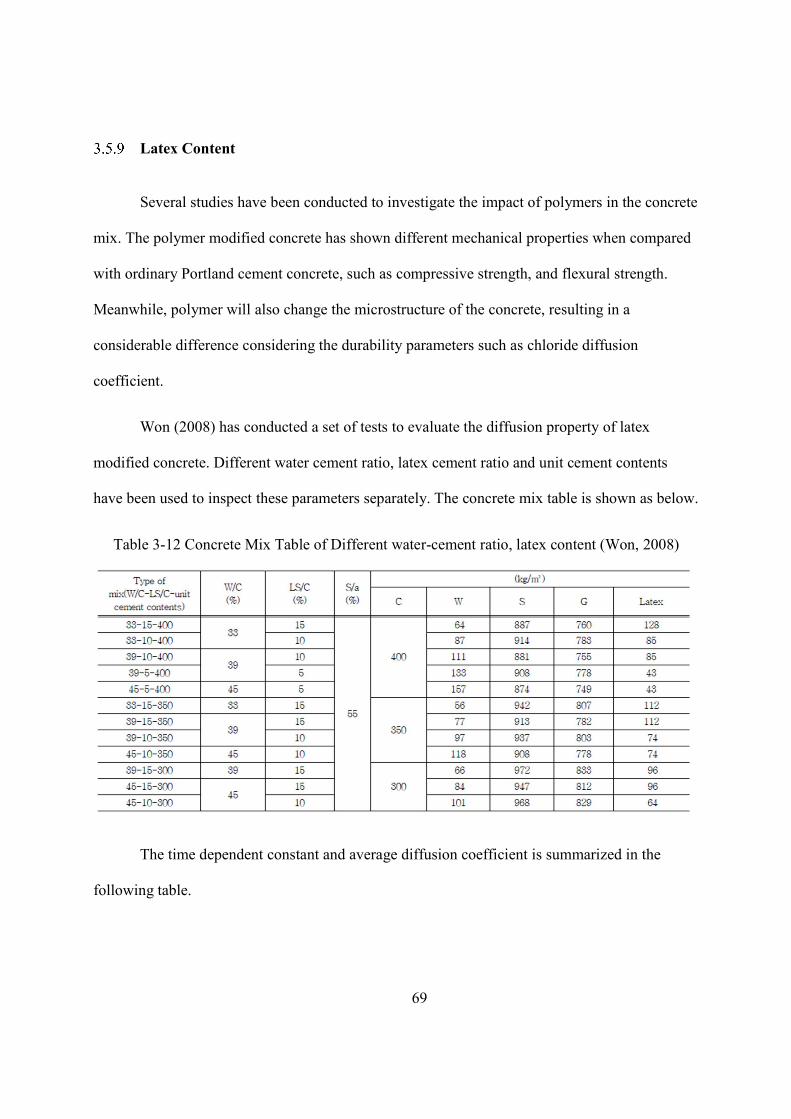
69
Latex Content
Several studies have been conducted to investigate the impact of polymers in the concrete
mix. The polymer modified concrete has shown different mechanical properties when compared
with ordinary Portland cement concrete, such as compressive strength, and flexural strength.
Meanwhile, polymer will also change the microstructure of the concrete, resulting in a
considerable difference considering the durability parameters such as chloride diffusion
coefficient.
Won (2008) has conducted a set of tests to evaluate the diffusion property of latex
modified concrete. Different water cement ratio, latex cement ratio and unit cement contents
have been used to inspect these parameters separately. The concrete mix table is shown as below.
Table 3-12 Concrete Mix Table of Different water-cement ratio, latex content (Won, 2008)
The time dependent constant and average diffusion coefficient is summarized in the
following table.
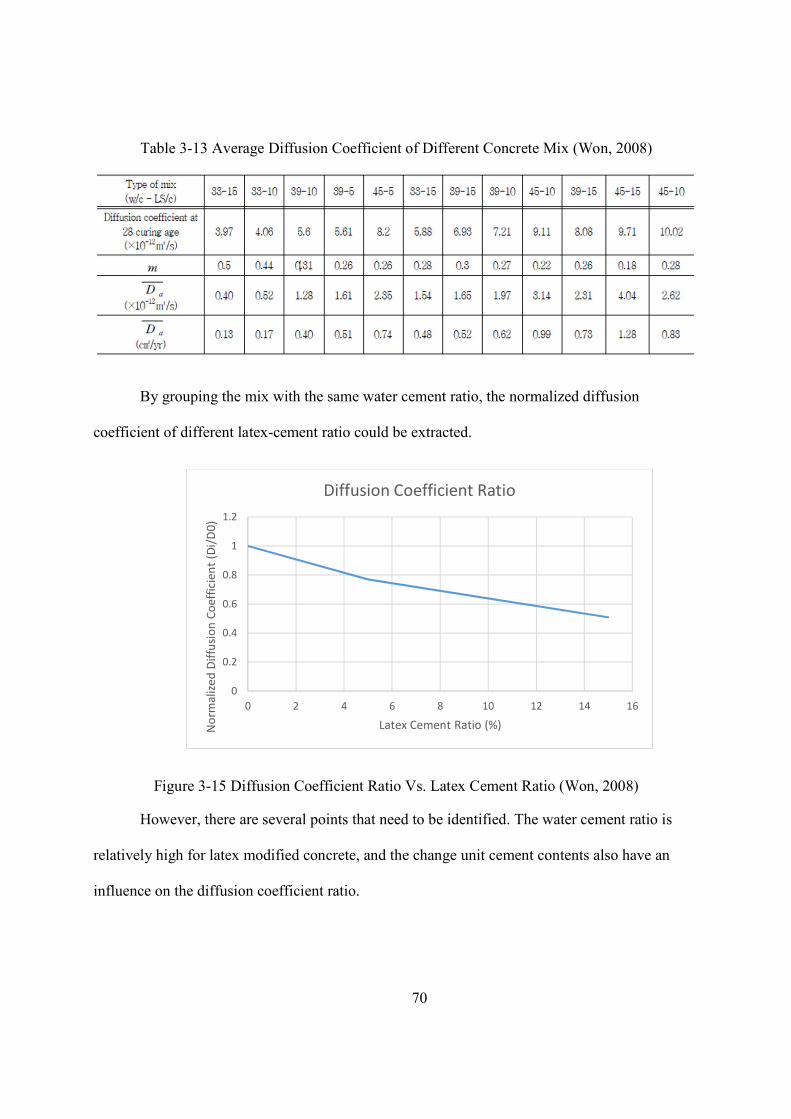
70
Table 3-13 Average Diffusion Coefficient of Different Concrete Mix (Won, 2008)
By grouping the mix with the same water cement ratio, the normalized diffusion
coefficient of different latex-cement ratio could be extracted.
Figure 3-15 Diffusion Coefficient Ratio Vs. Latex Cement Ratio (Won, 2008)
However, there are several points that need to be identified. The water cement ratio is
relatively high for latex modified concrete, and the change unit cement contents also have an
influence on the diffusion coefficient ratio.
0
0.2
0.4
0.6
0.8
1
1.2
0 2 4 6 8 10 12 14 16
Nor
mal
ized
Diff
usio
n Co
effic
ient
(Di/
D0)
Latex Cement Ratio (%)
Diffusion Coefficient Ratio
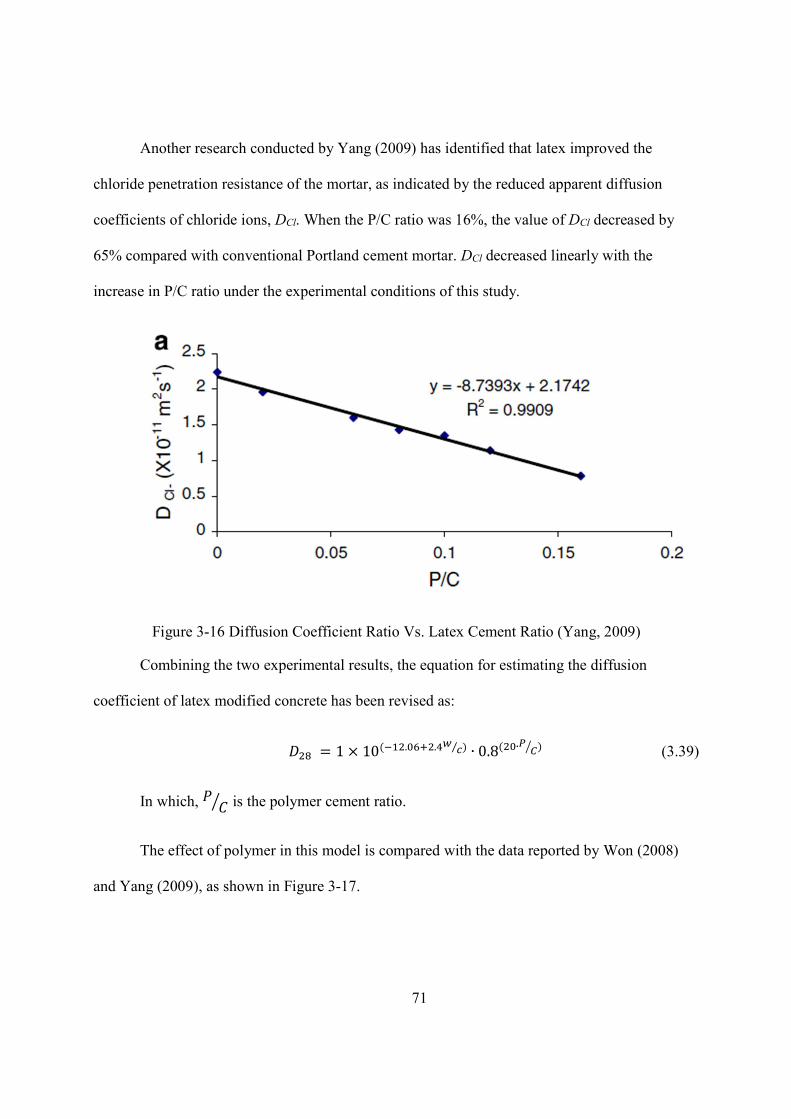
71
Another research conducted by Yang (2009) has identified that latex improved the
chloride penetration resistance of the mortar, as indicated by the reduced apparent diffusion
coefficients of chloride ions, DCl. When the P/C ratio was 16%, the value of DCl decreased by
65% compared with conventional Portland cement mortar. DCl decreased linearly with the
increase in P/C ratio under the experimental conditions of this study.
Figure 3-16 Diffusion Coefficient Ratio Vs. Latex Cement Ratio (Yang, 2009)
Combining the two experimental results, the equation for estimating the diffusion
coefficient of latex modified concrete has been revised as:
= 1 × 10( . . ⁄ ) ∙ 0.8( ∙ ) (3.39)
In which, is the polymer cement ratio.
The effect of polymer in this model is compared with the data reported by Won (2008)
and Yang (2009), as shown in Figure 3-17.
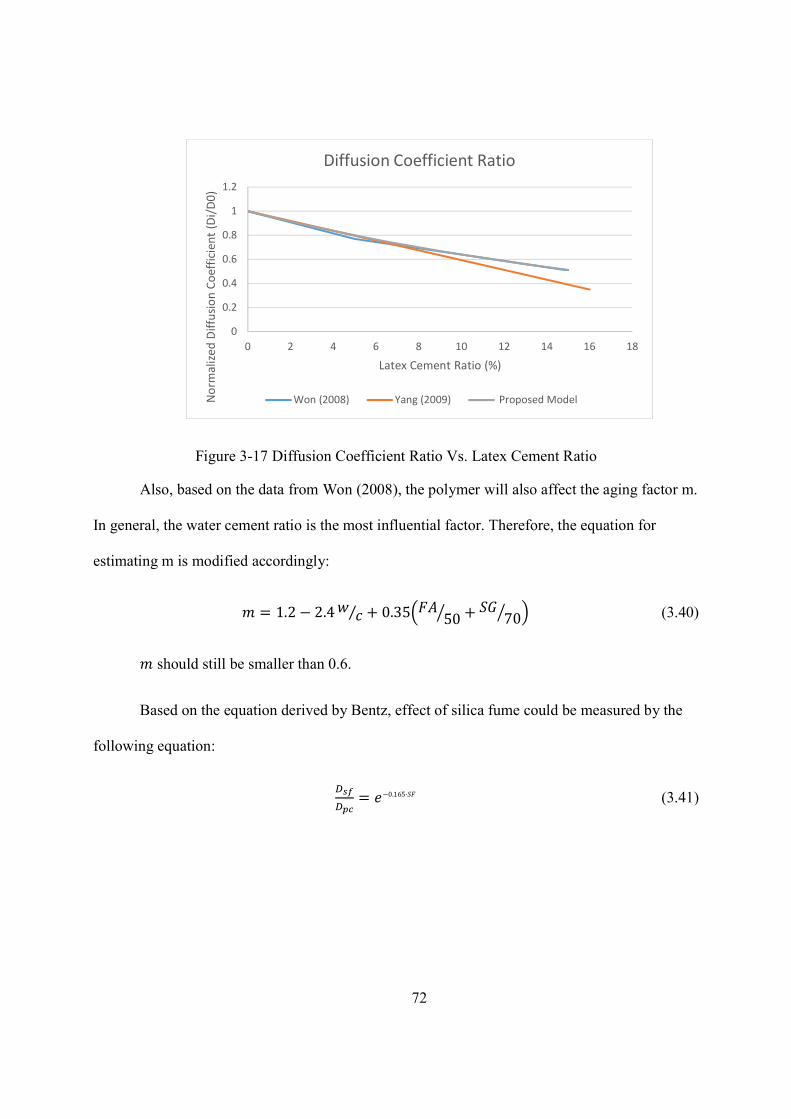
72
Figure 3-17 Diffusion Coefficient Ratio Vs. Latex Cement Ratio
Also, based on the data from Won (2008), the polymer will also affect the aging factor m.
In general, the water cement ratio is the most influential factor. Therefore, the equation for
estimating m is modified accordingly:
= 1.2 − 2.4 ⁄ + 0.35 50 + 70 (3.40)
should still be smaller than 0.6.
Based on the equation derived by Bentz, effect of silica fume could be measured by the
following equation:
= −0.165· (3.41)
0
0.2
0.4
0.6
0.8
1
1.2
0 2 4 6 8 10 12 14 16 18
Nor
mal
ized
Diff
usio
n Co
effic
ient
(Di/
D0)
Latex Cement Ratio (%)
Diffusion Coefficient Ratio
Won (2008) Yang (2009) Proposed Model
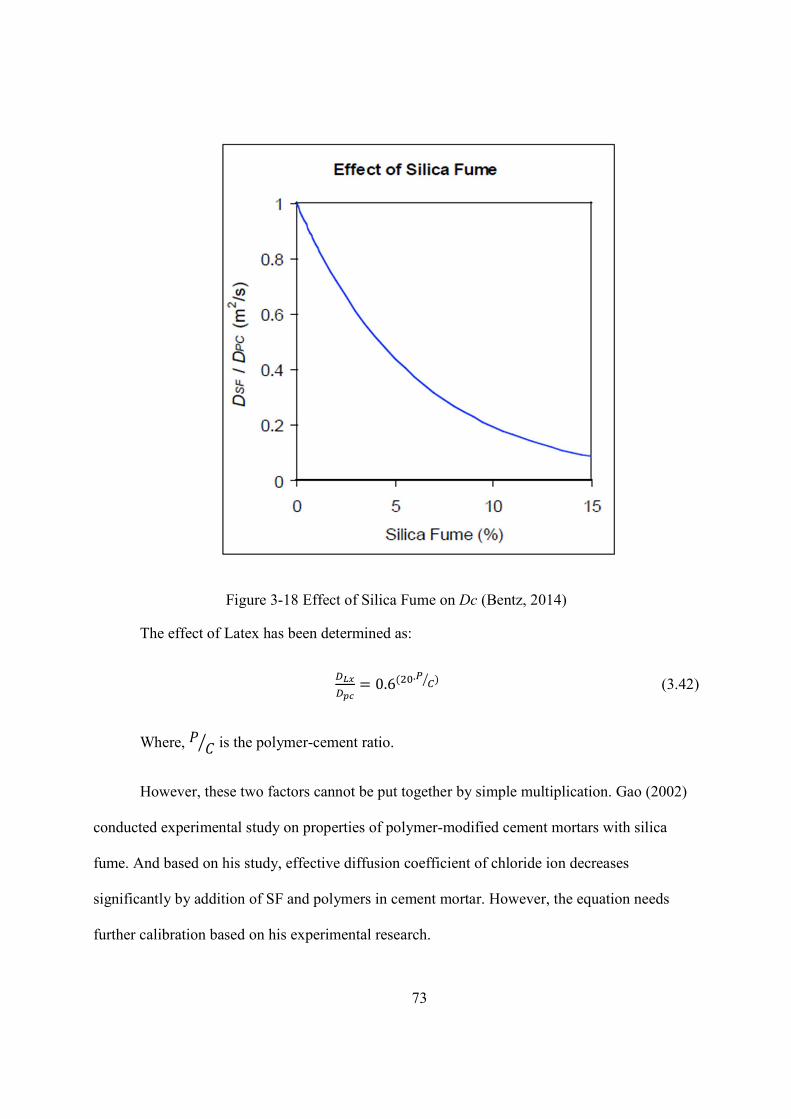
73
Figure 3-18 Effect of Silica Fume on Dc (Bentz, 2014)
The effect of Latex has been determined as:
= 0.6( ∙ ) (3.42)
Where, is the polymer-cement ratio.
However, these two factors cannot be put together by simple multiplication. Gao (2002)
conducted experimental study on properties of polymer-modified cement mortars with silica
fume. And based on his study, effective diffusion coefficient of chloride ion decreases
significantly by addition of SF and polymers in cement mortar. However, the equation needs
further calibration based on his experimental research.
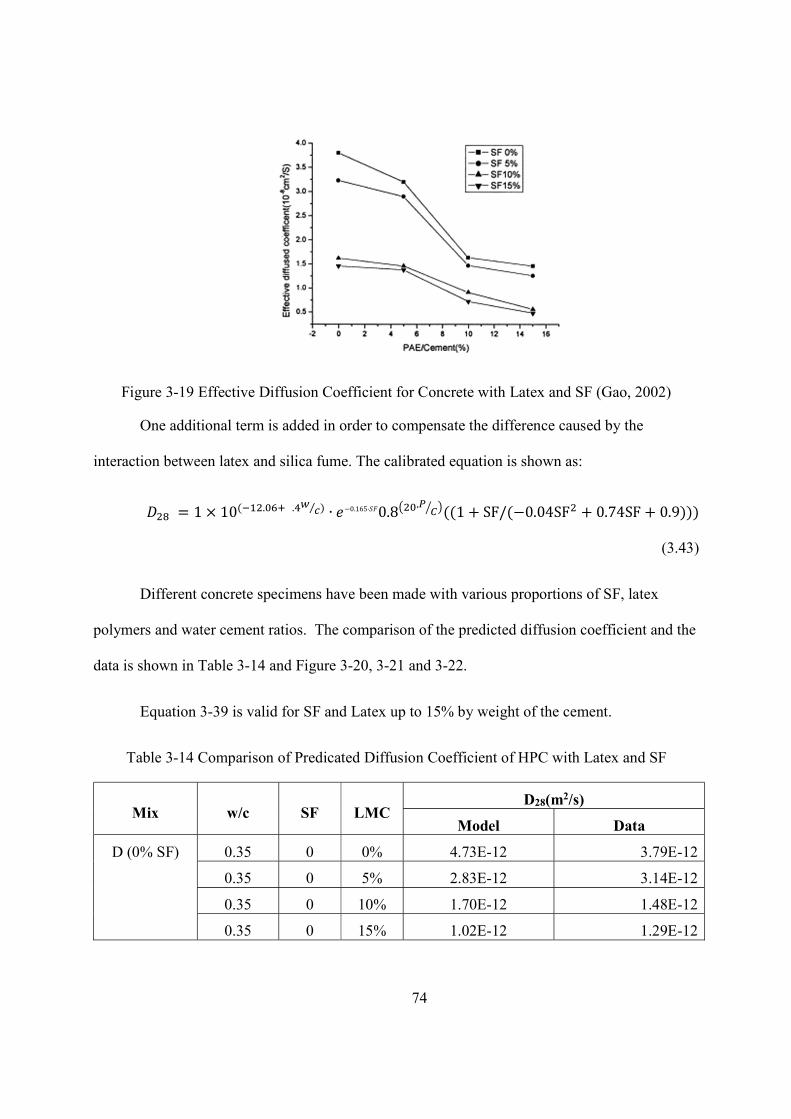
74
Figure 3-19 Effective Diffusion Coefficient for Concrete with Latex and SF (Gao, 2002)
One additional term is added in order to compensate the difference caused by the
interaction between latex and silica fume. The calibrated equation is shown as:
= 1 × 10( . . ⁄ ) ∙ −0.165· 0.8 ∙ ((1 + SF/(−0.04SF + 0.74SF + 0.9)))
(3.43)
Different concrete specimens have been made with various proportions of SF, latex
polymers and water cement ratios. The comparison of the predicted diffusion coefficient and the
data is shown in Table 3-14 and Figure 3-20, 3-21 and 3-22.
Equation 3-39 is valid for SF and Latex up to 15% by weight of the cement.
Table 3-14 Comparison of Predicated Diffusion Coefficient of HPC with Latex and SF
Mix w/c SF LMC D28(m2/s)
Model Data
D (0% SF)
0.35 0 0% 4.73E-12 3.79E-12
0.35 0 5% 2.83E-12 3.14E-12
0.35 0 10% 1.70E-12 1.48E-12
0.35 0 15% 1.02E-12 1.29E-12
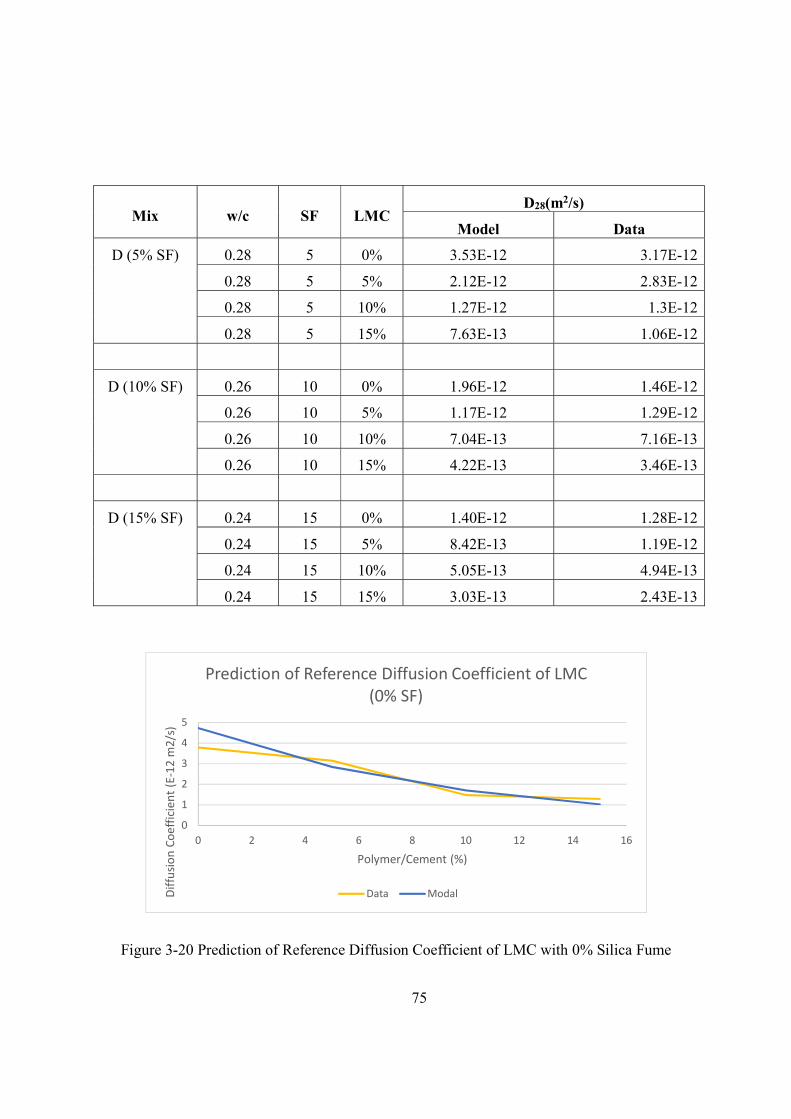
75
Mix w/c SF LMC D28(m2/s)
Model Data
D (5% SF)
0.28 5 0% 3.53E-12 3.17E-12
0.28 5 5% 2.12E-12 2.83E-12
0.28 5 10% 1.27E-12 1.3E-12
0.28 5 15% 7.63E-13 1.06E-12
D (10% SF)
0.26 10 0% 1.96E-12 1.46E-12
0.26 10 5% 1.17E-12 1.29E-12
0.26 10 10% 7.04E-13 7.16E-13
0.26 10 15% 4.22E-13 3.46E-13
D (15% SF)
0.24 15 0% 1.40E-12 1.28E-12
0.24 15 5% 8.42E-13 1.19E-12
0.24 15 10% 5.05E-13 4.94E-13
0.24 15 15% 3.03E-13 2.43E-13
Figure 3-20 Prediction of Reference Diffusion Coefficient of LMC with 0% Silica Fume
0
1
2
3
4
5
0 2 4 6 8 10 12 14 16
Diff
usio
n Co
effic
ient
(E-1
2 m
2/s)
Polymer/Cement (%)
Prediction of Reference Diffusion Coefficient of LMC (0% SF)
Data Modal
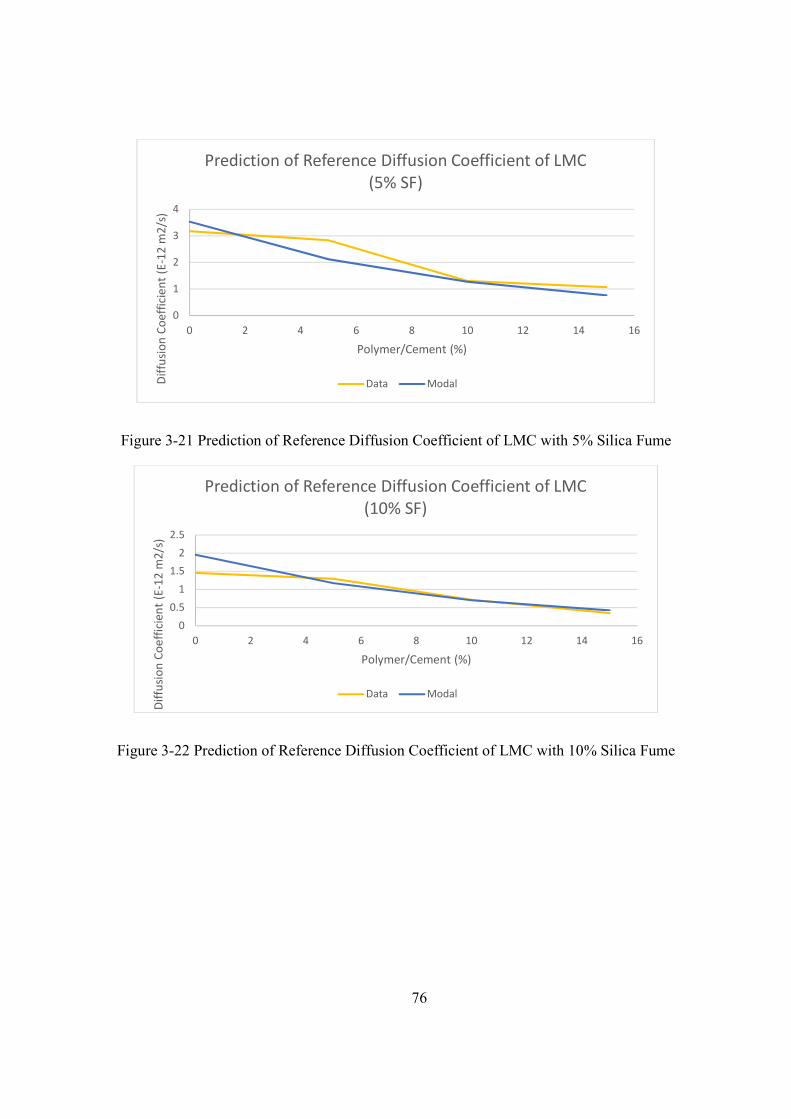
76
Figure 3-21 Prediction of Reference Diffusion Coefficient of LMC with 5% Silica Fume
Figure 3-22 Prediction of Reference Diffusion Coefficient of LMC with 10% Silica Fume
0
1
2
3
4
0 2 4 6 8 10 12 14 16
Diff
usio
n Co
effic
ient
(E-1
2 m
2/s)
Polymer/Cement (%)
Prediction of Reference Diffusion Coefficient of LMC (5% SF)
Data Modal
0
0.5
1
1.5
2
2.5
0 2 4 6 8 10 12 14 16
Diffu
sion
Coe
ffici
ent (
E-12
m2/
s)
Polymer/Cement (%)
Prediction of Reference Diffusion Coefficient of LMC (10% SF)
Data Modal
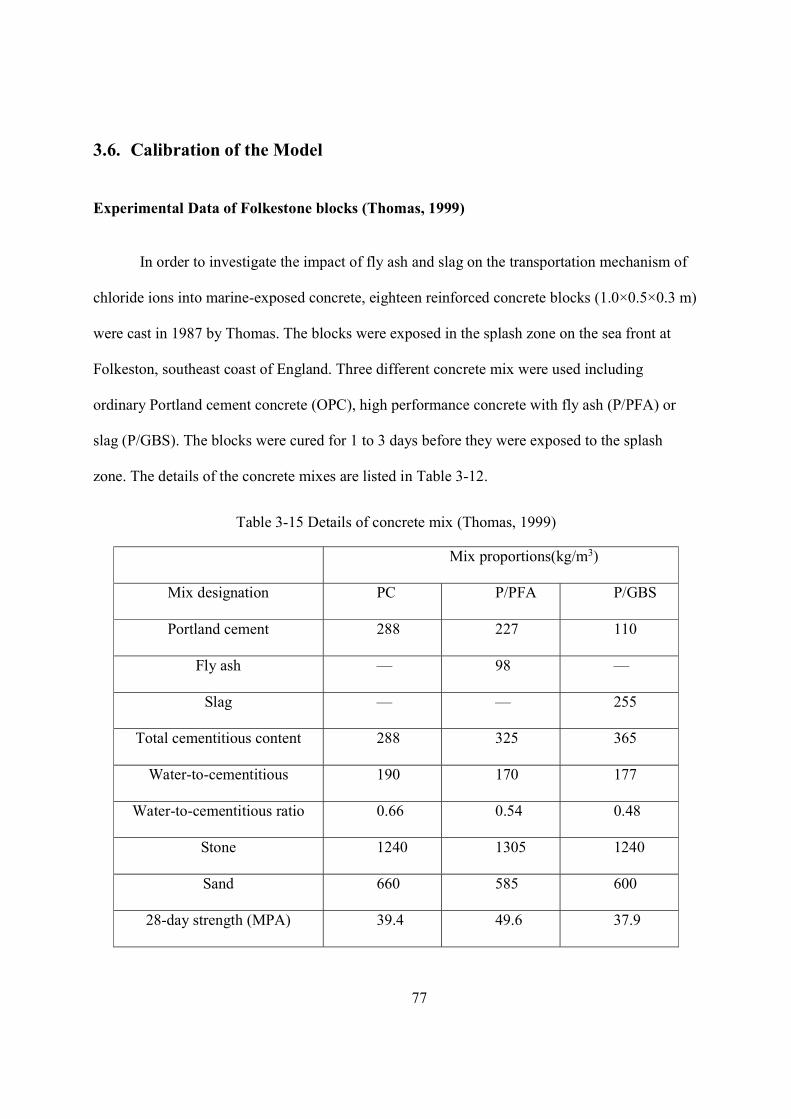
77
3.6. Calibration of the Model
Experimental Data of Folkestone blocks (Thomas, 1999)
In order to investigate the impact of fly ash and slag on the transportation mechanism of
chloride ions into marine-exposed concrete, eighteen reinforced concrete blocks (1.0×0.5×0.3 m)
were cast in 1987 by Thomas. The blocks were exposed in the splash zone on the sea front at
Folkeston, southeast coast of England. Three different concrete mix were used including
ordinary Portland cement concrete (OPC), high performance concrete with fly ash (P/PFA) or
slag (P/GBS). The blocks were cured for 1 to 3 days before they were exposed to the splash
zone. The details of the concrete mixes are listed in Table 3-12.
Table 3-15 Details of concrete mix (Thomas, 1999)
Mix proportions(kg/m3)
Mix designation PC P/PFA P/GBS
Portland cement 288 227 110
Fly ash — 98 —
Slag — — 255
Total cementitious content 288 325 365
Water-to-cementitious 190 170 177
Water-to-cementitious ratio 0.66 0.54 0.48
Stone 1240 1305 1240
Sand 660 585 600
28-day strength (MPA) 39.4 49.6 37.9

78
For the concrete mix OPC, the reference diffusion coefficient is calculated based on
equation, = 1 × 10( . . ⁄ ); m=0.488; w/c=0.66; = 0.8; is the calculated based on
the average monthly temperature; =1.087; =1.8; =1, no damage is assumed. Based on these
parameters, the predicted chloride diffusion coefficient for OPC compared with the diffusion
coefficient derived from the best fit of the Fick’s law solution is compared in Figure 3-23.
Figure 3-23 Predicted and Reported Chloride Diffusion Coefficient OPC
As shown in the figure, the equation gives reasonable predication of the chloride
diffusion coefficient as a function of exposure environment and age. Due to the impact of the
temperature change, the predicted chloride diffusion wobbles around the apparent diffusion
coefficient which is regressed from the chloride profile of the exposed blocks. The initial
diffusion coefficient is relatively high and decreases dramatically due to the early age hydration
of the concrete, which complies with the experimental findings.
The same comparison has been made for high performance concrete with fly ash and
slag. The aging factor m is 0.358 for concrete mix with 54% of fly ash. And it is assigned as 0.6
0
1E-11
2E-11
3E-11
4E-11
5E-11
0 1 2 3 3 4 5 6 7 8Diff
usio
n Co
effic
ient
(m2/
s)
Time (Year)
Comparison of Predicted and Reported Chloride Diffusion Coefficient (OPC )
Model Data

79
for concrete mix with 70% slag since 0.6 is the maximum allowable value for aging factor as
stated in (life-365, 2014). The concrete mix will also affect the value used for binding factor and
environmental factor. In this case, it is assumed that = 0.65 and = 0.375 respectively. The
comparison between the predicted and reported chloride diffusion coefficient for concrete mix with fly
ash and slag is presented in Figure 3-24 and 3-25.
Figure 3-24 Predicted and Reported Chloride Diffusion Coefficient HPC with Fly Ash
Figure 3-25 Predicted and Reported Chloride Diffusion Coefficient for High Performance Concrete with Slag
01E-122E-123E-124E-125E-126E-127E-12
0.0 0.7 1.3 2.0 2.7 3.3 4.0 4.7 5.3 6.0 6.7 7.3 8.0
Diff
usio
n Co
effic
ient
(m2/
s)
Time (Year)
Comparison of Predicted and Reported Chloride Diffusion Coefficient (HPC with Fly Ash )
Model Data
0
5E-12
1E-11
1.5E-11
2E-11
0 1 2 3 3 4 5 6 7 8
Diff
usio
n Co
effic
ient
(m2/
s)
Time (Year)
Comparison of Predicted and Reported Chloride Diffusion Coefficient (HPC with Slag)
Model Data

80
3.7. Summary
Chloride induced corrosion is the most common root cause for concrete bridge
deterioration. Once the chloride content reaches a certain threshold value, the passive layer
formed on the surface of reinforcement rebar will dissolve and corrosion initiates. Due to the
manner of chloride transportation mechanism, diffusion is used to model the long-term chloride
ingression in our research.
The chloride profile, surface concentration and chloride diffusion coefficient should be
tested and monitored for all the concrete bridge elements. It is also important to test and record
the concrete properties for newly constructed elements in order to get a reference value for
chloride diffusion coefficient and the damage index. The dynamic elastic modulus of concrete
should also be tested.
The typical values of diffusion coefficient for normal concrete were reported between 10-
12 m2/s and 10-11 m2/s. If silica fume, fly ash or other alternative cementitious materials are used,
the diffusion coefficient may reduce to 10-13 m2/s.
The chloride threshold valued could be estimated by the equation proposed by Fagerlund.
For simplification purpose, a value of 0.05% of the weight of the concrete (1.97 lb./cu.yd.) can
be used for ordinary Portland cement with black steel.
If sufficient data is not available, the diffusion variables should be estimated based on the
proposed numerical equations.

81
4. FINITE ELEMENT ANALYSIS
4.1. Introduction
In severe exposure conditions, service life of the concrete bridge component mainly
depends on the chloride-induced corrosion. In order get a more refined prediction for the
remaining service life, a variety of numerical models are available. In order to do so, the chloride
profile should be predicted, which is the chloride concentration at certain depth at a given time.
ABAQUS is selected to perform the finite element analysis. In the analysis, diffusion variables
can be estimated using proposed numerical models. Temperature and exposure condition will
also be specified to be part of the external load conditions. Combined with all the inputs, the
finite element model can be constructed. It will be able to determine the chloride profile for the
concrete specimen for any given time. Compared with the average concrete cover thickness and
the chloride threshold value for corrosion initiation, the time for corrosion initiation will be
identified for the finite element model for the concrete bridge component under a certain
exposure condition and a condition state.
The results of the FEA are compared with the experimental data in literature for both the
chloride concentration and the corrosion initiation time. The achieved chloride profiles from
FEA are also compared with experimental/ field data in order to validate the model.
Slab is selected to be the bridge element modeled by ABAQUS since the slab is under the
most severe exposure condition among all the bridge components. The presences of deicing salt,
the effect of the traffic load, and the possible pond water due to precipitation will have a negative
effect on the service life of the components. The surface of the slab may also experience scaling
and cracks caused by other deterioration mechanisms. The average thickness of the concrete for
82
slabs is also smaller than those for other components. Therefore, a typical concrete bridge deck
element is used in the FEA.
4.2. Element Type
Due to the similarity of the partial differential equation, the FEA of chloride diffusion
could be achieved by using the heat transfer modular in ABAQUS. DC2D8, an 8-node
biquadratic element, are selected since they are capable of conducting mass diffusion analysis.
4.3. Material Properties and Real Constants
The Soret effect is set equal to 1 and the solubility is defined by the Fick’s Law. The
element type is assumed to be isotropic so the diffusion coefficient is a constant in any direction.
The concrete diffusion coefficient is estimated by the refined equation. And the temperature,
surface chloride concentration and other input parameters are estimated based on the exposure.
However, ABAQUS does not recognize time as a variable for diffusivity. The time was
set as a field variable, and the diffusion coefficient is then tabulated as dependents of this field
variable. As the field variable was constantly updated to correspond to the current time
increment, and the diffusivity was also changed according to the current field variable value. In
this way, the time dependent diffusivity could be implemented throughout the analysis.
4.4. Boundary Conditions and Loading
Chloride surface concentration is set as a time-dependent variable based on the exposure
conditions, while the diffusion coefficient for the chloride ions is mapped to diffusivity, with the
solubility set to a value of 1. The diffusion coefficient is tabulated as dependents of the field
83
variable defined as time. The steel bars in the concrete are set as the reflective boundary since the
chloride ions tend to accumulate when they reach the surface of the reinforcing steel.
4.5. Validation of the FEA Model
Chloride Profile: Experimental Data of Folkestone blocks (Thomas, 1999)
Based on the chloride diffusion coefficient predicted from the model, the chloride profile
after certain years of exposure could be derived from FEA analysis. The chloride profile shows
the chloride concentration at different depth below the concrete cover, which is the most direct
value to assess the potential of ongoing corrosion. In this study, Abaqus is used as the Finite
Element Analysis software.
The finite element model is a block of a typical concrete bridge deck, shown in Figure 4-
1. A sketch of the element has been developed according to the experiment set up as shown in
Figure 4-1. A 8 in by 8 in (as in 20.32 cm*20.32 cm) block is modeled. Two No. 6 rebar are
placed into the concrete in order to better simulate the chloride profile for real structure. 1 in
(2.54 cm) cover is provided for the bottom reinforcement. An additional 1.5 in (3.81 cm) cover is
used for top reinforcement. Since only the top surface is exposed to the environment, the
chloride transportation are assumed to start from the top side of the deck. Transient analysis is
performed in order to find out the chloride concentration in the model based on the boundary
condition and initial condition.
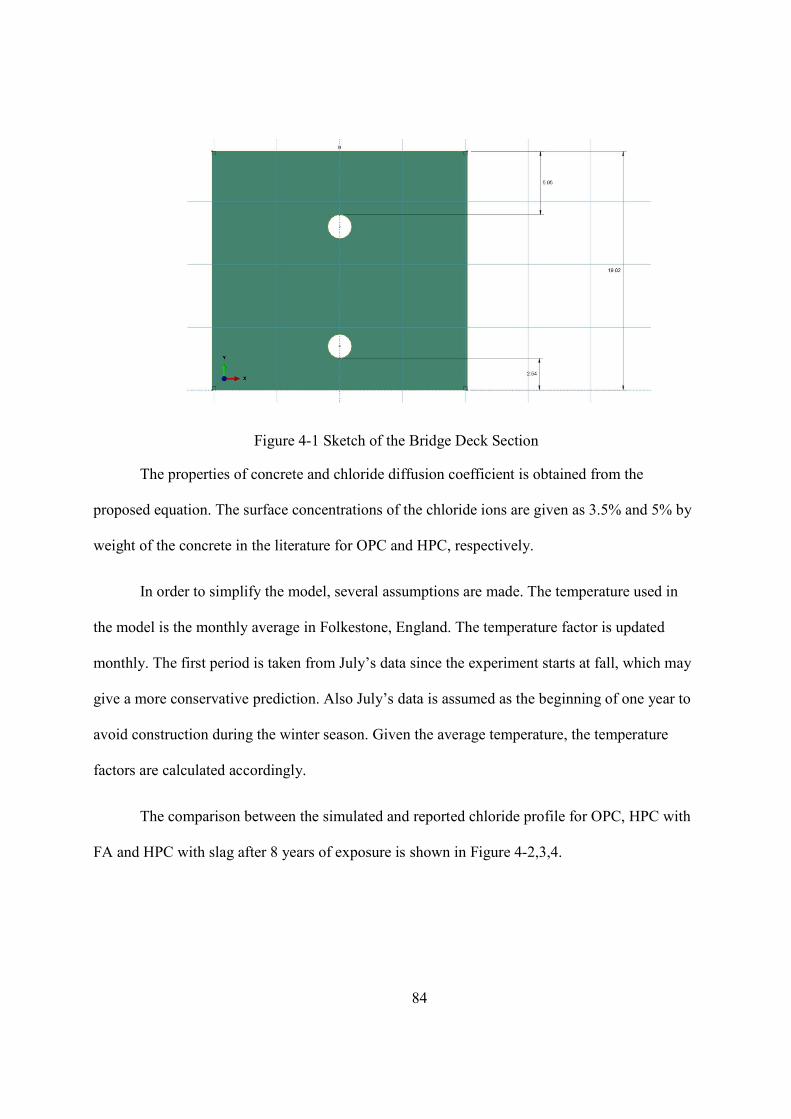
84
Figure 4-1 Sketch of the Bridge Deck Section
The properties of concrete and chloride diffusion coefficient is obtained from the
proposed equation. The surface concentrations of the chloride ions are given as 3.5% and 5% by
weight of the concrete in the literature for OPC and HPC, respectively.
In order to simplify the model, several assumptions are made. The temperature used in
the model is the monthly average in Folkestone, England. The temperature factor is updated
monthly. The first period is taken from July’s data since the experiment starts at fall, which may
give a more conservative prediction. Also July’s data is assumed as the beginning of one year to
avoid construction during the winter season. Given the average temperature, the temperature
factors are calculated accordingly.
The comparison between the simulated and reported chloride profile for OPC, HPC with
FA and HPC with slag after 8 years of exposure is shown in Figure 4-2,3,4.

85
Figure 4-2 Comparison of the Simulated and measured chloride Profile for OPC
Figure 4-3 Comparison of the Simulated and measured chloride Profile for HPC with FA
00.05
0.10.15
0.20.25
0.30.35
5 15 25 35 45Cllo
ride
Conc
entr
atio
n (%
wt.
con.
)
Depth (mm)
OPC
data FEM model
00.05
0.10.15
0.20.25
0.30.35
0.40.45
5 15 25 35 45
Cllo
ride
Conc
entr
atio
n (%
wt.
con.
)
Depth (mm)
HPC with FA
Data FEM Model
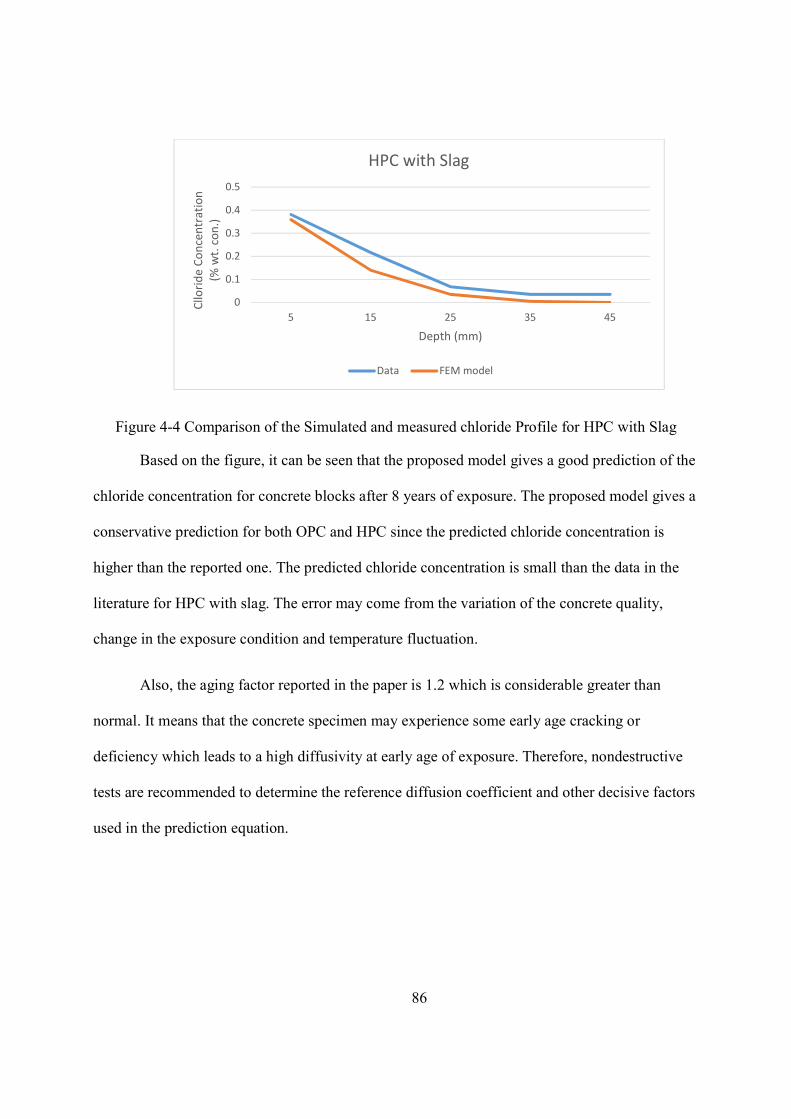
86
Figure 4-4 Comparison of the Simulated and measured chloride Profile for HPC with Slag
Based on the figure, it can be seen that the proposed model gives a good prediction of the
chloride concentration for concrete blocks after 8 years of exposure. The proposed model gives a
conservative prediction for both OPC and HPC since the predicted chloride concentration is
higher than the reported one. The predicted chloride concentration is small than the data in the
literature for HPC with slag. The error may come from the variation of the concrete quality,
change in the exposure condition and temperature fluctuation.
Also, the aging factor reported in the paper is 1.2 which is considerable greater than
normal. It means that the concrete specimen may experience some early age cracking or
deficiency which leads to a high diffusivity at early age of exposure. Therefore, nondestructive
tests are recommended to determine the reference diffusion coefficient and other decisive factors
used in the prediction equation.
0
0.1
0.2
0.3
0.4
0.5
5 15 25 35 45
Cllo
ride
Conc
entr
atio
n (%
wt.
con.
)
Depth (mm)
HPC with Slag
Data FEM model

87
Chloride Profile: Sea Wall (Thomas, 1999)
Thomas (1999) also presented data from a field investigation of a 30-year-old concrete
sea wall in South Wales. The wall is situated a few meters above the high tidal level and having a
slightly milder exposure condition than the Folkesttone blocks. The concrete has a water cement
ratio approximately 0.5 to 0.6 where no exact data is available. w/c=0.5 is selected in order to
estimate the reference diffusion coefficient. 25% of fly ash is also used in the concrete mix. The
temperature profile for South Wales is inputted. Other parameters are determined from the
proposed equation.
The result is shown in Figure 4-5.
Figure 4-5 Chloride Profile of Sea Wall after 30 years of Exposure
0
0.1
0.2
0.3
0.4
0.5
0.6
2.50 7.5 12.50 17.5 22.50 27.5
Cllo
ride
Conc
entr
atio
n (%
wt.
con.
)
Depth (mm)
Chloride Profile of Sea Wall after 30 years
Data FEM Model
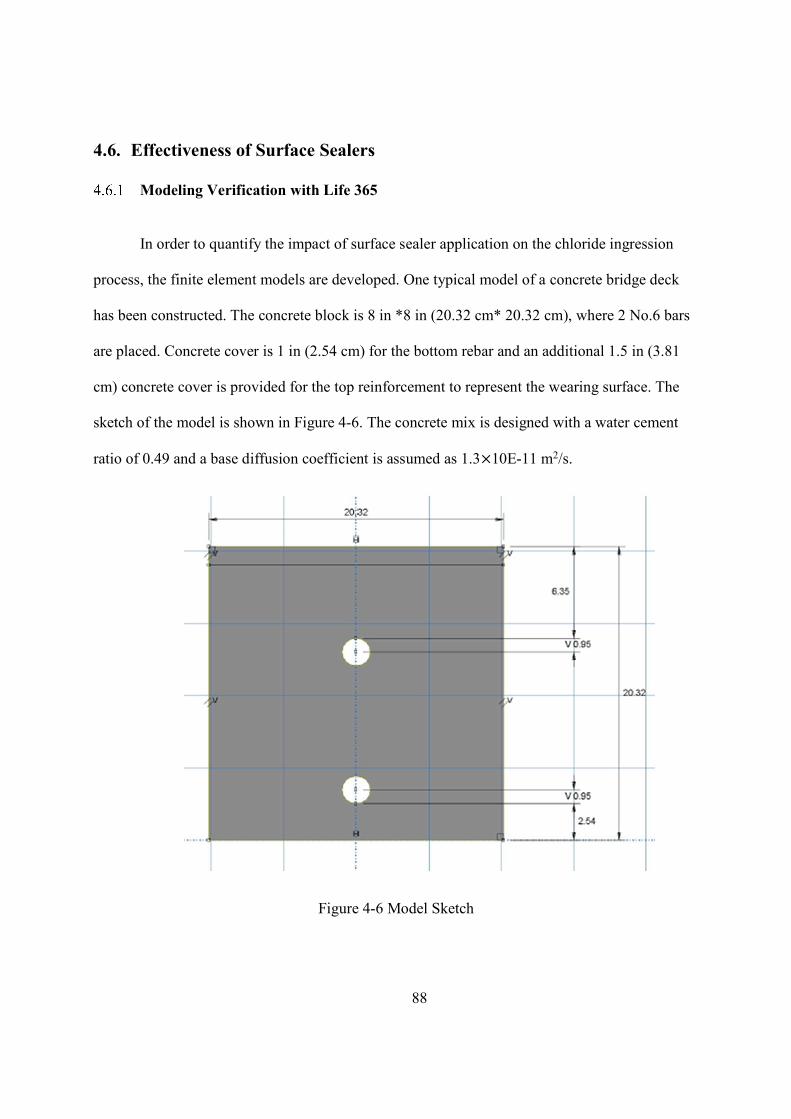
88
4.6. Effectiveness of Surface Sealers
Modeling Verification with Life 365
In order to quantify the impact of surface sealer application on the chloride ingression
process, the finite element models are developed. One typical model of a concrete bridge deck
has been constructed. The concrete block is 8 in *8 in (20.32 cm* 20.32 cm), where 2 No.6 bars
are placed. Concrete cover is 1 in (2.54 cm) for the bottom rebar and an additional 1.5 in (3.81
cm) concrete cover is provided for the top reinforcement to represent the wearing surface. The
sketch of the model is shown in Figure 4-6. The concrete mix is designed with a water cement
ratio of 0.49 and a base diffusion coefficient is assumed as 1.3×10E-11 m2/s.
Figure 4-6 Model Sketch
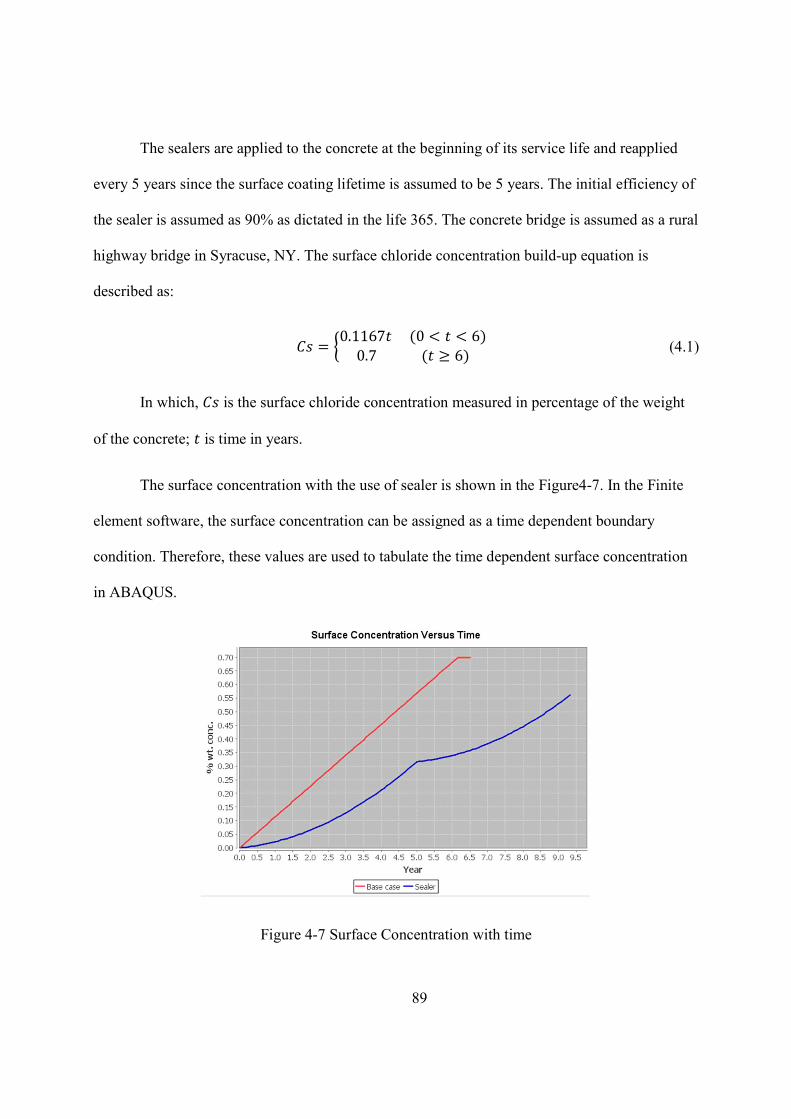
89
The sealers are applied to the concrete at the beginning of its service life and reapplied
every 5 years since the surface coating lifetime is assumed to be 5 years. The initial efficiency of
the sealer is assumed as 90% as dictated in the life 365. The concrete bridge is assumed as a rural
highway bridge in Syracuse, NY. The surface chloride concentration build-up equation is
described as:
=0.1167 (0 < < 6)
0.7 ( 6) (4.1)
In which, is the surface chloride concentration measured in percentage of the weight
of the concrete; is time in years.
The surface concentration with the use of sealer is shown in the Figure4-7. In the Finite
element software, the surface concentration can be assigned as a time dependent boundary
condition. Therefore, these values are used to tabulate the time dependent surface concentration
in ABAQUS.
Figure 4-7 Surface Concentration with time
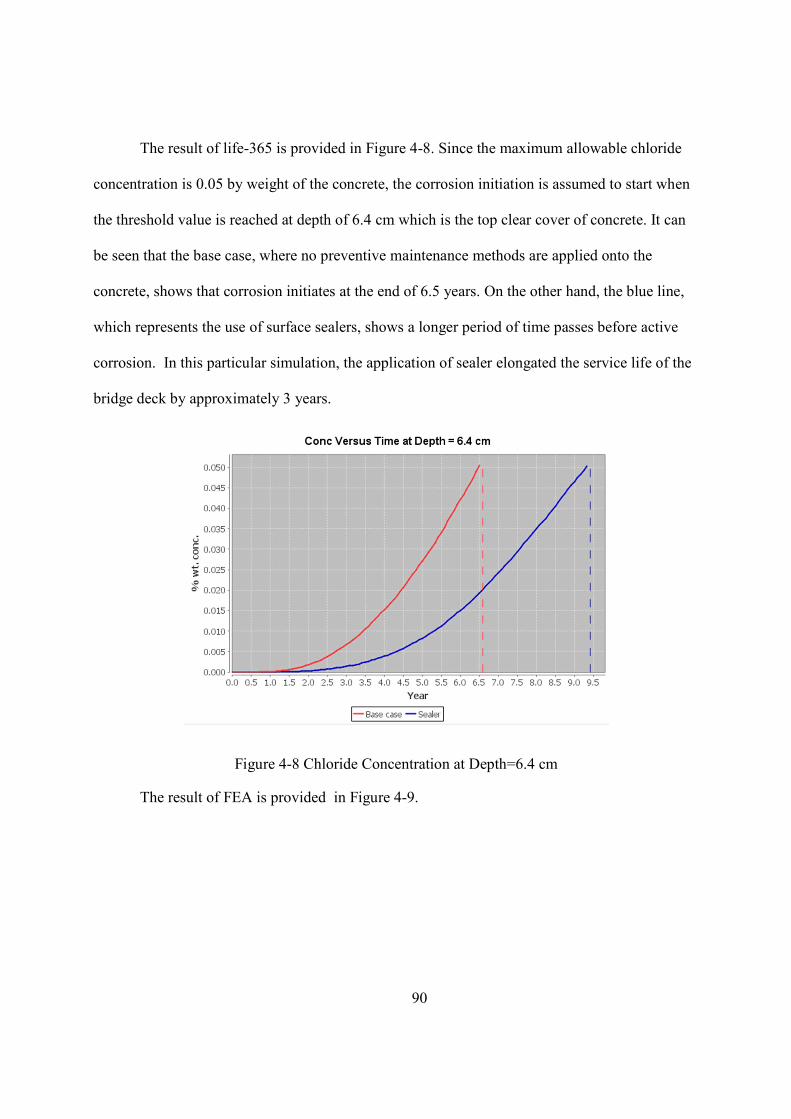
90
The result of life-365 is provided in Figure 4-8. Since the maximum allowable chloride
concentration is 0.05 by weight of the concrete, the corrosion initiation is assumed to start when
the threshold value is reached at depth of 6.4 cm which is the top clear cover of concrete. It can
be seen that the base case, where no preventive maintenance methods are applied onto the
concrete, shows that corrosion initiates at the end of 6.5 years. On the other hand, the blue line,
which represents the use of surface sealers, shows a longer period of time passes before active
corrosion. In this particular simulation, the application of sealer elongated the service life of the
bridge deck by approximately 3 years.
Figure 4-8 Chloride Concentration at Depth=6.4 cm
The result of FEA is provided in Figure 4-9.
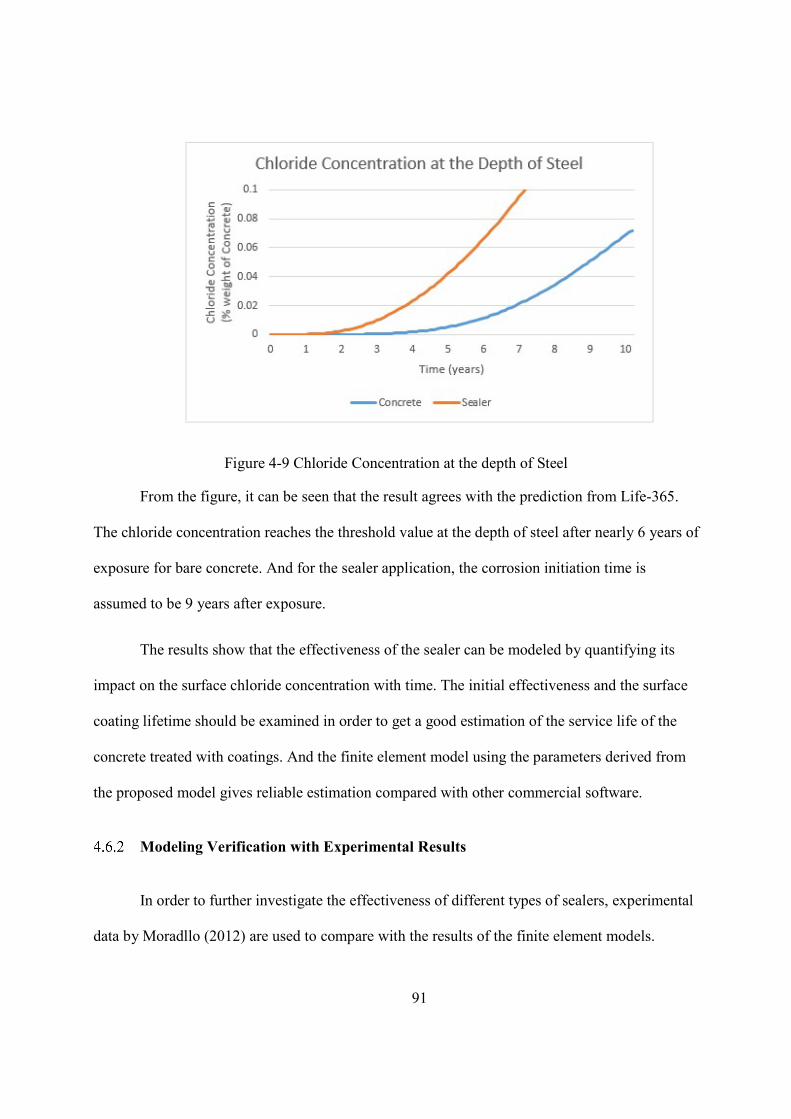
91
Figure 4-9 Chloride Concentration at the depth of Steel
From the figure, it can be seen that the result agrees with the prediction from Life-365.
The chloride concentration reaches the threshold value at the depth of steel after nearly 6 years of
exposure for bare concrete. And for the sealer application, the corrosion initiation time is
assumed to be 9 years after exposure.
The results show that the effectiveness of the sealer can be modeled by quantifying its
impact on the surface chloride concentration with time. The initial effectiveness and the surface
coating lifetime should be examined in order to get a good estimation of the service life of the
concrete treated with coatings. And the finite element model using the parameters derived from
the proposed model gives reliable estimation compared with other commercial software.
Modeling Verification with Experimental Results
In order to further investigate the effectiveness of different types of sealers, experimental
data by Moradllo (2012) are used to compare with the results of the finite element models.
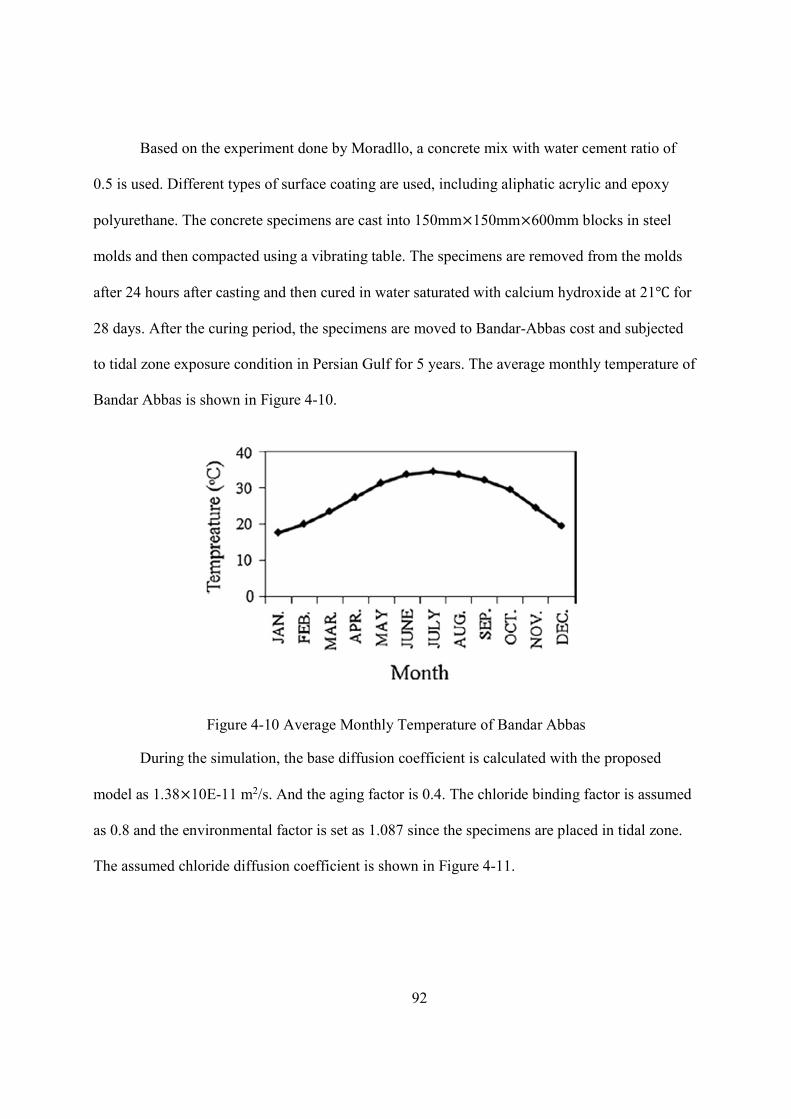
92
Based on the experiment done by Moradllo, a concrete mix with water cement ratio of
0.5 is used. Different types of surface coating are used, including aliphatic acrylic and epoxy
polyurethane. The concrete specimens are cast into 150mm×150mm×600mm blocks in steel
molds and then compacted using a vibrating table. The specimens are removed from the molds
after 24 hours after casting and then cured in water saturated with calcium hydroxide at 21 for
28 days. After the curing period, the specimens are moved to Bandar-Abbas cost and subjected
to tidal zone exposure condition in Persian Gulf for 5 years. The average monthly temperature of
Bandar Abbas is shown in Figure 4-10.
Figure 4-10 Average Monthly Temperature of Bandar Abbas
During the simulation, the base diffusion coefficient is calculated with the proposed
model as 1.38×10E-11 m2/s. And the aging factor is 0.4. The chloride binding factor is assumed
as 0.8 and the environmental factor is set as 1.087 since the specimens are placed in tidal zone.
The assumed chloride diffusion coefficient is shown in Figure 4-11.
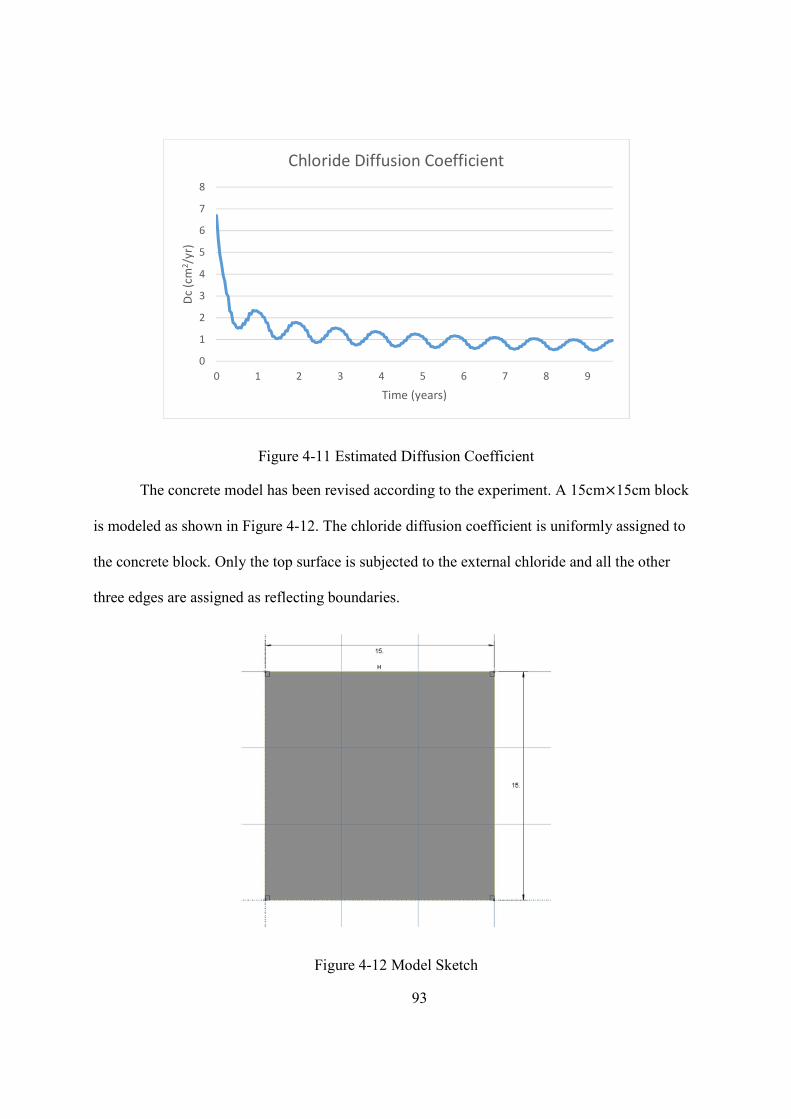
93
Figure 4-11 Estimated Diffusion Coefficient
The concrete model has been revised according to the experiment. A 15cm×15cm block
is modeled as shown in Figure 4-12. The chloride diffusion coefficient is uniformly assigned to
the concrete block. Only the top surface is subjected to the external chloride and all the other
three edges are assigned as reflecting boundaries.
Figure 4-12 Model Sketch
0
1
2
3
4
5
6
7
8
0 1 2 3 4 5 6 7 8 9
Dc
(cm
2 /yr
)
Time (years)
Chloride Diffusion Coefficient
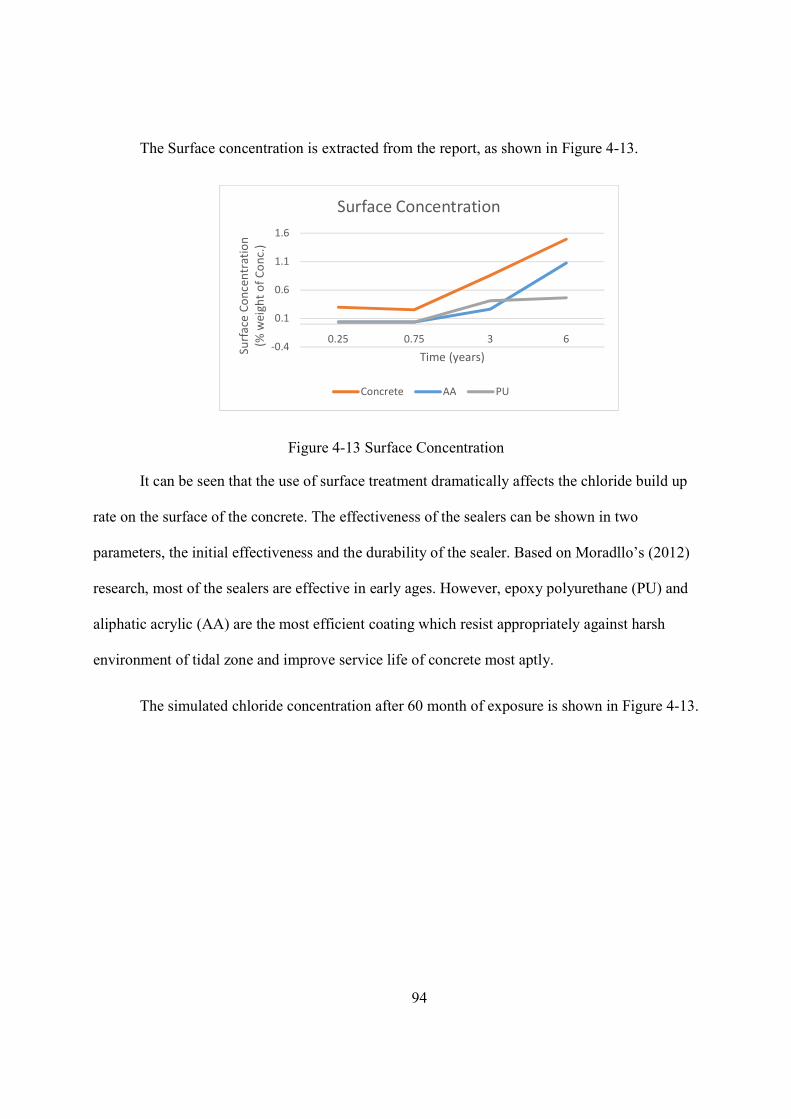
94
The Surface concentration is extracted from the report, as shown in Figure 4-13.
Figure 4-13 Surface Concentration
It can be seen that the use of surface treatment dramatically affects the chloride build up
rate on the surface of the concrete. The effectiveness of the sealers can be shown in two
parameters, the initial effectiveness and the durability of the sealer. Based on Moradllo’s (2012)
research, most of the sealers are effective in early ages. However, epoxy polyurethane (PU) and
aliphatic acrylic (AA) are the most efficient coating which resist appropriately against harsh
environment of tidal zone and improve service life of concrete most aptly.
The simulated chloride concentration after 60 month of exposure is shown in Figure 4-13.
-0.4
0.1
0.6
1.1
1.6
0.25 0.75 3 6
Surf
ace
Conc
entr
atio
n (%
wei
ght o
f Con
c.)
Time (years)
Surface Concentration
Concrete AA PU
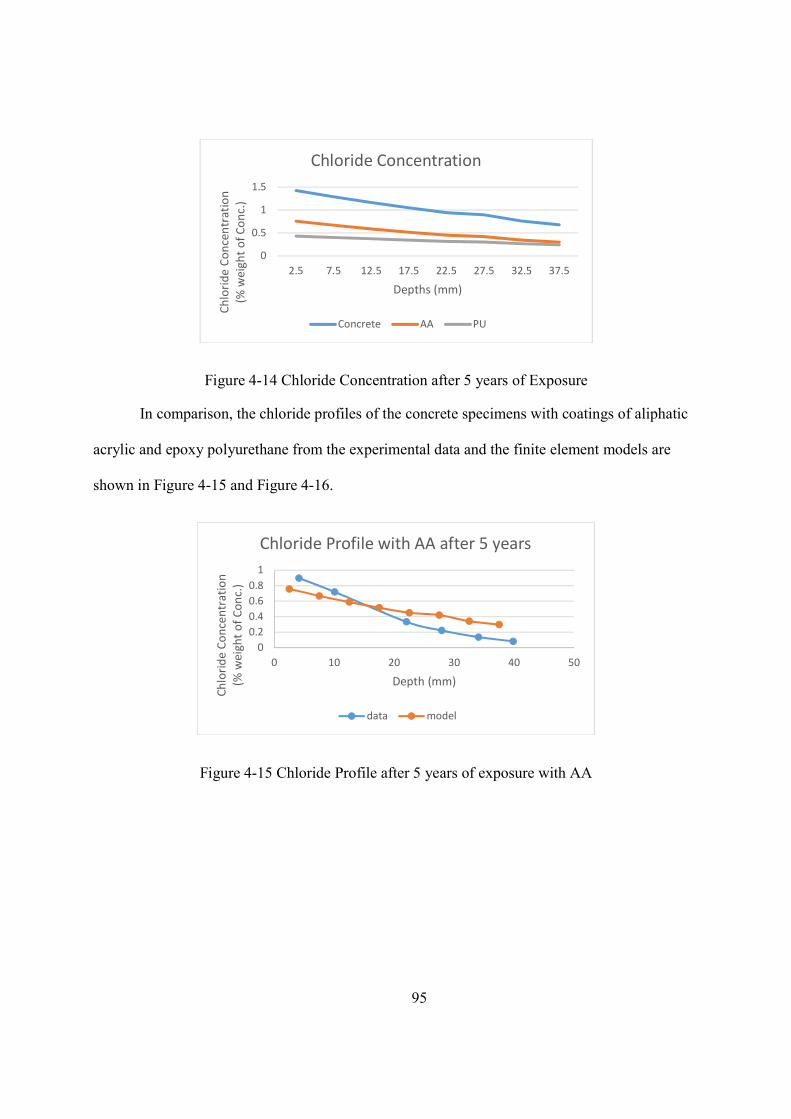
95
Figure 4-14 Chloride Concentration after 5 years of Exposure
In comparison, the chloride profiles of the concrete specimens with coatings of aliphatic
acrylic and epoxy polyurethane from the experimental data and the finite element models are
shown in Figure 4-15 and Figure 4-16.
Figure 4-15 Chloride Profile after 5 years of exposure with AA
0
0.5
1
1.5
2.5 7.5 12.5 17.5 22.5 27.5 32.5 37.5
Chlo
ride
Conc
entr
atio
n(%
wei
ght o
f Con
c.)
Depths (mm)
Chloride Concentration
Concrete AA PU
00.20.40.60.8
1
0 10 20 30 40 50
Chlo
ride
Conc
entr
atio
n(%
wei
ght o
f Con
c.)
Depth (mm)
Chloride Profile with AA after 5 years
data model
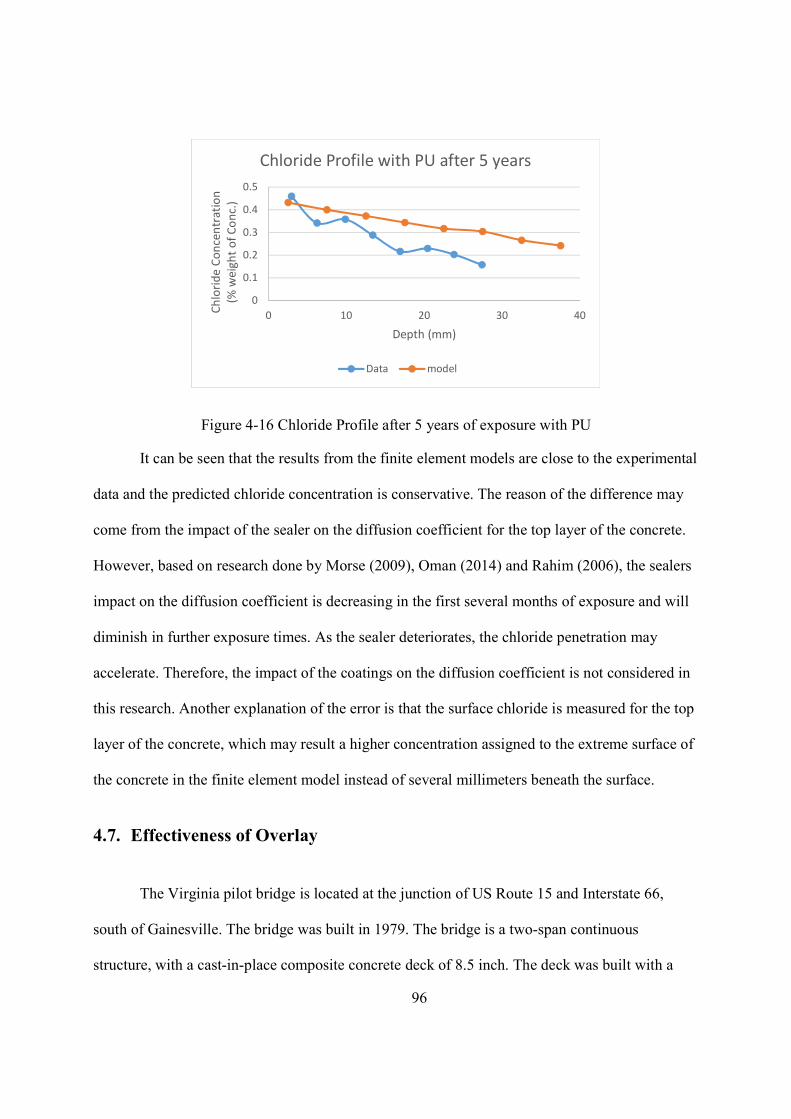
96
Figure 4-16 Chloride Profile after 5 years of exposure with PU
It can be seen that the results from the finite element models are close to the experimental
data and the predicted chloride concentration is conservative. The reason of the difference may
come from the impact of the sealer on the diffusion coefficient for the top layer of the concrete.
However, based on research done by Morse (2009), Oman (2014) and Rahim (2006), the sealers
impact on the diffusion coefficient is decreasing in the first several months of exposure and will
diminish in further exposure times. As the sealer deteriorates, the chloride penetration may
accelerate. Therefore, the impact of the coatings on the diffusion coefficient is not considered in
this research. Another explanation of the error is that the surface chloride is measured for the top
layer of the concrete, which may result a higher concentration assigned to the extreme surface of
the concrete in the finite element model instead of several millimeters beneath the surface.
4.7. Effectiveness of Overlay
The Virginia pilot bridge is located at the junction of US Route 15 and Interstate 66,
south of Gainesville. The bridge was built in 1979. The bridge is a two-span continuous
structure, with a cast-in-place composite concrete deck of 8.5 inch. The deck was built with a
0
0.1
0.2
0.3
0.4
0.5
0 10 20 30 40Chlo
ride
Conc
entr
atio
n(%
wei
ght o
f Con
c.)
Depth (mm)
Chloride Profile with PU after 5 years
Data model
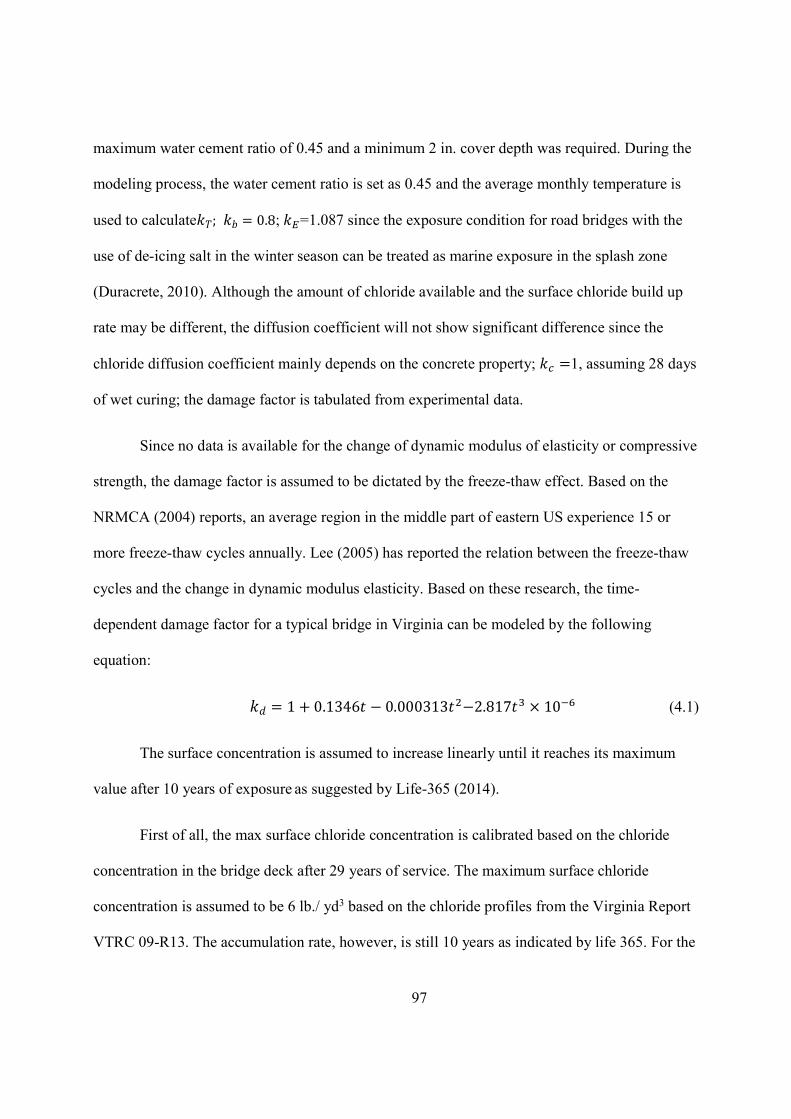
97
maximum water cement ratio of 0.45 and a minimum 2 in. cover depth was required. During the
modeling process, the water cement ratio is set as 0.45 and the average monthly temperature is
used to calculate ; = 0.8; =1.087 since the exposure condition for road bridges with the
use of de-icing salt in the winter season can be treated as marine exposure in the splash zone
(Duracrete, 2010). Although the amount of chloride available and the surface chloride build up
rate may be different, the diffusion coefficient will not show significant difference since the
chloride diffusion coefficient mainly depends on the concrete property; =1, assuming 28 days
of wet curing; the damage factor is tabulated from experimental data.
Since no data is available for the change of dynamic modulus of elasticity or compressive
strength, the damage factor is assumed to be dictated by the freeze-thaw effect. Based on the
NRMCA (2004) reports, an average region in the middle part of eastern US experience 15 or
more freeze-thaw cycles annually. Lee (2005) has reported the relation between the freeze-thaw
cycles and the change in dynamic modulus elasticity. Based on these research, the time-
dependent damage factor for a typical bridge in Virginia can be modeled by the following
equation:
= 1 + 0.1346 − 0.000313 −2.817 × 10 (4.1)
The surface concentration is assumed to increase linearly until it reaches its maximum
value after 10 years of exposure as suggested by Life-365 (2014).
First of all, the max surface chloride concentration is calibrated based on the chloride
concentration in the bridge deck after 29 years of service. The maximum surface chloride
concentration is assumed to be 6 lb./ yd3 based on the chloride profiles from the Virginia Report
VTRC 09-R13. The accumulation rate, however, is still 10 years as indicated by life 365. For the

98
chloride concentration, the FEM model shows a reasonable curve that cross the average of the
sets of data points. In general, the FEM gives a conservative prediction since it does not consider
the variation in the surface concentration from different data point.
The difference between the FEM and the data can be explained by routine maintenance
and difference in the exposure.
Figure 4-17 Chloride Concentration at Year 29 In Bridge Deck
Different overlay systems are used based on the report, in which, Overlay System A, B,
C, D and E are selected to calibrate the finite element model.
With different concrete mix design, the reference diffusion coefficients (D0) and the
decaying factor (m) for different overlay systems varies. The reference diffusion coefficient
calculated based on the concrete mix is displayed in the Table 4-1.
0
1
2
3
4
5
1 1.2 1.4 1.6 1.8 2 2.2 2.4 2.6 2.8 3
Chlo
ride
Conc
entr
atio
n (lb
/cu.
yd.)
Depth (in)
Chloride Concentration At Year 29 In Bridge Deck
Data Ave. Data 5e Data 2E
Data 2W Data 5W Data 8E
Data 8W Data 14W Data 11E
Data 18E FEM Model (Modified)

99
Table 4-1 Concrete Mix and estimated Reference Diffusion Coefficient
Mix w/c FA SF Slag LMC D0(m2/s) m D0(cm2/year)
OPC 0.5 0% 0% 0% 0% 1.38E-11 0.4 4.35
A 0.4 0% 7% 0% 0% 2.50E-12 0.32 0.79
B 0.4 0% 5% 35% 0% 3.48E-12 0.495 1.1
C 0.4 15% 5% 0% 0% 3.48E-12 0.425 1.1
E 0.25 15% 13% 0% 0% 1.75E-12 0.305 0.55
The chloride concentrations from the filed data used to calibrate the chloride
concentration in the overlay are summarized in Table 4-2.
Table 4-2 Field Data from Virginia Pilot Bridge
Data
Depth (in.) Chloride Concentration (lb./cu.yd.)
A (7%SF) B (5% SF 35%Slag) C (5% SF 15% FA) D (15% LMC)
E (13% SF 15%FA)
2E 2W 5E 5W 8E 8W 14 W 11E 18E
0-0.125 3.44 5.899 2.182 5.112 3.887 7.594 3.568 3.131 2.323
0.125-0.25 3.195 5.723 1.07 4.062 2.52 7.232 2.001 2.964 2.951
0.25-0.375 2.321 4.928 0.749 2.116 1.421 4.209 0.865 2.962 3.037
0.375-0.5 1.453 3.501 0.747 1.069 1.018 1.919 0.507 2.303 2.538
0.5-0.625 1.028 2.896 0.904 0.711 0.949 1.472 0.385 1.929 1.898
0.625-0.75 0.72 2.395 0.582 1.156 1.145 0.238 1.76 1.768
0.75-0.875 1.931 0.48 1.082 0.247 1.655
0.875-1 1.849 0.516 0.925 0.359
1-1.125 1.824 0.905 0.751 0.819
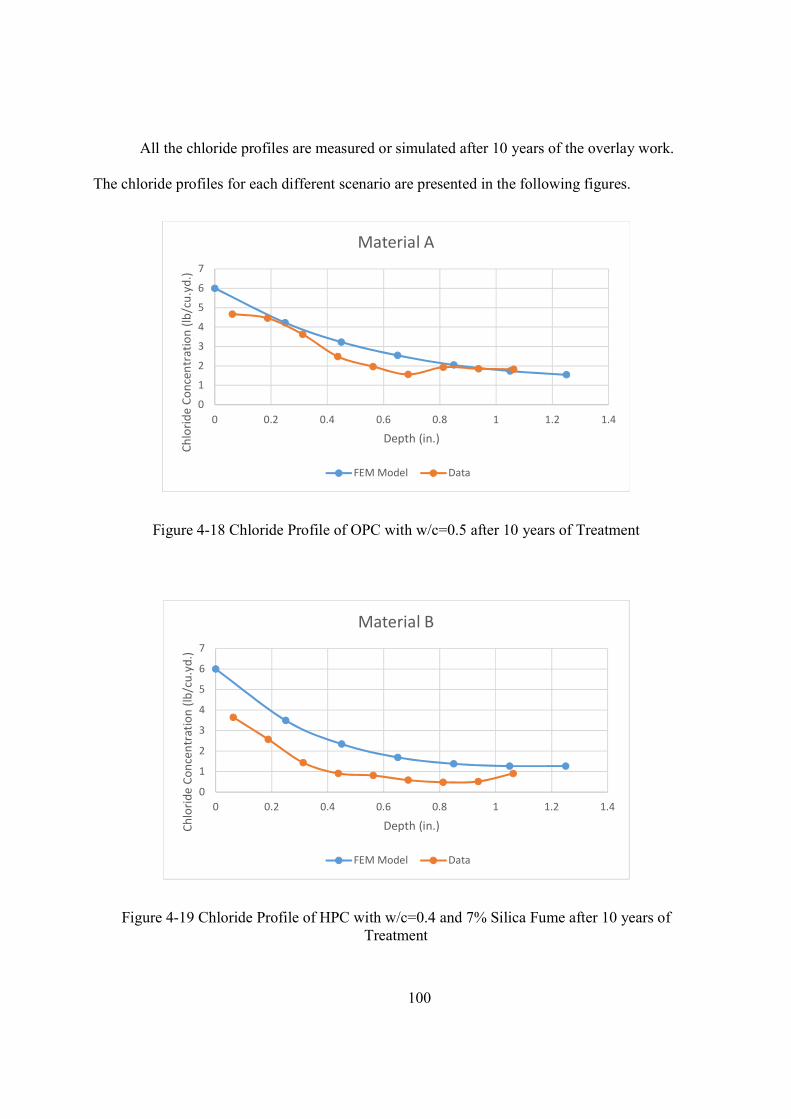
100
All the chloride profiles are measured or simulated after 10 years of the overlay work.
The chloride profiles for each different scenario are presented in the following figures.
Figure 4-18 Chloride Profile of OPC with w/c=0.5 after 10 years of Treatment
Figure 4-19 Chloride Profile of HPC with w/c=0.4 and 7% Silica Fume after 10 years of Treatment
0
1
2
3
4
5
6
7
0 0.2 0.4 0.6 0.8 1 1.2 1.4
Chlo
ride
Conc
entr
atio
n (lb
/cu.
yd.)
Depth (in.)
Material A
FEM Model Data
0
1
2
3
4
5
6
7
0 0.2 0.4 0.6 0.8 1 1.2 1.4
Chlo
ride
Conc
entr
atio
n (lb
/cu.
yd.)
Depth (in.)
Material B
FEM Model Data

101
Figure 4-20 Chloride Profile of HPC with w/c=0.4 and 5% Silica Fume and 35% Slag after 10 years of Treatment
Figure 4-21 Chloride Profile of HPC with w/c=0.25 and 15% Fly Ash and 13% Silica Fume after 10 years of Treatment
4.8. Effectiveness of Latex Modified Concrete Overlay
The latex modified concrete overlay is used on the Virginia Pilot bridge and it was the
overlay Type D. Latex has a great impact on reducing the permeability of the newly constructed
0
1
2
3
4
5
6
7
0 0.2 0.4 0.6 0.8 1 1.2 1.4
Chlo
ride
Conc
entr
atio
n (lb
/cu.
yd.)
Depth (in.)
Material C
FEM Model Data
0
1
2
3
4
5
6
7
0 0.2 0.4 0.6 0.8 1 1.2 1.4
Chlo
ride
Conc
entr
atio
n (lb
/cu.
yd.)
Depth (in.)
Material E
FEM Model Data

102
overlay. As the other bridge deck models, the original bridge deck is 8 in thick. The clear cover
for the bottom rebar is 1 in. The concrete cover for the top reinforcement is 2.5 in., including a 1
in wearing surface. After 29 years of service, the bridge deck is rehabilitated by cutting out the 1
in wearing surface and then overlaying with 1.25” thick latex modified concrete. The latex
modified concrete has a water cement ratio of 0.4 and the latex-cement ratio is 15% by weight.
The chloride concentration is measured after 10 years follows the rehabilitation. Based on the
result, it can be seen that the model gives an accurate prediction for the chloride profile in the
latex modified concrete overlay.
Figure 4-22 Chloride Profile of 15% Latex Modified Concrete after 10 years of Treatment
4.9. Effectiveness of Wearing of the Top of Concrete Deck
In order to investigate the impact of wearing on the diffusion process on bridge deck
elements, a modified FEM is constructed. The same geometric parameters are used from the
example where the latex modified concrete is analyzed. The bridge deck is originally 8 in high.
0
1
2
3
4
5
6
7
0 0.2 0.4 0.6 0.8 1 1.2 1.4Chlo
ride
Conc
entr
atio
n (lb
/cu.
yd.)
Depth (in.)
Latex Modified Concrete (15% LMC)
FEM Model Data
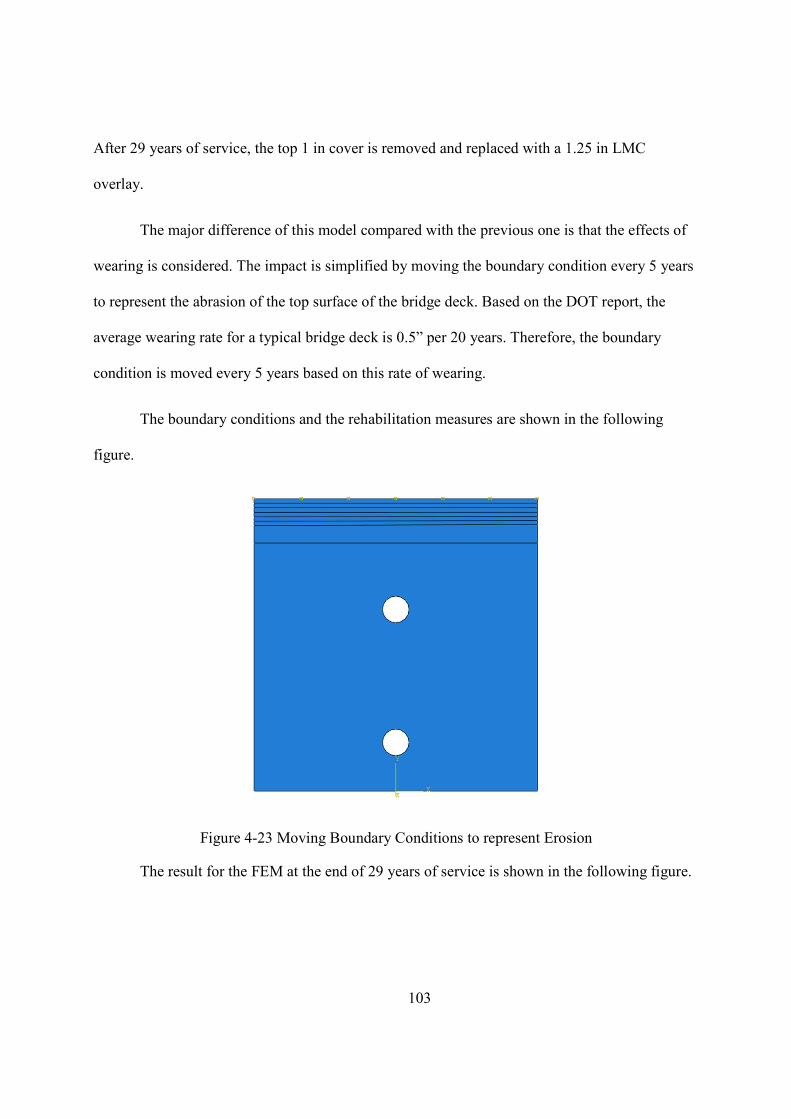
103
After 29 years of service, the top 1 in cover is removed and replaced with a 1.25 in LMC
overlay.
The major difference of this model compared with the previous one is that the effects of
wearing is considered. The impact is simplified by moving the boundary condition every 5 years
to represent the abrasion of the top surface of the bridge deck. Based on the DOT report, the
average wearing rate for a typical bridge deck is 0.5” per 20 years. Therefore, the boundary
condition is moved every 5 years based on this rate of wearing.
The boundary conditions and the rehabilitation measures are shown in the following
figure.
Figure 4-23 Moving Boundary Conditions to represent Erosion
The result for the FEM at the end of 29 years of service is shown in the following figure.

104
Figure 4-24 Comparison of Chloride Profile of FEM with or without Considering Wearing
It can be seen that the FEM considering wearing has a good correlation with the data. Since the surface concentration used as an input was actually the average over a long span of the bridge, a new max surface concentration representing the local exposure condition, 5 lb. /cu. yd. is assumed based on the trajectory of its own data. The FEM result considering wearing is closer to the reported data. It gives an accurate estimation concentration near the surface of the concrete and does not overestimate the chloride concentration compared to the field data.
Figure 4-25 Chloride Profile of the original bridge deck at 29 years
0
1
2
3
4
5
6
7
0 0.5 1 1.5 2
Chlo
ride
Conc
entr
atio
n (lb
/cu.
yd)
Depth (in.)
Chloride Concentration at 29 years
Data FEM with Wearing FEM without Wearing
0
1
2
3
4
5
6
0 0.5 1 1.5 2
Chlo
ride
Conc
entr
atio
n (lb
/cu.
yd)
Depth (in.)
Chloride Concentration at 29 years
Data FEM with Wearing FEM without Wearing
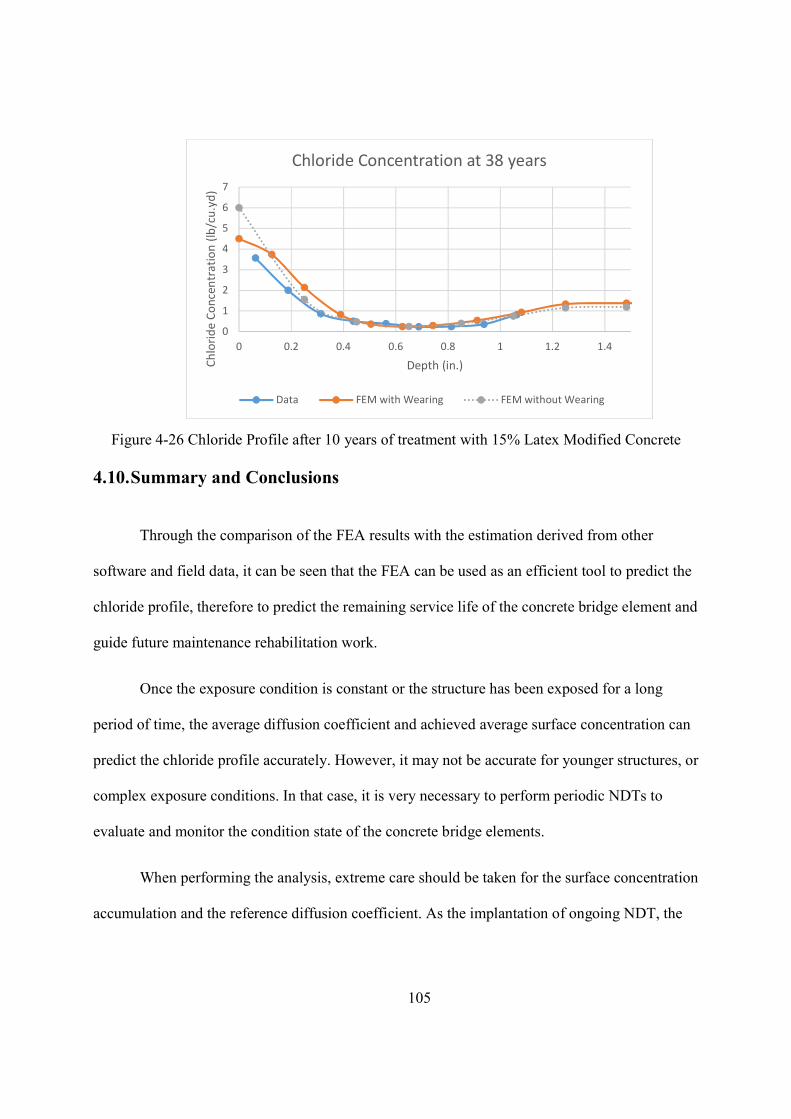
105
Figure 4-26 Chloride Profile after 10 years of treatment with 15% Latex Modified Concrete
4.10. Summary and Conclusions
Through the comparison of the FEA results with the estimation derived from other
software and field data, it can be seen that the FEA can be used as an efficient tool to predict the
chloride profile, therefore to predict the remaining service life of the concrete bridge element and
guide future maintenance rehabilitation work.
Once the exposure condition is constant or the structure has been exposed for a long
period of time, the average diffusion coefficient and achieved average surface concentration can
predict the chloride profile accurately. However, it may not be accurate for younger structures, or
complex exposure conditions. In that case, it is very necessary to perform periodic NDTs to
evaluate and monitor the condition state of the concrete bridge elements.
When performing the analysis, extreme care should be taken for the surface concentration
accumulation and the reference diffusion coefficient. As the implantation of ongoing NDT, the
0
1
2
3
4
5
6
7
0 0.2 0.4 0.6 0.8 1 1.2 1.4
Chlo
ride
Conc
entr
atio
n (lb
/cu.
yd)
Depth (in.)
Chloride Concentration at 38 years
Data FEM with Wearing FEM without Wearing
106
accumulated inspection data could not only serve as a reference value in the record, but also help
to calibrate the estimating equations.
In this chapter, the impact of the combination of Latex modified concrete and silica fume
into the concrete mix is evaluated. The degradation of the concrete caused by wearing is also
considered.
The FEA model, however, is used for further investigation in the next chapter to perform
a life cycle cost analysis model.

107
5. COST ANALYSIS FOR A TYPICAL BRIDGE DECK ELEMENT
5.1. Introduction
The bridge construction and operation cost to an agency is never a one-time expenditure.
Since following its planning, design, and construction, a bridge requires periodic maintenance
and possibly repair or rehabilitation actions to ensure its continued function and safety.
In this chapter, a 75-year design service life is considered for comparison of the cost for
different maintenance strategies. The timing to apply preventive maintenance actions are
determined based on the results from the finite element analysis and the cost for individual
application of the preventive maintenance measure are identified. The maintenance cost is
compared by covering all the cost to the present value considering the time value. No user cost is
considered in this analysis. The life cycle cost is used to compare different maintenance
strategies for different concrete quality and exposure conditions.
In this segment, only the agency cost, which includes the material cost and labor are
investigated. Whenever a repair or rehabilitation work is necessary on a bridge, a significant
portion of the cost of the activity comes from incidental costs, rather than the actual repair or
material costs. Incidental costs include mobilization, traffic control, and repairs and
improvements to other parts of the bridge, such as drains, barrier rails, and approaches (Kepler,
2000). This part of the cost is not included due to its nature of uncertainty.
Also, there is another cost associated with preventive maintenance activities on bridges
that is not considered in this economic analysis, which is the user cost. The user costs are the
costs incurred by the traveling public attributable to the application of the bridge preservation
actions, which includes time lost due to delays or detours, accidents and other resources used.
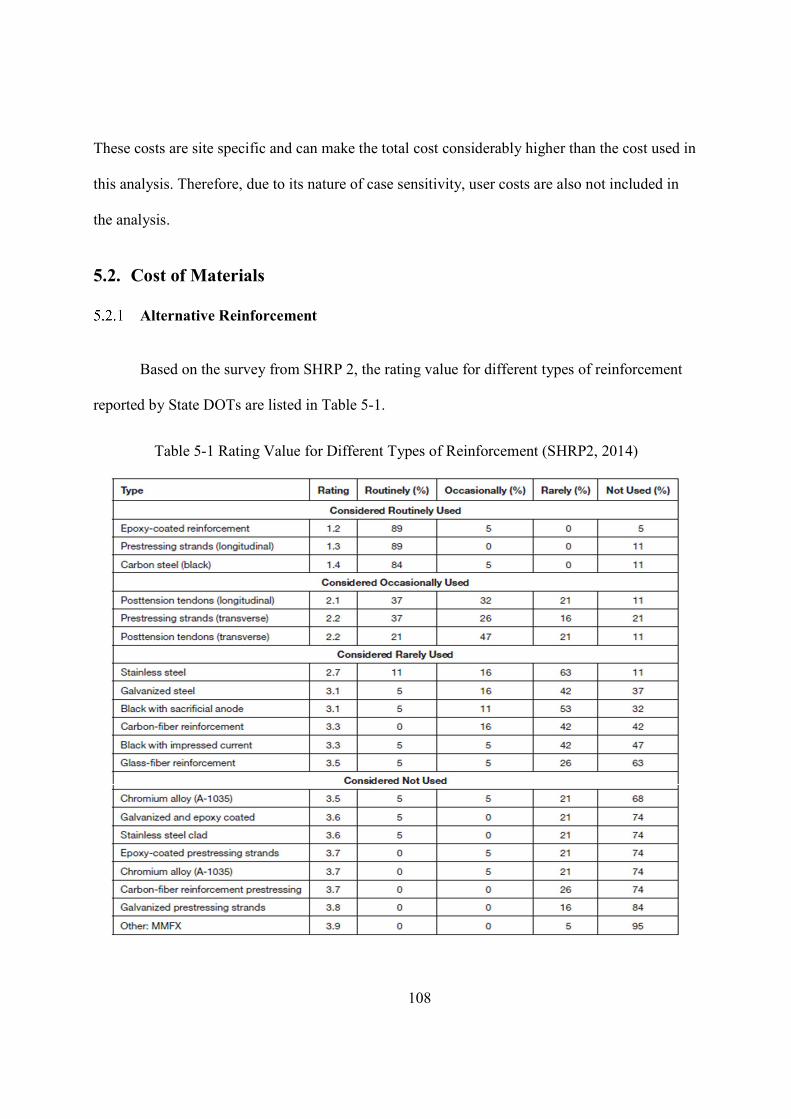
108
These costs are site specific and can make the total cost considerably higher than the cost used in
this analysis. Therefore, due to its nature of case sensitivity, user costs are also not included in
the analysis.
5.2. Cost of Materials
Alternative Reinforcement
Based on the survey from SHRP 2, the rating value for different types of reinforcement
reported by State DOTs are listed in Table 5-1.
Table 5-1 Rating Value for Different Types of Reinforcement (SHRP2, 2014)

109
The considered rating scale was 1=routinely, 2=occasionally, 3=rarely, and 4=not used.
In general, the most widely adopted reinforcement steel are carbon steel (black steel), epoxy-
coated reinforcement and prestressing strands (longitudinal).
Carbon steel is the most commonly used reinforcement in the concrete and it has the
lowest unit price compared to the others, despite the price may vary based on the size of the
rebar. Triandafilou (2012) has identified the unit cost of carbon steel #4 bars at 0.48 $/lb. for
materials only. The cost estimated from Life-365 has a similar value which is 0.45 $/lb. The
2013 National Construction Estimator gives a slightly different value which is 0.65 $/lb. for a #4
rebar, and if it is placed and tied in structural slabs, an additional 0.31 $/lb. cost should be added
for labor.
Compared to carbon steel, epoxy coated rebar has a higher material unit cost coming
from the epoxy coating. The epoxy coated steel reinforcing bars are introduced into bridge
construction more than 40 years ago and they are suitable for any concrete subjected to corrosive
conditions, including exposure to deicing salts or marine waters. Triandafilou (2012) reported a
unit cost of epoxy coated rebar as 0.7 $/lb., similar to the Life-365’s estimation, which is 0.6
$/lb. Based on the 2013 National Construction Estimator, the unit cost of epoxy coated rebar is
0.3 $/lb. higher than the black steel, which yields to a unit cost of 0.97 $/lb. Also, based on
Sharp’s Report (2009), the labor cost associated with placing epoxy coated rebar may be higher
and unanticipated direct costs may occur during construction phase while using epoxy coated
rebar, the actual in-place unit cost of epoxy coated rebar may be as high as 0.9 $/lb.
Galvanized steel is also considered rarely used based on Table 5-1. Hot-dipped
galvanized, or zinc-coated rebar have been used since 1930s. However, the performance of its
corrosion resistance is controversial. Some of the researchers say the threshold value for
110
corrosion initiation is 4 to 10 times higher than the threshold value for black bar while others say
galvanized steel will only produce a slight increase in the service life of a structure in severe
chloride environment. (Basham, 1999) The unit cost for galvanized steel is slightly higher than
the epoxy coated rebar, which is around 0.7 $/lb. for materials only.
Stainless steel is another alternative for reinforcement which has a chloride threshold
value at least 10 times greater than carbon steel. The threshold value for Type 304 stainless steel
with a stainless steel cathode was 12 to 30 lb./yd3. For Type 316 stainless steel in both mats, the
threshold value for chloride concentration can range from 20 to 33 lb./yd3. If stainless steel is
used in concrete bridge elements, the element can easily achieve a 100-year life span without any
other corrosion protection system. However, the initial cost for stainless steel is much higher
compared to the other alternatives, reaching 2.99 $/lb., which is 6 times more expensive than
black steel.
One particular type of steel, MMFX, is listed in the table and it is barely used by State
DOTs. Bar for bar in place cost estimates, MMFX rebar is approximately one-half the cost of
stainless steel rebar. It is roughly 30% more than galvanized and 50% more than ECR bar for
bar; however, the additional handling and field costs of galvanized and ECR need to be taken
into account. Further, MMFX outperforms both galvanized and ECR for corrosion resistance
resulting in the lowest life cycle cost over the competing products. According to the report
(MMFX, 2016), upon the first repair of structures built with galvanized rebar or ECR the costs
are estimated at 5 times or more than if constructed with MMFX rebar. Based on these
information, the unit cost of the MMFX rebar could be estimated as 0.94 $/lb.
The unit cost of different types of reinforcement that will be used in the cost analysis in
this chapter is summarized in Table 5-2.
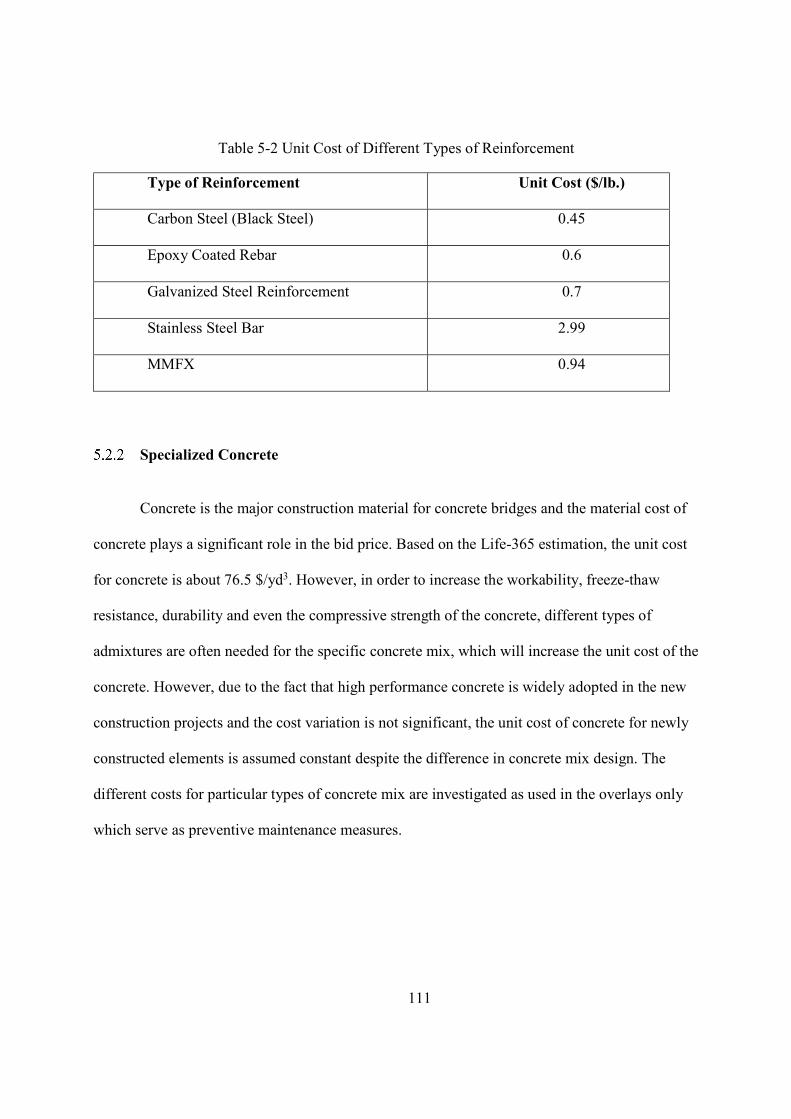
111
Table 5-2 Unit Cost of Different Types of Reinforcement
Type of Reinforcement Unit Cost ($/lb.)
Carbon Steel (Black Steel) 0.45
Epoxy Coated Rebar 0.6
Galvanized Steel Reinforcement 0.7
Stainless Steel Bar 2.99
MMFX 0.94
Specialized Concrete
Concrete is the major construction material for concrete bridges and the material cost of
concrete plays a significant role in the bid price. Based on the Life-365 estimation, the unit cost
for concrete is about 76.5 $/yd3. However, in order to increase the workability, freeze-thaw
resistance, durability and even the compressive strength of the concrete, different types of
admixtures are often needed for the specific concrete mix, which will increase the unit cost of the
concrete. However, due to the fact that high performance concrete is widely adopted in the new
construction projects and the cost variation is not significant, the unit cost of concrete for newly
constructed elements is assumed constant despite the difference in concrete mix design. The
different costs for particular types of concrete mix are investigated as used in the overlays only
which serve as preventive maintenance measures.
112
5.3. Cost of Preventive Maintenance Measures
Sealers
5.3.1.1 Crack sealing
The crack sealing is mainly used to prevent the intrusion of moisture and other harmful
compounds through existing cracks. These treatments typically require high quality materials and
good preparation. Sealants commonly used by State DOTs are Reactive Methyl Methacrylate
(MMA), High molecular weight methacrylate (HMWM) and epoxy-based sealant.
Based on the Oman’s (2014) research, the crack sealants used by Minnesota DOT were
examined. The cost for MMA resins from different manufactures ranges from $42 to $87 per
gallon. While the material cost for Epoxy-based sealant varies within a range of $42 to $81 per
gallon.
However, since the crack sealant is not needed for the entire surface of the concrete
structure, the actual cost of implementing crack sealant is significantly depending on the crack
density. The unit price for the application is always measured in linear foot. Based on the
NCHRP report 523, the cost is approximately $0.3-$1.5 per linear foot for crack filling and
cracks sealing and the cost are slightly higher if it is for a small job.
5.3.1.2 Penetrating Sealers
Due to the effectiveness and the low cost of penetrating sealants, numerous products and
systems are available in the market provided by different manufactures. The sealants could be
installed with a common low pressure garden sprayer, as well as production field spraying
equipment might also be used to improve installation time and application uniformity. Based on
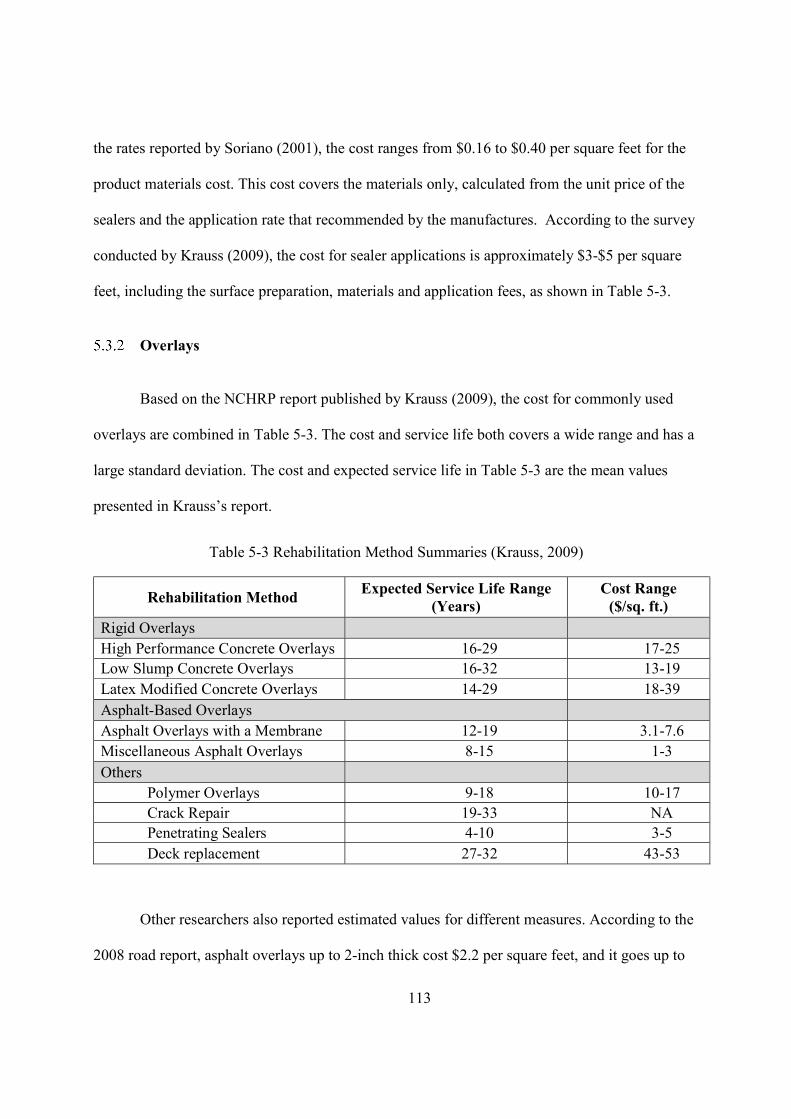
113
the rates reported by Soriano (2001), the cost ranges from $0.16 to $0.40 per square feet for the
product materials cost. This cost covers the materials only, calculated from the unit price of the
sealers and the application rate that recommended by the manufactures. According to the survey
conducted by Krauss (2009), the cost for sealer applications is approximately $3-$5 per square
feet, including the surface preparation, materials and application fees, as shown in Table 5-3.
Overlays
Based on the NCHRP report published by Krauss (2009), the cost for commonly used
overlays are combined in Table 5-3. The cost and service life both covers a wide range and has a
large standard deviation. The cost and expected service life in Table 5-3 are the mean values
presented in Krauss’s report.
Table 5-3 Rehabilitation Method Summaries (Krauss, 2009)
Rehabilitation Method Expected Service Life Range
(Years) Cost Range
($/sq. ft.)
Rigid Overlays
High Performance Concrete Overlays 16-29 17-25 Low Slump Concrete Overlays 16-32 13-19 Latex Modified Concrete Overlays 14-29 18-39 Asphalt-Based Overlays
Asphalt Overlays with a Membrane 12-19 3.1-7.6 Miscellaneous Asphalt Overlays 8-15 1-3 Others
Polymer Overlays 9-18 10-17 Crack Repair 19-33 NA Penetrating Sealers 4-10 3-5 Deck replacement 27-32 43-53
Other researchers also reported estimated values for different measures. According to the
2008 road report, asphalt overlays up to 2-inch thick cost $2.2 per square feet, and it goes up to
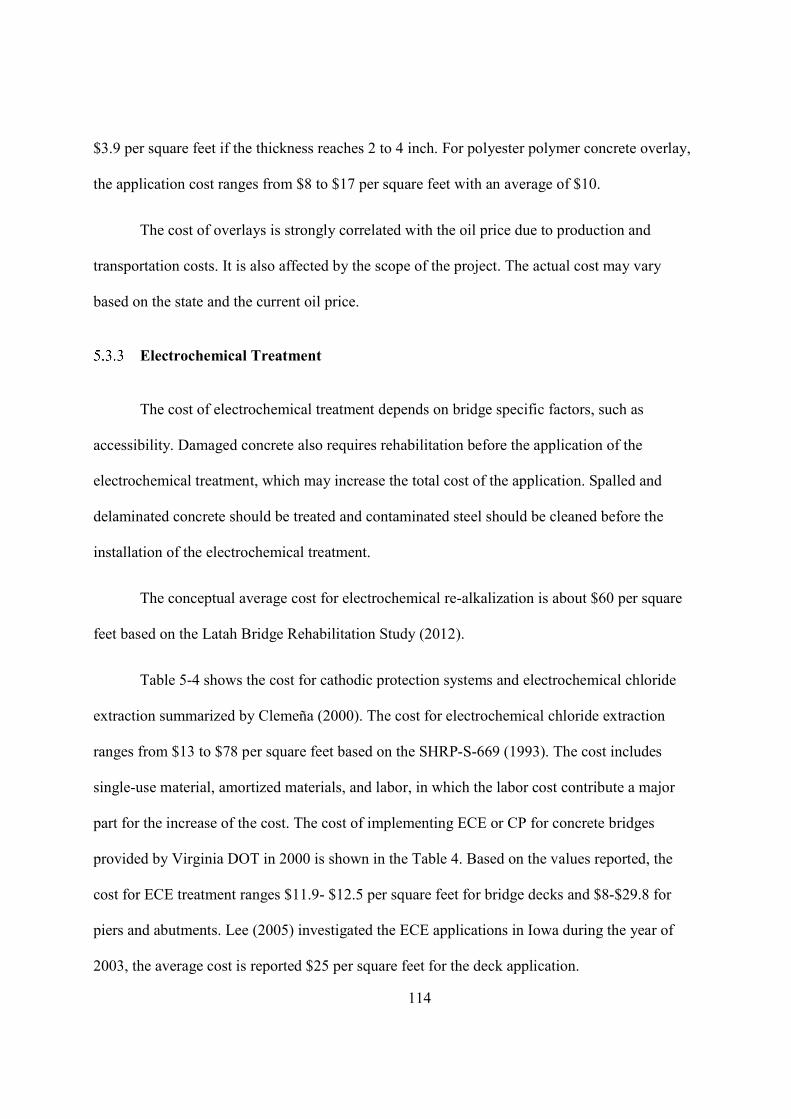
114
$3.9 per square feet if the thickness reaches 2 to 4 inch. For polyester polymer concrete overlay,
the application cost ranges from $8 to $17 per square feet with an average of $10.
The cost of overlays is strongly correlated with the oil price due to production and
transportation costs. It is also affected by the scope of the project. The actual cost may vary
based on the state and the current oil price.
Electrochemical Treatment
The cost of electrochemical treatment depends on bridge specific factors, such as
accessibility. Damaged concrete also requires rehabilitation before the application of the
electrochemical treatment, which may increase the total cost of the application. Spalled and
delaminated concrete should be treated and contaminated steel should be cleaned before the
installation of the electrochemical treatment.
The conceptual average cost for electrochemical re-alkalization is about $60 per square
feet based on the Latah Bridge Rehabilitation Study (2012).
Table 5-4 shows the cost for cathodic protection systems and electrochemical chloride
extraction summarized by Clemeña (2000). The cost for electrochemical chloride extraction
ranges from $13 to $78 per square feet based on the SHRP-S-669 (1993). The cost includes
single-use material, amortized materials, and labor, in which the labor cost contribute a major
part for the increase of the cost. The cost of implementing ECE or CP for concrete bridges
provided by Virginia DOT in 2000 is shown in the Table 4. Based on the values reported, the
cost for ECE treatment ranges $11.9- $12.5 per square feet for bridge decks and $8-$29.8 for
piers and abutments. Lee (2005) investigated the ECE applications in Iowa during the year of
2003, the average cost is reported $25 per square feet for the deck application.
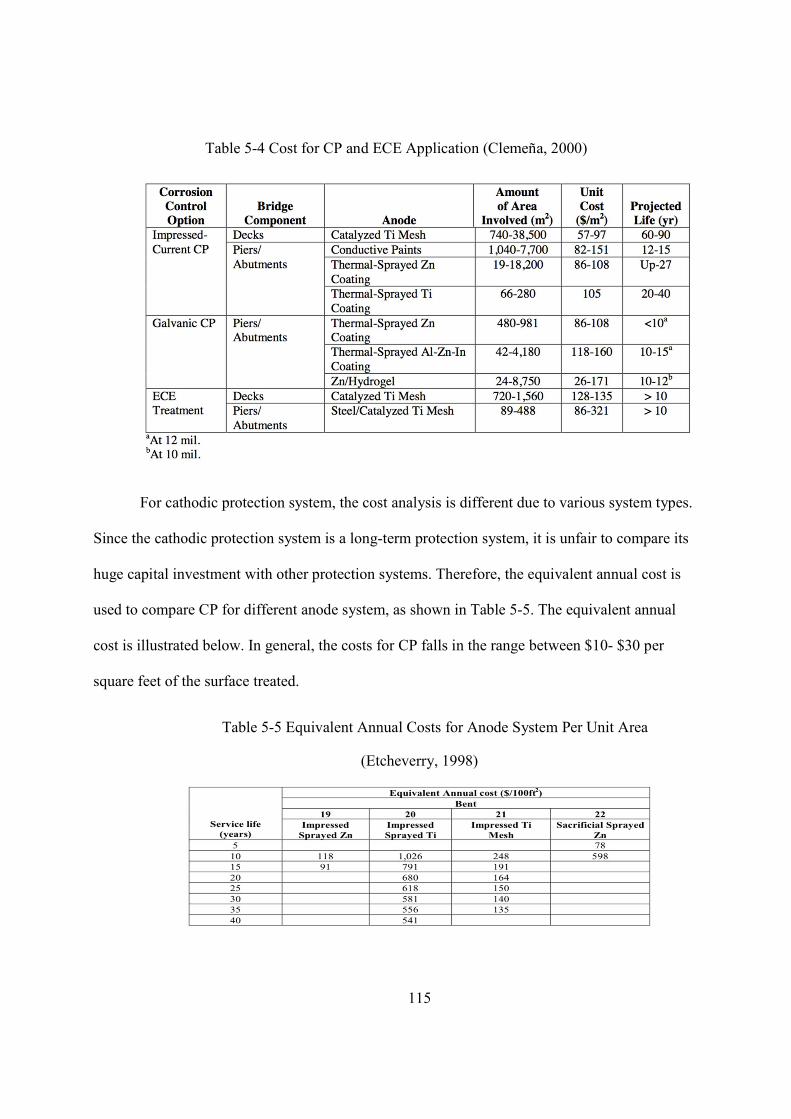
115
Table 5-4 Cost for CP and ECE Application (Clemeña, 2000)
For cathodic protection system, the cost analysis is different due to various system types.
Since the cathodic protection system is a long-term protection system, it is unfair to compare its
huge capital investment with other protection systems. Therefore, the equivalent annual cost is
used to compare CP for different anode system, as shown in Table 5-5. The equivalent annual
cost is illustrated below. In general, the costs for CP falls in the range between $10- $30 per
square feet of the surface treated.
Table 5-5 Equivalent Annual Costs for Anode System Per Unit Area
(Etcheverry, 1998)
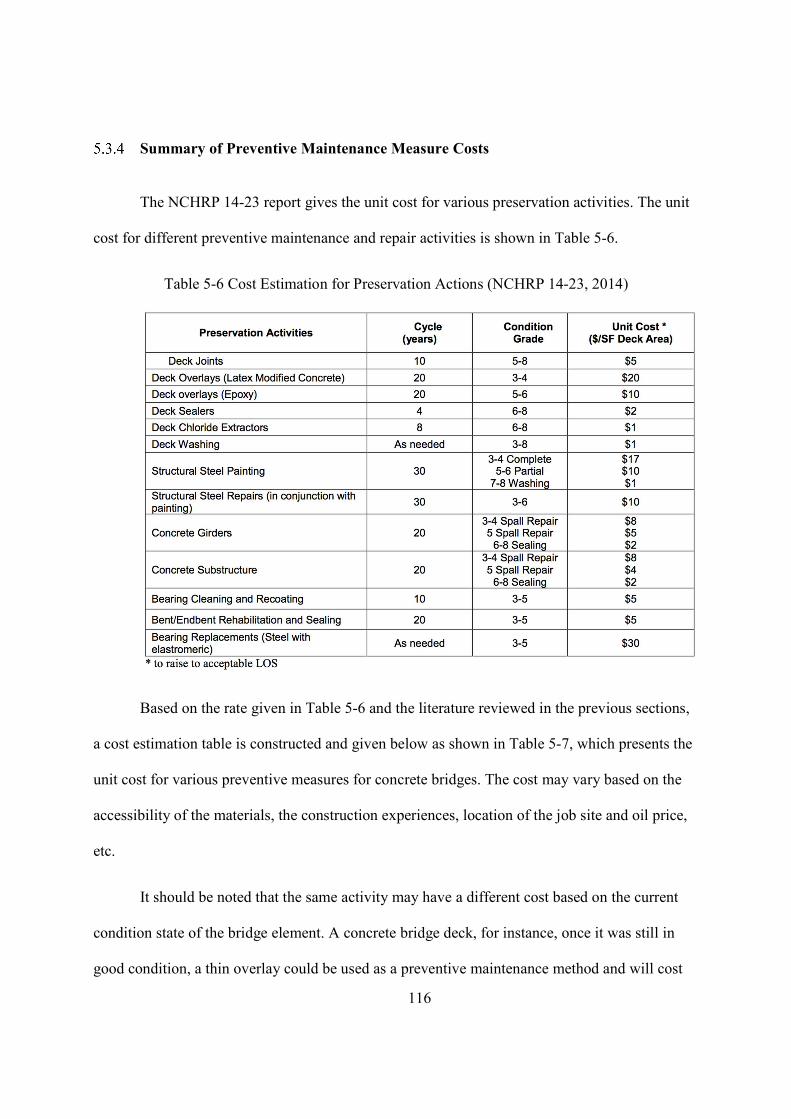
116
Summary of Preventive Maintenance Measure Costs
The NCHRP 14-23 report gives the unit cost for various preservation activities. The unit
cost for different preventive maintenance and repair activities is shown in Table 5-6.
Table 5-6 Cost Estimation for Preservation Actions (NCHRP 14-23, 2014)
Based on the rate given in Table 5-6 and the literature reviewed in the previous sections,
a cost estimation table is constructed and given below as shown in Table 5-7, which presents the
unit cost for various preventive measures for concrete bridges. The cost may vary based on the
accessibility of the materials, the construction experiences, location of the job site and oil price,
etc.
It should be noted that the same activity may have a different cost based on the current
condition state of the bridge element. A concrete bridge deck, for instance, once it was still in
good condition, a thin overlay could be used as a preventive maintenance method and will cost
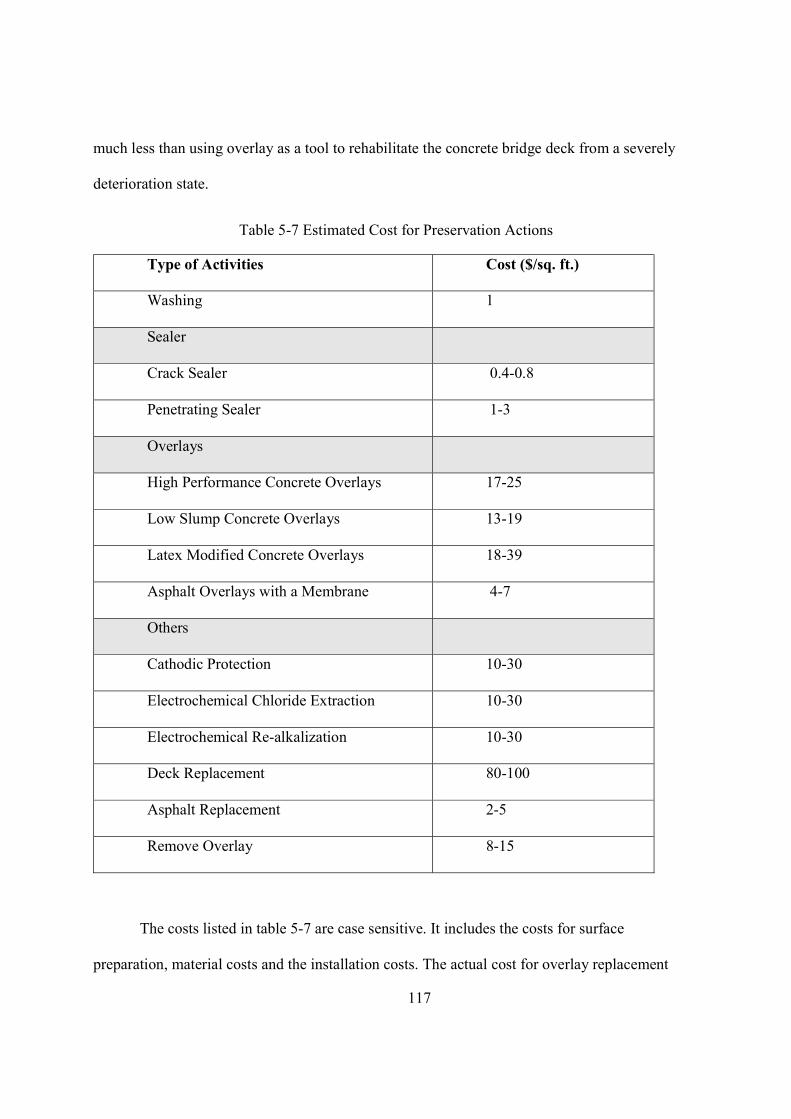
117
much less than using overlay as a tool to rehabilitate the concrete bridge deck from a severely
deterioration state.
Table 5-7 Estimated Cost for Preservation Actions
Type of Activities Cost ($/sq. ft.)
Washing 1
Sealer
Crack Sealer 0.4-0.8
Penetrating Sealer 1-3
Overlays
High Performance Concrete Overlays 17-25
Low Slump Concrete Overlays 13-19
Latex Modified Concrete Overlays 18-39
Asphalt Overlays with a Membrane 4-7
Others
Cathodic Protection 10-30
Electrochemical Chloride Extraction 10-30
Electrochemical Re-alkalization 10-30
Deck Replacement 80-100
Asphalt Replacement 2-5
Remove Overlay 8-15
The costs listed in table 5-7 are case sensitive. It includes the costs for surface
preparation, material costs and the installation costs. The actual cost for overlay replacement
118
may be higher for the reapplication due to the fact that the existing surface need to be removed
and that activity introduce additional costs to the total costs. In addition, the actual cost for
implementing electrochemical treatment such as cathodic protection, chloride extraction and re-
alkalization might also be higher since major rehabilitation work always needs to be done before
the treatment is done.
The values are used in this report for the cost analysis and comparison between different
preventive maintenance systems and application strategies. The actual costs for each application
need to be identified for the purpose of optimizing the preventive maintenance systems and the
timing for implementing the actions.
5.4. Service Life Estimation under Different Preventive Maintenance
Strategies
Finite Element Model
In order to estimate the service life of the concrete bridge deck element, a finite element
model shown below in Figure 5-1 has been constructed. The original depth of the bridge deck is
20.32 cm (8 in). Due to the first Overlay application, 1” of the original concrete cover is removed
and 1.25” overlay is applied, resulting in a total depth of the bridge deck to be equal to 20.955
cm (8.25 in). The succeeding overlay applications consist of 1.25” removal and 1.25” overlay,
which will maintain the depth of the deck without composing too much excessive dead load onto
the bridge system.

119
Figure 5-1 Sketch of the Finite Element Model
Exposure Conditions
Exposure condition is a vital parameter to estimate the service life of the concrete bridge
elements. Temperature, freeze-thaw cycles, and surface chloride concentration are the major
dependents of exposure condition. The exposure condition is identical for each bridge. However,
in order to simplify the analysis, three exposure conditions are selected to conduct the life cycle
analysis, which are severe, normal and mild exposure.
Three Rural highway bridges from New York, Virginia and North Carolina are selected
to represent severe, normal and mild exposure respectively. The surface Chloride concentration
for each State is summarized in Figure 5-2.

120
Figure 5-2 Surface Chloride Concentration for Different Exposure Condition
The average monthly temperature for each state is listed in Table 5-8.
Table 5-8 Average Monthly Temperature for NY, VA, NC
Month NY VA NC (°C) (°C) (°C)
Jul 22 26 23 Aug 21 25 22 Sep 20 22 19 Oct 10 16 13 Nov 5 11 9 Dec -1 7 4 Jan -4 4 2 Feb -4 5 4 Mar 1 9 9 Apr 8 14 13 May 14 19 17 Jun 20 23.5 21
05
101520253035
0 10 20 30 40 50 60 70 80 90
Surf
ace
Chlo
irde
Conc
entr
atio
n (lb
/cu.
yd)
Time (years)
Surface Chloride Concentration for Different Exposure Condition
NY VA NC
121
Concrete Quality
Chloride diffusion coefficient of the concrete element should be tested and monitored
using NDT methods mentioned in the previous chapter. If sufficient field data is not available, it
could be estimated based on the proposed equation for predicting the chloride diffusion
coefficient based on the concrete mix, exposure conditions, and other parameters such as the
deterioration status.
Three different categories are generated to represent the concrete quality, Poor, normal
and Good. An ordinary Portland cement concrete with water-cement ratio of 0.45 is assumed for
poor quality concrete representing the old structures which have high water cement ratio and
high diffusive concrete. An ordinary Portland cement concrete with water-cement ratio of 0.35 is
assigned for normal quality concrete. For good quality concrete, the water-cement ratio is still
0.35, however, the top 1” cover is replaced with high performance concrete with 15% fly ash and
5% silica fume. In this case, the top 1 in. overlay consists of high performance concrete is cast
during the construction of the concrete bridge deck.
Identifying Preservation Actions
The preservation actions are limited by the current condition state of the concrete bridge
element. Some elements may have only one or two feasible actions especially when the bridge
element is in excellent condition or totally deteriorated. In order to achieve active preventive
maintenance, measures should be taken before any corrosion initiates.
Two main aspects of information need to be identified for preservation actions, the cost
and the effects of the preservation actions.
122
The unit cost of the preservation actions is often influenced by the previous condition
state, target condition state after maintenance, the amount of work, accessibility and other
effects. Major rehabilitation works, like bridge deck replacement, is costly but effective for
restoring the condition state to excellent or near new condition. On the other hand, minor
rehabilitation works, like washing and sealing, will not be an appropriate solution to enhance the
condition state of a bridge element, but cost much less than the major ones.
The effects of the preservation actions can be classified into two categories: restoration of
the condition state or extension of time in the same condition state. The typical treatment that
will result in a restoration in condition state for concrete decks is application of overlays, which
will eliminate spalls and delamination on the deck surface and set the condition of the bridge
deck to a better state. Application of sealers is a typical action that will lead to the extension of
time that a bridge element could stay in the same condition state. The presence of sealers will
postpone the deterioration while the condition state is still in the state of good or fair.
Table 5-9 Assumed Cost for Each Activity
Type of Activities Cost ($/sq. ft.)
Penetrating Sealer 2
Crack Sealing 2
Patching 30
Concrete Overlays as Preventive Maintenance Measure 10
Concrete Overlays as Reactive Maintenance Measure 20
Cathodic Protection 30
Deck Replacement 90
123
The most likely cost of individual maintenance action is assumed within the range
governed by Table 5-7 and listed in Table 5-9.
Also, for existing bridge element, the effectiveness of preventive maintenance measures
is not only governed by the treatment effectiveness, but also the current deterioration state of the
element. For instance, once the chloride concentration in the concrete slab exceeds a certain
value, applying overlay will not contribute to extend the service life of the deck since the
remaining chloride in the concrete slab will continue ingress into the concrete and cause
corrosion. In this case, the chloride concentration at the surface of the steel is assigned as the
threshold value to evaluate the effectiveness and the service life of the preventive maintenance
activities.
5.5. Life-cycle Cost analysis
Initial Construction Cost Using Different Materials
From the previous research, it can be seen that based on different exposure environment
and requirements, State DOTs have their own preference when choosing the construction
materials.
The construction cost based on alternative reinforcement is discussed. The unit cost for
carbon steel, epoxy coated rebar, stainless steel and MMFX is listed in Table 5-2. The concrete
unit cost can be estimated as $76.5/yd3 as listed above if no special admixture is used.
Based on these information, the initial construction cost can be estimated for a typical
bridge deck element which is 180 ft.×100 ft. ×8in. The reinforcement ratio of the bridge deck is
assumed as 1.2% so that the volume of the rebar used can be estimated based on the volume of
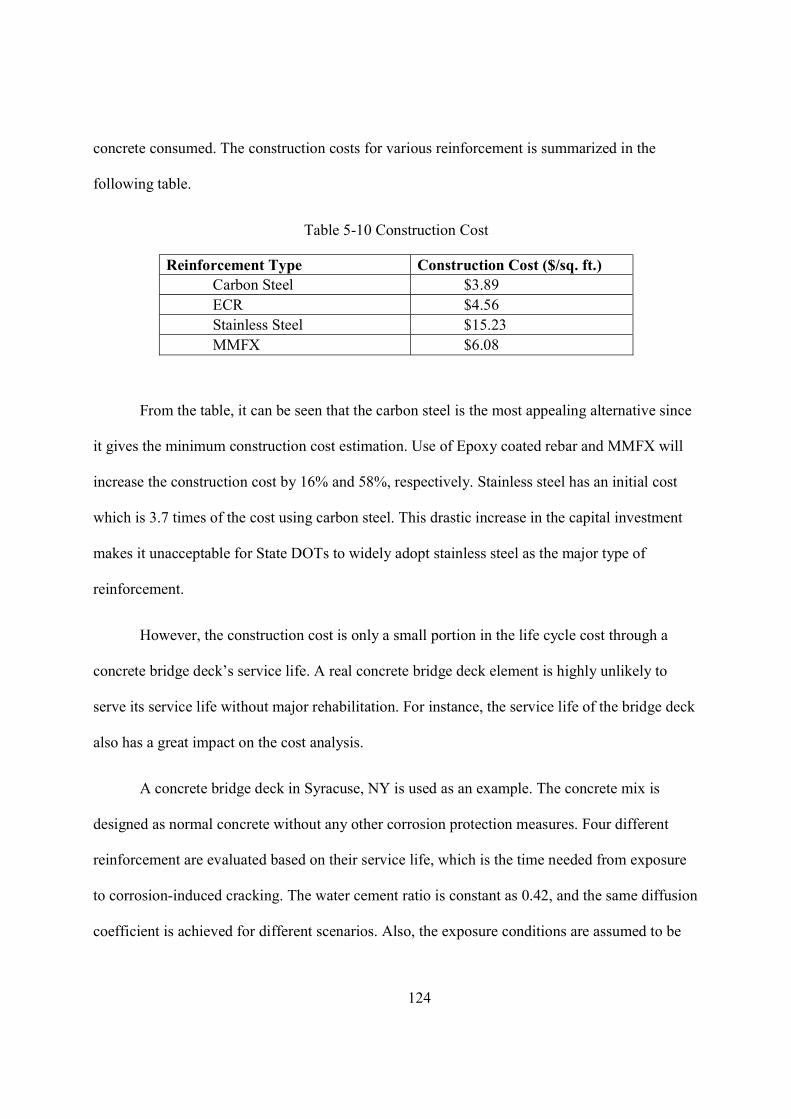
124
concrete consumed. The construction costs for various reinforcement is summarized in the
following table.
Table 5-10 Construction Cost
Reinforcement Type Construction Cost ($/sq. ft.) Carbon Steel $3.89 ECR $4.56 Stainless Steel $15.23 MMFX $6.08
From the table, it can be seen that the carbon steel is the most appealing alternative since
it gives the minimum construction cost estimation. Use of Epoxy coated rebar and MMFX will
increase the construction cost by 16% and 58%, respectively. Stainless steel has an initial cost
which is 3.7 times of the cost using carbon steel. This drastic increase in the capital investment
makes it unacceptable for State DOTs to widely adopt stainless steel as the major type of
reinforcement.
However, the construction cost is only a small portion in the life cycle cost through a
concrete bridge deck’s service life. A real concrete bridge deck element is highly unlikely to
serve its service life without major rehabilitation. For instance, the service life of the bridge deck
also has a great impact on the cost analysis.
A concrete bridge deck in Syracuse, NY is used as an example. The concrete mix is
designed as normal concrete without any other corrosion protection measures. Four different
reinforcement are evaluated based on their service life, which is the time needed from exposure
to corrosion-induced cracking. The water cement ratio is constant as 0.42, and the same diffusion
coefficient is achieved for different scenarios. Also, the exposure conditions are assumed to be

125
the same. Therefore, the major variable is the chloride threshold value and the propagation time
needed from corrosion initiation to cracking. The estimated service life is listed in Table 5-11.
Table 5-11 Service Life of Concrete Bridge Decks with Different Reinforcement
Reinforcement Type Construction Cost
($/sq. ft.) Expected Service Life
(Years)) Carbon Steel $3.89 13.9 ECR $4.56 27.9 Stainless Steel $15.23 93.3 MMFX $6.08 28.3
From Table 5-11, it can be seen that concrete bridge decks reinforced with carbon steel
has the shortest service life that equals 13.9 years, which means the element needs repair and
rehabilitation after only 14 years of completion. If the designing service life is 100 years, it is
guaranteed that the carbon steel reinforced bridge deck needs several rounds of major
rehabilitation and even replacement of the entire element. MMFX and ECR exhibit better
performance compared to carbon steel, achieving an estimated service life of 27.9 and 28.3 years
respectively. However, the epoxy coating of on the ECR is prone to damage during construction,
which may lead to pitting corrosion. It will accelerate the corrosion process once the chloride
concentration at the break face reaches the threshold value. The actual service life of bridge deck
using ECR is normally shorter than expected and needs close monitor.
On the other hand, stainless steel has outperformed all the other reinforcement
alternatives by achieving a service life of 93.3 years without any other corrosion mitigation
measures. The benefits from this extended service life is outstanding. No major rehabilitation is
needed through its whole design service life, which will benefit the bridge management agencies
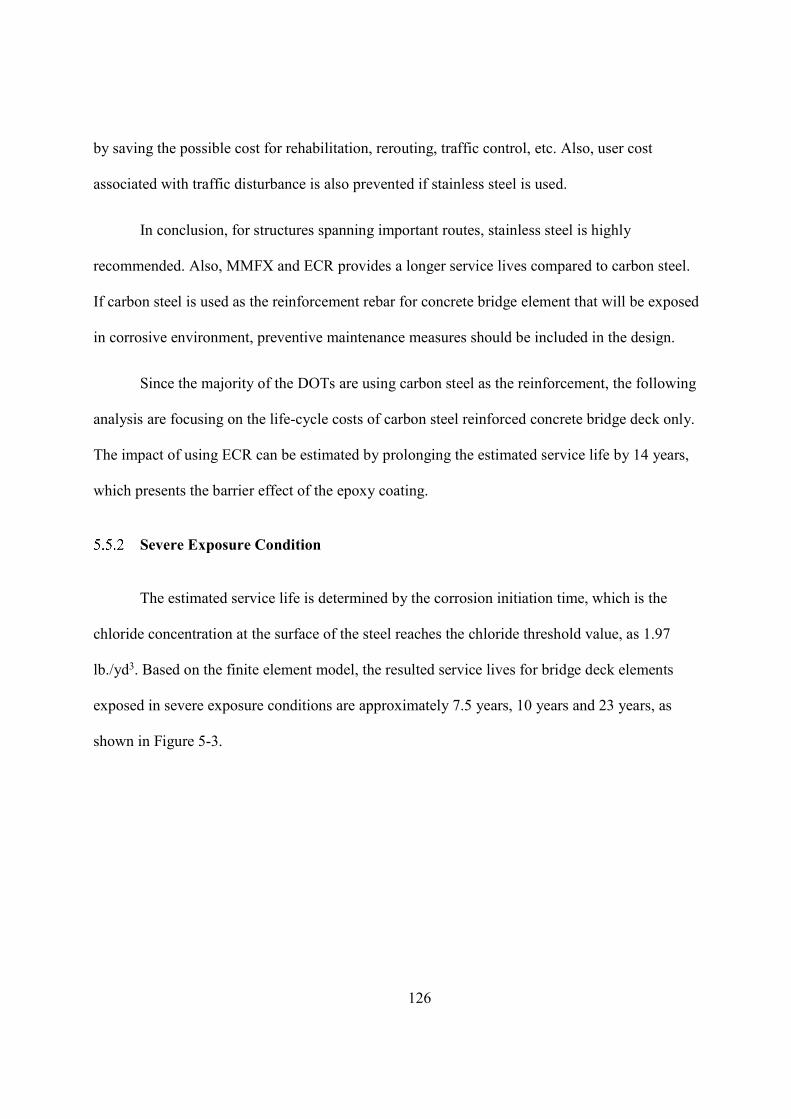
126
by saving the possible cost for rehabilitation, rerouting, traffic control, etc. Also, user cost
associated with traffic disturbance is also prevented if stainless steel is used.
In conclusion, for structures spanning important routes, stainless steel is highly
recommended. Also, MMFX and ECR provides a longer service lives compared to carbon steel.
If carbon steel is used as the reinforcement rebar for concrete bridge element that will be exposed
in corrosive environment, preventive maintenance measures should be included in the design.
Since the majority of the DOTs are using carbon steel as the reinforcement, the following
analysis are focusing on the life-cycle costs of carbon steel reinforced concrete bridge deck only.
The impact of using ECR can be estimated by prolonging the estimated service life by 14 years,
which presents the barrier effect of the epoxy coating.
Severe Exposure Condition
The estimated service life is determined by the corrosion initiation time, which is the
chloride concentration at the surface of the steel reaches the chloride threshold value, as 1.97
lb./yd3. Based on the finite element model, the resulted service lives for bridge deck elements
exposed in severe exposure conditions are approximately 7.5 years, 10 years and 23 years, as
shown in Figure 5-3.
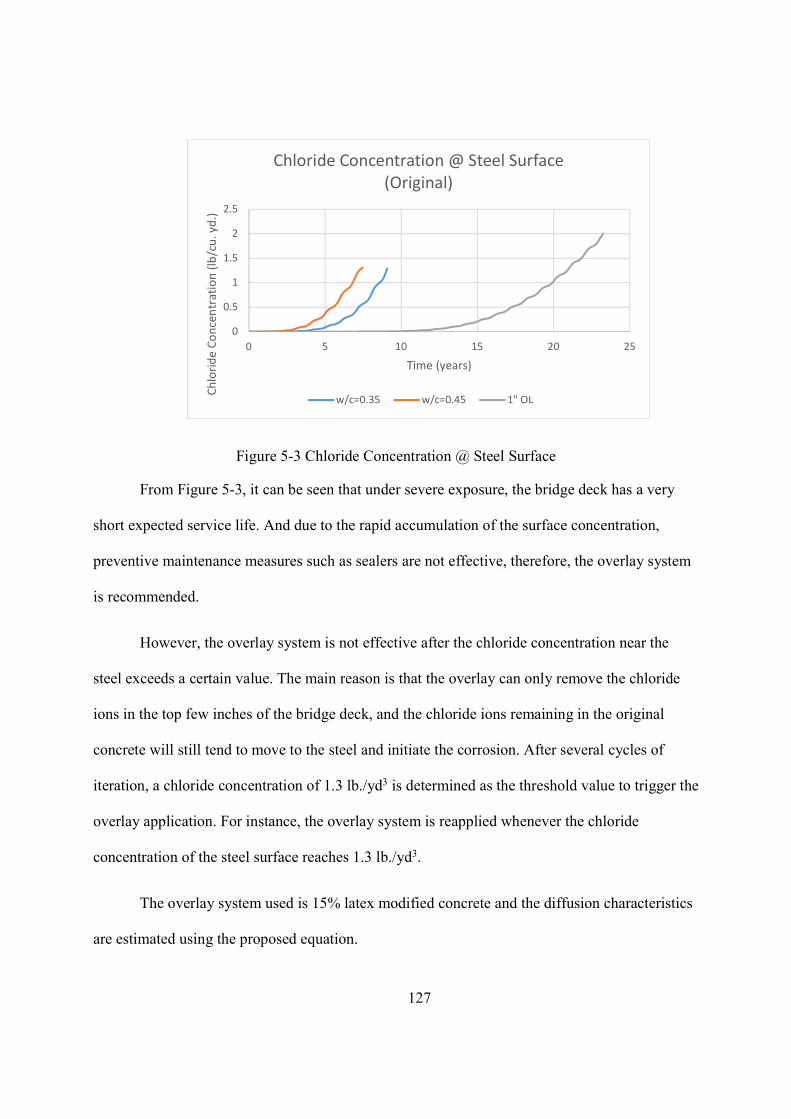
127
Figure 5-3 Chloride Concentration @ Steel Surface
From Figure 5-3, it can be seen that under severe exposure, the bridge deck has a very
short expected service life. And due to the rapid accumulation of the surface concentration,
preventive maintenance measures such as sealers are not effective, therefore, the overlay system
is recommended.
However, the overlay system is not effective after the chloride concentration near the
steel exceeds a certain value. The main reason is that the overlay can only remove the chloride
ions in the top few inches of the bridge deck, and the chloride ions remaining in the original
concrete will still tend to move to the steel and initiate the corrosion. After several cycles of
iteration, a chloride concentration of 1.3 lb./yd3 is determined as the threshold value to trigger the
overlay application. For instance, the overlay system is reapplied whenever the chloride
concentration of the steel surface reaches 1.3 lb./yd3.
The overlay system used is 15% latex modified concrete and the diffusion characteristics
are estimated using the proposed equation.
0
0.5
1
1.5
2
2.5
0 5 10 15 20 25
Chlo
ride
Conc
entr
atio
n (lb
/cu.
yd.
)
Time (years)
Chloride Concentration @ Steel Surface (Original)
w/c=0.35 w/c=0.45 1" OL
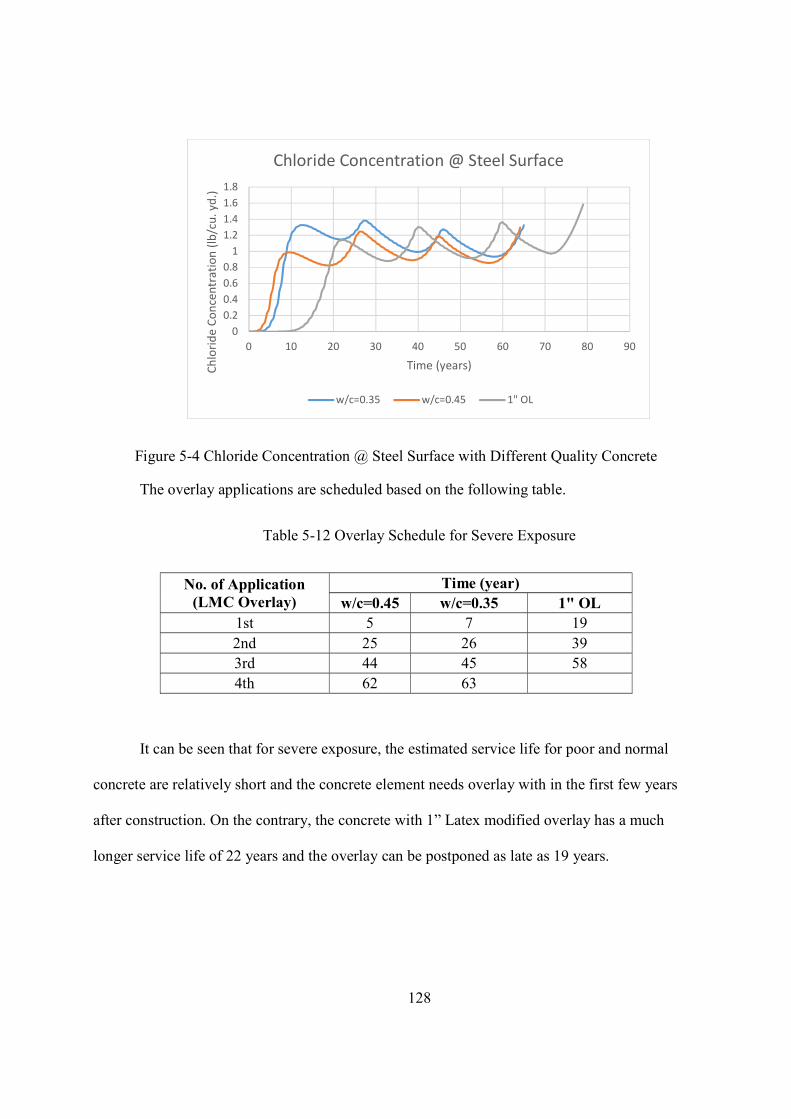
128
Figure 5-4 Chloride Concentration @ Steel Surface with Different Quality Concrete
The overlay applications are scheduled based on the following table.
Table 5-12 Overlay Schedule for Severe Exposure
No. of Application (LMC Overlay)
Time (year) w/c=0.45 w/c=0.35 1" OL
1st 5 7 19 2nd 25 26 39 3rd 44 45 58 4th 62 63
It can be seen that for severe exposure, the estimated service life for poor and normal
concrete are relatively short and the concrete element needs overlay with in the first few years
after construction. On the contrary, the concrete with 1” Latex modified overlay has a much
longer service life of 22 years and the overlay can be postponed as late as 19 years.
00.20.40.60.8
11.21.41.61.8
0 10 20 30 40 50 60 70 80 90
Chlo
ride
Conc
entr
atio
n (lb
/cu.
yd.
)
Time (years)
Chloride Concentration @ Steel Surface
w/c=0.35 w/c=0.45 1" OL
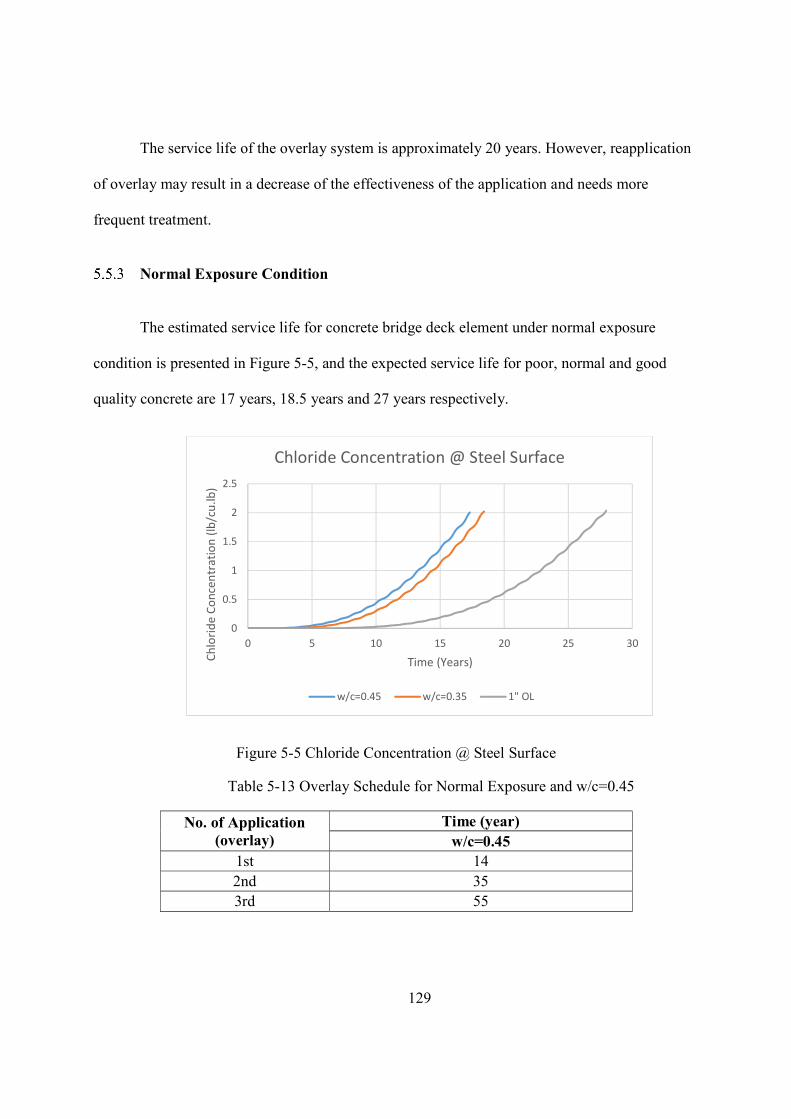
129
The service life of the overlay system is approximately 20 years. However, reapplication
of overlay may result in a decrease of the effectiveness of the application and needs more
frequent treatment.
Normal Exposure Condition
The estimated service life for concrete bridge deck element under normal exposure
condition is presented in Figure 5-5, and the expected service life for poor, normal and good
quality concrete are 17 years, 18.5 years and 27 years respectively.
Figure 5-5 Chloride Concentration @ Steel Surface
Table 5-13 Overlay Schedule for Normal Exposure and w/c=0.45
No. of Application (overlay)
Time (year) w/c=0.45
1st 14 2nd 35 3rd 55
0
0.5
1
1.5
2
2.5
0 5 10 15 20 25 30
Chlo
ride
Conc
entr
atio
n (lb
/cu.
lb)
Time (Years)
Chloride Concentration @ Steel Surface
w/c=0.45 w/c=0.35 1" OL
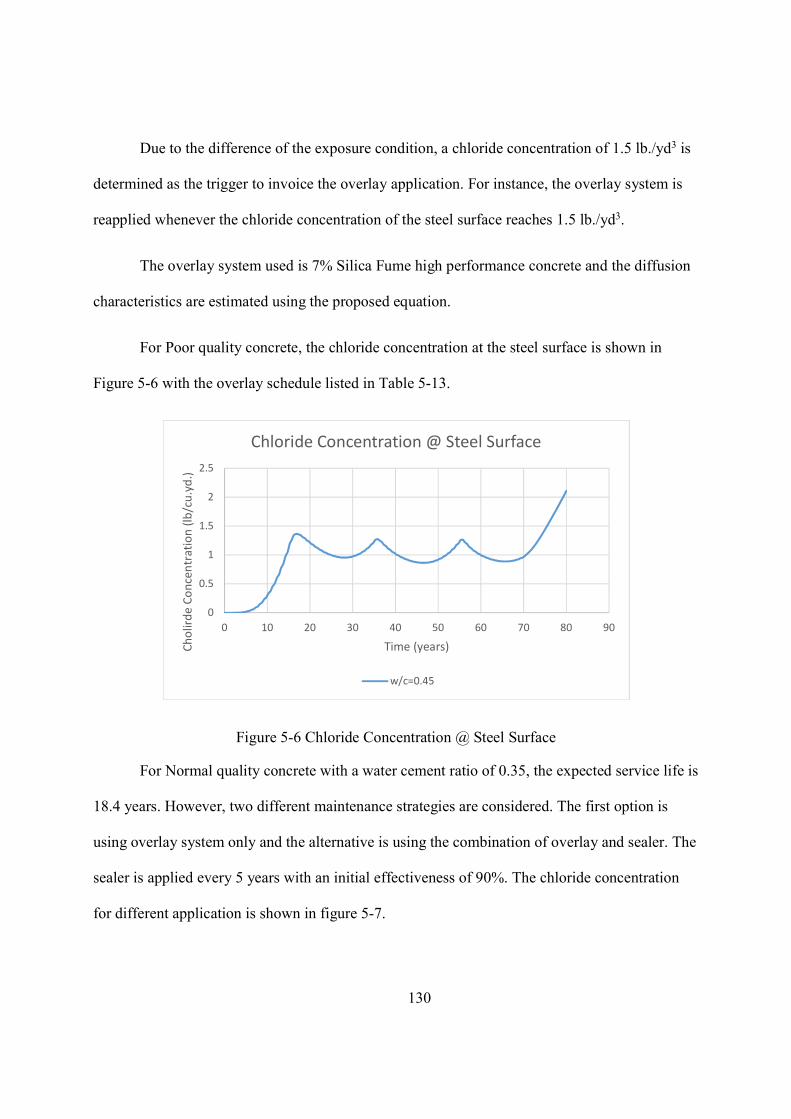
130
Due to the difference of the exposure condition, a chloride concentration of 1.5 lb./yd3 is
determined as the trigger to invoice the overlay application. For instance, the overlay system is
reapplied whenever the chloride concentration of the steel surface reaches 1.5 lb./yd3.
The overlay system used is 7% Silica Fume high performance concrete and the diffusion
characteristics are estimated using the proposed equation.
For Poor quality concrete, the chloride concentration at the steel surface is shown in
Figure 5-6 with the overlay schedule listed in Table 5-13.
Figure 5-6 Chloride Concentration @ Steel Surface
For Normal quality concrete with a water cement ratio of 0.35, the expected service life is
18.4 years. However, two different maintenance strategies are considered. The first option is
using overlay system only and the alternative is using the combination of overlay and sealer. The
sealer is applied every 5 years with an initial effectiveness of 90%. The chloride concentration
for different application is shown in figure 5-7.
0
0.5
1
1.5
2
2.5
0 10 20 30 40 50 60 70 80 90
Chol
irde
Conc
entr
atio
n (lb
/cu.
yd.)
Time (years)
Chloride Concentration @ Steel Surface
w/c=0.45
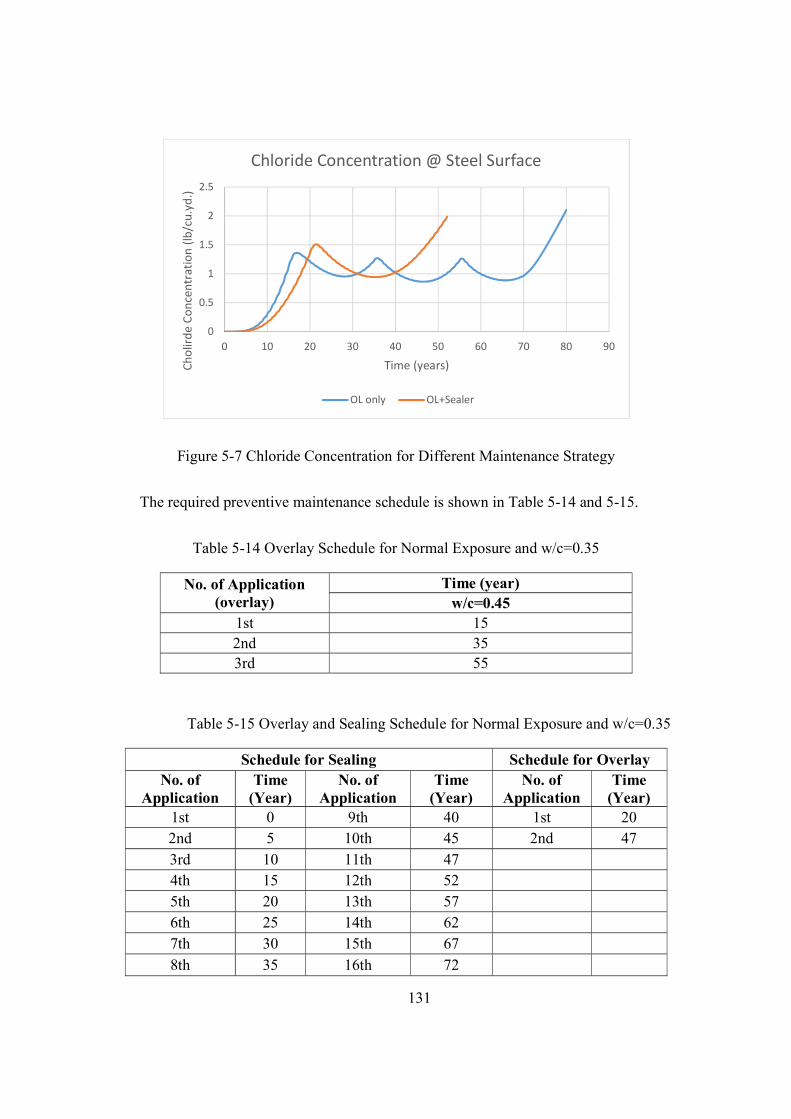
131
Figure 5-7 Chloride Concentration for Different Maintenance Strategy
The required preventive maintenance schedule is shown in Table 5-14 and 5-15.
Table 5-14 Overlay Schedule for Normal Exposure and w/c=0.35
No. of Application (overlay)
Time (year) w/c=0.45
1st 15 2nd 35 3rd 55
Table 5-15 Overlay and Sealing Schedule for Normal Exposure and w/c=0.35
Schedule for Sealing Schedule for Overlay No. of
Application Time
(Year) No. of
Application Time
(Year) No. of
Application Time
(Year) 1st 0 9th 40 1st 20 2nd 5 10th 45 2nd 47 3rd 10 11th 47 4th 15 12th 52 5th 20 13th 57 6th 25 14th 62 7th 30 15th 67 8th 35 16th 72
0
0.5
1
1.5
2
2.5
0 10 20 30 40 50 60 70 80 90
Chol
irde
Conc
entr
atio
n (lb
/cu.
yd.)
Time (years)
Chloride Concentration @ Steel Surface
OL only OL+Sealer

132
For good quality concrete with a water cement ratio of 0.35 and 1” cover of high
performance concrete, the scheduled preventive maintenance is shown in Figure 5-8.
Figure 5-8 Chloride Concentration for Different Maintenance Strategy
Figure 5-8 indicates the required time to apply sealer or overlay treatment. If the overlay
is selected as the only preventive maintenance measure, then the schedule should be applied
based on Table 5-16.
Table 5-16 Overlay Schedule for Normal Exposure and Good Quality Concrete
No. of Application Time (year)
w/c=0.45 1st 25 2nd 52
If both overlay and sealer are selected as the potential preventive maintenance treatment,
then the optimized schedule for sealing and overlay is shown in Table 5-17.
00.20.40.60.8
11.21.41.61.8
0 10 20 30 40 50 60 70 80 90
Chol
irde
Conc
entr
atio
n (lb
/cu.
yd.)
Time (years)
Chloride Concentration @ Steel Surface
OL only OL+sealer
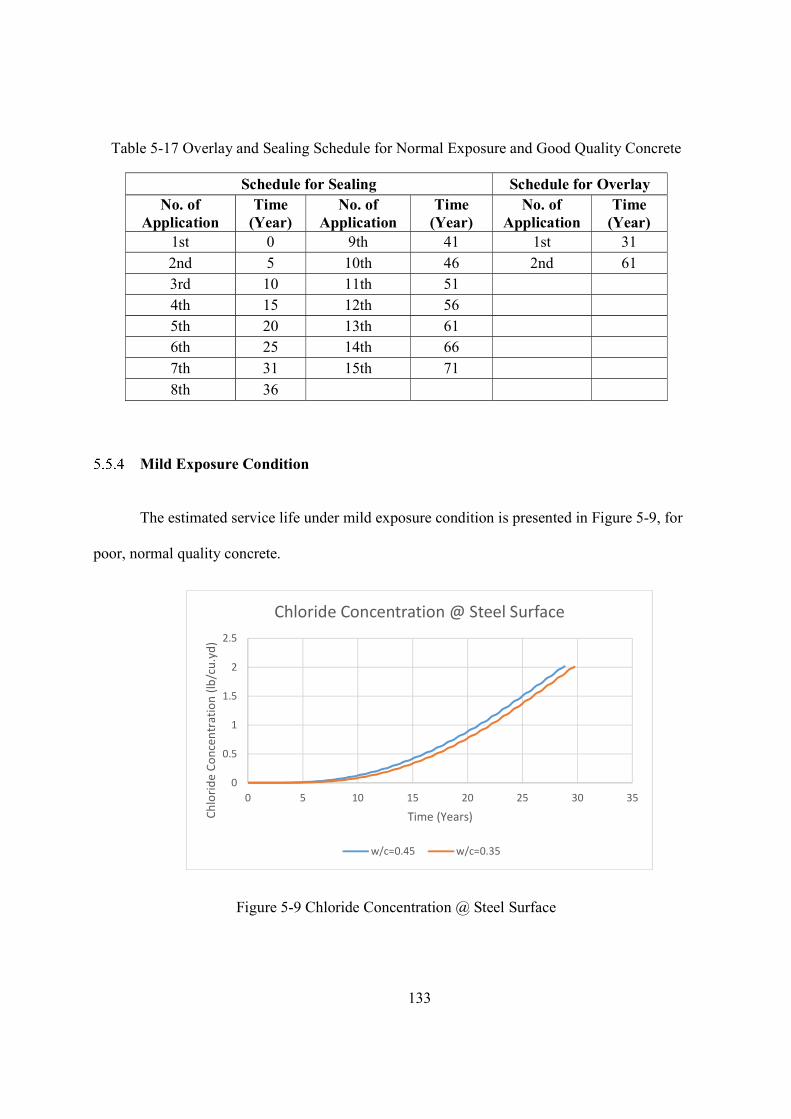
133
Table 5-17 Overlay and Sealing Schedule for Normal Exposure and Good Quality Concrete
Schedule for Sealing Schedule for Overlay No. of
Application Time
(Year) No. of
Application Time
(Year) No. of
Application Time
(Year) 1st 0 9th 41 1st 31 2nd 5 10th 46 2nd 61 3rd 10 11th 51 4th 15 12th 56 5th 20 13th 61 6th 25 14th 66 7th 31 15th 71 8th 36
Mild Exposure Condition
The estimated service life under mild exposure condition is presented in Figure 5-9, for
poor, normal quality concrete.
Figure 5-9 Chloride Concentration @ Steel Surface
0
0.5
1
1.5
2
2.5
0 5 10 15 20 25 30 35
Chlo
ride
Conc
entr
atio
n (lb
/cu.
yd)
Time (Years)
Chloride Concentration @ Steel Surface
w/c=0.45 w/c=0.35
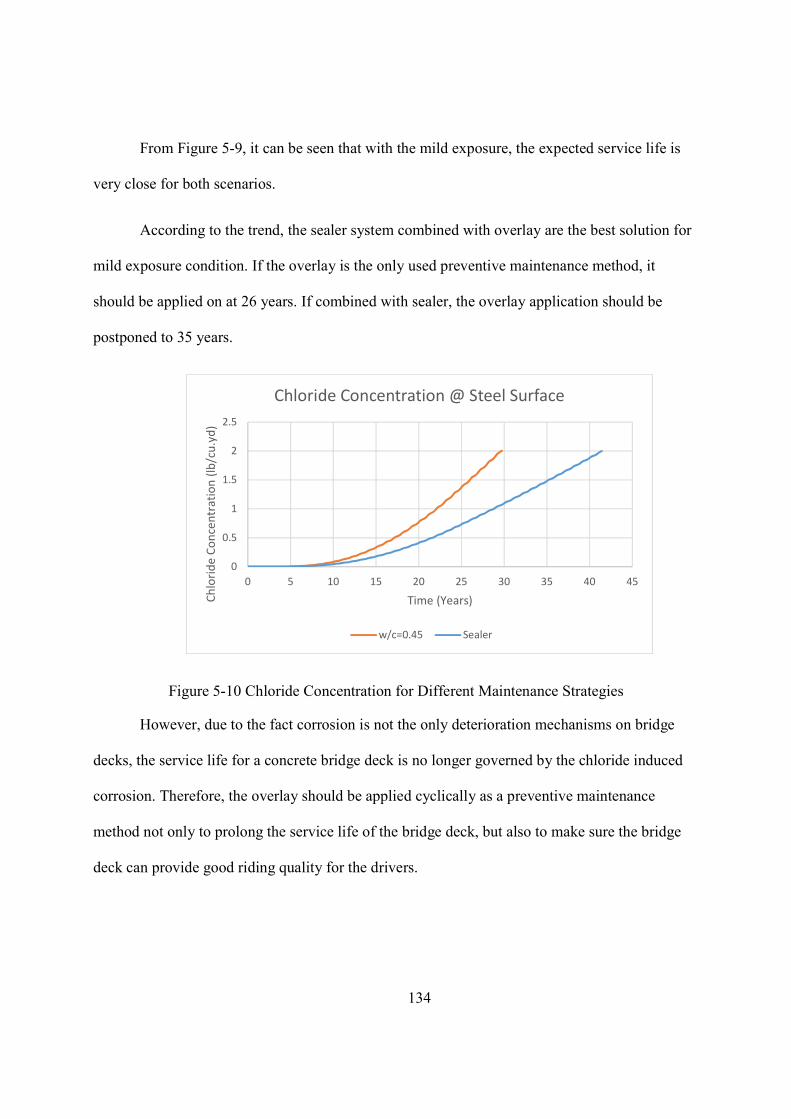
134
From Figure 5-9, it can be seen that with the mild exposure, the expected service life is
very close for both scenarios.
According to the trend, the sealer system combined with overlay are the best solution for
mild exposure condition. If the overlay is the only used preventive maintenance method, it
should be applied on at 26 years. If combined with sealer, the overlay application should be
postponed to 35 years.
Figure 5-10 Chloride Concentration for Different Maintenance Strategies
However, due to the fact corrosion is not the only deterioration mechanisms on bridge
decks, the service life for a concrete bridge deck is no longer governed by the chloride induced
corrosion. Therefore, the overlay should be applied cyclically as a preventive maintenance
method not only to prolong the service life of the bridge deck, but also to make sure the bridge
deck can provide good riding quality for the drivers.
0
0.5
1
1.5
2
2.5
0 5 10 15 20 25 30 35 40 45
Chlo
ride
Conc
entr
atio
n (lb
/cu.
yd)
Time (Years)
Chloride Concentration @ Steel Surface
w/c=0.45 Sealer
135
Life-cycle Cost Comparison
5.5.5.1 Introduction
In order to conduct this simplified life cycle cost analysis, a 75-year analysis period is
selected. The 75-year period is determined by the average design service life reported from the
questionnaire answers given by state DOTs. Also, the bridge may be functionally obsolete due to
the increase of transportation demands.
Based on the literature reviewed, a 3% discount rate is assumed for the life-cycle
analysis. For preventive maintenance actions conducted in year n, the equivalent present value
can be derived from Equation 7-1:
( / , , ) = ×( )
(7-1)
where, F is the future cost of the preventive maintenance, is the discount rate and n is
the year that the maintenance is applied.
All the strategies are compared based on the planning starts from the current year. Some
single action’s costs are not included in this analysis, such as rehabilitation of a small portion of
an element in poor condition before applying treatment to the entire bridge component.
5.5.5.2 Service life Cost Comparison for Normal Exposure
In order to conduct the life cycle cost analysis, a set of assumptions have to be made. The
integrated surface of the 1” overlay for the good quality concrete does not come with additional
charge. The active preventive maintenance strategies are derived from the previous analysis.
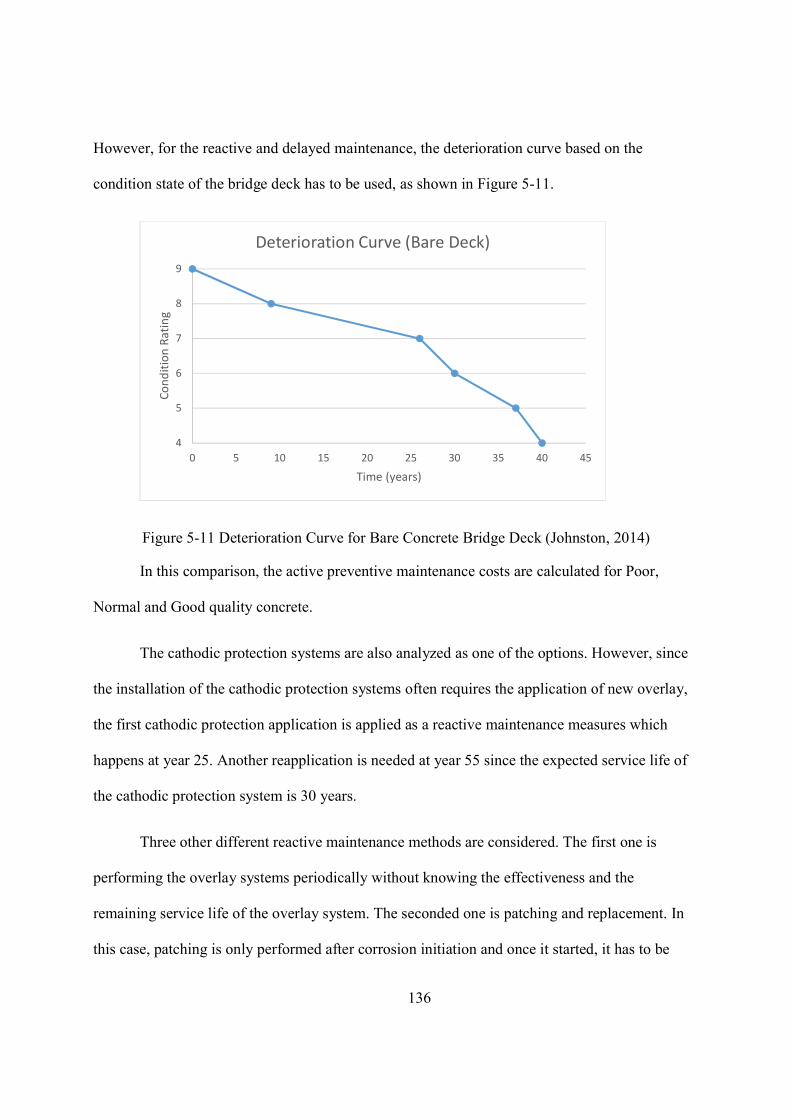
136
However, for the reactive and delayed maintenance, the deterioration curve based on the
condition state of the bridge deck has to be used, as shown in Figure 5-11.
Figure 5-11 Deterioration Curve for Bare Concrete Bridge Deck (Johnston, 2014)
In this comparison, the active preventive maintenance costs are calculated for Poor,
Normal and Good quality concrete.
The cathodic protection systems are also analyzed as one of the options. However, since
the installation of the cathodic protection systems often requires the application of new overlay,
the first cathodic protection application is applied as a reactive maintenance measures which
happens at year 25. Another reapplication is needed at year 55 since the expected service life of
the cathodic protection system is 30 years.
Three other different reactive maintenance methods are considered. The first one is
performing the overlay systems periodically without knowing the effectiveness and the
remaining service life of the overlay system. The seconded one is patching and replacement. In
this case, patching is only performed after corrosion initiation and once it started, it has to be
4
5
6
7
8
9
0 5 10 15 20 25 30 35 40 45
Cond
ition
Rat
ing
Time (years)
Deterioration Curve (Bare Deck)
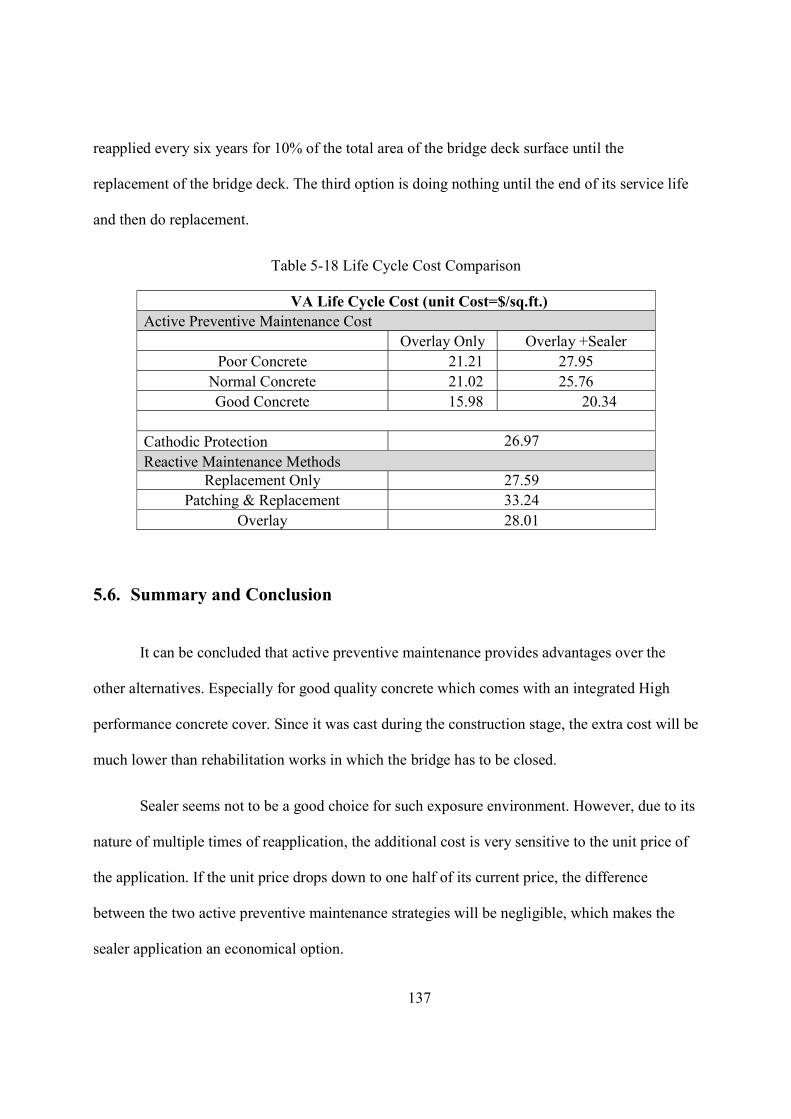
137
reapplied every six years for 10% of the total area of the bridge deck surface until the
replacement of the bridge deck. The third option is doing nothing until the end of its service life
and then do replacement.
Table 5-18 Life Cycle Cost Comparison
VA Life Cycle Cost (unit Cost=$/sq.ft.) Active Preventive Maintenance Cost
Overlay Only Overlay +Sealer Poor Concrete 21.21 27.95
Normal Concrete 21.02 25.76 Good Concrete 15.98 20.34
Cathodic Protection 26.97 Reactive Maintenance Methods
Replacement Only 27.59 Patching & Replacement 33.24
Overlay 28.01
5.6. Summary and Conclusion
It can be concluded that active preventive maintenance provides advantages over the
other alternatives. Especially for good quality concrete which comes with an integrated High
performance concrete cover. Since it was cast during the construction stage, the extra cost will be
much lower than rehabilitation works in which the bridge has to be closed.
Sealer seems not to be a good choice for such exposure environment. However, due to its
nature of multiple times of reapplication, the additional cost is very sensitive to the unit price of
the application. If the unit price drops down to one half of its current price, the difference
between the two active preventive maintenance strategies will be negligible, which makes the
sealer application an economical option.
138
Cathodic protection is not favorable in this case, however, under severe exposure
conditions, it might be the only option to delay or even stop corrosion, especially on old
structures.
Even though the do noting option has the lowest life cycle cost among reactive
maintenance methods, it is still not favorable due to the drop of the condition state and quality of
service.
After all, the use of alternative reinforcing material could also be a good reasonable
alternative since it will eventually yield to a low life cycle cost despite of the fact that it requires
more initial investment during construction.
139
6. RECOMMENDATIONS ON FUTURE INSPECTION AND
MAINTENANCE PROGRAM
Current bridge design service life ranges from 75 years to 100 years. Extensive
maintenance work is needed throughout the whole service life of the concrete bridges, the cost of
which is commonly 4 or 5 time of the construction cost. If a cost effective preventive
maintenance program is adopted, the maintenance cost will decrease drastically. The key to
success of preventive maintenance program depends on preventing physical deterioration of
concrete members, which could be done through preventing/ delaying harmful chemical
reactions. Assessing the chemical condition of a bridge would allow preventive actions before
physical deterioration starts.
Chemical NDTs are essential for estimating the deterioration process and predict the
service condition state for concrete bridge elements. The test should be applied on all elements,
including those elements that are still in good or fair condition. Carbonation tests, chloride
content tests, chloride diffusion tests and ASR test should be performed in order to quantify the
parameters for numerical deterioration equations. The following tests should be performed:
Carbonation Test: The carbonation depth can be used to evaluate the cause of
corrosion; to estimate service life where penetration of the carbonation frontier is
critical; to monitor the effectiveness of applications for re-alkalization.
Chloride Content Test: The chloride content test can be used to evaluate the cause of
corrosion; to estimate the apparent diffusion coefficient by curve fitting using the
chloride diffusion equations; to monitor the effectiveness of preventive maintenance
measures such as sealers and membranes by comparing the chloride concentration.
140
Chloride Diffusion Test: The chloride diffusion test can be used to test the resistance
of concrete for chloride ingression under exposure; to estimate the diffusion
coefficient and the remaining service life of the specimen; to check and verify the
effectiveness of preventive maintenance applications such as sealers and membranes.
ASR Test: The ASR test can be used to determine if the concrete structure is prone to
ASR deterioration mechanism.
In addition to the tests listed above, the properties of the concrete should be tested and
recorded. The compressive strength, porosity and permeability can be tested and used as a
reference to get a value for the water cement ratio for the existing bridge if no historical data is
available. The dynamic modulus of elasticity should also be tested for all new structures.
The NDT can be also used as a tool for selection of preventive maintenance alternatives.
Combining the results of carbonation test, chloride diffusion test and chloride content tests with
numerical deterioration models, the effectiveness of the preventive maintenance measures can be
evaluated. Taking the advantage offered by NDTs and preventive maintenance approaches, the
inspectors can identify possible deterioration before excessive physical damage has occurred,
and then recommend a proper maintenance treatment based on the root cause of the
deterioration. The reapplication of the cost-effective preventive maintenance measures such as
the use of sealers and corrosion inhibitors can be determined by evaluating the chemical
condition of concrete element. If deterioration reaches a critical threshold value, more aggressive
methods, such as overlays could be applied to the structure. If the deterioration rate is high after
years of service and corrosion is the main concern for further deterioration, then cathodic
protection systems could be considered as an alternative treatment.

141
A flowchart (Figure 6-1) has been constructed to better illustrate the usage of Chemical NDE, followed by preventive maintenance activities.
Figure 6-1 Flowchart for Chemical NDT Based Inspection and Preventive Maintenance Strategies
Therefore, the NDTs are not only a method for inspection. They should also be adopted
as part of decision making process, as well as monitoring and evaluation system for a preventive
maintenance plan. By performing a real active preventive maintenance plan, the overall life cycle
cost of the concrete bridge system will decrease.
142
7. SUMMARY AND CONCLUSIONS
7.1. Summary
The current practice for physical evaluation and delayed maintenance of deteriorated
concrete bridge is fundamentally wrong. A cost-effective bridge maintenance program is a
program using preventive maintenance based on the chemical conditions of the concrete bridge
elements. In order to conduct active preventive maintenance, a chemical based, nondestructive
inspection program was proposed. A more refined equation for estimating the chloride diffusion
coefficient that accounts for the effects of latex, cement replacement materials, exposure
conditions, stress, curing, aging, and erosion was proposed. Based on which, an FEA model that
can predict the future chloride profile and the remaining service life was constructed. The FEM
was verified against experimental/field data and other commercial software. The FEM was then
used to show its ability to evaluate the effectiveness of preventive maintenance measures and
guide the active preventive maintenance practice. Furthermore, a life cycle cost analysis of a
typical concrete bridge deck element is conducted in order to demonstrate that the preventive
maintenance plan is economical.
7.2. General Conclusions
This dissertation presents the economy of preventive maintenance for concrete bridge
elements due to corrosion. It presents an in-depth chemical evaluation and preventive
maintenance of existing highway concrete bridges. Based on this study, the following general
conclusions could be drawn:
143
1. Cost-effective maintenance of concrete bridges starts with the use of high quality
concrete and durable materials. The quality of initial construction and workmanship
needs to be guaranteed.
2. As the corrosion of steel bars is the primary cause of deterioration of concrete
bridges, it is recommended to reinforce new concrete bridge decks with FRP bars, or
stainless steel bars, or regular bars along with corrosion protection systems.
3. Preventive maintenance of concrete bridges starts on day one, right after the
construction has been completed.
4. Bridge inspection should be based on the chemical condition more than on the
physical condition of the bridge. There should be a systematic bridge inspection and
evaluation of the chemical condition of bridges. Such new approaches would allow
detecting deterioration mechanism (using preventive maintenance approach) before
they start, long before deterioration of concrete and corrosion of steel bars have
started.
5. Preventive maintenance approach may not eliminate the need for replacement of
bridge decks during the service life of the bridge. Shrinkage, direct traffic wearing,
fatigue stresses will continue to produce cracking in bridge decks. These cracks will
reduce the service life of bridge decks, and require more aggressive maintenance
measures.
6. There is no one preventive maintenance solution for all concrete bridges/bridge
elements. The effectiveness of preventive maintenance is very much site dependent,
as it is affected by the quality of concrete, type of traffic, age of bridge, severity of
surrounding environment, accurate measurement of the effectiveness of preventive
144
maintenance measures, and the chemical condition of the bridge with and without
maintenance measures.
7. Deterioration of concrete bridges is a two-step process; (1) harmful chemical
reactions followed by (2) physical deterioration. The cost of freezing or delaying the
harmful chemical reactions is much lower than the cost of fixing the physical damage.
8. The effective approach to freeze and/or delay the harmful chemical reactions starts
with successful assessment of the chemical condition of the bridge through non-
destructive testing
9. There is a need to conduct field tests to verify the effectiveness of maintenance
actions. Lab test are insufficient to assess the effectiveness of these actions.
7.3. Specific Conclusions
Besides the general conclusions, some specific conclusions could be drawn based on the
analytical models, the finite element modeling and the cost analysis examples.
1. The diffusion coefficient of the concrete element can be achieved by three different
means. The first one is obtained by curve fitting to a chloride profile, which is
suitable for old marine structures. The second one is obtained by using NDT methods
such as the RCP tests. The third one is obtained by using the proposed refined
estimation equation.
2. The chloride diffusion coefficient is dominated by numerous factors. The water
cement ratio, the type and proportion of cementitious materials, and the curing
process have a great impact on the initial chloride diffusion coefficient. In addition,
aging of the concrete, presence and development of the cracks, the exposure

145
environment including temperature and humidity, also play a significant role on the
chloride diffusion coefficient.
3. The impact of the cracks on the chloride diffusion coefficient is quantified by using
the damage index, which is the ratio between the initial and the tested dynamic
modulus of elasticity. The damage index could also be used to represent the impact of
freeze and thaw effect and the ASR reaction on increasing the chloride induced
corrosion process.
4. For concrete bridge deck elements, abrasion is also a vital parameter. In the analysis,
it is modeled by moving the exposed surface. The abrasion rate is associated with the
average daily traffic and the traffic type.
5. Based on the analysis, overlay is the most economical preventive method. It has a
relatively low unit cost, when applied on bridge elements while they are still in good
or fair conditions. The estimated service life of the overlay is around 20 years and
varies depending on the overlay materials and the exposure conditions.
6. Sealer applications will postpone the corrosion initiation while increasing the life
cycle cost of the bridge element. However, the life cycle cost of sealer treatment is
very sensitive to the unit cost for each application due to its relatively short service
life (3-5 years). If the unit cost is decreased and the durability of the sealer increased,
the use of sealer along with periodic overlay could be an economical solution.
7. Cathodic protection systems are suitable for elements under extreme corrosive
environments. Also, it is suitable for old structural elements that do not need major
rehabilitation work but have ongoing corrosion.
146
7.4. Limitations and Recommendations for Future Study
1- Due to the limited availability of experimental/field data, it is recommended that
further validation goes through other concrete bridge components.
2- Some of the chemical NDTs are partially destructive to the structural elements. The
development of imbedded monitoring equipment could be helpful and possibly cost
effective.
3- The chloride induced corrosion is considered as the primary deterioration mechanism
and other deterioration mechanism impacts are only reflected through the change of
diffusion coefficient. A more comprehensive deterioration model that accounts for the
interrelations between different deterioration mechanisms should be investigated.
4- The effectiveness and the cost for preventive maintenance measures are selected
based on the mean values from literature review. If sufficient data is available,
sensitivity analysis should be performed for life cycle cost analysis.
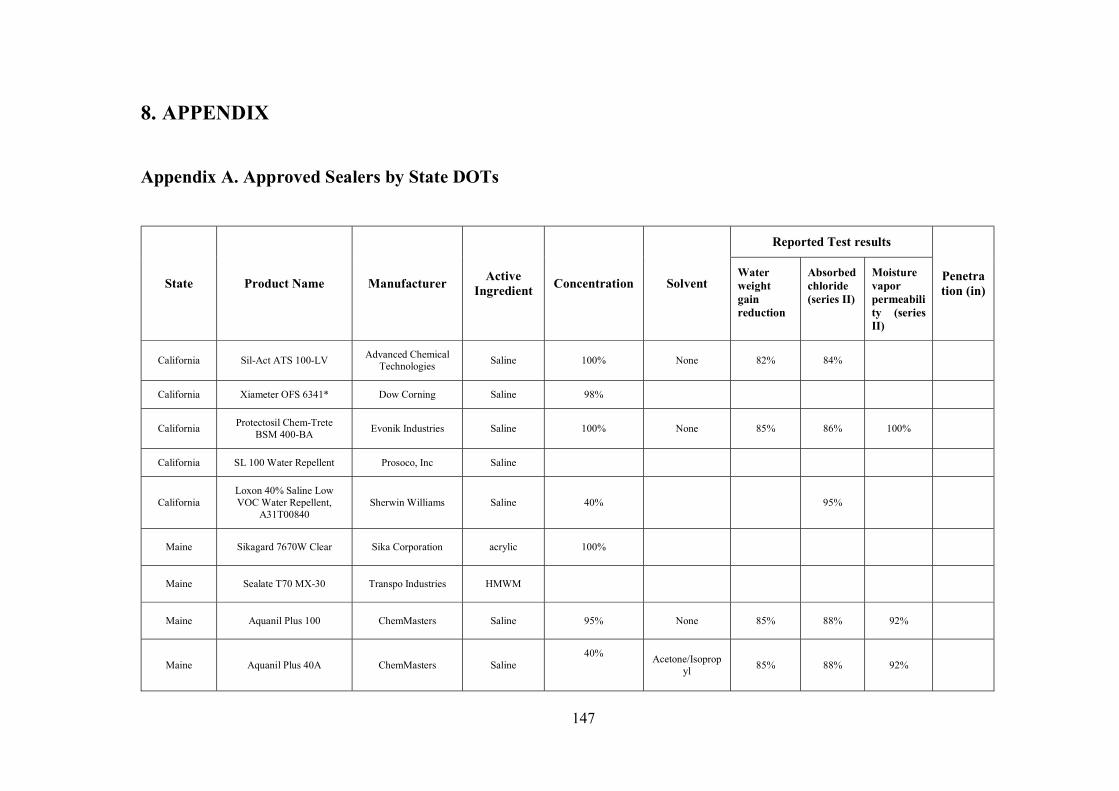
147
8. APPENDIX
Appendix A. Approved Sealers by State DOTs
State Product Name Manufacturer Active
Ingredient Concentration Solvent
Reported Test results
Penetration (in)
Water weight gain reduction
Absorbed chloride (series II)
Moisture vapor permeability (series II)
California Sil-Act ATS 100-LV Advanced Chemical
Technologies Saline 100% None 82% 84%
California Xiameter OFS 6341* Dow Corning Saline 98%
California Protectosil Chem-Trete
BSM 400-BA Evonik Industries Saline 100% None 85% 86% 100%
California SL 100 Water Repellent Prosoco, Inc Saline
California Loxon 40% Saline Low VOC Water Repellent,
A31T00840 Sherwin Williams Saline 40% 95%
Maine Sikagard 7670W Clear Sika Corporation acrylic 100%
Maine Sealate T70 MX-30 Transpo Industries HMWM
Maine Aquanil Plus 100 ChemMasters Saline 95% None 85% 88% 92%
Maine Aquanil Plus 40A ChemMasters Saline 40%
Acetone/Isoprop
yl 85% 88% 92%
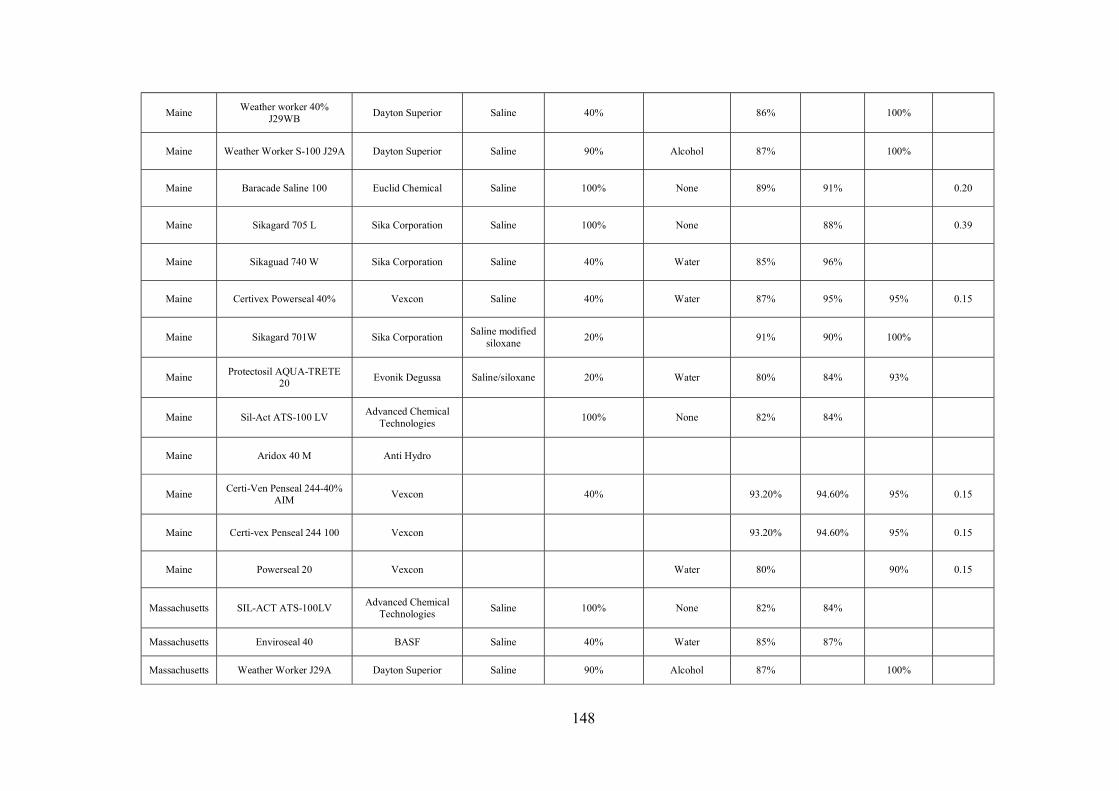
148
Maine Weather worker 40%
J29WB Dayton Superior Saline 40% 86% 100%
Maine Weather Worker S-100 J29A Dayton Superior Saline 90% Alcohol 87% 100%
Maine Baracade Saline 100 Euclid Chemical Saline 100% None 89% 91% 0.20
Maine Sikagard 705 L Sika Corporation Saline 100% None 88% 0.39
Maine Sikaguad 740 W Sika Corporation Saline 40% Water 85% 96%
Maine Certivex Powerseal 40% Vexcon Saline 40% Water 87% 95% 95% 0.15
Maine Sikagard 701W Sika Corporation Saline modified
siloxane 20% 91% 90% 100%
Maine Protectosil AQUA-TRETE
20 Evonik Degussa Saline/siloxane 20% Water 80% 84% 93%
Maine Sil-Act ATS-100 LV Advanced Chemical
Technologies 100% None 82% 84%
Maine Aridox 40 M Anti Hydro
Maine Certi-Ven Penseal 244-40%
AIM Vexcon 40% 93.20% 94.60% 95% 0.15
Maine Certi-vex Penseal 244 100 Vexcon 93.20% 94.60% 95% 0.15
Maine Powerseal 20 Vexcon Water 80% 90% 0.15
Massachusetts SIL-ACT ATS-100LV Advanced Chemical
Technologies Saline 100% None 82% 84%
Massachusetts Enviroseal 40 BASF Saline 40% Water 85% 87%
Massachusetts Weather Worker J29A Dayton Superior Saline 90% Alcohol 87% 100%
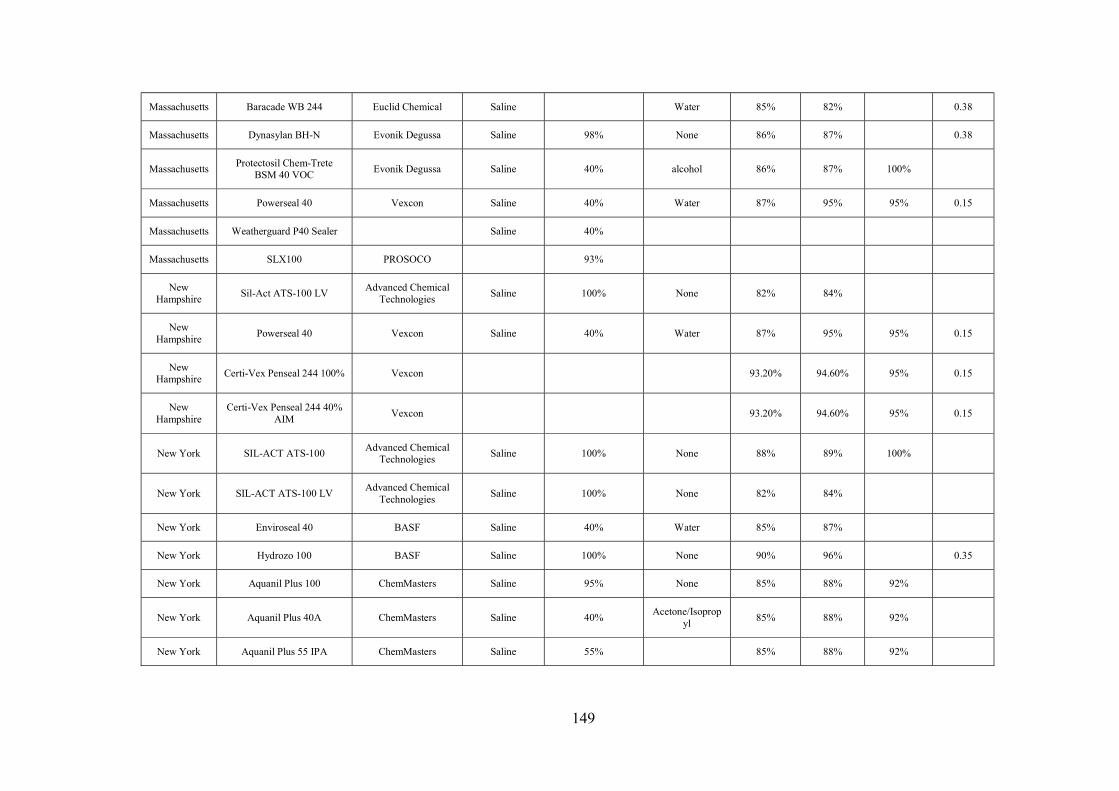
149
Massachusetts Baracade WB 244 Euclid Chemical Saline Water 85% 82% 0.38
Massachusetts Dynasylan BH-N Evonik Degussa Saline 98% None 86% 87% 0.38
Massachusetts Protectosil Chem-Trete
BSM 40 VOC Evonik Degussa Saline 40% alcohol 86% 87% 100%
Massachusetts Powerseal 40 Vexcon Saline 40% Water 87% 95% 95% 0.15
Massachusetts Weatherguard P40 Sealer Saline 40%
Massachusetts SLX100 PROSOCO 93%
New Hampshire
Sil-Act ATS-100 LV Advanced Chemical
Technologies Saline 100% None 82% 84%
New Hampshire
Powerseal 40 Vexcon Saline 40% Water 87% 95% 95% 0.15
New Hampshire
Certi-Vex Penseal 244 100% Vexcon 93.20% 94.60% 95% 0.15
New Hampshire
Certi-Vex Penseal 244 40% AIM
Vexcon 93.20% 94.60% 95% 0.15
New York SIL-ACT ATS-100 Advanced Chemical
Technologies Saline 100% None 88% 89% 100%
New York SIL-ACT ATS-100 LV Advanced Chemical
Technologies Saline 100% None 82% 84%
New York Enviroseal 40 BASF Saline 40% Water 85% 87%
New York Hydrozo 100 BASF Saline 100% None 90% 96% 0.35
New York Aquanil Plus 100 ChemMasters Saline 95% None 85% 88% 92%
New York Aquanil Plus 40A ChemMasters Saline 40% Acetone/Isoprop
yl 85% 88% 92%
New York Aquanil Plus 55 IPA ChemMasters Saline 55% 85% 88% 92%
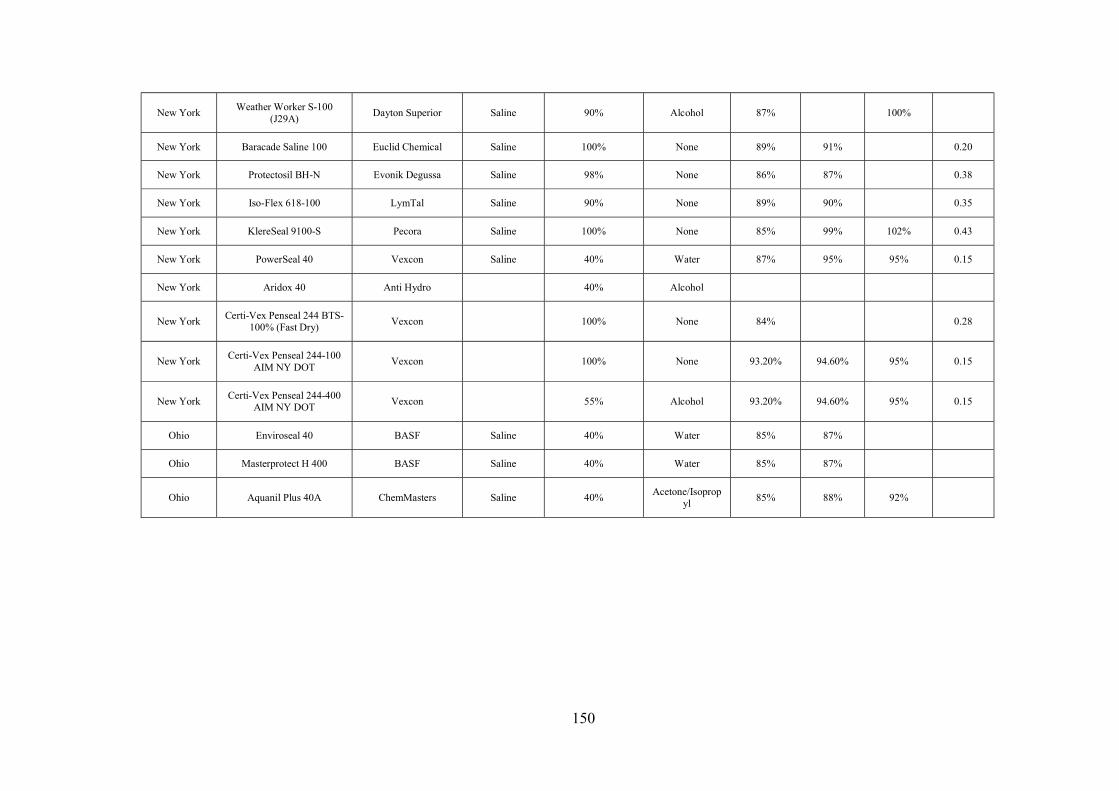
150
New York Weather Worker S-100
(J29A) Dayton Superior Saline 90% Alcohol 87% 100%
New York Baracade Saline 100 Euclid Chemical Saline 100% None 89% 91% 0.20
New York Protectosil BH-N Evonik Degussa Saline 98% None 86% 87% 0.38
New York Iso-Flex 618-100 LymTal Saline 90% None 89% 90% 0.35
New York KlereSeal 9100-S Pecora Saline 100% None 85% 99% 102% 0.43
New York PowerSeal 40 Vexcon Saline 40% Water 87% 95% 95% 0.15
New York Aridox 40 Anti Hydro 40% Alcohol
New York Certi-Vex Penseal 244 BTS-
100% (Fast Dry) Vexcon 100% None 84% 0.28
New York Certi-Vex Penseal 244-100
AIM NY DOT Vexcon 100% None 93.20% 94.60% 95% 0.15
New York Certi-Vex Penseal 244-400
AIM NY DOT Vexcon 55% Alcohol 93.20% 94.60% 95% 0.15
Ohio Enviroseal 40 BASF Saline 40% Water 85% 87%
Ohio Masterprotect H 400 BASF Saline 40% Water 85% 87%
Ohio Aquanil Plus 40A ChemMasters Saline 40% Acetone/Isoprop
yl 85% 88% 92%
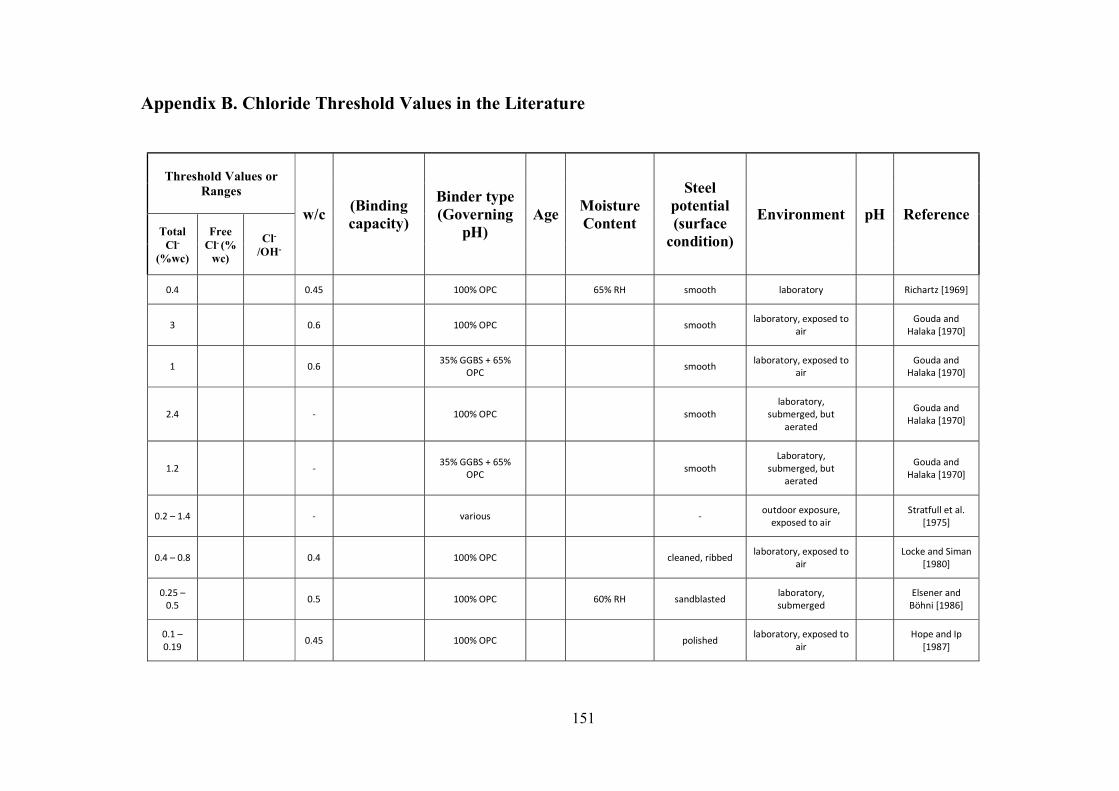
151
Appendix B. Chloride Threshold Values in the Literature
Threshold Values or Ranges
w/c (Binding capacity)
Binder type (Governing
pH) Age
Moisture Content
Steel potential (surface
condition)
Environment pH Reference Total
Cl- (%wc)
Free Cl- (%
wc)
Cl-
/OH-
0.4 0.45 100% OPC 65% RH smooth laboratory Richartz [1969]
3 0.6 100% OPC smooth laboratory, exposed to
air Gouda and
Halaka [1970]
1 0.6 35% GGBS + 65% OPC smooth laboratory, exposed to
air Gouda and Halaka [1970]
2.4 - 100% OPC smooth laboratory,
submerged, but aerated
Gouda and Halaka [1970]
1.2 - 35% GGBS + 65%
OPC smooth Laboratory,
submerged, but aerated
Gouda and
Halaka [1970]
0.2 – 1.4 - various - outdoor exposure, exposed to air
Stratfull et al. [1975]
0.4 – 0.8 0.4 100% OPC cleaned, ribbed laboratory, exposed to air
Locke and Siman [1980]
0.25 – 0.5 0.5 100% OPC 60% RH sandblasted
laboratory, submerged
Elsener and Bohni [1986]
0.1 – 0.19
0.45 100% OPC polished laboratory, exposed to
air
Hope and Ip [1987]
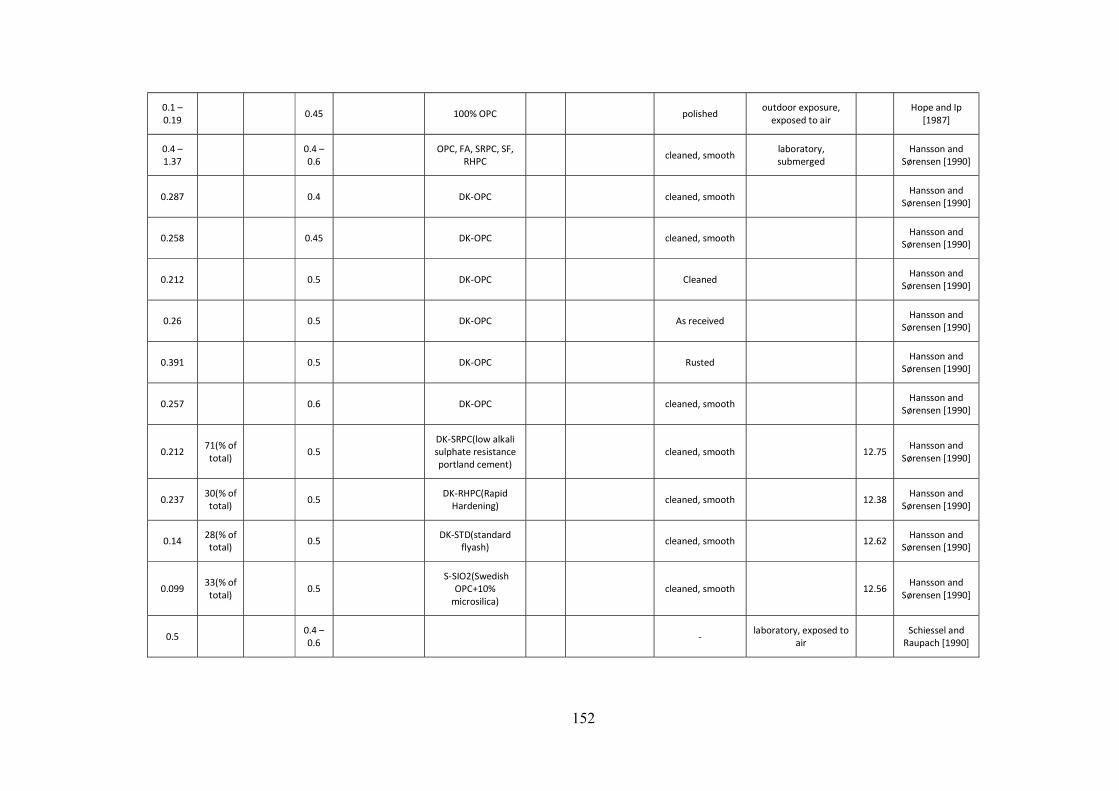
152
0.1 – 0.19
0.45 100% OPC polished outdoor exposure,
exposed to air
Hope and Ip [1987]
0.4 – 1.37
0.4 – 0.6
OPC, FA, SRPC, SF, RHPC cleaned, smooth
laboratory, submerged
Hansson and Sørensen [1990]
0.287 0.4 DK-OPC cleaned, smooth Hansson and
Sørensen [1990]
0.258 0.45 DK-OPC cleaned, smooth Hansson and Sørensen [1990]
0.212 0.5 DK-OPC Cleaned Hansson and
Sørensen [1990]
0.26 0.5 DK-OPC As received Hansson and Sørensen [1990]
0.391 0.5 DK-OPC Rusted Hansson and Sørensen [1990]
0.257 0.6 DK-OPC cleaned, smooth Hansson and Sørensen [1990]
0.212 71(% of total)
0.5 DK-SRPC(low alkali sulphate resistance portland cement)
cleaned, smooth 12.75 Hansson and
Sørensen [1990]
0.237 30(% of total) 0.5
DK-RHPC(Rapid Hardening) cleaned, smooth 12.38
Hansson and Sørensen [1990]
0.14 28(% of total) 0.5 DK-STD(standard
flyash) cleaned, smooth 12.62 Hansson and Sørensen [1990]
0.099 33(% of total)
0.5 S-SIO2(Swedish
OPC+10% microsilica)
cleaned, smooth 12.56 Hansson and
Sørensen [1990]
0.5 0.4 – 0.6 -
laboratory, exposed to air
Schiessel and Raupach [1990]
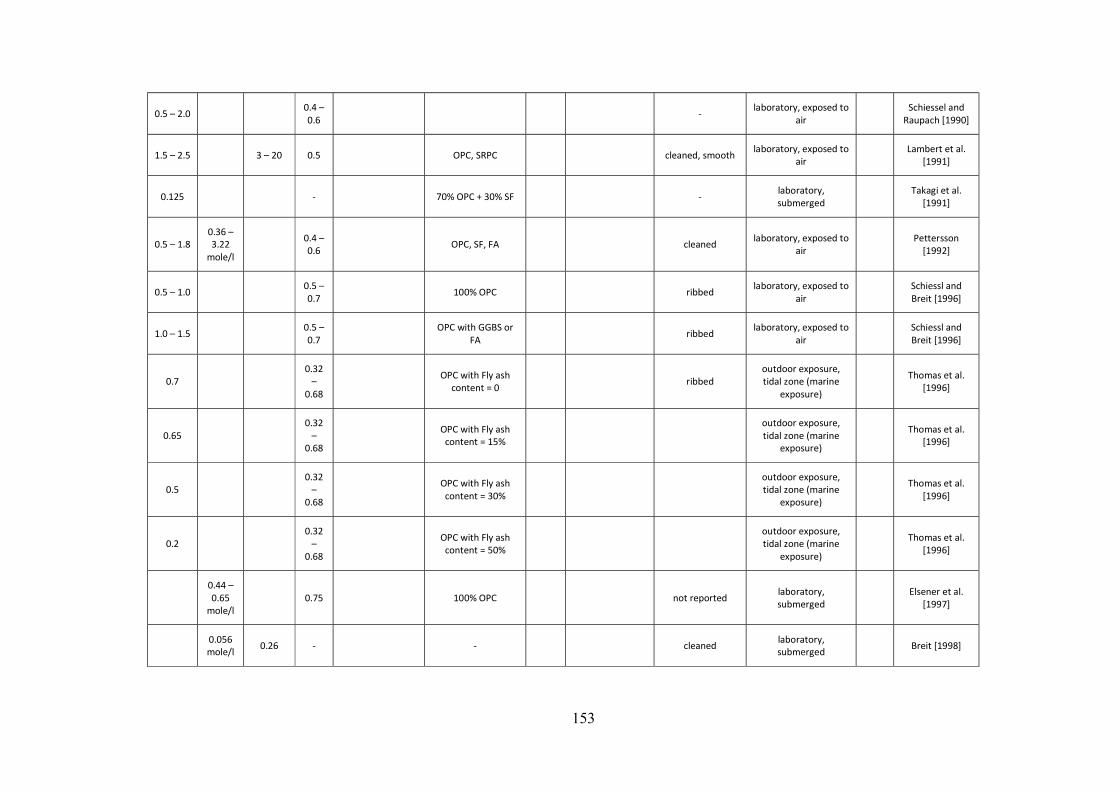
153
0.5 – 2.0 0.4 – 0.6
- laboratory, exposed to
air
Schiessel and Raupach [1990]
1.5 – 2.5 3 – 20 0.5 OPC, SRPC cleaned, smooth laboratory, exposed to
air Lambert et al.
[1991]
0.125 - 70% OPC + 30% SF - laboratory, submerged
Takagi et al. [1991]
0.5 – 1.8 0.36 – 3.22
mole/l 0.4 –
0.6 OPC, SF, FA cleaned laboratory, exposed to
air Pettersson
[1992]
0.5 – 1.0 0.5 – 0.7
100% OPC ribbed laboratory, exposed to
air
Schiessl and Breit [1996]
1.0 – 1.5 0.5 – 0.7
OPC with GGBS or
FA ribbed
laboratory, exposed to air
Schiessl and Breit [1996]
0.7 0.32
– 0.68
OPC with Fly ash content = 0
ribbed outdoor exposure, tidal zone (marine
exposure) Thomas et al.
[1996]
0.65 0.32
– 0.68
OPC with Fly ash content = 15%
outdoor exposure, tidal zone (marine
exposure)
Thomas et al. [1996]
0.5 0.32
– 0.68
OPC with Fly ash content = 30%
outdoor exposure, tidal zone (marine
exposure)
Thomas et al. [1996]
0.2 0.32
– 0.68
OPC with Fly ash content = 50%
outdoor exposure, tidal zone (marine
exposure) Thomas et al.
[1996]
0.44 – 0.65
mole/l 0.75 100% OPC not reported
laboratory, submerged
Elsener et al. [1997]
0.056 mole/l 0.26 - - cleaned laboratory,
submerged Breit [1998]
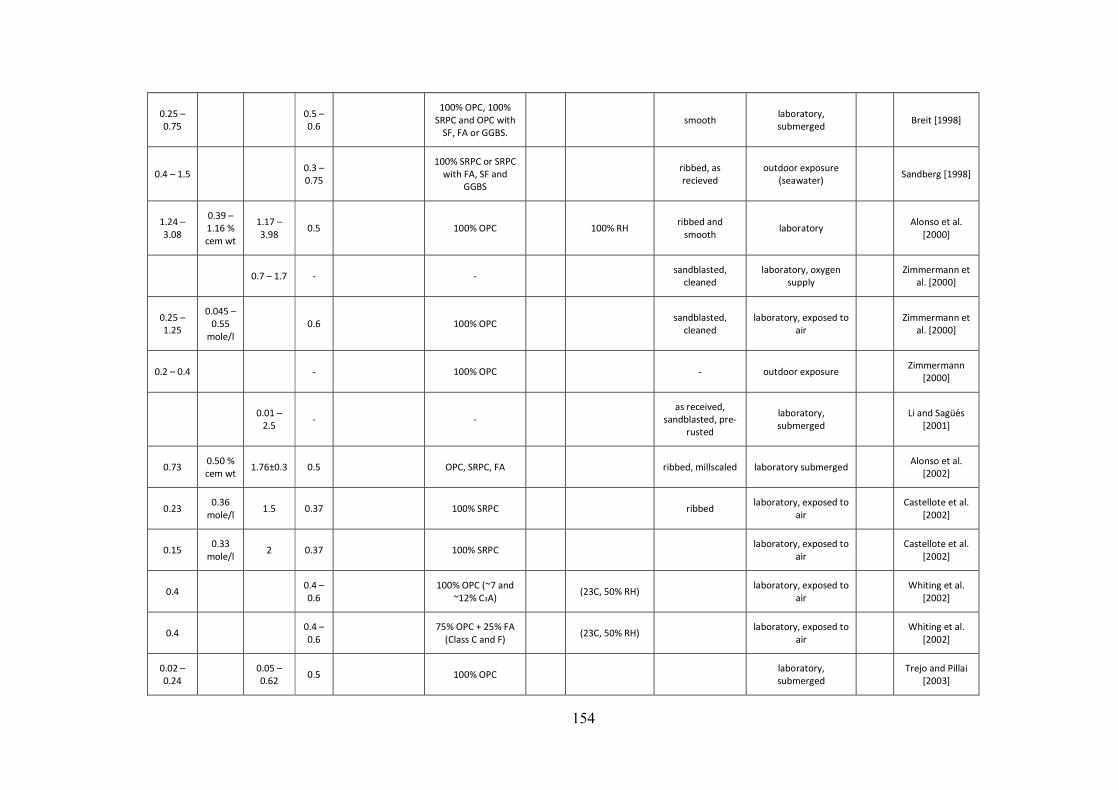
154
0.25 – 0.75
0.5 – 0.6
100% OPC, 100% SRPC and OPC with
SF, FA or GGBS. smooth
laboratory, submerged Breit [1998]
0.4 – 1.5 0.3 – 0.75
100% SRPC or SRPC
with FA, SF and GGBS
ribbed, as recieved
outdoor exposure (seawater)
Sandberg [1998]
1.24 – 3.08
0.39 – 1.16 % cem wt
1.17 – 3.98
0.5 100% OPC 100% RH ribbed and
smooth laboratory
Alonso et al. [2000]
0.7 – 1.7 - - sandblasted,
cleaned laboratory, oxygen
supply Zimmermann et
al. [2000]
0.25 – 1.25
0.045 – 0.55
mole/l 0.6 100% OPC sandblasted,
cleaned laboratory, exposed to
air Zimmermann et
al. [2000]
0.2 – 0.4 - 100% OPC - outdoor exposure Zimmermann
[2000]
0.01 –
2.5 - - as received,
sandblasted, pre-rusted
laboratory, submerged
Li and Sagues [2001]
0.73 0.50 % cem wt
1.76±0.3 0.5 OPC, SRPC, FA ribbed, millscaled laboratory submerged Alonso et al. [2002]
0.23 0.36
mole/l 1.5 0.37 100% SRPC ribbed
laboratory, exposed to air
Castellote et al.
[2002]
0.15 0.33
mole/l 2 0.37 100% SRPC
laboratory, exposed to air
Castellote et al.
[2002]
0.4 0.4 – 0.6
100% OPC (~7 and
~12% C3A) (23C, 50% RH)
laboratory, exposed to air
Whiting et al.
[2002]
0.4 0.4 – 0.6
75% OPC + 25% FA
(Class C and F) (23C, 50% RH)
laboratory, exposed to air
Whiting et al.
[2002]
0.02 – 0.24
0.05 – 0.62 0.5 100% OPC
laboratory, submerged
Trejo and Pillai [2003]
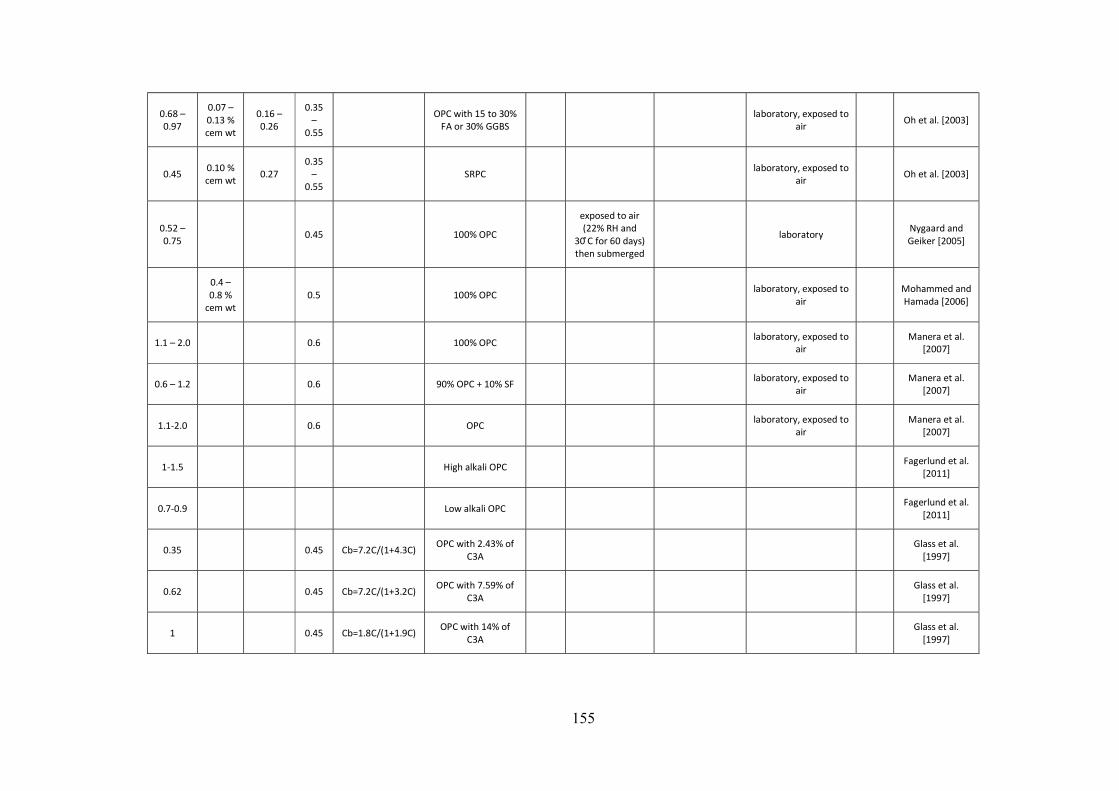
155
0.68 – 0.97
0.07 – 0.13 % cem wt
0.16 – 0.26
0.35 –
0.55
OPC with 15 to 30% FA or 30% GGBS
laboratory, exposed to air Oh et al. [2003]
0.45 0.10 % cem wt
0.27 0.35
– 0.55
SRPC laboratory, exposed to air
Oh et al. [2003]
0.52 – 0.75
0.45 100% OPC
exposed to air (22% RH and
30 C for 60 days) then submerged
laboratory Nygaard and Geiker [2005]
0.4 – 0.8 %
cem wt 0.5 100% OPC
laboratory, exposed to air
Mohammed and Hamada [2006]
1.1 – 2.0 0.6 100% OPC laboratory, exposed to air Manera et al.
[2007]
0.6 – 1.2 0.6 90% OPC + 10% SF laboratory, exposed to air
Manera et al. [2007]
1.1-2.0 0.6 OPC laboratory, exposed to air
Manera et al. [2007]
1-1.5 High alkali OPC Fagerlund et al. [2011]
0.7-0.9 Low alkali OPC Fagerlund et al.
[2011]
0.35 0.45 Cb=7.2C/(1+4.3C) OPC with 2.43% of
C3A
Glass et al. [1997]
0.62 0.45 Cb=7.2C/(1+3.2C) OPC with 7.59% of
C3A
Glass et al. [1997]
1 0.45 Cb=1.8C/(1+1.9C) OPC with 14% of
C3A
Glass et al. [1997]
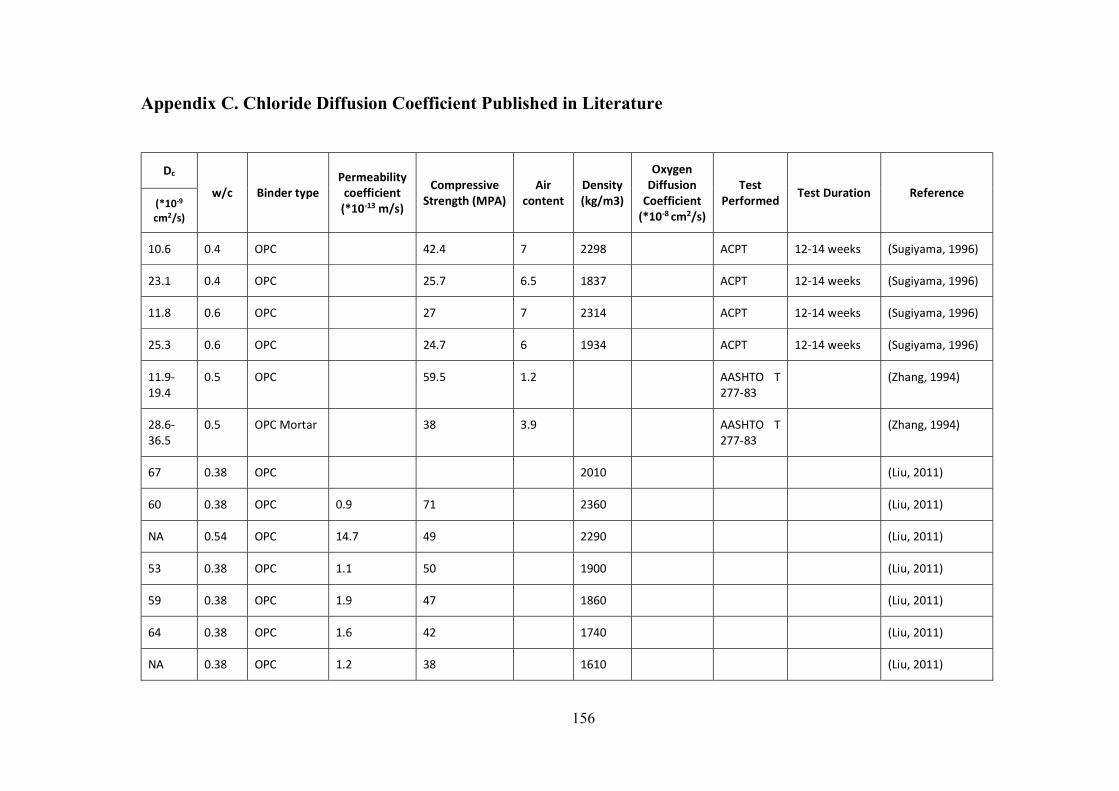
156
Appendix C. Chloride Diffusion Coefficient Published in Literature
Dc
w/c Binder type Permeability
coefficient (*10-13 m/s)
Compressive Strength (MPA)
Air content
Density (kg/m3)
Oxygen Diffusion
Coefficient (*10-8 cm2/s)
Test Performed
Test Duration Reference (*10-9 cm2/s)
10.6 0.4 OPC 42.4 7 2298 ACPT 12-14 weeks (Sugiyama, 1996)
23.1 0.4 OPC 25.7 6.5 1837 ACPT 12-14 weeks (Sugiyama, 1996)
11.8 0.6 OPC 27 7 2314 ACPT 12-14 weeks (Sugiyama, 1996)
25.3 0.6 OPC 24.7 6 1934 ACPT 12-14 weeks (Sugiyama, 1996)
11.9-19.4
0.5 OPC 59.5 1.2 AASHTO T 277-83
(Zhang, 1994)
28.6-36.5
0.5 OPC Mortar 38 3.9 AASHTO T 277-83
(Zhang, 1994)
67 0.38 OPC 2010 (Liu, 2011)
60 0.38 OPC 0.9 71 2360 (Liu, 2011)
NA 0.54 OPC 14.7 49 2290 (Liu, 2011)
53 0.38 OPC 1.1 50 1900 (Liu, 2011)
59 0.38 OPC 1.9 47 1860 (Liu, 2011)
64 0.38 OPC 1.6 42 1740 (Liu, 2011)
NA 0.38 OPC 1.2 38 1610 (Liu, 2011)
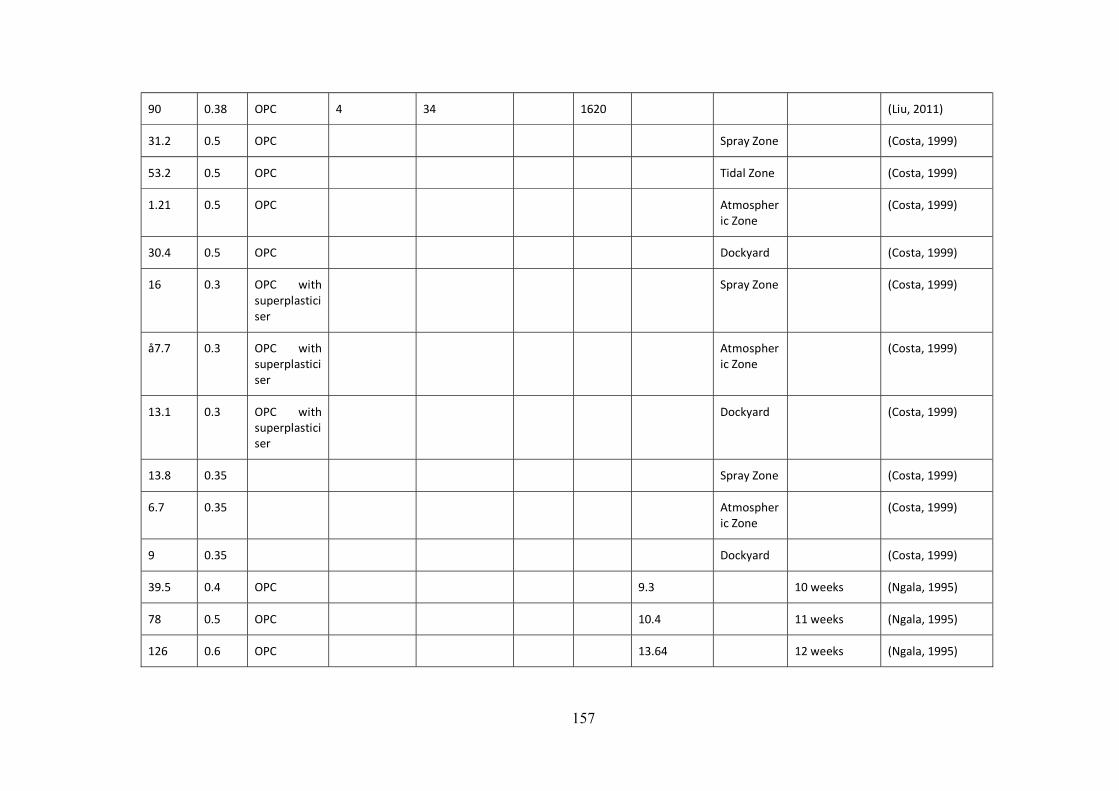
157
90 0.38 OPC 4 34 1620 (Liu, 2011)
31.2 0.5 OPC Spray Zone (Costa, 1999)
53.2 0.5 OPC Tidal Zone (Costa, 1999)
1.21 0.5 OPC Atmospheric Zone
(Costa, 1999)
30.4 0.5 OPC Dockyard (Costa, 1999)
16 0.3 OPC with superplasticiser
Spray Zone (Costa, 1999)
å7.7 0.3 OPC with superplasticiser
Atmospheric Zone
(Costa, 1999)
13.1 0.3 OPC with superplasticiser
Dockyard (Costa, 1999)
13.8 0.35 Spray Zone (Costa, 1999)
6.7 0.35 Atmospheric Zone
(Costa, 1999)
9 0.35 Dockyard (Costa, 1999)
39.5 0.4 OPC 9.3 10 weeks (Ngala, 1995)
78 0.5 OPC 10.4 11 weeks (Ngala, 1995)
126 0.6 OPC 13.64 12 weeks (Ngala, 1995)
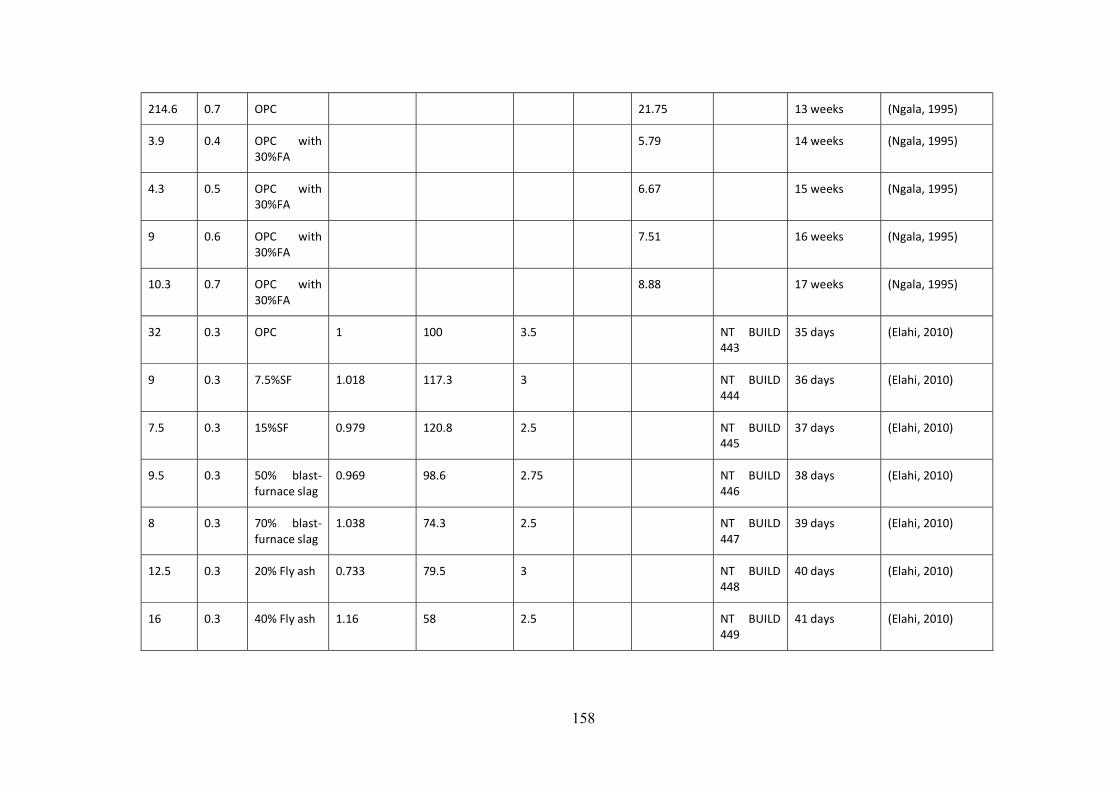
158
214.6 0.7 OPC 21.75 13 weeks (Ngala, 1995)
3.9 0.4 OPC with 30%FA
5.79 14 weeks (Ngala, 1995)
4.3 0.5 OPC with 30%FA
6.67 15 weeks (Ngala, 1995)
9 0.6 OPC with 30%FA
7.51 16 weeks (Ngala, 1995)
10.3 0.7 OPC with 30%FA
8.88 17 weeks (Ngala, 1995)
32 0.3 OPC 1 100 3.5 NT BUILD 443
35 days (Elahi, 2010)
9 0.3 7.5%SF 1.018 117.3 3 NT BUILD 444
36 days (Elahi, 2010)
7.5 0.3 15%SF 0.979 120.8 2.5 NT BUILD 445
37 days (Elahi, 2010)
9.5 0.3 50% blast-furnace slag
0.969 98.6 2.75 NT BUILD 446
38 days (Elahi, 2010)
8 0.3 70% blast-furnace slag
1.038 74.3 2.5 NT BUILD 447
39 days (Elahi, 2010)
12.5 0.3 20% Fly ash 0.733 79.5 3 NT BUILD 448
40 days (Elahi, 2010)
16 0.3 40% Fly ash 1.16 58 2.5 NT BUILD 449
41 days (Elahi, 2010)
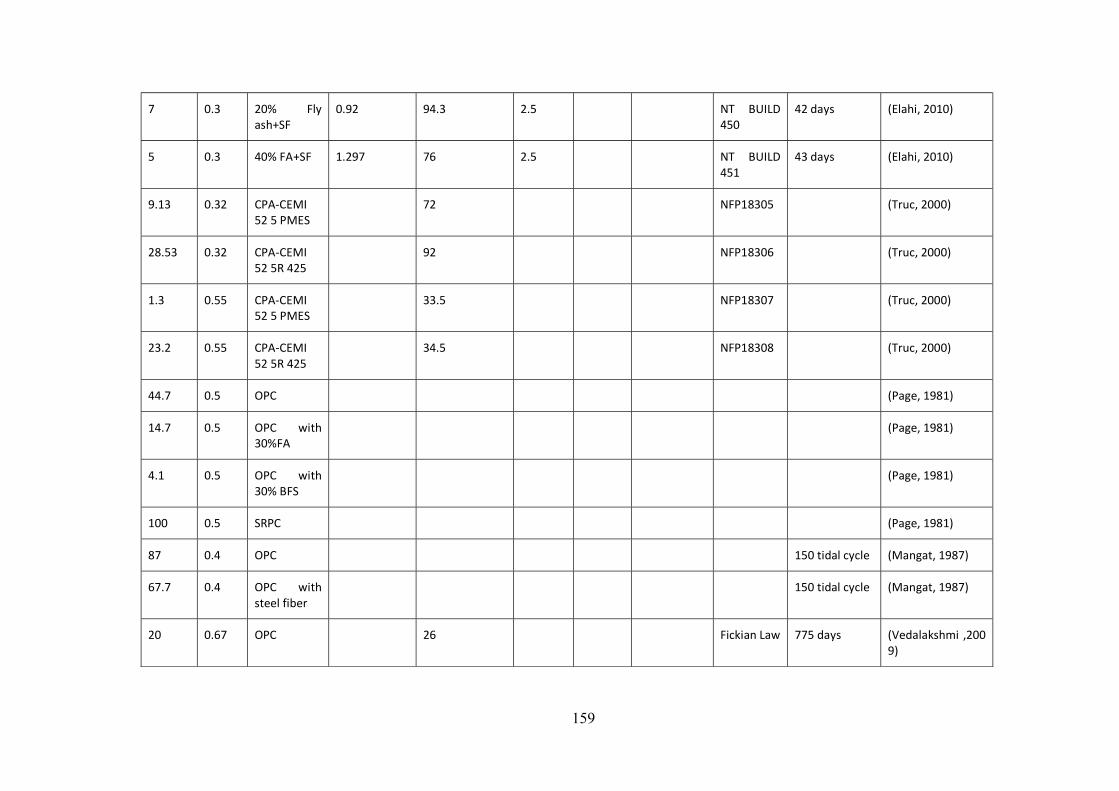
159
7 0.3 20% Fly ash+SF
0.92 94.3 2.5 NT BUILD 450
42 days (Elahi, 2010)
5 0.3 40% FA+SF 1.297 76 2.5 NT BUILD 451
43 days (Elahi, 2010)
9.13 0.32 CPA-CEMI 52 5 PMES
72 NFP18305 (Truc, 2000)
28.53 0.32 CPA-CEMI 52 5R 425
92 NFP18306 (Truc, 2000)
1.3 0.55 CPA-CEMI 52 5 PMES
33.5 NFP18307 (Truc, 2000)
23.2 0.55 CPA-CEMI 52 5R 425
34.5 NFP18308 (Truc, 2000)
44.7 0.5 OPC (Page, 1981)
14.7 0.5 OPC with 30%FA
(Page, 1981)
4.1 0.5 OPC with 30% BFS
(Page, 1981)
100 0.5 SRPC (Page, 1981)
87 0.4 OPC 150 tidal cycle (Mangat, 1987)
67.7 0.4 OPC with steel fiber
150 tidal cycle (Mangat, 1987)
20 0.67 OPC 26 Fickian Law 775 days (Vedalakshmi ,2009)
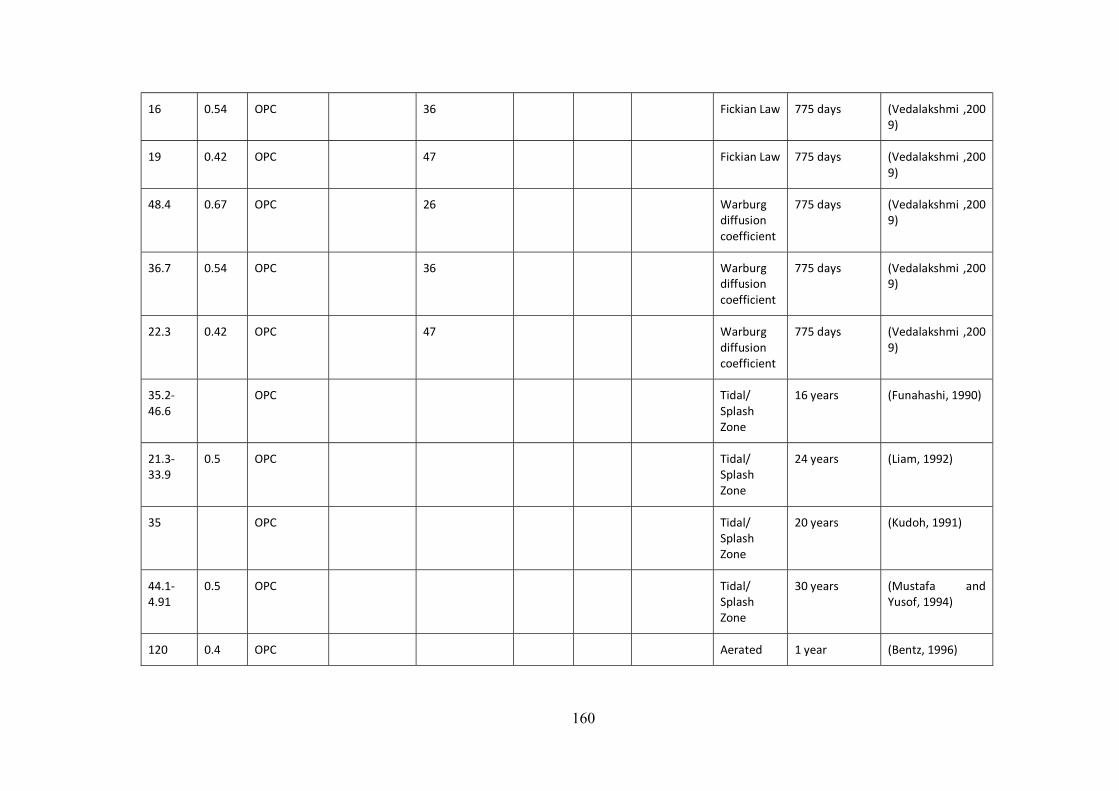
160
16 0.54 OPC 36 Fickian Law 775 days (Vedalakshmi ,2009)
19 0.42 OPC 47 Fickian Law 775 days (Vedalakshmi ,2009)
48.4 0.67 OPC 26 Warburg diffusion coefficient
775 days (Vedalakshmi ,2009)
36.7 0.54 OPC 36 Warburg diffusion coefficient
775 days (Vedalakshmi ,2009)
22.3 0.42 OPC 47 Warburg diffusion coefficient
775 days (Vedalakshmi ,2009)
35.2-46.6
OPC Tidal/ Splash Zone
16 years (Funahashi, 1990)
21.3-33.9
0.5 OPC Tidal/ Splash Zone
24 years (Liam, 1992)
35 OPC Tidal/ Splash Zone
20 years (Kudoh, 1991)
44.1-4.91
0.5 OPC Tidal/ Splash Zone
30 years (Mustafa and Yusof, 1994)
120 0.4 OPC Aerated 1 year (Bentz, 1996)
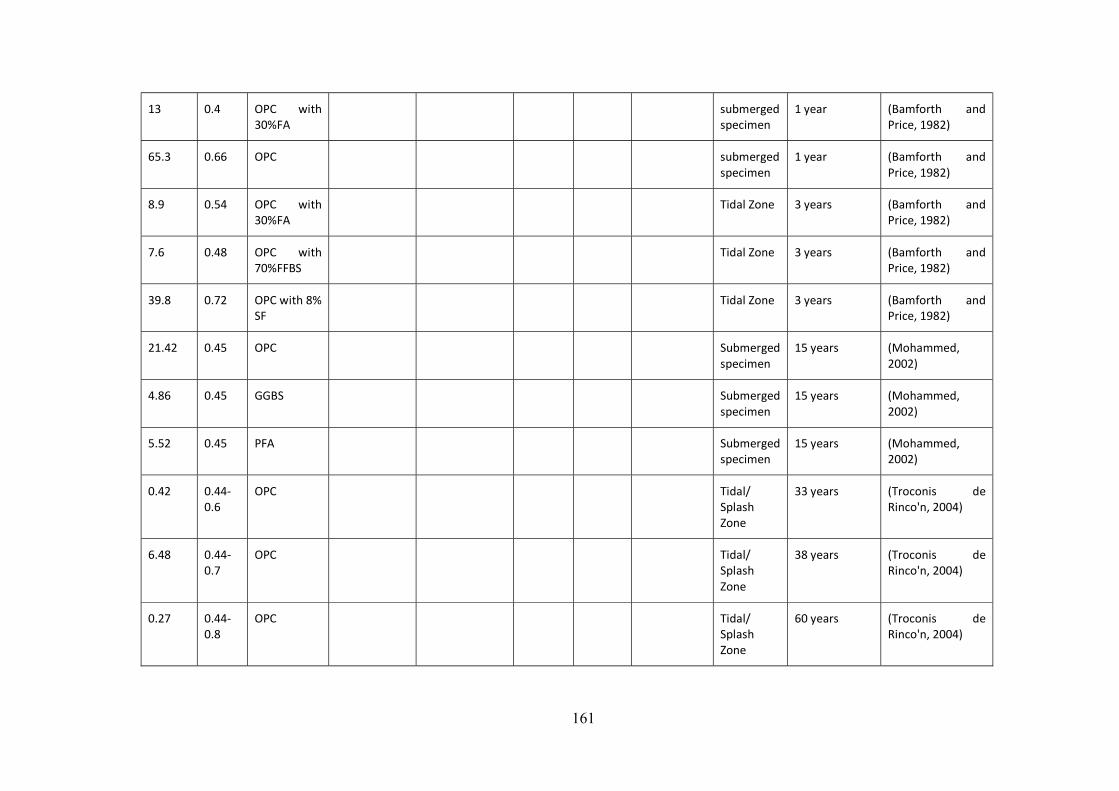
161
13 0.4 OPC with 30%FA
submerged specimen
1 year (Bamforth and Price, 1982)
65.3 0.66 OPC submerged specimen
1 year (Bamforth and Price, 1982)
8.9 0.54 OPC with 30%FA
Tidal Zone 3 years (Bamforth and Price, 1982)
7.6 0.48 OPC with 70%FFBS
Tidal Zone 3 years (Bamforth and Price, 1982)
39.8 0.72 OPC with 8% SF
Tidal Zone 3 years (Bamforth and Price, 1982)
21.42 0.45 OPC Submerged specimen
15 years (Mohammed, 2002)
4.86 0.45 GGBS Submerged specimen
15 years (Mohammed, 2002)
5.52 0.45 PFA Submerged specimen
15 years (Mohammed, 2002)
0.42 0.44-0.6
OPC Tidal/ Splash Zone
33 years (Troconis de Rinco'n, 2004)
6.48 0.44-0.7
OPC Tidal/ Splash Zone
38 years (Troconis de Rinco'n, 2004)
0.27 0.44-0.8
OPC Tidal/ Splash Zone
60 years (Troconis de Rinco'n, 2004)
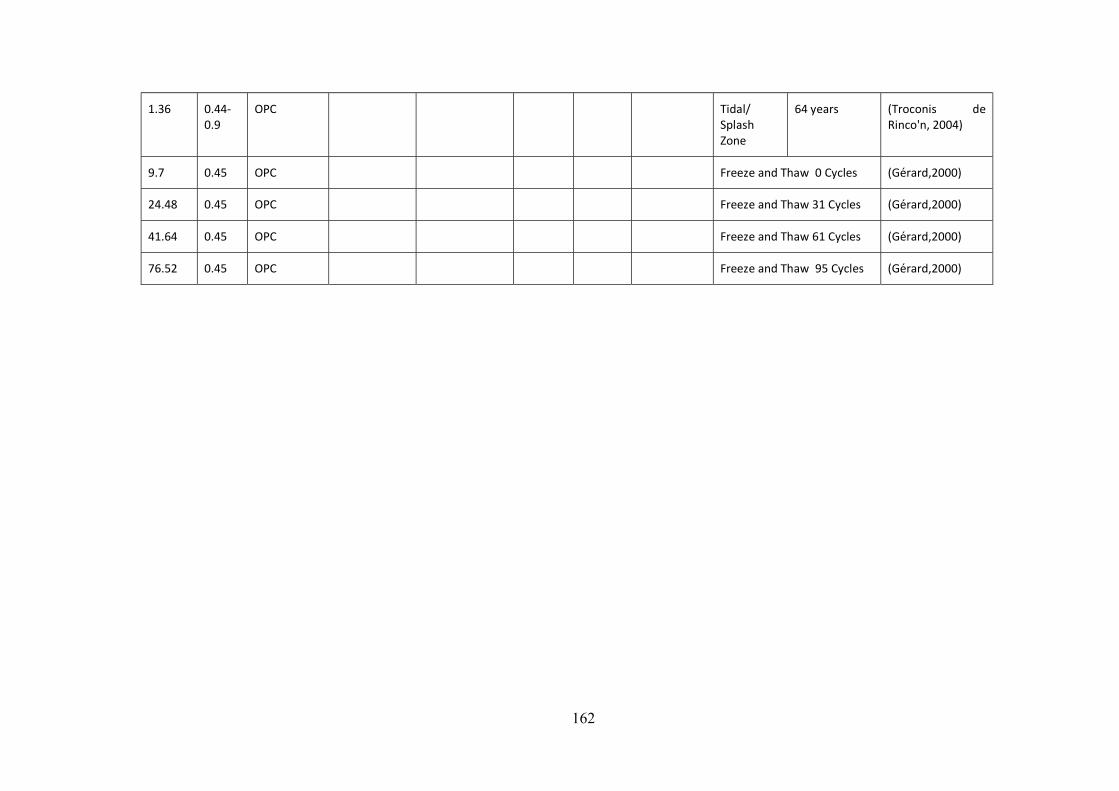
162
1.36 0.44-0.9
OPC Tidal/ Splash Zone
64 years (Troconis de Rinco'n, 2004)
9.7 0.45 OPC Freeze and Thaw 0 Cycles (Gerard,2000)
24.48 0.45 OPC Freeze and Thaw 31 Cycles (Gerard,2000)
41.64 0.45 OPC Freeze and Thaw 61 Cycles (Gerard,2000)
76.52 0.45 OPC Freeze and Thaw 95 Cycles (Gerard,2000)

163
9. REFERENCES
1) AASHTO, “The AASHTO LRFD Bridge Construction Specifications,” American
Association of State Highway and Transportation Officials, ISBN: 978-1-56051-452-7,
2010.
2) AASHTO, “Manual for Bridge Element Inspection,” American Association of State
Highway and Transportation Officials, ISBN: 978-1-56051-591-3, 2013.
3) Aboutaha, Riyad, “Guide for Maintenance and Rehabilitation of Concrete Bridge
Components with FRP Composites – Research into Practice,” Research Report, Syracuse
University, Syracuse, NY, USA, 2004.
4) Alizadeh, R., “Effect of Curing Conditions on the Service Life Design of RC Structures
in the Persian Gulf Region”, DOI: 10.1061/(ASCE)0899-1561,20:1(2), 2008
5) Angst, U., “Critical chloride content in reinforced concrete — A review”, Cement and
Concrete Research, 39 1122–1138. 2009).
6) Ann, K.Y., “Chloride Threshold Level for Corrosion of Steel in Concrete”, Corrosion
Science 49 4113–4133. 2007.
7) Ann, K.Y., “The importance of chloride content at the concrete surface in assessing the
time to corrosion of steel in concrete structures”. Construction and Building Materials 23
2009.
8) Bangert, F., “Chemo-hygro-mechanical modeling and numerical simulation of concrete
deterioration caused by alkali–silica reaction”, International Journal for Numerical and
Analytical Methods in Geomechanics. 2004.
164
9) BASHAM, K., “Choices in corrosion resistant Rebar”. Publication #C99J027, The
Aberdeen Group, a division of Hanley-Wood, Inc.1999.
10) Bennett, J., “Electrochemical Chloride Removal and Protection of Concrete Bridge
Components: Field Trials”. SHRP-S-669, Strategic Highway Research Program, 1993.
11) Bertolini, L., “Effects of cathodic prevention on the chloride threshold for steel corrosion
in concrete”, Electrochimica Acta 54 (5) 1452-1463. 2009.
12) Boulfiza, M., “Prediction of chloride ions ingress in uncracked and cracked concrete”.
ACI Mater J; 100(1): 38–48, 2003.
13) Clemeña, G., “Trial Application of Electrochemical Chloride Extraction On Concrete
Bridge Components in Virginia,” VTRC 00-R18, Virginia Transportation Research
Council, 2000.
14) Collepardi, M., et al, “Penetration of chloride ions into cement pastes and concrete”.
American Ceramic Society, Vol. 55. USA. 1972.
15) Costa, A., “Chloride penetration into concrete in marine environment - Part I1: Prediction
of long term chloride penetration”. Materials and Structures/Matriaux et Constructions,
Vol. 32, pp 354-359, 1999.
16) Erlin, B., Hime, W., “Some chemical and physical aspects of phenomena associated with
chloride-induced corrosion”. Corrosion, Concrete and Chlorides, ACI SP-102, pp. 1-12,
1987.
17) Etcheverry, L., “Evaluation of Cathodic Protection Systems for Marine Bridge
Substructures,” TX-00/2945-1, Center for Transportation Research the University of
Texas at Austin. 1998.
165
18) Fagerlund G., “The Threshold Chloride Level for Initiation of Reinforcement Corrosion
in Concrete: Some Theoretical Considerations”, Report TVBM-3159, 2011.
19) Ferreira, R.M., “Optimization of RC structure performance in marine environment”. Eng.
Structure, 32(5), pp. 1489-1494. 2010
20) Ferreira, RM., “Optimization of RC structure performance in marine environment”. Eng.
Structure, 32(5): 1489–94. 2010.
21) Frederiksen, J.M., “Method for Determination of Chloride Threshold Values for Steel in
Concrete”, NORDTEST project number: 1441-99. 2002.
22) Frederiksen, J.M., “HETEK, A system for estimation of chloride ingress into concrete,
Theoretical background”, The Danish Road Directorate, Report No. 83. 1997.
23) Gao, J.M., “Experimental study on properties of polymer-modified cement mortars with
silica fume”. Cement and Concrete Research 32, 41–45. 2002.
24) Gerard, B., “Influence of cracking on the diffusion properties of cement-based materials”.
Cement and Concrete Research 30, 37–43. 2000.
25) Gergely, J., “Concrete Diffusion Coefficients and Existing Chloride Exposure in North
Carolina”, FHW A/NC/2006-26, 2006.
26) Hausmann, D.A., “Steel corrosion in concrete. How does it occur?” Materials Protection
6,19-23.1967.
27) Hobbs, D.W., “Alkali-Silica Reaction in Concrete”, Thomas Telford, London, 1988.
28) Hong K., Hooton R.D., “Effects of Cyclic Chloride Exposure On Penetration of Concrete
Cover”, Cement and Concrete Research, V. 29, pp.1379-1386. 1999.

166
29) Hurley, M., “Chloride Threshold Levels in Clad 316L and Solid 316LN Stainless Steel
Rebar”, Center for Electrochemical Science and Engineering Department of Materials
Science and Engineering University of Virginia Charlottesville, VA. 2008.
30) Jang, S.Y., “Effect of crack width on chloride diffusion coefficients of concrete by steady-
state migration tests”, Cement and Concrete Research 41,9-19. 2011.
31) Jin, L.B., “Likeness of multiple environment time reaches his to apply medium in wear of
coastal concrete structure theoretically”, Zhejiang University, Zhejiang, China. 2008.
32) JSCE, “JSCE standard specification for concrete structures (construction)”, Japan Society
of Civil Engineering, Tokyo; 2002.
33) Johnston, D., “Handbook for Practical Bridge Preservation Actions and Investment
Strategies,” NCHRP 14-23, National Center for Pavement Preservation. 2014.
34) Kepler, J., “Evaluation of Corrosion Protection Methods for Reinforced Concrete
Highway Structures”, Structural Engineering and Engineering Materials SM Report No.
58, University of Kansas Center for Research, Inc. Lawrence, Kansas. 2000.
35) Krauss, P., “Guidelines for Selection of Bridge Deck Overlays, Sealers and Treatments”,
NCHRP Project 20-07, Task 234, National Cooperative Highway Research Program,
Transportation Research Board. 2009.
36) Latah Bridge Rehabilitation Study, “Latah Bridge Rehabilitation Study”. City of
Spokane, Washington. 2012.
37) Lee, H., “Effectiveness of Electrochemical Chloride Extraction for The Iowa Avenue
Pedestrian Bridge”. Iowa Department Transportation Iowa Highway Research Board
Project # TR-499. 2005.
167
38) Lee, H., “Effectiveness of Electrochemical Chloride Extraction for The Iowa Avenue
Pedestrian Bridge,” Iowa Department Transportation Iowa Highway Research Board
Project # TR-499. 2005.
39) Life-365, “Life-365 Service Life Prediction Model and Computer Program for Prediction
the Service Life and Life-Cycle Cost of Reinforced Concrete Exposed to Chlorides”.
Life-365 user’s manual. 2014.
40) Mohammed, T.U., “Relationship between Free Chloride and Total Chloride Contents in
Concrete”, Cement and Concrete Research 33, 1487–1490. 2003.
41) Moradllo, M., “Time-dependent performance of concrete surface coatings in tidal zone of
marine environment”. Construction and Building Materials 30, 198-205. 2012.
42) NCHRP Report 14-20, “Consequences of Delayed Maintenance.” Cambridge
Systematics, Inc. Rep. no. Washington, DC: Transportation Research Board, 2012.
43) Nilsson, L.O., “Chloride penetration into concrete, State-of-the-Art”, HETEK Report No.
53, 1996, 1-151. 1996.
44) NRMCA, “Resistance of Pervious Concrete”. National Ready Mixed Concrete
Association, 2004.
45) Oman, M., “Concrete Bridge Deck Crack Sealant Evaluation and Implementation”.
Report No. MN/RC 2014-34. 2014.
46) Pettersson, K., “Corrosion threshold value and corrosion rate in reinforced concrete”.
CBI report 2:92., Swedish Cement and Concrete Research Institute, 1-43. 1992.
47) Pettersson, K., “Corrosion of steel in high performance Concrete”. Proceedings of 3rd
International Symposium on Utilization of High Strength Concrete, Lillehammer,
Norway, 1993.

168
48) Pettersson, K., “Chloride induced reinforcement corrosion”, status report.
Högpresterande Betongkon- struktioner, CBI, Report M1:5, 1994.
49) Pettersson, K., “Criteria for cracks in connection with corrosion in high performance
concrete”. In: Proceedings of CANMET/ACI International Symposium on Utilization of
High Strength/High Performance Concrete, Paris, France, 1996.
50) Poulsen, S., “Chloride Threshold Values – State of the art”, Danish Expert Centre for
Infrastructure Constructions, Danish Expert Centre for Infrastructure Constructions.
2012.
51) Rahman, K., “Simulation of Chloride Migration in Compression-Induced Damage in
Concrete”. DOI: 10.1061/(ASCE)MT.1943-5533.0000458. 2012.
52) Ronning, T., “Freeze-Thaw Resistance of ConcreteEffect of: Curing Conditions,
Moisture Exchange and Materials”, Doctoral thesis, The Norwegian Institute of
Technology, 2001.
53) Saetta, A.V., “Analysis of chloride diffusion into partially saturated concrete”. ACI Mater
J; 90(5): 441–51. 1993.
54) Saetta, A.V., Scotta, R., Vitaliani, R., “Analysis of chloride diffusion into partially
saturated concrete”. ACI Materials Journal, 90, pp. 441–451. 1993.
55) Schiessel, P., Breit. W., “Time to depassivation depending on concrete composition and
environmental conditions”, Proceedings of the RILEM Workshop on “Chloride
Pnetration in Concrete”, Saint-Rémylès-Chevreuse, France, 1995.
56) Sharp, S. “Field Comparison of the Installation and Cost of Placement of Epoxy-Coated
and MMFX 2 Steel Deck Reinforcement: Establishing a Baseline for Future Deck, 2009.
169
57) SHRP 2, “Field validation testing of NDT technologies on a concrete bridge deck 02”,
University of Illinois, The National Academics, http://vimeo.com/26123878. 2011.
58) So, H.S., “The Properties of Chloride Ion Diffusion of Concrete Under High Temperature
Conditions, with Implications for the Storage of Spent Nuclear Fuel in Concrete Casks”.
KSCE Journal of Civil Engineering, 18(7):2227-2233. 2014.
59) Song, G., “Corrosion of steel in Concrete: Causes, Detection and Prediction”, Review
Report 4, ARRB Transport Research Ltd. 1998.
60) Song, H., “Factors influencing chloride transport in concrete structures exposed to marine
environments”. Cement & Concrete Composites 30,113-121. 2008.
61) Song, L., “Time Dependent Chloride Diffusion Coefficient in Concrete”, DOI
10.1007/s11595-013-0685-6, 2013
62) Song, L., “Time Dependent Chloride Diffusion Coefficient in Concrete”. Journal of Wuhan
University of Technology-Mater. Sci. Ed. Vol.28 No.2. 2013.
63) Soriano, A., “Alternative Sealants for Bridge Decks,” SD2001-04-D, AEC Engineering,
Inc. 2001
64) Stanish, K.D., “Testing the chloride penetration resistance of concrete: a literature
review”, FHWA contract DTFH61 1997, Department of Civil Engineering, University of
Toronto, Canada. 1997.
65) Sugiyama, T., “Determination of Chloride Diffusion Coefficient and Gas Permeability of
Concrete and Their Relationship”. Cement and Concrete Research, Vol. 26, No. 5, pp. 781-
790, 1996.
170
66) Suprenant, B., “Testing for chloride permeability of concrete- the rapid chloride
permeability test (RCPT) is an alternative to ponding tests”, Concrete Construction, July
1991, pp. 8-12. 1991.
67) Thomas, MDA, “Modelling chloride diffusion in concrete Effect of fly ash and slag”,
Cement and Concrete Research 29 (1999) 487–495. 1999.
68) Ward-Waller, E., “Corrosion Resistance of Concrete Reinforcement”, Master thesis, Sc.B. Civil Engineering, Brown University. 2004.
69) Won, J., “Evaluation of Diffusion Property of Latex Modified Concrete”. DOI:
10.5389/KSAE.2008.50.4.027. 2008.
70) Xu, J., “Effectiveness of inhibitors in increasing chloride threshold value for steel
corrosion”, Water Science and Engineering, 2013, 6(3): 354-363. 2013.
71) Yang, Z., “Effect of styrene–butadiene rubber latex on the chloride permeability and
microstructure of Portland cement mortar”. Construction and Building Materials 23, 2283-
2290. 2009.
72) Zhang, S., “Experimental determination of chloride penetration in cracked concrete
beams”. Procedia Engineering 24, 380-384. 2011.
73) Zhao, J., Cai, G., Gao, D., Zhao, S., “Influences of freeze–thaw cycle and curing time on
chloride ion penetration resistance of Sulphoaluminate cement concrete”. Construction
and Building Materials 53, pp. 305–311. 2014.
74) Zhao, X., “Durability Study of concrete Structures Based on Chloride Ingress”, College
of Civil Engineering of Chongqing University, Chongqing, China. 2011.
75) Zhao, Y., “I-345 Bridge Repair”. 2010 Structures Congress. 2010.

171
10. VITA
NAME OF AUTHOR Haotian Zhang
PLACE OF BIRTH Xi’an, China
DATE OF BIRTH February 16, 1988
EDUCATION
September 2016 Ph.D. in Civil Engineering,
College of Engineering and Computer Science,
Syracuse University,
Syracuse, NY, USA
JULY 2013 M.S. in Civil Engineering,
College of Engineering and Computer Science,
Syracuse University,
Syracuse, NY, USA
July 2010 B.S. in Engineering Mechanics,
School of Mechanical Engineering,
Tianjin University,
Tianjin, China
EXPERIENCE
Aug. 2013-May 2016 Graduate Research Assistant,
Department of Civil and Environmental Engineering,
Syracuse University,
Syracuse, NY, USA
Copyright © 2022 FDOKUMEN