The economics of childbearing: Three essays - UNH Scholars ...
129
University of New Hampshire University of New Hampshire University of New Hampshire Scholars' Repository University of New Hampshire Scholars' Repository Doctoral Dissertations Student Scholarship Spring 2006 The economics of childbearing: Three essays The economics of childbearing: Three essays Andrea Kutinova University of New Hampshire, Durham Follow this and additional works at: https://scholars.unh.edu/dissertation Recommended Citation Recommended Citation Kutinova, Andrea, "The economics of childbearing: Three essays" (2006). Doctoral Dissertations. 320. https://scholars.unh.edu/dissertation/320 This Dissertation is brought to you for free and open access by the Student Scholarship at University of New Hampshire Scholars' Repository. It has been accepted for inclusion in Doctoral Dissertations by an authorized administrator of University of New Hampshire Scholars' Repository. For more information, please contact [email protected].
-
Upload
khangminh22 -
Category
Documents
-
view
0 -
download
0
Transcript of The economics of childbearing: Three essays - UNH Scholars ...

University of New Hampshire University of New Hampshire
University of New Hampshire Scholars' Repository University of New Hampshire Scholars' Repository
Doctoral Dissertations Student Scholarship
Spring 2006
The economics of childbearing: Three essays The economics of childbearing: Three essays
Andrea Kutinova University of New Hampshire, Durham
Follow this and additional works at: https://scholars.unh.edu/dissertation
Recommended Citation Recommended Citation Kutinova, Andrea, "The economics of childbearing: Three essays" (2006). Doctoral Dissertations. 320. https://scholars.unh.edu/dissertation/320
This Dissertation is brought to you for free and open access by the Student Scholarship at University of New Hampshire Scholars' Repository. It has been accepted for inclusion in Doctoral Dissertations by an authorized administrator of University of New Hampshire Scholars' Repository. For more information, please contact [email protected].

THE ECONOMICS OF CHILDBEARING: THREE ESSAYS
by
ANDREA KUTINOVA
B.A., Charles University in Prague, 2001
M.A., University of New Hampshire, 2003
DISSERTATION
Submitted to the University of New Hampshire
in Partial Fulfillment of the Requirements
for the Degree of
Doctor of Philosophy
in
Economics
May, 2006
Reproduced with permission of the copyright owner. Further reproduction prohibited without permission.

UMI Number: 3217428
INFORMATION TO USERS
The quality of this reproduction is dependent upon the quality of the copy
submitted. Broken or indistinct print, colored or poor quality illustrations and
photographs, print bleed-through, substandard margins, and improper
alignment can adversely affect reproduction.
In the unlikely event that the author did not send a complete manuscript
and there are missing pages, these will be noted. Also, if unauthorized
copyright material had to be removed, a note will indicate the deletion.
®
UMIUMI Microform 3217428
Copyright 2006 by ProQuest Information and Learning Company.
All rights reserved. This microform edition is protected against
unauthorized copying under Title 17, United States Code.
ProQuest Information and Learning Company 300 North Zeeb Road
P.O. Box 1346 Ann Arbor, Ml 48106-1346
Reproduced with permission of the copyright owner. Further reproduction prohibited without permission.

This dissertation has been examined and approved.
Chair: Karen S. Conway Professor of Economics
Reagan A. Baughman Assistant Professor of Economics
Partha DebAssociate Professor of Economics; Hunter College, CUNY
Robert D. Mohr Assistant Professor of Economics
Robert S. Woodward Forrest McKerley Professor of Health Economics
Date:
Reproduced with permission of the copyright owner. Further reproduction prohibited without permission.

Acknowledgements
I am indebted to Karen Conway, Reagan Baughman, Partha Deb, Robert Mohr, and Robert Woodward for their excellent guidance and to the Graduate School for their financial support through the Dissertation Fellowship.
iii
Reproduced with permission of the copyright owner. Further reproduction prohibited without permission.

Contents
Acknowledgements.................................................................................................................... iiiList of Figures............................................................. vList of Tables............................................................................................................................. viAbstract.....................................................................................................................................viiPreface....................................................................................................................................... ix1. The Forgotten Beneficiary of the Medicaid Expansions........................................................1
1.1. Introduction................................................................................................................ 21.2. Background................................................................................................................. 31.3. Empirical Strategy and Data........................................................................................ 7
1.3.1. Empirical Strategy.............................................................................................. 81.3.2. Description of Data and Models Estimated........................................................12
1.4. Descriptive Statistics................................................................................................. 171.5. Empirical Results.......................................................................................................21
1.5.1. Medicaid Eligibility.......................................................................................... 211.5.2. Sensitivity Checks............................................................................................. 271.5.3. Other Results....................................................................................................27
1.6. Concluding Remarks................................................................................................. 28Bibliography............................................................................................................................. 31Appendix...................................................................................................................................442. The Effects of Unemployment on Childbearing................................................................. 47
2.1. Background............................................................................................................... 482.2. Framework.................................................................................................................502.3. Data and Methods...................................................................................................... 53
2.3.1. Data.................................................................................................................. 532.3.2. Empirical Strategy............................................................................................ 57
2.4. Results...................................................................................................................... 582.4.1. Descriptive Statistics......................................................................................... 582.4.2. Baseline Results................................................................................................ 602.4.3. State-Level Analyses........................................................................................ 632.4.4. Stratification by Socioeconomic Status............................................................ 65
2.4.4.1. Marital Status.......................................................................................... 652.4.4.2. Education................................................................................................ 67
2.4.5. The Effects of Unemployment on Cohort Characteristics................................... 692.5. Conclusion.................................................................................................................71
Bibliography............................................................................................................................. 733. Paternity Deferments and the Timing of Births: U.S. Natality during the Vietnam War 90
3.1. Background................................................................................................................913.2. Data and Methods...................................................................................................... 943.3. Results...................................................................................................................... 97
3.3.1. Descriptive Analysis......................................................................................... 973.3.2. Regression Results............................................................................................ 993.3.3. Correction for Misclassification.......................................................................1013.3.4. Robustness Checks..........................................................................................102
3.4. Conclusions............................................................................................................. 105Bibliography........................................................................................................................... 107Technical Appendix................................................................................................................115
iv
Reproduced with permission of the copyright owner. Further reproduction prohibited without permission.

List of Figures
Part 1.Figure 1. Medicaid Eligibility Threshold, 1988-1996; Minimum, Maximum, and Average.36Figure 2. Medicaid Eligibility Threshold, 1988-1996; Five Largest States............................... 36
Part 2.Figure 1. The Effects of an Increase in Unemployment............................................................ 77Figure 2. Variation in County-Level Unemployment within and across States, 1991-1999......... 78
Part 3.Figure 1. Monthly Number of Inductions; United States, 1963-1966.......................................110Figure 2. Proportion of 1st Births by Month and Year of Birth; United States, 1961-1970.110Figure 3. Proportion of 1st Births by Month and Year of Birth; United States, 1963-1968;Detrended and Deseasonalized................................................................................................ I l lFigure 4. Interval since Last Live Birth for Second Births; United States, 1969-1971 ................ I l l
v
Reproduced with permission of the copyright owner. Further reproduction prohibited without permission.

List of Tables
Part 1.Table 1. Descriptive Statistics, 1989-1996 Births....................................................................... 37Table 2. Trends in Prenatal Care Use and Maternal Health........................................................38Table 3. The Effects of Medicaid Eligibility Rules on PNC Use and Maternal Health; OddsRatios from a Logit; 1989-1996................................................................................................. 40Table 4. The Effects of Medicaid Eligibility Rules on PNC Use and Maternal Health; Coefficientsfrom a Linear Probability Model; 1989-1996.............................................................................42Table 5. Any Complication; Odds Ratios from a Logit; 1989-1996............................................ 43
Part 2.Table 1. Characteristics of Race Cohorts....................................................................................79Table 2. The Effects of Unemployment on Prenatal Care Use, Infant and Maternal Health; ByRace..........................................................................................................................................80Table 3. Characteristics of Race Cohorts; State-Level Cells.............................................. ,....... 81Table 4. The Effects of Unemployment on Prenatal Care Use, Infant and Maternal Health; ByRace; State-Level Unemployment............................................................................................. 82Table 5. The Effects of Unemployment on Prenatal Care Use, Infant and Maternal Health; ByRace; State-Level Unemployment and Cells..............................................................................83Table 6. Characteristics of Race/Marital Status Cohorts............................................................ 84Table 7. The Effects of Unemployment on Prenatal Care Use, Infant and Maternal Health; ByRace and Marital Status.............................................................................................................85Table 8. Characteristics of Race/Education Cohorts.................................................................. 86Table 9. The Effects of Unemployment on Prenatal Care Use, Infant and Maternal Health; ByRace and Education................................................................................................................... 87Table 10. The Effects of Unemployment on Cohort Characteristics; By Race............................89
Part 3.Table 1. Median Age of Brides and Grooms at the Time of First Marriage..............................112Table 2. Percentages of Fathers 19 to 25 Years Old by Mother’s Age..................................... 112Table 3. The Effects of the Vietnam War Paternity Deferments on the Proportion of 1st Births;United States, 1963-1968; OLS Estimation.............................................................................112Table 4. The Effects of the Vietnam War Paternity Deferments on the Number of 1st Births; United States, 1963-1968; OLS Estimation.............................................................................113
vi
Reproduced with permission of the copyright owner. Further reproduction prohibited without permission.

ABSTRACT
THE ECONOMICS OF CHILDBEARING: THREE ESSAYS
by
Andrea Kutinova
University of New Hampshire, May, 2006
Expenditure programs, business cycles, and government interventions can affect
many decisions surrounding the birth of a child. For example, public insurance programs
such as Medicaid have the potential to increase the utilization of prenatal care. This, in
turn, may lead to better infant and maternal health outcomes. Given the high and
increasing number of pregnant women covered by Medicaid, the effectiveness of the
program in promoting prenatal care use and improving health needs to be evaluated.
Also, the impacts of business cycles on childbearing are of interest to policymakers. For
example, does unemployment substantially affect the decision to conceive a child or the
ability to obtain appropriate medical services? And, if so, are infant and maternal health
outcomes compromised during economic downturns? A well-informed government can
design policies to help deal with issues such as these. Government interventions,
however, can have unintended (and potentially harmful) consequences as well. For
example, several recent economics papers have demonstrated that fiscal policies may
affect fertility and the timing of delivery. Understanding the incentives embedded in
government programs and assessing the responsiveness of individual behavior to these
incentives is therefore key. My dissertation consists of three essays in which I investigate
an important understudied aspect of the Medicaid program, inform policymakers about
the impacts of unemployment on prenatal care use, infant and maternal health, and add to
vii
Reproduced with permission of the copyright owner. Further reproduction prohibited without permission.

our understanding of the unintended effects of government interventions on the timing of
births.
viii
Reproduced with permission of the copyright owner. Further reproduction prohibited without permission.

PREFACE
The first essay of my dissertation (coauthored with Karen S. Conway) contributes
to evidence regarding the effectiveness of the Medicaid expansions by focusing on a key
beneficiary - the mother - who has previously been overlooked. Using the Natality Detail
Files for 1989-96, we estimate the relationship between Medicaid eligibility and
potentially avoidable maternal morbidities (placental abruption, anemia, and pregnancy-
related hypertension) for several treatment groups and a control group. The validity of
our cohorts is verified in an analysis of the Current Population Survey data. Potential
biases caused by improved reporting are addressed by using a 'straw man' maternal
complication (diabetes) not preventable with prenatal care. Our results suggest that
increased Medicaid eligibility leads to fewer preventable maternal complications among
women most likely to have benefited from the Medicaid expansions.
As the first essay demonstrates, a well-informed government can design policies
promoting prenatal care use and health outcomes. This may be especially important
during temporary economic downturns. Interestingly, infant health and prenatal care use
reportedly improve when the unemployment rate increases. In my second essay, I test the
hypothesis that one avenue for these beneficial effects is an improved access to health
insurance via the Medicaid program. I focus on local labor markets and add maternal
health to the outcomes studied. Using the Natality Detail Files for 1989-99 aggregated to
county/year/race cells, I find that higher unemployment at the county level is associated
with improved infant health especially among whites and increased prenatal care use and
potentially improved maternal health among blacks. In some cases, both unemployment
per se and Medicaid contribute to these benefits. In others, Medicaid mitigates, offsets, or
ix
Reproduced with permission of the copyright owner. Further reproduction prohibited without permission.

outweighs detrimental effects of unemployment. At least some of these aggregate results
are due to changes in the selection into pregnancy. Consistent with the role of Medicaid
as a safety net for credit-constrained populations, unemployment increases - and
Medicaid eligibility decreases - the proportion of high-SES mothers.
While the first two essays show beneficial effects of a targeted public program,
government interventions can have unintended (and potentially harmful) consequences as
well. During the conflict in Vietnam, married men with dependents could obtain a
deferment from the draft. In 1965, following President Johnson’s Executive Order 11241
and a Selective Service System announcement, this policy changed substantially in a way
that provided strong incentives for childless American couples to conceive a first-born
child. Since the changes were both unexpected and widely publicized, this is an ideal
opportunity to study the effects of policy on fertility. Information about the fecundity of
the U.S. population in the 1960’s and anecdotal evidence (e.g., conception of the current
Vice President’s first daughter) suggest that young couples were ready to react quickly.
In my third essay, I extract time series data from the Vital Statistics for 1963-68 and
employ a difference-in-differences methodology. My analysis suggests that the number
of first births increased by 15,532 in June and August 1966 in response to the policy
changes. Such an increase represents over 7% of the total number o f first deliveries and
about 28% of the Selective Service System calls for inductees in those months.
All in all, in my dissertation, I contribute to our knowledge about how the
government and the economy interact to influence the birth of a child. In particular, I
investigate an important understudied aspect of the Medicaid program, inform
policymakers about the impacts of unemployment on prenatal care use, infant and
x
Reproduced with permission of the copyright owner. Further reproduction prohibited without permission.

maternal health, and add to our understanding of the unintended effects of government
interventions on the timing of births. By complementing previous studies in the
economics of childbearing, my research helps policymakers design programs that benefit
both the mother and the child.
xi
Reproduced with permission of the copyright owner. Further reproduction prohibited without permission.

1. THE FORGOTTEN BENEFICIARY OF THE MEDICAID EXPANSIONS
i
Reproduced with permission of the copyright owner. Further reproduction prohibited without permission.

2
1.1. Introduction
In the late 1980’s and early 1990’s, the Medicaid eligibility rules changed
substantially. The income thresholds increased and individuals in two-parent families
started to qualify. By providing health insurance coverage to all low-income pregnant
women and their children, the policymakers hoped to achieve their ultimate goal:
improve health outcomes. Have they succeeded? Trying to answer this question, several
studies have investigated the effects of the expansions on infant health (Currie and
Gmber 1996a, 1997; Dubay et al. 2001; Currie and Grogger 2002) and a few studies have
focused on the effects on child health (Currie and Gruber 1996b; Kaestner et al. 2001).
So far, the results have been mixed, leading to a general skepticism about the
effectiveness of the Medicaid eligibility expansions in improving health.
We argue, however, that an important potential beneficiary of the expansions -
the mother - has been left completely out of the analysis. To our knowledge, no
economic study has investigated the effects of the policy changes of the 1980’s and
1990’s on maternal health. However, pregnant women have always been a key target
population of the Medicaid program. Therefore, without estimating the impacts of the
expansions on maternal health (in addition to infant health and child health), any
evaluation of the effectiveness of the policy is incomplete. In this paper, we attempt to
close the gap. In particular, using the Natality Detail Files for 1989-96, we estimate the
relationship between Medicaid eligibility and maternal health outcomes for several
treatment groups and a control group. Our results suggest that increased Medicaid
Reproduced with permission of the copyright owner. Further reproduction prohibited without permission.

3
eligibility indeed lead to fewer preventable maternal complications among women most
likely to have benefited from the expansions.
1.2. Background
It is surprising to find that the direct health effects of policies targeted at
disadvantaged women in the US have largely been overlooked in the economics
literature. After ten years, an observation made by Jennifer Haas and her coauthors (Haas
et al. 1993) remains valid: “Although there has been substantial policy interest in
interventions to improve the neonatal outcomes of disadvantaged women, little attention
has been paid to the health status of pregnant women themselves.” (p.61) As our previous
research suggests, this is an important oversight. In Conway and Kutinova (2005), we
demonstrate that timely and adequate prenatal care (to which Medicaid can improve
access) may increase the probability of maintaining a healthy weight after the birth.
We are aware of only one recent economic policy-oriented study dealing with the
health status of disadvantaged women in the US: Kaestner and Tarlov (2003) investigate
the effects of the welfare contractions of the 1990’s on women’s health (overall health
status and mental health) and health behaviors (smoking, drinking, and exercise). In
particular, the authors hypothesize that the welfare changes were likely to affect the
“employment stress”, “organizational stress”, and “financial stress” faced by low-income
women and thus might have indirectly affected the health status of these women. While
the Kaestner and Tarlov (2003) study certainly represents an important contribution to the
health economics literature, it does not fill the gap identified above. First, the authors
focus on the general health of a disadvantaged population rather than studying the
Reproduced with permission of the copyright owner. Further reproduction prohibited without permission.

particular health complications women may encounter due to pregnancy and/or
maternity. Second, the study deals with an indirect impact of a general welfare program
on health outcomes and behaviors rather than estimating the effects of a policy - such as
Medicaid - designed primarily to improve the health status of its target population.
To our knowledge, there are only two economic studies of health policies in the
US that include the mother - Currie and Gruber (1997, 2001). However, these studies
focus on the effects public insurance has on the medical treatments and procedures
provided to the mother (i.e., cesarean section delivery, use of a fetal monitor, receipt of
ultrasound and induction/stimulation of labor). They do not estimate any impact on
maternal health outcomes.
Is maternal health an issue in a developed country such as the US? We believe
that it is. As Haas et al. (1993) note in their study: “Although only 10 per 100,000 women
die from a complication of pregnancy or childbirth, 60% of women receive medical care
for some complication of pregnancy, and 30% suffer complications that result in serious
morbidity.”(p.61) An interest in the issues surrounding maternity in the US is finally
awakening among applied economists; for instance, Chatterji and Markowitz (2004)
estimate the impacts of the length of maternity leave on maternal depression and
women’s “overall health” (number of outpatient visits) postpartum. The importance of
maternal health has also repeatedly been recognized in national health guidelines - most
recently the Healthy People 20101 (Public Health Service 2000). Also, the Medicaid
1 The Healthy People 2010 include an explicit objective to “reduce maternal illness and complications due to pregnancy” (Objective 16-5) which involves reduction in “prenatal illness and complications” as well as “complications during labor and delivery.”
Reproduced with permission of the copyright owner. Further reproduction prohibited without permission.

program itself has been designed to help disadvantaged pregnant women and their infants
and children.
Unfortunately, due to the lack of research in the area, there is not a generally
recognized measure of maternal health (an analog to birth weight in infant health studies).
Facing this problem in our current study, we have decided to focus on the incidence of
three complications to maternal health identified in the medical literature as potentially
preventable by prenatal care: placental abruption, pregnancy-associated hypertension, and
anemia. In addition, due to the rarity of these events, we have also employed a summary
indicator of maternal health capturing the presence of any of the three complications
mentioned above. All of our measures of maternal health can be derived using the
information available in vital statistics.
Placental abruption2 and pregnancy-associated hypertension3 are identified in
Haas et al. (1993) as important causes of maternal morbidity that can be prevented by
interventions during the prenatal period. The Healthy People 2010 stress the need for
timely and high-quality prenatal care which would “improve maternal health by
identifying women who are at particularly high risk and taking steps to mitigate risks,
such as the risk of high blood pressure [...]” (Public Health Service 2000, p.16-8) In the
public health literature, the role of comprehensive prenatal care in managing hypertension
has long been recognized (Scholl et al. 1994, Sachs et al. 1988). As for anemia,4 several
2 “Premature separation o f a normally implanted placenta from the uterus.” (CDC 2003)
3 “An increase o f blood pressure o f at least 30mm Hg systolic or 15mm Hg diastolic on two measurements taken 6 hours apart after the 20th week o f gestation.” (CDC 2003)
Reproduced with permission of the copyright owner. Further reproduction prohibited without permission.

recent medical papers have investigated the options for preventing the occurrence of this
complication in pregnant women and have concluded that adequate iron therapy during
prenatal period can be very effective (Bashiri et al. 2003, Makrides et al. 2003, Villar et
al. 2003). The Healthy People 2010 recommendations urge to “reduce anemia among
low-income pregnant females in their third trimester” and to “reduce iron deficiency
among pregnant females.” (Public Health Service 2000, Objectives 19-13 and 19-14,
respectively) Laditka et al. (2005a) who have constructed an index of avoidable maternity
complications (AMCs) stress the role of prenatal care in preventing and treating anemia.
Therefore, if the Medicaid expansions increased the health insurance coverage of low-
income pregnant women and improved their access to prenatal care, our four measures
(including the summary indicator) should be able to capture the potential positive impact
of the expansions on maternal health.
As a CDC report notes, anemia and hypertension were among the most common
complications of pregnancy in the 1990’s (CDC 2001). In the year 1999, for example,
2.32 and 3.82 percent of pregnant women suffered from anemia and pregnancy-
associated hypertension, respectively. Placental abruption occurs less frequently (0.6
percent of pregnant women had it in the year 1999) but its consequences are more severe.
Preventing maternal complications such as anemia, hypertension, and placental
abruption can lead to improvements in the quality of life as well as to substantial cost
savings. In the year 1997, for example, pregnancy-related hypertension and anemia were
among the top 100 primary diagnoses associated with the highest national expenditures
for hospital stays; the costs of “hypertension complicating pregnancy, childbirth and the
4 “Hemoglobin level o f less than 10.0 g/dL during pregnancy or a hematocrit o f less than 30 percent during pregnancy.” (CDC 2003)
Reproduced with permission of the copyright owner. Further reproduction prohibited without permission.

7
puerperium” were over $1,237,239,000 and the costs of anemia (pregnancy-related or
other) over $962,102,000. For purposes of comparison, the national charges for hospital
stays due to “short gestation, low birth weight, and fetal growth retardation” were about
$1,102,761,000 in the year 1997 (Geocities 2004). Estimates of the overall annual costs
of “hypertensive disorders of pregnancy” for the year 2003 exceed $3 billion
(Preeclampsia Foundation 2004). Placental abruption is a rarer - but still costly -
morbidity. In the year 1996, for example, the annual national costs of hospitalizations due
to placental abruption were $156 million (AHRQ 1996). These numbers further highlight
the fact that maternal health is an important issue.
1.3. Empirical Strategy and Data
The two major changes to the Medicaid policy in the late 1980’s and early 1990’s
were a dramatic increase in the income cutoff below which women qualified for
Medicaid and an extension of Medicaid eligibility to married women. The federal
government has played a key role in initiating these changes. By April 1990, all states
were required to offer Medicaid coverage to pregnant women with incomes below 133%
of the federal poverty line. However, the states were given some freedom in designing
their Medicaid programs. For example, states could increase the eligibility threshold for
pregnant women up to 185% of the poverty line and still qualify for subsidies from the
federal government. It is also important to note that the states started from very different
positions with initial eligibility ranging from 34% (Louisiana) to 185% (Massachusetts,
Minnesota, Mississippi, and Vermont) of the federal poverty line in 1988. As a result,
while the increase in Medicaid eligibility in the early 1990’s was a nation-wide
Reproduced with permission of the copyright owner. Further reproduction prohibited without permission.

phenomenon, the states differed with respect to the magnitude of the increase. Also, the
timing of the changes varied widely across states. Figure 1 shows how the minimum,
maximum, and average eligibility cutoffs changed over time and Figure 2 shows how the
eligibility rules differed across the five largest US states. This variability allows us to
study the effects of the Medicaid eligibility increases on utilization of prenatal care and
the associated maternal health improvements while controlling for state heterogeneity in
unobservable characteristics as well as a national time trend.
1.3.1. Empirical Strategy
Mothers with low socioeconomic status (SES) were most likely to be affected by
the Medicaid policy changes. Many of these women did not qualify for Medicaid before
the reforms (either because they had incomes above the cutoff or because they were
married) but gained their eligibility in the early 1990’s. High SES women, on the other
hand, are unlikely to benefit from the reforms because their incomes are too high. This
variability in the likely effects of the Medicaid eligibility expansions across individuals
allows us to further identify the causality of the relationship between the expansions and
prenatal care utilization and health outcomes. In particular, we adopt a difference-in-
differences type of approach and compare the effects of the policy changes among
members of several treatment groups - low SES married and single mothers - and a
control group - high SES married women.5 If Medicaid did help its target population, we
5 For the sake o f comparability, we follow the general spirit o f the infant health literature (Currie and Grogger 2002) and treat marital status as exogenous. As some have suggested, however, the decision to marry might have itself been affected by the changes in the Medicaid eligibility rules. (Yelowitz 1998)
Reproduced with permission of the copyright owner. Further reproduction prohibited without permission.

would expect to find a significant effect of the expansions on women in the treatment
groups but an insignificant effect on women in the control group.
Furthermore, we hypothesize that very-low SES pregnant women benefited from
the expansions the most. As previous studies have found, the eligibility expansions were
most likely to lead to insurance coverage increases (high take-up rate, low crowd-out of
private insurance), increases in the utilization of a variety of obstetric procedures, and
infant health improvements among the lowest SES women (Currie and Gruber 1996a,
1997, 2001). Therefore, any improvements in maternal health attributable to the Medicaid
eligibility expansions would likely be concentrated in the very-low SES cohort. Since
married women might be more strongly affected by the eligibility changes than single
mothers (many single women already qualified for Medicaid before the reforms) and
since the two groups of women could also be differentially affected by the welfare
declines of the early 1990’s (only single women generally qualified for AFDC at that
time6) we have decided to stratify our treatment population by marital status. The control
group is selected to represent mothers least likely to benefit from the expansions (with
high SES married women typically ineligible for means-tested public programs).
Unfortunately, our data (to be discussed shortly) do not include information on
individual-level income. Therefore, we follow earlier studies (Dubay et al. 2001; Currie
and Grogger 2002; Kaestner and Kaushal 2002; Kaestner and Tarlov 2003; Joyce et al.
2003) and proxy for socioeconomic status with educational achievement. In particular,
we assign women with less than 12 years of education (“less than high school”), 12 years
6 Married women could only qualify for the AFDC-UP (Unemployed Parent) program which provided transitional cash assistance to families in which both parents were living in the household and the principal earner, whether the father or the mother, was unemployed.
Reproduced with permission of the copyright owner. Further reproduction prohibited without permission.

10
of education (“high school completed”), and between 13 and 15 years of education
(“some college”) into three separate less educated/low SES cohorts and women with 16
or more years of education (“college completed”) into the highly educated/high SES
cohort.
We explore the validity of this stratification with an analysis of the Current
Population Survey (CPS) data. In particular, we use 1989 and 1996 data from the CPS to
calculate cohort-specific “treatment probabilities” according to the following formula:
Prob(treatment) = prob(covered by Medicaid in 1996| not covered by Medicaid in 1989)
= prob(covered by Medicaid in 1996 and not in 1989)/prob(not covered
by Medicaid in 1989),
which we approximate with the following:
= 100*(% covered by Medicaid in 1996 - % covered by Medicaid in
1989)/(100 - % covered by Medicaid in 1989).
The treatment probabilities for each of our race/education/marital status cohorts
are reported in the first column of Table 3, and they clearly demonstrate that less
educated women were most affected by the expansions. Among blacks, married women
with “less than high school” education had the highest treatment probability
(prob(treatment)= 17.51) followed by single low-educated women (prob(treatment)=
4.32). While the treatment probability in the latter group seems relatively low, it is
important to note that unmarried black women with “less than high school” education
experienced a decline in the AFDC caseload of about 11 percentage points in the studied
period (in contrast to a modest increase in most other groups). Thus, Medicaid
Reproduced with permission of the copyright owner. Further reproduction prohibited without permission.
expansions above and beyond welfare had to be especially strong in this cohort in order
to offset the negative effect of the AFDC contraction.
Among the whites, the treatment probability was the highest among single
mothers with “less than high school” education (prob(treatment)=13.24), followed by
single mothers with “high school completed” ((prob(treatment)=8.17), and married
women with “less than high school” education (prob(treatment)=7.73). As hypothesized,
treatment probabilities were close to zero among highly educated women from both racial
groups (prob(treat)=-1.36 and 0.79 among blacks and whites, respectively). These
findings strongly support our selection of the treatment and control groups. Furthermore,
as a recent paper (Lewbel 2003) demonstrates, any misclassification into the treatment
and/or control cohorts will bias the estimated treatment effects towards zero making our
results conservative.
In addition to treatment misclassification, however, there is still a possible
confounding factor in that improved prenatal care access (and by extension Medicaid)
could lead to increased reporting of maternal health complications. This reporting bias
would cause further underestimation of the impact Medicaid has on maternal health. To
deal with this issue, we use a “straw man” complication against which we compare the
results for our key measures of maternal health (placental abruption, anemia, and
pregnancy-related hypertension). Unlike our central measures, this complication should
not be preventable by prenatal care and thus should not be affected by the Medicaid
eligibility changes. Based on our reading of the medical literature, diabetes fulfills these
requirements (Buchanan and Xiang 2005, Ecker 2004, Farrell 2003, Gabbe and Graves
2003, Simmons 1996). Also, the high prevalence of diabetes makes this disease a suitable
Reproduced with permission of the copyright owner. Further reproduction prohibited without permission.

12
candidate for the “straw man”.7 If reporting bias is present, we would expect Medicaid to
have a positive, if anything, effect on the incidence of diabetes and we could use this
estimated effect to make adjustments to the predicted effects of Medicaid on our other -
preventable - complications.
1.3.2. Description of Data and Models Estimated
Our data comes from the Natality Detail Files for the years 1989 to 1996 (US
Dept, of Health and Human Services 1990-1997). This data (for the period 1990 to 1996)
is used by Currie and Grogger (2002) who estimate the impacts of the Medicaid
eligibility increases on prenatal care utilization and infant health. Since our approach here
is close to that followed by Currie and Grogger (with the important exception that we
focus on maternal health instead of infant health), the use of the same dataset has the
advantage of making comparisons between the two studies possible.
Since 1985, the Natality Detail Files have included information on all US births
and so have contained more than 3 million observations annually. The large sample size
is especially useful given our goal which is to study the determinants of relatively rare
outcomes - particular complications of pregnancy and delivery. Furthermore, since we
estimate all of our models separately for the treatment and control groups and also want
to stratify our sample by race, a large number of observations is a necessity.
The Natality Detail Files include information on maternal and infant
characteristics (such as mother’s age, marital status, race, Hispanic origin, education, and
7 In the 1990s, diabetes was - together with anemia and pregnancy-related hypertension - among the three most common complications o f pregnancy (CDC 2001).
Reproduced with permission of the copyright owner. Further reproduction prohibited without permission.

state of residence; and infant’s sex and birth weight) as well as the characteristics of
pregnancy (such as gestation and birth order) typically employed in infant health studies.
In addition, since 1989, variables describing maternal morbidity during pregnancy and
delivery have also been present. For example, and importantly for our purposes in this
paper, the files contain information on the incidences of placental abruption, pregnancy-
associated hypertension, anemia, and diabetes in pregnant women.8
The biggest disadvantage of using the Natality Detail Files is that the dataset does
not include any information on individual-level income or insurance status. Therefore, as
discussed above, we rely on educational achievement as a proxy for socioeconomic
status. While certainly imprecise, we believe this measure allows us to identify low SES
and high SES women as reliably as possible. Moreover, stratification of the sample based
on education seems appropriate in that educational achievement is unlikely to be affected
by the Medicaid policy changes. Note also that the absence of individual-level income
data does not cause a problem in constructing our Medicaid eligibility variable. To
capture the exogenous effect of the Medicaid policy on pregnant women, we follow
Cutler and Gruber (1996), Currie and Grogger (2002) and others and use a state-wide
eligibility measure (to be described later) rather than the eligibility status of each
particular individual.
8 Sixteen “medical risk factors” (anemia, cardiac disease, lung disease, diabetes, genital herpes, hydramnios/oligohydramnios, hemoglobinopathy, hypertension chronic and pregnancy-associated, eclampsia, incompetent cervix, previous infant 4000+ grams, previous preterm or small-for-gestational age infant, renal disease, Rh sensitization, and uterine bleeding) and fifteen “complications o f labor and/or delivery” (febrile, meconium, premature rupture o f membrane, abruption placenta, placenta previa, other excessive bleeding, seizures during labor, precipitous labor, prolonged labor, dysfunctional labor, breech/malpresentation, cephalopelvic disproportion, cord prolapse, anesthetic complication, and fetal distress) are separately identified in the natality files. Out o f these, we focus on conditions that significantly affect maternal health and are known to be preventable by timely and adequate prenatal care. Diabetes serves as a “straw man”.
Reproduced with permission of the copyright owner. Further reproduction prohibited without permission.

14
In this study, we limit our sample to non-Hispanic black and white women. Since
previous studies of the effects of Medicaid on prenatal care use and pregnancy outcomes
document large racial differences (Dubay et al. 2001 and Currie and Grogger 2002), we
stratify all of our models by race. This strategy is also supported by the fact that the
“treatment probabilities” calculated from the CPS vary greatly between blacks and whites
within each education/marital status group. We only look at women 19 to 50 years of age
who had a singleton birth in the period from 1989 to 1996. As Joyce et al. (2003) note,
the variability of educational achievement and marital status among teenage mothers is
not sufficient to reliably assign these women into the treatment and control groups.
Furthermore, in the case of teenage pregnancies, it is not clear whether the mother herself
is the ultimate decision maker. In the baseline models, we include women with no or
“unknown” prenatal care utilization. As a robustness check, however, we also exclude
these women from the analysis, and the qualitative results do not change. Foreign
residents are excluded. Further, women from Louisiana and Nebraska in the year 1989,
Oklahoma in years 1989-1990, and New York in years 1989-1991 are excluded due to
missing information on maternal health. Mothers from Washington State in years 1989-
1991 are excluded due to missing information on marital status and those from New
Hampshire in years 1989-1992 due to missing information on ethnicity. Finally, it is
important to note again that we only focus on selected treatment and control groups in the
current study. These data cuts leave us with 10,855,048 observations in our final sample.
To investigate the impacts of the Medicaid eligibility increases of the 1990’s on
prenatal care utilization and maternal health, we estimate several reduced-form models.
First, following Currie and Grogger (2002), we regress different measures of prenatal
Reproduced with permission of the copyright owner. Further reproduction prohibited without permission.

care utilization (PNC) on a measure of Medicaid eligibility (ELIG), welfare caseload
(CASELOAD), unemployment rate (UNEMPL), a full set of state and year dummies (u
and v, respectively), and individual characteristics (X). Our model has the following
general form:
PNCist = a + p*ELIGst + y*CASELOADst + 5*UNEMPLst + us + vt + 0*Xist + eist,
where i represents individuals, s states and t time periods.
While the ultimate outcome of interest is maternal health, we find it useful to
focus on prenatal care utilization (an input into health production in the household
production framework) first. This is done in order to explore the most likely channel
through which Medicaid eligibility can indirectly benefit pregnant women. We focus on
two measures of prenatal care (based on Currie and Grogger 2002): “timely prenatal
care” as determined by whether the women received prenatal care in the first trimester of
her pregnancy and “adequate prenatal care” as defined by “adequate” or “intermediate”
care on the APNCU (Adequacy of Prenatal Care Utilization) scale.
After estimating the prenatal care equations, we turn our attention to models of
maternal health outcomes (MHEALTH) in the following general form:
MHEALTHist= a + p*ELIGst + y*CASELOADst + 5*UNEMPLst + us + vt + 0*Xist + eis,.
The right-hand-side variables are defined as above and the subscripts i, s, and t index
individuals, states, and time periods, respectively.
As mentioned above, we focus on four measures of maternal health
(MHEALTH): the incidence of placental abruption as a complication of delivery, the
Reproduced with permission of the copyright owner. Further reproduction prohibited without permission.

16
incidences of pregnancy-related hypertension and anemia as complications of pregnancy,
and the incidence of at least one of the three complications listed (a “summary variable”).
In addition, we explore the impacts of the Medicaid expansions on a “straw man”
maternal complication: diabetes. The maternal health models include all of the
explanatory variables from the prenatal care equations.
Our measure of eligibility is the state-level time-specific Medicaid eligibility
cutoff (as a percent of the federal poverty line) below which pregnant women qualified
for Medicaid (Hill 1992, National Governors’ Association 2003). Following Currie and
Grogger (2002), we merge the eligibility measure to the vital statistics by half-years. This
is done to account for the fact that the eligibility rules often change twice in a year.
As discussed in Currie and Grogger (2002), the declines in welfare caseloads
throughout the 1990’s might have affected prenatal care utilization by pregnant women
by making the access to Medicaid more difficult for them. While the link between
Medicaid and welfare has formally been eliminated, the authors make the point (and
support it by empirical evidence) that an “administrative link” between Medicaid and
AFDC has persisted making the application process for Medicaid more burdensome for
women not enrolled in welfare. Therefore, we include a welfare caseload variable in our
models. The measure (same as in Currie and Grogger (2002)) is constructed as the
percentage of each state’s population enrolled in the welfare program in each year
(Administration for Children and Families 2003a, 2003b; US Census Bureau 2003a,
2003b). While the variable clearly does not capture all the institutional changes to the
welfare program in the 1990’s, it is used here as a simple proxy for the program’s overall
generosity.
Reproduced with permission of the copyright owner. Further reproduction prohibited without permission.

17
Like Currie and Grogger (2002), we include the unemployment rate (Bureau of
Labor Statistics 2005) in our analyses to proxy for the general economic conditions
facing women in the different state/year cells. In addition, full sets of state and year
dummies are employed in order to account for state-specific, time-invariant effects and
general time trends, respectively. As in Currie and Grogger (2002) and Joyce et al.
(2003), we lag our policy variables (Medicaid eligibility threshold, welfare caseloads, and
unemployment rate) by six months to allow them to impact pregnant women at a crucial
stage of their pregnancies.
As for individual characteristics, we use education and marital status dummies to
define our treatment and control groups. We also stratify our sample by race (focusing on
non-Hispanic black and white mothers only). In addition, mother’s age, age squared,
parity, and infant gender are included in all of our models.
In our econometric analyses, for reasons of computational convenience and to
ensure that the observed differences in the significance of the Medicaid eligibility
coefficients are not driven by vast differences in sample sizes among our treatment and
control cohorts, we use a 1/3 random sub-sample of the largest highly educated/white
population. We check the robustness of our findings to re-sampling. All models are
estimated by both logit and OLS, with standard errors adjusted for clustering by state and
year.
1.4. Descriptive Statistics
Table 1 shows the descriptive statistics for the full samples of less educated
married and single and highly educated married mothers. As can be seen, black women
Reproduced with permission of the copyright owner. Further reproduction prohibited without permission.

18
are substantially more likely to suffer from anemia than white women. Note also that this
racial difference exists at all education levels. Furthermore, the gap seems to be
proportionally the largest among highly educated women. The incidences of placental
abruption and hypertension, on the other hand, are similar across the races.9 Interestingly,
among blacks, hypertension occurs much more frequently among highly educated
mothers than among women from the less educated cohorts. This may perhaps be
attributable to the significantly higher mean age in the highly educated sample.
According to the Centers for Disease Control and Prevention, the incidence of
pregnancy-associated hypertension is elevated at the extreme tails of the maternal age
distribution (CDC 2003). Anemia and placental abruption are more prevalent in the less
educated groups. Due to the offsetting effects of education on hypertension versus
placental abruption and anemia, the incidence of “any complication” appears fairly stable
across the education cohorts. The incidence of diabetes is higher among married than
among single women and, among single women, it increases with education. This pattern
likely reflects the variation in maternal age.
The other patterns in Table 1 corroborate findings of previous studies. Namely,
black women (in all cohorts) tend to start prenatal care later and are also less likely than
white women to receive adequate care. Highly educated women have higher utilization of
prenatal care than less educated mothers. Married low-educated women receive earlier
and more adequate care than single low-educated women. Highly educated mothers are
substantially older than less educated mothers and have fewer children on average. Black
women are disproportionately represented in the “unmarried” cohorts and, irrespective of
9 In a recent report, the CDC also discovers and notes these racial patterns (CDC 2003).
Reproduced with permission of the copyright owner. Further reproduction prohibited without permission.

19
marital status, have higher parity than white women. As expected, there are no big
differences across the racial and education groups with respect to the state-level
variables. On average, all cohorts face similar Medicaid eligibility thresholds, welfare
caseload levels, and unemployment rates.
Table 2 shows the trends in prenatal care utilization (represented by receipt of
prenatal care in the first trimester) and maternal health in the period under study. As is
apparent, in years 1989-1996, the utilization of prenatal care increased substantially. The
percentage of women receiving early prenatal care rose for all education categories and
the change was especially remarkable for the less educated cohorts. For example, for
black single low-educated (“less than high school”) women - the most “disadvantaged”
group - the percentage of those receiving prenatal care in the first trimester of their
pregnancy increased from about 48% in the year 1989 to approximately 60% in the year
1996.
As also evident from Table 2, the incidence of anemia initially slightly decreased
(reaching minimum in years 1990-1992) and then kept increasing (for most cohorts)
during the mid-1990’s. This pattern was even stronger for hypertension. The incidence of
placental abruption, on the other hand, did not change or declined modestly. As a CDC
report notes, anemia and hypertension were (in addition to diabetes) among the three
most common complications of pregnancy in the 1990-1999 period and “their rates have
risen steadily” (27% increase in anemia and 40% increase in hypertension; CDC 2001,
p. 11). Unfortunately, a simple descriptive analysis does not enable us to study the
underlying causes of these observed trends. Most likely, several factors affected the
incidence of maternal complications simultaneously. For example, average maternal age
Reproduced with permission of the copyright owner. Further reproduction prohibited without permission.

20
first modestly decreased and then increased in the mid-1990’s. If maternal age is an
important determinant of women’s health, this could explain some of the observed
patterns. Similarly, an initial acceleration and a later slowdown of the Medicaid eligibility
expansions would be consistent with the observed trends. To account for all of these
concomitant changes, a multivariate approach is needed.
Another problem with the reported numbers is that they do not enable us to
distinguish between a “true” increase in maternal complications and a better monitoring
of already existing morbidities. As the CDC report acknowledges: “Some of the apparent
increases since 1990 may be an artifact of improved reporting.” (CDC 2001, p .ll) As
long as the improvements in reporting have been universal (independent of the Medicaid
expansions), their effects should be captured by the year dummies and should not bias
our policy coefficients. It is highly probable, however, that the Medicaid expansions did
contribute to better reporting. If women targeted by the Medicaid program had
traditionally been those most likely to go without prenatal care and if Medicaid
succeeded in providing these women with such care (of which pregnancy monitoring is a
key component), we could observe a positive correlation between the Medicaid
expansions and the reported maternal complications.
We take some comfort in the fact that - based on the descriptive statistics - the
“bad” trends seem to have been similar across the education cohorts. Moreover, even if.
our estimates of the “true” beneficial impacts of the expansions suffer from this reporting
bias, the direction of the bias will be downward, making our results conservative. And,
finally, our analysis of diabetes provides a “straw man” against which to compare the
central results. Specifically, as argued above, diabetes does not seem to be preventable by
Reproduced with permission of the copyright owner. Further reproduction prohibited without permission.

21
prenatal care. Thus, any effect of the Medicaid expansions on the incidence of diabetes
would only reflect improvements in reporting. The steady increase in the incidence of
diabetes in the 1989-1996 period (Table 2) is at least consistent with this hypothesis.
1.5. Empirical Results
1.5.1. Medicaid Eligibility
Table 3 shows the effects - expressed as both odds ratios and marginal effects
evaluated at the population means - of our Medicaid policy variable on the utilization of
prenatal care and maternal health.10 Table 4 reports the same results from the models
estimated with OLS. Note that the marginal effects form the logit and the OLS
coefficients are similar in magnitude. The full set of logit results is reported in Table 5 for
the summary measure. The general finding in Tables 3 and 4 is that the Medicaid
expansions of the 1990’s benefited less educated mothers, especially whites. First, as
apparent, increases in Medicaid eligibility significantly increase the probability of
receiving prenatal care in the first trimester and of receiving adequate or intermediate
prenatal care among less educated single women (both black and white; second and third
columns of Tables 3 and 4). On the other hand, as hypothesized, the eligibility
coefficients are at best marginally significant (blacks) or have the opposite sign (whites)
among highly educated mothers. This finding corroborates the results in Currie and
Grogger (2002) where women with low socioeconomic status benefited from the
10 A negative (positive) coefficient suggests the variable decreases (increases) the probability o f the outcome, thus yielding an odds ratio o f less than (greater than) one. As mentioned earlier, we have used 100% of observations in all but the biggest “white” control cohorts. Recall also that the first column o f Tables 3 and 4 shows the cohort-specific “treatment probability” calculated from the CPS.
Reproduced with permission of the copyright owner. Further reproduction prohibited without permission.

22
Medicaid expansions but women with high socioeconomic status did not. When testing
for the significance of the differences, we strongly reject the null hypothesis that white
“treatment” and “control” women are affected equally. In the linear probability model
(Table 4) but not the logit model (Table 3), this is also the case for blacks. Surprisingly,
however, the beneficial effect of Medicaid in promoting prenatal care use did not reach
statistical significance among low-educated (“less than high school”) married women of
either race.
The fourth column of Tables 3 and 4 presents our results for placental abruption.
As can be seen, there is no strong evidence of a beneficial effect of the Medicaid
eligibility expansions on the incidence of this complication. This is not too surprising
given the rarity of the event: in the 1989-1996 period, no more than 1% of women
suffered from placental abruption in any of our sub-samples (Table 1).
The results for the other three measures of preventable complications are more
supportive of an effect of Medicaid, as the estimated coefficients are universally of the
correct sign and in general are the largest in magnitude for the most disadvantaged
women. Column five reports encouraging results for anemia: while not significant at
conventional levels, all of the Medicaid eligibility coefficients are negative among
women in the treatment groups and the sizes of the effects are sometimes substantial
(odds ratios between 0.89 and 0.97). The causality of the relationship between anemia
and Medicaid is further supported by the fact that neither black nor white highly educated
married mothers seem to have been affected by the policy changes (mostly positive
coefficients but differences from treatment groups statistically insignificant). These are
potentially important findings given that anemia has been a relatively common
Reproduced with permission of the copyright owner. Further reproduction prohibited without permission.

23
complication of pregnancy (over 3% of less educated blacks and close to 2% of less
educated whites suffered from anemia in the 1989-1996 period; Table 1).
The results for hypertension in the sixth column of Tables 3 and 4 are even
stronger. Again, the eligibility coefficients always have the correct sign among women in
the treatment groups. Furthermore, the beneficial effects of Medicaid are highly
significant among white women with “less than high school” education (both married and
single) and, in the logit model, marginally significant among single black and white
mothers with “high school completed”. Among married whites, the effect is significantly
different between women in the treatment and control groups.
The results for the summary measure (experiencing “any complication”) are
reported in the seventh column of Tables 3 and 4. The Medicaid expansions appear to
have reduced the incidence of any of the three maternal complications studied among
low-educated (“less than high school”) whites (both married and single; coefficients
highly significant) and married blacks (coefficients marginally significant). The effects
are sizeable (odds ratios of about 0 .88) and among whites (but not blacks) significantly
different between women in the treatment and control groups. This is an important result
given that 5-7% of women in our sample suffered from at least one of the preventable
morbidities in the 1989-1996 period (Table 1).
Finally, the last column of Tables 3 and 4 shows the estimates for diabetes. As
hypothesized, Medicaid eligibility has no beneficial effect on the incidence of this “straw
man” complication. In fact, the coefficients are positive and statistically significant
among white women with at least high school education. This result is consistent with the
concept of improved reporting discussed earlier. In particular, since diabetes is not
Reproduced with permission of the copyright owner. Further reproduction prohibited without permission.

24
believed to be preventable by prenatal care and since the Medicaid expansions likely
improved monitoring of maternal morbidities, we would expect the effect of Medicaid on
the observed incidence of diabetes to be positive, if anything.
To get more insight into the reporting bias present in our maternal health
estimates, we compare the effects of Medicaid eligibility on preventable maternal
complications with the effects on diabetes. Specifically, we test for whether there is a
statistically significant difference between the coefficients on each of the preventable
complications and the coefficients on diabetes. If all complications share the same
reporting bias, our exercise is essentially purging the preventable complications’
estimates of this bias. Of course, this is a very strong assumption and so we view our
calculations as illustrative only. Also, we caution that our exercise compares percentage
point changes in the outcomes of interest which limits its applicability in situations where
the incidence of maternal complications vastly differs.
Comparison to diabetes leads to statistically significant effects of Medicaid on all
of the white treatment groups and for almost every maternal health measure. For
hypertension and the summary measure, the ‘bias-purged’ effects are significantly
negative for all four white treatment groups (Tables 3 and 4). For anemia, they are
significantly negative for two (Table 3) or three (Table 4) of the treatment cohorts; only
less educated married mothers did not significantly benefit, mostly because diabetes did
not increase in this group. Among white women with at least “high school completed”,
even placental abruption now seems to have significantly lower incidence (especially in
Table 4).
Reproduced with permission of the copyright owner. Further reproduction prohibited without permission.

25
For blacks, however, the “straw man” exercise has little impact on our
conclusions. Since the incidence of diabetes seems generally unaffected by Medicaid, the
beneficial effects of Medicaid on preventable complications remain mostly insignificant.
Only the strongest (unadjusted) effect we find - the reduction in the incidence of “any
complication” among married less educated blacks - maintains its marginal significance
after the adjustment (Table 4).
These apparent racial differences in the effects of Medicaid on prenatal care use
and maternal health merit further discussion. As our findings suggest, both black and
white mothers obtained more adequate prenatal care as a result of the Medicaid
expansions. Indeed, in the OLS model, the same treatment groups for both races (i.e.,
single mothers) experienced improvements that are significantly different from the effects
on the corresponding control groups (Table 4). Among treatment whites, these increases
in access translated into improved maternal outcomes even among those who did not
experience improvements in our measures of prenatal care (i.e., married women). Among
blacks, on the other hand, few improvements in maternal health are observed and none
are statistically different from the effects on the control group. A further puzzle is that the
black cohort most affected in terms of maternal health - less educated married mothers -
did not experience an increase in our measures of prenatal care.
While the observed racial disparities in the effects of Medicaid on maternal health
mentioned above could partly be attributable to lower sample sizes among blacks, they
seem inconsistent with the highly statistically significant (and substantial) improvements
in the utilization of prenatal care experienced across the races.11 A possible explanation
Reproduced with permission of the copyright owner. Further reproduction prohibited without permission.

26
for this phenomenon is that black women receive lower quality o f prenatal care than
whites. The role of prenatal care quality has been mentioned in Currie and Grogger
(2002), who found strong racial differences in the effects of Medicaid on prenatal care
use and infant health. Unfortunately, the quality of prenatal care cannot be investigated
using data from the vital statistics. Suggestive evidence, however, can be found in other
studies. For example, Kogan et al. (1994) find that pregnant blacks are less likely than
pregnant whites to receive advice on cessation of alcohol consumption and smoking
cessation even when the timing of prenatal care initiation is controlled for. In a recent
paper, Chandra and Skinner (2003) argue that blacks tend to seek care in areas where
quality levels for all patients (black and white) are lower.
A different explanation for the observed racial disparities can be found in
Geronimus and Bound (1990). In particular, the authors’ main argument is that the health
of black women deteriorates with age more rapidly than the health of white women and
that this can be attributed to a cumulative effect of poor medical care among blacks. If so,
black women may have more pre-existing morbidities when they reach their childbearing
age which can make it more difficult for prenatal care providers to intervene. Using
hospital discharge data from South Carolina, Laditka et al. (2005b) find disparities in the
incidence of potentially preventable maternal complications between black and white
mothers enrolled in Medicaid. Interestingly, these racial disparities are eliminated once
socio-economic characteristics and comorbidities are controlled for. Future research
should reconcile the above findings.
11 Racial disparities o f a similar sort have been observed elsewhere. For example, Decker and Rapaport (2002) show that becoming eligible for Medicare at the age o f 65 increases the chances o f receiving mammography among low-educated blacks and whites but is associated with improvements in the stage of breast cancer diagnosis only among whites.
Reproduced with permission of the copyright owner. Further reproduction prohibited without permission.

27
1.5.2. Sensitivity Checks
In order to test the robustness of our results, we conduct several sensitivity
checks. First, we re-estimate our logit models excluding 1989 from the analysis (Table
Al in the Appendix). 1989 is the first year when maternal complications were recorded in
the Natality Detail Files and we want to verify that the adoption of new birth certificates
did not somehow contaminate our findings. In addition, information on maternal health
outcomes is missing for three states - Louisiana, Nebraska, and Oklahoma - in the year
1989. Limiting the period studied to 1990-1996 leaves the results qualitatively
unchanged.
Second, we redefine prenatal care adequacy as receiving “adequate” (as opposed
to “adequate” or “intermediate”) prenatal care (Table A2 in the Appendix). The results
remain qualitatively the same. This is also true if we exclude women with “no” or
“unknown” prenatal care utilization from the analysis (Table A3 in the Appendix).
Finally, drawing different random samples (1/3 of all births) from the control white
population has little influence on our estimates.
1.5.3. Other Results
What factors besides Medicaid affect maternal health? In Table 5, we report the
full set of results (except for state and year dummy coefficients) for the incidence of “any
complication” estimated with logit. (The full set of results from the other models are
available upon request.) Among white treatment women, welfare surprisingly seems to
modestly increase the incidence of pregnancy complications. This result probably reflects
Reproduced with permission of the copyright owner. Further reproduction prohibited without permission.

28
the positive association between poverty and health care need. The effects of
unemployment are insignificant.
As expected, the incidence of “any complication” first decreases (until the mid to
late 20s) and then increases with maternal age.12 Controlling for age, parity generally
decreases the probability of complications. And, finally, having a male infant is
associated with more complications among whites but with fewer complications among
blacks. This finding may be attributable to a differential effect of infant gender on the
incidence of specific morbidities. In particular, our unreported results suggest that male t
infants are associated with a higher incidence of hypertension (at least among whites) and
with a lower incidence of anemia (among both blacks and whites).
1.6. Concluding Remarks
Overall, our results suggest that there was an additional beneficiary of the
Medicaid expansions of the 1990’s - the mother. Specifically, the eligibility changes lead
to a higher utilization of prenatal care and fewer preventable maternal health
complications among those women (i.e., economically disadvantaged) most likely to
have benefited from the expansions. While the increases in prenatal care access seem
similar across the races, however, our findings indicate that the improvements in maternal
health were mostly concentrated among whites.
To get a better idea about the magnitude of the estimated health effects, consider
an example of California in the year 1989. In the early 1990’s, California experienced an
increase in the Medicaid eligibility threshold from 109 to 185 percent of the federal
12 Recall the U-shape relationship between maternal age and hypertension noted in the 2003 CDC report.
Reproduced with permission of the copyright owner. Further reproduction prohibited without permission.

29
poverty line (this was one of the largest percentage point increases nationally). Based on
our (statistically significant) results, such an increase would be associated with a decline
in the odds of hypertension of:
12.9% among married whites with “less than high school” education,
10.6% among single whites with “less than high school” education,
5.3% among single whites with “high school completed”, and
7.6% among single blacks with “high school completed”.
Similarly, the Californian expansion would cause a decline in the odds of “any
complication” of:
9.1% among married whites with “less than high school” education,
9.9% among married blacks with “less than high school” education, and
8.4% among single whites with “less than high school” education.
Given the costs of pregnancy complications to the mother and society, these are not
negligible improvements.
To better understand the link between Medicaid eligibility and maternal health,
future research could consider a wider range of maternal health outcomes, such as other
types of maternal complications of pregnancy/delivery and more “subtle” measures of
maternal health (mothers’ weight status postpartum, for example) and women’s general
health behaviors (such as maternal smoking). Another promising extension is to
investigate the possible endogeneity of both marital status (Yelowitz 1998) and fertility
(Bitler and Zavodny 2004).
Finally, the results of our research reveal that maternal health improved among
some disadvantaged mothers who did not experience an apparent change in the timing
Reproduced with permission of the copyright owner. Further reproduction prohibited without permission.

30
and/or adequacy of prenatal care. Conversely, other women (such as single blacks)
experienced an increase in prenatal care access but failed to experience improved
maternal health. These findings beg the question of what other channels exist through
which Medicaid eligibility actually affects maternal health. For example, Currie and
Gruber (1997, 2001) demonstrate that the eligibility expansions affect the treatments and
procedures received by women during their pregnancy and delivery. The question
remains, however, whether and how these changes translate into improvements in
maternal outcomes. According to our findings, the potential of public policies to improve
the health status of disadvantaged pregnant women may be large.
Reproduced with permission of the copyright owner. Further reproduction prohibited without permission.

31
Bibliography
Administration for Children and Families. 2003a.(http://www.acf.dhhs.gov/programs/opre/afdc/afdc.htm; Accessed 10/02/2003)
Administration for Children and Families. 2003b. (http://www.acf.dhhs.gov/news/stats/caseload.htm; Accessed 10/01/2003)
Agency for Healthcare Research and Quality (AHRQ). 1996. Hospital Inpatient Statistics, 1996. (http://www.ahcpr.gov/data/hcup/his96/tableld.htm; Accessed 03/27/2004)
Bashiri, A.; E. Burstein, E. Sheiner, and M. Mazor. 2003. “Anemia during Pregnancy and Treatment with Intravenous Iron: Review of the Literature,” European Journal o f Obstetrics, Gynecology, and Reproductive Biology, 110:1, pp. 2-7.
Bitler, Marianne P. and Madeline Zavodny. 2004. “The Effects of Medicaid Eligibility Expansions on Fertility,” Unpublished.
Buchanan, Thomas A. and Anny H. Xiang. 2005. “Gestational Diabetes Mellitus,” The Journal o f Clinical Investigation, 115:3, pp. 485-491.
Bureau of Labor Statistics. 2005. Local Area Unemployment Statistics. (http://data.bls.gov/cgi-bin/surveymost71a; Accessed 04/24/2005)
Centers for Disease Control and Prevention (CDC). 2001. National Vital Statistics Report, 49:1. (http://www.cdc.gov/nchs/data/nvsr/nvsr49/nvsr49_01.pdf; Accessed 12/15/2003)
Centers for Disease Control and Prevention (CDC). 2003. National Vital Statistics Report, 52:10. (http://www.cdc.gov/nchs/data/nvsr/nvsr52/nvsr52_10.pdf; Accessed 02/01/2004)
Chandra, Amitabh and Jonathan Skinner. 2003. “Geography and Racial Health Disparities,” NBER Working Paper No. 9513, National Bureau of Economic Research, Cambridge, Massachusetts.
Reproduced with permission of the copyright owner. Further reproduction prohibited without permission.

32
Chatterji, Pinka and Sara Markowitz. 2004. “Does the Length of Maternity Leave Affect Maternal Health?,” NBER Working Paper No. 10206, National Bureau of Economic Research, Cambridge, Massachusetts.
Conway, Karen S. and Andrea Kutinova. 2005. “Maternal Health: Does Prenatal Care Make a Difference?,” Health Economics, Forthcoming.
Currie, Janet and Jeffrey Grogger. 2002. “Medicaid Expansions and Welfare Contractions: Offsetting Effects on Prenatal Care and Infant Health?,” Journal o f Health Economics, 21:2, pp. 313-35.
Currie, Janet and Jonathan Gruber. 1996a. “Saving Babies: The Efficacy and Cost of Recent Changes in the Medicaid Eligibility of Pregnant Women,” Journal o f Political Economy, 104:6, pp. 1263-1296.
Currie, Janet and Jonathan Gruber. 1996b. “Health Insurance Eligibility, Utilization of Medical Care, and Child Health,” The Quarterly Journal o f Economics, 111:2, pp. 431- 466.
Currie, Janet and Jonathan Gruber. 1997. “The Technology of Birth: Health Insurance, Medical Interventions, and Infant Health,” NBER Working Paper No. 5985, National Bureau of Economic Research, Cambridge, Massachusetts.
Currie, Janet and Jonathan Gruber. 2001. “Public Health Insurance and Medical Treatment: The Equalizing Impact of the Medicaid Expansions,” Journal o f Public Economics, 82, pp. 63-89.
Cutler, David M. and Jonathan Gruber. 1996. “Does Public Insurance Crowd Out Private Insurance?,” The Quarterly Journal o f Economics, 111:2, pp. 391-430.
Decker, Sandra L. and Carol Rapaport. 2002. “Medicare and Disparities in Women’s Health,” NBER Working Paper No. 8761, National Bureau of Economic Research, Cambridge, Massachusetts.
Dubay, Lisa; Ted Joyce, Robert Kaestner, and Genevieve M. Kenney. 2001. “Changes in Prenatal Care Timing and Low Birth Weight by Race and Socioeconomic Status:
Reproduced with permission of the copyright owner. Further reproduction prohibited without permission.

33
Implications for the Medicaid Expansions for Pregnant Women,” Health Services Research, 36:2, pp. 373-398.
Ecker, Jeffrey L. 2004. “Gestational Diabetes: Are Prediction and Prevention Possible?,” Diabetes Forecast, Jan 2004, pp. 109-111.
Farrell M. 2003. “Improving the Care of Women with Gestational Diabetes,” The American Journal o f Maternal Child Nursing, 28:5, pp. 301-305.
Gabbe, SG and CR Graves. 2003. “Management of Diabetes Mellitus Complicating Pregnancy,” Obstetrics and Gynecology, 102:4, pp. 857-868.
Geocities, 2004. “National Health Statistics - National Bill.” Data source: HCUPnet, Healthcare Cost and Utilization Project. Agency for Healthcare Research and Quality, Rockville, MD. (http://www.geocities.com/s7ss/National_Health_Bill.htm; Accessed 02/01/2004)
Geronimus, Arline T. and John Bound. 1990. “Black/White Differences in Women’s Reproductive-Related Health Status: Evidence from Vital Statistics,” Demography, 27:3, pp. 457-466.
Haas, Jennifer S.; Steven Udvarhelyi, and Arnold M. Epstein. 1993. “The Effects of Health Coverage for Uninsured Pregnant Women on Maternal Health and the Use of Cesarean Section,” JAMA, 270:1, pp. 61-64.
Hill, Ian T. 1992. The Medicaid Expansions fo r Pregnant Women and Children: A State Program Characteristics Information Base. Washington, D.C.: Health Systems Research.
Joyce, Ted; Robert Kaestner, and Sanders Korenman. 2003. “Welfare Reform and Non- Marital Fertility in the 1990s: Evidence from Birth Records,” Advances in Economic Analysis and Policy, 3:1, Article 6 .
Kaestner, Robert; Ted Joyce, and Andrew Racine. 2001. “Medicaid Eligibility and the Incidence of Ambulatory Care Sensitive Hospitalizations for Children,” Social Science and Medicine, 52, pp. 305-313.
Reproduced with permission of the copyright owner. Further reproduction prohibited without permission.

34
Kaestner, Robert and Neeraj Kaushal. 2002. “Welfare Reform and Health Insurance Coverage of Low-income Families,” NBER Working Paper #10033, Cambridge MA.
Kaestner, Robert and Elizabeth Tarlov. 2003. “Changes in the Welfare Caseload and the Health of Low-educated Mothers,” NBER Working Paper #10034, Cambridge MA.
Kogan M.D.; M. Kotelchuck, G. Alexander, and W.E. Johnson. 1994. "Racial Disparities in Reported Prenatal Care Advice from Health Care Providers," American Journal o f Public Health, 84, pp. 82-88.
Laditka, Sarah B.; James N. Laditka, Melanie P. Mastanduno, Michele R. Lauria, and Tina C. Foster. 2005a. “Potentially Avoidable Maternity Complications: An Indicator of Access to Prenatal and Primary Care during Pregnancy,” Women and Health, Forthcoming.
Laditka, Sarah B.; James N. Laditka, and Janice C. Probst. 2005b. “Racial and Ethnic Disparities in Potentially Avoidable Delivery Complications Among Pregnant Medicaid Beneficiaries in South Carolina,” Unpublished.
Lewbel, Arthur. 2003. “Estimation of Average Treatment Effects with Misclassification,” Boston College Working Paper in Economics No. 556, Boston College, Chestnut Hill, Massachusetts.
Makrides, M.; C.A. Crowther, R.A. Gibson, R.S. Gibson, and C.M. Skeaff. 2003. “Efficacy and Tolerability of Low-dose Iron Supplements during Pregnancy: A Randomized Controlled Trial,” American Journal o f Clinical Nutrition, 78:1, pp.145-53.
National Governors’ Association. 2003. Maternal and Child Health (MCH) Updates, 1994-1999 Issues, (http://www.nga.org; Accesses 09/27/2003)
Preeclampsia Foundation, 2004. “The Cost of Preeclampsia in the USA.” Data source: Agency for Healthcare Research and Quality and Centers for Disease Control and Prevention, (http://www.preeclampsia.org/statistics.asp; Accessed 02/01/2004)
Public Health Service. 2000. “Healthy People 2010: Objectives for Improving Health,” US Department of Health and Human Services, Public Health Service, Washington D.C.
Reproduced with permission of the copyright owner. Further reproduction prohibited without permission.

35
Sachs BP, DA Brown, SG Driscoll, E Schulman, D Acker, BJ Ransil, and JF Jewett. 1988. “Hemorrhage, Infection, Toxicemia, and Cardiac Disease, 1954-85: Causes for their Declining Role in Maternal Mortality,” American Journal o f Public Health, 78:6, pp. 671-5.
Scholl TO, ML Hediger, and DH Belsky. 1994. “Prenatal Care and Maternal Health during Adolescent Pregnancy: A Review and Meta-Analysis,” Journal o f Adolescent Health, 15:6, pp. 444-456.
Simmons, David. 1996. “Can Gestational Diabetes/Non-Insulin-Dependent Diabetes in Pregnancy be Prevented?,” The Australian and New Zealand Journal o f Obstetrics and Gynaecology, 36:2, pp. 117-119.
US Census Bureau. 2003a.(http://eire.census.gOv/popest/archives/1990#state; Accessed 10/02/2003)
US Census Bureau. 2003b.(http://www.census.gov/population/estimates/state/st-99-3.txt; Accessed 10/01/2003)
US Dept, of Health and Human Services, National Center for Health Statistics. 1990-1997. Natality Detail File, 1989-1996. Hyattsville, MD: US Dept, of Health and Human Services, National Center for Health Statistics [producer], 1990-1997. Ann Arbor, MI: Inter-University Consortium for Political and Social Research [distributor], 2003.
Villar, J.; M. Merialdi, A.M. Gulmezoglu, E. Abalos, G. Carroli, R. Kulier, and M. de Onis. 2003. “Nutritional Interventions during Pregnancy for the Prevention or Treatment of Maternal Morbidity and Preterm Delivery: An Overview of Randomized Controlled Trials,” Journal o f Nutrition, 133:5 (Suppl2), pp. 1606S-1625S.
Yelowitz, Aaron S. 1998. “Will Extending Medicaid to Two-Parent Families Encourage Marriage?,” The Journal o f Human Resources, 33:4, pp. 833-865.
Reproduced with permission of the copyright owner. Further reproduction prohibited without permission.

Elig
ibili
ty
thre
shol
d (%
FPL)
El
igib
ility
th
resh
old
(% FP
L)
36
Figure 1.
Medicaid Eligibility Threshold, 1988-1996Minimum, Maximum, and Average
350%
300%
250%
200%
150%
100%
50%
0 %1995 19961993 199419921990 19911989
Y earJul-Dec 1988
•Min Max Average
Jan-Jun 1996
Figure 2.
Medicaid Eligibility Threshold, 1988-1996Five Largest S tates
250%
200%
150%
100%
50%
0%19961994 19951992 19931990 19911989
Y ear Jan-Jun 1996Jul-Dec 1988
CA FL - N Y TX
Reproduced with permission of the copyright owner. Further reproduction prohibited without permission.

Reproduced with
permission
of the copyright owner.
Further reproduction prohibited
without permission.
Table 1. Descriptive Statistics1989-1996 Births
Blacks WhitesTreatment group #1 (less than
high school, married)
Treatment group #2 (less than
high school, single)
Treatment group #3
(high school completed,
single)
Treatment group #4
(some college, single)
Controlgroup
(collegecompleted,married)
Treatment group #1 (less than
high school, married)
Treatment group #2 (less than
high school, single)
Treatment group #3
(high school completed,
single)
Treatment group #4
(some college, single)
Controlgroup
(collegecompleted,married)
# of observations 134,196 619,946 1,204,987 495,896 278,471 1,110,384 723,699 1,341,567 533,435 4,412,467Placental abruption (%)
0.81 0.86 0.74 0.68 0.55 0.79 0.89 0.77 0.70 0.48
Anemia (%) 3.49 3.86 3.41 3.21 2.48 1.93 2.23 1.86 1.80 1.14Hypertension (%) 2.45 2.04 2.80 3.33 3.62 2.47 2.29 3.35 3.70 2.95Any complication(%)
6.56 6.56 6.73 7.02 6.48 5.08 5.27 5.84 6.06 4.49
Diabetes (%) 3.21 1.54 1.83 2.23 3.51 2.57 1.92 2.15 2.33 2.34PNC in first trimester (%)
62.51 53.11 61.70 69.07 90.18 70.86 63.46 70.37 74.35 95.15
Adequate/intermed. PNC (%)
84.21 75.47 84.50 89.55 97.59 90.22 86.94 91.40 92.67 99.04
Age (years) 27.00 24.04 24.50 25.57 30.82 24.90 23.45 24.46 25.67 31.00Parity (# of live births)
3.44 3.07 2.31 1.96 1.90 2.58 2.25 1.78 1.66 1.83
Male infant 50.75 50.61 50.75 50.89 50.65 51.25 51.11 51.35 51.26 51.43Medicaid eligibility* (% of FPL/100)
1.55 1.54 1.55 1.57 1.58 1.50 1.54 1.57 1.60 1.58
Welfare caseload* (% on welfare)
4.90 5.10 5.05 5.16 4.96 4.69 4.85 4.89 4.93 4.83
Unemployment rate* 6.35 6.30 6.25 6.30 6.20 6.13 6.13 6.09 6.09 6.07* Medicaid eligibility, welfare caseload, and unemployment rate are state-level explanatory variables.
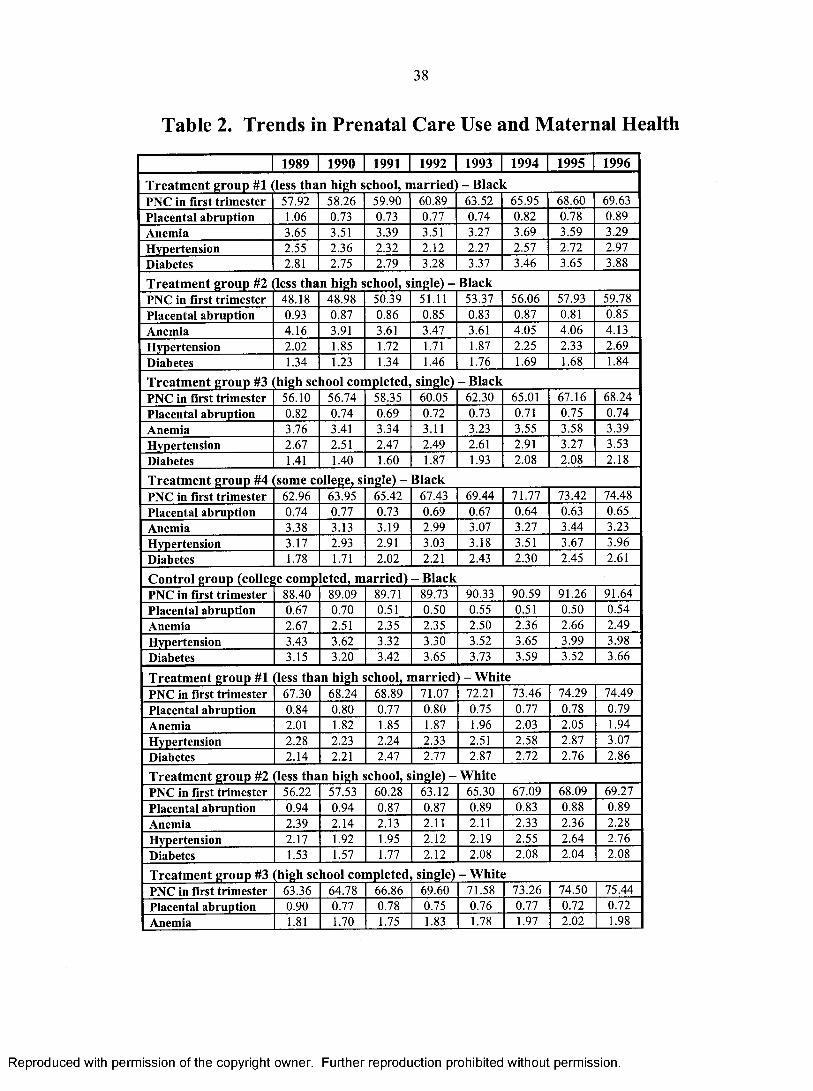
38
Table 2. Trends in Prenatal Care Use and Maternal Health
1989 1990 1991 1992 1993 1994 1995 1996
Treatm ent group #1 less than high school, m arried - BlackPNC in first trimester 57.92 58.26 59.90 60.89 63.52 65.95 68.60 69.63Placental abruption 1.06 0.73 0.73 0.77 0.74 0.82 0.78 0.89Anemia 3.65 3.51 3.39 3.51 3.27 3.69 3.59 3.29Hypertension 2.55 2.36 2.32 2.12 2.27 2.57 2.72 2.97Diabetes 2.81 2.75 2.79 3.28 3.37 3.46 3.65 3.88
Treatm ent group #2 ile ss than high school, single) - BlackPNC in first trimester 48.18 48.98 50.39 51.11 53.37 56.06 57.93 59.78Placental abruption 0.93 0.87 0.86 0.85 0.83 0.87 0.81 0.85Anemia 4.16 3.91 3.61 3.47 3.61 4.05 4.06 4.13Hypertension 2.02 1.85 1.72 1.71 1.87 2.25 2.33 2.69Diabetes 1.34 1.23 1.34 1.46 1.76 1.69 1.68 1.84
Treatm ent group #3 (high school com pleted, single) - B lackPNC in first trimester 56.10 56.74 58.35 60.05 62.30 65.01 67.16 68.24Placental abruption 0.82 0.74 0.69 0.72 0.73 0.71 0.75 0.74Anemia 3.76 3.41 3.34 3.11 3.23 3.55 3.58 3.39Hypertension 2.67 2.51 2.47 2.49 2.61 2.91 3.27 3.53Diabetes 1.41 1.40 1.60 1.87 1.93 2.08 2.08 2.18
Treatm ent group #4 some college, single) - BlackPNC in first trimester 62.96 63.95 65.42 67.43 69.44 71.77 73.42 74.48Placental abruption 0.74 0.77 0.73 0.69 0.67 0.64 0.63 0.65Anemia 3.38 3.13 3.19 2.99 3.07 3.27 3.44 3.23Hypertension 3.17 2.93 2.91 3.03 3.18 3.51 3.67 3.96Diabetes 1.78 1.71 2.02 2.21 2.43 2.30 2.45 2.61
Control group (college com pleted, m arried) - B lackPNC in first trimester 88.40 89.09 89.71 89.73 90.33 90.59 91.26 91.64Placental abruption 0.67 0.70 0.51 0.50 0.55 0.51 0.50 0.54Anemia 2.67 2.51 2.35 2.35 2.50 2.36 2.66 2.49Hypertension 3.43 3.62 3.32 3.30 3.52 3.65 3.99 3.98Diabetes 3.15 3.20 3.42 3.65 3.73 3.59 3.52 3.66
Treatm ent group #1 less than high school, m arried - W hitePNC in first trimester 67.30 68.24 68.89 71.07 72.21 73.46 74.29 74.49Placental abruption 0.84 0.80 0.77 0.80 0.75 0.77 0.78 0.79Anemia 2.01 1.82 1.85 1.87 1.96 2.03 2.05 1.94Hypertension 2.28 2.23 2.24 2.33 2.51 2.58 2.87 3.07Diabetes 2.14 2.21 2.47 2.77 2.87 2.72 2.76 2.86
Treatment group #2 (less than high school, single) - W hitePNC in first trimester 56.22 57.53 60.28 63.12 65.30 67.09 68.09 69.27Placental abruption 0.94 0.94 0.87 0.87 0.89 0.83 0.88 0.89Anemia 2.39 2.14 2.13 2.11 2.11 2.33 2.36 2.28Hypertension 2.17 1.92 1.95 2.12 2.19 2.55 2.64 2.76Diabetes 1.53 1.57 1.77 2.12 2.08 2.08 2.04 2.08
Treatment group #3 (high school com pleted, single) - W hitePNC in first trimester 63.36 64.78 66.86 69.60 71.58 73.26 74.50 75.44Placental abruption 0.90 0.77 0.78 0.75 0.76 0.77 0.72 0.72Anemia 1.81 1.70 1.75 1.83 1.78 1.97 2.02 1.98
Reproduced with permission of the copyright owner. Further reproduction prohibited without permission.

39
Hypertension 3.03 2.92 2.92 3.14 3.30 3.55 3.74 3.92Diabetes 1.73 1.78 2.09 2.26 2.32 2.28 2.23 2.29Treatm ent group #4 som e college, single) - W hitePNC in first trimester 67.29 68.89 71.00 73.21 74.92 76.50 77.93 78.56Placental abruption 0.74 0.77 0.65 0.72 0.74 0.71 0.68 0.66Anemia 1.78 1.58 1.61 1.68 1.76 1.94 1.92 1.93Hypertension 3.33 3.22 3.15 3.52 3.54 3.92 4.06 4.29Diabetes 1.92 1.92 2.35 2.52 2.45 2.40 2.35 2.46Control group (college com pleted, m arried) - W hitePNC in first trimester 94.44 94.83 94.93 95.18 95.24 95.41 95.50 95.39Placental abruption 0.55 0.52 0.48 0.47 0.47 0.47 0.46 0.46Anemia 0.95 0.99 1.08 1.15 1.11 1.22 1.29 1.24Hypertension 2.71 2.59 2.64 2.85 2.96 3.10 3.16 3.37Diabetes 2.19 2.19 2.36 2.63 2.46 2.34 2.23 2.31
Reproduced with permission of the copyright owner. Further reproduction prohibited without permission.

Reproduced with
permission
of the copyright owner.
Further reproduction prohibited
without permission.
Table 3. The Effects of Medicaid Eligibility Rules on PNC Use and Maternal Health Odds Ratios and Marginal Effects from a Logit; 1989-1996
Cohort Treatmentprobability
PNC in first trimester
Adequate/ Intermed. PNC
Placentalabruption
Anemia Hypertension Anycomplication
Diabetes
Treatment group #1 (less than high school, married) - Black
17.51 1.00[-0.001](-0.05)
1.04[0.005](0.77)
1.09[0.001](0.49)
0.89[-0.003](-1.04)
0.84[-0.004](-1.58)
0.87*[-0.008](-1.92)
1.06[0.001](0.55)
Treatment group #2 (less than high school, single) - Black
4.32A j 28***[0.041](4.16)
1.16***[0.024](3.50)
0.95[-0.000](-0.48)
0.89[-0.004](-1.24)
0.92[-0.002](-0.86)
0.90[-0.006](-1-37)
0.90[-0.002](-1.17)
Treatment group #3 (high school completed, single) - Black
1.74 1 16*** [0.034] (4.09)
| |9*** [0.021] (4.29)
0.99[-0.000](-0.15)
0.93[-0.002](-1.01)
0.90*[-0.002](-1-69)
0.93[-0.004](-1.34)
0.96[-0.001](-0.68)
Treatment group #4 (some college, single) - Black
3.14 1.15***[0.031](2.92)
1.20***[0.019](3.52)
0.91[-0.001](-0.82)
0.97[-0.001](-0.40)
0.90[-0.003](-1-25)
0.94[-0.004](-0.96)
0.93[-0.001](-1.00)
Control group (college completed, married) - Black
-1.36 1.06[0.008](0.87)
1.22*[0.008](1-95)
0.85[-0.001](-0.93)
1.07[0.002](0.64)
0.94[-0.001](-0.75)
0.98[-0.001](-0.30)
0.98[-0.000](-0.20)
Treatment group #1 (less than high school, married) - White
7.73 1.00[0.000](0.06)
1.01[0.000](0.09)
1.02[0.000](0.30)
0.90[-0.001](-1.45)
0.83*** b 1-0.005] (-4.28)
0.88*** “ [-0.006] (-3.72)
0.97[-0.001](-0.62)
Treatment group #2 (less than high school, single) - White
13.24 2 24*** [0.029] (3.11)
2 27*** [0.014] (2.97)
0.92[-0.001](-0.95)
0.91[-0.002](-1.28)
0.86** b [-0.004] (-2.36)
0.89** b [-0.006] (-2.46)
1.07[0.002](1.00)
Treatment group #3 (high school completed, single) - White
8.17 I I I ***
[0.020] (3.33)
1.16***[0.011](3.59)
1.02 b [0.000] (0.37)
0.93 c [-0.001] (-1-10)
0.93* c [-0.002] (-1-93)
0.95 c [-0.003] (-1-59)
1.20***[0.005](3.94)
Treatment group #4 (some college, single) - White
4.65 1.12***[0.021](3.15)
I N* *[0.0071(2.12)
0.99[-0.000](-0.10)
0.92 b [-0.001] (-0.99)
0.95 b [-0.001] (-0.85)
0.96 b [-0.002] (-0.98)
1.16**[0.004](2.20)
Control group (college completed, married) — White
0.79 0.97[-0.001](-0.56)
0.87*[-0.002](-1-74)
0.98[-0.000](-0.27)
1.08[0.001](0.83)
0.99 s [-0.000] (-0.25)
1.01 s [0.000] (0.17)
111**
[0.002](2.35)

Reproduced with
permission
of the copyright owner.
Further reproduction prohibited
without permission.
41Notes to Table 3:The first row in each cell reports the odds ratio. Marginal effects evaluated at population means are given in square brackets.*, **, and *** denote statistical significance at the 90%, 95%, and 99% confidence levels, respectively.Standard errors have been adjusted for clustering at the state/year level. T-statistics are given in parentheses.“Treatment probability” has been calculated from CPS according to the following formula: treatment probability = 100*(% covered by Medicaid in 1996-% covered by Medicaid in 1989)/(l 00-% covered by Medicaid in 1989). Most substantial increases are bolded (see note A below).A Unmarried black women with less than high school education experienced a decline in the % on AFDC of about 11 percentage points (in contrast to a modest increase in most other groups). Thus, Medicaid expansions above and beyond welfare had to be especially strong in this cohort in order to offset the negative effect of the AFDC contraction.All coefficients have been compared between treatment and control cohorts. Cells with a difference significant at the 95% or 99% confidence level are shaded.Coefficients on placental abruption, anemia, hypertension, and ‘any complication’ have been compared to coefficients on diabetes within cohorts. a, b, andc indicate differences statistically significance at the 90%, 95%, and 99% confidence levels, respectively.

Reproduced with
permission
of the copyright owner.
Further reproduction prohibited
without permission.
42Table 4. The Effects of Medicaid Eligibility Rules on PNC Use and Maternal Health
Coefficients from a Linear Probability Model; 1989-1996
Cohort Treatmentprobability
PNC in first trimester
Adequate/ Intermed. PNC
Placentalabruption
Anemia Hypertension Anycomplication
Diabetes
Treatment group #1 (less than high school, married) - Black
17.51 0.000(0.04)
0 . 0 1 1
(1.43)0 . 0 0 1
(0.74)-0.004(-1.15)
-0.004(-1.48)
-0.009* a (-1.87)
0 . 0 0 2
(0.72)
Treatment group #2 (less than high school, single) - Black
4.32 A 0.040***(4.21)
0.U33***(4.01)
- 0.000(-0.45)
-0.005(-1.28)
-0 . 0 0 1
(-0.52)-0.006(-1.30)
-0 . 0 0 1
(-0 .8 8 )
Treatment group #3 (high school completed, single) — Black
1.74 0.036***(4.45)
0.029***(4.97)
- 0.000(-0.04)
-0.003(-1.08)
-0 . 0 0 2
(-1.17)-0.004(-1.25)
- 0.000(-0.13)
Treatment group #4 (some college, single) - Black
3.14 0.033***(3.26)
0.023***(4.00)
-0 . 0 0 1
(-0.90)-0 . 0 0 1
(-0.40)-0.003(-0.97)
-0.004(-0.94)
-0 . 0 0 1
(-0.72)
Control group (college completed, married) - Black
-1.36 0.004(0.74)
0.005**(1.99)
-0 . 0 0 1
(-0.95)0 . 0 0 1
(0.52)-0 . 0 0 2
(-0.76)-0 . 0 0 2
(-0.42)- 0.000(-0 .1 1 )
Treatment group #1 (less than high school, married) - White
7.73 0.004(0.46)
0.005(0.95)
0.000(0.43)
-0 . 0 0 2
(-1.25)-0.004*** b
(-3.81)-0.005*** b
(-3.27)-0 . 0 0 1
(-0.81)
Treatment group #2 (less than high school, single) - White
13.24 0.032***(3.23)
0 .0 2 2 ***(3.36)
-0 . 0 0 1
(-0.96)-0 . 0 0 2 a (-1.33)
-0.003* b (- 1 .8 8 )
-0.005** b (-2.19)
0 . 0 0 1
( 1 .0 2 )
Treatment group #3 (high school completed, single) - White
8.17 0.023***(3.58)
0.015***(4.07)
0.000 c (0.59)
- 0.001 c (-1 .1 0 )
-0 . 0 0 2 c (-1.42)
-0 . 0 0 2 c (-1.25)
0.004***(3.82)
Treatment group #4 (some college, single) - White
4.65 0.024***(3.44)
0 .0 1 2 ***(2.92)
- 0.000 b (-0 .1 2 )
- 0.001 b (-0.98)
- 0.001a (-0.54)
-0 . 0 0 2 a (-0.76)
0.003**(2.27)
Control group (college completed, married) - White
0.79 -0 . 0 0 1
(-0.50)-0 . 0 0 1
(-1.52)- 0.000 b (-0.18)
0.000(0.46)
0.000(0 .1 0 )
0.000(0.29)
0 .0 0 2 **(2.41)
*, **, and *** denote statistical significance at the 90%, 95%, and 99% confidence levels, respectively.Standard errors have been adjusted for clustering at the state/year level. T-statistics are given in parentheses.“Treatment probability” has been calculated from CPS according to the following formula: treatment probability = 100*(% covered by Medicaid in 1996-% covered by Medicaid in 1989)/(100-% covered by Medicaid in 1989). Most substantial increases are bolded (see note A below).A Unmarried black women with less than high school education experienced a decline in the % on AFDC of about 11 percentage points (in contrast to a modest increase in most other groups). Thus, Medicaid expansions above and beyond welfare had to be especially strong in this cohort in order to offset the negative effect o f the AFDC contraction.All coefficients have been compared between treatment and control cohorts. Cells with a difference significant at the 95% or 99% confidence level are shaded.Coefficients on placental abruption, anemia, hypertension, and ‘any complication’ have been compared to coefficients on diabetes within cohorts. “, b, an d c indicate differences statistically significance at the 90%, 95%, and 99% confidence levels, respectively.

Reproduced with
permission
of the copyright owner.
Further reproduction prohibited
without permission.
43
Table 5. Any ComplicationOdds Ratios from a Logit; 1989-1996
Blacks W hitesTreatment group #1 (less than
high school, married)
Treatment group #2 (less than
high school, single)
Treatment group #3
(high school completed,
single)
Treatment group #4
(some college, single)
Controlgroup
(collegecompleted,married)
Treatment group #1 (less than
high school, married)
Treatment group #2 (less than
high school, single)
Treatment group #3
(high school completed,
single)
Treatment group #4
(some college, single)
Controlgroup
(collegecompleted,married)
Medicaid eligibility 0 . 8 7 *
( - 1 . 9 2 )
0 . 9 0
( - 1 . 3 7 )
0 . 9 3
( - 1 . 3 4 )
0 . 9 4
( - 0 . 9 6 )
0 . 9 8
( - 0 . 3 0 )
0 . 8 8 * * *
( - 3 . 7 2 )
0 . 8 9 * *
( - 2 . 4 6 )
0 . 9 5
( - 1 . 5 9 )
0 . 9 6
( - 0 . 9 8 )
1 . 0 1
( 0 . 1 7 )
Welfare caseload 1 . 0 0
( 0 . 0 3 )
0 . 9 8
( - 0 . 8 2 )
0 . 9 7
( - 1 . 1 2 )
0 . 9 5 *
( - 1 . 7 8 )
0 . 9 6
( - 1 . 2 0 )
Y 0 5 * * *
( 2 . 7 1 )
0 . 9 9
( - 0 . 4 6 )
1 . 0 3 * *
( 2 . 1 2 )
1 . 0 6 * * *
( 3 . 5 8 )
1 . 0 2
( 1 . 0 6 )
Unemployment rate 1 . 0 0
( - 0 . 0 3 )
1 . 0 0
( - 0 . 0 8 )
1 . 0 0
( 0 . 0 1 )
1 . 0 1
( 0 . 5 2 )
1 . 0 1
( 0 . 4 7 )
1 . 0 0
( 0 . 1 1 )
1 . 0 1
( 0 . 6 3 )
1 . 0 1
( 0 . 8 0 )
0 . 9 9
( - 0 . 8 3 )
1 . 0 0
( 0 . 3 5 )
Age 0 8 7 * * *
( - 8 . 6 7 )
Q 9 i * * *
( - 1 0 . 0 2 )
Q
( - 1 4 . 7 7 )
0 . 9 5 * *
( - 4 . 7 3 )
0 . 8 7 * * *
( - 7 . 6 2 )
0 . 8 8 * * *
( - 1 7 . 0 9 )
0 . 8 8 * * *
( - 1 2 . 3 6 )
q
( - 1 5 . 9 0 )
0 9 i * * *
( - 9 . 6 2 )
q 7 9 * * *
( - 2 0 . 1 9 )
Age squared 1 . 0 0 * * *
( 8 . 9 7 )
1 . 0 0 * * *
( 9 . 6 0 )
1 . 0 0 * * *
( 1 5 . 0 3 )
1 . 0 0 * * *
( 5 . 6 2 )
1 . 0 0 * * *
( 8 . 5 8 )
1 . 0 0 * * *
( 1 9 . 5 5 )
1 . 0 0 * * *
( 1 3 . 6 4 )
1 . 0 0 * * *
( 1 7 . 1 0 )
1 . 0 0 * * *
( 1 0 . 8 7 )
1 . 0 0 * * *
( 2 1 . 4 7 )
Parity 1 . 0 1
( 1 . 5 7 )
1 . 0 1
( 1 . 5 9 )
q 9 7 * * *
( - 5 . 3 4 )
q 9 5 * * *
( - 6 . 4 7 )
0 . 8 9 * * *
( - 1 1 . 3 2 )
0 9 j * * *
( - 1 9 . 4 4 )
0 9 3 * * *
( - 1 0 . 6 0 )
0 . 8 6 * * *
( - 2 2 . 8 3 )
0 . 8 7 * * *
( - 1 4 . 6 7 )
0 . 7 5 * * *
( - 3 5 . 8 0 )
Male infant 0 . 9 7
( - 1 . 2 8 )
0 . 9 6 * * *
( - 3 - 4 7 )
q 9 g * * *
( - 2 . 8 2 )
0 . 9 6 * * *
( - 3 . 1 9 )
0 . 9 6 * * *
( - 2 . 6 9 )
1 . 0 3 * * *
( 3 . 8 2 )
1 0 4 * * *
( 3 . 8 7 )
1 . 0 6 * * *
( 7 . 0 8 )
1 . 0 3 * *
( 2 . 4 3 )
1 . 0 2 * *
( 2 . 1 9 )
*, **, and *** denote statistical significance at the 90%, 95%, and 99% confidence levels, respectively. Standard errors have been adjusted for clustering at the state/year level. T-statistics are given in parentheses.

Reproduced with
permission
of the copyright owner.
Further reproduction prohibited
without permission.
Appendix
Table A l. The Effects of Medicaid Eligibility Rules on PNC Use and Maternal HealthOdds Ratios from a Logit; 1990-1996
Cohort PNC in first trimester
Adequate/ Intermed. PNC
Placentalabruption
Anemia Hypertension Anycomplication
Diabetes
Treatment group #1 (less than high school, married) - Black
0.99(-0.15)
1 . 0 1
(0.14)0.89
(-0.53)0.89
(-0.92)0.78*
(-1.85)0.82**(-2.51)
1.04(0.29)
Treatment group #2 (less than high school, single) - Black
J jg***(3.56)
1 1 1 **(2 .2 0 )
0 . 8 6
(-1.41)0.95
(-0.48)0.93
(-0.67)0.93
(-0.91)0.97
(-0.28)
Treatment group #3 (high school completed, single) - Black
1 17***(3.66)
1 i^***(3.11)
0.91(-1.41)
0.92(-0.91)
0.94(-0.98)
0.93(-1.17)
0.97(-0.41)
Treatment group #4 (some college, single) — Black
1 19***(2.96) (2.63)
0.87(-0.94)
0.91(-0.98)
0.89(-1.25)
0.91(-1.45)
0.97(-0.29)
Control group (college completed, married) - Black
1 . 1 1
(1.40)1 3 9 *** (2.98)
0.77(-1.16)
1.05(0.42)
0 . 8 8
(-1.38)0.92
(-0.96)0.98
(-0 .2 2 )
Treatment group #1 (less than high school, married) - White
1.05(0.69)
1.03(0.33)
0.99(-0 .1 2 )
0.93(-0.87)
0.81***(-4.17)
0.87***(-3.36)
1 . 0 0
(-0.03)
Treatment group #2 (less than high school, single) - White
1 2 1 *** (3.87)
1 .2 0 ***(2.72)
0.82*(-1.96)
0 .8 6 *(-1.82)
0 .8 8 *(-1.87)
0.85***(-3.10)
1.15*(1.73)
Treatment group #3 (high school completed, single) - White
1 1 2 *** (3.02)
1 1 7 ***(3.05)
1.03(0.48)
0.89(-1.60)
0.95(-1.13)
0.95(-1.49)
1 23*** (3.82)
Treatment group #4 (some college, single) - White
1.15***(3.40)
1 .1 2 **(2 .0 1 )
0.99(-0.09)
0.92(-0.85)
0.98(-0.43)
0.97(-0.74)
1.17**(2.08)
Control group (college completed, married) - White
0.98(-0.42)
0.83*(-1 .8 8 )
0.96(-0.49)
1.17(1.51)
1 . 0 1
(0.14)1.03
(0.75)1 .1 1 *(1.94)
*, **, and *** denote statistical significance at the 90%, 95%, and 99% confidence levels, respectively. Standard errors have been adjusted for clustering at the state/year level. T-statistics are given in parentheses.

45
Table A2. The Effects of Medicaid Eligibility Rules on PNC AdequacyOdds Ratios from a Logit; 1989-1996
Cohort Adequate/ Intermediate PNC
AdequatePNC
Treatment group #1 (less than high school, married) - Black
1.04(0.77)
1 . 0 0
(-0.07)
Treatment group #2 (less than high school, single) - Black
1.16***(3.50)
2 27***(4.12)
Treatment group #3 (high school completed, single) - Black
2 jg***(4.29)
2 22*** (3.23)
Treatment group #4 (some college, single) - Black
1 .2 0 ***(3.52)
1.09**(2 .0 0 )
Control group (college completed, married) - Black
1 .2 2 *(1.95)
0.95(-0.98)
Treatment group #1 (less than high school, married) - White
1 . 0 1
(0.09)0.99
(-0 .2 1 )
Treatment group #2 (less than high school, single) - White
2 2 7 ***(2.97)
2 2 1 *** (2.73)
Treatment group #3 (high school completed, single) - White
1.16***(3.59)
1.06**(2.05)
Treatment group #4 (some college, single) - White
1 U**(2 .1 2 )
1.03(0 .8 6 )
Control group (college completed, married) - White
0.87*(-1.74)
0.84***(-3.56)
*, **, and *** denote statistical significance at the 90%, 95%, and 99% confidence levels, respectively. Standard errors have been adjusted for clustering at the state/year level. T-statistics are given in parentheses.
Reproduced with permission of the copyright owner. Further reproduction prohibited without permission.

Reproduced with
permission
of the copyright owner.
Further reproduction prohibited
without permission.
Table A3. The Effects of Medicaid Eligibility Rules on PNC Use and Maternal HealthOdds Ratios from a Logit; 1989-1996; PNC Users
Cohort PNC in first trimester
Adequate/ Intermed. PNC
Placentalabruption
Anemia Hypertension Anycomplication
Diabetes
Treatment group #1 (less than high school, married) - Black
0.95(-1 .02)
0.94(-1 .00)
1.17(0.84)
0.89(-1 .11)
0.84(-1.56)
0.87*(-1.84)
1.04(0.36)
Treatment group #2 (less than high school, single) - Black
1 17***
(4.35)1 i 5***
(3.41)N/A 0.89
(-1.30)0.92
(-0.85)0.90
(-1.44)0.90
(-1.16)
Treatment group #3 (high school completed, single) - Black
2 24***
(3.80)1.16***(3.65)
0.95(-0.65)
0.94(-0.93)
0.90*(-1.78)
0.93(-1.39)
0.95(-0.79)
Treatment group #4 (some college, single) - Black
2 23**
(2.58)1.16***(2.72)
0.93(-0.65)
0.96(-0.43)
0.90(-1.29)
0.94(-0.99)
0.93(-0.94)
Control group (college completed, married) - Black
1.02(0.28)
1.06(0.48)
0.87(-0.79)
1.07(0.65)
0.95(-0.73)
0.98(-0.24)
0.98(-0.24)
Treatment group #1 (less than high school, married) - White
0.99(-0 .21)
0.97(-0.49)
1.00(0.06)
0.90(-1.49)
0.83***(-4.20)
0 .8 8 ***(-3.83)
0.97(-0.70)
Treatment group #2 (less than high school, single) - White
1 13***
(3.01)1.15***(2.77)
0.94(-0.64)
0.89(-1.45)
0 .8 8 **(-2 .12)
0.89**(-2.43)
1.07(1 .02)
Treatment group #3 (high school completed, single) - White
1 IQ***
(3.15)2 24***
(3.25)1.03
(0.50)0.93
(-1.03)0.93*(-1.90)
0.95(-1.47)
1.20***(3.89)
Treatment group #4 (some college, single) - White
1 22*** (3.15)
1 U * *
(2.04)1.02
(0.16)0.94
(-0 .6 6 )0.96
(-0.73)0.96
(-0.78)1.15**(2.06)
Control group (college completed, married) - White
1.01(0.31)
0 .8 6 *(-1.80)
1.00(-0 .0 0 )
1.10(0.94)
1.00(0.13)
1.03(0.96)
1.08*(1.69)
*, **, and *** denote statistical significance at the 90%, 95%, and 99% confidence levels, respectively. Standard errors have been adjusted for clustering at the state/year level. T-statistics are given in parentheses.

2. THE EFFECTS OF UNEMPLOYMENT ON CHILDBEARING
47
Reproduced with permission of the copyright owner. Further reproduction prohibited without permission.

48
2.1. Background
Are recessions good for your health? At the end of the 20th century, the simple
answer for an average American seems to be: Yes (Ruhm 2000). But what about the
traditionally vulnerable groups? In this paper, my goal is to contribute to our
understanding of the relationship between economic fluctuations and health by asking a
more targeted question: Are recessions good for your pregnancy? Focusing on prenatal
care utilization, infant and maternal health, I find the answer to be: Yes, overall, but... In
particular, analyzing the US Natality Detail Files data for the 1990’s aggregated by
county, year, and race, I conclude that at least some of the overall apparent benefits of
unemployment may be attributable to the Medicaid ‘safety net’.
The relationship between macro-level unemployment fluctuations and health has
recently received increased attention in the economics literature. Ruhm (2000, 2003)
finds that the general health status - as measured either by cause-specific mortality rates
(including infant and neonatal mortality) or by more subtle measures (such as activity
limitations and the use of medical care) - improves during temporary economic
downturns. Ruhm (2000, 2005) observes that health-related behavior improves during
recessions. The author explains his findings by the cyclical fluctuations in non-market
time and the related time costs of health-producing activities.
Recently, Dehejia and Lleras-Muney (2004) report reduced incidence of low birth
weight and very low birth weight and lower neonatal and post-neonatal mortality rates in
times of higher unemployment. In the same paper, they also find a positive impact of
unemployment on prenatal care use. In line with Ruhm’s reasoning (Ruhm 2000, 2003,
2005), a possible explanation for this phenomenon is that in times of higher
Reproduced with permission of the copyright owner. Further reproduction prohibited without permission.

49
unemployment women face looser time constraints, which increases their ability to obtain
appropriate prenatal care. In the case of behaviors and health outcomes related to
pregnancy, however, the observed aggregate effects of unemployment may also mask
compositional changes. Specifically, as stressed in Dehejia and Lleras-Muney (2004),
selection through fertility decisions may play an important role. If, for example, only the
most affluent women decide to conceive during temporary economic downturns, the
average prenatal care utilization and health outcomes will likely improve.
Importantly, another reason why women in depressed labor markets may get more
appropriate medical care is that unemployment makes many of them eligible for
Medicaid. For women in low-skilled jobs (which often do not offer employer-sponsored
health insurance coverage), eligibility for Medicaid can significantly improve access to
prenatal care. While the effects of increased Medicaid eligibility on prenatal care
utilization and health outcomes have been studied, the interplay of unemployment and
Medicaid in the production of health has not systematically been investigated. Therefore,
in the current paper, my goal is to study how the interaction between unemployment
changes and Medicaid eligibility affects childbearing.
I use the Natality Detail Files data for years 1989-1999 aggregated to
county/year/race cells and estimate the effects of unemployment - overall, direct
(‘unemployment per se’), and indirect (through increased Medicaid eligibility) - on
prenatal care utilization and health outcomes. By conducting the analysis at the county
level rather than by state (as previous research has done), I am able to construct better
proxies for the actual economic conditions facing pregnant women. Since unemployment
varies greatly within states and local labor market conditions are important for Medicaid
Reproduced with permission of the copyright owner. Further reproduction prohibited without permission.

50
eligibility (to be discussed shortly), a county-level analysis seems superior. In some of
my sensitivity analyses, however, I use state-level cells and unemployment rates for
comparison purposes.
As in Dehejia and Lleras-Muney (2004), I employ several measures of prenatal
care use and infant health. In addition, I study the effects of unemployment on a key but
overlooked outcome — maternal complications of pregnancy and delivery. My
econometric analysis indicates that, overall, higher unemployment at the county level is
associated with improved infant outcomes especially among whites. Among blacks,
unemployment increases prenatal care utilization (and potentially improves maternal
health). In some cases, both unemployment per se and unemployment interacted with
Medicaid eligibility seem to contribute to the beneficial effects. In others, the Medicaid
‘safety net’ acts to mitigate, completely offset, or outweigh detrimental effects of
unemployment.
2.2. Framework
Changes in unemployment lead to changes in resources available to women of
reproductive age. This, in turn, has consequences for selection into pregnancy as well as
for behavior and health while pregnant. Figure 1 lays out these two paths (columns) and
the various ways these two paths may be affected by unemployment.
First, as unemployment increases, the average wage income and fringe benefits
(such as private health insurance) decrease. According to the standard economic theory
of fertility (Becker 1960), this will lead to a reduction in birth rates (upper left cell of
Figure 1). In perfect markets, the negative income effect will only demonstrate itself in
Reproduced with permission of the copyright owner. Further reproduction prohibited without permission.

51
the presence of long-run unemployment changes (because permanent rather than
transitory income determines fertility). As Dehejia and Lleras-Muney (2004) argue,
however, the existence of credit constraints may lead to significant fertility reactions even
in the short run. Further, in response to the negative income shock, prenatal care
utilization (a normal good) will fall among those pregnant (upper right cell of Figure 1).
The impacts on health outcomes will depend on the relative magnitudes of the income
effects for healthy versus unhealthy behaviors (Ruhm 2000, Dehejia and Lleras-Muney
2004). Ruhm (2005) estimates that the pure income effect of unemployment on health-
related behavior is weak and Ruhm (2003) associates the negative income shock with an
increase in medical problems and activity limitations.
Second, higher unemployment leads to more leisure (or non-work) time. As the
opportunity costs fall, the demand for children (and thus fertility) will increase (Becker
1965; middle left cell of Figure 1). As Dehejia and Lleras-Muney (2004) point out, the
substitution effect - moving from labor market to childbearing - will be especially strong
among women whose human capital depreciates slowly. For women who have decided
to become pregnant, the demand for time-intensive activities (such as regular prenatal
care visits and exercise) will increase (Becker 1965, Ruhm 2000; middle right cell of
Figure 1). In an empirical analysis, Ruhm (2005) finds support for this hypothesis and
associates the non-market time available during times of higher unemployment with
improvements in health-related behavior. Once again, however, the effects on health
(conditional on becoming pregnant) will theoretically be ambiguous.
I contribute to this conceptual framework by adding a third row to Figure 1 — the
possible role that Medicaid plays in enforcing or mitigating the effects of unemployment.
Reproduced with permission of the copyright owner. Further reproduction prohibited without permission.

52
Theoretically, the effect of unemployment on Medicaid enrollment is ambiguous. On the
one hand, lower incomes in times of higher unemployment will qualify additional women
for the receipt of Medicaid. On the other, higher unemployment may lead to fiscal
pressures and budget cuts (Cawley and Simon 2005). In empirical studies, Holahan and
Garrett (2001) calculate that a 1 percentage point increase in unemployment will lead to
an increase in Medicaid enrollment by 1.5 million13 and Cawley and Simon (2005) also
find Medicaid enrollment to be counter-cyclical. These two studies reveal the potential
for a Medicaid ‘safety net’ effect.
Changes in Medicaid eligibility may affect both selection into pregnancy and
circumstances during pregnancy (conditional on becoming pregnant). In a recent study,
Bitler and Zavodny (2004) show that the effects of Medicaid on fertility are theoretically
ambiguous since Medicaid gives pro-natalist incentives by lowering the costs of prenatal
and infant medical care but also potentially anti-natalist incentives by funding abortions
in some states (lower left cell of Figure 1). In an empirical analysis, the authors find the
pro-natalist effects to dominate (especially among low-educated, single, and white
women). In theory, higher Medicaid eligibility should also lead to increased prenatal
care utilization and improved health conditional on being pregnant (lower right cell of
Figure 1). Empirical studies generally find supportive evidence for these hypotheses
(see, for example, Currie and Grogger (2002) for evidence on prenatal care use and infant
health and Kutinova and Conway (2005) for evidence on prenatal care use and maternal
health).
13 This number includes non-disabled adults, children, and the disabled.
Reproduced with permission of the copyright owner. Further reproduction prohibited without permission.

53
Given all of these effects of unemployment on fertility, prenatal care use, and
health, the overall impact cannot easily be determined. Moreover, previous studies
suggest that the effects will likely differ by women’s characteristics such as race, marital
status, and education (Bitler and Zavodny 2004, Dehejia and Lleras-Muney 2004). The
evidence to date suggests that, in times of higher unemployment, fertility decreases
especially among single blacks (Dehejia and Lleras-Muney 2004) and among low-
educated women (Bitler and Zavodny 2004). Prenatal care use increases in aggregate
data (Dehejia and Lleras-Muney 2004) and general health-related behaviors improve in
both aggregate and individual-level data (Ruhm 2000, 2005). Finally, infant health
improves with unemployment in aggregate data (Dehejia and Lleras-Muney 2004),
overall health (including infant health) improves in aggregate data (Ruhm 2000), and
medical problems and activity limitations decrease with unemployment in individual-
level data (Ruhm 2003). So far, no systematic study explicitly investigating the interplay
of unemployment and Medicaid, focusing on local labor markets, and considering a
broader range of outcomes (including a key outcome of pregnancy — maternal health) has
been conducted. The primary goal of this paper is to fill this gap.
2.3. Data and Methods
2.3.1. Data
The main source of data are the Natality Detail Files for years 1989-1999 (US
Dept, of Health and Human Services 1991-2000). Since 1985, the files have included
information on all US births and so have contained more than 3 million observations
Reproduced with permission of the copyright owner. Further reproduction prohibited without permission.

54
annually. Traditionally, infant health measures (such as birth weight and the Apgar
score) and various maternal characteristics (such as age, marital status, race, ethnic
origin, education, and place of residence) have been reported. In addition, since 1989,
variables describing maternal morbidity during pregnancy and delivery have also been
included.14
In this study, foreign residents are excluded from the analysis. Further, women
from Louisiana and Nebraska in the year 1989, Oklahoma in years 1989-1990, and New
York in years 1989-1991 are excluded due to missing information on maternal health.
Mothers from Washington State in years 1989-1991 are excluded due to missing
information on marital status and those from New Hampshire in years 1989-1992 due to
missing information on ethnicity. Only non-Hispanic black and white women are
included in the analysis (as in Currie and Grogger 2002 and Kutinova and Conway 2005).
Also, the sample is restricted to women between 19 and 50 years of age who had a
singleton birth and resided in a county with population of at least 100,000 people (FIPS
codes for smaller counties are not available in the natality files making it impossible to
match county-level unemployment rates to these observations).
In the main model specification, the Natality Detail Files data are aggregated to
county/year/race cells and are merged with county-level annual unemployment rates from
the 2002 Area Resource File. Six-month lags of unemployment are used in order to
14 Sixteen “medical risk factors” (anemia, cardiac disease, lung disease, diabetes, genital herpes, hydramnios/oligohydramnios, hemoglobinopathy, hypertension chronic and pregnancy-associated, eclampsia, incompetent cervix, previous infant 4000+ grams, previous preterm or small-for-gestational age infant, renal disease, Rh sensitization, and uterine bleeding) and fifteen “complications o f labor and/or delivery” (febrile, meconium, premature rupture o f membrane, abruption placenta, placenta previa, other excessive bleeding, seizures during labor, precipitous labor, prolonged labor, dysfunctional labor, breech/malpresentation, cephalopelvic disproportion, cord prolapse, anesthetic complication, and fetal distress) are separately identified in the natality files.
Reproduced with permission of the copyright owner. Further reproduction prohibited without permission.

55
allow the economic conditions to impact women at a crucial stage of their pregnancies
rather than just before delivery.15 In my data, there is substantial variation in
unemployment within states which would not be captured by simple across-state
comparisons (Figure 2). In particular, the standard deviation of the state-level
unemployment rates is 1.23 and the average standard deviation of county-level
unemployment rates within state is 1.48. In this case, the state unemployment rates mask
significant county-level differences. Performing the analysis on the county level rather
than by state therefore allows me to construct more precise proxies for the actual
economic conditions facing pregnant women. And, as Baughman (2005) shows, local
labor market conditions play an important role in determining Medicaid coverage.
To mitigate the problem of influential observations in very small samples, cells
with less than 100 pregnancies are excluded from the estimations.16 The omission of
small counties is common in infant health studies (Corman and Grossman 1985, Corman
et al. 1987). The above restrictions leave me with 3,426 county/year observations in the
black cohort and 5,125 observations in the white cohort.17
15 Since annual unemployment rates are used, all deliveries in the last 6 months o f ‘year 1 ’ or in the first 6 months o f ‘year 2 ’ are assigned unemployment rates for ‘year 1 ’. The same algorithm is later employed to assign Medicaid eligibility rules. In principle, different lags should be used to study selection into pregnancy and behavior conditional on becoming pregnant. The use o f annual unemployment rates and Medicaid eligibility rules, however, makes a precise distinction impossible.
16 Because o f the large within-state variation in unemployment and the importance o f local labor markets for the effectiveness o f government policies, a county-level analysis has many advantages over a state-level analysis. Admittedly, however, there are drawbacks to this approach as well. Most importantly, by excluding small counties, rural areas may be left out from the analysis. As descriptive statistics suggest, women included in my baseline sample have slightly higher utilization o f prenatal care and better infant and maternal health outcomes than the state-level average (Tables 1 and 3). As a sensitivity check, I have therefore reestimated the models in this paper using state/year/race cells. The results remain qualitatively the same (see ‘State-Level Analyses’ below).
Reproduced with permission of the copyright owner. Further reproduction prohibited without permission.

56
First, I estimate the effects of the unemployment rate on prenatal care utilization.
Two measures of prenatal care use are employed: the percentage of women receiving
prenatal care in the first trimester of pregnancy and the percentage of women with
‘adequate’ or ‘intermediate’ prenatal care (on the Kessner adequacy scale). Next, I turn
to two measures of infant health: the incidences of low birth weight (birth weight
between 1,500 and 2,500 grams) and very low birth weight (birth weight below 1,500
grams). Finally, I explore four measures of maternal health: the incidences of placental
abruption18, anemia19, pregnancy-associated hypertension20, and ‘any maternal
complication’ (i.e., any of the above) in pregnant women. As Flaas et al. (1993) note in
their study of maternal complications in the US: “Although only 10 per 100,000 women
die from a complication of pregnancy or childbirth, 60% of women receive medical care
for some complication of pregnancy, and 30% suffer complications that result in serious
morbidity.” (p.61) Therefore, adding maternal health measures to infant health measures
in a study of pregnancy outcomes seems highly relevant. Placental abruption, anemia,
and pregnancy-related hypertension have all been identified in the medical and public
health literatures as important causes of maternal morbidity that are sensitive to
interventions during the prenatal period (Laditka et al. 2005, Bashiri et al. 2003,
17 In order to verify that potential racial differences in my results are not driven primarily by different sample sizes, I have also estimated all the models for white women including only counties used in the estimations for blacks. The results remained qualitatively the same.
18 “Premature separation o f a normally implanted placenta from the uterus.” (CDC)
19 “Hemoglobin level o f less than 10.0 g/dL during pregnancy or a hematocrit o f less than 30 percent during pregnancy.” (CDC)
20 “An increase o f blood pressure o f at least 30mm Hg systolic or 15mm Hg diastolic on two measurements taken 6 hours apart after the 20th week o f gestation.” (CDC)
Reproduced with permission of the copyright owner. Further reproduction prohibited without permission.

57
Makrides et al. 2003, Villar et al. 2003, Scholl et al. 1994, Haas et al. 1993, Sachs et al.
1988). As such, these morbidities are among those most likely to be affected by the
economic environment women face.
2.3.2. Empirical Strategy
Following earlier studies on the effects of unemployment changes on health-
related behavior and health, I first estimate prenatal care use, infant and maternal health
models in the following general form:
Yijt = Po + Pi*unem ploym ent rateJt + p2*J + P 3 * T + £ijt,
where y is a measure of prenatal care use, infant or maternal health, i indexes race
cohorts, j counties, and t years. J and T denote vectors of county and year dummies,
respectively. In the above equation, pi measures the overall effects of unemployment on
the outcomes of interest. In order to capture the overall (i.e., reduced form) effects of
unemployment, cohort characteristics which change as ‘selection into pregnancy’
changes are not included on the right hand side.
Next, in order to investigate the interaction between unemployment and Medicaid
in their effects on childbearing, I turn to models in the following form:
yijt = Yo + Yi*unemploym ent rateJt + y2*M edicaid elig ib ilityst + y3*unem ploym ent ratej,*Medicaid
eligibility st + y4*J + y5*T + p,Jt,
where i indexes race cohorts, j counties, s states, t years, and y, J, and T are defined
as above. Medicaid eligibility is measured as the income cutoff (as a percent of the
Reproduced with permission of the copyright owner. Further reproduction prohibited without permission.

58
federal poverty line) below which pregnant women qualified for Medicaid in a given
state and year. This data comes from Hill (1992) and the National Governors’
Association (2003) and six-month lags are used. In the interacted models, yi measures
the effects of ‘unemployment per se’ and 73 the effects of the unemployment and
Medicaid eligibility interaction. As discussed above, the signs of these coefficients are
theoretically ambiguous but it seems reasonable to assume that both ‘unemployment per
se’ (yi) and the Medicaid ‘safety net’ (73) will have a significant and independent impact
on the outcomes of interest.
All models in this paper are estimated with OLS and robust standard errors
correcting for heteroskedasticity and clustering at the county level are calculated.21
Observations are weighted by the number of individuals in each county/year/race cell.
2.4. Results
2.4.1. Descriptive Statistics
Following Dehejia and Lleras-Muney (2004), I first estimate all models stratified
by mother’s race. As has previously been demonstrated, black and white women have
different fertility and pregnancy-related behavior and there are also large ‘unexplained’
racial disparities in infant and maternal health (e.g., Dubay et al. 2001, Currie and
Grogger 2002, Kutinova and Conway 2005, Conway and Kutinova 2005). Therefore, it
21 As a sensitivity check, all models have also been estimated with tobit (to account for the fact that the values o f prenatal care and infant health measures are bounded between 0 and 100 and those o f maternal health measures between 0 and 1,000; i.e. the variables are censored). The coefficients o f interest are robust to the choice o f the estimation method. As suggested in Bertrand et al. (2004), clustering at the county level has been performed in order to account for a possible serial correlation within counties.
Reproduced with permission of the copyright owner. Further reproduction prohibited without permission.

59
seems important to let the effects of unemployment (and Medicaid eligibility) differ by
race.
The racial disparities documented elsewhere can also be observed in my data
(Table 1). In particular, black mothers are less likely than white mothers to obtain
prenatal care in the first trimester and to receive ‘adequate’ or ‘intermediate’ care. The
incidence of low birth weight among black infants is more than twice that among white
infants (9.06% vs. 3.73%, p<0.01). The racial gap in the incidence of very-low birth
weight is even bigger (2.64% vs. 0.72%, p<0.01). Turning to maternal health, black
women again have poorer outcomes than whites. In particular, 6.64% of black women
and 4.90% of white women suffer from at least one of the morbidities studied (p<0.01)
and the racial gap is the largest for the incidence of anemia (3.19% vs. 1.43%, p<0.01).
Some of these differences may be attributable to the fact that black women are, on
average, younger, less educated, and less likely to be married than whites (Table 1).
As to the economic environment facing the two groups of women, it can be seen
that black mothers live in states with slightly higher average unemployment rates (5.90
vs. 5.80, p<0.05; Table 1). The racial disparity in the average county-level
unemployment rate is even higher (5.92 vs. 5.34, p<0.01). The finding that the variation
in the economic conditions (proxied by the unemployment rate) across counties is larger
than the variation across states adds justification for the choice of the county-level
variable in the econometric analysis. Finally, the descriptive statistics demonstrate that
black and white women live in counties with similar per-capita income levels and
Medicaid eligibility rates.
Reproduced with permission of the copyright owner. Further reproduction prohibited without permission.

2.4.2. Baseline Results
60
In the baseline model similar to that in Dehejia and Lleras-Muney (2004), the
county-level unemployment rate is the sole determinant (along with county and year
dummies) of prenatal care use, infant and maternal health (upper panel of Table 2;
combined effects from all cells of Figure 1). In this specification, the reduced-form effect
of unemployment on prenatal care use is positive and statistically significant among
blacks and insignificant (negative when measured by prenatal care initiation in the first
trimester and positive when measured by ‘adequate/intermediate’ prenatal care) among
whites. While Dehejia and Llleras-Muney (2004) find positive effects for both races, a
negative (or zero) effect of unemployment among whites is consistent with their more
general finding of ‘negative selection’ among women in this cohort. As in Dehejia and
Llleras-Muney (2004), unemployment has a beneficial effect on infant health across the
races (statistically significant only among whites). An equally strong beneficial effect is
22not observed for maternal health.
Models that add Medicaid eligibility and an interaction between unemployment
and Medicaid eligibility to the unemployment rate on the right hand side (bottom panel of
Table 2) help disentangle some of the overall effects observed above. It seems that
unemployment per se (first and second rows of Figure 1) contributes to the higher
prenatal care use among blacks and that Medicaid (third row of Figure 1) strengthens this
effect (coefficients statistically insignificant). Among whites, on the other hand,
unemployment per se significantly decreases prenatal care use but Medicaid eligibility
22 Note that positive signs on prenatal care measures indicate an increased use o f prenatal care and negative signs on adverse infant and maternal health outcomes indicate improvements and infant and maternal health.
Reproduced with permission of the copyright owner. Further reproduction prohibited without permission.

partly offsets this effect. Using the estimated coefficients, I have calculated the threshold
level of Medicaid eligibility (MA), i.e., the level of Medicaid eligibility needed to
completely offset the detrimental effects of unemployment on the outcomes of interest.
Note that when MA is low, the overall effects of unemployment in the simple models
(with unemployment as the sole explanatory variable) are driven by the
unemployment*Medicaid eligibility interaction. When MA is high, the effects of
unemployment per se dominate. Similarly, UA is used to indicate the level of
unemployment at which the effects of Medicaid on prenatal care use (and health
outcomes) switch from those driven by Medicaid per se to those driven by the
unemployment*Medicaid interaction. As can be seen (Table 2), the noninteracted
Medicaid variable sometimes has the counter-intuitive sign (decreasing prenatal care use)
while the unemployment*Medicaid interaction acts in the expected direction.
Fortunately, the level of UA is mostly very low (reaching ‘out-of-sample’ values),
indicating that the effects of Medicaid per se are not relevant for the range of
unemployment rates actually observed.
Turning to infant health, Medicaid seems to be playing a role in the reduction of
low birth weight among both races (significant for whites; bottom panel of Table 2).
Similarly, Medicaid in times of higher unemployment has a weak beneficial effect on
maternal health. While mostly insignificant, the coefficients on the
unemployment*Medicaid eligibility variable are consistently negative. Furthermore,
among white women, the Medicaid ‘safety net’ significantly reduces the incidence of
placental abruption (bottom panel of Table 2).
Reproduced with permission of the copyright owner. Further reproduction prohibited without permission.

62
Thus, overall, the uninteracted results suggest that black women experience
increases in prenatal care use (and potentially small improvements in health outcomes)
when unemployment temporarily increases. As the interacted results show, Medicaid
may be playing a beneficial role. The statistical significance of these results is weak,
however. Among whites, infant health improves and prenatal care utilization and
maternal health do not change significantly when unemployment (overall) increases.
While these aggregate findings may seem puzzling, the interacted models shed more light
on the mechanisms behind the observed reduced-form results. In particular, as expected,
Medicaid eligibility in times of higher unemployment has a beneficial impact on all three
sets of outcomes - increasing prenatal care utilization and improving infant and maternal
health. Since unemployment per se mostly worsens outcomes, the resulting reduced-
form impacts of unemployment reflect the relative magnitudes of the counteracting
effects.
There are several reasons why the effects of unemployment per se may differ
across the races (as well as across the outcomes studied). As mentioned above,
unemployment induces income and substitution effects which influence ‘selection into
pregnancy’ as well as women’s behavior while pregnant (first and second rows of Figure
1). And, it seems likely that the relative sizes of the substitution and income effects as
well as their impacts on selection and behavior will differ. For example, Dehejia and
Lleras-Muney (2004) argue that the income effect is relatively stronger among black
women who tend to be more credit constrained and that this effect demonstrates itself in a
strong positive selection among blacks. Infant health improvements among whites, on
the other hand, seem to be attributable to healthier behavior of white women during
Reproduced with permission of the copyright owner. Further reproduction prohibited without permission.

63
pregnancy and these behavioral changes, in turn, are likely a consequence of significant
substitution effects (Dehejia and Lleras-Muney 2004). No matter what the impacts of
unemployment per se, however, the effects of the Medicaid ‘safety net’ (third row of
Figure 1) seem to be — at least weakly — beneficial for both racial cohorts and across all
sets of outcomes studied.
2.4.3. State-Level Analyses
As discussed above, a county-level analysis is superior in many respects to a
state-level analysis. There are, however, limitations to using counties as well. Most
importantly, the Natality Detail Files do not report geographic codes for counties with
population of less than 100,000. In addition, to mitigate the problem of influential
observations in very small samples, I have excluded county/year/race cells with less than
100 births from the estimations. Thus, my analysis omits the most sparsely populated
(rural) areas. To investigate the possibility of a bias, I have reestimated the baseline
models using state/year/race cells. This comparison is also useful in judging the potential
limitations of using state level unemployment rates, as previous studies have done.
As descriptive statistics suggest, women included in my baseline sample have
slightly higher utilization of prenatal care and better infant and maternal health outcomes
than the state-level average (Tables 1 and 3). They are also more likely to be older,
highly educated and married. To test the sensitivity of my results to the level of
aggregation, I therefore consider two alternatives to the baseline county-level models: 1.
a county-level analysis with state unemployment rates (Table 4) and 2. a state-level
analysis with state unemployment rates (Table 5).
Reproduced with permission of the copyright owner. Further reproduction prohibited without permission.

64
In the reduced form models with unemployment as the sole explanatory variable
of interest, both state-level analyses confirm the county-level results (upper panels of
Tables 2, 4, and 5). In particular, in all three specifications, unemployment significantly
increases prenatal care use among black mothers and improves infant health among
whites. Thus, the main findings are robust to the level of aggregation. This result also
suggests that using state unemployment rates (as previous research has done) may be a
reasonable practice.
The unit of analysis and the unemployment measure seem more important in the
models that add Medicaid eligibility and the unemployment*Medicaid interaction on the
right hand side (lower panels of Tables 2, 4, and 5). This is an appealing finding since
the benefits of using county-level data should be the largest in models which already have
a state-level variable - Medicaid eligibility - on the right hand side. It is noteworthy,
however, that the differences in results across the three model specifications are again not
large. In particular, among black women, the interacted results do not reach statistical
significance in any of the model specifications but the coefficients mostly have the same
sign. Among white women, unemployment per se decreases prenatal care use and the
Medicaid ‘safety net’ increases it across all three specifications. Not surprisingly, the
results are most significant when county-level cells are used (lower panels of Tables 2
and 4). In fact, the Medicaid ‘safety net’ is associated with significant benefits to infant
and maternal health only when county-level cells are used (lower panels of Tables 2 and
4) and the results are most consistent across outcomes studied when county-level
unemployment is also employed (lower panel of Tables 2).
Reproduced with permission of the copyright owner. Further reproduction prohibited without permission.

65
Overall, the above sensitivity checks suggest that using county-level data is more
important in the interacted models than in the simplest reduced form but, in both cases,
the main findings seem reasonably robust to the level of aggregation.
2.4.4. Stratification by Socioeconomic Status
As previous research suggests, individuals with low socioeconomic status are the
most vulnerable to the cyclical unemployment changes. For example, Hines et al. (2001)
conduct a systematic review of the literature and corroborate the finding that “[...] labor
market outcomes are procyclical, with greater sensitivity among lower skilled groups.”
(p.5) Furthermore, since Medicaid is designed as a program for credit constrained
populations, the ‘safety net’ should play the largest role among economically
disadvantaged women. In order to test this hypothesis, I stratify the baseline sample by
two measures of socioeconomic status: marriage and education.
2.4.4.I. Marital Status
Within both racial cohorts, there are large differences in the outcomes and
characteristics of married and single women (Table 6). For example, among blacks,
64.36% of single women and 81.72% of married women receive prenatal care in the first
trimester (p<0.01). Among whites, the corresponding figures are 72.72% and 91.31%
(p<0.01). As to infant and maternal health, single women are, on average, more likely to
deliver a low birth weight infant (10.28% vs. 6.94% among blacks and 6.00% vs. 3.29%
among whites, p<0 .01) and to suffer from at least one of the maternal morbidities studied
(6.71% vs. 6.40% among blacks and 5.55% vs. 4.77% among whites, p<0.01). Of
course, many of these disparities are probably partly driven by differences in socio
Reproduced with permission of the copyright owner. Further reproduction prohibited without permission.

66
economic status. Single women of both races are younger and less educated, on average.
Differences in the macroeconomic conditions facing the different cohorts of mothers are
remarkable as well. Most interestingly, the county-level unemployment rate (much more
than the state-level measure) varies substantially with single pregnant women of both
races facing higher unemployment than their married counterparts (Table 6).
When the samples are stratified by marital status, single women of both races
seem to be more strongly affected by unemployment changes than married women (upper
panel of Table 7). Namely, unemployment significantly increases prenatal care
utilization among single black women and decreases it among single whites; infant health
improves with unemployment among both single blacks and single whites; and, there is
some evidence suggesting that maternal health improves with unemployment among
single blacks. Married women are only weakly affected.
The models which explicitly take the interaction between unemployment and
Medicaid eligibility into account yield additional interesting insights (bottom panel of
Table 7). Among blacks (both single and married), the results generally do not reach
statistical significance. There is one exception, however: Medicaid in times of higher
unemployment significantly increases ‘adequate/intermediate’ prenatal care use among
married blacks. The results for single whites are very informative. In this cohort,
unemployment per se decreases prenatal care use and potentially leads to a deterioration
of infant and maternal health. In all these cases, however, the unemployment* Medicaid
eligibility interaction acts to (partially) offset unemployment’s detrimental effects. The
Medicaid ‘safety net’ therefore seems particularly operative in this group of women.
Reproduced with permission of the copyright owner. Further reproduction prohibited without permission.

67
Among married whites, prenatal care use again decreases with unemployment per se and
increases with Medicaid but the results for infant and maternal health are more mixed.
2.4.4.2. Education
Among both black and white women, education is a significant correlate of
prenatal care use and infant and maternal health (Table 8). For example, among blacks,
56.58% of women with ‘less than 12 years’ of education, 71.82% of women with ’12 to
15 years’ of education, and 88.40% of women with ’16 or more years’ of education
initiate prenatal care in the first trimester (p<0.01). The corresponding numbers are
69.18%, 87.31%, and 95.33% among whites (p<0.01). Less educated women of both
races also deliver more low birth weight and very-low birth weight infants and have
higher incidences of placental abruption and anemia. Pregnancy-associated hypertension,
on the other hand, does not seem to fall monotonically with education. As expected, less
educated black and white mothers are younger and less likely to be married. Notably, the
county-level unemployment rate (more than the state-level variable) facing pregnant
women consistently decreases with education. The county-level per-capita income
increases.
In the models stratified by education, the prenatal care increases in times of higher
unemployment previously observed among black women occur only among those with
‘less than 12 years’ or ‘12 to 15 years’ of schooling (upper panel of Table 9). Among
highly-educated blacks (‘16 or more years’ of education) and among whites of all
education levels, the unemployment rate is associated with prenatal care decreases or
with no significant change. With respect to infant health, there is some evidence of
general improvements in times of higher unemployment across all racial and education
Reproduced with permission of the copyright owner. Further reproduction prohibited without permission.

68
cohorts (with the exception of highly-educated blacks). White women with ‘12 to 15
years’ or ‘16 or more years’ of education seem most strongly affected. The effects of
unemployment on maternal health exhibit no clear pattern. (If anything, blacks with ‘12
to 15 years’ and whites with ‘less than 12 years’ of education seem to benefit and more
educated whites seem to be hurt.)
Once again, the interacted models with unemployment and Medicaid eligibility
reveal additional interesting relationships (bottom panel of Table 9). Among blacks with
‘less than 12 years’ and ’12 to 15 years’ of education, both unemployment per se and
unemployment interacted with Medicaid eligibility potentially increase prenatal care use.
Among highly-educated blacks (‘16 or more years’ of education; coefficients
insignificant) and among whites of all education levels (significant effects), prenatal care
decreases with unemployment per se but Medicaid has a protective effect.
The results for infant health are suggestive. Namely, unemployment per se seems
deleterious and unemployment*Medicaid eligibility beneficial among black women with
’12 to 15 years’ of education and among whites with ‘less than 12 years’ of schooling.
Women from these groups are likely the most vulnerable to the cyclical unemployment
changes but they are also those most likely to be enrolled in Medicaid when the economy
temporarily deteriorates. Similarly, unemployment per se increases maternal
complications and unemployment*Medicaid eligibility decreases them among black
women with ‘less than 12 years’ of education and among whites with ‘less than 12 years’
or ’12 to 15 years’ of schooling. The results for other cohorts are mixed. Overall, the
above findings are consistent with the hypothesis that unemployment per se may be
Reproduced with permission of the copyright owner. Further reproduction prohibited without permission.

69
harmful for women with low socioeconomic status and that Medicaid eligibility acts to
mitigate the unemployment’s detrimental effects.
2.4.5. The Effects of Unemployment on Cohort Characteristics
As discussed above, the effects of unemployment (and Medicaid) on aggregate-
level behaviors and health outcomes may arise both from differential changes in fertility
across different groups of women (first column of Figure 1) and from changes in
behaviors and outcomes conditional on becoming pregnant (second column of Figure 1).
In order to investigate how much of the effects of unemployment observed in this paper
are due to ‘selection into pregnancy’, I regress the county/year-specific mean
characteristics of the two racial cohorts on the same set of explanatory variables
employed above (Table 10).
The reduced-form effects of unemployment on maternal characteristics are highly
significant (upper panel of Table 10; combined effects from the first column of Figure 1).
In particular, in times of higher unemployment, the percentages of married and older
women significantly increase among both blacks and whites. This finding is intuitively
appealing because married and older women are less likely to be credit constrained (and
thus subjected to a large negative income shock caused by unemployment) than single
and young mothers.
The interacted results add further insights (bottom panel of Table 10).
Specifically, among blacks, unemployment per se (upper and middle left cells of Figure
1) increases the percentage of mothers with ‘16 or more years’ of education as well as the
percentages of older mothers. Interestingly, the unemployment*Medicaid interaction
Reproduced with permission of the copyright owner. Further reproduction prohibited without permission.

(lower left cell of Figure 1) acts in the opposite direction, significantly decreasing the
percentages of more educated and older blacks. Similarly, among whites, unemployment
per se has a significant positive effect on both maternal education (as measured by the
percentage with ’16 or more years’ of schooling) and age. In addition, the percentage of
married white women increases when the economy temporarily deteriorates. In all these
cases, Medicaid acts to partially offset the unemployment’s effects; i.e., it significantly
decreases maternal education, age, and the percentage of married moms. These findings
are consistent with the hypothesis that unemployment per se leads to a ‘positive selection
into pregnancy’ (only more affluent women becoming pregnant) and that the Medicaid
‘safety net’ mitigates this effect by financially supporting less affluent women.
There are, however, seemingly puzzling patterns in the interacted results as well.
First, while unemployment per se significantly increases (and Medicaid decreases) the
percentage of white mothers with ’16 or more years’ of schooling, the effect of
unemployment (unemployment*Medicaid) on the percentage of white women with ‘less
than 12 years’ of education is positive (negative) and significant as well. Notably,
however, the statistical significance of the latter effect is lower. Also, the results appear
less counter-intuitive when keeping in mind that the percentages of mothers with ‘less
than 12 years’, ‘12 to 15 years’, and ‘at least 16 years’ of education have to sum up to
100%. Viewed from this perspective, my results suggest that unemployment decreases
(and Medicaid increases) the percentage of mothers with ’12 to 15 years’ of schooling -
an economically vulnerable group subject to large business cycle fluctuation in
employment and health insurance coverage.
Reproduced with permission of the copyright owner. Further reproduction prohibited without permission.

71
Another puzzling finding is that ‘Medicaid per se’ significantly increases the
percentages of married, older, and most educated whites. Since the threshold levels of
unemployment (UA) at which the effects of Medicaid switch sign are relatively high
(above the national average), these effects may be ‘truly operative’ for at least some of
the counties in my sample. In these cases, Medicaid eligibility expansions far beyond the
poverty line may be causing ‘positive selection’ among whites. Overall, however, my
results strongly suggest that unemployment per se increases - and the Medicaid ‘safety
net’ decreases - maternal education, age, and the percentage of married moms.
2.5. Conclusion
The goal of this paper is to contribute to our understanding of the effects of
unemployment on health-related behaviors and health by studying the specific impacts of
unemployment on pregnant women. Explicitly recognizing that, in this population,
Medicaid eligibility in times of higher unemployment may serve as a ‘safety net’, I
investigate the interplay of unemployment and Medicaid in affecting prenatal care
utilization, infant and maternal health. These relationships have not systematically been
investigated in research to date. Also, by including an important overlooked pregnancy
outcome — maternal health — and by using a more refined measure of unemployment, I
add new value to previous work.
My empirical analysis of US data for the 1990’s indicates that, overall, higher
unemployment at the county level is associated with improved infant health especially
among whites and increased prenatal care utilization (and potentially improved maternal
health) among blacks. In some cases, both unemployment per se and unemployment
Reproduced with permission of the copyright owner. Further reproduction prohibited without permission.

interacted with Medicaid eligibility seem to be contributing to the beneficial effects. In
others, the Medicaid ‘safety net’ acts to mitigate, completely offset, or outweigh
detrimental effects of unemployment. Interestingly, at least some of these aggregate-
level effects are apparently due to changes in the selection of women into pregnancy.
Specifically, unemployment per se increases - and unemployment*Medicaid eligibility
decreases - the percentages of highly educated, older, and married mothers. These
results are consistent with the role of Medicaid as a ‘safety net’ for vulnerable, credit
constrained populations. In analyses stratified by marital status and education, Medicaid
plays the largest role among economically disadvantaged (single and less educated)
women. Thus, unemployment may be good for your pregnancy — provided Medicaid
steps in.
Reproduced with permission of the copyright owner. Further reproduction prohibited without permission.

73
Bibliography
Bashiri, A.; E. Burstein, E. Sheiner, and M. Mazor. 2003. “Anemia during Pregnancy and Treatment with Intravenous Iron: Review of the Literature,” European Journal o f Obstetrics, Gynecology, and reproductive Biology, 110:1, pp. 2-7.
Baughman, Reagan. 2005. “Expanding Public Health Insurance for Children: Do Local Economic Conditions Matter?,” Unpublished.
Becker, Gary. 1960. “An Economic Analysis of Fertility,” in Demographic and Economic Change in Developed Countries. National Bureau of Economic Research Series, Number 11. Princeton, NJ: Princeton University Press, 1960. pp. 209-231.
Becker, Gary. 1965. “A Theory of the Allocation of Time,” The Economic Journal, 75:299, pp. 493-517.
Bertrand, Marianne; Esther Duflo, and Sendhil Mullainathan. 2004. “How Much Should We Trust Differences-in-Differences Estimates?,” The Quarterly Journal o f Economics, 119:1, pp. 249-275.
Bitler, Marianne P. and Madeline Zavodny. 2004. “The Effect of Medicaid Eligibility Expansions on Fertility,” Unpublished.
Cawley, John and Kosali I. Simon. 2005. “Health Insurance Coverage and the Macroeconomy,” Journal o f Health Economics, 24:2, pp. 299-315.
Conway, Karen S. and Andrea Kutinova. 2005. “Maternal Health: Does Prenatal Care Make a Difference?,” Health Economics, Forthcoming.
Corman, Hope and Michael Grossman. 1985. “Determinants of Neonatal Mortality Rates in the U.S.: A Reduced Form Model,” Journal o f Health Economics, 4:3, pp. 213-236.
Corman, Hope; Theodore J. Joyce, and Michael Grossman. 1987. “Birth Outcome Production Function in the United States,” The Journal o f Human Resources, 22:3, pp. 339-360.
Reproduced with permission of the copyright owner. Further reproduction prohibited without permission.

74
Currie, Janet and Jeffrey Grogger. 2002. “Medicaid Expansions and Welfare Contractions: Offsetting Effects on Prenatal Care and Infant Health?,” Journal o f Health Economics, 21:2, pp. 313-335.
Dehejia, Rajeev and Adriana Lleras-Muney. 2004. “Booms, Busts, and Babies’ Health,” The Quarterly Journal o f Economics, 119:3, pp. 1091-1130.
Dubay, Lisa; Ted Joyce, Robert Kaestner, and Genevieve M. Kenney. 2001. “Changes in Prenatal Care Timing and Low Birth Weight by Race and Socioeconomic Status: Implications for the Medicaid Expansions for Pregnant Women,” Health Services Research, 36:2, pp. 373-398.
Haas, Jennifer S.; Steven Udvarhelyi, and Arnold M. Epstein. 1993. “The Effects of Health Coverage for Uninsured Pregnant Women on Maternal Health and the Use of Cesarean Section,” JAMA, 270:1, pp. 61-64.
Hill, Ian T. 1992. The Medicaid Expansions fo r Pregnant Women and Children: A State Program Characteristics Information Base. Washington, D.C.: Health Systems Research.
Hines, James R. Jr.; Hilary Hoynes, and Alan B. Krueger. 2001. “Another Look at Whether a Rising Tide Lifts All Boats,” NBER Working Paper No. 8412, National Bureau of Economic Research, Cambridge, Massachusetts.
Health Resources and Services Administration, Bureau of Health Professions. 2002. Area Resource File (ARF) System, (Fairfax, VA: Quality Resource Systems, Inc., 2002).
Holahan, John and Bowen Garrett. 2001. “Rising Unemployment and Medicaid,” Health Policy Online (http://www.urban.org/UploadedPDF/410306_HPOnline_l.pdf; Accessed 08/29/05).
Kutinova, Andrea and Karen S. Conway. 2005. “The Forgotten Beneficiary of the Medicaid Expansions,” Unpublished.
Laditka, Sarah B.; James N. Laditka, Melanie P. Mastanduno, Michele R. Lauria, and Tina C. Foster. 2005. “Potentially Avoidable Maternity Complications: An Indicator of
Reproduced with permission of the copyright owner. Further reproduction prohibited without permission.

75
Access to Prenatal and Primary Care during Pregnancy,” Women and Health, 41:3, pp. 1- 26.
Makrides, M.; C.A. Crowther, R.A. Gibson, R.S. Gibson, and C.M. Skeaff. 2003. “Efficacy and Tolerability of Low-dose Iron Supplements during Pregnancy: A Randomized Controlled Trial,” American Journal o f Clinical Nutrition, 78:1, pp.145-53.
National Governors’ Association. 2003. Maternal and Child Health (MCH) Updates, 1994-1999 Issues, (http://www.nga.org; Accesses 09/27/2003)
Ruhm, Christopher J. 2000. “Are Recessions Good for Your Health?,” The Quarterly Journal o f Economics, 115:2, pp. 617-650.
Ruhm, Christopher J. 2003. “Good Times Make You Sick,” Journal o f Health Economics, 22:4, pp. 637-658.
Ruhm, Christopher J. 2005. “Healthy Living in Hard Times,” Journal o f Health Economics, 24:2, pp. 341-363.
Sachs B.P.; D.A. Brown, S.G. Driscoll, E. Schulman, D. Acker, B.J. Ransil, and J.F. Jewett. 1988. “Hemorrhage, Infection, Toxicemia, and Cardiac Disease, 1954-85: Causes for their Declining Role in Maternal Mortality,” American Journal o f Public Health,78:6, pp. 671-5.
Scholl T.O.; M.L. Hediger, and D.H. Belsky. 1994. “Prenatal Care and Maternal Health during Adolescent Pregnancy: A Review and Meta-Analysis,” Journal o f Adolescent Health, 15:6, pp. 444-456.
US Department of Health and Human Services, National Center for Health Statistics. 1990-2000. Natality Detail File, 1989-1999. Hyattsville, MD: US Department of Health and Human Services, National Center for Health Statistics [producer], 1990-2000. Ann Arbor, MI: Inter-university Consortium for Political and Social Research [distributor], 2003.
Villar, J.; M. Merialdi, A.M. Gulmezoglu, E. Abalos, G. Carroli, R. Kulier, and M. de Onis. 2003. “Nutritional Interventions during Pregnancy for the Prevention or Treatment
Reproduced with permission of the copyright owner. Further reproduction prohibited without permission.

76
of Maternal Morbidity and Preterm Delivery: An Overview of Randomized Controlled Trials,” Journal o f Nutrition, 133:5 (Suppl 2), pp. 1606S-1625S.
Reproduced with permission of the copyright owner. Further reproduction prohibited without permission.

Reproduced with
permission
of the copyright owner.
Further reproduction prohibited
without permission.
77
Figure 1. The Effects of an Increase in Unemployment
Change in resources available to women of reproductive age
W age incom e/Fringe benefits (
Consequence for selection into pregnancy Consequences conditional on becoming pregnant
Theory: Fertility ) (Becker 1960, Dehejia and Lleras-Muney Theory: Prenatal care use I . H ealth ? (Ruhm 2000, Dehejia and2004) Lleras-Muney 2004)
Empirical: Effect on health-related behavior weak (Ruhm 2005), Medical problems and activity limitations f (Ruhm 2003)
Leisure (non-work) time f Theory: Fertility f (Becker 1965, Dehejia and Lleras-Muney Theory: Prenatal care use f (Becker 1965, Ruhm 2000), Health ?2004)
Theory: Medicaid access ? (Cawley and Simon 2005) Theory: Fertility ? (Bitler and Zavodny 2004) Empirical: Medicaid access t (Holahan and Garrett Empirical: Fertility ( (Bitler and Zavodny 2004) 2001, Cawley and Simon 2005)
Empirical: Health-related behavior j (Ruhm 2005)
Theory: Prenatal care use f, Health jEmpirical: Prenatal care use (, Health | (Currie and Grogger 2002, Kutinova and Conway 2005)
Fertility Individual-level prenatal care use/health
Aggregate-level prenatal care use/health

Reproduced with
permission
of the copyright owner.
Further reproduction prohibited
without permission.
78
Figure 2. Variation in County-Level Unemployment within and across States, 1991-1999
12
10
♦8
♦6
4♦
♦2
0
0
1 +-< c 0) ES'Q.E0cD
Arizona State
♦ Mean ♦ (Mean - SD) ♦ (Mean + SD)
‘M ean’ is the state unem ploym ent rate constructed as a w eighted average o f county unem ploym ent rates. ‘S D ’ is a w eighted standard deviation o f county unem ploym ent rates w ithin state.

79
Table 1. Characteristics of Race Cohorts
Percentage or mean Black(3,426 obs.)
White(5,125 obs.)
PNC in 1st trimester 70.68 88.30Adequate/intermediate PNC 87.84 96.79Low birth weight 9.06 3.73Very-low birth weight 2.64 0.72Placental abruption 0.70 0.56Anemia 3.19 1.43Hypertension 3.01 3.05 cAny maternal complication 6.64 4.9030 <= age < 40 26.54 41.55Age >= 40 1.49 2.11Less than high school education 18.96 8.59At least college education 11.54 32.23Married 36.28 83.72Unemployment rate - county 5.92 5.34Unemployment rate - state 5.90 5.80 APer-capita income (USD) 23,544 23,654 cMedicaid eligibility threshold (% federal poverty line/100)
1.64 1.65 c
Unless otherwise noted, all differences between blacks and whites are statistically significant at the 99% confidence level. A, B, and c indicate significance at the 95%, 90%, and less than 90% confidence level, respectively.
Reproduced with permission of the copyright owner. Further reproduction prohibited without permission.
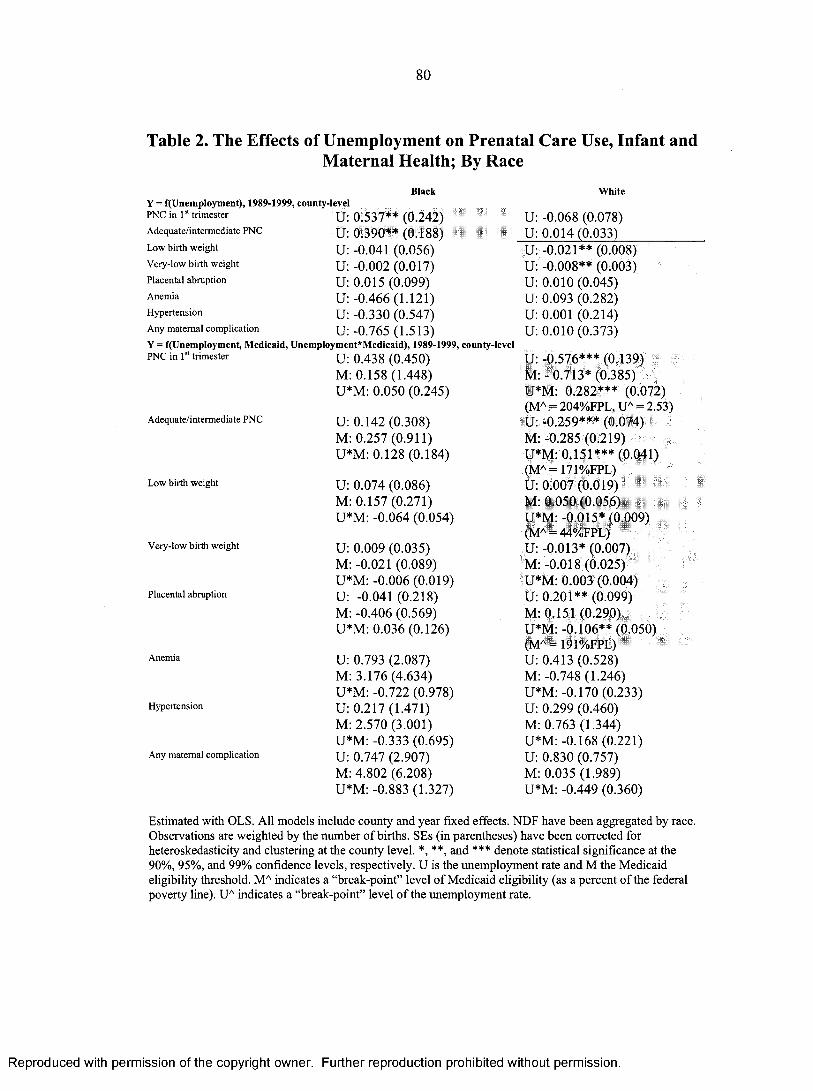
80
Table 2. The Effects of Unemployment on Prenatal Care Use, Infant andMaternal Health; By Race
Black WhiteY = f(Unemployment), 1989-1999, county-levelPNC in 1 trimester U: 0.537** (0.242) U: -0.068 (0.078)Adequate/intermediate PNC U: 0.390** (0.188) U: 0.014(0.033)Low birth weight U: -0.041 (0.056) U: -0.021** (0.008)Very-low birth weight U: -0.002 (0.017) U: -0.008** (0.003)Placental abruption U: 0.015 (0.099) U: 0.010 (0.045)Anemia U: -0.466(1.121) U: 0.093 (0.282)Hypertension U: -0.330 (0.547) U: 0.001 (0.214)Any maternal complication U: -0.765 (1.513) U: 0.010(0.373)Y = f(Unemployment, Medicaid, Unemployment*Medicaid), 1989-1999, county-levelPNC in 1 trimester U: 0.438 (0.450) U: -0.576*** (0.139)
M: 0.158(1.448) M: - 0.713* (0.385)U*M: 0.050 (0.245) U*M: 0.282*** (0.072)
(MA = 204%FPL, UA = 2.53)Adequate/intermediate PNC U: 0.142 (0.308) U: -0.259*** (0.074)
M: 0.257(0.911) M: -0.285 (0.219)U*M: 0.128(0.184) U*M: 0.151*** (0.041)
(MA= 171%FPL)Low birth weight U: 0.074 (0.086) U: 0.007 (0.019)
M: 0.157(0.271) M: 0.050 (0.056)U*M: -0.064 (0.054) U*M: -0.015* (0.009)
(MA = 44%FPL)Very-low birth weight U: 0.009 (0.035) U: -0.013* (0.007)
M: -0.021 (0.089) M :-0.018 (0.025)U*M: -0.006 (0.019) U*M: 0.003 (0.004)
Placental abruption U: -0.041 (0.218) U: 0.201** (0.099)M: -0.406 (0.569) M: 0.151 (0.290)U*M: 0.036(0.126) U*M: -0.106** (0.050)
Anemia
Hypertension
Any maternal complication
U: 0.793 M: 3.176 U*M: -0. U: 0.217 M: 2.570 U*M: -0. U: 0.747 M: 4.802 U*M: -0.
(2.087)(4.634)722 (0.978)(1.471)(3.001)333 (0.695) (2.907) (6.208)883 (1.327)
(MA = 191%FPL)U: 0.413 (0.528)M: -0.748 (1.246) U*M: -0.170 (0.233) U: 0.299 (0.460)M: 0.763 (1.344) U*M: -0.168 (0.221) U: 0.830 (0.757)M: 0.035 (1.989) U*M: -0.449 (0.360)
Estimated with OLS. All models include county and year fixed effects. NDF have been aggregated by race. Observations are weighted by the number o f births. SEs (in parentheses) have been corrected for heteroskedasticity and clustering at the county level. *, **, and *** denote statistical significance at the 90%, 95%, and 99% confidence levels, respectively. U is the unemployment rate and M the Medicaid eligibility threshold. MA indicates a “break-point” level o f Medicaid eligibility (as a percent o f the federal poverty line). UA indicates a “break-point” level o f the unemployment rate.
Reproduced with permission of the copyright owner. Further reproduction prohibited without permission.

81
Table 3. Characteristics of Race Cohorts; State-Level Cells
Proportion or mean Black(504 obs.)
White(597 obs.)
PNC in 1st trimester 70.05 87.04Adequate/intermediate PNC 88.02 96.58Low birth weight 9.00 3.86Very-low birth weight 2.58 0.73Placental abruption 0.71 0.59Anemia 3.32 1.51Hypertension 3.15 3.37Any maternal complication 6.91 5.3230 <= age < 40 25.33 37.45Age >= 40 1.42 1.86Less than high school education 19.29 10.22At least college education 10.66 27.96Married 36.31 83.28Unemployment rate - state 5.86 5.69 cMedicaid eligibility threshold (% federal poverty line/100)
1.63 1.62 c
Unless otherwise noted, all differences between blacks and whites are statistically significant at the 99% confidence level. A, B, and c indicate significance at the 95%, 90%, and less than 90% confidence level, respectively.
Reproduced with permission of the copyright owner. Further reproduction prohibited without permission.

82
Table 4. The Effects of Unemployment on Prenatal Care Use, Infant andMaternal Health; By Race; State-Level Unemployment
Black WhiteY = f(Unemployment), 1989-1999, county-levelPNC in 1 trimester u 0.756** (0.317)Adequate/intermediate PNC u 0.481* (0.251)Low birth weight u -0.060 (0.073)Very-low birth weight u -0.009 (0.023)Placental abruption u -0.150(0.114)Anemia u -1.418 (1.552)Hypertension u -0.415 (0.728)Any maternal complication u -1.926 (2.128)Y = f(Unemployment, Medicaid, Unemployment*Medicaid), 1989-1999, county-levelPNC in Is trimester U: 0.555 (0.805)
M: -0.193 (2.278)U*M: 0.110(0.420)
Adequate/intermediate PNC U: 0.012 (0.620)M: -0.466(1.611)U*M: 0.258 (0.308)
Low birth weight U: 0.047 (0.114)M: 0.167(0.393)U*M: -0.060 (0.080)
Very-low birth weight U: -0.020 (0.056)M: -0.084 (0.140)
Placental abruption
Anemia
Hypertension
Any maternal complication
U*M: 0.008 (0.027) U: -0.036 (0.385)M: 0.147(1.123) U*M: -0.063 (0.228)
U: -2.199 (3.309)M: -2.150 (9.516) U*M: 0.462 (1.821) U: 0.456(1.955)M: 3.902 (4.874) U*M: -0.551 (0.981) U: -2.115 (4.357)M: 0.766 (12.093) U*M: 0.081 (2.306)
U: -0.059 (0.107) U: 0.015 (0.042)U: -0.036*** (0.011)U: -0.009** (0.004)U: 0.063 (0.067)U: 0.114 (0.325)U: 0.033 (0.259)U: 0.098 (0.439)
U: -0.913*** (0.220) M :-1.939*** (0.647) U*M: 0.490*** (0.121) (MA = 186%FPL)U: -0.434*** (0.135) M: -0.915** (0.393) U*M: 0.257*** (0.072) (MA = 169%FPL)U: 0.003 (0.034)M: 0.098 (0.100)U*M: -0.022 (0.018)U: -0.024* (0.013)M: -0.052 (0.043) U*M: 0.009 (0.008)U: 0.400** (0.179)M: 0.648 (0.543)U*M: -0.192* (0.098) (MA = 208%FPL)U: -0.820 (0.919)M: -4.436* (2.465) U*M: 0.562 (0.508)U: 0.241 (0.897)M: 0.604 (2.649)U*M: -0.121 (0.472)U: -0.147 (1.412)M: -2.907 (3.984)U*M: 0.166 (0.763)
Estimated with OLS. All models include county and year fixed effects. NDF have been aggregated by race. Observations are weighted by the number o f births. SEs (in parentheses) have been corrected for heteroskedasticity and clustering at the county level. *, **, and *** denote statistical significance at the 90%, 95%, and 99% confidence levels, respectively. U is the unemployment rate and M the Medicaid eligibility threshold. MA indicates a “break-point” level o f Medicaid eligibility (as a percent o f the federal poverty line).
Reproduced with permission of the copyright owner. Further reproduction prohibited without permission.

83
Table 5. The Effects of Unemployment on Prenatal Care Use, Infant andMaternal Health; By Race; State-Level Unemployment and Cells
Black WhiteY = f(Unemptoyment), 1989-1999, state-levelPNC in Is trimester u 0 . 7 3 0 * ( 0 . 3 9 5 ) U - 0 . 0 8 3 ( 0 . 1 4 7 )Adequate/intermediate PNC u 0 . 4 7 2 * ( 0 . 2 5 4 ) U 0 . 0 1 8 ( 0 . 0 6 2 )
Low birth weight u - 0 . 0 5 5 ( 0 . 0 9 0 ) u - 0 . 0 3 5 * * * ( 0 . 0 1 3 )Very-low birth weight u - 0 . 0 1 0 ( 0 . 0 3 2 ) u - 0 . 0 1 1 * * * ( 0 . 0 0 4 )Placental abruption u - 0 . 1 0 6 ( 0 . 1 0 7 ) u 0 . 0 7 0 ( 0 . 0 6 4 )
Anemia u - 1 . 4 5 1 ( 1 . 5 6 1 ) u 0 . 2 3 6 ( 0 . 2 7 5 )Hypertension u - 0 . 4 8 0 ( 0 . 7 8 6 ) u - 0 . 0 3 5 ( 0 . 3 8 0 )Any maternal complication u - 1 . 9 6 8 ( 2 . 1 4 2 ) u 0 . 1 9 2 ( 0 . 3 7 2 )Y = f(Unemp!oyment, Medicaid, Unemployment*Medicaid), 1989-1999, state-levelPNC in 1 trimester U: 0 . 5 0 6 ( 0 . 9 6 4 ) u - 0 . 8 7 8 * * ( 0 . 3 5 5 )
M: 0 . 1 1 1 ( 2 . 8 0 8 ) M: - 1 . 7 2 3 * ( 1 . 0 1 8 )
Adequate/intermediate PNC
Low birth weight
Very-low birth weight
Placental abruption
Anemia
Hypertension
Any maternal complication
U*M: 0.114(0.497)
U: -0.134 (0.671)M: -0.825 (1.878) U*M: 0.339 (0.357)
U: 0.059(0.162)M: 0.145 (0.550) U*M: -0.063 (0.113) U: -0.020 (0.074)M: -0.126 (0.198) U*M: 0.009 (0.037) U: 0.132 (0.412)M: 0.534(1.195) U*M: -0.139(0.243) U: -2.541 (3.512)M: -3.846 (9.679) U*M: 0.676 (1.929) U: 0.591 (2.013)M: 3.617(5.361) U*M: -0.659(1.033) U: -2.114(4.565)M: -0.738 (12.928) U*M: 0.097 (2.491)
U*M: 0.463** (0.188) (MA = 189%FPL)U :-0.443** (0.191) M: -1.008* (0.532) U*M: 0.269** (0.100) (MA = 165%FPL)U: 0.016 (0.047)M: 0.149(0.154) U*M: -0.030 (0.027) U: -0.018 (0.015)M: -0.038 (0.045) U*M: 0.005 (0.009)U: 0.307 (0.194)M: 0.529 (0.640) U*M: -0.138(0.117) U: -0.578 (1.046)M: -4.076 (2.648) U*M: 0.508 (0.575)U: 0.361 (1.232)M: 0.756 (3.895) U*M: -0.229 (0.679) U: 0.115 (1.516)M: -2.495 (4.597) U*M: 0.079 (0.867)
Estimated with OLS. AH models include state and year fixed effects. NDF have been aggregated by race. Observations are weighted by the number of births. SEs (in parentheses) have been corrected for heteroskedasticity and clustering at the state level. *, **, and *** denote statistical significance at the 90%, 95%, and 99% confidence levels, respectively. U is the unemployment rate and M the Medicaid eligibility threshold. MA indicates a “break-point” level o f Medicaid eligibility (as a percent o f the federal poverty line).
Reproduced with permission of the copyright owner. Further reproduction prohibited without permission.

84
Table 6. Characteristics of Race/Marital Status Cohorts
Percentage or mean SingleBlack
(3,002 obs.)
MarriedBlack
(2,554 obs.)
SingleWhite
(4,864 obs.)
MarriedWhite
(5,123 obs.)PNC in 1st trimester 64.36 81.72 72.72 91.31Adequate/intermediate PNC 84.22 94.06 91.16 97.87Low birth weight 10.28 6.94 6.00 3.29Very-low birth weight 2.86 2.28 1.23 0.62Placental abruption 0.75 0.60 0.73 0.53Anemia 3.36 2.81 1.92 1.33Hypertension 2.86 3.23 3.07 3.05 LAny maternal complication 6.71 6.40 5.55 4.7730 <= age < 40 18.84 40.26 19.94 45.75Age >= 40 1.01 2.36 1.47 2.23Less than high school education 25.06 8.33 24.22 5.57At least college education 4.83 23.39 7.56 37.00Unemployment rate - county 6.03 5.76 5.55 5.30Unemployment rate - state 5.91 5.91 c 5.80 5.80 cPer-capita income (USD) 23,516 23,694 c 23,091 23,767Medicaid eligibility threshold (% federal poverty line/100)
1.64 1.65 c 1.67 1.64 A
Unless otherwise noted, all differences between single and married women within a racial cohort are statistically significant at the 99% confidence level. A, B, and c indicate significance at the 95%, 90%, and less than 90% confidence level, respectively.
Reproduced with permission of the copyright owner. Further reproduction prohibited without permission.

85Table 7. The Effects of Unemployment on Prenatal Care Use, Infant and Maternal Health;
By Race and Marital StatusSingle Married Single MarriedBlack Black White White
Y = f(Unemployment), 1989-1999, county-levelPNC in 1st trimester U: 0.690* (0.350) U: 0.130(0.180) U: -0.522*** (0.141) U: -0.070 (0.077)Adequate/intermediate PNC U: 0.507* (0.271) U: 0.115 (0.114) U: -0.147* (0.077) U: 0.012 (0.030)Low birth weight U: -0.054 (0.071) U: -0.006 (0.042) U :-0.018 (0.031) U: -0.009 (0.008)Very-low birth weight U: -0.008 (0.027) U: 0.017 (0.022) U: -0.027* (0.015) U: -0.002 (0.004)Placental abruption U :-0.011 (0.107) U: 0.051 (0.132) U: -0.014 (0.088) U: 0.018 (0.045)Anemia U: -0.224(1.308) U: -0.963 (0.954) U: 0.011 (0.399) U: 0.132 (0.283)Hypertension U: -0.454 (0.623) U: -0.055 (0.541) U: -0.221 (0.277) U: 0.028 (0.222)Any maternal complication U: -0.665 (1.755) U: -0.960(1.329) U: -0.275 (0.546) U: 0.074 (0.368)Y = f(Unemployment, Medicaid, Unemployment*Medicaid), 1989-1999, county-levelPNC in 1st trimester U: 0.893 (0.608) U: -0.064 (0.325) U : -1.060*** (0.257) U: -0.537*** (0.127)
M: 0.886 (2.088) M: -0.258 (0.844) M: -0.606 (0.685) M: -0.735** (0.354)U *M :-0.122 U*M: 0.110 U*M: 0.291** (0.127) U*M: 0.261***(0.339) (0.171) (MA=364%FPL) (0.065)
(MA=206%FPL,UA=2.81)
Adequate/intermediate PNC U: 0.492 (0.420) U: -0.184 (0.194) U: -0.611*** (0.171) U : -0.201*** (0.062)M: 1.021 (1.334) M: -0.264 (0.479) M: -0.055 (0.500) M :-0.282 (0.183)U*M: -0.010 U*M: 0.167* U*M: 0.249*** (0.091) U*M: 0.119***(0.251) (0.098)
(MA=110%FPL)(MA=246%FPL) (0.033)
(MA=170%FPL)Low birth weight U: 0.052 (0.113) U: 0.104(0.097) U: 0.072 (0.056) U: 0.010 (0.017)
M: 0.189(0.314) M: 0.076 (0.291) M: 0.194(0.146) M: 0.049 (0.049)U*M: -0.059 U*M: -0.061 U*M: -0.049** (0.023) U *M :-0.011 (0.009)(0.060) (0.058) (MA=147%FPL)
Very-low birth weight U: 0.016(0.059) U: -0.046 (0.050) U: 0.013 (0.028) U: -0.017** (0.007)M: -0.042(0.148) M: -0.108(0.136) M: -0.002 (0.085) M: -0.019(0.022)U*M: -0.011 U*M: 0.036 U*M: -0.021 (0.015) U*M: 0.008**(0.030) (0.024) (0.004)
(MA=206%FPL)Placental abruption U :-0.196 (0.276) U: 0.181 (0.268) U: 0.126 (0.211) U: 0.218** (0.101)
M: -0.837 (0.672) M: 0.206 (0.741) M: -0.295 (0.579) M: 0.235 (0.293)U*M: 0.112 (0.157) U*M: -0.074
(0.150)U*M: -0.074 (0.103) U*M: -0.111**
(0.051)(MA=196%FPL)
Anemia U: 2.153 (2.452) U: -1.617(1.945) U: 1.377* (0.822) U: 0.157(0.518)M: 5.527 (5.348) M :-1.171 (4.513) M: 0.896(1.834) M: -1.258 (1.255)U*M :-1.348 U*M: 0.373 U*M: -0.735** (0.329) U*M: -0.005 (0.236)(1.137) (0.964) (MA=187%FPL)
Hypertension U: 0.287 (1.813) U: 0.274(1.235) U: 0.421 (0.668) U: 0.215 (0.457)M: 2.700 (3.712) M: 2.316(2.672) M: 2.689(1.810) M: 0.279(1.337)U*M: -0.438 U*M: -0.211 U*M: -0.356 (0.318) U*M: -0.105 (0.220)(0.872) (0.561)
Any maternal complication U: 1.874 (3.525) U :-1.114 (2.473) U: 1.814(1.198) U: 0.524 (0.735)M: 6.644 (7.498) M: 1.170 (5.356) M: 3.211 (3.026) M: -0.859 (1.923)U*M: -1.452 U*M: 0.069 U *M :-1.133** (0.550) U*M: -0.241 (0.352)(1.619) (1.155) (MA=160%FPL)
Estimated with OLS. All models include county and year fixed effects. NDF have been aggregated by race and marital status. Observations are weighted by the number o f births. SEs (in parentheses) have been corrected for heteroskedasticity and clustering at the county level. *, **, and *** denote statistical significance at the 90%, 95%, and 99% confidence levels, respectively. U is the unemployment rate and M the Medicaid eligibility threshold. MA indicates a “break-point” level o f Medicaid eligibility (as a percent of the federal poverty line). UA indicates a “break-point” level o f the unemployment rate.
Reproduced with permission of the copyright owner. Further reproduction prohibited without permission.
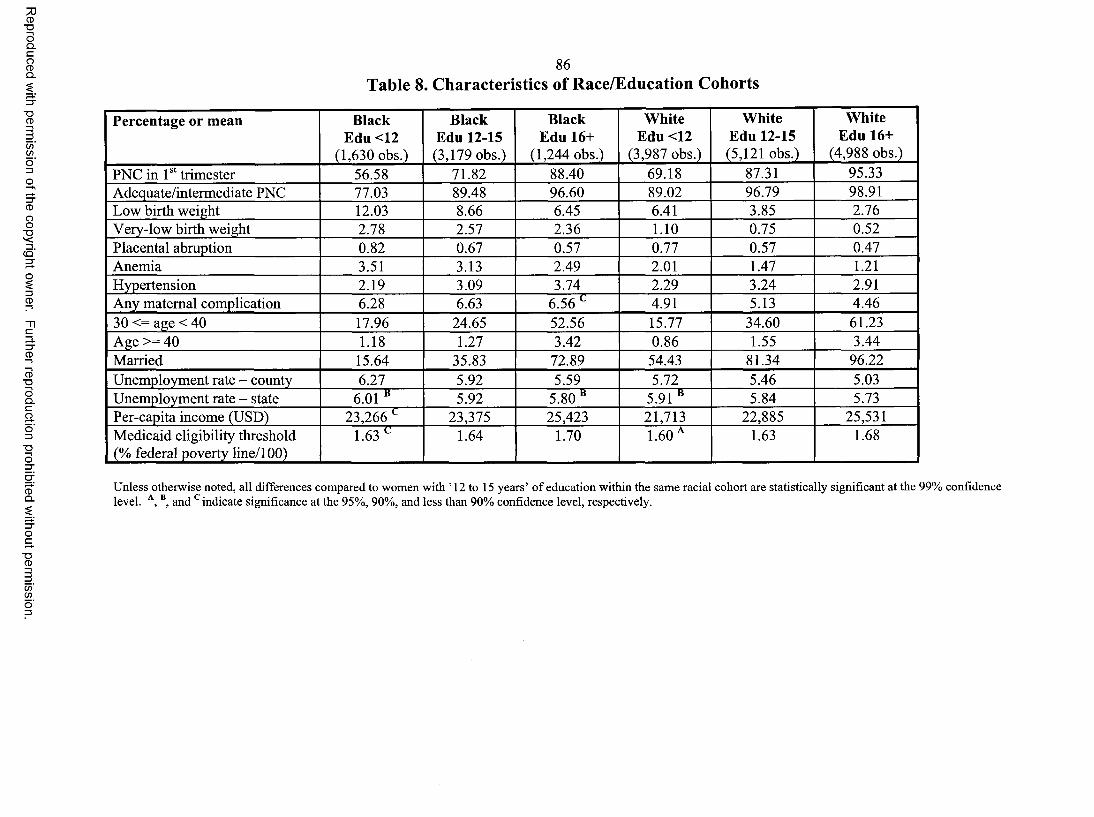
Reproduced with
permission
of the copyright owner.
Further reproduction prohibited
without permission.
86Table 8. Characteristics of Race/Education Cohorts
Percentage or mean Black Edu <12
(1,630 obs.)
Black Edu 12-15(3,179 obs.)
Black Edu 16+
(1,244 obs.)
White Edu <12
(3,987 obs.)
White Edu 12-15(5,121 obs.)
White Edu 16+
(4,988 obs.)PNC in 1st trimester 56.58 71.82 88.40 69.18 87.31 95.33Adequate/intermediate PNC 77.03 89.48 96.60 89.02 96.79 98.91Low birth weight 12.03 8.66 6.45 6.41 3.85 2.76Very-low birth weight 2.78 2.57 2.36 1.10 0.75 0.52Placental abruption 0.82 0.67 0.57 0.77 0.57 0.47Anemia 3.51 3.13 2.49 2.01 1.47 1.21Hypertension 2.19 3.09 3.74 2.29 3.24 2.91Any maternal complication 6.28 6.63 6.56 c 4.91 5.13 4.4630 <= age < 40 17.96 24.65 52.56 15.77 34.60 61.23Age >= 40 1.18 1.27 3.42 0.86 1.55 3.44Married 15.64 35.83 72.89 54.43 81.34 96.22Unemployment rate - county 6.27 5.92 5.59 5.72 5.46 5.03Unemployment rate - state 6.01 “ 5.92 5.80“ 5.91 “ 5.84 5.73Per-capita income (USD) 23,266 c 23,375 25,423 21,713 22,885 25,531Medicaid eligibility threshold (% federal poverty line/100)
1.63 c 1.64 1.70 1.60 A 1.63 1.68
Unless otherwise noted, all differences compared to women with ’ 12 to 15 years’ o f education within the same racial cohort are statistically significant at the 99% confidence level. A, B, and c indicate significance at the 95%, 90%, and less than 90% confidence level, respectively.

87Table 9. The Effects of Unemployment on Prenatal Care Use, Infant and Maternal
Health; By Race and Education
Black Black Black White White WhiteEdu <12 Edu 12-15 Edu 16+ Edu <12 Edu 12-15 Edu 16+
Y = f(Unemp!oyment), 1989-1999, county-levelPNC in 1st U: 1.145** U: 0.526** U: 0.030 (0.145) U: -0.342** U: -0.028 (0.083) U: -0.012 (0.056)trimester (0.476) (0.232) (0.155)
Adequate/inter U: 0.942** U: 0.334* U: -0.070 (0.095) U: 0.006 (0.093) U: 0.026 (0.034) U: -0.012(0.025)
m ediate PNC (0.389) (0.175)
L ow birth U: -0.048 (0.109) U: -0.063 (0.051) U: 0.032 (0.053) U: -0.046 (0.035) U: -0.017* (0.010) U: -0.021* (0.012)
w eightV ery-low birth U: -0.009 (0.044) U: -0.004 (0.017) U: 0.029 (0.034) U: 0.003 (0.014) U :-0.011*** U: -0.000 (0.005)
w eight (0.004)
Placental U: 0.129 (0.179) U: -0.023 (0.104) U: 0.102 (0.268) U: -0.099(0.114) U: 0.027 (0.048) U: 0.042 (0.064)abruptionA nem ia U: 0.402(1.388) U: -0.510(1.147) U: -1.921 (1.548) U: -0.039 (0.457) U: 0.012 (0.255) U: 0.325 (0.423)H ypertension U: -0.217 (0.671) U: -0.359 (0.519) U: 0.254(1.250) U: -0.081 (0.295) U: 0.045 (0.222) U: 0.098 (0.258)A ny maternal U: 0.350 (1.839) U: -0.885 (1.504) U :-1.509 (2.316) U: -0.285 (0.585) U: 0.003 (0.371) U: 0.314(0.503)com plicationY = f(Unemployment, Medicaid, Unemployment*Medicaid), 1989-1999, county-levelPNC in 1st U: 0.948 (0.886) U: 0.441 (0.398) U: -0.200 (0.461) U: -0.635* (0.342) U: -0.466*** (0.144) U: -0.202** (0.092)
trimester M: -0.515(3.104) M: 0.352(1.348) M: -0.160 (0.967) M: 0.113 (1.108) M: -0.558 (0.407) M:-0.211 (0.223)U*M: 0.113 U*M: 0.040 1PM: 0.127 U*M: 0.157 U*M: 0.243*** IPM: 0.105**(0.485) (0.219) (0.242) (0.171) (0.074)
(MA = 192)(0.043) (MA= 191)
Adequate/inter U: 0.595 (0.672) U: 0.122 (0.249) U: -0.360 (0.254) U: -0.371* (0.217) U: -0.177** (0.071) U: -0.094* (0.049)
m ediate PNC M: 0.720 (2.107) M: 0.319(0.749) M: -0.485 (0.559) M: 0.369 (0.762) M: -0.110(0.216) M: -0.149 (0.145)U*M: 0.168 TPM: 0.108 TPM: 0.162 IPM: 0.200* U*M: 0.111*** IPM: 0.046* (0.024)(0.377) (0.143) (0.134) (0.121) (MA= 185) (0.038)
(MA= 159)(MA = 204)
L ow birth U: -0.115 (0.222) U: 0.116(0.090) U: 0.003 (0.163) U: 0.091 (0.072) U: -0.003 (0.025) U: 0.013 (0.031)
w eight M: -0.298 (0.548) M: 0.302 (0.297) M: -0.279 (0.346) M: 0.299 (0.252) M: 0.009 (0.075) M: 0.116(0.073)U*M: 0.041 U*M: -0.100* TPM: 0.018 1PM: -0.076** TPM: -0.008 (0.012) U*M: -0.019 (0.016)(0.105) (0.059)
(MA =116)(0.081) (0.035)
(MA= 120)V ery-low birth U: 0.054 (0.089) U: 0.001 (0.034) U: -0.013(0.111) U: 0.001 (0.027) U: -0.007 (0.010) U: -0.006 (0.011)
w eight M: -0.023 (0.217) M: -0.032 (0.099) M: -0.173 (0.254) M: -0.110(0.086) M: 0.002 (0.032) M: 0.017(0.031)U*M: -0.032 U*M: -0.002 1PM: 0.025 1PM: 0.002 TPM: -0.002 (0.005) TPM: 0.003 (0.006)(0.043) (0.018) (0.060) (0.015)
Placental U: 1.019* (0.537) U: -0.182 (0.234) U: 0.591 (0.426) U: 0.210(0.251) U: 0.187* (0.108) U: 0.263* (0.140)
abruption M: 1.622(1.225) M: -0.476 (0.627) M: 0.290(1.099) M: -0.198(0.763) M: 0.035 (0.309) M: 0.422 (0.367)U*M: -0.497* U*M: 0.092 TPM: -0.268 IPM: -0.165 TPM: -0.087 (0.053) IPM: -0.124*(0.293) (0.122) (0258) (0.123) (0.071)(MA = 205) (MA = 212)
A nem ia U: 5.625 (3.820) U: 0.243 (2.013) U: -3.934(3.183) U: 1.418 (1.232) U: 0.497 (0.499) U: -0.188 (0.663)M: 13.247 M: 1.379(4.402) M :-1.961 (6.238) M: 1.028 (2.900) M: -0.389(1.260) M: -2.146(1.388)(10.003) U*M: -0.424 1PM: 1.112 U*M: -0.791 U*M: -0.262 (0.221) U*M: 0.294 (0.308)U*M: -2.989 (0.930) (1.478) (0.547)(2.025)
Hypertension U: 1.443 (2.353) U: 0.082 (1.487) U: -1.067 (2.360) U: 0.949 (0.719) U: 0.596 (0.475) U: 0.058 (0.578)M: 4.583 (4.942) M: 2.418 (3.114) M: -2.160(4.687) M: 1.930(1.932) M: 0.877(1.465) M: 1.122(1.504)U*M: -0.957 U*M: -0.274 IPM: 0.738 TPM: -0.567* TPM: -0.306 (0.229) TPM: 0.015(0.296)(1.167) (0.709) (1.035) (0.318)
(MA = 167)A ny maternal U: 7.411 (5.050) U: -0.031 (2.835) U: -4.040 (4.498) U: 2.488(1.570) U: 1.162(0.761) U: 0.063 (0.906)
com plication M: 17.656 M: 3.008 (6.048) M: -3.786 (8.507) M: 2.735 (4.106) M: 0.293 (2.121) M: -0.650(1.993)(12.292) TPM: -0.504 1PM: 1.411 1PM: -1.510** U*M: -0.634* TPM: 0.141 (0.451)U*M: -4.036 (1.280) (1.960) (0.717) (0.361)(2.576) (MA= 165) (MA = 183)
Reproduced with permission of the copyright owner. Further reproduction prohibited without permission.

88
Notes to Table 9:Estimated with OLS. All models include county and year fixed effects. NDF have been aggregated by race and education. Observations are weighted by the number o f births. SEs (in parentheses) have been corrected for heteroskedasticity and clustering at the county level. *, **, and *** denote statistical significance at the 90%, 95%, and 99% confidence levels, respectively. U is the unemployment rate and M the Medicaid eligibility threshold. MA indicates a “break-point” level o f Medicaid eligibility (as a percent o f the federal poverty line).
Reproduced with permission of the copyright owner. Further reproduction prohibited without permission.

89
Table 10. The Effects of Unemployment on Cohort Characteristics; By Race
BlackY = f(Unemployment), 1989-1999, county-levelLess than high school education U: 0.082 (0.091)At least college education U: 0.037 (0.056)_____________________Married U: 0.425** (0.216)30 <= age <40 U: 0.395*** (0.085)Age >=40 U: 0.044*** (0.012)Y = f(Unemployment, Medicaid, Unemployment*Medicaid), 1989-1999, county-level Less than high school education U: -0.066 (0.205)
M: -0.207 (0.619)U*M: 0.082 (0.121)
White
U: -0.006(0.031) U: -0.002 (0.072)
At least college education
Married
30 <= age < 40
Age >= 40
U: 0.310*** (0.083) U: 0.093 (0.070)
U: 0.671*** (0.167)M: 1.545*** (0.469)U*M: -0.362*** (0.091)(MA = 185%FPL, UA = 4.26) U: 0.610(0.378)M: 0.822 (1.058)U*M: -0.112(0.227)
U: 1.174*** (0.263)M: 2.235** (0.985)U*M:-0.451*** (0.147)(MA = 260%FPL, UA = 4.96) U: 0.085*** (0.032)M: 0.099 (0.122)U*M: -.024 (0.019)
U: 0.055*** (0.019)
U: 0.220** (0.090)M: 0.371 (0.269)U*M: -0.126** (0.053)(MA = 175%FPL)U: 0.929*** (0.158)M: 2.953*** (0.501)U*M: -0.528*** (0.856)(MA = 176%FPL, UA = 5.59) U: 0.813*** (0.172)M: 1.914*** (0.522)U*M: -0.287*** (0.095)(MA = 283%FPL, UA = 6.66) U: 1.005*** (0.158)M: 2.832*** (0.532)U*M: -0.517*** (0.088)(MA = 194%FPL, UA = 5.48) U: 0.147*** (0.030)M: 0.361*** (0.110)U*M: -0.053*** (0.020)(MA = 277%FPL, UA = 6.80)
Estimated with OLS. All models include county and year fixed effects. NDF have been aggregated by race. Observations are weighted by the number o f births. SEs (in parentheses) have been corrected for heteroskedasticity and clustering at the county level. *,**, and *** denote statistical significance at the 90%, 95%, and 99% confidence levels, respectively. U is the unemployment rate and M the Medicaid eligibility threshold. MA indicates a “break-point” level o f Medicaid eligibility (as a percent o f the federal poverty line). UA indicates a “break-point” level o f the unemployment rate.
Reproduced with permission of the copyright owner. Further reproduction prohibited without permission.

3. PATERNITY DEFERMENTS AND THE TIMING OF BIRTHS: U.S. NATALITY
DURING THE VIETNAM WAR
90
Reproduced with permission of the copyright owner. Further reproduction prohibited without permission.

91
3.1. Background
During the conflict in Vietnam, men between 18/4 and 25 years of age were
subject to the draft. Several exemptions to this rule existed. For example, students were
exempt. Importantly for the purposes of this study, married men with dependents could
also obtain a deferment from the draft, and the particulars of this policy underwent
substantial changes in the 1960’s. In August 1965, President Johnson issued Executive
Order 11241, which formally eliminated deferments for childless men who got married
after August 26, 1965, and, in October 1965, the Selective Service declared that childless
married men (irrespective of the date of marriage) were to be called up. Both
announcements came as a surprise (The New York Times, 1965a). Since married men
with children remained exempt, the declarations provided a strong incentive for young *
couples to conceive a (first-born) child. Before August 1965, marriage had been a
sufficient condition for a deferment. Even just a few hours before the August 26
midnight deadline, desperate couples tried to make use of this provision by quickly
scheduling their wedding. Between August and October, couples that had missed the
deadline had to satisfy an additional condition - conceiving a child. In October 1965, the
risk of induction was further extended to all couples that had remained childless. Finally,
in April 1970, the family deferments were entirely eliminated by Executive Order 11527
(The Selective Service System 2004).
Past research has demonstrated that taxes and expenditure programs can affect
fertility (e.g., Whittington et al 1990; see also Milligan 2002 for an excellent review) as
well as the timing of delivery (Dickert-Conlin and Chandra 1999). The goal of this paper
is to extend this reasoning to a dramatic yet unexamined government intervention - the
Reproduced with permission of the copyright owner. Further reproduction prohibited without permission.

92
effects of the Vietnam War paternity deferments on the decision to conceive a first-born
child. As discussed in the popular press, Vice President Dick Cheney’s first daughter,
Elizabeth, was bom nine months and two days after the Selective Service System
announced that childless married men were to be drafted (The Boston Globe 2000, Slate
Chatterbox 2004). Did other draft eligible men react to the announcement the way Vice
President Cheney apparently did? And, if so, how fast was the response?
To my knowledge, no one has investigated the impacts of the Vietnam draft on
natality. By using the Vietnam draft rules to identify a causal effect, however, I build on
several prior studies. Joshua Angrist, for example, uses the exogeneity of the Vietnam
draft rules to identify the effects of military service on lifetime earnings (Angrist 1990)
and to measure the racial differences in the value of military service (Angrist 1991).
Gullason (1989) and Card and Lemieux (2001, 2002) estimate the effects of the Vietnam
draft on schooling explicitly recognizing that college attendance often served as a vehicle
to avoid the draft. Both studies find a significant effect of the probability of being drafted
on school enrollment.
The fact that the changes in the Selective Service rules were both unexpected and
widely publicized makes this an ideal example to study the effects of policy on fertility
decisions. Milligan (2002) argues that the assumptions made about the timing of the
response to policy are arbitrary since a reaction will be delayed not only by a nine-month
gestational lag but also by the time necessary for the diffusion of information about the
change in policy. In the case examined here, however, the criticism seems less relevant.
Newspaper clippings from August 27, 1965 suggest that the issuance of the Executive
Order 11241 did receive broad attention. For example, the story was listed on the front
Reproduced with permission of the copyright owner. Further reproduction prohibited without permission.

93
pages of The New York Times (1965c) and The Washington Post (1965b). The benefits
of becoming a father were made explicit: “From now on, a draft-age man who gets
married and becomes a father before being called into service will go into the same
deferred class as other fathers.” (The Washington Post, 1965b, p. A12) Similarly, on
October 27, 1965, one day after the Selective Service declared that childless married men
were to be called up, the top U.S. newspapers commented on the policy change (The New
York Times, 1965a; The Washington Post, 1965a).23 It is reasonable to assume that the
general public was well aware of the news.
Also, given the urgency of the situation for the potential draftees, any behavioral
response was likely to be fast. In the mid 1960’s, the risk of induction facing young
American men was increasing dramatically. In the year 1965, when the new policies
were announced, the number of men inducted each month increased by more than sixfold
(Figure 1). And, as anecdotal evidence suggests, young couples were ready to react
almost immediately. For example, after President Johnson’s Executive Order was issued
on August 26, 1965 limiting the eligibility for marital deferments to men married on or
before that date, many couples quickly scheduled their wedding in order to beat the
midnight deadline (The New York Times, 1965b).
Finally, information about the fecundity of the U.S. population in the early 1960’s
confirms that young women were, on average, able to conceive a child quickly. In the
year 1960, 52% of Americans 20-24 years old were able to conceive within a month from
trying and 77% were successful within two months (Crist 2004). Thus, a fast and
23 Unfortunately, only a few transcripts o f television news are available for years prior to 1968 (Vanderbilt Television News Archive, NBC News Archive, and Burrell’s Transcript Service) and none o f them is relevant to the issue at hand.
Reproduced with permission of the copyright owner. Further reproduction prohibited without permission.

94
relatively strong reaction to the Executive Order issuance and the Selective Service
announcement is realistic.
3.2. Data and Methods
To empirically investigate the effects of the Vietnam draft on natality, I focus on
the impacts of President Johnson’s Executive Order 11241 and the October 1965
Selective Service announcement and make use of the fact that these policies affected
different groups of young men differently. In particular, I use a difference-in-differences
type of approach and compare the effects of the policy changes on the behavior of
treatment and control groups of young men.
Ideally, all American men in the draft-eligible age would constitute the treatment
group. Unfortunately, however, the dataset most suitable for the study - the Vital
Statistics of the United States (U.S. Department of Health, Education, and Welfare 1963-
77) - does not provide detailed information on paternal characteristics.24 Therefore, I use
maternal age as a proxy for the father’s age and adjust for the possibility of bias due to
misclassification. In my baseline model, I use women 20-24 years old as the treatment
group since only men up to 25 years of age were eligible for the draft and since women,
24 I have explored several micro datasets but none of them was suitable for this study. For example, the Natality Detail File series only started in the year 1968. The Current Population Survey reports age in years but not the month o f birth (making it impossible to focus on children as respondents) and only asks females questions related to fertility (making it impossible to link children to their fathers and to focus on fathers as respondents). The National Longitudinal Survey o f Young Men (NLSYM) includes information on individuals 14 to 24 years old in the year 1966 but contains no appropriate control group. Also, the sample size in the NLSYM is too small to permit reliable inferences from a stratified analysis (for example, in the summer o f 1966, sampled men 19-24 years old had only 22 first-bom children). The Childbirth and Adoption History File o f the Panel Study of Income Dynamics collected since 1985 does not contain enough first births in the control group to support reliable difference-in-differences estimation.
Reproduced with permission of the copyright owner. Further reproduction prohibited without permission.

95
on average, tend to be younger than their partners (Table l ).25 In an alternative
specification, I add teenagers (15 to 19 years old) to the treatment group. Women 25-29
years old - with husbands likely to be 26 years old or older and thus ineligible for the
Vietnam draft - comprise the control group.
To assess the validity of my treatment and control groups, I use the U.S. Natality
Detail Files for the years 1969-197126 and calculate the percentages of fathers 19 to 25
years old (the draft eligible cohort) by maternal age (Table 2). Maternal age is a
reasonably good proxy for paternal age. In particular, 65% of mothers 20 to 24 years old
(the baseline treatment group) had babies with fathers 19 to 25 years old in each of the
years 1969, 1970, and 1971. The corresponding percentage was 68% for women 15 to 24
years old (an alternative treatment group) and 11% for mothers in the 25 to 29 year old
cohort (the control group). These estimates prove useful in adjusting for possible
misclassification, as I discuss shortly.
Since the existence of children rather than their number played a role in
determining draft eligibility, I focus on the birth of a first-born child when estimating the
effects of the Executive Order and the Selective Service announcement. Also, the
25 The Vital Statistics report the number of births for the following age cohorts: under 15 years, 15-19 years, 20-24 years, 25-29 years, 30-34 years, 35-39 years, 40-44 years, 45-49 years, and 50 years and over. I exclude teenagers from the baseline analysis since women under 15 years o f age were unlikely to be affected by the government policy and since mothers 15-19 years old seem diverse with respect to their fertility responsiveness (the attitudes towards family planning will likely differ among women in this group). Also, my calculations suggest that between 17.3% (year 1963) and 26.7% (year 1968) o f mothers 15-19 years old were single in the period under study. The corresponding estimates are 5.7% and 8.3% for mothers 20-24 years old. (http://www.cdc.gov/nchs/data/statab/t941xl8.pdf,http://www.cdc.gov/nchs/data/statab/t941xl9.pdf, http://www.cdc.gov/nchs/data/statab/t941x07.pdf, and http://www.census.gov/popest/archives/pre-1980/PE-ll.html; A ccessed03/19/2006)In an alternative model specification, however, I add women 15-19 years old to the treatment group and the results remain qualitatively the same.
26 These are the first years when the age o f both parents was recorded.
Reproduced with permission of the copyright owner. Further reproduction prohibited without permission.

96
outcome measure needs to be corrected for the overall effects of the war on fertility. In
particular, it needs to isolate the potential changes in the number of first births in reaction
to the new deferment rules from the overall changes in natality in a country where many
young men had been sent to war. Therefore, I use the age-specific ratio of the number of
first-bom infants to all infants (reported by month and year of delivery) as the dependent
variable. If the 1965 declarations had a significant effect on the fertility behavior of the
potential draftees, the “first-bom infants/all infants” ratio should increase in the summer
of 1966 (about 9 months after the policy changes were enacted) for women in the
treatment group and stay unchanged (or to increase less) for women in the control group.
Thus, a comparison of the monthly “first-born infants/all infants” series (purged of a
linear time trend and seasonal variation) for the treatment and control groups yields an
estimate of the causal relationship between the new government draft policies and
fertility.27 More formally, I estimate:
Y tj = a + P*Tj + y*M t + 5*Tj*Mt + etj,
where t indexes time periods (months from January 1963 to December 1968) and j
indexes cohorts (treatment or control). Y is the detrended and deseasonalized “first-born
infants/all infants” ratio, T is a dummy variable denoting the treatment group
membership (age 20-24 in the baseline specification), and M is a set of dummy
variables, one for each month following the first policy change (August 1965). T*M are
interaction dummies denoting the treatment group membership in months following the
27 In one of my robustness checks below, I verify that the number o f subsequent births in not driving my results.
Reproduced with permission of the copyright owner. Further reproduction prohibited without permission.

97
policy changes, and s is an error term. In the above model, the estimated 5’s on months
9 and 10 after each policy change are the difference-in-differences estimates of interest.
3.3. Results
3.3.1. Descriptive Analysis
Figure 2 plots the proportions of first births for American women 20 to 24 and 25
to 29 years old by month and year of delivery. From 1963 to 1968, the two ratios grew
about linearly with only small deviations from the trend. The series, however, exhibited
a spike in the summer of 1966 - approximately nine months after the new draft policies
were announced. As hypothesized, the spike was more remarkable for the younger
cohort.
Based on the descriptive analysis, it seems reasonable to focus on the relatively
stable period from January 1963 to December 1968 when estimating the effects of the
new draft policy on fertility. This time period includes several years preceding the
Executive Order 11241 issuance (pre-August 1965) as well as several years following the
expected effects of the new policies on fertility (post-July/August 1966). Limiting the
period studied to the mid-1960’s also simplifies the analysis by avoiding the substantial
changes to the draft process associated with the introduction of the draft lottery in late
1969.28 Finally, a relatively short follow up is sufficient for studying the immediate
decision of affected young couples to conceive a first-born child. Due to the construction
28 Beginning in 1970, young men were at risk o f induction for only one year rather than for the entire period between ages 18 Vi and 25, as was the case previously. As Card and Lemieux (2001, 2002) note, the shortened period o f exposure together with the relatively low rate o f inductions after 1969 significantly reduced the incentives to pursue draft-avoidance strategies.
Reproduced with permission of the copyright owner. Further reproduction prohibited without permission.

98
of the outcome measure - the proportion of first births to the total number of births -
investigating long-term fertility dynamics would be complicated as the corrective
decrease in the number of first deliveries and an increase in the number of second and
subsequent deliveries would be difficult to separate out. For the purposes of this study,
year 1968 therefore seems like a reasonable cutoff. Unfortunately, limiting attention to
years prior to 1969 excludes the effects of the family deferment elimination of April 1970
from the analysis.
Since the two series of the first-birth ratio likely followed a different (linear) time
trend in 1963 to 1968 and since their seasonal pattern might have also differed,
appropriate detrending and deseasonalizing had to be performed.29 A simple visual
examination of the detrended and deseasonalized series (Figure 3) suggests that the
government draft policies very likely did have a significant impact on the fertility of the
potential draftees. In particular, while the residual ratios for the treatment and control
groups followed a similar time path in the years 1963 to 1965, the treatment mothers
experienced a much sharper increase in the proportion of first births in the summer of
1966. That the control mothers experienced any increase at all may stem from the fact
that maternal age is an imperfect proxy for paternal age and so that some of the women in
the control group might have also reacted to the draft. As further obvious from Figure 3,
the two cohorts of mothers behaved somewhat differently towards the end of the studied
period. More specifically, the treatment mothers had a lower residual ratio of first-bom
babies about 12 and 22 months after the 1966 spike. This is consistent with the fertility
29 A continuous time variable and a full set o f month dummies have been used. This approach is similar to that in Card and Lemieux (2001, 2002) who regress the annual education outcomes on a linear inter-cohort time trend when estimating the effects o f the Vietnam draft on college attendance.
Reproduced with permission of the copyright owner. Further reproduction prohibited without permission.

99
behavior (birth spacing in particular) prevalent in the U.S. at that time. Based on data
from the Natality Detail Files for the years 1969-1971,30 the distribution of the length of
time between the first and the second live birth peaked at months 13 and 23 in the late
1960’s and early 1970’s (Figure 4). A decreased number of first births coupled with an
increased number of subsequent births in the years 1967 and 1968 by women who had
responded to the Vietnam draft by advancing their first delivery to summer 1966 may
thus be responsible for the observed pattern.
3.3.2. Regression Results
To formally estimate the size and significance of the effect of the Vietnam draft
mles on natality, I employ a difference-in-differences type of methodology. In the
baseline specification of my model, I regress the detrended and deseasonalized “first-bom
infants/all infants” ratio on a dummy variable set equal to one for the treatment group,
seven dummy variables set equal to one for months 8 to 14 after the August 1965
Executive Order issuance (i.e., months 6 to 12 after the October 1965 Selective Service
announcement), and seven interaction dummies set equal to one for observations on the
treatment group in the exposed months.31 If the new policies did induce young women to
time the conception of their first-bom child in order to make the baby’s father exempt
from the draft, the coefficients on the interaction dummies for months 9 and 10 after each
30 These are the first years when the information on birth spacing was recorded by at least some states. Obtaining this information for the years 1966-1968 would have been preferable since, if the number o f first births was exogenously affected by the policy change, birth spacing might have been affected as well. Nevertheless, the stability o f the birth spacing distribution in the 1969-1971 period makes extrapolation to the earlier years seem justifiable.
31 As a robustness check, I have also estimated the main equation with detrending and deseasonalizing in one step. This modification had no substantial impact on the results.
Reproduced with permission of the copyright owner. Further reproduction prohibited without permission.

100
of the new policies was announced should be positive and statistically significant. In
addition, since the announcements were made on August 26 and October 26, 1965, even
a quick response by the potential draftees would likely increase the number of infants
bom in June 1966 (10 months after the Executive Order issuance) and August 1966 (10
months after the Selective Service announcement) by more than the number of infants
bom in May and July 1966. Therefore, the coefficients on the interaction dummies for
months 10 and 12 after the Executive Order issuance (i.e., months 8 and 10 after the
October 1965 Selective Service announcement) should be larger in magnitude.
Results from my baseline OLS estimation are reported in the first column of
Table 3. Two of the interaction variables are positive and significant at the 95%
confidence level: the interaction dummies for months 10 and 12 after the Executive Order
issuance, i.e., months 8 and 10 after the Selective Service announcement. The increased
natality in June 1966 very likely represents a direct response to the Executive Order
issuance and the increased natality in August 1966 is likely caused by the Selective
Service announcement. Even though statistically insignificant, the proportions of first
births among treatment women are higher in July, September, and October 1966 as well
and the gap diminishes over time.
The second column of Table 3 reports results from a specification where
teenagers (mothers 15-19 years old) are added to the treatment group. In this case, the
interaction dummies for June, July, August, and September 1966 are all positive, large,
and statistically significant. Taken together, the above results thus provide strongly
suggestive evidence that the Vietnam War draft policy played a role in determining the
timing, and perhaps the number, of births.
Reproduced with permission of the copyright owner. Further reproduction prohibited without permission.

101
3.3.3. Correction for Misclassification
After estimating the baseline model, I explicitly acknowledge that some women
might have been misclassified into the treatment and/or control group. A recent paper
(Lewbel 2003) demonstrates that as long as the misclassification probabilities are known
to the researcher (for example from a validation sample or from aggregate population
proportions), the true average treatment effect can be calculated as: t* = t/(po+pi-l),
where x denotes the estimated (biased) treatment effect, po is the proportion of
untreated individuals in the control group, pi the proportion of truly treated individuals
in the treatment group, and po+pi>l. (The Technical Appendix includes a more extensive
discussion of this result and its use in adjusting my estimates.) As obvious from the
above formula, the true treatment effect is zero if and only if the estimated treatment
effect is zero. Furthermore, any misclassification into the treatment and/or control group
will bias the estimated treatment effect downward. Therefore, my estimates of the effect
of the deferment rules on natality are conservative. If, for example, 65% of women in the
baseline treatment group and 11% of women in the control group had babies with men of
the draft-eligible age (as suggested by the Natality Detail File estimates), the correct
magnitude of the baseline coefficients on the interaction dummies for months 10 and 12
after the Executive Order issuance (i.e., months 8 and 10 after the Selective Service
announcement) would be nearly double (0.016/(0.89+0.65-l)=0.030 and
0.017/(0.89+0.65-l)=0.031, respectively). Similarly, in the specification where teenagers
are added to the treatment group, the corrected statistically significant coefficients
(months 10 to 13 after the Executive Order issuance) would be 0.040, 0.025, 0.037, and
0.026, respectively.
Reproduced with permission of the copyright owner. Further reproduction prohibited without permission.

102
To attach meaning to these estimates, I calculate the predicted increase in the
number of births. First, I consider the baseline case with no correction for
misclassification. Using the actual number of deliveries obtained from the Vital Statistics
suggests that the number of first births increased by 6,488 as a result of the new draft
policy announcements.32 Next, using the corrected treatment effects and recognizing that
65% of mothers 20-24 years old and 11% of mothers 25-29 years old were “at risk”
modifies the estimate to 8,283. And, finally, using the baseline estimates but taking into
account that a fraction of the teenage group could have been affected by the new draft
policies further increases the predicted effect to 15,532.
When teenagers are directly added to the treatment group, the magnitude of the
estimated effect increases further. In particular, my results indicate that the number of
first births might have increased by as many as 19,540 in June and August 1966. In fact,
when all the statistically significant coefficients from the alternative specification are
employed, the predicted number of additional first births delivered between June and
September 1966 rises to 32,914.
3.3.4. Robustness Checks
To check the robustness of the baseline results, several alternative specifications
of the difference-in-differences model are estimated.33 First, I add dummy variables for
32 Let Yi denote the number o f first births, Y2 the number o f subsequent births, and Z the policy change of interest. Then, t = d (Y ]IY ]+ Y 1)ldZ = [(SY,/3Z)*( Y^+Y1)-Y x*(dYlldZ + oY2/dZ)]/( Y ^ ) 2, where dY2/dZ is assumed to be 0 (this assumption is verified in my analysis o f subsequent births). Thus, 5YJdZ = t*(Yi+Y 2)2/Y 2- Using the actual numbers o f first and subsequent births to women 20-24 years old reported in the Vital Statistics yields: dY\!dZ = (0.016*107,0422/61,796 =) 2,967 (June 1966) + (0.017*116,8862/65,966 =) 3,521 (August 1966) = 6,488.
Reproduced with permission of the copyright owner. Further reproduction prohibited without permission.

103
all the remaining months after the Executive Order issuance as well as their interactions
with the treatment dummy to the baseline regression. This way, the Executive Order of
August 1965 and the Selective Service announcement of October 1965 are allowed to
have an effect on fertility throughout the entire period from September 1965 to December
1968. Results from this specification are very similar to those reported in the first
column of Table 3.
Next, I consider the possibility that the trend in the “first-born infants/all infants”
ratio was not linear (for either the treatment or the control cohort) in the mid-1960’s. To
allow for this possibility, I follow Card and Lemieux (2001, 2002) and add a quadratic
time variable to the simple linear time term and the full set of month dummies when
detrending and deseasonalizing the original series. I then use the residuals from this
analysis in the difference-in-differences type of model. The magnitude of the coefficients
on the interaction dummies of interest (10 months after each of the policy changes)
decreases only very slightly and both variables remain highly statistically significant.
None of the other interaction dummies reaches statistical significance at the 95%
confidence level. As before, the main conclusions do not change when the full model
(with dummies for all months after September 1965) is estimated.
To verify the causality of the relationship, I also estimate the above models for an
artificial (i.e., unreal) policy change. In particular, I assume that instead of being
announced in the summer of 1965, the new draft rules were announced, alternatively, in
the summer of 1962, 1963, 1964, 1966, or 1967. As hypothesized, the policy coefficients
of interest never approach statistical significance in these models.
33 Results from all alternative estimations are available upon request.
Reproduced with permission of the copyright owner. Further reproduction prohibited without permission.

104
Further, to verify that the number of subsequent births is not driving my results, I
use the number of subsequent births instead of the “first-born infants/all infants” ratio as
the dependent variable. As expected, there is no difference between the treatment and
control groups of mothers following the policy changes.
Also, since the use of the “first-bom infants/all infants” ratio imposes a functional
restriction on the model, I replace this variable with the number of first birth and add the
number of subsequent births (as well as its interaction with the treatment group
membership) on the right-hand side (Table 4). Both of the new regressors are positive
and highly statistically significant but the main results remain qualitatively the same. The
magnitude of the estimates is very similar as well. In particular, the new results indicate
that the number of first births increased by 2,576 and 3,759 in June and August 1965,
respectively. The sum of these two effects, i.e., 6,355 additional first births, is very close
to the 6,488 additional births predicted by the baseline model (without correction for
misclassification).
Finally, in order to formally test the joint hypothesis that the proportion of first
births increased significantly in months 9 and 10 after each of the policy changes, I
replace the individual dummies for months 9 to 12 after the Executive Order issuance
(i.e., months 7 to 10 after the October 1965 Selective Service announcement) by a single
dummy variable. As expected, the coefficient on this variable interacted with the
treatment group membership is large and highly statistically significant (8 =0 .010,
SE=0.004 for the baseline treatment group and 8 =0.017, SE=0.004 for the treatment
group including teenagers). Other coefficients in the model are unaffected by this change.
Reproduced with permission of the copyright owner. Further reproduction prohibited without permission.

105
3.4. Conclusions
The magnitude of the effect of the Vietnam War paternity deferments on the
decision to start a family estimated in this paper is quite substantial. In particular, the
calculated conservative increase in the number of first births by 15,532 in June and
August 1966 represents over 7% of the total number of first deliveries in those two
months. It also corresponds to about 28% of the Selective Service System calls for
inductees in those months (The Selective Service System 1968). This finding adds to a
growing body pf evidence that government interventions may indeed affect individuals’
reproductive behavior. It also adds to the list of potentially long lasting effects of the
Vietnam War draft policies.
An interesting question that remains is to what extent the increase in the number
of births in the summer of 1966 translated into an increase in completed fertility and to
what extent it represented a mere change in birth timing. Unfortunately, this issue is
difficult to address with existing data.34 The consequences of either change - in terms of
maternal education, labor market behavior, marital decisions, maternal and child health,
341 have examined the CPS 1995 Fertility and Marital History Supplement and obtained the distribution of the lifetime number o f births (completed fertility) for women 20-24 years old at their first delivery whose first child was bom in the summer o f 1966. I then compared this distribution to the corresponding distributions for women whose first delivery occurred in the summers o f 1962-1965 and 1967-1970. Unfortunately, the number o f observations (about 80 each year - 753 in total) was too low to enable reliable comparisons. Furthermore, the methodology used made it impossible to study the proportion of women with no births. This is an important limitation since, as Ananat et al. (2004) note, zero is the only point in the fertility distribution for which there is an unambiguous prediction: in the case examined here, the proportion o f childless women should fall. Following Ananat et al. (2004), I have therefore considered a complementary approach. In particular, I have used the method o f cohort analysis to study completed fertility o f women 10-14, 15-19, 20-24 (the exposed group), 25-29, and 30-34 years old in the year 1966. For the purposes at hand, however, this analysis proved too crude as the general decline in fertility over time strongly dominated any other fertility pattern.
Reproduced with permission of the copyright owner. Further reproduction prohibited without permission.

106
and other outcomes - could potentially be important.35 Thus, by influencing natality, the
draft deferments likely had other long lasting effects.
35 See, for example, Rosenzweig and Schultz (1985), Shapiro and Mott (1994), Angrist and Evans (1998), and Jacobsen et al. (1999) for the effects o f childbearing on women’s labor supply and earnings and Royer (2004) for the effects o f maternal age on infant health.
Reproduced with permission of the copyright owner. Further reproduction prohibited without permission.

107
Bibliography
Ananat, Elizabeth Oltmans; Jonathan Gruber, and Phillip B. Levine. 2004. “Abortion Legalization and Lifecycle Fertility,” NBER Working Paper No. 10705, National Bureau of Economic Research, Cambridge, Massachusetts.
Angrist, Joshua D. 1990. “Lifetime Earnings and the Vietnam Era Draft Lottery:Evidence from Social Security Administrative Records,” The American Economic Review, 80:3, pp. 313-336.
Angrist, Joshua D. 1991. “The Draft Lottery and Voluntary Enlistment in the Vietnam Era,” Journal o f the American Statistical Association, 86:415, pp. 584-595.
Angrist, Joshua D. and William N. Evans. 1998. “Children and Their Parents’ Labor Supply: Evidence from Exogenous Variation in Family Size,” American Economic Review, 88:3, pp. 450-77.
Baughman, Reagan and Stacy Dickert-Conlin. 2003. “Did Expanding the EITC Promote Motherhood?,” American Economic Review, 93:2, pp. 247-251.
The Boston Globe. 2000. “Republican Ticket Lets a Military Connection Slip,” The Boston Globe(http://www.boston.com/news/politics/president/bush/articles/2000/07/28/republican_tick et_lets_a_military_connection_slip; Accessed 10/03/2004).
Card, David and Thomas Lemieux. 2001. “Going to College to Avoid the Draft: The Unintended Legacy of the Vietnam War,” The American Economic Review, 91:2, pp. 97- 102 .
Card, David and Thomas Lemieux. 2002. “Did Draft Avoidance Raise College Attendance During the Vietnam War?,” Working Paper No. 46, Center for Labor Economics, University of California, Berkeley, California.
Crist, Thomas O. 2004. “Life Table Problem Set”(http://zoology.muohio.edu/crist/zoo204/Life_Table2.html; Accessed 11/03/2004).
Reproduced with permission of the copyright owner. Further reproduction prohibited without permission.

108
Dickert-Conlin, Stacy and Amitabh Chandra. 1999. “Taxes and the Timing of Births,” The Journal o f Political Economy, 107:1, pp. 161-177.
Gullason, Edward T. 1989. “The Consumption Value of Schooling: An Empirical Estimate of One Aspect,” The Journal o f Human Resources, 24:2, pp. 287-298.
Jacobsen, Joyce P.; James Wishart Pearce III, and Joshua L. Rosenbloom. 1999. “The Effects of Childbearing on Married Women’s Labor Supply and Earnings: Using Twin Births as a Natural Experiment,” Journal o f Human Resources, 34:3, pp. 449-74.
Lewbel, Arthur. 2003. “Estimation of Average Treatment Effects with Misclassification,” Boston College Working Paper in Economics No. 556, Boston College, Chestnut Hill, Massachusetts.
Milligan, Kevin. 2002. “Subsidizing the Stork: New Evidence on Tax Incentives and Fertility,” NBER Working Paper No. 8845, National Bureau of Economic Research, Cambridge, Massachusetts.
National Center for Health Statistics, Centers for Disease Control and Prevention. 1967-71. Vital Statistics o f the United States 1963-1968, Volume 3: Marriage and Divorce, (http://www.cdc.gov/nchs/products/pubs/pubd/vsus/1963/1963.htm; Accessed 11/03/2004).
Rosenzweig, Mark R. and Paul T. Schultz. 1985. “The Demand for and Supply of Births: Fertility and Its Life Cycle Consequences,” American Economic Review, 75:5, pp. 992- 1015.
Royer, Heather N. 2004. “What All Women (and Some Men) Want to Know: Does Maternal Age Affect Infant Health?,” University of California, Berkley, Center for Labor Economics Working Paper No. 68.
Shapiro, David and Frank L. Mott. 1994. “Long-Term Employment and Earnings of Women in Relation to Employment Behavior Surrounding the First Birth,” Journal o f Human Resources, 29:2, pp. 248-75.
The New York Times. 1965a. “Draft Expected to Call Students and Married Men,” The New York Times, October 27, pp. 1 and 4.
Reproduced with permission of the copyright owner. Further reproduction prohibited without permission.

109
The New York Times. 1965b. “Many Seek to Beat Deadline,” The New York Times, August 27, p. 10.
The New York Times. 1965c. “New Husbands Face Draft As Exemption Is Removed,” The New York Times, August 27, pp. 1 and 10.
The Selective Service System, Office of Public and Intergovernmental Affairs (http://www.sss.gov; Accessed 09/18/2004)
The Selective Service System. 1968. Annual Report o f the Director o f Selective Service for the Fiscal Year 1967 to the Congress o f the United States, Washington, DC: U.S. Government Printing Office.
Slate Chatterbox. 2004. “Elizabeth Cheney, Deferment Baby; How Dick Cheney Dodged the Vietnam Draft,” Slate Chatterbox (http://slate.msn.com/id/2097365; Accessed 09/16/2004).
U.S. Department of Health, Education, and Welfare. 1963-77. Vital Statistics o f the United States 1961-1975, Volume 1: Natality, Washington, D.C.: U.S. Department of Health, Education, and Welfare.
U.S. Dept, of Health and Human Services, National Center for Health Statistics. 1970-72. Natality Detail File, 1969-71. Hyattsville, MD: US Dept, of Health and Human Services, National Center for Health Statistics [producer], 1970-72. Ann Arbor, MI: Interuniversity Consortium for Political and Social Research [distributor], 2002.
The Washington Post. 1965a. “Maryland Plans Draft of Husbands,” The Washington Post, October 27, p. B l.
The Washington Post. 1965b. “Draft Delays Ended for Newlywed,” The Washington Post, August 27, p. A12.
Whittington, Leslie A.; James Aim, and Elizabeth Peters. 1990. “Fertility and the Personal Exemption: Implicit Pronatalist Policy in the United States,” American Economic Review, 80:3, pp. 545-56.
Reproduced with permission of the copyright owner. Further reproduction prohibited without permission.

Tota
l nu
mbe
r of
indu
ctio
ns
110
Figure 1.
Monthly Number of Inductions United States, 1963-1966
60,000
|38,691men I inducted
50,000
40,000
30,000
20,000 [5,815 men inducted
10,000
Y e a r 196 5
4824 360 12
M onth/year
Figure 2.
Proportion of 1st Births by Month and Year of Birth United States, 1961-1970
0.5
0.4
August 1966:12 m onths after the Executive Order 11241 issuance/ 10 m onths after the O ctober 1965 Selective Service announcem ent
0.3
0.2
[January 1963 [December 1968
80 100 12020 600 40
M onth/year of birth
| — " M o th e rs 20-24 years old Mothers 2 5 -2 9 years old]
Reproduced with permission of the copyright owner. Further reproduction prohibited without permission.

Prop
ortio
n of
1st
birt
hs
111
Figure 3.
Proportion of 1st Births by Month and Year of Birth United States, 1963-1968; Detrended and Deseasonalized
August 1966 :12 m onths after the Executive Order 11241 issuance/ 10 m onths after the O ctober 1965 Selective Service announcem ent0.03
0.02
0.01
048
- 0.01
Months 12 and 22 after the 1966 spike
- 0.02
-0.03
Month/year of birth
Mothers 20-24 years old Mothers 25-29 years old
Figure 4.
Interval Since Last Live Birth for Second Births United States, 1969-1971
3.5I Months 13 and 23
2.5
oO)njcoe4)O.
0.5
0 20 40 60 80 100 120
N um ber o f m on ths s in c e la s t live birth
1969 1970 1971
Source: Natality Detail Files 1969-1971
Reproduced with permission of the copyright owner. Further reproduction prohibited without permission.

112
Table 1. Median Age of Brides and Grooms at the Time of First MarriageUnited States, 1963-1968
Year Median age of brides Median age of grooms Difference in median age1963 20.3 22.5 2.21964 20.5 23.0 2.51965 20.4 22.5 2.11966 20.3 22.6 2.31967 20.8 22.9 2.11968 20.6 22.4 1.8
Source: National Center for Health Statistics, CDC (1967-71)
Table 2. Percentages of Fathers 19 to 25 Years Old by Mother’s Age United States, 1969-1971
Year 1969 1970 1971
% missing info on father’s age 9.18 9.70 9.89
Mother’s age cohort
20 to 24 years old (baseline treatment group) 64.82 65.10 65.46
15 to 24 years old (alternative treatment group) 68.30 68.33 68.62
25 to 29 years old (control group) 11.18 10.84 11.20
Source: U.S. Dept, o f Health and Human Services, National Center for Health Statistics (1970-72)
Table 3. The Effects of the Vietnam War Paternity Deferments on the Proportion of 1st Births; United States, 1963-1968; OLS Estimation
Variable Parameter estimateBaseline
treatment group (20-24
years old)
Alternative treatment
group (15-24 years old)
Treatment cohort -0.001(0.001)
-0.001(0.001)
8 months after the Executive Order 11241 issuance/ 6 months after the October 1965 Selective Service announcement
-0.003(0.006)
-0.003(0.005)
9 months after the Executive Order 11241 issuance/ 7 months after the October 1965 Selective Service announcement
-0.001(0.006)
-0.001(0.005)
10 months after the Executive Order 11241 issuance/ 8 months after the October 1965 Selective Service announcement
-0.004(0.006)
-0.004(0.005)
11 months after the Executive Order 11241 issuance/ 9 months after the October 1965 Selective Service announcement
0.004(0.006)
0.004(0.005)
12 months after the Executive Order 11241 issuance/10 months after the October 1965 Selective Service announcement
0.002(0.006)
0.002(0.005)
Reproduced with permission of the copyright owner. Further reproduction prohibited without permission.

113
13 months after the Executive Order 11241 issuance/ 11 months after the October 1965 Selective Service announcement
0.002(0.006)
0.002(0.005)
14 months after the Executive Order 11241 issuance/ 12 months after the October 1965 Selective Service announcement
0.007(0.006)
0.007(0.005)
8 months after the Executive Order 11241 issuance/ 6 months after the October 1965 Selective Service announcement * Treatment cohort
-0.003(0.008)
0.007(0.008)
9 months after the Executive Order 11241 issuance/ 7 months after the October 1965 Selective Service announcement * Treatment cohort
-0.001(0.008)
0.011(0.008)
10 months after the Executive Order 11241 issuance/ 8 months after the October 1965 Selective Service announcement * Treatment cohort
0.016**(0.008)
0.023***(0.008)
11 months after the Executive Order 11241 issuance/ 9 months after the October 1965 Selective Service announcement * Treatment cohort
0.007(0.008)
0.014*(0.008)
12 months after the Executive Order 11241 issuance/10 months after the October 1965 Selective Service announcement * Treatment cohort
0.017**(0.008)
0.021***(0.008)
13 months after the Executive Order 11241 issuance/11 months after the October 1965 Selective Service announcement * Treatment cohort
0.011(0.008)
0.015**(0.008)
14 months after the Executive Order 11241 issuance/12 months after the October 1965 Selective Service announcement * Treatment cohort
0.003(0.008)
0.005(0.008)
The dependent variable is the linearly detrended and deseasonalized proportion o f first births to all U.S. births. An intercept term (not statistically significant) was included in the model. Standard errors are given in parentheses. ***, **, and * denote statistical significance at the 99%, 95%, and 90% confidence levels, respectively.
Table 4. The Effects of the Vietnam War Paternity Deferments on the Number of 1st Births; United States, 1963-1968; OLS Estimation
Variable Parameter estimateBaseline treatment
group (20-24 years old)Treatment cohort 455.19
(6423.44)Number of subsequent births 0.31***
(0.05)Number of subsequent births* Treatment cohort 0.35***
(0.09)8 months after the Executive Order 11241 issuance/ 6 months after the October 1965 Selective Service announcement
-20.28(950.42)
9 months after the Executive Order 11241 issuance/ 7 months after the October 1965 Selective Service announcement
419.63(978.87)
10 months after the Executive Order 11241 issuance/ 8 months after the October 1965 Selective Service announcement
140.84(969.92)
11 months after the Executive Order 11241 issuance/ 9 months after the October 1965 Selective Service announcement
1358.64(1015.25)
12 months after the Executive Order 11241 issuance/ 10 months after the October 1965 Selective Service announcement
862.29(982.75)
13 months after the Executive Order 11241 issuance/11 months after the October 1965 Selective Service announcement
841.22(976.81)
Reproduced with permission of the copyright owner. Further reproduction prohibited without permission.

114
14 months after the Executive Order 11241 issuance/ 12 months after the October 1965 Selective Service announcement
1357.21(978.84)
8 months after the Executive Order 11241 issuance/ 6 months after the October 1965 Selective Service announcement * Treatment cohort
-1256.40(1344.63)
9 months after the Executive Order 11241 issuance/ 7 months after the October 1965 Selective Service announcement * Treatment cohort
-966.06(1379.01)
10 months after the Executive Order 11241 issuance/ 8 months after the October 1965 Selective Service announcement * Treatment cohort
2576.34*(1391.64)
11 months after the Executive Order 11241 issuance/ 9 months after the October 1965 Selective Service announcement * Treatment cohort
1476.56(1446.25)
12 months after the Executive Order 11241 issuance/10 months after the October 1965 Selective Service announcement * Treatment cohort
3758.99***(1407.67)
13 months after the Executive Order 11241 issuance/11 months after the October 1965 Selective Service announcement * Treatment cohort
2430.89*(1382.85)
14 months after the Executive Order 11241 issuance/ 12 months after the October 1965 Selective Service announcement * Treatment cohort
1134.80(1372.37)
The dependent variable is the linearly detrended and deseasonalized number o f first U.S. births. An intercept term was included in the model. Standard errors are given in parentheses. *** and * denote statistical significance at the 99% and 90% confidence levels, respectively.
Reproduced with permission of the copyright owner. Further reproduction prohibited without permission.

115
Technical Appendix: Estimation of Average Treatment Effects with Misclassification
Based on: Lewbel, Arthur. 2003. “Estimation o f Average Treatment Effects with Misclassification,” Working Paper. (Especially “Identification by Known Misclassification Probabilities” - pp. 5-8 and “Proof of Theorem 1” - pp. 24-25) - http://www2.bc.edu/~lewbel/mistreal 1 .pdf
Notation:
Y observed outcomep* actual treatmentT reported treatmentt= 1 receiving treatmentt = 0 no treatmentY(t) outcome from treatment T* = tX vector of observable covariates
Tl: T = 1 T2: T = 0
Definitions:
p0(x) = E[I(T*=0)|X=x, T=0] = D/(C+D) = D/T2 (= 0.89)pi(x) = E[I(T*=l)|X=x, T=l] = A/(A+B) = A/Tl (= 0.65)
-> the relative sizes of groups “T=l” and “T=0” do not matter for the calculation of po(x) and pi(x)
b0(x) = E[I(T=l)|X=x, T*=0] = B/(B+D)bi(x) = E[I(T=0)|X=x, T*=l] = C/(A+C)
-> the relative sizes of groups “T=l” and “T=0” do matter for the calculation of bo(x) and bi(x)
r*(x) = E[T*|X=x]
ht*(x) = E[Y|X=x, T*=t] = (from assumption #2 below) E[Y|X=x, T*=t, T]
t*(x) = E[Y|X=x, T*=l] - E[Y|X=x, T*=0] = hi*(x) - h0*(x) = (from assumption #1 below) E[Y(l)-Y(0)|X=x] -> the average treatment effect
t (x ) = E[Y|X=x, T=l] - E[Y|X=x, T=0]
Reproduced with permission of the copyright owner. Further reproduction prohibited without permission.

116
Assumptions (pp. 5-7 in Lewbel 2003):
1. unconfoundedness: E[Y(t)|T*, X] = E[Y(t)|X] -> treatment group membership has no effect on outcomes other than through the effects of treatment itself -> O.K.
2. E[Y|X, T*, T] = E[Y|X, T*] assignment into the treatment group has no effect on outcomes when true treatment group membership is controlled for -> O.K.
3. i) b0(x) + bi(x)< 1(b0(x) + b,(x) = 0.35*T1/(0.35*T1+0.89*T2) + 0.11*T2/(0.11T2+0.65T1)= (0.0385*T1*T2 + 0.2275*T12 + 0.0385*T1*T2 + 0.0979 T22) / (0.0385*T1*T2 + 0.2275*T12 + 0.5785*T1*T2 + 0.0979 T22) < 1)
O.K.
ii) E[T*|X=x, T=l] ^ E[T*|X=x, T=0](E[T*\X=x, T=l] = 0.65 ] E[T*\X=x, T=0] = 0.11)
O.K.
iii) 0 < r*(x) < 1r*(x) = (A+C)/(A+B+C+D) O.K.
4. x(x) is identified, i.e., consistently estimated
Derivation (pp. 24-25 in Lewbel 2003):
E[Y|X=x, T=l] = E[Y|X=x, T=l, T*=0]*Pr(T*=0|X=x, T=l) + E[Y|X=x, T=l, T*=l]*Pr(T*=l|X=x, T=l) = h0*(x)[l- pi(x)] + hi*(x) pi(x)
E[Y|X=x, T=0] = E[Y|X=x, T=0, T*=0]*Pr(T*=0|X=x, T=0) + E[Y|X=x, T=0, T*=l]*Pr(T*=l|X=x, T=0) = h0*(x) p0(x) + h1*(x)[l-p0(x)]
-> t(x) = h0*(x)[l- pi(x)] + hi*(x) pi(x) - h0*(x) p0(x) - hi*(x)[l-p0(x)]= h0*(x)[l- p0(x) - pi(x)] + hi*(x)[-l+ p0(x) + pi(x)] = [hi*(x) - h0*(x)][p0(x) + pi(x) -1] = T*(x) [po(x) + Pi(x) - 1]
-»T *(x) = T(xVrDn(x) + Pi(x)- 11
(t *(x ) = T (x)/[0.89 + 0.65-1] = x(x)/0.54)
Reproduced with permission of the copyright owner. Further reproduction prohibited without permission.