Public Policies and Women's Employment after Childbearing
48
IZA DP No. 3937 Public Policies and Women's Employment after Childbearing Wen-Jui Han Christopher Ruhm Jane Waldfogel Elizabeth Washbrook DISCUSSION PAPER SERIES Forschungsinstitut zur Zukunft der Arbeit Institute for the Study of Labor January 2009
Transcript of Public Policies and Women's Employment after Childbearing

IZA DP No. 3937
Public Policies and Women's Employment afterChildbearing
Wen-Jui HanChristopher RuhmJane WaldfogelElizabeth Washbrook
DI
SC
US
SI
ON
PA
PE
R S
ER
IE
S
Forschungsinstitutzur Zukunft der ArbeitInstitute for the Studyof Labor
January 2009
Public Policies and Women’s Employment after Childbearing
Wen-Jui Han Columbia University
Christopher Ruhm
University of North Carolina at Greensboro, NBER and IZA
Jane Waldfogel
Columbia University
Elizabeth Washbrook CMPO, University of Bristol
Discussion Paper No. 3937 January 2009
IZA
P.O. Box 7240 53072 Bonn
Germany
Phone: +49-228-3894-0 Fax: +49-228-3894-180
E-mail: [email protected]
Any opinions expressed here are those of the author(s) and not those of IZA. Research published in this series may include views on policy, but the institute itself takes no institutional policy positions. The Institute for the Study of Labor (IZA) in Bonn is a local and virtual international research center and a place of communication between science, politics and business. IZA is an independent nonprofit organization supported by Deutsche Post World Net. The center is associated with the University of Bonn and offers a stimulating research environment through its international network, workshops and conferences, data service, project support, research visits and doctoral program. IZA engages in (i) original and internationally competitive research in all fields of labor economics, (ii) development of policy concepts, and (iii) dissemination of research results and concepts to the interested public. IZA Discussion Papers often represent preliminary work and are circulated to encourage discussion. Citation of such a paper should account for its provisional character. A revised version may be available directly from the author.

IZA Discussion Paper No. 3937 January 2009
ABSTRACT
Public Policies and Women’s Employment after Childbearing*
This paper examines how the public policy environment in the United States affects work by new mothers following childbirth. We examine four types of policies that vary across states and affect the budget constraint in different ways. The policy environment has important effects, particularly for less advantaged mothers. There is a potential conflict between policies aiming to increase maternal employment and those maximizing the choices available to families with young children. However, this tradeoff is not absolute since some choice-increasing policies (generous child care subsidies and state parental leave laws) foster both choice and higher levels of employment. JEL Classification: J13, J18, J22 Keywords: public policies, maternal employment, childbearing Corresponding author: Elizabeth Washbrook Bristol Institute of Public Affairs 2 Priory Road Bristol, BS8 1TX United Kingdom E-mail: [email protected]
* We gratefully acknowledge funding support from NICHD and the Leverhulme Trust.

1
INTRODUCTION
American women begin work quickly after giving birth compared with their counterparts
in other developed nations – for example, 41% have worked by three months after the birth
compared with only 7% in the UK.1 The public policy environment facing new mothers in the
United States also differs substantially from those in other nations in terms of parental leave
rights, provision of universal child care, and cash assistance for families with young children
(Waldfogel 2001). A number of studies have explored the association between parental leave
rights and longer work absences (Jaumotte 2004; Pettit and Hook 2005; Baker and Milligan
2007; Han, Ruhm and Waldfogel 2009) yet these are not the only public policies that shape the
choices available to new parents. In this paper we consider the work incentives generated by
leave laws alongside three other policies that affect budget constraints in different and
potentially conflicting ways. Specifically, we examine how state parental leave laws, child care
subsidies, cash welfare and Food Stamp benefit generosity, and welfare work requirements for
mothers of infants affect the employment patterns of mothers of newborns and young
children. Fundamental to our analysis is the recognition that the opportunities available vary
substantially with socio‐economic status and geographic location, and that the policies we
examine target different groups and have varying effects on work incentives.
We know surprisingly little about how the policy environment affects the work decisions
of American women with infants and young children. This study begins to fill this gap through
analysis of the Early Childhood Longitudinal Study‐Birth Cohort (ECLS‐B), a nationally
1 Authors’ calculations from the Early Child Longitudinal Birth Cohort study (2001) and the Millennium Cohort Study (2000/1) respectively

2
representative sample of more than 10,000 U.S. women giving birth in 2001. We exploit both
cross‐state variation and differential targeting of the policies to identify plausibly causal effects
on work participation, as measured by the probability of working at or before 12 weeks and by
9 months post‐birth, with limited additional analysis of longer‐term effects on employment
around the time of the child’s fourth birthday. These estimates are used to illustrate potential
effects of different policy packages implemented at the national level, paying special attention
to the results of implementing a bundle of “work maximization” policies, designed to increase
early work participation, and of a “choice promotion” package, intended to provide mothers
with the greatest freedom of opportunities. Three of the four focal policies are targeted at
relatively disadvantaged women, so our conclusions are particularly relevant for them.
The policy environment matters. Moving from a package of policies with the weakest to
the strongest employment incentives is predicted to increase the fraction of mothers working
at or before their child’s ninth month by around eight percentage points, with much stronger
effects for single or less educated mothers. It is noteworthy that some policies increasing the
choices available to new mothers – child care subsidies and parental leave laws – are also
associated with increased employment, suggesting that the twin goals of providing choice and
encouraging work may not be incompatible.
That said, the most work promoting policies include those that decrease nonearned
incomes (e.g. by limiting welfare work exemptions and providing low levels of transfer
payments) and have the potential to reduce the well‐being of mothers. Thus we provide
information about but can not determine the “optimal” mix of public policies. Doing so requires
evaluation of tradeoffs between the potentially conflicting goals of protecting the employment

3
rights of mothers and incomes of families during the period surrounding a birth versus
attempting to maximize the employment of mothers (particularly the disadvantaged), which
has been a key policy goal of welfare reform.
STATE POLICIES
This section details our focal policies, discusses their likely effects on early maternal
employment, and illustrates the geographical variation in each type of policy.
State parental leave laws
Parental leaves laws increase the choices available to new mothers by extending the
time they can take off work without forfeiting their pre‐birth jobs. Klerman and Leibowitz
(1997) point out that these entitlements are expected to increase leave‐taking but have
ambiguous effects on work, primarily because some parents may choose a short job‐protected
leave rather than a longer absence that requires finding a new job (see Ruhm 1998 and
Waldfogel 1999 for related discussions). One result is that the effects of such laws may differ in
the short‐term and medium‐term. For instance, work might decrease during the leave period
but rise subsequently, because covered women can more often continue in their pre‐birth
positions rather than having to search for new jobs.
Mothers of the ECLS‐B cohort children gave birth in 2001 and so were all covered by the
federal 1993 Family and Medical Leave Act (FMLA). Therefore we cannot evaluate the impact of
the FMLA but rather focus on state leave laws.2 Fewer than one‐half of private sector workers
2 Prior research indicates that the FMLA has no overall effect on post‐childbirth employment but is associated with more leave‐taking and so some initial decreases in work (Han, Ruhm, and Waldfogel, 2009). Ross (1998), Waldfogel (1999) and Han and Waldfogel (2003) provide further evidence on the FMLA, and Klerman and Leibowitz (1997) analyze state leave laws in the period prior FMLA enactment.

4
meet the qualifying conditions for FMLA (Waldfogel 2001), but 15 states have state parental
leave laws more generous than the federal law. Many increase coverage by relaxing the FMLA
conditions on firm size, tenure, or work hours requirements (see Appendix Table 1).3 Some
states allow for unpaid leaves in excess of 12 weeks, and five states have temporary disability
insurance (TDI) laws that provide a short (typically six weeks) period of paid leave. Our main
analysis uses a binary indictor distinguishing states with any leave law, regardless of its terms,
from those with just the federal FMLA. We explored the differential effects of the various types
of state leave laws, but collinearity and small samples precluded meaningful analysis of this
issue.
Figure 1a depicts the geographical variation in state leave laws. Generous leave
entitlements tend to be located in the west coast, great lakes, and northeast regions.
Child care subsidies for low income families
Child care subsidies raise the net income a mother receives from given work hours and
so are likely to increase rates of employment. Subsidies also lower the cost of paid versus
unpaid care, and so make (relatively costly) formal child care more affordable, presumably
leading to a substitution of paid and formal care for unpaid and informal care.
Although Blau and Currie (2004) argue that previous research suggests a small overall
elasticity of employment with respect to child care prices, Blau and Tekin (2007) emphasize that
child care subsidies are typically much larger for low‐income families and are targeted towards
3 The FMLA provides 12 weeks of unpaid parental leave to those in firms of 50 or more employees who worked at least 1,250 hours in the prior year. We do not code state laws that are restricted to state government employees as these cover only a small share of the workforce. Han, Ruhm, and Waldfogel (2009) provide a detailed discussion of state leave laws.

5
certain population sub‐groups, whose responsiveness may be relatively high. Support for this is
obtained from studies of local subsidy programs implemented prior to the 1996 welfare
reforms (Berger and Black 1992; Anderson and Levine 2000; Meyers et al. 2002), which found
substantial positive employment effects for low income or disadvantaged groups.
Under welfare reform, child care funding was consolidated into the Child Care and
Development Fund (CCDF) block grant, with total state and federal subsidies increasing from
$1.7 billion in 1992 to $9.5 billion in 2000 (Gish 2002). The CCDF allows states to serve families
with incomes up to 85 percent of state median income (many states set lower thresholds) and
where the parents are working or in school. States determine child care prices and parent co‐
payment rates, and must offer a choice of child care types and providers. They can also transfer
funds from their TANF block grants to CCDF and may use TANF funds to directly purchase some
child care. A small amount of funding is also available through the federal Social Services Block
Grant.
Evidence on the employment effects of these dramatic expansions in child care
subsidies is limited. Blau and Tekin (2007), using data for 13 states in 1999, estimated that child
care subsidy receipt increased the employment of single mothers by 33 percentage points.
Tekin (2007) estimated that a one dollar wage subsidy raised the employment of single mothers
by 7 percentage points versus 3.7 points for a corresponding child care subsidy. However per
dollar of government funds, the latter is more cost‐effective, because it only targets working
mothers using paid child care and not all employed mothers. Magnuson, Meyers, and
Waldfogel (2007) find that increased child care subsidies explained 14 to 16 percent of the rise
in formal child care enrollment occurring between 1992 and 2000, among preschool‐age

6
children from low‐income families, but they did not examine maternal employment. Lefebvre
and Merrigan (2008) show that Quebec’s $5‐a‐day day‐care policy had large and statistically
significant effects on the employment of Canadian mothers with young children. A general
limitation of previous research is that it does not focus on parents of newborns, who might be
especially sensitive to child care subsidies because of the relatively high costs of infant care.
Conversely, preferences for parental versus non‐parental care could be relatively price‐inelastic
during this period.
We measure child care subsidies through a continuous variable capturing federal and
state Child Care Development Fund (CCDF) expenditures in fiscal year 2000 (in 2001 dollars) per
poor child under the age of 6.4 The timing is not ideal since fiscal year 2000 covers October 1,
1999 to September 30, 2000, whereas the first 9 months of the ECLS‐B cohort extend from
January 1, 2001 to September 30, 2002 but expenditure data for the relevant period is not
available. We experimented with using a weighted average of child care subsidy allocations
(rather than expenditures) in FY 2001 and 2002. However, CCDF allocations and expenditures
vary substantially because some states roll funds over from one fiscal year to the next and the
correlation between the two in FY2000 – when both series are available ‐‐ is just 0.59. As the
correlation between expenditures in FY2000 and FY2003 is 0.97, we believe that the
expenditure series for 2000 fairly accurately reflects the subsidies available to ECLS‐B parents
during the first 9 months after the birth.
4 States receive a federal block grant earmarked explicitly for the CCDF and may transfer up to 30 percent of their TANF block grant directly to the CCDF. They can also use remaining TANF funds to subsidize child care directly (largely through vouchers). Our measure includes all three sources of child care subsidies.

7
Figure 1b shows that the geographical variation in average annual CCDF spending per
poor child under 6 follows a fairly strong north‐south divide. Spending is divided into low,
middle, and high categories in the figure but measured continuously in our multivariate
analysis.
Welfare work exemptions and benefit levels
Welfare work exemptions and generous transfer payments reduce the net gain from
employment and so are expected to discourage work participation. Consistent with this,
previous research finds that more work‐oriented welfare rules and lower welfare or Food
Stamp benefits raise the employment of single mothers (Blank 2002; Grogger and Karoly 2005).
However, few prior studies focus on those with young children or explicitly examine infant work
exemptions, which are among the most dramatic welfare reforms. (Before TANF, women were
generally exempted from welfare work requirements until their youngest child reached 36
months of age.) The limited available research finds that new mothers work more and breast‐
feed for shorter durations in states that do not exempt them from work requirements
(Jacknowitz and Schoeni 2003; Hill, 2007).
Other potential measures of welfare generosity include time limits on receipt and the
stringency of sanctions for families not complying with work requirements. However, these
measures are likely to be strongly correlated at the state level, and since we are examining the
behavior of families with newborns, the welfare work exemptions seem most relevant. We do
not examine the effects of expansions in the EITC program since most policy variation occurred
at the federal level.

8
We measure state welfare work exemptions for parents of infants using a dummy
variable equal to one for the 27 states providing an exemption of 12 months or more. Since 23
states had exemptions lasting exactly 12 months (see Appendix Table 2), this seems like a
sensible threshold. However, our results are robust to the use of other cut‐offs.
Transfer payment generosity is proxied by the maximum dollar value of TANF plus Food
Stamp (TANF‐FS) benefits in the state for a family of three.5 Again, we treat this as a continuous
variable in our multivariate analysis, but define low, middle and high categories for our
graphical presentation.
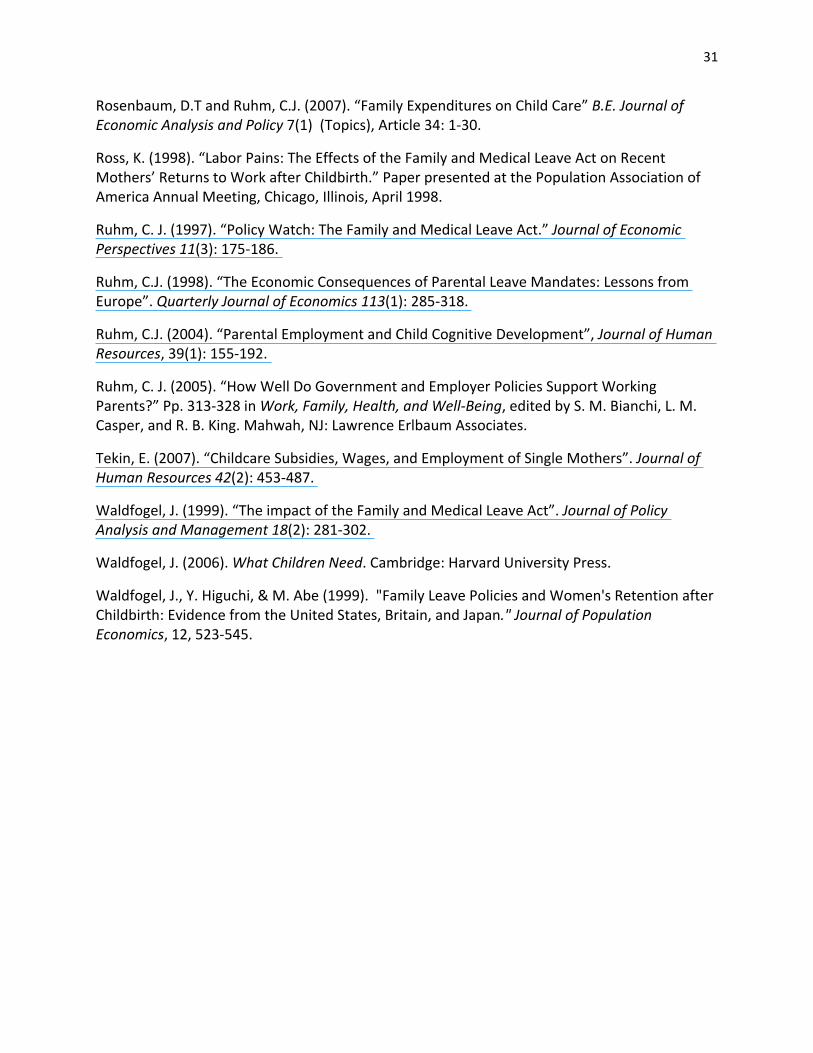
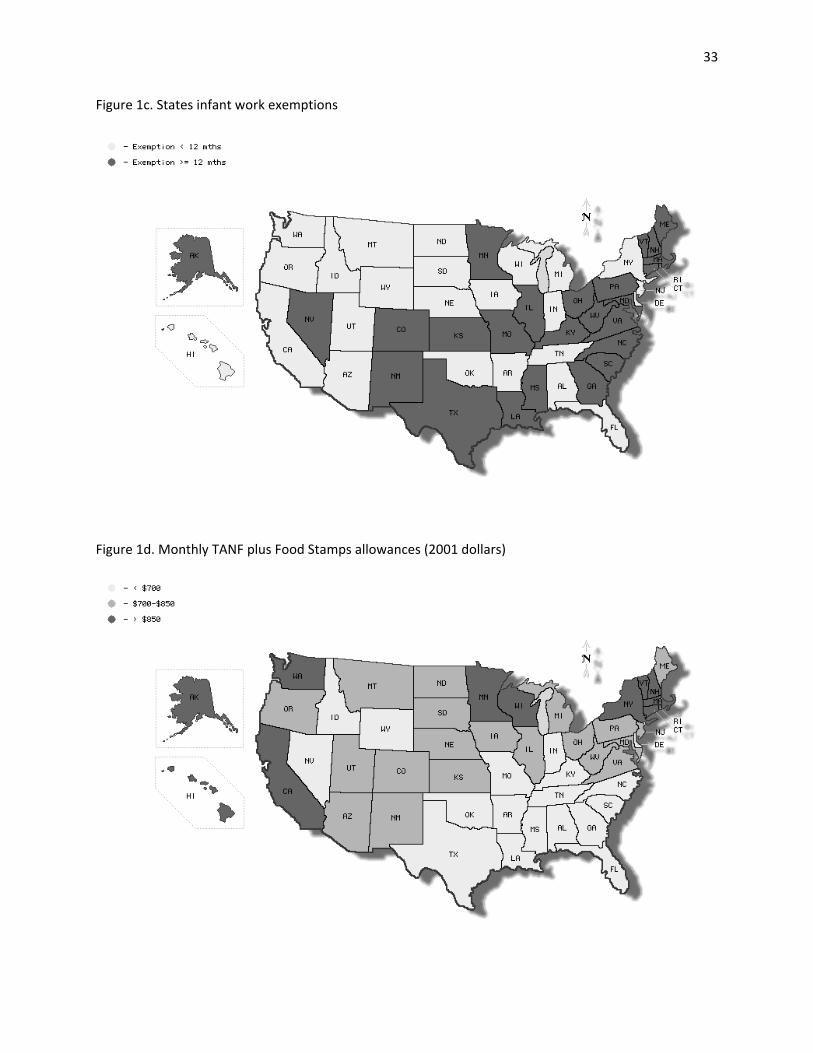
Figures 1c and 1d show that prolonged welfare work exemptions tend to be
concentrated in the south, southeast, and midwest , while TANF and Food Stamp benefits are
most generous in the northeast, upper midwest, and west, and least so in the south.
Other state policies and characteristics
Figures 1a to 1d showed that each of the four policies tend to be clustered
geographically but that the patterns differ markedly across the types of policies. These
variations are likely to be associated with differences in other state policies and characteristics,
as documented in Appendix Table 3. For instance, states with generous maternity leave tend to
have relatively high family incomes, union coverage, abortion rates, and Democratic state
legislators, but low rates of infant mortality or uninsured children. Generous leave rights are
5 Three is the most representative family size: in FY2001 the average size of TANF families was 2.6, such families averaged two recipient children, and 60 percent had only one adult recipient (2002 TANF Annual Report to Congress, available at http://www.acf.hhs.gov/programs/ofa/data‐reports/annualreport5/chap10.pdf).

9
also correlated with TANF‐FS benefits, child care subsidies, stringent child care regulations, high
child care worker wages, and more licensed child care centers.
EARLY CHILDHOOD LONGITUDINAL STUDY‐BIRTH COHORT
The ECLS‐B contains a nationally representative sample of children born in 2001, and
oversamples of Asian and Pacific Islanders, American Indian and Alaska Natives, Chinese
children, twins, and low birth weight infants.6 Information is available from the birth
certificate, baseline parent interviews, and child assessments when each child was
approximately 9 months old. Further survey waves were conducted when the child was 24
months old, and in the years immediately before and after kindergarten entry. The 9‐month
interview provided rich information on parental employment, demographic characteristics,
lifestyles, and behaviors. State of residence at birth, taken from the birth certificate, was used
to define the state policies relevant to each mother. We also made use of data on maternal
employment status from the pre‐kindergarten wave.
Outcomes
At the 9‐month interview, mothers were asked if they had worked for pay during the
last week and, if not working or on vacation/leave at that time, if they had done so at any time
since giving birth. If the answer to either question was yes, they were asked how old the child
was when they first went back to work. Using this information, we constructed dichotomous
work participation variables indicating whether the mother started working less than 12 weeks
6 Further information on the ECLS‐B is available at http://nces.ed.gov/ECLS/index.asp.

10
post‐birth and whether she had worked by 36 weeks (9 months) after it.7 Longer‐term effects
were examined by measuring whether the mother was working (or on vacation) in the fall of
the year prior to the child’s entering kindergarten. Eighty percent of sample children were 4
years old at this interview and, for the sake of brevity, we refer to this below as employment at
or around age 4. The sample size for this variable is reduced by attrition (N=8760), an issue we
address in our empirical estimation below.
Approximately 28 percent of mothers in our sample worked within 12 weeks of
childbirth, and 59 percent within 9 months, with a similar fraction working when their child was
around 4 years old (see Appendix Table 4). Figure 2 shows the geographical variation in work
participation rates by 9 months and indicates that mothers return to work relatively quickly in
the midwest, south, mid‐atlantic and mountain states, and slowly in the west and northwest.
Control Variables
We use the rich ECLS‐B data (detailed in Appendix Table 4) to control for differences in
maternal and family characteristics. These include standard demographic variables (e.g. marital
status, race/ethnicity, and education), information on the mother’s experiences in childhood
and later life, health‐related behaviors, attitudes towards motherhood, and her desired number
of children.
We also include additional controls to proxy characteristics that may affect the mother’s
propensity to work but differ systematically between states. However, in doing so, we exclude
7 The first (second) variable is coded as one if the answer to the age question was one or two months, or one to 11 weeks (one to 9 months, or one to 36 weeks). Mothers on leave are classified as not working. Observations for whom the respondent is not the biological mother (N = 146) were dropped from the sample, as were those for whom employment timing data was missing (N = 62), leaving an analysis sample of 10,480.

11
factors potentially affected by post‐birth employment (such as breast feeding), since their
inclusion might absorb a portion of the true policy effect. Specifically, we control for education
of the mother’s parents, whether she lived continuously with her biological mother and father
until age 16, and whether her family received welfare in childhood. We also include indicators
of long‐term health behaviors such as body mass index and alcohol use before pregnancy,
smoking, drinking/drug problems, criminal behavior, and psychological problems.
METHODS
Our analysis utilizes a difference‐in‐difference (DD) strategy that identifies “treatment”
and “control” groups for each policy. This is possible because the policies are likely to affect the
post‐birth employment of some groups of mothers but to have little or no effect on others.
Operationally, some individuals in our treatment groups may not actually be influenced by the
policies, while some in the control groups might be affected by them, with the result that our
estimates are likely to understate the true policy effects.
We take two further steps to reduce the effects of potential confounding factors. First,
we include state fixed effects, to sweep out influences that are common to all mothers in a
given state. Second, we include controls for the exhaustive set of characteristics detailed in
Appendix Table 4.
Formally, our estimating equation is:
( ){ } isp
pis
ps
ppis
pissis ITSTITXy εθγβα +×+++= ∑' , (1)
where is the outcome for individual i in state s, isy sα is a state fixed effect (a vector of state
dummy variables), is a vector of individual, child, and family characteristics, equals isX ' pisIT
12
one if the woman is in the treatment group for policy p and zero otherwise, and is the
state policy variable (e.g. a maternity leave entitlement more generous than the FMLA, a
welfare work exemption of a year or more, and levels of CCDF expenditures and TANF‐FS
allowances). , the estimated “treatment effect”, captures the treatment versus control
group difference in states with the specified policy relative to those without it.
psST
pθ
8
We report results of linear probability (LP) models for our dichotomous work
participation outcomes because LP coefficients are easier to interpret than corresponding
probit or logit estimates, especially when including interaction terms.9 However, prior to doing
so, we compared the results for LP and probit models for specifications that included all
covariates except the interactions. The magnitudes and statistical significance of the marginal
effects were quite similar, indicating that the linear probability results are informative. All
estimates are weighted to adjust for disproportionate sampling, survey nonresponse, and
noncoverage of the target population. The standard errors account for complex survey design.10
In addition to estimating treatment effects, we simulate overall effects of the policies,
either singly or in combination, on the work participation of new mothers. For these estimates,
each mother retains her individual characteristics, state fixed effect, and individual treatment
8 A standard difference‐in‐difference model also contains state policy variable “main effects” (not interacted with the individual treatment indicators). These are captured by the vector of state dummy variables in equation (1) and are directly controlled for in the models not including the former.
9 Ai and Norton (2003) show that probit or logit coefficients may have the opposite sign as the predicted effect of the interaction on the dichotomous dependent variable.
10 The standard errors tend to be somewhat larger than those obtained by clustering at the state level (Bertrand, Duflo and Mullainathan, 2004), which is less geographically disaggregated than the stratum and primary sampling unit clustering we use.

13
status. The state treatment indicator for each policy is then “switched on” or “off” to
correspond to a particular policy package, and the mother’s participation probability is
predicted from the estimated coefficients. We average this predicted probability over all
mothers (in the specified group) to obtain the simulated employment rate. The difference
between this prediction and an alternative is the estimated “effect” of the specified policy
change. Because the state policy variable is interacted with the individual treatment indicator,
only the treatment groups are assumed to be affected by the change in policies. For example,
the participation probability of married mothers is assumed to be unaffected by infant work
exemption policies, because the treatment group indicator (single parenthood) is set to zero.
Since our model is linear and additive, the effect of the policy on the participation rate is equal
to the coefficient on the interaction term multiplied by the proportion of women affected by
the policy change. The latter varies across policies and sub‐groups.
Formally, we estimate
( ){ }∑ ×+++=p
pis
ps
ppis
pissis ITSTITXy ** ˆˆˆ'ˆˆ θγβα (2)
Where is a set of values for the state treatment indicators corresponding to a specific
policy scenario, is individual i’s simulated probability of participation, and the “hats”
indicate regression estimates. For example, in one scenario we define such that all states
offer leave entitlements beyond the FMLA, have infant work exemptions lasting at least one
year, and provide CCDF and TANF‐FS allowances at the 90th percentile, a configuration we refer
to as “choice‐promoting”. The effect of switching to this policy scenario from the current one
(denoted without a star) for mothers in sub‐group j is:
*psST
*ˆisy
*psST

14
( ) ( ){ }∑ ∑∑∈∈
×−=−p Ji
pis
ps
ps
J
p
Jiisis
J
ITSTSTN
yyN
** 1ˆˆˆ1 θ (3)
Treatment and control groups
When evaluating state leave laws, our treatment group is mothers employed at some
point in the 12 months prior to the birth; those not so employed are the controls. The rationale
is that mothers who do not work during pregnancy are ineligible for leave and so cannot be
affected by leave rights.11 As mentioned, the treatment group contains some women
unaffected by the state policies. This occurs because most state laws relax qualifying conditions
for FMLA‐like benefits (although longer leaves are sometimes provided), implying that women
already eligible under the FMLA gain no additional rights. Mothers covered by employer leave
policies at least as generous as those provided by state laws will also be unaffected, as will
women remaining ineligible under the state laws.
We performed sensitivity analysis using mothers who separated from their pre‐birth
employers prior to delivery as an alternative control group (dropping from the sample those
who did not work in the year before birth). Such women have no access to maternity rights and
so cannot be affected by the terms of laws. This specification has the advantage of not being
affected by differences in the characteristics of mothers who did and did not work in the year
before birth (e.g. if high female employment rates affect the decision by states to adopt leave
laws). However, these are not our “preferred” estimates, because leave entitlements might
influence the decision of whether or not to quit jobs during pregnancy.
11 This assumes that the decision to work during pregnancy is not influenced by state leave policies, which seems reasonable in the U.S., since the leaves are short and mostly unpaid (in contrast to Europe where women often have strong incentives to work prior to birth, so as to qualify for lengthy paid leave).

15
The treatment group for child care subsidies is families where no parent has a high
school diploma. We define our treatment group according to parental education, even though
child care subsidies are targeted to low income families, to reduce the endogeneity problem
whereby child care costs influence work and therefore earnings. Our choice of educationally‐
disadvantaged households (the lowest 19% of the population) means that some proportion of
the control group will be eligible for child care subsidies. Nevertheless, since the subsidies are
awarded on a sliding scale (parental co‐payments depend on family income), they are likely to
provide far stronger incentives for less than more educated households. In sensitivity analyses
we widen the treatment group to include parents with high school diplomas and then those
with some college.
The treatment group consists of single mothers when considering infant welfare work
exemptions or TANF‐FS benefits. Based on evidence that state welfare policies do not
substantially affect marital status (Moffitt, 1998), this is an effective way to define welfare
eligibility. For instance, 66% of ECLS‐B mothers claiming welfare in the first 9 months post‐birth
were single (at the end of the period), compared with just 16% of those not on welfare. By
contrast, defining the treatment group by education yields equivalent figures of 47% and 17%
(79% and 37%) if less than 12th grade (high school graduate) is the threshold.12
UNADJUSTED DD ESTIMATES
Figures 3a through 3d use our difference‐in‐difference strategy to provide descriptive
evidence of how the four types of work‐family policies are related to the post‐birth work
12 These numbers are only suggestive since welfare participation does not identify all women whose decisions are affected by features of the system.

16
participation of mothers. For example, the dashed line in Figure 3a displays the extent to which
mothers who worked during the year before birth (the treatment group) are more likely to be
employed after it than those who did not work in the preceding year (the controls), for women
in states with a leave law. The solid line shows corresponding disparities for women in states
without leave laws. The difference between these two lines is the unadjusted (for other
characteristics) DD estimate, since it shows how the treatment‐control gap differs in states with
and without the specified policy.
The descriptive patterns suggest substantial and plausible policy effects. State leave
laws are associated with lower rates of work beginning 6 weeks after birth, with the largest
differences occurring between 8 and 15 weeks; the two groups have virtually identical
employment probabilities from 17 to 23 weeks, with some evidence of higher rates of work for
the treatment group 6 months or more after birth. Such patterns are consistent with findings
from the U.K. (Gregg, Gutierrez‐Domenech and Waldfogel, 2007) and make sense, since state
leave laws allow some women to take additional leave shortly after pregnancy but may
eventually raise work participation by increasing job continuity.
High child care subsidies (>$2500 per poor child under 6) are associated with substantial
increases in post‐birth work, as shown in Figure 3b, compared with either medium ($1500‐
$2500) or small (<$1500) amounts. Employment begins to rise within a month after birth and is
sustained throughout the first nine months. There is also some suggestion that intermediate
subsidy levels elevate work participation in the second and third months, but these differences
are small and disappear quickly.

17
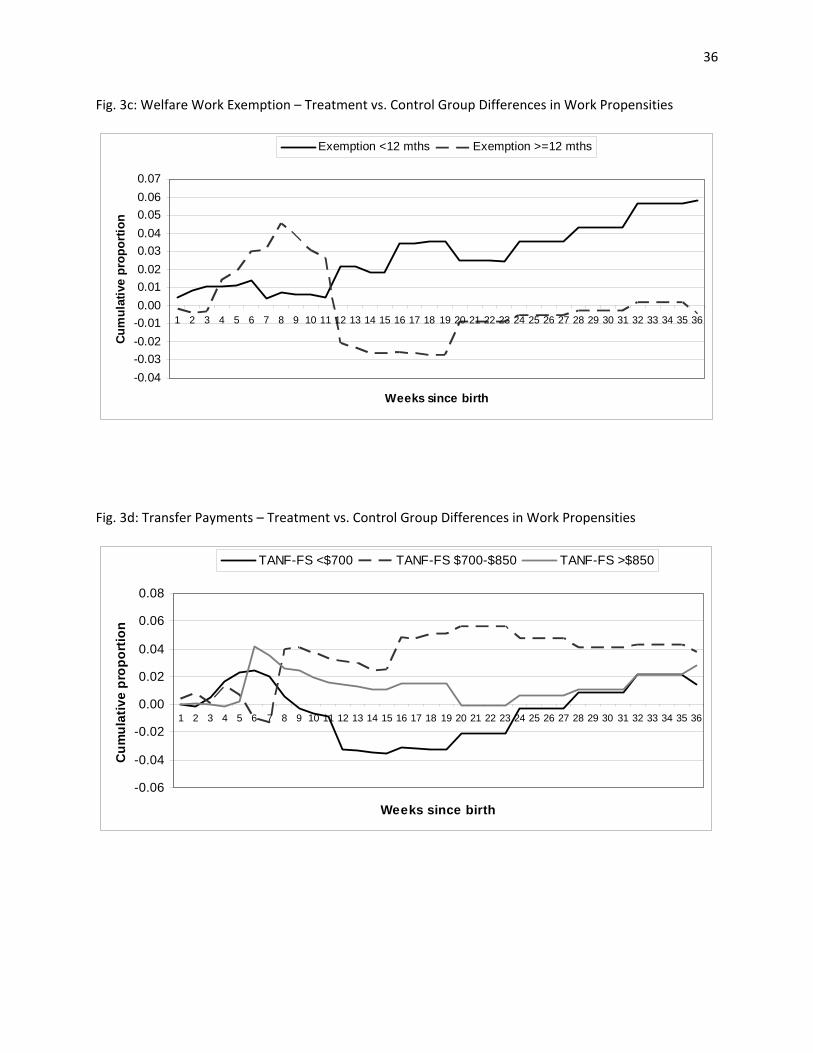
Short welfare work exemptions are associated with higher rates of work beginning 12
weeks after the birth (figure 3c). This is exactly when an effect is expected, since the exemption
expires at exactly three months in 16 states. Employment rates increase further for the
treatment group at four months, which makes sense since the exemptions expire at that time in
four additional states.
The results for TANF‐FS benefits (figure 3d) are less clear. Inconsistent patterns are
found in the first 8 weeks after birth. The largest relative increases in work thereafter are found
in states offering intermediate benefits ($700‐$850 per month), with smaller growth predicted
for the most generous states (>$850 per month).
ECONOMETRIC ESTIMATES
We next present econometric estimates. The “parsimonious” difference‐in‐difference
specifications in Table 1 control only for the state policies and their interactions with the
treatment group indicators. These correspond to the “unadjusted” DD estimates above, except
that they assume a linear dose‐response effect and consider all the policies simultaneously. The
“fully conditioned” models, in Table 2, incorporate state fixed‐effects and the wide variety of
mother, family, and child covariates. Both tables display coefficients on the interactions
between the policies and relevant treatment group indicators. To use leave laws as an example,
the parameter estimate on the main effect (not shown) captures differences in the probability
of working for the control group in states with leave laws relative to those in states without
them. Since such mothers are not expected to be affected by the policies, any observed
relationship is assumed to result from uncontrolled confounding factors. The interaction

18
coefficient then provides the estimated leave law effect – the differential effect for the
treatment group relative to the controls.
The parsimonious estimates in Table 1 largely accord with the descriptive relationships
provided previously. The first two rows show that state leave laws are associated with a
statistically significant 6.7 percentage point reduction in the work probabilities within 12 weeks
of birth but a 4.7 point increase at 9 months. Lengthy welfare work exemptions have no effect
at 12 weeks but predict a significant 8.2 percentage point employment reduction at 9 months.
An extra thousand dollars of child care subsidies (per poor child) correlates with a 4 point
employment increase at both 12 weeks and 9 months. TANF‐FS benefits are unrelated to work
at 12 weeks but are negatively correlated with it at 9 months.
To assess longer‐term effects, we estimated how the policies were related to the
probability of the mother working at the age 4 interview. Since attrition shrinks the sample by
around 16 percent, we first repeated the <12 week and ≤9 month models on the sample of
mothers for whom we have information at the later date. The results, shown in the fourth
through sixth columns of Table 1, suggest that most effects observed at 9 months continue
through age 4, although the magnitudes and statistical significance are often reduced. For state
leave laws, the age 4 effect (4.4 percentage points) is only slightly smaller than at ≤9 months
(4.6 points for the same sample), although the standard error increases. Conversely, the work
reduction predicted by lengthy welfare work exemptions is just over half as large as at 9
months (4.7 versus 8.3 percentage points) and is not significant. CCDF spending is predicted to
have considerably larger effects at four years of age than earlier, but the estimates are
imprecise and the coefficients at <12 weeks and ≤9 months are substantially attenuated from

19
those for the full sample. Finally, the work reducing effects of TANF‐FS benefits are of similar
magnitude at age 4 as at 9 months, but the standard errors are large.
Most estimates are little affected by controlling for state fixed‐effects and the extensive
set of child, individual, and family characteristics. The results, shown in Table 2, confirm that
state leave laws are predicted to lower rates of work prior to 12 weeks but increase them by 9
months post‐birth. The welfare work exemption estimates are nearly identical to those
previously obtained and indicate reductions in work at ≤9 months and 4 years old. The findings
for child care subsidies are also unchanged, continuing to predict positive although not always
significant effects in all time periods. Finally, TANF‐FS benefits have similar or somewhat more
negative predicted effects on work in all periods and the coefficients more often approach or
reach statistical significance.
Robustness Checks
The similarity of the results between Tables 1 and 2 increases our confidence in the
estimation strategy, since it suggests even the parsimonious difference‐in‐difference
specifications control well for potential confounding factors. The findings are also robust to the
use of a variety of alternative specifications, as detailed next.
As discussed, we used an alternative control group for leave laws, consisting of mothers
who worked during some part of the year before the birth but were no longer employed at the
time of it. These specifications suggest somewhat stronger (11.1 percentage point) reductions
in work by 12 weeks and marginally weaker increases at ≤9 months or four years old.
When considering child care subsidies, our main specifications used families where no
parent had a high school diploma as the treatment group. Broadening the treatment group to

20
also include those with high school diplomas but no college or, alternatively, some college
attendance but no degree, weakened the estimated subsidy effects, as expected since the
alternative treatment groups include more families unlikely to receive subsidies. For example,
when the treatment group included parents with some college (but no degree), the child care
subsidy parameters were small and insignificant.
We also estimated models using funds allocated to child care subsidies in FY 2001 and
2002, rather than child care subsidy expenditures in FY 2000. As discussed, these data
correspond more closely to the timing of the period following the births of the ECLS‐B cohort
but are imperfectly correlated with contemporaneous expenditures. The results are similar to
the main specification, but somewhat smaller in magnitude and less precisely estimated. This is
expected if there is greater measurement error in the allocations series.
When evaluating welfare work exemptions and TANF‐FS benefits, we examined the
effect of dropping from the analysis families where a parent had attended college, so that the
treatment group includes less educated single mothers and the controls are corresponding
married women. These specifications yielded somewhat weaker effects than for the full
sample: welfare work exemptions of ≥12 months reduced the predicted probability of working
at 9 months by 5.1 percentage points and an extra hundred dollars per month of transfer
payments decreased it by 1.0 points. Neither estimate was statistically significant although this
may be partly because the sample size was reduced by three‐fifths. These estimates compare to
statistically significant reductions of 8.2 and 1.6 percentage points in the main model.
Next, we varied the definition or timing of the dependent variables. When we examined
work at ≤16 weeks rather than <12 weeks after birth, the effects of state leave laws weakened

21
considerably (falling from 6.7 to an insignificant 2.7 percentage points) whereas longer welfare
work exemptions strengthened from virtually no effect to predicting a significant 6.7
percentage point employment. Both results are plausible and reinforce our confidence that we
are obtaining causal estimates. Specifically, most state leave laws phase out between 12 and 16
weeks, so that there should be a rapid return to work during this period for the treatment
group. Similarly, since the duration of welfare work exemptions is exactly 3 months in 16 of 24
control states, differential rates of work should show up most strongly between 3 and 4
months.
Finally, we ran models where the outcome was a dichotomous variable indicating if the
mother was working at nine months post‐birth, rather than at any point up to that time. The
results were similar but with slightly stronger increases associated with state leave laws or child
care subsidies, and marginally weaker reductions predicted for welfare work exemptions. The
most significant change was the more than 60 percent decrease (from ‐0.016 to ‐0.006) in the
coefficient on TANF‐FS benefits. This suggests that the early work promoted by low levels of
transfer payments is often unstable, so that many mothers beginning jobs have left them by
nine months after birth.
SIMULATIONS
We next use results from the fully conditioned models in Table 2 to project how
different configurations of work‐family policies affect maternal work participation after birth.
These simulations assume that the policies have no effect on the control groups and may
understate the total effect, to the extent this is not the case. This exercise is limited by the
policy variation observed in the United States so that we cannot, for example, estimate the

22
effects of providing the lengthy parental leave entitlements common in Canada and many
European countries but nonexistent in the U.S. Our results explore scenarios in which currently
existing state policies are implemented nationally. For the dichotomous policy variables –
parental leave laws and infant work exemptions – our simulations model turning the policy
“on” or “off”. For the continuous policy variables – CCDF and TANF‐FS spending – we compare
benefits at the 10th and 90th percentiles of the actual national distribution, referred to
respectively “low” and “high” expenditures.13
Table 3 summarizes results for the full sample. Under existing policies, just over one
million mothers (roughly 28 percent) were working within 12 weeks of giving birth and 2.3
million (nearly 60 percent) by 9 months. Rows 1‐8 show the predicted influence of changing
single policies. For instance, abolishing all state leave laws increases predicted employment
rates at or before 12 weeks by 1.7 percentage points and reduces the probability of work within
9 months by 1.0 point (row 1). Conversely, instituting leave laws in all states decreases
predicted employment rates by 3.1 percentage points before 12 weeks and raises them by 1.8
percentage points by 9 months (row 2). Generous child care subsidies are associated with
substantial increases in post‐birth work while transfer payments and welfare work exemptions
have smaller predicted effects.
The last two panels of Table 3 show results for policy combinations. Row (9) displays the
simulated effect of a set of policies that restrict the choices available to new mothers.
13 The 10th and 90th percentiles for CCDF annual spending are $974 (South Carolina) and $3,863 (District of Columbia), per poor child under 6. The 10th and 90th percentiles for TANF‐FS are $545 per month (Alabama) and $928 per month (Connecticut), where these amounts refer to the maximum allowance for a family of 3.

23
Specifically, states are assumed to offer no parental leave (beyond the federal legislation), child
care subsidies and TANF‐FS payments are at the 10th percentile, and welfare work exemptions
are shorter than 12 months. Row (10) shows the opposite case, where women have the most
choice: all states have leave laws, offer at least a one year welfare work exemption, and child
care spending and TANF‐FS payments are at the 90th percentile. The last two rows provide
information for different counterfactuals, where policies are selected according to the direction
of their effect on participation rates by 9 months post‐birth. Row (11) refers to policies
estimated to promote work participation: all states have a leave law; none have a welfare work
exemption lasting a year or more; CCDF and TANF‐FS spending are at the 90th and 10th
percentiles respectively. The second examines the reverse situation where no state has a leave
law, welfare work exemptions last at least one year, and states have low child care subsidies
and high transfer payments.14
The combined predicted effect of policies promoting choice is relatively modest –work
participation falls at <12 weeks by 1.6 percentage points and increases at ≤9 months by 2.0
points. Switching from policies offering the least choice to those supplying the most –
calculated by subtracting row (9) from row (10) – is predicted to decrease work before 12
weeks by 2.9 percentage points but increase employment at ≤ 9 months by 2.1 points. This is
noteworthy, because it implies that legal and financial supports for new mothers can be
structured to allow them to spend a longer period of time at home with infants, without
14 Leave laws are predicted to decrease work in the first months but increase it thereafter. We characterize them as an employment‐promoting policy, focusing on the 9 month effects, since we think that medium to long term effects are most relevant in terms of policies to encourage work.

24
reducing employment in the medium‐term. The relatively small effect of the “choice package”
occurs partly because some components (lengthy work exemptions and generous transfer
payments) reduce employment incentives while others (high child care subsidies and leave
laws) either promote work or have different effects in the short‐term and medium‐term.
Public policy nevertheless has potentially powerful effects. A set of policies designed to
maximize maternal employment has large effects, as can be seen by taking the difference
between rows (12) and (11). Moving from the least to the most work‐promoting policies is
predicted to reduce work probabilities before 12 weeks by 2.1 percentage points but increase
rates at ≤9 months by 7.8 points. The reason that the “work maximization” package reduces
employment before 12 weeks is that universal leave laws discourage employment during the
first three months but increase it subsequently.
Table 3 provided estimates for all U.S. mothers. Since three of the four focal policies
target the disadvantaged, we anticipate stronger effects for such women. Table 4 confirms that
this occurs. The simulations suggest that married/cohabiting mothers (results shown in the first
two columns) are moderately affected by state leave laws and minimally influenced by child
care subsidy policies.15 By contrast, all four policies have strong predicted effects on single
mothers (see columns 3 and 4). We focus our remarks on the packages of policies, summarized
in the last four rows of the table, since these show most explicitly the effects and tradeoffs
implied by different types of policies.
15 When a group represents the control group for a specified policy (e.g. married/cohabiting mothers when considering infant work exemptions or TANF‐FS spending), the policy effect is set to zero by assumption.

25
The effects of a choice promotion package differ substantially across groups. Such a
package is associated with increased work participation by ≤9 months for married mothers and
in less educated families, with those in the latter group appearing to be particularly constrained
by the high costs of child care. Single mothers are the only group where greater choice is
associated with a lower work probability by ≤9 months. This reflects the relatively strong
employment‐reducing effect of welfare work exemptions.
Increased choice generally has a more negative predicted influence on work
participation before 12 weeks (than at ≤9 months), suggesting that many mothers are
constrained in their ability to stay home with infants and would take advantage of policies that
make it easier for them to do so. The least educated families again represent an exception; here
the results suggest an unfulfilled demand for early work participation that is constrained by a
lack of affordable child care.
The package of work promoting policies is predicted to have a sizable medium‐term
effect on single mothers, raising their employment at ≤9 months by 12.6 points (relative to the
baseline of 61 percent). The difference between this and the set of policies that encourage
early work the least is an extremely large 22.3 percentage points. By comparison, the
corresponding change for married/cohabiting mothers, moving from the least to most work
promoting policies, is 4.2 percentage points.
The estimated effects for women with less than a high school education are, if anything,
even bigger than for single mothers. The medium‐term effects (by 9 months) are of similar
magnitude but larger in relative terms because of their lower (46.5 percent) baseline
employment rate, and the short‐term (<12 weeks) predicted effects are also greater. As already

26
mentioned, the employment of this group is particularly sensitive to CCDF spending levels,
suggesting the importance of child care costs as a constraint on work.
Conversely, the policies have much smaller effects on more highly educated mothers, as
expected, since they constitute the control group for CCDF funding and are relatively frequently
married or cohabiting (and thus in the control group for TANF‐FS benefits and welfare work
exemptions). However, the effects of state leave laws appear to increase with maternal
education, consistent with evidence recently presented by Han, Ruhm and Waldfogel (2009).
Notice also that a long‐term “work maximization” package of policies is predicted to reduce
early employment (<12 weeks) among highly educated and married/cohabiting mothers, while
increasing that of their less advantaged counterparts.
DISCUSSION
The types of public policies currently enacted in the United States have potentially
powerful effects on the employment of new mothers, particularly the disadvantaged. For
instance, implementing a set of policies designed to maximize work participation 9 months
after the birth is predicted to increase the employment of single or less educated mothers by
30 to 50 percent, compared to corresponding policies providing weak work incentives.
Evidence that disadvantaged mothers are highly sensitive to the net returns of working
does not, however, identify the optimal mix of policies, because there may be a tradeoff
between policies that maximize the choices available versus those that increase the
employment of mothers with young children. On the one hand, evidence on the possible
adverse consequences of very early employment for child health and development (e.g.,
Smolensky and Gootman 2003; Ruhm, 2004; Waldfogel 2006) suggests that policy should seek

27
to discourage early work. On the other hand, proponents of welfare reform view early work to
be desirable in its own right and as a route out of poverty, hinting at the opposite conclusion.
The timing of employment effects also matters. For instance, we may be less concerned about
policies that deter work during the infancy period if they promote it later in the child’s life.
However, the tradeoff between choice and employment is not absolute. As mentioned,
parental leave policies relax constraints immediately after the birth but are also associated with
significantly higher work participation rates by nine months. Child care subsidies targeted to the
most disadvantaged mothers also increase choice (particularly if they are offered alongside paid
leave policies) and have strongly positive effects on employment, suggesting that the costs of
high quality infant care are a real barrier to work among those with lower incomes.16
The results should be interpreted in light of several caveats. First, the data are for a
single cohort of births and so cannot exploit policy variation occurring over time. One
implication is that we cannot investigate federal policies (such as the FMLA) enacted
simultaneously throughout the country. Second, our identification strategy involves a series of
difference‐in‐difference estimates where policies are anticipated to affect some groups but not
others. Alternative but corresponding policies targeting our current control groups might have
different consequences. For instance, child care subsidies for middle‐ or high‐income mothers
may have smaller effects than CCDF funding, which assists low‐income mothers. Similarly,
income support policies to married families (such as those in many European countries) may
16 Rosenbaum and Ruhm (2007) provide evidence that child care expenditures, as a share of income, are larger for low‐income than high‐income families, and that the disparity would increase dramatically if not for the lower employment rates and cheaper sources of child care used by the former.

28
have weaker disemployment effects than TANF‐FS benefits targeting single women. Finally,
although we analyze a wider constellation of work‐family policies than previous research, we
neither include all possibly relevant policies nor consider interactions between government and
employer policies. In particular, our discussion has assumed a policy environment where
disadvantaged mothers face a simple trade‐off between poverty and work. Cash assistance
policies, such as a system of child allowances, suggest a third alternative – one currently
available to more advantaged mothers – in which staying home to care for an infant is an
affordable option.
Notwithstanding these qualifications, our results are new and noteworthy. Packages of
policies designed to promote or discourage maternal employment are likely to have strong
effects. Policies maximizing the choices available to women have smaller but frequently positive
predicted employment impacts, because some of them (parental leave entitlements and child
care subsidies) promote work in the medium‐term. The responsiveness of less educated
women to child care subsidies was of particular interest because it was unanticipated when we
began our investigation. Future research is needed to verify this result and identify mechanisms
for it. More generally, our findings highlight the need for further investigation into the effects
of work‐family policies, using techniques and approaches that address the limitations in this
work and include an even wider array of policies.

29
REFERENCES
Anderson, P. M. and P. B. Levine. (2000). “Child Care and Mothers’ Employment Decisions.” Pp. 420‐462 in Finding Jobs: Work and Welfare Reform, edited by D. E. Card and R. M. Blank. New York, NY: Russell Sage Foundation.
Baker, M. and K. Milligan (2007). “Maternal employment, breastfeeding, and health: Evidence from maternity leave mandates,” NBER Working Paper No. 13188
Becker, G.S. (1965). “A Theory of the Allocation of Time,” Economic Journal 75(299): 493‐517.
Berger, M. C., and D. A. Black. (1992). “Child Care Subsidies, Quality of Care, and the Labor Supply of Low Income Single Mothers.” Review of Economics and Statistics 74(4):635–642.
Bertrand, M., E. Duflo, and S. Mullainathan. (2004). "How Much Should We Trust Differences‐in‐Differences Estimates?," The Quarterly Journal of Economics 119(1): 249‐275.
Blank, R. (2002). “Evaluating Welfare Reform in the United States.” Journal of Economic Literature 40(4): 1105‐1167.
Blau, D. and J. Currie. (2004). “Preschool, Day Care and Afterschool Care: Who’s Minding the Kids”. NBER Working Paper 10670, National Bureau of Economic Research.
Blau, D. and E. Tekin. (2007). “The Determinants and Consequences of Child Care Subsidies for Single Mothers in the USA”. Journal of Population Economics 20: 719‐741.
Gelbach, J. (2002). “Public Schooling for Young Children and Maternal Labor Supply.” American Economic Review 92(1):307–322.
Gish, M. (2002). “Child Care Funding and Spending under Federal Block Grants.” Report to Congress. Washington, DC: Congressional Research Service.
Glass, J.L., and L. Riley, L. (1998). “Family Responsive Policies and Employee Retention Following Childbirth.” Social Forces, 76(4), 1401‐1435.
Gregg, P., M. Gutierrez‐Domenech, and J. Waldfogel (2007). “The Employment of Married Mothers in Great Britain: 1974‐2000.” Economica 74(296): 842‐864.
Grogger, J. and L. A. Karoly. (2005). Welfare Reform: Effects of a Decade of Change. Cambridge, MA: Harvard University Press.
Haider, S. J., A. Jacknowitz, and R. F. Schoeni. (2003). “Welfare Work Requirements and Child Well‐Being: Evidence from the Effects on Breast‐Feeding.” Demography 40(3): 479‐497.
Han, W.‐J., C. J. Ruhm, and J. Waldfogel. (2009). “Parental Leave Policies and Parents’ Employment and Leave‐Taking.” Journal of Policy Analysis and Management 28(1): 29‐54.

30
Han, W.‐J., and J. Waldfogel. (2003). “Parental Leave: The Impact of Recent Legislation on Parents’ Leave‐Taking.” Demography 40(1): 191‐200.
Hill, H. (2007). “Maternity Leave for the Poor: Welfare to Work Exemptions and Employment Rates among Single Mothers with Young Children.” Working Paper, Northwestern University.
Jaumotte, F. (2004). Labour Force Participation of Women: Empirical Evidence on the Role of Policy and Other Determinants in OECD Countries. OECD Economic Studies No. 37.
Klerman, J. and A. Leibowitz. (1997). “Labor Supply Effects of State Maternity Leave Legislation.” Pp. 65‐85 in Gender and Family Issues in the Workplace edited by F. Blau and R. Ehrenberg. New York: Russell Sage.
Leibowitz, A. (2005). “An Economic Perspective on Work, Family, and Well‐Being.” Pp. 187‐200 in Work, Family, Health, and Well‐Being, edited by S. M. Bianchi, L. M. Casper, and R. B. King. Mahwah, NJ: Lawrence Erlbaum Associates.
Lefebvre, P. and P. Merrigan. (2008). “Child‐Care Policy and the Labor Supply of Mothers with Young Children: A Natural Experiment from Canada.” Journal of Labor Economics 26(3): 519‐548.
Magnuson, K. A., M. K. Meyers, and J. Waldfogel. (2007). “Public Funding and Enrollment in Formal Child Care in the 1990s.” Social Service Review 81(1): 47‐83.
Meyers, M. K., T. Heintze, and D. A. Wolf. (2002). “Child Care Subsidies and the Employment of Welfare Recipients.” Demography 39(1):165–180.
Meyers, M. K., D. Rosenbaum, C. J. Ruhm, and J. Waldfogel. (2004). “Inequality in Early Childhood Education and Care: What Do We Know?” Pp. 223‐270 in Social Inequality, edited by K. N. Neckerman. New York: Russell Sage Foundation.
Mincer, J. (1962). “Labor Force Participation of Married Women: A Study of Labor Supply. Pp. 63‐105 in Aspects of Labor Economics, edited by H. G. Lewis. Princeton: Princeton University Press.
Moffitt, R. (1998). “The Effect of Welfare on Marriage and Fertility: What Do We Know and What Do We Need to Know?” Pp. 50‐97 in The Effect of Welfare on the Family and Reproductive Behavior, edited by R. Moffitt. Washington, D.C.: National Research Council.
Moss, P., & F. Deven (eds.) (1999). Parental Leave: Progress or Pitfall? Brussels: CBGS.
Moss, P. & M. Korintus (eds) (2008). International Review of Leave Policies and Related Research 2008. Department for Business, Enterprise, and Regulatory Reform, Employment Relations Research Series No. 100.
Pettit, B., & Hook, J. (2005). “The Structure of Women’s Employment in Comparative Perspective.” Social Forces 84(2): 779‐801.
31
Rosenbaum, D.T and Ruhm, C.J. (2007). “Family Expenditures on Child Care” B.E. Journal of Economic Analysis and Policy 7(1) (Topics), Article 34: 1‐30.
Ross, K. (1998). “Labor Pains: The Effects of the Family and Medical Leave Act on Recent Mothers’ Returns to Work after Childbirth.” Paper presented at the Population Association of America Annual Meeting, Chicago, Illinois, April 1998.
Ruhm, C. J. (1997). “Policy Watch: The Family and Medical Leave Act.” Journal of Economic Perspectives 11(3): 175‐186.
Ruhm, C.J. (1998). “The Economic Consequences of Parental Leave Mandates: Lessons from Europe”. Quarterly Journal of Economics 113(1): 285‐318.
Ruhm, C.J. (2004). “Parental Employment and Child Cognitive Development”, Journal of Human Resources, 39(1): 155‐192.
Ruhm, C. J. (2005). “How Well Do Government and Employer Policies Support Working Parents?” Pp. 313‐328 in Work, Family, Health, and Well‐Being, edited by S. M. Bianchi, L. M. Casper, and R. B. King. Mahwah, NJ: Lawrence Erlbaum Associates.
Tekin, E. (2007). “Childcare Subsidies, Wages, and Employment of Single Mothers”. Journal of Human Resources 42(2): 453‐487.
Waldfogel, J. (1999). “The impact of the Family and Medical Leave Act”. Journal of Policy Analysis and Management 18(2): 281‐302.
Waldfogel, J. (2006). What Children Need. Cambridge: Harvard University Press.
Waldfogel, J., Y. Higuchi, & M. Abe (1999). "Family Leave Policies and Women's Retention after Childbirth: Evidence from the United States, Britain, and Japan." Journal of Population Economics, 12, 523‐545.

32
Figure 1a. States leave laws more generous than the federal minimum in 2001
Figure 1b. CCDF spending per poor child under 6 in FY2000 (2001 dollars)
33
Figure 1c. States infant work exemptions
Figure 1d. Monthly TANF plus Food Stamps allowances (2001 dollars)

34
Figure 2. Proportion of mothers participating in work 9 months post‐birth
Note: States in white contain fewer than 20 observations.

35
Figure 3a: State Leave Laws – Treatment vs. Control Group Differences in Work Propensities
0.00
0.10
0.20
0.30
0.40
0.50
0.60
1 2 3 4 5 6 7 8 9 10 11 12 13 14 15 16 17 18 19 20 21 22 23 24 25 26 27 28 29 30 31 32 33 34 35 36
Weeks since birth
Cum
ulat
ive
prop
ortio
n
No state leave law Has state leave law
Fig. 3b: Child Care Subsidies – Treatment vs. Control Group Differences in Work Propensities
-0.25
-0.20
-0.15
-0.10
-0.05
0.00
0.05
1 2 3 4 5 6 7 8 9 10 11 12 13 14 15 16 17 18 19 20 21 22 23 24 25 26 27 28 29 30 31 32 33 34 35 36
Weeks since birth
Cum
ulat
ive
prop
ortio
n
CCDF <$1500 CCDF $1500-$2500 CCDF >$2500
36
Fig. 3c: Welfare Work Exemption – Treatment vs. Control Group Differences in Work Propensities
-0.04-0.03-0.02-0.010.000.010.020.030.040.050.060.07
1 2 3 4 5 6 7 8 9 10 11 12 13 14 15 16 17 18 19 20 21 22 23 24 25 26 27 28 29 30 31 32 33 34 35 36
Weeks since birth
Cum
ulat
ive
prop
ortio
n
Exemption <12 mths Exemption >=12 mths
Fig. 3d: Transfer Payments – Treatment vs. Control Group Differences in Work Propensities
-0.06
-0.04
-0.02
0.00
0.02
0.04
0.06
0.08
1 2 3 4 5 6 7 8 9 10 11 12 13 14 15 16 17 18 19 20 21 22 23 24 25 26 27 28 29 30 31 32 33 34 35 36
Weeks since birth
Cum
ulat
ive
prop
ortio
n
TANF-FS <$700 TANF-FS $700-$850 TANF-FS >$850

37
Table 1. Parsimonious Difference‐in‐Difference Estimates Dummy Variable = 1 if mother at work in: Treatment effects (interaction terms)
< 12 wks ≤ 9 mths < 12 wks ≤ 9 mths At approx.
age 4
Full sample Restricted sample
State leave law x ‐0.067*** 0.047* ‐0.079*** 0.046* 0.044 employed in year before birth (0.019) (0.025) (0.022) (0.027) (0.029) CCDF spending x 0.041** 0.038* 0.025 0.020 0.035
No parental HS diploma (0.018) (0.020) (0.022) (0.019) (0.022)
Exemption≥12 mths x 0.014 ‐0.082*** ‐0.014 ‐0.083*** ‐0.047 single mother (0.031) (0.023) (0.035) (0.028) (0.033) TANF‐FS x single mother ‐0.003 ‐0.016* ‐0.003 ‐0.018 ‐0.013 (0.010) (0.010) (0.011) (0.011) (0.013)
Observations 10480 10480 8760 8760 8760 R‐squared 0.12 0.22 0.11 0.22 0.1 * p < .05, ** p < .01, *** p < .001 Note: Models include state‐ and individual‐level treatment indicators (listed in Appendix Table 4), but not state fixed effects or individual‐level control variables. Standard errors, corrected for complex survey design, are in brackets. CCDF spending and TANF level variables are represented as deviations from means. CCDF spending is expressed in thousands of 2001 dollars per poor child under 6. TANF‐FS allowance is monthly value in hundreds of 2001 dollars for family of 3.

38
Table 2. Estimated Difference‐in‐Difference Estimates from Fully Conditioned Model Dummy Variable = 1 if mother at work: Treatment effects (interaction terms)
< 12 wks ≤ 9 mths < 12 wks ≤ 9 mths At approx.
age 4
Full sample Restricted sample
State leave law x ‐0.067*** 0.040* ‐0.078*** 0.04 0.047
employed in year before birth (0.021) (0.023) (0.024) (0.027) (0.030)
CCDF spending x 0.041** 0.038** 0.026 0.021 0.034
No parental HS diploma (0.017) (0.018) (0.022) (0.018) (0.021)
Exemption≥12 mths x 0.005 ‐0.082*** ‐0.027 ‐0.084*** ‐0.045
single mother (0.025) (0.020) (0.029) (0.027) (0.031)
TANF‐FS x single mother ‐0.007 ‐0.016* ‐0.008 ‐0.018* ‐0.015
(0.009) (0.009) (0.010) (0.010) (0.012)
Observations 10480 10480 8760 8760 8760
R‐squared 0.15 0.25 0.15 0.25 0.14
* p < .05, ** p < .01, *** p < .001 Note: Models include individual‐level treatment effects from Table 1, as well as the individual‐level demographic and additional controls detailed in Appendix Table 4, and a full set of state dummy variables. Standard errors, corrected for complex survey design, are in brackets.

39
Table 3. Simulated Effect of Different State Policies on Maternal Work Participation After Birth Work participation < 12 weeks ≤ 9 months Percentage Number Percentage Number Predicted work participation under existing policies 27.7 1,089,679 59.1 2,325,350
Changes due to policy reform: Single policy reforms (holding other policies constant): % points Numbers % points Numbers State leave laws (1) Abolished +1.7 +65,876 ‐1.0 ‐38,896
(2) Universal ‐3.1 ‐122,080 +1.8 +72,082
CCDF spending equalized at:
(3) 10th percentile ‐0.6 ‐23,398 ‐0.5 ‐21,535
(4) 90th percentile +1.7 +67,809 +1.6 +62,413
Infant work exemptions 12 months or more:
(5) Abolished ‐0.1 ‐2,056 +0.8 +31,835
(6) Universal +0.1 +2,054 ‐0.8 ‐31,828
TANF spending equalized at:
(7) 10th percentile +0.3 +10,295 +0.6 +22,938
(8) 90th percentile ‐0.3 ‐11,583 ‐0.7 ‐25,806
Combined policies to promote choice
(9) Least ‐ (1), (3), (5), (7) +1.3 +50,718 ‐0.1 ‐5,659
(10) Most ‐ (2), (4), (6), (8) ‐1.6 ‐63,798 +2.0 +76,861
Combined policies to maximize early work
(11) Most ‐ (2), (4), (5), (7) ‐1.2 ‐46,032 +4.8 +189,268
(12) Least – (1), (3), (6), (8) +0.9 +32,949 ‐3.0 ‐118,065
Simulations are conducted using the full sample estimates from Table 2 and are evaluated holding individual characteristics and state fixed effects constant. Sample weights are used to adjust these predicted individual probabilities to provide nationally representative estimates. All changes are relative to existing policies.

40
Married or cohabiting
Single mother Less than high school
High school or some college
College degree or more
< 12 wks ≤ 9 mths < 12 wks ≤ 9 mths < 12 wks ≤ 9 mths < 12 wks ≤ 9 mths < 12 wks ≤ 9 mths Predicted work participation under existing policies 27.4 58.5 29.0 61.4 19.3 46.5 32.1 62.3 26.0 61.9
% point change due to policy reform State leave laws (1) Abolished +1.7 ‐1.0 +1.5 ‐0.9 +1.3 ‐0.7 +1.6 ‐1.0 +2.0 ‐1.2
(2) Universal ‐3.1 +1.8 ‐3.2 +1.9 ‐2.2 +1.3 ‐3.4 +2.0 ‐3.2 +1.9
CCDF spending equalized at:
(3) 10th percentile ‐0.4 ‐0.3 ‐1.5 ‐1.4 ‐3.1 ‐2.8 0 0 0 0
(4) 90th percentile +1.2 +1.1 +3.9 +3.6 +8.8 +8.1 0 0 0 0
Infant work exemptions:
(5) Abolished 0 0 ‐0.3 +4.1 ‐0.1 +1.9 ‐0.1 +0.9 0.0 +0.1
(6) Universal 0 0 +0.3 ‐4.1 +0.1 ‐1.9 +0.1 ‐0.8 0.0 ‐0.1
TANF spending equalized at:
(7) 10th percentile 0 0 +1.3 +3.0 +0.6 +1.3 +0.3 +0.6 0.0 +0.1
(8) 90th percentile 0 0 ‐1.5 ‐3.3 ‐0.7 ‐1.6 ‐0.3 ‐0.7 0.0 ‐0.1
Combined policies to promote choice
(9) Least ‐ (1), (3), (5), (7) +1.3 ‐1.4 +1.1 +4.8 ‐1.3 ‐0.4 +1.9 +0.5 +2.0 ‐1.0
(10) Most ‐ (2), (4), (6), (8) ‐1.9 +2.9 ‐0.6 ‐1.9 +6.0 +6.0 ‐3.7 +0.5 ‐3.2 +1.7
Combined policies to maximize early work
(11) Most ‐ (2), (4), (5), (7) ‐1.9 +2.9 +1.7 +12.6 +7.1 +12.6 ‐3.2 +3.5 ‐3.2 +2.1
(12) Least – (1), (3), (6), (8) +1.3 ‐1.3 ‐1.2 ‐9.7 ‐2.4 ‐7.0 +1.4 ‐2.5 +2.0 ‐1.4
Note: Simulations are conducted using estimates corresponding to those in Table 2 but with the sample limited to the specified subgroup, and with zero effects assumed for the control groups. Sample weights are used to adjust these predicted individual probabilities to provide nationally representative estimates. All changes are estimated relative to existing policies.
Table 4. Simulated Effect of Different Policies on Maternal Work Participation After Birth of Different Subgroups

41
Appendix Table 1. The content of state leave law policies
TDI state Min. firm size < 50
Max. weeks
leave > 12
Min. tenure < 1
yr Min. hours
< 25 Obs in state
California X 1,581 Connecticut X X 130 District of Columbia X X X 3 Hawaii X X X 104 Maine X X 100 Massachusetts X X X 246 Minnesota X X X 223 Montana X X X 21 New Jersey X X 690 New York X 390 Oregon X X X X 105 Rhode Island X X 70 Tennessee X X 171 Vermont X 1 Wisconsin X 74 Obs affected 2,835 870 479 699 1696 3,909 Appendix Table 2. Distribution of lengths of infant work exemptions
# months of
exemption
# of states
States
0 4 AZ, ID, MT, UT
3 16 AL, AR, CA, DE, FL, IA, IN, MI, NE, NJ, NY, OK, OR,
SD, WI, WY 4 3 ND, TN, WA 6 1 HI
12 23 AK, CO, CT, DC, GA, IL, KS, KY, LA, MD, ME, MN, MO, MS, NC, NM, NV, OH, PA, RI, SC, TX, WV
18 1 VA 24 3 MA, NH, VT

42
Appendix Table 3. Characteristics of states with different types of policies
Panel A: General state characteristics
State maternity
leave law CCDF spending (FY2000) per poor child under 6, $2001
Welfare work exemption ≥12
mths Max. monthly TANF+FS
value for family of 3, $2001
No Yes < $1500 $1500‐$2500 > $2500 No Yes <$700
$700‐$850 >$850
Number of states 36 15 20 17 14 24 27 18 21 12 Proportion all births in 2001 0.64 0.36 0.34 0.47 0.19 0.53 0.47 0.43 0.30 0.27 Population (millions) 5.22 6.48 4.29** 9.12 3.16** 6.01 5.22 5.70 4.66 7.05 Median family income 54260 59560** 50230*** 56945 62435** 54387 57091 51635** 55990 61795** Unemployment rate 4.52 4.48 4.71 4.49 4.22 4.41 4.59 4.71 4.38 4.42 Poverty rate 11.53 10.99 13.50*** 10.79 9.02* 11.44 11.31 12.85 11.13 9.56 Proportion Black 0.11 0.09 0.11 0.11 0.09 0.07 0.13* 0.16* 0.09 0.05 Proportion Hispanic 0.07 0.07 0.08 0.07 0.05 0.07 0.07 0.06 0.07 0.07 Proportion Elderly 0.12 0.13 0.12 0.13 0.13 0.13 0.12 0.12 0.13 0.12 % covered by union 12.13 17.68*** 10.65* 14.95 16.76 13.93 13.61 10.21** 14.01 18.66** % low income children uninsured 6.97 4.86** 8.13** 6.26 3.91*** 6.55 6.16 7.88* 6.21 4.28** Abortion rate 14.67 24.09*** 12.43*** 19.90 21.62 16.96 17.87 14.38 18.70 19.83 Infant mortality rate 7.36 6.48* 7.37 7.12 6.69 7.02 7.17 7.92* 7.08 5.91** State governor is Democrat 0.42 0.29 0.35 0.35 0.46 0.33 0.42 0.50* 0.20 0.50* Proportion State Senate Democrat 0.48 0.58* 0.50 0.50 0.55 0.47 0.54 0.52 0.45 0.60** Proportion State House Democrat 0.48 0.59** 0.50 0.50 0.56 0.48 0.54 0.51 0.46 0.59** Median child care worker hourly wage 7.58 8.35*** 7.23*** 8.01 8.36 7.63 7.96 7.23*** 7.81 8.65*** # licensed child care centers 5.06 6.14 5.00 4.97 6.42 4.87 5.83 5.37 5.12 5.84 # family day care providers 14.94 17.93 14.81 13.34 20.25* 15.53 16.07 11.10** 17.94 19.16

43
State maternity
leave law CCDF spending (FY2000) per poor child under 6, $2001
Welfare work exemption ≥12
months Max. monthly TANF+FS
value for family of 3, $2001
No Yes < $1500 $1500‐$2500 > $2500 No Yes <$700
$700‐$850 >$850
State maternity leave law 0 1 0.05** 0.35 0.57 0.33 0.26 0.06 0.24 0.75*** CCDF < $1500 0.53 0.07*** 1 0 0 0.46 0.33 0.67* 0.38 0.00** CCDF $1500‐$2500 0.31 0.40 0 1 0 0.29 0.37 0.28 0.43 0.25 CCDF > $2500 0.17 0.53*** 0 0 1 0.25 0.30 0.06 0.19 0.75*** Welfare work exemption ≥ 12 mths 0.61 0.60 0.50 0.71 0.64 0 1 0.56 0.57 0.75 Max TANF+FS < $700 0.47 0.07*** 0.60* 0.29 0.07 0.38 0.33 1 0 0 Max TANF+FS $700‐$850 0.44 0.33 0.40 0.53 0.29 0.42 0.41 0 1 0 Max TANF+FS > $850 0.08 0.60*** 0.00* 0.18 0.64*** 0.21 0.26 0 0 1 State EITC 0.08 0.47*** 0.00** 0.24 0.43 0.13 0.26 0.00** 0.24 0.42 State refundable CADC tax credit 0.14 0.33 0.10 0.29 0.21 0.25 0.15 0.06 0.24 0.33 State nonrefundable CADC tax credit 0.31 0.40 0.30 0.35 0.36 0.21 0.44* 0.39 0.33 0.25 Max infant/staff ratio 4.63 4.03** 5.00*** 4.13 4.04 4.41 4.48 5.03*** 4.21 4.04 Infant group size: <10 0.28 0.67*** 0.25 0.41 0.57 0.42 0.37 0.22 0.33 0.75** Infant group size: ≥10 0.33 0.20 0.35 0.35 0.14 0.17 0.41* 0.44 0.29 0.08 Infant group size: not regulated 0.39 0.13* 0.40 0.24 0.29 0.42 0.22 0.33 0.38 0.17
* p < .05, ** p < .01, *** p < .001. Stars relate to a t‐test of difference in the means. Where there are three categories (i.e. for CCDF and TANF+FS levels), the test is relative to the mean of the middle category. All numbers are for 2001, with the exception of the abortion rate (2000) and the child care worker’s median wage (2002). Dollar values are in constant 2001 prices. Abortion rate is per 1000 women age 15‐44. Infant mortality rate is per 1000 live births. Number of licensed child care centers/family day care providers is per 1000 children under 6. Median income is for a family of four.
Panel B: State‐level policies

44
Appendix Table 4. Descriptive Statistics for Variables Used in Main Analysis Variable Mean (SD) Dependent variables Mother at work before 12 weeks 0.28 Mother at work at or before 9 months 0.59 Mother employed at pre‐school wave (approx. age 4; N = 8760) 0.60 Demographic control variables Married to resident biological father 0.65 Cohabiting with resident biological father 0.14 Single mother (no resident father) 0.20 Other family type (e.g. step‐father) 0.01 White non‐Hispanic 0.57 Black non‐Hispanic 0.14 Hispanic 0.23 Asian 0.03 Other race/ethnicity 0.03 Mother: Less than high school 0.27 Mother: High school 0.22 Mother: Some college 0.36 Mother: BA degree 0.15 Mother: More than BA degree 0.09 Mother’s age at birth 28.18 (6.18) No resident siblings at 9 months 0.41 1 resident sibling at 9 months 0.34 More than 1 resident sibling at 9 months 0.26 Sibling under 3 in household at 9 months 0.16 Sibling age 3 or 4 in household at 9 months 0.21 Mother foreign born 0.22 Mother’s primary language non‐English 0.13 Urban area 0.74 Urban cluster 0.12 Rural area 0.14 Father: Less than high school 0.17 Father: High school 0.18 Father: Some college 0.21 Father: BA degree 0.14 Father: More than BA degree 0.10 Father: No resident father 0.20 Additional control variables Mother received welfare in childhood 0.11 Childhood welfare missing 0.01 Mother’s mother some college or more 0.32 Mother’s mother’s education missing 0.04 Mother’s father some college or more 0.33 Mother’s father’s education missing 0.11

45
Mother’s family intact til 16 0.58 0 risky life events ever happened 0.74 1 risky life event ever happened 0.16 2 to 6 risky life events ever happened 0.08 Risky life events missing 0.02 Pre‐pregnancy BMI: Under weight 0.05 Pre‐pregnancy BMI: Normal 0.54 Pre‐pregnancy BMI: Over weight 0.23 Pre‐pregnancy BMI: Obese 0.14 Pre‐pregnancy BMI: Missing 0.03 Ever smoked > 100 cigarettes 0.33 Alcohol pre‐pregnancy: Never 0.62 Alcohol pre‐pregnancy: < 4 drinks pwk 0.31 Alcohol pre‐pregnancy: ≥4 drinks pwk 0.07 Ideal number of children in whole life 2.85 (1.09) Ideal number of children missing 0.10 State‐level treatment variables State leave law 0.36 Annual CCDF spending per poor child under 6 (thousands 2001 dollars, FY2000) 1.85 (0.87) Infant work exemption 12 mths or more 0.47 Max. monthly TANF+FS family of 3 (hundreds 2001 dollars) 7.44 (1.49) Individual‐level treatment variables Mother employed in year before birth 0.71 No parent with high school diploma 0.19 Single mother (no resident father) 0.20 Note: Standard deviation of continuous variables shown in brackets. All other variables are dichotomous. N = 10480 unless otherwise indicated. All individual‐level control variables taken from baseline survey 9 months post‐birth. Statistics are weighted to correct for complex survey design.