The Economic Impact of Illegal Immigration on The United States
42
The University of Akron The University of Akron IdeaExchange@UAkron IdeaExchange@UAkron Williams Honors College, Honors Research Projects The Dr. Gary B. and Pamela S. Williams Honors College Spring 2020 The Economic Impact of Illegal Immigration on The United States The Economic Impact of Illegal Immigration on The United States Bryan Bixler [email protected] Follow this and additional works at: https://ideaexchange.uakron.edu/honors_research_projects Part of the American Politics Commons Please take a moment to share how this work helps you through this survey. Your feedback will be important as we plan further development of our repository. Recommended Citation Recommended Citation Bixler, Bryan, "The Economic Impact of Illegal Immigration on The United States" (2020). Williams Honors College, Honors Research Projects. 1218. https://ideaexchange.uakron.edu/honors_research_projects/1218 This Dissertation/Thesis is brought to you for free and open access by The Dr. Gary B. and Pamela S. Williams Honors College at IdeaExchange@UAkron, the institutional repository of The University of Akron in Akron, Ohio, USA. It has been accepted for inclusion in Williams Honors College, Honors Research Projects by an authorized administrator of IdeaExchange@UAkron. For more information, please contact [email protected], [email protected].
-
Upload
khangminh22 -
Category
Documents
-
view
0 -
download
0
Transcript of The Economic Impact of Illegal Immigration on The United States
The University of Akron The University of Akron
IdeaExchange@UAkron IdeaExchange@UAkron
Williams Honors College, Honors Research Projects
The Dr. Gary B. and Pamela S. Williams Honors College
Spring 2020
The Economic Impact of Illegal Immigration on The United States The Economic Impact of Illegal Immigration on The United States
Bryan Bixler [email protected]
Follow this and additional works at: https://ideaexchange.uakron.edu/honors_research_projects
Part of the American Politics Commons
Please take a moment to share how this work helps you through this survey. Your feedback will
be important as we plan further development of our repository.
Recommended Citation Recommended Citation Bixler, Bryan, "The Economic Impact of Illegal Immigration on The United States" (2020). Williams Honors College, Honors Research Projects. 1218. https://ideaexchange.uakron.edu/honors_research_projects/1218
This Dissertation/Thesis is brought to you for free and open access by The Dr. Gary B. and Pamela S. Williams Honors College at IdeaExchange@UAkron, the institutional repository of The University of Akron in Akron, Ohio, USA. It has been accepted for inclusion in Williams Honors College, Honors Research Projects by an authorized administrator of IdeaExchange@UAkron. For more information, please contact [email protected], [email protected].

1
The Economic Impact of Illegal Immigration on The United States
Bryan Bixler
April 25, 2020
The Williams Honors College
2
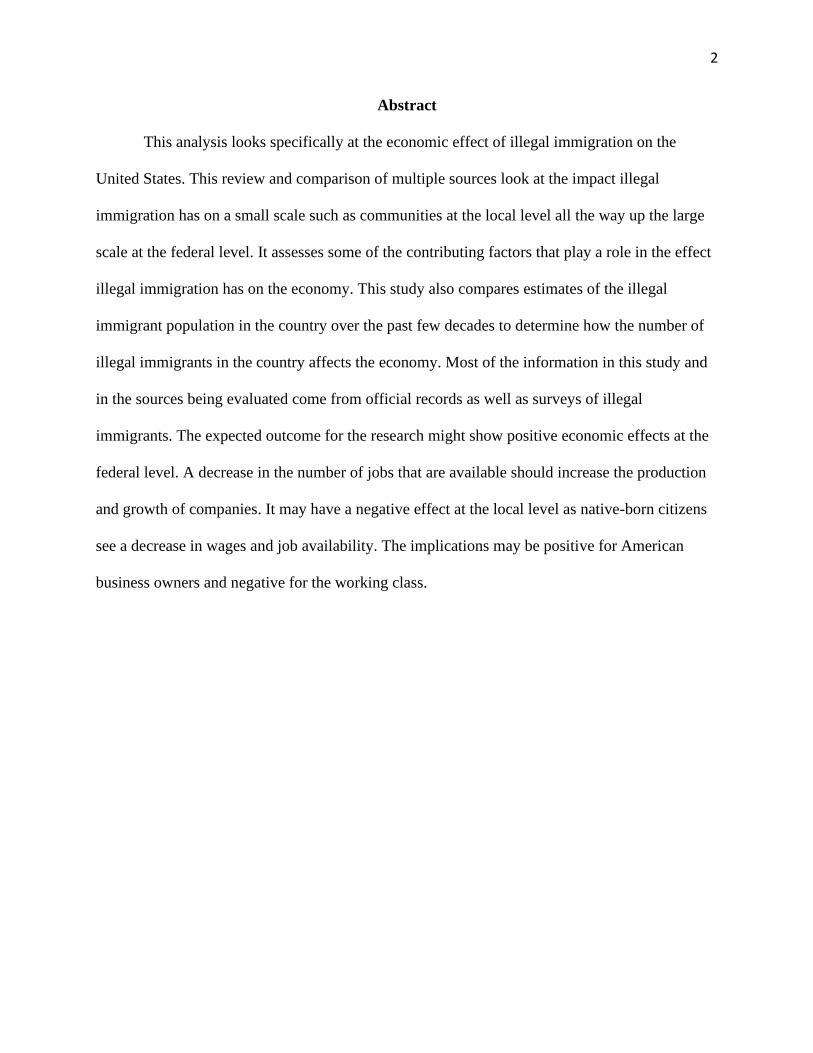
Abstract
This analysis looks specifically at the economic effect of illegal immigration on the
United States. This review and comparison of multiple sources look at the impact illegal
immigration has on a small scale such as communities at the local level all the way up the large
scale at the federal level. It assesses some of the contributing factors that play a role in the effect
illegal immigration has on the economy. This study also compares estimates of the illegal
immigrant population in the country over the past few decades to determine how the number of
illegal immigrants in the country affects the economy. Most of the information in this study and
in the sources being evaluated come from official records as well as surveys of illegal
immigrants. The expected outcome for the research might show positive economic effects at the
federal level. A decrease in the number of jobs that are available should increase the production
and growth of companies. It may have a negative effect at the local level as native-born citizens
see a decrease in wages and job availability. The implications may be positive for American
business owners and negative for the working class.
3
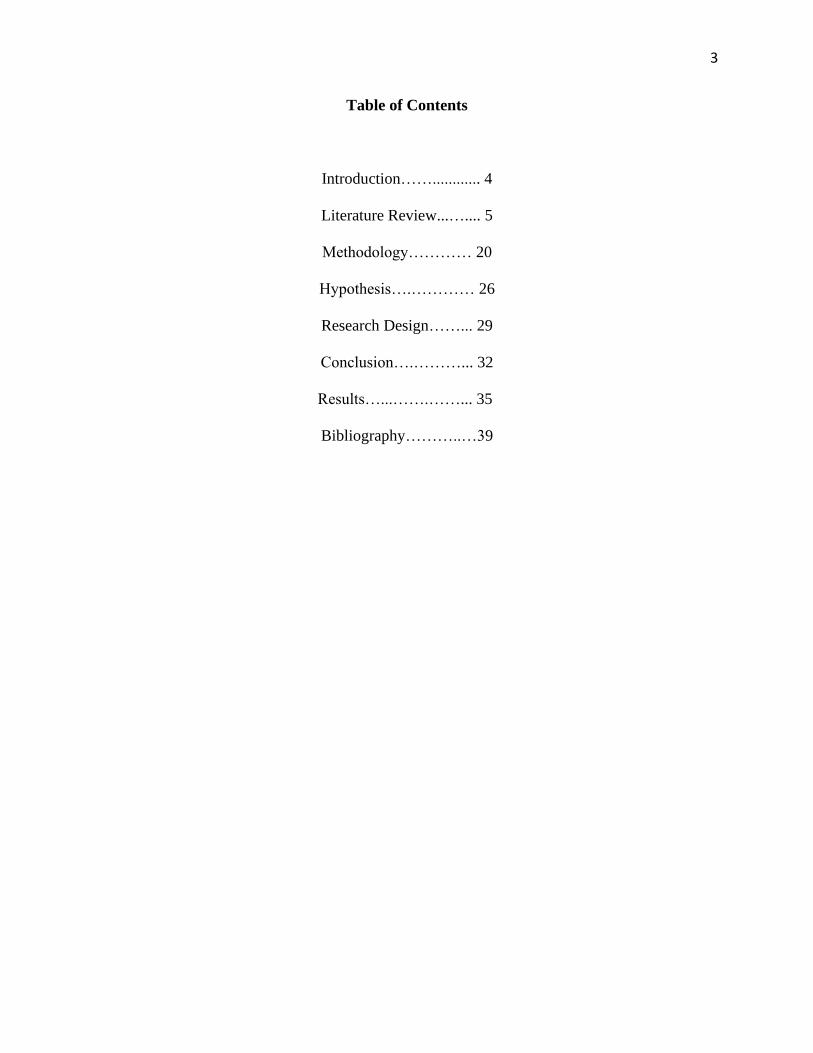
Table of Contents
Introduction……............ 4
Literature Review...….... 5
Methodology………… 20
Hypothesis….………… 26
Research Design……... 29
Conclusion….………... 32
Results…...…….……... 35
Bibliography………..…39
4
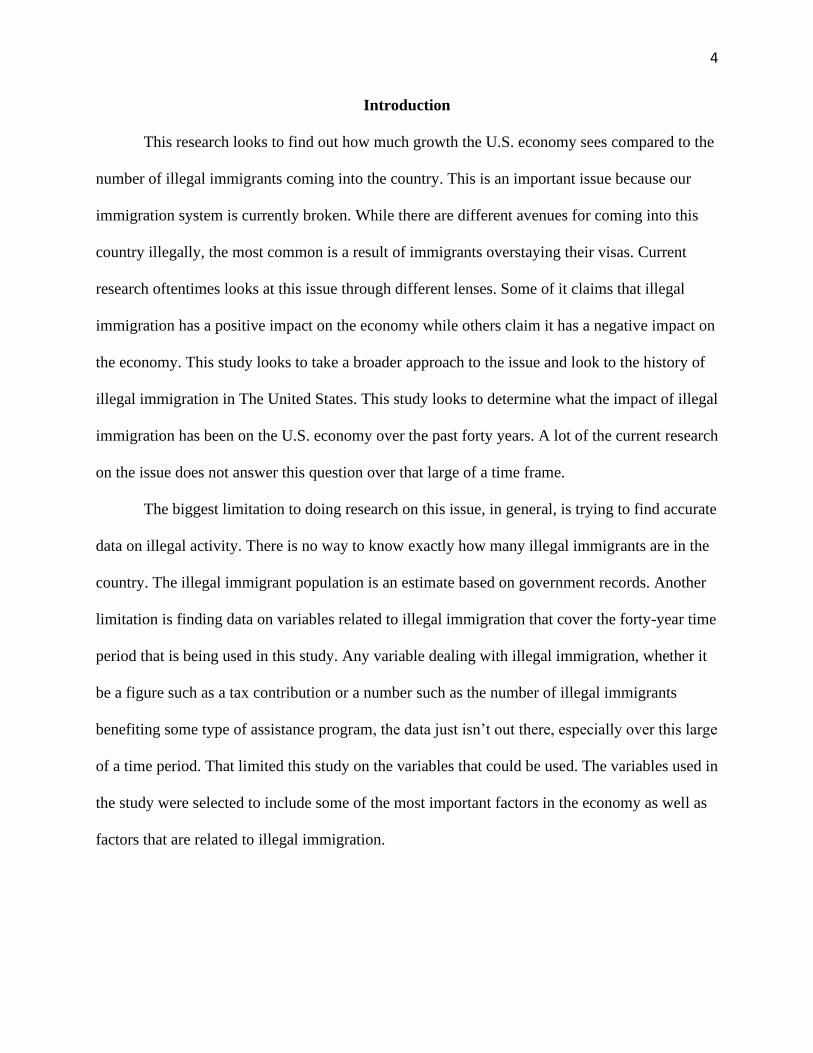
Introduction
This research looks to find out how much growth the U.S. economy sees compared to the
number of illegal immigrants coming into the country. This is an important issue because our
immigration system is currently broken. While there are different avenues for coming into this
country illegally, the most common is a result of immigrants overstaying their visas. Current
research oftentimes looks at this issue through different lenses. Some of it claims that illegal
immigration has a positive impact on the economy while others claim it has a negative impact on
the economy. This study looks to take a broader approach to the issue and look to the history of
illegal immigration in The United States. This study looks to determine what the impact of illegal
immigration has been on the U.S. economy over the past forty years. A lot of the current research
on the issue does not answer this question over that large of a time frame.
The biggest limitation to doing research on this issue, in general, is trying to find accurate
data on illegal activity. There is no way to know exactly how many illegal immigrants are in the
country. The illegal immigrant population is an estimate based on government records. Another
limitation is finding data on variables related to illegal immigration that cover the forty-year time
period that is being used in this study. Any variable dealing with illegal immigration, whether it
be a figure such as a tax contribution or a number such as the number of illegal immigrants
benefiting some type of assistance program, the data just isn’t out there, especially over this large
of a time period. That limited this study on the variables that could be used. The variables used in
the study were selected to include some of the most important factors in the economy as well as
factors that are related to illegal immigration.
5
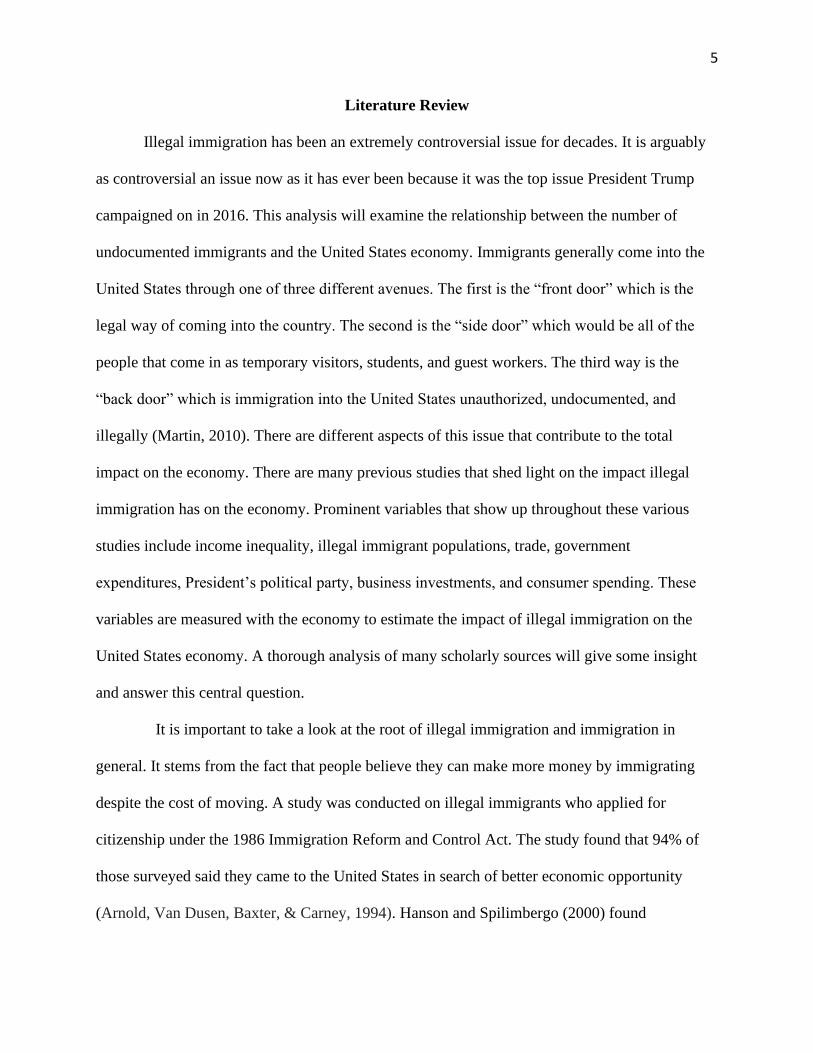
Literature Review
Illegal immigration has been an extremely controversial issue for decades. It is arguably
as controversial an issue now as it has ever been because it was the top issue President Trump
campaigned on in 2016. This analysis will examine the relationship between the number of
undocumented immigrants and the United States economy. Immigrants generally come into the
United States through one of three different avenues. The first is the “front door” which is the
legal way of coming into the country. The second is the “side door” which would be all of the
people that come in as temporary visitors, students, and guest workers. The third way is the
“back door” which is immigration into the United States unauthorized, undocumented, and
illegally (Martin, 2010). There are different aspects of this issue that contribute to the total
impact on the economy. There are many previous studies that shed light on the impact illegal
immigration has on the economy. Prominent variables that show up throughout these various
studies include income inequality, illegal immigrant populations, trade, government
expenditures, President’s political party, business investments, and consumer spending. These
variables are measured with the economy to estimate the impact of illegal immigration on the
United States economy. A thorough analysis of many scholarly sources will give some insight
and answer this central question.
It is important to take a look at the root of illegal immigration and immigration in
general. It stems from the fact that people believe they can make more money by immigrating
despite the cost of moving. A study was conducted on illegal immigrants who applied for
citizenship under the 1986 Immigration Reform and Control Act. The study found that 94% of
those surveyed said they came to the United States in search of better economic opportunity
(Arnold, Van Dusen, Baxter, & Carney, 1994). Hanson and Spilimbergo (2000) found
6
immigrants come to the U.S. because they believe that it is worth leaving behind everything they
have to start a new life. Berk, Schur, Chavez, and Frankel (2000) conducted a study to find out if
healthcare benefits are an incentive that draws illegal immigrants into the county. The study
concluded that excluding illegal immigrants as recipients of government-funded healthcare
would not have an effect on illegal immigration. Therefore, it is unlikely that healthcare benefits
play a role in illegal immigrants coming to the United States. They conclude the primary reason
illegal immigrants come to the United States is for better economic opportunity and higher-
paying jobs (Berk, Schur, Chavez, and Frankel, 2000).
The 1970s brought a substantial amount of legal immigration to the United States. While
legal immigration was increasing, so was illegal immigration. This is the first time in the nation's
history that illegal immigration started to become a prominent issue (Bean, Telles, and Lowell,
1987). The Select Commission on Immigration and Refugee Policy was created through federal
law to consider the impact of foreign workers on the United States labor market (Greenwood, &
McDowell, 1986). The substantial increase in foreign workers sparked the question of whether or
not immigrant workers cause the reduction of domestic wages for native workers and the
displacement of native workers from their current jobs. Research was conducted during this time
period to determine the effect immigration had on wages, employment and income inequality
(Greenwood, & McDowell, 1986).
After studying the impact immigrants have on domestic workers, Greenwood and
McDowell (1986) noted that there was a paucity of research in this area and a significant amount
of work needed to be done to fully understand the implications of this impact. They concluded
that the number of less-skilled immigrant workers began increasing substantially in the 1970s.
This trend is still consistent today as most illegal immigrants are competing for low skilled jobs
7
even if they are skilled or have an education (Espenshade, 1995; Djajic, 1997; The United States
Commission on Civil Rights, 2008; Hanson, 2009).
Greenwood and McDowell (1986) concluded that most native workers in higher-skilled
jobs are unaffected by illegal immigrants in terms of competition for jobs. While that was the
case in 1986, it is still the case today. Hanson (2009) also noted that illegal immigration
primarily provides a source of low-skilled labor. Greenwood and McDowell (1986) stated their
conclusions simply could not be made on the issue of immigration’s cumulative effect on
demand and capital. At the time of their study, there simply wasn’t any empirical evidence on the
subject matter. However, they did say that trends would suggest, as legal and illegal immigrants
invest in capital in the United States economy and gain experience, their productivity along with
the contribution they were making to the economy increased. Finally, with respect to the issue of
effects on low skilled workers, Greenwood and McDowell (1986) said the positive effects of
illegal immigration on the low-skilled labor force and their implications on low-skilled American
native workers were underestimated. The United States Commission on Civil Rights (2008)
stated different findings in a more recent study. Their research concluded that illegal immigration
had negative effects on the low-skilled labor force.
The effects legal and illegal immigrants had on the employment and wages of American
citizens is minimal according to the results of the 1986 study by Greenwood and McDowell.
They believed that legal and illegal immigrants at the time were competing with past legal and
illegal immigrants (Greenwood & McDowell, 1986). The number of legal and illegal immigrants
was significantly less in 1986 compared to recent years. In 1986 when this report was published
covering what was a relatively new phenomenon, Greenwood and McDowell predicted that
would be one of the most pressing issues for decades to come.
8
Winegarden and Khor conducted research based on the findings of Greenwood and
McDowell (1993). They attempted to set up a model to determine if an increase in illegal
immigration in the United States has a disequalizing effect on the income of native-born citizens
(Winegarden & Khor, 1993). Winegarden and Khor set up a model using income inequality in
native-born households and census-based estimates of the state distribution of illegal immigrants.
Their research concluded that legal and illegal immigration has a very small impact on income
inequality and that other socio-economic variables are much more influential (Winegarden &
Khor, 1993).
An updated analysis was presented by The United States Commission on Civil Rights to
The President, The Senate President, and The Speaker of the House in 2008. This briefing report
covered the effects of illegal immigration on economic loss and job opportunity costs to black
workers. Data was collected and analyzed from the United States census covering a forty-year
time period which included 1960 to 2000 (The United States Commission on Civil Rights, 2008).
The Commission stated illegal immigrants at that time made up about an estimated five percent
of the United States workforce. Most of those workers were concentrated in certain industries
that had minimal skill and education requirements. They also estimated that immigrants made up
one-seventh of the American workforce. Of that portion, illegal immigrants were estimated to
make up one-third of the total number of immigrants in the United States (The United States
Commission on Civil Rights, 2008).
The evidence that The United States Commission on Civil Rights presented had several
conclusions. The consistent increase in illegal immigration to the United States has significantly
increased the low-skilled, low-wage labor available in the United States labor market (The
United States Commission on Civil Rights. 2008). On average, six in every ten black males do
9
not have higher education attainments greater than a high school diploma. The commission
stated that this group of black males is in direct competition with the influx of illegal immigrants
coming into the United States. They are competing for the same jobs. They also noted that the
average person with a school diploma is less today than someone with a high school diploma
thirty-five years ago. The Commission stated that illegal immigration today is lowering the
wages and employment rates for all low-skilled American workers (The United States
Commission on Civil Rights 2008). Taking into consideration the number of black males that are
in the low skilled job market, a disproportionate number of them are being negatively impacted
by illegal immigration. The Commission specifically looked at the employment rates of Black
Americans and found that they decreased by 3.5% due to illegal immigration (The United States
Commission on Civil Rights 2008).
Illegal immigration has a negative impact on the local level while often having a positive
impact on the national level. A geographic area that sees an increase in jobs being occupied by
illegal foreign workers may see a positive short-term effect on wages of skilled native workers
(Djajic, 1997). Illegal immigration can also have a positive effect on unskilled native workers if
those workers are not competing for jobs with illegal foreign workers (Djajic, 1997). However,
native workers are competing for jobs in many cases which has a negative short-term effect on
the unskilled native workers (Djajic, 1997).
Another source has similar findings despite one small difference. The author noted that
illegal immigration benefits the U.S. and has a positive effect on the economy. The findings
suggest illegal immigration has a positive effect on both the primary and secondary sectors of the
labor force (Nadadur, 2009). These findings are mostly consistent with Djajic’s (1997) findings
despite the difference in the potential effects on the unskilled labor force. Espenshade (1995)
10
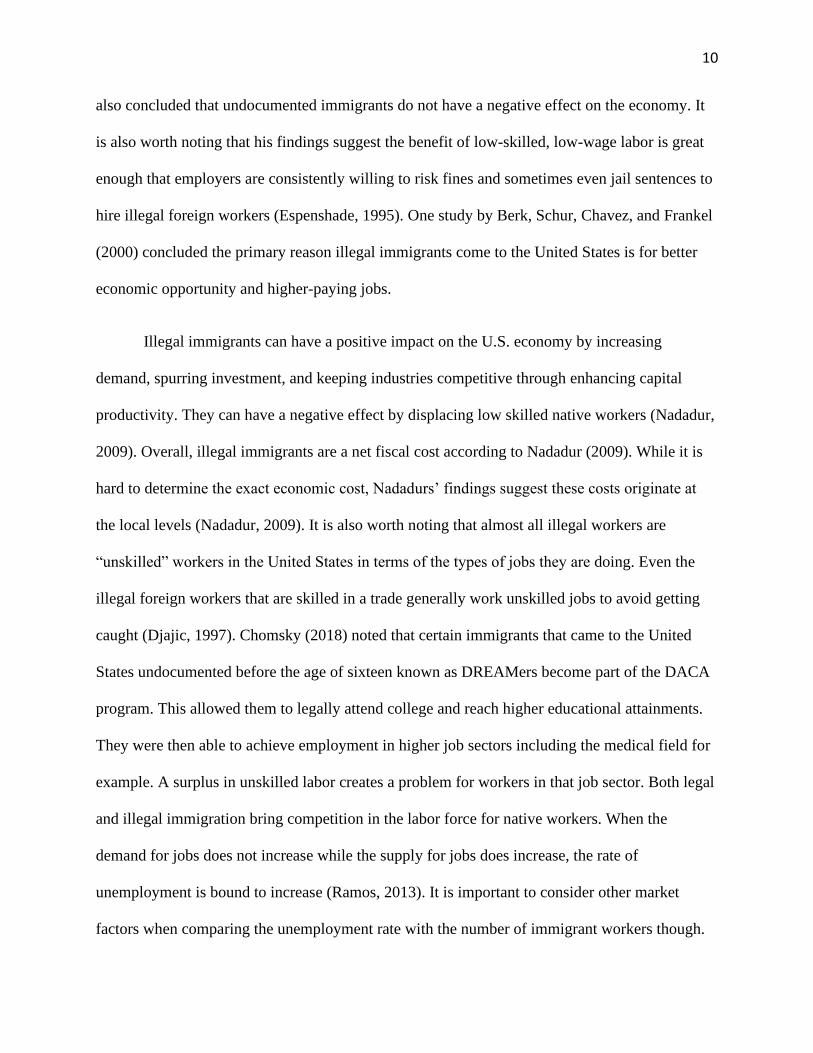
also concluded that undocumented immigrants do not have a negative effect on the economy. It
is also worth noting that his findings suggest the benefit of low-skilled, low-wage labor is great
enough that employers are consistently willing to risk fines and sometimes even jail sentences to
hire illegal foreign workers (Espenshade, 1995). One study by Berk, Schur, Chavez, and Frankel
(2000) concluded the primary reason illegal immigrants come to the United States is for better
economic opportunity and higher-paying jobs.
Illegal immigrants can have a positive impact on the U.S. economy by increasing
demand, spurring investment, and keeping industries competitive through enhancing capital
productivity. They can have a negative effect by displacing low skilled native workers (Nadadur,
2009). Overall, illegal immigrants are a net fiscal cost according to Nadadur (2009). While it is
hard to determine the exact economic cost, Nadadurs’ findings suggest these costs originate at
the local levels (Nadadur, 2009). It is also worth noting that almost all illegal workers are
“unskilled” workers in the United States in terms of the types of jobs they are doing. Even the
illegal foreign workers that are skilled in a trade generally work unskilled jobs to avoid getting
caught (Djajic, 1997). Chomsky (2018) noted that certain immigrants that came to the United
States undocumented before the age of sixteen known as DREAMers become part of the DACA
program. This allowed them to legally attend college and reach higher educational attainments.
They were then able to achieve employment in higher job sectors including the medical field for
example. A surplus in unskilled labor creates a problem for workers in that job sector. Both legal
and illegal immigration bring competition in the labor force for native workers. When the
demand for jobs does not increase while the supply for jobs does increase, the rate of
unemployment is bound to increase (Ramos, 2013). It is important to consider other market
factors when comparing the unemployment rate with the number of immigrant workers though.
11
For example, after the bubble burst in 2008, the unemployment rate rose to 9.7%. There were
major economic factors that contributed to this rather than political factors such as the number of
illegal immigrants in the United States (Pollin, 2011).
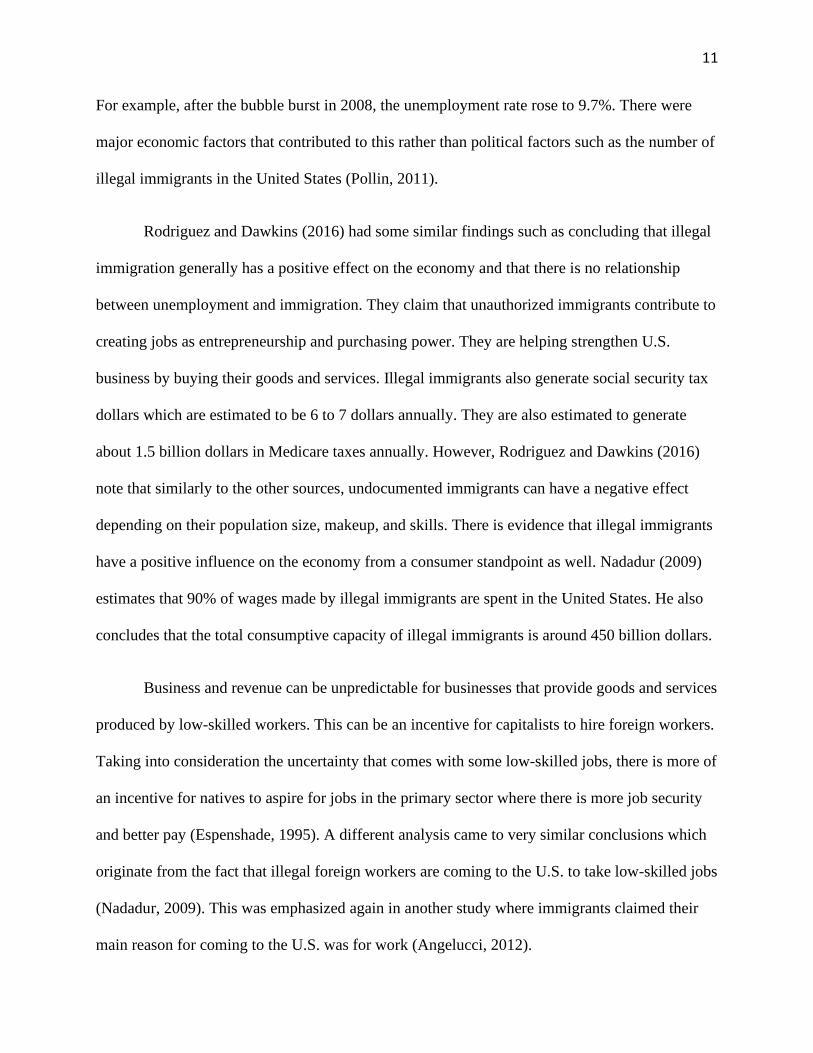
Rodriguez and Dawkins (2016) had some similar findings such as concluding that illegal
immigration generally has a positive effect on the economy and that there is no relationship
between unemployment and immigration. They claim that unauthorized immigrants contribute to
creating jobs as entrepreneurship and purchasing power. They are helping strengthen U.S.
business by buying their goods and services. Illegal immigrants also generate social security tax
dollars which are estimated to be 6 to 7 dollars annually. They are also estimated to generate
about 1.5 billion dollars in Medicare taxes annually. However, Rodriguez and Dawkins (2016)
note that similarly to the other sources, undocumented immigrants can have a negative effect
depending on their population size, makeup, and skills. There is evidence that illegal immigrants
have a positive influence on the economy from a consumer standpoint as well. Nadadur (2009)
estimates that 90% of wages made by illegal immigrants are spent in the United States. He also
concludes that the total consumptive capacity of illegal immigrants is around 450 billion dollars.
Business and revenue can be unpredictable for businesses that provide goods and services
produced by low-skilled workers. This can be an incentive for capitalists to hire foreign workers.
Taking into consideration the uncertainty that comes with some low-skilled jobs, there is more of
an incentive for natives to aspire for jobs in the primary sector where there is more job security
and better pay (Espenshade, 1995). A different analysis came to very similar conclusions which
originate from the fact that illegal foreign workers are coming to the U.S. to take low-skilled jobs
(Nadadur, 2009). This was emphasized again in another study where immigrants claimed their
main reason for coming to the U.S. was for work (Angelucci, 2012).
12
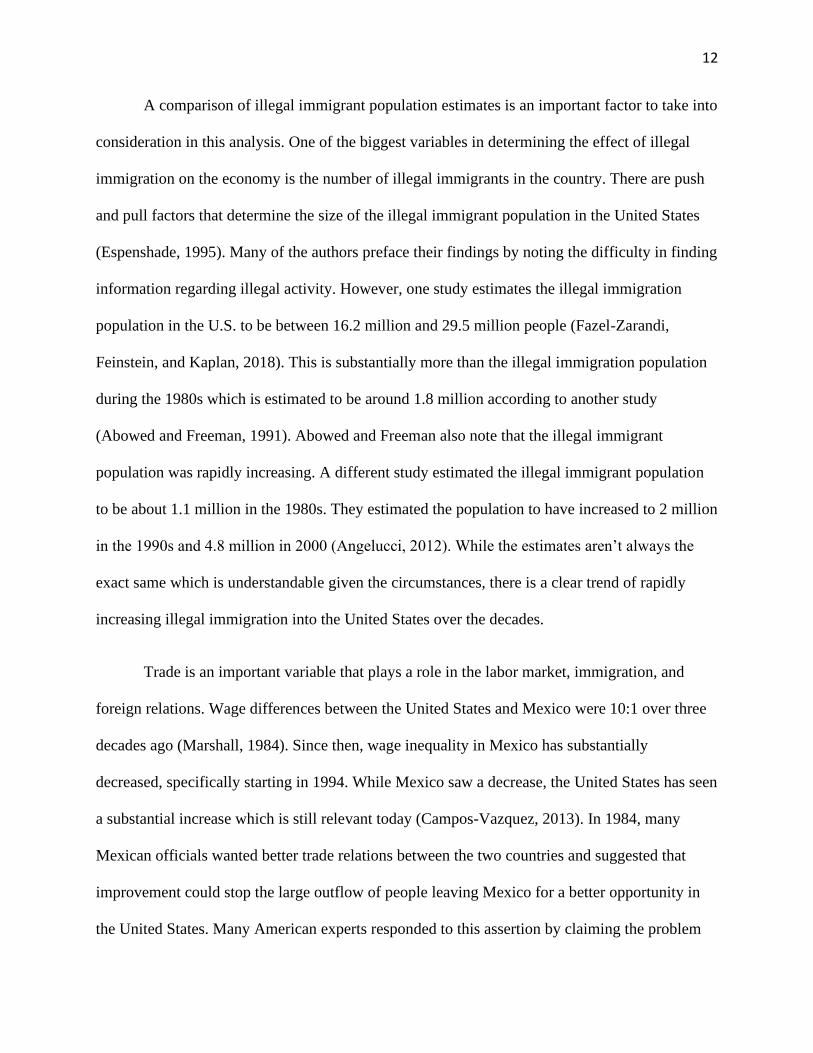
A comparison of illegal immigrant population estimates is an important factor to take into
consideration in this analysis. One of the biggest variables in determining the effect of illegal
immigration on the economy is the number of illegal immigrants in the country. There are push
and pull factors that determine the size of the illegal immigrant population in the United States
(Espenshade, 1995). Many of the authors preface their findings by noting the difficulty in finding
information regarding illegal activity. However, one study estimates the illegal immigration
population in the U.S. to be between 16.2 million and 29.5 million people (Fazel-Zarandi,
Feinstein, and Kaplan, 2018). This is substantially more than the illegal immigration population
during the 1980s which is estimated to be around 1.8 million according to another study
(Abowed and Freeman, 1991). Abowed and Freeman also note that the illegal immigrant
population was rapidly increasing. A different study estimated the illegal immigrant population
to be about 1.1 million in the 1980s. They estimated the population to have increased to 2 million
in the 1990s and 4.8 million in 2000 (Angelucci, 2012). While the estimates aren’t always the
exact same which is understandable given the circumstances, there is a clear trend of rapidly
increasing illegal immigration into the United States over the decades.
Trade is an important variable that plays a role in the labor market, immigration, and
foreign relations. Wage differences between the United States and Mexico were 10:1 over three
decades ago (Marshall, 1984). Since then, wage inequality in Mexico has substantially
decreased, specifically starting in 1994. While Mexico saw a decrease, the United States has seen
a substantial increase which is still relevant today (Campos-Vazquez, 2013). In 1984, many
Mexican officials wanted better trade relations between the two countries and suggested that
improvement could stop the large outflow of people leaving Mexico for a better opportunity in
the United States. Many American experts responded to this assertion by claiming the problem
13
was within Mexican trade imports being uncompetitive rather than any tariff or trade issue
(Marshall, 1984). Economic experts said our trade policy with all countries is generally on the
“most-favored-nation system” (Marshall, 1984). They were skeptical about changing the United
States trade policy with Mexico because it could negatively affect the trade policy with other
countries. Marshall states that there isn’t very much the United States can do from a political
standpoint to narrow the employment and wage gaps in the United States (Marshall, 1984).
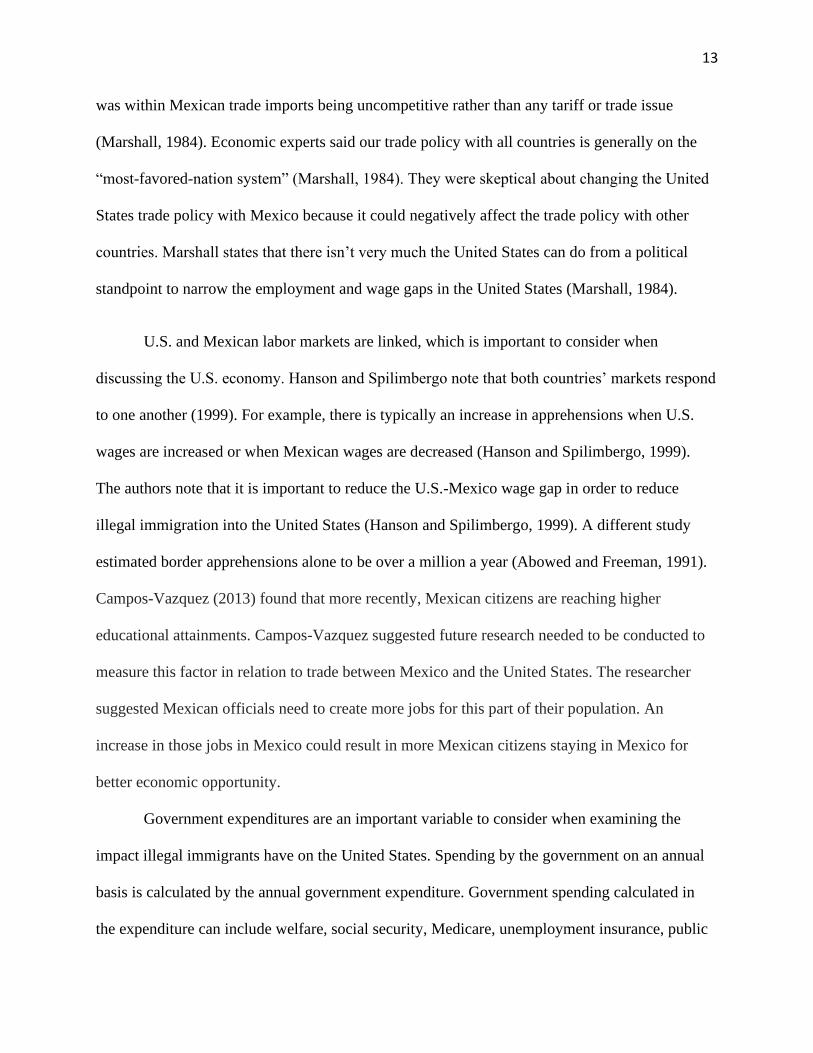
U.S. and Mexican labor markets are linked, which is important to consider when
discussing the U.S. economy. Hanson and Spilimbergo note that both countries’ markets respond
to one another (1999). For example, there is typically an increase in apprehensions when U.S.
wages are increased or when Mexican wages are decreased (Hanson and Spilimbergo, 1999).
The authors note that it is important to reduce the U.S.-Mexico wage gap in order to reduce
illegal immigration into the United States (Hanson and Spilimbergo, 1999). A different study
estimated border apprehensions alone to be over a million a year (Abowed and Freeman, 1991).
Campos-Vazquez (2013) found that more recently, Mexican citizens are reaching higher
educational attainments. Campos-Vazquez suggested future research needed to be conducted to
measure this factor in relation to trade between Mexico and the United States. The researcher
suggested Mexican officials need to create more jobs for this part of their population. An
increase in those jobs in Mexico could result in more Mexican citizens staying in Mexico for
better economic opportunity.
Government expenditures are an important variable to consider when examining the
impact illegal immigrants have on the United States. Spending by the government on an annual
basis is calculated by the annual government expenditure. Government spending calculated in
the expenditure can include welfare, social security, Medicare, unemployment insurance, public
14
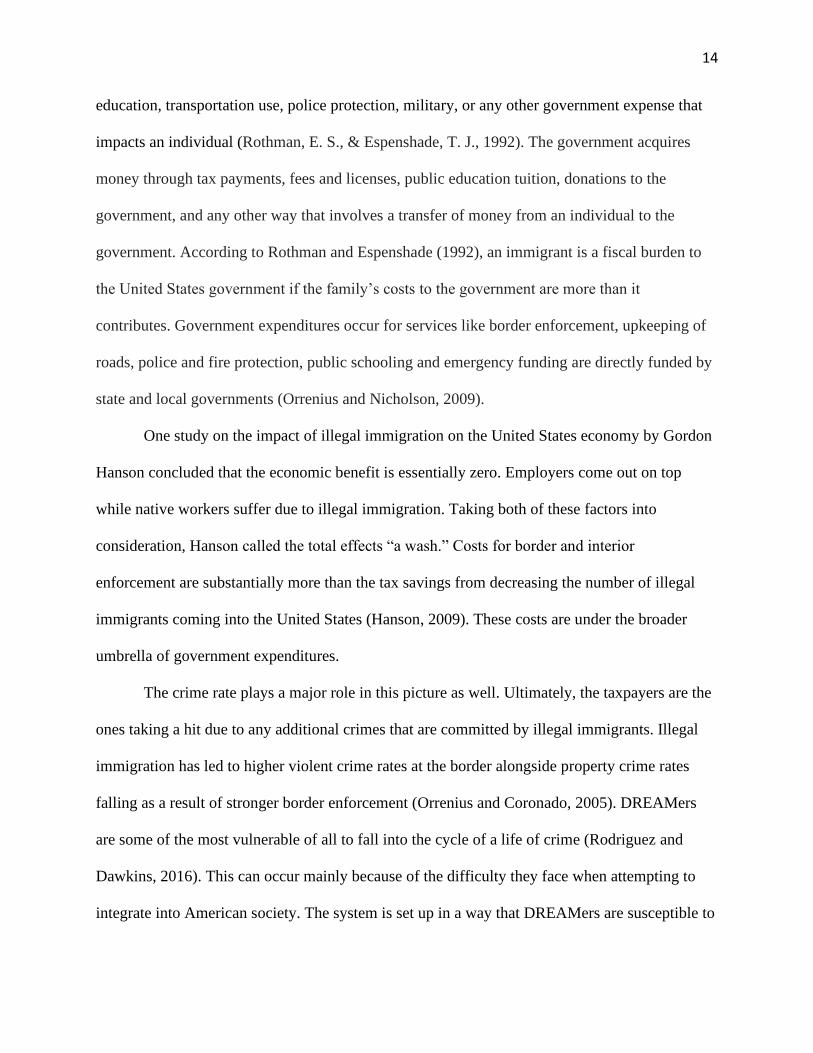
education, transportation use, police protection, military, or any other government expense that
impacts an individual (Rothman, E. S., & Espenshade, T. J., 1992). The government acquires
money through tax payments, fees and licenses, public education tuition, donations to the
government, and any other way that involves a transfer of money from an individual to the
government. According to Rothman and Espenshade (1992), an immigrant is a fiscal burden to
the United States government if the family’s costs to the government are more than it
contributes. Government expenditures occur for services like border enforcement, upkeeping of
roads, police and fire protection, public schooling and emergency funding are directly funded by
state and local governments (Orrenius and Nicholson, 2009).
One study on the impact of illegal immigration on the United States economy by Gordon
Hanson concluded that the economic benefit is essentially zero. Employers come out on top
while native workers suffer due to illegal immigration. Taking both of these factors into
consideration, Hanson called the total effects “a wash.” Costs for border and interior
enforcement are substantially more than the tax savings from decreasing the number of illegal
immigrants coming into the United States (Hanson, 2009). These costs are under the broader
umbrella of government expenditures.
The crime rate plays a major role in this picture as well. Ultimately, the taxpayers are the
ones taking a hit due to any additional crimes that are committed by illegal immigrants. Illegal
immigration has led to higher violent crime rates at the border alongside property crime rates
falling as a result of stronger border enforcement (Orrenius and Coronado, 2005). DREAMers
are some of the most vulnerable of all to fall into the cycle of a life of crime (Rodriguez and
Dawkins, 2016). This can occur mainly because of the difficulty they face when attempting to
integrate into American society. The system is set up in a way that DREAMers are susceptible to
15
experiencing personal failure in many different ways which can lead to a life of crime
(Rodriguez and Dawkins, 2016).
Illegal immigrants have a much-debated effect on social welfare programs. One study
claims the programs are highly participated in by illegal immigrants (Rodriguez and Dawkins,
2016). Berk, Schur, Chavez, and Frankel (2000) found that social services did not influence
illegal immigrants’ decisions to stay in the United States. Another common misconception is that
illegal immigrants come to the United States to reap the healthcare benefits of this country. The
study found that again, the main reason for coming is economic opportunity and health care did
not play a role. However, they did find that illegal immigrants did participate in a number of
assistance programs from the government along with federally and locally funded institutions.
Despite the conclusion that some illegal immigrants did participate in these programs, it was
unclear exactly how many illegal immigrants participated in such programs. Berk, Schur,
Chavez, and Frankel (2000) noted that there isn’t an accurate way to estimate that data. While
the amount of participation varied, some of those programs include food stamps, WIC, public
schools, free/reduced-price lunches, and subsidized housing (Berk, Schur, Chavez, and Frankel,
2000).
Immigration policy is another contributor that has shaped the current state of immigration
in the United States and thus, the implications it has had on the economy. Immigration policy is
largely a result of United States presidents and the ideology of their political parties which shape
the policies that they enact. While all of the past Presidents have had the best intentions for the
United States at heart, they have had differing views on what policies were best to achieve those
goals. Gordon Hanson examined this political variable in his works. President Bush attempted to
touch the surface of an increasingly larger issue in illegal immigration. On February 2nd, 2005,
16
President Bush said, “America’s immigration system is outdated, unsuited to the needs of our
economy and to the values of our country. We should not be content with laws that punish
hardworking people and deny business willing workers and invite chaos at our border” (Hanson,
pp. 3, 2009). President Obama echoed a similar message when addressing the issue of illegal
immigration. He spoke about the issue on June 28, 2008, and said, “We need immigration reform
that will secure our borders, and… that finally brings the twelve million people who are here
illegally out of the shadows… We must assert our values and reconcile our principles as a nation
of immigrants and nation of laws” (Hanson, pp. 3, 2009).
While both administrations agreed that the United States had a broken immigration
system, they had different approaches to fixing it. President Bush advocated for enforcement
initiatives and temporary work programs. While illegal immigration has largely negative effects
on the low-skilled labor force, both Presidents saw the positive contribution illegal immigrants
made to the economy overall (Hanson, 2009).
The Immigration Reform and Control Act of 1986, criminalized employment of illegal
immigrants, mandated monitoring of employers and expanded border control. This act has
shaped the current United States immigration policy. Employers are required to obtain proof of
citizenship or eligibility which is typically in the form of a social security card or a green card
from prospective employees (Hanson, 2007). Border patrol has gradually increased enforcement
since 1986 and especially recently under President Trump. Hanson (2007) noted that the number
of hours spent patrolling the United States border increased by 2.9 percent between the years of
1990 and 2005.
Blinder and Watson (2016) conducted a study to determine how a President’s political
party impacts the economy. They first noted that there are constant trends in the increase or
17
decrease in Gross Domestic Product (GDP) depending on whether the President is from the
Republican or Democratic party. Blinder and Watson used a precise methodology that measured
a President’s political party over sixteen Presidential terms to the growth or increase of the GDP.
They were able to determine which policy impacted the change in the GDP over these terms.
They concluded that there is consistently more growth in the economy when there is a
Democratic President, the gap being 1.79 percentage points (Blinder & Watson, 2016). This
growth was a direct result of Democratic control of the presidency rather than of Congress.
While Democrats like to attribute an increase in the GDP to better economic policy, Blinder and
Watson credit other variables. GDP growth as a result of policy variables is actually more
substantial under Republican Presidents. The major contributing variables that contribute to the
growth under Democratic presidents include better oil shocks than under Republican presidents,
faster growth of defense spending, and a better record of productivity shocks (Blinder & Watson,
2016).
Blinder and Watson (2016) also examined two other substantial variables and their
relationship to the GDP over a sixty-four-year period. They looked to see how business spending
and consumer spending impacted the fluctuation of the GDP. Political policy has a major impact
on business and consumer spending. For example, Federal policy impacts the interest rates which
have an effect on business investments. Blinder and Watson determined that the GDP growth
gap between Democratic and Republican Presidents comes from larger business spending on
fixed investments and larger consumer spending on durables (Blinder & Watson, 2016).
McConnell, Mosser, and Perez-Quiros (1999) examined the factors that contributed to the
increasing growth in GDP throughout the 1980s and 1990s. They determined that the growth was
largely attributed to four major factors including consumer spending, business investments,
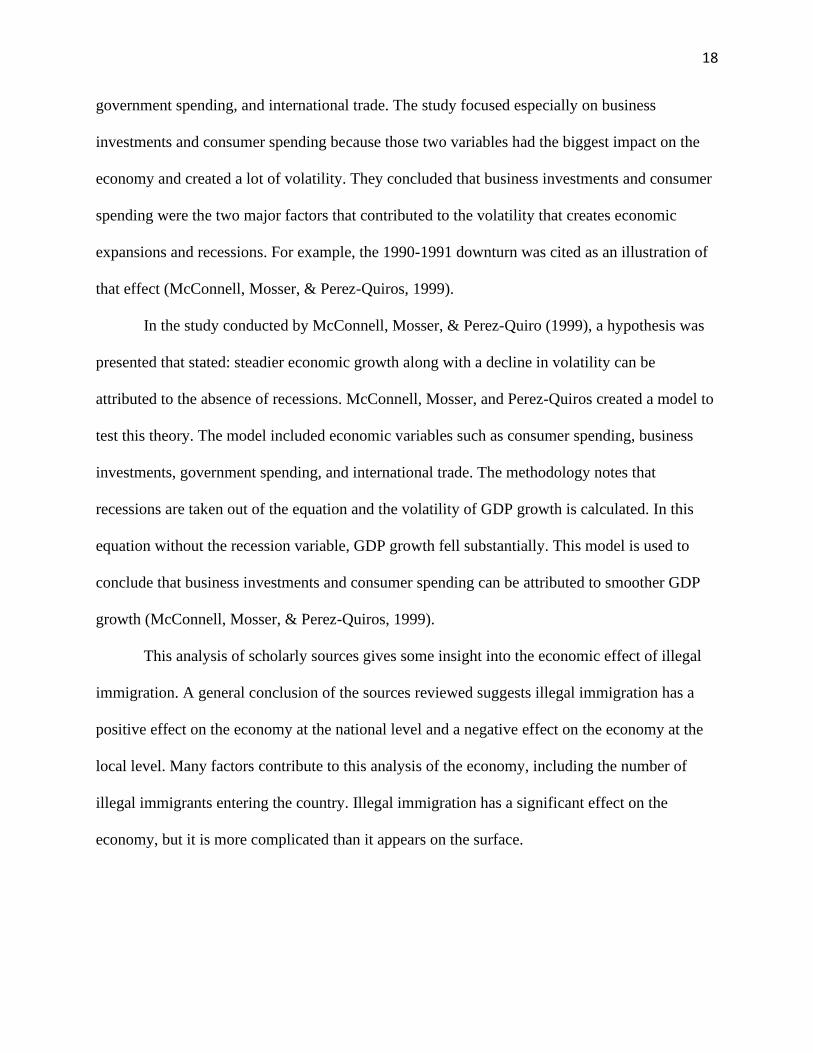
18
government spending, and international trade. The study focused especially on business
investments and consumer spending because those two variables had the biggest impact on the
economy and created a lot of volatility. They concluded that business investments and consumer
spending were the two major factors that contributed to the volatility that creates economic
expansions and recessions. For example, the 1990-1991 downturn was cited as an illustration of
that effect (McConnell, Mosser, & Perez-Quiros, 1999).
In the study conducted by McConnell, Mosser, & Perez-Quiro (1999), a hypothesis was
presented that stated: steadier economic growth along with a decline in volatility can be
attributed to the absence of recessions. McConnell, Mosser, and Perez-Quiros created a model to
test this theory. The model included economic variables such as consumer spending, business
investments, government spending, and international trade. The methodology notes that
recessions are taken out of the equation and the volatility of GDP growth is calculated. In this
equation without the recession variable, GDP growth fell substantially. This model is used to
conclude that business investments and consumer spending can be attributed to smoother GDP
growth (McConnell, Mosser, & Perez-Quiros, 1999).
This analysis of scholarly sources gives some insight into the economic effect of illegal
immigration. A general conclusion of the sources reviewed suggests illegal immigration has a
positive effect on the economy at the national level and a negative effect on the economy at the
local level. Many factors contribute to this analysis of the economy, including the number of
illegal immigrants entering the country. Illegal immigration has a significant effect on the
economy, but it is more complicated than it appears on the surface.
19
Methodology
This research is based on observational data collected from official sources. As a result,
the research design is quasi-experimental. The cases will be analyzed on an annual basis from
1975-2015. The dependent variable is the economy which is measured by GDP. The independent
variables include the illegal immigrant population, the president’s political party, income
inequality, US trade balance, government expenditures, private fixed investment, and consumer
spending. This study is conducted using quantitative data. The data is collected and analyzed
through an excel spreadsheet.
The sample size for this study is 40 years - 1975 to 2015. There are various reasons for
this sample size. It became clear throughout researching the current studies on this issue that
illegal immigration largely picked up in the 1970s. This same trend spiked even more in the
1980s and has yet to even out. The sample size conducted in this research is precisely targeted to
the years in which trends in illegal immigration in the United States became an issue. Many
studies have been conducted as cited in the literature to address this issue but none of them use a
sample size as large as the one being used in this research. The purpose of this sample size is to
get a better understanding of the economic impact of illegal immigration on the United States
and this sample size is ideal to discover those results on an updated larger scale that hasn’t been
conducted before. In the current research on the subject, the issue is typically addressed by
looking at the variables on a nationwide basis rather than a statewide basis. That approach was
mirrored in this study as well. Some of the variables do not have as reliable and readily available
data on a state by state basis. Most of the research conducted samples using data on a national
scale as it is more accurate for determining precise results on this issue.
20
A variety of sources were used to gather the data for this study. These data come from
official and government records. Federal Reserve Economic Data (FRED) was used to gather
information on the economic variables including GDP, government spending, and private fixed
investments. FRED gathers data on economic variables. It had the data going back for many
decades. ProCon.org and the United States Census Bureau are the sources for the number of
illegal immigrants in the United States. The United States Census Bureau has a search option to
find information and data for any given year if it was recorded. This search option was used to
gather all of the data that came from the source. One issue that came up was that there weren’t
any estimates for the illegal immigrant population prior to 1990. The exception for this was the
years that the census was taken. A few studies were conducted on random years prior to 1990
that estimated the number of illegal immigrants. According to the Department of Homeland
Security, the estimated number of illegal immigrants in the United States is determined by taking
the legal foreign-born resident population and subtracting it from the total foreign-born
population (Hoefer, Rytina, & Baker, 2012). The information found on ProCon.org including the
original sources were The Department of Homeland Security and The Pew Research Center. The
data on income inequality and trade balance are also from the Census Bureau. The data on
consumer spending comes from the United States Bureau of Labor Statistics.
21
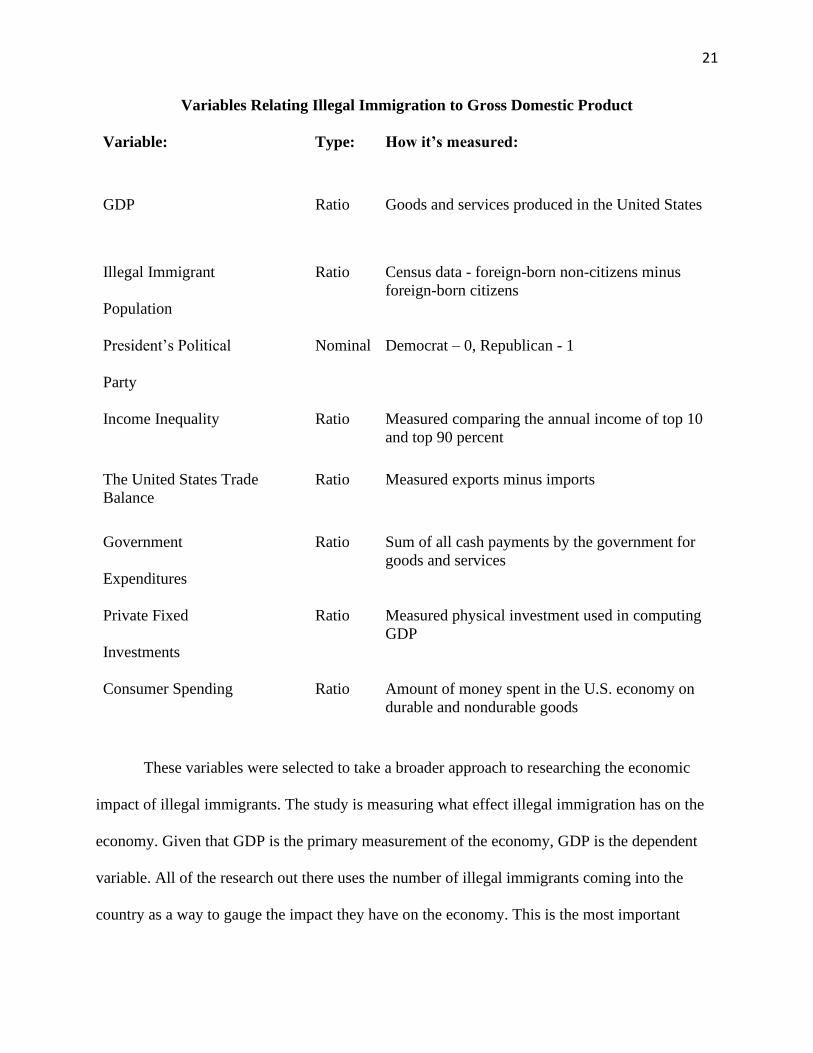
Variables Relating Illegal Immigration to Gross Domestic Product
Variable: Type: How it’s measured:
GDP Ratio Goods and services produced in the United States
Illegal Immigrant
Population
Ratio Census data - foreign-born non-citizens minus
foreign-born citizens
President’s Political
Party
Nominal Democrat – 0, Republican - 1
Income Inequality Ratio Measured comparing the annual income of top 10
and top 90 percent
The United States Trade
Balance
Ratio Measured exports minus imports
Government
Expenditures
Ratio Sum of all cash payments by the government for
goods and services
Private Fixed
Investments
Ratio Measured physical investment used in computing
GDP
Consumer Spending Ratio Amount of money spent in the U.S. economy on
durable and nondurable goods
These variables were selected to take a broader approach to researching the economic
impact of illegal immigrants. The study is measuring what effect illegal immigration has on the
economy. Given that GDP is the primary measurement of the economy, GDP is the dependent
variable. All of the research out there uses the number of illegal immigrants coming into the
country as a way to gauge the impact they have on the economy. This is the most important
22
independent variable for this study. Aside from these two variables, many of the studies vary in
exactly which variables they use.
A common trend throughout all of the studies are variables such as healthcare costs,
crime rates, number of border apprehensions, education costs, governmental assistance
programs, and other related costs. These variables are looking to see how much illegal
immigrants benefit from things such as healthcare benefits, protection from police officers and
firefighters, education benefits through the public school system, and assistance programs such
as welfare. All of these variables can be covered through one variable – government
expenditures.
When a measurement is being taken of the economy, it is important to include variables
that have a large impact on the economy along with the other independent variables being
studied. Without including all of the possible factors for the fluctuation in the economy, an
accurate study could not make any reasonable conclusions. Many studies, including those
mentioned in the literature review, state that four major variables contribute to the economy.
Those variables include consumer spending, business investments or private fixed investments,
trade, and government expenditures. Without considering the implications of each of these
variables on the GDP, accurate conclusions cannot be made about the effect other variables have
on the economy, such as the number of illegal immigrants in the United States.
The president's political party is an important variable to consider as well. The president's
political party is a representation of their political ideology. Their ideology determines the policy
decisions that they make. The policy that they implement, especially related to immigration, has
a major impact on the number of illegal immigrants that are coming into the country and how
those immigrants will affect the economy. Another example, as stated above in the literature
23
review, was trade policy. Certain trade policies encouraged many Mexican citizens to seek better
pay in the United States. This led to an increase in illegal immigration from Mexico to the United
States during that time period.
Income inequality is an important variable to include as well because it measures the
distribution of income. In the context of this study, the use of income inequality as an
independent variable can help determine how illegal immigration is impacting the income
distribution of American citizens. Considering almost all illegal immigrants are working low-
skilled, low-wage jobs, this measurement can help determine how American citizens in that same
job sector are affected.
For the broader sense that this study will cover, these are the most important variables.
They encompass the main variables relating to illegal immigration that impact the economy.
Previous research on this issue uses many different variables that can all be wrapped up in
government expenditures as stated above. Other variables that are related to illegal immigrants
were used in some of the studies. An example would be the illegal immigrant tax contribution.
The problem with all of these types of variables is that there isn’t consistent and accurate data on
them. Any data dealing with illegal immigrants is just using estimates. There is no way to get
that exact numbers on these types of variables. The other issue is there aren’t even estimates for
many of these variables over a consistent number of years. With the tax contribution example,
expensive and time-consuming studies were conducted on random years to get a general idea of
what the tax contribution by illegal immigrants might be in a given year. Consistent data has not
been collected on this variable or any that are similar to it that cover a range of forty years as
used in this study or even just ten years. They are few and far between. The studies that have
24
previously been conducted using these types of variables are only measuring the economic
impact of illegal immigration on the United States for one particular year.
The data collected for this study took a lot of time and extensive research to find. It is
easier to find data through some resources than others. The data found on FRED, for example,
was quick and easy. Anything through the Census Bureau was not as easy to find. Even though
there was a search option to find the data on any given year, it still took some digging to come up
with the data. Finding the number of illegal immigrants over a forty-year period was particularly
time-consuming. As stated above, it took a while to figure out that consistent data was not out
there prior to 1990 on the number of illegal immigrants in the United States. Multiple sources
were also used to gather as much information on this data as possible. The data was not tracked
for total consumer spending prior to 1984. It took an extensive investigation to come to that
conclusion as well. If that information was available, it would be in governmental records given
that this information was tracked by the government. The United States Bureau of Labor
Statistics did not have the information prior to 1984 on consumer spending and neither did any
other sources as they all get their data on this variable from the United States Bureau of Labor
Statistics.
This was a longitudinal study because it measures the data at different points in time. The
same sample is being measured over a forty-year time frame. The longitudinal data set is ideal
for this study because conclusions were made based on trends in the relationships between the
variables. A longitudinal shows those trends while a cross-sectional study does not.
25
Hypotheses
1. As the number of illegal immigrants increases, the GDP will increase.
The studies cited in the literature review generally came to the same conclusions
regarding illegal immigration and the economy. While illegal immigration may have a negative
effect on the local level, it has a positive effect on the national level. It is a safe assumption that
an increase in illegal immigration into the United States will have a positive relationship with
GDP. As illegal immigrants are increasing, companies and corporations in the United States are
able to profit more. With more production at a cheaper cost, businesses are bringing in more
revenue which has a positive impact on the GDP.
2. The economy experiences more growth under Democratic Presidents.
The policy that president’s advocate for and implement have an impact on the economy.
Presidents of the same political party generally implement similar economic policy. There is a
relationship between the political party of the president and the economic growth that occurs in
the U.S. The sources cited above note that while some trends can be traced, they are not
completely clear. There are many factors that have to been taken into consideration. While the
president’s party does impact the policy that they typically implement, the effects of those
policies do not always take effect immediately. Sometimes the implications are apparent sooner
rather than later.
3. Greater income inequality leads to higher GDP.
Income inequality will increase as GDP increases. Illegal immigration leads to higher
income inequality and higher income inequality leads to higher GDP. As the economy is doing
better, the people benefiting the most are not in the upper and middle classes. The lower class,
and specifically, low-skilled, low-wage workers do not receive the same benefit as those who are
26
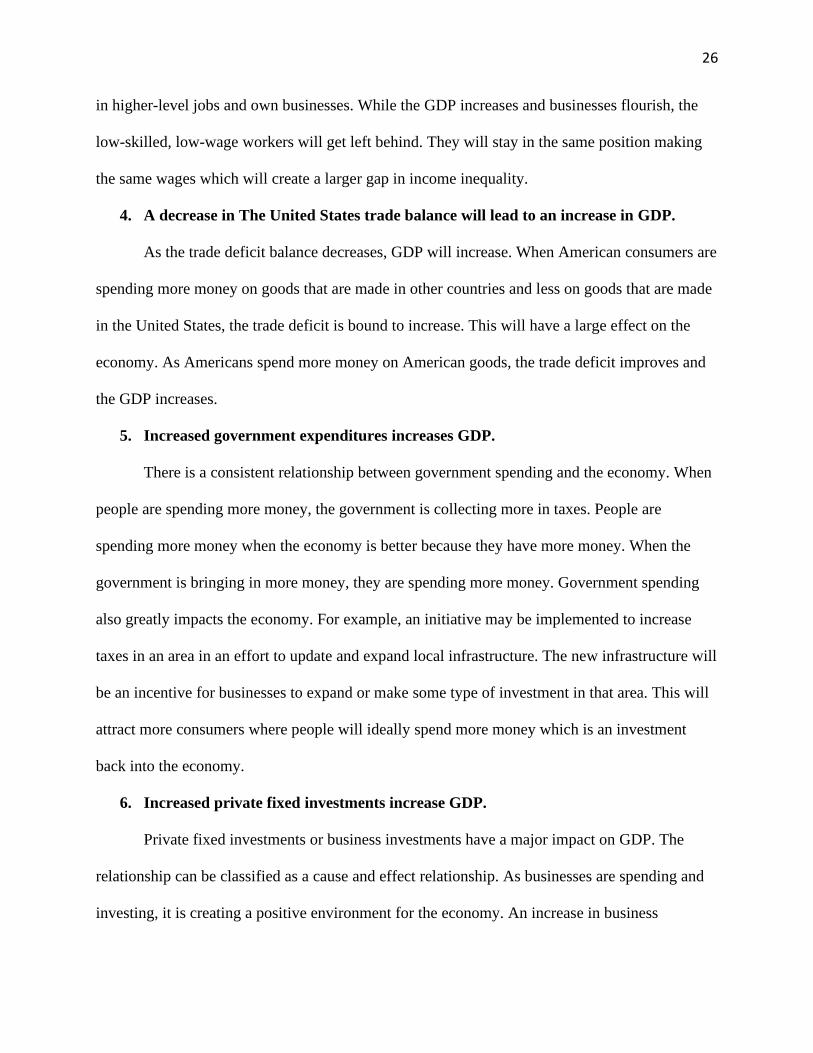
in higher-level jobs and own businesses. While the GDP increases and businesses flourish, the
low-skilled, low-wage workers will get left behind. They will stay in the same position making
the same wages which will create a larger gap in income inequality.
4. A decrease in The United States trade balance will lead to an increase in GDP.
As the trade deficit balance decreases, GDP will increase. When American consumers are
spending more money on goods that are made in other countries and less on goods that are made
in the United States, the trade deficit is bound to increase. This will have a large effect on the
economy. As Americans spend more money on American goods, the trade deficit improves and
the GDP increases.
5. Increased government expenditures increases GDP.
There is a consistent relationship between government spending and the economy. When
people are spending more money, the government is collecting more in taxes. People are
spending more money when the economy is better because they have more money. When the
government is bringing in more money, they are spending more money. Government spending
also greatly impacts the economy. For example, an initiative may be implemented to increase
taxes in an area in an effort to update and expand local infrastructure. The new infrastructure will
be an incentive for businesses to expand or make some type of investment in that area. This will
attract more consumers where people will ideally spend more money which is an investment
back into the economy.
6. Increased private fixed investments increase GDP.
Private fixed investments or business investments have a major impact on GDP. The
relationship can be classified as a cause and effect relationship. As businesses are spending and
investing, it is creating a positive environment for the economy. An increase in business
27
investments will help increase GDP. An increase in business investments creates an increase in
the economy, therefore, an increase in business investments creates an increase in GDP.
7. Increased consumer spending increases GDP.
Consumer spending has a similar effect on the economy as private fixed spending. An
increase in consumer spending is a characteristic of a positive economy. Like the private fixed
investment variable, consumer spending and GDP are a cause and effect relationship. As
Consumer spending increases, the GDP will increase. As consumer spending decreases, the GDP
will decrease. For example, consumer spending was consistently increasing until 2008. From
2008 to 2009, consumer spending took a turn and decreased. The GDP followed that same trend.
28
Research Design
The combined effect of the following variables - illegal immigrant population,
President’s political party, income inequality, U.S. trade balance, government expenditures,
private fixed investment, and consumer spending is statistically significantly related to GDP with
an alpha level of .05 and an R squared value of .99. However, when looking at the effect of
individual variables, 3 variables were found to have statistical significance when predicting
GDP. Those variables are income inequality, government expenditure, and consumer spending.
Thus, these three variables alone are the most important variables when predicting GDP. The
remaining variables including illegal immigrant population, President’s political party, U.S. trade
balance, and private fixed investments proved to have no statistical significance.
The alpha level of .05 was consistently used throughout all of the measurements of all of
the variables. These measurements are all available in the table below. The alpha level for illegal
immigration is 0.32. The alpha level for the President's political party is 0.16. The alpha level for
income inequality is 0. The alpha level for the U.S. trade balance is 0.49. The alpha level for
government expenditures is 0.05. The alpha level for private fixed investments is 0.74. The alpha
level for consumer spending is 0.
This research uses a quasi-experimental design. This was the best approach for various
reasons. All of the data used was quantitative data rather than qualitative data. The data was
collected from official records including data from the Census Bureau, FRED, The Department
of Homeland Security, The Pew Research Center, and The United States Bureau of Labor
Statistics. This was the best method for collecting data as there would be no way to manipulate
data using another method. The research includes forty cases that range from 1975 to 2015. The
variables are measured through a regression analysis.
29
There were various issues with collecting this data. Originally, variables were included
that focused more on illegal immigration such as public services costs of illegal immigrants.
Issues occurred when searching for data over the forty-year time span. There aren't even
estimates on the national level that covers a forty-year time period. For that reason, those types
of variables were not applicable to this study. All of the variables associated with illegal
immigration were more difficult to find. The illegal immigrant population is estimated as there
isn’t any way to find the exact number. Different sources slightly varied when it came to these
estimates as well. Another issue with finding the number of illegal immigrants was that the
Census Bureau only had the information going back to 1990. It took extensive research to find
the last 15 years of data for that variable. Finding the last eleven years for income inequality was
also difficult as the data on FRED only went back to 1986.
There are various limitations to this research. One of the major limitations to the research
is that it is not a true experimental design. In order to get accurate measurements, data had to be
collected from official records rather than collected independently. Therefore, there wasn’t any
way to control the variables. There wasn’t any control over the methods in which the data was
collected. As data was collected from different sources, i.e. the U.S. Census bureau, FRED, etc.,
the methods in which the data was collected varied. Another limitation is the data set did not
have a built-in control for inflation.
30
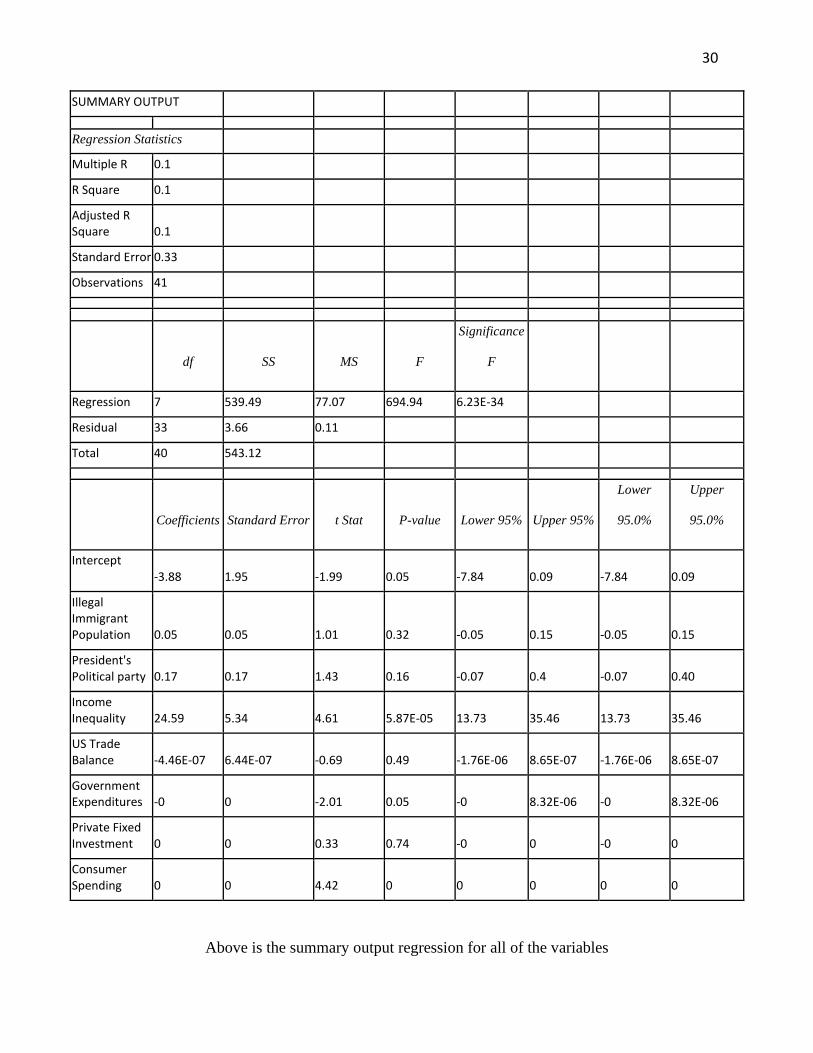
Above is the summary output regression for all of the variables
SUMMARY OUTPUT
Regression Statistics
Multiple R 0.1
R Square 0.1
Adjusted R Square 0.1
Standard Error 0.33
Observations 41
df SS MS F
Significance
F
Regression 7 539.49 77.07 694.94 6.23E-34
Residual 33 3.66 0.11
Total 40 543.12
Coefficients Standard Error t Stat P-value Lower 95% Upper 95%
Lower
95.0%
Upper
95.0%
Intercept -3.88 1.95 -1.99 0.05 -7.84 0.09 -7.84 0.09
Illegal Immigrant Population 0.05 0.05 1.01 0.32 -0.05 0.15 -0.05 0.15
President's Political party 0.17 0.17 1.43 0.16 -0.07 0.4 -0.07 0.40
Income Inequality 24.59 5.34 4.61 5.87E-05 13.73 35.46 13.73 35.46
US Trade Balance -4.46E-07 6.44E-07 -0.69 0.49 -1.76E-06 8.65E-07 -1.76E-06 8.65E-07
Government Expenditures -0 0 -2.01 0.05 -0 8.32E-06 -0 8.32E-06
Private Fixed Investment 0 0 0.33 0.74 -0 0 -0 0
Consumer Spending 0 0 4.42 0 0 0 0 0

31
Results
The economy is affected by a number of variables. This research seeks to determine what
impact illegal immigration has on the United States economy. While a number of conclusions
can be drawn from the regression analysis run in this study, illegal immigration proved not to be
statistically related to the economy. Economic variables including government expenditures,
consumer spending, and income inequality have a significant relationship with the economy
according to this analysis.
Illegal immigration proved to have a positive relationship with GDP. As the number of
illegal immigrants increased, GDP also increased. The p-value in the regression for illegal
immigration and GDP is 0.32 and the coefficient is 0.05. The standard error for the illegal
immigrant population is 0.05. The regression indicates that there is not a statistical significance
between the illegal immigrant population and GDP. This can be concluded because 0.32 is above
the alpha level of 0.05. Given that the coefficient was .05, the variables were found to have a
very low significance. While there is a positive relationship between the illegal immigrant
population and GDP, there is not a statistical significance between the variables.
There is not a relationship between the President’s political party and the GDP. The p-
value in the regression is 0.16. The coefficient for the variables is 0.16 and the standard error is
0.12. Similarly, with the illegal immigrant population, the p-value of 0.16 for the President’s
political party is above the 0.05 alpha level. This indicates that there is not a statistical
significance between the President’s political party and the GDP. While the coefficient is 0.11, it
is still a very small number meaning there is very low significance between the variables.
Therefore, the President's political party is not significantly related to the GDP.
32
The regression proved a statistical relationship between increasing income inequality
leading to higher GDP. The p-value for income inequality is 0. The coefficient was significantly
higher than all of the other variables at 24.59. The standard error is 5.34. The p-value shown in
the regression proves that it is below the 0.05 alpha level. This indicates a statistical significance
between income inequality and the GDP. The coefficient of 24.59 indicates the income
inequality that is much more significant than the other variables which all have coefficients
below 0. Therefore, there is a statistical significance between income inequality and GDP.
There was a negative relationship between the U.S. trade balance and GDP. As the trade
balance went down, GDP increased. The trade balance and GDP have a p-value of 0.49. The
coefficient is -4.46E-07 and the standard error is 6.44E-07. The p-value of 0.49 is above the
alpha level of 0.05, therefore the variables are not statistically significant. The coefficient of -
4.46 indicates very low significance. The regression indicates that there is not a statistical
significance between the U.S. trade balance and GDP.
The regression showed a positive relationship between government expenditures and
GDP. As government expenditures increase, so does GDP. The p-value for government
expenditures and GDP is 0.05. The coefficient is 0 and the standard error is 0. Given that the p-
value is 0.05, a conclusion can be drawn that government expenditures and GDP are statistically
significant given the alpha level is 0.05. Therefore, government expenditures are a contributing
factor in influencing GDP. However, the coefficient of 0 indicates that the significance is still
very low in comparison with income inequality. Regardless, there is a statistical significance
between government expenditures and GDP.
There is a positive relationship between private fixed investment and GDP. As private
fixed investments increase, so does the GDP. However, there is not a statistical significance
33
between the variables. The p-value for private fixed investments is 0.74. The coefficient is 0 and
the standard error is 0. The regression indicates the p-value of 0.74 is above the 0.05 alpha level.
It can be concluded from the coefficient of 0 that there is a very low significance between the
variables. Therefore, private fixed investments and GDP are not statistically significant.
Consumer spending has a positive relationship with GDP. Consumer spending increased
every year along with GDP. The p-value for consumer spending and GDP is 0. The coefficient is
0 and the standard error is 0. It can be concluded from a p-value of 0 measured with an alpha
level of 0.05 that consumer spending and GDP are statistically significant. However, the
coefficient of 0 indicates the significance is still much lower than the significance of income
inequality. Regardless, consumer spending and GDP are still statistically significant.
34
Conclusions
The first hypothesis stated: as the number of illegal immigrants increases, the GDP will
increase. According to the summary output, this hypothesis was correct. The second hypothesis
stated: illegal immigration will increase more under Republican Presidents than under
Democratic Presidents. According to the summary output, the null hypothesis was correct. The
third hypothesis stated: greater income inequality leads to higher GDP. According to the
summary output, this hypothesis was correct. The fourth hypothesis stated: The United States
trade balance will decrease as the GDP increases. According to the summary output, this
hypothesis was correct. The fifth hypothesis stated: Government expenditures will increase as
the GDP increases. According to the summary output, this hypothesis was correct. The sixth
hypothesis stated: private fixed investments will increase as GDP increases. According to the
summary output, this hypothesis was correct. The seventh hypothesis stated: consumer spending
will increase as GDP increases. According to the summary output, this hypothesis was correct.
This research provides insight into some of the factors that contribute to the GDP. The
analysis shows that illegal immigration does not have a significant impact on the economy.
There are other variables that are much more relevant to having an impact on the economy. The
analysis shows that income inequality is very much related to the economy. Government
expenditures and consumer spending are also related to GDP. The U.S. trade balance and private
fixed investments were found not to have a significant relationship with the economy. The
President’s political party does not have a statistical relationship with the economy. This
conclusion differs from Blinder and Watson (2016) as they concluded that there is a relationship
between the president's political party and the GDP. Their study found that the economy sees
more growth under Democratic presidents than Republican presidents.
35
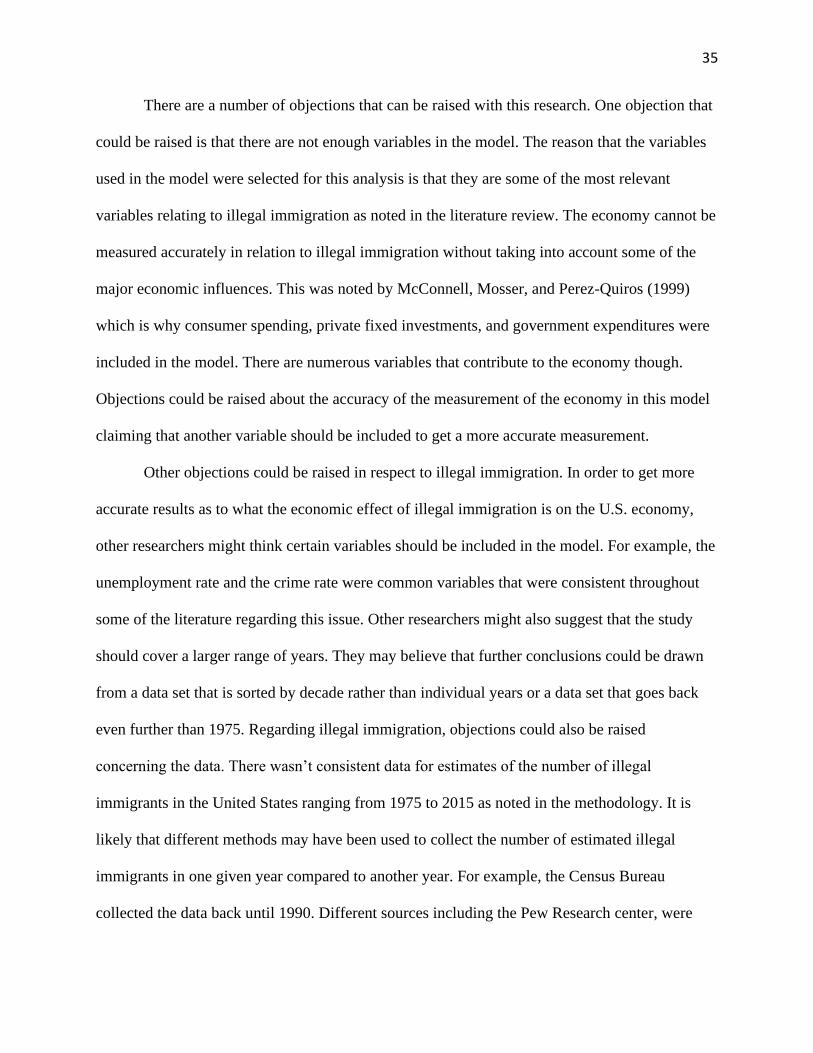
There are a number of objections that can be raised with this research. One objection that
could be raised is that there are not enough variables in the model. The reason that the variables
used in the model were selected for this analysis is that they are some of the most relevant
variables relating to illegal immigration as noted in the literature review. The economy cannot be
measured accurately in relation to illegal immigration without taking into account some of the
major economic influences. This was noted by McConnell, Mosser, and Perez-Quiros (1999)
which is why consumer spending, private fixed investments, and government expenditures were
included in the model. There are numerous variables that contribute to the economy though.
Objections could be raised about the accuracy of the measurement of the economy in this model
claiming that another variable should be included to get a more accurate measurement.
Other objections could be raised in respect to illegal immigration. In order to get more
accurate results as to what the economic effect of illegal immigration is on the U.S. economy,
other researchers might think certain variables should be included in the model. For example, the
unemployment rate and the crime rate were common variables that were consistent throughout
some of the literature regarding this issue. Other researchers might also suggest that the study
should cover a larger range of years. They may believe that further conclusions could be drawn
from a data set that is sorted by decade rather than individual years or a data set that goes back
even further than 1975. Regarding illegal immigration, objections could also be raised
concerning the data. There wasn’t consistent data for estimates of the number of illegal
immigrants in the United States ranging from 1975 to 2015 as noted in the methodology. It is
likely that different methods may have been used to collect the number of estimated illegal
immigrants in one given year compared to another year. For example, the Census Bureau
collected the data back until 1990. Different sources including the Pew Research center, were
36
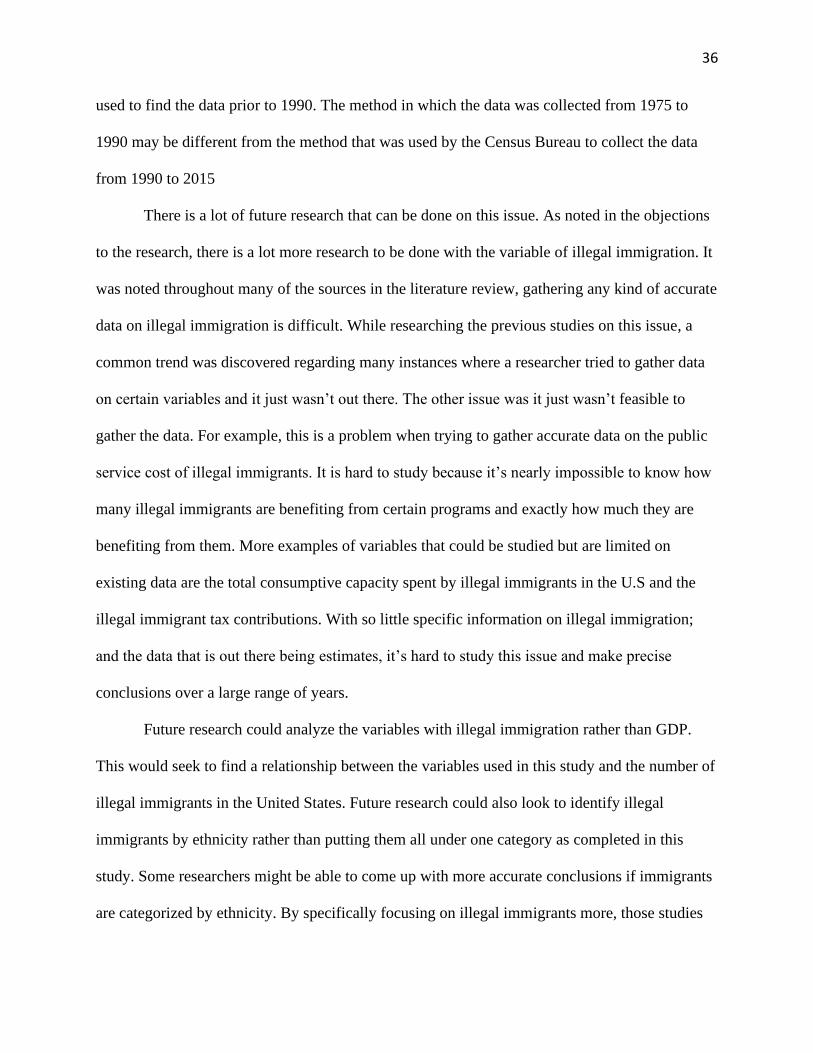
used to find the data prior to 1990. The method in which the data was collected from 1975 to
1990 may be different from the method that was used by the Census Bureau to collect the data
from 1990 to 2015
There is a lot of future research that can be done on this issue. As noted in the objections
to the research, there is a lot more research to be done with the variable of illegal immigration. It
was noted throughout many of the sources in the literature review, gathering any kind of accurate
data on illegal immigration is difficult. While researching the previous studies on this issue, a
common trend was discovered regarding many instances where a researcher tried to gather data
on certain variables and it just wasn’t out there. The other issue was it just wasn’t feasible to
gather the data. For example, this is a problem when trying to gather accurate data on the public
service cost of illegal immigrants. It is hard to study because it’s nearly impossible to know how
many illegal immigrants are benefiting from certain programs and exactly how much they are
benefiting from them. More examples of variables that could be studied but are limited on
existing data are the total consumptive capacity spent by illegal immigrants in the U.S and the
illegal immigrant tax contributions. With so little specific information on illegal immigration;
and the data that is out there being estimates, it’s hard to study this issue and make precise
conclusions over a large range of years.
Future research could analyze the variables with illegal immigration rather than GDP.
This would seek to find a relationship between the variables used in this study and the number of
illegal immigrants in the United States. Future research could also look to identify illegal
immigrants by ethnicity rather than putting them all under one category as completed in this
study. Some researchers might be able to come up with more accurate conclusions if immigrants
are categorized by ethnicity. By specifically focusing on illegal immigrants more, those studies

37
would be more likely to account for some of the variables that were prominent in other studies
relating to illegal immigration including the unemployment rate and crime rate.
38
Bibliography
Angelucci, M. (2012). US border enforcement and the net flow of Mexican illegal
migration. Economic Development and Cultural Change, 60(2), 311-357. Retrieved,
February 20, 2020.
Arnold, J., Van Dusen, A. E., Baxter, R. J., & Carney, B. (1994). Undocumented persons in a
health care reform environment. Lewin-VHI, Inc. Paper commissioned by the Kaiser
Family Foundation.
Bean, F., Telles, E., & Lowell, B. (1987). Undocumented Migration to the United States:
Perceptions and Evidence. Population and Development Review, 13(4), 671-690.
Retrieved, February 20, 2020.
Berk, M. L., Schur, C. L., Chavez, L. R., & Frankel, M. (2000). Health Care Use Among
Undocumented Latino Immigrants: Is free health care the main reason why Latinos come
to the United States? A unique look at the facts. Health Affairs, 19(4), 51-64. Retrieved,
February 20, 2020.
Blinder, A. S., & Watson, M. W. (2016). Presidents and the US economy: An econometric
exploration. American Economic Review, 106(4), 1015-45. Retrieved, February 20, 2020.
Borjas, G. J., Freeman, R. B., & Lang, K. (1991). Undocumented Mexican-born workers in the
United States: how many, how permanent?. In Immigration, trade, and the labor
market (pp. 77-100). University of Chicago Press. Retrieved, February 20, 2020.
Campos-Vázquez, R. M. (2013). Why did wage inequality decrease in Mexico after NAFTA?.
Economía Mexicana. Nueva Época, 22(2), 245-278. Retrieved, February 20, 2020.
Chomsky, A. (2018). " They take our jobs!": and 20 other myths about immigration. Beacon
Press. Retrieved, February 20, 2020.
39
Djajić, S. (1997). Illegal immigration and resource allocation. International Economic Review,
97-117. Retrieved, February 20, 2020.
Espenshade, T. J. (1995). Unauthorized immigration to the United States. Annual Review of
Sociology, 21(1), 195-216. Retrieved, February 20, 2020.
Fazel-Zarandi, M. M., Feinstein, J. S., & Kaplan, E. H. (2018). The number of undocumented
immigrants in the United States: Estimates based on demographic modeling with data
from 1990 to 2016. PloS one, 13(9). Retrieved, February 20, 2020.
Greenwood, M. J., & McDowell, J. M. (1986). The factor market consequences of US
immigration. Journal of Economic Literature, 24(4), 1738-1772. Retrieved, February 20,
2020.
Hanson, G. H. (2009). The economics and policy of illegal immigration in the United States.
Washington, DC: Migration Policy Institute. Retrieved, February 20, 2020.
Hanson, G. H. (2007). The economic logic of illegal immigration (p. 12). New York, NY:
Council on Foreign Relations. Retrieved, February 20, 2020.
Hanson, G. H., & Spilimbergo, A. (1999). Illegal immigration, border enforcement, and relative
wages: Evidence from apprehensions at the US-Mexico border. American Economic
Review, 89(5), 1337-1357. Retrieved, February 20, 2020.
Hoefer, M., Rytina, N. F., & Baker, B. (2012). Estimates of the unauthorized immigrant
population residing in the United States: January 2011 (pp. 1-7). Washington, DC:
Department of Homeland Security, Office of Immigration Statistics. Retrieved, February
20, 2020.
Marshall, R. (1984). Immigration: an international economic perspective. International
Migration Review, 18(3), 593-612. Retrieved, February 20, 2020.
40
Martin, P. (2010). The research‐policy nexus: the case of unauthorized Mexico–US migration
and US policy responses. Population, Space and Place, 16(3), 241-252. Retrieved,
February 20, 2020.
McConnell, M. M., Mosser, P. C., & Perez-Quiros, G. (1999). A decomposition of the increased
stability of GDP growth. current Issues in Economics and Finance, 5(13). Retrieved,
February 20, 2020.
Nadadur, R. (2009). Illegal Immigration: A Positive Economic Contribution to the United
States. Journal of Ethnic & Migration Studies, 35(6), 1037–1052. Retrieved, February
20, 2020. from https://doi.org/10.1080/13691830902957775
Orrenius, P. M., & Coronado, R. (2017). The effect of illegal immigration and border
enforcement on crime rates along the US-Mexico border. Retrieved, February 20, 2020.
Orrenius, P. M., & Nicholson, M. (2009). Immigrants in the U.S. Economy: A Host-Country
Perspective. Journal of Business Strategies, 26(1), 35–53. Retrieved, February 20, 2020.
Pollin, R. (2011, February). Economic prospects: Can we please stop blaming immigrants?.
In New Labor Forum (Vol. 20, No. 1, pp. 86-89). Sage CA: Los Angeles, CA: SAGE
Publications. Retrieved, February 20, 2020.
Ramos, J. (2013). A Review of Benefits and Costs Imposed by Immigrant Population on the US
Economy. Proceedings of the Northeast Business & Economics Association. Retrieved,
February 20, 2020.
Rothman, E. S., & Espenshade, T. J. (1992). Fiscal impacts of immigration to the United
States. Population Index, 381-415. Retrieved, February 20, 2020.
Rodriguez, F. A., & Dawkins, M. (2017). Undocumented Latino youth: migration experiences
and the challenges of integrating into American society. Journal of International
41
Migration and Integration, 18(2), 419-438. Retrieved, February 20, 2020.
Smith, J., & Edmonston, B. (1997). The new Americans: Economic, demographic, and fiscal
effects of immigration. Washington, DC: National Academy P. Retrieved, February 20,
2020.
The United States Commission on Civil Rights. (2008). The impact of illegal immigration on
the wages and unemployment opportunities of black workers. Retrieved, February 20,
2020. from The United States Commission on Civil Rights website:
https://www.usccr.gov/pubs/docs/IllegImmig_10-14-10_430pm.pdf
Winegarden, C. R., & Khor, L. B. (1993). Undocumented immigration and income inequality in
the native-born population of the US: econometric evidence. Applied Economics, 25(2),
157. Retrieved, February 20, 2020. From https://doi.org/10.1080/00036849300000020