The Environmental Impact of Immigration in the United States
191
Utah State University Utah State University DigitalCommons@USU DigitalCommons@USU All Graduate Theses and Dissertations Graduate Studies 5-2020 The Environmental Impact of Immigration in the United States The Environmental Impact of Immigration in the United States Guizhen Ma Utah State University Follow this and additional works at: https://digitalcommons.usu.edu/etd Part of the Sociology Commons Recommended Citation Recommended Citation Ma, Guizhen, "The Environmental Impact of Immigration in the United States" (2020). All Graduate Theses and Dissertations. 7782. https://digitalcommons.usu.edu/etd/7782 This Dissertation is brought to you for free and open access by the Graduate Studies at DigitalCommons@USU. It has been accepted for inclusion in All Graduate Theses and Dissertations by an authorized administrator of DigitalCommons@USU. For more information, please contact [email protected].
-
Upload
khangminh22 -
Category
Documents
-
view
1 -
download
0
Transcript of The Environmental Impact of Immigration in the United States

Utah State University Utah State University
DigitalCommons@USU DigitalCommons@USU
All Graduate Theses and Dissertations Graduate Studies
5-2020
The Environmental Impact of Immigration in the United States The Environmental Impact of Immigration in the United States
Guizhen Ma Utah State University
Follow this and additional works at: https://digitalcommons.usu.edu/etd
Part of the Sociology Commons
Recommended Citation Recommended Citation Ma, Guizhen, "The Environmental Impact of Immigration in the United States" (2020). All Graduate Theses and Dissertations. 7782. https://digitalcommons.usu.edu/etd/7782
This Dissertation is brought to you for free and open access by the Graduate Studies at DigitalCommons@USU. It has been accepted for inclusion in All Graduate Theses and Dissertations by an authorized administrator of DigitalCommons@USU. For more information, please contact [email protected].

THE ENVIRONMENTAL IMPACT OF IMMIGRATION IN THE UNITED STATES
by
Guizhen Ma
A dissertation submitted in partial fulfillment of the requirements for the degree
of
DOCTOR OF PHILOSOPHY
in
Sociology
Approved: ______________________ ____________________ Erin Trouth Hofmann, Ph.D. E. Helen Berry, Ph.D. Major Professor Committee Member ______________________ ____________________ Mark Brunson, Ph.D. Jennifer Givens, Ph.D. Committee Member Committee Member ______________________ ____________________ Peggy Petrzelka, Ph.D. Richard S. Inouye, Ph.D. Committee Member Vice Provost for Graduate Studies
UTAH STATE UNIVERSITY Logan, Utah
2020

ii
Copyright © Guizhen Ma 2020
All Rights Reserved

iii
ABSTRACT
The Environmental Impact of Immigration in the United States
by
Guizhen Ma, Doctor of Philosophy
Utah State University, 2020
Major Professor: Dr. Erin Trouth Hofmann Department: Sociology
The argument that immigration is harmful to the environment in the United States
is grounded on the population pressure caused by immigrants. However, the few
empirical studies suggest that locations with higher numbers of immigrants experience
better air quality than locations with greater proportions of U.S.-born residents. While
spatial autocorrelation of air quality is evident, it has not been addressed in prior research.
This study investigated the environmental impact of immigration in three steps. First, I
tested the relationship between U.S.-born population size, foreign-born population size,
and air quality across all the U.S. continental counties, using the air quality domain of the
Environmental Protection Agency's (EPA) Environmental Quality Index (EQI). The
findings showed that U.S.-born population was associated with worse air quality, while
foreign-born population was associated with better air quality, with variation by
immigrants’ origin and year of entry. Second, I extended the analysis of the association
between populations and air quality to a panel study by using the EPA’s Air Quality
Index (AQI) for contiguous U.S. counties from 2007 to 2014. I found that total
population, U.S.-born population, and foreign-born population were not associated with
iv
worse but better air quality. The results supported political economy theories and
indicated that ecologically unequal exchange between core and peripheral countries
mitigated the population pressure in the United States. These two quantitative studies
employed spatial models to account for spatial autocorrelation of air quality. Third, I
conducted a qualitative study to explore the differential associations between populations
and the environment through interviews with Chinese immigrants, Mexican immigrants,
and U.S.-born Whites regarding their household environmental behaviors. The research
found the disparity in environmental behaviors among the three groups, with immigrants
using less energy, driving less, and generating less waste. The study also suggests the
importance of cultural diversity for environmental sustainability.
(190 pages)

v
PUBLIC ABSTRACT
The Environmental Impact of Immigration in the United States
Guizhen Ma
Population growth increases pressure on the environment. Immigration may be
harmful to the environment because it is the major force of population growth in the
United States. However, this argument has not been supported by research findings. A
few studies on this topic show that locations with higher numbers of immigrants
experience better air quality than locations with greater proportions of U.S.-born
residents. This research investigated the environmental impact of immigration through
three independent studies. First, I tested the relationship between U.S.-born population,
foreign-born population, and air quality across all the U.S. continental counties. This
study analyzed the air quality data extracted from the Environmental Quality Index (EQI)
provided by the Environmental Protection Agency's (EPA). The results showed that U.S.-
born population was associated with worse air quality, while foreign-born population was
associated with better air quality. These associations varied by immigrants’ origin and
year of entry. Second, I examined the association between populations and air quality
across some contiguous U.S. counties over eight years from 2007 to 2014, using the
EPA’s Air Quality Index (AQI). I found that total population, U.S.-born population, and
foreign-born population were not associated with worse but better air quality. The results
indicated that population may not be the root cause of environmental harm. Third, I
explored the differential associations between populations and the environment through

vi
interviews with Chinese immigrants, Mexican immigrants, and U.S.-born Whites
regarding their household environmental behaviors. The research found different
environmental behaviors among the three groups. The immigrants tended to use less
energy, drive less, and produce less waste. The study suggests that culture has an
influence on environmental sustainability.

vii
DEDICATION
I dedicate my dissertation to my parents who instilled the value of education in
me from an early age and have spared no effort to support my pursuit of educational
achievement. Your love enlightens my life and makes me strong.
May my dear father rest in peace.

viii
ACKNOWLEDGMENTS
I greatly appreciate my advisor Dr. Erin Trouth Hofmann for her tremendous
efforts on helping me with my research and throughout the entire process. I would not be
able to publish the three papers of my dissertation without her incredible advice and
support. I am grateful to the rest of my committee members, Dr. Eddy Helen Berry, Dr.
Mark Brunson, Dr. Jennifer Givens, and Dr. Peggy Petrzelka, for their assistance and
feedback on this research. I appreciate Dr. Guadalupe Marquez-Velarde for her help with
the interview study of Mexican immigrants.
I am grateful to the Utah Agricultural Experiment Station for funding my first two
papers through Dr. Hofmann’s projects, and the Mountain West Center for Regional
Studies at Utah State University and Dr. Marquez-Velarde’s startup funding for
supporting my third paper. I am indebted to the Department of Sociology, Social Work,
and Anthropology, the Graduate School, Utah State University, and any other parties that
financially and academically support my Ph.D. studies. Thanks to Carina Linares for
helping with the Spanish interviews and the 60 interviewees participating in my study.
I give special thanks to my husband and son for their strong encouragement and
support for my doctoral studies. Thanks to my friends, Dr. Al Forsyth and Dr. Tagen
Towsley Baker, for their help with my English writing. I am grateful to Dr. Conner
Bailey at Auburn University. My dream of studying sociology would not come true
without his strong support. I cannot thank enough the sociologist whose book seeded this
dream in me two decades ago, though I do not remember his name.
Guizhen Ma

ix
CONTENTS
Page
ABSTRACT ...................................................................................................................... iii
PUBLIC ABSTRACT .........................................................................................................v
DEDICATION ................................................................................................................. vii
ACKNOWLEDGMENTS .............................................................................................. viii
LIST OF TABLES ............................................................................................................ xi
LIST OF FIGURES ......................................................................................................... xii
CHAPTER
I. INTRODUCTION ..................................................................................................1 Literature Review .................................................................................................. 3 Research Design .....................................................................................................6 Conclusion ............................................................................................................13 References .............................................................................................................14 II. IMMIGRATION AND ENVIRONMENT IN THE USA: A SPATIAL
STUDY OF AIR QUALITY ..........................................................................25 Introduction ...........................................................................................................25 Literature Review ................................................................................................. 27 Data .......................................................................................................................33 Methods .................................................................................................................40 Results ...................................................................................................................44 Conclusion ............................................................................................................51 References ...................................................................................................................... 56 III. POPULATION, IMMIGRATION, AND AIR QUALITY IN THE USA: A
SPATIAL PANEL STUDY ........................................................................... 66 Theoretical framework .......................................................................................... 68 Data .......................................................................................................................73 Method ..................................................................................................................78 Results ...................................................................................................................82 Conclusion ............................................................................................................88 References .............................................................................................................93 IV. A COMPARISON STUDY OF ENVIRONMENTAL BEHAVIORS OF U.S.-BORN WHITES AND IMMIGRANTS ...............................................103 Introduction .........................................................................................................103 Literature Review ............................................................................................... 105
x
Methods ...............................................................................................................110 Cross-cultural Comparison of Household Environmental Behaviors .................115 Conclusions .........................................................................................................129 References ...........................................................................................................134 V. CONCLUSION .................................................................................................145 Discussion ...........................................................................................................146 Policy Implications .............................................................................................149 Future Research ..................................................................................................151 References ...........................................................................................................153
APPENDICES .................................................................................................................159
CURRICULUM VITAE ..................................................................................................176

xi
LIST OF TABLES
Table Page
CHAPTER II
1 Descriptions of Variables .................................................................................38
2 Spatial Regression Results for Immigrant Population in General ...................45
3 Spatial Regression Results for Immigrant Population by Origin .....................47
4 Spatial Regression Results for Immigrant Population by Year of Entry .........49
CHAPTER III
1 Description Statistics of the 1070 Counties Across the Contiguous USA .......76
2 Global Moran’s I Test Statistics on All the Variables for the Sample in Three Selected Years .....................................................................................78
3 Fixed Effects Linear Regression Models ..........................................................83
4 Fixed Effects Spatial Durbin Models ...............................................................85
5 Fixed Effects Spatial Autocorrelation Models .................................................86
CHAPTER IV
1 Characteristics of the Interviewees ................................................................112
2 Interview Questions .......................................................................................113

xii
LIST OF FIGURES
Figure Page
CHAPTER II
1 Air quality and foreign-born population by the U.S. continental counties, 2000 ...............................................................................................................40
2 Local indicators of spatial autocorrelation map of air index .............................41 CHAPTER III
3 The sample of counties with AQI data .............................................................74

CHAPTER I
INTRODUCTION
The United States, the country of immigration, has long been struggling with
immigration issues, including economic, political, social, and environmental problems.
Although contentious, immigration has been linked to various negative consequences for
the environment (Beck 1996; Cafaro 2015; Chapman 2006; Garling 1998; Krikorian
2008; Population-Environment Balance 1992). This argument is grounded in the
environmental pressure of population growth driven by immigration in the USA. While
reducing the immigrant population may sound the best solution to ease the pressure on
the ecosystem, it is complicated by the U.S.’s inseparable relationship with immigration.
Despite higher fertility rates among immigrants, the total fertility rate in the USA still
falls below replacement level (The World Bank 2019). Immigration plays an essential
role in sustaining the labor force and supporting the aging society. Moreover, the
population pressure argument ignores the disparity in the environmental impact of U.S.-
born and foreign-born populations. The U.S. high-consumption lifestyle is maintained by
the use of natural resources that is disproportionate to its population. The United States,
with 4.7% of the world’s population, consumed 25.3% of all fossil fuels in 2000, which
was even greater than the 15 nations of the European Union that consumed 14.8% of
fossil fuels with 6.2% of the world’s population (Ewing 2004). Evidence shows that
consumption by Whites disproportionately causes air pollution in the USA (Tessum et al.
2019). Therefore, it is imperative to investigate the differential impacts of diverse
populations, i.e., whether immigration has an environmental impact that is

2 disproportionate to its number, compared to the U.S.-born population (Kraly 1998).
Despite the prevalent argument that immigration is the driving force behind
environmental harm in the USA, only a handful of empirical studies have compared the
environmental impact of U.S.-born and immigrant populations. However, the prior
studies are all quantitative analyses of small samples in metropolitan areas and do not
account for the autocorrelation of air quality across spatial units.
How do immigrants specifically affect the environment? How does their impact
differ from that of the U.S.-born population? My dissertation answers these research
questions by using both quantitative and qualitative methodologies. First, I test the
association between air quality and the two populations, i.e., U.S.-born and foreign-born
population, using spatial analysis of data for all the U.S. contiguous counties. The
foreign-born population is also broken down by origin and year of entry to explore the
potential variations. This study is cross-sectional, due to limited availability of
environmental data for the entire country. Second, I extend the research to a spatial panel
study covering eight years for about one-third of the U.S. contiguous counties. The panel
study is able to reveal the causality of the population-environmental relationship. Third, I
conduct a qualitative study on the household environmental behaviors of U.S.-born
Whites and two immigrant groups: Chinese and Mexican immigrants, to explore the
differences in behaviors that directly affect the environment across the three populations.
The three papers of my dissertation advance the literature and provide substantial
evidence on the controversy over the environmental impact of immigration through
empirical studies.

3 Literature Review
Despite the long history of immigration to the USA, there are many calls to
restrict new immigration to the country, with activists citing a variety of negative impacts
of immigration. Among these potential consequences of immigration, environmental
harm is of particular interest. As environmental sustainability has drawn increasing
attention, the environmental pressure posed by immigration is highlighted as the logic of
restricting immigration (Hultgren 2014; Park and Pellow 2011). The population pressure
argument derives from Malthus (1798) and Ehrlich’s (1968) warning that population will
outgrow its resources if left unchecked. Population growth increases the consumption of
energy, water, and other natural resources and waste and pollution (Bartlett and Lytwak
1995; Butler 2015; Catton 1982). Troubled by anxiety over population growth, the
restrictionists have easily targeted immigration because it is the major source of
population growth in the USA (Beck 1996; Beck et al. 2003; Cafaro 2015; Cafaro and
Staples 2009; Chapman 2006; DinAlt 1997; Garling 1998; Krikorian 2008; Population-
Environment Balance 1992; Simcox 1992; Zuckerman 1999).
Research on the environmental impact of population primarily focuses on air
quality, using IPAT or STIRPAT models, which examine the effects of population,
affluence, and technology (Dietz and Rosa 1994; Ehrlich & Holdren 1971). Results show
that population is positively associated with at least some air pollutants (Cole and
Neumayer 2004; Cramer 1998; Cramer 2002; Cramer and Cheney 2000; Lankao et al.
2009; Laureti et al. 2014; Preston 1996; Price and Feldmeyer 2012; Squalli 2009; Squalli
2010). Affluence and technology also affect the environment (Commoner 1972a, 1972b;
Preston 1996; Rudel et al. 2011). However, population growth, driven by either native-

4 born or foreign-born people, has an ecological footprint.
While immigration is blamed for environmental degradation in the USA, only a
few studies examine the environmental consequences of immigration specifically, and all
focus on air pollution (Cramer 1998; Price and Feldmeyer 2012; Squalli 2009, 2010).
These studies test the impact of immigrant population on air quality measured by ROG,
NOx, SOx, CO, and PM10 in California (Cramer 1998), by CO, NO2, PM10, and SO2 in
some U.S. counties (Squalli 2009) and across all U.S. states (Squalli 2010), and by CO,
NO2, PM10, SO2, PM2.5, and O3 and an index of these pollutants for 183 Metropolitan
Statistical Areas (Price and Feldmeyer 2012). Despite the differences in the
measurements of air quality and samples, the conclusions of these studies are similar.
Immigrant population was not associated with most air pollutants, while U.S.-born
population was more likely to be associated with air pollutants. Larger immigrant
populations were even associated with lower levels of some pollutants (Cramer 1998;
Price and Feldmeyer 2012; Squalli 2010). Therefore, compared to U.S.-born population,
immigrant population may be less harmful to the environment. A limitation of the prior
studies is the lack of consideration of spatial autocorrelation.
Immigrants, in general, are more likely than native-born people to engage in pro-
environmental behaviors, such as carpooling, saving energy, eating less meat, and
recycling (Blumenberg and Smart 2010; Chatman and Klein 2009; Heisz and
Schellenberg 2004; Hunter 2000; Pfeffer and Stycos, 2002; Uteng 2009). Variations in
environmental behaviors are also evident among immigrants. Compared to native-born
people, Latino and Asian immigrants were less likely to have personal cars and good
housing conditions (Bohon et al. 2008; Klocker et al. 2015). Hispanics and Asians used

5 less energy and produced less carbon dioxide pollution than Whites and Blacks in
California (Lutzenhiser 1997). Mexican immigrants were more likely than other Latinos
and U.S.-born individuals to drive less and use less household energy (Macias 2016).
Chinese culture stresses a harmonious relationship between man and nature, which
encourages environmentally friendly behaviors (Chan 2001; Lee 2017).
As some restrictionists argue, immigrants increase their negative environmental
impact once they assimilate into American consumptionism (Bartlett and Lytwak 1995;
Beck 1996; DinAlt 1997; Hall et al. 1994; Population-Environment Balance 1992).
Immigrants probably assimilate to the mainstream environmental behaviors over time due
to social pressure (Blumenberg and Shiki 2008; Carter et al. 2013; Hackett and
Lutzenhiser 1991; Hunter 2000; Macias 2016; Smith 2006). Nevertheless, immigrants
may not entirely accept American consumerism (Carter et al. 2013). Immigrants increase
driving as they resided longer in the USA but are still more dependent on public
transportation than U.S.-born population (Modarres 2013).
Meanwhile, the high-consumption lifestyle has not been paid enough attention for
environmental degradation in the Western countries, while immigration is an easy target
(Baldwin 2009; Bradley 2009; Head et al. 2019; Jones 2002; Klocker and Head 2013;
Merchant 2003; Neumayer 2006). In fact, minorities are disproportionately exposed to air
pollution caused by consumption primarily by Whites in the USA (Tessum et al. 2019).
Scholars across Western societies call for rethinking Western environmentalism and
embracing cultural diversity as a path to environmental sustainability (Anderson 2005;
Bradley 2009; Ehrlich 2002; Goodall 2008; Head et al. 2019; Klocker and Head 2013).
Diverse cultures and environmental behaviors may provide valuable information for

6 environmental sustainability in the USA.
Political economy theories contend that the root cause of environmental
degradation is the global political and economic system that perpetuates uneven
distribution and consumption of natural resources (Ciplet et al. 2015; Foster et al. 2011;
Pan et al. 2008; Roberts and Parks 2007; Sato 2014; Schnaiberg 1980; Stretesky and
Lynch 2009; Weber and Matthews 2007). Even Ehrlich agrees that the developed
countries are “the principal culprits” for the depletion of natural resources (Ehrlich and
Holdren 1971: 1214). Ecologically unequal exchange between wealthy, developed
countries and their less-developed counterparts allows the residents of developed
countries to enjoy the benefits of consumption but pass the resulting environmental
degradation onto developing countries (Bunker 1984; Jorgenson and Clark 2009; Prell
and Feng 2016; Rice 2007; Rothman 1998).
In sum, research suggests the importance of examining the environmental impact
of immigrant population specifically as opposed to native-born population, instead of
focusing on population growth associated with immigration. Given the variations in
environmental behaviors among immigrants and native-born people, it is necessary to
explore how specific immigrant groups may differ in their environmental behaviors from
native-born people. Analyses of large samples would be able to extend the literature to
generalize the comparison between native-born and foreign-born populations.
Research Design
Built on the prior studies, my dissertation aims to advance the literature on the
environmental impact of immigration in the USA by a series of three research papers.

7
Paper 1: A Spatial Cross-Sectional Study of Air Quality
Prior research on the relationship between immigrant population and air quality is
limited by small sample sizes and is not necessarily generalizable across the USA. Air
quality in a spatial unit may affect and be affected by air quality in its neighboring units.
Spatial analysis would reduce estimation bias caused by spatial effects. Although spatial
autocorrelation of air quality has been recognized and accounted for in studies of air
pollution (Chen et al. 2017; Havard et al. 2009; McCarty and Kaza, 2015), it is absent in
studies of the environmental impact of population.
This paper examines the association between populations and the environment
quality measured by air quality across the contiguous U.S. counties. The air quality data
is drawn from the Environmental Quality Index (EQI) constructed by the Environmental
Protection Agency (EPA) as a single point estimate covering the six years from 2000 to
2005. The EQI includes an index for five domains of environment, i.e., air, water, land,
built, and sociodemographic environments. The air domain of the EQI measures air
quality by using six criteria air pollutants — CO, SO2, NO2, ozone, PM10, and PM2.5 —
and 81 hazardous air pollutants (U.S. EPA 2014). The values of the air index range from
−3.24 to 2.79, with the lower values indicating better air quality. To visualize the data of
counties with varying air quality and immigrant populations, I make a map in ArcGIS.
This study examines the association between U.S.-born and foreign-born
populations and air quality, controlling for income, employment by industry, commute
time, and location characteristics indicated by rural-urban continuum codes (RUCC).
Most of the data are drawn from the 2000 U.S. Census. I also break down the immigrant
population to identify the possible variations in environmental impact. One breakdown is
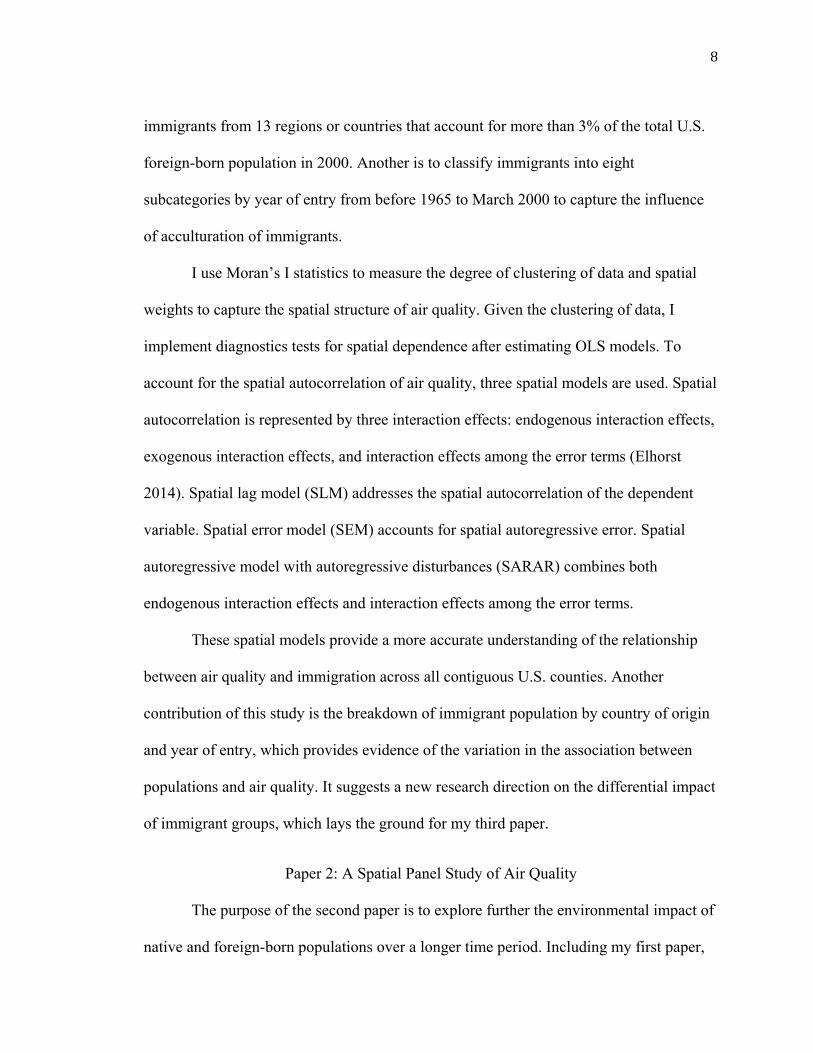
8 immigrants from 13 regions or countries that account for more than 3% of the total U.S.
foreign-born population in 2000. Another is to classify immigrants into eight
subcategories by year of entry from before 1965 to March 2000 to capture the influence
of acculturation of immigrants.
I use Moran’s I statistics to measure the degree of clustering of data and spatial
weights to capture the spatial structure of air quality. Given the clustering of data, I
implement diagnostics tests for spatial dependence after estimating OLS models. To
account for the spatial autocorrelation of air quality, three spatial models are used. Spatial
autocorrelation is represented by three interaction effects: endogenous interaction effects,
exogenous interaction effects, and interaction effects among the error terms (Elhorst
2014). Spatial lag model (SLM) addresses the spatial autocorrelation of the dependent
variable. Spatial error model (SEM) accounts for spatial autoregressive error. Spatial
autoregressive model with autoregressive disturbances (SARAR) combines both
endogenous interaction effects and interaction effects among the error terms.
These spatial models provide a more accurate understanding of the relationship
between air quality and immigration across all contiguous U.S. counties. Another
contribution of this study is the breakdown of immigrant population by country of origin
and year of entry, which provides evidence of the variation in the association between
populations and air quality. It suggests a new research direction on the differential impact
of immigrant groups, which lays the ground for my third paper.
Paper 2: A Spatial Panel Study of Air Quality
The purpose of the second paper is to explore further the environmental impact of
native and foreign-born populations over a longer time period. Including my first paper,

9 all the prior studies of the relationship between air quality and immigrant population are
not panel studies. Although previous studies show that immigrant population is
associated with better air quality while U.S.-born population is associated with worse air
quality, it remains unknown whether immigration influences air quality or vice versa.
Another concern is that some characteristics of the spatial units may be omitted in prior
studies. Panel study is important to test causality between the variables and address
omitted variable bias (Finkel 1995).
In this study, I analyze the relationship between air quality and populations across
one-third of U.S. contiguous counties over eight years, accounting for spatial
autocorrelation of the data. The only panel data of air quality is the Air Quality Index
(AQI) provided by EPA. Unlike EQI, AQI has been constructed since 1980 based on the
data of several air pollutants collected from local monitor sites. However, most of the
counties did not report the data regularly. Because of the large number of missing AQI
and the availability of independent variables, I focus on the data from 2007 to 2014.
AQI is a single index representing the concentration of six pollutants: O3, PM10,
PM2.5, CO, SO2, and NO2. The AQI value indicates the level of potential health harm for
each pollutant. The values range from 0 to 500, with smaller numbers indicating better air
quality. The sample includes 1,070 counties in the contiguous USA that report AQI for at
least four years in the study period. The median values of AQI, used as the dependent
variable, ranging from 0 to 108, with 90% of observations having median AQI values of
no more than 50. The limitation of AQI is that it may not be comparable across counties
because not all counties measure all six pollutants every day. I have contacted an EPA
expert on this issue and made sure this limitation does not invalidate the use of the data.

10 AQI has been widely used by the public and in previous literature (Laumbach 2010; Lee
et al. 2009; Lee, Ballinger, and Domino 2012; McCarty and Kaza 2015; Qiu and Kaza
2017).
I employ two different population specifications in this panel study. The first
specification is the total population and the percent of foreign-born population. The
second is U.S.-born population and foreign-born populations. The population data are
drawn from the U.S. Census Bureau’s American Community Survey (ACS) 5-year
estimates. The 5-year estimates are assigned to their middle years, following the
suggestion of the National Research Council (2007: 212).
Other independent variables, including those representing technology and
affluence, are also from ACS 5-year estimates. Technology is indicated by the total
number of persons employed in major industries that produce emissions: agriculture,
manufacturing, utilities, transportation, and warehousing. Affluence is measured by per
capita income. The county average of commuting time is also included due to traffic
emissions associated with it.
The data show spatial autocorrelation of air quality and the independent variables,
which implies that air quality, population, income, employment, and commute time in
one county can influence both local air quality and that in neighboring counties. To
address this issue, I estimate fixed effects spatial panel models. A spatial Durbin model
(SDM) accounts for spatial autocorrelation in both dependent and independent variables
(Elhorst 2014; LeSage and Pace 2009). A spatial Autocorrelation Model (SAC) or Spatial
Autoregressive Model with Autoregressive Disturbances (SARAR) takes into
consideration both endogenous interaction effect and interaction effects among the error

11 terms (Elhorst 2014; LeSage and Pace 2009). This study improves knowledge about the
association between population and air quality through a spatial analysis of panel data.
Paper 3: A Qualitative Study of Environmental Behaviors
Prior quantitative research has found that the association between population and
environmental quality varies by populations, with native-born population is more likely
than foreign-born population to be associated with worse air quality (Cramer 1998; Price
and Feldmeyer 2012; Squalli 2010). The first paper of my dissertation also shows
variations in the association with air quality by immigrant groups. A qualitative study of
environmental behaviors would provide insights into the reason for the different
associations. My third paper compares the environmental behaviors of U.S.-born Whites
with Chinese and Mexican immigrants through interview studies.
Existing research on immigrants’ environmental attitudes and behaviors focuses
primarily on Mexican and other Latin American immigrants. As the largest single group
of immigrants in the U.S., Mexicans are an important population for study. However,
mainland Chinese immigrants are now the third-largest immigrant group in the
U.S.(Migration Policy Institute 2018) and have not received attention in the limited
existing studies on environmental behaviors. Chinese culture is substantially different
from U.S. culture, which implies variation in environmental behaviors between the two
groups. This difference may be larger than the cultural difference between the U.S.
natives and other major immigrant groups such as Latinos. As a Chinese, I am well
placed to study this growing immigrant group.
I can interview Chinese immigrants in their mother language and understand the
nuance of Chinese culture. These are important to code the interviews and interpret the

12 meanings. For the interviews with Mexican immigrants, I collaborated with Spanish-
speaking researchers.
Research on environmental behaviors often involves both the private sphere (such
as household conservation practices) and public sphere activities (such as environmental
activism and voting). Immigrants often fail to engage in public activities, not due to their
indifference to the environment, but due to their marginal status, language barriers, or
cultural differences (Clarke and Agyeman 2011; DeSipio 2011; Klocker and Head 2013;
Lien et al. 2004; Pfeffer and Stycos 2002; Ramakrishnan and Viramontes 2010). Despite
immigrants’ limited public activism, household environmental behaviors are important
for environmental sustainability (Gibson et al. 2013; Klocker and Head 2013; Lane and
Gorman-Murray 2011; Reid et al. 2010; Waitt et al. 2012). I focus on household
environmental behaviors, including household energy use, transportation, and waste
management.
Given the funding and time constraints, I conduct the interviews in Cache County.
For the Chinese interviews, all the relevant paperwork is written in both English and
Chinese. I post research recruitment flyers in both physical locations and social media, by
myself or by the help of others. I also directly ask people if they can participate in the
interview. During the interviews, I ask semi-structured questions regarding household
energy use, transportation, and waste management. I also ask Chinese immigrants
whether their behaviors are influenced by Chinese culture and change since they came to
the USA. After all the interviews are transcribed, I code the data to find the emerging
themes.
The 20 Mexican interviews are conducted with the same procedures and questions

13 when extra funding and Spanish speaking interviewers are available at a later time.
This qualitative study helps to gain insights into the relationship between
populations and the environment through rich information provided by the interviews.
Supplementary to the two quantitative studies, it is crucial to link daily activities to the
environment and identify the differences and their implications for environmentalism.
Conclusion
The environmental impact of immigration is more alleged than studied.
Consequently, it is more of an excuse to restrict immigration than a motivation to address
environmental challenges. It would be better to focus on how to solve environmental
issues instead of blaming one or another. To this end, empirical studies are highly needed
to provide scientific evidence on the environmental impact of different populations.
Through a series of three studies, my dissertation investigates the association
between populations and the environment by using both quantitative and qualitative
methods and from different angles. The spatial cross-sectional study is able to generalize
the association across the U.S. contiguous counties. The spatial panel study extends
further to examine the causality of the association between populations and the
environment. The qualitative study digs into daily environmental behaviors to identify the
cultural influence on the environment and the potential for reducing environmental harm.
The two quantitative studies advance the literature through novel findings from spatial
analysis. The qualitative research is the first comparative study of environmental
behaviors across U.S.-born and foreign-born populations.

14 References
Anderson, K. (2005). Griffith Taylor lecture, geographical Society of New South Wales,
2004: Australia and the ‘state of nature/native’. Australian Geographer, 36(3),
267-282.
Baldwin, A. (2009). The white geography of Lawren Stewart Harris: Whiteness and the
performative coupling of wilderness and multiculturalism in Canada.
Environment and Planning A, 41(3), 529-544.
Bartlett, A., & Lytwak, P. (1995). Zero growth of the population of the United States.
Population and Environment, 16, 415–428.
Beck, R. H. (1996). The Case against Immigration. New York: WW Norton.
Beck, R., Kolankiewicz, L., & Camarota, S. A. (August 2003). Outsmarting smart
growth: Population growth, immigration, and the problem of sprawl. Center for
Immigration Studies. Washington DC. Retrieved Dec. 15, 2015 from
http://www.cis.org/node/53.
Blumenberg, E., & Shiki, K. (2008). Immigrants and resource sharing: The case of
carpooling. Transportation Research Board 87th Annual Meeting, No.07-2475.
Blumenberg, E., & Smart, M. (2010). Getting by with a little help from my friends… and
family: Immigrants and carpooling. Transportation, 37(3), 429-446.
Bohon, S. A., Stamps, K., & Atiles, J. H. (2008). Transportation and migrant adjustment
in Georgia. Population Research and Policy Review, 27(3), 273-291.
Bradley, K. (2009). Planning for eco-friendly living in diverse societies. Local
Environment, 14(4), 347-363.
Bunker, S. G. (1984). Modes of extraction, unequal exchange, and the progressive

15 underdevelopment of an extreme periphery: The Brazilian Amazon, 1600-
1980. American Journal of Sociology, 89(5), 1017-1064.
Butler, T. (Ed.). (2015). Overdevelopment, Overpopulation, Overshoot. Foundation for
Deep Ecology.
Cafaro, P. (2015). How Many is Too Many? The Progressive Argument for Reducing
Immigration into the United States. University of Chicago Press.
Cafaro, P., & Staples, W. III. (2009). The environmental argument for reducing
immigration to the United States. Environmental Ethic, 31, 5-30.
Carter, E. D., Silva, B., & Guzmán, G. (2013). Migration, acculturation, and
environmental values: The case of Mexican immigrants in central Iowa. Annals of
the Association of American Geographers, 103(1), 129-147.
Catton, W. R. (1982). Overshoot: The ecological basis of revolutionary change.
University of Illinois Press.
Chan, R. Y. (2001). Determinants of Chinese consumers' green purchase behavior.
Psychology and Marketing, 18(4), 389-413.
Chapman, R. L. (2006). Confessions of a Malthusian restrictionist. Ecological
Economics, 59(2), 214-219.
Chatman, D. G., & Klein, N. (2009). Immigrants and travel demand in the United States:
Implications for transportation policy and future research. Public Works
Management & Policy, 13(4), 312-327.
Chen, X., Shao, S., Tian, Z., Xie, Z., & Yin, P. (2017). Impacts of air pollution and its
spatial spillover effect on public health based on China's big data sample. Journal
of Cleaner Production, 142, 915-925.

16 Ciplet, D., Roberts, T., & Khan, M. (2015). Power in a Warming World: The New Global
Politics of Climate Change and the Remaking of Environmental Inequality.
Cambridge, MA: MIT Press.
Clarke, L., & Agyeman, J. (2011). Shifting the balance in environmental governance:
ethnicity, environmental citizenship and discourses of responsibility. Antipode,
43(5), 1773-1800.
Cole, M. A., & Neumayer, E. (2004). Examining the impact of demographic factors on
air pollution. Population and Environment, 26, 5-21.
Commoner, B. (1972a). The Closing Circle: Confronting the Environmental Crisis.
London: Jonathan Cape.
Commoner, B. (1972b). The environmental cost of economic growth. In R. G. Ridker
(Eds.), Population Resources and the Environment (pp. 339-363). Washington,
DC: GPO.
Cramer, J. C. (1998). Population growth and air quality in California. Demography, 3,
45–56.
Cramer, J. C. (2002). Population growth and local air pollution: Methods, models, and
results. Population and Development Review, 28, 22–52.
Cramer, J. C., & Cheney, R. P. (2000). Lost in the ozone: Population growth and ozone in
California. Population and Environment, 21, 315–337.
Desipio, L. (2011). Immigrant incorporation in an era of weak civic institutions:
Immigrant civic and political participation in the United States. American
Behavioral Scientist, 55(9), 1189-1213.
Dietz, T., & Rosa, E. A. (1994). Rethinking the environmental impacts of population,

17 affluence and technology. Human Ecology Review, 1, 277-300.
DinAlt, J. (1997). The environmental impact of immigration into the United States.
Carrying Capacity Network's Focus, 4(2). Retrieved Feb. 10, 2015 from
http://www.carryingcapacity.org/DinAlt.htm.
Ehrlich, P.R. (1968). The Population Bomb. New York: Ballantine Books.
Ehrlich, P. R. (2002). Human natures, nature conservation, and environmental
ethics. Bioscience, 52(1), 31-43.
Ehrlich, P.R., & Holdren, J.P. (1971). Impact of population growth. Science, 171, 1212-
1217.
Elhorst, J. P. (2014). Spatial Econometrics: From Cross-Sectional Data to Spatial
Panels. Berlin: Springer.
Ewing, W. A. (2004). Missing the forest for the trees: the environmental arguments of
immigration restrictionists miss the point. Immigration Policy Center, American
Immigration Council. Retrieved 15 March 2016 from
http://www.Immigrationpolicy.Org /Special-Reports/Missing-Forest-Trees-
Environmental-Arguments-Immigration-Restrictionists.
Finkel, S. E. (1995). Causal Analysis with Panel Data (No. 105). Thousand Oaks, CA:
Sage.
Foster, J. B., Clark, B., & York, R. (2011). The Ecological Rift: Capitalism’s War on the
Earth. New York, NY: NYU Press.
Garling, S. (1998). Immigration policy and the environment: The Washington DC
metropolitan area. Population and Environment, 20(1), 23–54.
Gibson, C., Farbotko, C., Gill, N., Head, L., & Waitt, G. (2013). Household

18 Sustainability: Challenges and Dilemmas in Everyday Life. Edward Elgar
Publishing.
Goodall, H. (2008). Will environmental history save the world? History Australia, 5(1),
13-16.
Hackett, B., & Lutzenhiser, L. (1991). Social structures and economic conduct:
Interpreting variations in household energy consumption. In Sociological Forum
(Vol. 6, No. 3, pp. 449-470). Kluwer Academic Publishers-Plenum Publishers.
Hall, C. A., Pontius, Jr, R. G., Coleman, L., & Ko, J. Y. (1994). The environmental
consequences of having a baby in the United States. Population and Environment,
15, 505-524.
Havard, S., Deguen, S., Zmirou-Navier, D., Schillinger, C., & Bard, D. (2009). Traffic-
related air pollution and socioeconomic status: A spatial autocorrelation study to
assess environmental equity on a small-area scale. Epidemiology, 20(2), 223-230.
Head, L., Klocker, N., & Aguirre-Bielschowsky, I. (2019). Environmental values,
knowledge and behaviour: Contributions of an emergent literature on the role of
ethnicity and migration. Progress in Human Geography, 43(3), 397-415.
Heisz, A., & Schellenberg, G. (2004). Public transit use among immigrants. Canadian
Journal of Urban Research, 13(1), 170-191.
Hultgren, J. (2014). The “nature” of American immigration restrictionism. New Political
Science, 36, 52-75.
Hunter, L. M. (2000). A comparison of the environmental attitudes, concern, and
behaviors of native-born and foreign-born US residents. Population and
Environment, 21, 565-580.

19 Jones, R. E. (2002). Blacks just don’t care: Unmasking popular stereotypes about concern
for the environment among African-Americans. International Journal of Public
Administration, 25(2-3), 221-251.
Jorgenson, A. K., & Clark, B. (2009). Ecologically unequal exchange in comparative
perspective: A brief introduction. International Journal of Comparative
Sociology, 50(3-4), 211-214.
Klocker, N., & Head, L. (2013). Diversifying ethnicity in Australia's population and
environment debates. Australian Geographer, 44(1), 41-62.
Klocker, N., Toole, S., Tindale, A., & Kerr, S. M. (2015). Ethnically diverse transport
behaviours: An Australian perspective. Geographical Research, 53(4), 393-405.
Kraly, E. P. (1998). Immigration and environment: A framework for establishing a
possible relationship. Population Research and Policy Review, 17, 421–437.
Krikorian, M. (2008). The New Case Against Immigration: Both Legal and Illegal. New
York, NY: Penguin.
Lane, R., & Gorman-Murray, A. (Eds.). (2011). Material Geographies of Household
Sustainability. Ashgate Publishing, Ltd.
Lankao, P. R., Tribbia, J. L., & Nychka, D. (2009). Testing theories to explore the drivers
of cities' atmospheric emissions. AMBIO: A Journal of the Human Environment,
38(4), 236-244.
Laumbach, R. J. (2010). Outdoor air pollutants and patient health. American Family
Physician, 81(2), 175.
Laureti, T., Montero, J. M., & Fernández-Avilés, G. (2014). A local scale analysis on
influencing factors of NOx emissions: Evidence from the community of Madrid,

20 Spain. Energy Policy, 74, 557-568.
Lee, Y. K. (2017). A comparative study of green purchase intention between Korean and
Chinese consumers: The moderating role of collectivism. Sustainability, 9(10),
1930. doi.org/10.3390/su9101930.
Lee, C. C., Ballinger, T. J., & Domino, N. A. (2012). Utilizing map pattern classification
and surface weather typing to relate climate to the Air Quality Index in Cleveland,
Ohio. Atmospheric Environment, 63, 50-59.
Lee, G., You, S., Ritchie, S., Saphores, J. D., Sangkapichai, M., & Jayakrishnan, R.
(2009). Environmental impacts of a major freight corridor: A study of I-710 in
California. Transportation Research Record: Journal of the Transportation
Research Board, (2123), 119-128.
LeSage, J. P., & R. K. Pace. (2009). Introduction to Spatial Econometrics. Boca Raton,
FL: Taylor & Francis.
Lien, P., Conway, M., & Wong, J. (2004). The Politics of Asian Americans: Diversity
and Community. New York, NY: Routledge.
Lutzenhiser, L. (1997). Social structure, culture, and technology: Modeling the driving
forces of household energy consumption. In P. C. Stern, T. Dietz, V. W. Ruttan,
R. H. Socolow, & J. Sweeney (Eds.), Environmentally Significant Consumption:
Research Directions (pp. 77-91). Washington, DC: National Academy Press.
Macias, T. (2016). Ecological assimilation: Race, ethnicity, and the inverted gap of
environmental concern. Society & Natural Resources, 29(1), 3-19.
Malthus, T. R. (1986) [1798]. An essay on the principle of population: The first edition
(1798) with Introduction and bibliography. In Wrigley, E.A. & D. Souden (Eds.),

21 The Works of Thomas Robert Malthus, Volume I. London: W. Pickering.
McCarty, J., & Kaza, N. (2015). Urban form and air quality in the United States.
Landscape and Urban Planning, 139, 168-179.
Merchant, C. (2003). Shades of darkness: Race and environmental history,
Environmental History, 8(3), 380-394.
Migration Policy Institute (MPI). (2018, March 1). Retrieved from
http://www.Migrationpolicy.Org/Programs/Data-Hub/Charts/Largest-Immigrant-
Groups-Over-Time.
Modarres, A. (2013). Commuting and energy consumption: Toward an equitable
transportation policy. Journal of Transport Geography, 33, 240-249.
National Research Council. (2007). Using the American Community Survey: Benefits and
Challenges. National Academies Press.
Neumayer, E. (2006). The environment: One more reason to keep immigrants out?
Ecological Economics, 59, 204–207.
Pan, J., Phillips, J., & Chen, Y. (2008). China’s balance of emissions embodied in trade:
Approaches to measurement and allocating international responsibility. Oxford
Review of Economic Policy, 24(2), 354-376.
Park, L. S. H., & Pellow, D. N. (2011). The Slums of Aspen: Immigrants vs. the
Environment in America’s Eden. New York: New York University Press.
Pfeffer, M. J., & Stycos, M. J. (2002). Immigrant environmental behaviors in New York
City. Social Science Quarterly, 83, 64–68.
Population-Environment Balance, Inc. (1992). Why excess immigration damages the
environment. Population and Environment, 13, 303-312.

22 Prell, C., & Feng, K. (2016). Unequal carbon exchanges: The environmental and
economic impacts of iconic US consumption items. Journal of Industrial
Ecology, 20(3), 537-546.
Preston, S. H. (1996). The effect of population growth on environmental quality.
Population Research and Policy Review, 15(2), 95–108.
Price, C. E., & Feldmeyer, B. (2012). The environmental impact of immigration: An
analysis of the effects of immigrant concentration on air pollution levels.
Population Research Policy Review, 31, 119-140.
Qiu, S., & Kaza, N. (2017). Evaluating the impacts of the clean cities program. Science of
the Total Environment, 579, 254-262.
Ramakrishnan, S. K., & Viramontes, C. (2010). Civic spaces: Mexican hometown
associations and immigrant participation. Journal of Social Issues, 66(1), 155-
173.
Reid, L., Sutton, P., & Hunter, C. (2010). Theorizing the meso level: The household as a
crucible of pro-environmental behaviour. Progress in Human Geography, 34(3),
309-327.
Rice, J. (2007). Ecological unequal exchange: International trade and uneven utilization
of environmental space in the world system. Social Forces, 85(3), 1369-1392.
Roberts, J. T., & Parks, B. C. (2007). Fueling injustice: Globalization, ecologically
unequal exchange and climate change. Globalizations, 4(2), 193-210.
Rothman, D. S. (1998). Environmental Kuznets curves-real progress or passing the buck?
Ecological Economics, 25(2), 177-194.
Rudel, T. K., Roberts, J. T., & Carmin, J. (2011). Political economy of the environment.
23 Annual Review of Sociology, 37, 221-238.
Sato, M. (2014). Embodied carbon in trade: A survey of the empirical literature. Journal
of Economic Surveys, 28(5), 831-861.
Schnaiberg, A. (1980). The Environment: From Surplus to Scarcity. Oxford, United
Kingdom: Oxford University Press.
Simcox, D. E. (1992). Sustainable immigration: Learning to say no. In L. Grant (Eds.),
Elephants in the Volkswagen: Facing the Tough Questions about Our
Overcrowded Country (pp. 166–177). New York: W.H. Freeman & Company.
Smith, R. (2006). Mexican New York: Transnational Lives of New Immigrants.
University of California Press.
Squalli, J. (2009). Immigration and environmental emissions: A U.S. county-level
analysis. Population and Environment, 30, 247-260.
Squalli, J. (2010). An empirical assessment of U.S. state-level immigration and
environmental emissions. Ecological Economics, 69, 1170-1175.
Stretesky, P. B., & Lynch, M. J. (2009). A cross-national study of the association
between per capita carbon dioxide emissions and exports to the United
States. Social Science Research, 38(1), 239-250.
Tessum, C.W., Apte, J.S., Goodkind, A.L., Muller, N.Z., Mullins, K.A., Paolella, D.A.,
Polasky, S., Springer, N.P., Thakrar, S.K., Marshall, J.D. and Hill, J.D., 2019.
Inequity in consumption of goods and services adds to racial–ethnic disparities in
air pollution exposure. Proceedings of the National Academy of
Sciences, 116(13), pp.6001-6006
The World Bank. (2019, January 25). Retrieved from https://data.worldbank.org/indicator

24 /SP.DYN.TFRT.IN?locations=US.
U.S. EPA (U.S. Environmental Protection Agency, Office of Research and
Development). 2014. Creating an overall environmental quality index: Technical
report. Retrieved May 22, 2017 from https://edg.epa.gov/data/PUBLIC/ORD
/NHEERL/EQI/EQI%20Overview%20Report__Final.pdf.zip.
Uteng, T.P. (2009). Gender, ethnicity, and constrained mobility: insights into the
resultant social exclusion. Environment and Planning A, 41(5), 1055 -1071.
Waitt, G., Caputi, P., Gibson, C., Farbotko, C., Head, L., Gill, N., & Stanes, E. (2012).
Sustainable household capability: Which households are doing the work of
environmental sustainability? Australian Geographer, 43(1), 51-74.
Weber, C. L., & Matthews, H. S. (2007). Embodied environmental emissions in US
international trade, 1997−2004. Environmental Science & Technology, 41(14),
4875–4881.
Zuckerman, B. (1999). The Sierra Club immigration debate: National implications.
Population and Environment, 20(1), 401–412.

25
CHAPTER II
IMMIGRATION AND ENVIRONMENT IN THE U.S.: A SPATIAL STUDY OF AIR
QUALITY*
Introduction
The United States has long ranked as the top destination country for international
migrants. According to the United Nations, the immigrant population in the U.S. reached
49.8 million in 2017, accounting for 19% of the world’s total (UN, 2017: 6). Despite the
importance of immigration in U.S. history and society, issues of immigration are
politically charged and hotly debated, with many political leaders and activists calling for
increased restrictions on immigration. Environmental issues, like immigration issues,
have gained much attention academically and politically. While opponents cite many
reasons to halt immigration, the environmental threat posed by immigrants is an issue that
uniquely bridges disparate parts of the American political spectrum (Hultgren, 2014, Park
and Pellow, 2011).
Immigrants have been blamed for environmental problems such as air pollution
and energy shortages (Beck, 1996; Beck, Kolankiewicz, & Camarota, 2003; Cafaro,
2015, Cafaro and Staples, 2009, Chapman, 2006, DinAlt, 1997, Garling, 1998, Krikorian,
* Reprinted from The Social Sciences Journal, Vol 56(1), Ma, Guizhen and Erin Trouth Hofmann, Immigration and Environment in the U.S.: A Spatial Study of Air Quality, Pages 94-106, Copyright (2019), with permission from Elsevier. https://doi.org/10.1016/j.soscij.2018.08.007. I am grateful to my advisor and co-author, Dr. Erin Trouth Hofmann, for her funding and guidance in the preparation and finalization of this paper. Funding: This work was supported by the Utah Agricultural Experiment Station [grant number A1009730, 2016].

26 2008, Population-Environment Balance, 1992, Simcox, 1992, Zuckerman, 1999). Others
argue that this claim ignores the root causes of both immigration and environmental
issues (Angus and Butler, 2011, Hultgren, 2014, Muradian, 2006, Neumayer, 2006).
Moreover, research indicates that immigrants consume less and produce less waste than
natives (Atiles & Bohon, 2003; Bohon, Stamps, & Atiles, 2008; Blumenberg and Shiki,
2008, Chatman and Klein, 2009, Hunter, 2000, Pfeffer and Stycos, 2002).
Because immigration is a substantial factor in U.S. population growth,
immigration has a clear potential for impact on environmental quality through population
pressure, as any type of population growth would. But the argument that population
pressure is detrimental to the environment is not sufficient to prove that immigration
specifically is harmful. There is a stark contrast between the widespread claims of
negative environmental impacts of immigration and the scanty empirical research on this
issue. To the best of our knowledge, there are only five empirical studies on the
association between environment and immigration in the U.S. (Cramer, 1998, Price and
Feldmeyer, 2012, Squalli, 2009, Squalli, 2010; Ma & Hofmann, n.d.). The five studies
analyze the association between immigration and air quality with variation in their
indicators of air quality, study units, and methods. All found little or no relationship
between immigration and most indicators of air pollution. These studies provide valuable
evidence for the debate over the relationship. However, only one considers spatial
dependence, which is an important feature of air quality, and all are hampered by limited
sample sizes.
Spatial analysis has been widely used to reduce estimation bias caused by spatial
effects. This study aims to examine the association between air quality and immigration

27 by using spatial analysis to account for spatial autocorrelation of air quality. We utilize
the Environmental Quality Index (EQI), which was constructed by the Environmental
Protection Agency (EPA) during 2000–2005 for all the U.S. continental counties (the
only air quality index available across all U.S. counties), and variables from population,
economic development, to location characteristics. Our spatial model provides insights
into the relationship between air quality and immigration across all contiguous U.S.
counties.
Literature review
The population pressure perspective links immigration to environmental
degradation in the U.S. through the impact of immigration as a component of population
growth. We present a review of this body of work, followed by a review of the much
smaller body of research on the specific association between immigration and
environment.
Population pressure perspective and immigration
The population pressure is pervasive in both public discussion and in the
academic field. Relying on Malthus’ (1798) population theory and the work of Ehrlich
(1968), the population pressure perspective argues that population growth poses pressure
on the local and global environments because it increases consumption of energy, water,
and other natural resources, and generates more waste and pollution (Bartlett and Lytwak,
1995, Butler, 2015, Catton, 1982). And, immigration, as the major component of
population growth in the U.S., increases pressure on local ecosystems and causes
populations to exceed the capacity of the local environments to support them (Beck,

28 1996, Beck et al., 2003, Cafaro, 2015, Cafaro and Staples, 2009, Chapman, 2006, DinAlt,
1997, Garling, 1998, Krikorian, 2008, Population-Environment Balance, 1992, Simcox,
1992, Zuckerman, 1999).
Empirical research on the relationship between population growth and
environment commonly employs the IPAT (Impact = Population × Affluence ×
Technology) model (Ehrlich & Holdren 1971) or STIRPAT model (Dietz & Rosa 1994)
for environmental impact by regression on population, affluence and technology. Air
quality data is frequently examined in research on the environmental consequences of
population because data for air quality are more available than data for other
environmental domains. Population growth impacts the environment, although the
precise nature of the relationship is uncertain. Population is positively associated with air
pollution, but the association holds only for some examined pollutants and not others
(Cole and Neumayer, 2004, Cramer, 1998, Cramer, 2002, Cramer and Cheney, 2000;
Lankao, Tribbia, & Nychka, 2009; Laureti, Montero, & Fernández-Avilés, 2014; Preston,
1996, Price and Feldmeyer, 2012, Squalli, 2009, Squalli, 2010). In addition to population,
economic development, technology, and political system also substantially affect the
environment (Commoner, 1972a, Commoner, 1972b, Preston, 1996; Rudel, Roberts, &
Carmin, 2011).
Since immigration is the major source of population growth in the U.S.,
immigrants have been linked to a variety of local environmental problems. Immigration
allegedly increases pressure on sewage treatment, conversion of rural land, natural
habitats, and transportation (Garling, 1998), energy consumption, air pollution, water
pollution and flooding (Abernethy, 2002, Beck et al., 2003), as well as food consumption,

29 and chlorofluorocarbon production (DinAlt, 1997). Immigration is hypothesized to harm
the environment through three pathways. First is the population pressure pathway, which
argues that immigration leads to population growth and that all population growth has
negative environmental impact. Immigrant population is potentially more harmful than
native population because of higher fertility among immigrants compared to natives
(Ehrlich & Ehrlich, 1991).
The second pathway is through assimilation into American consumption patterns.
The United States, home to 4.7% of the world’s population, consumed 25.3% of all fossil
fuels and generated 20.6% of all greenhouse gases in 2000. The 15 nations of the
European Union, which enjoy standards of living comparable to the United States,
collectively contained 6.2% of the world’s population, consumed 14.8% of fossil fuels,
and generated 11.8% of greenhouse gases (Ewing, 2004). Some argue that immigrants
are particularly harmful to the environment in the U.S. because they adopt American
consumption habits (Bartlett and Lytwak, 1995, Beck, 1996, DinAlt, 1997, Hall et al.,
1994; Population-Environment Balance, 1992). However, empirical research indicates
that this is not the case. Immigrants, at least in the first generation, do not necessarily
adopt American consumerist values (Carter, Silva, & Guzmán, 2013). They also exhibit
higher levels of environmental concern than native-born residents (Hunter, 2000), and are
more likely to engage in environmentally-friendly behaviors, such as carpooling and
energy-saving (Atiles and Bohon, 2003, Blumenberg and Shiki, 2008, Bohon et al., 2008,
Chatman and Klein, 2009, Hunter, 2000, Pfeffer and Stycos, 2002; Takahashi, Duan, &
Van Witsen, 2017). Therefore, immigration may be less harmful to the environment in
the U.S. than the native population.

30
The third pathway is community disorganization. Social disorganization theories
view diminished social control in ethnically heterogeneous communities as one of the
adverse effects of immigration (Bursik, 1999, Bursik and Grasmick, 1993, Warner,
1999). Immigrants are often susceptible to environmental harms because they have less
income and political clout in order to organize to address environmental issues
(Feldmeyer, 2009, Light and Gold, 2000, Steffensmeier and Demuth, 2001, Martinez,
2002, Portes and Rumbaut, 2006, Stowell, 2007). The very foundation of social
disorganization perspective, however, is questioned by the findings that immigration may
lead to the development of new types of social organization to mediate the negative
effects (Chavez and Griffiths, 2009, Lee and Martinez, 2002, Lee and Martinez, 2009,
Ousey and Kubrin, 2009, Schnapp, 2015, Sydes, 2017).
Some scholars (Hultgren, 2014, Neumayer, 2006) argue that it is inappropriate to
employ environmental reasons in support of calls for restrictions on immigration. Though
“green” arguments may be emotionally compelling even in the absence of clear scientific
findings, Kraly (1998) asserts that it is important to explore whether the environmental
impact of immigration is proportionate or disproportionate to its numbers, separating the
effects of immigration from the more general role of population growth.
Empirical research on environmental impact of immigration
Empirical research specifically on the environmental impact of immigration to the
U.S. is limited. To date, there are only five studies and all focus on air quality in the U.S.
(Cramer, 1998, Price and Feldmeyer, 2012, Squalli, 2009, Squalli, 2010; Ma & Hofmann,
n.d.). The four studies of other authors employ different combinations of air pollutants as
indicators of air quality. The most commonly used air pollutants are NOx, SOx, CO, and

31 PMx.
Cramer (1998) investigates the relationship between population growth and air
quality, which is measured by the reactive organic gases (ROG), NOx, SOx, CO, and
PM10 in California. He finds that population growth is strongly associated with some
sources of emissions but not with others. There is no evidence that the impact of
population growth depends on immigration. On the contrary, higher concentrations of
immigrants are associated with lower levels of one of the five air pollutants examined.
Thus, he argues that increased air pollution mainly comes from the pressure of domestic
population rather than immigration. Though the study covers only California, the large
population of immigrants in this region justifies his findings in explaining immigration’s
impact on the environment.
Using data for approximately 200 U.S. counties, primarily in urban areas, Squalli
(2009) tests the relationship between native-born and foreign-born population and the
four commonly used air pollutants. He finds that the size of the U.S.-born population is
associated with higher levels NO2, PM10, and SO2. The size of the immigrant population
is associated with lower levels of SO2 and higher levels of CO. Immigrant population is
relatively less harmful to the environment than natives.
Squalli (2010) examines the relationship between immigration and emissions of
the same four air pollutants, CO, SO2 NO2, and PM10, at the state level. He finds that U.S.
states with larger shares of foreign-born residents have lower emissions of not only SO2,
but also NO2. The higher CO associated with foreign-born population in his county-level
study is not present in the state-level study.
Price and Feldmeyer (2012) examine the effects of immigration on local air

32 pollution levels in 183 Metropolitan Statistical Areas. Air pollution is measured by CO,
NO2, Ozone, SO2, PM10, PM2.5 provided by EPA, and an air pollution index is created to
combine these six pollutants. Their findings indicate that immigration is not associated
with local air pollution levels across any of the seven pollution measures examined, but
negatively related to one of the pollutants. Instead, domestic migration and natural
population growth are linked to higher levels of three out of seven pollution measures.
Population growth from immigration does not have the same pollution effects that
accompany domestic migration and natural population growth. This result again provides
evidence that immigration has a lesser impact on the natural environment in the U.S., at
least in urban areas.
To help establish a causal link between population and air quality, we conducted a
spatial panel study of the EPA’s Air Quality Index (AQI) from 2007 to 2014. We found a
relationship between native-born population and worse air quality, and a relationship
between immigrant population and better air quality (Ma & Hofmann, n.d.). Like the
other studies discussed here, we were not able to cover the entire U.S. (particularly the
non-metropolitan U.S.) in our sample due to the availability of AQI data at county level,
and our choice of predictor variables was quite limited in order to maintain the panel
nature of the study. This limitation prompts us to take the advantage of the broad
coverage of the EQI data across the entire U.S. in this study, although it is cross-sectional
in nature.
In spite of their different measures of air pollution, units of analysis and study
scopes, the extant literature on the environmental impact of immigration has provided
consistent evidence against population pressure arguments that suggest immigration is the

33 major cause of environmental problems in the U.S.
These prior studies provide significant contributions to the debate over the
environment-immigration relationship. However, they have three major limitations. First,
most of these studies do not take into consideration of spatial autocorrelation of air
quality. Second, most of them are hampered by the small samples and the focus on
metropolitan areas. This is an important limitation because immigrants are increasingly
settling in geographically dispersed areas, including rural areas (Kandel & Parrado,
2005). Finally, all the studies treat the immigrant population as a homogenous group. In
fact, immigrants to the U.S. are a highly diverse population, with distinct geographic
patterns of settlement (Kritz & Gurak, 2015).
This study attempts to address these limitations by a spatial analysis of the
association between native and immigrant populations, using a composite air quality
index for all the U.S. continental counties. In addition to the comparison between natives
and immigrants in general, we examine the association between immigration and air
quality in the U.S. by delving deep into the components of immigrant population,
including immigrants by origin and immigrants by year of entry. Our research questions
are: (1) How are immigrants different from natives in their relationship with air quality?
(2) Does the relationship between air quality and immigrants vary by origin of
immigrants? (3) Do immigrants exhibit similar relationship with air quality to that of
natives through acculturation over time?
Data
Our analysis covers the 3,109 counties and county-equivalents in the contiguous
U.S. We exclude all counties in Alaska and Hawaii due to the consideration of spatial

34 proximity in spatial modeling.
Dependent variable
The dependent variable is the air quality index extracted from the EQI, provided
by the EPA for all counties in the United States as an estimate of overall environmental
quality relevant to human health (U.S. EPA, 2014a). The EQI summarizes information on
the wider environment to which humans are exposed, including the air, water, land, built,
and sociodemographic environments, and has an index for each of the five domains.
Because environmental data were not collected often enough to fully cover all areas at all
time intervals, the EQI utilizes a single point estimate to cover the entire 6-year period
from 2000 to 2005 for all the U.S. counties.
We use EQI’s air domain in order to be comparable with previous research on the
immigration-environment relationship, which all focuses on air pollution. The air domain
of the EQI measures air quality by combining measures and estimates of 6 criteria air
pollutants — CO, SO2, NO2, ozone, PM10, and PM2.5 — and 81 hazardous air pollutants
from two sources: the EPA’s Air Quality System (AQS) and the National-Scale Air
Toxics Assessment (NATA) (U.S. EPA, 2014b). The AQS collects ambient air pollution
data from thousands of monitors across the U.S; the NATA constructs air dispersion
models for estimating ambient concentrations of hazardous air pollutants at the county
and census-tract levels. The values of the air domain index range from −3.24 to 2.79,
with the higher values suggesting worse air quality.
The air quality domain of EQI has a number of limitations. First, the air domain
of the EQI is a single estimate representing the average of a 6-year period, which limits
this study to a cross-sectional analysis. Second, in the AQS data, not all counties monitor

35 air quality, so some data are interpolated, and even in counties that monitor air quality,
the specific pollutants measured vary somewhat. Third, the NATA data are based on
model estimates that may under-estimate the concentrations of pollutants and are only
available at three-year intervals. Nevertheless, the EQI is created by EPA through
extensive work from data source selection to data quality and coverage assessment, as
well as variable and index construction over years. In addition, the air quality index
produced through data reduction approaches can improve statistical efficiency. The
biggest advantage of the EQI is the broad coverage of air quality across the U.S. As far as
we know, this is the only air quality data that cover all U.S. counties. The EQI, including
its air domain, has been used widely by environmental scholars as a measure of
environmental conditions (An, Li, & Jiang, 2017; Grabich, Horney, Konrad, & Lobdell,
2015; Jian, Messer et al., 2017; Jian, Wu, & Gohlke, 2017; Lavery et al., 2017).
Independent variables
There are many factors that may affect air quality, among which population is a
major concern, as well as geophysical, traffic, industrial, and meteorological factors. This
study uses subcategories of population and immigrant population, income, employment
by industry, commute time, and location characteristics to predict air quality. Except
rural-urban continuum codes (RUCC), all the data are from the U.S. Census 2000.
Immigrant population refers to foreign-born population recorded in the U.S. Census
2000.
We divide population into native-born and foreign-born population to compare
these two populations regarding their relationship with air quality. Conceptually,
immigrant and foreign-born population are not exactly the same term. Practically, these

36 two terms are often used interchangeably. Following prior studies (Cramer, 1998, Price
and Feldmeyer, 2012, Squalli, 2009, Squalli, 2010), we refer to immigrant population as
foreign-born population, i.e., first-generation immigrants. In addition, we break
immigrants down into major national- or regional-origin groups. More than half of the
total immigrants to the U.S. came from Latin America, the majority from Mexico. We
identify 13 immigrant populations from regions or countries that account for more than
3% of the total U.S. foreign-born population in 2000, including immigrants born in
Mexico, Central America other than Mexico, the Caribbean, South America, Northern
Europe, Western Europe, Southern Europe, Eastern Europe, China, Eastern Asia other
than China (Korea and Japan), the Philippines, Vietnam, and India. Finally, to capture the
influence of acculturation of immigrants, we use a third specification of immigrant
population. The U.S. Census 2000 groups immigrants into 8 subcategories by year of
entry from before 1965 to March 2000. We employ these categories to represent
immigrants’ duration of stay.
Economic development has been found to be highly predictive of air quality.
Drawing upon previous studies, we include income and employment to represent the
economic development. Income per capita was used as the indicator of affluence at state
or county level (Cramer, 1998, Cramer, 2002, Squalli, 2009, Squalli, 2010). We conduct
sensitivity tests for different measures of income provided by the Census 2000. The
results show average family income is better than income per capita, average household
income or median incomes. We include percentages of employment in four major
pollution-prone industries: agriculture; mining; manufacturing; and transportation,
warehousing, and utilities. Following Price and Feldmeyer’s (2012) study, we also

37 include the percentage of commuters in the county who commute for 60 min or longer.
To control for county characteristics, we employ rural-urban continuum codes
which are used in the study on population effect on land development (Clement &York,
2017) and longitude and latitude, which are statistically significant in the study on the
factors of NOx emissions in Spain (Laureti et al., 2014). The U.S. Department of
Agriculture (USDA) 2003 rural-urban continuum codes classify counties into 9
categories by the population size and degree of urbanization and adjacency to a metro
area, with 1–3 indicating metro counties and 4–9 denoting nonmetro counties.
We test for sensitivity and include variables that are the better fits for this study.
All the dependent and independent variables have no missing values for all the 3,109
contiguous counties. Annual temperature is also incorporated as a predictor of air quality
in some studies (Elliott and Clement, 2015, Price and Feldmeyer, 2012). However, we
elect not to use annual temperature because in the 2000 data, temperature is missing for
Miami/Dade county (Florida), which has a foreign-born population of over 50%. The
regression results without this county only change a little in the levels of significance on
county characteristics variables, but do not affect the estimation of population variables
which are our primary interest. Therefore, we would rather keep this county with high
foreign-born population and maintain a full sample of all the continental counties than
consider the effect of temperature.
Table 1 displays summary statistics for the entire data set. The U.S. continental
counties on average had 80,002 native-born population and 9,926 foreign-born
population. Mexico was the largest source country, accounting for nearly 30% of total
immigrants. Except Latin America, Europe and Asia were the other major source regions

38 of immigrants. While each of the four parts of Europe contributed at least 3%
immigrants, in Asia, a few countries took the lead in immigration. The percentages of
employment varied substantially by industry and county.
Table 1 Descriptions of variables
Variable Mean Std. Dev. Min Max
Air domain index .0184942 .9818839 -3.241777 2.78984
Native-born population 80002 222803.6 67 6069894
Foreign-born population 9926 81977 0 3449444
Foreign-born by origin:
Foreign-born from Mexico 2950 32892.68 0 1525157
Foreign-born from the Caribbean 949 15272.93 0 688760
Foreign-born from Central America other than Mexico
651 9694.326 0 487130
Foreign-born from Southern America 620 6803.751 0 245553
Foreign-born from Eastern Europe 612 5820.253 0 207777
Foreign-born from the Philippines 405 4598.539 0 202568
Foreign-born from China 482 5271.598 0 196157
Foreign-born from East Asia other than China 379 3993.604 0 188108
Foreign-born from Vietnam 315 3394.382 0 111017
Foreign-born from Southern Europe 300 2086.142 0 50410
Foreign-born from India 329 2229.762 0 48503
Foreign-born from Northern Europe 312 1507.526 0 44349
Foreign-born from Western Europe 350 1518.244 0 43918
Foreign-born by year of entry:
Year of entry for foreign-born: 1995-2000 2424 16709.22 0 598886
Year of entry for foreign-born: 1990-1994 1787 14914.36 0 602148

39
Year of entry for foreign-born: 1985-1989 1498 14561.75 0 661448
Year of entry for foreign-born: 1980-1984 1204 11868.71 0 533114
Year of entry for foreign-born: 1975-1979 855 8857.915 0 420693
Year of entry for foreign-born: 1970-1974 636 6022.188 0 268033
Year of entry for foreign-born: 1965-1969 472 4016.309 0 142719
Year of entry for foreign-born: before 1965 1050 6502.281 0 222403
Average family income 51353.24 11841.46 20611.96 129475.6
% Employment in agriculture 6.07793 7.019468 0 55.60345
% Employment in mining 1.153751 2.704615 0 45.63584
% Employment in manufacturing 15.9153 9.084577 0 48.55398
% Employment in transportation warehousing, and utilities
5.452415 1.83958 .671141 26.04898
% Commutes > 60 minutes 7.672545 4.473702 1.106807 33.89079
Rural-urban continuum codes 5.110968 2.680229 1 9
Latitude 38.27961 4.838231 25.0461 48.82976
Longitude -91.65095 11.48403 -124.2154 -67.60872
Fig. 1 shows both the air index and foreign-born population across all the U.S.
contiguous counties in 2000. The shaded counties had negative values of air index
(indicating better air quality), while the light counties had worse air quality. Counties in
the Midwest, West, and Southwest are more likely to have better air quality than those in
the Northeast and Southeast. Counties with more than 10% of foreign-born population
(marked by bigger dots) are scattered primarily in the West Coast, East Coast, and West
South Central region. The relationship between air quality and foreign-born population is
not straightforward from this map. Immigrants are concentrated in counties with both
good and poor air quality across the U.S. in 2000.

40
Fig. 1 Air quality and foreign-born population by the U.S. continental counties, 2000
Methods
Spatial autocorrelation of air quality
According to Tobler’s (1970) First Law of Geography, “near things are more
related than distant things.” Spatial units would therefore influence each other, depending
on their locations. Spatial autocorrelation of air quality is documented in previous studies
(Chen, Shao, Tian, Xie, & Yin, 2017; Havard, Deguen, Zmirou-Navier, Schillinger, &
Bard, 2009; McCarty & Kaza, 2015). To measure the degree of this association, we
compute Moran’s I statistics using GeoDa (Anselin, Syabri, & Kho, 2006). Global
Moran’s I is a test of overall clustering, summarizing the degree to which similar or
dissimilar observations tend to occur near each other (Anselin, 1988).
Spatial weights matrix specifies the spatial structure of the data. Air quality in a
county may affect air quality in its neighboring counties more than that in counties farther

41 away. Air quality tends to correlate within a certain distance instead of within the
boundary of specific administrative units. Therefore, we use a distance-based weights
matrix with a threshold distance of approximately 146 km, which is the minimum
threshold necessary to ensure that each county has at least one neighbor. Counties within
the centroid distance of 146 km are considered as having influence on each other;
counties beyond that distance have no influence. Based on this weights matrix, Moran’s I
statistics are calculated. The global Moran’s I for air index is 0.606 (P = 0.001) which
indicates a moderately high clustering of like values on air index across all the counties.
Fig. 2 Local indicators of spatial autocorrelation map of air index
To understand where and how the counties cluster, we turn to local indicators of
spatial autocorrelation (LISA) statistics. Fig. 2 is a LISA map demonstrating local spatial
autocorrelation. The darker shaded counties were clusters with positive local spatial
autocorrelation, which means they clustered with their neighbors on either high or low air

42 index. The clustering counties in the middle of the U.S. had better air quality (lower air
index), whereas those clustering in the east or the west had worse air quality (higher air
index).
Both global and local Moran’s I test statistics indicate the presence of spatial
autocorrelation of air index.
Spatial models
Using linear regression to predict EQI values is inappropriate because it produces
spatial autocorrelation in model residuals (I=.354, p<.000), requiring the use of a spatial
model. There are two basic spatial models to address spatial autocorrelation.
Spatial lag model (SLM) accounts for the spatial autocorrelation of the dependent
variable by adding a spatial lag term of the dependent variable into the OLS model. The
SLM is expressed as:
Y = ρWY + 𝛽𝛽 X + 𝜀𝜀 (1)
where Y is the vector of the dependent variable; X represents a matrix of the explanatory
variables; β is the regression coefficient associated with the explanatory variables; and ε
is a normally distributed disturbance term. By adding ρWY, which averages the
neighboring values of a location to an OLS model, SLM specifies that the dependent
variable in a given county is not only affected by the explanatory variables in the
reference county, but also affected by the values of the dependent variables in nearby
counties. W is the spatial weights matrix capturing the interaction between the counties;
WY reflects the spatial lag of the dependent variable; ρ denotes the spatial
autocorrelation coefficient that represents the effect of WY.
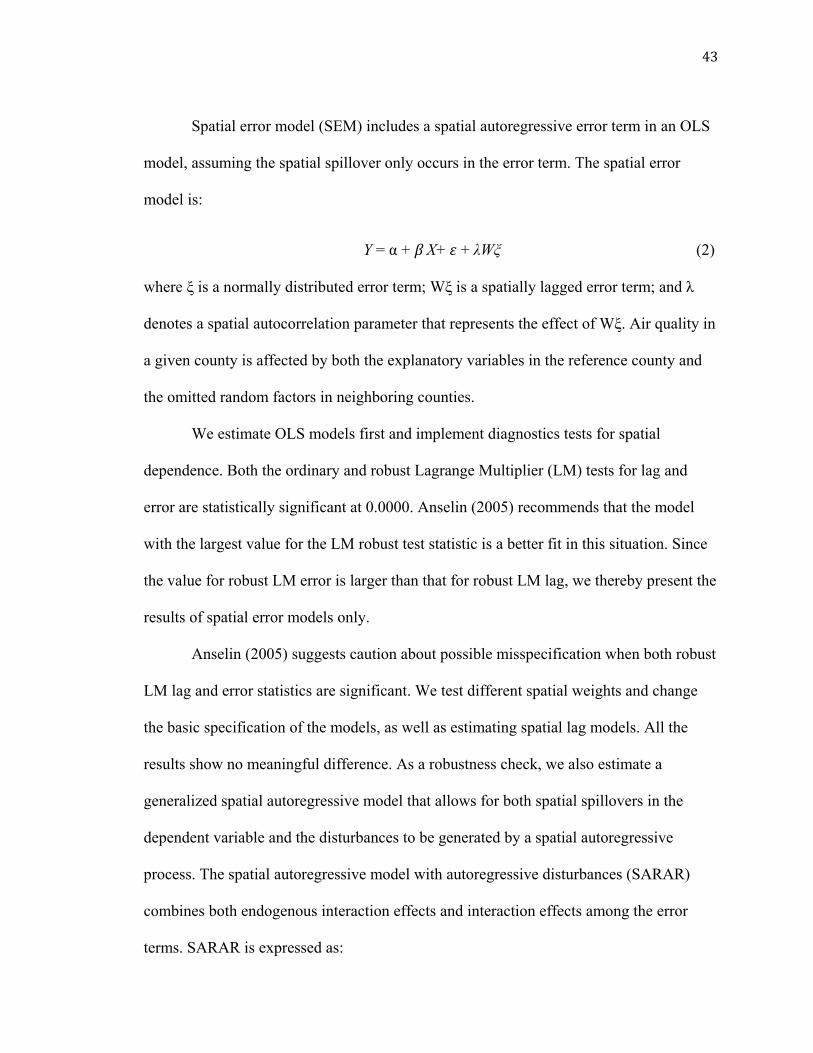
43
Spatial error model (SEM) includes a spatial autoregressive error term in an OLS
model, assuming the spatial spillover only occurs in the error term. The spatial error
model is:
Y = α + 𝛽𝛽 X+ 𝜀𝜀 + λWξ (2)
where ξ is a normally distributed error term; Wξ is a spatially lagged error term; and λ
denotes a spatial autocorrelation parameter that represents the effect of Wξ. Air quality in
a given county is affected by both the explanatory variables in the reference county and
the omitted random factors in neighboring counties.
We estimate OLS models first and implement diagnostics tests for spatial
dependence. Both the ordinary and robust Lagrange Multiplier (LM) tests for lag and
error are statistically significant at 0.0000. Anselin (2005) recommends that the model
with the largest value for the LM robust test statistic is a better fit in this situation. Since
the value for robust LM error is larger than that for robust LM lag, we thereby present the
results of spatial error models only.
Anselin (2005) suggests caution about possible misspecification when both robust
LM lag and error statistics are significant. We test different spatial weights and change
the basic specification of the models, as well as estimating spatial lag models. All the
results show no meaningful difference. As a robustness check, we also estimate a
generalized spatial autoregressive model that allows for both spatial spillovers in the
dependent variable and the disturbances to be generated by a spatial autoregressive
process. The spatial autoregressive model with autoregressive disturbances (SARAR)
combines both endogenous interaction effects and interaction effects among the error
terms. SARAR is expressed as:

44
Y = ρWY + Xβ + u (3)
u = λMu + 𝜀𝜀 (4)
where W and M are n × n spatial-weighting matrices; WY and Mu are n × 1 vector of
spatial lags; and λ and ρ are the corresponding parameters.
We estimate all the spatial models in GeoDaSpace 1.0 (Anselin & Rey, 2014).
The SARAR models are estimated by spatial two-stage least-squares (S2SLS) method.
The S2SLS estimator may allow better approximation of the true spatial dependence by
fitting multiple spatial lags. We test distance and contiguity weights matrices and find
little difference in the results, as other studies have found (Havard et al., 2009, LeSage
and Pace, 2014, Saito and Wu, 2016). Therefore, we present the results based on the
distance weights matrix with a threshold of 146 km, as used for Moran’s I tests.
Results
Table 2-4 display the results of the SEM and SARAR models examining the
relationship between air quality and the three specifications of immigrant population. The
coefficients of the control variables change little across the three tables.
Foreign-born population in general
Table 2 shows the results for the first specification of population, i.e., native-born
and foreign-born populations. The spatial coefficients ρ and λ are highly significant in the
models, which indicates that the models capture the spatial autocorrelation of the data.
Accounting for both spatial autoregression in the dependent variable and in the error
term, the SARAR model is better than the SEM in terms of pseudo R-squared. All the
coefficients are relatively small, corresponding to the narrow range (−3.24 to 2.79) of the

45 values of air index.
Table 2 Spatial regression results for immigrant population in general
Air index
SEM SARAR
Native-born population (in millions) 0.739*** (0.054)
0.779*** (0.056)
Foreign-born population (in millions) -0.731*** (0.136)
-0.781*** (0.141)
Average family income (in hundred thousand dollars) 0.305*** (0.085)
0.188** (0.086)
% Employment in agriculture -0.051*** (0.002)
-0.050*** (0.002)
% Employment in mining -0.019*** (0.003)
-0.017*** (0.003)
% Employment in manufacturing 0.005*** (0.001)
0.004*** (0.001)
% Employment in transportation warehousing, and utilities
-0.008** (0.004)
-0.005 (0.004)
% Commutes > 60 minutes -0.033*** (0.002)
-0.036*** (0.002)
Rural-urban continuum codes -0.105*** (0.004)
-0.104*** (0.004)
Latitude -0.007 (0.009)
-0.001 (0.004)
Longitude 0.020*** (0.004)
0.006*** (0.002)
Constant 2.935*** (0.495)
1.530*** (0.250)
Lambda 0.876*** (0.014)
0.697*** (0.027)
Rho
0.380*** (0.032)
Pseudo R-squared 0.7702 0.8430
N 3,109 3,109
* P<0.1, ** P<0.05, *** P<0.01
The results of both models are very similar. The coefficients of native and
immigrant populations are nearly identical in magnitude but opposite in signs at a high

46 level of significance. A larger native-born population is associated with a higher value of
air index and thus with worse air quality. On the contrary, a larger foreign-born
population is associated with a lower value of air index and thus with better air quality.
Counties with advanced economies are more likely to experience worse air
quality. A higher average family income is associated with worse air quality.
Employment plays an important role with regard to air quality as well. Employment in
agriculture and mining are associated with better air quality. Employment in
manufacturing is associated with worse air quality. These differences may reflect the fact
that agriculture and mining tend to be located in rural areas with less pollution while
manufacturing may be a source of air pollution. This explanation is supported by the
negative relationship of rural-urban continuum codes with air index. More rural counties
are associated with better air quality. Employment in transportation, warehousing, and
utilities is not statistically significant in SARAR model, though significant in SEM.
Surprisingly, commute time is negatively related to the air index. Longer commute times
correspond to better air quality, which may imply that people who live in more rural areas
tend to commute longer distances to urban areas for work. Longitude is significantly
related to the air index, while latitude is not. Counties in the east tend to have worse air
quality than those in the west, which is clear in Fig. 1, Fig. 2.
The results that immigrant population is significantly associated with better air
quality and natives are associated with worse air quality are consistent with prior studies.
Although population inevitably impose pressure on the environment, immigrant
population in general is less harmful to local air quality than native-born population.

47
Foreign-born population by origin
When we break down immigrant population by major sources, we find the
relationship between air quality and immigrant population varies by origin of immigrants
(Table 3). We primarily focus on the results of SARAR model which is better than SEM,
as measured by pseudo-R squared. Mexican immigrants, though accounting for the
largest share of immigrants to the U.S., are not associated with air quality. Immigrants
from the Caribbean, China, and East Asia other than China (Korea and Japan) are
significantly associated with worse air quality, whereas those from Central America other
than Mexico, the Philippines, Eastern, Northern, and Western Europe are associated with
better air quality. The positive association of some immigrant groups with air quality is
much stronger than the negative association of other groups, which results in the overall
positive association of immigrants with air quality identified in Table 2. These results
demonstrate substantial variations among immigrants by origin in the association with
local air quality, which has not yet been examined in previous studies. Due to the cross-
sectional nature of this study, the association between immigrant groups and air quality
Table 3 Spatial regression results for immigrant population by origin
Air index
SEM SARAR
Native-born population (in millions) 1.339*** (0.090)
1.344*** (0.092)
Foreign-born population by origin (in millions):
Foreign-born from Mexico -0.876 (0.691)
-0.205 (0.716)
Foreign-born from the Caribbean 2.643** (1.082)
3.039*** (1.117)
Foreign-born from Central America other than Mexico -8.128*** (2.420)
-9.738*** (2.487)

48 Foreign-born from Southern America -0.001
(2.612) -0.076 (2.679)
Foreign-born from Eastern Europe -9.268*** (2.029)
-10.386*** (2.090)
Foreign-born from the Philippines -11.610*** (3.522)
-13.069*** (3.671)
Foreign-born from China 18.205*** (3.043)
18.334*** (3.108)
Foreign-born from East Asia other than China 16.054** (6.469)
16.633** (6.607)
Foreign-born from Vietnam -3.656 (3.635)
-6.066 (3.727)
Foreign-born from Southern Europe 11.991* (6.205)
9.907 (6.318)
Foreign-born from India -9.940* (5.695)
-7.967 (5.819)
Foreign-born from Northern Europe -75.734*** (21.204)
-66.003*** (21.720)
Foreign-born from Western Europe -34.968* (20.793)
-38.021* (21.252)
Average family income (in hundred thousand dollars) 0.461*** (0.088)
0.334*** (0.089)
% Employment in agriculture -0.050*** (0.002)
-0.049*** (0.002)
% Employment in mining -0.018*** (0.003)
-0.016*** (0.003)
% Employment in manufacturing 0.007*** (0.001)
0.005*** (0.001)
% Employment in transportation warehousing, and utilities -0.009** (0.004)
-0.006 (0.004)
% Commutes > 60 minutes -0.032*** (0.002)
-0.034*** (0.002)
Rural-urban continuum codes -0.098*** (0.004)
-0.098*** (0.004)
Latitude -0.008 (0.010)
-0.002 (0.004)
Longitude 0.019*** (0.004)
0.005** (0.002)
Constant 2.742*** (0.507)
1.363*** (0.255)
Lambda 0.882*** (0.014)
0.711*** (0.026)
Rho
0.375*** (0.032)
Pseudo R-squared 0.7758 0.8473
N 3,109 3,109
* P<0.1, ** P<0.05, *** P<0.01

49 may go two directions, i.e., air quality may affect the settlement of immigrants, or
immigrants may affect air quality. Further research is expected to explore why and how
origins of immigrants affect their association with air quality in the U.S.
Foreign-born population by year of entry
Immigrants may acculturate to American excessive consumption pattern, which
increases pressure on the environment. Table 4 presents the results of spatial models that
replace the overall immigrant population with immigrant groups by year of entry. Again,
we rely on the SARAR model due to the higher pseudo R-square value. Immigrants who
came to the U.S. from 1995 to 2000, those who came from 1975 to 1979, and those who
came before 1965, are significantly associated with better air quality. Immigrants arriving
between 1990 and 1994, between 1970 and 1974, and between 1965 and 1969 are
associated with worse air quality. The association of immigrants and air quality over time
shows no evidence of a consistent linear trend towards assimilation to American
consumption behavior. Instead, our results indicate a cohort effect. Immigrants entering in
different periods both arrived from and entered into specific social and political
circumstances, which can affect their settlement patterns and pathways of assimilation.
These differences could create differing associations with air quality. Year of entry is likely
Table 4 Spatial regression results for immigrant population by year of entry
Air index
SEM SARAR
Native-born population (in millions) 1.412*** (0.096)
1.402*** (0.098)
Foreign-born by year of entry (in millions):

50 Year of entry for foreign-born: 1995-2000 -16.601***
(3.239) -12.843***
(3.391) Year of entry for foreign-born: 1990-1994 19.475***
(5.296) 14.458***
(5.536) Year of entry for foreign-born: 1985-1989 12.001
(7.974) 17.645** (8.252)
Year of entry for foreign-born: 1980-1984 7.608 (11.366)
3.320 (11.684)
Year of entry for foreign-born: 1975-1979 -61.340*** (12.532)
-63.285*** (12.713)
Year of entry for foreign-born: 1970-1974 39.670** (18.117)
41.841** (18.261)
Year of entry for foreign-born: 1965-1969 35.777* (19.639)
34.172* (20.112)
Year of entry for foreign-born: before 1965 -50.069*** (7.583)
-50.482*** (7.697)
Average family income (in hundred thousand dollars) 0.441*** (0.085)
0.302*** (0.086)
% Employment in agriculture -0.050*** (0.002)
-0.049*** (0.002)
% Employment in mining -0.018*** (0.003)
-0.016*** (0.003)
% Employment in manufacturing 0.007*** (0.001)
0.006*** (0.001)
% Employment in transportation warehousing, and utilities -0.009** (0.004)
-0.006 (0.004)
% Commutes > 60 minutes -0.033*** (0.002)
-0.035*** (0.002)
Rural-urban continuum codes -0.098*** (0.004)
-0.098*** (0.004)
Latitude -0.009 (0.009)
-0.003 (0.004)
Longitude 0.018*** (0.004)
0.005** (0.002)
Constant 2.726*** (0.481)
1.347*** (0.242)
Lambda 0.875*** (0.014)
0.693*** (0.026)
Rho
0.379*** (0.031)
Pseudo R-squared 0.7781 0.8487
N 3,109 3,109
* P<0.1, ** P<0.05, *** P<0.01
to be related to national origin groups as well, since different groups were most likely to
immigrate in specific periods.

51 Conclusion
The claim that immigration particularly harms the environment neither addresses
the root cause of the environmental problems nor the immigration issues in the U.S.
Empirical research is sorely needed for the debate over the immigration-environment
relationship. However, the existing studies are limited in number, methodology, and
generalization across the entire U.S. This study examines the relationship between native
population, immigrant population, and air quality in the U.S. by using spatial methods to
analyze the data for all the U.S. continental counties in 2000.
We find that larger native population is significantly associated with worse air
quality, in line with previous studies (Cramer, 1998, Squalli, 2009; Ma and Hofmann,
n.d.). Our findings also support the results of existing research that immigrant population
is associated with better air quality (Cramer, 1998, Price and Feldmeyer, 2012, Squalli,
2009; Ma and Hofmann, n.d.). In contrast to other studies, where findings of a positive
association between immigration and air quality only hold for some pollutants or some
regions in the U.S., our findings show clear evidence of an association between
immigration and overall air quality across the contiguous U.S. counties, and this
association is robust to controls for spatial autocorrelation. We thus provide strong
support for the hypotheses that immigrants, overall, do not assimilate into U.S. consumer
behaviors and that immigrants do not create social disorganization that prevents
communities from addressing environmental concerns.
There are numerous possible explanations for the relationships that we found. The
disparity in environmental impact by nativity may be attributable to lower consumption
patterns of immigrants than their native counterparts due to lower income or traditional

52 habits, as documented in the literature (Atiles and Bohon, 2003, Blumenberg and Shiki,
2008, Bohon et al., 2008, Chatman and Klein, 2009, Hunter, 2000, Pfeffer and Stycos,
2002, Takahashi et al., 2017). Immigrants may serve to revitalize communities and make
them more willing or able to address environmental issues, as Price and Feldmeyer
(2012) argue. Immigration may also be an effect of air quality; that is, immigrants may be
drawn to settle in areas precisely because they have better air quality. Finally, the
association may be spurious. For example, a liberal political environment at the state
level is conducive to legislation that is particularly welcoming to immigrants, and the
same political environment may be equally conducive to measures to improve air quality
(Hero & Preuhs, 2007).
We also find the variations among immigrant populations by origin in the
relationship with air quality. Being the largest immigrant group, Mexicans were not
associated with air quality. Most European immigrant groups, as well as immigrants from
Central America and the Philippines, were related to better air quality, while East Asian
immigrants were related to worse air quality. Like our overall association between
immigration and air quality, these varied associations could have a variety of
explanations. If immigrants’ overall lesser impact on air quality is caused by their
consumption and environmental behaviors, then it makes sense that these behaviors
might vary according to immigrants’ socioeconomic status or cultural norms. Variation
across immigrant groups may also reflect settlement patterns that vary by country of
origin. In 2000, Mexican immigrants were increasingly settling in smaller cities and rural
areas, while Asian immigrants remained concentrated in a handful of large, and mostly
coastal, cities (Massey & Capoferro, 2008). Their urban concentration could explain

53 Asians’ association with worse air quality. Socioeconomic and cultural differences could
also influence the ability and desire of immigrant groups to settle in areas with better air
quality. This variation by origin is a complex relationship and deserves further
exploration.
Another interesting breakdown of immigrant population by year of entry shows
variation in the relationship with air quality among immigrants staying in the U.S. for
various lengths. Existing findings on assimilation and environmental impact are mixed,
as some studies argue that immigrants assimilate into American super-consuming habits
(DinAlt, 1997, Ehrlich and Ehrlich, 1991, Hunter, 2000) and others find it is not true
(Carter et al., 2013). Our results provide no support for the assimilation hypothesis,
instead pointing to cohort effects. Immigration cohorts may represent groups who have
specific cultural, political, or socioeconomic similarities that shape their consumption
patterns and settlement choices. This is all the more likely because immigration cohort is
also tied to country of origin.
Our findings have important policy implications. First of all, it demonstrates that
in the short run, restrictions on immigration will not produce significant environmental
benefit, at least in terms of air quality. This finding is not likely to deter immigration
opponents, or end the debate on the environmental consequences of immigration. In the
long run, more immigration today does mean a larger native-born population in the
future, with potentially negative environmental consequences. Although our findings tell
against the theory that first-generation immigrants assimilate into American consumption
patterns, the question of what happens with their children is less certain. Some evidence
from Canada indicates that consumption patterns of children of immigrants are

54 indistinguishable from those of the rest of the native population (Abizadeh & Ghalam,
1992). Other evidence indicates that living in a multicultural society can lead to patterns
of increased consumption (Demangeot & Sankaran, 2012).
The second and more important implication is that the characteristics of a
population, including its nativity characteristics, are more important than its size in the
association between population and environmental quality. Studies show that population
pressure perspective may overestimate the impact of population growth which have much
less effect than technology (Commoner, 1972a, Commoner, 1972b, Commoner, 1991)
and overlooks politics in estimating environmental impact (Rudel, Roberts, & Carmin,
2011). The “treadmill of production” in a capitalist system, which requires ever-
increasing levels of consumption to drive economic growth, is a major cause of
environmental harm (Kovel, 2002, Park and Pellow, 2011, Schnaiberg, 1980, Speth,
2008). Much research highlights these high levels of consumption among Americans
(Blumenberg and Shiki, 2008, Carter et al., 2013, Ewing, 2004, Hunter, 2000, Pfeffer and
Stycos, 2002). As demonstrated in this study, native-born population is in sharp contrast
with foreign-born population in terms of environmental impact, which may be a result of
the differences in consumption patterns among the two groups. To protect the
environment, a variety of policies can be considered, including policies that limit
population growth. However, our research highlights that modifying Americans’
consumption patterns provides a promising approach to both short- and long-term
environmental protection.
There are two main limitations of this study. The first is that we use cross-
sectional data which fail to capture causal relationship between immigration and air

55 quality. We can only identify the statistically significant association between immigrants
and air quality. Another is that the air domain index of EQI is somewhat opaque. EQI
was measured only once, so the validity of the air index and its compatibility across
counties has not been clearly established. Despite these limitations, our study serves as an
important counterpart to existing studies by providing strong supporting evidence for the
contention that immigrant population is generally less harmful than native-born
population, though population growth in any form increases pressure on the environment.
We would suggest that it is worth extending the analysis of the dynamic association of
immigration and air quality to grasp the influence of original countries on immigrants in
their lives in the U.S. This study also indicates that duration of stay is an important factor
in considering the immigration-environment relationship in future research.

56 References
Abernethy, D. (2002). Population dynamics: Poverty, inequality, and self-regulating
fertility rates. Population and Environment, 24, 69–96.
Abizadeh, S., & Ghalam, N. Z. (1992). Immigration: A consumption impact
assessment. ACR Special Volumes.
An, R., Li, X., & Jiang, N. (2017). Geographical variations in the environmental
determinants of physical inactivity among US adults. International Journal of
Environmental Research and Public Health, 14(11), 1326.
Angus, I., & Butler, S. (2011). Too Many People? Population, Immigration, and the
Environmental Crisis. Chicago, IL: Haymarket Books.
Anselin, L. (1988). Spatial Econometrics: Methods and Models. Dordrecht, The
Netherlands: Kluwer Academic Publishers.
Anselin, L. (2005). Exploring spatial data with GeoDa: A workbook. Urbana, 51(61801),
309.
Anselin, L., Syabri, I. & Kho, Y. (2006). GeoDa: An introduction to spatial data analysis.
Geographical Analysis, 38 (1), 5-22.
Anselin, L., & Rey, S. J. (2014). Modern Spatial Econometrics in Practice: A Guide to
GeoDa, GeoDaSpace and PySAL. Chicago, IL: GeoDa Press LLC
Atiles, J. H., & Bohon, S. A. (2003). Camas calientes: Housing adjustments and barriers
to social and economic adaptation among Georgia’s rural Latinos. Southern Rural
Sociology, 19(1), 97-122.
Bartlett, A., & Lytwak, P. (1995). Zero growth of the population of the United States.
Population and Environment, 16, 415–428.

57 Beck, R. H. (1996). The Case against Immigration. New York: WW Norton.
Beck, R., Kolankiewicz, L., & Camarota, S. A. (August 2003). Outsmarting smart
growth: Population growth, immigration, and the problem of sprawl. Center for
Immigration Studies. Washington DC. Retrieved Dec. 15, 2015 from
http://www.cis.org/node/53.
Bohon, S. A., Stamps, K., & Atiles, J. H. (2008). Transportation and migrant adjustment
in Georgia. Population Research and Policy Review, 27(3), 273-291.
Blumenberg, E., & Shiki, K. (2008). Immigrants and resource sharing: The case of
carpooling. Transportation Research Board 87th Annual Meeting, 22.
Bursik, Robert J. Jr. (1999). The informal control of crime through neighborhood
networks. Sociological Focus, 32, 85-97.
Bursik, Robert J. Jr. and Harold Grasmick. (1993). Economic Deprivation and
Neighborhood Crime Rates, 1960-1980. Law and Society Review, 27, 263-283.
Butler, T. (Ed.). (2015). Overdevelopment, Overpopulation, Overshoot. Foundation for
Deep Ecology.
Cafaro, P. (2015). How Many is Too Many? The Progressive Argument for Reducing
Immigration into the United States. University of Chicago Press. Carter, E. D., Silva,
B., & Guzmán, G. (2013). Migration, acculturation, and environmental values: The
case of Mexican immigrants in central Iowa. Annals of the Association of American
Geographers, 103, 129-147.
Cafaro, P., & Staples, W. III. (2009). The environmental argument for reducing
immigration to the United States. Environmental Ethic, 31, 5-30.
Catton, W. R. (1982). Overshoot: The Ecological Basis of Revolutionary Change.

58 University of Illinois Press.
Chapman, R. L. (2006). Confessions of a Malthusian restrictionist. Ecological
Economics, 59(2), 214-219.
Chatman, D. G., & Klein, N. (2009). Immigrants and travel demand in the United States:
Implications for transportation policy and future research. Public Works
Management & Policy, 13(4), 312-327.
Chavez, J. M., & Griffiths, E. (2009). Neighborhood dynamics of urban violence:
Understanding the immigration connection. Homicide Studies, 13(3), 261-273.
Chen, X., Shao, S., Tian, Z., Xie, Z., & Yin, P. (2017). Impacts of air pollution and its
spatial spillover effect on public health based on China's big data sample. Journal of
Cleaner Production, 142, 915-925.
Clement, M. T., & York, R. (2017). The asymmetric environmental consequences of
population change: An exploratory county-level study of land development in the
USA, 2001-2011. Population and Environment, 39(1), 47-68.
Cole, M. A., & Neumayer, E. (2004). Examining the impact of demographic factors on
air pollution. Population and Environment, 26, 5-21.
Commoner, B. (1972a). The Closing Circle: Confronting the Environmental Crisis.
London: Jonathan Cape.
Commoner, B. (1972b). The environmental cost of economic growth. In R. G. Ridker
(Eds.), Population Resources and the Environment (pp. 339-363). Washington, DC:
GPO.
Commoner, B. (1991). Rapid population growth and environmental stress. International
Journal of Health Services, 21(2), 199-227.

59 Cramer, J. C. (1998). Population growth and air quality in California. Demography, 3,
45–56.
Cramer, J. C. (2002). Population growth and local air pollution: Methods, models, and
results. Population and Development Review, 28, 22–52.
Cramer, J. C., & Cheney, R. P. (2000). Lost in the ozone: Population growth and ozone in
California. Population and Environment, 21, 315–337.
Dietz, T., & Rosa, E. A. (1994). Rethinking the environmental impacts of population,
affluence and technology. Human Ecology Review, 1, 277-300.
DinAlt, J. (1997). The environmental impact of immigration into the United States.
Carrying Capacity Network's Focus, 4(2). Retrieved Feb. 10, 2015 from
http://www.carryingcapacity.org/DinAlt.htm.
Demangeot, C., & Sankaran, K. (2012). Cultural pluralism: Uncovering consumption
patterns in a multicultural environment. Journal of Marketing Management, 28(7-8),
760-783.
Ehrlich, P.R. (1968). The Population Bomb. New York: Ballantine Books.
Ehrlich, P. R., & Ehrlich, A. H. (1991). The most overpopulated nation. NPG Forum
Series.
Ehrlich, P.R., & Holdren, J.P. (1971). Impact of population growth. Science, 171, 1212-
1217.
Elliott, J. R., & Clement, M. T. (2015). Developing spatial inequalities in carbon
appropriation: A sociological analysis of changing local emissions across the United
States. Social Science Research, 51, 119-131.
Ewing, W. A. (March 01, 2004). Missing the forest for the trees: The environmental

60 arguments of immigration restrictionists miss the point. Immigration Policy Center,
American Immigration Council. Retrieved March 15, 2016 from
http://www.immigrationpolicy.org/special-reports/missing-forest-trees-
environmental-arguments-immigration-restrictionists.
Feldmeyer, B. (2009). Immigration and violence: The offsetting effects of immigration
on Latino violence. Social Science Research, 38, 717–731.
Garling, S. (1998). Immigration policy and the environment: The Washington DC
metropolitan area. Population and Environment, 20(1), 23–54.
Grabich, S. C., Horney, J., Konrad, C., & Lobdell, D. T. (2015). Measuring the storm:
Methods of quantifying hurricane exposure with pregnancy outcomes. Natural
Hazards Review, 17(1), 06015002.
Hall, C. A., Pontius, Jr, R. G., Coleman, L., & Ko, J. Y. (1994). The environmental
consequences of having a baby in the United States. Population and Environment,
15, 505-524.
Havard, S., Deguen, S., Zmirou-Navier, D., Schillinger, C., & Bard, D. (2009). Traffic-
related air pollution and socioeconomic status: A spatial autocorrelation study to
assess environmental equity on a small-area scale. Epidemiology, 20(2), 223-230.
Hero, R. E., and R. R. Preuhs (2007). “Immigration and the Evolving American Welfare
State: Examining Policies in the U.S. States.” American Journal of Political Science,
51(3), 498-517.
Hultgren, J. (2014). The “nature” of American immigration restrictionism. New Political
Science, 36, 52-75.
Hunter, L. M. (2000). A comparison of the environmental attitudes, concern, and

61 behaviors of native-born and foreign-born US residents. Population and
Environment, 21, 565-580.
Jian, Y., Messer, L. C., Jagai, J. S., Rappazzo, K. M., Gray, C. L., Grabich, S. C., &
Lobdell, D. T. (2017). Associations between environmental quality and mortality in
the contiguous United States, 2000–2005. Environmental Health Perspectives,
125(3), 355.
Jian, Y., Wu, C. Y., & Gohlke, J. M. (2017). Effect modification by environmental
quality on the association between heatwaves and mortality in Alabama, United
States. International Journal of Environmental Research and Public Health, 14(10),
1143.
Kandel, W., & Parrado, E. A. (2005). Restructuring of the US meat processing industry
and new Hispanic migrant destinations. Population and Development Review, 31,
447-471.
Kovel, J. (2002). The Enemy of Nature: The End of Capitalism or the End of the World?
New York: Zed Books.
Kraly, E. P. (1998). Immigration and environment: A framework for establishing a
possible relationship. Population Research and Policy Review, 17, 421–437.
Krikorian, M. (2008). The New Case Against Immigration: Both Legal and Illegal. New
York, NY: Penguin.
Kritz, Mary M., & Douglas T. Gurak. (2015). U.S. Immigrants in dispersed and
traditional settlements: National origin heterogeneity. International Migration
Review, 49(1), 106-141.
Lankao, P. R., Tribbia, J. L., & Nychka, D. (2009). Testing theories to explore the drivers

62 of cities' atmospheric emissions. AMBIO: A Journal of the Human Environment,
38(4), 236-244.
Laureti, T., Montero, J. M., & Fernández-Avilés, G. (2014). A local scale analysis on
influencing factors of NOx emissions: Evidence from the community of Madrid,
Spain. Energy Policy, 74, 557-568.
Lavery, A. M., Waldman, A. T., Casper, T. C., Roalstad, S., Candee, M., Rose, J.,
Belman, A., Weinstock-Guttman, B., Aaen, G., Tillema, J.M., & Rodriguez, M.
(2017). Examining the contributions of environmental quality to pediatric multiple
sclerosis. Multiple Sclerosis and Related Disorders, 18, 164-169.
Lee, M. T., & Martinez Jr, R. (2002). Social disorganization revisited: Mapping the
recent immigration and black homicide relationship in northern Miami. Sociological
Focus, 35(4), 363-380.
Lee, M. T., & Martinez, R. (2009). Immigration reduces crime: An emerging scholarly
consensus. In Immigration, Crime and Justice (pp. 3-16). Emerald Group Publishing
Limited.
LeSage, J. P., & Pace, R. K. (2014). The biggest myth in spatial econometrics.
Econometrics, 2(4), 217-249.
Light, I., & Gold, S. J. (2000). Ethnic Economies. San Diego, CA: Academic Press.
Ma, G. & Hofmann, E.T. (n.d.). Population, immigration, and air quality in the U.S.: A
spatial panel study. Unpublished Manuscript.
Malthus, T. R. (1986) [1798]. An essay on the principle of population: The first edition
(1798) with Introduction and bibliography. In Wrigley, E.A. & D. Souden (Eds.),
The Works of Thomas Robert Malthus, Volume I. London: W. Pickering.

63 Martinez, R., Jr. (2002). Latino Homicide: Immigration, Violence, and Community. New
York: Routledge.
Massey, D. S. & Capoferro, C. (2008). The geographic diversification of American
immigration. In D. S. Massey (Ed.), New Faces in New Places: The Changing
Geography of American Immigration. New York: Russell Sage Foundation.
McCarty, J., & Kaza, N. (2015). Urban form and air quality in the United States.
Landscape and Urban Planning, 139, 168-179.
Muradian, R. (2006). Immigration and the environment: Underlying values and scope of
analysis. Ecological Economics, 59, 208–213.
Neumayer, E. (2006). The environment: One more reason to keep immigrants out?
Ecological Economics, 59, 204–207.
Ousey, G. C., & Kubrin, C. E. (2009). Exploring the connection between immigration
and violent crime rates in US cities, 1980–2000. Social Problems, 56(3), 447-473.
Park, L. S. H., & Pellow, D. N. (2011). The Slums of Aspen: Immigrants vs. the
Environment in America’s Eden. New York: New York University Press.
Pfeffer, M. J., & Stycos, M. J. (2002). Immigrant environmental behaviors in New York
City. Social Science Quarterly, 83, 64–68.
Population-Environment Balance, Inc. (1992). Why excess immigration damages the
environment. Population and Environment, 13, 303-312.
Portes, A., & Rumbaut, R. G. (2006). Immigrant America: A portrait. Berkeley:
University of California Press.
Preston, S. H. (1996). The effect of population growth on environmental quality.
Population Research and Policy Review, 15, 95–108.

64 Price, C. E., & Feldmeyer, B. (2012). The environmental impact of immigration: An
analysis of the effects of immigrant concentration on air pollution levels. Population
Research Policy Review, 31, 119-140.
Rudel, T. K., Roberts, J. T., & Carmin, J. (2011). Political economy of the environment.
Annual Review of Sociology, 37, 221-238.
Saito, H., & Wu, J. (2016). Agglomeration, congestion, and US regional disparities in
employment growth. Journal of Regional Science, 56(1), 53-71.
Schnaiberg, A. (1980). The Environment: From Surplus to Scarcity. Oxford, United
Kingdom: Oxford University Press.
Schnapp, P. (2015). Identifying the effect of immigration on homicide rates in US cities:
An instrumental variables approach. Homicide Studies, 19(2), 103-122.
Simcox, D. E. (1992). Sustainable immigration: Learning to say no. In L. Grant (Eds.),
Elephants in the Volkswagen: Facing the Tough Questions about Our Overcrowded
Country (pp. 166–177). New York: W.H. Freeman & Company.
Speth, J. G. (2008). The Bridge at the Edge of the World: Capitalism, the Environment,
and Crossing from Crisis to Sustainability. New Haven, CT: Yale University Press.
Squalli, J. (2009). Immigration and environmental emissions: A U.S. county-level
analysis. Population and Environment, 30, 247-260.
Squalli, J. (2010). An empirical assessment of U.S. state-level immigration and
environmental emissions. Ecological Economics, 69, 1170-1175.
Steffensmeier, D., & Demuth, S. (2001). Ethnicity and judges’ sentencing decisions:
Hispanic- black–white comparisons. Criminology, 39(1), 145–178.
Stowell, J. I. (2007). Immigration and Crime: The Effects of Immigration on Criminal

65 Behavior. New York: LFB Scholarly Publishing.
Sydes, M. (2017). Revitalized or disorganized? Unpacking the immigration-crime link in
a multiethnic setting. Journal of Research in Crime and Delinquency, 54(5),680-714.
Takahashi, B., Duan, R. & Van Witsen, A. (2017). Hispanics’ behavioral intentions
toward energy conservation: The role of sociodemographic, informational, and
attitudinal variables. Social Science Quarterly. DOI:10.1111/ssqu.12395
Tobler, W. R. 1970. A computer movie simulating urban growth in the Detroit
region. Economic Geography, 46, 234–240.
Warner, Barbara D. (1999). Whither poverty? Social disorganization theory in an era of
urban transformation. Sociological Focus, 32, 99-113.
Zuckerman, B. (1999). The Sierra Club immigration debate: National implications.
Population and Environment, 20(1), 401–412.
UN (United Nations). (2017). International migration report 2017. Retrieved May 2, 2018
from http://www.un.org/en/development/desa/population/migration/publications
/migrationreport/docs/MigrationReport2017.pdf
U.S. EPA (U.S. Environmental Protection Agency, Office of Research and
Development). 2014a. Environmental quality index overview report. Retrieved May
22, 2017 from https://edg.epa.gov/data/PUBLIC/ORD/NHEERL/EQI
/EQI%20Overview%20Report__Final.pdf. (5.22. 2016).
U.S. EPA (U.S. Environmental Protection Agency, Office of Research and
Development). 2014b. Creating an overall environmental quality index: Technical
report. Retrieved May 22, 2017 from https://edg.epa.gov/data/PUBLIC/ORD
/NHEERL/EQI/EQI%20Overview%20Report__Final.pdf.zip.
66
CHAPTER III
POPULATION, IMMIGRATION, AND AIR QUALITY IN THE USA: A SPATIAL
PANEL STUDY*
Population growth has been pinpointed as the cause of environmental problems
since Malthus (1798) drew the connection, and the issue has been debated ever since. In
the USA, research on population and air quality (one of the most common measures of
environmental harm) generally finds that both population growth and population size are
associated with some sources of emissions, but not with other examined emissions
(Preston 1996; Cramer 1998; Cramer and Cheney 2000; Cramer 2002; Cole and
Neumayer 2004; Lankao et al. 2009; Squalli 2009, 2010; Price and Feldmeyer 2012;
Laureti et al. 2014). The question of how immigration specifically contributes to
environmental degradation is a source of particular debate. As the recipient of more
immigrants than any other country, the USA has long been divided on immigration
issues. Opposition to immigration comes in many forms, but opposition on environmental
grounds is particularly interesting because of its ability to unite opposing forces in the
American political spectrum (Park and Pellow 2011; Hultgren 2014). Both anti-
immigrant and environmental activists in the USA have made the case that immigration
harms the environment (Garling 1998; Chapman 2006; Cafaro 2015). Based on the
* Reprinted by permission from Springer Nature, Population and Environment, Ma, Guizhen and Erin Trouth Hofmann, Population, Immigration, and Air Quality in the U.S.: A Spatial Panel Study, 40(3), 283-302, Copyright (2019). https://doi.org/10.1007/s11111-018-0311-9. I am grateful to my advisor and co-author, Dr. Erin Trouth Hofmann, for her funding and guidance in the preparation and finalization of this paper. Funding: This study was funded by Utah Agricultural Experiment Station (grant number UTA01269).

67 Malthusian population pressure perspective, they argue that immigrants are necessarily
responsible for a substantial share of local environmental problems, because they are the
major source of population growth in the USA.
However, this argument has been criticized for scapegoating immigrants and
failing to grapple with the root causes of either immigration or environmental destruction
(Muradian 2006; Neumayer 2006; Angus and Butler 2011; Hultgren 2014) and for
drawing inference about the causal effect of immigration on environment without direct
measurement (Kraly 1995, 1998). In fact, research on environmental attitudes and
behaviors among US immigrants indicates that, compared to natives, immigrants
consume less and produce less waste (Hunter 2000; Atiles and Bohon 2003; Bohon et al.
2008; Blumenberg and Shiki 2008; Chatman and Klein 2009). Moreover, a handful of
empirical studies show that the size of the immigrant population does not have the
negative association with air quality that the native population does and is even
associated with lower levels of some pollutants (Cramer 1998; Squalli 2009, 2010; Price
and Feldmeyer 2012; Ma and Hofmann 2019).
We extend the existing literature by analyzing the relationship between air quality
and population across 1070 US counties from 2007 to 2014, accounting for spatial
autocorrelation of the data. To our knowledge, the present study is the first spatial
analysis of panel data on the relationship between air quality and immigrant population.
Spatial analysis can reduce estimation bias caused by spatial effects. Although spatial
analysis has not yet been commonly used in studies of population or air quality,
researchers have applied spatial methods to inequality and carbon emissions (Elliott and
Clement 2015), the demographic dimension of carbon emissions (Roberts 2014), the

68 effect of urban form on air quality (McCarty and Kaza 2015), and the consequences of
population change on land development (Clement and York 2017).
Theoretical framework
We build our research on theories of and empirical studies on environmental
consequences of population pressure and immigration. We focus especially on studies
that measure environmental degradation by using measures of air quality, which are
widely used in the USA and elsewhere because of the availability of data.
Environmental consequences of population pressure
Population pressure affects the environment through consumption and production,
but theorists debate both the magnitude and the root causes of environmental
consequences.
The Malthusian and human ecology perspectives stress the pressure of population
growth on the environment. These theories are based on the concepts of finite resources,
or carrying capacity, and argue that population growth has important negative effects on
environmental quality (Malthus 1798; Duncan 1961, 1964; Ehrlich and Holdren 1971;
Harrison 1993; Dietz and Rosa 1994). Empirical studies have provided evidence that
population pressure influences air quality, but they are not in agreement on the details of
the relationship. Cross-national studies find population size is significantly associated
with some pollutant emissions, such as SO2, CO, and NOX (Preston 1996; Cole and
Neumayer 2004; Lankao et al. 2009). At the local level, more pollutants are examined.
Larger populations are generally related to higher levels of some pollutant emissions but
unrelated to others (Cramer 1998; Cramer and Cheney 2000; Cramer 2002; Squalli 2009,

69 2010; Price and Feldmeyer 2012), although Price and Feldmeyer (2012) also find that
population growth was associated with lower levels of SO2 in 183 US Metropolitan
Statistical Areas (MSAs). Laureti et al. (2014) show that a 1% increase in population
yields a 0.24% increase in NOx, a significant but relatively weak relationship.
Although these studies provide evidence that population pressure is related to
environmental problems, they also indicate that other factors, such as economic
development, consumption, technology, and urbanization, also play important roles.
Preston (1996) asserts that population growth constitutes only a minor influence on
environmental hazards, while affluence and technology are much more responsible for
environmental damage. Commoner (1972a, 1972b) argues that technology, instead of
population pressure, is primarily responsible for environmental degradation.
Indeed, the claim that population pressure is the cause of environmental
degradation is widely critiqued. The political economy perspective views the global
political and economic system as the root cause of environmental degradation
(Schnaiberg 1980; Roberts and Parks 2007; Foster et al. 2011; Ciplet et al. 2015).
Developed countries are “the principal culprits” for consuming disproportionately more
natural resources (Ehrlich and Holdren 1971: 1214). In a hierarchical world system,
environmental burdens are transferred from the core nations to subordinate semi-
peripheral or peripheral nations through trade (Weber and Matthews 2007; Pan et al.
2008; Stretesky and Lynch 2009; Sato 2014; Hoekstra et al. 2016). This ecologically
unequal exchange eases population pressure in developed countries and causes
environmental degradation in developing countries (Bunker 1984; Rothman 1998; Rice
2007; Jorgenson and Clark 2009; Prell and Feng 2016).

70
Environmental consequences of immigration
The relationship between immigration and the environment is of special concern
in both academic and public debates because environmental concerns can justify
restrictions on immigration. Normandin and Valles (2015) contend that environmentalism
and population control activism are the major forces of the US anti-immigration
movement. Immigrants have been blamed for causing environmental harm to the USA
due to the population pressure they put on local areas (Beck 1996; Garling 1998;
Chapman 2006; Cafaro 2015). Immigration not only adds more people to the USA
directly but also accelerates population growth due to higher birth rates of immigrants
(Pew Research Center 2015). The added population from immigration consumes goods
and produces waste, and immigrants consume and waste more after adopting American
super-consuming habits (Ehrlich and Ehrlich 1991; Hunter 2000). However, the fierce
arguments that immigration causes environmental degradation in the USA have never
been substantiated by empirical evidence.
Contrary to the expectation that immigrants adopt the excessive materialism of
American life quickly after immigration, immigrants are critical of American consumerist
values and concerned about environmental consequences of these norms (Carter et al.
2013). In comparison with US-born people, immigrants are more likely to have lifestyles
less harmful to the environment because they are less likely to afford luxury items, big
houses, and technologies that create more environmental stress (Atiles and Bohon 2003;
Price and Feldmeyer 2012) and more likely to carpool or ride public transportation
(Bohon et al. 2008; Blumenberg and Shiki 2008; Chatman and Klein 2009). In addition,
immigrants are more likely to engage in energy-saving behaviors as compared to the US-

71 born population (Hunter 2000; Pfeffer and Stycos 2002; Takahashi et al. 2018). Although
immigrants contribute to population growth, they also have less harmful environmental
values and behaviors than their US-born counterparts.
To date, only a few studies examine specifically the environmental consequences
of immigration, all focusing on air pollution in the USA (Cramer 1998; Squalli 2009,
2010; Price and Feldmeyer 2012; Ma and Hofmann 2019). Cramer (1998) tests the
impact of different specifications of population on air quality measured by ROG, NOx,
SOx, CO, and PM10 in California. Squalli (2009) analyzes the immigration–environment
association across approximately 200 US counties in 2000 by using four air pollutants as
indicators of air quality: CO, NO2, PM10, and SO2. Squalli (2010) examines the same four
pollutants across all US states. Price and Feldmeyer (2012) investigate the environmental
impact of immigration by adding PM2.5 and O3 to the above four air pollutants and
creating an index for 183 MSAs in the USA. These studies examine various population
specifications. Squalli (2009, 2010) examines two population specifications, one is US-
and foreign-born populations, and another is total population and percent of foreign-born.
Cramer (1998) tests five population specifications, one of which is the ratio of
immigrants in 1990 to the total population in 1980 and the ratio of non-immigrants in
1990 to the total population in 1980. Price and Feldmeyer (2012) use total population and
percent of immigrants.
Despite using different measures of air quality, units of analysis, and study
scopes, these studies generally reach similar conclusions that are contrary to the
population pressure position. Neither the overall size of the immigrant population nor the
growth of the immigrant population was associated with higher levels of local air

72 pollution. In some studies, larger or growing immigrant populations were even associated
with lower levels of some emissions (Cramer 1998; Squalli 2010; Price and Feldmeyer
2012) and better values on the air quality index (Ma and Hofmann 2019). Although
Squalli (2009) indicates immigrant population size was positively associated with CO
emission, he also finds a negative association of immigrant population with SO2 and no
association with two other pollutants examined at the US county level. In contrast, a
larger US-born population was more likely to be related to higher levels of more
pollutants than was a larger immigrant population and never negatively associated with
any emissions examined (Cramer 1998; Squalli 2009). Overall, these empirical studies
provide evidence that immigrant population is not associated with most air pollutants but
is sometimes associated with better air quality, whereas US-born population is more
likely to be related to air pollution.
These theories and empirical studies lay the groundwork for the relationship
between air quality and immigration. However, most of the research relies on limited,
geographically dispersed samples, which do not, or cannot, take into consideration spatial
autocorrelation of air quality. Air quality in spatial proximity tends to be correlated
(Havard et al. 2009; McCarty and Kaza 2015; Chen et al. 2017). Without accounting for
spatial dependence, least-squares estimates will be biased and inconsistent (Anselin 1988;
Elhorst 2001; LeSage and Pace 2009). In addition, existing research relies primarily on
cross-sectional data. Analysis of cross-sectional data is limited in its ability to establish
temporal order and address omitted variable bias. From previous studies, it remains
unclear whether immigration influences air quality or air quality drives migration
patterns. Additionally, it remains possible that the observed association between
73 immigrant population and air quality is explained by unmeasured characteristics of the
county, state, or MSA. In contrast, a panel study provides advantages over cross-sectional
studies in exploring causality among variables because it is able to establish temporal
order, reduce spuriousness, and correct measurement errors (Finkel 1995). Therefore, we
employ a spatial panel model to assess the association between air quality and two
different specifications of population.
Data
Dependent variable
As our measure of air pollution, we use the Air Quality Index (AQI) provided by
the U.S. Environmental Protection Agency (EPA). AQI is a composite index reflecting
overall air quality. It incorporates into a single index the concentration of six pollutants:
O3, PM10, PM2.5, CO, SO2, and NO2. The index is normalized across pollutants so that an
AQI value represents the level of potential health harm associated with the health-based
standard for each pollutant. The values of AQI range from 0 to 500, with smaller
numbers indicating better air quality. AQI values from 0 to 50 indicate good air
conditions; values from 51 to 100 indicate moderate air conditions; values from 101 to
150 are considered unhealthy for sensitive groups; 151–200 are unhealthy for all; 201–
300 are very unhealthy; and 301–500 are hazardous.
EPA provides only median AQI values for counties, which is the dependent
variable in this study. We limit our data to the 2007–2014 period due to the large number
of missing AQI, particularly before 2000, and the availability of independent variables.
The values of median AQI in the data range from 0 to 108, with 90% of observations
having median AQI values of no more than 50. To maintain as large a sample size as

74 possible and simultaneously restrict the fraction of missingness, we include counties that
report AQI for at least 4 years in the study period, which yields a sample of 1070 counties
in the contiguous USA (see Fig. 1).
Fig. 1 The sample of counties with AQI data (shaded)
AQI is not fully comparable across counties, because not all counties measure all
six pollutants on all days. Ozone, for example, is measured in most counties only during
the warm months of the year.1 States and counties typically monitor air pollutants that
are perceived as problematic in a particular area at a particular season. In addition, the
location of monitoring stations may mean that AQI does not accurately describe the air
quality in the county as a whole. Nevertheless, AQI values are widely used to determine
things such as whether schoolchildren are allowed to play outdoors, and as such, daily
75 AQI values have a meaningful effect on the quality of life of local residents. Following
the example of previous literature (Lee et al. 2009; Laumbach 2010; Lee et al. 2012;
McCarty and Kaza 2015; Qiu and Kaza 2017), we treat AQI as comparable across
counties despite these limitations.
Using AQI to operationalize air pollution is appealing because of its availability
in a standardized format for a large number of counties and years. To our knowledge,
AQI is the only available panel data of air quality at county level for a large subset of US
counties. Although prior studies use individual pollutants and/or create an index based on
the pollutants, thereby overcoming some of the limitations of the AQI, doing so forces
the use of a much smaller sample. These smaller samples are less representative of the
USA as a whole and too geographically dispersed to make spatial analysis feasible.
Instead, we take advantage of the geographic scope of AQI for spatial analysis which has
not yet been conducted with regard to this topic.
Independent variables
As the key independent variable, we employ two different population
specifications. The first specification is the total county population and the percent of that
population that is foreign-born at the county level, and the second is the total US- and
foreign-born populations. To obtain annual data covering as many counties as possible,
we extract population data from the U.S. Census Bureau’s American Community Survey
(ACS) 5-year estimates which are available for all US counties from 2005–2009 to 2012–
2016. We assign these 5-year estimates to their middle years, following the suggestion of
the National Research Council (2007: 212) on using ACS 5-year estimates. And thus, our
dataset covers 8 years from 2007 to 2014.

76
All other independent variables are also from ACS 5-year estimates. In addition to
population, technology and affluence are two other major factors in the literature
examining the relationship between population and environment (Dietz and Rosa 1997;
Cramer 2002; Shi 2003; York et al. 2003; Cole and Neumayer 2004; Cramer 1998;
Squalli 2009, 2010). Technology represents the effects of specific types of economic
activity. We use the total number of persons employed in three major industries that
produce emissions: agriculture, manufacturing, and utilities, transportation, and
warehousing.
Table 1 Description statistics of the 1070 counties across the contiguous U.S.
Variable Mean Std. Dev. Min Max
AQI 39 12 0 108
Total population 235,876 511,192 552 1.01e+07
% Foreign-born population 6.46 6.86 0 52.23
US-born population 201,003 377,693 549 6,582,850
Foreign-born population 34,873 148,897 0 3,485,724
Per capita income 25,860 6,276 11,614 66,522
Employment in agriculture 1,516 3,432 0 72171
Employment in manufacturing 11,080 24,592 0 533,779
Employment in utilities, transportation & warehousing
5,467 12,996 3 256,614
Average Commute Time (in min) 24.3 7.9 7 142
Although studies on the relationship between population and emissions at the
national level use average gross domestic product to measure affluence (Dietz and Rosa
1997; Shi 2003; York et al. 2003; Cole and Neumayer 2004), per capita income is a

77 common indicator of affluence at the state or county level (Cramer 1998; Cramer 2002;
Squalli 2009, 2010). We tested per capita income, average family income, and household
income in our models and found that both model selection criteria of Akaike’s
information criterion (AIC) and Bayesian information criterion (BIC) direct us to use per
capita income.
Drawing on Price and Feldmeyer’s (2012) study, we take into account of traffic
emissions by incorporating the county average of commuting time into our explanatory
variables. Table 1 shows the summary statistics for all the variables included in this
study.
Spatial autocorrelation of the data
Spatial dependence of air quality has been well documented in the literature.
Independent variables, such as population and commute time, may be spatially related as
well. Moran’s I statistic measures the degree of linear association between an attribute at
a given location and the weighted average of the attribute at its neighboring locations
(Anselin 1988). Global Moran’s I describes spatial autocorrelation of the data, by
assigning weights to spatial units to represent their different influences. The values of
Moran’s I usually range from − 1 to + 1, with 0 indicating no autocorrelation.
We calculate Moran’s I statistics for all the variables with both inverse distance
and contiguity weights matrices. Table 2 displays global Moran’s I test statistics with
inverse distance weights matrix on all the variables in 2007, 2010, and 2014. The values
of Moran’s I are all positive and significant at p < 0.0000. Counties cluster with those
have similar high or low values on population, income, commute, and employment in
agriculture, manufacturing, and utilities, transportation, and warehousing, though the

78 levels of spatial autocorrelation vary. This was true regardless of what weights matrix we
used. The Moran’s I statistics indicate that air quality in one county depends on not only
air quality but also other factors in neighboring counties.
Table 2 Global Moran’s I test statistics on all the variables for the sample in three selected years
2007 2010 2014
AQI 0.223 0.164 0.131
Total population 0.197 0.194 0.191
% Foreign-born population 0.706 0.717 0.734
US-born population 0.188 0.181 0.175
Foreign-born population 0.207 0.214 0.221
Per capita income 0.619 0.646 0.600
Employment in agriculture 0.149 0.149 0.136
Employment in manufacturing 0.143 0.141 0.140
Employment in utilities, transportation & warehousing
0.204 0.232 0.190
Average commute time (min) 0.155 0.581 0.596
Note: weights matrices are inverse distance-based. p = 0.000.
Method
AQI and all the explanatory variables in this study display spatial autocorrelation,
which violates the assumption of ordinary least-squares regression that observations be
independent. To address spatial autocorrelation of the data, we employ spatial panel
models to assess the relationship between air quality and population.
Multiple Imputation of Missing Data
The spatial panel models that we use require balanced panel data, which our
samples do not have due to missingness. Multiple imputation (MI) is applied to handle

79 missingness (Enders 2010; Allison 2012a). MI does not predict a single value for each
missing value as does conventional imputation. Instead, it replaces missingness with
multiple sets of simulated values and adjusts estimates for uncertainty of missing data
(Rubin 1996).
We impute missing values on AQI, per capita income, and commute time in the
samples by using a Multiple Imputation by Chained Equations (MICE) procedure, which
does not assume multivariate normality. MICE imputes multiple variables by using a
sequence of univariate imputation methods with fully conditional specification of
prediction equations (van Buuren et al. 1999). As recommended by Graham et al. (2007),
Bodner (2008), White et al. (2011), and Allison (2012b), the number of imputations for
accuracy should be similar to the percentage of missing data. Because the missingness of
the sample is 4.25%, we generate 10 imputations of missing values.
Fixed Effects Specification
There are potentially many features of a county relevant to local air quality,
including the nature of the local economy, urban versus rural status, topography, and
climate. Counties that host large numbers of tourists may experience disproportionately
high emissions from cars. Basins trap pollution while mountains stop the spread of smog.
Accounting for all these potential covariates is impossible given available data. A fixed
effects model accounts for time-invariant county-level characteristics and thereby allows
us to focus on change within counties over time and avoids the omitted regressor bias that
random effects model may have (Elhorst 2012).

80
Spatial Weights Matrix
The extent to which spatial units influence each other depends on their spatial
locations relative to others. A spatial weights matrix defines the spatial structure of
relationships between spatial units and identifies which locations are important in driving
the spatial correlation (Anselin 1988). In panel models, spatial relationships are treated as
time-invariant.
In a spatial weights matrix W, the element wij (i, j = 1, …, n) reflects the spatial
influence of unit j on unit i, while wii always equals zero. Distance-based spatial weights
matrix measures the centroid distance dij between each pair of spatial units i and j. We
construct an inverse distance weights matrix, where wij = 1/dij, based on the law of
distance decay, which indicates that the effects of counties diminish over distance. A
contiguity weights matrix indicates spatial relationships between counties sharing a
boundary. wij is 1 if points i and j are neighbors, and is 0 otherwise. In our dataset, the
queen contiguity weights matrix has 84 islands, which means 84 counties have no
neighboring counties that share even a vertex with them. It is unclear how these counties
interact with others in terms of air quality. A distance-based weights matrix is more
appropriate than a contiguity weights matrix for our data because air quality is more
likely to correlate within a certain distance rather than within the boundary of specific
administrative units. However, we test both inverse distance weights matrix and queen
contiguity weights matrix for analysis of spatial models.
Spatial Panel Models
Spatial dependence is primarily explained by three interaction effects:
endogenous interaction effects, exogenous interaction effects, and interaction effects

81 among the error terms (Elhorst 2014). Endogenous interaction effects refer to a spatial
interaction process where the dependent variable of a spatial unit depends on the
dependent variable of other units. Exogenous interaction effects represent the effects of
independent variables of neighboring units on the dependent variable of a given unit.
Interaction effects among the error terms capture spatial autocorrelation of omitted
variables.
Table 2 shows both endogenous and exogenous interaction effects of the data.
Significant spatial autocorrelation of air quality indicates that air quality in a given
county depends on air quality in other counties. Spatial autocorrelation of independent
variables implies that characteristics of counties, such as population and commute time,
would influence both local air quality and that in neighboring counties. A Spatial Durbin
Model (SDM) can account for spatial autocorrelation in both dependent and independent
variables, and is the best starting spatial model because it generalizes both spatial lag
model and spatial error model (LeSage and Pace 2009; Elhorst 2014).
The SDM panel model is expressed as
yt = ρWyt + Xtβ + WZtθ + μ + εt (1)
where yt is the N-dimensional vector of dependent variables in period t; W is the spatial
weights matrix capturing the interaction between the N spatial units; Wyt reflects the
endogenous interaction effects among the dependent variable, or the spatial lag of
dependent variable; ρ denotes the spatial autoregressive coefficient that represents the
effect of Wyt; Xt is an N×K matrix of K independent variables; Xtβ denotes the effects
of independent variables on the dependent variable in the same unit; θ denotes a K×1
vector that reflects the effects of averaged characteristics of neighboring units; and WZt

82 is the exogenous interaction effects among the independent variables that represent the
average effects of the independent variables in neighboring spatial units. The SDM
examines air quality at the U.S. county level by accounting for population, income,
commute time, and employment in agriculture, manufacturing, and utilities,
transportation, and warehousing in the same county, air quality and the explanatory
variables in neighboring counties, and other unobserved characteristics.
While SDM combines both endogenous and exogenous interaction effects, Spatial
Autocorrelation Model (SAC) or Spatial Autoregressive Model with Autoregressive
Disturbances (SARAR) takes into consideration both endogenous interaction effect and
interaction effects among the error terms (LeSage and Pace 2009; Elhorst 2014). We
estimate SAC model since determinants of air quality omitted from the model may be
spatially autocorrelated as well.
The SAC panel model takes the form
yt = ρWyt + Xtβ + μ + 𝜐𝜐t (2)
𝜐𝜐t = 𝜆𝜆M𝜐𝜐t + εt (3)
where 𝜐𝜐t denotes n × 1 vector of regression disturbances; 𝜆𝜆 is spatial autocorrelation
coefficient; M is a spatial weights matrix; M𝜐𝜐t denotes the interaction effects among the
disturbance term of the counties.
Results
For the purposes of comparison, we begin with nonspatial fixed effects panel
models shown in Table 3. The fixed effects panel models reveal how changes within
individual counties across time affect their air quality. The specification of population

83 does not turn out to matter much for the results. In the first specification, total population
is negatively associated with AQI, i.e., a larger population size is associated with better
air quality. While the percent of foreign-born population shows negative association with
AQI, it is not significant. In the second specification, both US- and foreign-born
population sizes are negatively associated with AQI. In both model specifications, higher
income is also significantly associated with better air quality. On the other hand, greater
employment in agriculture and manufacturing and more commute time contribute to air
pollution.
Table 3 Fixed effects linear regression models
AQI
b/se b/se
Total population (100,000s) -3.278***
(0.533) % Foreign-born population -0.218
(0.119) US-born population (100,000s) -2.438**
(0.743)
Foreign-born population (100,000s) -6.060***
(1.552)
Per capita income (10,000s) -5.407***
(0.505) -5.236***
(0.519) Employment in agriculture (10,000s) 3.613*
(1.533) 3.519*
(1.532) Employment in manufacturing (10,000s) 1.513**
(0.520) 1.470**
(0.520) Employment in Utilities, Transportation & Warehousing (10,000s)
2.193 (1.205)
2.327 (1.198)
Average commute time (hours) 5.393***
(0.768) 5.292***
(0.768) Constant 54.164***
(1.787) 55.919***
(1.730) N 8,196 8,196
* p < 0.05, ** p < 0.01, *** p < 0.001

84 To address spatial autocorrelation of the data, we move to spatial models. Spatial
dependence is often represented by separating direct and indirect effects. For the purpose
of this study, however, we focus on the overall population–environment association
instead of separating direct and spillover effects. Tables 4 and 5 present spatial Durbin
and spatial autocorrelation models with both inverse distance and contiguity weights
matrices, respectively. The spatial autocorrelation coefficients, ρ and λ, are highly
significant in all the models, indicating spatial autocorrelation of air quality across the
counties and the effects of omitted county factors. Air quality in a given county is likely
to be affected by air quality and other factors in neighboring counties, independent of the
impact of income, employment, and commute time. This affirms that a spatial model is
more appropriate than a nonspatial model. The coefficients in the spatial models are
generally smaller in magnitude than those of the nonspatial models, which indicates an
upward bias in least-squares estimates as opposed to spatial estimates (LeSage and Pace
2009). Moreover, fewer coefficients are statistically significant in the spatial models, in
contrast to the nonspatial models in which most of the coefficients are significant.
The spatial models yield some consistent results on the population–environment
association, despite using different weights matrices and different specifications of
population. First, total population is significantly associated with better air quality across
all the models. An increase of 100,000 persons in total population in a reference county
would reduce local median AQI by approximately 1.6–2.6 points in the same county.
Second, when breaking down the total population, US-born population is significantly
associated with better air quality while the similar impact of foreign-born population is
significant only in the SDM with a contiguity weights matrix. The weaker association

85 Table 4 Fixed effects Spatial Durbin models
Inverse Distance Matrix
Contiguity Matrix
Inverse Distance Matrix
Contiguity Matrix
Total population (100,000s) -1.606**
(0.504) -2.416***
(0.562)
% Foreign-born population 0.216 (0.127)
-0.165 (0.132)
US-born population (100,000s) -1.417*
(0.696) -1.859*
(0.744) Foreign-born population (100,000s) -2.187
(1.477) -4.457**
(1.658) Per capita income (10,000s) 0.720
(0.680) -3.770***
(0.627) 0.725
(0.690) -3.845***
(0.640) Employment in agriculture (10,000s) -1.099
(1.396) 2.303
(1.526) -0.930 (1.397)
2.365 (1.541)
Employment in manufacturing (10,000s)
0.321 (0.482)
0.861 (0.518)
0.409 (0.483)
0.859 (0.522)
Employment in utilities, transportation & warehousing (10,000s)
1.466 (1.082)
1.367 (1.164)
1.407 (1.087)
1.266 (1.171)
Average commute time (hours) 0.462 (0.729)
3.383***
(0.741) 0.523
(0.728) 3.331***
(0.743) W * Total population (100,000s) -15.310***
(3.466) -0.163 (1.884)
W * % Foreign-born population -0.066 (0.646)
1.516**
(0.487)
W * US-born population (100,000s) -23.117***
(4.493) -0.710 (2.576)
W * Foreign-born population (100,000s)
12.721 (10.575)
6.154 (5.351)
W * Per capita income (10,000s)
2.644 (1.813)
-2.236 (2.005)
1.952 (1.621)
-0.459 (1.928)
W * Employment in agriculture (10,000s)
83.881***
(14.581) 9.739
(5.149) 91.484***
(14.834) 8.057
(5.188) W * Employment in manufacturing (10,000s)
-7.687*
(3.744) 1.540
(1.865) 0.922
(4.471) 1.060
(1.873) W * Employment in utilities, transportation & warehousing (10,000s)
1.391 (6.607)
-2.312 (3.930)
-6.415 (7.204)
-3.199 (3.949)
W * Average commute time (hours) 7.049**
(2.455) 16.629***
(3.405) 4.191
(2.645) 16.227***
(3.388) Spatial rho 0.678***
(0.009) 0.680***
(0.033) 0.680***
(0.009) 0.680***
(0.033) * p < 0.05, ** p < 0.01, *** p < 0.001
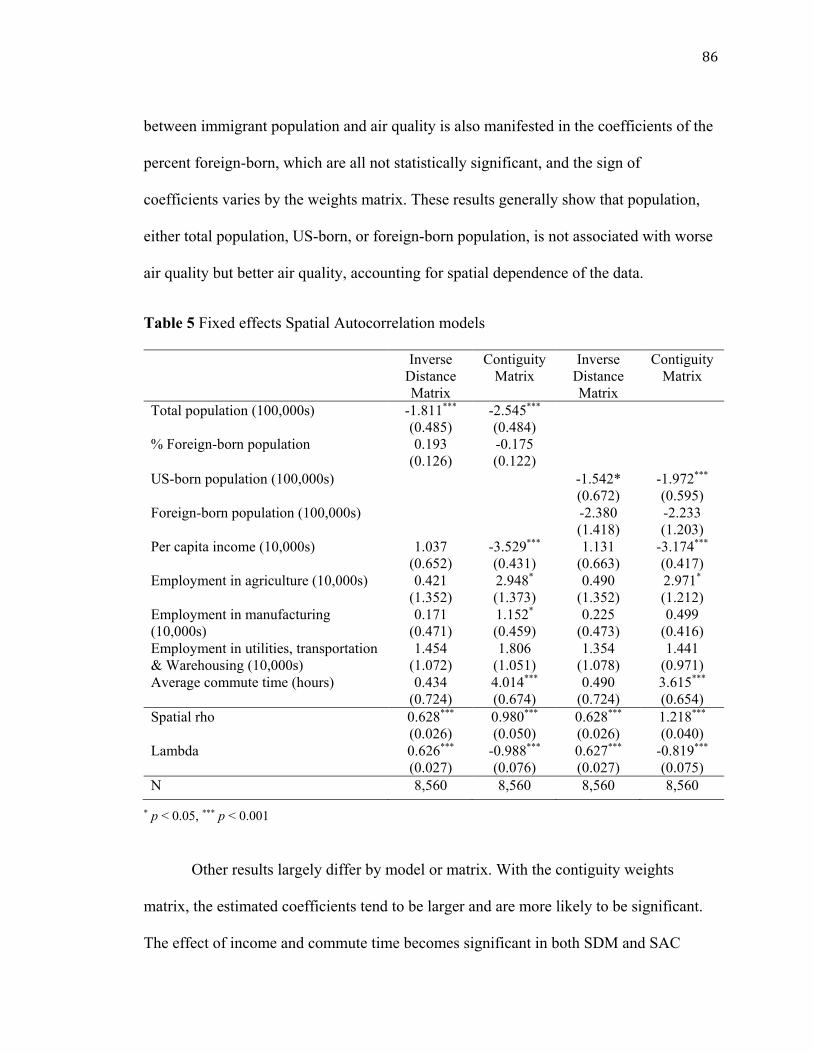
86 between immigrant population and air quality is also manifested in the coefficients of the
percent foreign-born, which are all not statistically significant, and the sign of
coefficients varies by the weights matrix. These results generally show that population,
either total population, US-born, or foreign-born population, is not associated with worse
air quality but better air quality, accounting for spatial dependence of the data.
Table 5 Fixed effects Spatial Autocorrelation models
Inverse Distance Matrix
Contiguity Matrix
Inverse Distance Matrix
Contiguity Matrix
Total population (100,000s) -1.811*** (0.485)
-2.545*** (0.484)
% Foreign-born population
0.193 (0.126)
-0.175 (0.122)
US-born population (100,000s) -1.542* (0.672)
-1.972*** (0.595)
Foreign-born population (100,000s) -2.380 (1.418)
-2.233 (1.203)
Per capita income (10,000s) 1.037 (0.652)
-3.529*** (0.431)
1.131 (0.663)
-3.174*** (0.417)
Employment in agriculture (10,000s) 0.421 (1.352)
2.948* (1.373)
0.490 (1.352)
2.971* (1.212)
Employment in manufacturing (10,000s)
0.171 (0.471)
1.152* (0.459)
0.225 (0.473)
0.499 (0.416)
Employment in utilities, transportation & Warehousing (10,000s)
1.454 (1.072)
1.806 (1.051)
1.354 (1.078)
1.441 (0.971)
Average commute time (hours) 0.434 (0.724)
4.014*** (0.674)
0.490 (0.724)
3.615*** (0.654)
Spatial rho 0.628*** (0.026)
0.980*** (0.050)
0.628*** (0.026)
1.218*** (0.040)
Lambda 0.626*** (0.027)
-0.988*** (0.076)
0.627*** (0.027)
-0.819*** (0.075)
N 8,560 8,560 8,560 8,560
* p < 0.05, *** p < 0.001
Other results largely differ by model or matrix. With the contiguity weights
matrix, the estimated coefficients tend to be larger and are more likely to be significant.
The effect of income and commute time becomes significant in both SDM and SAC

87 models with the contiguity weights matrix, but not with the inverse distance weights
matrix. Higher per capita income is associated with better air quality, while longer
commute time is associated with worse air quality. An increase of 10,000 dollars in per
capita income in a county would decrease AQI by 3.2–3.8 points, whereas an increase of
1 h in average commute would increase AQI by 3.3–4.0 points. In other words, the more
affluent counties are more likely to have better air quality, whereas the counties with
longer average commute time are more likely to have worse air quality. Larger numbers
of workers in agriculture and manufacturing are associated with worse air quality only in
the SAC models with contiguity weights matrix.
The spatially lagged variables in the SDMs (Table 4) show that air quality in a
given county is significantly affected by most of the variables in neighboring counties.
The spatially lagged coefficients in SDM are the only area in which population
specification begins to matter. Using the second population specification (US- and
foreign-born populations), the US-born population is negatively associated with AQI in
the model using the inverse distance weights matrix, which implies that a county’s air
quality benefits from a larger population in neighboring counties. In the same model,
increase in neighboring counties’ employment in agriculture contributes to worse air
quality in the reference county. Using the contiguity weights matrix, only neighboring
counties’ average commute times has a statistically significant association with AQI,
leading to worse air quality in the reference county.
Using the first population specification (total population and percent immigrant),
total population of neighboring counties is negatively associated with AQI in the model
using inverse distance weights, while percent immigrant has no significant association

88 with air quality. In this model, a larger scale of manufacturing in neighboring counties
makes air quality in the reference county better, while an increase in employment in
agriculture and longer commute time in neighboring counties result in worse air quality
in the reference county. Using the contiguity matrix, total population in neighboring
counties has no significant association with the air quality of the reference county, but
percent foreign-born is significantly associated with worse air quality in neighboring
counties. This is the only positive association between immigrants and AQI in any of our
models. The only other significant spatially lagged coefficient in the contiguity weights
models is commute time, which is associated with worse air quality in the reference
county.
In sum, accounting for spatial dependence of air quality, total population and US-
born population in the study counties are consistently associated with better air quality,
while foreign-born population is generally not associated with air quality. These results
hold across two spatial panel models with different weights matrices, as well as two
different specifications of population, and net of the effects of other established
technological and economic drivers of air pollution. The effects of neighboring counties’
US- and foreign-born populations, shown in the SDMs, are much less clear, with the
results being highly dependent on both the population specification and the type of
weights matrix used.
Conclusion
The relationship between population, particularly immigrant population, and the
environment is contentious both theoretically and empirically. On one hand, population is
linked to environmental degradation by the Malthusian perspective and quantitative

89 studies, though the strength of the relationship and the extent to which it holds across
different types of environmental harm is not clear. Both nativists and environmentalists
have used this to argue that immigration, as the major source of US population growth,
poses a unique set of harms to the environment. On the other hand, immigrants tend to
behave and consume in more environmentally friendly ways than do US natives, and a
handful of empirical studies show that the size of the US-born population has a negative
association with air quality, while the size of the immigrant population has a neutral or
positive association. On balance, empirical findings support the conclusion that
population growth due to immigration is less environmentally harmful than population
growth of the US-born population, a conclusion that has not ended the immigration–
environment debate, because immigration today of course means a larger US-born
population in the next generation.
Our findings call into question the consensus that immigration has a different
relationship with air quality than does growth of the US-born population. By using fixed
effects spatial panel analysis, we find that total population, US-born population, and
sometimes foreign-born population are significantly associated with better air quality
across 1070 counties in the contiguous USA. Previous studies find a positive relationship
between total population size and specific pollutants (Preston 1996; Cramer 1998;
Cramer and Cheney 2000; Cole and Neumayer 2004; Squalli 2009, 2010; Lankao et al.
2009; Price and Feldmeyer 2012; Laureti et al. 2014). Other studies find that US-born
population is more likely to be associated with worse air quality than foreign-born
population (Cramer 1998; Squalli 2009, 2010; Price and Feldmeyer 2012; Ma and
Hofmann 2019). In contrast, this study shows that within counties, increases in

90 population, whether US- or foreign-born, are associated with better overall air quality.
There are a number of possible reasons for the differences between our findings
and those of previous, similar studies. First, the use of spatial regression models tended to
shrink the magnitude and significance of our coefficients. It is unclear how much spatial
autocorrelation may have influenced the results of previous studies. For example, Price
and Feldmeyer (2012) used MSAs as their level of analysis, which means that some of
their spatial units were located near each other, but they were not actually contiguous.
More importantly, the use of fixed effects models, which are unique to our study, may
explain a great deal of the difference in results. Finally, the use of AQI is also unique to
our study, and our use of a composite measure of air quality may mask different
relationships between population and specific individual pollutants.
In accord with political economy theory, our findings imply that population
growth is not the primary cause of air pollution, at least in this sample. York and Rosa
(2012) argue that the number of households has greater effects on pollution than the size
of households, which means that developed nations, with smaller average household
sizes, contribute more to air pollution. With population less than the total of the 15
wealthy nations of the European Union, the USA consumed much more fossil fuels and
generated much more greenhouse gases than the total of these countries (Ewing 2004).
Ecologically unequal exchange shifts environmental burdens from core to semi-
peripheral and peripheral nations (Bunker 1984; Rothman 1998; Roberts and Parks 2007;
Rice 2007; Jorgenson and Clark 2009). Environmental costs of population in developed
countries are transferred to developing countries through trade (Weber and Matthews
2007; Pan et al. 2008; Stretesky and Lynch 2009; Sato 2014; Hoekstra et al. 2016).

91 Consequently, population pressure on the US environment may be greatly mitigated, as
indicated by our findings.
Interestingly, Elliott and Clement (2015) reveal similar spatial inequalities in
carbon emissions among US counties: more affluent areas appropriate the global carbon
cycle for use and exchange purposes by shifting carbon-intensive industrial production to
less developing areas, without reducing carbon-intensive residential energy emissions.
The environmental inequality across counties in the USA is an analogy to the inequality
across countries in the world, demonstrating environmental advantage of the developed
regions over the less developed regions.
This study suffers from a number of limitations. AQI, as a measure, has some
fundamental weaknesses, as discussed earlier. Counties that report AQI data are not
representative of the USA as a whole and over-represent urban areas and the West and
Northeastern regions. To maintain a larger sample size, we relied on imputation of the
data, which has the potential to introduce bias (White and Carlin 2010). Finally, although
the panel nature of this data is an advantage, only a small set of years are available,
limiting our conclusions about the longer-term effects of population change on air
quality. Despite these limitations, this dataset allowed us to focus on within-county
change in a way that was not possible in previous studies, challenging the conclusion that
immigration has a unique relationship with air quality.
This finding should serve as a springboard for future research on the population–
environment connection and particularly the immigration–environment connection. We
see three particularly promising areas for future research. First, research at a lower level
of analysis has the potential to better identify relationships between population change
92 and environmental impact. Particularly when studying air quality, the county level is not
an ideal measurement, because air quality is shaped by climatic and topographic
conditions that do not correspond to county boundaries and neither do people live evenly
dispersed within counties. Second, better measurement of county- or lower-level
characteristics would push research on this topic forward. While studies of population
across counties tend to show a negative relationship between total population and air
quality, our within-county models showed the opposite relationship, indicating that some
unmeasured characteristics of counties play an important role. Finally, the relationship
between immigration and aspects of environmental quality other than air quality has
received almost no attention in the literature. Immigrants’ more environmentally friendly
lifestyles may manifest themselves more strongly in waste production, carbon emissions,
or other aspects of environmental quality better than they do in air quality, but more
research is needed.
Notes
1. This information was learned through communication with Senior Statistician David
Mintz of Air Quality Analysis Group at U.S. Environmental Protection Agency during
February 21 and 23, 2017.

93 References
Allison, P. D. (2012a). Missing Data. Thousand Oaks, CA: Sage.
Allison, P. D. (2012b). Why you probably need more imputations than you think.
Statistical Horizons. Available at http://statisticalhorizons.com/more-
imputationsal. Cited 14 May 2018.
Angus, I., & Butler, S. (2011). Too Many People? Population, Immigration, and the
Environmental Crisis. Haymarket Books.
Anselin, L. (1988). Spatial Econometrics: Methods and Models. Dorddrecht, The
Netherlands: Kluwer Academic Publishers.
Atiles, J. H., & Bohon, S. A. (2003). Camas calientes: Housing adjustments and barriers
to social and economic adaptation among Georgia’s rural Latinos. Southern Rural
Sociology, 19(1), 97-122.
Beck, R. (1996). The Case Against Immigration: The Moral, Economic, Social, and
Environmental Reasons for Reducing Immigration Back to Traditional Levels.
New York: WW Norton & Company.
Blumenberg, E., & Shiki, K. (2008). Immigrants and resource sharing: The case of
carpooling. Transportation Research Board 87th Annual Meeting, No.07-2475.
Bodner, T. E. (2008). What improves with increased missing data imputations?
Structural Equation Modeling, 15(4), 651–675.
Bohon, S. A., Stamps, K., & Atiles, J. H. (2008). Transportation and migrant adjustment
in Georgia. Population Research and Policy Review, 27(3), 273-291.
Bunker, S. G. (1984). Modes of extraction, unequal exchange, and the progressive
underdevelopment of an extreme periphery: The Brazilian Amazon, 1600-

94 1980. American Journal of Sociology, 89(5), 1017-1064.
Cafaro, P. (2015). How Many is Too Many? The Progressive Argument for Reducing
Immigration into the United States. Chicago, IL: University of Chicago Press.
Carter, E. D., Silva, B., & Guzmán, G. (2013). Migration, acculturation, and
environmental values: The case of Mexican immigrants in central Iowa. Annals of
the Association of American Geographers, 103(1), 129-147.
Chapman, R. L. (2006). Confessions of a Malthusian restrictionist. Ecological
Economics, 59 (2), 214-219.
Chatman, D. G., & Klein, N. (2009). Immigrants and travel demand in the United States:
Implications for transportation policy and future research. Public Works
Management & Policy, 13(4), 312-327.
Chen, X., Shao, S., Tian, Z., Xie, Z., & Yin, P. (2017). Impacts of air pollution and its
spatial spillover effect on public health based on China's big data sample. Journal
of Cleaner Production, 142, 915-925.
Ciplet, D., Roberts, T., & Khan, M. (2015). Power in a Warming World: The New Global
Politics of Climate Change and the Remaking of Environmental Inequality.
Cambridge, MA: MIT Press.
Clement, M. T., & York, R. (2017). The asymmetric environmental consequences of
population change: An exploratory county-level study of land development in the
USA, 2001-2011. Population and Environment, 39(1), 47-68.
Cole, M. A., & Neumayer, E. (2004). Examining the impact of demographic factors on
air pollution. Population and Environment, 26 (1), 5-21.
Commoner, B. (1972a). The Closing Circle: Confronting the Environmental Crisis.

95 London: Jonathan Cape.
Commoner, B. (1972b). The environmental cost of economic growth. In R. G. Ridker
(Ed.), Population Resources and the Environment (pp. 339-363). Wahington, DC:
GPO.
Cramer, J. C. (1998). Population growth and air quality in California. Demography,
35(1), 45–56.
Cramer, J. C. (2002). Population growth and local air pollution: Methods, models, and
results. Population and Development Review, 28, 22-52.
Cramer, J. C., & Cheney, R. P. (2000). Lost in the ozone: Population growth and ozone in
California. Population and Environment, 21(3), 315–337.
Dietz, T., & Rosa, E. A. (1994). Rethinking the environmental impacts of population,
affluence and technology. Human Ecology Review, 1(2), 277-300.
Dietz, T., & Rosa, E. A. (1997). Effects of population and affluence on CO2 emissions.
Proceedings of the National Academy of Sciences, 94(1), 175–179.
Duncan, O. D. (1961). From social system to ecosystem. Sociological Inquiry, 31(2),
140-149.
Duncan, O. D. (1964). Social organization and the ecosystem. In R. E. Faris (Ed.),
Handbook of Modern Sociology (pp. 36-82). Chicago, IL: Rand McNally.
Ehrlich, P. R., & Ehrlich, A. H. (1991). The most overpopulated nation. NPG Forum
Series: 1-4.
Ehrlich, P.R., & Holdren, J.P. (1971). Impact of population growth. Science, 171, 1212-
1217.
Elhorst, J. P. (2001). Dynamic models in space and time. Geographical Analysis, 33(2),

96 119-140.
Elhorst, J. P. (2012). Dynamic spatial panels: Models, methods, and inferences. Journal
of Geographical Systems, 14(1), 5-28.
Elhorst, J. P. (2014). Spatial econometrics: From Cross-Sectional Data to Spatial Panels.
Berlin: Springer.
Elliott, J. R., & Clement, M. T. (2015). Developing spatial inequalities in carbon
appropriation: A sociological analysis of changing local emissions across the
United States. Social Science Research, 51, 119-131.
Enders, C.K. (2010). Applied Missing Data Analysis. New York: The Guilford Press.
Ewing, W. A. (Mar 01, 2004). Missing the forest for the trees: The environmental
arguments of immigration restrictionists miss the point. Restrictionist Watch.
Available at https://www.shusterman.com/pdf/restrict504.pdf. Cited 1 Jan 2018.
Finkel, S. E. (1995). Causal Analysis with Panel Data (No. 105). Thousand Oaks, CA:
Sage.
Foster, J. B., Clark, B., & York, R. (2011). The Ecological Rift: Capitalism’s War on the
Earth. New York, NY: NYU Press.
Garling, S. (1998). Immigration policy and the environment: The Washington DC
metropolitan area. Population and Environment, 20(1), 23–54.
Graham, J. W., Olchowski, A. E., & Gilreath, T. D. (2007). How many imputations are
really needed? Some practical clarifications of multiple imputation
theory. Prevention Science, 8(3), 206-213.
Harrison, P. (1993). The Third Revolution. London, England: Penguin.
Havard, S., Deguen, S., Zmirou-Navier, D., Schillinger, C., & Bard, D. (2009). Traffic-

97 related air pollution and socioeconomic status: A spatial autocorrelation study to
assess environmental equity on a small-area scale. Epidemiology, 20(2), 223-230.
Hoekstra, R., Michel, B., & Suh, S. (2016). The emission cost of international sourcing:
Using structural decomposition analysis to calculate the contribution of
international sourcing to CO2-emission growth. Economic Systems
Research, 28(2), 151-167.
Hultgren, J. (2014). The “nature” of American immigration restrictionism. New Political
Science, 36(1), 52-75.
Hunter, L. M. (2000). A comparison of the environmental attitudes, concern, and
behaviors of US-born and foreign-born US residents. Population and
Environment, 21(6), 565-580.
Jorgenson, A. K., & Clark, B. (2009). Ecologically unequal exchange in comparative
perspective: A brief introduction. International Journal of Comparative
Sociology, 50(3-4), 211-214.
Kraly, E. P. (1995). US Immigration and the Environment: Scientific Research and
Analytic Issues. US Commission on Immigration Reform Research Paper.
Washington, DC: US Commission on Immigration Reform.
Kraly, E. P. (1998). Immigration and environment: A framework for establishing a
possible relationship. Population Research and Policy Review, 17(5), 421–437.
Lankao, P. R., Tribbia, J. L., & Nychka, D. (2009). Testing theories to explore the drivers
of cities' atmospheric emissions. AMBIO: A Journal of the Human Environment,
38(4), 236-244.
Laureti, T., Montero, J. M., & Fernández-Avilés, G. (2014). A local scale analysis on

98 influencing factors of NOx emissions: Evidence from the community of Madrid,
Spain. Energy Policy, 74, 557-568.
Laumbach, R. J. (2010). Outdoor air pollutants and patient health. American Family
Physician, 81(2), 175.
Lee, C. C., Ballinger, T. J., & Domino, N. A. (2012). Utilizing map pattern classification
and surface weather typing to relate climate to the Air Quality Index in Cleveland,
Ohio. Atmospheric Environment, 63, 50-59.
Lee, G., You, S., Ritchie, S., Saphores, J. D., Sangkapichai, M., & Jayakrishnan, R.
(2009). Environmental impacts of a major freight corridor: A study of I-710 in
California. Transportation Research Record: Journal of the Transportation
Research Board, (2123), 119-128.
LeSage, J. P., & R. K. Pace. (2009). Introduction to Spatial Econometrics. Boca Raton,
FL: Taylor & Francis.
Ma, G., & Hofmann, E. T. (2019). Immigration and environment in the USA: A spatial
study of air quality. The Social Science Journal, 56(1), 94-106.
Malthus, T. R. (1798). An essay on the principle of population: The first edition (1798)
with introduction and bibliography (The Works of Thomas Robert Malthus). W.
Pickering.
McCarty, J., & Kaza, N. (2015). Urban form and air quality in the United States.
Landscape and Urban Planning, 139, 168-179.
Muradian, R. (2006). Immigration and the environment: Underlying values and scope of
analysis. Ecological Economics, 59(2), 208–213.
National Research Council. (2007). Using the American Community Survey: Benefits and
99 Challenges. National Academies Press.
Neumayer, E. (2006). The environment: One more reason to keep immigrants out?
Ecological Economics, 59(2), 204–207.
Normandin, S., & Valles, S. A. (2015). How a network of conservationists and
population control activists created the contemporary US anti-immigration
movement. Endeavour, 39(2), 95-105.
Pan, J., Phillips, J., & Chen, Y. (2008). China’s balance of emissions embodied in trade:
Approaches to measurement and allocating international responsibility. Oxford
Review of Economic Policy, 24(2), 354-376.
Park, L. S. H., & Pellow, D. N. (2011). The Slums of Aspen: Immigrants vs. the
Environment in America’s Eden. New York: New York University Press.
Pew Research Center, 2015. Modern Immigration Wave Brings 59 Million to U.S.,
Driving Population Growth and Change Through 2065: Views of Immigration’s
Impact on U.S. Society Mixed. Washington, D.C.: September.
Pfeffer, M. J., & Stycos, M. J. (2002). Immigrant environmental behaviors in New York
City. Social Science Quarterly, 83(1), 64–68.
Prell, C., & Feng, K. (2016). Unequal carbon exchanges: The environmental and
economic impacts of iconic US consumption items. Journal of Industrial
Ecology, 20(3), 537-546.
Preston, S. H. (1996). The effect of population growth on environmental quality.
Population Research and Policy Review, 15(2), 95–108.
Price, C. E., & Feldmeyer, B. (2012). The environmental impact of immigration: An
analysis of the effects of immigrant concentration on air pollution levels.

100 Population Research Policy Review, 31(1), 119-140.
Qiu, S., & Kaza, N. (2017). Evaluating the impacts of the clean cities program. Science of
the Total Environment, 579, 254-262.
Rice, J. (2007). Ecological unequal exchange: International trade and uneven utilization
of environmental space in the world system. Social Forces, 85(3), 1369-1392.
Roberts, J. T., & Parks, B. C. (2007). Fueling injustice: Globalization, ecologically
unequal exchange and climate change. Globalizations, 4(2), 193-210.
Roberts, T. D. (2014). Intergenerational transfers in US county-level CO2 emissions,
2007. Population and Environment, 35(4), 365-390.
Rothman, D. S. (1998). Environmental Kuznets curves-real progress or passing the buck?
Ecological Economics, 25(2), 177-194.
Rubin, D. B. (1996). Multiple imputation after 18+ years. Journal of the American
Statistical Association, 91(434), 473-489.
Sato, M. (2014). Embodied carbon in trade: A survey of the empirical literature. Journal
of Economic Surveys, 28(5), 831-861.
Schnaiberg, A. (1980). The Environment: From Surplus to Scarcity. Oxford, United
Kingdom: Oxford University Press.
Shi, A. (2003). The impact of population pressure on global Carbon dioxide emissions,
1975–1996: Evidence from pooled cross-country data. Ecological Economics,
44(1), 24–42.
Squalli, J. (2009). Immigration and environmental emissions: A U.S. county-level
analysis. Population and Environment, 30(6), 247-260.
Squalli, J. (2010). An empirical assessment of U.S. state-level immigration and

101 environmental emissions. Ecological Economics, 69(5), 1170-1175.
Stretesky, P. B., & Lynch, M. J. (2009). A cross-national study of the association
between per capita carbon dioxide emissions and exports to the United
States. Social Science Research, 38(1), 239-250.
Takahashi, B., Duan, R., & Van Witsen, A. (2018). Hispanics’ behavioral intentions
toward energy conservation: The role of sociodemographic, informational, and
attitudinal variables. Social Science Quarterly, 99(1), 341-361.
Van Buuren, S., Boshuizen, H. C., & Knook, D. L. (1999). Multiple imputation of
missing blood pressure covariates in survival analysis. Statistics in
Medicine, 18(6), 681-694.
Weber, C. L., & Matthews, H. S. (2007). Embodied environmental emissions in US
international trade, 1997− 2004. Environmental Science & Technology, 41(14),
4875–4881.
White, I. R., & Carlin, J. B. (2010). Bias and efficiency of multiple imputation compared
with complete‐case analysis for missing covariate values. Statistics in Medicine,
29(28), 2920-2931.
White, I. R., Royston, P., & Wood, A. M. (2011). Multiple imputation using chained
equations: Issues and guidance for practice. Statistics in Medicine, 30(4), 377-
399.
York, R., Rosa, E. A., & Dietz, T. (2003). STIRPAT, IPAT and ImPACT: Analytic tools
for unpacking the driving forces of environmental impacts. Ecological
Economics, 46(3), 351–365.

102 York, R., & Rosa, E. A. (2012). Choking on modernity: A human ecology of air
pollution. Social Problems, 59(2), 282–300.

103
CHAPTER IV
A COMPARISON STUDY OF ENVIRONMENTAL BEHAVIORS OF U.S.-BORN
WHITES AND IMMIGRANTS*
Introduction
The relationship between population and the environment is controversial across
the countries of immigration. In the USA, some activists have long argued that
immigration, as the major component of U.S. population growth, is also a key source of
environmental harm (Abernethy 2002; Beck et al. 2003; Cafaro 2015; Chapman 2006;
Krikorian 2008; Simcox 1992). However, the handful of empirical studies that test the
relationship between immigrant population and environmental quality (measured as air
quality) find that the immigrant population is more likely to be associated with better air
quality, while the U.S.-born population is more likely to be associated with worse air
quality (Cramer 1998; Ma and Hofmann 2019; Price and Feldmeyer 2012; Squalli 2009,
2010). Moreover, while the population pressure that immigrants place on the
environment has been highlighted, their environmental capacities shaped by diverse
cultures have been ignored (Klocker and Head 2013).
* This chapter is based on a published paper and a supplementary study. Reprinted by permission from Springer Nature, Journal of International Migration and Integration, Ma, Guizhen, Similar or Different? A Comparison of Environmental Behaviors of US-Born Whites and Chinese Immigrants, 20(4): 1203-1223, Copyright (2019). https://doi.org/10.1007/s12134-019-00653-4 I am thankful to Dr. Guadalupe Marquez-Velarde and Carina Linares for helping with the interviews of Mexican immigrants. Funding: This research was supported by the MountainWest Center for Regional Studies at Utah State University and Dr. Guadalupe Marquez-Velarde’s startup funding at Utah State University.
104 The relationship between immigration and better air quality may be related to
immigrants’ environmental behaviors, which are, on average, more environmentally
friendly than those of U.S.-born people (Chatman and Klein 2009; Hunter 2000; Pfeffer
and Stycos 2002). Given the heterogeneity of immigrant groups in the USA, it is not
surprising that they differ in both environmental behaviors and associations with air
quality. Studies find racial/ethnic variation in recycling, household energy consumption,
and rates of input energy waste and carbon dioxide pollution (Hackett and Lutzenhiser
1991; Johnson et al. 2004; Lutzenhiser 1997). Furthermore, the associations between
immigrants and air quality vary by immigrants’ country of origin (Ma and Hofmann
2019). These differences may be explained by the differential environmental behaviors of
immigrant groups. However, the limited research on immigrants’ environmental
behaviors in the USA either treats immigrants as a homogenous group or focuses on
Latino immigrants’ transportation and housing adjustments (Atiles and Bohon 2003;
Bohon et al. 2008). There is a dearth of qualitative research on how culturally specific
immigrant groups differ from U.S.-born people in environmental behaviors.
How might cultural disparity lead to different environmental behaviors and
impacts on the environment? How might environmentalism in the USA be advanced by
ethnic and cultural diversity which is a unique resource for the country of immigration?
Research on the daily sustainabilities of ethnic minorities would shed light on alternative
opportunities for sustainability (Klocker and Head 2013). The purpose of this study is to
compare immigrants with U.S.-born Whites. I choose two of the largest immigrant
groups, Mexican and Chinese, to compare with Whites. This qualitative interview study

105 gains insights into household environmental behaviors and explores alternative
opportunities for sustainability.
Literature Review
Environmental Behaviors
Research studies measure environmental behaviors in various ways. Some focus
on private environmental behaviors, such as household energy use, consumption,
recycling, driving, and waste management (Hunter 2000; Kim and Moon 2012; Olli et al.
2001; Walton and Austin 2011). Others include both private and public environmental
behaviors such as environmental reading, political activity, and participation in
environmental groups (Johnson et al. 2004; Pfeffer and Stycos 2002). However,
immigrants may not engage in public environmental behaviors actively as Whites do.
Anglo/Eurocentrism of environmentalism has been criticized for prioritizing dominant
culture over practices of other cultural groups (Baldwin 2009; Bradley 2009; Head et al.
2018; Jones 2002; Klocker and Head 2013; Merchant 2003; Neumayer 2006).
Immigrants’ lack of civic engagement regarding environmental issues is merely a
reflection of their often-marginalized status, language barriers, or cultural differences
(Clarke and Agyeman 2011; DeSipio 2011; Klocker and Head 2013; Lien et al. 2004;
Pfeffer and Stycos 2002; Ramakrishnan and Viramontes 2010). Household environmental
behaviors are crucial to connect daily practices to the environment and, thereby, to
inform environmental policy and education (Gibson et al. 2013; Klocker and Head 2013;
Lane and Gorman-Murray 2011; Reid et al. 2010; Waitt et al. 2012). This study focuses
on household environmental behaviors, such as household energy use, waste
management, and transportation.

106
A wide variety of personal and social factors are linked to environmental
behaviors, from demographics to socio-cultural, economic, and institutional forces (see
Gifford and Nilsson 2014 and Frederiks et al. 2015 for reviews). Personal norms may
guide people to reduce car use (Abrahamse et al. 2009), to reduce littering (Cialdini et al.
1990), and to recycle (Matthies et al. 2012). People with higher levels of education or
more knowledge about the environment are more likely to adopt responsible
environmental behaviors (Fielding and Head 2012; Johnson et al. 2004; Laidley 2011;
Levine and Strube 2012; Mobley et al. 2010). Older people are more likely than younger
ones to engage in pro-environmental behaviors (Gilg et al. 2005; Johnson et al. 2004; Olli
et al. 2001; Pinto et al. 2011; Swami et al. 2011). This finding suggests a cohort or period
effect that individual experience of scarcity in hard economic times may lead to frugality
(Gifford and Nilsson 2014; Olli et al. 2001). Household energy use usually increases with
income and household size (Abrahamse and Steg 2009; Benders et al. 2006; Brandon and
Lewis 1999; Poortinga et al. 2004; O’neill and Chen 2002). In Western countries,
immigrants often have limited choices but to drive cars (Waitt et al. 2016). Research
maintains that access to a structured recycling program is the most important determinant
of recycling (Barr 2007; Berger 1997; Derksen and Gartrell 1993; Guagnano et al. 1995;
Steel 1996; Walton and Austin 2011). These factors can shape individuals’ environmental
behaviors in varying degrees.
Variation in Environmental Behaviors
Immigrants, in general, differ from native-born people in their environmental
behaviors. Research indicates that immigrants were more likely to ride public
transportation, carpool, or walk and less likely to drive personal vehicles than native-born

107 people in the Western countries (Australian Bureau of Statistics 2012; Blumenberg and
Smart 2010; Chatman and Klein 2009; Heisz and Schellenberg 2004; Uteng 2009).
Immigrants were more likely than U.S.-born people to adjust behaviors for environmental
reasons, including buying organic produce, eating less meat, cutting back on driving, and
recycling (Hunter 2000). In New York City, immigrants were more likely to buy energy-
saving appliances, save water, and eat less meat, while U.S.-born people were more likely
to buy energy-saving light-bulbs (Pfeffer and Stycos 2002). In Australia, foreign-born
minorities were more likely than native-born people to reduce energy consumption
(Australian Department of Environment and Conservation 2005).
Meanwhile, immigrants are not homogeneous with regard to environmental
behaviors that are jointly shaped by social status, ethnicity, and material culture
(Lutzenhiser 1997). Latino immigrants were less likely than U.S.-born people to have
personal cars and good housing conditions due to their lower-income, legal status, and
other deficits (Atiles and Bohon 2003; Bohon et al. 2008). Foreign-born Mexicans were
more likely than U.S.-born people and other immigrants to engage in sustainable
practices, such as driving less, water conservation, and reducing household energy
consumption (Macias 2016). Hispanics and Asians used less energy and produced less
carbon dioxide pollution than U.S.-born residents in California (Lutzenhiser 1997).
Electricity consumption varied by birthplace in two apartment complexes in California,
with the immigrants using less than the U.S. citizens after utilities were no longer
included in the rent (Hackett and Lutzenhiser 1991). Asians were more likely than Latino
immigrants and U.S.-born people to recycle (Johnson et al. 2004). Asian immigrants
owned fewer cars and drove less than Australian‐born counterparts, controlling for

108 demographic and socioeconomic factors (Klocker et al. 2015). These studies suggest
significant differences in environmental behaviors between native-born people and
immigrants, and among immigrants of different origins.
Cultural Differences and Assimilation
Culture plays a key role in shaping diverse environmental behaviors across
race/ethnicity (Johnson et al. 2004; Klocker and Head 2013; Lutzenhiser 1997; Oreg and
Katz-Gerro 2006; Stern et al. 1995). Western culture tends to emphasize humankind’s
mastery over nature (Hand and Van Liere 1984; Schultz et al. 2000; White 1967). Asian
culture, by contrast, views that human beings are part of nature in a harmonious
relationship and are responsible for nature (Altman and Chemers 1980; Callicott and
Ames 1989; Kluckhohn and Strodtbeck 1961), which prompts individuals to participate
in environmentally friendly behaviors (Kim and Moon 2012). Collectivism, which is
common in Asian culture, encourages pro-environmental behaviors, such as recycling
(McCarty and Shrum 2001) and green purchase behaviors (Kim and Choi 2005). Chinese
culture has a strong focus on harmonious man–nature orientation and collectivism, which
is conducive to pro-environmental behaviors, such as green purchasing (Chan 2001; Lee
2017). Nevertheless, this pro-environmental orientation of Asian culture may be
weakened since Western culture substantially influences contemporary non-Western
societies through colonialism, religion, industrialism, consumerism, and materialistic
values (Johnson et al. 2004; Sodowsky et al. 1994).
Immigrants have to consider the appropriateness of environmental behaviors in
the culture which they settle (Hackett and Lutzenhiser 1991), where they often
experience significant social pressure to acculturate (Carter et al. 2013; Smith 2006).

109 They assimilate into the mainstream culture over time, which narrows the gap in
environmental behaviors between immigrants and native-born people (Blumenberg and
Shiki 2008; Hackett and Lutzenhiser 1991; Hunter 2000; Macias 2016). Immigrants
became similar to native-born people in transportation patterns after the first few years of
residence (Blumenberg 2009; Chatman and Klein 2009; Heisz and Schellenberg 2004; Lo
et al. 2011; Myers 1997; Tal and Handy 2010), though they may be still more dependent
on public transportation than native-born population (Modarres 2013). Foreign-born
Latinos were less likely to recycle than U.S.-born Latinos who are similar to U.S.-born
Whites in recycling (Johnson et al. 2004). Although immigrants assimilated into
dominant environmental behaviors, they may be skeptical about the excessive
materialism of American consumerism (Carter et al. 2013).
Amid the immigration-environment debate, rising voices across Western societies
call for an opening to cultural diversity in seeking environmental sustainability
(Anderson 2005; Bradley 2009; Ehrlich 2002; Goodall 2008; Head et al. 2018; Klocker
and Head 2013). Klocker and Head (2013, 52) warn that the assimilation of immigrants
into Western consumption patterns may be an “environmental liability.” Bradley (2009)
contends that immigrants are expected to live up to Swedish environmental norms
including recycling, using public transportation, and buying energy-efficient light bulbs
while the high consumption lifestyle of Swedes, such as large house sizes, ownership of
multiple homes, and high frequency of car driving, is neglected. Swedes have larger
ecological footprints than immigrants, even though they recycle more and consume more
organic foods (Bradley 2009). Klocker and Head (2013) further point out that Western
environmentalism assumes the superiority of Anglo or European culture over
110 environmental values and practices of minority groups and treats ethnic diversity as a
threat to environmentalism that needs to be subdued through assimilation. Instead, it is
beneficial to environmental sustainability to take advantage of cultural diversity (Bradley
2009; Head et al. 2018; Klocker and Head 2013).
This study begins as an effort to explore how cultural diversity may contribute to
environmental sustainability in the U.S. context. Immigrants from Mexico have long been
the largest single group of U.S. immigrants, currently accounting for 25% of all
immigrants (Migration Policy Institute 2018). Their incorporation into U.S. society has
been the most widely studied. The population of immigrants from mainland China
increased significantly since 1980 and became the third-largest immigrant group in the
USA (Migration Policy Institute 2018). The large share of Chinese immigrants with a
culture very different from Western culture makes a potential starting point to tap into
alternative capacities to address environmental challenges. I compare the environmental
behaviors of Chinese immigrants with U.S.-born Whites. Then, I incorporate Mexican
immigrants into the comparison in order to further investigate the distinctness of Chinese
immigrants. This study aims to broaden our knowledge about how daily behaviors are
related to the environment, how immigrants may integrate or disintegrate into American
environmental behaviors, and the implications for environmentalism in the USA.
Methods
To obtain insight into cross-cultural environmental behaviors at the household
level, I conducted face-to-face interviews with U.S.-born persons and mainland Chinese
immigrants from October 2017 to March 2018. The interviews took place in a college
town and nearby areas where the immigrant population is only a small share, compared to

111 the dominant non-Hispanic White population.
The study was reviewed and approved by my university’s Institutional Review
Board (IRB). In addition to posting and sending out the recruitment flyers in physical
locations, such as the city library and churches, I asked my acquaintances to help to
spread the word or send out the flyers. I also posted Chinese flyers on local Chinese
immigrants’ social media groups. My interviewees often helped me to spread the word or
give out the flyers. While a snowball approach was key to recruit the participants, a
purposeful sampling approach with maximum variation was also used to capture the
heterogeneity of the targeted population (Creswell 2012; Patton 2002). When there were
about four interviewees in each group that have similar characteristics such as age and
education, I stopped recruiting the same types of participants. To look for different
participants, I went to other locations such as a food pantry and Chinese restaurants.
As I neared 20 interviews for each group, the amount of new information
diminished significantly. Therefore, I conducted 20 interviews with U.S.-born persons
and 20 interviews with mainland Chinese immigrants. Unexpectedly, one of the Chinese
interviewees turned out to live in an American-Chinese family. I excluded this case
because it would confound the comparison between U.S.-born persons and Chinese
immigrants and, also, because it provides neither more information nor contradictory
data. All but one of the U.S.-born interviewees are Whites. Excluding this case as well
leaves a sample of 19 mainland Chinese immigrants and 19 U.S.-born Whites.
The interviewees varied by nature of work, age, and length of residence (for
immigrants). Most of the interviewees had at least some college education and were
females. The major demographic difference between the two groups of interviewees was

112 that the U.S.-born Whites had wider ranges of occupations and ages than the Chinese.
There were five retired and highly-educated U.S.-born Whites but no Chinese
counterparts. Table 1 summarizes the primary characteristics of the 38 interviewees.
Table 1 Characteristics of the interviewees
Chinese I i
U.S.-born Whites Gender Men 6 4 Women 13 15 Education level (highest in the family) High school or less 7 7 Some college 1 4 College degree 3 5 Graduate degree 8 3 Years in the USA (longest in the family) Less than 5 7 0 5-15 7 0 More than 15 5 19 N 19 19
The interviews were carried out in English with the U.S.-born Whites and in
Chinese with the Chinese immigrants. All the relevant documents were available in both
languages. I conducted the interviews with the participants mostly in public locations,
and the interviews lasted from 10 to 35 min. I presented the consent form in English or in
Chinese and made sure they read through it and agreed to continue. Then, I asked the
questions one by one while they also had a copy of the questions for reference. The semi-
structured interviews involved questions regarding household environmental behaviors,
including energy use at home, transportation, and waste management (Table 2). The

113 Chinese immigrants were asked two more questions. One is whether their behaviors are
influenced by Chinese culture. Another is whether there are changes in their behaviors
over time.
Table 2 Interview questions
Background:
How long have you been in (local geography)?
How long have you been in the USA (for Chinese interviewees)?
What is your occupation?
Are you concerned about air quality in (local geography)? Why?
Do you live in a single-family house or an apartment?
How many people live in your household?
Energy use:
What are appliances and devices in your home that use electricity, gas, or other energy?
How often do you use them? What are typical temperatures you set your thermostat in summer and winter? Do you turn lights off in unused rooms? Or do you tend to keep them on? Do you line-dry clothes or use a dryer? Or do you do a combination of the two? Do you wash dishes by hand or use a dishwasher? Do you wait for a full load to use a washing machine and a dishwasher?
Or do you run them more frequently?
Transportation/Driving habits: Do you usually drive a car, use public transportation, carpool, or walk? How often?
If you or anyone in your household drive a car: How many cars do you have? How many miles do you drive a car per year? What is the total mileage on all the cars in your household?

114 Do you ever idle your car before driving? If yes, how often? Do you cut back on driving a car for environmental reasons? Do you drive an energy-efficient car?
Waste Management:
How likely do you buy products that can be recycled, are environmentally friendly or organic, or have less packaging? How much waste does your household produce per week? Do you recycle? What and how do you recycle? Do you reuse household items? How often do you use plastic bags? For Chinese only:
Do you think your environmental behaviors are influenced by Chinese culture, or because you are Chinese? If yes, how is the connection between them?
Have your behaviors mentioned above changed over time since you came to the USA? If so, what is the change? Why?
All the interviews were audio-recorded, except two with Chinese interviewees
who refused to be recorded. In the latter two cases, I wrote notes when conducting these
interviews and expanded the notes immediately after the interviews. I transcribed the
interviews with Chinese and 2 of the interviews with the U.S.-born persons. The
remaining 18 interviews in English were transcribed by a professional company which
provides confidential transcription services. I double-checked the transcriptions by
reading through again and comparing them with the corresponding audio records if
needed. I printed out all the transcripts and manually coded the data line-by-line.
After completing the interviews with Chinese immigrants, I was able to be funded
to complete supplementary interviews with 20 Mexican immigrants. These interviews
were conducted by two Spanish-speaking researchers in the same region, with the same

115 interview questions and techniques. The findings of the interviews with Chinese and
Mexican immigrants show significant differences from those of Whites, while the two
groups share similarities. I focus primarily on the comparison between Whites and
Chinese immigrants, with a summary of the findings from Mexican immigrants.
Cross-cultural Comparison of Household Environmental Behaviors
Household environmental behaviors of the Whites and the immigrants were
different in some respects yet similar in others. The U.S.-born interviewees were more
likely than the immigrants to be concerned about local air quality, i.e., winter inversions
that trap a dense layer of cold and polluted air below a layer of warm air. However,
Whites’ higher levels of environmental concern were not necessarily translated into more
environmentally friendly behaviors. Consistent with prior research, this indicates that
fundamental factors other than concern may shape environmental behaviors.
Differences
Household Energy Use
The culture of thrift is the essential theme that emerges from the narratives of the
Chinese immigrants, which distinguishes them from the U.S.-born Whites.
Heating and cooling account for most household energy use. The interviews were
conducted in a region that is usually cold in winter and moderately hot in summer. All the
interviewee’s houses had heating systems, but some did not have air conditioners. Some
U.S.-born interviewees who had both heating systems and air conditioners set constant
temperatures around 70 °F throughout the year. Most Chinese interviewees did not use
air conditioners in summer, though a few of them set temperatures higher than 70 °F

116 during winter. The U.S.-born Whites were more likely to set slightly lower temperatures
on their air conditioners in summer than the Chinese immigrants who used air
conditioners. The U.S.-born Whites who did not use air conditioners did this largely
because they did not have them, whereas the Chinese immigrants often had air
conditioners but chose not to use them.
Most of the Chinese interviewees felt it was not necessary to turn on air
conditioners. A Chinese interviewee who had been in the USA for less than one year
said:
I personally feel like Americans waste more than Chinese. For example, they
set much lower temperatures on air conditioners in summer, while keeping
rooms too warm in winter. I think either high or low temperature wastes
energy and is also uncomfortable. But they just like that [set temperatures low
in summer and high in winter].
Some Chinese believed that ventilating the house by opening windows than is
more natural than using air conditioners. Others were concerned about the cost. A young
Chinese professional living in a single-family house said:
I figured out that if I were very comfortable, my wallet would be very
uncomfortable.… I tried to set the temperature to the point that made me very
comfortable during the summer. But I found my utility bills were much too
expensive! I had to raise it to around 78 °F.
In addition, frequencies of using the washer, the dryer, and the dishwasher were
higher among the U.S.-born interviewees than among the Chinese interviewees. For the
same family size, the Chinese immigrants usually had fewer washing loads per week than

117 the U.S.-born interviewees. For instance, a White and a Chinese family of five had the
most washing loads per week in each of their groups. The White family washed 10 loads
per week, while the Chinese family washed 5 loads per week. When there was no washer
available in the apartment, some Chinese immigrants preferred not to use laundromats,
but to wash by hand due to concern about the hygiene of laundromats.
Frugality even keeps some Chinese immigrants from using the dishwasher and the
dryer which are not common in China even now. Most of the Chinese interviewees were
skeptical about these time- and energy-consuming appliances. Only three of them used
dishwashers at least once a week. One young Chinese said he would use the dishwasher
once he has one because it does not necessarily consume more water than hand washing.
In contrast, the U.S.-born interviewees generally reported higher frequencies of using
dishwashers, from once a week to daily, except those who did not have one. The Chinese
interviewees who used dryers were the youngest or those living in the USA for the
longest time. The youngest living in apartments and did laundry at laundromats and had
to use both washers and dryers. The longer-term immigrants often got used to the dryer
for its convenience, after rejecting it in their first few years in the USA. Five Chinese
who used dryers also dried their clothes on clotheslines, especially during summer. Five
other Chinese interviewees line-dried only. On the contrary, only one U.S.-born
interviewee said his family line-dried and seldom used a dryer. Four others used
clotheslines only in summer.
The Chinese interviewees consistently mentioned other energy- or resource-
saving behaviors that were driven by their sense of thriftiness. Many of them volunteered
that they turned off lights whenever no one was in a room and emphasized that it was a

118 habit. By contrast, only a few U.S.-born interviewees said that they tried to do so after I
asked them. The inclination among the Chinese to reuse things extended to a variety of
household items, such as paper, plastics, water, and clothes. Meanwhile, they observed
that their U.S.-born neighbors were not as frugal, i.e., turning on lights throughout the
whole house, watering their lawn every day, and setting room temperatures high in winter
and low in summer.
Socioeconomic status was related to household energy use only to some extent.
The higher incomes of some Chinese interviewees relative to others, inferred from their
occupations, enabled them to live in more energy-consuming single-family houses,
instead of smaller apartments. However, high income may not necessarily imply greater
energy use. Among the U.S.-born Whites, a young student and a low-income person
whom I met at a food pantry each lived in a single-family house their parents bought.
And this low-income person used the dishwasher for her family of two every day, more
frequently even than other U.S.-born Whites. Among the Chinese, the young students
with low or no income were more likely than longer-term immigrants to use dryers and
dishwashers, if available in their apartments, and to keep room temperatures warmer in
winter.
Overall, the Chinese immigrants used less electricity and gas at home than the
U.S.-born Whites. Culture differences between the two groups seem to account for the
disparity. The cultural imprint of thrift was heavier on the Chinese immigrants than on
the U.S.-born Whites, which may be related to the different standards of living in the
USA and in China. Most of the Chinese interviewees attributed their frugal household
energy use to Chinese culture, though a few highly-educated Chinese felt their

119 knowledge of environmental impact was also a major factor. The frugal habits of the
Chinese immigrants, instilled from an early age in China, became part of their daily lives,
as a Chinese woman who had been in the USA for 11 years said:
I notice that...most Chinese, including myself, may be very frugal. Maybe our
living habits, cultural habits matter. Parents always told us to be frugal. So, I
see many of my friends, as well as ourselves, never leave a light on if it is not
needed. We must turn it off [laughter]. As for the dishwasher, we use it as
little as possible. And we won’t use it until it is really full. Same with the
washer. We use it until a certain capacity is met. Otherwise, we won’t use it.
The first-generation Chinese immigrants also trained their U.S.-born children to
be frugal, such as washing dishes by hand, turning off lights whenever leaving a room,
and not turning on the air conditioner in summer, which were not mentioned by any of
the White interviewees. Among the U.S.-born Whites, only the elderly interviewees
intentionally saved energy at home. The only U.S.-born interviewee who line-dried
laundry and rarely used the air conditioner in summer noticed changes in environmental
behaviors from generation to generation:
I think probably…because we’re now in our 70s. We grew up in a different
time. When there wasn’t quite so much access, activities, access resources,
we just are comfortable with using less.… Our kids are pretty
environmentally conscious as well. Maybe a little bit less than we are because
they’re just kids, you know, young adults. But that’s how it is.
This generational gap in frugality was evident among the Chinese immigrants as
well. The younger Chinese interviewees were raised with relatively more resources and,

120 thereby, were less likely to be frugal than the older Chinese.
The Mexican immigrants in this study mentioned energy-saving activities, such as
turning off lights that were unused. However, they also exhibit interesting differences
from Chinese immigrants and Whites. Most of the Mexicans set room temperature
around 70 °F during winter, while three families set as high as 75 °F or even 80 °F.
Among the 12 interviewees who had air conditioners, eight set lower than 70 °F in
summer, and five lowered to 60 °F. Mexican interviewees also used washers and dryers
more frequently than two other groups, probably due to their larger family sizes—nearly
half of them had five or more family members. Two of them reported that they line-dried
laundry. Hence, Mexican immigrant households seemed to consume more energy for
heating, air conditioning, and washing than Chinese immigrants and similar to Whites in
this regard.
Transportation
The statement of a White interviewee that “I live in my car” may exaggerate the
frequency of car driving but highlights the vital role of the automobile in Americans’
lives. However, the widespread use of the automobile contributes to air pollution. The
cities where most of the interviewees lived in provided free public transportation. The
university also offered free shuttles transporting students around the campus. However,
driving a car was still important for many residents.
The disparity in driving between the U.S.-born and Chinese-born interviewees is
remarkable. All the interviewees had at least one car in their household, except two new
Chinese students who expressed the desire to buy a car sooner or later. Most of the U.S.-
born Whites reported that annual average miles per driver in their household were from

121 10,000 to 20,000 miles, while the majority of the Chinese immigrants drove fewer than
10,000 miles annually. Besides, the U.S.-born Whites were more likely than the Chinese
to drive a pickup, a big SUV, or a sports car that creates high emissions. Although the
major purposes of driving a car for both groups were commuting, transporting kids to
activities, and running errands, long-distance travel substantially increased the mileages
of the U.S.-born interviewees. Chinese immigrants generally have fewer family members,
friends, and relatives in the USA to visit than Americans and, thus, do less long-distance
driving. Six U.S.-born Whites but only one Chinese mentioned they drove long distances
to visit their family members during summer. One U.S.-born White and two of her family
members each commuted 3 hours every weekday. Compared to the U.S.-born Whites, the
Chinese immigrants were less likely to live in remote areas that demand more driving.
These differences in driving suggest that the Chinese immigrants generated fewer driving
emissions than the U.S.-born Whites did.
The majority of Mexican interviewees drove old cars, except two who did not
drive. Six of them drove less than 10, 000 miles per year; six others drove more than
10,000 miles. The remaining six interviewees did not know their mileage, but two of
them drove long distances. In general, both Mexican and Chinese immigrants drove less
than Whites.
Waste Management
The Chinese immigrants generally produced smaller amounts of household waste
than the U.S.-born Whites because they often cooked on a daily basis and ate less
packaged foods. They were typically critical about the use of disposable paper and plastic
goods. Most of the Chinese interviewees used plastic shopping bags as trash bags as a
122 way to reduce plastic use, regardless of income and occupation. However, the plastic
shopping bags would be too small for the U.S.-born Whites who cooked less and bought
more packaged foods than the Chinese immigrants. None of the U.S.-born interviewees
mentioned they reused shopping bags, though some of them returned the bags to stores. A
Chinese immigrant who arrived in recent years said:
We should save energy, such as [reducing the use of] disposable utensils and
plastic bags. I rarely use these. When I came to the USA, I was surprised by
the wide use of these plastic things. They have something to do with air
quality.
The interviewees who lived in apartments had no convenient access to recycling
bins. Among them, almost all the Chinese interviewees recycled cardboard; only one
White was active in recycling.
Both the U.S.-born Whites and the Chinese immigrants who lived in single-family
houses typically had two to three bins for waste, recycling, and green waste, and did
better in recycling than those living in apartments. A few families in both groups were
dedicated to recycling. A U.S.-born White said:
I buy as much as I can that can be recycled. We recycle our newspapers, all
the things the city takes, all the things the university takes, [such as] glass. I
guess that’s about all we can recycle right now. Cans, the city takes also.
We’re pretty good about recycling.
Almost all Mexican immigrants recycled plastics or reused household items. For
instance, they used plastic shopping bags as trash bags and empty containers to store
food.

123 Wood Burning
Wood burning is a major factor of winter inversions in the study areas. A few
U.S.-born families in this study had wood burning fireplaces or stoves. Two of them
constantly used wood burning for heating during winter. Chinese immigrants did not burn
wood. Four of them were concerned about the impact of various forms of burning on air
quality, such as burning leaves, barbecuing, and other outdoor burning. A Chinese who
has lived in the USA for 17 years said:
We don’t burn anything. Air quality often gets worse from fall onwards.
That’s because the fall leaves are burned. Smog is trapped in the valley and
can’t get out. We collect our leaves to compost only. We never burn.
The U.S.-born Whites have a different understanding of burning, as one of them
said:
We recycle. We have a green waste sweeper. We have a burn pile. We have
anything that’s recyclable.
The different views reveal a cultural difference in environmental tradeoffs
between wood burning and air quality. For the Whites, it is natural to burn green waste or
use wood burning fireplaces, even though it emits air pollution.
Assimilation
Assimilation research shows that the minimum cutoff is 10 to 15 years for being a
long-term immigrant (Beyer 2016; Borjas 1985). Among 10 of the Chinese immigrants in
this study who have been living in the USA for more than 10 years, five of them had
come 15 years ago. The changes in environmental behaviors among the Chinese

124 immigrants and the distinction between the long-term and short-term immigrants
illustrate the importance of culture on environmental behaviors in threefold ways.
First, Chinese immigrants often acculturated to the dominant American
environmental behaviors over time, more or less. These changes were largely
demonstrated by the acceptance of dryers and dishwashers, by driving more, and by
increased picking up of litter. A Chinese interviewee who has lived more than 10 years in
the USA described the process:
We were surprised by using dryers and dishwashers when we came to the
USA. How can they use things like that? We prefer drying clothes under the
sun to kill bacteria. When time went by, we saw others used dryers. So we
started to use [the dryer]. Of course, how can’t it not be good to use energy
[laughter]?... I think we changed after about 5 years in the USA. Then, from 5
to 10 years, we were willing to accept and find the pros and cons. After 10
years, I would say we were very close to the American way of life.
This acculturation was more evident among younger immigrants. A Chinese
interviewee who immigrated many years ago as a child noticed:
I might be kind of wasteful [laughter]. I used more energy than other
Chinese…. Oftentimes, I would walk in China. But in the USA, people drive
a car even just go to the opposite side of the street [laughter]. This is
definitely an American style. I would say I became more and more like an
American.
Second, the effect of assimilation on environmental behaviors of the Chinese
immigrants was mediated by the influence of Chinese culture. Although the Chinese
immigrants may gradually acculturate to the American style of energy use over time,

125 such as using dryers and dishwashers, they have maintained their frugality in household
energy use. Most Chinese interviewees insisted that thrift is a virtue, and they would
continue to be frugal. Meanwhile, they were willing to engage in pro-environmental
behaviors they learned in the USA, such as dedicated recycling. A long-term Chinese
immigrant said:
I’d like to do things if it’s good for society and my family…. We weren’t
required to recycle in China. But we are conscious of recycling in the USA.
There are recycling bins. So we do our best to recycle…. On the other side,
Americans like to have many lights on and make beautiful lighting in their
houses. We won’t follow this way.
Third, China’s booming economy in recent decades shortens the time of
acculturation for young immigrants. The young Chinese immigrants grew up in a more
affluent situation than earlier Chinese immigrants did. As a result, they were not as frugal
as their older cohorts. They were more likely than earlier Chinese immigrants to turn on
more lights, use air conditioners, set comfortable temperatures for heating and cooling,
accept the use of dryers and dishwashers, and drive more. This is especially true for
Chinese undergraduate students in this study whose parents paid for their expensive
international student tuition and living expenses. Raised in more affluent families, they
were less concerned with thrift than the older Chinese.
Mexican immigrants also noticed changes in their environmental behaviors over
time. On the one hand, they drove more, used washers, dryers, and dishwashers more
frequently as they stayed longer in the USA. On the other hand, they have learned
recycling which they were not aware of in Mexico. Most of them do not connect their

126 behaviors to Mexican culture. Instead, they attribute their changing behaviors to different
situations in Mexico and the USA, particularly economic disparity. They started to use
household appliances that were not available when they were in Mexico, while they also
kept thrifty habits such as reusing household items.
Similarities
Social Contexts
Interviewees from all the three groups, i.e., the U.S.-born Whites, the Chinese
immigrants, and the Mexican immigrants, complained that it was not easy to engage in
some environmentally friendly behaviors in certain social contexts. They were concerned
about the convenience of public transportation, drying clothes outside, the prevalence of
plastic bags, access to recycling, and old appliances in some apartments.
None of the interviewees thought they could actually cut down on driving for
environmental reasons, though they expressed a desire to purchase a hybrid car, idle less,
or combine errands into one trip. Most of them mentioned that they cannot reduce driving
because there were no other options. In the cities, public transportation was limited to
buses, with a small number of routes that may not be near peoples’ homes. A Chinese
compared public transportation in China with that in the USA and concluded that she
would prefer not to drive if there were advanced public transportation systems in the
USA. A White interviewee who lived in a small town and drove a lot said:
[G]rowing up here in the valley, I know that we’ve seen the air quality
decline over the last several years. I think we are conscious of it, we are just
not in a situation right now that we feel like we can do much to change our
behaviors.

127
Drying clothing outside under the sun is very common in China, and it is believed
to be a good way to not only dry clothes but also kill bacteria and dust mites. Some
Chinese interviewees said that they had to use dryers because drying outside seemed not
acceptable in the USA, though the convenience of using a dryer was also an attraction.
These comments echo Hackett and Lutzenhiser’s (1991) argument that immigrants have
to think about whether their activities are appropriate in a new destination. Although
drying clothing on a line is obviously much more pro-environmental than using a dryer,
only 10 Chinese interviewees and five U.S.-born Whites line-dried at least sometimes. A
Chinese interviewee who has been in the USA for more than 10 years said:
We have gotten used to the dryer. Previously we did line-drying. But now…I
feel there’s no place [outside] to line-dry. And it’s also not appropriate to dry
outside the house [in the USA]. So, we decided to use a dryer.
Plastic bags are widely used in the USA. Most White interviewees were not
concerned about using plastic bags, as long as they were recycled. Only one White
interviewee noticed the effect of social context on plastic use because of her cross-
cultural experience:
I lived in Germany for a year and a half.… And there, they don’t have plastic
bags, right? You just like stick stuff in your bag. I got back to America and I
went shopping with my friend and we only bought a few things. I was just
like shoving them into my backpack after we bought them and she’s like,
stops me, just like, “What are you doing? You can’t do that” [laughter].… I
do use the plastic bags but it’s mostly because of a culture norm thing. If I
had my way, I would just shove some of the stuff that I buy into my
backpack. But it’s not culturally accepted here [laughter].

128
From the perspective of most Chinese interviewees, plastic bags were excessively
used in the USA. China has been promoting less use of plastic bags for years. A recent
Chinese immigrant was surprised by the wide use of plastic bags in the USA:
The store cashiers often give you too many plastic bags. That’s the issue. We
don’t need so many plastic bags. Personally speaking, I wouldn’t put only one
thing in one bag.
The availability of curbside recycling played an important role in recycling
among the interviewees in this study. The interviewees expressed their concerns that the
cities did not provide good access to recycling. Some became frustrated with recycling
due to limited access to recycle things other than cardboard and plastics. Recycling was
even less convenient for those living in the apartments where recycling bins were often
absent.
Given these social contexts, the interviewees, both the U.S.-born Whites and the
immigrants, were discouraged from being more pro-environmental. They had to use older
appliances in the apartments that may be less energy-efficient, drive a lot and create more
emissions, give up line-drying and use a dryer instead, use more plastics, and recycle less
than they wanted.
Cost Consideration
Cost was often the priority for both the U.S.-born and foreign-born interviewees.
Most interviewees acknowledged that it would be better for the environment if people
used solar panels rather than regular electricity or natural gas, if they replaced old
appliances for heating or cooking with new energy-saving ones, or if they bought more

129 organic foods. Although a few interviewees were interested in solar energy, only one was
able to put solar panels on his roof. The interviewees repeatedly brought up the issue of
extra costs to be pro-environmental. A White woman said:
I like [to be] more efficient, but again, to get rid of those appliances and
replace them, there’s a cost.
A Chinese who immigrated more than 15 years ago responded to the question of
how likely she would buy organic or environmentally friendly goods:
Not really. I have to consider the cost. Some of these kinds of goods are
expensive. I often compare the cost and effectiveness [of the goods] to decide
whether to buy. It’s not my priority to buy these goods just because they are
recyclable.
Cost was the most practical consideration in the decision of adopting pro-
environmental behaviors for both the U.S.-born Whites and the immigrants. They tried to
find a balance between cost and effectiveness.
Conclusions
The debate over the immigration-environment relationship has been focusing on
population pressure caused by immigrants and ignoring the potential of cultural diversity
to promote environmental sustainability (Klocker and Head 2013). This study starts the
exploration of household environmental behaviors among immigrants and U.S.-born
Whites, with the aim to uncover cultural influence on the environment and the new
possibilities for environmentalism. Drawing on face-to-face interviews, this analysis
finds both differences and similarities in environmental behaviors between the U.S.-born

130 Whites, the Chinese immigrants, and the Mexican immigrants, as well as the integration
and disintegration of immigrants into the American lifestyle.
The U.S.-born Whites and the immigrants differed significantly in household
environmental behaviors, probably as the result of cultural differences. The U.S.-born
Whites, on average, used more energy and plastics and drove more than the Chinese and
Mexican immigrants, which implies they may contribute more harm to the environment.
The findings are consistent with the previous research that immigrants, in general, used
less energy, drove less, and recycled more than U.S.-born people (Chatman and Klein
2009; Hunter 2000; Pfeffer and Stycos 2002), and Asians particularly used less energy
and were eager to recycle (Hackett and Lutzenhiser 1991; Johnson et al. 2004;
Lutzenhiser 1997). The relatively strong pro-environmental behaviors of the Chinese
immigrants were shaped by Chinese culture that views thrift as a virtue and prefers a
natural lifestyle, such as using clotheslines instead of dryers, using natural ventilation
instead of heavily relying on air conditioners, and reducing energy use. The Mexican
immigrants linked their thrifty behaviors to poverty in Mexico when they grew up. They
used more household energy, drove more as adapting to life in the USA, while reusing
plastics and other items as a habit built in Mexico. A few U.S.-born Whites in this study
claimed they were environmentally conscientious and intentionally reduced energy use or
drove less. Nevertheless, the American lifestyle has an emphasis on material comfort,
which inherently demands more energy and generates more harm to the environment.
However, the pro-environmental behaviors of the immigrants faded away over
time due to assimilation into American mainstream culture. This is in line with prior
findings of other immigrant groups. During the process of assimilation, immigrants
131 significantly used more energy, drove more, and produced more waste and pollution,
though they may also increase recycling. Younger Chinese immigrants even experienced
accelerated acculturation since they grew up during China’s economic boom and were
influenced by American culture from their early ages. The American lifestyle heavily
relies on technologies to keep a high standard of living but overlooks the trade-off
between convenience and environmental harm. The United States, with 4.7% of the
world’s population, disproportionately consumed 25.3% of all fossil fuels in 2000 (Ewing
2004). As immigrants become more similar to U.S.-born Whites in environmental
behaviors, their ecological footprints would increase. Assimilation of immigrants into
American environmental behaviors thereby amounts to a hindrance, which increases
environmental harm, rather than a boon as assumed. It is imperative to take brave steps to
reflect on high-consumption lifestyles and open environmentalism to possible
alternatives.
Ethnic diversity can be an advantage rather than an environmental liability in a
multicultural context (Bradley 2009; Head et al. 2018; Klocker and Head 2013). While
immigration inevitably increases population pressure on the environment in the host
countries, it brings diverse cultural capitals that offer opportunities as well.
Unidirectional assimilation of ethnic minorities into mainstream culture assumes that
Western norms and practices are the most appropriate and, thereby, neglects the potential
for improvement. In this study, the Chinese immigrants had to give up line-drying under
social pressure, which demonstrates forced assimilation (Carter et al. 2013; Smith 2006).
Instead, reciprocal assimilation between immigrants and native-born people allows
learning from diverse cultures for the good of the environment, without supposing the

132 superiority of one environmentalism over another. While the Chinese immigrants were
concerned about the American style of excessive energy use, they were eager to sort and
recycle as their American neighbors did. The Mexican immigrants mentioned how they
learned recycling and no littering in the USA. In contrast, the U.S.-born Whites seldom
expressed their reflection on daily environmental behaviors or interest in environmental
behaviors of ethnic minorities. Environmental harm can be reduced if both U.S.-born
Whites and immigrants learn the strengths of daily environmental practices from each
other. Immigrants can learn pro-environmental practices in the USA such as recycling
and the use of canvas bags. U.S.-born Whites can also make an effort to reduce heavy
reliance on air conditioners, drive less, and use fewer plastic bags.
Household environmental behaviors affect the environment on a daily basis, and it
is a key area for environmental sustainability. Some household environmental behaviors
are subject to social contexts, such as availability and convenience of public
transportation, access to recycling, and the prevalence of plastic bags. Others may be
limited by economic costs. The findings indicate policy strategies to foster engagement
among the public for sustainability. First, environmental education is an important way to
make changes. There is a need for informing people of how their daily lives are linked to
the environment and the alternative ways of life that are more environmentally friendly.
Studies on environmental behaviors of diverse cultures will provide further knowledge
about the potential. Second, diverse cultures can be integrated into the policy process.
Environmental policy that recognizes the benefit of cultural diversity holds promise for
sustainability. Lastly, supportive institutions and infrastructure are highly desired to
enable action. These may include developing convenient public transportation, providing

133 more access to recycling, especially for the apartments, regulating or banning plastic use,
and subsidizing solar energy use, among other things.
This study suggests a couple of directions for future research. First, more attention
needs to be paid to cultural diversity for environmental sustainability. Further empirical
studies on environmental behaviors of diverse ethnicities using a variety of
methodologies will uncover alternative possibilities for everyday sustainabilities. The
findings of these analyses will greatly inform the public and policymakers of the potential
for addressing environmental challenges. Second, research can move beyond assimilation
of immigrants into the mainstream towards reciprocal assimilation that recognizes
cultural diversity and its potential for environmental sustainability. Given the high energy
consumption and large ecological footprints in the USA, it is necessary to rethink
American environmentalism and incorporate other cultures into the environmental
framework.

134 References
Abernethy, D. (2002). Population dynamics: Poverty, inequality, and self-regulating
fertility rates. Population and Environment, 24(1), 69–96.
Abrahamse, W., & Steg, L. (2009). How do socio-demographic and psychological factors
relate to households’ direct and indirect energy use and savings? Journal of
Economic Psychology, 30(5), 711-720.
Abrahamse, W., Steg, L., Gifford, R., & Vlek, C. (2009). Factors influencing car use and
the intention to reduce it: A question of morality? Transportation Research Part
F: Psychology and Behavior, 12(4), 317–324.
Altman, I., & Chemers, M. (1980). Culture and environment. Monterey, CA: Brooks and
Cole.
Anderson, K. (2005). Griffith Taylor lecture, geographical Society of New South Wales,
2004: Australia and the ‘state of nature/native’. Australian Geographer, 36(3),
267-282.
Atiles, J. H., & Bohon, S. A. (2003). Camas calientes: Housing adjustments and barriers
to social and economic adaptation among Georgia’s rural Latinos. Southern Rural
Sociology, 19(1), 97-122.
Australian Bureau of Statistics (ABS). (2012). Transport data generated using ABS
TableBuilder, ABS, Canberra.
Australian Department of Environment and Conservation. (2005). The environment and
ethnic communities in 2004, DEC, Sydney.
Baldwin, A. (2009). The white geography of Lawren Stewart Harris: Whiteness and the
performative coupling of wilderness and multiculturalism in Canada.

135 Environment and Planning A, 41(3), 529-544.
Barr, S. (2007). Factors influencing environmental attitudes and behaviors: A UK case
study of household waste management. Environment and Behavior, 39(4), 435-
473.
Beck, R. H., Kolankiewicz, L. J., & Camarota, S. A. (2003). Outsmarting smart growth:
Population growth, immigration, and the problem of sprawl. Center for
Immigration Studies.
Benders, R. M., Kok, R., Moll, H. C., Wiersma, G., & Noorman, K. J. (2006). New
approaches for household energy conservation—In search of personal household
energy budgets and energy reduction options. Energy Policy, 34(18), 3612-3622.
Berger, I. E. (1997). The demographics of recycling and the structure of environmental
behavior. Environment and Behavior, 29(4), 515-531.
Beyer, R. C. (2016). The labor market performance of immigrants in Germany.
International Monetary Fund.
Blumenberg, E. (2009). Moving in and moving around: Immigrants, travel behavior, and
implications for transport policy. Transportation Letters, 1(2), 169-180.
Blumenberg, E., & Shiki, K. (2008). Immigrants and resource sharing: The case of
carpooling. In Proceedings of the Transportation Research Board 87th Annual
Meeting. Washington DC: Transportation Research Board.
Blumenberg, E., & Smart, M. (2010). Getting by with a little help from my friends… and
family: Immigrants and carpooling. Transportation, 37(3), 429-446.
Bohon, S. A., Stamps, K., & Atiles, J. H. (2008). Transportation and migrant adjustment
in Georgia. Population Research and Policy Review, 27(3), 273-291.
136 Borjas, G. J. (1985). Assimilation, changes in cohort quality, and the earnings of
immigrants. Journal of Labor Economics, 3(4), 463-489.
Bradley, K. (2009). Planning for eco-friendly living in diverse societies. Local
Environment, 14(4), 347-363.
Brandon, G., & Lewis, A. (1999). Reducing household energy consumption: A
qualitative and quantitative field study. Journal of Environmental
Psychology, 19(1), 75-85.
Cafaro, P. (2015). How many is too many? The progressive argument for reducing
immigration into the United States. Chicago, IL: University of Chicago Press.
Callicott, J. B., & Ames, R. T. (Eds.). (1989). Nature in Asian traditions of thought:
Essays in environmental philosophy. SUNY press.
Chan, R. Y. (2001). Determinants of Chinese consumers' green purchase
behavior. Psychology and Marketing, 18(4), 389-413.
Chapman, R. L. (2006). Confessions of a Malthusian restrictionist. Ecological
Economics, 59(2), 214-219.
Carter, E. D., Silva, B., & Guzmán, G. (2013). Migration, acculturation, and
environmental values: The case of Mexican immigrants in Central Iowa. Annals
of the Association of American Geographers, 103(1), 129-147.
Chatman, D. G., & Klein, N. (2009). Immigrants and travel demand in the United States:
implications for transportation policy and future research. Public Works
Management and Policy, 13(4), 312-327.
Cialdini, R. B., Reno, R. R., & Kallgren, C. A. (1990). A focus theory of normative
conduct: Recycling the concept of norms to reduce littering in public places.
137 Journal of Personality and Social Psychology, 58(6), 1015–1026.
Clarke, L., & Agyeman, J. (2011). Shifting the balance in environmental governance:
ethnicity, environmental citizenship and discourses of
responsibility. Antipode, 43(5), 1773-1800.
Cramer, J. C. (1998). Population growth and air quality in California. Demography,
35(1), 45–56.
Creswell, J. W. (2012). Educational research: Planning, conducting, and evaluating
quantitative (4th ed.). Boston, MA: Pearson Education, Inc.
Derksen, L., & Gartrell, J. (1993). The social context of recycling. American Sociological
Review, 58(3), 434-442.
Desipio, L. (2011). Immigrant incorporation in an era of weak civic institutions:
Immigrant civic and political participation in the United States. American
Behavioral Scientist, 55(9), 1189-1213.
Ehrlich, P. R. (2002). Human natures, nature conservation, and environmental
ethics. Bioscience, 52(1), 31-43.
Ewing, W. A. (2004). Missing the forest for the trees: The environmental arguments of
immigration restrictionists miss the point. Immigration Policy Center, American
Immigration Council. Retrieved March 15, 2016 from
http://www.Immigrationpolicy.Org/Special-Reports/Missing-Forest-Trees-
Environmental-Arguments-Immigration-Restrictionists.
Fielding, K. S., & Head, B. W. (2012). Determinants of young Australians’
environmental actions: The role of responsibility attributions, locus of control,
knowledge and attitudes. Environmental Education Research, 18(2), 171–186.

138 Frederiks, E. R., Stenner, K., & Hobman, E. V. (2015). The socio-demographic and
psychological predictors of residential energy consumption: a comprehensive
review. Energies, 8(1), 573-609.
Gibson, C., Farbotko, C., Gill, N., Head, L., & Waitt, G. (2013). Household
sustainability: Challenges and dilemmas in everyday life. Edward Elgar
Publishing.
Gifford, R., & Nilsson, A. (2014). Personal and social factors that influence pro-
environmental concern and behavior: A review. International Journal of
Psychology, 49(3), 141-157.
Gilg, A., Barr, S., & Ford, N. (2005). Green consumption or sustainable lifestyles?
Identifying the sustainable consumer. Futures, 37(6), 481-504.
Goodall, H. (2008). Will environmental history save the world? History Australia, 5(1),
13-16.
Guagnano, G. A., Stern, P. C., & Dietz, T. (1995). Influences on attitude-behaviors
relationships: A natural experiment with curbside recycling. Environment and
Behavior, 27(5), 699-718.
Hackett, B., & Lutzenhiser, L. (1991). Social structures and economic conduct:
Interpreting variations in household energy consumption. In Sociological
Forum (Vol. 6, No. 3, pp. 449-470). Kluwer Academic Publishers-Plenum
Publishers.
Hand, C. M., & Van Liere, K. D. (1984). Religion, mastery-over-nature, and
environmental concern. Social Forces, 63(2), 555-570.
Head, L., Klocker, N., & Aguirre-Bielschowsky, I. (2018). Environmental values,

139 knowledge and behaviour: Contributions of an emergent literature on the role of
ethnicity and migration. Progress in Human Geography, https://doi.org/10.1177
/0309132518768407.
Heisz, A., & Schellenberg, G. (2004). Public transit use among immigrants. Canadian
Journal of Urban Research, 13(1), 170-191.
Hunter, L. M. (2000). A comparison of the environmental attitudes, concern, and
behaviors of US-born and foreign-born US residents. Population and
Environment, 21(6), 565-580.
Johnson, C. Y., Bowker, J. M. & Cordell, H. K. (2004). Ethnic variation in environmental
belief and behavior: An examination of the new ecological paradigm in a social
psychological context. Environment and Behavior, 36(2), 157-186.
Jones, R. E. (2002). Blacks just don’t care: Unmasking popular stereotypes about concern
for the environment among African-Americans. International Journal of Public
Administration, 25(2-3), 221-251.
Kim, Y., & Choi, S. M. (2005). Antecedents of green purchase behavior: An examination
of collectivism, environmental concern, and PCE. NA - Advances in Consumer
Research, 32, 592-599.
Kim, K., & Moon, S. G. (2012). Determinants of the pro-environmental behaviors of
Korean immigrants in the US. International Review of Public
Administration, 17(3), 99-123.
Klocker, N., & Head, L. (2013). Diversifying ethnicity in Australia's population and
environment debates. Australian Geographer, 44(1), 41-62.
Klocker, N., Toole, S., Tindale, A., & Kerr, S. M. (2015). Ethnically diverse transport

140 behaviours: An Australian perspective. Geographical Research, 53(4), 393-405.
Kluckhohn, F. R., & Strodtbeck, F. L. (1961). Variations in value orientations. Evanston,
IL: Row, Peterson.
Krikorian, M. (2008). The new case against immigration: Both legal and illegal. New
York, NY: Penguin.
Laidley, T. M. (2011). The influence of social class and cultural variables on
environmental behaviors: Municipal-level evidence from Massachusetts.
Environment and Behavior, 45(2), 170-197.
Lane, R., & Gorman-Murray, A. (Eds.). (2011). Material geographies of household
sustainability. Ashgate Publishing, Ltd.
Lee, Y.K. (2017). A comparative study of green purchase intention between Korean and
Chinese consumers: The moderating role of collectivism. Sustainability, 9(10),
1930. doi.org/10.3390/su9101930.
Levine, D. S., & Strube, M. J. (2012). Environmental attitudes, knowledge, intentions and
behaviors among college students. Journal of Social Psychology, 152(3), 308–
326.
Lien, P., Conway, M., & Wong, J. (2004). The politics of Asian Americans: diversity and
community. New York, NY: Routledge.
Lo, L., Shalaby, A., & Alshalalfah, B. (2011). Relationship between immigrant
settlement patterns and transit use in the Greater Toronto Area. Journal of Urban
Planning and Development, 137(4), 470-476.
Lutzenhiser, L. (1997). Social structure, culture, and technology: Modeling the driving
forces of household energy consumption. In P. C. Stern, T. Dietz, V. W. Ruttan,

141
R. H. Socolow, & J. Sweeney (Eds.), Environmentally significant consumption:
Research directions (pp. 77-91). Washington, DC: National Academy Press.
Ma, G., & Hofmann, E. T. (2019). Immigration and environment in the USA: A spatial
study of air quality. The Social Science Journal, 56(1), 94-106.
Macias, T. (2016). Ecological assimilation: Race, ethnicity, and the inverted gap of
environmental concern. Society & Natural Resources, 29(1), 3-19.
Matthies, E., Selge, S., & Klöckner, C. A. (2012). The role of parental behavior for the
development of behavior specific environmental norms—The example of
recycling and reuse behavior. Journal of Environmental Psychology, 32(3), 277–
284.
McCarty, J.A. & Shrum, L.J. (2001). The influence of individualism, collectivism, and
locus of control on environmental beliefs and behavior. Journal of Public Policy
and Marketing, 20(1), 93–104.
Merchant, C. (2003). Shades of darkness: Race and environmental history.
Environmental History, 8(3), 380-394.
Migration Policy Institute (MPI). (2018). Retrieved March 1, 2018 from
http://www.Migrationpolicy.Org/Programs/Data-Hub/Charts/Largest-Immigrant-
Groups-Over-Time.
Mobley, C., Vagias, W.M., & Deward, S. L. (2010). Exploring additional determinants of
environmentally responsible behavior: The influence of environmental literature
and environmental attitudes. Environment and Behavior, 42(4), 420–447.
Modarres, A. (2013). Commuting and energy consumption: Toward an equitable
transportation policy. Journal of Transport Geography, 33, 240-249.

142 Myers, D. (1997). Changes over time in transportation mode for journey to work: Effects
of aging and immigration. Decennial Census Data for Transportation Planning:
Case Studies and Strategies for 2000, Vol 2, 84-102.
Neumayer, E. (2006). The environment: One more reason to keep immigrants out?
Ecological Economics, 59(2), 204-207.
Olli, E., Grendstad, G., & Wollebaek, D. (2001). Correlates of environmental behaviors:
Bringing back social context. Environment and Behavior, 33(2), 181-208.
O’neill, B. C., & Chen, B. S. (2002). Demographic determinants of household energy use
in the United States. Population and Development Review, 28, 53-88.
Oreg, S., & Katz-Gerro, T. (2006). Predicting proenvironmental behaviors cross-
nationally: Values, the theory of planned behavior, and value-belief-norm
theory. Environment and Behavior, 38(4), 462-483.
Patton, M. Q. (2002). Qualitative research and evaluation methods. Thousand Oaks,
CA: Sage.
Pfeffer, M. J., & Stycos, M. J. (2002). Immigrant environmental behaviors in New York
City. Social Science Quarterly, 83(1), 64–68.
Pinto, D. C., Nique, W. M., Añaña, E. D. S., & Herter, M. M. (2011). Green consumer
values: How do personal values influence environmentally responsible water
consumption? International Journal of Consumer Studies, 35(2), 122-131.
Poortinga, W., Steg, L., & Vlek, C. (2004). Values, environmental concern, and
environmental behavior: A study into household energy use. Environment and
Behavior, 36(1), 70-93.
Price, C. E., & Feldmeyer, B. (2012). The environmental impact of immigration: An

143 analysis of the effects of immigrant concentration on air pollution levels.
Population Research Policy Review, 31(1), 119-140.
Ramakrishnan, S. K., & Viramontes, C. (2010). Civic spaces: Mexican hometown
associations and immigrant participation. Journal of Social Issues, 66(1), 155-
173.
Reid, L., Sutton, P., & Hunter, C. (2010). Theorizing the meso level: The household as a
crucible of pro-environmental behaviour. Progress in Human Geography, 34(3),
309-327.
Schultz, P.W., Zelezny, L., & Dalrymple, N. J. (2000). A multinational perspective on the
relation between judeo-christian religious beliefs and attitudes of environmental
concern. Environment and Behavior, 32(4), 576-591.
Simcox, D. E. (1992). Sustainable immigration: Learning to say no. Elephants in the
Volkswagen: Facing the Tough Questions about Our Overcrowded Country. New
York, NY: W.H. Freeman & Company.
Smith, R. (2006). Mexican New York: Transnational lives of new immigrants. University
of California Press.
Sodowsky, G. R., Maguire, K., Johnson, P., Ngumba, W., & Kohles, R. (1994). World
views of White American, mainland Chinese, Taiwanese, and African students:
An investigation into between-group differences. Journal of Cross-Cultural
Psychology, 25(3), 309-324.
Squalli, J. (2009). Immigration and environmental emissions: A U.S. county-level
analysis. Population and Environment, 30(6), 247-260.
Squalli, J. (2010). An empirical assessment of U.S. state-level immigration and
144 environmental emissions. Ecological Economics, 69(5), 1170-1175.
Steel, B. S. (1996). Thinking globally and acting locally? Environmental attitudes,
behavior and activism. Journal of Environmental Management, 47(1), 27-36.
Stern, P. C., Dietz, T., & Guagnano, G. A. (1995). The new ecological paradigm in
social-psychological context. Environment and Behavior, 27(6), 723-743.
Swami, V., Chamorro-Premuzic, T., Snelgar, R., & Furnham, A. (2011). Personality,
individual differences, and demographic antecedents of self-reported household
waste management behaviors. Journal of Environmental Psychology, 31, 21–26.
Tal, G., & Handy, S. (2010). Travel behavior of immigrants: An analysis of the 2001
National Household Transportation Survey. Transport Policy, 17(2), 85-93.
Uteng, T.P. (2009). Gender, ethnicity, and constrained mobility: insights into the
resultant social exclusion. Environment and Planning A, 41(5), 1055 -1071.
Waitt, G., Caputi, P., Gibson, C., Farbotko, C., Head, L., Gill, N., & Stanes, E. (2012).
Sustainable household capability: Which households are doing the work of
environmental sustainability? Australian Geographer, 43(1), 51-74.
Waitt, G., Kerr, S. M., & Klocker, N. (2016). Gender, ethnicity and sustainable mobility:
A governmentality analysis of migrant Chinese women’s daily trips in
Sydney. Applied Mobilities, 1(1), 68-84.
Walton, T., & Austin, D. M. (2011). Pro-environmental behaviors in an urban social
structural context. Sociological Spectrum, 31(3), 260-287.
White, Jr., L. (1967). The historical roots of our ecologic crisis. Science, 155 (3767),
1203-1207.

145
CHAPTER V
CONCLUSION
The environmental impact of immigration lies at the intersection of immigration
and environmental issues, which are contentious and have a great influence on society.
Yet, the relationship between immigration and the environment has not been
systematically examined. Although immigration is the driving force of population growth
in the USA, this population increase is important for the nation with an aging population
and a lower fertility rate than replacement level. Environmental restrictionism has been
criticized for using environmental pressure to justify the restriction on immigration
(Hultgren 2014; Neumayer 2006). While immigration can be an easy target, blaming
immigration diverts attention from addressing the issues associated with either
immigration or the environment. The key to address the issues is examining whether
immigrant population causes environmental harm disproportionately to its numbers
(Kraly 1998).
All populations consume natural resources and generate waste and pollution. The
difference is the amount that each population consumes and generates. On the one hand,
research finds that immigrants tend to have a smaller environmental footprint than native-
born people. Quantitative research finds that the U.S.-born population is more likely to be
associated with worse air quality, while the immigrant population is more likely to be
associated with better air quality (Cramer 1998; Price and Feldmeyer 2012; Squalli 2009,
2010). Similarly, qualitative research shows that immigrants are more likely than native-
born people to use public transportation, drive less, and use less energy (Australian

146 Bureau of Statistics 2012; Blumenberg and Smart 2010; Chatman and Klein 2009; Heisz
and Schellenberg 2004; Hunter 2000; Pfeffer and Stycos 2002; Uteng 2009).
On the other hand, the high-consumption lifestyle in the USA has been
overlooked. Scholars, largely outside the USA, call for a rethinking of Western
environmentalism that prioritizes dominant culture over ethnic cultures and ignores high-
consumption lifestyles (Baldwin 2009; Bradley 2009; Head et al. 2019; Klocker and
Head 2013; Merchant 2003; Neumayer 2006). Cultural diversity has been recognized as a
valuable resource for promoting environmental sustainability (Anderson 2005; Bradley
2009; Ehrlich 2002; Goodall 2008; Head et al. 2019; Klocker and Head 2013).
My dissertation examines the environmental consequences of immigration and
compares environmental behaviors between U.S.-born and foreign-born populations. The
two quantitative studies advance the literature by accounting for spatial autocorrelation of
air quality at the county level. One cross-sectional study covers the entire U.S. continent,
and one panel study analyzes the association between populations and air quality over a
time span of eight years. The qualitative study investigates household environmental
behaviors to explain the varying associations between U.S.-born and foreign-born
populations and the environment.
Discussion
My dissertation provides some interesting findings. The spatial cross-sectional
study shows that a larger U.S.-born population is significantly associated with worse air
quality while immigrant population is associated with better air quality. Accounting for
spatial autocorrelation of the data across the contiguous U.S. counties, this study supports
the previous studies (Cramer 1998; Price and Feldmeyer 2012; Squalli 2009, 2010).

147 However, like the other studies, this research is not able to determine causality but mere
association. Population, either U.S.-born or foreign-born, may not significantly affect air
quality but may be pulled or deterred by air quality in a certain area.
The spatial panel study gains deeper insights into the associations between
population and air quality. It finds that populations, including total population, U.S.-born
population, and sometimes foreign-born population, are associated with better air quality
across approximately one-third of U.S. contiguous counties over time. This result is
incongruent with prior findings that population size is generally associated with some
pollutants (Cole and Neumayer 2004; Cramer 1998; Cramer and Cheney 2000; Lankao et
al. 2009; Laureti et al. 2014; Preston 1996; Price and Feldmeyer 2012; Squalli 2009,
2010) and that U.S.-born population is more likely than foreign-born population to be
associated with worse air quality in my spatial cross-sectional study and other studies
(Cramer 1998; Price and Feldmeyer 2012; Squalli 2009, 2010).
The disparity in the findings between my panel study and prior studies is probably
a result of differences in data and methodologies. The spatial panel study accounts for
spatial autocorrelation of the data for the first time in the studies on the population-
environment relationship. The finding is in accordance with political economy theories
that population growth is not the primary cause of air pollution. It also supports the
empirical studies that the developed countries consume more natural resources and
contribute to more environmental harms (Ewing 2004; York and Rosa 2012) and the
consequences of the overconsumption in these countries are transported to developing
countries through ecologically unequal exchange (Bunker 1984; Hoekstra et al. 2016;
Jorgenson and Clark 2009; Rice 2007; Roberts and Parks 2007; Weber and Matthews

148 2007). Therefore, population pressure on the environment in the USA is mitigated by
transferring environmental problems to other countries in the capitalist world system.
While the spatial panel study finds that population is not the root cause of air
pollution, the cross-sectional study indicates that, at least in the short run, associations
with air quality vary by populations. These differential associations are supported by the
studies showing that immigrants may be less harmful to the environment because of their
lower consumption than U.S.-born people (Atiles and Bohon 2003; Blumenberg and
Shiki 2008; Bohon et al. 2008; Chatman and Klein 2009; Hunter 2000; Pfeffer and
Stycos 2002; Takahashi et al. 2017). The variations may be related to cultural, political,
and economic contexts that shape consumption patterns.
The qualitative study explores cultural differences underpinning the varying
associations with the environment. Chinese and Mexican immigrants are more likely than
U.S.-born Whites to use less energy, drive less, recycle, and produce less waste, although
there are also notable differences in behaviors between Chinese and Mexican immigrants.
This result is in line with prior studies on environmental behaviors of immigrants, but
also highlights the importance of understanding the cultural values behind environmental
actions (Chatman and Klein 2009; Hackett and Lutzenhiser 1991; Hunter 2000; Johnson
et al. 2004; Lutzenhiser 1997; Pfeffer and Stycos 2002). The finding seems inconsistent
with the spatial cross-sectional study showing that Chinese immigrants are associated
with worse air quality and Mexican immigrants are not statistically associated with air
quality. However, Asians, including Chinese immigrants, are more likely to live in urban
areas (Jensen 2006). Therefore, Chinese immigrants’ association with worse air quality is
possibly a result of settlement choices rather than consumption patterns. The diaspora of
149 Mexican immigrants in the USA also indicates variations in their relationships with air
quality.
Nevertheless, the pro-environmental behaviors of the immigrants decline as they
assimilate into the American lifestyle featured by the high-consumption of energy. It
thereby raises questions about assimilation. If the assimilation of immigrants into the
mainstream culture is not good for the environment, why should assimilation be a policy
priority? Is the assumption that American environmentalism is superior to those of
immigrants a barrier to environmental sustainability? How can ethnic diversity be
incorporated into the mainstream environmentalism to advance environmental
sustainability? These questions deserve more considerations in the effort toward
environmental sustainability in the USA.
Policy Implications
The findings of my dissertation suggest a few policy implications. First, policies
restricting immigration would not effectively improve environmental quality such as air
quality in the USA. Immigrant population is less likely to be associated with worse air
quality than U.S.-born population and more likely to engage in behaviors that cause less
harm to the environment. Although cutting down the numbers of immigrants reduces
population size and growth simultaneously, high-consumption rates by the U.S.-born
population are likely to offset this bonus and perpetuate environmental issues.
Second, more attention should be paid to the effect of high-consumption lifestyles
on the environment. Both the public and the policymakers should be informed of the
environmental consequences of high-consumption lifestyles. U.S.-born people often take
their lifestyle for granted without thinking of alternatives. However, high consumption

150 creates environmental problems not only in the USA but also overseas through
ecologically unequal exchange. The interconnectedness of the environment does not
allow any population to be separated from the environment in other areas on the earth.
Environmental education would help people to connect their daily life with the
environment and develop an awareness of responsible environmental behavior. Policies
could also direct people towards more environmentally friendly behaviors.
Third, joint efforts need to be made to address environmental issues that are
rooted in the political and economic systems. The political economy approach posits that
a capitalist system drives high consumption which causes environmental harm (Kovel
2002; Park and Pellow 2011; Schnaiberg 1980, Speth 2008). While educating the public
is important to make a change, capitalism influences people’s daily decisions more
powerfully. The environment cannot be improved without addressing the driving force
behind the high consumption.
Fourth, social context should also be considered in encouraging people to be
environmentally friendly. It is highly desired to provide institutional support and
infrastructure to engage people in environmentally responsible behaviors. Convenient and
advanced public transportation would reduce driving emissions. More access to
recycling would make it easy for people to engage in recycling. It is sustainable to
promote clean energy such as solar energy through subsidization or other incentives.
Lastly, environmental policy should take diverse cultures into consideration.
While American consumerism is not environmentally friendly, it is necessary to find
alternatives for environmental sustainability. It is promising to learn from other ethnic
cultures about the practices that are less harmful to the environment. The USA has the

151 advantage of diverse ethnicities and cultures that can contribute to environmental
sustainability.
Future Research
This work began as an effort to explore the possible differences in environmental
impact between immigrants and U.S.-born people, using spatial analysis of air quality
and interviews of environmental behaviors. Given the availability of data, methodologies,
and funding, this work suffers some limitations. It indicates several directions for future
research. First, spatial studies of environmental impact can contribute substantially to our
understanding of the relationship between population and the environment. The
environmental impact is still understudied. Research can extend spatial studies to lower
levels of analysis than county level to measure the characteristics of the locations more
accurately, and thus, provide better knowledge about the relationships between
population and the environment.
Second, the impact on other domains of the environment needs to be investigated.
There are various indicators of environmental quality, such as water and land quality.
Spatial analysis is very useful to study environmental issues because of the
autocorrelation of the environment across spatial units. Research on various domains of
the environment would assess the association between population/immigration and the
environment comprehensively.
Third, research on environmental behaviors may use various methods other than
interview. For instance, survey can collect more information from larger and more
immigrant populations. Comparative studies of various ethnic minorities will shed light
on the different practices and their impacts on the environment. These analyses will be

152 informative for the public and policymakers to make an effort for change.
Fourth, assimilation research that turns to reciprocal assimilation instead of
assimilation of immigrants into the mainstream holds promise for environmental
sustainability by bridging values of diverse cultures. The traditional assimilation theory
assumes that mainstream culture is superior to the immigrants’ cultures and needs to be
adopted by immigrants. The more harm caused by American consumerism than other
ethnic values reminds us that assimilation can be reciprocal for the sake of the
environment.

153 References
Anderson, K. (2005). Griffith Taylor lecture, geographical Society of New South Wales,
2004: Australia and the ‘state of nature/native’. Australian Geographer, 36(3),
267-282.
Atiles, J. H., & Bohon, S. A. (2003). Camas calientes: Housing adjustments and barriers
to social and economic adaptation among Georgia’s rural Latinos. Southern Rural
Sociology, 19(1), 97-122.
Australian Bureau of Statistics (ABS). (2012). Transport Data Generated Using ABS
TableBuilder, ABS, Canberra.
Baldwin, A. (2009). The white geography of Lawren Stewart Harris: Whiteness and the
performative coupling of wilderness and multiculturalism in Canada.
Environment and Planning A, 41(3), 529-544.
Blumenberg, E., & Smart, M. (2010). Getting by with a little help from my friends… and
family: immigrants and carpooling. Transportation, 37(3), 429-446.
Blumenberg, E., & Shiki, K. (2008). Immigrants and resource sharing: The case of
carpooling. In Proceedings of the Transportation Research Board 87th Annual
Meeting. Washington DC: Transportation Research Board.
Bohon, S. A., Stamps, K., & Atiles, J. H. (2008). Transportation and migrant adjustment
in Georgia. Population Research and Policy Review, 27(3), 273-291.
Bradley, K. (2009). Planning for eco-friendly living in diverse societies. Local
Environment, 14(4), 347-363.
Bunker, S. G. (1984). Modes of extraction, unequal exchange, and the progressive
underdevelopment of an extreme periphery: The Brazilian Amazon, 1600-

154 1980. American Journal of Sociology, 89(5), 1017-1064.
Chatman, D. G., & Klein, N. (2009). Immigrants and travel demand in the United States:
Implications for transportation policy and future research. Public Works
Management & Policy, 13(4), 312-327.
Cole, M. A., & Neumayer, E. (2004). Examining the impact of demographic factors on
air pollution. Population and Environment, 26, 5-21.
Cramer, J. C. (1998). Population growth and air quality in California. Demography,
35(1), 45–56.
Cramer, J. C., & Cheney, R. P. (2000). Lost in the ozone: Population growth and ozone in
California. Population and Environment, 21(3), 315–337.
Ehrlich, P. R. (2002). Human natures, nature conservation, and environmental ethics.
Bioscience, 52(1), 31-43.
Ewing, W. A. (Mar 01, 2004). Missing the forest for the trees: The environmental
arguments of immigration restrictionists miss the point. Restrictionist Watch.
Retrieved Jan 1, 2018 from https://www.shusterman.com/pdf/restrict504.pdf.
Goodall, H. (2008). Will environmental history save the world? History Australia, 5(1),
13-16.
Kovel, J. (2002). The Enemy of Nature: The End of Capitalism or the End of the World?
New York: Zed Books.
Kraly, E. P. (1998). Immigration and environment: A framework for establishing a
possible relationship. Population Research and Policy Review, 17(5), 421–437.
Hackett, B., & Lutzenhiser, L. (1991). Social structures and economic conduct:
Interpreting variations in household energy consumption. In Sociological Forum,

155 6(3), 449-470. Kluwer Academic Publishers-Plenum Publishers.
Head, L., Klocker, N., & Aguirre-Bielschowsky, I. (2019). Environmental values,
knowledge and behaviour: Contributions of an emergent literature on the role of
ethnicity and migration. Progress in Human Geography, 43(3), 397-415.
Heisz, A., & Schellenberg, G. (2004). Public transit use among immigrants. Canadian
Journal of Urban Research, 13(1), 170-191.
Hoekstra, R., Michel, B., & Suh, S. (2016). The emission cost of international sourcing:
Using structural decomposition analysis to calculate the contribution of
international sourcing to CO2-emission growth. Economic Systems
Research, 28(2), 151-167.
Hultgren, J. (2014). The “nature” of American immigration restrictionism. New Political
Science, 36(1), 52-75.
Hunter, L. M. (2000). A comparison of the environmental attitudes, concern, and
behaviors of native-born and foreign-born US residents. Population and
Environment, 21, 565-580.
Jensen, L. 2006. New Immigrant Settlements in Rural America: Problems, Prospects, and
Policies. Report on Rural America 1(3). Durham, NH: Carsey Institute.
Johnson, C. Y., Bowker, J. M. & Cordell, H. K. (2004). Ethnic variation in
environmental belief and behavior: An examination of the new ecological
paradigm in a social psychological context. Environment and Behavior, 36(2),
157-186.
Jorgenson, A. K., & Clark, B. (2009). Ecologically unequal exchange in comparative
perspective: A brief introduction. International Journal of Comparative

156 Sociology, 50(3-4), 211-214.
Klocker, N., & Head, L. (2013). Diversifying ethnicity in Australia's population and
environment debates. Australian Geographer, 44(1), 41-62.
Lankao, P. R., Tribbia, J. L., & Nychka, D. (2009). Testing theories to explore the drivers
of cities' atmospheric emissions. AMBIO: A Journal of the Human
Environment, 38(4), 236-244.
Laureti, T., Montero, J. M., & Fernández-Avilés, G. (2014). A local scale analysis on
influencing factors of NOx emissions: Evidence from the community of Madrid,
Spain. Energy Policy, 74, 557-568.
Lutzenhiser, L. (1997). Social structure, culture, and technology: Modeling the driving
forces of household energy consumption. In P. C. Stern, T. Dietz, V. W. Ruttan,
R. H. Socolow, & J. Sweeney (Eds.), Environmentally Significant Consumption:
Research Directions (pp. 77-91). Washington, DC: National Academy Press.
Merchant, C. (2003). Shades of darkness: Race and environmental history.
Environmental History, 8(3), 380-394.
Neumayer, E. (2006). The environment: One more reason to keep immigrants out?
Ecological Economics, 59, 204–207.
Park, L. S. H., & Pellow, D. N. (2011). The Slums of Aspen: Immigrants vs. the
Environment in America’s Eden. New York: New York University Press.
Pfeffer, M. J., & Stycos, M. J. (2002). Immigrant environmental behaviors in New York
City. Social Science Quarterly, 83, 64–68.
Preston, S. H. (1996). The effect of population growth on environmental quality.
Population Research and Policy Review, 15(2), 95–108.

157 Price, C. E., & Feldmeyer, B. (2012). The environmental impact of immigration: An
analysis of the effects of immigrant concentration on air pollution levels.
Population Research Policy Review, 31(1), 119-140.
Rice, J. (2007). Ecological unequal exchange: International trade and uneven utilization
of environmental space in the world system. Social Forces, 85(3), 1369-1392.
Roberts, J. T., & Parks, B. C. (2007). Fueling injustice: Globalization, ecologically
unequal exchange and climate change. Globalizations, 4(2), 193-210.
Schnaiberg, A. (1980). The Environment: From Surplus to Scarcity. Oxford, United
Kingdom: Oxford University Press.
Speth, J. G. (2008). The Bridge at the Edge of the World: Capitalism, the Environment,
and Crossing from Crisis to Sustainability. New Haven, CT: Yale University
Press.
Squalli, J. (2009). Immigration and environmental emissions: A U.S. county-level
analysis. Population and Environment, 30(6), 247-260.
Squalli, J. (2010). An empirical assessment of U.S. state-level immigration and
environmental emissions. Ecological Economics, 69(5), 1170-1175.
Takahashi, B., Duan, R., & Van Witsen, A. (2018). Hispanics’ behavioral intentions
toward energy conservation: The role of sociodemographic, informational, and
attitudinal variables. Social Science Quarterly, 99(1), 341-361.
Uteng, T.P. (2009). Gender, ethnicity, and constrained mobility: insights into the
resultant social exclusion. Environment and Planning A, 41(5), 1055 -1071.
Weber, C. L., & Matthews, H. S. (2007). Embodied environmental emissions in US
international trade, 1997− 2004. Environmental Science & Technology, 41(14),

158 4875–4881.
York, R., & Rosa, E. A. (2012). Choking on modernity: A human ecology of air
pollution. Social Problems, 59(2), 282–300.

159
APPENDICES

160

161

162

163

164

165

166

167

168
169
170

171

172

173

174

175

176
Guizhen Ma Department of Sociology, Social Work, and Anthropology
Utah State University, Logan, UT 84322-0730 [email protected]
EDUCATION
Ph.D. in Sociology, Utah State University Expected May 2020 M.A. in Economics, Xiamen University, China 1997 College Diploma, Statistics, Shenyang Metallurgical Machinery College, China 1991 PUBLICATIONS
Ma, Guizhen. 2019. Similar or Different? A Comparison of Environmental Behaviors of US-Born Whites and Chinese Immigrants. Journal of International Migration and Integration, 20(4): 1203-1223. https://link.springer.com/article/10.1007%2Fs12134-019-00653-4.
Ma, Guizhen and Erin Trouth Hofmann. 2019. Population, Immigration, and Air Quality in the U.S.: A Spatial Panel Study. Population and Environment, 40(3):283-302. https://link.springer.com/article/10.1007%2Fs11111-018-0311-9.
Ma, Guizhen and Erin Trouth Hofmann. 2019. Immigration and Environment in the U.S.: A Spatial Study of Air Quality. The Social Science Journal, 56(1):94-106. https://www.sciencedirect.com/science/article/pii/S0362331918301162?dgcid=author.
Jackson-Smith, Douglas, Courtney G. Flint, Mallory Dolan, Carla K. Trentelman, Grant Holyoak, Blake Thomas, and Guizhen Ma. 2016. Effectiveness of the Drop-Off/Pick-Up Survey Methodology in Different Neighborhood Types. Journal of Rural Social Sciences, 31(3):35–66.
MANUSCRIPTS UNDER REVIEW
Ma, Guizhen. Community Attachment: Perceptions of Context Matters. AWARDS
Larry Gould Best Article Award, the Western Social Science Association and The Social Science Journal, 2019 Graduate Student Paper Award, Natural Resources Research Group of the Rural Sociology Society, 2015

177 CONFERENCE PRESENTATIONS
Ma, Guizhen. A Comparison of Environmental Behaviors of US-Born Whites and Chinese Immigrants. The 2018 Utah Demography Summit, Salt Lake City, UT, October 26, 2018.
Ma, Guizhen and Erin Trouth Hofmann. Population, Immigration, and Air Quality in the U.S.: A Spatial Panel Study. The 24th International Symposium on Society and Resource Management (ISSRM), Salt Lake City, UT, June 17-21, 2018.
Ma, Guizhen. Environmental Behavior and Air Quality in the U.S.: The Case of Chinese Immigrants. The 89th Annual Meeting of the Pacific Sociological Association (PSA), Long Beach, CA, March 28-31, 2018.
Ma, Guizhen and Erin Trouth Hofmann. Environmental Impact of Immigration to the U.S.: An Empirical Study of Air Quality. Annual Meeting of the Population Association of America (PAA), Chicago, IL, April 27-29, 2017.
Ma, Guizhen. China’s Forest Tenure Reform: Socially Differentiated Entitlements. Annual Meeting of the Rural Sociology Society (RSS), Toronto, Canada, August 7-10, 2016.
Ma, Guizhen and Conner Bailey. Privatization of China’s Collectively-Owned Forestlands: Need for Social Science Research. Annual Meeting of the Rural Sociology Society (RSS), Madison, WI, August 6-9, 2015.
PROFESSIONAL EXPERIENCES
Lecturer, Assistant Professor, Associate Professor Department of Economics and Management, Southwest Forestry University, Kunming, China, 2000-2014
Visiting Scholar School of Forestry and Wildlife Sciences, Auburn University, USA, 2012-2013 School of Forestry, Kasetsart University, Thailand, 2001
GRANTS AND FELLOWSHIPS
Dissertation Fellowship, Graduate School, Utah State University, 2019-2020 Mountain West Center for Regional Studies Small Grants Program, Utah State University, for the project on “Environmental Behavior Related to Air Quality: A Qualitative Study of Chinese Immigrants,” 2017 Fellowship and Research/Teaching Assistantships Utah State University Department of Sociology, Social Work, and Anthropology, 2014-2020

178 PROFESSIONAL SERVICES
Journal Reviewer
• Population and Environment, February 2019, July 2019, March 2020, April 2020
• The Annals of Regional Science, November 2019 Conference Moderator, The 24th International Symposium on Society and Resource Management (ISSRM), Salt Lake City, UT, June 19, 2018
Student representative, Rural Sociology Society Membership Committee, 2016 TEACHING EXPERIENCE
Instructor:
• Social Statistics (SOC 3120), Utah State University Spring 2019, Summer 2018, Summer 2017 • Social Problems (SOC1020), Utah State University Fall 2018, Spring 2018 • Economics courses, including Microeconomics and International Trade,
Southwest Forestry University, China 2000-2014 Teaching Training:
• Sociology Teaching Certificate, Utah State University Spring 2019 SKILLS
Proficient in Stata, SPSS, ArcGIS, GeoDa, and GeoDaSpace