
NH2-truncated human tau induces deregulated mitophagy in ...
THE ECONOMIC RECORD, VOL. 12, NO. 216. MARCH 1996, 24-35
The Economic Efficiency of Telecommunications in a Deregulated Market: The case of New Zealand*
DAVID BOLES DE BOER and LEWIS EVANS Finance Performance Group,
Telecom New Zealand Limited, Department of Economics,
Victoria University of Wellington, Wellington Wellington
This paper estimates the productivity and consumer and producer changes in the New Zealand telecommunications network market between 1987, when it was deregulated, and 1993; as the major firmv Telecom, evolved from a government department to a public company in an environment of light regulation. The growth in pro- ductivity is estimated to reduced costs at an annual compound average of 5.6 per cent. The bulk of the substantial gains in con- sumer surplus has come from price reductions on 1987 consump- tion levels. There has been marked improvements in the quality of outputs. Shareholders have had a profitable investment.
1 lntroduction Public policy towards oligopolistic markets with
firms tending to natural monopolies has under- gone dramatic change in many countries. None more so than in New Zealand where the concept of ‘soft regulation’ was first implemented. This form of regulation was adopted in 1987 as part of the economy-wide deregulatory experience dating from 1984. It eschews industry-specific regu- lation, relying instead on the potential for entry to discipline behaviour within the context of a busi- ness environment for which the competitive prac- tices of all firms are subject to a single Commerce Act. The performance of markets under soft regu- lation is critical to the continuance of this policy. This paper examines New Zealand’s telecommu- nications market from 1987 until 1993. It contains an example of the creation of a state owned enter-
* The paper has benefited from the comments of Paul Baines, Stephen Burnell. Colin Campbell-Hunt, Melvyn Fuss, John McMillan, Ingo Vogelsang. and two refe- rees. It was presented at a University of Toronto Insti- tute for Policy Analysis seminar and the Western Social Science Association annual conference 1994. Telecom New Zealand Limited provided virtually unfettered access to data.
prise from a government department, and then its sale by tender on the open market. The study finds that there was significant productivity growth resulting in an annual compound rate of cost reduction of 5.6 per cent. This contributes to very considerable gains in consumers’ surplus over the period, and the telecommunication firm’s profit- ability to investors. Studies of this sort are required if the soft regulatory policy itself is to be appraised. On the basis of this study the policy is a success.
New Zealand’s wide-ranging reforms included the deregulation of foreign exchange and financial markets, removal of agricultural subsidies, reduc- tion of tariffs and removal of quantitative import restrictions, substitution of value-added for income taxes, labour market deregulation and revamping the public sector. The public sector had included industries historically perceived to be natural monopolies. The key component of its reform was that the core public service could be separated from activities that delivered goods and services for which good substitutes could be found, or produced, in the private sector. Essen- tially, the choice of organizational structure was based upon the extent to which output could be
24
1996. The Economic Society of Australia. ISSN 00134249.
I996 EFFICIENCY OF TELECOMMUNICATIONS 25
measured. Those activities that were amenable to measurement, for example railway, postal and tel- ecommunications services and forestry produc- tion, were bundled into stand-alone state enterprises, and those of a qualitative nature, for example policy advice, were retained in the form of government departments. Lying between these extremes of measurability, the government has retained a strong managerial and funding role in health and education, and one of the factors in this has been the extent of asymmetric information reflecting difficulties of quantification of outputs in these areas. Carroll (1991) makes a formal argument of the importance of output measurabil- ity for the nature of the delivering organization. It draws on the multi-task principal-agent model of Holmstrom and Milgrom (1991).
The central argument as to why government departments perform less economically efficiently than State Owned Enterprises (SOEs) which, in turn, perform less efficiently than private firms has to do with the political connection to man- agement, multiple objectives and the absence of an immutable budget constraint.' The growing lit- erature on the relative performance of government and privately owned firms had, by the early 199Os, reached the view of Yarrow (1986) that what mattered was competition and managerial accountability. A difficulty with the managerial component of this conclusion is that certain incen- tives and accountability mechanisms are endemic to each form of ownership.
The recent review of Megginson, Nash and Van Randenborgh (1994) of pre- and post-privatization operating performance of 61 companies in 18 countries and 32 industries documents strong per- formance improvements following full, and in some cases, partial privatization. However, the measurements of the review do not include total factor productivity and economic efficiency: instead they rely on ratios of various measures of profitability and output to various measures of input. Galal, Jones, Tandon and Vogelsang (1992) construct counterfactuals for comparison and con- clude that in 1 1 of the 12 cases they examine there were net welfare gains for privatization. They report that employees as a group were not made worse off and Megginson et al . report that there is no evidence that employment falls with priva-
'Economic efficiency is taken to be the sum of pro- ducer and consumer surpluses. It is affected by the firm's pricing decisions and its productivity or, in Lie- benstein's (1966) terms, x-efficiency.
tization. There has been both a fall in employment and significant welfare gains in New Zealand's telecommunications network industry since its dissolution as a government department.2
II The Evolution of Telecom Established in the 19th century as a postal
organization to which responsibilities for tele- graph and telephony were later added, the New Zealand Post Office (NZPO) operated as a Depart- ment of State under the Post Office Act of 1959. In addition to delivering telecommunications, postal and banking services, it provided govern- ment with policy advice, and regulated the tele- communications and radio networks. The NZPO was an archetypal government trading department. It was constrained in its operation by the Public Service terms and conditions of employment and operating systems. It was highly centralized and its senior managers were not allocated responsi- bility for the resources required for their tasks. The NZPO's pricing and provision were very much determined by the Cabinet of the elected political party via the minister responsible for the Department. Investment decisions had to pass political criteria. Their financing required formal government approval and was subject to the scru- tiny of the Treasury. The fact that the NZPO reg- ulated telecommunications at the same time as providing them led to confused objectives and restricted competition.
Telecommunications operations and assets were bundled into an SOE, Telecom Corporation of New Zealand, on 1 April 1987. The Telecom- munications Act of 1987 provided for the removal of regulatory restrictions on the supply of all tel- ecommunications equipment by mid- 1988, and by 1 April 1989 Telecom's statutory monopoly was eliminated. The terms and conditions of compet- itive firms' connections to the network were
*Until 1992 Telecom was the sole firm in the tele- communications market. We equate the telecommuni- cations network industry with Telecom although since that date Clear Corporation has made inroads into the tolls market. Clear Corporation started operating in the New Zealand Telecommunications market in 1991. It is majority owned by MCI Communications and Bell Canada from North America and minority partnered by New Zealand based companies Television New Zealand, Todd Corporation and New Zealand Railways. It has focused on the toll market where it has gained significant market share. In 1993 the second major com- petitor, Bell South, started to establish a cell-phone network.
26 THE ECONOMIC RECORD MARCH
subject only to the economy-wide Commerce Act 1986: the key features of which for Telecom are Section 363. and a provision for price control to be invoked. The absence of any industry-specific regulatory body and no regulatory impediment to entry are features of New Zealand’s soft regulation.4
Some industry-specific regulation was imposed through the government’s ownership of the SOE, and at the time of privatization by the govern- ment’s retention of a ‘Kiwi’ share which requires that, for residential consumers: there will be a free local calling option, rental on a standard line will not rise faster than the Consumer Price Index (CPI) (unless the profits of Telecom’s operating companies are unreasonably impaired), and rural rentals will not exceed urban rentals. In addition, under the Telecommunications Act 1987, Telecom must retrospectively disclose the terms of and conditions of contracts offering discounts which exceed 10 per cent of listed prices.
Telecom first chose a decentralized organiza- tional structure. Subsidiary companies, including four Regional Operating Companies (ROCs), were allocated their own assets, managers and operational systems, although some central control was retained for large investments. This structure did break up the NZPO departmental hierarchy and provide the potential for competi- tion between sections of the company, and indeed for tournaments for existing NZPO staff to show their abilities and skills in a deregulated business environment? Managers’ performances in the ROCs would affect their promotion in the company and affect their prospects for employ- ment if the decentralized ROCs were replaced by a centralized organizational structure. A central- ized structure was deemed more efficient and restructuring took place in 1992. The current structure is centralized to the point that even faults are monitored and managed from one location.
Following the establishment of the SOE, prices were set on a more commercial basis and capital
3Section 36 requires that no person who has a dom- inant position in a market shall use that position for the purpose of restricting entry or preventing competitive conduct in any market, or eliminating any person from any market. It carries heavy financial penalties for noncompliance.
4An exception is the sharemarket for which the Secu- rities and Exchange Commission has regulatory oversight.
5See Rasmusen 11989.167) for an introduction to . . tournaments in organizations.
investment increased dramatically as Telecom expanded capacity, and improved the quality of the network. From July 1988 to July 1991 the pro- portion of electronic exchanges grew from less than 40 per cent to more than 85 per cent. Some of this work had been proposed under the NZPO. The electronic exchanges reduce operational costs to Telecom, and they improve the quality of con- nections. The investment carried out as an SOE was massive6 There is anecdotal evidence that there has been some excess investment, particu- larly in office and computing equipment and in the capacity of the network.
On 12 September 1990, Telecom was sold by the government to a consortium led by Bell Atlan- tic and Ameritech. Under the competitive tender- ing process the purchase price was NB4.25 billion and the purchasers were required to sell a majority of the shares to private investors? On 19 July 1991 the consortium complied with the requirement and sold 724.5 million shares.
As a corporation with publicly held shares, investment remained at the SOE level for a year, whence followed a substantial reduction in the rate of investment from its peak of 1990. All SOEs were constrained from diversification and more diversified activity has been sought by Telecom since privatization: much aimed at expanding demand for the existing network.
III The Productivify of Telecom In this section we estimate the productivity, or
x-efficiency, change in Telecom over the period 1987-1993, that is, since its incorporation as a SOE.* Records of the antecedent government department do not permit evaluation of depart- mental performance. Productivity change is of interest in itself because many of the arguments for the corporatization and privatization processes have to do with incentives and monitoring and with internal contractual and behavioural changes which will improve the level of output produced by any bundle of inputs; that is, improve x-effi- ciency. Furthermore, productivity change is an important ingredient of the change in consumer and producer welfare which has taken place over
6From 1988 to 1991 NZ$2.6b was invested. ’Also in 1990, the spectrum for radio, television and
cellular-telephone were auctioned. Key features of these auctions have been noted by McMillan (1994,
8Each cited year refers to the year ending March. 148- 150).

1996 EFFICIENCY OF TELECOMMUNICATIONS 21
this period. These welfare changes are examined in the next section.
We focus on network productivity and do not consider ancillary activities such as provision of a business directory and equipment sales. We adopt the standard approach of estimating total factor productivity growth in year r as g[rl = g [ q l - rsg[i] where g[.] denotes rate of growth, q is output, rs is returns to scale and g[il = alg[rnl + a&fl + a3g[k ] is aggregate input growth con- structed using the ai, measured by cost shares; and m, I, and k, respectively, are material input, labour and capital indices9 The growth in total factor productivity is measured as the difference between the growth in the indices of outputs and inputs adjusted for returns to scale. Scale econo- mies mean that rs will exceed one. Telecommu- nications networks are characterized by significant fixed costs and thus enjoy scale economies. For the analysis of welfare in the next section we use as marginal cost a weighted sum of average incre- mental costs calculated for network components in 1992 and fixed costs for that year to calculate network costs. Fixed costs include the joint and common costs which are required to produce the combined outputs of Telecom; in particular they include expenses such as executive personnel costs, executive support costs, for example office space costs, regional management costs and capital charges for non-operational expenses. The presence of fixed and marginal costs means that Telecom does have scale economies and that the returns to scale can be calculated from the meas- ured Telecom network cost function. There is a further complication resulting from the fact that the percentage cost reduction yielded by any pro- ductivity growth will be less than the percentage productivity growth. This occurs because under scale economies efficient input use will adjust less to productivity improvements than would be the case under either decreasing or constant returns to scale. The link between total factor productivity and changes in the cost function are pointed out in the Appendix.
It is likely that g[r ] will also reflect more than simply organizational gains in x-efficiency. Quan- titative output changes may not capture quality changes which are of benefit to consumers and thus may understate output growth which is rele- vant to consumers. We examine this issue by sup-
9For a review and application of this approach see Kendrick (1973). and for an application to utilities see Denny, Fuss and Waverman (1979).
plementing the calculation of g [ t ] with information about changes in quality of service. In addition, inputs may embody technological advance. If this occurs and technological advance of the company is not measured then our index of productivity growth will reflect technological advance as well as organizational efficiencies.1° Finally, we recognize that g[r] is a static concept and that it does not measure dynamic efficiency- which entails choosing the timing and amount of investment in the presence of adjustment costs and intertemporal market and organizational issues. However, the growth of output, inputs and g[r ] over time, together with information such as capacity utilization and quality performance, will aid an assessment of dynamic efficiency.
We now turn to measurement issues. One reason for carrying out a total factor productivity study is that profits and rates of return may not be good indicators of efficiency as they will reflect any departures from Ramsey pricing which may be possible because of the dominant position of the company." Indeed, such pricing, and even Ramsey pricing itself, means that output indices constructed using these prices may not accurately indicate output changes. To address this issue we have chosen to use the price-free measure of aggregate output; total minutes of use of the network.I2 The appropriate index of output is obtained by weighting each output using the
losee Norsworthy and Jang (1992) for discussion of the implication of quality changes for the measurement of productivity and for the estimation of quality adjusted indices.
"Ramsey (1927) provided the pricing rules for a declining cost industry which maximizes consumer welfare under the restriction of normal profits. Where demands are not importantly affected by demands for other outputs, the rules imply pricing above marginal cost in inverse proportion to the elasticity of demand for any output.
I2The issues associated with this measure of output are canvassed in Kiss (1983). The output index aggre- gates minutes of use of local, residential, and business, calls, and domestic and international calls. While minutes of use for toll calls are measured local call minutes of use have to be estimated using various factors, including the number of lines and surveys of the durations and number of calls. The data are much less reliable in the 1980s than those of the 1990s. For this reason the minutes of use in 1987 have also been estimated a second way by using surveys of residential use in the mid 1980s together with relationships between residential and business use in the 1990s. when more data are available.
MARCH THE ECONOMIC RECORD 28
average incremental cost of each output.13 These costs are available for 1992 only, and they provide a measure of aggregate output which is very similar to that used in this study.
The input markets are taken to be competitive. The index for material inputs was constructed by using Statistics New Zealand’s Producer’s Price Index, (PPI), to place expenditure on inputs, other than those associated with capital and labour on a 1987 constant-price basis. Material input has com- ponents such as; power, travel, property rental, stationery, legal advice, vehicles and consultants. Restructuring costs, insofar as they could be iso- lated from the accounts, have been excluded from the input indices, as these costs did not represent inputs which contributed to the delivery of tele- communications outputs.
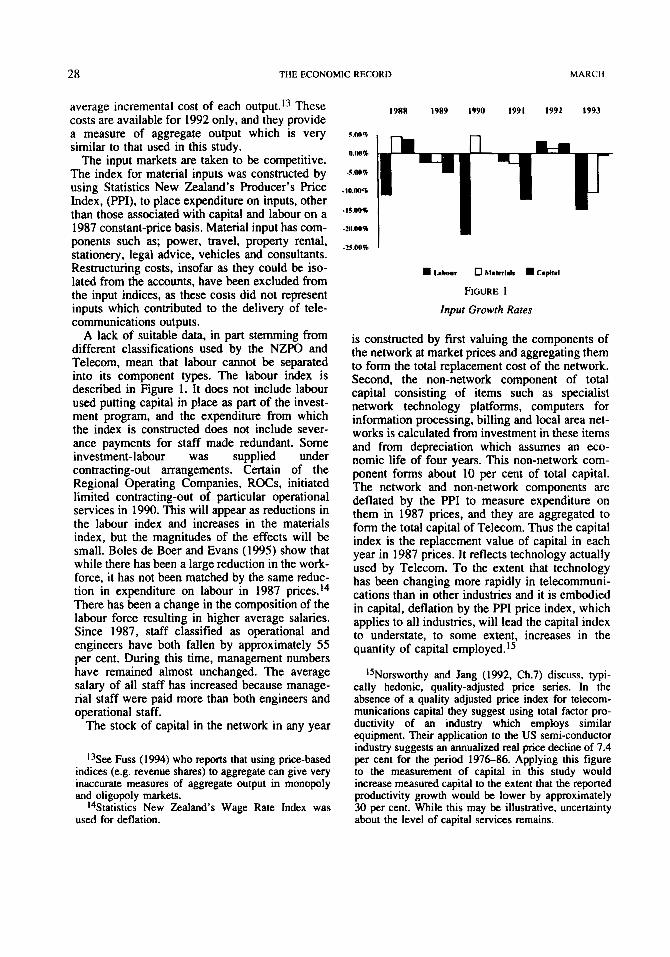
A lack of suitable data, in part stemming from different classifications used by the NZPO and Telecom, mean that labour cannot be separated into its component types. The labour index is described in Figure 1. It does not include labour used putting capital in place as part of the invest- ment program, and the expenditure from which the index is constructed does not include sever- ance payments for staff made redundant. Some investment-labour was supplied under contracting-out arrangements. Certain of the Regional Operating Companies, ROCs, initiated limited contracting-out of particular operational services in 1990. This will appear as reductions in the labour index and increases in the materials index, but the magnitudes of the effects will be small. Boles de Boer and Evans (1995) show that while there has been a large reduction in the work- force, it has not been matched by the same reduc- tion in expenditure on labour in 1987 prices.I4 There has been a change in the composition of the labour force resulting in higher average salaries. Since 1987, staff classified as operational and engineers have both fallen by approximately 55 per cent. During this time, management numbers have remained almost unchanged. The average salary of all staff has increased because manage- rial staff were paid more than both engineers and operational staff.
The stock of capital in the network in any year
13See Fuss (1994) who reports that using price-based indices (e.g. revenue shares) to aggregate can give very inaccurate measures of aggregate output in monopoly and oligopoly markets.
14Statistics New Zealand’s Wage Rate Index was used for deflation.
19x8 1989 1990 1991 1992 1993
c
5.W%
n.m+
-?;.00+
. 1 0 . 0 0 ~
.15.001
-211.00%
-25.00% I
W ~ n k r 0 hlnlcri.h W Cnphi
FIGURE 1
Input Growth Rates
is constructed by first valuing the components of the network at market prices and aggregating them to form the total replacement cost of the network. Second, the non-network component of total capital consisting of items such as specialist network technology platforms, computers for information processing, billing and local area net- works is calculated from investment in these items and from depreciation which assumes an eco- nomic life of four years. This non-network com- ponent forms about 10 per cent of total capital. The network and non-network components are deflated by the PPI to measure expenditure on them in 1987 prices, and they are aggregated to form the total capital of Telecom. Thus the capital index is the replacement value of capital in each year in 1987 prices. It reflects technology actually used by Telecom. To the extent that technology has been changing more rapidly in telecommuni- cations than in other industries and it is embodied in capital, deflation by the PPI price index, which applies to all industries, will lead the capital index to understate, to some extent, increases in the quantity of capital emp10yed.l~
15Norsworthy and Jang (1992. Ch.7) discuss, typi- cally hedonic, quality-adjusted price series. In the absence of a quality adjusted price index for telecom- munications capital they suggest using total factor pro- ductivity of an industry which employs similar equipment. Their application to the US semi-conductor industry suggests an annualized real price decline of 7.4 per cent for the period 1976-86. Applying this figure to the measurement of capital in this study would increase measured capital to the extent that the reported productivity growth would be lower by approximately 30 per cent. While this may be illustrative, uncertainty about the level of capital services remains.
I996 EFFICIENCY OF TELECOMMUNICATIONS 29
During the period of the study, Telecom invested heavily in the network. The balance of this investment between upgrading and raising the capacity of the network to meet anticipated cus- tomer demands, and investment aimed at pre- empting competition is problematical.16 In any event, the substantial investment may have affected the utilization rate of capital, and thus the estimate of productivity change. Although time- series estimates of utilization of the network are not available, there are data which describe the utilization of SPC exchanges: these form 22 per cent of the total value of the network. These data are reported in Boles de Boer and Evans (1995) and they indicate utilization rates declining from 85 per cent in mid 1988 to approximately 75 per cent in 1993. The optimal utilization rate, which recognizes that extra capacity is required for exi- gencies, may be less than 85 per cent, neverthe- less, we explore the effect of utilization on productivity by applying the utilization rates for SPC exchanges across all capital equipment, under the assumption that provision for unantici- pated demand shocks is covered at the 85 per cent rate.
The growth rates of inputs depicted in Figure 1 show that capital has declined steadily over the period: the decline in capital of 1991 reflecting efficiencies achieved under the new SPC exchanges. Given the significant level of invest- ment, the decline is suggestive that the PPI price index used to deflate capital may not have declined at the same rate as a properly-specified price index for capital services. The consequent measure of total factor productivity is likely to include some productivity growth attributable to growth in capital services. However, while it affects the interpretation of total factor productiv- ity it will not affect the measurement of cost reduction. Consider, the rate of change in cost g[c]
+ a3g[wk] obtainable from the Appendix. If g[t] is higher due to lower growth in capital resulting from the price index of capital services declining more rapidly than the PPI, the lowered growth in capital, g [ k ] , will be exactly offset by the decline in g[wk]. in the determination of the rate of growth of costs.
The first substantial decline in labour input
= (l/mJ[ql + (Ws)g[rI + a&,I + q!g[wrl
16The strategic uses of excess capacity to deter entry of a potential entrant, or to discipline the pricing behav- iour of a competitor are discussed in Tirole (1988. Ch.6).
occurred immediately after incorporatization as a SOE, the second was in 1990 just prior to priva- tization, and the third occurred in 1993 as part of a major restructuring, that entailed elimination of the ROCs and the duplication of managerial and administrative services which they represented. Although capital and labour both declined, sub- stitution of capital for labour has taken place. It is noteworthy that material input grew in three years.
The growth in total input was obtained by weighting together the growth rates of the three inputs. For this purpose the annual rental value of capital was calculated using the company’s average cost of capital. The weights, ai, were the ith input’s share of total expenditure, including the rental value of capital, in each year.17
We estimate that output grew over the six years by 35 per cent. When we subtract the growth in total input adjusted for returns to scale we get an annual compound productivity growth of 9.5 per cent. This figure increases to approximately 10 per cent when capital is adjusted for utilization. To the extent that the unutilized capital represents excess capacity which is designed to pre-empt competition, it is the higher figure which repre- sents gains in productivity, but such is the pro- ductivity growth that the capital utilization adjustment does not much affect conclusions. The productivity growth rate is considerably higher than that of British Telecom following privatiza- tion, reported by Avishur (1994); which reports that the rate of technical rogress increased from the date of privatization.pE Galal, Jones, Tando, and Vogelsang (1994, 65) also suggest British Telecom had a lower rate of productivity growth than that of Telecom New Zealand; but conclude that total factor productivity did not increase at privatization. Returning to Telecom, economies of scale are quite significant and so the compound annual percentage cost reduction resulting from productivity growth of 5.6 per cent is quite a lot lower than the rate of productivity growth. The aggregate network cost reduction over the period is 38.3 per cent.
Both the rates of productivity growth and cost reduction are very high by the standards of other industries, and by the standard of the telecom- munications industry, at least for the period
I7The Tomqvist (1936) index, where the weights are averaged between time periods, was used to construct the index of aggregate input growth.
IBThe decreasing returns to scale of British Telecom
30 THE ECONOMIC RECORD MARCH
1963-1 98219. Although the numerical estimates of productivity change must be viewed cautiously because of data measurement issues, their order of magnitude does suggest that there has been most significant productivity growth and cost reduction. They will reflect technical change as well as organizational changes.
In evaluating this conclusion we need to examine whether the gain in total factor produc- tivity has been at the expense of output quality. To the extent that output quality is of direct concern to customers it is a relevant, but unob- servable, component of output, and improvements in it can be regarded as output growth. Boles de Boer and Evans (1995) report quality indicators which are of direct relevance to customers. They describe the penetration rate of electronic exchanges, illustrating that the use of these exchanges has increased to the point that virtually all exchanges are electronically operated using sophisticated software. In addition to reducing Telecom’s operating costs these exchanges improve the quality of minutes of use through their clearer connections and their ability to offer digital transmissions.
The number of customers waiting at the last day of the month for services such as the installation of a phone are also described in Boles de Boer and Evans (1995). They indicate that, although there was an increase at the time the regional operating companies were established, the number of customers waiting for service has become neg- ligible. Total faults have halved since mid-1988 and exchange downtime has fallen dramatically. Exchange downtime and repeat faults increased substantially in 1990; again the period when the ROCs were established. While downtime returned rapidly to its downward path repeat faults have proved more resilient and have fallen only slowly. There is some suggestion that the nature of con- tracts affected repeat faults in the two ROCs which contracted-out repair work, but one of the other two ROCs also experienced a sharp increase and slow decline in repeat faults. Total faults do not include repeat faults and they have declined significantly. While our analysis will capture cost reductions, our measure of output will not reflect
I9See the total factor productivity figures cited in the report The Contribution of Telecommunications Infra- structure to Aggregate and Sectoral Eficiency, DRY McGraw-Hill, Lexington. MA, February 1991, and those of Norsworthy and Jang (1992) for the computer industry.
enhanced quality. We conclude that quality of service has improved since 1987, making our quantitative estimate of productivity growth a lower limit to gains in x-efficiency.
N Welfare Changes in aggregate welfare which have
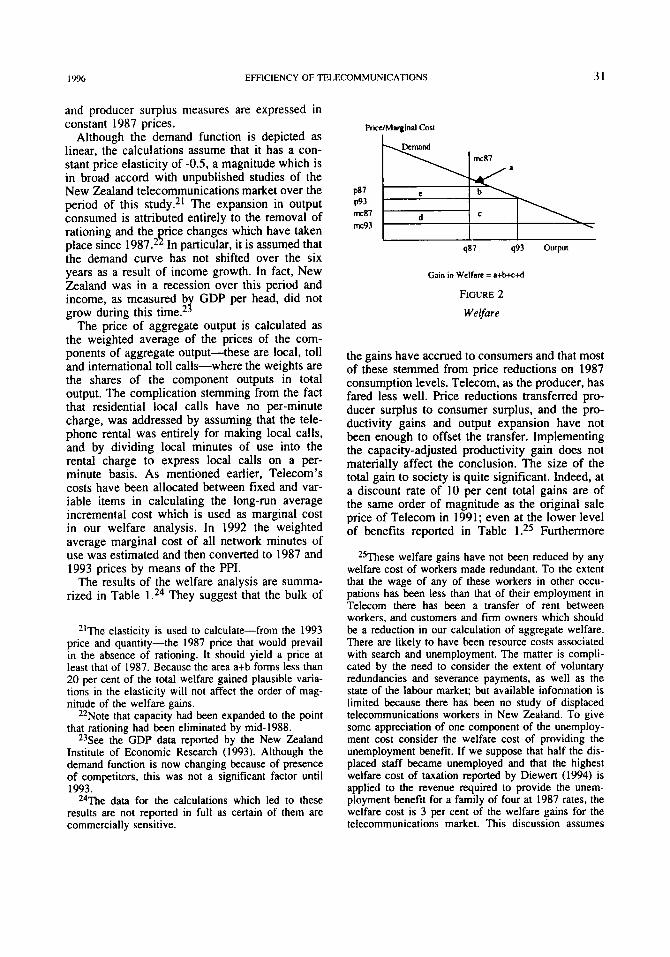
flowed from Telecom since 1987 are indicated by changes in producer and consumer surpluses gen- erated over the period and they incorporate the productivity change. The framework is described in Figure 4, which describes the telecommunica- tions market as it applies to Telecom in 1987 and 1993. The diagram assumes a stable demand curve over the period and that demand can be sep- arated into residential and business. The welfare calculations are based solely on the supply and demand for telecommunications. They take no account of costs or benefits shifted to other sectors of the economy?0
At the time of incorporatization as a state owned enterprise, in 1987, there was excess demand for the network. This appeared as an ina- bility to make calls, particularly at certain times of the day, and in the time it took to implement customer services. It is depicted as a vertical mar- ginal cost curve and it will understate the welfare gains from relaxing the calling constraint. It meas- ures the welfare loss of congestion for marginal consumers; area a of Figure 4. In fact, the constraint applied to consumers irrespective of willingness to pay and must have restricted infra- marginal consumers as well.
In the diagram, e+b is the consumer surplus gain from reduced real prices, and c+d indicates the increase in producer’s surplus resulting from improved productivity, as it applies to variable costs, and the expansion in demand. The area e has no effect on total welfare, but is a transfer from producers to consumers. To producer’s surplus must be added the improved productivity of the fixed assets. All prices, costs and consumer
*OCertain trading government departments provided social services beyond the provision which would occur if outputs were commercially priced. While a full welfare analysis would have to assess changes in the supply of these services, SOEs. from the outset, were to continue this practice only if the supply of these serv- ices was contracted with them, generally by govern- ment. The analysis of this paper starts with the formation of the SOE and therefore should not consider these social services.
I996 EFFICIENCY OF TELECOMMUNICATIONS 31
and producer surplus measures are expressed in constant 1987 prices.
Although the demand function is depicted as linear, the calculations assume that it has a con- stant price elasticity of -0.5. a magnitude which is in broad accord with unpublished studies of the New Zealand telecommunications market over the period of this study.2* The expansion in output consumed is attributed entirely to the removal of rationing and the rice changes which have taken
the demand curve has not shifted over the six years as a result of income growth. In fact, New Zealand was in a recession over this period and income, as measured b GDP per head, did not
The price of aggregate output is calculated as the weighted average of the prices of the com- ponents of aggregate output-these are local, toll and international toll calls-where the weights are the shares of the component outputs in total output. The complication stemming from the fact that residential local calls have no per-minute charge, was addressed by assuming that the tele- phone rental was entirely for making local calls, and by dividing local minutes of use into the rental charge to express local calls on a per- minute basis. As mentioned earlier, Telecom’s costs have been allocated between fixed and var- iable items in calculating the long-run average incremental cost which is used as marginal cost in our welfare analysis. In 1992 the weighted average marginal cost of all network minutes of use was estimated and then converted to 1987 and 1993 prices by means of the PPI.
The results of the welfare analysis are summa- rized in Table They suggest that the bulk of
place since 1987.2 I: In particular, it is assumed that
grow during this time. 2 r
21The elasticity is used to calculate-from the 1993 price and quantity-the 1987 price that would prevail in the absence of rationing. It should yield a price at least that of 1987. Because the area a+b forms less than 20 per cent of the total welfare gained plausible varia- tions in the elasticity will not affect the order of mag- nitude of the welfare gains.
22Note that capacity had been expanded to the point that rationing had been eliminated by mid-1988.
23See the GDP data reported by the New Zealand Institute of Economic Research (1993). Although the demand function is now changing because of presence of competitors, this was not a significant factor until 1993.
24The data for the calculations which led to these results are not reported in full as certain of them are commercially sensitive.
Pricc/Mnrginal Cost
I
I I I q8’ q93 output
Gain in Welfare = atbtc td
FIGURE 2
Werfare
the gains have accrued to consumers and that most of these stemmed from price reductions on 1987 consumption levels. Telecom, as the producer, has fared less well. Price reductions transferred pro- ducer surplus to consumer surplus, and the pro- ductivity gains and output expansion have not been enough to offset the transfer. Implementing the capacity-adjusted productivity gain does not materially affect the conclusion. The size of the total gain to society is quite significant. Indeed, at a discount rate of 10 per cent total gains are of the same order of magnitude as the original sale price of Telecom in 1991; even at the lower level of benefits reported in Table 1.25 Furthermore
25These welfare gains have not been reduced by any welfare cost of workers made redundant. To the extent that the wage of any of these workers in other occu- pations has been less than that of their employment in Telecom there has been a transfer of rent between workers, and customers and firm owners which should be a reduction in our calculation of aggregate welfare. There are likely to have been resource costs associated with search and unemployment. The matter is compli- cated by the need to consider the extent of voluntary redundancies and severance payments, as well as the state of the labour market; but available information is limited because there has been no study of displaced telecommunications workers in New Zealand. To give some appreciation of one component of the unemploy- ment cost consider the welfare cost of providing the unemployment benefit. If we suppose that half the dis- placed staff became unemployed and that the highest welfare cost of taxation reported by Diewert (1994) is applied to the revenue required to provide the unem- ployment benefit for a family of four at 1987 rates, the welfare cost is 3 per cent of the welfare gains for the telecommunications market. This discussion assumes
32 THE ECONOMIC RECORD MARCH
they understate the gains accruing to the telecom- munications market as a whole. Our calculations have estimated consumer and producer surpluses for Telecom alone, and yet competitors, particu- larly Clear Corporation, have gained a substantial 18 per cent share in the tolls markets. The growth of this share has been such that the issue becomes of significance in the 1993 year. If it is assumed that the competitors are at least breaking even, then there have been additional gains in consumer surplus stemming from consumers switching to Telecom competitors in the deregulated environ- ment. The total gains reported in Table 1 thus understate the welfare gains enjoyed by the total telecommunications market over the period.
Reconciling the reduced producer’s surplus with the share price performance is complex because New Zealand real interest rates have fallen sig- nificantly since 1991, and the share price reflects expectations. Also, some of the growth in share price will have been affected by revenue growth from non-network activities. Nevertheless it is useful to attempt a reconciliation. Boles de Boer and Evans (1995) graph the share price against a New Zealand share price index modified to exclude Telecom. They use the index as a basis of comparison because it reflects changes in general economic conditions that will also affect Telecom’s share price. They show that Telecom’s share price has performed better than the average of all listed shares in New Zealand, particularly since early in 1993.
The superior performance of Telecom as an investment has occurred, despite the loss of prod- ucer’s surplus. There are various explanations for this outcome. The share price will reflect the expected stream of dividends to shareholders, and thus expected future cash flows. Various factors will affect this expectation. Telecom has carried out an extensive, primarily internally funded, investment program the magnitude of which is also described in Boles de Boer and Evans (1995). Investment expenditure increased until 1991 since when it has steadily declined. The marked share- price increase occurs coincidentally with the decline in cash devoted to investment; however, in an informed market, and at a company’s optimal debt-equity balance, it should not make any difference whether investment is funded inter- nally or by borrowing. While continuing to finance investment internally when Telecom had
that the redundancies did not affect the economy’s agre- gregate demand.
TABLE 1 Consumer and Producer Benefits: 1987-1993*
Consumer Surplus Gain: Area a+b+e
Residential $307.93m ($25 1.7m) Business $348.02m ($287.3m)
Producer Surplus Gain: Area c+d-e
Residential -$1 W.08m (-$85.07m) Business -$131.89m (-$I 10.72m) Fixed Cost Reduction $155.05m
Total $575.03m ($498.26m)
*The data in brackets are based on the alternative method of estimating 1987 output (see fmmote 12). All data are in 1987 prices.
a low debvequity ratio can be expected to restrict the share price, it is unlikely to account for the growth that took place in Telecom’s share price from January 1991.26 The increase, relative to the market, may well have been affected by the amount and direction of the huge investment which has taken place since 1987. If investment projects were not perceived by investors as well directed, for example, investment which ineffec- tively pre-empted competition, then the massive investment may have been perceived as having significant components which were not achieving the company’s cost of capital. To the extent that the less productive investments have declined with the decline in aggregate investment the share price will rise. In addition, as restructuring has proceeded it may be that the non-production costs of restructuring have been lower than investors anticipated. When these factors are combined with growth in non-network services it is entirely pos- sible that the share price may rise even when some producer’s surplus has been transferred to consumers.
V Discussion This paper has described the static productivity
and welfare gains which have occurred over time in network activity as Telecom developed as an
26Telecom’s share repurchase of 1993 was carried out to raise the debdequity ratio, but it is likely to have had a small ‘cost-of-capital’ effect on the share price because New Zealand has a dividend imputation regime. It may have had some effect through the valuation placed on the shares by foreign investors, however.
I996 EFFICIENCY OF TELECOMMUNICATIONS 33
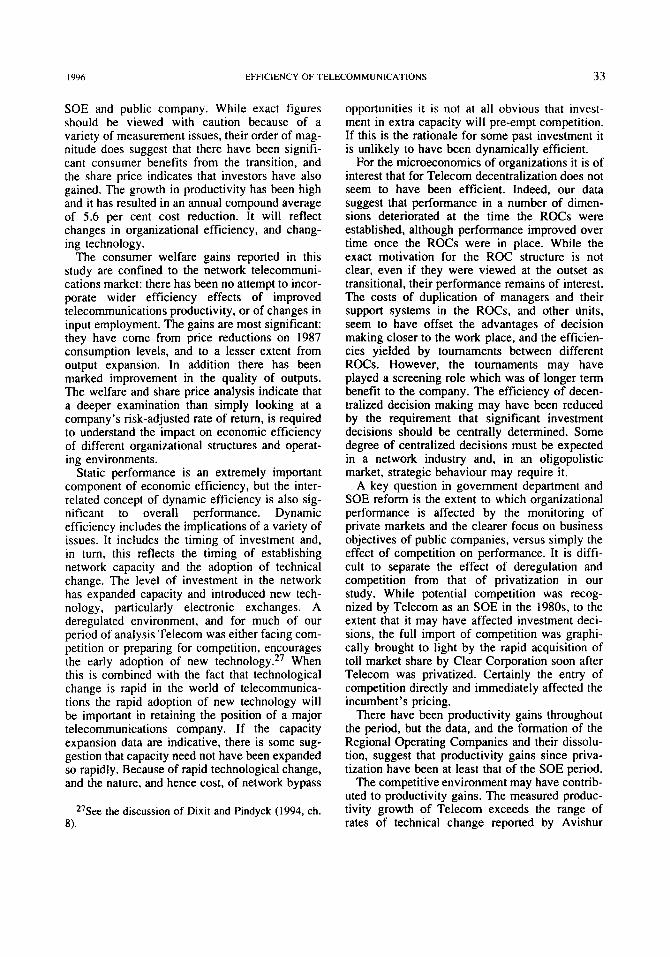
SOE and public company. While exact figures should be viewed with caution because of a variety of measurement issues, their order of mag- nitude does suggest that there have been signifi- cant consumer benefits from the transition, and the share price indicates that investors have also gained. The growth in productivity has been high and it has resulted in an annual compound average of 5.6 per cent cost reduction. It will reflect changes in organizational efficiency, and chang- ing technology.
The consumer welfare gains reported in this study are confined to the network telecommuni- cations market: there has been no attempt to incor- porate wider efficiency effects of improved telecommunications productivity, or of changes in input employment. The gains are most significant: they have come from price reductions on 1987 consumption levels, and to a lesser extent from output expansion. In addition there has been marked improvement in the quality of outputs. The welfare and share price analysis indicate that a deeper examination than simply looking at a company’s risk-adjusted rate of return, is required to understand the impact on economic efficiency of different organizational structures and operat- ing environments.
Static performance is an extremely important component of economic efficiency, but the inter- related concept of dynamic efficiency is also sig- nificant to overall performance. Dynamic efficiency includes the implications of a variety of issues. It includes the timing of investment and, in turn, this reflects the timing of establishing network capacity and the adoption of technical change. The level of investment in the network has expanded capacity and introduced new tech- nology, particularly electronic exchanges. A deregulated environment, and for much of our period of analysis Telecom was either facing com- petition or preparing for competition, encourages the early adoption of new techno log^.^^ When this is combined with the fact that technological change is rapid in the world of telecommunica- tions the rapid adoption of new technology will be important in retaining the position of a major telecommunications company. If the capacity expansion data are indicative, there is some sug- gestion that capacity need not have been expanded so rapidly. Because of rapid technological change, and the nature, and hence cost, of network bypass
27See the discussion of Dixit and Pindyck (1994, ch. 8) .
opportunities it is not at all obvious that invest- ment in extra capacity will pre-empt competition. If this is the rationale for some past investment it is unlikely to have been dynamically efficient.
For the microeconomics of organizations it is of interest that for Telecom decentralization does not seem to have been efficient. Indeed, our data suggest that performance in a number of dimen- sions deteriorated at the time the ROCs were established, although performance improved over time once the ROCs were in place. While the exact motivation for the ROC structure is not clear, even if they were viewed at the outset as transitional, their performance remains of interest. The costs of duplication of managers and their support systems in the ROCs, and other linits, seem to have offset the advantages of decision making closer to the work place, and the efficien- cies yielded by tournaments between different ROCs. However, the tournaments may have played a screening role which was of longer term benefit to the company. The efficiency of decen- tralized decision making may have been reduced by the requirement that significant investment decisions should be centrally determined. Some degree of centralized decisions must be expected in a network industry and, in an oligopolistic market, strategic behaviour may require it.
A key question in government department and SOE reform is the extent to which organizational performance is affected by the monitoring of private markets and the clearer focus on business objectives of public companies, versus simply the effect of competition on performance. It is diffi- cult to separate the effect of deregulation and competition from that of privatization in our study. While potential competition was recog- nized by Telecom as an SOE in the 1980s, to the extent that it may have affected investment deci- sions, the full import of competition was graphi- cally brought to light by the rapid acquisition of toll market share by Clear Corporation soon after Telecom was privatized. Certainly the entry of competition directly and immediately affected the incumbent’s pricing.
There have been productivity gains throughout the period, but the data, and the formation of the Regional Operating Companies and their dissolu- tion, suggest that productivity gains since priva- tization have been at least that of the SOE period.
The competitive environment may have contrib- uted to productivity gains. The measured produc- tivity growth of Telecom exceeds the range of rates of technical change reported by Avishur
34 THE ECONOMIC RECORD MARCH
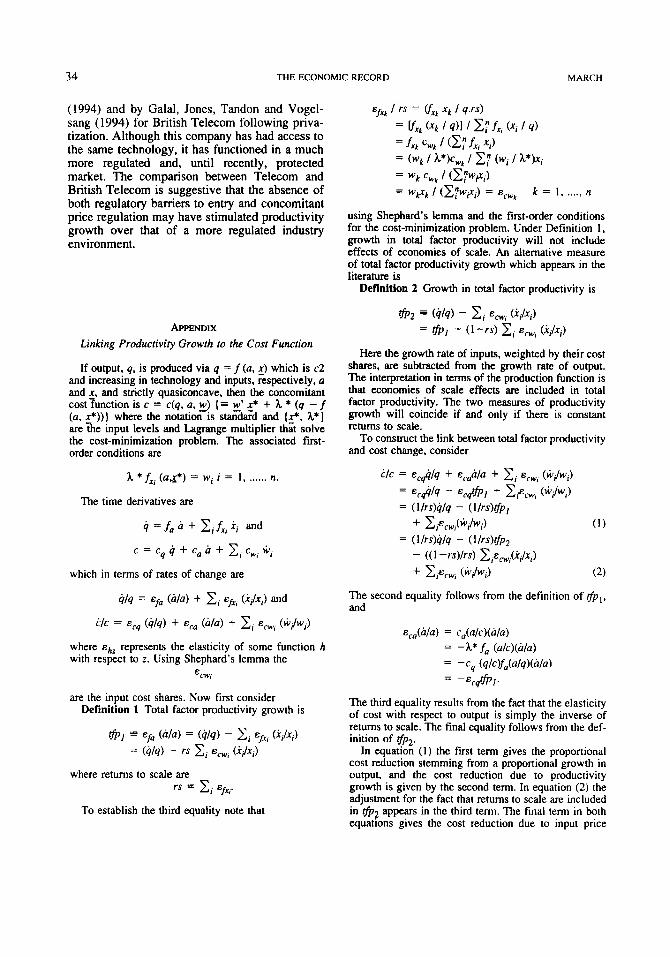
(1994) and by Galal, Jones, Tandon and Vogel- sang (1994) for British Telecom following priva- tization. Although this company has had access to the same technology, it has functioned in a much more regulated and, until recently, protected market. The comparison between Telecom and British Telecom is suggestive that the absence of both regulatory barriers to entry and concomitant price regulation may have stimulated productivity growth over that of a more regulated industry environment.
APPENDIX Linking Productivity Growth to rhe Cost Function
If output, q. is produced via q = f (u, E ) which is c2 and increasing in technology and inputs. respectively, a and x, and strictly quasiconcave. then the concomitant cost Tunction is c = c(q. a, w ) (= E* f* + X * (q - f (a. g) ) ) where the notation is standard and (e, X*] are the input levels and Lagrange multiplier that solve the cost-minimization problem. The associated fmt- order conditions are
h * fx j (ax*) = w; i = 1, ...... n.
The time derivatives are
9 =fa u + xj fx , ii and
c = c 4 + c, a + 2; c,; wi 9
which in terms of rates of change are
9/q = Ef, (ah) + xi Efx, ( i ; / X j ) and
i/c = ecq (419) + E, (a/a) + 2; E~~~ (wj/wj)
where E , , ~ represents the elasticity of some function h with respect to z. Using Shephard's lemma the
ECw;
are the input cost shares. Now first consider Definition 1 Total factor productivity growth is
rfpfpl Ef, ( d a ) = (414) - x; Efx, ( i j h i )
= (d/q) - TS Ci E W i ( i j / X , )
where returns to scale are TS = C i Efxi.
To establish the third equality note that
Efxt / TS = (fx, xk 1 q.rS)
= v x k ( x k
- fxk cwk 1 (C.1 L, xi) = (wk / h*)cwk / C1 (wj / h*)x; = wk Cwk (21wFj) = W@k / ( 2 l W , X ; ) = ECwk
411 / zlfx; (xi / 4) -
k = 1, ...., n
using Shephard's lemma and the first-order conditions for the cost-minimization problem. Under Definition 1, growth in total factor productivity will not include effects of economies of scale. An alternative measure of total factor productivity growth which appears in the literature is
Definition 2 Growth in total factor productivity is
tfP2 = (414 - c; Ecw; (+;) = &, - ( 1 - r ~ ) Ci E~~ ( idx i )
Here the growth rate of inputs. weighted by their cost shares, are subtracted from the growth rate of output. The interpretation in terms of the production function is that economies of scale effects are included in total factor productivity. The two measures of productivity growth will coincide if and only if there is constant returns to scale.
To construct the link between total factor productivity and cost change, consider
I?/C = Ec&/q + Ec&U + 2; ECwj (W;/W;)
= E c & h - Ec6fPfpl + C ; E c w , (W;/W,)
= (l/rs)4/q - (l/rs)rfp,
= ( I / r s ) i / q - (I/rs)rfpz + C I q . J W j / W j ) ( 1 )
- ((1 -rs)/rs) Clscw, ( i i /x l ) CiE, , , (wj /W;) (2)
The second equality follows from the definition of and
Ecu(U/U) = C,(U/C)(a/U)
= -h* f, (U/C) (U/U)
= -cq (q/clf,(u/q)(a/u) = -ECq!7h.
The third equality results from the fact that the elasticity of cost with respect to output is simply the inverse of returns to scale. The final equality follows from the def- inition of tfpz.
In equation (1) the first term gives the proportional cost reduction stemming from a proportional growth in output, and the cost reduction due to productivity growth is given by the second term. In equation (2) the adjustment for the fact that returns to scale are included in tfpz appears in the third term. The final term in both equations gives the cost reduction due to input price

1996 EFFICIENCY OF TELECOMMUNICATIONS 35
changes. Since the weights are cost shares they sum to 1, and if there are no relative price changes, then the price effect will simply be the inflation rate of input prices. The cost-change equation can take various forms.
Equations ( 1 ) and (2) will be the same under constant returns to scale, otherwise they will be different. Equa- tion ( I ) partitions the rate of cost change into that due to output growth and productivity growth and that due to price changes. We employ this equation because tfpl is directly interpretable as the rate of change in the level of output for any level of inputs.
In linking productivity to cost reduction in this study we must recognize that the network cost function canies a large fixed cost, f , and a low marginal cost, mc. In this case returns to scale, rs, can be calculated from estimates of fixed and marginal cost using the cost func- tion c(9) = f + mc.9.
REFERENCES
Avishur, Areh (1994). The Eflect of Privatisotion of British Telecom on Eficiency: a generalised produc- tion function approach. Department of Economics, University of Haifa, mimeo.
Boles de Boer, David and Evans, Lewis (1995). The Economic Eficiency of Telecomunications in a Deregulated Market: The Case of New Zealand, Graduate School of Business and Government Man- agement Working Paper, 8/95, Victoria University of Wellington.
Carrol, A. (1992). Agency issues of the firm and their application in an institutional comparison, unpubli- shed MCA thesis, Victoria University of Wellington.
Commerce Act (1986). New Zealand Government Print, Wellington.
Denny, M. Fuss, M. and Waverman, L. (1981), ‘The measurement and interpretation of total factor pro- ductivity in regulated industries with an application to Canadian Telecommunications’, in T.G. Cowing and R.E. Stevenson (eds), Productivity in Regulated Industries, Academic Press, New York, 179-218.
Diewert, Erwin W. and Lawrence, Denis A. (1994), The Marginal Costs of Taxation in New Zealand, Report Prepared for the Business Roundtable by SWAN Consultants (Canberra) Pty Ltd.
Dixit. Avinash K. and Pyndyck, Robert S. (1994).
Investment Under Uncertainty, Princeton University Press, Princeton.
Fudenberg, Drew and Tirole. Jean (1991), Game Theory. MIT Press, Cambridge, Massachusetts.
Fuss, Melvyn A. (1994). ‘Productivity growth in Cana- dian telecommunications’, Canadian Journal of Eco- nomics, XXVII. 2. 371-92.
Galal, Ahmed. Leroy Jones, Pankaj Tando, and Vogel- sang, Ingo (1W4), Werfare Consequences of Selling Public Enterprises: on empirical analysis, World Bank, Washington, DC.
Holmstrom, B. and Milgrom. P. (1991), ‘Multi-task principal and agent analyses: incentive contracts asset ownership and job design’, Journal of Law Econom- ics and Organisation 7 , 24-52.
Kendrick, J. W. (1973). Postwar productivity trends in the United States, 1948-1969, Columbia University Press.
Kiss, F. (1983). ‘Productivity gains in Bell Canada’, in Leon Courville, Alain de Fontenay and Rodney Dobell (eds), Economic Analysis of Telecommunica- tions: theory ond applications, Elsevier. North Holland, New York.
Leibenstein. H. (1%6), ‘Allocative Efficiency vs X-effi- ciency’, The Americon Economic Review 56. 392415.
Megginson. William L., Nash, Robert C. and Van Ran- denborgh, Matthias (1994). ‘The Financial and Oper- ating Performance of Newly Privatised Firms: An International Empirical Analysis’, Journal of Finance
New Zealand Institute of Economic Research (1993), Quarterly Predictions 116, Wellington.
McMillan. John (1994). ‘Selling Spectrum Rights’, The Journal of Economics Perspectives 8(3), 145-62.
Norsworthy, J.R., and Jang, S.L. (1992). ‘Empirical Measurement and Analysis of Productivity and Tech- nological Change: Applications in High Technology and service industries’, Contribution to Economic Analysis 211, North-Holland, New York.
Ramsey, Frank, P. (1927). ‘A Contribution to the Theory of Taxation’. Economic Journal 37, 47-61.
Rasmusen, Eric (1989). Games and Information: an introduction to game theory, Basil Blackwell, Oxford.
Tirole, J. (1988), A Theory of Industrial Organisation, MIT, Cambridge.
Yarrow, George (1986). ‘Privatisation in Theory and Practice’, Economic Policy 2, 324-64.
XLIX(2). 403-52.
Copyright © 2022 FDOKUMEN