The diversity of fungi in four Irish forest types By ... - CiteSeerX
405
i The diversity of fungi in four Irish forest types By Richard O’Hanlon B.Sc. (Ed) A thesis submitted for the degree of Doctor of Philosophy, At the Faculty of Science and Engineering, University of Limerick, Ireland. Supervisor: Dr Thomas Harrington, Department of Life Sciences, University of Limerick. Submitted to the University of Limerick: May 2011
-
Upload
khangminh22 -
Category
Documents
-
view
4 -
download
0
Transcript of The diversity of fungi in four Irish forest types By ... - CiteSeerX
i
The diversity of fungi in four Irish forest types
By Richard O’Hanlon B.Sc. (Ed)
A thesis submitted for the degree of Doctor of Philosophy, At the Faculty of Science and Engineering,
University of Limerick, Ireland.
Supervisor:
Dr Thomas Harrington, Department of Life Sciences,
University of Limerick.
Submitted to the University of Limerick: May 2011

ii

iii
“The task of an ecologist”
There is an old story about a man who, returning home one night found his
neighbour searching the ground beneath a street lamp. “Can I help you find
something?” he asked. “I lost my key” replied the neighbour. “Do you know
about where you dropped it?”, “Yes” replied the neighbour “over there” pointing
to a dark corner of the street. “If you dropped it over there then why are you
looking here” asked the man. “Because this is where the light is” replied the
neighbour.
The task of the ecologist is not to bring the search to where the light is, but to bring the light to where the search is.
Perry et al. (2008)

iv

v
Abstract
Sampling of the macrofungal sporocarps, ectomycorrhizal morphotypes and vascular plants was carried out in 28 plots from four forest types (ash, oak, Scot’s pine, Sitka spruce) between the years 2007 and 2009. A total of 409 macrofungal species, 51 ectomycorrhizal morphotypes and 68 vascular plant species were recorded over the three years. It was found that at equal sampling intensities, there were no significant differences in total macrofungal species or ectomycorrhizal morphotype richness between the oak, Scot’s pine and Sitka spruce forest types. Species richness estimation revealed that between 45 and 77% of the above-ground macrofungal species richness and between 57 and 100% of the below-ground ectomycorrhizal morphotype richness were recorded. Cortinarius,
Mycena, Russula, Lactarius and Inocybe were the most species-rich genera recorded. Forty-eight macrofungal species are new records to Ireland and five of the species recorded are on the British Red-Data List.
Based on sporocarp frequency over the three year’s sampling, distinctive macrofungal communities were distinguished using nonmetric multi-dimension scaling, which corresponded to the dominant tree type of the forest. Ash forests lacked the ectomycorrhizal species component, oak forests had many wood- and litter-decay species present, Scot’s pine forests had some specific Lactarius species present (e.g. L. rufus, L. hepaticus) and Sitka spruce forests had a large diversity of Mycena species.
The below-ground ectomycorrhizal communities were surveyed in soil cores taken from four plots from each of three of the forest types. The ectomycorrhizal communities of the forest types (oak, Scot’s pine and Sitka spruce) were distinctly different according to the dominant tree species of the plot. The use of mantle descriptions, RFLP and sequencing methods allowed for the identification of 36 ectomycorrhizal species. The morphology and anatomy of remaining 15 morphotypes is described.
The ability of plantation forests to provide a supplementary habitat for native fungal species richness and diversity is discussed.

vi

vii
Declaration
I hereby declare that I am the sole author of this thesis and that it has not been submitted for any other academic award. References and acknowledgements have been made, where necessary, to the work of others. . Richard O’Hanlon Department of Life Sciences University of Limerick Ireland
Date:

viii

ix
Acknowledgements
I wish to thank my supervisor Dr Tom Harrington for all his help and guidance throughout the work involved in this thesis. I am very grateful for the many hours spent in the lab passing on his taxonomic knowledge of fungi and also for the help he gave me to develop this thesis and also my writing skills. I would like to thank all the staff of the Department of Life Sciences for their help, support and friendship during my years as both an undergraduate and post-graduate. Prof. John Breen, University of Limerick and Dr Gareth Griffith, Aberystwyth University, provided valuable comments and corrections to an earlier draft of this thesis. I am very grateful to the Council for Forest Research and Development (COFORD) for funding this PhD through the FUNCTIONALBIO project. I would like to express my gratitude to Prof. Tom Bolger, School of Biology and Environmental Science, UCD, for his organisation and management of the FUNCTIONALBIO project. I would like to thank my sponsors whom accepted me as a Visiting Scholar during this research. Dr Sue Grayston, Department of Forest Sciences, University of British Columbia, for all her help in organising my trip to Canada. Dr Dan Luoma and Dr Joyce Eberhart for their kindness, support and explanation of the methods for describing ectomycorrhizal communities during my Visiting Scholar trip to Oregon. Both Visiting Scholar exchanges greatly broadened my views on ecology and mycology. COFORD is gratefully acknowledged for funding both Visiting Scholar exchanges. I am grateful to my family for their support and encouragement during my time at University. I would also like to thank all of my friends and fellow postgrads for talking about topics other than my research with me. I would like to thank Dr Chris Quine, Forest Research, and Dr Jonathan Humphrey for allowing access to the “Biodiversity in Britain’s planted forests” data.

x

xi
List of Abbreviations
Abbreviation Full term
ACE Abundance-based Coverage Estimator ANOVA Analysis of Variance CHAO2 Chao 2 richness estimator CWD Coarse Woody Debris DBH Diameter at Breast Height DNA Deoxyribonucleic Acid ECM Ectomycorrhizal FAO Food and Agriculture Organisation FSC Forest Stewardship Council ICE Incidence-based Coverage Estimator ITS Internal Transcribed Spacer IV Indicator Value JI Jaccard Index MRPP Multi-Response Permutation Procedure NMS Nonmetric Multi-dimensional Scaling PAR Photosynthetic Active Radiation PCR Polymerase Chain Reaction PRS Plant Root Simulator RFLP Restriction Fragment Length Polymorphism SD Standard Deviation SFM Sustainable Forest Management SP Scot’s pine SS Sitka spruce U.K. United Kingdom

xii
xiii
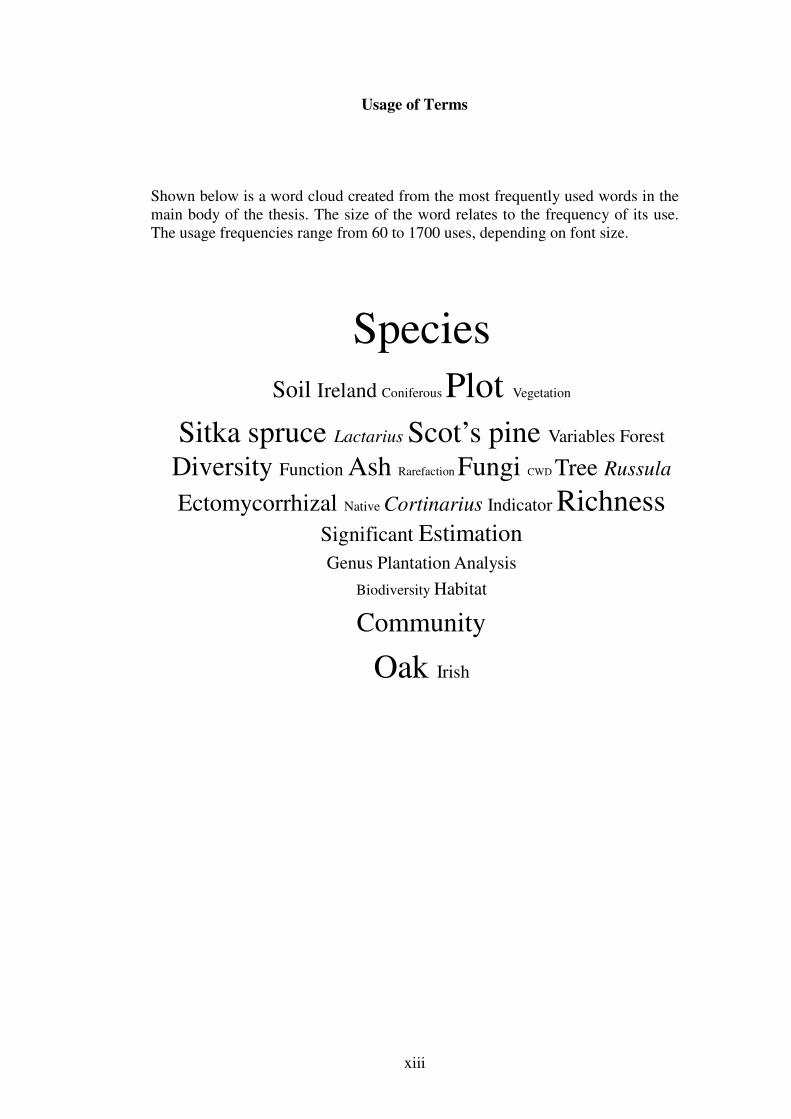
Usage of Terms
Shown below is a word cloud created from the most frequently used words in the main body of the thesis. The size of the word relates to the frequency of its use. The usage frequencies range from 60 to 1700 uses, depending on font size.
Species
Soil Ireland Coniferous Plot Vegetation
Sitka spruce Lactarius Scot’s pine Variables Forest
Diversity Function Ash Rarefaction Fungi CWD Tree Russula
Ectomycorrhizal Native Cortinarius Indicator Richness Significant EstimationGenus Plantation Analysis
Biodiversity Habitat
Community
Oak Irish

xiv
xv
Contents
Abstract…………………………………………….…….…………...……...…..iii Declaration…………………………………………….………...……………….iv Acknowledgements………………………………….……………………………v Listof Abbreviations………………………………...……………………………xi Usage of terms………………..…………………………………………………xiii Chapter 1: Introduction 1.1 The changing face of Irish forests ........................................................................... 3
1.2 Biodiversity and Irish forests .................................................................................. 4
1.3 The Functionalbio project ....................................................................................... 6
1.4 Macrofungi in forest ecosystems ............................................................................ 7
1.5 Layout of the thesis ................................................................................................. 8
Chapter 2: Literature review 2.1 Sustainable forest management and certification .................................................. 13
2.2 COFORD and recent forest research in Ireland .................................................... 14
2.3 Studies of fungi in forest ecosystems. ................................................................... 16
2.4 Forest management practices and their effects on forest fungi ............................. 17
2.5 Functional groupings for fungi ............................................................................. 21
2.6 Below-ground ectomycorrhizal diversity in forests .............................................. 26
2.7 Soil and site variables and their relationship with fungal diversity ...................... 27
Chapter 3: The sites: vegetation and site variables measured 3.1 Introduction ........................................................................................................... 41
3.1.1 Forests of Ireland: Extent and current trends ..................................................... 41
3.1.2 Classification of Irish forest habitats ................................................................. 43
3.1.3 Rational for site selection ................................................................................... 44
3.2 Aims of this chapter .............................................................................................. 47
3.3 Materials and methods .......................................................................................... 48
3.3.1 The sites ............................................................................................................. 48
3.3.2 Data collection methods ..................................................................................... 52
3.3.3 Statistical analysis .............................................................................................. 54
3.4 Results ................................................................................................................... 58
3.4.1 Soils physical and chemical attributes. .............................................................. 58
3.4.2 Relationship between plots based on soil variables measured ........................... 67
3.4.3 The species list ................................................................................................... 69
3.4.4 The vegetation and classification of the individual sites ................................... 75
3.4.5 Structural descriptions of the sites ..................................................................... 79
3.4.6 Meteorological data ............................................................................................ 83
3.4.7 Community structure of the vegetation in the plots ........................................... 85
3.4.8 Forest management related to plant species richness ....................................... 105
3.5 Discussion ........................................................................................................... 107
3.5.1 Significantly different plant communities across the four forest types ........... 107
3.5.2 The plant communities of the four forest types ............................................... 108
3.5.3 Relationship of these findings to possible fungal species richness .................. 114
3.6 Conclusions ......................................................................................................... 120
Chapter 4: Macrofungal species richness and diversity in the different forest types 4.1 Introduction ......................................................................................................... 123
4.1.1 Fungal diversity in temperate forest ecosystems ............................................. 123
xvi
4.1.2 Fungal diversity in Irish forests and forests similar in tree species composition and climate ............................................................................................ 124
4.1.3 Factors affecting macrofungal diversity in forests ........................................... 125
4.1.4 Difficulties in estimating fungal diversity in forests ........................................ 127
4.2 Aims of this chapter ............................................................................................. 129
The aims of this chapter are:...................................................................................... 129
4.3 Materials and Methods ....................................................................................... 130
4.3.1 Sites .................................................................................................................. 130
4.3.2 Macrofungal assessment ................................................................................... 130
4.3.3 Statistical analysis ............................................................................................ 131
4.3.4 Species richness comparisons and the estimation of fungal diversity in the forest types and sites .................................................................................................. 132
4.3.5 Species diversity and evenness analysis of the sites......................................... 133
4.3.6 Species richness of functional groups in the different forest types .................. 134
4.3.7 Functional group frequencies across the forest types ....................................... 135
4.3.8 Influence of site variables on species richness ................................................. 135
4.3.9 Seasonal effects on fungal phenology .............................................................. 136
4.4 Results ................................................................................................................. 137
4.4.1 Macrofungal species in the forest plots ............................................................ 137
4.4.2 Species richness estimation of fungal diversity in the forest types .................. 153
4.4.3 Species richness estimation: variation within forest types ............................... 161
4.4.4 Species diversity and evenness ......................................................................... 165
4.4.5 Functional groups of macrofungi ..................................................................... 167
4.4.6 Influence of site variables on species richness ................................................. 171
4.4.7 Effect of weather variables on fungal fruiting .................................................. 176
4.5 Discussion ............................................................................................................ 182
4.5.1 Fungal species richness and the effect of forest type ....................................... 182
4.5.2 Rare and common fungi in Irish forests ........................................................... 188
4.5.3 Functional groups of fungi in Irish forests ....................................................... 191
4.5.4 Species and fruitbody abundance correlated to weather parameters ................ 193
4.5.5 Estimating fungal diversity in Irish forest habitats ........................................... 194
4.6 Conclusions ......................................................................................................... 199
Chapter 5: Macrofungal communities of the forest types 5.1 Introduction ......................................................................................................... 203
5.1.1 Mycocoenological study methods .................................................................... 203
5.1.2 Macrofungal communities of forest ecosystems .............................................. 204
5.1.3 Past studies of macrofungal communities in temperate oak, ash, Scot’s pine and Sitka spruce forest habitats ................................................................................. 206
5.2 Aims of this chapter ............................................................................................. 209
5.3 Materials and methods ......................................................................................... 210
5.3.1. Site list ............................................................................................................. 210
5.3.2 Macrofungal assessment ................................................................................... 210
5.3.3 Abiotic variables ............................................................................................... 210
5.3.4 Stand structural attributes ................................................................................. 210
5.3.5 Statistical and multivariate analysis ................................................................. 210
5.3.6 Multivariate analysis ........................................................................................ 211
5.3.7 Year to year variation ....................................................................................... 213
5.4 Results ................................................................................................................. 215
5.4.1 Species abundance patterns .............................................................................. 215
5.4.2 Analysis of macrofungal community similarity between the sites ................... 224
xvii
5.4.3 Ordination of the forest plots. .......................................................................... 230
5.4.4 Indicator species analysis ................................................................................. 237
5.4.5 Change in fungal community over sample years ............................................. 245
5.5 Discussion ........................................................................................................... 247
5.5.1 Evidence for the existence of distinctive communities of macrofungi in Irish forests ........................................................................................................................ 247
5.5.2 The macrofungal communities of the forest types ........................................... 249
5.5.3 Host preference in macrofungi ......................................................................... 258
5.6 Conclusions ......................................................................................................... 260
Chapter 6: Ectomycorrhizal morphotype richness and community analysis of the forest types 6.1 Introduction ......................................................................................................... 263
6.1.1 Ectomycorrhizas in forest ecosystems ............................................................. 263
6.1.2 Quantifying and recording ectomycorrhizal fungi in forests ........................... 264
6.1.3 Ectomycorrhizal research in Ireland and other temperate countries ................ 265
6.2 Aims of this chapter ............................................................................................ 268
6.2 Methods ............................................................................................................... 269
6.3.1 The plots ........................................................................................................... 269
6.3.2 Sampling and enumeration ............................................................................... 269
6.3.3 Molecular identification of ECM types............................................................ 270
6.3.4 Statistical analysis ............................................................................................ 272
6.3.5 Community similarity analysis ........................................................................ 272
6.3.6 Multivariate community analysis ..................................................................... 273
6.4 Results ................................................................................................................. 275
6.4.1 ECM morphotypes ........................................................................................... 275
6.4.2 ECM richness and abundance in the forest types............................................. 286
6.4.3 Similarity of below-ground ECM assemblage and above-ground ECM sporocarp assemblage................................................................................................ 300
6.4.4 ECM community analysis ................................................................................ 304
6.5 Discussion ........................................................................................................... 316
6.5.1 Ectomycorrhizal diversity ................................................................................ 316
6.5.2 The ECM communities of the forest types ...................................................... 318
6.5.3 Relationship between above-ground ECM sporocarps and below-ground ECM morphotypes .................................................................................................... 322
6.5 Conclusions ......................................................................................................... 328
Chapter 7: General discussion and conclusions 7.1 Macrofungal diversity in Irish forest sites .......................................................... 331
7.2 Macrofungal functional group diversity.............................................................. 333
7.3 Below-ground ectomycorrhizal diversity ............................................................ 334
7.4 The macrofungal communities of Irish forests ................................................... 335
7.5 The value of plantation forests as habitats for macrofungal diversity ................ 340
7.6 Unanswered questions and future research directions ........................................ 342
7.7 Final conclusions: Plantations as a habitat for native macrofungi ...................... 345
7.8 Key findings of this project ................................................................................. 346
References ................................................................................................................. 348
Colour plates ............................................................................................................. 388
Appendix 1 ................................................................................................................ 395
Appendix 2 ................................................................................................................ 396

xviii

1
Chapter 1: Introduction

2
3
Introduction
1.1 The changing face of Irish forests
The Food and Agriculture Organization of the United Nations states that over two
thirds of the worlds land based species live in forests (Anon. 2005). Up until
2005, very little research has been carried out on the biodiversity of forest
plantations in Ireland and how it changes through different stages of the forest
cycle. Investigation into the ecological impacts of the exotic conifer Sitka spruce
(Picea sitchensis) plantations, which will account for at least 60% of the forest
cover in Ireland up to 2030 (Anon. 1996), is necessary. Currently, native tree
species comprise less than 25% of the forested area (National Forest Inventory
2007), but generous grants are available to encourage the planting of more mixed
crops and native broadleaf trees.
Ireland was once covered in dense forests of oak, elm, pine, ash and hazel,
but anthropogenic influence (Cole and Mitchell 2003) has reduced the area of
native woodland to less than 1% of the land area, one of the lowest levels in
Europe (FRA 2010). Native woodlands in Ireland belong to a number of
phytosociological categories, but the principal types are acidophilus oak woods
(Blechno-Quercetum petraeae) dominated by sessile oak Quercus petraea, and
ash-elm-hazel woodland (Corylo-Fraxinetum) on more fertile soils (White and
Doyle 1982). What remains is highly fragmented and frequently modified by
naturalized non-indigenous species such as beech (Fagus sylvatica) and sycamore
(Acer pseudoplatanus) (Perrin et al. 2008).
The trend in Europe is very similar to that in Ireland with major
afforestation being carried out on former agricultural land (UNECE 2003). The
increase of forested area in Europe is 770,000 ha per year (FRA 2010) with over
50% of this increase due to afforestation in Spain, Italy, Norway and Russia. Of
the 50 countries examined in Europe, only Albania and Estonia reported a net loss
of forest area (total loss 8000ha; FRA 2010). In countries such as Belgium,
Denmark, Netherlands, Portugal, United Kingdom and Ireland, exotic species
dominate a large proportion (>30%) of the forest area (UNECE 2000). The
majority of afforestation in Ireland includes the non-native conifer Sitka spruce,
often as the dominant species in mixed plantations (Joyce and O’Carroll 2002).
4
Sitka spruce is particularly well suited to growth conditions in Ireland and if
properly managed on fertile sites, can reach a maximum annual mean increment
of 30m3/ha/annum (Horgan et al. 2004). The fast growth of Sitka spruce in Ireland
makes it an ideal candidate for carbon sequestration. Sitka spruce forests are
second only to unthinned poplar forests in their carbon sequestration ability in
Ireland (Kilbride et al. 1999).
Coniferous tree species such as Sitka spruce and Douglas fir become
commercially mature much faster than deciduous trees such as oak and beech. By
way of planting restrictions and generous grants, the Irish government is
attempting to promote more planting of native and deciduous tree species. Current
planting restrictions state that a plantation must contain at least 10% broadleaf
species and that these trees should be planted “in swathes and not as single stems
within the canopy” (Anon. 2000). As the majority of current afforestation involves
conifers on improved/enclosed land, non-intimate mixes of conifers and
broadleaves are, therefore, likely to become the dominant configuration in future
afforestation (Smith et al. 2005).
1.2 Biodiversity and Irish forests
The word “biodiversity” has been defined in a variety of ways (more than 80
definitions in De Long 1996). In this study the definition used is that of the
Convention on Biological Diversity CBD:
Biological diversity means the variability among living organisms from all sources including, inter-alia, terrestrial, marine and other aquatic ecosystems and the ecological complexes of which they are part; this includes diversity within species, between species and of ecosystems.
(Anon. 1992)
Biodiversity in this form is extremely difficult to measure and therefore
only organism diversity at the level of species is examined because it
encompasses different hierarchies of biological and ecological diversity. Thus,
this project examines the biodiversity of fungal species in Irish forest ecosystems.
Biodiversity is known to have large beneficial effects on ecosystem productivity
5
and stability (Gaston and Spicer 2007) and therefore its conservation is extremely
important.
In this study, functional group biodiversity or functional biodiversity is
also investigated. This is the diversity of species which fit into a specific
functional group and are capable of carrying out that ecosystem function. The
meaning of functional biodiversity and its value to ecosystems was examined by
Bolger (2001), who puts forwards a number of hypotheses as to how we should
look at biodiversity and its value to an ecosystem. The common theme in the
article is that each living organism in an ecosystem is limited in the tasks it can do
and therefore an ecological “division of labor” occurs among the organisms in the
ecosystem (Hector 2011). If one organism were to disappear then there is a chance
that another organism can fill its functional role. However there is also the
possibility that some organisms are keystone participants to the ecosystem and
once lost, their function will be lost as well. This would lead to changes in the
ecosystem structure, chemistry and biological characteristics. Functional
redundancy has been identified in soil decomposer fungi in the U.K., where it was
found that when abundant species were removed from the ecosystem, occasional
species could fill their functional position (Deacon et al. 2006).
It is generally accepted that “biodiversity per se is a good thing; that its
loss is bad and that something should be done to preserve it” (Gaston 1996).
Giller and O’Donovan (2002) provide a good review of the question ‘Does
biodiversity matter’ and list a number of reasons why biodiversity should be
conserved and protected. One of the reasons they list is that biodiversity and its
effect on ecosystems has a monetary value. Constanze et al. (1997) has estimated
the value of the ecological services provided by ecosystems at US$33 trillion. In a
more recent assessment, Bullock et al. (2008) explained that although it is
difficult to put an exact monetary figure on biodiversity in Irish forests, if it is
taken that biodiversity has positive effects on wood production, wood loss
prevention, increased carbon sequestration as well as an increase in aesthetic
value and forest visits, then the total worth of biodiversity to Irish forests could be
more than €700 million per annum. When dealing with such a large source of
income, it is wise to plan and research how possible actions will affect future
growth predictions. As the famous American ecologist Aldo Leopold stated, the
6
first precaution of intelligent tinkering is to "keep every wheel and cog" (Leopold
1949).
A significant start has been made in examining and recording the
biodiversity in Irish forests through the BIOFOREST programme
(http://bioforest.ucc.ie/). The BIOFOREST research group revealed the
biodiversity of vegetation, bryophytes, hoverflies, spiders and birds in both native
and plantation forests as well as making recommendations of how to increase the
biodiversity in the selected forests (Smith et al. 2005; Iremonger et al. 2006;
Smith et al. 2006).
1.3 The FUNCTIONALBIO project
Following on from the large amount of work completed by the BIOFOREST
project, the functional biodiversity of Irish native and plantation forests was
identified as a key research area. The FUNCTIONALBIO project
(http://www.coford.ie/) was set up in 2007 and funded by the Council for Forest
Research and Development (COFORD). The overall aim of the
FUNCTIONALBIO project is to investigate the “Functional biodiversity in
forests, including the diversity of soil decomposers and predatory and parasitic
arthropods. The project is composed of two work packages:
(1) Fungal diversity (macrofungi and ectomycorrhizal diversity) package.
Investigated by Mr Richard O’Hanlon and Dr Thomas Harrington, Department of
Life Sciences, University of Limerick.
(2) Predatory and parasitic arthropods package.
Investigated by Dr Julio Arroyo and Prof. Thomas Bolger, School of Biology and
Environmental Science, University College Dublin.
Both packages are examining the same forest sites over the same time
period (2007-2009). This thesis is concerned with package 1 of the
FUNCTIONALBIO project, which investigates the fungal diversity of the forest
types. A final report on the project will draw together the key findings of both
packages and identify the factors that affect functional biodiversity in these forest
types.

7
1.4 Macrofungi in forest ecosystems
In terms of biomass, diversity and their ecological functions, fungi are the most
important group of organisms in forest ecosystems after the trees themselves (Paul
2007). It is estimated that the fungal biomass in soils exceeds the biomass of all
other soil organisms combined, except plant roots (Paul 2007). A study by Hunt
and Wall (2002) which modelled the removal of different biotic components of
the soil found that the removal of only two component groups, bacteria and
saprophytic (decay) fungi caused drastic changes in net primary productivity. This
suggests that as a functional group (decomposers in the latter case), fungi are
essential for soil processes.
With an estimated 1.5 - 4.5 million species worldwide (Hawksworth 1991;
O’Brien et al. 2005) fungi are one of the most diverse groups of organisms. They
vary from microscopic yeasts to gigantic mushrooms which can grow to weigh up
to 316 kg (Burdsall et al. 1996). A fungus also holds the record for the biggest
living organism ever recorded (Armillaria bulbosa which was found in forest soil
in Oregon which spread for over 40 hectares; Ferguson et al. 2003). The
biodiversity of fungi in an ecosystem has been shown to affect plant diversity (van
der Heijden et al. 1998) and thus primary productivity in terrestrial ecosystems.
Fungi hold key roles in the maintenance of forest ecosystems in particular. Moore
et al. (2001) lists these as:
• Nutrient cycling, retention and formation of soil structure.
• Food in detritivore food webs in forests and forest streams.
• Micro-habitat creation in forests by fungal pathogens.
• Mycorrhizal mutualisms.
Many countries have recognised the important roles fungi play in
ecosystems and have created laws and regulations which protect endangered
species. Slovakia has listed 52 species of fungi as having a ‘special legal status’
which enables the prevention of damage to habitats where these fungi are found
(Lizon 1999). The United Kingdom (English Nature 1999) and Switzerland (Egli
et al. 1995) have also taken steps to halt the loss of fungal diversity by creating
codes of practice and recommendations to achieve fungal conservation. In
contrast, Ireland has no fungi listed as protected in the most recent Checklist of
Protected Species in Ireland (Anon. 2003). On a broader scale, the exclusion of
8
fungi from red lists continues. There are 45,000 species on the International Union
for the Conservation of Nature (IUCN) international red-list of which only one,
Pleurotus nebrodensis, is a fungus (IUCN 2009). Despite the recognition of fungi
as a key part of most ecosystems, studies on fungi are still relatively limited when
compared to the number of studies on vegetation and arthropods in ecosystems.
This may be due to the limited number of researchers working in mycology. Atlas
et al. (1992) pointed out the decline of scientists studying mycology when he
stated “the number of microbial taxonomists has diminished to a level that
qualifies those now working in this speciality as themselves being considered
members of an endangered species”.
1.5 Layout of the thesis
This thesis is composed of seven chapters and two appendices. Chapter 1 is an
introduction to biodiversity and fungal diversity in forests. It also gives the
background to the FUNCTIONALBIO project. Chapter 2 is a literature review
examining the theory and practical findings of previous research into macrofungal
and ectomycorrhizal diversity in forests. Chapter 3 examines the vascular plant
diversity of the plots and gives a rationale for the selection of the forest types. The
vascular diversity is used to predict likely macrofungal diversity. Chapter 4 deals
with the species richness and functional group richness of macrofungi in the forest
types. The completeness of the macrofungal survey is statistically estimated using
species richness estimators. Chapter 5 describes the macrofungal community
composition of the different forest types and examines the relationship between
site variables and community composition. Chapter 6 focuses on the below-
ground ectomycorrhizal diversity of the forest types, describing the
ectomycorrhizal morphotypes using both morphological and molecular methods.
Finally, Chapter 7 provides a general discussion and links the findings of Chapters
3-6 into an overall description of fungal biodiversity in Irish forests and its
relationship to the biodiversity of other organisms in Irish forests. Appendix 1 is
supplied as an attached CD containing images related to this project. Appendix 2
contains an uncorrected proof of the article “Diversity and distribution of

9
mushroom forming fungi (Agaricomycetes) in Ireland” (O’Hanlon and Harrington
in press).

10

11
Chapter 2: Literature review

12

13
2.1 Sustainable forest management and certification
With the percentage of land use devoted to forestry increasing in Ireland, it is of
the utmost importance that more research is conducted to analyze the suitability of
the Forest Biodiversity Guidelines (Anon. 2000) for conserving and protecting
biodiversity and improving our understanding of the effects these plantation
forests will have on the environment and the biodiversity of the Irish countryside.
It is through Sustainable Forest Management (SFM) that both the ecological and
economical aspects of forests can be protected. As forest-related enterprises
employ directly and indirectly over 3.35 million people in Europe, it is important
that forest health is protected, so that Europe can continue to compete with other
nations in terms of forest products created and exported (Anon. 2006b).
The term Sustainable Forest Management covers many aspects of forest
health and sustainability but broadly speaking it can be taken to mean the use and
conservation of forests for the benefit of present and future generations. It is a
term which originated in the 1990s and has been added to and improved over the
years to suit current forest requirements and recommendations. In the most recent
Food and Agriculture (FAO) forestry publication title “State of the World’s
Forests 2007” (FAO 2007) seven thematic elements have been identified through
research by groups such as the United Nations Forum on Forests. These elements
are:
• Extent of forest resources.
• Biological diversity.
• Forest health and vitality.
• Productive functions of forest resources.
• Protective functions of forest resources.
• Socio-economic functions.
• Legal, policy and institutional framework.
In Ireland, sustainable forest certification is carried out by the Forest
Stewardship Council (FSC) (www.fsc.org). The FSC is a not-for-profit body
which is one of two forest certification bodies in Europe, the other being the

14
Programme for the Endorsement of Forest Certification Schemes
(http://www.pefc.org). The FSC has 10 principles which must be adhered to if a
forest is to be FSC certified. The certification is issued for 5 years and Coillte
successfully retained its certification in 2006.
The main principles of the FSC (www.coillte.ie) that deal with biological
diversity (and therefore fungal diversity) on a site are:
• Environmental impact: management will work to conserve biological
diversity so as to protect the ecological functions and integrity of the
forest.
• Benefits from the forest: management will encourage the use of the forests
for production of many products and services to ensure economic viability.
Edible or medicinal fungal fruitbodies would be an example of non-wood
forest products which have economic values.
• Maintenance of high conservation value forests: management decisions
which affect forests of high conservation status will maintain or enhance
the attributes which define such forests.
In the most recent FSC draft report, it was highlighted that a decrease in
the planting of Sitka spruce, increase in the planting of broadleaf species and an
increase in open space/biodiversity enhancement area are necessary in order to
meet FSC criteria (Anon. 2009). This project will produce data that will contribute
to the fulfillment of the three FSC principles outlined above and therefore help
Irish forests to receive the FSC standard.
2.2 COFORD and recent forest research in Ireland
With many consumers becoming more conscious of environmental issues, it is
through certification and eco-labeling that independent reassurance and Forest
Certification is assuring consumers that the timber or timber products they buy
come from a sustainable and well managed forest. Without this eco-friendly
certification, exports of Irish timber would suffer and revenue from timber exports
would drop. To research Irish forest practices and their effects on biodiversity, the
forest service division of the Department of Agriculture, Fisheries and Food set up
15
the National Council for Forest Research and Development (COFORD).
COFORD invests a large sum of money into the research and development of
forest policies and priorities. Some of the projects funded in the past which relate
to forest biodiversity and ways to increase it are the BIOFOREST projects
1. Assessment of biodiversity at different forest stages (Smith et al. 2005)
2. Experimental methods to enhance biodiveristy in plantation forests
(Iremonger et al. 2006)
3. Biodiveristy assessment of afforested sites (Smith et al. 2006)
The first project, undertaken by Smith et al. (2005), identified a number of
indicators of good forest health and high diversity in both ash and Sitka spruce
plantation forests. Indicators such as the type of vegetation present in a site or the
presence of a specific bird species were identified and related to forest
biodiversity. Overall the project made a number of recommendations on how
forest procedures and planting regimes might be changed to enhance forest
biodiversity of vegetation, bryophytes, hoverflies, spiders and birds in forests
(Smith et al. 2008).
The second project, by Iremonger et al. (2006) pointed out that there is no
“one size fits all” with regard to increasing forest biodiversity. Priority must be
given to retaining areas which are of high conservation value. Another
recommendation relates to the importance of open spaces in Irish plantation
forests (Smith et al. 2007; French et al. 2008). Guidelines were given for the
minimum area which should be retained as open spaces and also for the minimum
sizes for forest paths and roads.
The third project, investigated by Smith et al. (2006), assessed the changes
which occurred in afforested lands in the species assemblages of vegetation,
spiders, hoverflies and birds. It was found that the changes that took place in the
first five years of afforestation were not as marked as the changes that took place
as forests age from pre-thicket to thicket, and mature to over-mature (Oxbrough et
al. 2005, 2006, 2006b). However, Oxbrough et al. (2006) also pointed out a
limitation of their study, in that it is not very meaningful to compare the diversity
of different habitat types such as a wetland, which may have a low biodiversity
when surrounded by other wetlands can have a very high biodiversity if it was
16
situated in an area of improved grassland. With this in mind they accord caution to
comparisons of different habitat types.
Of the listed recommendations given in the three projects above, the ones
most related to this project are:
1. The use of surrogate measures of biodiversity as an indicator of fungal
species richness, e.g. quantity of Coarse Woody Debris (CWD) quantity
(Ferris et al. 2000a).
2. The effect of mixed tree crops on biodiversity of plantation forests e.g.
birch spruce mixtures should be investigated for its effect on biodiversity.
3. The retention of high conservation value areas within forests e.g. variable
retention, where an area which has a high level of biodiversity is retained
and a new forest cycle is planted around it thus conserving and possibly
promoting the spread of the plants and animals back into the newly
forming forest.
The National Forest Inventory was completed by the Forest Service of the
Department of Agriculture and Food in 2007 and has also collected much data on
forest composition, health and biodiversity (National Forest Inventory 2007). It
has produced a large body of data on the diversity of plants and lichens in Irish
woodlands but no such work on fungi has taken place.
2.3 Studies of fungi in forest ecosystems.
There have been many studies carried out in the United Kingdom (U.K.)
and Europe looking at the diversity of fungi in different forested habitats (Table
2.1). Biodiversity or ecological diversity is scale-dependent and has a hierarchy in
nature (Whittaker 1977). Diversity can be broken up into levels, alpha, beta,
gamma and epsilon. Alpha diversity, which is also known as within habitat
diversity, is the diversity in a patch or in the case of this project within-site
diversity. Beta diversity describes the contribution of multiple habitats to the
overall diversity of a site (Zak and Willig 2004). In the case of this project, beta
diversity is the between-site diversity. Gamma diversity indicates the number of
species within a region or landscape type. For this project, gamma diversity is
taken to mean between-forest diversity. Epsilon diversity, which is the highest
17
level of diversity put forward by Whittaker (1977), is a measure of the diversity of
a large biogeographic region. Epsilon diversity was not examined in this project
because of the small area of forest landscape and fragmented nature of the
remaining native forests.
Macrofungal diversity is gaining more research interest in Europe in recent
years (Table 2.1). The projects listed that are most related to the
FUNCTIONALBIO projects are the two projects in the U.K., by Ferris et al.
(2000a) and by Humphrey et al. (2000). These studies found, contrary to the
existing opinion, that fungal diversity is usually lower in non-native forests, exotic
conifers such as Sitka spruce and Norway spruce can support a large and varied
collection of fungi, lower than, but nonetheless comparable to that of native
forests. Many of the other studies (Table 2.1) found that fungal diversity and
species abundance is affected by many different factors including soil physical
and chemical variables along with forest structural variables.
Table 2.1 List of previous fungal diversity studies from forests in Europe
Country Scale Reference
England Gamma Ferris et al. 2000a
England Gamma Humphrey et al. 2000
England Alpha Tofts and Orton 1998
England Beta Orton 1987
Estonia Beta Tedersoo et al. 2006
Ireland Beta Heslin et al. 1992
Norway Beta Hoiland and Bendickson 1996
Portugal Alpha Baptista et al. 2010
Scotland Gamma Alexander and Watling 1987
Scotland Beta Newton et al. 2002
Spain Beta Fernandez et al. 2006
Spain Alpha Sarrionandia et al. 2009
Spain Beta Oria de rueda et al. 2010
Sweden Beta Ruhling and Tyler 1990
2.4 Forest management practices and their effects on forest fungi
It has been suggested that even moderate forest management practices can have a
negative effect on macrofungal species diversity in forested sites (Bader et al.
1995). Studies by Penttila (1995), Kotiranta and Niemela (1996) and Lindbald
(1998) in Eastern Europe, Finland and Norway show that species richness of
18
wood-inhabiting fungi is lower in managed forests than in pristine or near-pristine
forests. Forest management is nevertheless important because forest managers and
ecologists strive to strike a balance in the best interest of both disciplines. This is
one of the key principles of SFM, that forests are used in a sustainable and
ecologically safe way for the benefit of current and future generations. There are
many practices, some old and some new, that are used to generate and harvest
high quality wood from forests. These practices can have both positive and
negative effects on forest biodiversity.
The retention of biodiversity in forests has been recognised as a key factor
in the forestry policy of countries such as U.K. (Forestry Commission 1998). The
Heritage Council of Ireland has created a framework for the conservation of
biodiversity in Irish habitats at a local level, and has listed the conservation of
biodiversity, and the sustainable use of the components of biodiversity, as its main
goals (Anon. 2003). Some of the forestry practices currently in place or being
investigated are: thinning of the understory of coniferous forests, planting of
mixed species of trees, retention of coarse woody debris (CWD) on site, the
retention of trees beyond financial maturity and the creation of open spaces within
the forest. A recent and beneficial technique to be developed as a spin off from the
COFORD project ForestScan (COFORD 2009), is the use of terrestrial laser
scanning to accurately measure total wood volume. By estimating how much
wood will be harvested, forest managers can reduce the amounts of waste timber
harvested and also leave areas forested until the timber is needed for processing.
The planting of mixed species of trees as an alternative to monocultures
has been investigated in Ireland for many years. Despite the fact that Sitka spruce
and the other imported conifers are capable of growing on sites of poor fertility
that cannot be used for farming, it has been realized that having single dominant
species has economic, biological and environmental risks. An example of a
biological risk caused by planting of monocultures was the recent outbreak of the
fungal pathogen Phytophthora ramorum, which has caused widespread damage to
larch plantations in the U.K. (Webber et al. 2010), indicating an apparent host
shift from broadleaf to coniferous tree species. To protect against these risks,
planting rules were created (Anon. 1996), that (1) reduced the annual planting of
Sitka spruce to below 60% of the total trees planted and (2) set out guidelines to
ensure that all sites had a measure of heterogeneity. The benefits of mixed crops
19
of trees have been investigated in Ireland and elsewhere, and show that a mixture
of the primary tree species with a nursing tree species produces a more vigorous
growth rate (O’Carroll 1978; Scherer-Lorenzen 2005), less need for fertilizer
application (Carey et al. 1988), resistance to pests and diseases (Su et al. 1996;
Muller 1998; Lugo 1997) and a more substantial monetary return at the end of the
cycle (Joyce and O’Carroll 2002). In studies in Europe and the United States,
mixed forests of two or more tree species have been found to have higher
diversity of vascular plants (Felton et al. 2010), bryophytes (Coote et al. 2008),
lichens (Humphrey et al. 1998) and fungi (Bills et al. 1986; Ferris et al. 2000a)
compared to monocultures. Massicotte et al. (1999) suggest that by having a
mixed crop of trees in a site, there are more opportunities for fungi (especially
ectomycorrhizal fungi) to colonize one or more tree species, due to many fungi
being host generalists and spreading vegetatively to different tree species.
The retention of trees beyond financial maturity is listed in the Forest
Biodiversity Guidelines (Anon. 2000) as a key factor in increasing biodiversity in
Irish forests. This practice is supported by the findings of many researchers
(Peterken et al. 1992; Ferris et al. 2000a; Jones et al. 2003; Humphrey 2005), who
hypothesised that retaining some old growth trees will help to re-establish the
biota that were present in the forest before felling. The general consensus is that
retaining a patch containing a number of trees is much more biologically efficient
than retaining single trees scattered around the site (Luoma et al. 2004). It has
been shown that during primary establishment, young trees depend on
mycorrhizal inoculum from neighbouring trees (Jumpponen et al. 2002;
Ashkannejhad and Horton 2006; Cline et al. 2005). Jones et al. (2003), Dickie and
Reich (2005) and Outerbridge and Trofymow (2004) have shown that the extent
of colonization of roots of immature trees by ectomycorrhizas of older trees
decreases with distance from the older trees. Luoma et al. (2004) found that any
removal of mature trees causes a loss in biomass of the next season’s mushroom
and truffle crop, and that retention of 15% of the stems is not sufficient to prevent
wholesale loss of the mushroom crop.
Just as biodiversity has been shown to be positively related to retention of
trees beyond financial maturity, clear-cutting has been shown to have negative
effects on forest biodiversity. The negative effects of clear-cutting have been
investigated by many researchers and reviewed by Rosenvald and Lohmus (2008).
20
These negative effects include drastic changes in abundance, biomass and
community structure of soil fauna (Huhta 1971, 1976; Huhta et al. 1967, 1969;
Grayston et al. 2006), woodland plant species (Hill 1979), and woodland fungi
(Baath 1981; Jones et al. 2003). In fact, it has been found that many ECM fungi
cannot survive clear-cutting (Amaranthus 1992; Borchers and Perry 1990) and
therefore depend on pockets of surviving inoculum to re-colonise the site. It is not
just the removal of the trees which negatively effects fungal diversity; the
processes related to the removal of the timber also damage soil fungal networks.
Machines used for tree removal damage the soil layer and cause major soil
disturbances to the soil’s moisture and temperature regime, stand structure and
soil micro-site conditions (Franklin and DeBell 1973; Rogerson 1976; Stark
1982). The effect of forest litter-layer disruption on fungi has been investigated by
Luoma et al. (2006a) and depending on the depth of the soil disturbance, a large
reduction (up to 75%) was found in the fruiting of the matsutake fungus during
the ensuing nine years of the study.
Pruning and thinning are very important for the creation of a high quantity
and quality timber in Sitka spruce forests (Joyce and O’Carroll 2002). The
removal of low branches both allows more light to permeate to the ground layers
and also significantly adds to the CWD present of the forest floor. Pruning also
promotes plant diversity in conifer forests (Iremonger 1999; Ferris et al. 2000b)
by allowing shade-limited species to re-colonize from the seed bank or invade
from surrounding habitats. Thinned Sitka spruce stands also have greater aesthetic
appeal. It has been found by Vesterdal et al. (1995) that in un-thinned forests,
carbon, nitrogen and phosphorus accumulated in unavailable forms when litter
production rates exceeded decomposition rates of the ground litter. Thinning, in
addition to wind-throw, is an important contributor to the volume of deadwood in
a stand, in the form of stumps and felled trees (Smith et al. 2005).
Although thinning can have positive effects on biodiversity in forests,
heavy-intensity thinning has been shown to reduce fungal sporocarp numbers by
studies in the Pacific Northwest forests (Pilz and Perry 1984; Waters et al. 1994;
Colgan et al. 1999) and in oak forests in Sweden (Norden et al. 2008). It has been
shown that recently thinned forests experience an overall reduction of fungal
sporocarp production. This finding is in agreement with Edmonds and Lebo
(1998), which found that where bryophyte cover increased (possibly due to
21
increased light penetration to the forest floor) sporocarp production was reduced
or absent. A contributory factor may be increased soil desiccation due to the
reduction in canopy cover in thinned forests (Siitonen et al. 2005). The report by
Colgan et al. (1999) found that, in variably-thinned forests, a reduction in total
hypogeous fungi fruitbodies was found, but that total species richness was higher
in lightly-thinned stands. The authors believe that the process of thinning induced
the fruiting of these extra species, possibly through a survival response, similar to
when plants allocate much of their resources to creating reproductive structures to
ensure the survival of future generations of the plant.
The occurrence of various types of CWD has been listed as a key factor
for increasing biodiversity in forest ecosystems (Franklin et al. 1987; Esseen et al.
1992; Kohm and Franklin 1997). Current recommendations promote the retention
of high quality and a high quantity of CWD in forest sites (Bader et al. 1995;
Christensen and Emborg 1996; Smith et al. 2005; Sippola and Renvall 1999). The
forest biodiversity guidelines (Anon. 2000) state that CWD should be left on site
as standing stems, fallen logs and wind-thrown areas after thinning and final
harvesting. This provides a habitat or refuge for some forest species and can then
promote re-colonization of the forest from the left-over CWD (Renvall 1995).
CWD left on site is one of the main substrates for many fungal fruitbodies,
including corticoid basidiomycetes which have been described as hatcheries for
diverse groups of insects and arthropods (Norden et al. 2008; O’Connell and
Bolger 1997; Okland et al. 2005, 2008). In fact, CWD has been given such a
positive link with enhancing biodiversity that it is being used as a surrogate to
measure relative forest health by forest managers (Kohl 1996; Tomppo 1996;
Gunnar-Jonsson and Jonsell 1999).
2.5 Functional groupings for fungi
The term functional diversity is used in this project to quantify diversity and
richness in groups of fungal species that have identical methods of acquiring
nutrition. The examination of functional groups instead of the number of species
is useful as some relationships between diversity and the environment only
emerge when a functional approach is employed (Smith et al. 2005; Williams and
Hero 2001; Keil et al. 2008). As Waksman (1916) explained “the question is not
22
how many numbers and types of fungi can be found in the soil, but what
organisms lead an active life in soil”. Within a single taxon such as genus or
family, the diversity of functional groups is likely to be determined by completely
different factors than is species richness (Williams & Hero 2001; Schweiger et al.
2007). Schweiger et al. (2007) found that had an analysis of species diversity only
been carried out on their hoverfly data, then the environmental variables would
not have explained the diversity or abundance of hoverflies found on their sites.
However, when the species were grouped based on an array of traits covering a
broad spectrum of a species’ ecology, it was found that environmental variables
had a significant effect on these functional groups. This suggests that a functional
approach may provide a better base for conservation and applied research
(Schweiger et al. 2007).
Functional group analysis is important because in most cases species
extinction is not a random occurrence, and is driven by species dependence on a
resource or on the limited dispersal of that species. Functional groups which have
a large dependence on a resource and also have limited dispersal mechanisms are
even more at risk of extinction due to these non-random events. The functional
groupings being used in this project are the same as those used in Ferris et al.
(2000a). These are ectomycorrhizal fungi (ECM), wood-decay (WD), litter-decay
(LD) and parasitic (P) fungi. Functional groups that are not of prime consideration
in this study include entomogenous fungi, phylloplane fungi, lichens, endophytic
fungi, yeasts, fungal parasites of insects and vertebrates, and aquatic
hyphomycetes.
Wood- and litter-decay fungi (Saprobic fungi)
Saprobic fungi have important recycling functions in terrestrial ecosystems. The
fungal hyphae release enzymes that break down remains of plants and animals,
and release these nutrients back into the soil when the plant and animal material
decomposes. With up to 70% of the above-ground biomass of forests in the form
of perennial plants (Rodin and Basilevic 1968), it is important that the nutrients
stored in this biomass are recycled into the forest soil. The saprobic fungi
examined in this study are litter- and wood-decay fungi. Litter-decay fungi break
down leaves and coniferous needles and so release nutrients from these into the
ecosystem in available forms. The diversity and community composition of these
23
fungi are tightly linked to litter layer variables, and litter variables can vary
significantly in different forest types.
Wood-decay fungi break down branches and CWD in the forest
environment. It has been shown that the diversity of wood-decay fungi is closely
related to the amount of CWD left in situ (Ferris et al. 2000a). Factors such as
CWD size (Odor et al. 2006; Heilmann-Clausen and Christensen 2005), CWD
quality (Sippola et al. 2005) and a range of CWD at different decay stages (Boddy
et al. 1987; Hoiland and Bendickson 1996) are most important in the promotion of
a high diversity of wood-decay fungi in forests.
It has been suggested that the amount of CWD can be used as an indicator
for biodiversity of forest ecosystems (Humphrey et al. 2003). Forest sites with a
high amount of CWD are often rich in red-list species. Studies by Heilmann-
Clausen and Christensen (2003, 2005) have shown that many red-listed polypores
are often restricted to unmanaged forests that characteristically have a high
amount of CWD present. Crites and Dale (1998) found that species richness of
lichens and bryophytes on logs in contact with the ground increased as the logs
progressed through decay stages.
Ectomycorrhizal (ECM) fungi
Ectomycorrhizas are but one of a number of different groups of mycorrhizal fungi
found on roots of forest trees and some forest shrubs. The others include
arbuscular, ericoid and ectendomycorrhizal types, which are not a primary
consideration in this study, because the principal tree species investigated in this
study (oak, Scot’s pine and Sitka spruce) are ECM hosts, and because ECM
diversity is reflected to some extent in above-ground sporocarps. ECM fungi form
symbiotic relationships with the majority of angiosperm and coniferous forest
trees (Molina et al. 1992) in temperate and boreal regions, primarily with oaks
(Quercus), beeches (Fagus), birches (Betula), poplars (Populus), pines (Pinus),
spruces (Picea), firs (Abies) and larches (Larix). In forest ecosystems where soil
fertility is relatively low, trees rely heavily on mycorrhizal associations for
nutrient uptake (Allen 1991; Leake et al. 2004; Smith and Read 2008).
Mycorrhizal relationships are one of the oldest and most important
relationships in terrestrial ecosystems (Brundrett 2002; Stubblefield and Taylor
1988). The fungus forms a mantle around the roots of the plant and aids it in
24
absorbing macro- and micro-nutrients from the soil (Cumming 1996), and thus
confers better growth and survival on the tree (Amaranthus and Perry 1987; Perry
et al. 1990). It has been shown that the fungal part of the mutualism can absorb
almost any limiting nutrient depending on the host (Allen 1991; Smith and Read
2008). Andersson et al. (1996) found increased concentration of phosphorus,
calcium, magnesium and potassium in plants with the ECM fungus Paxillus
involutus present on its roots. Trees with ECM fungi present on their roots also
have increased ability to acquire water, a factor which increases the tree’s ability
to survive in drought-affected areas (Lehto and Zwiazek 2011). In exchange for
this acquisition of nutrients, the plant provides the fungus with up to 20% of its
photosynthate (Graham 2000; Hobbie 2006). In temperate and boreal forest
ecosystems, it has been shown that ECM fungi colonize more than 90% of the
fine roots of trees (Markkola et al. 1996).
Work by Baxter and Dighton (2001) highlighted the importance of ECM
diversity to the host trees, showing that plants with increased ECM diversity on
their roots had higher concentrations of phosphorus in their tissues. The fungal
part of the ECM association (mycobiont) also has the ability to acquire nutrients
directly from decomposing litter (Leake and Read 1997), from live animals such
as springtails (Klironomos and Hart 2001), dead nematodes (Perez-Moreno and
Read 2001) and from stone particles in the soil (Jongmans et al. 1997; Landeweert
et al. 2001) so directly linking the above-ground and below-ground ecosystems.
Plants with mycorrhizae present on their roots have also been shown to have an
increased tolerance to harsh conditions, such as heavy metal toxicity and drought
(Hartley et al. 1997) and also a higher resistance to plant pathogens (Duchesne et
al. 1988).
Although a number of ECM fungi are host specialist in that they only
occur with a specific tree type (Harley and Harley 1987; Molina et al. 1992),
laboratory studies have shown that the majority of ECM fungi are host generalist
and often colonise more than one tree species (Molina and Trappe 1982; Smith et
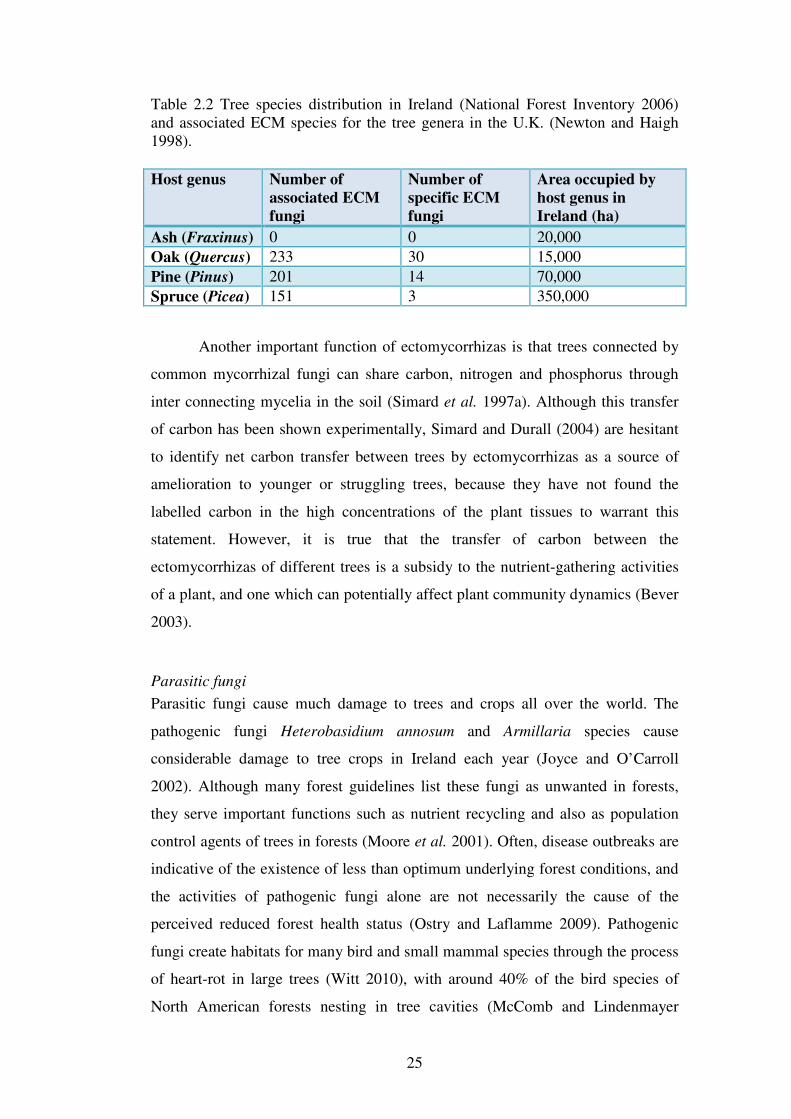
al. 1995; Simard 1997b). Of the four tree species being investigated in this
project, ash is the only species which does not form ECM structures (Table 2.2)
while oak supports the greatest diversity of ECM fungi in the U.K. with similar
results expected for Ireland.
25
Table 2.2 Tree species distribution in Ireland (National Forest Inventory 2006) and associated ECM species for the tree genera in the U.K. (Newton and Haigh 1998).
Host genus Number of
associated ECM
fungi
Number of
specific ECM
fungi
Area occupied by
host genus in
Ireland (ha)
Ash (Fraxinus) 0 0 20,000
Oak (Quercus) 233 30 15,000
Pine (Pinus) 201 14 70,000
Spruce (Picea) 151 3 350,000
Another important function of ectomycorrhizas is that trees connected by
common mycorrhizal fungi can share carbon, nitrogen and phosphorus through
inter connecting mycelia in the soil (Simard et al. 1997a). Although this transfer
of carbon has been shown experimentally, Simard and Durall (2004) are hesitant
to identify net carbon transfer between trees by ectomycorrhizas as a source of
amelioration to younger or struggling trees, because they have not found the
labelled carbon in the high concentrations of the plant tissues to warrant this
statement. However, it is true that the transfer of carbon between the
ectomycorrhizas of different trees is a subsidy to the nutrient-gathering activities
of a plant, and one which can potentially affect plant community dynamics (Bever
2003).
Parasitic fungi
Parasitic fungi cause much damage to trees and crops all over the world. The
pathogenic fungi Heterobasidium annosum and Armillaria species cause
considerable damage to tree crops in Ireland each year (Joyce and O’Carroll
2002). Although many forest guidelines list these fungi as unwanted in forests,
they serve important functions such as nutrient recycling and also as population
control agents of trees in forests (Moore et al. 2001). Often, disease outbreaks are
indicative of the existence of less than optimum underlying forest conditions, and
the activities of pathogenic fungi alone are not necessarily the cause of the
perceived reduced forest health status (Ostry and Laflamme 2009). Pathogenic
fungi create habitats for many bird and small mammal species through the process
of heart-rot in large trees (Witt 2010), with around 40% of the bird species of
North American forests nesting in tree cavities (McComb and Lindenmayer
26
1999). Trees weakened by parasites are more susceptible to wind-throw, which
creates large canopy gaps and promotes regeneration of other tree species. Other
species of fungal pathogens attack specific tree species only, and so promote a
level of tree species diversity in forests. Annosus root rot caused by
Heterobasidion annosum attacks conifer species, but species such as ash
(Fraxinus spp.) and oak (Quercus spp.) are left undamaged, thus promoting
colonization by these and other broadleaves (Korhonen et al. 1998).
2.6 Below-ground ectomycorrhizal diversity in forests
The study of ECM populations presents particular problems for fungal ecologists.
There are two principal difficulties, identification and quantification of ECM
populations. In practice, most studies use a combination of morphological and
molecular methods for identifying ECM fungi. This method has been used by
Harrington and Mitchell (2002), Sakakibara et al. (2002), Horton and Bruns
(2001) and Kaldorf et al. (2004), where mycorrhizas were identified firstly by
morphological examination of the outer surface and also the mantle pattern
according to Agerer (1987-2002), and then by molecular methods to identify to
species level. It is important to examine the ECM structures on the roots as well as
above-ground sporocarps, as previous studies have shown sporocarps alone to be
bad indicators of the ECM fungi present in the soil (Clapp et al. 1995; Cripps
2004; Danielson 1984; Luoma et al. 2004). Quantification of population sizes is
difficult, because of the near impossibility of defining a fungal “individual”, and
also because of the fact that ectomycorrhizas are non-randomly distributed in the
vertical and horizontal dimensions of the soil layer (Horton and Bruns 2001;
Taylor 2002; Tedersoo et al. 2003). As population estimation is not an aim of the
present study, it will not be considered further here.
Past studies have shown that many ectomycorrhizas are host-specific
(Molina et al. 1992; Newton and Haigh 1998; Bills et al. 1986; Kranabetter et al.
1999; Ishida et al. 2007) and so it would be expected that differences in ECM
communities between the different forest types and also between chronological
stages of the forests (Last et al. 1987; Mason et al. 1987; Smith et al. 2002; Wang
et al. 2005) would be found. ECM communities are not only influenced by tree
species, but also by their position on the roots. It has been shown that ECM

27
communities vary in composition, according to their depth in the soil profile
(Dickie et al. 2002; Rosling et al. 2003; Tedersoo et al. 2003) and also their
distance from the tree (Bruns 1995; Deacon and Fleming 1992; Luoma et al.
2006a). Differing levels of carbon allocation between roots, near and far from the
tree, were once thought to be one of the main drivers of high ECM diversity in
forests (Bruns 1995), but recent findings such as niche specificity (Tedersoo et al.
2003; Buee et al. 2007) and functional ECM exploration types (Peay et al. 2011)
are now thought to have a stronger influence on ECM diversity at the horizontal
level in soil.
2.7 Soil and site variables and their relationship with fungal diversity
Soil biotic and abiotic variables have been suggested to have an influence on
fungal diversity (Enttema and Wardle 2002; Villeneuve et al. 1989). At the
smallest scale, fungi respond to differences in soil pore space, soil aggregates,
organic matter position and the distribution of fine roots in the soil horizon. At a
larger scale, soil type, previous land use and topography, influence the fungi that
can survive in the soil. Soil moisture was found to be positively correlated with
species richness of vascular plants in boreal forests (Zinko et al. 2005). A study
by Krebs et al. (2008) showed that by artificially increasing summer rainfall, the
biomass of fungal sporocarps increased two fold. Soil pH has been regarded as
one of the best indicators of fertility in terrestrial ecosystems such as deciduous
and coniferous forests in northern Europe (Nihlgard and Lindgreen 1977;
Diekmann 1994, 1999; Engelmark and Hytteborn 1999). The fact that pH can
have a large influence on the diversity of fungi in an ecosystem has been shown in
previous studies (Arnolds 1982; Bohus 1984; Harrington and Mitchell 2005a).
Humphrey et al. (2000) used principal components analysis to identify the main
soil factors affecting fungal diversity and found that pH, K, Mg and Ca were the
most influential soil factors in forests. It is well known that pH is related to many
other soil variables, and so pH is sometimes used as a proxy variable for other soil
chemical factors. For instance, at a low pH, soil nitrifying bacteria are limited in
their ability to convert soil ammonium into nitrate (Allison and Prosser 1991;
Jiang and Bakken 1999). Tyler (1985) analysed the base saturation or the
combined percent saturation of the four major cations that have a basic or alkaline
28
reaction (K+, Ca++, Mn++ and Mg++), and found that the fungal diversity was found
to be closely related to the base saturation of the soil.
The effect of, and response to soil abiotic variables is not a prime issue of
this study, as this study is mainly concerned with an examination of fungal
diversity in Irish forests.
The selection of variables known to affect forest fungal diversity
It has been found that the diversity of fungi in forest ecosystems is affected by
physical, chemical, biological, geographical and meteorological factors (Dickie
and Reich 2005; Villeneuve et al. 1989; Ferris et al. 2000a; Cripps 2004; Tyler
1985; Baar 1996; Schmit et al. 2005; Smith et al. 2003; Baar and Kuyper 1998;
Jones et al. 2003; Lee and Lee 2004; Krebs et al. 2008). The most used methods
of measuring these variables are dealt with in the following sections.
The variables examined here are:
1) Edge effect.
2) Soil physical structure.
3) Litter depth.
4) Canopy gaps.
5) Coarse woody debris (CWD).
6) Soil chemical characteristics (pH, Soil P, K, N).
7) Organic matter quantity.
8) Moisture content.
9) Trees species.
10) Tree age.
11) Vegetation layer.
12) Forest structural diversity.
13) Past land use.
14) Altitude.
15) Aspect.
16) Weather.
29
The edge effect and the measurement of forest canopy gaps
Forest edges can be hotspots of diversity due to the numerous biotic and abiotic
gradients that occur where the forest ecosystem meets the adjoining ecosystem.
Due to their significant effect on migration, evolutionary changes of organisms
and species diversity and abundance, edges have become one of the most
researched areas in ecology (Ries et al. 2004). A significant edge effect has been
found in studies on the diversity of fungi (Allen 1987; Kranabetter and Wylie
1998; Kernaghan and Harper 2001; Heilmann and Christenson 2003; Cripps 2004;
Dickie and Reich 2005; Siitonen et al. 2005), plants, birds, mammals and
invertebrates (for review see Ries et al. 2004). Areas within a forest stand with
breaks in the canopy that allow more light to penetrate to the ground floor, are
known as forest gaps and also constitute edges.
Forest gaps have also been identified as areas with high diversity of
vascular plants and bryophytes (Smith et al. 2007a; French et al. 2008). Both
forest edges and forest gaps in the canopy can experience: (a) an increase in
ground floor vegetation due to the higher availability of solar radiation, (b) an
increase in soil moisture from the increase of rainfall reaching the soil, and (c) an
increase in wind turbulence at the forest floor when compared to an area within
the forest interior. All of these effects can influence fungal diversity in the
resulting microsites created. Certain ECM fungal species have been shown to be
more common near areas close to gaps in the forest canopy (Cripps 2004). This
could be due to the preference of some ECM species for areas of low root density
(Peay et al. 2011). Also, fungal species that rely on air turbulence to disperse
spores often occur near the edge of forests and near forest gaps, where their spores
have a greater chance of being dispersed by wind currents (Allen et al. 1993).
The methods of identifying and quantifying canopy gaps have been
reviewed, and their advantages and disadvantages identified (Table 2.3).
Measurements of light or Photsynthetically Active Radiation (PAR) reaching the
ground are time-consuming. Simpler methods to evaluate gaps in the forest
canopy involve measurement of canopy cover and/or canopy closure. The
definition and measurement of these two variables can be found in review papers
by Jennings et al. (1999) and Paletto and Tosi (2009).
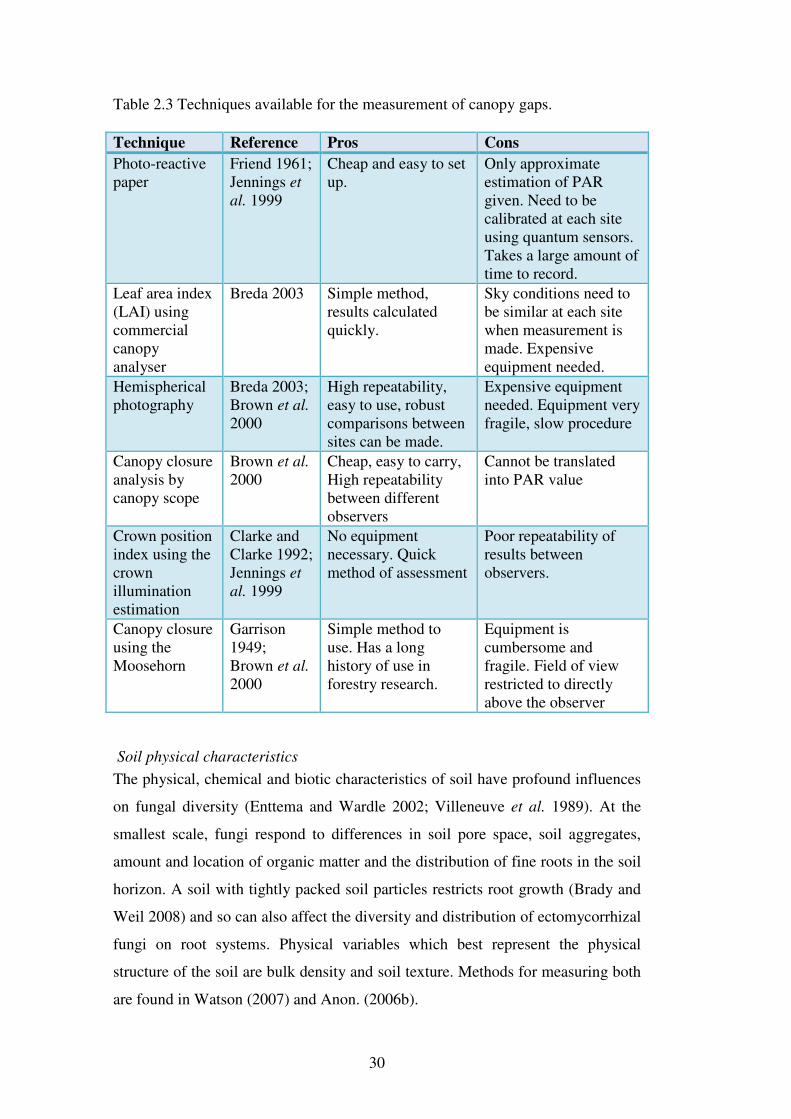
30
Table 2.3 Techniques available for the measurement of canopy gaps.
Technique Reference Pros Cons
Photo-reactive paper
Friend 1961; Jennings et
al. 1999
Cheap and easy to set up.
Only approximate estimation of PAR given. Need to be calibrated at each site using quantum sensors. Takes a large amount of time to record.
Leaf area index (LAI) using commercial canopy analyser
Breda 2003 Simple method, results calculated quickly.
Sky conditions need to be similar at each site when measurement is made. Expensive equipment needed.
Hemispherical photography
Breda 2003; Brown et al. 2000
High repeatability, easy to use, robust comparisons between sites can be made.
Expensive equipment needed. Equipment very fragile, slow procedure
Canopy closure analysis by canopy scope
Brown et al. 2000
Cheap, easy to carry, High repeatability between different observers
Cannot be translated into PAR value
Crown position index using the crown illumination estimation
Clarke and Clarke 1992; Jennings et
al. 1999
No equipment necessary. Quick method of assessment
Poor repeatability of results between observers.
Canopy closure using the Moosehorn
Garrison 1949; Brown et al. 2000
Simple method to use. Has a long history of use in forestry research.
Equipment is cumbersome and fragile. Field of view restricted to directly above the observer
Soil physical characteristics
The physical, chemical and biotic characteristics of soil have profound influences
on fungal diversity (Enttema and Wardle 2002; Villeneuve et al. 1989). At the
smallest scale, fungi respond to differences in soil pore space, soil aggregates,
amount and location of organic matter and the distribution of fine roots in the soil
horizon. A soil with tightly packed soil particles restricts root growth (Brady and
Weil 2008) and so can also affect the diversity and distribution of ectomycorrhizal
fungi on root systems. Physical variables which best represent the physical
structure of the soil are bulk density and soil texture. Methods for measuring both
are found in Watson (2007) and Anon. (2006b).
31
Litter depth has also been found to be related to fungal diversity. Ferris et
al. (2000a) found that as litter depth increased, so did the fruiting of wood
saprotrophs and ECM fungi in British forests. The authors attribute this to
increased water-holding capacity of the soil due to the covering layer of leaf litter.
However, de Vries et al. (1995) found the opposite in nitrogen-enriched (due to
atmospheric pollution) forests in the Netherlands; it was found that sod cutting
(manual removal of the litter layer) increased the fruiting of saprobic and ECM
sporocarps significantly. Baar and Kuyper (1998) found that removal of the
Deschampsia flexuosa sward from their Scot’s pine plot in the Netherlands
significantly increased ECM fruiting. The tight mat of roots formed by D.
flexuosa is thought to inhibit ECM fruiting (Arnolds 1991). The current
dominance of another forest grass species, Luzula sylvatica, in Irish acidophilous
oak forests (Anon. 2005a) may have similar effects on the ECM fungi in these
forests. Soil depth and the horizon of the soil are also of great importance,
especially when dealing with ECM root sampling. Many studies have shown that
ECM species have certain preferences for either the organic or mineral soil layers
(Stendell et al. 1999; Taylor and Bruns 1999).
Soil organic matter (SOM) has also been shown to be related to the
diversity of fungi in forests. Tyler (1985) found that diversity and abundance of
sporocarps was highly correlated with SOM in Swedish forests. Harrington (2003)
and Harrington and Mitchell (2005a) found that the distribution and abundance of
several mycorrhizal and saprophytic basidiomycetes species in the Burren Dryas
heaths varied with SOM content. Humphrey et al. (2000) found that SOM was a
key soil variable used in ordinating their sites based on their fungal communities.
Erland and Taylor (2003) reviewed the effect of SOM on fungi, and concluded
that at least in the case of ECM fungi, certain species show a greater affinity for
high and low organic matter concentrations.
Coarse woody debris CWD
Dead wood is closely associated with the life-histories of a variety of flora and
fauna, including fungi (Norden et al. 2004b), bryophytes (Odor et al. 2006) and
invertebrates (Kappes 2006; Topp et al. 2006). The amount of CWD on site can
be measured in a number of ways. The total volume of each piece of wood in a

32
site may be found if a restricted number of samples are being focused on, as in
Hoiland and Bendiksen (1996). In studies which involve a number of different
sites at a number of different chronological stages, other methods of estimating
CWD are necessary. Newton (2007) provides a good introduction to these
methods. The line intercept method is the quickest method, and gives an estimate
of the volume of CWD in a site; calculated by counting the pieces of wood
crossing a transect of known length. The longer the transect length and the more
transects can be taken per site, the more accurate the estimate of CWD volume.
The line intercept method was originally devised by Warren and Olsen (1964),
and has been modified by Kirby et al. (1998) to give final estimates in m3/ha
according to the relationship:
V= nd2 π
2 10
4/8t
Where V= volume of deadwood in m3 per ha n = number of times diameter class crosses transect line d = diameter class of deadwood at point of intersection in meters t= length of transect line in meters
Similar methods have been used in fungal diversity studies by Ferris et al.
(2000a) and Humphrey et al. (2000), and have found that the diversity of wood-
decay fungi was significantly correlated to the amount of CWD present on site.
The decomposition stage of the CWD is also an important variable, and Newton
(2007) devised a system of rating CWD on a scale of 1-5 with 1 being freshly
fallen timber and 5 being well rotten timber. Previous studies have shown that
there is a definite chronosequence of fungal colonizers of CWD (Boddy et al.
1987; Boddy and Watkinson 1995). In studies on fungi in forests, it has been
found that many rare and threatened fungi such as Sclerophora coniophaea and
Skeletocutis odora in Sweden, have a distinct preference for CWD in the
advanced stages of decay (Kruys et al. 1999).
Soil chemical variables
Fungal diversity has been linked to soil chemical variables in many studies
(Termorshuizen 1991; Goodman and Trofymow 1998; Villeneuve et al. 1989;
Humphrey et al. 2000). The main variables measured include: pH, available and
total soil phosphorus and nitrogen, soil potassium, soil organic matter, and
moisture content. Soil pH has been regarded as one of the best indicators of
33
fertility in terrestrial ecosystems, such as deciduous and coniferous forests in
northern Europe (Nihlgard and Lindgreen 1977; Diekmann 1999; Engelmark and
Hytteborn 1999). pH can have a large influence on the species richness and
diversity of fungi in an ecosystem (Arnolds 1982; Humphrey et al. 2000).
The concentrations of different ions and anions in the soil has also been
found to affect fungal populations, with edaphic factors such as cation exchange
capacity (CEC), % base saturation (Hansen 1988; Tyler 1985; Ruhling and Tyler
1990) and richness value (standardised measure of calcium, magnesium,
potassium, phosphorus and nitrogen in soil; Nantel and Newman 1992), having
been found to be related to fungal diversity in previous studies.
Soil nitrogen has been shown to affect ECM species composition and
abundance (Newton and Piggot 1991). In repeated fertilization trials in the
coniferous temperate forests of British Columbia, the percentage colonization of
fine roots was found to be negatively correlated with the addition of fertilizer to
forests (Berch et al. 2006). Further still, some fungal genera have been found to be
either nitrophobic or nitrophilic, such as species from the genera Cortinarius and
Piloderma being nitrophobic and species of Tomentella and Thelephora being
nitrophilic (Lilleskov et al. 2002).
The total measurement of soil nutrients through a one-off collection of a
sample is valid, but tells very little about the flux of nutrients available to the plant
roots over time. A novel approach is to use an in situ method of measurement for
soil nutrient availability. Unlike conventional soil extractions, in situ burials of
ion exchange membranes (IEM) integrate all of the principal edaphic factors
affecting nutrient uptake by plants (soil moisture and temperature, mineralization
and immobilization, buffer power, dissolution, ion diffusion from greater
distances and free ion activities), regardless of soil type (Qian and Schoenau
2002). They have been used to great effect in the areas of forestry (Coll et al.
2007; Hangs et al. 2004), agriculture (Jowkin and Schoenau 1998) and
environmental research (Liang and Schoenau 1995). The results found using this
method for soil N in spruce and pine plots have been found to be similar
throughout a number of studies (Huang and Schoenau 1997; Johnson et al. 2001;
Hangs et al. 2004). The PRSTM probes system (Plant Root Simulator probes,
Western Ag Innovations Inc., Saskatoon, Sask.) differs from the traditional
34
methods of soil analysis as destructive sampling and disturbance of the site is
minimal.
Tree species and tree age
The main tree species and total diversity of tree species present in a site has a
large effect on the diversity of fungi found (Schmit et al. 2005; Ferris et al. 2000a;
Humphrey et al. 2000; Lee and Lee 2004; Ishida et al. 2007). Decay fungi are
known to be specific in the organic compounds they can break down in leaves,
needles and woody debris (Osono et al. 2003; Boddy and Rayner 1983;
Unterseher and Tal 2006; Ludley et al. 2008), and some ECM fungi have been
shown to be highly specific in the symbiotic relationships which they will form
with forest trees (Molina et al. 1992; Newton and Haigh 1998). Stand age in itself
is not normally a strong indicator of fungal species richness in a site; many studies
have found no significant differences between the total numbers of species found
in forests of different ages, but have found that the species profile of the sites did
differ between the age classes (Dighton et al. 1986; Humphrey et al. 2000;
Fernandez et al. 2006; Grebenc et al. 2009; Kranabetter et al. 2005). It has been
proposed that these differences in species composition between different aged
forests are more as a result of changes in the forest soil (Blasius & Oberwinkler
1989; Tyler 1989) and not because of the increase of tree age.
Forest floor vegetation
The vegetation composition of the forest floor is a variable which is often
recorded in studies on fungal diversity. The majority of the forest floor vegetation
in deciduous forests is composed of woodland herbs, the most diverse group of
vascular plants in these habitats (McCarthy and Bailey 1996; Hermy et al. 1999).
There can be large differences in the diversity and structure of vegetation in
broadleaved forests of the same association, due to differences in gazing pressure
and management history. Many woodland herbs and bryophytes of broadleaved
forest can colonize conifer plantations, but generally these plantations are much
poorer in ground vegetation, at least when young (Ferris et al. 2000b). The
National Forest Inventory (National Forest Inventory 2007) found that there were
large differences in the richness of the ground flora between coniferous and
deciduous forests in Ireland. Less than 10% of the deciduous forests surveyed had

35
less than five vascular plant species, while in the coniferous plantations surveyed,
over 20% of the survey sites had less than five plant species in the ground layer.
Forest floor vegetation diversity has been shown to be a good indicator of
fungal diversity in some studies (Perini et al. 1995; Gable and Gable 2007), but
others have found only weak correlations between plant diversity of the forest
floor vegetation (including vascular plants and bryophytes) and fungal diversity
(Humphrey et al. 2000, 2003; Ruhling and Tyler 1990; Sastad 1995). Despite
this, the diversity vegetation has been used in total fungal species richness
estimates (Hawksworth 1991). Watling (1995) has estimated that total fungal and
plant species richness is often at a 6:1 ratio in temperate countries, while
Villeneuve et al. (1989) found the macrofungal : plant ratio of temperate forests at
2:1 in Canada.
Vegetation can often serve as a proxy for soil chemical composition and
soil fertility. Barr (1996) conducted an interesting study which looked at the
decline of ectomycorrhizal fungi in forests, due to the perceived increase in
atmospheric nitrogen deposition. It was known that increased nitrogen deposition
also increased the ground cover of the grass Deschampsia flexuosa, which was
found to have adverse effects on the fruiting of some ECM fungi (Baar and Ter
Braak 1996). The thick mats made by the roots of Deschampsia species probably
inhibit the formation of many fungal sporocarps. The effect of a ground flora
dominated by woodrush Luzula sylvatica, may have similar effects on the
formation of fungal sporocarps, although studies investigating the effect of matt
forming herbs on fungal sporulation are lacking.
Forest structural composition
Managed commercial forests typically consist of one or two canopy layers, as
competition from “wild trees” is minimised to allow for full growth potential of
the cultivated tree crop. In natural forests, there can be multiple canopy layers due
to heterogeneity in the ages of the dominant canopy trees, and also the presence of
understory canopy trees and tall shrubs such as holly (Ilex aquifolium) and hazel
(Corylus avellana). Studies have shown that forests with a larger percentage cover
in multiple canopy layers have higher values for biodiversity (MacArthur 1964;
Wilson 1974), bird diversity (MacArthur and MacArthur 1961), plant diversity
(Ferris et al. 2000b) and fungal diversity (Ferris et al. 2000a; Humphrey et al.
36
2000) than those with a limited number of canopy layers. One method of
recording the species composition and structural composition of vegetation in a
site is the vertical cover index (Ferris-Kaan et al. 1998). Humphrey et al. (2000),
using this method, found significant correlations between the vertical cover index
and fungal diversity in native oak and plantation Sitka spruce and Scot’s pine
forests in the U.K. The method for determining the vertical cover index in
managed forests and semi-natural forests is based on visual assessments of plant
cover in four defined strata. The cover index of the site can then be calculated
using the formula from Humphrey et al. (2003):
CI = 1.9s1 + 3s2 + 10s3 + 5s4 CI = cover index s1 (field) 10 cm –1.9 m in height s2 (shrub) 2–5 m s3 (lower canopy) 5.1–15 m s4 (upper canopy) 15.1–20 m
The numbers before the strata layer in the formula refer to the height of the
layer being measured e.g. the s2 layer spreads from 2-5meters in height and
therefore the percentage cover in this layer is multiplied by 3. This index is not
meant to replace traditional quadrat sampling techniques used in ecological
inventories. It was devised as a method of describing the bottom-to-top
configuration of above-ground vegetation in a forest (Brokaw and Lent 1999).
Site history and past land use
Due to anthropogenic pressures, the land use of much of Europe and North
America has changed over the years. Large-scale deforestation by humans has led
to a situation where in 1996 it was estimated that only 53% of the world’s original
forest cover remained (World Resources Institute 2004 as cited in Perry et al.
2008). Land use prior to planting is of utmost importance when fungal diversity of
a forest is being examined. If land has been used for agricultural purposes in the
past, then elevated nutrient levels can affect the fungi that may colonise that area
(Arnolds 1988; Tyler 1985; Griffith et al. 2004). If the land had previously been
planted with forests, then surviving fungal propagules in the form of vegetative
mycelium and spores could increase the rate of fungal colonization and the
diversity of colonizers (Jones et al. 2003). Site histories can be key to explaining
the fungal diversity of a particular site (Heilmann-Clausen and Christensen 2005).
37
A study by Harrington and Mitchell (2002) described populations of ECM fungi
on Dryas shrub vegetation in Ireland, and suggested that populations of the ECM
host tree Scot’s pine (Pinus sylvestris) in the habitat that became locally extinct
(ca. 500 AD), had provided the necessary inoculation material for the currently
thriving ECM communities there. This finding from the Burren region of Ireland
is similar to that found for ECM species in Oregon, with some ECM species
forming arbutoid mycorrhizas with Arctostaphylos spp. and Arbutus menziesii
after the ECM hosts (Douglas fir) have been removed from the area (Molina and
Trappe 1982).
Site geographic characteristics
Altitude has been shown to be a determining factor in the survival of mycorrhizal
fungi, as many mycorrhizal fungi decrease in numbers as elevation increases
(Lagana et al. 1999; Kernagahan and Harper 2001). The aspect of the site may
also have an impact on the fungi appearing, as south-facing slopes will generally
get more sunlight than north-facing slopes, so a south-facing slope can expect
higher soil and site temperatures and lower moisture contents of the soil. Lee and
Lee (2004) found that fungal diversity was increased in their plots which faced
north, due to higher relative moisture levels in the soil.
Weather patterns and their effect on fungal diversity assessment
Fungal fruiting patterns have been shown to be highly influenced by weather
conditions (Ohenoja 1993; Gulden et al. 1992; Carrier 2003; Krebs et al. 2008)
making a comprehensive study of fungi on a site very difficult. Straatsma and
Krisai-Greilhuber (2003) found no clear relationship between the variation in
weather conditions and fungal diversity over the seven years of their study in
deciduous and coniferous forests in Switzerland. However, there was a positive
relationship between fungal productivity and the amount of rainfall in the July
prior to fruiting in autumn. They also found that relatively high temperatures in
November allowed for a prolonged fruiting season. Mild temperatures suit the
fruiting of macrofungi best, as Humphrey et al. (2000) found that fungal species
richness was positively correlated with accumulated temperature (AT; the number
of degree-days above 5ºC). Moisture deficit (MD) was also found to be correlated
(positively) to fungal species richness in their plots. MD is a measure of the
dryness of a site and is calculated as the maximum accumulated amount that

38
potential evapotranspiration exceeds precipitation. The finding that both AT and
MD are related to fungal diversity and fruiting makes them stand out as possible
standards for quantifying rainfall and ambient temperature. Other studies
(Heilmann-Clausen and Christensen 2005) have used another ratio of precipitation
to temperature called Lang’s index (annual precipitation/annual temperature; Lang
1915) and found it to be significantly related to fungal diversity.

39
Chapter 3: The sites: vegetation and site
variables measured

40
41
3.1 Introduction
3.1.1 Forests of Ireland: Extent and current trends
Forests currently cover over 650,000 ha (10%) of land in Ireland, with the figure
set to increase to 1.2 million ha (17%) by 2030 (Anon. 1996). Currently native
tree species comprise less than 25% of the forested area (National Forest
Inventory 2007), but plans have been put into place to decrease the planting of
exotic species and increase the planting of native broad leaves (Anon. 2009).
Compared to other European countries, Ireland is a deforested country. Just over
81,000 ha of Irish woodlands are classed as semi-natural (FRA 2010). This
equates to 1% of the total land area, the third lowest in Europe after Netherlands
and the Czech Republic but this is increasing at the eleventh fastest rate in the
European Union (FRA 2010).
Up to Neolithic times, Ireland was covered in dense forests of oak
(Quercus species), elm (Ulmus glabra), ash (Fraxinus excelsior), Scot’s pine
(Pinus sylvestris) and alder (Alnus glutinosa) (Mitchell 1995). Anthropogenic
processes associated with the expansion of farming, and climate change in the
Sub-Boreal Period have, over the past 4,500 years, brought about dramatic
changes in the abundance and extent of native forest types. Palynological records
have shown that elm underwent extreme reduction commencing 5000 years ago
and Scot’s pine had become extinct in Ireland by 2000 before present (B.P.)
(Cross 1998). Were it not for the influence of humans, the vegetation of Ireland
would be much different from the current status. Cross (2006) estimated that left
undisturbed, the majority of land area in Ireland would be covered in dense
pedunculate and sessile oak forests with a lesser component of ash, hazel and
alder woods. Present day land cover is vastly different from this hypothetical
situation. The four most abundantly planted tree species in Ireland are exotic
species (Table 3.1).
The majority of the forests planted for commercial gain in Ireland are of
the exotic conifer Sitka spruce (Picea sitchensis Bong Carr.). Sitka spruce is
particularly well suited to growth conditions in Ireland, and if properly managed
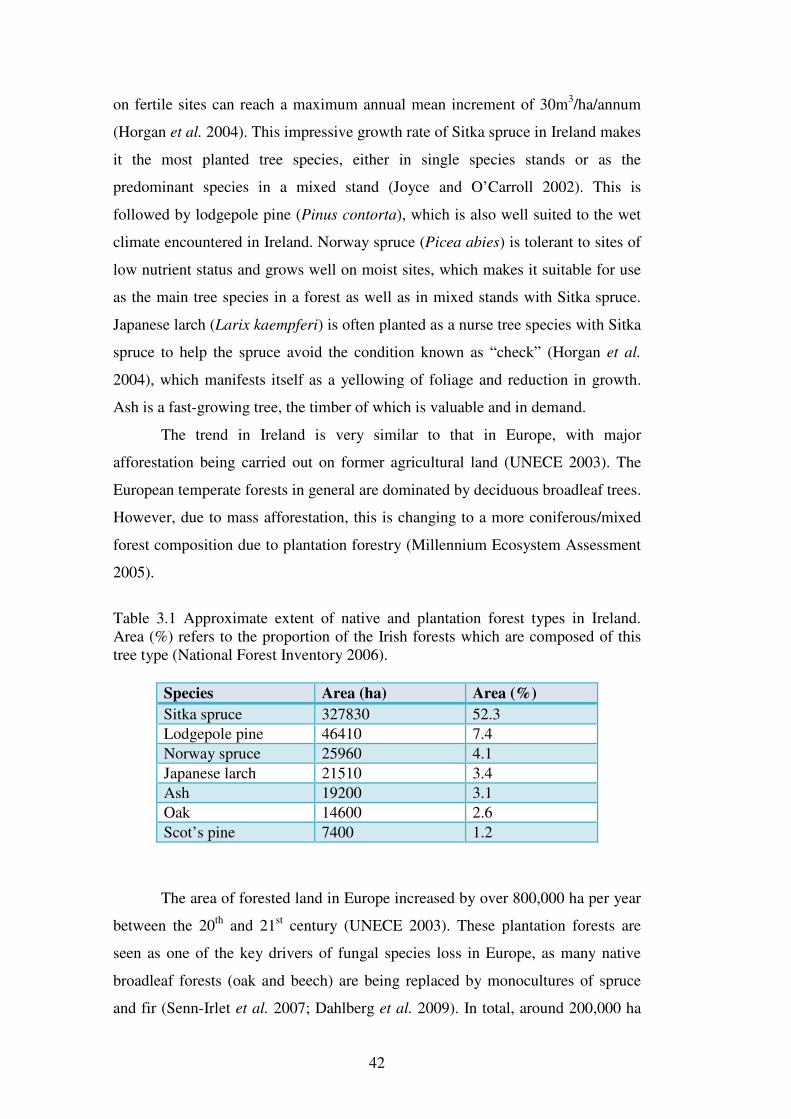
42
on fertile sites can reach a maximum annual mean increment of 30m3/ha/annum
(Horgan et al. 2004). This impressive growth rate of Sitka spruce in Ireland makes
it the most planted tree species, either in single species stands or as the
predominant species in a mixed stand (Joyce and O’Carroll 2002). This is
followed by lodgepole pine (Pinus contorta), which is also well suited to the wet
climate encountered in Ireland. Norway spruce (Picea abies) is tolerant to sites of
low nutrient status and grows well on moist sites, which makes it suitable for use
as the main tree species in a forest as well as in mixed stands with Sitka spruce.
Japanese larch (Larix kaempferi) is often planted as a nurse tree species with Sitka
spruce to help the spruce avoid the condition known as “check” (Horgan et al.
2004), which manifests itself as a yellowing of foliage and reduction in growth.
Ash is a fast-growing tree, the timber of which is valuable and in demand.
The trend in Ireland is very similar to that in Europe, with major
afforestation being carried out on former agricultural land (UNECE 2003). The
European temperate forests in general are dominated by deciduous broadleaf trees.
However, due to mass afforestation, this is changing to a more coniferous/mixed
forest composition due to plantation forestry (Millennium Ecosystem Assessment
2005).
Table 3.1 Approximate extent of native and plantation forest types in Ireland. Area (%) refers to the proportion of the Irish forests which are composed of this tree type (National Forest Inventory 2006).
Species Area (ha) Area (%)
Sitka spruce 327830 52.3
Lodgepole pine 46410 7.4
Norway spruce 25960 4.1
Japanese larch 21510 3.4
Ash 19200 3.1
Oak 14600 2.6
Scot’s pine 7400 1.2
The area of forested land in Europe increased by over 800,000 ha per year
between the 20th and 21st century (UNECE 2003). These plantation forests are
seen as one of the key drivers of fungal species loss in Europe, as many native
broadleaf forests (oak and beech) are being replaced by monocultures of spruce
and fir (Senn-Irlet et al. 2007; Dahlberg et al. 2009). In total, around 200,000 ha
43
(20%) of newly afforested land in Europe is planted with introduced species every
year, but this figure varies very much depending on the country in question
(UNECE 2003). Much of this afforestation is taking place on land previously used
for agriculture. In Ireland, 90% of current private afforestation is being carried out
by agricultural land owners (Teagasc 2005). In recent years the relationship
between biodiversity and forest productivity, health and other positive benefits of
biodiversity on ecosystem functioning have been identified (for review see Loreau
et al. 2007). This has brought about changes in forestry practices to promote
biodiversity in forests, and protect habitats which are rich in native biodiversity,
such as native Irish oak forests and semi-native beech forests (Anon. 2009).
3.1.2 Classification of Irish forest habitats
In order to meet the large scale changes in the composition of Irish forests from
native to non-native tree species, parallel changes in the classification systems
used for the vegetation of Irish forests are being researched. In the first major
classification system for vegetation in Irish habitats, all plantation coniferous
forests were grouped together under the classification Vaccinio –Piceetea (Br. –
Bl. Et Vlieger 1939; Kelly and Kirby 1982). The later classification systems for
Irish habitats by Fossitt (2000), again grouped the plantation forests under one
heading “conifer plantation WD4”. Recent work on the vegetation of Irish
plantation forests has significantly expanded this classification system, by
devising 8 distinct groups of vegetation composition in Irish plantation forests
(French et al. 2008).
The current classification system in use for Irish habitats is “A guide to
habitats in Ireland” by Fossitt (2000). A criticism of this system is that it groups
all coniferous woodlands into 4 sub-groups, regardless of the ground flora
vegetation of the sites (Roche et al. 2009; French et al. 2008). Earlier systems in
use in Ireland similarly grouped the coniferous forest into a small number of
groups (White and Doyle 1982), and others did not designate coniferous forests as
a habitat, because coniferous species are not native to Ireland (Perrin et al. 2008).
In recent years, there have been more focussed keys to Irish forest habitats
developed to complement the already established keys. In oak woods in Ireland,
Kelly and Kirby (1982), Kelly and Iremonger (1997) and Kelly (2005) have all
44
designed classification systems for their plant communities. Ash woodlands have
been the focus of a study by Kelly and Kirby (1982), with plantation ash forests
being examined by French et al. (2008). The study by French et al. (2008) also
examined the ground flora classification of Irish plantation Sitka spruce forests,
while Roche et al. (2009) examined Scot’s pine forests in Ireland with a view to
classifying their plant communities.
Previous research in forests of Scotland (Hawksworth 1991), Canada
(Villeneuve et al. 1989) and the U.S.A. (Gable and Gable 2007) have found a
significant relationship between the vascular plant communities and macrofungal
communities of temperate forests. With this in mind, it may be possible to
estimate macrofungal richness and diversity based on the vascular plant richness
and diversity in the forests.
3.1.3 Rational for site selection
To compare the different vegetational composition of Irish unmanaged and
plantation forests, four forest types were selected for study: ash woodlands (ash),
oak woodlands including both pedunculate and sessile oak (oak), Scot’s pine
woodlands (SP) and Sitka spruce woodlands (SS). In the interest of replication,
geographical spread, and the limitations of man-hours, it was decided to limit the
forest types to these four dominant tree species. Representative study sites were
chosen both from an existing list used in the BIOFOREST program (Smith et al.
2005, 2006; Iremonger et al. 2006), and also from known sites which fit the forest
types chosen for the study.
The rationale for choosing these four forest types was:
1. Broadleaved forest types comprising ectomycorrhizal tree species (such as
sessile and pedunculate oak) would be expected to support the greatest species
richness of native macrofungi. Estimates of extent and patterns of fungal diversity
from such forest types would provide a yardstick against which macrofungal
diversity estimates from plantation forests can be compared.
2. Ash is a native sub-climax tree that does not support ectomycorrhizal fungi.
The ash forest type was included because this forest type is found widely,
45
particularly in the midlands, and planting of ash has expanded greatly in recent
years.
3. Sitka spruce and Scot’s pine are non-native conifers, both of which support a
wide range of macrofungi, including ectomycorrhizal species, in their native
ranges. Sitka spruce is the most widely-planted plantation conifer in Ireland, and
assessing fungal diversity of these plantations was a principal objective of the
study. Scot’s pine plantations were included in the study because, while they are
of little commercial extent nowadays, they are anecdotally considered to support a
wider fungal diversity than other faster-maturing plantation forest types. If this is
true, it may be not least be because Scot’s pine plantations are considerably older
than other plantation types.

46

47
3.2 Aims of this chapter
The aims of this chapter are:
• To give the rationale for choosing the forest types to be examined in
further chapters.
• To give the rational for choosing which variables would be measured in
the selected forests.
• To describe the vegetation, structural and chemical characteristics of the
selected plots.
• To group the plots according to the measured variables, as a precursor to
the groupings based on fungal communities used in later chapters.
• To estimate macrofungal species richness using the recorded relationships
between vegetation species richness and macrofungal species richness.

48
3.3 Materials and methods
3.3.1 The sites
The locations of the sites and the corresponding site codes along with geographic
data and past land use data are presented in Fig. 3.1 and Table 3.2. One plot per
site was deemed sufficient, as each site was also represented by a replicate site
based on similarity of dominant tree species, vegetation cover and stand age as
suggested by Coll and Bolger (2007).
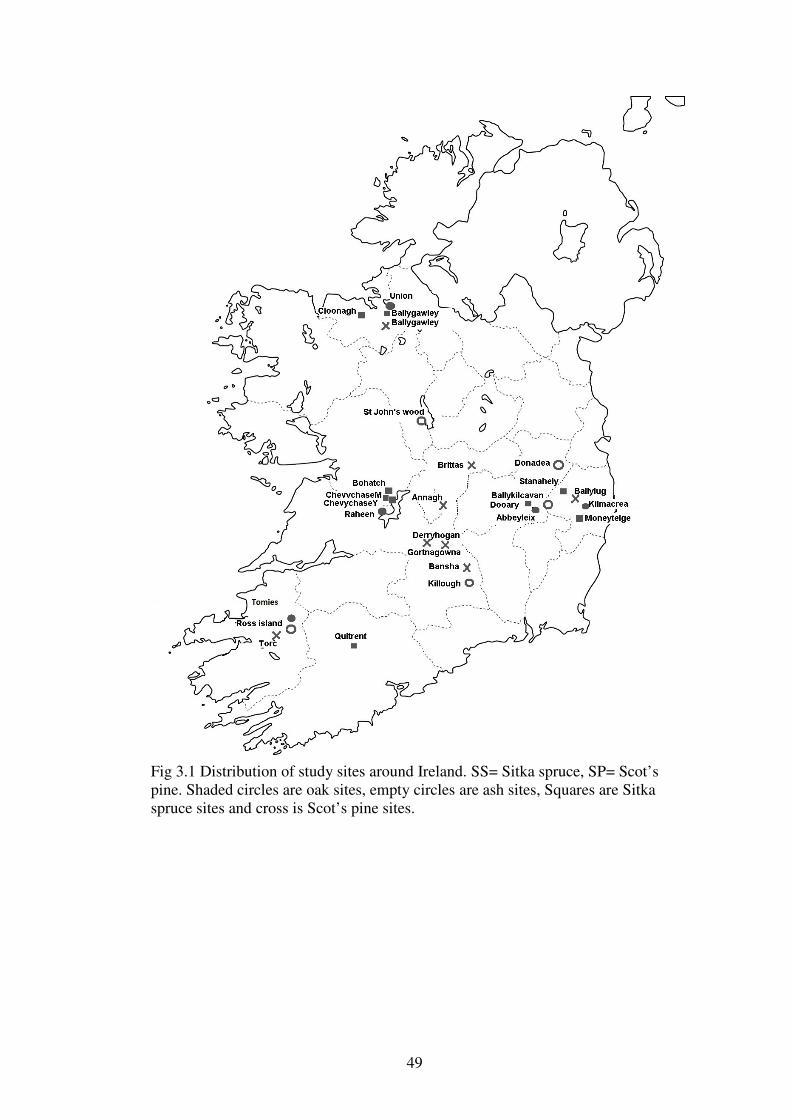
49
Fig 3.1 Distribution of study sites around Ireland. SS= Sitka spruce, SP= Scot’s pine. Shaded circles are oak sites, empty circles are ash sites, Squares are Sitka spruce sites and cross is Scot’s pine sites.
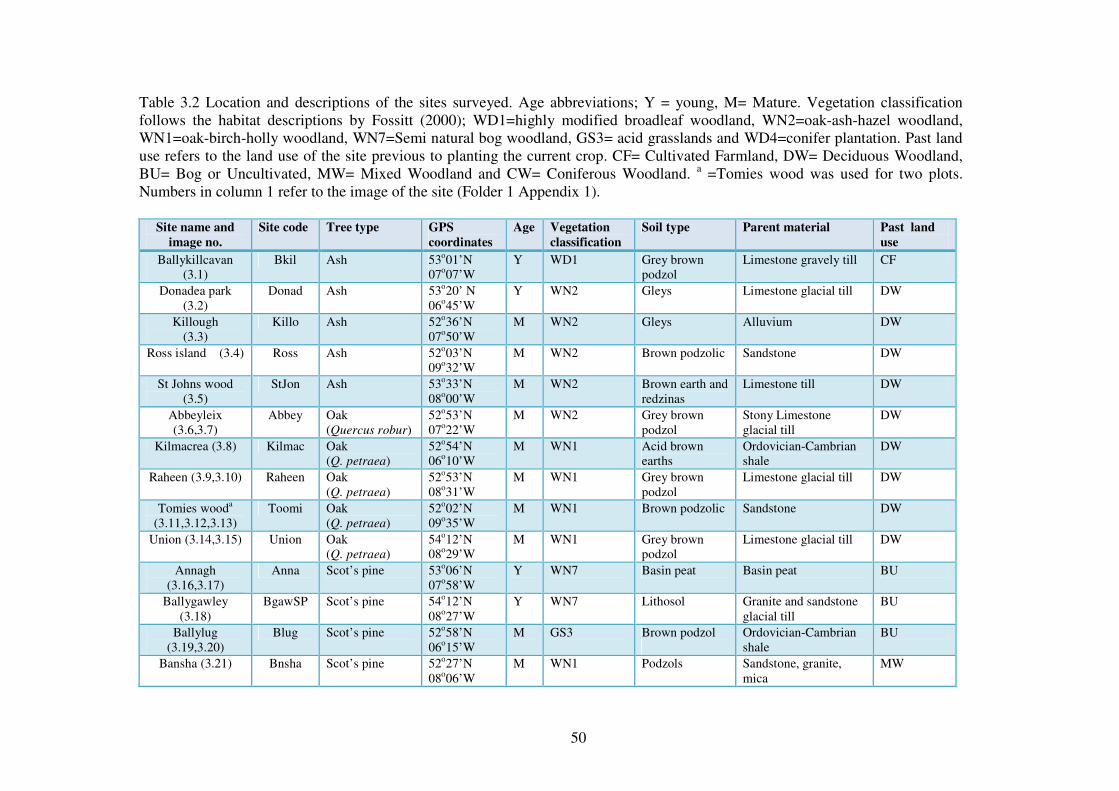
50
Table 3.2 Location and descriptions of the sites surveyed. Age abbreviations; Y = young, M= Mature. Vegetation classification follows the habitat descriptions by Fossitt (2000); WD1=highly modified broadleaf woodland, WN2=oak-ash-hazel woodland, WN1=oak-birch-holly woodland, WN7=Semi natural bog woodland, GS3= acid grasslands and WD4=conifer plantation. Past land use refers to the land use of the site previous to planting the current crop. CF= Cultivated Farmland, DW= Deciduous Woodland, BU= Bog or Uncultivated, MW= Mixed Woodland and CW= Coniferous Woodland. a =Tomies wood was used for two plots. Numbers in column 1 refer to the image of the site (Folder 1 Appendix 1).
Site name and
image no.
Site code Tree type GPS
coordinates
Age Vegetation
classification
Soil type Parent material Past land
use
Ballykillcavan (3.1)
Bkil Ash 53o01’N 07o07’W
Y WD1 Grey brown podzol
Limestone gravely till CF
Donadea park (3.2)
Donad Ash 53o20’ N 06o45’W
Y WN2 Gleys Limestone glacial till DW
Killough (3.3)
Killo Ash 52o36’N 07o50’W
M WN2 Gleys Alluvium DW
Ross island (3.4) Ross Ash 52o03’N 09o32’W
M WN2 Brown podzolic Sandstone DW
St Johns wood (3.5)
StJon Ash 53o33’N 08o00’W
M WN2 Brown earth and redzinas
Limestone till DW
Abbeyleix (3.6,3.7)
Abbey Oak (Quercus robur)
52o53’N 07o22’W
M WN2 Grey brown podzol
Stony Limestone glacial till
DW
Kilmacrea (3.8) Kilmac Oak (Q. petraea)
52o54’N 06o10’W
M WN1 Acid brown earths
Ordovician-Cambrian shale
DW
Raheen (3.9,3.10) Raheen Oak (Q. petraea)
52o53’N 08o31’W
M WN1 Grey brown podzol
Limestone glacial till DW
Tomies wooda
(3.11,3.12,3.13) Toomi Oak
(Q. petraea) 52o02’N 09o35’W
M WN1 Brown podzolic Sandstone DW
Union (3.14,3.15) Union Oak (Q. petraea)
54o12’N 08o29’W
M WN1 Grey brown podzol
Limestone glacial till DW
Annagh (3.16,3.17)
Anna Scot’s pine 53o06’N 07o58’W
Y WN7 Basin peat Basin peat BU
Ballygawley (3.18)
BgawSP Scot’s pine 54o12’N 08o27’W
Y WN7 Lithosol Granite and sandstone glacial till
BU
Ballylug (3.19,3.20)
Blug Scot’s pine 52o58’N 06o15’W
M GS3 Brown podzol
Ordovician-Cambrian shale
BU
Bansha (3.21) Bnsha Scot’s pine 52o27’N 08o06’W
M WN1 Podzols Sandstone, granite, mica
MW
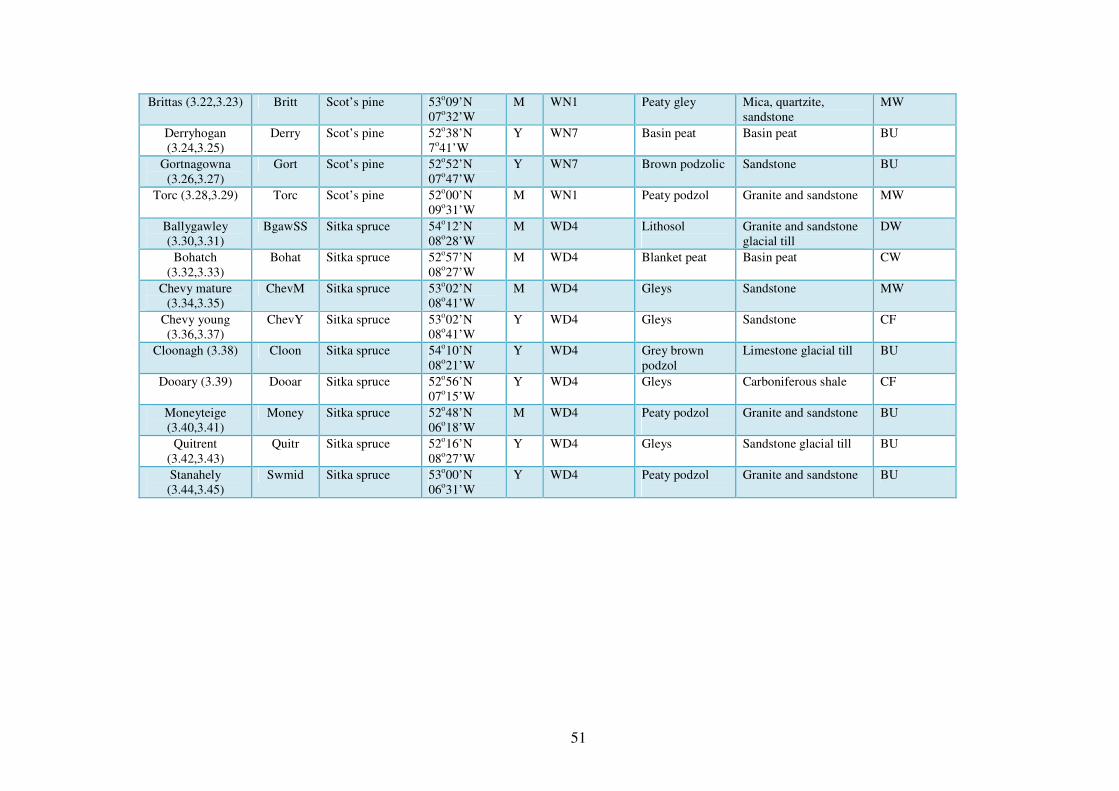
51
Brittas (3.22,3.23) Britt Scot’s pine 53o09’N 07o32’W
M WN1 Peaty gley Mica, quartzite, sandstone
MW
Derryhogan (3.24,3.25)
Derry Scot’s pine 52o38’N 7o41’W
Y WN7 Basin peat Basin peat BU
Gortnagowna (3.26,3.27)
Gort Scot’s pine 52o52’N 07o47’W
Y WN7 Brown podzolic Sandstone BU
Torc (3.28,3.29) Torc Scot’s pine 52o00’N 09o31’W
M WN1 Peaty podzol
Granite and sandstone MW
Ballygawley (3.30,3.31)
BgawSS Sitka spruce 54o12’N 08o28’W
M WD4 Lithosol
Granite and sandstone glacial till
DW
Bohatch (3.32,3.33)
Bohat Sitka spruce 52o57’N 08o27’W
M WD4 Blanket peat Basin peat CW
Chevy mature (3.34,3.35)
ChevM Sitka spruce 53o02’N 08o41’W
M WD4 Gleys Sandstone MW
Chevy young (3.36,3.37)
ChevY Sitka spruce 53o02’N 08o41’W
Y WD4 Gleys Sandstone CF
Cloonagh (3.38) Cloon Sitka spruce 54o10’N 08o21’W
Y WD4 Grey brown podzol
Limestone glacial till BU
Dooary (3.39) Dooar Sitka spruce 52o56’N 07o15’W
Y WD4 Gleys Carboniferous shale CF
Moneyteige (3.40,3.41)
Money Sitka spruce 52o48’N 06o18’W
M WD4 Peaty podzol
Granite and sandstone BU
Quitrent (3.42,3.43)
Quitr Sitka spruce 52o16’N 08o27’W
Y WD4 Gleys Sandstone glacial till BU
Stanahely (3.44,3.45)
Swmid Sitka spruce 53o00’N 06o31’W
Y WD4 Peaty podzol
Granite and sandstone BU
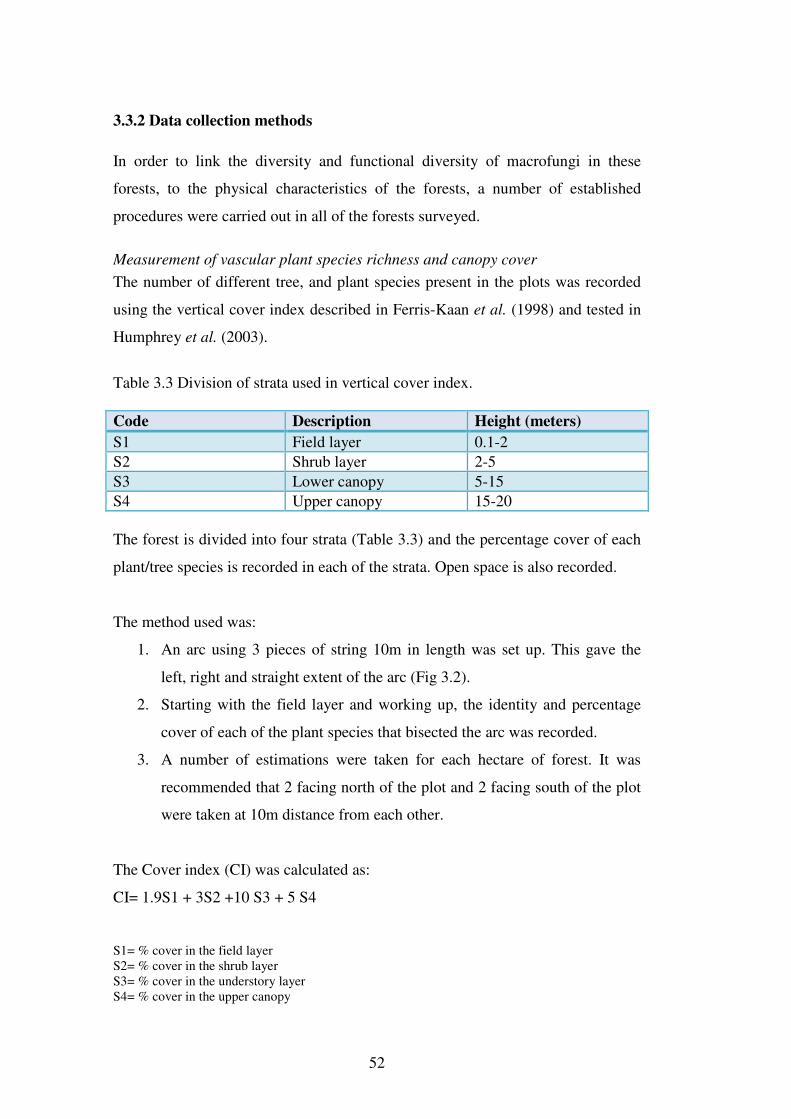
52
3.3.2 Data collection methods
In order to link the diversity and functional diversity of macrofungi in these
forests, to the physical characteristics of the forests, a number of established
procedures were carried out in all of the forests surveyed.
Measurement of vascular plant species richness and canopy cover
The number of different tree, and plant species present in the plots was recorded
using the vertical cover index described in Ferris-Kaan et al. (1998) and tested in
Humphrey et al. (2003).
Table 3.3 Division of strata used in vertical cover index.
Code Description Height (meters)
S1 Field layer 0.1-2
S2 Shrub layer 2-5
S3 Lower canopy 5-15
S4 Upper canopy 15-20
The forest is divided into four strata (Table 3.3) and the percentage cover of each
plant/tree species is recorded in each of the strata. Open space is also recorded.
The method used was:
1. An arc using 3 pieces of string 10m in length was set up. This gave the
left, right and straight extent of the arc (Fig 3.2).
2. Starting with the field layer and working up, the identity and percentage
cover of each of the plant species that bisected the arc was recorded.
3. A number of estimations were taken for each hectare of forest. It was
recommended that 2 facing north of the plot and 2 facing south of the plot
were taken at 10m distance from each other.
The Cover index (CI) was calculated as:
CI= 1.9S1 + 3S2 +10 S3 + 5 S4
S1= % cover in the field layer S2= % cover in the shrub layer S3= % cover in the understory layer S4= % cover in the upper canopy
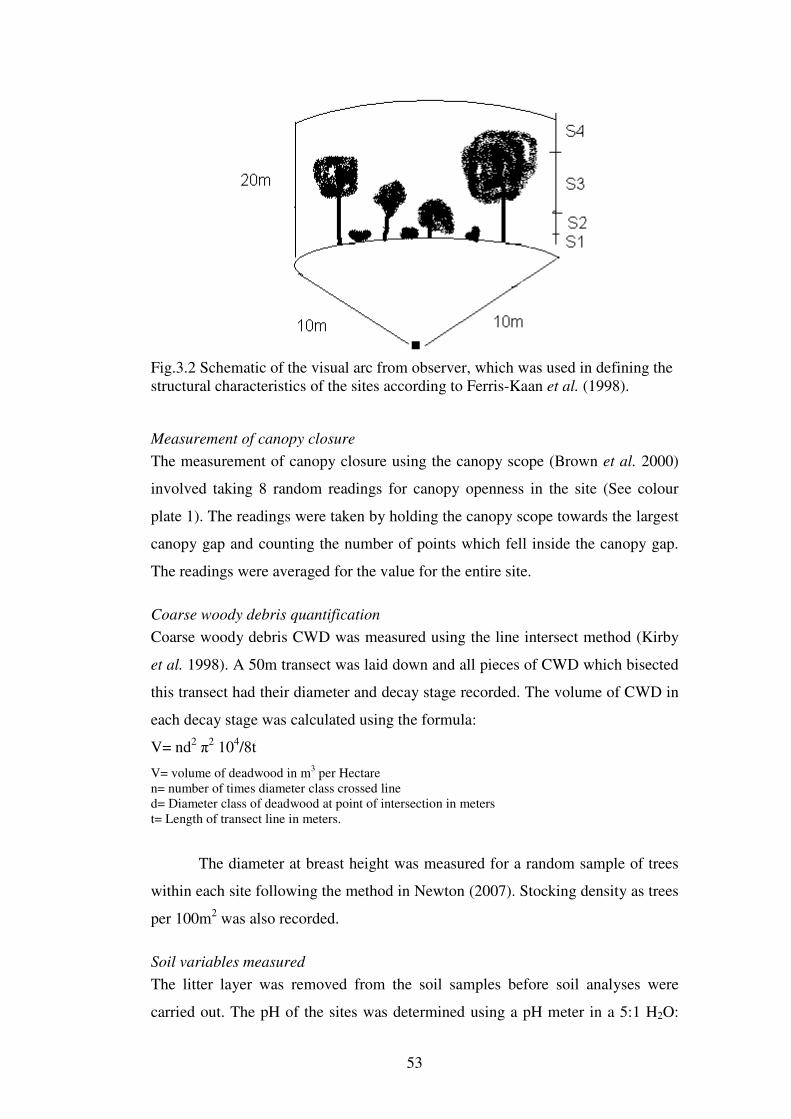
53
Fig.3.2 Schematic of the visual arc from observer, which was used in defining the structural characteristics of the sites according to Ferris-Kaan et al. (1998).
Measurement of canopy closure
The measurement of canopy closure using the canopy scope (Brown et al. 2000)
involved taking 8 random readings for canopy openness in the site (See colour
plate 1). The readings were taken by holding the canopy scope towards the largest
canopy gap and counting the number of points which fell inside the canopy gap.
The readings were averaged for the value for the entire site.
Coarse woody debris quantification
Coarse woody debris CWD was measured using the line intersect method (Kirby
et al. 1998). A 50m transect was laid down and all pieces of CWD which bisected
this transect had their diameter and decay stage recorded. The volume of CWD in
each decay stage was calculated using the formula:
V= nd2 π2 104/8t
V= volume of deadwood in m3 per Hectare n= number of times diameter class crossed line d= Diameter class of deadwood at point of intersection in meters t= Length of transect line in meters.
The diameter at breast height was measured for a random sample of trees
within each site following the method in Newton (2007). Stocking density as trees
per 100m2 was also recorded.
Soil variables measured
The litter layer was removed from the soil samples before soil analyses were
carried out. The pH of the sites was determined using a pH meter in a 5:1 H2O:
54
soil dilution (Anon. 2006b). Moisture content was calculated as the loss in mass
after 2 day at 105ºC (Anon. 2006b). Organic matter was calculated as the loss on
ignition after 1 day at 450ºC (Anon. 2006b). Bedrock description was estimated
from the use of geological maps of Ireland (Gardener and Radford 1980).
PRSTM-probes system (Plant Root Simulator probes; Western Ag
Innovations Inc., Saskatoon, Sask.) were used to measure the in-situ supply of
anions and cations through the soil in the sites (Colour plate 2). Four pairs of
probes (four cations and four anion) were placed in the soil in each site during the
sampling period (September to November 2008; and September to October 2009)
and a trench sliced around the probe to reduce competition from plant roots with
the probes. The probes were left for ca. 1 month and were then removed, washed
with de-ionised water and stored at 4ºC until they were returned to Canada for
analysis. The past land use category of the site was determined from the forester
and also from Ordnance Survey Ireland historic maps. Data for the meteorological
records for the seven weather stations closest to the sites was acquired from Met
Eireann (www.met.ie). The seven stations that were closest to the sites were
Birr/Oak park (Co. Offaly), Casement (Co. Dublin), Claremorris (Co. Mayo),
Cork airport (Co. Cork), Kilkenny (Co. Kilkenny), Shannon (Co. Clace) and
Valentia (Co. Kerry).
3.3.3 Statistical analysis
All environmental variables were tested for significant differences between the
forest types using a Mann-Whitney U test. Box plots were created to show the
distribution of the plots within a measured variable. Spearman’s rank correlation
(rs) was used to check for relationships between ordination axes and other
variables measured. The rs value is a measure of how strongly correlated two
variables are. Stepwise linear regression was used to analyse the relationships
between environmental variables and plant and tree species richness.
Simpson’s and Shannon’s diversity indices were calculated using the
program EstimateS (Colwell 2004) using similar settings as those used for the
macrofungal data in Section 4.3.5, Chapter 4.
The effects of site nominal variables (age, rotation stage etc.) on the
numbers of plant species in each forest type separately were tested using a

55
generalized linear model with Poisson error distribution and log-link function (for
analysis of non-normal data). For ash, the effect of site management (semi-
natural/managed) and forest age (young/mature) was tested for relationships with
species per plot visit. For oak, the effect of grazing large mammals (grazed/non-
grazed) on the numbers of species per plot visit. For Scot’s pine, the effect of
rotation stage (first/second rotation) and forest age (young/mature) was tested for
relationships with species per plot visit. For Sitka spruce forests, the effect of
rotation stage (first/second rotation) and forest age (young/mature) was tested for
relationships with species per plot visit.
Multivariate analysis
To analyse the plant species similarity between the different sites, the abundance-
based Jaccard similarity index (Chao et al. 2005) as calculated by Estimate-S
(Colwell 2004) was used. This index is a modified form of the Jaccard
presence/absence index which uses quantitative data and also estimates the
number of unseen taxa in the sample, thus combining a species richness estimator
and a similarity index.
Nonmetric multidimensional scaling (NMS) was used to compare
composition of plant vegetation communities the forest types. NMS is effective
with ecological data because it does not assume linearity of species’ responses to
gradients (McCune and Grace 2002). NMS uses rank order information in a
dissimilarity matrix that eliminates the ‘‘zero truncation’’ problem in most
ordination methods, and can use any distance measure. NMS was run on two data
sets in this chapter.
These were:
(a) Using the environmental variables as the main matrix (producing a 28 x 18
plot by variable matrix; Table 3.6) to examine if the plots grouped into their
respective forest types.
(b) Using the vascular plant presence/absence data as the main matrix (producing
a 28 x 68 plot by species matrix; Table 3.7), and the environmental variables
as the second matrix to examine if the vascular plant communities of the
56
forest types were useful in separating the plots into their respective forest
types.
The data was analysed using PC-Ord version 4.36 (MjM Software Design,
Gleneden Beach, OR). A Sørensen distance measure was used for all the data sets.
The Sørensen distance measure is an intuitively meaningful measure as it takes
into account the abundance of the shared species between two groups divided by
the abundances of species found in each sample (McCune and Grace 2002). A
random seed started each analysis and included 40 runs of real data and 50 runs of
randomized data for use in a Monte Carlo permutation procedure (McCune and
Grace 2002). The Monte Carlo permutation procedure is a randomization test that
determines if NMS is generating stronger axes than expected by chance. Results
of the Monte Carlo test and examination of the stress in a scree plot were used to
determine dimensionality. Overlays and correlations with axes were run in PC-
Ord to interpret the data.
To test if the sites were grouped more closely based on their plant
communities according to the forest type they were defined as, a multi-response
permutation procedure (MRPP), a non-parametric hypothesis test for multivariate
differences between groups was carried out in PC-ORD. MRPP constructs a
distance matrix, calculates average within-group distances, and compares these to
a Pearson’s type III continuous distribution of all possible partitions of the data
(Peck 2003). Groups were analyzed by forest type using PC-Ord. The Sørensen
distance measure was used for all analyses. With MRPP, the chance-corrected
within-group agreement (A) statistic describes effect size. Values for A range
from -1 to +1. When A = -1, there is less agreement between groups than expected
by chance. When A =0, groups are no more or less different than expected by
chance, and when A = 1, groups are identical. The more positive A is, the more
homogeneous groups are and the greater confidence in the p-value, especially
when the sample size is small (Peck 2003). The grouping variable forest type (ash,
oak, Scot’s pine and Sitka spruce) was used.
Indicator species analysis was used to identify plant species which are
indicative of a certain forest type. The method used was designed by Dufrene and
Legendre (1997). Indicator species analysis uses data on the concentration of
species abundances in a particular user set group (e.g. forest type), and also the
57
faithfulness of occurrence of a species to a particular group (McCune and Grace
2002). To identify plant species which are indicative of the habitat examined in
this project, Indicator values (IV) for each species were calculated in PC-ORD
using the method by Dufrene and Legendre (1997) with statistical significance
calculated by a Monte Carlo test with 1000 runs. Indicator values (IV) range from
0 (no indication) to 100 (perfect indication). Perfect indication means that
presence of a certain species points to a particular group without error (McCune
and Grace 2002).
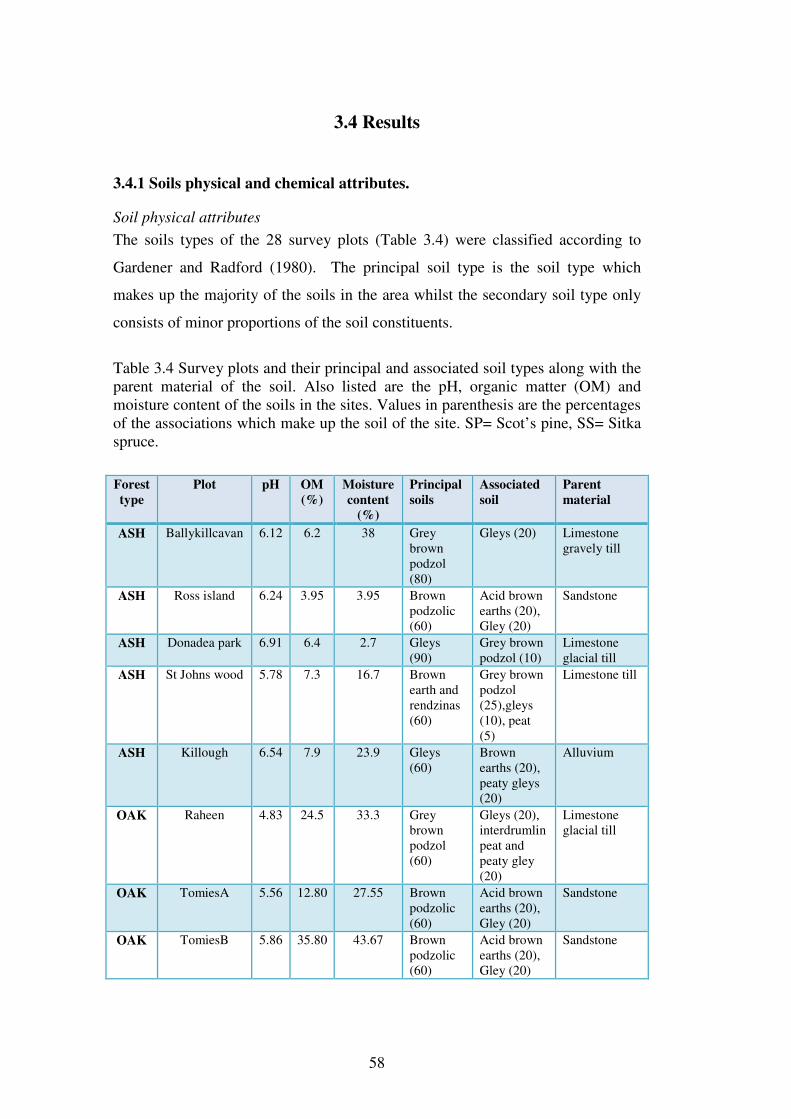
58
3.4 Results
3.4.1 Soils physical and chemical attributes.
Soil physical attributes
The soils types of the 28 survey plots (Table 3.4) were classified according to
Gardener and Radford (1980). The principal soil type is the soil type which
makes up the majority of the soils in the area whilst the secondary soil type only
consists of minor proportions of the soil constituents.
Table 3.4 Survey plots and their principal and associated soil types along with the parent material of the soil. Also listed are the pH, organic matter (OM) and moisture content of the soils in the sites. Values in parenthesis are the percentages of the associations which make up the soil of the site. SP= Scot’s pine, SS= Sitka spruce.
Forest
type
Plot pH OM
(%)
Moisture
content
(%)
Principal
soils
Associated
soil
Parent
material
ASH Ballykillcavan 6.12 6.2 38 Grey brown podzol (80)
Gleys (20) Limestone gravely till
ASH Ross island 6.24 3.95 3.95 Brown podzolic (60)
Acid brown earths (20), Gley (20)
Sandstone
ASH Donadea park 6.91 6.4 2.7 Gleys (90)
Grey brown podzol (10)
Limestone glacial till
ASH St Johns wood 5.78 7.3 16.7 Brown earth and rendzinas (60)
Grey brown podzol (25),gleys (10), peat (5)
Limestone till
ASH Killough 6.54 7.9 23.9 Gleys (60)
Brown earths (20), peaty gleys (20)
Alluvium
OAK Raheen 4.83 24.5 33.3 Grey brown podzol (60)
Gleys (20), interdrumlin peat and peaty gley (20)
Limestone glacial till
OAK TomiesA 5.56 12.80 27.55 Brown podzolic (60)
Acid brown earths (20), Gley (20)
Sandstone
OAK TomiesB 5.86 35.80 43.67 Brown podzolic (60)
Acid brown earths (20), Gley (20)
Sandstone
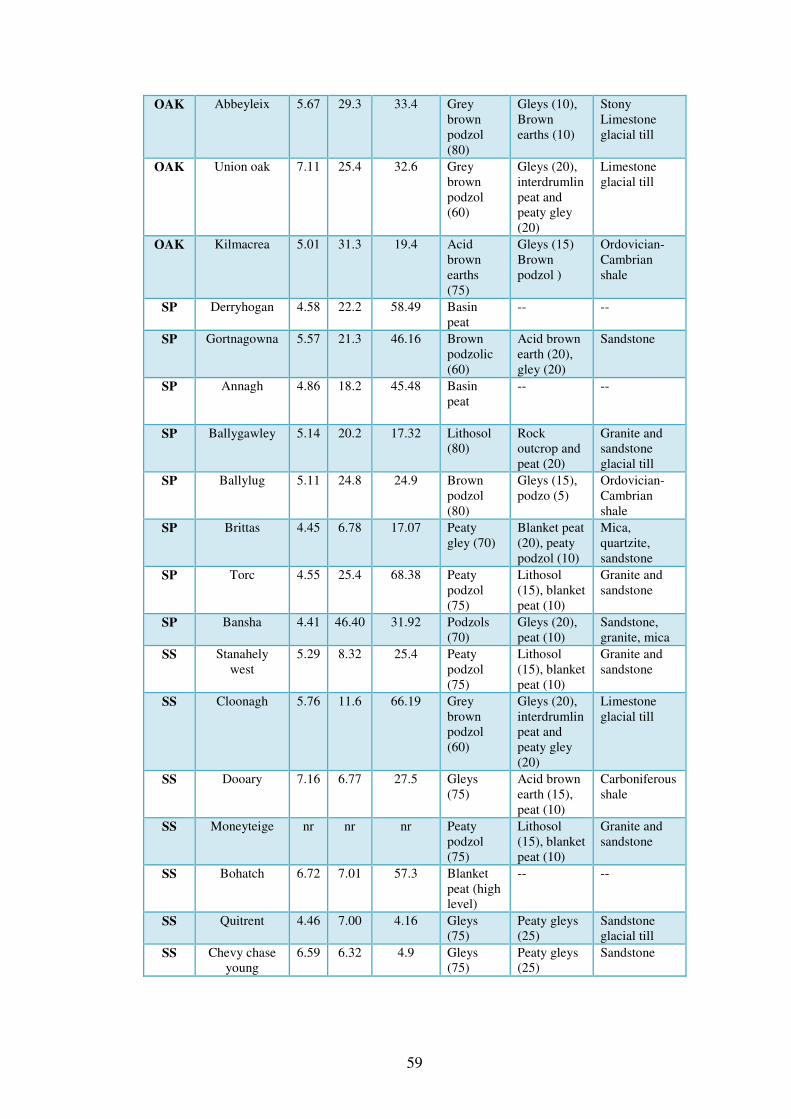
59
OAK Abbeyleix 5.67 29.3 33.4 Grey brown podzol (80)
Gleys (10), Brown earths (10)
Stony Limestone glacial till
OAK Union oak 7.11 25.4 32.6 Grey brown podzol (60)
Gleys (20), interdrumlin peat and peaty gley (20)
Limestone glacial till
OAK Kilmacrea 5.01 31.3 19.4 Acid brown earths (75)
Gleys (15) Brown podzol )
Ordovician-Cambrian shale
SP Derryhogan 4.58 22.2 58.49 Basin peat
-- --
SP Gortnagowna 5.57 21.3 46.16 Brown podzolic (60)
Acid brown earth (20), gley (20)
Sandstone
SP Annagh 4.86 18.2 45.48 Basin peat
-- --
SP Ballygawley 5.14 20.2 17.32 Lithosol (80)
Rock outcrop and peat (20)
Granite and sandstone glacial till
SP Ballylug 5.11 24.8 24.9 Brown podzol (80)
Gleys (15), podzo (5)
Ordovician-Cambrian shale
SP Brittas 4.45 6.78 17.07 Peaty gley (70)
Blanket peat (20), peaty podzol (10)
Mica, quartzite, sandstone
SP Torc 4.55 25.4 68.38 Peaty podzol (75)
Lithosol (15), blanket peat (10)
Granite and sandstone
SP Bansha 4.41 46.40 31.92 Podzols (70)
Gleys (20), peat (10)
Sandstone, granite, mica
SS Stanahely west
5.29 8.32 25.4 Peaty podzol (75)
Lithosol (15), blanket peat (10)
Granite and sandstone
SS Cloonagh 5.76 11.6 66.19 Grey brown podzol (60)
Gleys (20), interdrumlin peat and peaty gley (20)
Limestone glacial till
SS Dooary 7.16 6.77 27.5 Gleys (75)
Acid brown earth (15), peat (10)
Carboniferous shale
SS Moneyteige nr nr nr Peaty podzol (75)
Lithosol (15), blanket peat (10)
Granite and sandstone
SS Bohatch 6.72 7.01 57.3 Blanket peat (high level)
-- --
SS Quitrent 4.46 7.00 4.16 Gleys (75)
Peaty gleys (25)
Sandstone glacial till
SS Chevy chase young
6.59 6.32 4.9 Gleys (75)
Peaty gleys (25)
Sandstone
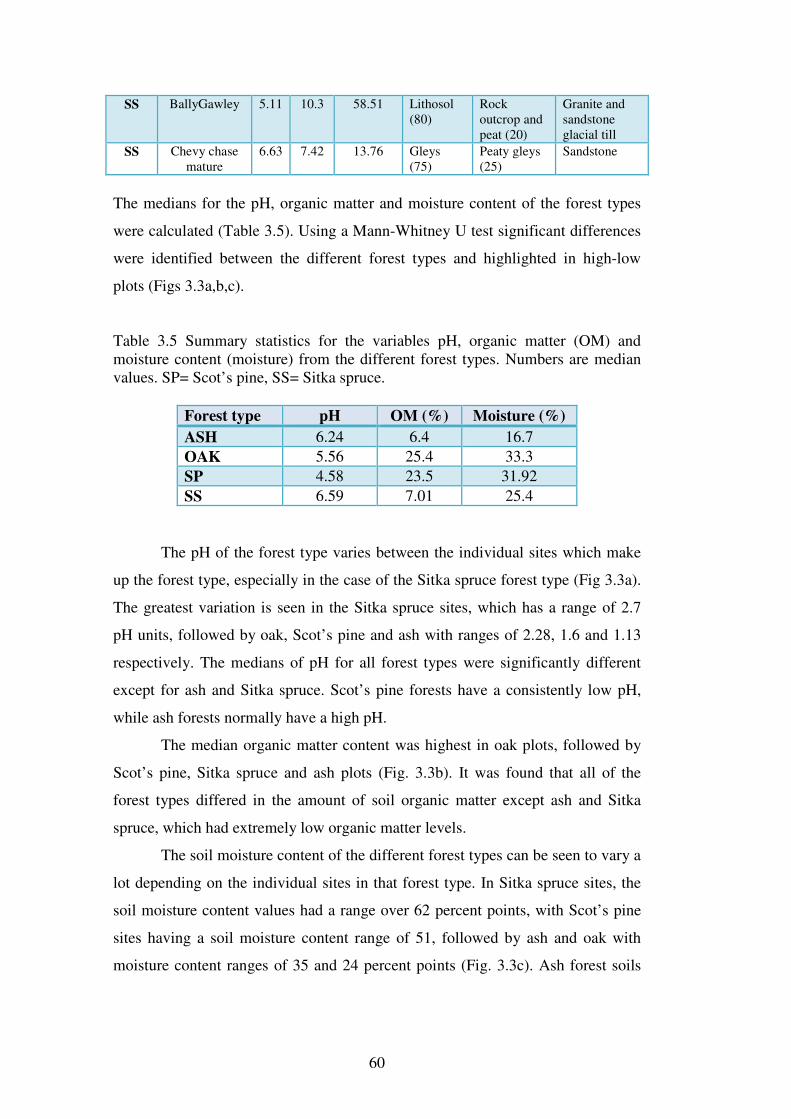
60
SS BallyGawley 5.11 10.3 58.51 Lithosol (80)
Rock outcrop and peat (20)
Granite and sandstone glacial till
SS Chevy chase mature
6.63 7.42 13.76 Gleys (75)
Peaty gleys (25)
Sandstone
The medians for the pH, organic matter and moisture content of the forest types
were calculated (Table 3.5). Using a Mann-Whitney U test significant differences
were identified between the different forest types and highlighted in high-low
plots (Figs 3.3a,b,c).
Table 3.5 Summary statistics for the variables pH, organic matter (OM) and moisture content (moisture) from the different forest types. Numbers are median values. SP= Scot’s pine, SS= Sitka spruce.
Forest type pH OM (%) Moisture (%)
ASH 6.24 6.4 16.7
OAK 5.56 25.4 33.3
SP 4.58 23.5 31.92
SS 6.59 7.01 25.4
The pH of the forest type varies between the individual sites which make
up the forest type, especially in the case of the Sitka spruce forest type (Fig 3.3a).
The greatest variation is seen in the Sitka spruce sites, which has a range of 2.7
pH units, followed by oak, Scot’s pine and ash with ranges of 2.28, 1.6 and 1.13
respectively. The medians of pH for all forest types were significantly different
except for ash and Sitka spruce. Scot’s pine forests have a consistently low pH,
while ash forests normally have a high pH.
The median organic matter content was highest in oak plots, followed by
Scot’s pine, Sitka spruce and ash plots (Fig. 3.3b). It was found that all of the
forest types differed in the amount of soil organic matter except ash and Sitka
spruce, which had extremely low organic matter levels.
The soil moisture content of the different forest types can be seen to vary a
lot depending on the individual sites in that forest type. In Sitka spruce sites, the
soil moisture content values had a range over 62 percent points, with Scot’s pine
sites having a soil moisture content range of 51, followed by ash and oak with
moisture content ranges of 35 and 24 percent points (Fig. 3.3c). Ash forest soils

61
were found to have significantly lower moisture content than the other forest
types.
Soil chemical results
The anion and cation supply rate to the PRS probes in the soil over 30 days was
calculated (Table 3.6). Significant differences between the median values for soil
available nitrate nitrogen, ammonium nitrogen, calcium magnesium, potassium
and phosphorus in each of the forest types were found using a Mann-Whitney U
test (Figs 3.4a, b; 3.5a, b; 3.6a, b).
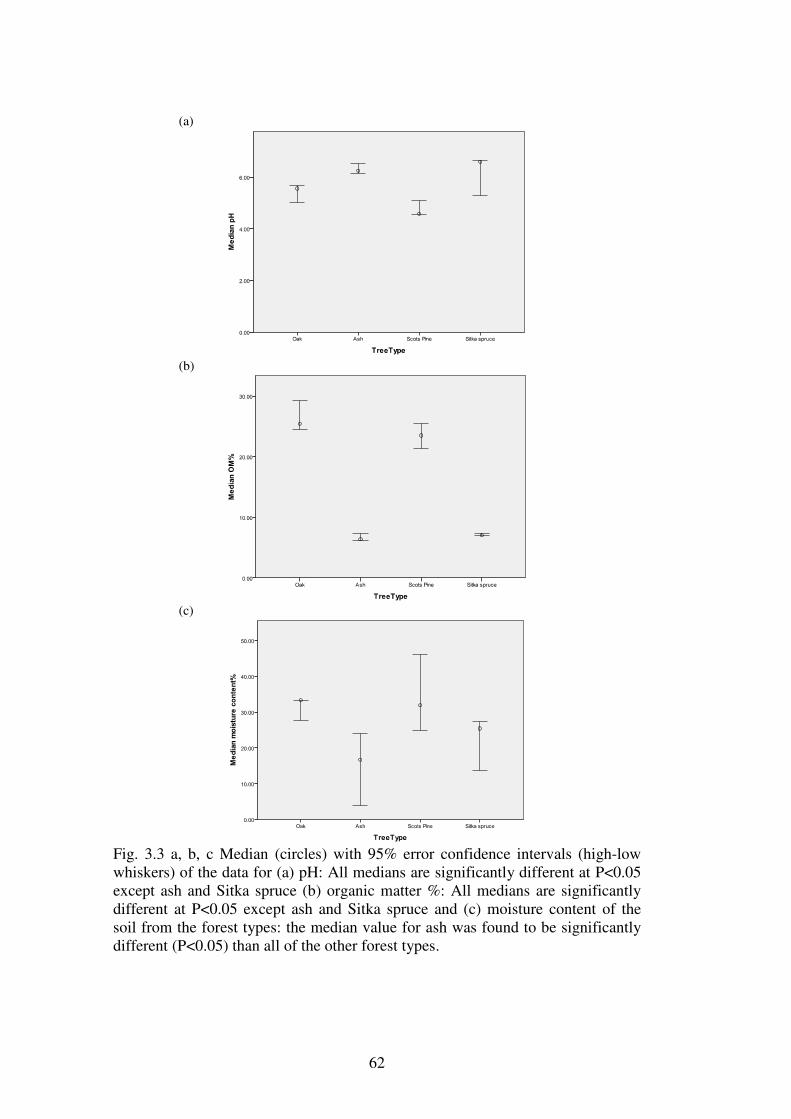
62
(a)
(b)
(c)
Fig. 3.3 a, b, c Median (circles) with 95% error confidence intervals (high-low whiskers) of the data for (a) pH: All medians are significantly different at P<0.05 except ash and Sitka spruce (b) organic matter %: All medians are significantly different at P<0.05 except ash and Sitka spruce and (c) moisture content of the soil from the forest types: the median value for ash was found to be significantly different (P<0.05) than all of the other forest types.

63
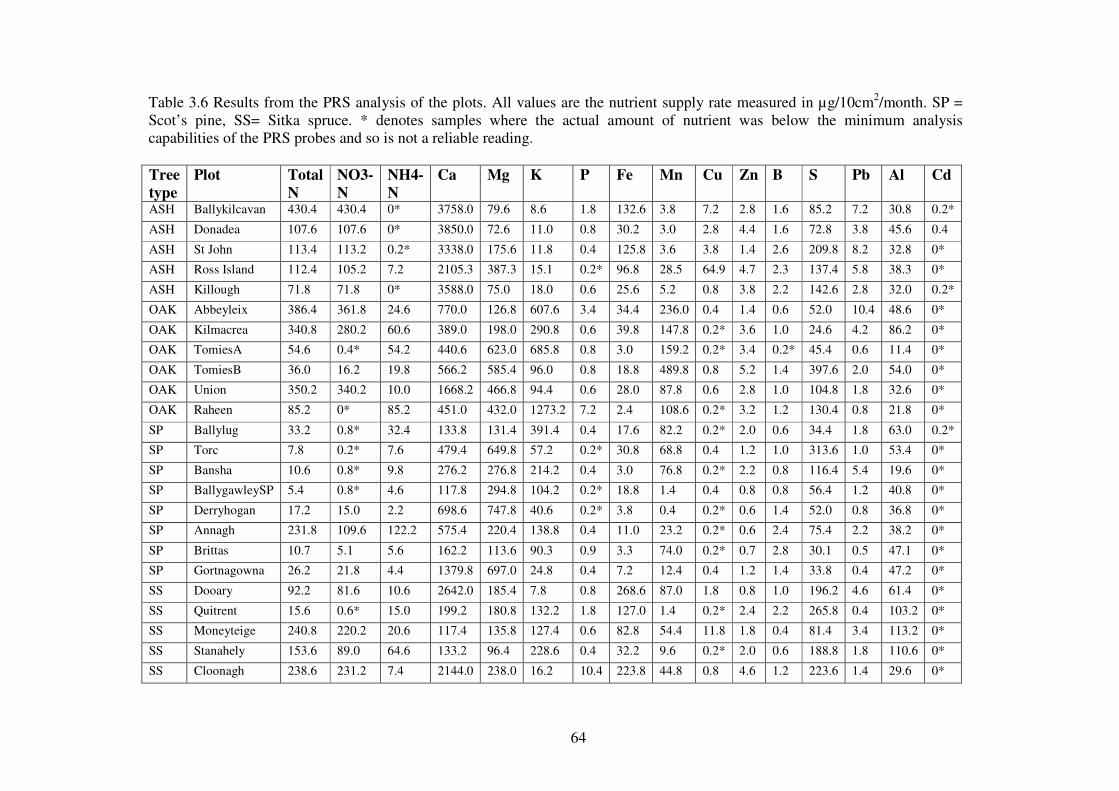
64
Table 3.6 Results from the PRS analysis of the plots. All values are the nutrient supply rate measured in µg/10cm2/month. SP = Scot’s pine, SS= Sitka spruce. * denotes samples where the actual amount of nutrient was below the minimum analysis capabilities of the PRS probes and so is not a reliable reading.
Tree
type
Plot Total
N
NO3-
N
NH4-
N
Ca Mg K P Fe Mn Cu Zn B S Pb Al Cd
ASH Ballykilcavan 430.4 430.4 0* 3758.0 79.6 8.6 1.8 132.6 3.8 7.2 2.8 1.6 85.2 7.2 30.8 0.2*
ASH Donadea 107.6 107.6 0* 3850.0 72.6 11.0 0.8 30.2 3.0 2.8 4.4 1.6 72.8 3.8 45.6 0.4
ASH St John 113.4 113.2 0.2* 3338.0 175.6 11.8 0.4 125.8 3.6 3.8 1.4 2.6 209.8 8.2 32.8 0*
ASH Ross Island 112.4 105.2 7.2 2105.3 387.3 15.1 0.2* 96.8 28.5 64.9 4.7 2.3 137.4 5.8 38.3 0*
ASH Killough 71.8 71.8 0* 3588.0 75.0 18.0 0.6 25.6 5.2 0.8 3.8 2.2 142.6 2.8 32.0 0.2*
OAK Abbeyleix 386.4 361.8 24.6 770.0 126.8 607.6 3.4 34.4 236.0 0.4 1.4 0.6 52.0 10.4 48.6 0*
OAK Kilmacrea 340.8 280.2 60.6 389.0 198.0 290.8 0.6 39.8 147.8 0.2* 3.6 1.0 24.6 4.2 86.2 0*
OAK TomiesA 54.6 0.4* 54.2 440.6 623.0 685.8 0.8 3.0 159.2 0.2* 3.4 0.2* 45.4 0.6 11.4 0*
OAK TomiesB 36.0 16.2 19.8 566.2 585.4 96.0 0.8 18.8 489.8 0.8 5.2 1.4 397.6 2.0 54.0 0*
OAK Union 350.2 340.2 10.0 1668.2 466.8 94.4 0.6 28.0 87.8 0.6 2.8 1.0 104.8 1.8 32.6 0*
OAK Raheen 85.2 0* 85.2 451.0 432.0 1273.2 7.2 2.4 108.6 0.2* 3.2 1.2 130.4 0.8 21.8 0*
SP Ballylug 33.2 0.8* 32.4 133.8 131.4 391.4 0.4 17.6 82.2 0.2* 2.0 0.6 34.4 1.8 63.0 0.2*
SP Torc 7.8 0.2* 7.6 479.4 649.8 57.2 0.2* 30.8 68.8 0.4 1.2 1.0 313.6 1.0 53.4 0*
SP Bansha 10.6 0.8* 9.8 276.2 276.8 214.2 0.4 3.0 76.8 0.2* 2.2 0.8 116.4 5.4 19.6 0*
SP BallygawleySP 5.4 0.8* 4.6 117.8 294.8 104.2 0.2* 18.8 1.4 0.4 0.8 0.8 56.4 1.2 40.8 0*
SP Derryhogan 17.2 15.0 2.2 698.6 747.8 40.6 0.2* 3.8 0.4 0.2* 0.6 1.4 52.0 0.8 36.8 0*
SP Annagh 231.8 109.6 122.2 575.4 220.4 138.8 0.4 11.0 23.2 0.2* 0.6 2.4 75.4 2.2 38.2 0*
SP Brittas 10.7 5.1 5.6 162.2 113.6 90.3 0.9 3.3 74.0 0.2* 0.7 2.8 30.1 0.5 47.1 0*
SP Gortnagowna 26.2 21.8 4.4 1379.8 697.0 24.8 0.4 7.2 12.4 0.4 1.2 1.4 33.8 0.4 47.2 0*
SS Dooary 92.2 81.6 10.6 2642.0 185.4 7.8 0.8 268.6 87.0 1.8 0.8 1.0 196.2 4.6 61.4 0*
SS Quitrent 15.6 0.6* 15.0 199.2 180.8 132.2 1.8 127.0 1.4 0.2* 2.4 2.2 265.8 0.4 103.2 0*
SS Moneyteige 240.8 220.2 20.6 117.4 135.8 127.4 0.6 82.8 54.4 11.8 1.8 0.4 81.4 3.4 113.2 0*
SS Stanahely 153.6 89.0 64.6 133.2 96.4 228.6 0.4 32.2 9.6 0.2* 2.0 0.6 188.8 1.8 110.6 0*
SS Cloonagh 238.6 231.2 7.4 2144.0 238.0 16.2 10.4 223.8 44.8 0.8 4.6 1.2 223.6 1.4 29.6 0*
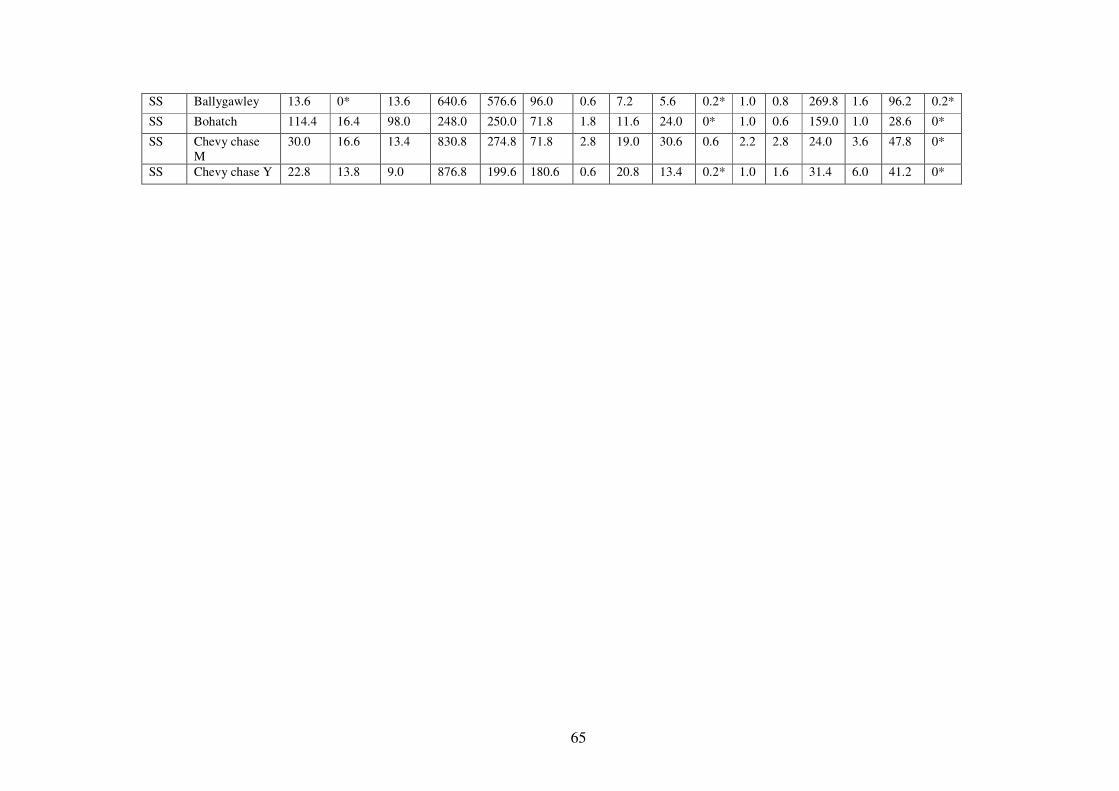
65
SS Ballygawley 13.6 0* 13.6 640.6 576.6 96.0 0.6 7.2 5.6 0.2* 1.0 0.8 269.8 1.6 96.2 0.2*
SS Bohatch 114.4 16.4 98.0 248.0 250.0 71.8 1.8 11.6 24.0 0* 1.0 0.6 159.0 1.0 28.6 0*
SS Chevy chase M
30.0 16.6 13.4 830.8 274.8 71.8 2.8 19.0 30.6 0.6 2.2 2.8 24.0 3.6 47.8 0*
SS Chevy chase Y 22.8 13.8 9.0 876.8 199.6 180.6 0.6 20.8 13.4 0.2* 1.0 1.6 31.4 6.0 41.2 0*

66
(a)
(b)
(c)
(d)
(e)
(f)
Fig 3.4 a, b, c, d, e, f. Median (circles) with high–low values (whiskers) of the data for soil available (a) nitrate nitrogen, (b) ammonium nitrogen, (c) calcium, (d) magnesium, (e) potassium and (f) phosphorus in the different forest types. Medians which do not share letters are significantly different (P<0.05) according to a Mann-Whitney U test.
Soil nitrogen levels can be seen to vary a lot between the different forest
types (Table 3.6). One visible trend is the larger amounts of nitrate nitrogen
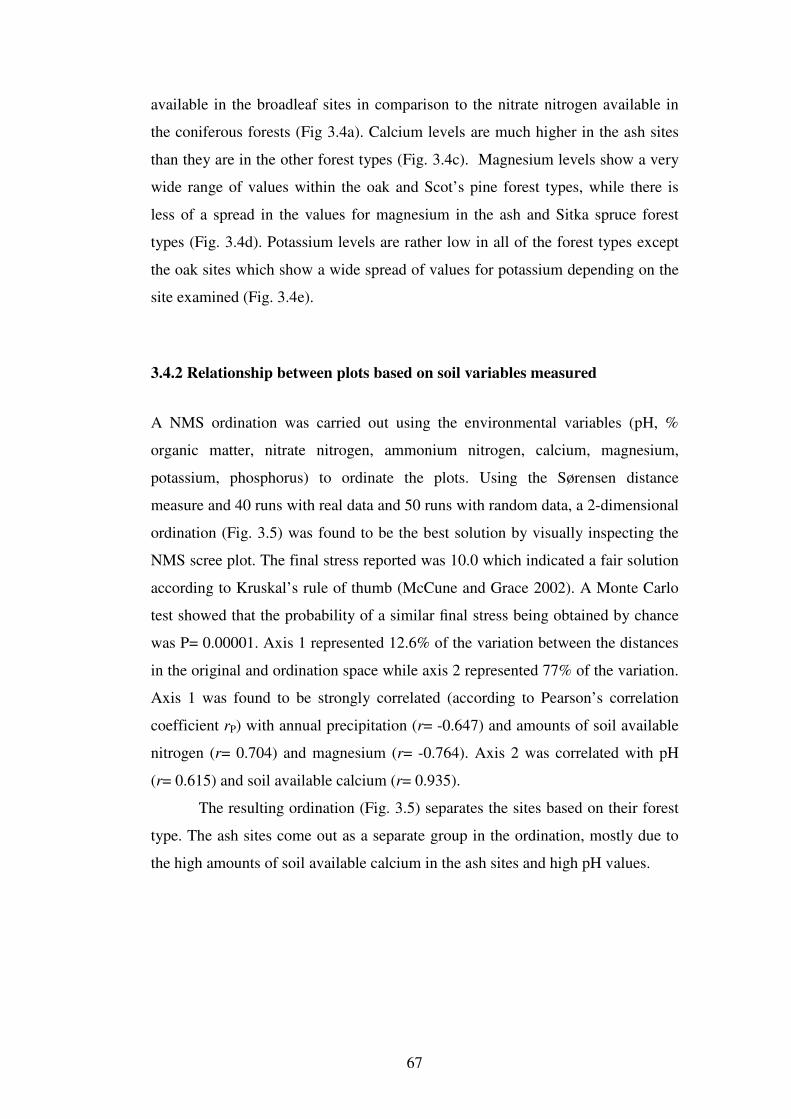
67
available in the broadleaf sites in comparison to the nitrate nitrogen available in
the coniferous forests (Fig 3.4a). Calcium levels are much higher in the ash sites
than they are in the other forest types (Fig. 3.4c). Magnesium levels show a very
wide range of values within the oak and Scot’s pine forest types, while there is
less of a spread in the values for magnesium in the ash and Sitka spruce forest
types (Fig. 3.4d). Potassium levels are rather low in all of the forest types except
the oak sites which show a wide spread of values for potassium depending on the
site examined (Fig. 3.4e).
3.4.2 Relationship between plots based on soil variables measured
A NMS ordination was carried out using the environmental variables (pH, %
organic matter, nitrate nitrogen, ammonium nitrogen, calcium, magnesium,
potassium, phosphorus) to ordinate the plots. Using the Sørensen distance
measure and 40 runs with real data and 50 runs with random data, a 2-dimensional
ordination (Fig. 3.5) was found to be the best solution by visually inspecting the
NMS scree plot. The final stress reported was 10.0 which indicated a fair solution
according to Kruskal’s rule of thumb (McCune and Grace 2002). A Monte Carlo
test showed that the probability of a similar final stress being obtained by chance
was P= 0.00001. Axis 1 represented 12.6% of the variation between the distances
in the original and ordination space while axis 2 represented 77% of the variation.
Axis 1 was found to be strongly correlated (according to Pearson’s correlation
coefficient rP) with annual precipitation (r= -0.647) and amounts of soil available
nitrogen (r= 0.704) and magnesium (r= -0.764). Axis 2 was correlated with pH
(r= 0.615) and soil available calcium (r= 0.935).
The resulting ordination (Fig. 3.5) separates the sites based on their forest
type. The ash sites come out as a separate group in the ordination, mostly due to
the high amounts of soil available calcium in the ash sites and high pH values.

68
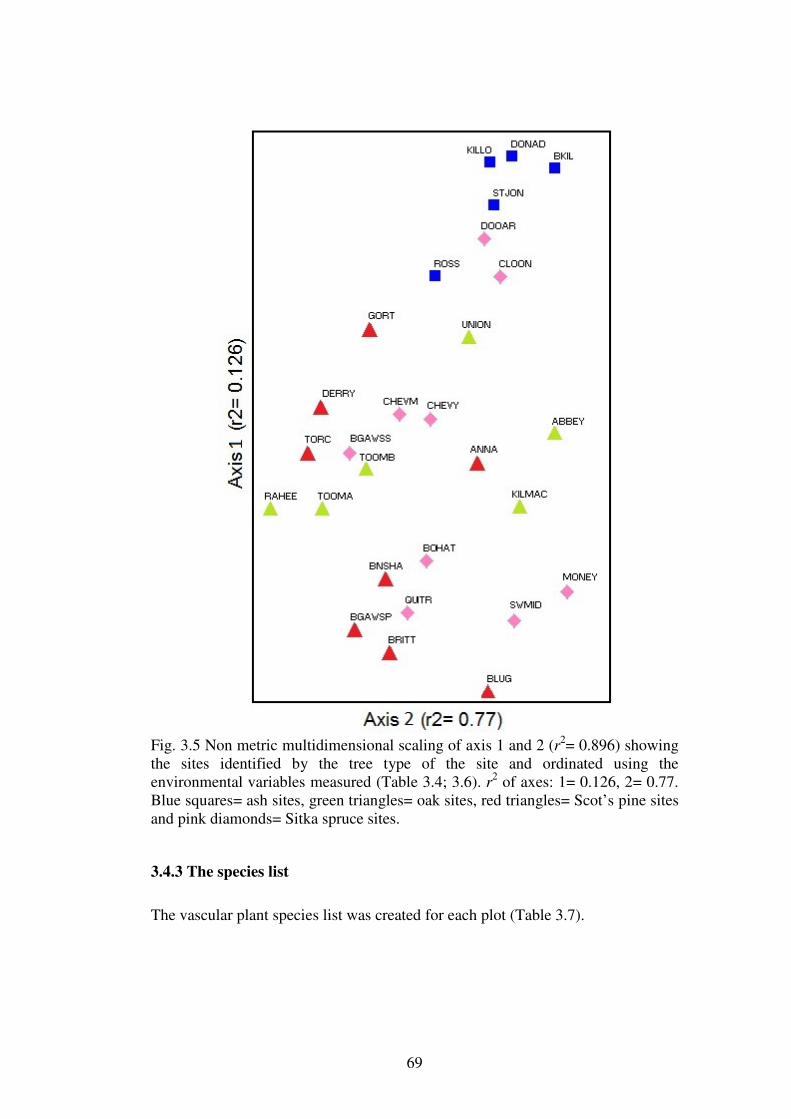
69
Fig. 3.5 Non metric multidimensional scaling of axis 1 and 2 (r2= 0.896) showing the sites identified by the tree type of the site and ordinated using the environmental variables measured (Table 3.4; 3.6). r2 of axes: 1= 0.126, 2= 0.77. Blue squares= ash sites, green triangles= oak sites, red triangles= Scot’s pine sites and pink diamonds= Sitka spruce sites.
3.4.3 The species list
The vascular plant species list was created for each plot (Table 3.7).

70
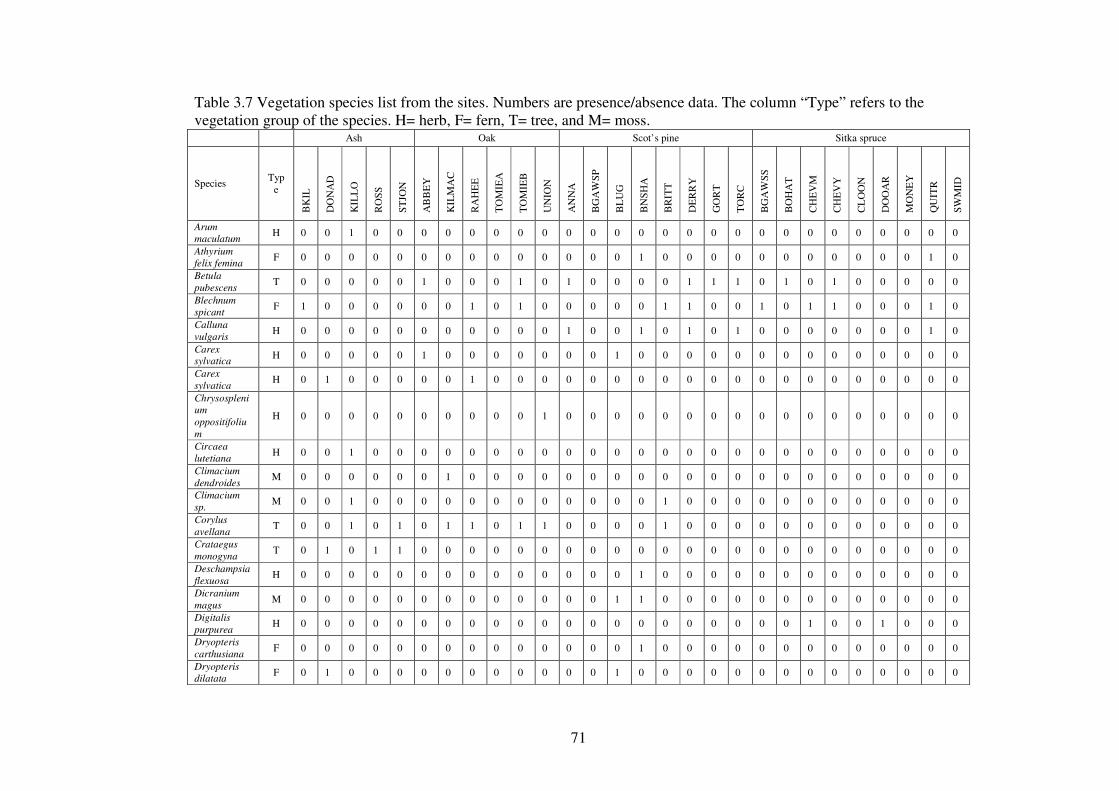
71
Table 3.7 Vegetation species list from the sites. Numbers are presence/absence data. The column “Type” refers to the vegetation group of the species. H= herb, F= fern, T= tree, and M= moss.
Ash Oak Scot’s pine Sitka spruce
Species Typ
e
BK
IL
DO
NA
D
KIL
LO
RO
SS
ST
JON
AB
BE
Y
KIL
MA
C
RA
HE
E
TO
MIE
A
TO
MIE
B
UN
ION
AN
NA
BG
AW
SP
BL
UG
BN
SH
A
BR
ITT
DE
RR
Y
GO
RT
TO
RC
BG
AW
SS
BO
HA
T
CH
EV
M
CH
EV
Y
CL
OO
N
DO
OA
R
MO
NE
Y
QU
ITR
SW
MID
Arum
maculatum H 0 0 1 0 0 0 0 0 0 0 0 0 0 0 0 0 0 0 0 0 0 0 0 0 0 0 0 0
Athyrium
felix femina F 0 0 0 0 0 0 0 0 0 0 0 0 0 0 1 0 0 0 0 0 0 0 0 0 0 0 1 0
Betula
pubescens T 0 0 0 0 0 1 0 0 0 1 0 1 0 0 0 0 1 1 1 0 1 0 1 0 0 0 0 0
Blechnum
spicant F 1 0 0 0 0 0 0 1 0 1 0 0 0 0 0 1 1 0 0 1 0 1 1 0 0 0 1 0
Calluna
vulgaris H 0 0 0 0 0 0 0 0 0 0 0 1 0 0 1 0 1 0 1 0 0 0 0 0 0 0 1 0
Carex
sylvatica H 0 0 0 0 0 1 0 0 0 0 0 0 0 1 0 0 0 0 0 0 0 0 0 0 0 0 0 0
Carex
sylvatica H 0 1 0 0 0 0 0 1 0 0 0 0 0 0 0 0 0 0 0 0 0 0 0 0 0 0 0 0
Chrysospleni
um
oppositifoliu
m
H 0 0 0 0 0 0 0 0 0 0 1 0 0 0 0 0 0 0 0 0 0 0 0 0 0 0 0 0
Circaea
lutetiana H 0 0 1 0 0 0 0 0 0 0 0 0 0 0 0 0 0 0 0 0 0 0 0 0 0 0 0 0
Climacium
dendroides M 0 0 0 0 0 0 1 0 0 0 0 0 0 0 0 0 0 0 0 0 0 0 0 0 0 0 0 0
Climacium
sp. M 0 0 1 0 0 0 0 0 0 0 0 0 0 0 0 1 0 0 0 0 0 0 0 0 0 0 0 0
Corylus
avellana T 0 0 1 0 1 0 1 1 0 1 1 0 0 0 0 1 0 0 0 0 0 0 0 0 0 0 0 0
Crataegus
monogyna T 0 1 0 1 1 0 0 0 0 0 0 0 0 0 0 0 0 0 0 0 0 0 0 0 0 0 0 0
Deschampsia
flexuosa H 0 0 0 0 0 0 0 0 0 0 0 0 0 0 1 0 0 0 0 0 0 0 0 0 0 0 0 0
Dicranium
magus M 0 0 0 0 0 0 0 0 0 0 0 0 0 1 1 0 0 0 0 0 0 0 0 0 0 0 0 0
Digitalis
purpurea H 0 0 0 0 0 0 0 0 0 0 0 0 0 0 0 0 0 0 0 0 0 1 0 0 1 0 0 0
Dryopteris
carthusiana F 0 0 0 0 0 0 0 0 0 0 0 0 0 0 1 0 0 0 0 0 0 0 0 0 0 0 0 0
Dryopteris
dilatata F 0 1 0 0 0 0 0 0 0 0 0 0 0 1 0 0 0 0 0 0 0 0 0 0 0 0 0 0

72
Dryopteris
filix-mas F 0 1 1 1 1 0 1 1 1 0 0 0 0 0 0 1 0 1 0 0 0 0 1 0 0 0 0 0
Dryopteris
psued- mas F 0 0 1 0 0 0 0 0 0 0 0 0 0 0 0 0 0 0 0 0 0 0 0 0 0 0 0 0
Epilobium
sp. H 0 1 0 0 0 0 0 0 0 0 0 0 0 0 0 0 0 0 0 0 0 0 0 0 0 0 1 0
Helleborine
sp. H 0 0 1 0 0 0 0 0 0 0 0 0 0 0 0 0 0 0 0 0 0 0 0 0 0 0 0 0
Euonymus
europaeus H 0 0 1 0 0 0 0 0 0 0 0 0 0 0 0 0 0 0 0 0 0 0 0 0 0 0 0 0
Fagus
sylvatica T 0 1 0 1 0 1 0 1 0 0 1 0 0 0 0 0 0 0 0 0 0 0 0 0 0 0 0 0
Festuca H 0 0 0 0 0 0 0 0 0 0 0 0 0 0 1 0 0 0 0 0 0 0 0 0 0 0 0 0
Fragaria
vesca H 0 0 1 0 0 1 0 0 0 0 0 0 0 0 0 0 0 0 0 0 0 0 0 0 0 0 0 0
Fraxinus
excelsior T 1 1 1 1 1 0 0 0 0 0 1 0 0 0 0 0 0 0 0 0 0 0 0 0 0 0 0 0
Geum
urbanum H 0 0 1 0 0 0 0 0 0 0 0 0 0 0 0 0 0 0 0 0 0 0 0 0 0 0 0 0
Glechoma
hederacea H 0 0 0 1 0 0 0 0 0 0 0 0 0 0 0 0 0 0 0 0 0 0 0 0 0 0 0 0
Hedera helix H 1 1 1 1 1 1 0 1 1 1 1 0 0 0 0 0 1 0 1 1 0 1 1 0 0 0 0 0
Heracleum
sphondylium H 0 1 0 0 0 0 0 0 0 0 0 0 0 0 0 0 0 0 0 0 0 0 0 0 0 0 0 0
Hyacinthoide
s non-scripta H 0 0 1 0 0 0 0 0 0 0 0 0 0 0 0 0 0 0 0 0 0 0 0 0 0 0 0 0
Ilex
aquifolium H 0 0 0 0 1 0 1 1 1 1 0 1 0 1 1 1 0 0 1 1 0 0 0 0 0 0 0 0
Larix
decidua T 0 0 0 0 0 1 0 0 0 0 0 0 0 0 0 0 0 0 0 0 0 0 0 0 0 0 0 0
Lonicera
periclymenu
m
H 0 0 1 0 0 0 1 1 0 1 0 0 0 0 1 0 0 1 0 0 0 0 0 0 0 0 0 0
Luzula
sylvatica H 0 0 0 0 0 0 1 0 1 1 1 0 0 0 0 1 0 0 0 1 0 0 0 0 0 0 0 0
Oxalis
acetosella H 0 0 0 0 0 1 1 1 1 1 0 0 1 1 0 1 0 0 0 1 1 1 0 0 0 0 0 1
Phyllitis
scolopendriu
m
F 0 1 0 0 0 0 0 0 0 0 0 0 0 0 0 0 0 0 0 0 0 0 0 0 0 0 0 0
Picea
sitchensis T 0 0 0 0 0 0 0 0 0 0 0 0 0 0 0 0 1 0 0 1 1 1 1 1 1 1 1 1
Pinus
contorta T 0 0 0 0 0 0 0 0 0 0 0 0 0 0 0 0 0 0 0 0 0 0 0 0 0 0 1 0
Pinus
sylvestris T 0 0 0 0 0 0 0 0 0 0 0 1 1 1 1 1 1 1 1 0 0 0 0 0 0 0 0 0
Polystichum
setiferum M 0 0 1 0 1 0 0 1 1 1 0 1 0 0 0 1 0 0 0 0 0 0 0 0 0 0 0 0
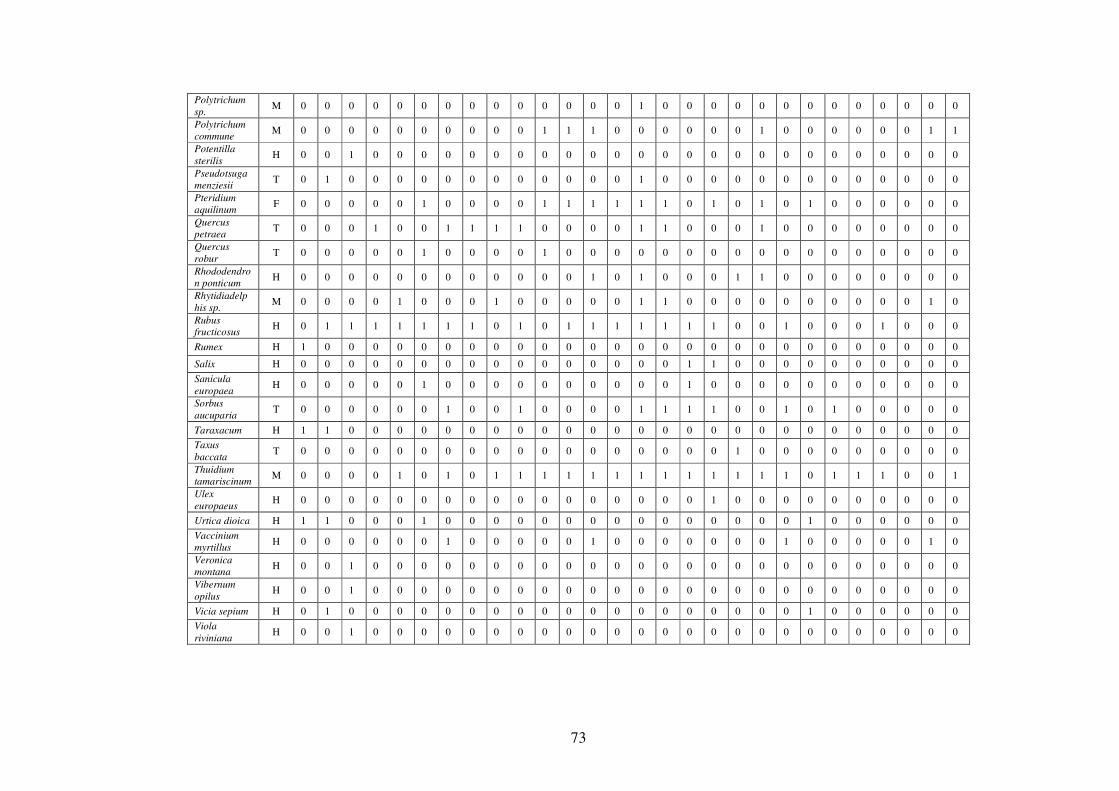
73
Polytrichum
sp. M 0 0 0 0 0 0 0 0 0 0 0 0 0 0 1 0 0 0 0 0 0 0 0 0 0 0 0 0
Polytrichum
commune M 0 0 0 0 0 0 0 0 0 0 1 1 1 0 0 0 0 0 0 1 0 0 0 0 0 0 1 1
Potentilla
sterilis H 0 0 1 0 0 0 0 0 0 0 0 0 0 0 0 0 0 0 0 0 0 0 0 0 0 0 0 0
Pseudotsuga
menziesii T 0 1 0 0 0 0 0 0 0 0 0 0 0 0 1 0 0 0 0 0 0 0 0 0 0 0 0 0
Pteridium
aquilinum F 0 0 0 0 0 1 0 0 0 0 1 1 1 1 1 1 0 1 0 1 0 1 0 0 0 0 0 0
Quercus
petraea T 0 0 0 1 0 0 1 1 1 1 0 0 0 0 1 1 0 0 0 1 0 0 0 0 0 0 0 0
Quercus
robur T 0 0 0 0 0 1 0 0 0 0 1 0 0 0 0 0 0 0 0 0 0 0 0 0 0 0 0 0
Rhododendro
n ponticum H 0 0 0 0 0 0 0 0 0 0 0 0 1 0 1 0 0 0 1 1 0 0 0 0 0 0 0 0
Rhytidiadelp
his sp. M 0 0 0 0 1 0 0 0 1 0 0 0 0 0 1 1 0 0 0 0 0 0 0 0 0 0 1 0
Rubus
fructicosus H 0 1 1 1 1 1 1 1 0 1 0 1 1 1 1 1 1 1 0 0 1 0 0 0 1 0 0 0
Rumex H 1 0 0 0 0 0 0 0 0 0 0 0 0 0 0 0 0 0 0 0 0 0 0 0 0 0 0 0
Salix H 0 0 0 0 0 0 0 0 0 0 0 0 0 0 0 0 1 1 0 0 0 0 0 0 0 0 0 0
Sanicula
europaea H 0 0 0 0 0 1 0 0 0 0 0 0 0 0 0 0 1 0 0 0 0 0 0 0 0 0 0 0
Sorbus
aucuparia T 0 0 0 0 0 0 1 0 0 1 0 0 0 0 1 1 1 1 0 0 1 0 1 0 0 0 0 0
Taraxacum H 1 1 0 0 0 0 0 0 0 0 0 0 0 0 0 0 0 0 0 0 0 0 0 0 0 0 0 0
Taxus
baccata T 0 0 0 0 0 0 0 0 0 0 0 0 0 0 0 0 0 0 1 0 0 0 0 0 0 0 0 0
Thuidium
tamariscinum M 0 0 0 0 1 0 1 0 1 1 1 1 1 1 1 1 1 1 1 1 1 0 1 1 1 0 0 1
Ulex
europaeus H 0 0 0 0 0 0 0 0 0 0 0 0 0 0 0 0 0 1 0 0 0 0 0 0 0 0 0 0
Urtica dioica H 1 1 0 0 0 1 0 0 0 0 0 0 0 0 0 0 0 0 0 0 0 1 0 0 0 0 0 0
Vaccinium
myrtillus H 0 0 0 0 0 0 1 0 0 0 0 0 1 0 0 0 0 0 0 0 1 0 0 0 0 0 1 0
Veronica
montana H 0 0 1 0 0 0 0 0 0 0 0 0 0 0 0 0 0 0 0 0 0 0 0 0 0 0 0 0
Vibernum
opilus H 0 0 1 0 0 0 0 0 0 0 0 0 0 0 0 0 0 0 0 0 0 0 0 0 0 0 0 0
Vicia sepium H 0 1 0 0 0 0 0 0 0 0 0 0 0 0 0 0 0 0 0 0 0 1 0 0 0 0 0 0
Viola
riviniana H 0 0 1 0 0 0 0 0 0 0 0 0 0 0 0 0 0 0 0 0 0 0 0 0 0 0 0 0
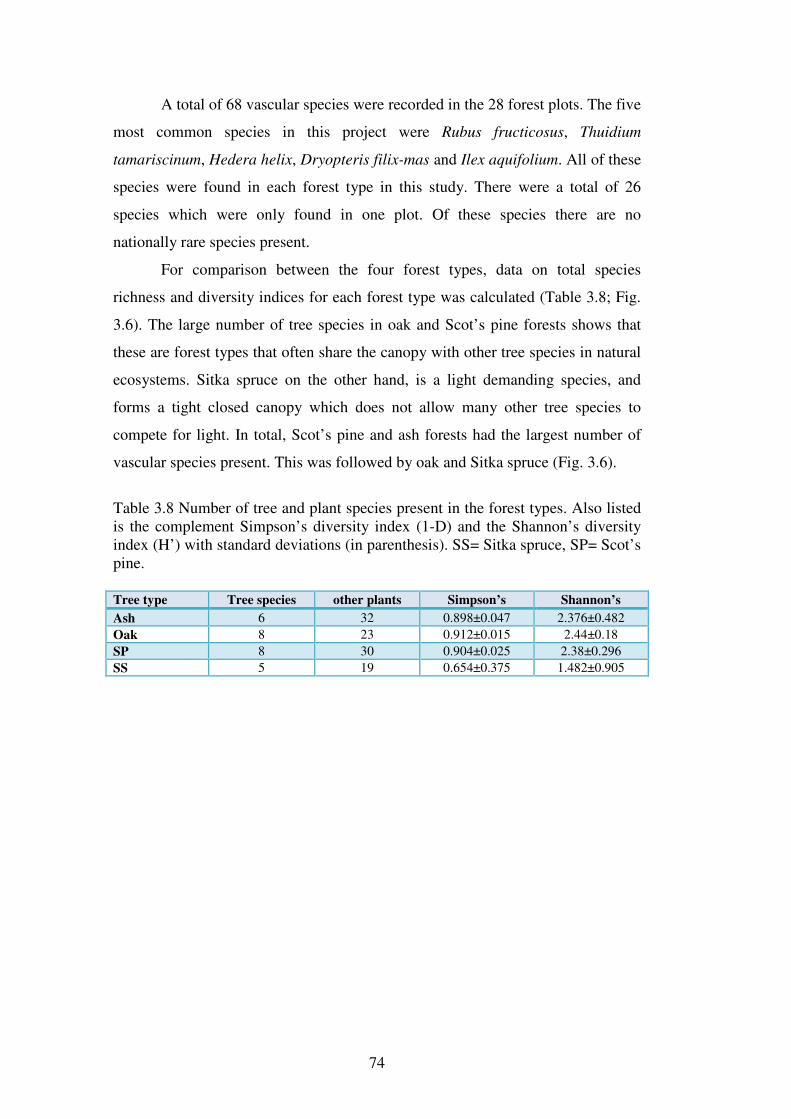
74
A total of 68 vascular species were recorded in the 28 forest plots. The five
most common species in this project were Rubus fructicosus, Thuidium
tamariscinum, Hedera helix, Dryopteris filix-mas and Ilex aquifolium. All of these
species were found in each forest type in this study. There were a total of 26
species which were only found in one plot. Of these species there are no
nationally rare species present.
For comparison between the four forest types, data on total species
richness and diversity indices for each forest type was calculated (Table 3.8; Fig.
3.6). The large number of tree species in oak and Scot’s pine forests shows that
these are forest types that often share the canopy with other tree species in natural
ecosystems. Sitka spruce on the other hand, is a light demanding species, and
forms a tight closed canopy which does not allow many other tree species to
compete for light. In total, Scot’s pine and ash forests had the largest number of
vascular species present. This was followed by oak and Sitka spruce (Fig. 3.6).
Table 3.8 Number of tree and plant species present in the forest types. Also listed is the complement Simpson’s diversity index (1-D) and the Shannon’s diversity index (H’) with standard deviations (in parenthesis). SS= Sitka spruce, SP= Scot’s pine. Tree type Tree species other plants Simpson’s Shannon’s
Ash 6 32 0.898±0.047 2.376±0.482
Oak 8 23 0.912±0.015 2.44±0.18
SP 8 30 0.904±0.025 2.38±0.296
SS 5 19 0.654±0.375 1.482±0.905
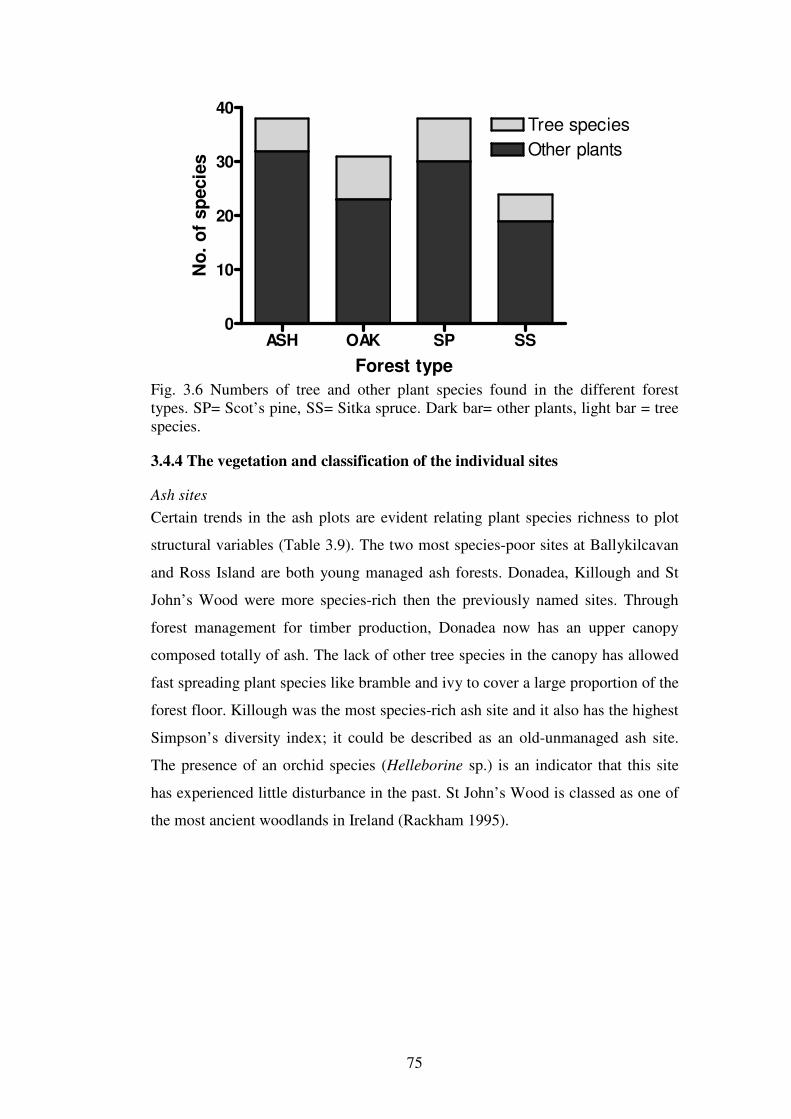
75
ASH OAK SP SS0
10
20
30
40Tree speciesOther plants
Forest type
No
. o
f sp
ecie
s
Fig. 3.6 Numbers of tree and other plant species found in the different forest types. SP= Scot’s pine, SS= Sitka spruce. Dark bar= other plants, light bar = tree species.
3.4.4 The vegetation and classification of the individual sites
Ash sites
Certain trends in the ash plots are evident relating plant species richness to plot
structural variables (Table 3.9). The two most species-poor sites at Ballykilcavan
and Ross Island are both young managed ash forests. Donadea, Killough and St
John’s Wood were more species-rich then the previously named sites. Through
forest management for timber production, Donadea now has an upper canopy
composed totally of ash. The lack of other tree species in the canopy has allowed
fast spreading plant species like bramble and ivy to cover a large proportion of the
forest floor. Killough was the most species-rich ash site and it also has the highest
Simpson’s diversity index; it could be described as an old-unmanaged ash site.
The presence of an orchid species (Helleborine sp.) is an indicator that this site
has experienced little disturbance in the past. St John’s Wood is classed as one of
the most ancient woodlands in Ireland (Rackham 1995).
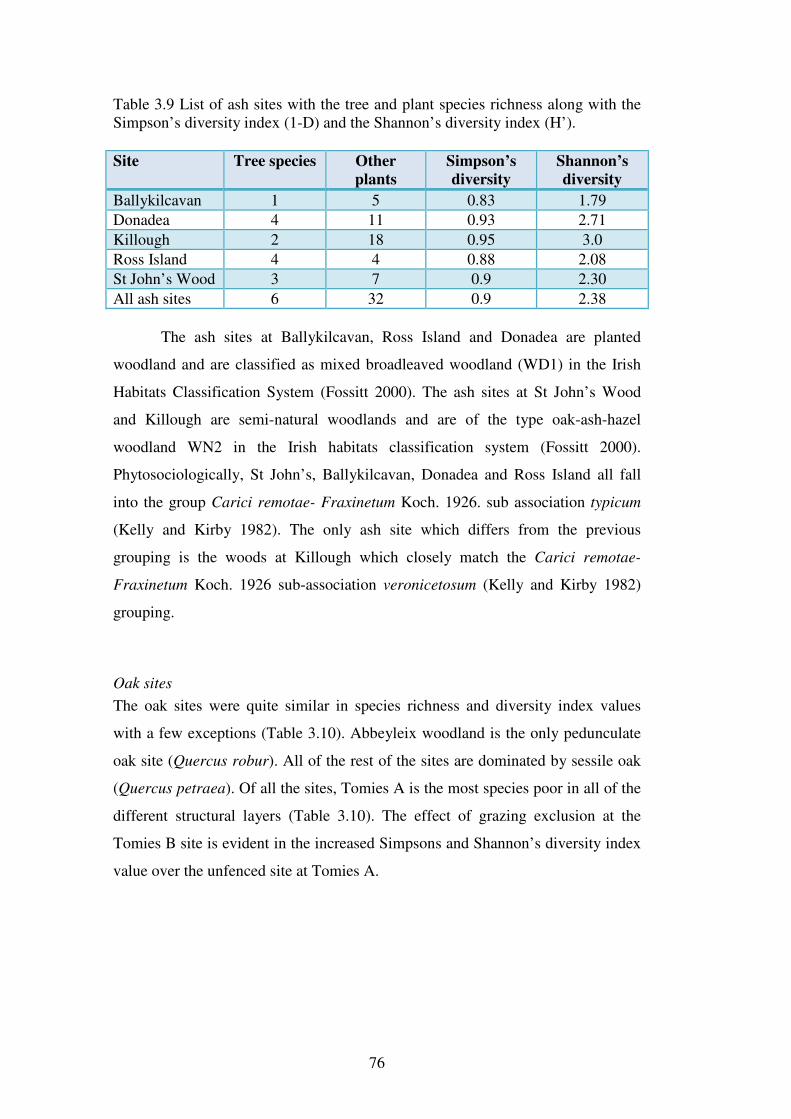
76
Table 3.9 List of ash sites with the tree and plant species richness along with the Simpson’s diversity index (1-D) and the Shannon’s diversity index (H’).
Site Tree species Other
plants
Simpson’s
diversity
Shannon’s
diversity
Ballykilcavan 1 5 0.83 1.79
Donadea 4 11 0.93 2.71
Killough 2 18 0.95 3.0
Ross Island 4 4 0.88 2.08
St John’s Wood 3 7 0.9 2.30
All ash sites 6 32 0.9 2.38
The ash sites at Ballykilcavan, Ross Island and Donadea are planted
woodland and are classified as mixed broadleaved woodland (WD1) in the Irish
Habitats Classification System (Fossitt 2000). The ash sites at St John’s Wood
and Killough are semi-natural woodlands and are of the type oak-ash-hazel
woodland WN2 in the Irish habitats classification system (Fossitt 2000).
Phytosociologically, St John’s, Ballykilcavan, Donadea and Ross Island all fall
into the group Carici remotae- Fraxinetum Koch. 1926. sub association typicum
(Kelly and Kirby 1982). The only ash site which differs from the previous
grouping is the woods at Killough which closely match the Carici remotae-
Fraxinetum Koch. 1926 sub-association veronicetosum (Kelly and Kirby 1982)
grouping.
Oak sites
The oak sites were quite similar in species richness and diversity index values
with a few exceptions (Table 3.10). Abbeyleix woodland is the only pedunculate
oak site (Quercus robur). All of the rest of the sites are dominated by sessile oak
(Quercus petraea). Of all the sites, Tomies A is the most species poor in all of the
different structural layers (Table 3.10). The effect of grazing exclusion at the
Tomies B site is evident in the increased Simpsons and Shannon’s diversity index
value over the unfenced site at Tomies A.

77
Table 3.10 List of oak sites with the tree and plant species richness along with the Simpson’s diversity index (1-D) and the Shannon’s diversity index (H’).
Site Tree species Other plants Simpson’s
diversity
Shannon’s
diversity
Abbeyleix 4 9 0.92 2.49
Kilmacrea 4 8 0.92 2.49
Raheen 3 9 0.92 2.49
Union 4 6 0.9 2.30
Tomies A 1 8 0.89 2.2
Tomies B 4 10 0.93 2.71
All oak sites 8 23 0.91 2.44
In phytosociological terms, the Tomies sites belong to the Blechno-
Quercetum Association (Braun-Blanquet and Tuxen 1952) subassociation
scapanietosum (Kelly and Moore 1975). The woods at Kilmacrea belong to the
Blechno-Quercetum Association (Braun-Blanquet and Tuxen 1952)
subassociation typicum (Kelly and Moore 1975). Both Raheen and Union oak fit
into the Blechno-Quercetum Association subassociation coryletosum (Kelly and
Moore 1975) while the site at Abbeyleix belongs to the Querco- Fagetea.
Scot’s pine sites
There are large differences between the individual sites within the grouping of
Scot’s pine forests (Table 3.11). Bansha and Brittas are the two most species rich-
sites. Both forests are structurally diverse with numerous tree species in each of
the canopy layers. All of the other SP sites are less species rich than these two
sites. The woodland at Torc is one of the most ancient SP woodlands in Ireland;
however its vegetation composition is very species-poor. This is probably due to
the invasive species Rhododendron ponticum which is aggressively spreading and
shading the native ground flora. Annagh, Derryhogan and Gortnagowna are all
relatively young forests planted on bog soil. Derryhogan differs in that it includes
a sizable proportion of Sitka spruce (20%) of the forest canopy. This inclusion of
Sitka spruce in the canopy has effects on the other plant species present.
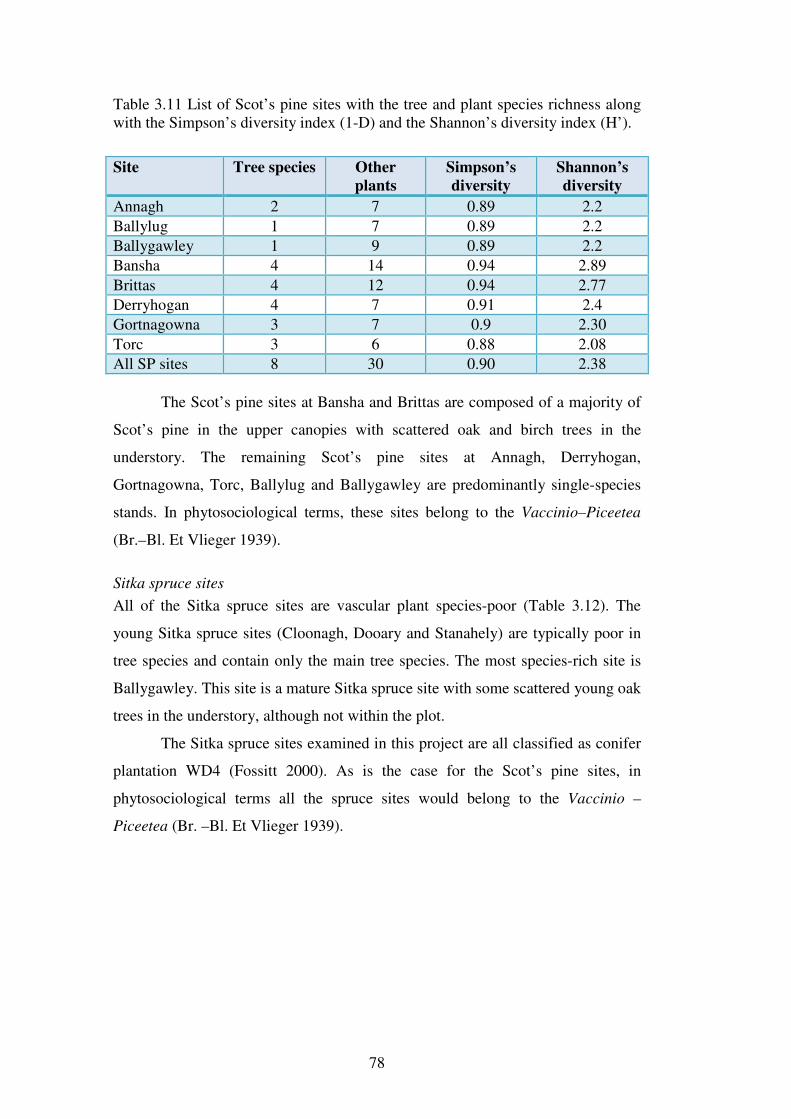
78
Table 3.11 List of Scot’s pine sites with the tree and plant species richness along with the Simpson’s diversity index (1-D) and the Shannon’s diversity index (H’).
Site Tree species Other
plants
Simpson’s
diversity
Shannon’s
diversity
Annagh 2 7 0.89 2.2
Ballylug 1 7 0.89 2.2
Ballygawley 1 9 0.89 2.2
Bansha 4 14 0.94 2.89
Brittas 4 12 0.94 2.77
Derryhogan 4 7 0.91 2.4
Gortnagowna 3 7 0.9 2.30
Torc 3 6 0.88 2.08
All SP sites 8 30 0.90 2.38
The Scot’s pine sites at Bansha and Brittas are composed of a majority of
Scot’s pine in the upper canopies with scattered oak and birch trees in the
understory. The remaining Scot’s pine sites at Annagh, Derryhogan,
Gortnagowna, Torc, Ballylug and Ballygawley are predominantly single-species
stands. In phytosociological terms, these sites belong to the Vaccinio–Piceetea
(Br.–Bl. Et Vlieger 1939).
Sitka spruce sites
All of the Sitka spruce sites are vascular plant species-poor (Table 3.12). The
young Sitka spruce sites (Cloonagh, Dooary and Stanahely) are typically poor in
tree species and contain only the main tree species. The most species-rich site is
Ballygawley. This site is a mature Sitka spruce site with some scattered young oak
trees in the understory, although not within the plot.
The Sitka spruce sites examined in this project are all classified as conifer
plantation WD4 (Fossitt 2000). As is the case for the Scot’s pine sites, in
phytosociological terms all the spruce sites would belong to the Vaccinio –
Piceetea (Br. –Bl. Et Vlieger 1939).
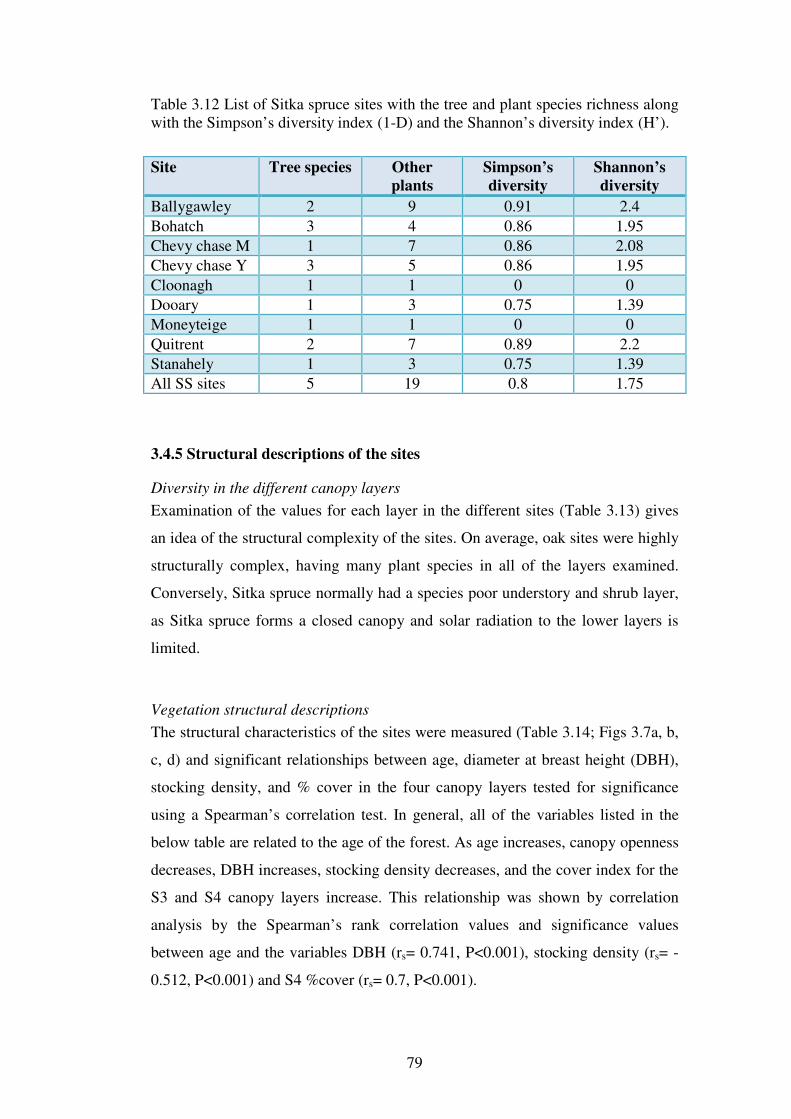
79
Table 3.12 List of Sitka spruce sites with the tree and plant species richness along with the Simpson’s diversity index (1-D) and the Shannon’s diversity index (H’).
Site Tree species Other
plants
Simpson’s
diversity
Shannon’s
diversity
Ballygawley 2 9 0.91 2.4
Bohatch 3 4 0.86 1.95
Chevy chase M 1 7 0.86 2.08
Chevy chase Y 3 5 0.86 1.95
Cloonagh 1 1 0 0
Dooary 1 3 0.75 1.39
Moneyteige 1 1 0 0
Quitrent 2 7 0.89 2.2
Stanahely 1 3 0.75 1.39
All SS sites 5 19 0.8 1.75
3.4.5 Structural descriptions of the sites
Diversity in the different canopy layers
Examination of the values for each layer in the different sites (Table 3.13) gives
an idea of the structural complexity of the sites. On average, oak sites were highly
structurally complex, having many plant species in all of the layers examined.
Conversely, Sitka spruce normally had a species poor understory and shrub layer,
as Sitka spruce forms a closed canopy and solar radiation to the lower layers is
limited.
Vegetation structural descriptions
The structural characteristics of the sites were measured (Table 3.14; Figs 3.7a, b,
c, d) and significant relationships between age, diameter at breast height (DBH),
stocking density, and % cover in the four canopy layers tested for significance
using a Spearman’s correlation test. In general, all of the variables listed in the
below table are related to the age of the forest. As age increases, canopy openness
decreases, DBH increases, stocking density decreases, and the cover index for the
S3 and S4 canopy layers increase. This relationship was shown by correlation
analysis by the Spearman’s rank correlation values and significance values
between age and the variables DBH (rs= 0.741, P<0.001), stocking density (rs= -
0.512, P<0.001) and S4 %cover (rs= 0.7, P<0.001).
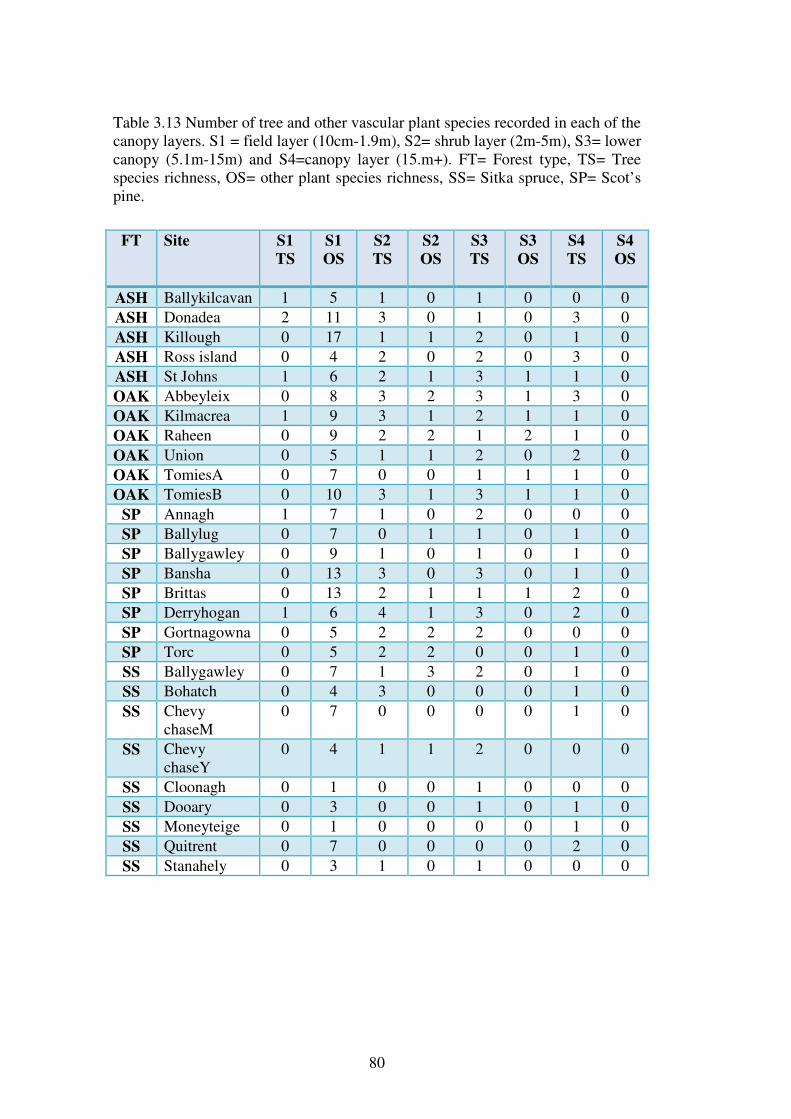
80
Table 3.13 Number of tree and other vascular plant species recorded in each of the canopy layers. S1 = field layer (10cm-1.9m), S2= shrub layer (2m-5m), S3= lower canopy (5.1m-15m) and S4=canopy layer (15.m+). FT= Forest type, TS= Tree species richness, OS= other plant species richness, SS= Sitka spruce, SP= Scot’s pine.
FT Site S1
TS
S1
OS
S2
TS
S2
OS
S3
TS
S3
OS
S4
TS
S4
OS
ASH Ballykilcavan 1 5 1 0 1 0 0 0
ASH Donadea 2 11 3 0 1 0 3 0
ASH Killough 0 17 1 1 2 0 1 0
ASH Ross island 0 4 2 0 2 0 3 0
ASH St Johns 1 6 2 1 3 1 1 0
OAK Abbeyleix 0 8 3 2 3 1 3 0
OAK Kilmacrea 1 9 3 1 2 1 1 0
OAK Raheen 0 9 2 2 1 2 1 0
OAK Union 0 5 1 1 2 0 2 0
OAK TomiesA 0 7 0 0 1 1 1 0
OAK TomiesB 0 10 3 1 3 1 1 0
SP Annagh 1 7 1 0 2 0 0 0
SP Ballylug 0 7 0 1 1 0 1 0
SP Ballygawley 0 9 1 0 1 0 1 0
SP Bansha 0 13 3 0 3 0 1 0
SP Brittas 0 13 2 1 1 1 2 0
SP Derryhogan 1 6 4 1 3 0 2 0
SP Gortnagowna 0 5 2 2 2 0 0 0
SP Torc 0 5 2 2 0 0 1 0
SS Ballygawley 0 7 1 3 2 0 1 0
SS Bohatch 0 4 3 0 0 0 1 0
SS Chevy chaseM
0 7 0 0 0 0 1 0
SS Chevy chaseY
0 4 1 1 2 0 0 0
SS Cloonagh 0 1 0 0 1 0 0 0
SS Dooary 0 3 0 0 1 0 1 0
SS Moneyteige 0 1 0 0 0 0 1 0
SS Quitrent 0 7 0 0 0 0 2 0
SS Stanahely 0 3 1 0 1 0 0 0
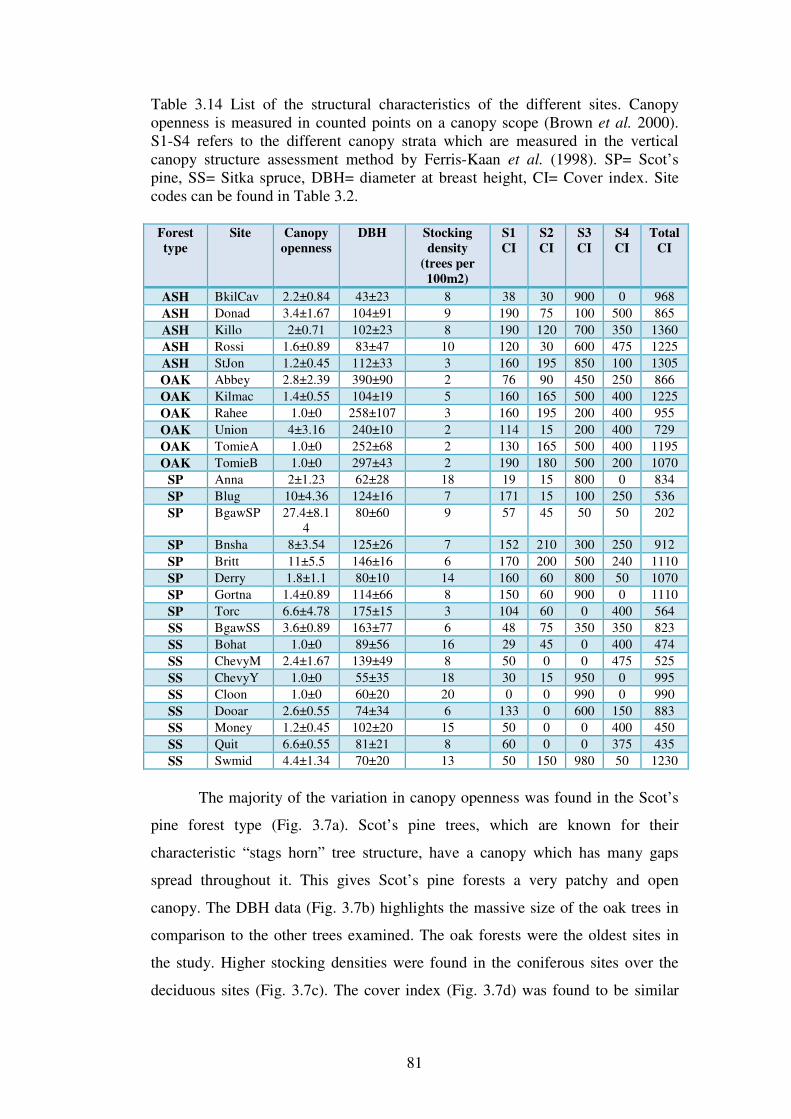
81
Table 3.14 List of the structural characteristics of the different sites. Canopy openness is measured in counted points on a canopy scope (Brown et al. 2000). S1-S4 refers to the different canopy strata which are measured in the vertical canopy structure assessment method by Ferris-Kaan et al. (1998). SP= Scot’s pine, SS= Sitka spruce, DBH= diameter at breast height, CI= Cover index. Site codes can be found in Table 3.2. Forest
type
Site Canopy
openness
DBH Stocking
density
(trees per
100m2)
S1
CI
S2
CI
S3
CI
S4
CI
Total
CI
ASH BkilCav 2.2±0.84 43±23 8 38 30 900 0 968
ASH Donad 3.4±1.67 104±91 9 190 75 100 500 865
ASH Killo 2±0.71 102±23 8 190 120 700 350 1360
ASH Rossi 1.6±0.89 83±47 10 120 30 600 475 1225
ASH StJon 1.2±0.45 112±33 3 160 195 850 100 1305
OAK Abbey 2.8±2.39 390±90 2 76 90 450 250 866
OAK Kilmac 1.4±0.55 104±19 5 160 165 500 400 1225
OAK Rahee 1.0±0 258±107 3 160 195 200 400 955
OAK Union 4±3.16 240±10 2 114 15 200 400 729
OAK TomieA 1.0±0 252±68 2 130 165 500 400 1195
OAK TomieB 1.0±0 297±43 2 190 180 500 200 1070
SP Anna 2±1.23 62±28 18 19 15 800 0 834
SP Blug 10±4.36 124±16 7 171 15 100 250 536
SP BgawSP 27.4±8.14
80±60 9 57 45 50 50 202
SP Bnsha 8±3.54 125±26 7 152 210 300 250 912
SP Britt 11±5.5 146±16 6 170 200 500 240 1110
SP Derry 1.8±1.1 80±10 14 160 60 800 50 1070
SP Gortna 1.4±0.89 114±66 8 150 60 900 0 1110
SP Torc 6.6±4.78 175±15 3 104 60 0 400 564
SS BgawSS 3.6±0.89 163±77 6 48 75 350 350 823
SS Bohat 1.0±0 89±56 16 29 45 0 400 474
SS ChevyM 2.4±1.67 139±49 8 50 0 0 475 525
SS ChevyY 1.0±0 55±35 18 30 15 950 0 995
SS Cloon 1.0±0 60±20 20 0 0 990 0 990
SS Dooar 2.6±0.55 74±34 6 133 0 600 150 883
SS Money 1.2±0.45 102±20 15 50 0 0 400 450
SS Quit 6.6±0.55 81±21 8 60 0 0 375 435
SS Swmid 4.4±1.34 70±20 13 50 150 980 50 1230
The majority of the variation in canopy openness was found in the Scot’s
pine forest type (Fig. 3.7a). Scot’s pine trees, which are known for their
characteristic “stags horn” tree structure, have a canopy which has many gaps
spread throughout it. This gives Scot’s pine forests a very patchy and open
canopy. The DBH data (Fig. 3.7b) highlights the massive size of the oak trees in
comparison to the other trees examined. The oak forests were the oldest sites in
the study. Higher stocking densities were found in the coniferous sites over the
deciduous sites (Fig. 3.7c). The cover index (Fig. 3.7d) was found to be similar
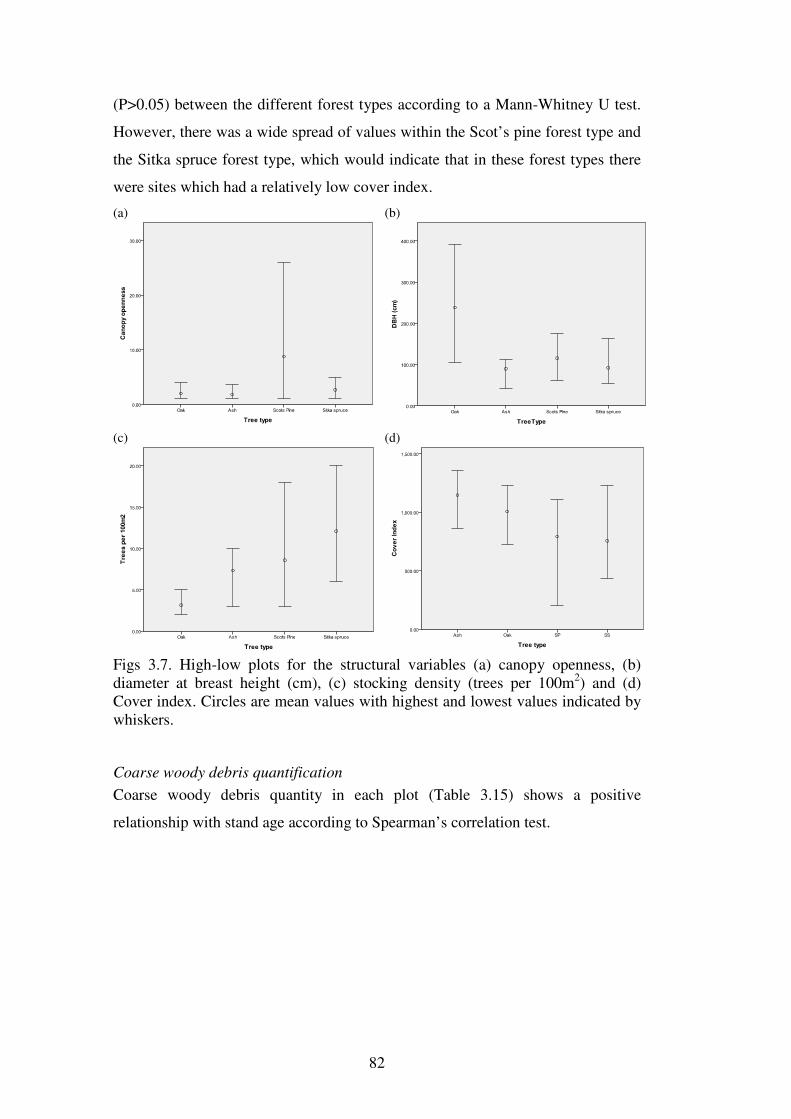
82
(P>0.05) between the different forest types according to a Mann-Whitney U test.
However, there was a wide spread of values within the Scot’s pine forest type and
the Sitka spruce forest type, which would indicate that in these forest types there
were sites which had a relatively low cover index.
(a)
(b)
(c)
(d)
Figs 3.7. High-low plots for the structural variables (a) canopy openness, (b) diameter at breast height (cm), (c) stocking density (trees per 100m2) and (d) Cover index. Circles are mean values with highest and lowest values indicated by whiskers.
Coarse woody debris quantification
Coarse woody debris quantity in each plot (Table 3.15) shows a positive
relationship with stand age according to Spearman’s correlation test.
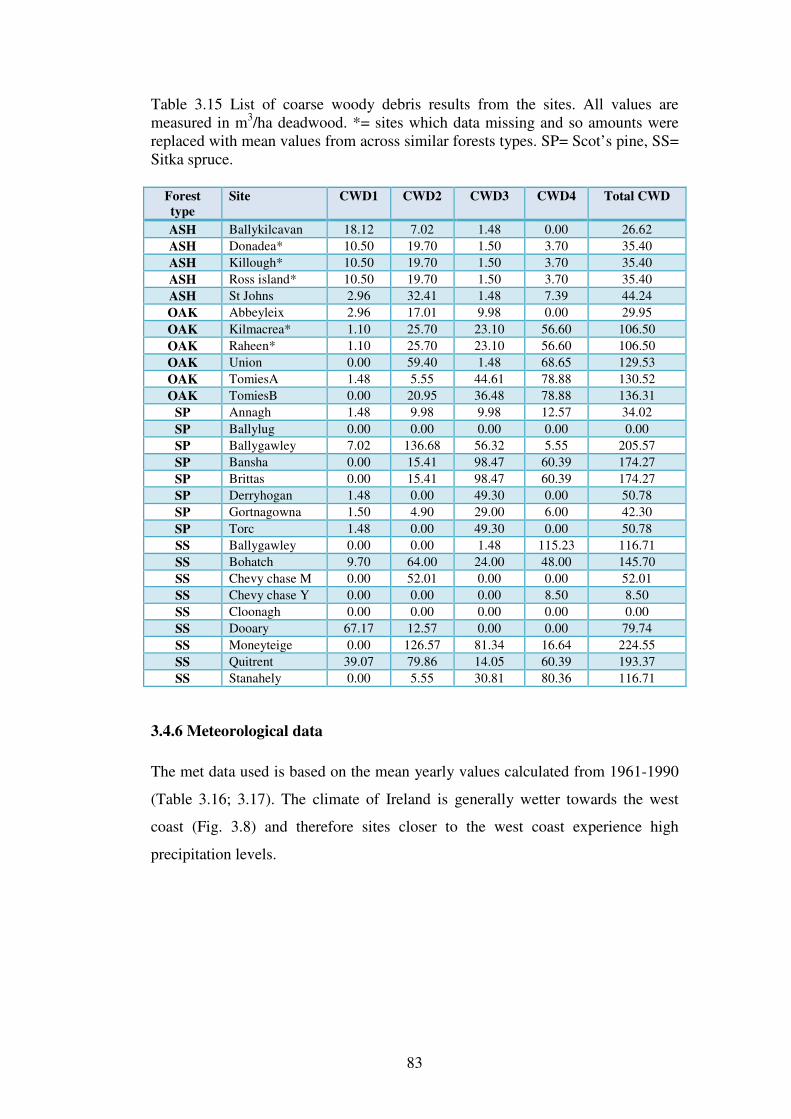
83
Table 3.15 List of coarse woody debris results from the sites. All values are measured in m3/ha deadwood. *= sites which data missing and so amounts were replaced with mean values from across similar forests types. SP= Scot’s pine, SS= Sitka spruce.
Forest
type
Site CWD1 CWD2 CWD3 CWD4 Total CWD
ASH Ballykilcavan 18.12 7.02 1.48 0.00 26.62
ASH Donadea* 10.50 19.70 1.50 3.70 35.40
ASH Killough* 10.50 19.70 1.50 3.70 35.40
ASH Ross island* 10.50 19.70 1.50 3.70 35.40
ASH St Johns 2.96 32.41 1.48 7.39 44.24
OAK Abbeyleix 2.96 17.01 9.98 0.00 29.95
OAK Kilmacrea* 1.10 25.70 23.10 56.60 106.50
OAK Raheen* 1.10 25.70 23.10 56.60 106.50
OAK Union 0.00 59.40 1.48 68.65 129.53
OAK TomiesA 1.48 5.55 44.61 78.88 130.52
OAK TomiesB 0.00 20.95 36.48 78.88 136.31
SP Annagh 1.48 9.98 9.98 12.57 34.02
SP Ballylug 0.00 0.00 0.00 0.00 0.00
SP Ballygawley 7.02 136.68 56.32 5.55 205.57
SP Bansha 0.00 15.41 98.47 60.39 174.27
SP Brittas 0.00 15.41 98.47 60.39 174.27
SP Derryhogan 1.48 0.00 49.30 0.00 50.78
SP Gortnagowna 1.50 4.90 29.00 6.00 42.30
SP Torc 1.48 0.00 49.30 0.00 50.78
SS Ballygawley 0.00 0.00 1.48 115.23 116.71
SS Bohatch 9.70 64.00 24.00 48.00 145.70
SS Chevy chase M 0.00 52.01 0.00 0.00 52.01
SS Chevy chase Y 0.00 0.00 0.00 8.50 8.50
SS Cloonagh 0.00 0.00 0.00 0.00 0.00
SS Dooary 67.17 12.57 0.00 0.00 79.74
SS Moneyteige 0.00 126.57 81.34 16.64 224.55
SS Quitrent 39.07 79.86 14.05 60.39 193.37
SS Stanahely 0.00 5.55 30.81 80.36 116.71
3.4.6 Meteorological data
The met data used is based on the mean yearly values calculated from 1961-1990
(Table 3.16; 3.17). The climate of Ireland is generally wetter towards the west
coast (Fig. 3.8) and therefore sites closer to the west coast experience high
precipitation levels.
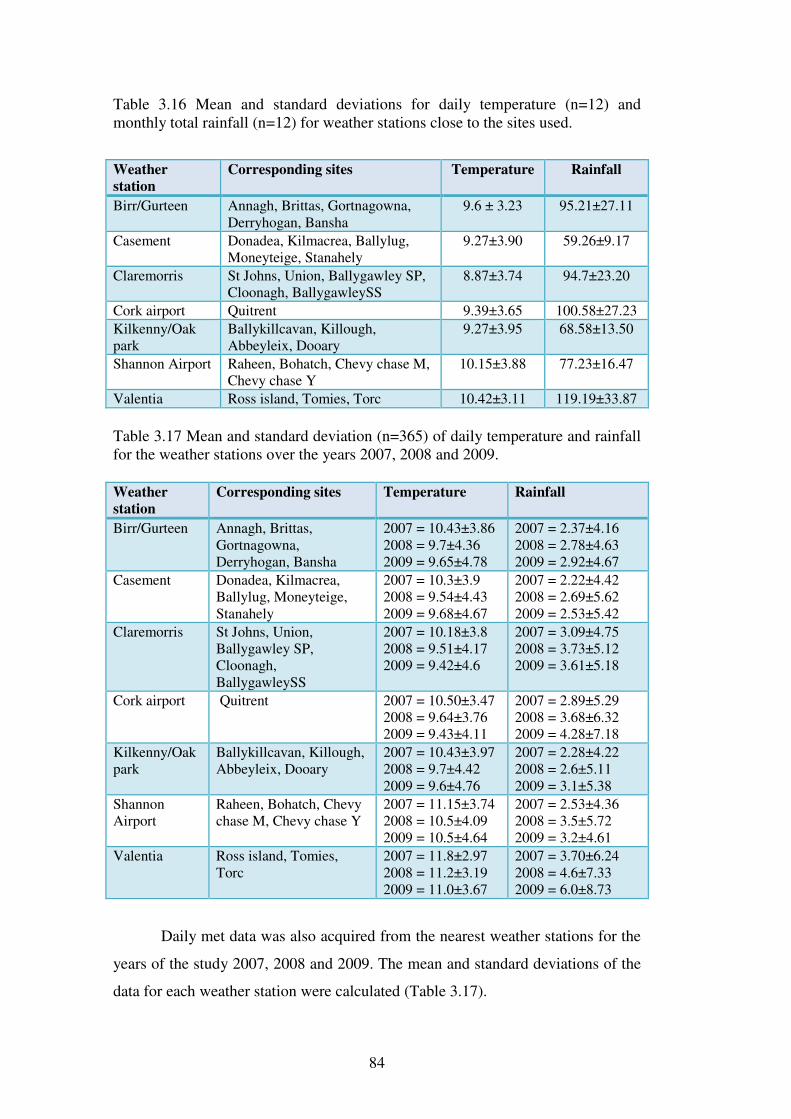
84
Table 3.16 Mean and standard deviations for daily temperature (n=12) and monthly total rainfall (n=12) for weather stations close to the sites used.
Weather
station
Corresponding sites Temperature Rainfall
Birr/Gurteen Annagh, Brittas, Gortnagowna, Derryhogan, Bansha
9.6 ± 3.23 95.21±27.11
Casement Donadea, Kilmacrea, Ballylug, Moneyteige, Stanahely
9.27±3.90 59.26±9.17
Claremorris St Johns, Union, Ballygawley SP, Cloonagh, BallygawleySS
8.87±3.74 94.7±23.20
Cork airport Quitrent 9.39±3.65 100.58±27.23
Kilkenny/Oak park
Ballykillcavan, Killough, Abbeyleix, Dooary
9.27±3.95 68.58±13.50
Shannon Airport Raheen, Bohatch, Chevy chase M, Chevy chase Y
10.15±3.88 77.23±16.47
Valentia Ross island, Tomies, Torc 10.42±3.11 119.19±33.87
Table 3.17 Mean and standard deviation (n=365) of daily temperature and rainfall for the weather stations over the years 2007, 2008 and 2009. Weather
station
Corresponding sites Temperature Rainfall
Birr/Gurteen Annagh, Brittas, Gortnagowna, Derryhogan, Bansha
2007 = 10.43±3.86 2008 = 9.7±4.36 2009 = 9.65±4.78
2007 = 2.37±4.16 2008 = 2.78±4.63 2009 = 2.92±4.67
Casement Donadea, Kilmacrea, Ballylug, Moneyteige, Stanahely
2007 = 10.3±3.9 2008 = 9.54±4.43 2009 = 9.68±4.67
2007 = 2.22±4.42 2008 = 2.69±5.62 2009 = 2.53±5.42
Claremorris St Johns, Union, Ballygawley SP, Cloonagh, BallygawleySS
2007 = 10.18±3.8 2008 = 9.51±4.17 2009 = 9.42±4.6
2007 = 3.09±4.75 2008 = 3.73±5.12 2009 = 3.61±5.18
Cork airport Quitrent 2007 = 10.50±3.47 2008 = 9.64±3.76 2009 = 9.43±4.11
2007 = 2.89±5.29 2008 = 3.68±6.32 2009 = 4.28±7.18
Kilkenny/Oak park
Ballykillcavan, Killough, Abbeyleix, Dooary
2007 = 10.43±3.97 2008 = 9.7±4.42 2009 = 9.6±4.76
2007 = 2.28±4.22 2008 = 2.6±5.11 2009 = 3.1±5.38
Shannon Airport
Raheen, Bohatch, Chevy chase M, Chevy chase Y
2007 = 11.15±3.74 2008 = 10.5±4.09 2009 = 10.5±4.64
2007 = 2.53±4.36 2008 = 3.5±5.72 2009 = 3.2±4.61
Valentia Ross island, Tomies, Torc
2007 = 11.8±2.97 2008 = 11.2±3.19 2009 = 11.0±3.67
2007 = 3.70±6.24 2008 = 4.6±7.33 2009 = 6.0±8.73
Daily met data was also acquired from the nearest weather stations for the
years of the study 2007, 2008 and 2009. The mean and standard deviations of the
data for each weather station were calculated (Table 3.17).
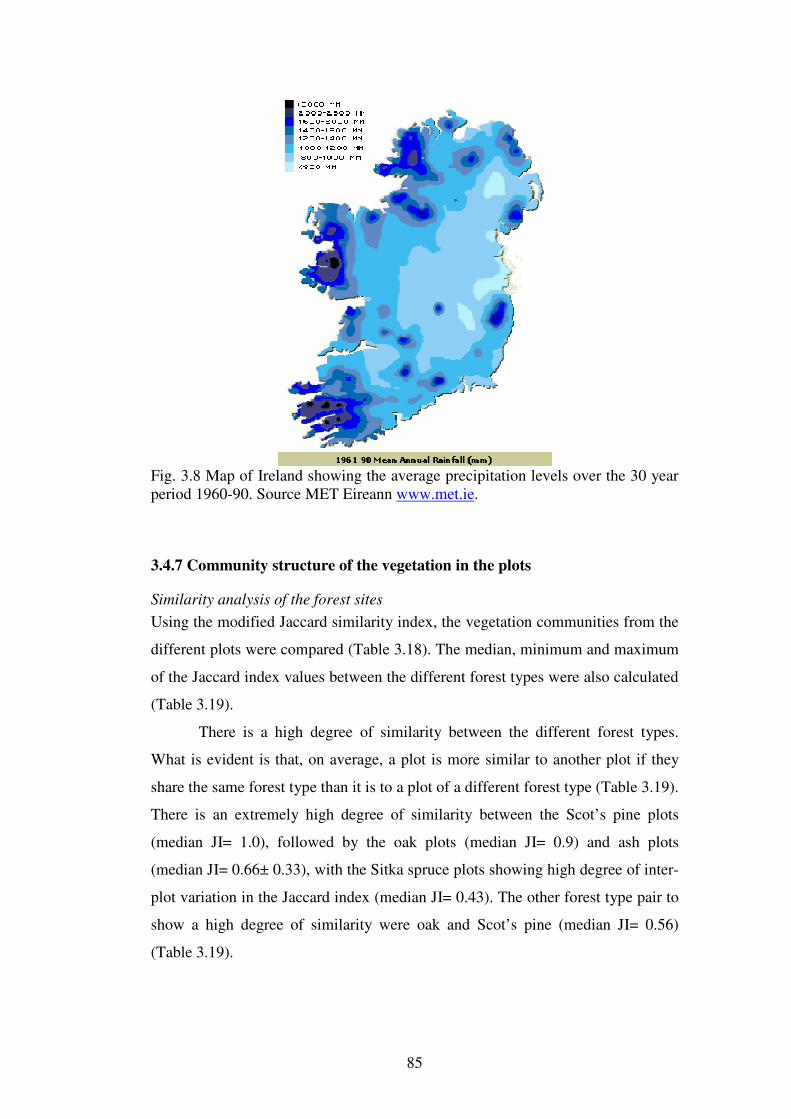
85
Fig. 3.8 Map of Ireland showing the average precipitation levels over the 30 year period 1960-90. Source MET Eireann www.met.ie.
3.4.7 Community structure of the vegetation in the plots
Similarity analysis of the forest sites
Using the modified Jaccard similarity index, the vegetation communities from the
different plots were compared (Table 3.18). The median, minimum and maximum
of the Jaccard index values between the different forest types were also calculated
(Table 3.19).
There is a high degree of similarity between the different forest types.
What is evident is that, on average, a plot is more similar to another plot if they
share the same forest type than it is to a plot of a different forest type (Table 3.19).
There is an extremely high degree of similarity between the Scot’s pine plots
(median JI= 1.0), followed by the oak plots (median JI= 0.9) and ash plots
(median JI= 0.66± 0.33), with the Sitka spruce plots showing high degree of inter-
plot variation in the Jaccard index (median JI= 0.43). The other forest type pair to
show a high degree of similarity were oak and Scot’s pine (median JI= 0.56)
(Table 3.19).

86
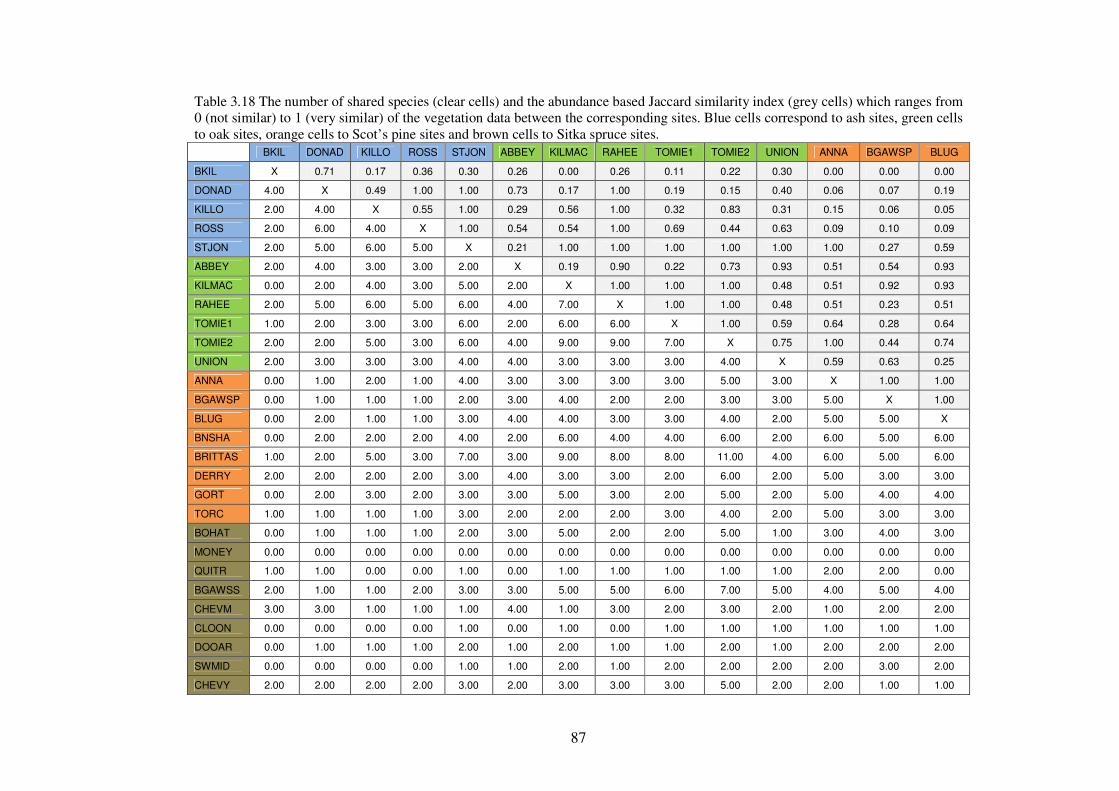
87
Table 3.18 The number of shared species (clear cells) and the abundance based Jaccard similarity index (grey cells) which ranges from 0 (not similar) to 1 (very similar) of the vegetation data between the corresponding sites. Blue cells correspond to ash sites, green cells to oak sites, orange cells to Scot’s pine sites and brown cells to Sitka spruce sites.
BKIL DONAD KILLO ROSS STJON ABBEY KILMAC RAHEE TOMIE1 TOMIE2 UNION ANNA BGAWSP BLUG
BKIL X 0.71 0.17 0.36 0.30 0.26 0.00 0.26 0.11 0.22 0.30 0.00 0.00 0.00
DONAD 4.00 X 0.49 1.00 1.00 0.73 0.17 1.00 0.19 0.15 0.40 0.06 0.07 0.19
KILLO 2.00 4.00 X 0.55 1.00 0.29 0.56 1.00 0.32 0.83 0.31 0.15 0.06 0.05
ROSS 2.00 6.00 4.00 X 1.00 0.54 0.54 1.00 0.69 0.44 0.63 0.09 0.10 0.09
STJON 2.00 5.00 6.00 5.00 X 0.21 1.00 1.00 1.00 1.00 1.00 1.00 0.27 0.59
ABBEY 2.00 4.00 3.00 3.00 2.00 X 0.19 0.90 0.22 0.73 0.93 0.51 0.54 0.93
KILMAC 0.00 2.00 4.00 3.00 5.00 2.00 X 1.00 1.00 1.00 0.48 0.51 0.92 0.93
RAHEE 2.00 5.00 6.00 5.00 6.00 4.00 7.00 X 1.00 1.00 0.48 0.51 0.23 0.51
TOMIE1 1.00 2.00 3.00 3.00 6.00 2.00 6.00 6.00 X 1.00 0.59 0.64 0.28 0.64
TOMIE2 2.00 2.00 5.00 3.00 6.00 4.00 9.00 9.00 7.00 X 0.75 1.00 0.44 0.74
UNION 2.00 3.00 3.00 3.00 4.00 4.00 3.00 3.00 3.00 4.00 X 0.59 0.63 0.25
ANNA 0.00 1.00 2.00 1.00 4.00 3.00 3.00 3.00 3.00 5.00 3.00 X 1.00 1.00
BGAWSP 0.00 1.00 1.00 1.00 2.00 3.00 4.00 2.00 2.00 3.00 3.00 5.00 X 1.00
BLUG 0.00 2.00 1.00 1.00 3.00 4.00 4.00 3.00 3.00 4.00 2.00 5.00 5.00 X
BNSHA 0.00 2.00 2.00 2.00 4.00 2.00 6.00 4.00 4.00 6.00 2.00 6.00 5.00 6.00
BRITTAS 1.00 2.00 5.00 3.00 7.00 3.00 9.00 8.00 8.00 11.00 4.00 6.00 5.00 6.00
DERRY 2.00 2.00 2.00 2.00 3.00 4.00 3.00 3.00 2.00 6.00 2.00 5.00 3.00 3.00
GORT 0.00 2.00 3.00 2.00 3.00 3.00 5.00 3.00 2.00 5.00 2.00 5.00 4.00 4.00
TORC 1.00 1.00 1.00 1.00 3.00 2.00 2.00 2.00 3.00 4.00 2.00 5.00 3.00 3.00
BOHAT 0.00 1.00 1.00 1.00 2.00 3.00 5.00 2.00 2.00 5.00 1.00 3.00 4.00 3.00
MONEY 0.00 0.00 0.00 0.00 0.00 0.00 0.00 0.00 0.00 0.00 0.00 0.00 0.00 0.00
QUITR 1.00 1.00 0.00 0.00 1.00 0.00 1.00 1.00 1.00 1.00 1.00 2.00 2.00 0.00
BGAWSS 2.00 1.00 1.00 2.00 3.00 3.00 5.00 5.00 6.00 7.00 5.00 4.00 5.00 4.00
CHEVM 3.00 3.00 1.00 1.00 1.00 4.00 1.00 3.00 2.00 3.00 2.00 1.00 2.00 2.00
CLOON 0.00 0.00 0.00 0.00 1.00 0.00 1.00 0.00 1.00 1.00 1.00 1.00 1.00 1.00
DOOAR 0.00 1.00 1.00 1.00 2.00 1.00 2.00 1.00 1.00 2.00 1.00 2.00 2.00 2.00
SWMID 0.00 0.00 0.00 0.00 1.00 1.00 2.00 1.00 2.00 2.00 2.00 2.00 3.00 2.00
CHEVY 2.00 2.00 2.00 2.00 3.00 2.00 3.00 3.00 3.00 5.00 2.00 2.00 1.00 1.00

88
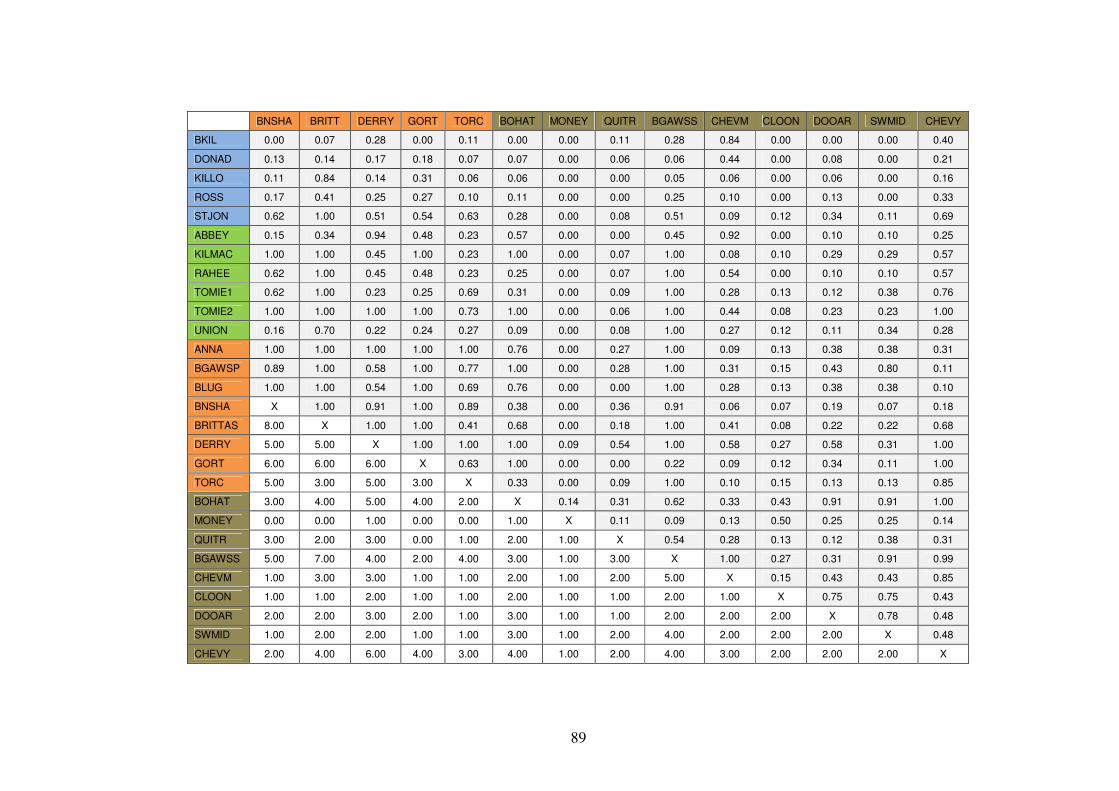
89
BNSHA BRITT DERRY GORT TORC BOHAT MONEY QUITR BGAWSS CHEVM CLOON DOOAR SWMID CHEVY
BKIL 0.00 0.07 0.28 0.00 0.11 0.00 0.00 0.11 0.28 0.84 0.00 0.00 0.00 0.40
DONAD 0.13 0.14 0.17 0.18 0.07 0.07 0.00 0.06 0.06 0.44 0.00 0.08 0.00 0.21
KILLO 0.11 0.84 0.14 0.31 0.06 0.06 0.00 0.00 0.05 0.06 0.00 0.06 0.00 0.16
ROSS 0.17 0.41 0.25 0.27 0.10 0.11 0.00 0.00 0.25 0.10 0.00 0.13 0.00 0.33
STJON 0.62 1.00 0.51 0.54 0.63 0.28 0.00 0.08 0.51 0.09 0.12 0.34 0.11 0.69
ABBEY 0.15 0.34 0.94 0.48 0.23 0.57 0.00 0.00 0.45 0.92 0.00 0.10 0.10 0.25
KILMAC 1.00 1.00 0.45 1.00 0.23 1.00 0.00 0.07 1.00 0.08 0.10 0.29 0.29 0.57
RAHEE 0.62 1.00 0.45 0.48 0.23 0.25 0.00 0.07 1.00 0.54 0.00 0.10 0.10 0.57
TOMIE1 0.62 1.00 0.23 0.25 0.69 0.31 0.00 0.09 1.00 0.28 0.13 0.12 0.38 0.76
TOMIE2 1.00 1.00 1.00 1.00 0.73 1.00 0.00 0.06 1.00 0.44 0.08 0.23 0.23 1.00
UNION 0.16 0.70 0.22 0.24 0.27 0.09 0.00 0.08 1.00 0.27 0.12 0.11 0.34 0.28
ANNA 1.00 1.00 1.00 1.00 1.00 0.76 0.00 0.27 1.00 0.09 0.13 0.38 0.38 0.31
BGAWSP 0.89 1.00 0.58 1.00 0.77 1.00 0.00 0.28 1.00 0.31 0.15 0.43 0.80 0.11
BLUG 1.00 1.00 0.54 1.00 0.69 0.76 0.00 0.00 1.00 0.28 0.13 0.38 0.38 0.10
BNSHA X 1.00 0.91 1.00 0.89 0.38 0.00 0.36 0.91 0.06 0.07 0.19 0.07 0.18
BRITTAS 8.00 X 1.00 1.00 0.41 0.68 0.00 0.18 1.00 0.41 0.08 0.22 0.22 0.68
DERRY 5.00 5.00 X 1.00 1.00 1.00 0.09 0.54 1.00 0.58 0.27 0.58 0.31 1.00
GORT 6.00 6.00 6.00 X 0.63 1.00 0.00 0.00 0.22 0.09 0.12 0.34 0.11 1.00
TORC 5.00 3.00 5.00 3.00 X 0.33 0.00 0.09 1.00 0.10 0.15 0.13 0.13 0.85
BOHAT 3.00 4.00 5.00 4.00 2.00 X 0.14 0.31 0.62 0.33 0.43 0.91 0.91 1.00
MONEY 0.00 0.00 1.00 0.00 0.00 1.00 X 0.11 0.09 0.13 0.50 0.25 0.25 0.14
QUITR 3.00 2.00 3.00 0.00 1.00 2.00 1.00 X 0.54 0.28 0.13 0.12 0.38 0.31
BGAWSS 5.00 7.00 4.00 2.00 4.00 3.00 1.00 3.00 X 1.00 0.27 0.31 0.91 0.99
CHEVM 1.00 3.00 3.00 1.00 1.00 2.00 1.00 2.00 5.00 X 0.15 0.43 0.43 0.85
CLOON 1.00 1.00 2.00 1.00 1.00 2.00 1.00 1.00 2.00 1.00 X 0.75 0.75 0.43
DOOAR 2.00 2.00 3.00 2.00 1.00 3.00 1.00 1.00 2.00 2.00 2.00 X 0.78 0.48
SWMID 1.00 2.00 2.00 1.00 1.00 3.00 1.00 2.00 4.00 2.00 2.00 2.00 X 0.48
CHEVY 2.00 4.00 6.00 4.00 3.00 4.00 1.00 2.00 4.00 3.00 2.00 2.00 2.00 X

90
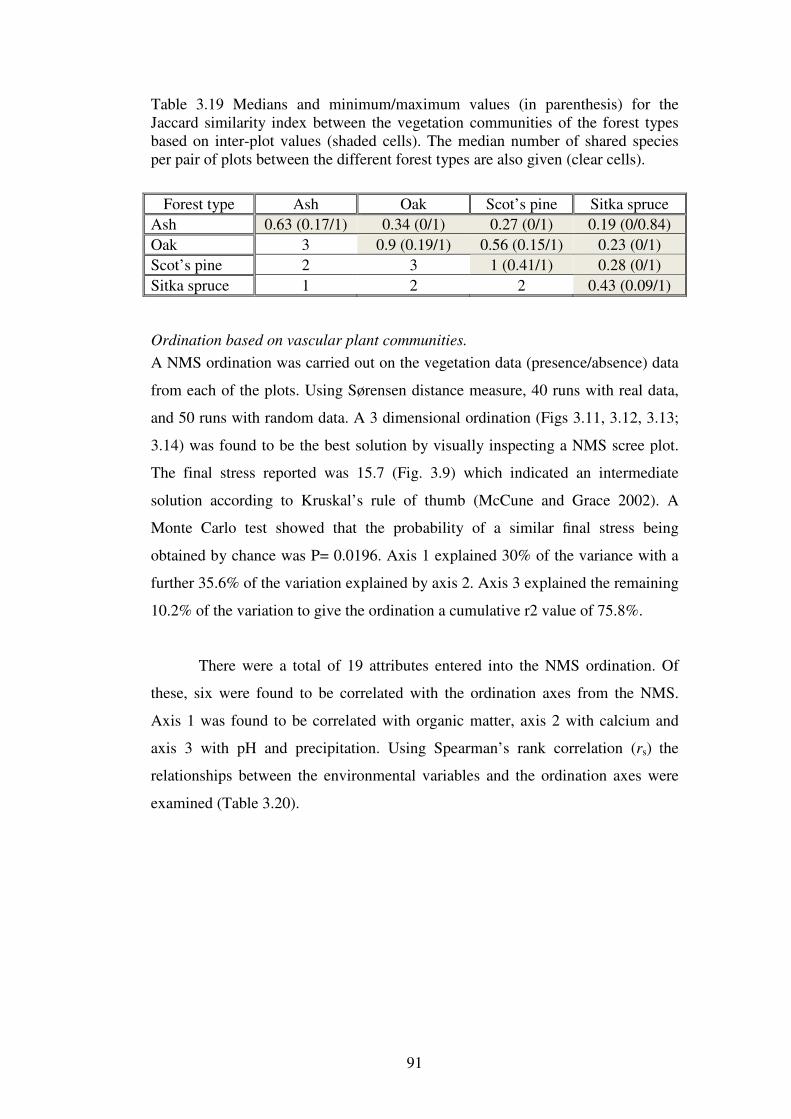
91
Table 3.19 Medians and minimum/maximum values (in parenthesis) for the Jaccard similarity index between the vegetation communities of the forest types based on inter-plot values (shaded cells). The median number of shared species per pair of plots between the different forest types are also given (clear cells).
Forest type Ash Oak Scot’s pine Sitka spruce
Ash 0.63 (0.17/1) 0.34 (0/1) 0.27 (0/1) 0.19 (0/0.84)
Oak 3 0.9 (0.19/1) 0.56 (0.15/1) 0.23 (0/1)
Scot’s pine 2 3 1 (0.41/1) 0.28 (0/1)
Sitka spruce 1 2 2 0.43 (0.09/1)
Ordination based on vascular plant communities.
A NMS ordination was carried out on the vegetation data (presence/absence) data
from each of the plots. Using Sørensen distance measure, 40 runs with real data,
and 50 runs with random data. A 3 dimensional ordination (Figs 3.11, 3.12, 3.13;
3.14) was found to be the best solution by visually inspecting a NMS scree plot.
The final stress reported was 15.7 (Fig. 3.9) which indicated an intermediate
solution according to Kruskal’s rule of thumb (McCune and Grace 2002). A
Monte Carlo test showed that the probability of a similar final stress being
obtained by chance was P= 0.0196. Axis 1 explained 30% of the variance with a
further 35.6% of the variation explained by axis 2. Axis 3 explained the remaining
10.2% of the variation to give the ordination a cumulative r2 value of 75.8%.
There were a total of 19 attributes entered into the NMS ordination. Of
these, six were found to be correlated with the ordination axes from the NMS.
Axis 1 was found to be correlated with organic matter, axis 2 with calcium and
axis 3 with pH and precipitation. Using Spearman’s rank correlation (rs) the
relationships between the environmental variables and the ordination axes were
examined (Table 3.20).
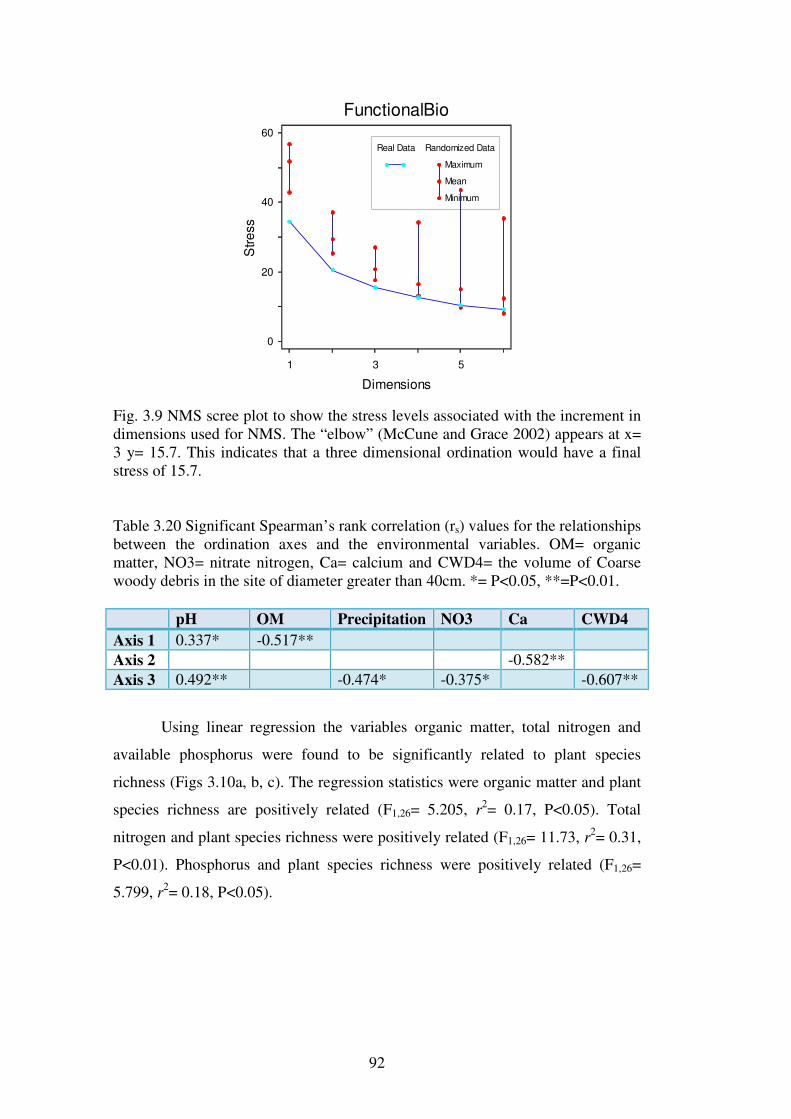
92
0
20
40
60
1 3 5
FunctionalBio
Dimensions
Stre
ss
Randomized Data
Maximum
Mean
Minimum
Real Data
Fig. 3.9 NMS scree plot to show the stress levels associated with the increment in dimensions used for NMS. The “elbow” (McCune and Grace 2002) appears at x= 3 y= 15.7. This indicates that a three dimensional ordination would have a final stress of 15.7. Table 3.20 Significant Spearman’s rank correlation (rs) values for the relationships between the ordination axes and the environmental variables. OM= organic matter, NO3= nitrate nitrogen, Ca= calcium and CWD4= the volume of Coarse woody debris in the site of diameter greater than 40cm. *= P<0.05, **=P<0.01.
pH OM Precipitation NO3 Ca CWD4
Axis 1 0.337* -0.517**
Axis 2 -0.582**
Axis 3 0.492** -0.474* -0.375* -0.607**
Using linear regression the variables organic matter, total nitrogen and
available phosphorus were found to be significantly related to plant species
richness (Figs 3.10a, b, c). The regression statistics were organic matter and plant
species richness are positively related (F1,26= 5.205, r2= 0.17, P<0.05). Total
nitrogen and plant species richness were positively related (F1,26= 11.73, r2= 0.31,
P<0.01). Phosphorus and plant species richness were positively related (F1,26=
5.799, r2= 0.18, P<0.05).
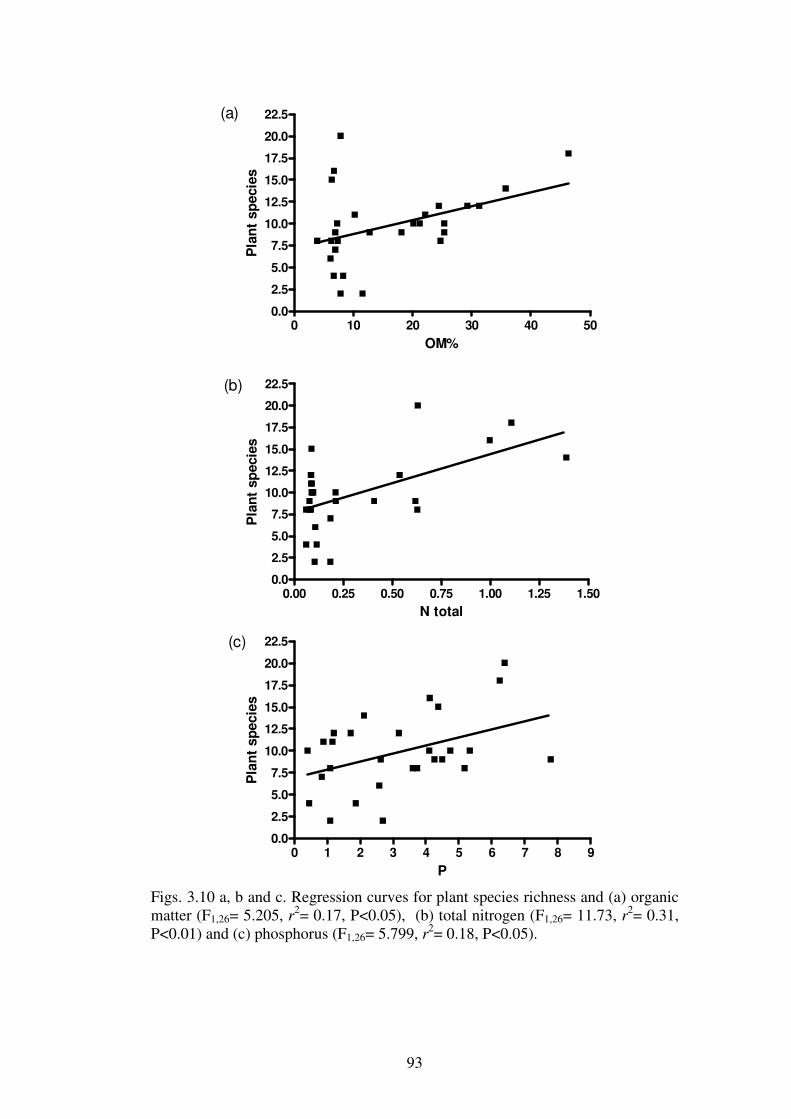
93
0 10 20 30 40 500.0
2.5
5.0
7.5
10.0
12.5
15.0
17.5
20.0
22.5
OM%
Pla
nt
sp
ecie
s
0.00 0.25 0.50 0.75 1.00 1.25 1.500.0
2.5
5.0
7.5
10.0
12.5
15.0
17.5
20.0
22.5
N total
Pla
nt
sp
ecie
s
0 1 2 3 4 5 6 7 8 90.0
2.5
5.0
7.5
10.0
12.5
15.0
17.5
20.0
22.5
P
Pla
nt
sp
ecie
s
(a)
(b)
(c)
Figs. 3.10 a, b and c. Regression curves for plant species richness and (a) organic matter (F1,26= 5.205, r2= 0.17, P<0.05), (b) total nitrogen (F1,26= 11.73, r2= 0.31, P<0.01) and (c) phosphorus (F1,26= 5.799, r2= 0.18, P<0.05).

94
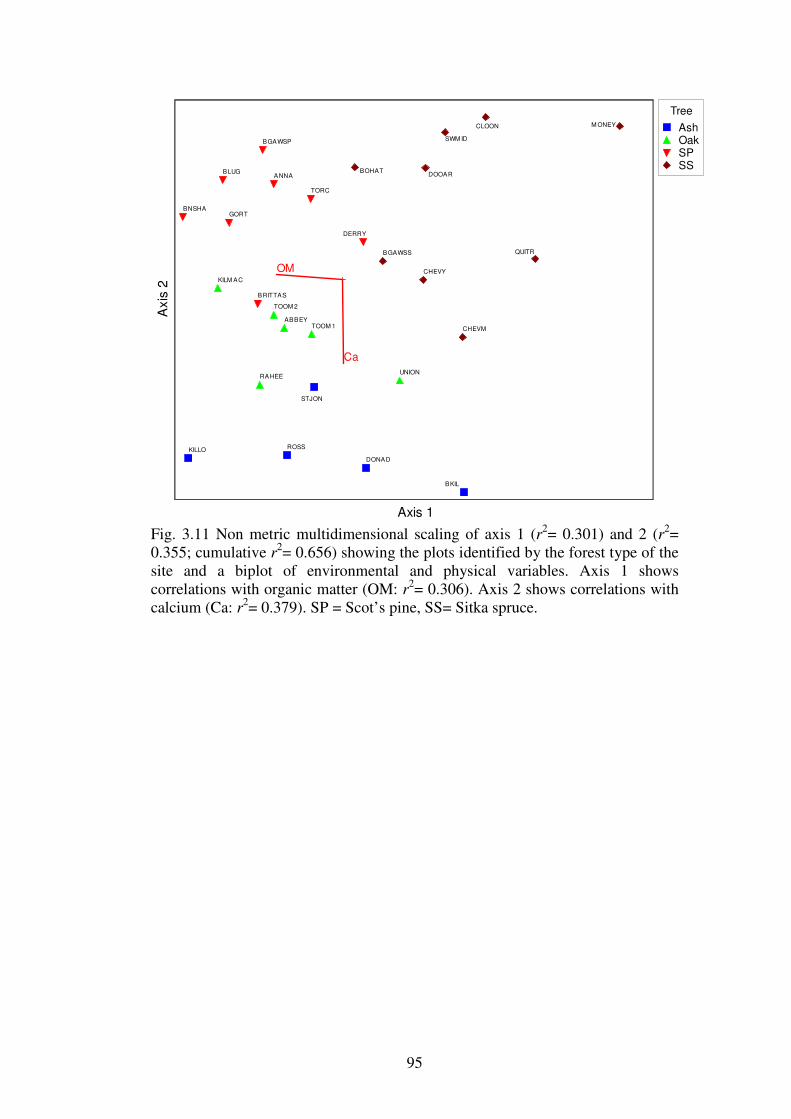
95
BKIL
DONAD
KILLO ROSS
STJON
ABBEY
KILM AC
RAHEE
TOOM 1
TOOM 2
UNION
ANNA
BGAWSP
BLUG
BNSHA
BRITTAS
DERRY
GORT
TORC
BOHAT
M ONEY
QUITRBGAWSS
CHEVM
CLOON
DOOAR
SWM ID
CHEVYOM
Ca
NMS ordination
Axis 1
Axi
s 2
Tree
AshOakSPSS
Fig. 3.11 Non metric multidimensional scaling of axis 1 (r2= 0.301) and 2 (r2= 0.355; cumulative r2= 0.656) showing the plots identified by the forest type of the site and a biplot of environmental and physical variables. Axis 1 shows correlations with organic matter (OM: r2= 0.306). Axis 2 shows correlations with calcium (Ca: r2= 0.379). SP = Scot’s pine, SS= Sitka spruce.

96
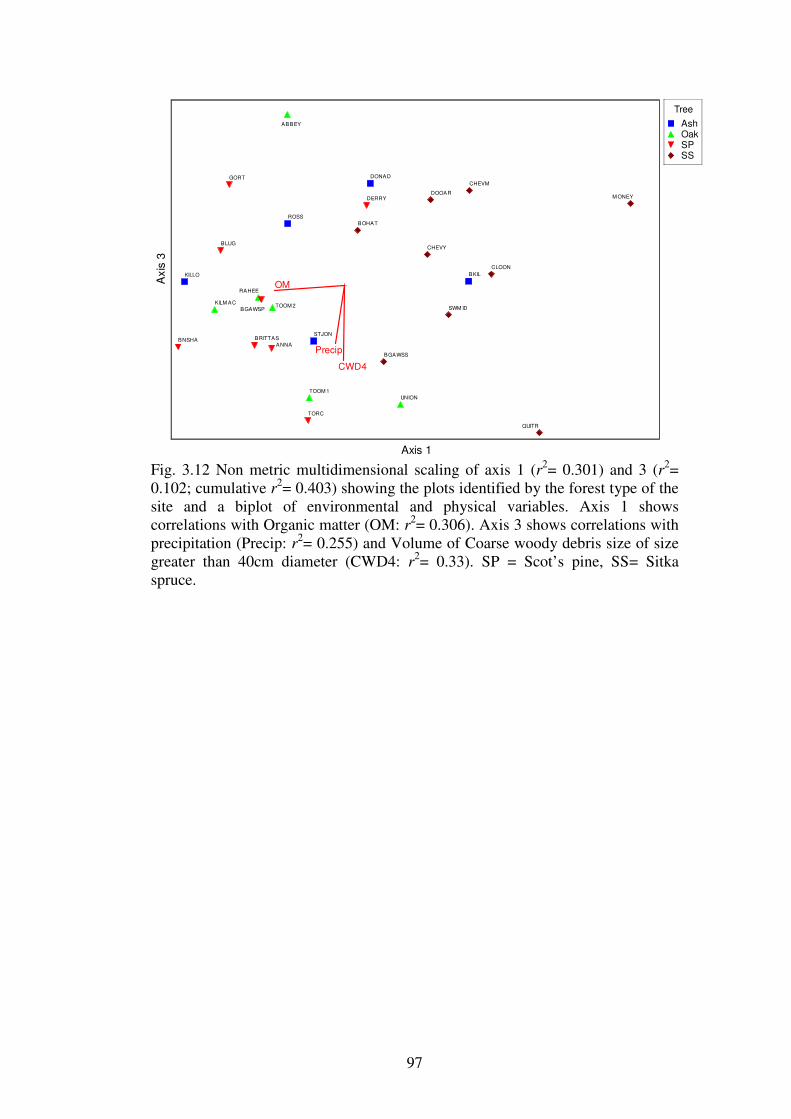
97
BKIL
DONAD
KILLO
ROSS
STJON
ABBEY
KILM AC
RAHEE
TOOM 1
TOOM 2
UNION
ANNA
BGAWSP
BLUG
BNSHA BRITTAS
DERRY
GORT
TORC
BOHAT
M ONEY
QUITR
BGAWSS
CHEVM
CLOON
DOOAR
SWM ID
CHEVY
OM
Precip
CWD4
NMS ordination
Axis 1
Axi
s 3
Tree
AshOakSPSS
Fig. 3.12 Non metric multidimensional scaling of axis 1 (r2= 0.301) and 3 (r2= 0.102; cumulative r2= 0.403) showing the plots identified by the forest type of the site and a biplot of environmental and physical variables. Axis 1 shows correlations with Organic matter (OM: r2= 0.306). Axis 3 shows correlations with precipitation (Precip: r2= 0.255) and Volume of Coarse woody debris size of size greater than 40cm diameter (CWD4: r
2= 0.33). SP = Scot’s pine, SS= Sitka spruce.

98
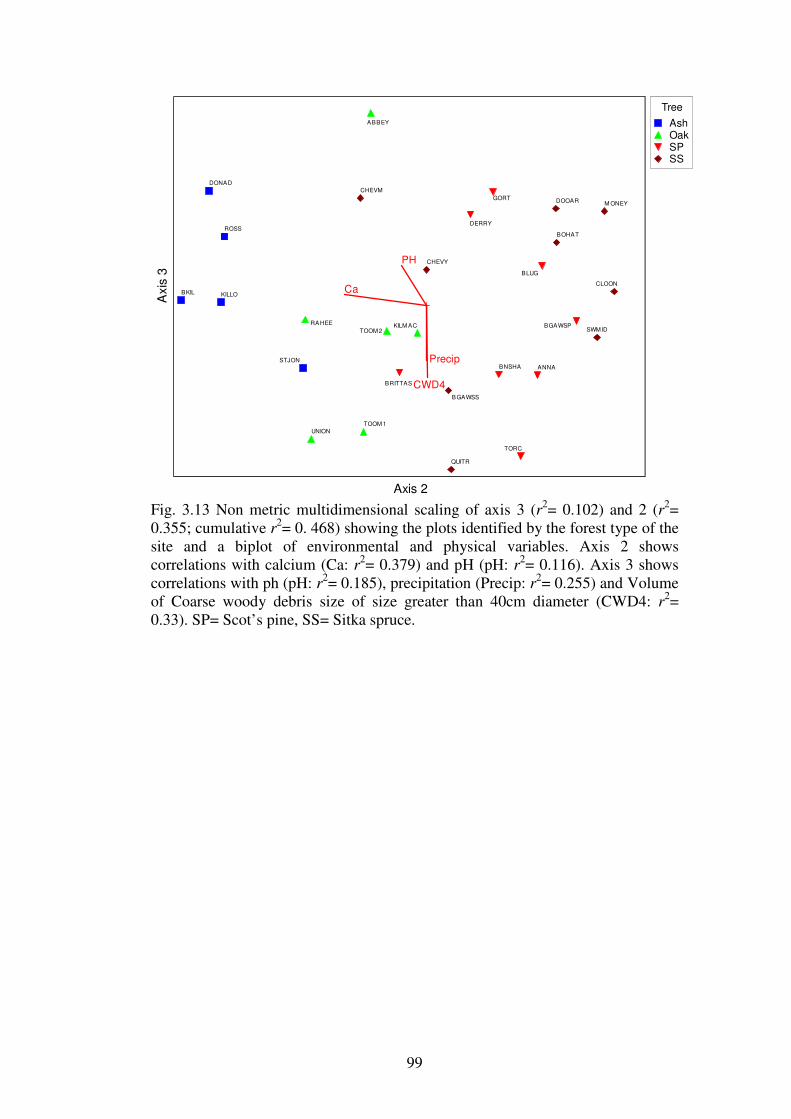
99
BKIL
DONAD
KILLO
ROSS
STJON
ABBEY
KILM ACRAHEE
TOOM 1
TOOM 2
UNION
ANNA
BGAWSP
BLUG
BNSHA
BRITTAS
DERRY
GORT
TORC
BOHAT
M ONEY
QUITR
BGAWSS
CHEVM
CLOON
DOOAR
SWM ID
CHEVYPH
Precip
Ca
CWD4
Axis 2
Axi
s 3
Tree
AshOakSPSS
Fig. 3.13 Non metric multidimensional scaling of axis 3 (r2= 0.102) and 2 (r2= 0.355; cumulative r2= 0. 468) showing the plots identified by the forest type of the site and a biplot of environmental and physical variables. Axis 2 shows correlations with calcium (Ca: r2= 0.379) and pH (pH: r2= 0.116). Axis 3 shows correlations with ph (pH: r2= 0.185), precipitation (Precip: r2= 0.255) and Volume of Coarse woody debris size of size greater than 40cm diameter (CWD4: r
2= 0.33). SP= Scot’s pine, SS= Sitka spruce.

100
101
The resulting ordination from axis 1 and 2 (Fig. 3.11) shows good separation
between the sites based on the forest type of the site. The correlation of axis 1 with
organic matter is useful in separating the sites as the Scot’s pine and oak sites had
higher OM content than the ash or the Sitka spruce. Axis 2 is useful in separating the
sites as it shows correlations with calcium. The ash sites were found to have more
calcium present than any other tree type. Two points to note are the grouping of the
Scot’s pine site Brittas with the oak sites, and the of the ash site at St John’s wood
with the oak sites. Both of these sites are relatively undisturbed sites which have rich
understory species richness. The site at Brittas has some oak trees in the understory
and so this has no doubt contributed to grouping this site in the oak grouping.
The resulting ordination using axes 1 and 3 (Fig. 3.12) does not show good
separation of the sites based on forest type. The correlation of axis 1 with organic
matter is useful in separating the Scot’s pine sites which normally had high OM%
from the ash and Sitka spruce sites.
The ordination showing axis 2 and 3 (Fig. 3.13) produces good separation of
the sites based on the forest type of the sites. The values for pH and calcium are very
useful in separating the sites, as ash sites had a very large calcium and hence pH
value. pH was useful in separating the usually low (~4) pH coniferous sites from the
medium to high pH (5-6) deciduous sites.
Indicator species analysis
To identify plant species which are indicative of the habitat examined in this project,
Indicator values for each species were calculated in PC-ORD using the method by
Dufrene and Legendre (1997) with statistical significance calculated by a Monte
Carlo test with 1000 runs. Eight species were found to be indicators of a specific
forest type (Table 3.21).
The results of the indicator species analysis show that Calluna vulgaris and
Pteridium aquilinum could be useful indicator species of Scot’s pine forests.
Crataegus monogyna could be a useful indicator species for ash habitats in Ireland.
Oak habitats would be indicated by the presence of Luzula sylvatica and Oxalis
acetosella. Sitka spruce habitats were not strongly indicated by the presence of any
plant species (Table 3.21).
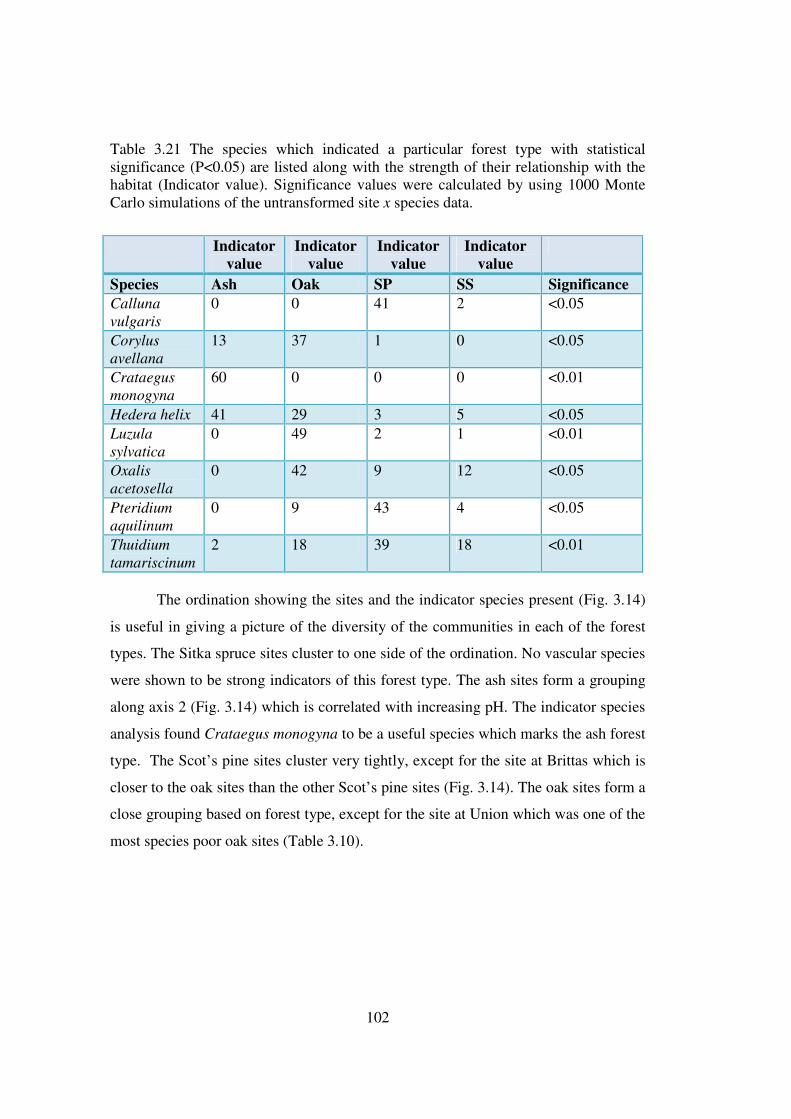
102
Table 3.21 The species which indicated a particular forest type with statistical significance (P<0.05) are listed along with the strength of their relationship with the habitat (Indicator value). Significance values were calculated by using 1000 Monte Carlo simulations of the untransformed site x species data.
Indicator
value
Indicator
value
Indicator
value
Indicator
value
Species Ash Oak SP SS Significance
Calluna
vulgaris
0 0 41 2 <0.05
Corylus
avellana
13 37 1 0 <0.05
Crataegus
monogyna
60 0 0 0 <0.01
Hedera helix 41 29 3 5 <0.05
Luzula
sylvatica
0 49 2 1 <0.01
Oxalis
acetosella
0 42 9 12 <0.05
Pteridium
aquilinum
0 9 43 4 <0.05
Thuidium
tamariscinum
2 18 39 18 <0.01
The ordination showing the sites and the indicator species present (Fig. 3.14)
is useful in giving a picture of the diversity of the communities in each of the forest
types. The Sitka spruce sites cluster to one side of the ordination. No vascular species
were shown to be strong indicators of this forest type. The ash sites form a grouping
along axis 2 (Fig. 3.14) which is correlated with increasing pH. The indicator species
analysis found Crataegus monogyna to be a useful species which marks the ash forest
type. The Scot’s pine sites cluster very tightly, except for the site at Brittas which is
closer to the oak sites than the other Scot’s pine sites (Fig. 3.14). The oak sites form a
close grouping based on forest type, except for the site at Union which was one of the
most species poor oak sites (Table 3.10).
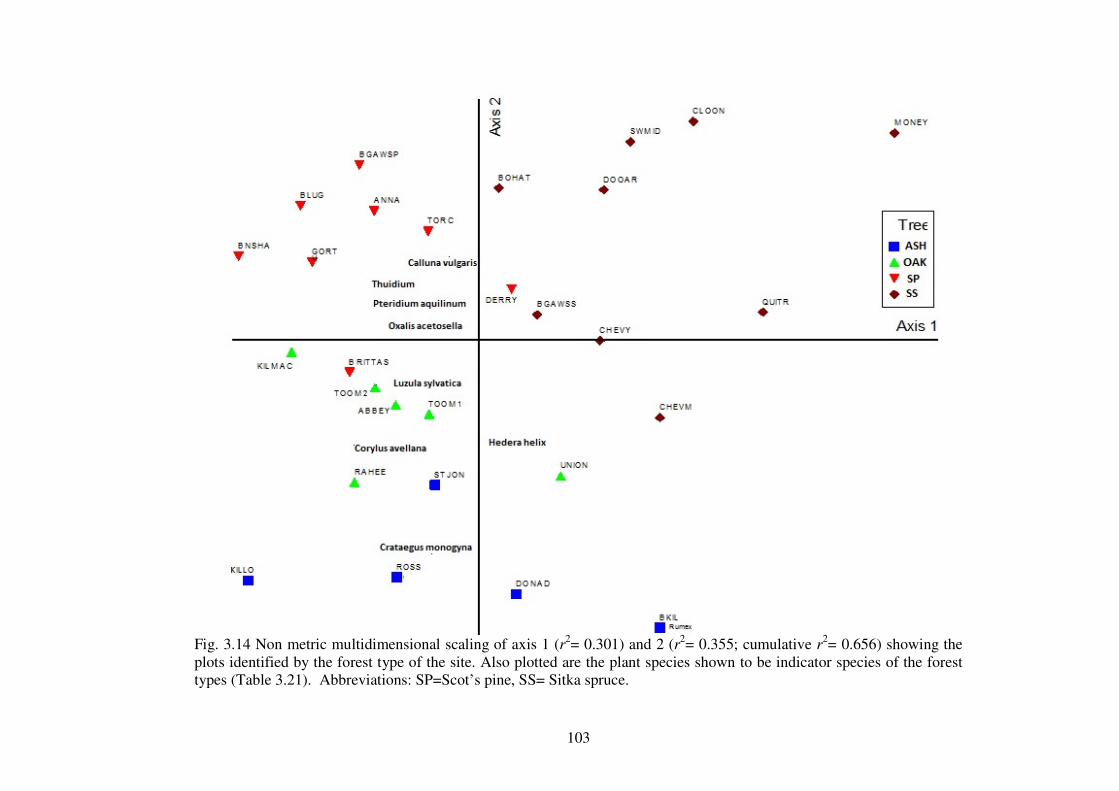
103
Fig. 3.14 Non metric multidimensional scaling of axis 1 (r2= 0.301) and 2 (r2= 0.355; cumulative r2= 0.656) showing the plots identified by the forest type of the site. Also plotted are the plant species shown to be indicator species of the forest types (Table 3.21). Abbreviations: SP=Scot’s pine, SS= Sitka spruce.

104
105
Multi response permutation procedure
Plant communities did differ significantly between forest types, and this was
confirmed by MRPP analysis (P<0.001, A=0.178). What this means is that sites
with the same forest type were grouped closer together in the ordination than was
expected by chance based on their plant communities. This analysis backs up the
ordination and community similarity analysis by confirming that the different
forest types have significantly different vascular plant communities.
3.4.8 Forest management related to plant species richness
Although the multivariate analysis showed that the forest types had significantly
different plant species communities, there was variation in the communities
between plots of the same forest type. Possible effects of forest structural and
management variables on plant species richness were examined using generalized
linear modelling.
The generalized linear model for oak found that the model explained a
significant amount of the variation between the oak forest plots (likelihood ratio
chi-square= 18.878, df=1, P<0.001). This means that the model explained
significantly more variation between the oak sites than the null model. The model
found that ungrazed oak plots had significantly higher plant species richness than
grazed plots (mean difference [ungrazed –grazed]= 0.187, df= 1, P<0.001).
In the ash forests the model was significant at describing the numbers of
species per plot visit (likelihood ratio chi-square= 43.837, df=3, P<0.001). It
found that vascular plant species richness per plot was much higher in un-
managed plots than in managed plots (mean difference [unmanaged–managed]=
0.654, df= 1, P=0.001).
In Scot’s pine forests, the model was significant at explaining the numbers
of plant species per plot visit (likelihood ratio chi-square= 8.723, df=2, P<0.05).
The model found that rotation stage was significant at explaining some of the
variation within the Scot’s pine plots with 2nd rotation plots having higher
vascular species richness per plot than 1st rotation plots (mean difference [2nd
rotation-1st rotation]= 0.35, df= 1, P<0.05). Age was not found to have a
significant effect on plant species richness.
106
The model describing the plant species richness in Sitka spruce forests was better
at explaining the variation in the dependent variable (litter decay species per plot
visit) than the null model (likelihood ratio chi-square= 43.728, df=2, P<0.001).
The model found that in Sitka spruce plots, age explained a significant proportion
of the variation between the vascular species richness of the Sitka spruce plots.
Mature spruce plots were found to have significantly higher plant species richness
than young plots (mean difference [Mature –young]= 0.6, df= 1, P<0.001).
107
3.5 Discussion
3.5.1 Significantly different plant communities across the four forest types
The analysis in this chapter has shown that there are distinctive plant communities
in each of the four forests types, and that these communities are significantly
different from each other. Previous studies in Irish native (Perrin et al. 2008) and
plantation forests (French et al. 2008) have shown by ordination, that the vascular
plant species present in a plot can be used to separate the plots based on a higher
classification, such as the dominant tree species or woodland classification type of
the plot. It is also known that the macrofungal communities of forests can be
related to the vascular plant communities, and this relationship is examined in
more detail later (Section 3.5.3, this Chapter; and Section 4.5.5, Chapter 4).
However, there was some variation in the similarity of the communities
within plots of similar forest type. Based on (1) the loose ordination of the group
sites by NMS, (2) the failure of indicator species analysis to identify species
specific to the group and (3) the variability of the site structural and edaphic
variables, Sitka spruce forests are the most variable with regard to their biological
and abiotic variables. The forest type that showed the least variability was the oak
forest type. The reason for the variation in vascular plant communities within the
Sitka spruce and to a lesser extent Scot’s pine forest types, was found to be due to
the inter-plot variation in age and rotation stages of the coniferous plots. In
contrast to this, all of the oak plots were of similar age and rotation stage; and
many of the ash plots were of similar age and rotation stage. The climax plant
communities that develop in old growth forests have much more vascular species
rich communities than forests that are managed for short rotation wood production
(Ferris et al. 2000b), and their communities also vary considerably.
Previous studies in Irish forests have identified other forest variables that
affect vascular plant community composition and species richness (Smith et al.
2007; Iremonger et al. 2006). Among the variables identified are canopy gaps,
open spaces, and retention of patches of forest beyond financial maturity. The
2006 BIOFOREST report (Iremonger et al. 2006) concluded that the current
forest regulation of providing 5-10% of the forest as open space (Anon. 1996),
108
may not be sufficient for the conservation and enhancement of species diversity of
vascular plants in Irish plantation forests.
In order for plantation forests to provide worthwhile returns in a short time
period and also conserve biodiversity and therefore ecosystem function, previous
studies (Peterken et al. 1992; Ferris et al. 2000b; Humphrey 2005) have noted that
biodiversity in forests might benefit more from the retention of patches of forest
beyond financial maturity than the increase which might arise from extended
growth rotations of larger areas of forest. By retaining forest patches, a mosaic of
different habitats would be created within each forest stand. Mosaic patterns and
structural diversity in forests has been identified as a positive indicator of
biodiversity (see Lindenmayer et al. 2000 for review), and so management
techniques which increase the patchwork pattern of forest structure in forests
should be promoted.
3.5.2 The plant communities of the four forest types
The overall plant species richness was 68 with 38, 31, 38 and 24 species found in
ash, oak, Scot’s pine and Sitka spruce forests respectively. The distribution data
for all of the species ranges from 500 to 1300+ records in Ireland (NBDC 2010)
and none of the species are on the checklist of protected species in Ireland (Curtis
and McGough 1988). Each forest type was found to have a vascular plant
community which was significantly different from the other forest types.
Irish ash forests
Overall the ash sites were the 3rd most diverse with respect to their plant
communities. Indicator species analysis identified Corylus avellana, Crataegus
monogyna and Hedera helix as possible vegetation indicators of ash forests in
Ireland table 3.19. Of these three, Crataegus monogyna is the only plant species
which has a high IV and so shows high fidelity to the ash forest communities.
French et al. (2008) also identified Hedera helix as an indicator species for ash
forests in Ireland. Soil available calcium and pH were found to be higher in the
ash forest type than in the other forest types. These variables would have a strong
effect on the plant species community composition of the ash plots. Irish ash
forests have been noted as having very high soil available calcium levels (Smith et
109
al. 2005) and this is due to the high requirements and basic soils necessary for
good growth of ash in Ireland (Horgan et al. 2004).
The effect of inter-forest type variation in site characteristics on the
vegetation community of the ash plots is evident within the ash forest type.
Generalized linear modelling identified forest management as having negative
effects on plant species richness with the unmanaged sites having higher plant
species richness than the managed sites. Through management the understory
plant composition of the managed plots has been modified from the perhaps
expected oak-ash-hazel WN2 (Fossitt 2000) to a type which might fit the highly
modified broadleaf woodland WD1 (Fossitt 2000).
The ash plot at Killough is in an unmanaged condition with little
disruption and forest management (apart from small amounts of coppice removal)
as can be seen by the presence of an orchid species (Helleborine sp.), which are
known to be negatively affected by habitat change and eutrophication (Dixon et
al. 2003). The plot at St John’s wood also had high species diversity and would be
classified as oak-ash-hazel WN2 (Fossitt 2000). This site is noted as being in one
of the oldest and most pristine forests in Ireland (Rackham 1995).
French et al. (2008) classified ash plantation forests in Ireland into 4
groups: grassland and heath (mostly remnant vegetation from a grassland, acidic
grassland and heath (grassland vegetation with more acid loving species),
basophilic forest (vegetation closely corresponding to that of Corylo-Fraxinetum
(Braun-Blanquet and Tuxen 1952) and bramble dominated plantations. The plots
at St John’s wood and Killough would be classified as the basophilic group
according to French et al. (2008) descriptions. The remaining ash sites all fit into
the broad classification of bramble dominated plantation forests. Similar to the
study by French et al. (2008) fast spreading species like bramble and ivy are very
common in the ash sites, as even when a closed canopy is formed there is still
sufficient light for growth reaching the forest floor.
Irish oak forests
The oak sites had the third highest species richness of vascular plants of the 4
forest types with a total of 31 species present. According to the diversity indices,
oak was the most species diverse of the forest types. The species most commonly
found in the oak sites in this project were all previously found to be common in
110
oak sites throughout Ireland (Kelly and Iremonger 1997). Indicator species
analysis identified Corylus avellana, Hedera helix, Luzula sylvatica and Oxalis
acetosella as possible indicators of oak forests. Of these indicator species Luzula
sylvatica and Oxalis acetosella show high indicator values which would indicate a
high degree of faithfulness of the species to the oak forest grouping. Kelly and
Iremonger (1997) utilised the distribution of Oxalis acetosella in TWINSPAN
analysis to separate their oak dominated groupings from the other forest types
they examined.
Ordination of the oak sites by vegetation species (presence/absence data)
produced a tight cluster of data points with the plots at Abbeyleix and Union
shown as outliers. Abbeyleix is the only pure pedunculate oak site in this project
and is known to be quite old being the remnants of a demesne woodland
(Rackham 1995). Its ground flora is very typical of Quercus robur sites, with a
good representation of bluebells and wood sanicle. It has been investigated by
Kelly and Iremonger (1997) and Kelly (2005) and described as an acidophilous
oak woodland dominated by of Quercus robur. It is best described as oak-ash-
hazel woodland WN2 (Fossitt 2000).
Union wood is classified as old (>200 years) sessile oak wood by a
previous study (Anon. 2005a). It is based on calcareous soils with very high
calcium availability, a neutral pH and is subject to grazing by Sika deer (Cervus
nippon Temminck) which has led to greater woodrush becoming a very dominant
species in the forest floor layer (Anon. 2005a). The preferential grazing by the
deer on oak saplings reduces the regeneration of the oak floristic component
(Kelly 2002) and causes a decline in the tightly closed oak dominated canopy. The
increase in light availability to the ground floor gives bushy quick-growing herbs,
like woodrush, a competitive advantage over slow growing shade tolerant herb
species. This change in the ground flora is a large reason that the Union site did
not group closely with the other oak sites in the project.
Raheen woodland has many species common to sessile oak woodlands
WN1 (Fossitt 2000) in Ireland including hard fern and honeysuckle. Kilmacrea
woodland clusters between the oak and Scot’s pine sites. It is an acidophilous
sessile oak wood (Perrin et al. 2006a) and has a history of oak trees in the site
since 1840. It is one of the only oak sites to have bilberry present, although
bilberry is listed as a common composite of the oak-birch-holly WN1 (Fossitt
111
2000). It is the only oak site to be situated on acid brown earth and along with the
low calcium levels, may have more acidic loving plant species present than the
other oak sites.
The effect of browsing by Sika deer on oak regeneration was highlighted
in this chapter by generalized linear modelling and also by the lack of oak
seedlings in the lower canopy layers in plots which suffer from deer browsing.
The plots at Union, Abbeyleix and TomiesA show almost no oak trees in the
lower canopy layers. Deer have been found to preferentially eat
oak>ash>beech>birch (Peterken and Jones 1989) and previous studies have
highlighted grazing by deer as a problem in the woodlands at Tomies wood (Kelly
2002; Perrin et al. 2006b) and Union woods (Anon. 2005a). Possible steps may
include exclusion of the deer by fencing or removal or control of the deer
population by increased culling (Heinze et al. 2010).
An interesting method of controlling the rampant red deer Cervus elaphus
is documented in Beschta and Ripple (2010). In order to help regenerate the
natural cotton wood plant communities of Yellowstone national park, scientists at
Oregon State University re-introduced the extinct predator grey wolf Canis lupis
into the park in 1995. Due primarily to the predation of the wolves on the deer, the
park has seen large increases in tree species regeneration since the re-introduction
of the “top predator”. The grey wolf was also a native species to Ireland up to ca.
1780 when it was made extinct following years of hunting and destruction of its
habitat (Hickey 2000). Although the re-introduction of wolves is most certainly
not an option for Irish or other heavily populated countries for many reasons not
least public opinion (Agarwala et al. 2010), the recent re-introduction of eagles
into Ireland in Donegal (O’Toole et al. 2002) and Killarney (White tailed eagle
project 2010) may have a small effect on the deer populations as eagles have been
known to kill young sheep and other small mammals.
Irish Scot’s pine forests
The Scot’s pine sites had the tied highest species richness of plants, along with
ash sites with 38 plant species. A past study by Roche et al. (2009) also identified
many of the species found in Scot’s pine habitats in this study as being commonly
found in Scot’s pine sites in Ireland. Indicator species analysis identified
Thuidium tamariscinum, Calluna vulgaris and Pteridium aquilinum as indicator
112
species of Scot’s pine forests. Both Calluna vulgaris and Pteridium aquilinum
were identified as indicator species of Scot’s pine habitats in Ireland, with
Pteridium aquilinum being a constant species in any pine habitats and Calluna
vulgaris being indicative of the Calluna vulgaris–Eriophorum vaginatum sub-
group (Roche et al. 2009). Humphrey and Coombs (1997) investigated a Scot’s
pine plantation forest in Scotland and found 37 vascular plant species of which 10
species were common to the Scot’s pine forests in this study.
The Scot’s pine plots formed a close grouping according to ordination
with the two Scot’s pine plots at Brittas and Bansha falling slightly outside this
grouping. The plot at Brittas has a number of oak planted in it. Although not as
dominant in the canopy as the Scot’s pine, oak trees are represented well in the S2
and S3 canopy layers, which has effects on the ground flora species and makes the
site similar to the oak-birch-holly WN1 habitat (Fossitt 2000). Bansha also has an
amount of oak (Quercus petraea) in the lower canopy layers within 10m of the
plot, which along with the presence of the oak-birch-holly indicator species,
honeysuckle and bilberry would classify it as a WN1 habitat (Fossitt 2000). The
rest of the Scot’s pine plots cluster very well together due to their similar species
composition which is best described as the Semi natural bog woodland WN7
(Fossitt 2000).
The Scot’s pine plots are some of the most open canopy plots of the
project. The typical crown form of the Scot’s pine trees leaves large open spaces
in the canopy which allows a lot of solar radiation to the ground layer, often
resulting in very high vegetation cover of fast growing light dependent species
(bracken, bramble, willow and birch) in the S1 and S2 layers.
The study by Roche et al. (2009) examined the vegetation of Scot’s pine
forests in Ireland. They found that Scot’s pine supported a high number of native
plant species (116). Using ordination, they divided the vegetation types of Scot’s
pine forests into 4 groups. Group 1 the V. myrtillus-I. aquifolium corresponds to
the plots at Brittas, Bansha and Torc. This vegetation type is the most similar to
that of semi-natural forest communities especially that of oak-birch-holly WN1
(Fossitt 2000). Group 2 (sensu Roche et al. 2009) the C. vulgaris-E. vaginatum
grouping matches the vegetation at Annagh, Ballygawley, Derryhogan and
Gortnagowna and is similar to the Semi natural bog woodland WN7 grouping
(Fossitt 2000). All of the Scot’s pine sites (except Gortnagowna) have a
113
component of peat in their soil make-up. Scot’s pine is often planted on peat sites
due to its tolerance to acid and waterlogged conditions, and also due to its tap
rooting system which ensures stability on soft peaty soils (Horgan et al. 2004).
Group 4: the G. saxatile-A. capillaries grouping matches the vegetation at
Ballylug and has been said to resemble that of acid grasslands GS3 (Fossitt 2000)
more so than any woodland vegetation community. The largely grassland type
plant communities of the Ballylug Scot’s pine plot could be ascribed to the high
light availability in Scot’s pine woodlands allowing colonisation of the forest
floor by the surrounding vegetation types, in this case acid grassland type
(Rodwell and Cooper 1995).
Irish Sitka spruce forests
Sitka spruce forests had the lowest total species richness and diversity index value
of all the forest types examined. The maximum of 11 plant species is very low
compared to the other forest types. The low species richness of Irish Sitka spruce
forests, especially in comparison to native oak forests is a well established fact
(Fahy and Gormally 1998; Boyle and Farrell 2004). All of the plant flora found in
the spruce forests in this study were identified as being found in Sitka spruce
plantations in a past study (French et al. 2008).
Indicator species analysis was not very successful at identifying indicator
species in Sitka spruce forests, but it identified Oxalis acetosella and Thuidium
tamariscinum as indicators of Sitka spruce forests albeit only weak indicators
(based in indicator value). Ferris et al. (2000b) and Wallace et al. (1992) also
noted a lack of ground flora species in young plantation Sitka spruce stands in the
U.K., especially when there was not a history of woodland establishment on the
site. Age was identified as significant in explaining the variability in plant species
between the Sitka spruce plots. Young plots were found to have less vascular
species richness than mature plots in this project. Ferris et al. (2000b) found that
as age increased, so did total species and vascular plant species cover. This result
can be explained by the dense canopy which is formed in mid-rotation Sitka
spruce and other coniferous forests that cause a decline in ground floor species
richness due to shading (Sakura et al. 1985; Hill 1986).
Ordination of the Sitka spruce plots shows a clear separation of the spruce
plots from the other forest types. As Sitka spruce is not a native tree species, there
114
has been a delay in designating it as a habitat in Ireland. Under the Fossitt (2000)
habitat guide, four of the Sitka spruce plots are designated as conifer plantation
WD4, while the remaining five could be classified as oak-birch-holly WN1
habitats. A difficulty in applying this system to non native vegetation, is that some
of the key species which designate a habitat grow in many different habitats, even
previously unrecognised ones. These “new biotic assemblages” (sensu Hobbs et
al. 2006) consist of groupings of flora and fauna which have not been documented
before or are not recognised as an established community. Hard fern Blechnum
spicant is an indicator species of the oak-birch-holly WN1 grouping (Fossitt
2000) and grows in 5 of the 9 Sitka spruce plots, although only 2 of these plots
have either oak, birch or holly present in the canopy. The study by French et al.
(2008) was one of the first to examine Sitka spruce vegetation in Ireland. They
classified Sitka spruce plots into 5 groups, grassland and heath groups (none in
this study), two age classes of closed canopy forest (closest fit for all of the Sitka
spruce plots examined in this project) and bramble dominated forest (no plots in
this study).
The spruce sites also had very low quantities of coarse woody debris,
especially lacking large diameter CWD in the plots. This anomaly has been
identified as a problem in Irish plantation forests (Sweeney et al. 2010a) and may
have implications for biodiversity in these forests. When examining the number of
tree species present in the canopy of Sitka spruce forests, it is noticeable that
often, Sitka spruce dominates the canopy especially in mature sites where it can
be the only tree species present in the plot. The highly competitive growth form of
Sitka spruce has been noted in the past and along with its heavy shading of the
forest floor may lead to low plant species diversity in the sites (Ferris et al.
2000b).
3.5.3 Relationship of these findings to possible fungal species richness
As a precursor to the Chapter 4, the possible fungal species richness of the sites
was estimated from the plant species richness recorded in the plots. It has been
accepted in the past in most ecosystems that the total fungal to plant species
richness ratio stands at 7:1 (Hawksworth 1991). In this project only macrofungi
115
were of interest, and therefore total fungal species richness was not being
measured. Using data from a well studied area (the Hebrides) the recalculated
ratio for macrofungi to vascular plants is 1259:860 or 1.46:1 (Hawksworth 1991;
Dennis 1986). The previous figure is quite similar to one proposed by Villeneuve
et al. (1989) for data from Canadian deciduous and coniferous forests, which was
2:1 macrofungi to vascular plants. In a study of both deciduous and coniferous
forests in the drier region of South Dakota, Gable and Gable (2007) found a
macrofungi to plant species relationship of 1:1.5. Using a meta-analysis of the
total fungal and vascular plant records from Europe, Schmit and Mueller (2007)
found a lower ratio of 1:0.55 macrofungal to plant species. The estimate by
Schmit and Mueller is undoubtedly a lower limit estimate as it is accepted that
there are still many undiscovered macrofungal species in European habitats
(Rodriguez 2000 as cited in Hawksworth and Mueller 2005), which would affect
the ratio if included in the analysis.
If the relationship between vascular plants and macrofungi in Irish forests
is similar to that from a well studied region in Canada (Villeneuve et al.1989),
then the richness of vascular plant species in the examined forest habitats would
be directly related to the species richness of macrofungi in these forests. Table
3.22 and Fig. 3.15 identify the possible macrofungal species richness estimates for
the examined plots calculated from the vascular species richness of the plots.
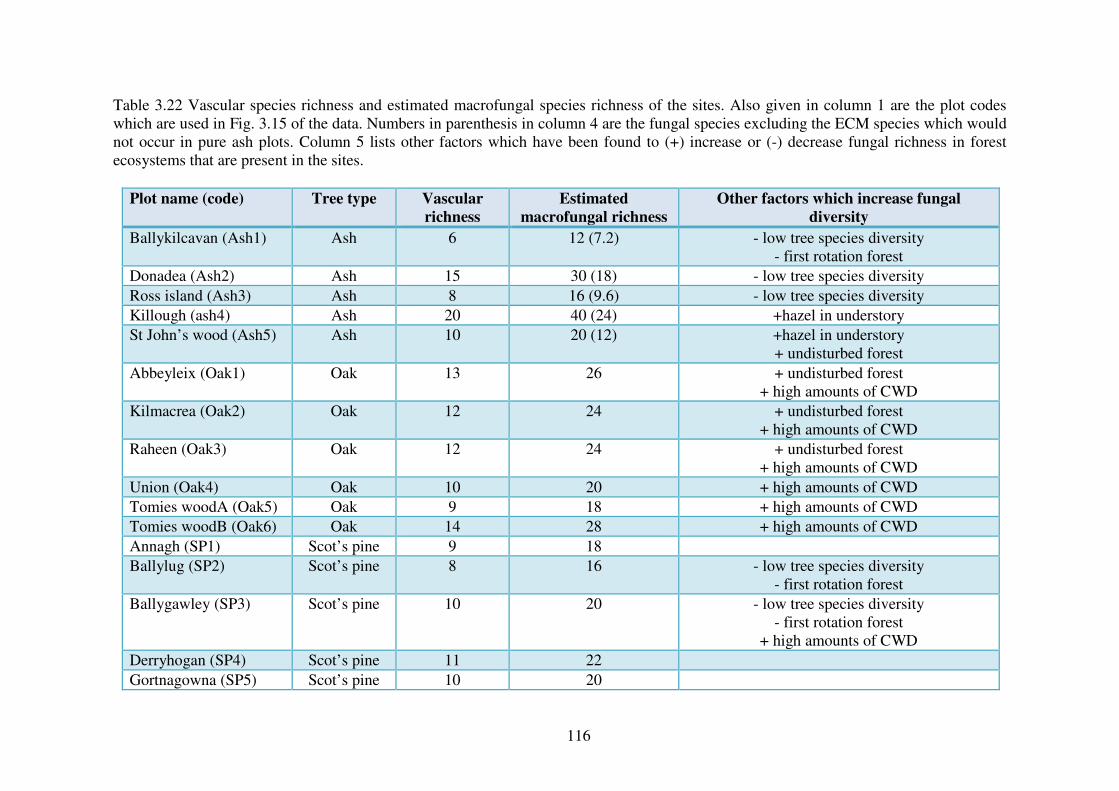
116
Table 3.22 Vascular species richness and estimated macrofungal species richness of the sites. Also given in column 1 are the plot codes which are used in Fig. 3.15 of the data. Numbers in parenthesis in column 4 are the fungal species excluding the ECM species which would not occur in pure ash plots. Column 5 lists other factors which have been found to (+) increase or (-) decrease fungal richness in forest ecosystems that are present in the sites.
Plot name (code) Tree type Vascular
richness
Estimated
macrofungal richness
Other factors which increase fungal
diversity
Ballykilcavan (Ash1) Ash 6 12 (7.2) - low tree species diversity - first rotation forest
Donadea (Ash2) Ash 15 30 (18) - low tree species diversity
Ross island (Ash3) Ash 8 16 (9.6) - low tree species diversity
Killough (ash4) Ash 20 40 (24) +hazel in understory
St John’s wood (Ash5) Ash 10 20 (12) +hazel in understory + undisturbed forest
Abbeyleix (Oak1) Oak 13 26 + undisturbed forest + high amounts of CWD
Kilmacrea (Oak2) Oak 12 24 + undisturbed forest + high amounts of CWD
Raheen (Oak3) Oak 12 24 + undisturbed forest + high amounts of CWD
Union (Oak4) Oak 10 20 + high amounts of CWD
Tomies woodA (Oak5) Oak 9 18 + high amounts of CWD
Tomies woodB (Oak6) Oak 14 28 + high amounts of CWD
Annagh (SP1) Scot’s pine 9 18
Ballylug (SP2) Scot’s pine 8 16 - low tree species diversity - first rotation forest
Ballygawley (SP3) Scot’s pine 10 20 - low tree species diversity - first rotation forest
+ high amounts of CWD
Derryhogan (SP4) Scot’s pine 11 22
Gortnagowna (SP5) Scot’s pine 10 20
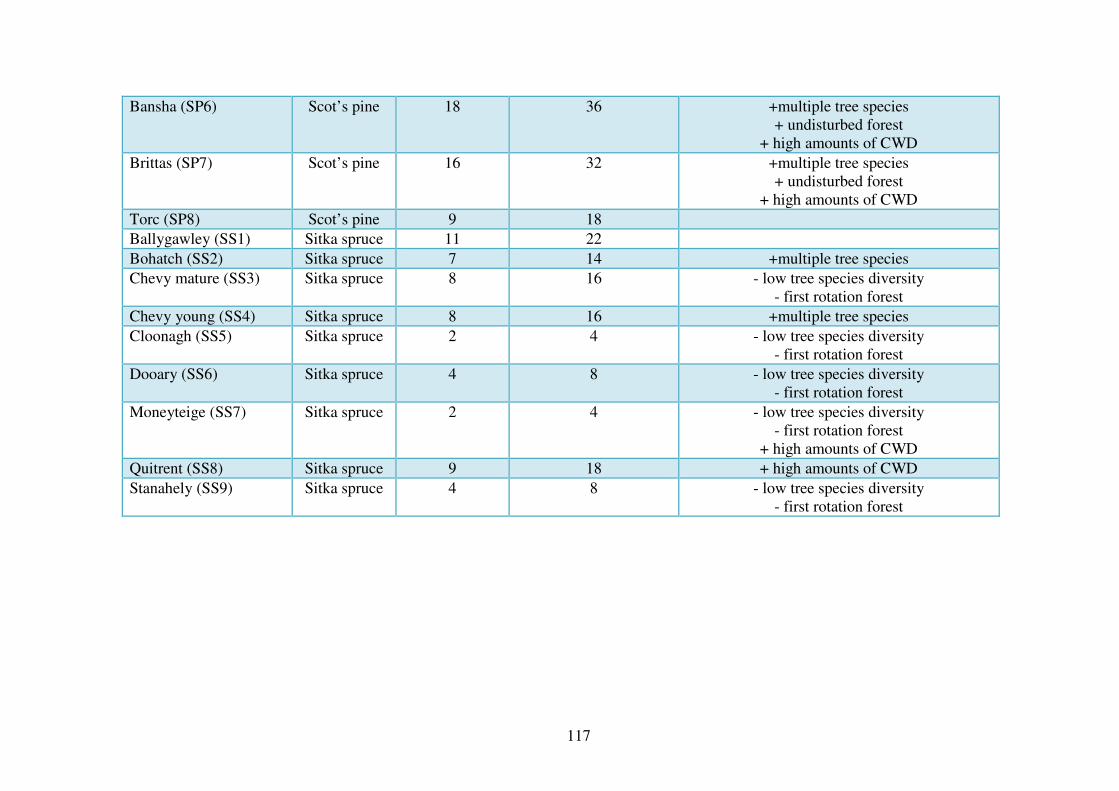
117
Bansha (SP6) Scot’s pine 18 36 +multiple tree species + undisturbed forest
+ high amounts of CWD
Brittas (SP7) Scot’s pine 16 32 +multiple tree species + undisturbed forest
+ high amounts of CWD
Torc (SP8) Scot’s pine 9 18
Ballygawley (SS1) Sitka spruce 11 22
Bohatch (SS2) Sitka spruce 7 14 +multiple tree species
Chevy mature (SS3) Sitka spruce 8 16 - low tree species diversity - first rotation forest
Chevy young (SS4) Sitka spruce 8 16 +multiple tree species
Cloonagh (SS5) Sitka spruce 2 4 - low tree species diversity - first rotation forest
Dooary (SS6) Sitka spruce 4 8 - low tree species diversity - first rotation forest
Moneyteige (SS7) Sitka spruce 2 4 - low tree species diversity - first rotation forest
+ high amounts of CWD
Quitrent (SS8) Sitka spruce 9 18 + high amounts of CWD
Stanahely (SS9) Sitka spruce 4 8 - low tree species diversity - first rotation forest
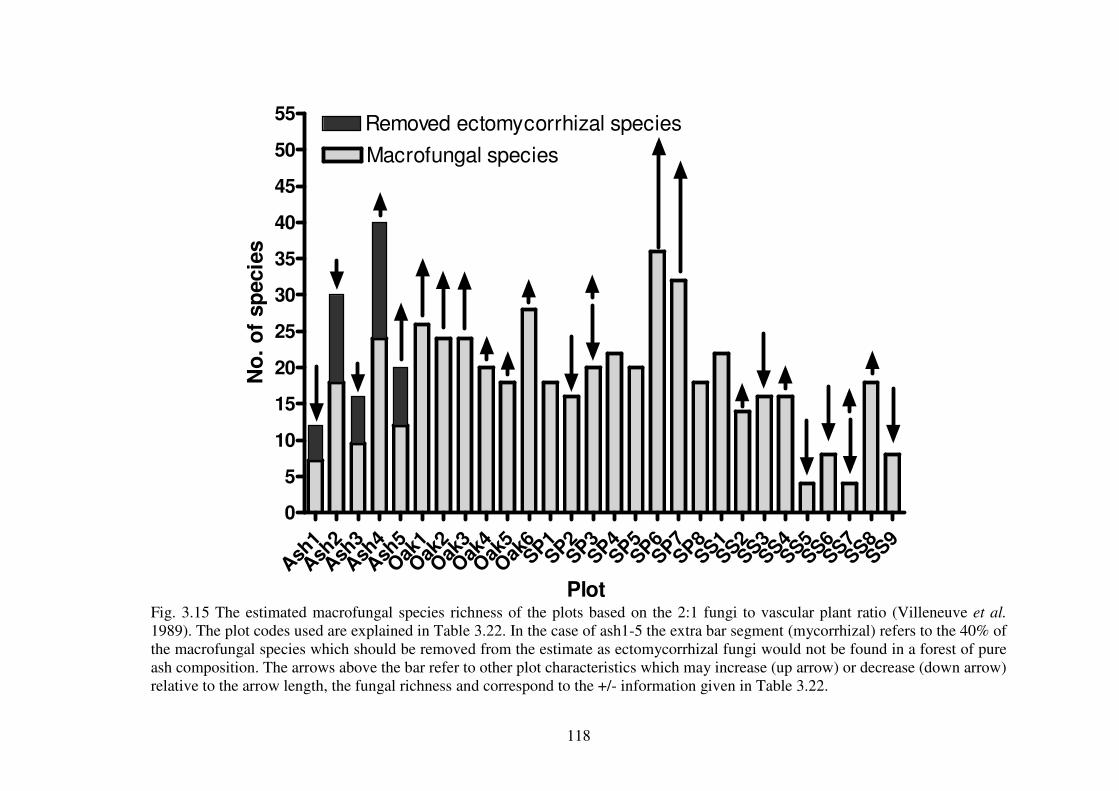
118
Ash
1A
sh2
Ash
3A
sh4
Ash
5O
ak1
Oak
2O
ak3
Oak
4O
ak5
Oak
6SP1SP2SP3SP4SP5SP6SP7SP8SS1SS2SS3SS4SS5SS6SS7SS8SS9
0
5
10
15
20
25
30
35
40
45
50
55
Macrofungal species
Removed ectomycorrhizal species
Plot
No
. o
f sp
ecie
s
Fig. 3.15 The estimated macrofungal species richness of the plots based on the 2:1 fungi to vascular plant ratio (Villeneuve et al. 1989). The plot codes used are explained in Table 3.22. In the case of ash1-5 the extra bar segment (mycorrhizal) refers to the 40% of the macrofungal species which should be removed from the estimate as ectomycorrhizal fungi would not be found in a forest of pure ash composition. The arrows above the bar refer to other plot characteristics which may increase (up arrow) or decrease (down arrow) relative to the arrow length, the fungal richness and correspond to the +/- information given in Table 3.22.

119
According to this simple calculation, the oak forest would be estimated to
be the most fungal species rich with a mean species richness of 23 (±3.7sd)
species, followed by Scot’s pine, ash and Sitka spruce forests with 23 (±7.2), 14
(±6.8) and 12 (±6.4) fungal species. The relationship between estimated species
richness and actual species richness of macrofungi in these plots is examined in
the next chapter (Section 4.5.5, Chapter 4).

120
3.6 Conclusions
• The forest types were well differentiated based on their vegetation
communities, with plots of the same forest type having a more similar
vascular plant community.
• The ash and Scot’s pine plots were found to be the most species rich
followed by the oak and Sitka spruce forests. Sitka spruce forests were
found to have low levels of species richness and age of the plot was found
to be positively related to the species richness. Future management of
plantation forests should incorporate management techniques which
increase the diversity of plants in these forests, similar to
recommendations made in Iremonger et al. (2006).
• The native oak forests of Ireland are at risk due to large herbivore
browsing. Management techniques along the lines of those proposed by
Perrin et al. (2006) need to be examined in order to promote natural
regeneration in oak forests.
• Possible macrofungal species richness estimates according to the ratio of
vascular plants to macrofungi indicate that oak forests would be the most
macrofungal species rich forest type followed by Scot’s pine, ash and
Sitka spruce forests.
121
Chapter 4: Macrofungal species richness and
diversity in the different forest types

122
123
4.1 Introduction
4.1.1 Fungal diversity in temperate forest ecosystems
Of the estimated 1.5 million fungal species (Hawksworth and Rossman 1997),
only 7% (100,000) have been described so far (Kirk et al. 2008). The total number
of species recorded for Ireland and the U.K. alone, currently stands at over 16,500
(FRDBI 2010). Rodriguez (2000), as cited in Hawksworth and Mueller (2005),
estimate that there are over 25,000 species of fungi (including epigeous and
hypogeous macrofungi, yeasts and lichen-forming fungi) in Europe with another
40,000 yet to be described. Fungi are most diverse in forest ecosystems, and it has
been estimated that the fungal biomass in forest soils exceeds the biomass of all
other soil organisms combined, except roots (Paul 2007). The link between fungi
and forests is so strong that fungal species richness has been shown to increase
with increasing forest area (Peay et al. 2007; Strong and Levin 1975), and the
number of tree species present (Ferris et al. 2000a; Schmit et al. 2005). Forests
also support more rare and threatened fungi, with over 70% of threatened fungi
being found primarily in forests (Arnolds and de Vries 1993).
The fungal biota of forests is often found to be dominated by
ectomycorrhizal species (Humphrey et al. 2000), which normally account for ca.
40% of the macrofungal species richness in forest ecosystems (Watling 1995).
The most diverse ectomycorrhizal genera found in temperate forest ecosystems
are Cortinarius, Russula and Lactarius which have 193, 133 and 67 species in
England alone (Legon and Henrici 2005). The genus Cortinarius contains almost
2000 described species worldwide (Garnica et al. 2005).
An evolving area of conservation research is the area of biodiversity
indicators (Lindenmayer et al. 2000). It has been suggested that fungi could be
used as surrogate indicators for overall biodiversity in forest ecosystems (Ferris
and Humphrey 1999). In the past, fungi have been used as indicators of lichen and
bryophyte species-rich habitats (Norden et al. 2007), and also as indicators of the
presence of other red-listed fungal species (Halme et al. 2009). Forest fungi could
possibly be used as an indicator of collembolan diversity in forests, as past studies
have found that the community structure of Collembola and other
124
microarthropods is clustered on or near fungal sporocarps (O’Connell and Bolger
1997, 2007).
4.1.2 Fungal diversity in Irish forests and forests similar in tree species
composition and climate
In Ireland, there have been very few investigations into the diversity of fungi in
forests and no systematic study of macrofungal diversity in Irish forests. The
Atlantic oak woods in Co Kerry are probably the best studied woodland habitat in
Ireland (Gill et al. 1948; Ramsbottom 1936; Muskett and Malone 1978, 1980).
Grasslands (Carter 1998; McHugh et al. 2001; Mitchel 2006, 2007, 2008, 2009)
along with other habitat types such as sand dune ecosystems (Hassell 1953; Landy
2001) and the relict communities of forest macrofungi of the Burren (Harrington
1996, 2003; Harrington and Mitchell 2002) have also been documented.
Previous studies have commented on the wealth of macrofungi found in
Irish oak forest habitats (Gill et al. 1948; Ramsbottom 1936). The British
Mycological Society’s visit to the sessile oak woods of Killarney, Ireland, in
1935, identified 39 macrofungal species from one woodland area from a one-day
foray. The macrofungi of forests in the Counties Wicklow and Dublin have also
received attention with a number of published lists of macrofungi for these vice-
counties (Pim 1989; Muskett and Malone 1978; 1980). Counties Wicklow (with
the largest percentage of woodland cover) and Kerry (with the largest percentage
cover of semi-natural woodlands), have the first and second highest numbers of
macrofungal records in Ireland. The macrofungi of other woodland areas in
Ireland have received little or no attention. O’Hanlon and Harrington (in press)
estimated that 25 of the 26 vice counties in Ireland have less than 50% of their
macrofungal species recorded, and that Irish woodlands may reveal many
unrecorded macrofungal species. The work by Harrington in the Burren area,
although not investigating macrofungi in forest ecosystems, does give an idea of
the diversity of forest macrofungi which at one time existed in Irish native
woodlands: 88 macrofungi were recorded from three years sampling (Harrington
2003). Thirty-five percent of these species were putative ectomycorrhizal species
that were ectomycorrhizal on mountain avens (Dryas octopetala), in the absence
of host tree species in the Burren. There was also a number of woodland
125
saprotrophs e.g. Lepista nuda, Mycena spp. present. It has been proposed that the
ectomycorrhizal and woodland saprotrophic macrofungi present in the area are
relict species from the extensive pine forests which grew in the area over 2000
years ago (Harrington 1996).
The macrofungal diversity of British native and plantation woodlands have
received much more study that of Irish forests, and three recent systematic studies
have revealed that plantation woodlands in the U.K. support levels of macrofungal
richness comparable to those of semi-natural woodlands (Ferris et al. 2000a;
Humphrey et al. 2000; Newton et al. 2002). The first study investigated the fungal
biota of Scot’s pine and Norway spruce habitats in the U.K. and found that there
was a high richness of fungi (343 species) in these plantation forests. The second
study compared the macrofungal richness and community structure of plantation
forests of exotic (Sitka spruce) and native tree species (Scot’s pine and oak). They
also found that plantation forests can provide a supplementary habitat for native
fungal species. The final study, by Newton et al. (2002), examined the distribution
of the threatened group of macrofungi known as stipitate hydnoid fungi in
Scottish native and plantation woodlands. They found that plantation woodlands
could support a number of these endangered macrofungi, and agreed with the
studies by Ferris et al. (2000a) and Humphrey et al. (2000), that plantation
woodlands in the U.K. can be managed to provide a sufficient habitat for many
native forest macrofungi. In its home range of North America, Sitka spruce is
known to show low levels of ECM specificity, and its ability to form
ectomycorrhizas with many different ECM fungi is noted as a possible reason for
the tree species survival and success in its native habitat, which is normally very
tree species rich (Alexander and Watling 1987). The ability of Sitka spruce to
form ectomycorrhizal linkages with many different fungi may increase its fitness,
by allowing access to many different common mycorrhizal networks and a share
in the carbon and limiting nutrients which they carry (Smith and Read 2008).
4.1.3 Factors affecting macrofungal diversity in forests
Forests are now seen as one of the key reservoirs for biodiversity in Europe (EEA
2010). Conserving biodiversity is important as: (a) declining species richness
leads to declines in overall ecosystem functioning, (b) at least one species per
126
functional group is essential for ecosystem functioning and (c) the nature of an
ecosystem’s response to declining biodiversity depends on the species lost
(Naeem 1999). Functional diversity (defined as a group of species sharing similar
ecological features that can influence their performance in nature; Keil et al.
2008) has also been shown to be an important factor affecting ecosystem
functioning (see Gaston and Spicer 2007; Bolger 2001). Humphrey et al. (2000)
and Ferris et al. (2000a) examined the functional diversity of fungi in forests in
the U.K., and found that the numbers of species within different functional groups
varied between forest types, and that certain structural and abiotic variables were
responsible for these functional group variations.
There have been numerous factors identified which are known to affect the total
numbers of macrofungal species, and species within defined functional groups
found in temperate forest ecosystems. These are:
• Deciduous forests have been found to harbour a larger number of fungal
species than coniferous forests (Bills et al. 1986; Humphrey et al. 2000).
• It has been found that the number of tree species present in a forest is
positively related to the number of macrofungal species in the forest (Ferris et
al. 2000a; Schmit et al. 2005). This is possibly due to the increasing number of
symbiotic partners available in multi-tree species forests for ectomycorrhizal
fungi (Ishida et al. 2007) and due to the substrate specificity demonstrated by
many litter-decay fungi (Ludley et al. 2008). Certain fungal parasites are tree
species specific (e.g. Heterobasidion annosum only attacks coniferous trees)
and therefore increases in the number of tree species can also cause an increase
in parasitic fungi present.
• Stand age has been shown to be related to the number of macrofungal species
recorded in coniferous forests (O’Dell et al. 1999; Smith et al. 2002). It has
been noted that as some coniferous forests age, they acquire a large number of
macrofungal species that fruit infrequently, thus giving the appearance of
reduced macrofungal species richness if sporocarp sampling is used to record
the fungal biota.
127
• The quantity of CWD present in a forest has been shown to be positively
related to the species richness of wood-decay macrofungi (Ferris et al. 2000a).
The decay stage and overall quality of the CWD has also been linked to the
species richness of wood-decay macrofungi present in forest ecosystems
(Sippola and Renvall 1999).
• The proximity of fungal inoculum sources (as spores or mycelium) has been
identified as important for increasing the species richness of macrofungi in
temperate forests. Distance to retained mature and ectomycorrhizally diverse
trees has been shown to allow for the inoculation of young trees with existing
ectomycorrhizal fungi (Jumpponen et al. 2002; Ashkannejhad and Horton
2006; Cline et al. 2005).
4.1.4 Difficulties in estimating fungal diversity in forests
Creating an inventory of the entire fungal biota of a forest area is a difficult task.
The ephemeral nature of fruitbodies and the effects of weather on fruitbody
production make fungal diversity studies difficult (Ohenoja 1993; Gulden et al.
1992; Carrier 2003; Krebs et al. 2008). Sporadic fruiting means that long-term
studies are required. Many long-term studies (>20 years) were still finding new
species (Straatsma and Krisai-Greilhuber 2003; Tofts and Orton 1998; Orton
1987). Often the overwhelming number of species which can be found in even a
relatively small area also present difficulties (for review see Watling 1995). These
obstacles have been an impediment to macrofungal diversity studies, but recent
molecular techniques such as pyrosequencing are revealing extraordinarily high
fungal diversity from small sample areas (for review see Hibbett et al. 2011).
In cases where the total species richness cannot be recorded, richness
estimators can be used to extrapolate from existing data, and provide an estimate
of population diversity to which confidence intervals can be assigned (Colwell
and Coddington 1994). Species richness estimators have been used in the past for
many species groups, including fungi (Schmit et al. 1999; Unterseher et al. 2008).
Many of the techniques for estimating species richness are based on models
devised by Anne Chao and her colleagues (Chao 1984, 1987; Chao et al. 2000).
Some of the estimation methods most commonly used are Chao1 (Chao 1984),
Chao2 (Chao et al. 2000), ACE and ICE (Chao and Lee 1992), jackknife
128
estimates (Burnham and Overton 1979), bootstrap richness estimator (Smith and
Belle 1984) and the Michaelis–Menten richness estimator (Raaijmakers 1987).
The Chao1, Chao2, jacknife, bootstrap, ICE, ACE and Michaelis- Menten
estimators have been used in fungal diversity studies (Schmit et al. 1999;
Unterseher et al. 2008). Many of the older estimators such as Chao1 and Chao2
use the ratio of singletons (species only found in one sample) to doubletons
(species found in two samples) to calculate the species estimate. The most recent
estimators, the coverage estimators ICE and ACE, use the ratio of rare to frequent
species to estimate the richness. In this study, rarefaction was employed to
estimate the number of species which would have been discovered had a lesser
sampling intensity been used. The purpose of this is to equalise the sampling
intensity between the least and the most intensive sample and thus make them
statistically comparable. Species richness estimation was carried out using the
Chao2, ACE and ICE species richness estimators.
129
4.2 Aims of this chapter
The aims of this chapter are:
• To enumerate the macrofungal species richness of forest plots belonging to
four principal forest types that are represented in Ireland. It was expected that
there would be considerable differences in terms of species richness,
functional group richness and fungal community composition (addressed in
Chapter 5). Between the forest types it was expected that native forest types
would have greater species richness than non-native plantation conifers, as
would forests composed of ectomycorrhizal host trees compared to non-
ectomycorrhizal hosts. On this basis, a working hypothesis was that oak
forest would have the highest species richness and ash the least.
• To examine if variables within each forest type, such management history and
stand age (as described in Ch. 3), have a significant influence on macrofungal
species richness and functional group richness. As forest age has been shown
to be negatively related to the numbers of macrofungal species in some
temperate coniferous forests (O’Dell et al. 1999; Smith et al. 2003), it was
expected that the macrofungal species numbers would be higher in younger
coniferous forest sites than in the mature coniferous forest sites.
• To examine if plots with a history of forest use (for example, second rotation
stands on sites that had been previously forested) would have higher species
richness of macrofungi than forests which did not have a history of use as
forests (first rotation forests). In previous work, the availability of fungal
inoculum (either as spores of mycelium) has been shown to be positively
related to fungal species richness in forests (Jones et al. 2003; Dickie and
Reich 2005; Outerbridge and Trofymow 2004).
130
4.3 Materials and Methods
4.3.1 Sites
Details of the sample plots within the forest sites sampled are given in Section
3.3.1, Chapter 3 (Table 3.2). Plots were visited from 2007-2009 inclusive during
the autumn (August – November). Most plots were sampled on at least three dates
in each year. Each of the forest types was represented by at least two replicate
plots that were selected on the basis of similarity of vegetation cover, stand age
and management history.
4.3.2 Macrofungal assessment
In each forest site a 100m2 permanent plot (2x50m) was set up. The plot was
divided into 5 sub-plots of 10m x 2m. All macrofungi inside the plots were
identified in situ where possible, and sporocarps of unidentified species were
retained for later identification. Species were identified using standard general
texts (Breitenbach and Kranzlin 1984-2005; Phillips 2006; Moser 1983) and more
specialized texts for Lactarius (Heilmann-Clausen et al. 1998), Entoloma
(Noordeloos 1992; 2005), Cortinarius (Brandrud et al. 1990-1997), Boletus
(Muñoz 2005) and Tricholoma (Riva 2003). Specimens of rare or critical species
were dried and retained as herbarium samples at the Department of Life Sciences,
University of Limerick, Limerick, Ireland. Sporocarps of ectomycorrhizal species
were frozen at -80ºC for molecular analysis and sequencing (see Chapter 6).
Digital photographs were taken of the macro- and micro-morphological features
of rare species (Folder 2, Appendix 1). Species were assigned to functional groups
based on their primary mode of nutrition as used in Newton and Haigh (1998),
Ferris et al. (2000a) and Humphrey et al. (2000); i.e.
1. Litter-decay species found on forest floor.
2. Ectomycorrhizal fungi.
3. Parasitic on living plant material, or very fresh dead material.
4. Wood-decay species found on decaying wood.
The abundance of fungal sporocarps in each plot was recorded by counting
the numbers of sporocarps of each species in each sub-plot. The number of
fruiting bodies was recorded in each sub-plot up to a maximum of 12 fruitbodies.
131
Species outside of the plot, but within the same stand i.e. generally within 50 m of
the perimeter of the plot were also recorded, but only on a presence/absence basis.
4.3.3 Statistical analysis
For each plot and forest type, a number of parameters of macrofungal species
abundance were determined for all macrofungal species collectively, and for each
functional group of macrofungi:
• Total species richness = the cumulative number of macrofungal species
found in a plot or forest type over the entire sampling period of three
years. The total species richness per forest type = Σxi where x is the total
species richness of each plot in forest type i
• Mean species richness per plot visit = cumulative number of macrofungal
species found in a plot over the entire sampling period, divided by the
number of visits to that plot. By extension, the mean species richness per
forest type = cumulative number of macrofungal species found in all plots
of a specific forest type over the entire sampling period, divided by the
number of visits to all plots within that forest type.
• Log number of fruitbodies per plot visit = the natural logarithm of the
number of fruitbodies found on a single plot visit to a specified plot.
The forest plot visit matrix was created to use the qualitative presence/absence
data for species in each plot visit as a quantitative measurement. It was created by
pooling all of the macrofungal presence/absences from each plot visit into a site
by species matrix. Therefore these matrices were 219 species by 25, 36, 31 and 55
plot visits for ash, oak, Scot’s pine and Sitka spruce forests respectively.
132
4.3.4 Species richness comparisons and the estimation of fungal diversity in
the forest types and sites
Rarefaction analysis
To compare the species richness of the different plots and forest types at a similar
sampling intensity, sample-based rarefaction curves with 95% confidence
intervals were calculated, using the computer program EstimateS (Colwell 2004).
In these analyses, plots were sampled randomly with re-placement, over 500
permutations of the data, because otherwise confidence intervals are meaningless
in the upper end of the rarefaction curve (Colwell et al. 2004). The forest plot
visit matrix was used in these analyses. Sample-based rarefaction was used
instead of individual-based rarefaction, as fungal species have been shown to be
non-randomly distributed (Taylor 2002, Tedersoo et al. 2003). Rarefaction curves
read from right to left and are used for estimating species richness at smaller
sample sizes. Most cannot be used to estimate total species diversity of a
community, but work by Colwell et al. (2004) has allowed the estimation of
species richness from rarefaction curves. In this project, rarefaction was only used
to compare species richness in plots and forest types at lower sampling intensity.
Estimation of total species richness was conducted through species richness
estimators.
Species richness estimation
In order to statistically estimate the undiscovered species richness in the forest
types, and therefore rate the efficiency of a three year study to discover
macrofungal richness in temperate forests, species richness estimators were used
in EstimateS. The most recent estimators, the coverage estimators ICE and ACE
use the ratio of rare to frequent species to estimate the richness. The ICE estimator
is useful as it only needs presence/absence data, is fairly robust to patchy
distributions (Chazdon et al. 1998), and does not need large sample sizes to reach
an asymptote (Magurran 2004). The ACE richness estimator uses the ratio of
abundances of the common species to the rare species to estimate the total species
richness of the ecosystem. It has the drawback of requiring abundance data, and
has been shown to be strongly affected by patchy distributions. The use of
abundance-based richness estimators on fungal data may not be tenable, as these
estimators assume a larger degree of homogeneity between samples than the
133
incidence-based estimators. Fungal populations have been shown to be non-
randomly distributed (Taylor 2002) in nature and so abundance based estimators
may fail to return likely estimates.
The forest plot visit data matrices from the different forest types were used
for the species richness estimators. As rareness is an arbitrary figure, depending
on the organism group being investigated, the ecosystems examined and the
overall purpose of the investigation, cut-off points for rareness of fungal species
were created for each forest type. Using Gaston’s (1994) definition of rareness,
the cut-off point was set at the lower quartile of species abundance values from
samples. In all of the forest types and sites, this was set at two plot visits. This
meant that any species that was found on less than two occasions was defined as
rare. The Chao2 diversity estimator was also calculated for the sites and forest
types. This richness estimator is a presence/absence based estimator that uses the
ratio of species found in only one sample to species found in two or more
samples. It is useful as a minimum richness estimate is cases where species
richness estimates from other estimators have not reached an asymptote (Longino
et al. 2002). The % discovered species richness of the plots and the forest types is
calculated as:
=Actual species richness of forest typeX / Estimated species richness of forest typeX *100
4.3.5 Species diversity and evenness analysis of the sites
Diversity indices were applied to the forest types and plots to compare their
species diversity. The indices were calculated in EstimateS for the different forest
types using the sporocarp abundance data from the plot visits to the forest plots.
The Shannon diversity index, although having many critics (see Magurran 2004),
is one of the most popular diversity indices available and its values were
computed to facilitate comparison between this project and past projects.
Shannon-Wiener index of diversity:
H' = -ΣPi lnPi
134
where Pi is the probability of sampling the ith species among all species (Shannon
and Weaver 1949). This index has been used in similar studies (Bills et al. 1986;
Kranabetter 2004). It is popular because it takes into account the total number of
species and also the evenness with which the individuals are distributed between
each species (Zak and Willig 2004). The index can be modified to give a measure
of the evenness of the sample by dividing H’ by the natural log of the total species
found in the sample or H’ ÷ ln s.
Simpson’s diversity index (Simpson 1949) is another commonly used
index of diversity. It measures the probability that two individuals randomly
selected from a sample will belong to the same species. Its use is advocated by
Magurran (2004) as it is intuitively meaningful and does not make assumptions
about the degree of sampling.
Simpson’s diversity index:
D= Σ ni(ni-1) N(N-1)
Where ni is the number of individuals of the ith species and N is the total number
of individuals.
4.3.6 Species richness of functional groups in the different forest types
The mean and standard deviation of total species richness, mycorrhizal, litter-
decay, wood-decay and parasitic species richness per plot visit was calculated. As
the numbers of fungal species in the different functional groups were found to be
normally distributed, the parametric statistical test one-way analysis of variance
(ANOVA) with a Hochbergs GT2 post-hoc test using PASW version 18 (SPSS
Inc., Chicago, Illinois) was used on untransformed species per plot visit data. The
data was examined to test for significant differences between (a) mean species
richness of the forest types, and (b) mean species richness of the functional groups
in the forest types. The Hochbergs GT2 test is useful when sample sizes vary
between variables (Day and Quinn 1989).
135
4.3.7 Functional group frequencies across the forest types
To test if the relative numbers of species in each of the functional groups was
similar across oak, Scot’s pine and Sitka spruce forests, a one-way classification
chi-square test (following Hawkins 2009) was employed. The species richness in
the different functional groups was compared for each forest type pair separately.
Any relationships between the species richness in each of the functional
groups was tested using Pearson’s correlation coefficient on the species richness
of the functional groups per plot visit.
4.3.8 Influence of site variables on species richness
The effects of site nominal variables (age, rotation stage and other variables; see
Table 4.11) on the mean species richness and the mean richness of species in each
functional group per plot visit in each forest type were tested using a generalized
linear model with Poisson error distribution and log-link function (for analysis of
species count data). For ash, the effect of site management (semi-
natural/managed) and forest age (young/mature) was tested; for oak, the effect of
grazing by large mammals (grazed/non-grazed) was examined; for Scot’s pine the
effect of rotation stage (first/second rotation) and forest age (young/mature) was
tested and for Sitka spruce forests the effect of rotation stage (first/second
rotation) and forest age (young/mature) was tested for relationships with the mean
species richness and the mean richness of species in each functional group per
plot visit.
The generalized linear model procedure was carried out in PASW version
18. The dependent variables species richness, litter decay, ectomycorrhizal or
wood decay species richness per plot visit was entered and tested separately. The
Poisson log-linear model was selected as the model type, following Humphrey et
al. (2000). The factors entered in the model differed depending on the forest type
being tested e.g. presence of grazing in the oak forest type. A custom model was
created using the type 3 sum of squares option and only the main effects of the
model were examined. The effect of interaction between the nominal variables
was not examined as there was no a priori reason to do so (Hawkins 2009). The
Pearson’s chi-square option was chosen as the scale parameter method as
136
McCullagh and Nelder (1989) found that the Pearson’s chi-square estimate can
obtain more conservative variance estimates and significance levels. All of the
levels within each factor (i.e. grazed vs. non-grazed) were examined pairwise
using the sequential Sidak adjustment for their effect on the dependent variable.
Once the model was created, the likelihood ratio chi-square test identified
if the model could explain more variation in the dependent variable than variance
explained by the null model. Next, the influence of the factor on the dependent
variable was identified by examining the difference in the means of the dependent
variable (i.e. species richness) across all levels of the factor (i.e. grazed vs. non-
grazed). If statistically significant according to sequential Sidak adjustment for
pairwise comparisons, the factor level with the higher mean difference for the
dependent variable can be taken as having a positive effect on the dependent
variable.
4.3.9 Seasonal effects on fungal phenology
The numbers of fruitbodies were not normally distributed and therefore they were
natural-log transformed. Log transformations of biological variables often results
in better correlations with other variables (Burton 1998). To analyse the
relationship between meteorological variables (rainfall and temperature)
Spearman’s correlation coefficient was carried out between the species richness,
species richness of each functional group, log total number of fruitbodies and log
total number of fruitbodies in each functional group per plot visit and the
meteorological variables mean annual rainfall, mean annual temperature, total
annual rainfall, mean daily temperature in June; July and August, and mean daily
temperature and rainfall 1, 2, 3 and 4 weeks prior to sampling the plots. If
variables were found to be significantly correlated, then linear regression was
carried out in PASW version 18 using stepwise removal of independent variables
to find the linear model which best explained the variation in the dependent
variable. Both regression and correlation were carried out in PASW.

137
4.4 Results
4.4.1 Macrofungal species in the forest plots
A total of 409 species were identified from the sites over the three-year sampling
period (Table 4.2), with 215 different species photographed (Folder 2, Appendix
1). Of these, 219 species were found within the permanent plots. The remaining
190 were found within the same stand and generally with 50 m radius of the plot.
Of the species found within the plots, 56 were found in ash forests, 113 in oak
forests, 89 in Scot’s pine forests and 144 in Sitka spruce forests. Of the species
found in the plots, 17 species were found in all forest types, 34 species were found
in three forests types, 54 were found in two forest types and the remainder found
in only one forest type. Ash and oak had 41 species in common; ash and Scot’s
pine shared 21 species while ash and Sitka spruce shared 30 species. Oak and
Scot’s pine shared 44 species and oak and Sitka spruce shared 65 species. Sitka
spruce and Scot’s pine shared 58 species.
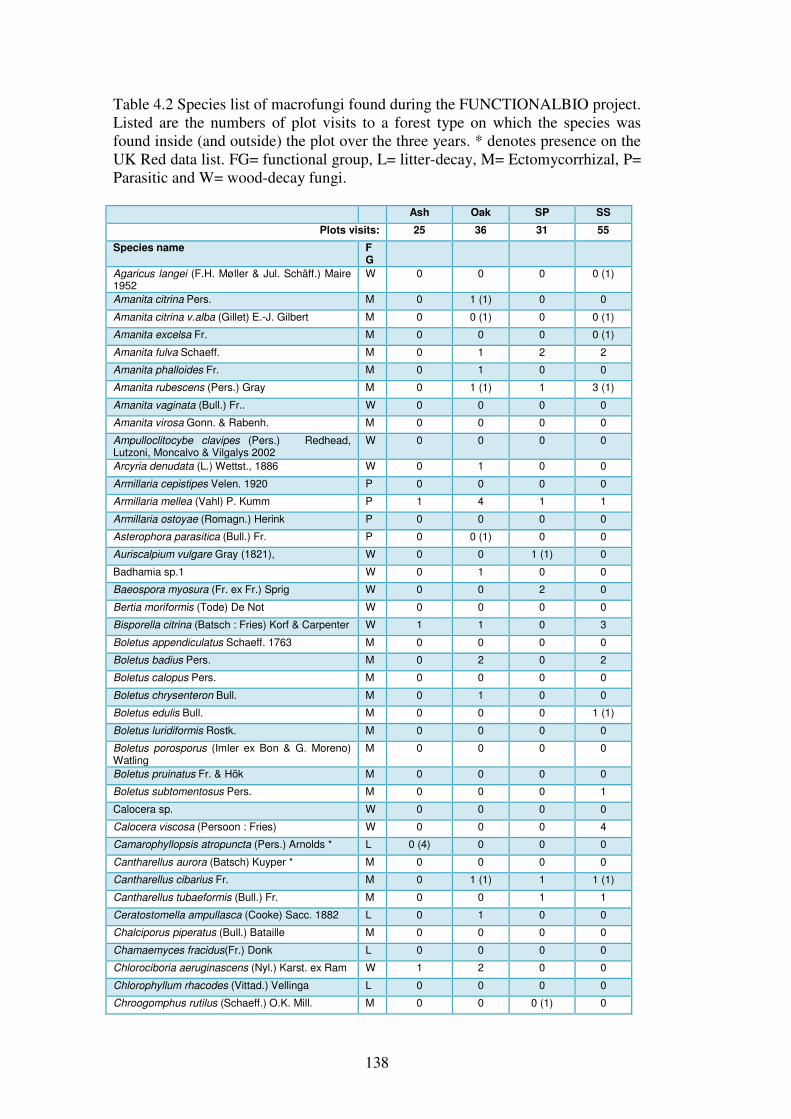
138
Table 4.2 Species list of macrofungi found during the FUNCTIONALBIO project. Listed are the numbers of plot visits to a forest type on which the species was found inside (and outside) the plot over the three years. * denotes presence on the UK Red data list. FG= functional group, L= litter-decay, M= Ectomycorrhizal, P= Parasitic and W= wood-decay fungi. Ash Oak SP SS
Plots visits: 25 36 31 55
Species name FG
Agaricus langei (F.H. Møller & Jul. Schäff.) Maire 1952
W 0 0 0 0 (1)
Amanita citrina Pers. M 0 1 (1) 0 0
Amanita citrina v.alba (Gillet) E.-J. Gilbert M 0 0 (1) 0 0 (1)
Amanita excelsa Fr. M 0 0 0 0 (1)
Amanita fulva Schaeff. M 0 1 2 2
Amanita phalloides Fr. M 0 1 0 0
Amanita rubescens (Pers.) Gray M 0 1 (1) 1 3 (1)
Amanita vaginata (Bull.) Fr.. W 0 0 0 0
Amanita virosa Gonn. & Rabenh. M 0 0 0 0
Ampulloclitocybe clavipes (Pers.) Redhead, Lutzoni, Moncalvo & Vilgalys 2002
W 0 0 0 0
Arcyria denudata (L.) Wettst., 1886 W 0 1 0 0
Armillaria cepistipes Velen. 1920 P 0 0 0 0
Armillaria mellea (Vahl) P. Kumm P 1 4 1 1
Armillaria ostoyae (Romagn.) Herink P 0 0 0 0
Asterophora parasitica (Bull.) Fr. P 0 0 (1) 0 0
Auriscalpium vulgare Gray (1821), W 0 0 1 (1) 0
Badhamia sp.1 W 0 1 0 0
Baeospora myosura (Fr. ex Fr.) Sprig W 0 0 2 0
Bertia moriformis (Tode) De Not W 0 0 0 0
Bisporella citrina (Batsch : Fries) Korf & Carpenter W 1 1 0 3
Boletus appendiculatus Schaeff. 1763 M 0 0 0 0
Boletus badius Pers. M 0 2 0 2
Boletus calopus Pers. M 0 0 0 0
Boletus chrysenteron Bull. M 0 1 0 0
Boletus edulis Bull. M 0 0 0 1 (1)
Boletus luridiformis Rostk. M 0 0 0 0
Boletus porosporus (Imler ex Bon & G. Moreno) Watling
M 0 0 0 0
Boletus pruinatus Fr. & Hök M 0 0 0 0
Boletus subtomentosus Pers. M 0 0 0 1
Calocera sp. W 0 0 0 0
Calocera viscosa (Persoon : Fries) W 0 0 0 4
Camarophyllopsis atropuncta (Pers.) Arnolds * L 0 (4) 0 0 0
Cantharellus aurora (Batsch) Kuyper * M 0 0 0 0
Cantharellus cibarius Fr. M 0 1 (1) 1 1 (1)
Cantharellus tubaeformis (Bull.) Fr. M 0 0 1 1
Ceratostomella ampullasca (Cooke) Sacc. 1882 L 0 1 0 0
Chalciporus piperatus (Bull.) Bataille M 0 0 0 0
Chamaemyces fracidus(Fr.) Donk L 0 0 0 0
Chlorociboria aeruginascens (Nyl.) Karst. ex Ram W 1 2 0 0
Chlorophyllum rhacodes (Vittad.) Vellinga L 0 0 0 0
Chroogomphus rutilus (Schaeff.) O.K. Mill. M 0 0 0 (1) 0
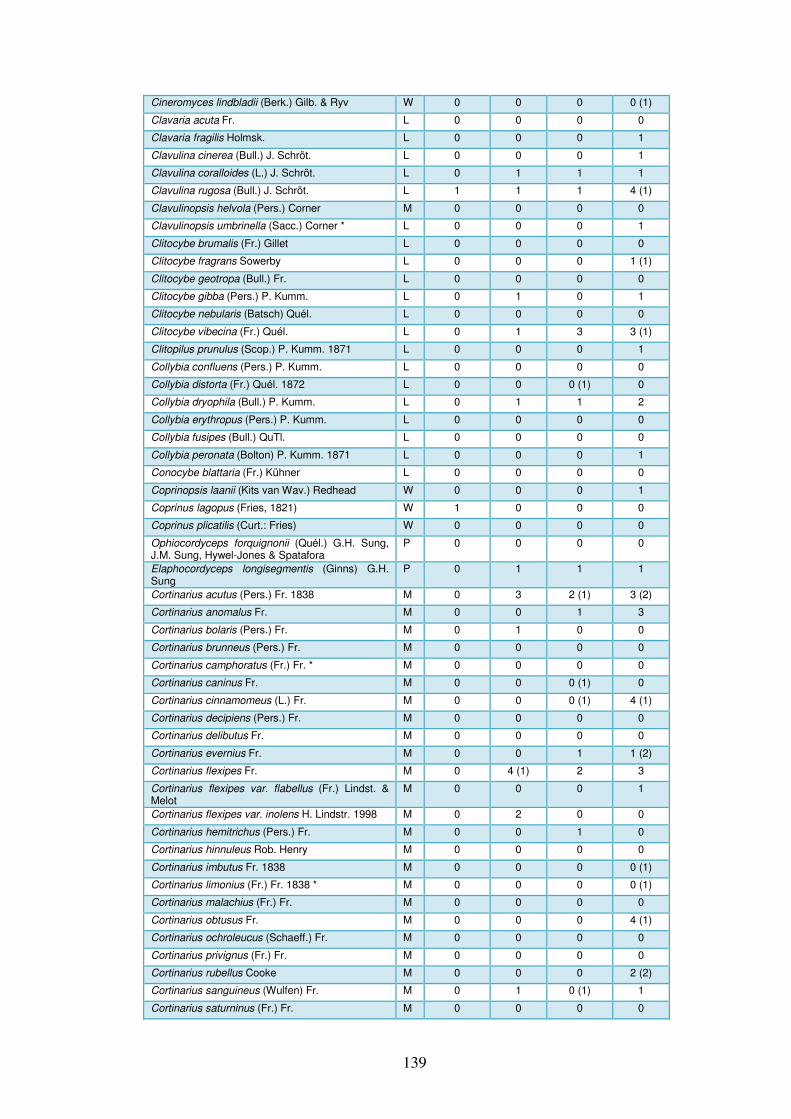
139
Cineromyces lindbladii (Berk.) Gilb. & Ryv W 0 0 0 0 (1)
Clavaria acuta Fr. L 0 0 0 0
Clavaria fragilis Holmsk. L 0 0 0 1
Clavulina cinerea (Bull.) J. Schröt. L 0 0 0 1
Clavulina coralloides (L.) J. Schröt. L 0 1 1 1
Clavulina rugosa (Bull.) J. Schröt. L 1 1 1 4 (1)
Clavulinopsis helvola (Pers.) Corner M 0 0 0 0
Clavulinopsis umbrinella (Sacc.) Corner * L 0 0 0 1
Clitocybe brumalis (Fr.) Gillet L 0 0 0 0
Clitocybe fragrans Sowerby L 0 0 0 1 (1)
Clitocybe geotropa (Bull.) Fr. L 0 0 0 0
Clitocybe gibba (Pers.) P. Kumm. L 0 1 0 1
Clitocybe nebularis (Batsch) Quél. L 0 0 0 0
Clitocybe vibecina (Fr.) Quél. L 0 1 3 3 (1)
Clitopilus prunulus (Scop.) P. Kumm. 1871 L 0 0 0 1
Collybia confluens (Pers.) P. Kumm. L 0 0 0 0
Collybia distorta (Fr.) Quél. 1872 L 0 0 0 (1) 0
Collybia dryophila (Bull.) P. Kumm. L 0 1 1 2
Collybia erythropus (Pers.) P. Kumm. L 0 0 0 0
Collybia fusipes (Bull.) QuTl. L 0 0 0 0
Collybia peronata (Bolton) P. Kumm. 1871 L 0 0 0 1
Conocybe blattaria (Fr.) Kühner L 0 0 0 0
Coprinopsis laanii (Kits van Wav.) Redhead W 0 0 0 1
Coprinus lagopus (Fries, 1821) W 1 0 0 0
Coprinus plicatilis (Curt.: Fries) W 0 0 0 0
Ophiocordyceps forquignonii (Quél.) G.H. Sung, J.M. Sung, Hywel-Jones & Spatafora
P 0 0 0 0
Elaphocordyceps longisegmentis (Ginns) G.H. Sung
P 0 1 1 1
Cortinarius acutus (Pers.) Fr. 1838 M 0 3 2 (1) 3 (2)
Cortinarius anomalus Fr. M 0 0 1 3
Cortinarius bolaris (Pers.) Fr. M 0 1 0 0
Cortinarius brunneus (Pers.) Fr. M 0 0 0 0
Cortinarius camphoratus (Fr.) Fr. * M 0 0 0 0
Cortinarius caninus Fr. M 0 0 0 (1) 0
Cortinarius cinnamomeus (L.) Fr. M 0 0 0 (1) 4 (1)
Cortinarius decipiens (Pers.) Fr. M 0 0 0 0
Cortinarius delibutus Fr. M 0 0 0 0
Cortinarius evernius Fr. M 0 0 1 1 (2)
Cortinarius flexipes Fr. M 0 4 (1) 2 3
Cortinarius flexipes var. flabellus (Fr.) Lindst. & Melot
M 0 0 0 1
Cortinarius flexipes var. inolens H. Lindstr. 1998 M 0 2 0 0
Cortinarius hemitrichus (Pers.) Fr. M 0 0 1 0
Cortinarius hinnuleus Rob. Henry M 0 0 0 0
Cortinarius imbutus Fr. 1838 M 0 0 0 0 (1)
Cortinarius limonius (Fr.) Fr. 1838 * M 0 0 0 0 (1)
Cortinarius malachius (Fr.) Fr. M 0 0 0 0
Cortinarius obtusus Fr. M 0 0 0 4 (1)
Cortinarius ochroleucus (Schaeff.) Fr. M 0 0 0 0
Cortinarius privignus (Fr.) Fr. M 0 0 0 0
Cortinarius rubellus Cooke M 0 0 0 2 (2)
Cortinarius sanguineus (Wulfen) Fr. M 0 1 0 (1) 1
Cortinarius saturninus (Fr.) Fr. M 0 0 0 0
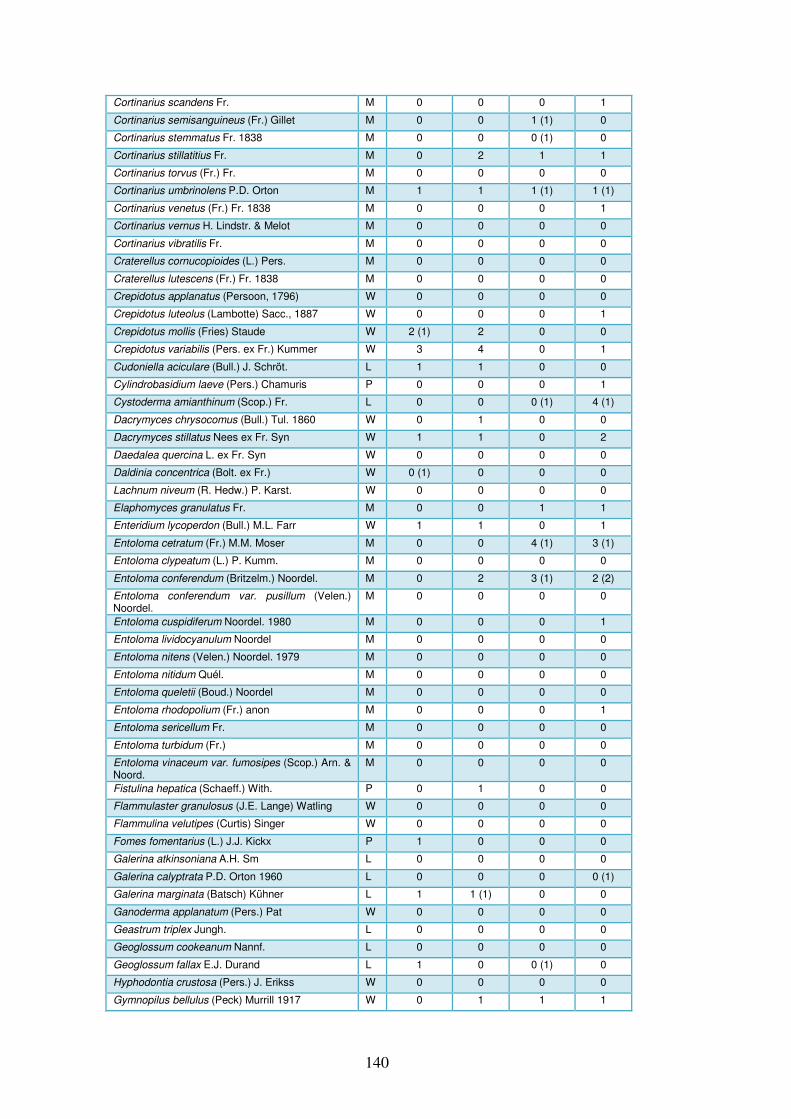
140
Cortinarius scandens Fr. M 0 0 0 1
Cortinarius semisanguineus (Fr.) Gillet M 0 0 1 (1) 0
Cortinarius stemmatus Fr. 1838 M 0 0 0 (1) 0
Cortinarius stillatitius Fr. M 0 2 1 1
Cortinarius torvus (Fr.) Fr. M 0 0 0 0
Cortinarius umbrinolens P.D. Orton M 1 1 1 (1) 1 (1)
Cortinarius venetus (Fr.) Fr. 1838 M 0 0 0 1
Cortinarius vernus H. Lindstr. & Melot M 0 0 0 0
Cortinarius vibratilis Fr. M 0 0 0 0
Craterellus cornucopioides (L.) Pers. M 0 0 0 0
Craterellus lutescens (Fr.) Fr. 1838 M 0 0 0 0
Crepidotus applanatus (Persoon, 1796) W 0 0 0 0
Crepidotus luteolus (Lambotte) Sacc., 1887 W 0 0 0 1
Crepidotus mollis (Fries) Staude W 2 (1) 2 0 0
Crepidotus variabilis (Pers. ex Fr.) Kummer W 3 4 0 1
Cudoniella aciculare (Bull.) J. Schröt. L 1 1 0 0
Cylindrobasidium laeve (Pers.) Chamuris P 0 0 0 1
Cystoderma amianthinum (Scop.) Fr. L 0 0 0 (1) 4 (1)
Dacrymyces chrysocomus (Bull.) Tul. 1860 W 0 1 0 0
Dacrymyces stillatus Nees ex Fr. Syn W 1 1 0 2
Daedalea quercina L. ex Fr. Syn W 0 0 0 0
Daldinia concentrica (Bolt. ex Fr.) W 0 (1) 0 0 0
Lachnum niveum (R. Hedw.) P. Karst. W 0 0 0 0
Elaphomyces granulatus Fr. M 0 0 1 1
Enteridium lycoperdon (Bull.) M.L. Farr W 1 1 0 1
Entoloma cetratum (Fr.) M.M. Moser M 0 0 4 (1) 3 (1)
Entoloma clypeatum (L.) P. Kumm. M 0 0 0 0
Entoloma conferendum (Britzelm.) Noordel. M 0 2 3 (1) 2 (2)
Entoloma conferendum var. pusillum (Velen.) Noordel.
M 0 0 0 0
Entoloma cuspidiferum Noordel. 1980 M 0 0 0 1
Entoloma lividocyanulum Noordel M 0 0 0 0
Entoloma nitens (Velen.) Noordel. 1979 M 0 0 0 0
Entoloma nitidum Quél. M 0 0 0 0
Entoloma queletii (Boud.) Noordel M 0 0 0 0
Entoloma rhodopolium (Fr.) anon M 0 0 0 1
Entoloma sericellum Fr. M 0 0 0 0
Entoloma turbidum (Fr.) M 0 0 0 0
Entoloma vinaceum var. fumosipes (Scop.) Arn. & Noord.
M 0 0 0 0
Fistulina hepatica (Schaeff.) With. P 0 1 0 0
Flammulaster granulosus (J.E. Lange) Watling W 0 0 0 0
Flammulina velutipes (Curtis) Singer W 0 0 0 0
Fomes fomentarius (L.) J.J. Kickx P 1 0 0 0
Galerina atkinsoniana A.H. Sm L 0 0 0 0
Galerina calyptrata P.D. Orton 1960 L 0 0 0 0 (1)
Galerina marginata (Batsch) Kühner L 1 1 (1) 0 0
Ganoderma applanatum (Pers.) Pat W 0 0 0 0
Geastrum triplex Jungh. L 0 0 0 0
Geoglossum cookeanum Nannf. L 0 0 0 0
Geoglossum fallax E.J. Durand L 1 0 0 (1) 0
Hyphodontia crustosa (Pers.) J. Erikss W 0 0 0 0
Gymnopilus bellulus (Peck) Murrill 1917 W 0 1 1 1
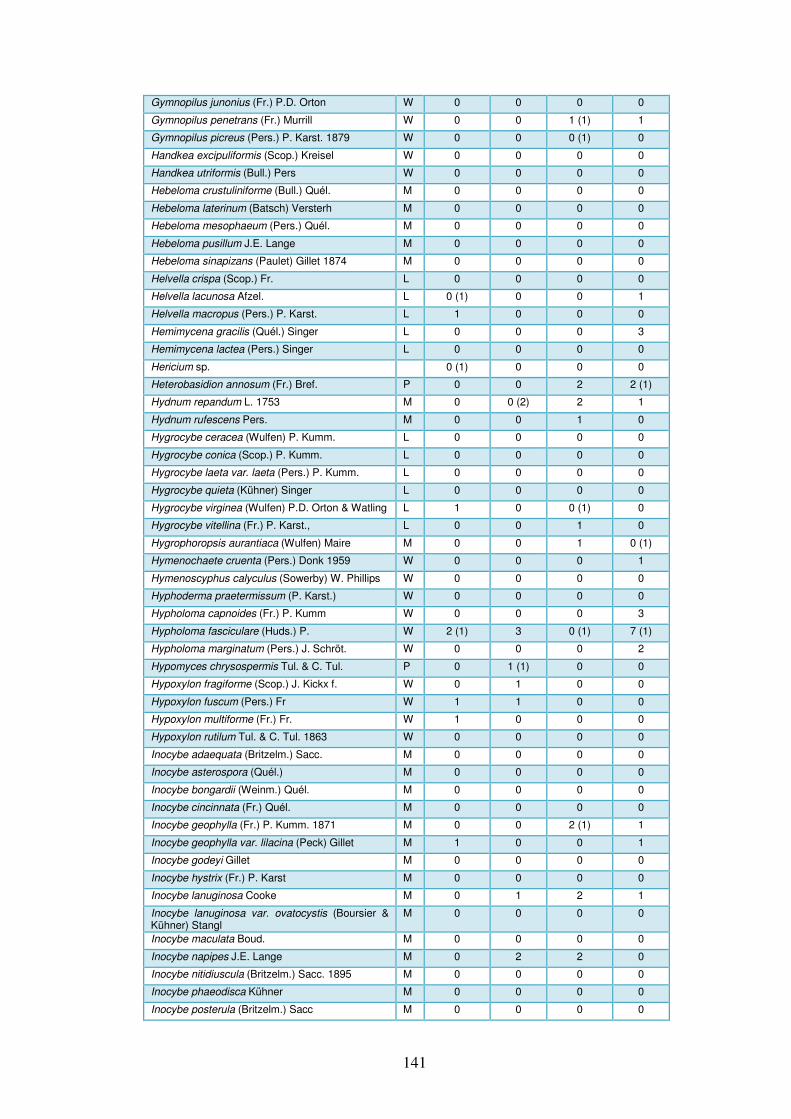
141
Gymnopilus junonius (Fr.) P.D. Orton W 0 0 0 0
Gymnopilus penetrans (Fr.) Murrill W 0 0 1 (1) 1
Gymnopilus picreus (Pers.) P. Karst. 1879 W 0 0 0 (1) 0
Handkea excipuliformis (Scop.) Kreisel W 0 0 0 0
Handkea utriformis (Bull.) Pers W 0 0 0 0
Hebeloma crustuliniforme (Bull.) Quél. M 0 0 0 0
Hebeloma laterinum (Batsch) Versterh M 0 0 0 0
Hebeloma mesophaeum (Pers.) Quél. M 0 0 0 0
Hebeloma pusillum J.E. Lange M 0 0 0 0
Hebeloma sinapizans (Paulet) Gillet 1874 M 0 0 0 0
Helvella crispa (Scop.) Fr. L 0 0 0 0
Helvella lacunosa Afzel. L 0 (1) 0 0 1
Helvella macropus (Pers.) P. Karst. L 1 0 0 0
Hemimycena gracilis (Quél.) Singer L 0 0 0 3
Hemimycena lactea (Pers.) Singer L 0 0 0 0
Hericium sp. 0 (1) 0 0 0
Heterobasidion annosum (Fr.) Bref. P 0 0 2 2 (1)
Hydnum repandum L. 1753 M 0 0 (2) 2 1
Hydnum rufescens Pers. M 0 0 1 0
Hygrocybe ceracea (Wulfen) P. Kumm. L 0 0 0 0
Hygrocybe conica (Scop.) P. Kumm. L 0 0 0 0
Hygrocybe laeta var. laeta (Pers.) P. Kumm. L 0 0 0 0
Hygrocybe quieta (Kühner) Singer L 0 0 0 0
Hygrocybe virginea (Wulfen) P.D. Orton & Watling L 1 0 0 (1) 0
Hygrocybe vitellina (Fr.) P. Karst., L 0 0 1 0
Hygrophoropsis aurantiaca (Wulfen) Maire M 0 0 1 0 (1)
Hymenochaete cruenta (Pers.) Donk 1959 W 0 0 0 1
Hymenoscyphus calyculus (Sowerby) W. Phillips W 0 0 0 0
Hyphoderma praetermissum (P. Karst.) W 0 0 0 0
Hypholoma capnoides (Fr.) P. Kumm W 0 0 0 3
Hypholoma fasciculare (Huds.) P. W 2 (1) 3 0 (1) 7 (1)
Hypholoma marginatum (Pers.) J. Schröt. W 0 0 0 2
Hypomyces chrysospermis Tul. & C. Tul. P 0 1 (1) 0 0
Hypoxylon fragiforme (Scop.) J. Kickx f. W 0 1 0 0
Hypoxylon fuscum (Pers.) Fr W 1 1 0 0
Hypoxylon multiforme (Fr.) Fr. W 1 0 0 0
Hypoxylon rutilum Tul. & C. Tul. 1863 W 0 0 0 0
Inocybe adaequata (Britzelm.) Sacc. M 0 0 0 0
Inocybe asterospora (Quél.) M 0 0 0 0
Inocybe bongardii (Weinm.) Quél. M 0 0 0 0
Inocybe cincinnata (Fr.) Quél. M 0 0 0 0
Inocybe geophylla (Fr.) P. Kumm. 1871 M 0 0 2 (1) 1
Inocybe geophylla var. lilacina (Peck) Gillet M 1 0 0 1
Inocybe godeyi Gillet M 0 0 0 0
Inocybe hystrix (Fr.) P. Karst M 0 0 0 0
Inocybe lanuginosa Cooke M 0 1 2 1
Inocybe lanuginosa var. ovatocystis (Boursier & Kühner) Stangl
M 0 0 0 0
Inocybe maculata Boud. M 0 0 0 0
Inocybe napipes J.E. Lange M 0 2 2 0
Inocybe nitidiuscula (Britzelm.) Sacc. 1895 M 0 0 0 0
Inocybe phaeodisca Kühner M 0 0 0 0
Inocybe posterula (Britzelm.) Sacc M 0 0 0 0
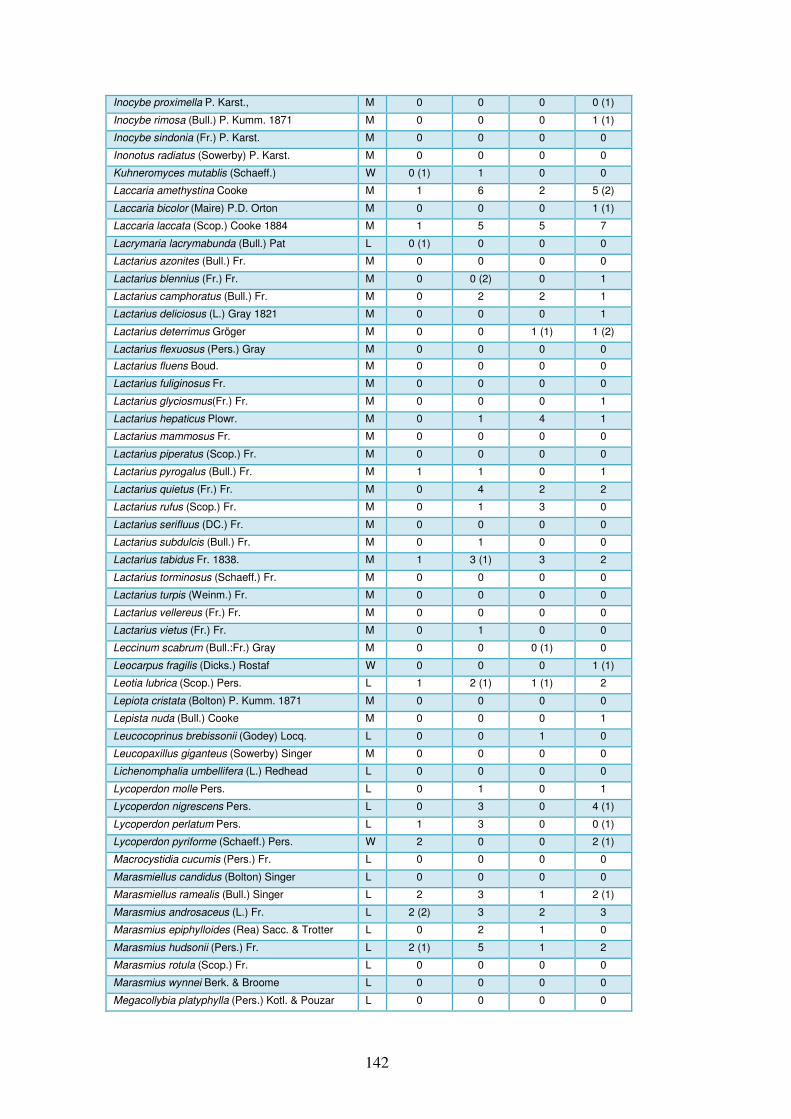
142
Inocybe proximella P. Karst., M 0 0 0 0 (1)
Inocybe rimosa (Bull.) P. Kumm. 1871 M 0 0 0 1 (1)
Inocybe sindonia (Fr.) P. Karst. M 0 0 0 0
Inonotus radiatus (Sowerby) P. Karst. M 0 0 0 0
Kuhneromyces mutablis (Schaeff.) W 0 (1) 1 0 0
Laccaria amethystina Cooke M 1 6 2 5 (2)
Laccaria bicolor (Maire) P.D. Orton M 0 0 0 1 (1)
Laccaria laccata (Scop.) Cooke 1884 M 1 5 5 7
Lacrymaria lacrymabunda (Bull.) Pat L 0 (1) 0 0 0
Lactarius azonites (Bull.) Fr. M 0 0 0 0
Lactarius blennius (Fr.) Fr. M 0 0 (2) 0 1
Lactarius camphoratus (Bull.) Fr. M 0 2 2 1
Lactarius deliciosus (L.) Gray 1821 M 0 0 0 1
Lactarius deterrimus Gröger M 0 0 1 (1) 1 (2)
Lactarius flexuosus (Pers.) Gray M 0 0 0 0
Lactarius fluens Boud. M 0 0 0 0
Lactarius fuliginosus Fr. M 0 0 0 0
Lactarius glyciosmus(Fr.) Fr. M 0 0 0 1
Lactarius hepaticus Plowr. M 0 1 4 1
Lactarius mammosus Fr. M 0 0 0 0
Lactarius piperatus (Scop.) Fr. M 0 0 0 0
Lactarius pyrogalus (Bull.) Fr. M 1 1 0 1
Lactarius quietus (Fr.) Fr. M 0 4 2 2
Lactarius rufus (Scop.) Fr. M 0 1 3 0
Lactarius serifluus (DC.) Fr. M 0 0 0 0
Lactarius subdulcis (Bull.) Fr. M 0 1 0 0
Lactarius tabidus Fr. 1838. M 1 3 (1) 3 2
Lactarius torminosus (Schaeff.) Fr. M 0 0 0 0
Lactarius turpis (Weinm.) Fr. M 0 0 0 0
Lactarius vellereus (Fr.) Fr. M 0 0 0 0
Lactarius vietus (Fr.) Fr. M 0 1 0 0
Leccinum scabrum (Bull.:Fr.) Gray M 0 0 0 (1) 0
Leocarpus fragilis (Dicks.) Rostaf W 0 0 0 1 (1)
Leotia lubrica (Scop.) Pers. L 1 2 (1) 1 (1) 2
Lepiota cristata (Bolton) P. Kumm. 1871 M 0 0 0 0
Lepista nuda (Bull.) Cooke M 0 0 0 1
Leucocoprinus brebissonii (Godey) Locq. L 0 0 1 0
Leucopaxillus giganteus (Sowerby) Singer M 0 0 0 0
Lichenomphalia umbellifera (L.) Redhead L 0 0 0 0
Lycoperdon molle Pers. L 0 1 0 1
Lycoperdon nigrescens Pers. L 0 3 0 4 (1)
Lycoperdon perlatum Pers. L 1 3 0 0 (1)
Lycoperdon pyriforme (Schaeff.) Pers. W 2 0 0 2 (1)
Macrocystidia cucumis (Pers.) Fr. L 0 0 0 0
Marasmiellus candidus (Bolton) Singer L 0 0 0 0
Marasmiellus ramealis (Bull.) Singer L 2 3 1 2 (1)
Marasmius androsaceus (L.) Fr. L 2 (2) 3 2 3
Marasmius epiphylloides (Rea) Sacc. & Trotter L 0 2 1 0
Marasmius hudsonii (Pers.) Fr. L 2 (1) 5 1 2
Marasmius rotula (Scop.) Fr. L 0 0 0 0
Marasmius wynnei Berk. & Broome L 0 0 0 0
Megacollybia platyphylla (Pers.) Kotl. & Pouzar L 0 0 0 0
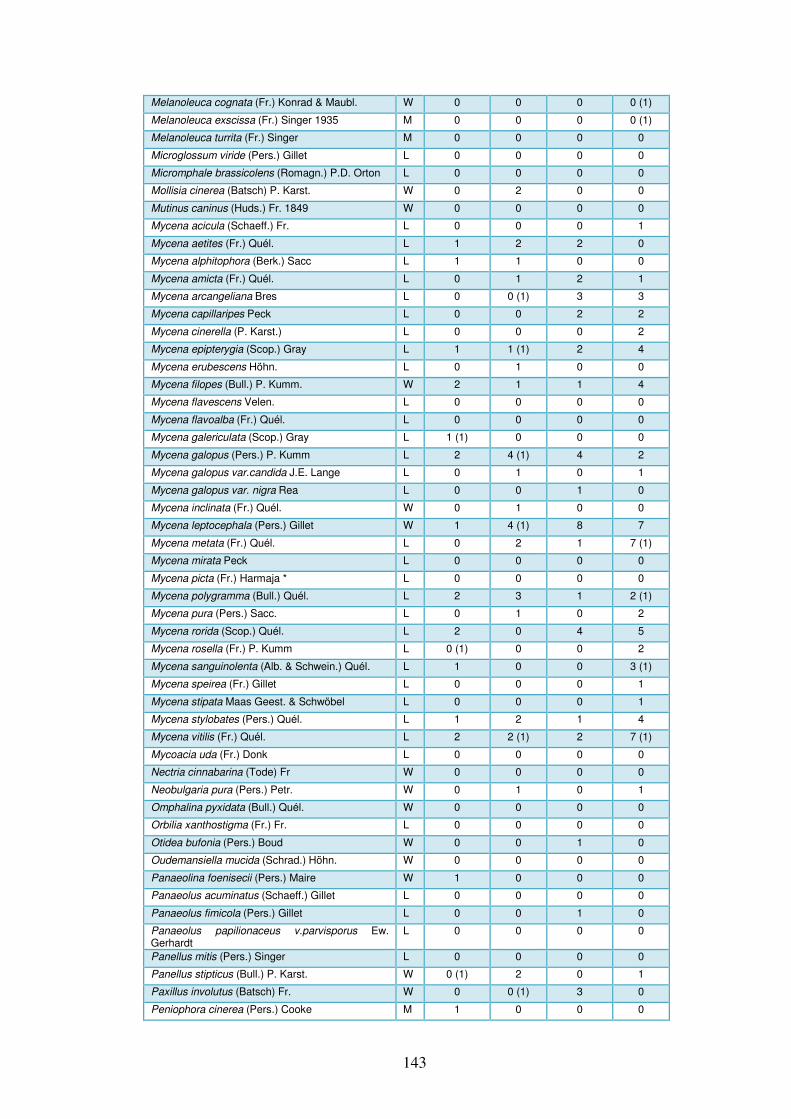
143
Melanoleuca cognata (Fr.) Konrad & Maubl. W 0 0 0 0 (1)
Melanoleuca exscissa (Fr.) Singer 1935 M 0 0 0 0 (1)
Melanoleuca turrita (Fr.) Singer M 0 0 0 0
Microglossum viride (Pers.) Gillet L 0 0 0 0
Micromphale brassicolens (Romagn.) P.D. Orton L 0 0 0 0
Mollisia cinerea (Batsch) P. Karst. W 0 2 0 0
Mutinus caninus (Huds.) Fr. 1849 W 0 0 0 0
Mycena acicula (Schaeff.) Fr. L 0 0 0 1
Mycena aetites (Fr.) Quél. L 1 2 2 0
Mycena alphitophora (Berk.) Sacc L 1 1 0 0
Mycena amicta (Fr.) Quél. L 0 1 2 1
Mycena arcangeliana Bres L 0 0 (1) 3 3
Mycena capillaripes Peck L 0 0 2 2
Mycena cinerella (P. Karst.) L 0 0 0 2
Mycena epipterygia (Scop.) Gray L 1 1 (1) 2 4
Mycena erubescens Höhn. L 0 1 0 0
Mycena filopes (Bull.) P. Kumm. W 2 1 1 4
Mycena flavescens Velen. L 0 0 0 0
Mycena flavoalba (Fr.) Quél. L 0 0 0 0
Mycena galericulata (Scop.) Gray L 1 (1) 0 0 0
Mycena galopus (Pers.) P. Kumm L 2 4 (1) 4 2
Mycena galopus var.candida J.E. Lange L 0 1 0 1
Mycena galopus var. nigra Rea L 0 0 1 0
Mycena inclinata (Fr.) Quél. W 0 1 0 0
Mycena leptocephala (Pers.) Gillet W 1 4 (1) 8 7
Mycena metata (Fr.) Quél. L 0 2 1 7 (1)
Mycena mirata Peck L 0 0 0 0
Mycena picta (Fr.) Harmaja * L 0 0 0 0
Mycena polygramma (Bull.) Quél. L 2 3 1 2 (1)
Mycena pura (Pers.) Sacc. L 0 1 0 2
Mycena rorida (Scop.) Quél. L 2 0 4 5
Mycena rosella (Fr.) P. Kumm L 0 (1) 0 0 2
Mycena sanguinolenta (Alb. & Schwein.) Quél. L 1 0 0 3 (1)
Mycena speirea (Fr.) Gillet L 0 0 0 1
Mycena stipata Maas Geest. & Schwöbel L 0 0 0 1
Mycena stylobates (Pers.) Quél. L 1 2 1 4
Mycena vitilis (Fr.) Quél. L 2 2 (1) 2 7 (1)
Mycoacia uda (Fr.) Donk L 0 0 0 0
Nectria cinnabarina (Tode) Fr W 0 0 0 0
Neobulgaria pura (Pers.) Petr. W 0 1 0 1
Omphalina pyxidata (Bull.) Quél. W 0 0 0 0
Orbilia xanthostigma (Fr.) Fr. L 0 0 0 0
Otidea bufonia (Pers.) Boud W 0 0 1 0
Oudemansiella mucida (Schrad.) Höhn. W 0 0 0 0
Panaeolina foenisecii (Pers.) Maire W 1 0 0 0
Panaeolus acuminatus (Schaeff.) Gillet L 0 0 0 0
Panaeolus fimicola (Pers.) Gillet L 0 0 1 0
Panaeolus papilionaceus v.parvisporus Ew. Gerhardt
L 0 0 0 0
Panellus mitis (Pers.) Singer L 0 0 0 0
Panellus stipticus (Bull.) P. Karst. W 0 (1) 2 0 1
Paxillus involutus (Batsch) Fr. W 0 0 (1) 3 0
Peniophora cinerea (Pers.) Cooke M 1 0 0 0
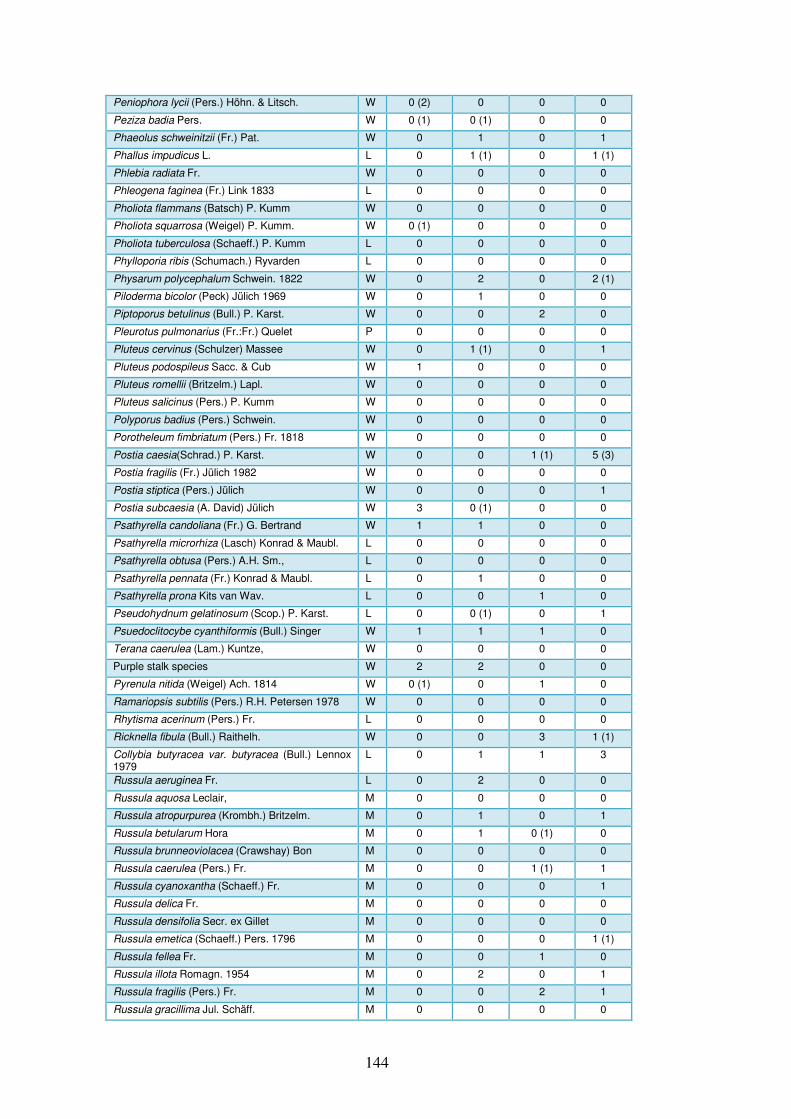
144
Peniophora lycii (Pers.) Höhn. & Litsch. W 0 (2) 0 0 0
Peziza badia Pers. W 0 (1) 0 (1) 0 0
Phaeolus schweinitzii (Fr.) Pat. W 0 1 0 1
Phallus impudicus L. L 0 1 (1) 0 1 (1)
Phlebia radiata Fr. W 0 0 0 0
Phleogena faginea (Fr.) Link 1833 L 0 0 0 0
Pholiota flammans (Batsch) P. Kumm W 0 0 0 0
Pholiota squarrosa (Weigel) P. Kumm. W 0 (1) 0 0 0
Pholiota tuberculosa (Schaeff.) P. Kumm L 0 0 0 0
Phylloporia ribis (Schumach.) Ryvarden L 0 0 0 0
Physarum polycephalum Schwein. 1822 W 0 2 0 2 (1)
Piloderma bicolor (Peck) Jülich 1969 W 0 1 0 0
Piptoporus betulinus (Bull.) P. Karst. W 0 0 2 0
Pleurotus pulmonarius (Fr.:Fr.) Quelet P 0 0 0 0
Pluteus cervinus (Schulzer) Massee W 0 1 (1) 0 1
Pluteus podospileus Sacc. & Cub W 1 0 0 0
Pluteus romellii (Britzelm.) Lapl. W 0 0 0 0
Pluteus salicinus (Pers.) P. Kumm W 0 0 0 0
Polyporus badius (Pers.) Schwein. W 0 0 0 0
Porotheleum fimbriatum (Pers.) Fr. 1818 W 0 0 0 0
Postia caesia(Schrad.) P. Karst. W 0 0 1 (1) 5 (3)
Postia fragilis (Fr.) Jülich 1982 W 0 0 0 0
Postia stiptica (Pers.) Jülich W 0 0 0 1
Postia subcaesia (A. David) Jülich W 3 0 (1) 0 0
Psathyrella candoliana (Fr.) G. Bertrand W 1 1 0 0
Psathyrella microrhiza (Lasch) Konrad & Maubl. L 0 0 0 0
Psathyrella obtusa (Pers.) A.H. Sm., L 0 0 0 0
Psathyrella pennata (Fr.) Konrad & Maubl. L 0 1 0 0
Psathyrella prona Kits van Wav. L 0 0 1 0
Pseudohydnum gelatinosum (Scop.) P. Karst. L 0 0 (1) 0 1
Psuedoclitocybe cyanthiformis (Bull.) Singer W 1 1 1 0
Terana caerulea (Lam.) Kuntze, W 0 0 0 0
Purple stalk species W 2 2 0 0
Pyrenula nitida (Weigel) Ach. 1814 W 0 (1) 0 1 0
Ramariopsis subtilis (Pers.) R.H. Petersen 1978 W 0 0 0 0
Rhytisma acerinum (Pers.) Fr. L 0 0 0 0
Ricknella fibula (Bull.) Raithelh. W 0 0 3 1 (1)
Collybia butyracea var. butyracea (Bull.) Lennox 1979
L 0 1 1 3
Russula aeruginea Fr. L 0 2 0 0
Russula aquosa Leclair, M 0 0 0 0
Russula atropurpurea (Krombh.) Britzelm. M 0 1 0 1
Russula betularum Hora M 0 1 0 (1) 0
Russula brunneoviolacea (Crawshay) Bon M 0 0 0 0
Russula caerulea (Pers.) Fr. M 0 0 1 (1) 1
Russula cyanoxantha (Schaeff.) Fr. M 0 0 0 1
Russula delica Fr. M 0 0 0 0
Russula densifolia Secr. ex Gillet M 0 0 0 0
Russula emetica (Schaeff.) Pers. 1796 M 0 0 0 1 (1)
Russula fellea Fr. M 0 0 1 0
Russula illota Romagn. 1954 M 0 2 0 1
Russula fragilis (Pers.) Fr. M 0 0 2 1
Russula gracillima Jul. Schäff. M 0 0 0 0
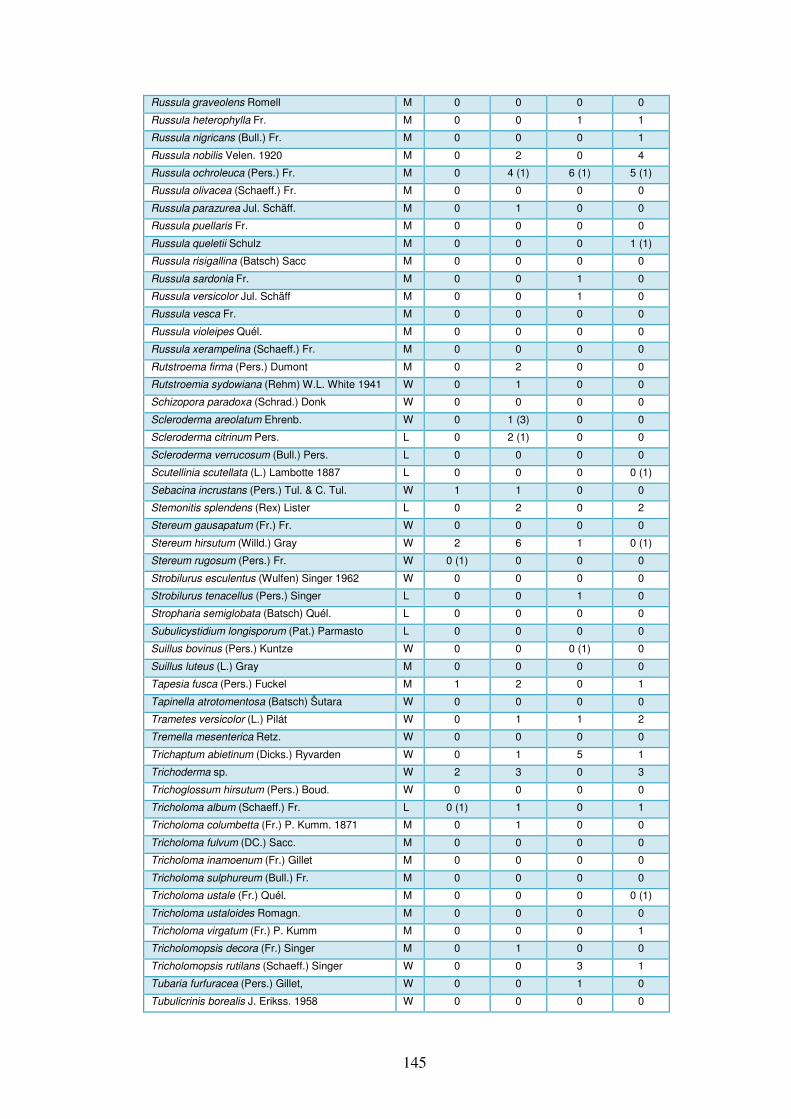
145
Russula graveolens Romell M 0 0 0 0
Russula heterophylla Fr. M 0 0 1 1
Russula nigricans (Bull.) Fr. M 0 0 0 1
Russula nobilis Velen. 1920 M 0 2 0 4
Russula ochroleuca (Pers.) Fr. M 0 4 (1) 6 (1) 5 (1)
Russula olivacea (Schaeff.) Fr. M 0 0 0 0
Russula parazurea Jul. Schäff. M 0 1 0 0
Russula puellaris Fr. M 0 0 0 0
Russula queletii Schulz M 0 0 0 1 (1)
Russula risigallina (Batsch) Sacc M 0 0 0 0
Russula sardonia Fr. M 0 0 1 0
Russula versicolor Jul. Schäff M 0 0 1 0
Russula vesca Fr. M 0 0 0 0
Russula violeipes Quél. M 0 0 0 0
Russula xerampelina (Schaeff.) Fr. M 0 0 0 0
Rutstroema firma (Pers.) Dumont M 0 2 0 0
Rutstroemia sydowiana (Rehm) W.L. White 1941 W 0 1 0 0
Schizopora paradoxa (Schrad.) Donk W 0 0 0 0
Scleroderma areolatum Ehrenb. W 0 1 (3) 0 0
Scleroderma citrinum Pers. L 0 2 (1) 0 0
Scleroderma verrucosum (Bull.) Pers. L 0 0 0 0
Scutellinia scutellata (L.) Lambotte 1887 L 0 0 0 0 (1)
Sebacina incrustans (Pers.) Tul. & C. Tul. W 1 1 0 0
Stemonitis splendens (Rex) Lister L 0 2 0 2
Stereum gausapatum (Fr.) Fr. W 0 0 0 0
Stereum hirsutum (Willd.) Gray W 2 6 1 0 (1)
Stereum rugosum (Pers.) Fr. W 0 (1) 0 0 0
Strobilurus esculentus (Wulfen) Singer 1962 W 0 0 0 0
Strobilurus tenacellus (Pers.) Singer L 0 0 1 0
Stropharia semiglobata (Batsch) Quél. L 0 0 0 0
Subulicystidium longisporum (Pat.) Parmasto L 0 0 0 0
Suillus bovinus (Pers.) Kuntze W 0 0 0 (1) 0
Suillus luteus (L.) Gray M 0 0 0 0
Tapesia fusca (Pers.) Fuckel M 1 2 0 1
Tapinella atrotomentosa (Batsch) Šutara W 0 0 0 0
Trametes versicolor (L.) Pilát W 0 1 1 2
Tremella mesenterica Retz. W 0 0 0 0
Trichaptum abietinum (Dicks.) Ryvarden W 0 1 5 1
Trichoderma sp. W 2 3 0 3
Trichoglossum hirsutum (Pers.) Boud. W 0 0 0 0
Tricholoma album (Schaeff.) Fr. L 0 (1) 1 0 1
Tricholoma columbetta (Fr.) P. Kumm. 1871 M 0 1 0 0
Tricholoma fulvum (DC.) Sacc. M 0 0 0 0
Tricholoma inamoenum (Fr.) Gillet M 0 0 0 0
Tricholoma sulphureum (Bull.) Fr. M 0 0 0 0
Tricholoma ustale (Fr.) Quél. M 0 0 0 0 (1)
Tricholoma ustaloides Romagn. M 0 0 0 0
Tricholoma virgatum (Fr.) P. Kumm M 0 0 0 1
Tricholomopsis decora (Fr.) Singer M 0 1 0 0
Tricholomopsis rutilans (Schaeff.) Singer W 0 0 3 1
Tubaria furfuracea (Pers.) Gillet, W 0 0 1 0
Tubulicrinis borealis J. Erikss. 1958 W 0 0 0 0

146
Tylopilus felleus (Bull.) P. Karst. W 0 0 0 0
Vuilleminia comedens (Nees) Maire W 0 0 0 0
Xylaria carpophila (Pers.) Fr. W 2 1 0 0
Xylaria hypoxylon (L.) Grev. W 4 5 0 2
Xylaria longipes Nitschke W 0 0 0 0
Xylaria polymorpha (Pers.) Grev. W 0 (1) 0 0 0
New species recorded in the Republic of Ireland
Of the total 409 species recorded, 119 are recorded as “common” in Ireland, 37
are “occasional” (Legon and Henrici 2005), and 205 although previously found in
Ireland are of uncertain distribution. The remaining 48 species are possible new
records for Ireland and are awaiting confirmation by referees (Table 4.3).
Camarophyllopsis atropuncta (Folder 2, Appendix 1) was not found until 2010,
when it was found in two of the semi-natural ash sites (Killough and St John’s
wood). It was found multiple times during 2010 in these two sites from late
August to late October. The habitat in which it was found closely matches the
known habitats for the species in the U.K. (Legon and Henrici 2005). Cortinarius
camphoratus (Folder 2, Appendix 1) was found in 2010 outside of the
Derryhogan plot under a >50 year-old spruce/pine mixture of trees planted on a
bog. The habitat matches that of the known habitats from U.K. It was only found
once during the study. Cortinarius limonius (Folder 2, Appendix 1) was found
outside the Bohatch plot (Site: Bohat) under Sitka spruce in 2008. It was only
found once during the study. Its habitat is described by Legon and Henrici (2005)
as “pine on boggy soils”. Mycena picta was found in a beech site at Carrowgarrif
in County Clare in 2007, which was not subsequently visited in the study. The
habitat where it was found matches the habitat for the species in the U.K. as listed
by Legon and Henrici (2005).
Five species in the total list (Cantharellus aurora, Camarophyllopsis
atropuncta, Cortinarius camphoratus, Cortinarius limonius and Mycena picta) are
listed as of conservation importance in the British Red Data List (Ing 1992; Evans
et al. 2003). Cantharellus aurora was found under Sitka spruce and Scot’s pine
outside the plot at Bansha Wood (Site Bansha). While it was found only once
during the study, anecdotal evidence suggests that it is more widely distributed in
Ireland than in the U.K.
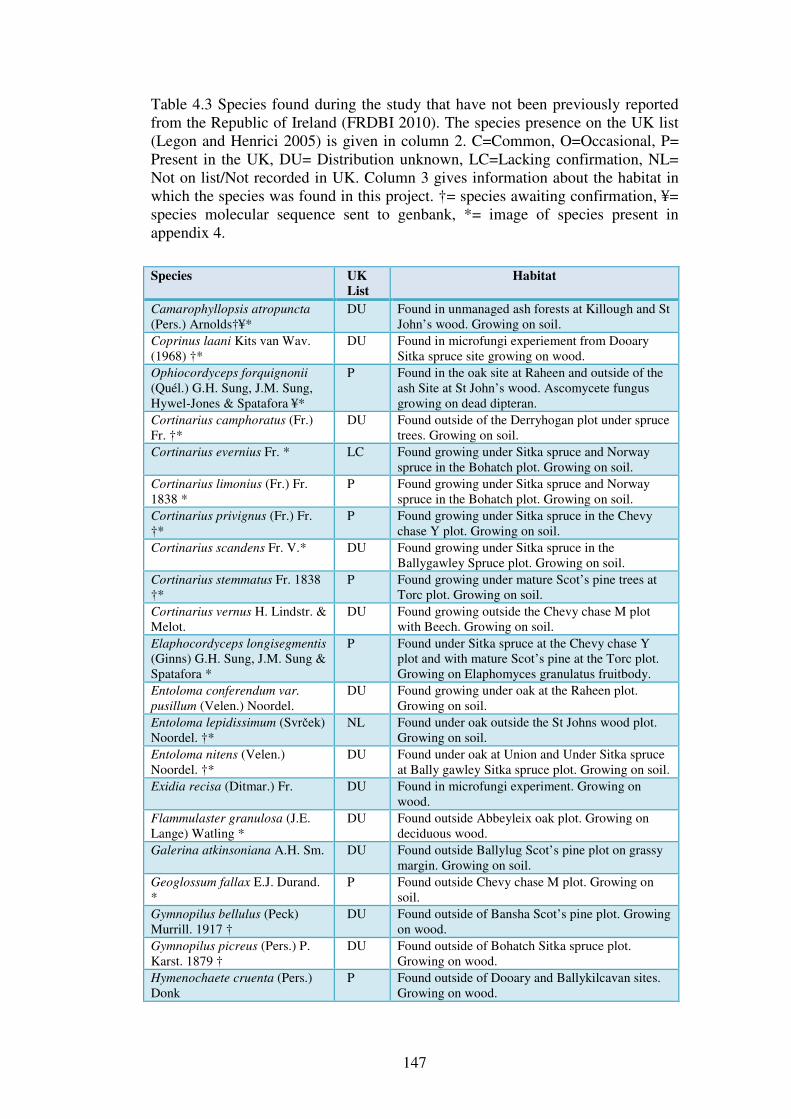
147
Table 4.3 Species found during the study that have not been previously reported from the Republic of Ireland (FRDBI 2010). The species presence on the UK list (Legon and Henrici 2005) is given in column 2. C=Common, O=Occasional, P= Present in the UK, DU= Distribution unknown, LC=Lacking confirmation, NL= Not on list/Not recorded in UK. Column 3 gives information about the habitat in which the species was found in this project. †= species awaiting confirmation, ¥= species molecular sequence sent to genbank, *= image of species present in appendix 4.
Species UK
List
Habitat
Camarophyllopsis atropuncta (Pers.) Arnolds†¥*
DU Found in unmanaged ash forests at Killough and St John’s wood. Growing on soil.
Coprinus laani Kits van Wav. (1968) †*
DU Found in microfungi experiement from Dooary Sitka spruce site growing on wood.
Ophiocordyceps forquignonii (Quél.) G.H. Sung, J.M. Sung, Hywel-Jones & Spatafora ¥*
P Found in the oak site at Raheen and outside of the ash Site at St John’s wood. Ascomycete fungus growing on dead dipteran.
Cortinarius camphoratus (Fr.) Fr. †*
DU Found outside of the Derryhogan plot under spruce trees. Growing on soil.
Cortinarius evernius Fr. *
LC Found growing under Sitka spruce and Norway
spruce in the Bohatch plot. Growing on soil.
Cortinarius limonius (Fr.) Fr. 1838 *
P Found growing under Sitka spruce and Norway spruce in the Bohatch plot. Growing on soil.
Cortinarius privignus (Fr.) Fr. †*
P Found growing under Sitka spruce in the Chevy chase Y plot. Growing on soil.
Cortinarius scandens Fr. V.* DU Found growing under Sitka spruce in the Ballygawley Spruce plot. Growing on soil.
Cortinarius stemmatus Fr. 1838 †*
P Found growing under mature Scot’s pine trees at Torc plot. Growing on soil.
Cortinarius vernus H. Lindstr. & Melot.
DU Found growing outside the Chevy chase M plot with Beech. Growing on soil.
Elaphocordyceps longisegmentis (Ginns) G.H. Sung, J.M. Sung & Spatafora *
P Found under Sitka spruce at the Chevy chase Y plot and with mature Scot’s pine at the Torc plot. Growing on Elaphomyces granulatus fruitbody.
Entoloma conferendum var.
pusillum (Velen.) Noordel. DU Found growing under oak at the Raheen plot.
Growing on soil.
Entoloma lepidissimum (Svrček) Noordel. †*
NL Found under oak outside the St Johns wood plot. Growing on soil.
Entoloma nitens (Velen.) Noordel. †*
DU Found under oak at Union and Under Sitka spruce at Bally gawley Sitka spruce plot. Growing on soil.
Exidia recisa (Ditmar.) Fr.
DU Found in microfungi experiment. Growing on wood.
Flammulaster granulosa (J.E. Lange) Watling *
DU Found outside Abbeyleix oak plot. Growing on deciduous wood.
Galerina atkinsoniana A.H. Sm. DU Found outside Ballylug Scot’s pine plot on grassy margin. Growing on soil.
Geoglossum fallax E.J. Durand. *
P Found outside Chevy chase M plot. Growing on soil.
Gymnopilus bellulus (Peck) Murrill. 1917 †
DU Found outside of Bansha Scot’s pine plot. Growing on wood.
Gymnopilus picreus (Pers.) P. Karst. 1879 †
DU Found outside of Bohatch Sitka spruce plot. Growing on wood.
Hymenochaete cruenta (Pers.) Donk
P Found outside of Dooary and Ballykilcavan sites. Growing on wood.
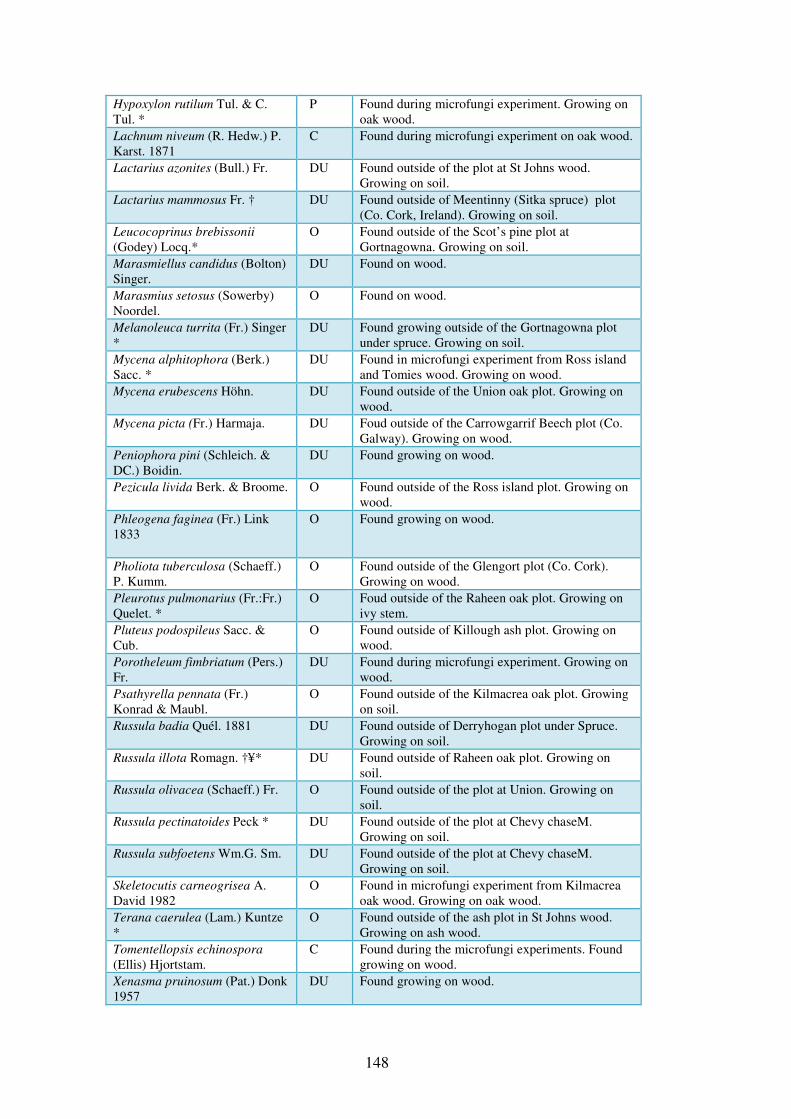
148
Hypoxylon rutilum Tul. & C. Tul. *
P Found during microfungi experiment. Growing on oak wood.
Lachnum niveum (R. Hedw.) P. Karst. 1871
C Found during microfungi experiment on oak wood.
Lactarius azonites (Bull.) Fr. DU Found outside of the plot at St Johns wood. Growing on soil.
Lactarius mammosus Fr. † DU Found outside of Meentinny (Sitka spruce) plot (Co. Cork, Ireland). Growing on soil.
Leucocoprinus brebissonii
(Godey) Locq.* O Found outside of the Scot’s pine plot at
Gortnagowna. Growing on soil.
Marasmiellus candidus (Bolton) Singer.
DU Found on wood.
Marasmius setosus (Sowerby) Noordel.
O Found on wood.
Melanoleuca turrita (Fr.) Singer *
DU Found growing outside of the Gortnagowna plot under spruce. Growing on soil.
Mycena alphitophora (Berk.) Sacc. *
DU Found in microfungi experiment from Ross island and Tomies wood. Growing on wood.
Mycena erubescens Höhn.
DU Found outside of the Union oak plot. Growing on wood.
Mycena picta (Fr.) Harmaja. DU Foud outside of the Carrowgarrif Beech plot (Co. Galway). Growing on wood.
Peniophora pini (Schleich. & DC.) Boidin.
DU Found growing on wood.
Pezicula livida Berk. & Broome. O Found outside of the Ross island plot. Growing on wood.
Phleogena faginea (Fr.) Link 1833
O Found growing on wood.
Pholiota tuberculosa (Schaeff.) P. Kumm.
O Found outside of the Glengort plot (Co. Cork). Growing on wood.
Pleurotus pulmonarius (Fr.:Fr.) Quelet. *
O Foud outside of the Raheen oak plot. Growing on ivy stem.
Pluteus podospileus Sacc. & Cub.
O Found outside of Killough ash plot. Growing on wood.
Porotheleum fimbriatum (Pers.) Fr.
DU Found during microfungi experiment. Growing on wood.
Psathyrella pennata (Fr.) Konrad & Maubl.
O Found outside of the Kilmacrea oak plot. Growing on soil.
Russula badia Quél. 1881 DU Found outside of Derryhogan plot under Spruce. Growing on soil.
Russula illota Romagn. †¥* DU Found outside of Raheen oak plot. Growing on soil.
Russula olivacea (Schaeff.) Fr. O Found outside of the plot at Union. Growing on soil.
Russula pectinatoides Peck * DU Found outside of the plot at Chevy chaseM. Growing on soil.
Russula subfoetens Wm.G. Sm. DU Found outside of the plot at Chevy chaseM. Growing on soil.
Skeletocutis carneogrisea A. David 1982
O Found in microfungi experiment from Kilmacrea oak wood. Growing on oak wood.
Terana caerulea (Lam.) Kuntze *
O Found outside of the ash plot in St Johns wood. Growing on ash wood.
Tomentellopsis echinospora
(Ellis) Hjortstam. C Found during the microfungi experiments. Found
growing on wood.
Xenasma pruinosum (Pat.) Donk 1957
DU Found growing on wood.
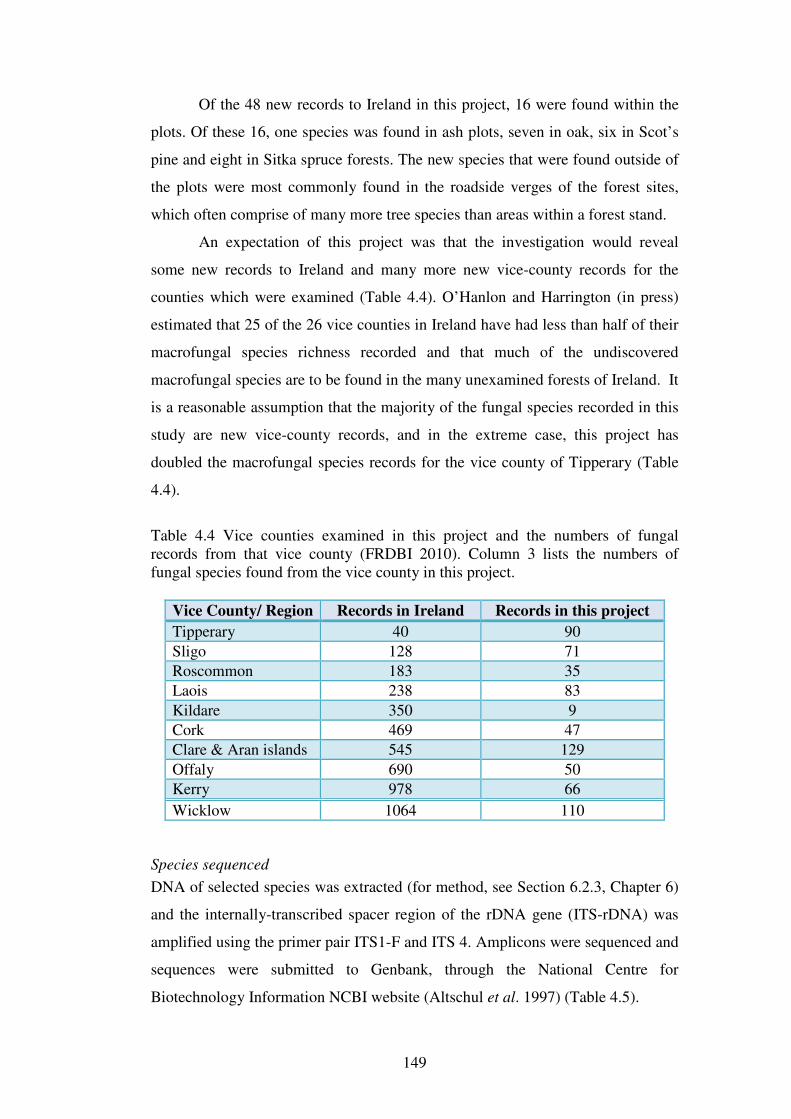
149
Of the 48 new records to Ireland in this project, 16 were found within the
plots. Of these 16, one species was found in ash plots, seven in oak, six in Scot’s
pine and eight in Sitka spruce forests. The new species that were found outside of
the plots were most commonly found in the roadside verges of the forest sites,
which often comprise of many more tree species than areas within a forest stand.
An expectation of this project was that the investigation would reveal
some new records to Ireland and many more new vice-county records for the
counties which were examined (Table 4.4). O’Hanlon and Harrington (in press)
estimated that 25 of the 26 vice counties in Ireland have had less than half of their
macrofungal species richness recorded and that much of the undiscovered
macrofungal species are to be found in the many unexamined forests of Ireland. It
is a reasonable assumption that the majority of the fungal species recorded in this
study are new vice-county records, and in the extreme case, this project has
doubled the macrofungal species records for the vice county of Tipperary (Table
4.4).
Table 4.4 Vice counties examined in this project and the numbers of fungal records from that vice county (FRDBI 2010). Column 3 lists the numbers of fungal species found from the vice county in this project.
Vice County/ Region Records in Ireland Records in this project
Tipperary 40 90
Sligo 128 71
Roscommon 183 35
Laois 238 83
Kildare 350 9
Cork 469 47
Clare & Aran islands 545 129
Offaly 690 50
Kerry 978 66
Wicklow 1064 110
Species sequenced
DNA of selected species was extracted (for method, see Section 6.2.3, Chapter 6)
and the internally-transcribed spacer region of the rDNA gene (ITS-rDNA) was
amplified using the primer pair ITS1-F and ITS 4. Amplicons were sequenced and
sequences were submitted to Genbank, through the National Centre for
Biotechnology Information NCBI website (Altschul et al. 1997) (Table 4.5).
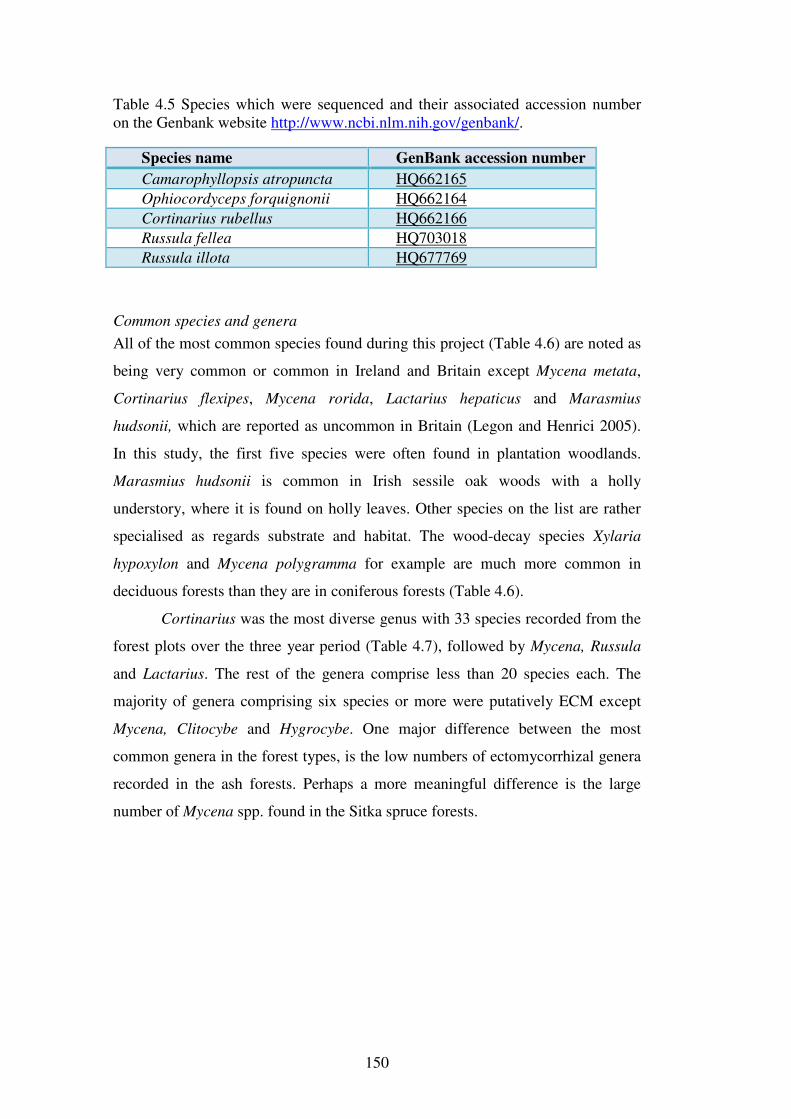
150
Table 4.5 Species which were sequenced and their associated accession number on the Genbank website http://www.ncbi.nlm.nih.gov/genbank/.
Species name GenBank accession number
Camarophyllopsis atropuncta HQ662165
Ophiocordyceps forquignonii HQ662164
Cortinarius rubellus HQ662166
Russula fellea HQ703018
Russula illota HQ677769
Common species and genera
All of the most common species found during this project (Table 4.6) are noted as
being very common or common in Ireland and Britain except Mycena metata,
Cortinarius flexipes, Mycena rorida, Lactarius hepaticus and Marasmius
hudsonii, which are reported as uncommon in Britain (Legon and Henrici 2005).
In this study, the first five species were often found in plantation woodlands.
Marasmius hudsonii is common in Irish sessile oak woods with a holly
understory, where it is found on holly leaves. Other species on the list are rather
specialised as regards substrate and habitat. The wood-decay species Xylaria
hypoxylon and Mycena polygramma for example are much more common in
deciduous forests than they are in coniferous forests (Table 4.6).
Cortinarius was the most diverse genus with 33 species recorded from the
forest plots over the three year period (Table 4.7), followed by Mycena, Russula
and Lactarius. The rest of the genera comprise less than 20 species each. The
majority of genera comprising six species or more were putatively ECM except
Mycena, Clitocybe and Hygrocybe. One major difference between the most
common genera in the forest types, is the low numbers of ectomycorrhizal genera
recorded in the ash forests. Perhaps a more meaningful difference is the large
number of Mycena spp. found in the Sitka spruce forests.
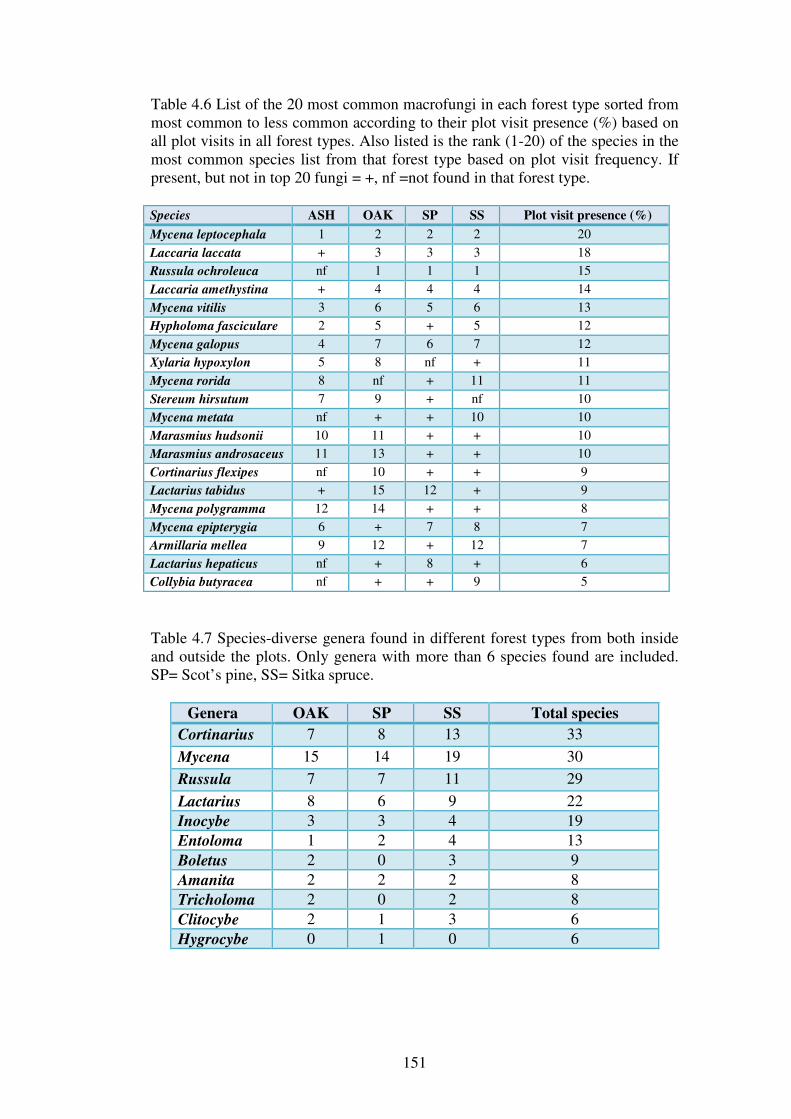
151
Table 4.6 List of the 20 most common macrofungi in each forest type sorted from most common to less common according to their plot visit presence (%) based on all plot visits in all forest types. Also listed is the rank (1-20) of the species in the most common species list from that forest type based on plot visit frequency. If present, but not in top 20 fungi = +, nf =not found in that forest type. Species ASH OAK SP SS Plot visit presence (%)
Mycena leptocephala 1 2 2 2 20
Laccaria laccata + 3 3 3 18
Russula ochroleuca nf 1 1 1 15
Laccaria amethystina + 4 4 4 14
Mycena vitilis 3 6 5 6 13
Hypholoma fasciculare 2 5 + 5 12
Mycena galopus 4 7 6 7 12
Xylaria hypoxylon 5 8 nf + 11
Mycena rorida 8 nf + 11 11
Stereum hirsutum 7 9 + nf 10
Mycena metata nf + + 10 10
Marasmius hudsonii 10 11 + + 10
Marasmius androsaceus 11 13 + + 10
Cortinarius flexipes nf 10 + + 9
Lactarius tabidus + 15 12 + 9
Mycena polygramma 12 14 + + 8
Mycena epipterygia 6 + 7 8 7
Armillaria mellea 9 12 + 12 7
Lactarius hepaticus nf + 8 + 6
Collybia butyracea nf + + 9 5
Table 4.7 Species-diverse genera found in different forest types from both inside and outside the plots. Only genera with more than 6 species found are included. SP= Scot’s pine, SS= Sitka spruce.
Genera OAK SP SS Total species
Cortinarius 7 8 13 33
Mycena 15 14 19 30
Russula 7 7 11 29
Lactarius 8 6 9 22
Inocybe 3 3 4 19
Entoloma 1 2 4 13
Boletus 2 0 3 9
Amanita 2 2 2 8
Tricholoma 2 0 2 8
Clitocybe 2 1 3 6
Hygrocybe 0 1 0 6
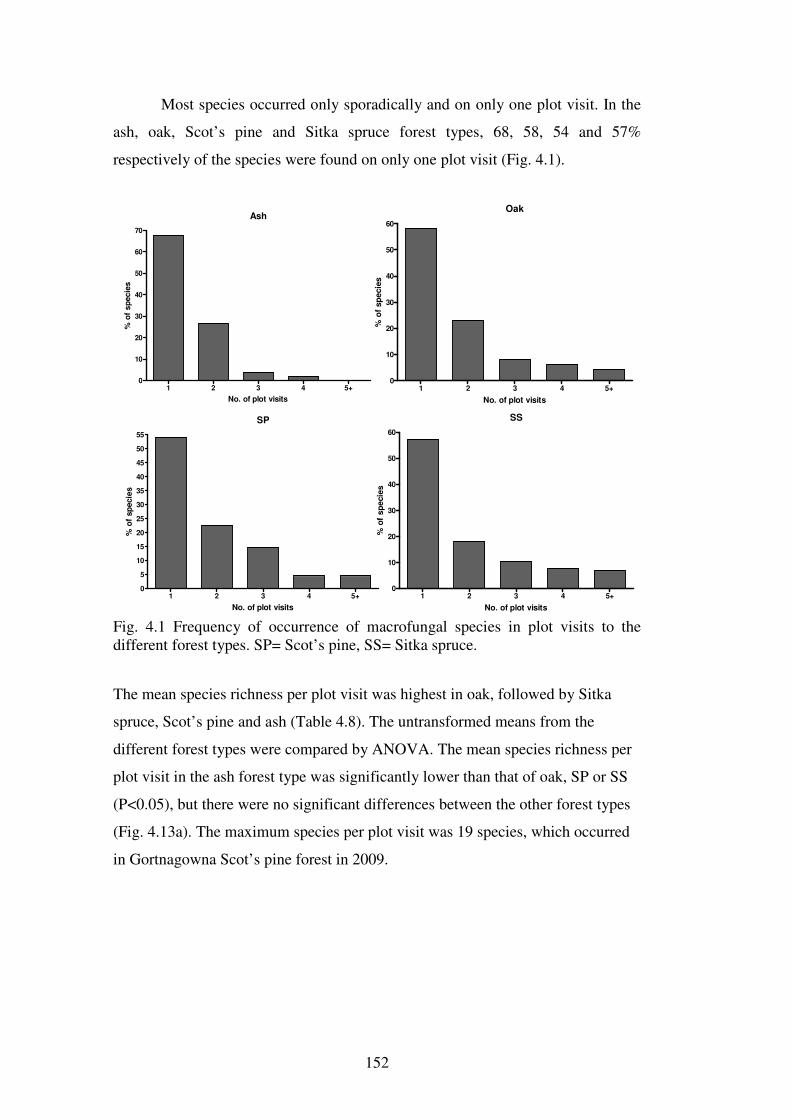
152
Most species occurred only sporadically and on only one plot visit. In the
ash, oak, Scot’s pine and Sitka spruce forest types, 68, 58, 54 and 57%
respectively of the species were found on only one plot visit (Fig. 4.1).
Ash
1 2 3 4 5+0
10
20
30
40
50
60
70
No. of plot visits
% o
f sp
ecie
s
Oak
1 2 3 4 5+0
10
20
30
40
50
60
No. of plot visits
% o
f sp
ecie
s
SP
1 2 3 4 5+0
5
10
15
20
25
30
35
40
45
50
55
No. of plot visits
% o
f sp
ecie
s
SS
1 2 3 4 5+0
10
20
30
40
50
60
No. of plot visits
% o
f sp
ecie
s
Fig. 4.1 Frequency of occurrence of macrofungal species in plot visits to the different forest types. SP= Scot’s pine, SS= Sitka spruce.
The mean species richness per plot visit was highest in oak, followed by Sitka
spruce, Scot’s pine and ash (Table 4.8). The untransformed means from the
different forest types were compared by ANOVA. The mean species richness per
plot visit in the ash forest type was significantly lower than that of oak, SP or SS
(P<0.05), but there were no significant differences between the other forest types
(Fig. 4.13a). The maximum species per plot visit was 19 species, which occurred
in Gortnagowna Scot’s pine forest in 2009.
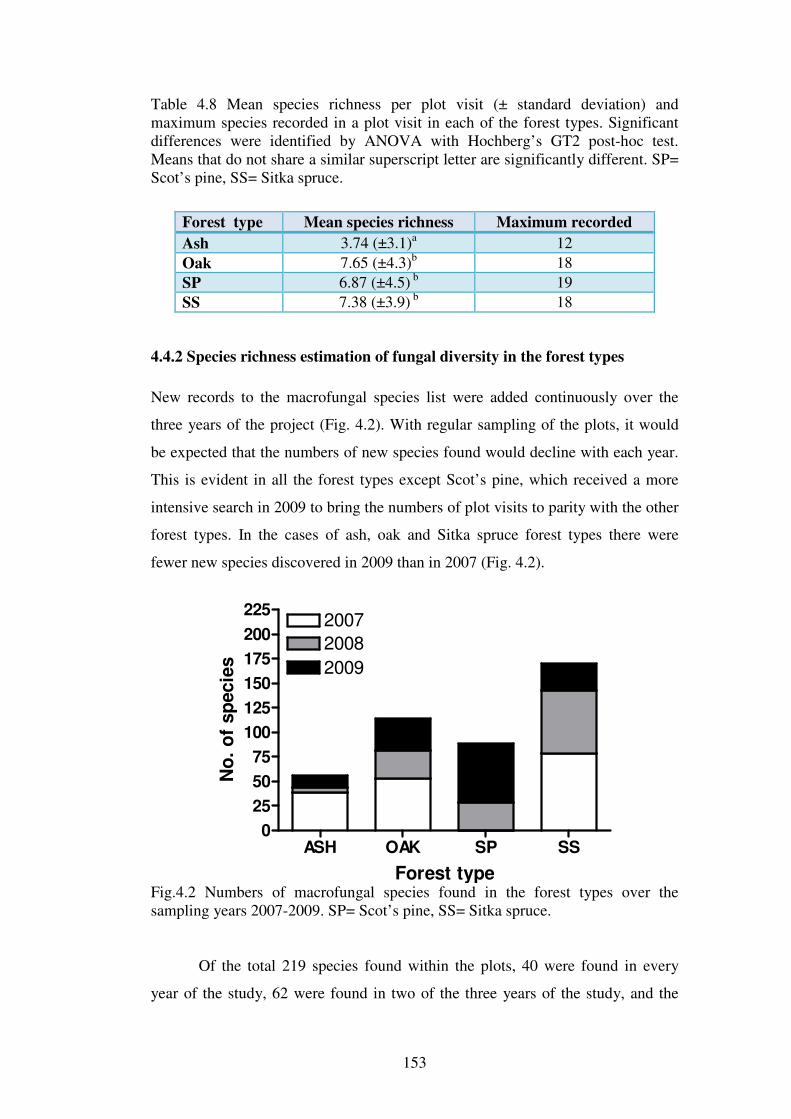
153
Table 4.8 Mean species richness per plot visit (± standard deviation) and maximum species recorded in a plot visit in each of the forest types. Significant differences were identified by ANOVA with Hochberg’s GT2 post-hoc test. Means that do not share a similar superscript letter are significantly different. SP= Scot’s pine, SS= Sitka spruce.
Forest type Mean species richness Maximum recorded
Ash 3.74 (±3.1)a 12
Oak 7.65 (±4.3)b 18
SP 6.87 (±4.5) b 19
SS 7.38 (±3.9) b 18
4.4.2 Species richness estimation of fungal diversity in the forest types
New records to the macrofungal species list were added continuously over the
three years of the project (Fig. 4.2). With regular sampling of the plots, it would
be expected that the numbers of new species found would decline with each year.
This is evident in all the forest types except Scot’s pine, which received a more
intensive search in 2009 to bring the numbers of plot visits to parity with the other
forest types. In the cases of ash, oak and Sitka spruce forest types there were
fewer new species discovered in 2009 than in 2007 (Fig. 4.2).
ASH OAK SP SS0
25
50
75
100
125
150
175
200
225200720082009
Forest type
No
. o
f sp
ecie
s
Fig.4.2 Numbers of macrofungal species found in the forest types over the sampling years 2007-2009. SP= Scot’s pine, SS= Sitka spruce.
Of the total 219 species found within the plots, 40 were found in every
year of the study, 62 were found in two of the three years of the study, and the

154
remaining 117 were only found in one year of the study. Almost all of the species
which fruited in every year of the study would be considered as very common, for
example, Armillaria mellea, Calocera viscosa, Collybia butyracea, Laccaria
laccata and L. amethystina. Of the species which only fruited in one year, many
were small delicate species such as Mycena rorida and other Mycena species.
However, there were also larger species that fruited in only one year, but when
they fruited they were locally common. The best example of this is
Camarophyllopsis atropuntca. This species was not found until 2010, when it
fruited in great numbers and over the entire fruiting season in two sites. The sites
were the two semi-natural ash sites at Killough and St John’s Wood. Another
good example of a species which fruited rarely but in large numbers was Inocybe
napipes. This species was not found until 2010, when it was discovered in six
sites. These were the oak sites Tomies and Abbeyleix, the Scot’s pine sites
Ballygawley and Gortnagowna, and a spruce site Kinnity. Inocybe rimosa also
followed this trend of sporadic but locally common fruiting; it fruited in Chevy
Chase Mature and St John’s Wood in 2007 and it was also found in the
Ballygawley Scot’s pine in 2009.
On the basis of the three year’s sampling and species recorded inside and
outside plots, Sitka spruce sites produced the greatest number of macrofungal
species (144), followed by oak (113), Scot’s pine (89) and ash (56). These totals
are based on quite different numbers of sampling units in the case of each forest
type (25, 36, 31 and 55 plot visits respectively). To compensate for the difference
in sampling effort and to compare species richness of the different sites and forest
types at a similar sampling intensity, sample-based rarefaction curves with 95%
confidence intervals were calculated for the four forest types (Figs. 4.3; 4.4). The
curve of randomized data is created by sampling and then randomly resampling
the plot data while the actual accumulation of new species is shown by the curve
titled “actual”. Levelling off of the randomized curves indicates that the number
of species found is getting close to the actual total number of species in the area.
Levelling off cannot be seen in any of the curves (Fig. 4.3) and so it may be
concluded that more species would be found with continued sampling.
According to the rarefaction estimates of macrofungal species richness in
the forest types, at a similar sampling intensity (23 plot visits) the species richness
of the forest types are: ash was estimated to be 34 species, oak 71, Scot’s pine 74

155
and Sitka spruce 76 species. The estimate for ash forest was significantly less
(P<0.05) than that of all of the other forest types at this sampling intensity, based
on non-overlapping confidence intervals (Fig. 4.4). According to the rarefaction
estimates, Sitka spruce would be the most species-rich forest type, followed by
Scot’s pine, oak and ash, notably so at higher sampling intensities.
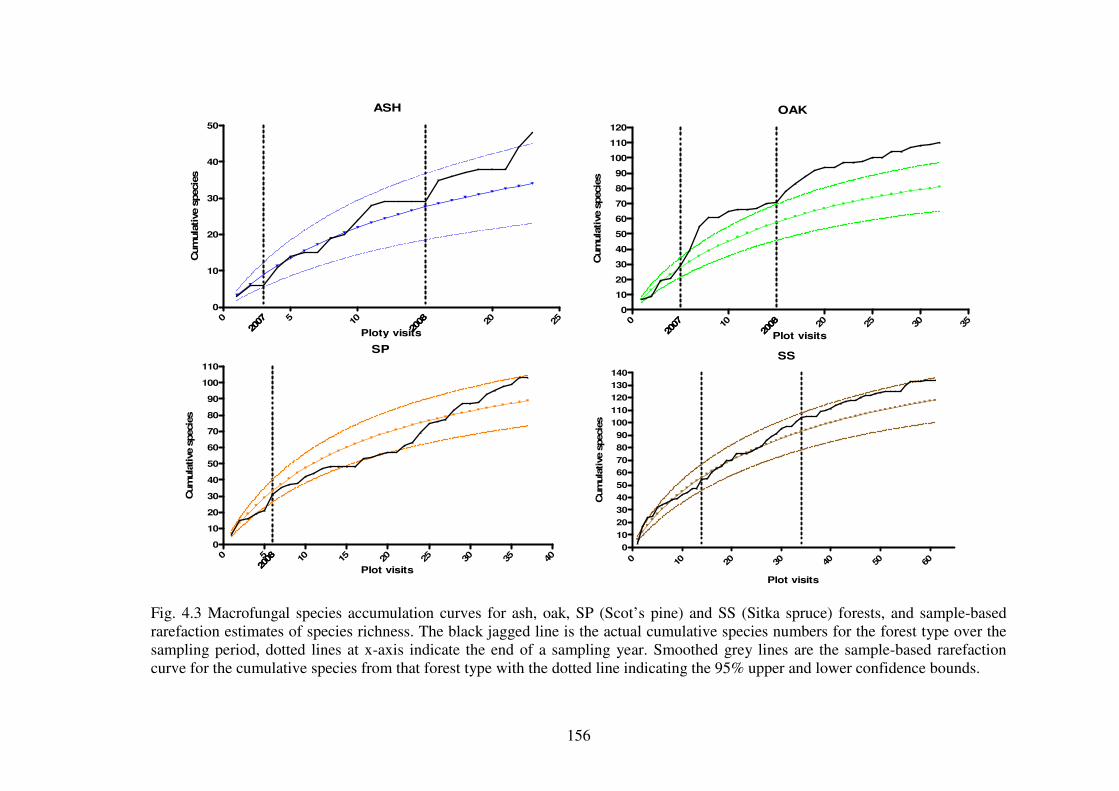
156
2007
2008
ASH
0 5 10 20 25
2007
2008
0
10
20
30
40
50
Ploty visits
Cum
ula
tive s
pecie
s
2007
2008
OAK
0 10 20 25 30 35
2007
2008
0
10
20
30
40
50
60
70
80
90
100
110
120
Plot visits
Cum
ula
tive s
pecie
s
2008
SP
0 5 10 15 20 25 30 35 40
2008
0
10
20
30
40
50
60
70
80
90
100
110
Plot visits
Cum
ula
tive s
pecie
s
SS
0 10 20 30 40 50 60
0
10
20
30
40
50
60
70
80
90
100
110
120
130
140
Plot visits
Cum
ula
tive s
pecie
s
Fig. 4.3 Macrofungal species accumulation curves for ash, oak, SP (Scot’s pine) and SS (Sitka spruce) forests, and sample-based rarefaction estimates of species richness. The black jagged line is the actual cumulative species numbers for the forest type over the sampling period, dotted lines at x-axis indicate the end of a sampling year. Smoothed grey lines are the sample-based rarefaction curve for the cumulative species from that forest type with the dotted line indicating the 95% upper and lower confidence bounds.
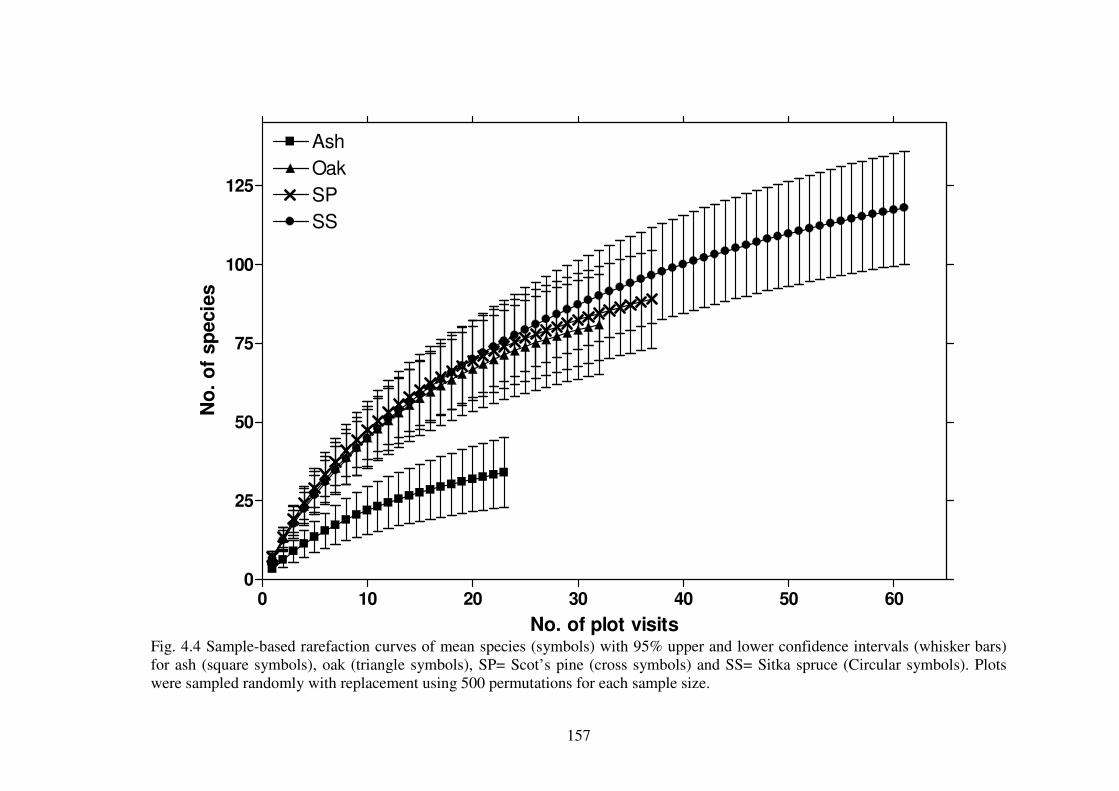
157
0 10 20 30 40 50 600
25
50
75
100
125
Ash
SPSS
Oak
No. of plot visits
No
. o
f sp
ecie
s
Fig. 4.4 Sample-based rarefaction curves of mean species (symbols) with 95% upper and lower confidence intervals (whisker bars) for ash (square symbols), oak (triangle symbols), SP= Scot’s pine (cross symbols) and SS= Sitka spruce (Circular symbols). Plots were sampled randomly with replacement using 500 permutations for each sample size.

158
Species richness estimates
Rarefaction was used in this study to estimate the number of species that would
have been found, at a lower but equal number of plot visits to the different forest
types. Species richness estimation uses the available data to statistically estimate
the hypothetical species richness, which would have been found if the entire
species richness was recorded. A number of estimators were employed to
statistically estimate the likely species richness of the forest types, based on the
accumulated number of species from the three year’s sampling. The data for the
different estimators versus sampling intensity was calculated (Figs. 4.5; 4.6).
From the overall trend of the curves (rising with sampling effort), it is likely that
the total species richness would increase with increasing sampling effort.
Depending on the estimator used, taking the final estimate of species richness in
each forest type gives values for species richness in ash forests ranging from 77 to
161, in oak from 166 to 208, in Scot’s pine from 135 to 203 and in Sitka spruce
from 186 to 218 species (Fig. 4.6). The actual number of species found in these
forests during this study was 56, 113, 89 and 144 respectively.
ASH
-ICE
ASH
-CHAO
2
ASH
-ACE
OAK-IC
E
OAK-C
HAO2
OAK-A
CE
SP-IC
E
SP-C
HAO2
SP-A
CE
SS-IC
E
SS-C
HAO
2
SS-A
CE
0102030405060708090
100110120130140150160170180190200210220
Nu
mb
er
of
sp
ecie
s
Fig. 4.5 The results for the species richness estimation of the ICE= Incidence based coverage estimator, ACE= Abundance based coverage estimator, CHAO2= Chao 2 richness estimator for each forest type are plotted. SP= Scot’s pine, SS= Sitka spruce. The grey lines indicate the actual species richness recorded in the ash, oak, Scot’s pine and Sitka spruce forest types.
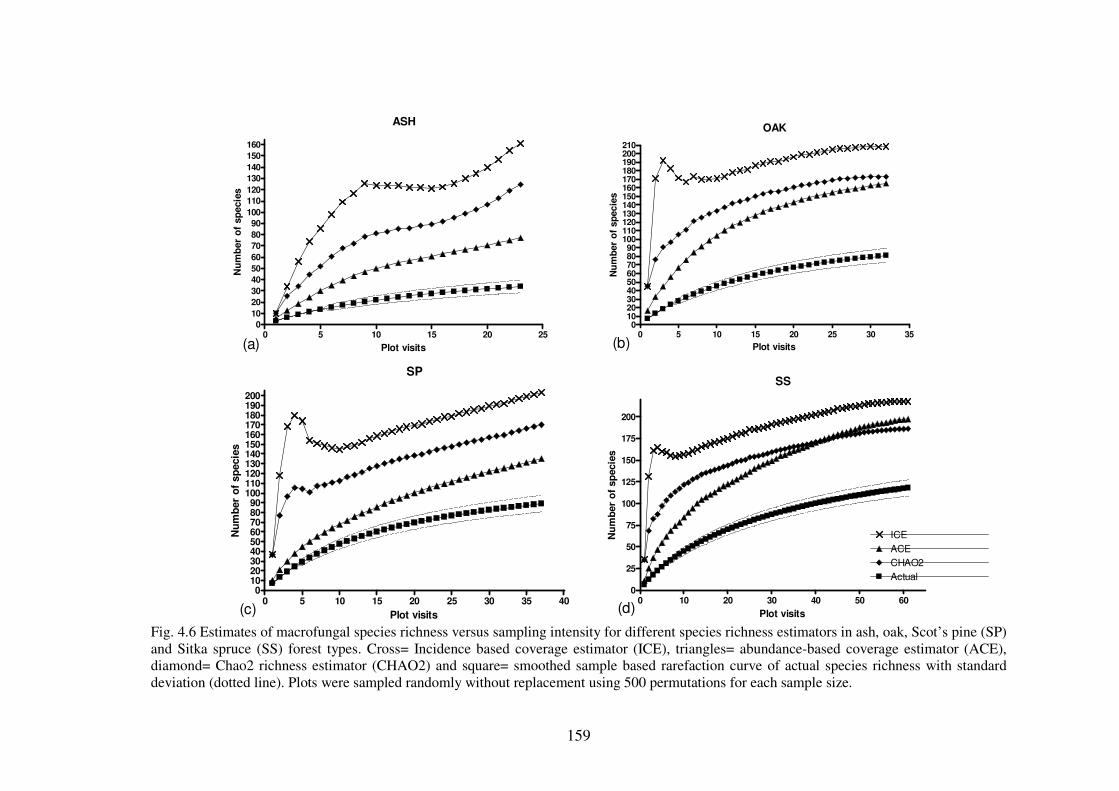
159
ASH
0 5 10 15 20 250
10
20
30
40
50
60
70
80
90
100
110
120
130
140
150
160
Plot visits
Nu
mb
er
of
sp
ecie
s
OAK
0 5 10 15 20 25 30 350
102030405060708090
100110120130140150160170180190200210
Plot visits
Nu
mb
er
of
sp
ec
ies
SP
0 5 10 15 20 25 30 35 400
102030405060708090
100110120130140150160170180190200
Plot visits
Nu
mb
er
of
sp
ecie
s
SS
0 10 20 30 40 50 600
25
50
75
100
125
150
175
200
ICEACECHAO2Actual
Plot visitsN
um
ber
of
sp
ecie
s
(a) (b)
(c) (d)
Fig. 4.6 Estimates of macrofungal species richness versus sampling intensity for different species richness estimators in ash, oak, Scot’s pine (SP) and Sitka spruce (SS) forest types. Cross= Incidence based coverage estimator (ICE), triangles= abundance-based coverage estimator (ACE), diamond= Chao2 richness estimator (CHAO2) and square= smoothed sample based rarefaction curve of actual species richness with standard deviation (dotted line). Plots were sampled randomly without replacement using 500 permutations for each sample size.
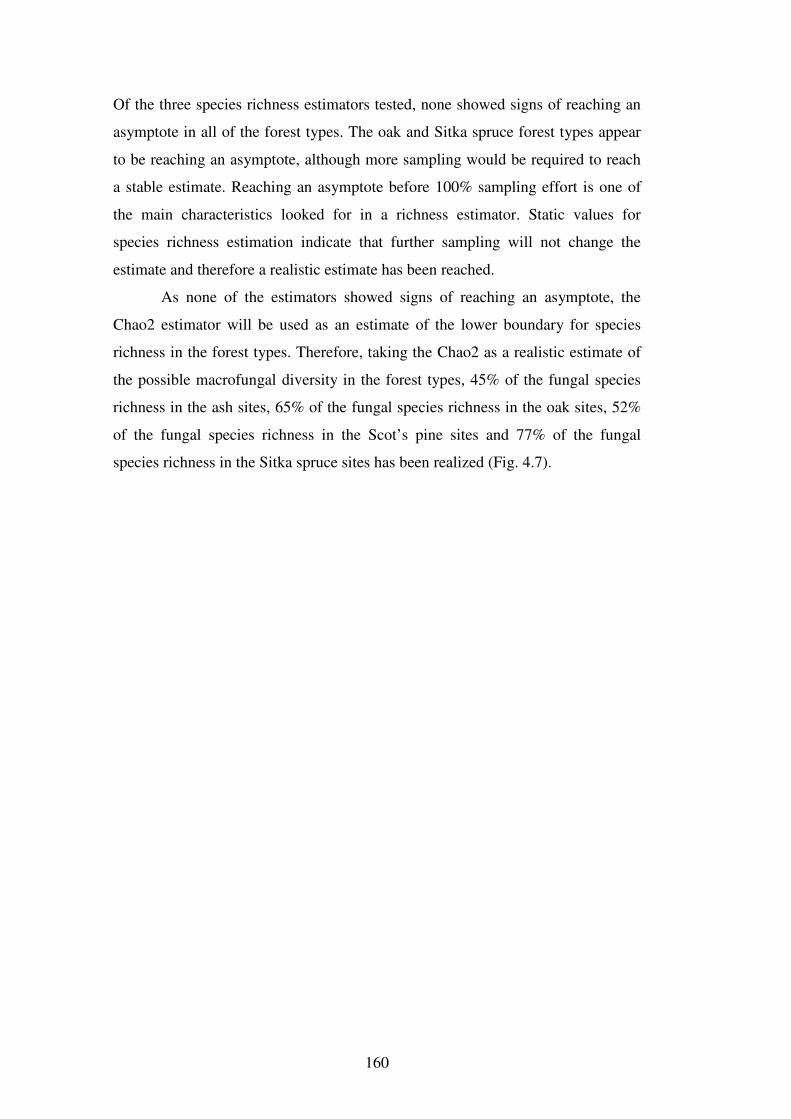
160
Of the three species richness estimators tested, none showed signs of reaching an
asymptote in all of the forest types. The oak and Sitka spruce forest types appear
to be reaching an asymptote, although more sampling would be required to reach
a stable estimate. Reaching an asymptote before 100% sampling effort is one of
the main characteristics looked for in a richness estimator. Static values for
species richness estimation indicate that further sampling will not change the
estimate and therefore a realistic estimate has been reached.
As none of the estimators showed signs of reaching an asymptote, the
Chao2 estimator will be used as an estimate of the lower boundary for species
richness in the forest types. Therefore, taking the Chao2 as a realistic estimate of
the possible macrofungal diversity in the forest types, 45% of the fungal species
richness in the ash sites, 65% of the fungal species richness in the oak sites, 52%
of the fungal species richness in the Scot’s pine sites and 77% of the fungal
species richness in the Sitka spruce sites has been realized (Fig. 4.7).
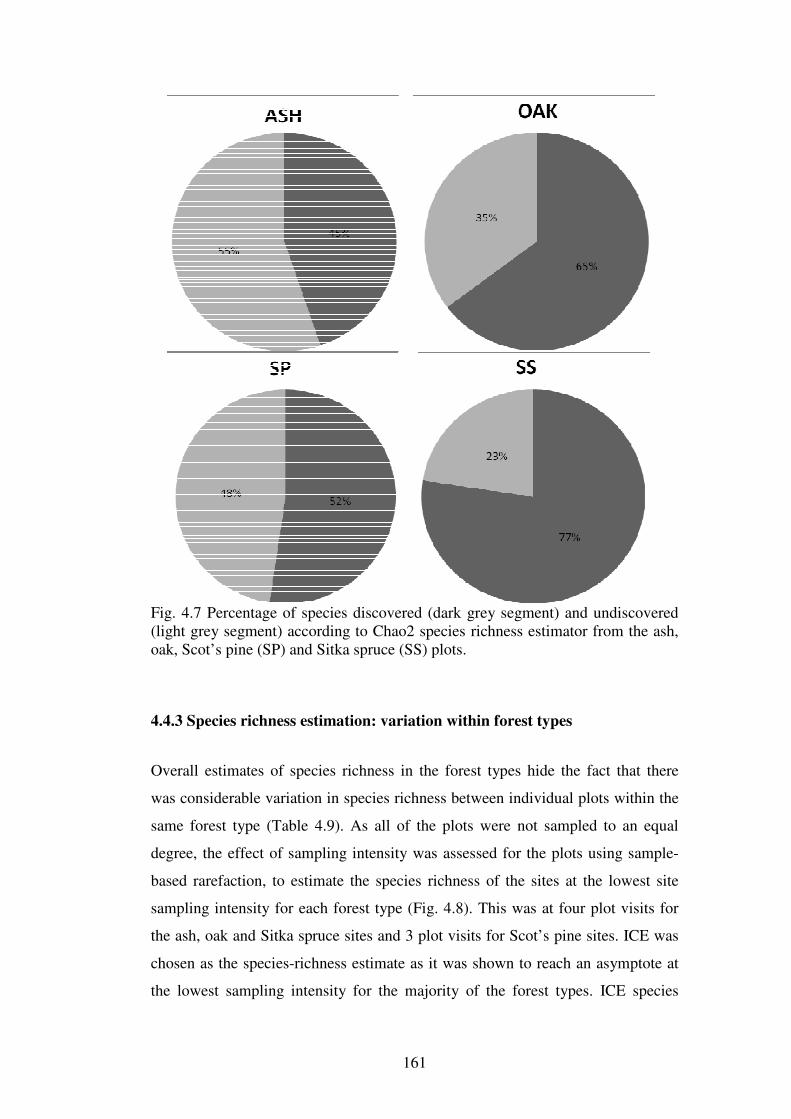
161
Fig. 4.7 Percentage of species discovered (dark grey segment) and undiscovered (light grey segment) according to Chao2 species richness estimator from the ash, oak, Scot’s pine (SP) and Sitka spruce (SS) plots.
4.4.3 Species richness estimation: variation within forest types
Overall estimates of species richness in the forest types hide the fact that there
was considerable variation in species richness between individual plots within the
same forest type (Table 4.9). As all of the plots were not sampled to an equal
degree, the effect of sampling intensity was assessed for the plots using sample-
based rarefaction, to estimate the species richness of the sites at the lowest site
sampling intensity for each forest type (Fig. 4.8). This was at four plot visits for
the ash, oak and Sitka spruce sites and 3 plot visits for Scot’s pine sites. ICE was
chosen as the species-richness estimate as it was shown to reach an asymptote at
the lowest sampling intensity for the majority of the forest types. ICE species
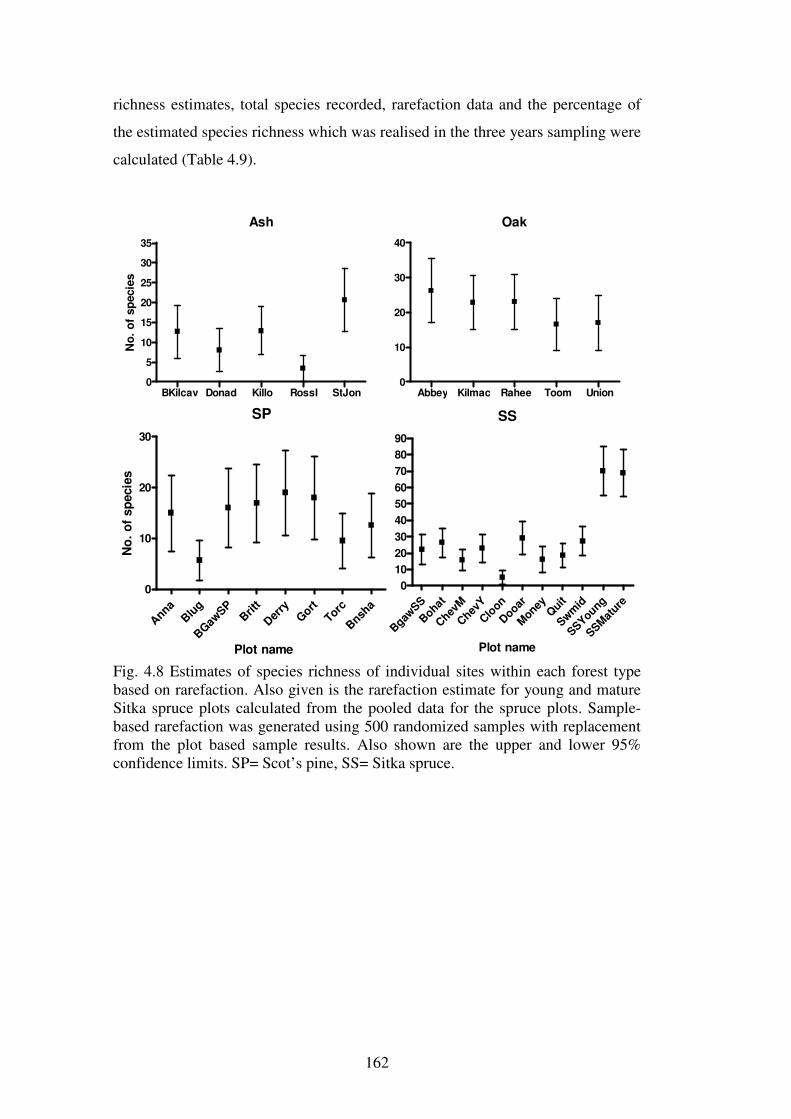
162
richness estimates, total species recorded, rarefaction data and the percentage of
the estimated species richness which was realised in the three years sampling were
calculated (Table 4.9).
Ash
BKilcav Donad Killo RossI StJon0
5
10
15
20
25
30
35
No
. o
f sp
ecie
s
Oak
Abbey Kilmac Rahee Toom Union0
10
20
30
40
SP
Anna
Blu
g
BGaw
SPBrit
t
Der
ryGort
Torc
Bnsh
a
0
10
20
30
Plot name
No
. o
f sp
ecie
s
SS
Bgaw
SS
Bohat
Chev
M
Chev
Y
Clo
on
Dooar
Money
Qui
t
Swm
id
SSYoung
SSMat
ure
0
10
20
30
40
50
60
70
80
90
Plot name
Fig. 4.8 Estimates of species richness of individual sites within each forest type based on rarefaction. Also given is the rarefaction estimate for young and mature Sitka spruce plots calculated from the pooled data for the spruce plots. Sample-based rarefaction was generated using 500 randomized samples with replacement from the plot based sample results. Also shown are the upper and lower 95% confidence limits. SP= Scot’s pine, SS= Sitka spruce.
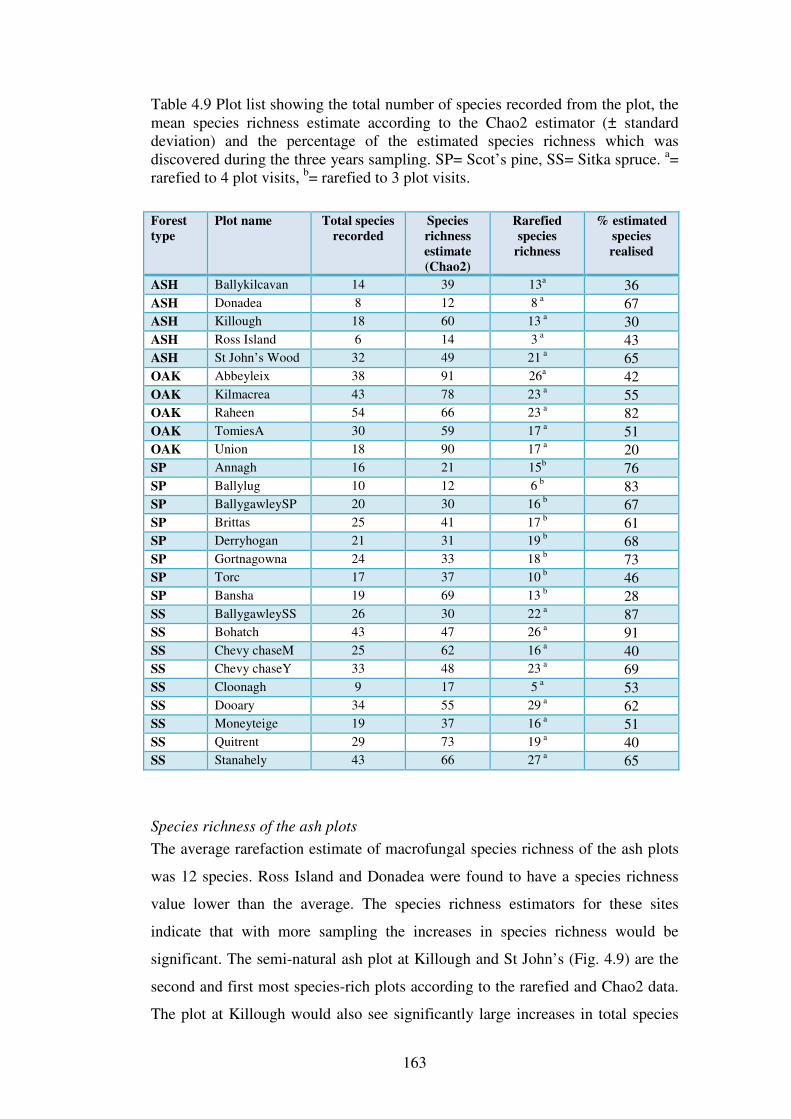
163
Table 4.9 Plot list showing the total number of species recorded from the plot, the mean species richness estimate according to the Chao2 estimator (± standard deviation) and the percentage of the estimated species richness which was discovered during the three years sampling. SP= Scot’s pine, SS= Sitka spruce. a= rarefied to 4 plot visits, b= rarefied to 3 plot visits.
Forest
type
Plot name Total species
recorded
Species
richness
estimate
(Chao2)
Rarefied
species
richness
% estimated
species
realised
ASH Ballykilcavan 14 39 13a 36
ASH Donadea 8 12 8 a 67
ASH Killough 18 60 13 a 30
ASH Ross Island 6 14 3 a 43
ASH St John’s Wood 32 49 21 a 65
OAK Abbeyleix 38 91 26a 42
OAK Kilmacrea 43 78 23 a 55
OAK Raheen 54 66 23 a 82
OAK TomiesA 30 59 17 a 51
OAK Union 18 90 17 a 20
SP Annagh 16 21 15b 76
SP Ballylug 10 12 6 b 83
SP BallygawleySP 20 30 16 b 67
SP Brittas 25 41 17 b 61
SP Derryhogan 21 31 19 b 68
SP Gortnagowna 24 33 18 b 73
SP Torc 17 37 10 b 46
SP Bansha 19 69 13 b 28
SS BallygawleySS 26 30 22 a 87
SS Bohatch 43 47 26 a 91
SS Chevy chaseM 25 62 16 a 40
SS Chevy chaseY 33 48 23 a 69
SS Cloonagh 9 17 5 a 53
SS Dooary 34 55 29 a 62
SS Moneyteige 19 37 16 a 51
SS Quitrent 29 73 19 a 40
SS Stanahely 43 66 27 a 65
Species richness of the ash plots
The average rarefaction estimate of macrofungal species richness of the ash plots
was 12 species. Ross Island and Donadea were found to have a species richness
value lower than the average. The species richness estimators for these sites
indicate that with more sampling the increases in species richness would be
significant. The semi-natural ash plot at Killough and St John’s (Fig. 4.9) are the
second and first most species-rich plots according to the rarefied and Chao2 data.
The plot at Killough would also see significantly large increases in total species
164
richness with continued sampling effort according to the % of the estimated
species realised from three years sampling.
Species richness of oak plots
The average rarefaction estimate of macrofungal species richness for the oak plots
is 21 species. The plots at Union and Tomies A were below this value. Four of the
five oak plots have ≤50% of their estimated species richness discovered and so
would likely see large increases in species richness with continuing sampling.
Within the oak forest type, there are no significant differences (P=0.05) in rarefied
species richness between any of the plots (Table 4.9).
Species richness of the Scot’s pine plots
The average rarefaction species richness estimate of the Scot’s pine plots was 14
species per plot. The plot at Ballylug had very low rarefied species richness with
only six species in total after 3 plot visits. The most species-rich Scot’s pine plot
according to rarefaction was Derryhogan, but with sufficient sampling to identify
all fungal species in the Scot’s pine plots (according to Chao2 estimate), the plot
at Bansha would be the most species rich Scot’s pine plot. Only 2 of the Scot’s
pine plots have less than 60% of their species richness left to be recorded
according to species richness estimation. In the Scot’s pine forest type, Ballylug
(Blug) had significantly lower (P=0.05) species richness than either Derryhogan
(Derry) or Gortnagowna (Gort) according to rarefaction (Table 4.9).
Species richness of the Sitka spruce plots
Overall, the Sitka spruce plots had an average rarefaction estimate of macrofungal
species richness of 20 species per plot. However, there was a very large variation
in the rarefaction estimate of species richness of the different Sitka spruce plots,
ranging from 5 to 29 species per plot. The plot with the lowest estimate,
Cloonagh, was one of the youngest Sitka spruce plots examined and was the first
rotation of forest which was planted on bog. The Sitka spruce plot at Stanahely
(Fig. 4.9) had the joint second highest actual species richness of all plots. Sitka
spruce plots showed the most variability in rarefaction estimates of macrofungal
species richness. The plot at Cloonagh (Cloon) had significantly lower (P=0.05)
species richness than the plots at Ballygawley (BgawSS), Bohatch (Bohat), Chevy
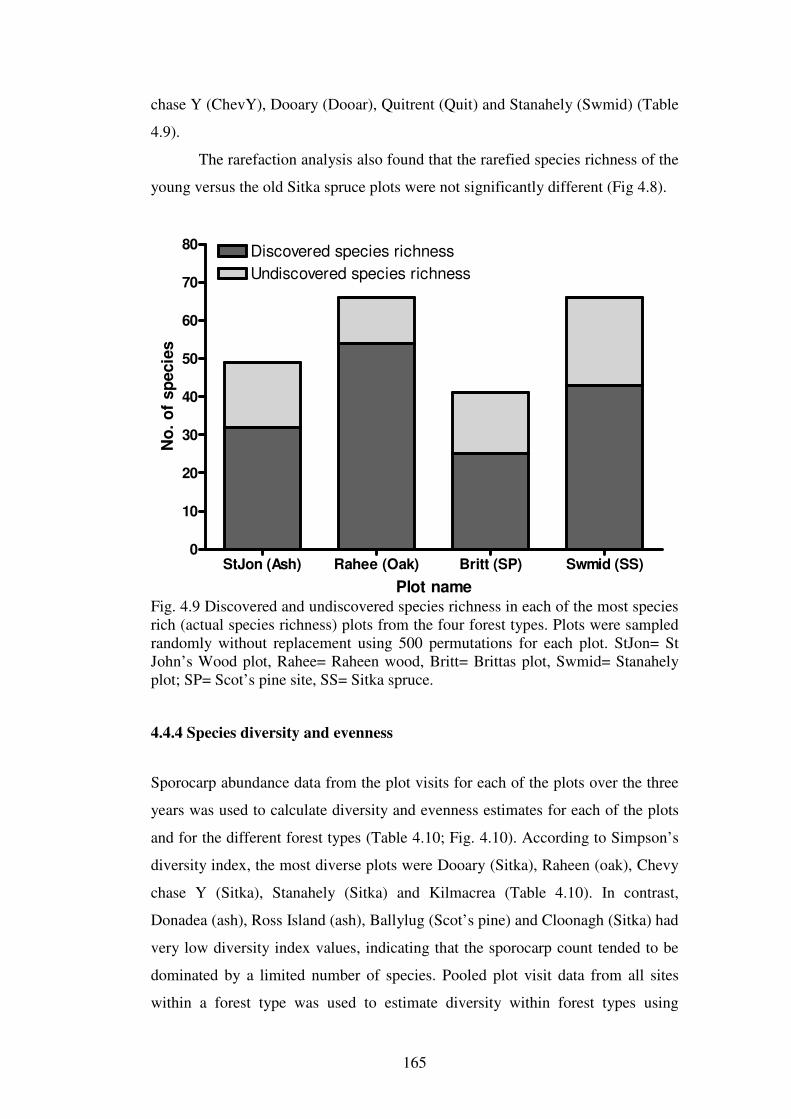
165
chase Y (ChevY), Dooary (Dooar), Quitrent (Quit) and Stanahely (Swmid) (Table
4.9).
The rarefaction analysis also found that the rarefied species richness of the
young versus the old Sitka spruce plots were not significantly different (Fig 4.8).
StJon (Ash) Rahee (Oak) Britt (SP) Swmid (SS)0
10
20
30
40
50
60
70
80 Discovered species richnessUndiscovered species richness
Plot name
No
. o
f sp
ecie
s
Fig. 4.9 Discovered and undiscovered species richness in each of the most species rich (actual species richness) plots from the four forest types. Plots were sampled randomly without replacement using 500 permutations for each plot. StJon= St John’s Wood plot, Rahee= Raheen wood, Britt= Brittas plot, Swmid= Stanahely plot; SP= Scot’s pine site, SS= Sitka spruce.
4.4.4 Species diversity and evenness
Sporocarp abundance data from the plot visits for each of the plots over the three
years was used to calculate diversity and evenness estimates for each of the plots
and for the different forest types (Table 4.10; Fig. 4.10). According to Simpson’s
diversity index, the most diverse plots were Dooary (Sitka), Raheen (oak), Chevy
chase Y (Sitka), Stanahely (Sitka) and Kilmacrea (Table 4.10). In contrast,
Donadea (ash), Ross Island (ash), Ballylug (Scot’s pine) and Cloonagh (Sitka) had
very low diversity index values, indicating that the sporocarp count tended to be
dominated by a limited number of species. Pooled plot visit data from all sites
within a forest type was used to estimate diversity within forest types using
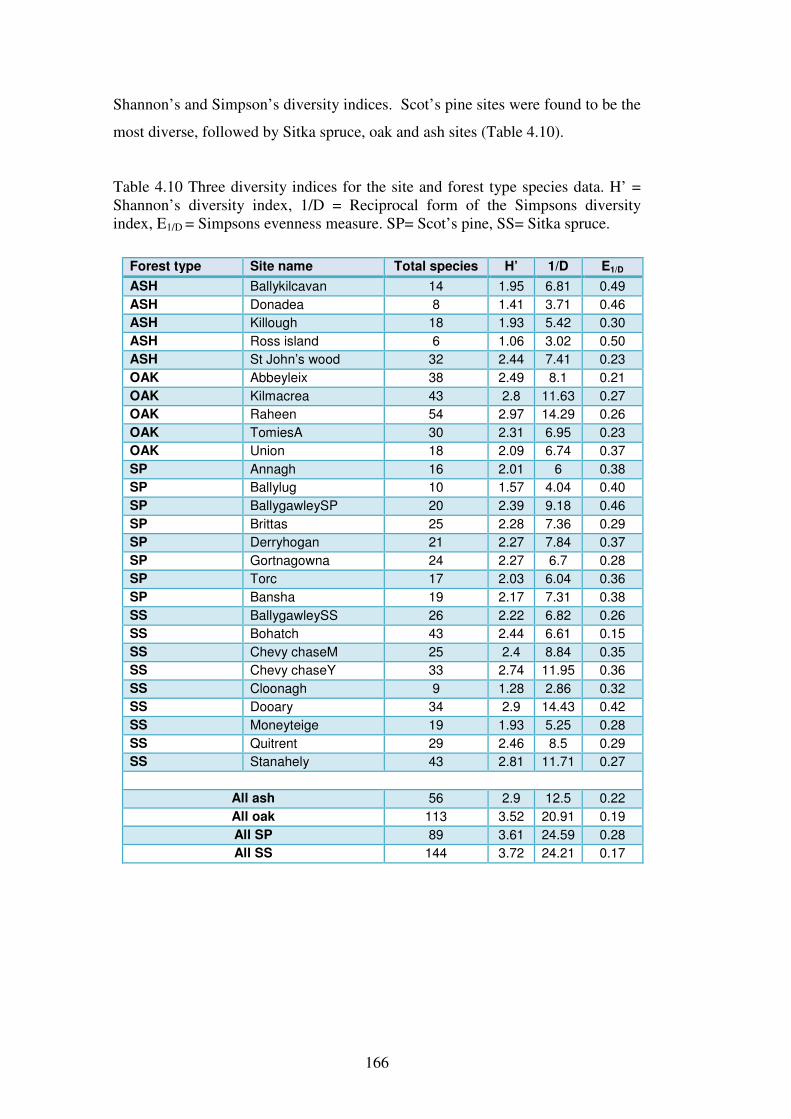
166
Shannon’s and Simpson’s diversity indices. Scot’s pine sites were found to be the
most diverse, followed by Sitka spruce, oak and ash sites (Table 4.10).
Table 4.10 Three diversity indices for the site and forest type species data. H’ = Shannon’s diversity index, 1/D = Reciprocal form of the Simpsons diversity index, E1/D = Simpsons evenness measure. SP= Scot’s pine, SS= Sitka spruce.
Forest type Site name Total species H’ 1/D E1/D
ASH Ballykilcavan 14 1.95 6.81 0.49 ASH Donadea 8 1.41 3.71 0.46 ASH Killough 18 1.93 5.42 0.30 ASH Ross island 6 1.06 3.02 0.50 ASH St John’s wood 32 2.44 7.41 0.23 OAK Abbeyleix 38 2.49 8.1 0.21 OAK Kilmacrea 43 2.8 11.63 0.27 OAK Raheen 54 2.97 14.29 0.26 OAK TomiesA 30 2.31 6.95 0.23 OAK Union 18 2.09 6.74 0.37 SP Annagh 16 2.01 6 0.38 SP Ballylug 10 1.57 4.04 0.40 SP BallygawleySP 20 2.39 9.18 0.46 SP Brittas 25 2.28 7.36 0.29 SP Derryhogan 21 2.27 7.84 0.37 SP Gortnagowna 24 2.27 6.7 0.28 SP Torc 17 2.03 6.04 0.36 SP Bansha 19 2.17 7.31 0.38 SS BallygawleySS 26 2.22 6.82 0.26 SS Bohatch 43 2.44 6.61 0.15 SS Chevy chaseM 25 2.4 8.84 0.35 SS Chevy chaseY 33 2.74 11.95 0.36 SS Cloonagh 9 1.28 2.86 0.32 SS Dooary 34 2.9 14.43 0.42 SS Moneyteige 19 1.93 5.25 0.28 SS Quitrent 29 2.46 8.5 0.29 SS Stanahely 43 2.81 11.71 0.27
All ash 56 2.9 12.5 0.22 All oak 113 3.52 20.91 0.19 All SP 89 3.61 24.59 0.28 All SS 144 3.72 24.21 0.17
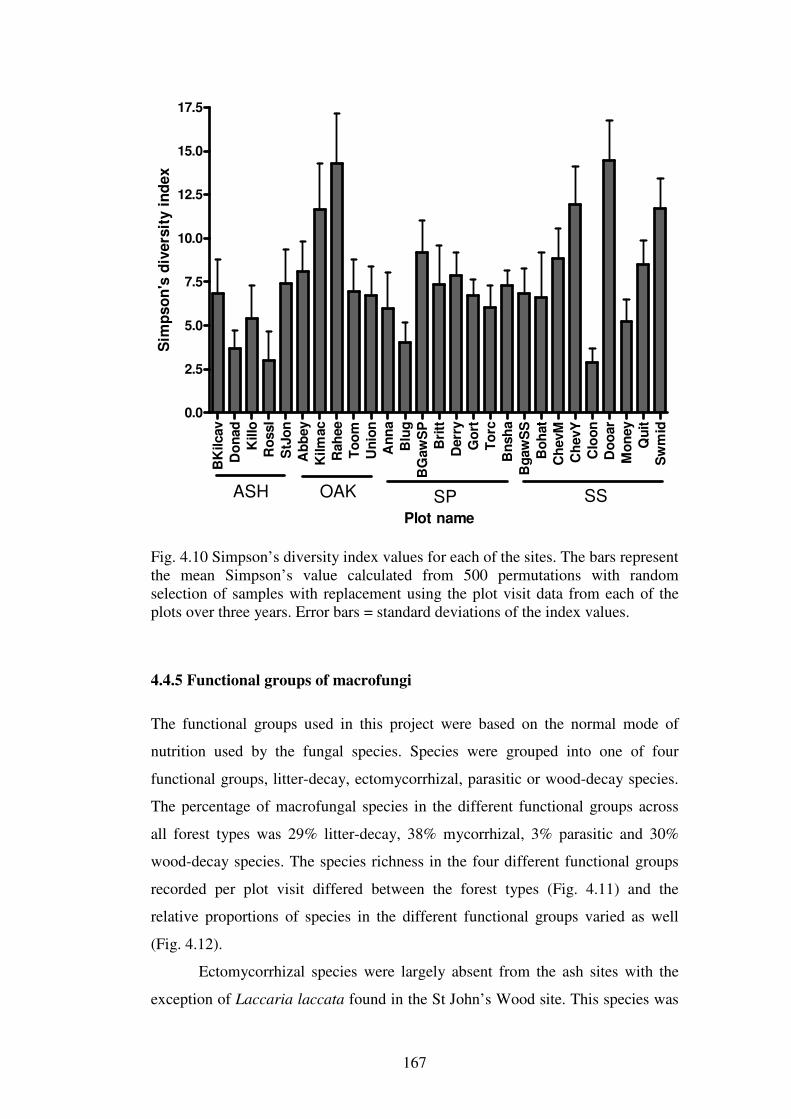
167
BK
ilcav
Do
nad
Killo
Ro
ssI
StJ
on
Ab
bey
Kilm
ac
Rah
ee
To
om
Un
ion
An
na
Blu
g
BG
aw
SP
Bri
tt
Derr
y
Go
rt
To
rc
Bn
sh
a
Bg
aw
SS
Bo
hat
Ch
evM
Ch
evY
Clo
on
Do
oar
Mo
ney
Qu
it
Sw
mid
0.0
2.5
5.0
7.5
10.0
12.5
15.0
17.5
ASH OAK SP SSPlot name
Sim
pso
n's
div
ers
ity i
nd
ex
Fig. 4.10 Simpson’s diversity index values for each of the sites. The bars represent the mean Simpson’s value calculated from 500 permutations with random selection of samples with replacement using the plot visit data from each of the plots over three years. Error bars = standard deviations of the index values.
4.4.5 Functional groups of macrofungi
The functional groups used in this project were based on the normal mode of
nutrition used by the fungal species. Species were grouped into one of four
functional groups, litter-decay, ectomycorrhizal, parasitic or wood-decay species.
The percentage of macrofungal species in the different functional groups across
all forest types was 29% litter-decay, 38% mycorrhizal, 3% parasitic and 30%
wood-decay species. The species richness in the four different functional groups
recorded per plot visit differed between the forest types (Fig. 4.11) and the
relative proportions of species in the different functional groups varied as well
(Fig. 4.12).
Ectomycorrhizal species were largely absent from the ash sites with the
exception of Laccaria laccata found in the St John’s Wood site. This species was
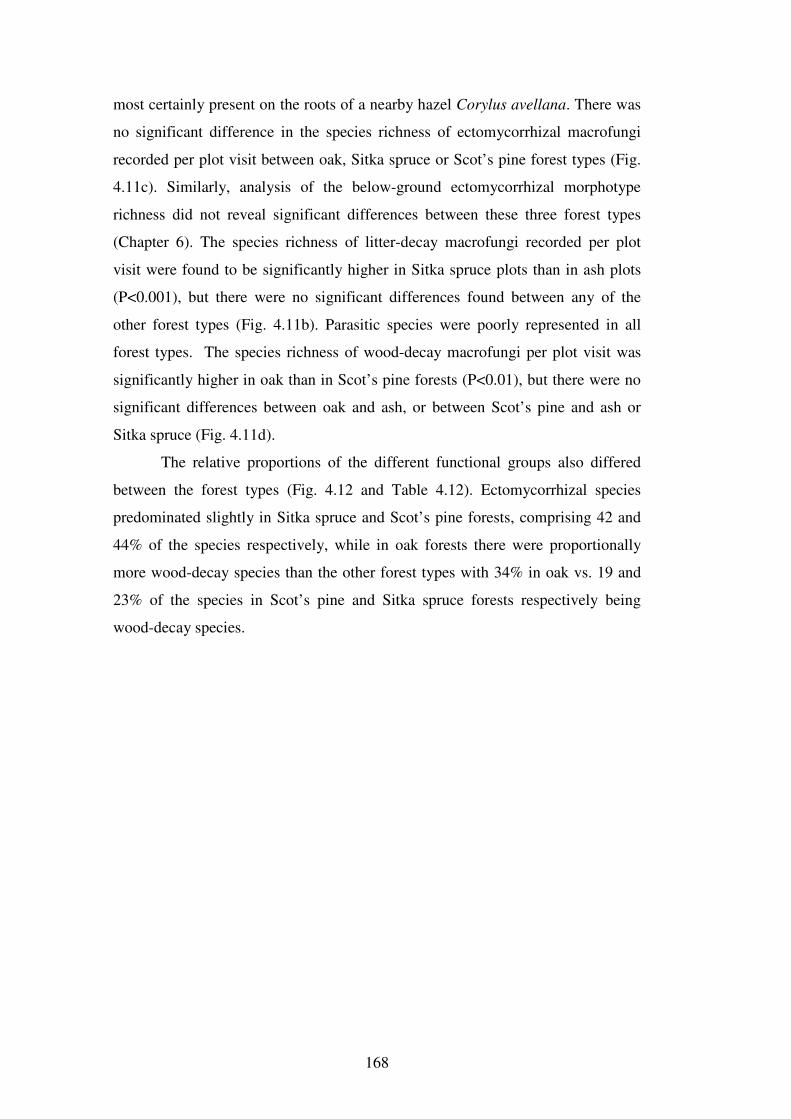
168
most certainly present on the roots of a nearby hazel Corylus avellana. There was
no significant difference in the species richness of ectomycorrhizal macrofungi
recorded per plot visit between oak, Sitka spruce or Scot’s pine forest types (Fig.
4.11c). Similarly, analysis of the below-ground ectomycorrhizal morphotype
richness did not reveal significant differences between these three forest types
(Chapter 6). The species richness of litter-decay macrofungi recorded per plot
visit were found to be significantly higher in Sitka spruce plots than in ash plots
(P<0.001), but there were no significant differences found between any of the
other forest types (Fig. 4.11b). Parasitic species were poorly represented in all
forest types. The species richness of wood-decay macrofungi per plot visit was
significantly higher in oak than in Scot’s pine forests (P<0.01), but there were no
significant differences between oak and ash, or between Scot’s pine and ash or
Sitka spruce (Fig. 4.11d).
The relative proportions of the different functional groups also differed
between the forest types (Fig. 4.12 and Table 4.12). Ectomycorrhizal species
predominated slightly in Sitka spruce and Scot’s pine forests, comprising 42 and
44% of the species respectively, while in oak forests there were proportionally
more wood-decay species than the other forest types with 34% in oak vs. 19 and
23% of the species in Scot’s pine and Sitka spruce forests respectively being
wood-decay species.
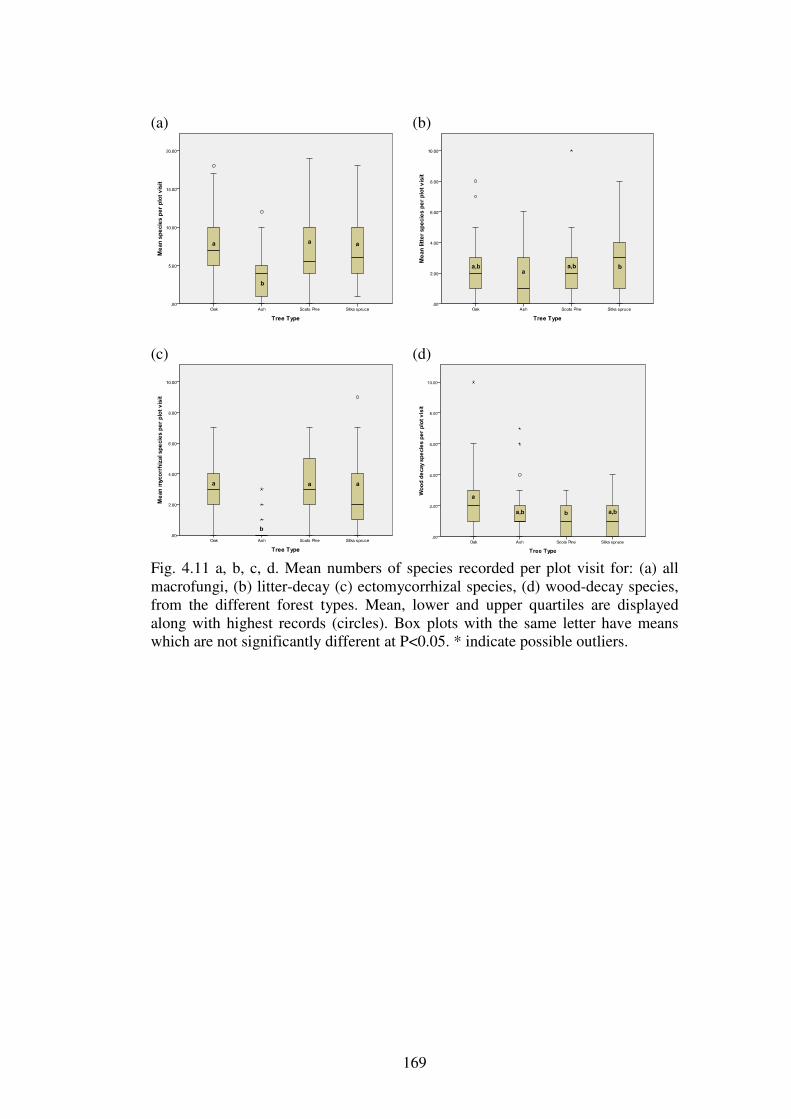
169
(a)
(b)
(c)
(d)
Fig. 4.11 a, b, c, d. Mean numbers of species recorded per plot visit for: (a) all macrofungi, (b) litter-decay (c) ectomycorrhizal species, (d) wood-decay species, from the different forest types. Mean, lower and upper quartiles are displayed along with highest records (circles). Box plots with the same letter have means which are not significantly different at P<0.05. * indicate possible outliers.
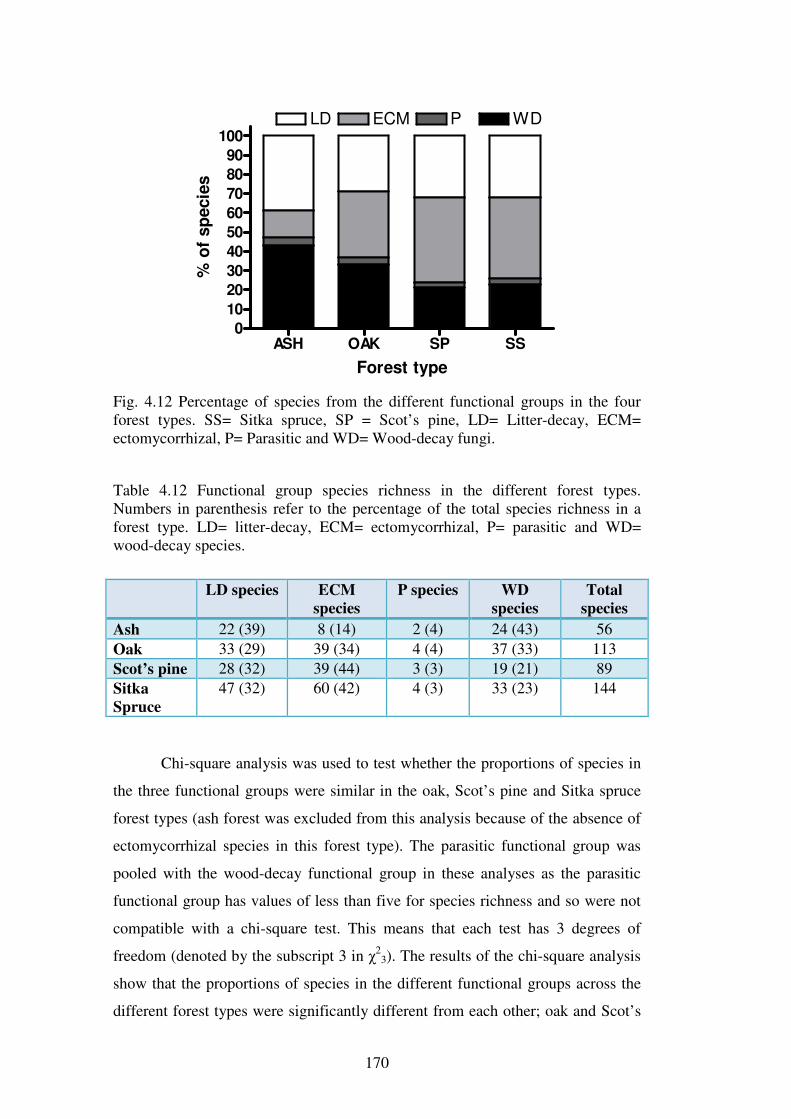
170
ASH OAK SP SS0
10
20
30
40
50
60
70
80
90
100LD ECM P WD
Forest type
% o
f sp
ecie
s
Fig. 4.12 Percentage of species from the different functional groups in the four forest types. SS= Sitka spruce, SP = Scot’s pine, LD= Litter-decay, ECM= ectomycorrhizal, P= Parasitic and WD= Wood-decay fungi.
Table 4.12 Functional group species richness in the different forest types. Numbers in parenthesis refer to the percentage of the total species richness in a forest type. LD= litter-decay, ECM= ectomycorrhizal, P= parasitic and WD= wood-decay species.
LD species ECM
species
P species WD
species
Total
species
Ash 22 (39) 8 (14) 2 (4) 24 (43) 56
Oak 33 (29) 39 (34) 4 (4) 37 (33) 113
Scot’s pine 28 (32) 39 (44) 3 (3) 19 (21) 89
Sitka
Spruce
47 (32) 60 (42) 4 (3) 33 (23) 144
Chi-square analysis was used to test whether the proportions of species in
the three functional groups were similar in the oak, Scot’s pine and Sitka spruce
forest types (ash forest was excluded from this analysis because of the absence of
ectomycorrhizal species in this forest type). The parasitic functional group was
pooled with the wood-decay functional group in these analyses as the parasitic
functional group has values of less than five for species richness and so were not
compatible with a chi-square test. This means that each test has 3 degrees of
freedom (denoted by the subscript 3 in χ23). The results of the chi-square analysis
show that the proportions of species in the different functional groups across the
different forest types were significantly different from each other; oak and Scot’s
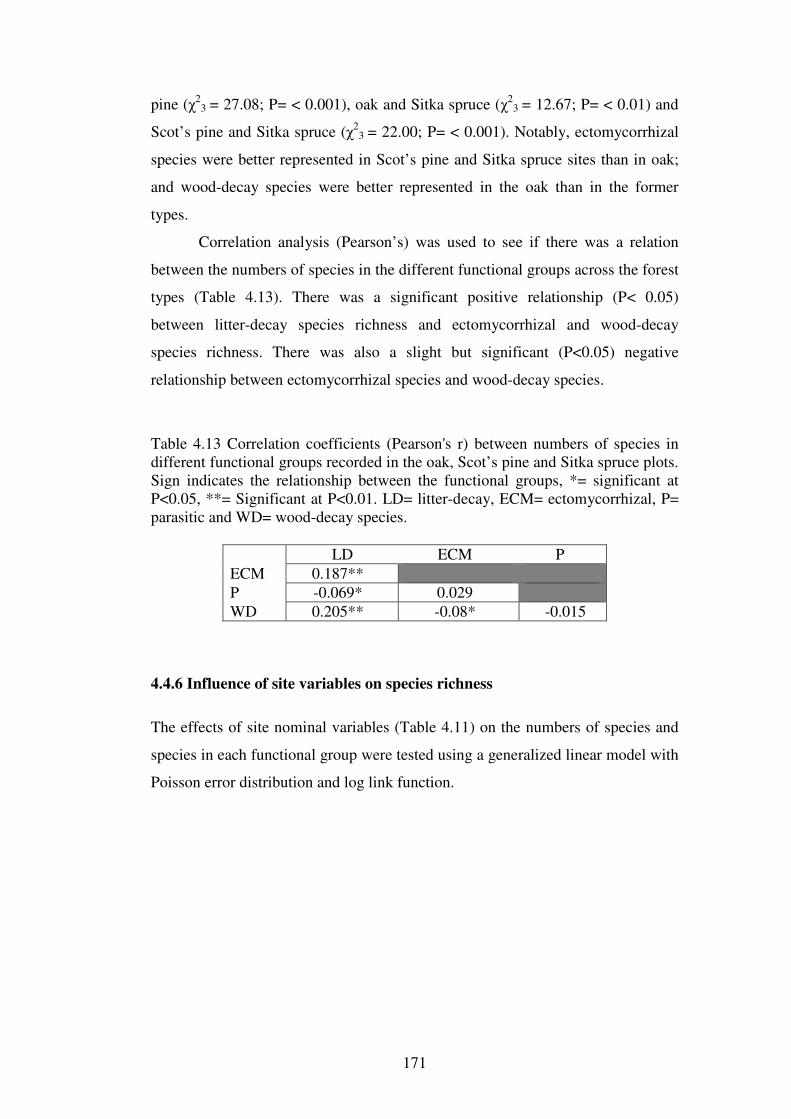
171
pine (χ23 = 27.08; P= < 0.001), oak and Sitka spruce (χ2
3 = 12.67; P= < 0.01) and
Scot’s pine and Sitka spruce (χ23 = 22.00; P= < 0.001). Notably, ectomycorrhizal
species were better represented in Scot’s pine and Sitka spruce sites than in oak;
and wood-decay species were better represented in the oak than in the former
types.
Correlation analysis (Pearson’s) was used to see if there was a relation
between the numbers of species in the different functional groups across the forest
types (Table 4.13). There was a significant positive relationship (P< 0.05)
between litter-decay species richness and ectomycorrhizal and wood-decay
species richness. There was also a slight but significant (P<0.05) negative
relationship between ectomycorrhizal species and wood-decay species.
Table 4.13 Correlation coefficients (Pearson's r) between numbers of species in different functional groups recorded in the oak, Scot’s pine and Sitka spruce plots. Sign indicates the relationship between the functional groups, *= significant at P<0.05, **= Significant at P<0.01. LD= litter-decay, ECM= ectomycorrhizal, P= parasitic and WD= wood-decay species.
LD ECM P
ECM 0.187**
P -0.069* 0.029
WD 0.205** -0.08* -0.015
4.4.6 Influence of site variables on species richness
The effects of site nominal variables (Table 4.11) on the numbers of species and
species in each functional group were tested using a generalized linear model with
Poisson error distribution and log link function.
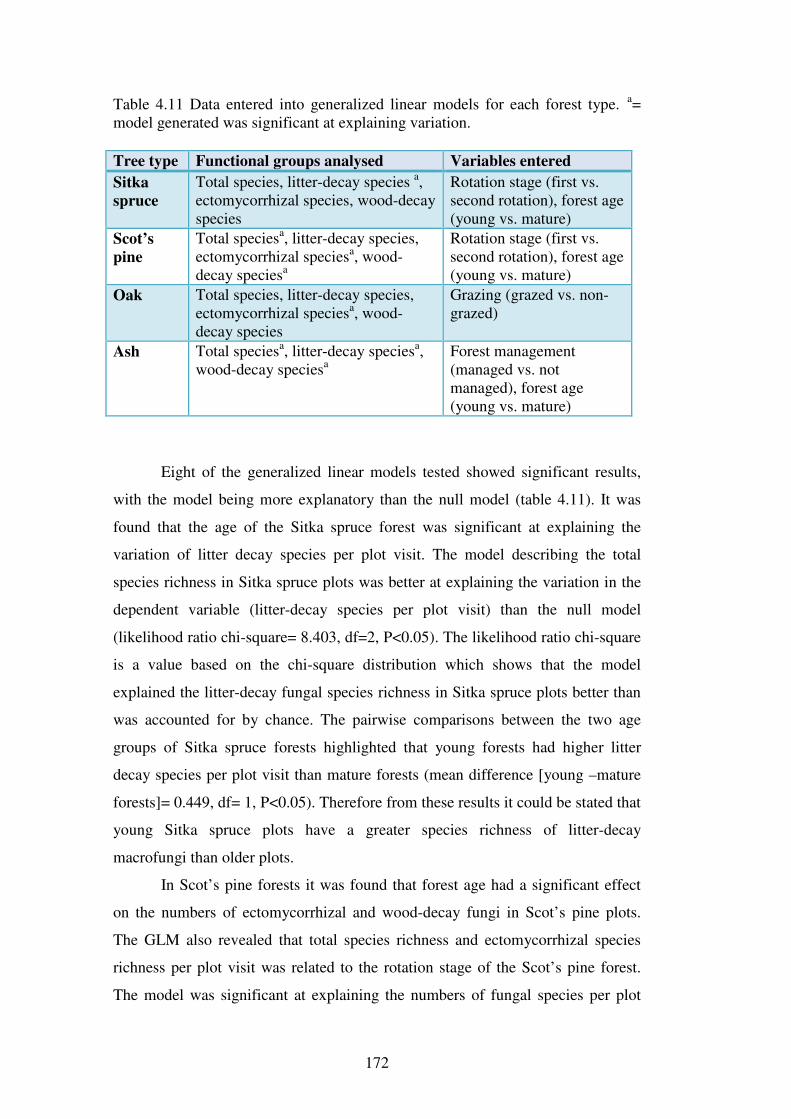
172
Table 4.11 Data entered into generalized linear models for each forest type. a= model generated was significant at explaining variation.
Tree type Functional groups analysed Variables entered
Sitka
spruce
Total species, litter-decay species a, ectomycorrhizal species, wood-decay species
Rotation stage (first vs. second rotation), forest age (young vs. mature)
Scot’s
pine
Total speciesa, litter-decay species, ectomycorrhizal speciesa, wood-decay speciesa
Rotation stage (first vs. second rotation), forest age (young vs. mature)
Oak Total species, litter-decay species, ectomycorrhizal speciesa, wood-decay species
Grazing (grazed vs. non-grazed)
Ash Total speciesa, litter-decay speciesa, wood-decay speciesa
Forest management (managed vs. not managed), forest age (young vs. mature)
Eight of the generalized linear models tested showed significant results,
with the model being more explanatory than the null model (table 4.11). It was
found that the age of the Sitka spruce forest was significant at explaining the
variation of litter decay species per plot visit. The model describing the total
species richness in Sitka spruce plots was better at explaining the variation in the
dependent variable (litter-decay species per plot visit) than the null model
(likelihood ratio chi-square= 8.403, df=2, P<0.05). The likelihood ratio chi-square
is a value based on the chi-square distribution which shows that the model
explained the litter-decay fungal species richness in Sitka spruce plots better than
was accounted for by chance. The pairwise comparisons between the two age
groups of Sitka spruce forests highlighted that young forests had higher litter
decay species per plot visit than mature forests (mean difference [young –mature
forests]= 0.449, df= 1, P<0.05). Therefore from these results it could be stated that
young Sitka spruce plots have a greater species richness of litter-decay
macrofungi than older plots.
In Scot’s pine forests it was found that forest age had a significant effect
on the numbers of ectomycorrhizal and wood-decay fungi in Scot’s pine plots.
The GLM also revealed that total species richness and ectomycorrhizal species
richness per plot visit was related to the rotation stage of the Scot’s pine forest.
The model was significant at explaining the numbers of fungal species per plot
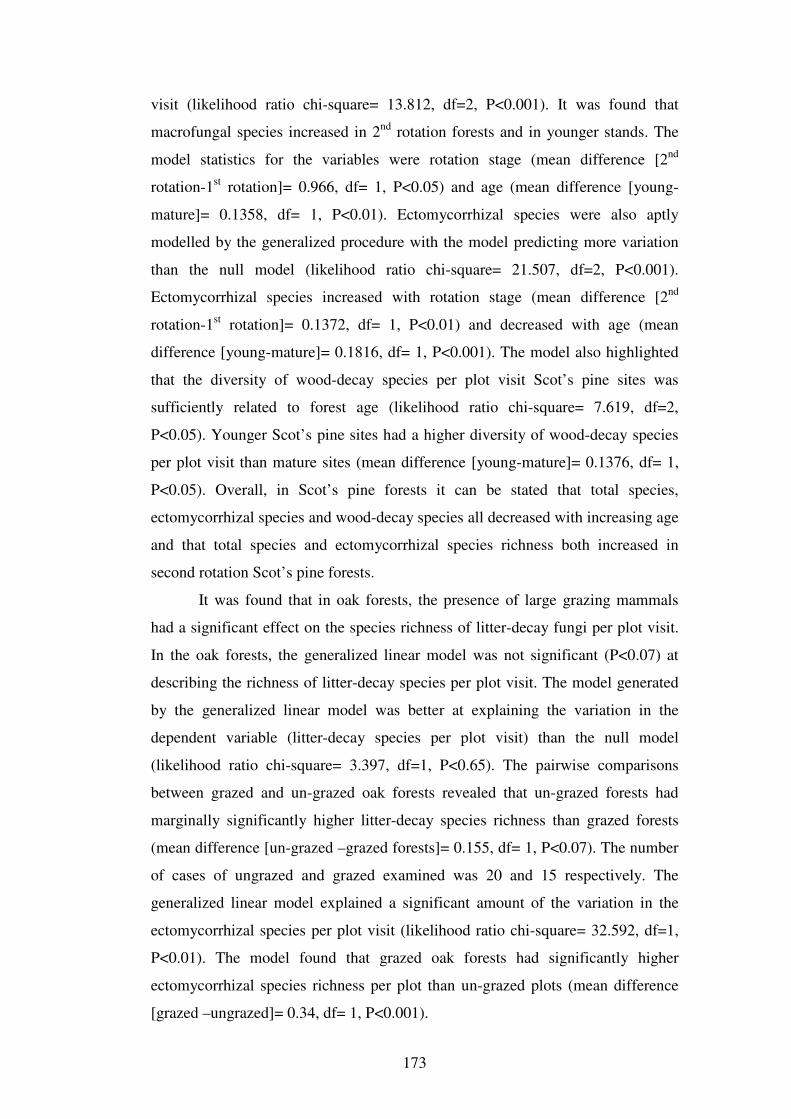
173
visit (likelihood ratio chi-square= 13.812, df=2, P<0.001). It was found that
macrofungal species increased in 2nd rotation forests and in younger stands. The
model statistics for the variables were rotation stage (mean difference [2nd
rotation-1st rotation]= 0.966, df= 1, P<0.05) and age (mean difference [young-
mature]= 0.1358, df= 1, P<0.01). Ectomycorrhizal species were also aptly
modelled by the generalized procedure with the model predicting more variation
than the null model (likelihood ratio chi-square= 21.507, df=2, P<0.001).
Ectomycorrhizal species increased with rotation stage (mean difference [2nd
rotation-1st rotation]= 0.1372, df= 1, P<0.01) and decreased with age (mean
difference [young-mature]= 0.1816, df= 1, P<0.001). The model also highlighted
that the diversity of wood-decay species per plot visit Scot’s pine sites was
sufficiently related to forest age (likelihood ratio chi-square= 7.619, df=2,
P<0.05). Younger Scot’s pine sites had a higher diversity of wood-decay species
per plot visit than mature sites (mean difference [young-mature]= 0.1376, df= 1,
P<0.05). Overall, in Scot’s pine forests it can be stated that total species,
ectomycorrhizal species and wood-decay species all decreased with increasing age
and that total species and ectomycorrhizal species richness both increased in
second rotation Scot’s pine forests.
It was found that in oak forests, the presence of large grazing mammals
had a significant effect on the species richness of litter-decay fungi per plot visit.
In the oak forests, the generalized linear model was not significant (P<0.07) at
describing the richness of litter-decay species per plot visit. The model generated
by the generalized linear model was better at explaining the variation in the
dependent variable (litter-decay species per plot visit) than the null model
(likelihood ratio chi-square= 3.397, df=1, P<0.65). The pairwise comparisons
between grazed and un-grazed oak forests revealed that un-grazed forests had
marginally significantly higher litter-decay species richness than grazed forests
(mean difference [un-grazed –grazed forests]= 0.155, df= 1, P<0.07). The number
of cases of ungrazed and grazed examined was 20 and 15 respectively. The
generalized linear model explained a significant amount of the variation in the
ectomycorrhizal species per plot visit (likelihood ratio chi-square= 32.592, df=1,
P<0.01). The model found that grazed oak forests had significantly higher
ectomycorrhizal species richness per plot than un-grazed plots (mean difference
[grazed –ungrazed]= 0.34, df= 1, P<0.001).
174
The GLM procedure identified relationships between forest management
and the total species and litter-decay species richness per plot visit in ash forests.
The modelling procedure also identified a relationship between forest age and the
numbers of wood decay species per plot visit in ash forests. In the ash forests the
model was significant at describing the numbers of species per plot visit
(likelihood ratio chi-square= 10.772, df=3, P<0.05). It was found that forest
management type was a important variable in determining the fungal species
richness of the ash sites with unmanaged forests having significantly higher
fungal species richness per plot visit than managed forests (mean difference
[unmanaged–managed]= 0.1457, df= 1, P=0.012). The model also predicted the
numbers of litter-decay (likelihood ratio chi-square= 10.815, df=1, P<0.05) and
wood-decay (likelihood ratio chi-square= 8.074, df=3, P<0.05) species per plot
visit. Litter-decay species increased in unmanaged ash forests (mean difference
[managed–unmanaged]= 0.1472, df= 1, P<0.05) while wood-decay species
decreased as forests aged (mean difference [young-mature]= 0.1609, df= 1,
P<0.08) In ash forests it can be stated that the total species and litter-decay species
per plot visit are higher in unmanaged ash forests than in managed ash forests. It
can also be stated that there are more wood-decay species in older ash forests than
there are in young ash forests.
Although only eight examples of relationships between site chronological
or historical variables and fungal species richness could be identified through the
generalized linear model analysis, certain general descriptions of the sites and
their fungal diversity can be stated. These are divided into the different forest
types below.
Ash plots
The ash plots can be divided into two groups regarding their land use history. The
semi-natural ash woodlands at Killough and St John’s wood are unmanaged and
as pristine ash forests as can be found in Ireland. The three remaining ash forests
at Donadea, Ballykilcavan and Ross Island are plantation ash forests. The two
plots which are classed as semi-natural ash woodlands were significantly more
species rich than the managed plots (P<0.05). Generalized linear modelling
revealed that management type had an effect on total species and litter-decay
175
species richness while age had an effect on wood-decay species richness in ash
plots.
Oak plots
There is no difference in the recent land use history of any of the oak plots, as
circa 1913 all of the plots were oak dominated forests. Based on structural
characteristics of the oak plots (Section 3.4.5, Chapter 3) there are not many
differences between the oak sites. One difference highlighted in Chapter 3 is the
presence or absence of large mammal grazing in the oak sites. The sites at
Raheen, Tomiesb and Kilmacrea are free from signs of grazing by deer whilst the
sites at Union, Tomies A and Abbeyleix are affected by year round browsing
grazing by deer. The effect of grazing was not significant (P<0.07) at lowering
litter-decay fungal species richness per plot and increasing ectomycorrhizal
species per plot visit (P<0.001).
Scot’s pine plots
Regarding past land use, it seems that Scot’s pine first rotation plantations do not
support as high a richness of fungal species (P<0.05) or ectomycorrhizal species
(P<0.01) as 2nd rotation sites. Age was found to affect the mycota of Scot’s pine
plots whereby younger plots were found to have a higher richness of total fungal
species (P<0.01), ectomycorrhizal (P<0.001) and wood-decay species (P<0.05)
per plot visit.
Sitka spruce plots
The Sitka spruce plots were the most numerous of all of the forest types. A central
aim of this project was to examine the diversity and functional group diversity of
fungi between different types of Sitka spruce forests. According to the generalized
linear modelling, only litter-decay species showed a significant relationship with
the variables examined. Younger sites were found to have a higher litter decay
species richness than older sites (P<0.05). The results of the generalized linear
modelling from Sitka spruce sites points to the fact that the examined variables
may not be sufficient at explaining the high inter-site variability with regard to the
fungal and functional group species richness in Sitka spruce forests in Ireland.
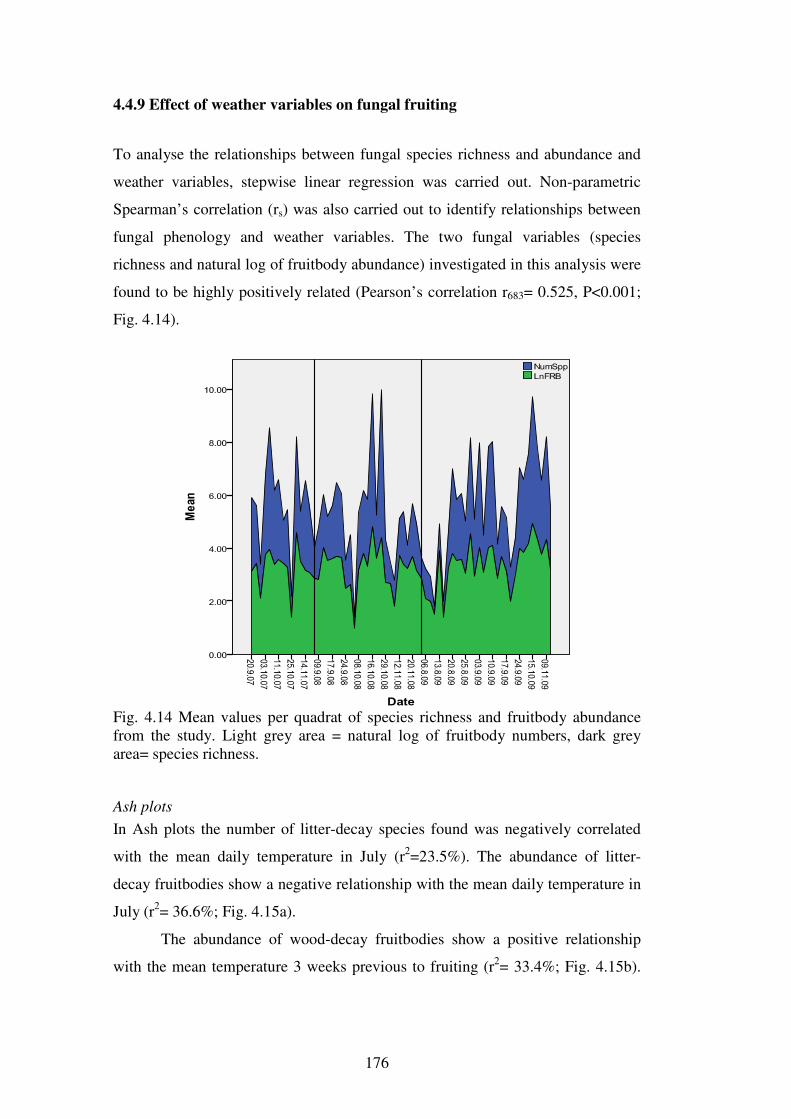
176
4.4.9 Effect of weather variables on fungal fruiting
To analyse the relationships between fungal species richness and abundance and
weather variables, stepwise linear regression was carried out. Non-parametric
Spearman’s correlation (rs) was also carried out to identify relationships between
fungal phenology and weather variables. The two fungal variables (species
richness and natural log of fruitbody abundance) investigated in this analysis were
found to be highly positively related (Pearson’s correlation r683= 0.525, P<0.001;
Fig. 4.14).
Fig. 4.14 Mean values per quadrat of species richness and fruitbody abundance from the study. Light grey area = natural log of fruitbody numbers, dark grey area= species richness.
Ash plots
In Ash plots the number of litter-decay species found was negatively correlated
with the mean daily temperature in July (r2=23.5%). The abundance of litter-
decay fruitbodies show a negative relationship with the mean daily temperature in
July (r2= 36.6%; Fig. 4.15a).
The abundance of wood-decay fruitbodies show a positive relationship
with the mean temperature 3 weeks previous to fruiting (r2= 33.4%; Fig. 4.15b).
177
Total fungal fruitbody counts were negatively correlated with the temperature 2
weeks previous to sampling (r2= 27.2%).
The main factors which are necessary to have high species richness in an
ash site seem to be a period of low rainfall 2-3 weeks prior to sampling. A mild
summer (especially July) with low to medium temperatures and low rainfall
throughout the autumn season will also help with the increase in species richness.
The main factors which influence the amount of fruitbodies of fungi in ash sites
are low rainfall and low temperatures 3-4 weeks previous to sampling. Low to
moderate temperatures in June, July and to a lesser extent August will lead to an
increase in fruitbodies as will low temperatures and low precipitation during the
autumn season.
Oak plots
Litter-decay fruitbodies were found to be negatively related to rainfall 2 and 4
weeks previous and positively related to rainfall 1 week previous (r2= 37.9%).
Litter-decay fruitbodies were shown to have a positive relationship with the
maximum average temperature in July (r2=41%; Fig. 4.15c). Ectomycorrhizal
fruitbodies were positively correlated with annual total precipitation (r2= 19.5%;
Fig. 4.15d). Ectomycorrhizal fruitbodies were positively correlated with
temperature 4 weeks and precipitation 3 weeks prior to sampling (r2= 35.1%).
The inclusion of the ectomycorrhizal species in oak makes it more
complex than the ash sites, but there are some similarities. Litter-decay and wood-
decay species richness show the same pattern with rainfall 3 and 4 weeks prior to
sampling. A dry spell is followed 3 weeks later by an increase in species richness
of litter-decay and wood-decay fungi. A warm spell is followed by an increase in
ectomycorrhizal species richness 3 weeks later.
It is less obvious than in ash, but warm mild summer favours species
richness of litter-decay fungi. The amounts of litter- and wood-decay fruitbodies
in oak plots show similar correlations as in ash plots. A dry spell is followed 3
weeks later by an increase in litter- and wood-decay fruitbody numbers.
Conversely, ectomycorrhizal fruitbodies seem to experience increased production
with increasing rainfall up to 2 weeks prior to sampling. Temperature is highly
correlated with ectomycorrhizal fruitbodies in oak sites. It appears that constant
warm weather from week 4 right up to sampling causes an increase in the
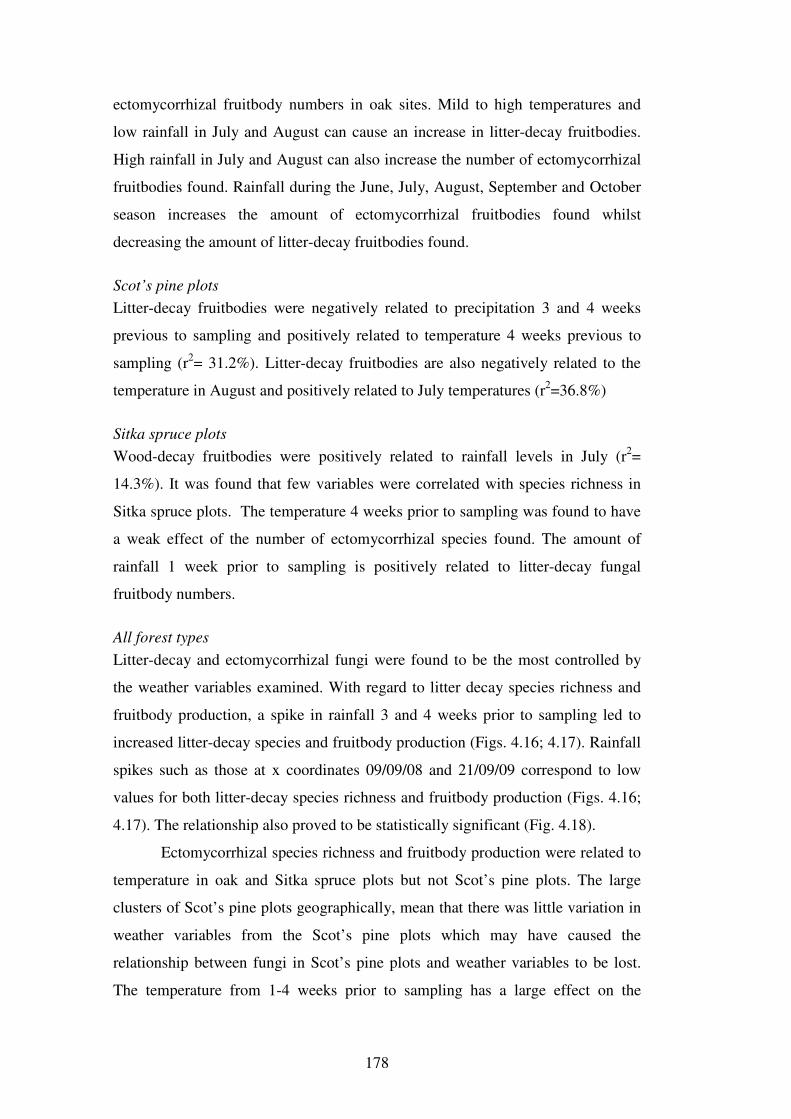
178
ectomycorrhizal fruitbody numbers in oak sites. Mild to high temperatures and
low rainfall in July and August can cause an increase in litter-decay fruitbodies.
High rainfall in July and August can also increase the number of ectomycorrhizal
fruitbodies found. Rainfall during the June, July, August, September and October
season increases the amount of ectomycorrhizal fruitbodies found whilst
decreasing the amount of litter-decay fruitbodies found.
Scot’s pine plots
Litter-decay fruitbodies were negatively related to precipitation 3 and 4 weeks
previous to sampling and positively related to temperature 4 weeks previous to
sampling (r2= 31.2%). Litter-decay fruitbodies are also negatively related to the
temperature in August and positively related to July temperatures (r2=36.8%)
Sitka spruce plots
Wood-decay fruitbodies were positively related to rainfall levels in July (r2=
14.3%). It was found that few variables were correlated with species richness in
Sitka spruce plots. The temperature 4 weeks prior to sampling was found to have
a weak effect of the number of ectomycorrhizal species found. The amount of
rainfall 1 week prior to sampling is positively related to litter-decay fungal
fruitbody numbers.
All forest types
Litter-decay and ectomycorrhizal fungi were found to be the most controlled by
the weather variables examined. With regard to litter decay species richness and
fruitbody production, a spike in rainfall 3 and 4 weeks prior to sampling led to
increased litter-decay species and fruitbody production (Figs. 4.16; 4.17). Rainfall
spikes such as those at x coordinates 09/09/08 and 21/09/09 correspond to low
values for both litter-decay species richness and fruitbody production (Figs. 4.16;
4.17). The relationship also proved to be statistically significant (Fig. 4.18).
Ectomycorrhizal species richness and fruitbody production were related to
temperature in oak and Sitka spruce plots but not Scot’s pine plots. The large
clusters of Scot’s pine plots geographically, mean that there was little variation in
weather variables from the Scot’s pine plots which may have caused the
relationship between fungi in Scot’s pine plots and weather variables to be lost.
The temperature from 1-4 weeks prior to sampling has a large effect on the
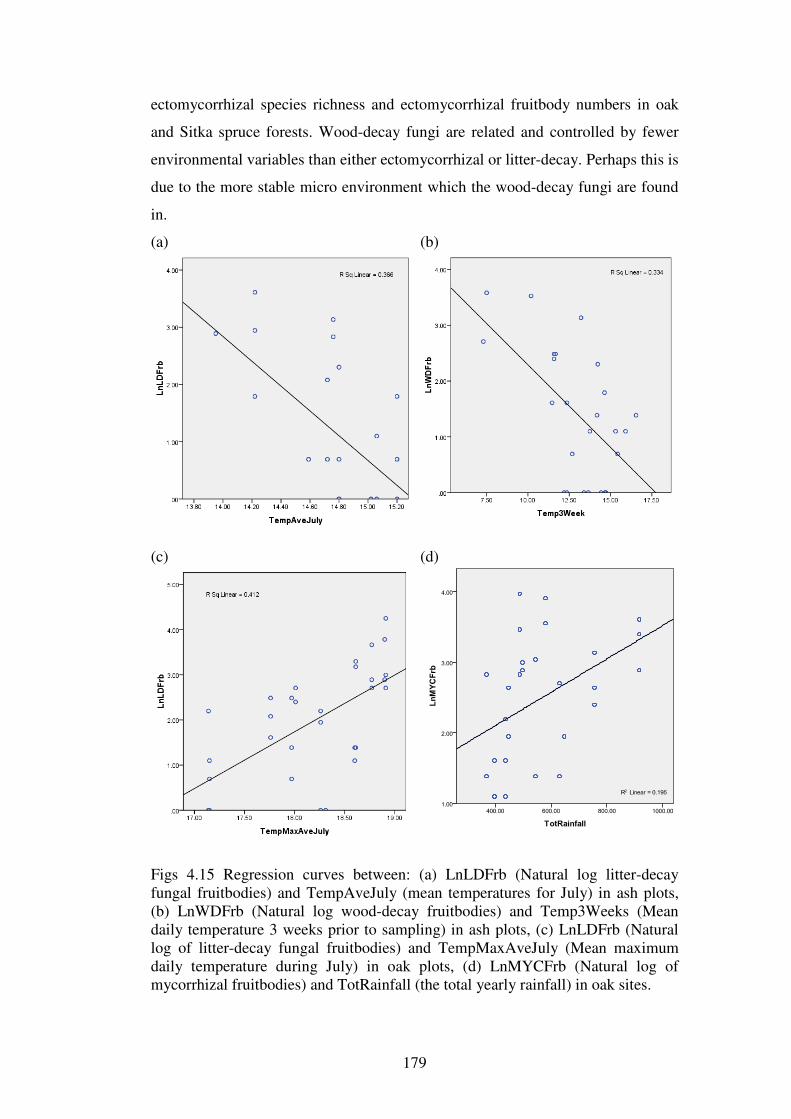
179
ectomycorrhizal species richness and ectomycorrhizal fruitbody numbers in oak
and Sitka spruce forests. Wood-decay fungi are related and controlled by fewer
environmental variables than either ectomycorrhizal or litter-decay. Perhaps this is
due to the more stable micro environment which the wood-decay fungi are found
in.
(a)
(b)
(c)
(d)
Figs 4.15 Regression curves between: (a) LnLDFrb (Natural log litter-decay fungal fruitbodies) and TempAveJuly (mean temperatures for July) in ash plots, (b) LnWDFrb (Natural log wood-decay fruitbodies) and Temp3Weeks (Mean daily temperature 3 weeks prior to sampling) in ash plots, (c) LnLDFrb (Natural log of litter-decay fungal fruitbodies) and TempMaxAveJuly (Mean maximum daily temperature during July) in oak plots, (d) LnMYCFrb (Natural log of mycorrhizal fruitbodies) and TotRainfall (the total yearly rainfall) in oak sites.
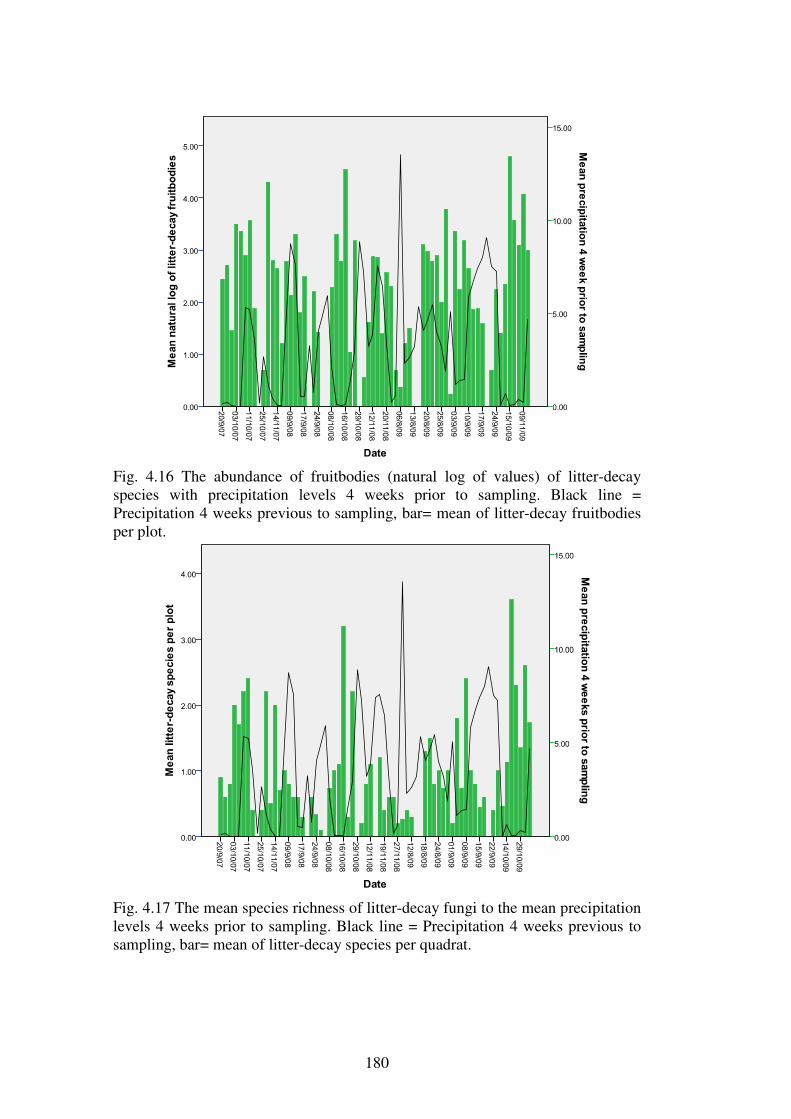
180
Fig. 4.16 The abundance of fruitbodies (natural log of values) of litter-decay species with precipitation levels 4 weeks prior to sampling. Black line = Precipitation 4 weeks previous to sampling, bar= mean of litter-decay fruitbodies per plot.
Fig. 4.17 The mean species richness of litter-decay fungi to the mean precipitation levels 4 weeks prior to sampling. Black line = Precipitation 4 weeks previous to sampling, bar= mean of litter-decay species per quadrat.
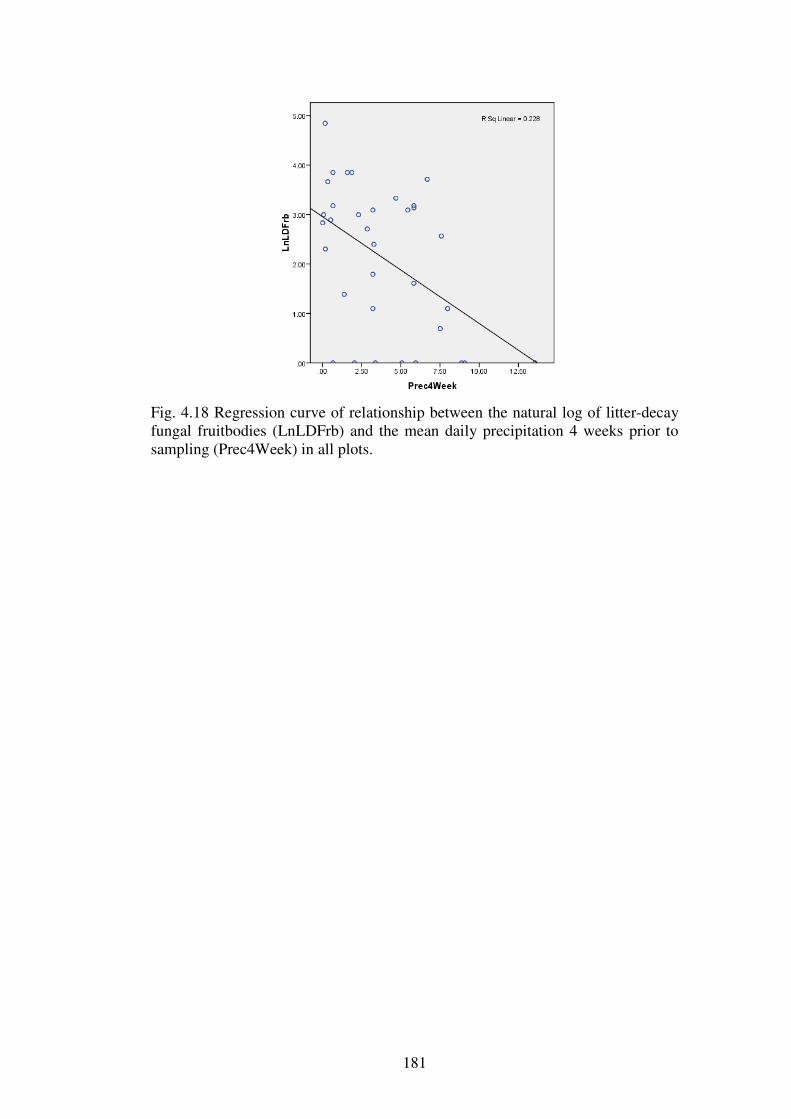
181
Fig. 4.18 Regression curve of relationship between the natural log of litter-decay fungal fruitbodies (LnLDFrb) and the mean daily precipitation 4 weeks prior to sampling (Prec4Week) in all plots.
182
4.5 Discussion
4.5.1 Fungal species richness and the effect of forest type
The total number of fungal species identified in this project was 416, which is on
par with similar studies in the U.K., mainland Europe and North America (Table
4.16). The most closely comparable studies are those of Ferris et al. (2000a) and
Humphrey et al. (2000) in the U.K. Ferris et al. (2000a) recorded 343
macrofungal species in Scot’s pine and Norway spruce sites in England, while
Humphrey et al. (2000) reported 419 species in forests of Sitka spruce, Scot’s
pine and oak in the U.K. (England and Scotland). In a study of oak forests in
Sweden, Ruhling and Tyler (1990) identified 470 macrofungal species over a 3
year study. A long-term survey (>7 years) by Straatsma and Krisai-Greilhuber
(2003) identified 886 taxa of macrofungi to species level in woodlands near
Vienna, that were composed of oak, beech, pine and ash. In North America, Smith
et al. (2003) found 263 taxa of fungi from old growth Douglas fir forests in
Oregon, U.S.A. Outerbridge (2002) found a total of 277 taxa of macrofungi
working in coniferous forests (Sitka spruce, Douglas fir, Western hemlock and
Western red cedar) on Vancouver Island, British Columbia. Another longer study
on Vancouver Island identified 551 taxa of fungi (Roberts et al. 2004) from six
different habitats.
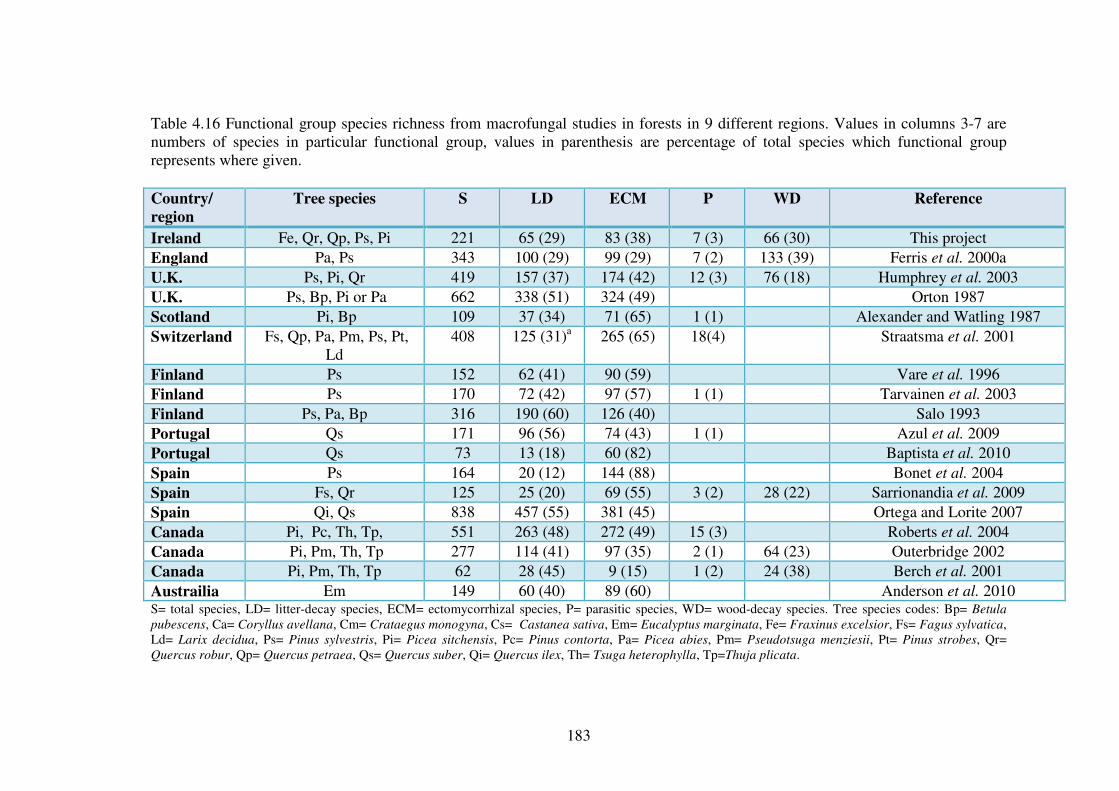
183
Table 4.16 Functional group species richness from macrofungal studies in forests in 9 different regions. Values in columns 3-7 are numbers of species in particular functional group, values in parenthesis are percentage of total species which functional group represents where given.
Country/
region
Tree species S LD ECM P WD Reference
Ireland Fe, Qr, Qp, Ps, Pi 221 65 (29) 83 (38) 7 (3) 66 (30) This project
England Pa, Ps 343 100 (29) 99 (29) 7 (2) 133 (39) Ferris et al. 2000a
U.K. Ps, Pi, Qr 419 157 (37) 174 (42) 12 (3) 76 (18) Humphrey et al. 2003
U.K. Ps, Bp, Pi or Pa 662 338 (51) 324 (49) Orton 1987
Scotland Pi, Bp 109 37 (34) 71 (65) 1 (1) Alexander and Watling 1987
Switzerland Fs, Qp, Pa, Pm, Ps, Pt, Ld
408 125 (31)a 265 (65) 18(4) Straatsma et al. 2001
Finland Ps 152 62 (41) 90 (59) Vare et al. 1996
Finland Ps 170 72 (42) 97 (57) 1 (1) Tarvainen et al. 2003
Finland Ps, Pa, Bp 316 190 (60) 126 (40) Salo 1993
Portugal Qs 171 96 (56) 74 (43) 1 (1) Azul et al. 2009
Portugal Qs 73 13 (18) 60 (82) Baptista et al. 2010
Spain Ps 164 20 (12) 144 (88) Bonet et al. 2004
Spain Fs, Qr 125 25 (20) 69 (55) 3 (2) 28 (22) Sarrionandia et al. 2009
Spain Qi, Qs 838 457 (55) 381 (45) Ortega and Lorite 2007
Canada Pi, Pc, Th, Tp, 551 263 (48) 272 (49) 15 (3) Roberts et al. 2004
Canada Pi, Pm, Th, Tp 277 114 (41) 97 (35) 2 (1) 64 (23) Outerbridge 2002
Canada Pi, Pm, Th, Tp 62 28 (45) 9 (15) 1 (2) 24 (38) Berch et al. 2001
Austrailia Em 149 60 (40) 89 (60) Anderson et al. 2010 S= total species, LD= litter-decay species, ECM= ectomycorrhizal species, P= parasitic species, WD= wood-decay species. Tree species codes: Bp= Betula
pubescens, Ca= Coryllus avellana, Cm= Crataegus monogyna, Cs= Castanea sativa, Em= Eucalyptus marginata, Fe= Fraxinus excelsior, Fs= Fagus sylvatica, Ld= Larix decidua, Ps= Pinus sylvestris, Pi= Picea sitchensis, Pc= Pinus contorta, Pa= Picea abies, Pm= Pseudotsuga menziesii, Pt= Pinus strobes, Qr= Quercus robur, Qp= Quercus petraea, Qs= Quercus suber, Qi= Quercus ilex, Th= Tsuga heterophylla, Tp=Thuja plicata.
184
Sitka spruce forest yielded the greatest species richness of macrofungi. A
total of 144 fungi were found in Sitka spruce forests, with 50 of these species
found only in these forests. This high species richness may reflect the ability of
Sitka spruce to accommodate a wide range of macrofungi (Alexander and Watling
1987). That Sitka spruce was also the most species rich according to rarefaction
analysis, shows that the high species richness of the Sitka spruce forest type was
not an artefact of the study design, which included more Sitka spruce plots.
Humphrey et al. (2000) found 269 macrofungal species in forests primarily
composed of Sitka spruce, with 73 of these species found only in this forest type.
Outerbridge (2002) investigated Sitka spruce in its home range on Vancouver
Island and found that in supported 37 fungal species which were not found in any
of the other forest types examined. To compare these previously mentioned
studies on similar scales, species per m2 data were calculated (Table 4.17). The
results from this study fall between those of the U.K. (Humphrey et al. 2003) and
Canadian studies (Outerbridge 2002). The study listed by Roberts et al. (2004)
used transect sampling, and so meaningful comparisons are difficult to draw. At
0.16 fungal species per m2, Sitka spruce forests are the second most species rich
forests (after oak) per unit area investigated in this study.
The high numbers of macrofungal species found in Sitka spruce
plantations in Ireland and the U.K. is a welcome fact for macrofungal
conservation, especially as the levels of Sitka spruce plantations are set to increase
throughout Europe (UNECE 2003). Several studies have shown that plantation
forests in Ireland can provide a habitat for a range of native flora and fauna such
as: vascular plants (French et al. 2007; Smith et al. 2007), spiders (Oxbrough et
al. 2006), beetles (Oxbrough et al. 2010), birds (Sweeney et al. 2010b) and mites
(Arroyo et al. 2010). The results of this study supports the views of Lindenmayer
et al. (2008) and Brockerhoff et al. (2008) that the afforestation with exotic tree
species can have positive effects on the diversity of other taxa, as long as native
woods are not removed to make way for the plantations (Quine and Humphreys
2010). Rarefaction analysis did not find significant differences between the total
species richness in young versus mature Sitka spruce plantations. Previous
research has shown a significant effect of age on species richness (Dighton et al.
1986), but the age groupings used in this study are not identical to those used in
the study of British Sitka spruce plantations by Dighton et al. (1986). It would be
185
expected that the community composition of the two age groupings of spruce
plots would be different and this is investigated later (Chapter 5).
The relatively lower numbers of macrofungal species found in ash forests
is not surprising as ash does not support ectomycorrhizal fungi. Those
ectomycorrhizal species that were found in ash plots were probably due to the
presence in the plots of roots from nearby trees of hazel or oak. In Ireland at least,
forests of pure ash are difficult to find. It is one of the most nutrient-demanding
tree species (Horgan et al. 2004) and it most often found planted in mixed
broadleaf plantations. Ash forest was the least species-rich forest type examined
per unit area with only 0.11 species per m2 (Table 4.17). There are very few
published studies on the macrofungi of ash forests. One such is the seven-year
study in a variety of Swiss forest habitats by Straatsma and Krisai-Greilhuber
(2003); they investigated the fungal communities in a very large mixed ash and
elm (Ulmus minor) plot. Over the seven years, they found a much larger number
of macrofungal species (228 species) than was found in this study (56 species).
However, when the two studies are equated in plot size by converting the results
to fungal species per m2, this study has a higher number of species at 0.11 species
per m2, while the Swiss study has only 0.02 species per m2 sampled (Table 4.17).
The study by Hering (1966) in an English ash woodland on limestone revealed
similar total species richness as this project with 59 species found over three
years. However, Hering undertook much more intense sampling of his plots,
visiting each one up to nine times a year for three years. The other two ash forest
studies (Table 4.17) used small-scale sampling strategies, and comparison
between these and this project are not meaningful.
Oak, one of two native tree types examined in this study, showed a very
high species richness of macrofungi (113 species) and the highest richness per m2
(0.23 species per m2) (Table 4.17). The oak forests of Ireland have been noted as
mycologically rich habitats (Ramsbottom 1936), especially the annexed habitat:
old sessile oak woods with Ilex and Blechnum in the British Isles (EUROPA
2009). The study by Humphrey et al. (2003) of British woodlands, found a total of
284 macrofungal species in oak forests (all pedunculate oak Quercus robur),
which equates to 0.32 species per m2 sampled, the most species-rich forest type on
an area basis. The study by Sarrionandia et al. (2009) found 99 species in oak (Q.
186
robur) forests in Northern Spain, or 0.06 species per m2. Differences in oak
species, the climate and in forest composition are possible reasons for the lower
species richness in the Spanish study. The study by Straatsma and Krisai-
Greilhuber (2003) examined a 16,000m2 plot with sessile oak as its dominant tree
species, and found 132 macrofungal species over seven years of sampling which
equates to 0.008 species per m2. Although a positive relationship has been
identified between forest size and macrofungal species richness (Peay et al. 2007)
it is unlikely that this relationship is linear with constant increases in species
richness as forest size increases. In the case of the oak plot in Straatsma and
Krisai-Greilhuber (2003), it may be possible that similar levels of species richness
could have been identified using a smaller plot size and therefore the values for
species/m2 are unrealistically low.
Of the two coniferous forest types Scot’s pine and Sitka spruce, the former
type was expected to have a higher overall diversity of macrofungi, given that 3 of
the Scot’s pine sites were in old stands and on previously forested areas, and due
to Scot’s pine being present in Ireland longer than Sitka spruce. However, this
was not the case, as Sitka spruce forest type yielded 144 macrofungal species
compared to Scot’s pine’s 89 species, and spruce forests were also more species
rich according to rarefaction.
A comparable study of plantation Scot’s pine stands in the U.K. (Ferris et
al. 2000a) identified 253 macrofungal species over a period of three years.
Humphrey et al. (2003) found 357 species of fungi in Scot’s pine forests in
England and Scotland. These forests were also plantation forests, but with
differing land use history, including six plots which were once native pine forests
and nine plots which were not native pine forests. It might be expected that the
plots which were once native stands would harbour greater macrofungal species
richness, but this was not the case as the non-pine past land use plots contained
285 fungal species while the plots used as native stands in the past contained 168
macrofungal species (C. Quine, unpub. data). The number of plots sampled was
not equal between the two land use histories, and so these comparisons of species
richness may not be realistic. In this study, the opposite result was found as
second rotation Scot’s pine forests were shown (by GLM) to have a higher species
richness than first rotation plots. Although Ferris et al. (2000a) did not investigate
the effect of past land use on fungal species richness, they did hypothesise that it
187
may be a key variable in explaining some of the variation in species richness
between their pine plots.
Studies on Scot’s pine macrofungi in Spain carried out by Oria de Rueda
et al. (2010) and Bonet et al. (2004) identified 84 and 164 species respectively,
while Tarvainen et al. (2003) found 168 species in Scot’s pine forests in Finland.
On a species richness per area basis, this study averaged 0.1 fungal species per
m2, which was lower than all of the studies listed in Table 4.17 with the exception
of the Oria de Rueda (2010) study. This low number of species per m2 is most
likely not a true representation of macrofungal diversity in Irish Scot’s pine
forests. Mature forests (as 4 of the 8 Scot’s pine plots could be regarded in this
study) are known to have a high number of rarer species that infrequently produce
sporocarps (O’Dell et al. 1999; Smith et al. 2003), which would therefore require
a longer period of sampling to discover. Morevover, since there are no surviving
native Scot’s pine forests in Ireland today (Mitchell 1988; Cross 1998), inoculum
sources for Scot’ pine forest fungi are not available as would be the case in
Scotland.
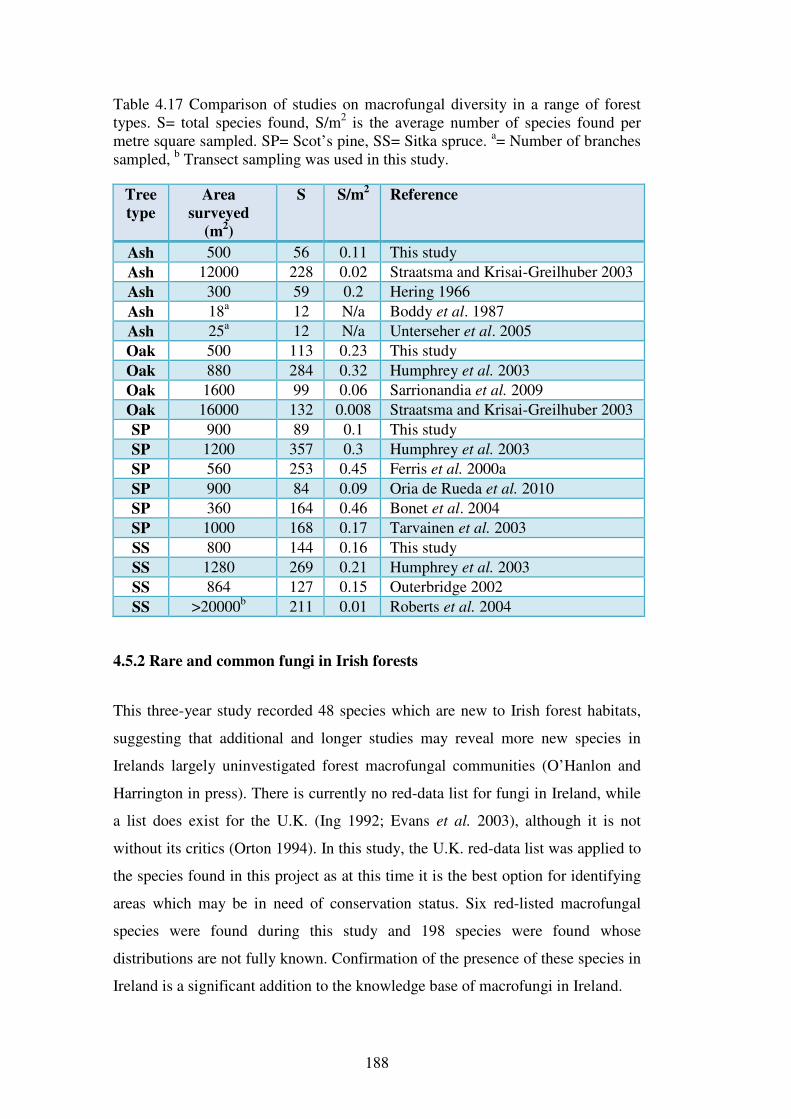
188
Table 4.17 Comparison of studies on macrofungal diversity in a range of forest types. S= total species found, S/m2 is the average number of species found per metre square sampled. SP= Scot’s pine, SS= Sitka spruce. a= Number of branches sampled, b Transect sampling was used in this study.
Tree
type
Area
surveyed
(m2)
S S/m2 Reference
Ash 500 56 0.11 This study
Ash 12000 228 0.02 Straatsma and Krisai-Greilhuber 2003
Ash 300 59 0.2 Hering 1966
Ash 18a 12 N/a Boddy et al. 1987
Ash 25a 12 N/a Unterseher et al. 2005
Oak 500 113 0.23 This study
Oak 880 284 0.32 Humphrey et al. 2003
Oak 1600 99 0.06 Sarrionandia et al. 2009
Oak 16000 132 0.008 Straatsma and Krisai-Greilhuber 2003
SP 900 89 0.1 This study
SP 1200 357 0.3 Humphrey et al. 2003
SP 560 253 0.45 Ferris et al. 2000a
SP 900 84 0.09 Oria de Rueda et al. 2010
SP 360 164 0.46 Bonet et al. 2004
SP 1000 168 0.17 Tarvainen et al. 2003
SS 800 144 0.16 This study
SS 1280 269 0.21 Humphrey et al. 2003
SS 864 127 0.15 Outerbridge 2002
SS >20000b 211 0.01 Roberts et al. 2004
4.5.2 Rare and common fungi in Irish forests
This three-year study recorded 48 species which are new to Irish forest habitats,
suggesting that additional and longer studies may reveal more new species in
Irelands largely uninvestigated forest macrofungal communities (O’Hanlon and
Harrington in press). There is currently no red-data list for fungi in Ireland, while
a list does exist for the U.K. (Ing 1992; Evans et al. 2003), although it is not
without its critics (Orton 1994). In this study, the U.K. red-data list was applied to
the species found in this project as at this time it is the best option for identifying
areas which may be in need of conservation status. Six red-listed macrofungal
species were found during this study and 198 species were found whose
distributions are not fully known. Confirmation of the presence of these species in
Ireland is a significant addition to the knowledge base of macrofungi in Ireland.
189
The list of the most species rich genera found from Irish forests (Fig. 4.19)
shares many similarities with the most commonly recorded fungi from Ireland
(O’Hanlon and Harrington in press) and the U.K. (FRDBI 2010). A more
focussed surveying of the grassland fungi in Ireland in the past, has led to high
levels of species richness in common grassland genera such as Entoloma and
Hygrocybe, which are not reflected in the genera richness levels found during this
study (Fig. 4.19).
Of the top 20 most commonly recorded fungi from this project, six are
present in the most common list for Ireland (O’Hanlon and Harrington in press),
five species are present in the U.K. top 20, five more are in the U.K. top 100 and
another five are within the top 150 species in the U.K. Seven of the top 20 most
commonly-found species in this project were also in the top 20 macrofungal
species in the study of plantation forests in England and Scotland (Humphrey et
al. 2003). Species that were common in this study but are not common in either
the list of common Irish species or U.K. woodland species (Humphrey et al. 2003)
include Cortinarius flexipes, Marasmius hudsonii, and Mycena rorida. Both
Mycena rorida and Cortinarius flexipes are listed as occasional in the U.K. by
Phillips (2006). According to the checklist of Basidiomycetes in Britain and
Ireland, Cortinarius flexipes is present in the U.K. and Ireland but its distribution
is not well known. Throughout this project Cortinarius flexipes was found in 13
oak plot visits, 4 Scot’s pine plot visits and 8 Sitka spruce plot visits. Taking these
values as an indication of its distribution in Ireland, it could be said to be
occasional to common in Irish oak forests and conifer plantations. Mycena rorida
is listed as occasional in the U.K. according to the Checklist of Basidiomycetes in
Britain and Ireland (Legon and Henrici 2005), whilst its distribution is unknown
in Ireland. In this study it was collected in 7 ash plot visits, 5 Scot’s pine plot
visits and 10 Sitka spruce plot visits. In the ash sites it was most commonly found
on Rubus fruticosus stems, while in the pine and spruce plots its substrate was
usually small conifer twigs. The expansion of Ireland’s plantation forests (Anon.
1996) may have the effect of making species like Cortinarius flexipes and Mycena
rorida more common in Ireland. Marasmius hudsonii is a saprobe of holly leaves.
It seems to be more common in Atlantic oak woods. It was not found in a survey
of Scottish western oak woods (Watling 2005), but has been found on a number of
the British Mycological Society’s forays (FRDBI 2010). Its distribution data show
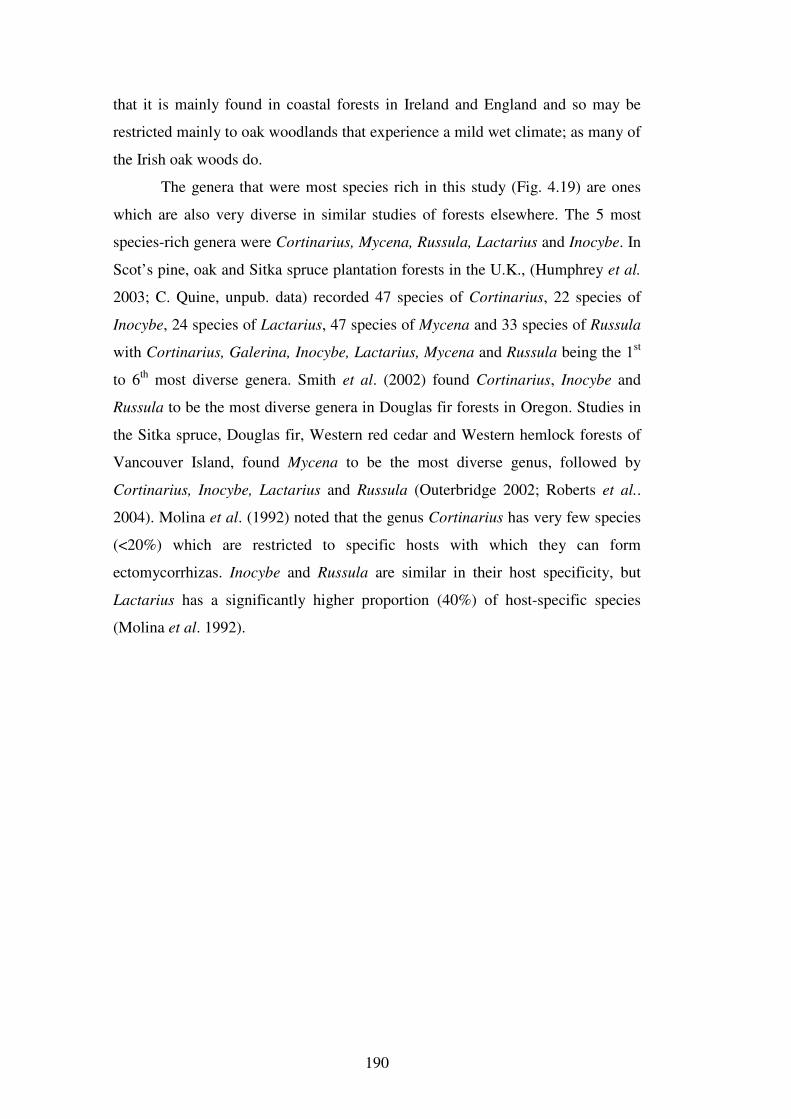
190
that it is mainly found in coastal forests in Ireland and England and so may be
restricted mainly to oak woodlands that experience a mild wet climate; as many of
the Irish oak woods do.
The genera that were most species rich in this study (Fig. 4.19) are ones
which are also very diverse in similar studies of forests elsewhere. The 5 most
species-rich genera were Cortinarius, Mycena, Russula, Lactarius and Inocybe. In
Scot’s pine, oak and Sitka spruce plantation forests in the U.K., (Humphrey et al.
2003; C. Quine, unpub. data) recorded 47 species of Cortinarius, 22 species of
Inocybe, 24 species of Lactarius, 47 species of Mycena and 33 species of Russula
with Cortinarius, Galerina, Inocybe, Lactarius, Mycena and Russula being the 1st
to 6th most diverse genera. Smith et al. (2002) found Cortinarius, Inocybe and
Russula to be the most diverse genera in Douglas fir forests in Oregon. Studies in
the Sitka spruce, Douglas fir, Western red cedar and Western hemlock forests of
Vancouver Island, found Mycena to be the most diverse genus, followed by
Cortinarius, Inocybe, Lactarius and Russula (Outerbridge 2002; Roberts et al..
2004). Molina et al. (1992) noted that the genus Cortinarius has very few species
(<20%) which are restricted to specific hosts with which they can form
ectomycorrhizas. Inocybe and Russula are similar in their host specificity, but
Lactarius has a significantly higher proportion (40%) of host-specific species
(Molina et al. 1992).
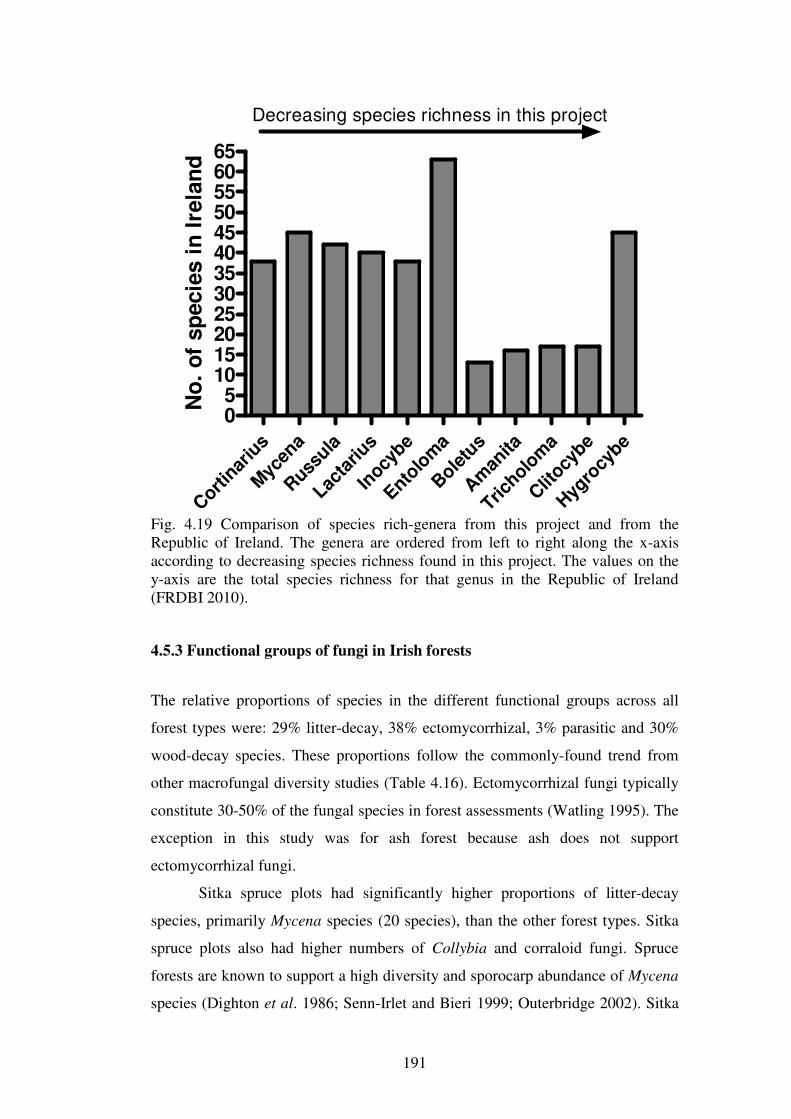
191
Cort
inar
ius
Myc
ena
Russ
ula
Lacta
rius
Inocy
be
Entolo
ma
Bole
tus
Am
anita
Tricholo
ma
Clit
ocybe
Hyg
rocy
be
05
101520253035404550556065
Decreasing species richness in this project
No
. o
f sp
ecie
s i
n I
rela
nd
Fig. 4.19 Comparison of species rich-genera from this project and from the Republic of Ireland. The genera are ordered from left to right along the x-axis according to decreasing species richness found in this project. The values on the y-axis are the total species richness for that genus in the Republic of Ireland (FRDBI 2010).
4.5.3 Functional groups of fungi in Irish forests
The relative proportions of species in the different functional groups across all
forest types were: 29% litter-decay, 38% ectomycorrhizal, 3% parasitic and 30%
wood-decay species. These proportions follow the commonly-found trend from
other macrofungal diversity studies (Table 4.16). Ectomycorrhizal fungi typically
constitute 30-50% of the fungal species in forest assessments (Watling 1995). The
exception in this study was for ash forest because ash does not support
ectomycorrhizal fungi.
Sitka spruce plots had significantly higher proportions of litter-decay
species, primarily Mycena species (20 species), than the other forest types. Sitka
spruce plots also had higher numbers of Collybia and corraloid fungi. Spruce
forests are known to support a high diversity and sporocarp abundance of Mycena
species (Dighton et al. 1986; Senn-Irlet and Bieri 1999; Outerbridge 2002). Sitka

192
spruce forests harbour large numbers of Mycena species in its home range in
Canada; Outerbridge (2002) found 45 species of Mycena on the thick layer of
needles in her Sitka spruce sites. A total of 28 species of Mycena were found in
Sitka spruce plots in the U.K., the second highest number of Mycena species after
Scot’s pine plots found in the study of Biodiversity in Britain’s planted forests (C.
Quine, unpub. data). In this study, it was found that the age of the spruce forest
had a significant effect on the litter decay species richness of the plots. Litter
decay species richness was seen to be negatively related to forest age. This finding
is similar to that made by Dighton et al. (1986) in a study of Sitka spruce
plantations in the U.K., when the age groupings used in the U.K. study are
amalgamated into similar groupings as used here.
Sitka spruce had the second highest proportion of ectomycorrhizal species
after Scot’s pine. The total numbers of ectomycorrhizal species recorded with
Quercus, Picea and Pinus in the U.K. are 233, 151, and 201 respectively (Newton
and Haigh 1998), and therefore it was expected that the oak forest type would
have a higher proportion of ectomycorrhizal species than the coniferous forest
types. However, this was not the case, as oak had a lower ectomycorrhizal species
richness per plot visit than Sitka spruce (although not significantly different).
Another factor which must be taken into account in explaining the lower number
and proportion of ectomycorrhizal species in oak than in Sitka spruce plots, is the
number of other mycorrhizal trees which were part of the plots. It was attempted
to position the plots in such a way to exclude tree species other than the tree
species of interest. This was difficult in the coniferous sites, as there were often
randomly placed birch trees in the plots. Species such as Lactarius glyciosmus, L.
torminosus and L. quietus were all present in the coniferous plots, although almost
definitely in association with birch for the first two species and with oak trees in
the plots for the latter species.
Oak and Sitka spruce forest contained the highest number of wood-decay
species, but in relative terms this group were most abundant in ash sites, where
they comprised 45% of the total number of species. Average wood decay species
per plot visit were significantly higher in oak than in Scot’s pine sites. This
difference is most likely due to the presence of more coarse woody debris (CWD)
in oak sites than in Scot’s pine sites (Table 3.15, Chapter 3). The lack of quantity
and high quality of CWD in Irish plantation forests has been highlighted by
193
Sweeney et al. (2010a), and they proposed a diversity of log sizes and qualities
that should be left on site, which would increase the invertebrate and fungal
diversity of the sites. As CWD quantity has been shown to be positively related to
the number of wood-decay species (Ferris et al. 2000a), increasing the quantity
and quality of CWD on site would also improve the number of fungal species.
The species richness of the macrofungi was similar between the plots of a
similar forest type. Larger differences in species richness values between sites of
the same forest type were most noticeable in the Sitka spruce forest type. It was
noted in two of the Sitka spruce plots that large slash piles bisecting the plots were
often the habitat for a number of wood decay species e.g. Mycena species (R
O’Hanlon pers. observation). Also, plots which had other ectomycorrhizal tree
species present near the plots had higher ectomycorrhizal species richness. This
finding is not surprising, as it is known that fungal species richness shows a
positive relationship with the number of tree species present (Ishida et al. 2007).
The amount of CWD present in sites has been shown to increase the richness of
decay fungi (Ferris et al. 2000a), and increasing the number of tree species causes
an increase in the number of fungi present (Ferris et al. 2000a; Schmit et al.
2005). Therefore, the guidelines put in place to govern the planting and
management of plantation forests in Ireland (Anon. 2000) which state that
minimum levels of CWD must be present, and that main tree species cannot
exceed 80% of the plantation, are both beneficial to overall macrofungal species
richness and diversity of functional groups.
4.5.4 Species and fruitbody abundance correlated to weather parameters
It is well known that macrofungi are highly affected by weather conditions
(Ohenoja 1993; Gulden et al. 1992; Carrier 2003). In this study, the main effects
of climatic conditions differed between the different forest types. One of the few
conclusions which hold true for all of the forest types investigated is that litter-
decay fruitbodies are negatively affected by large amounts of rainfall 3-4 weeks
previous to sampling. It has been shown by experimentation that excess water can
stimulate the growth of the mycelium to the detriment of fruiting body formation
(Manachere 1980; Pinna et al. 2010). In the present study, ectomycorrhizal fungal
194
fruitbodies were found to be more abundant in sites with a higher annual rainfall.
Similar results were found by Straatsma et al. (2001) and O’Dell et al. (1999),
where mean annual rainfall was found to be positively correlated to
ectomycorrhizal species richness and fruitbody abundance. This led O’Dell et al.
(1999) to state that ectomycorrhizal fungi may show a unimodal response to
precipitation levels.
4.5.5 Estimating fungal diversity in Irish forest habitats
The rarefied species accumulation curve had not levelled off for any of the forest
types by the end of the three year stud. It is highly probable that the number of
species from the plots would continue to increase with more sampling effort. An
important point to note from Fig. 4.3 is that the rarefaction estimate of the species
richness of the forest types is lower than the actual species richness at the
maximum sampling intensity. This is an artefact of the random sampling with
replacement sampling method used in the analysis. As samples are chosen
randomly and then replaced back into the data set, some samples can be chosen
twice, and some are not chosen at all. This has the effect of making the rarefaction
estimate fall below the actual estimate (Colwell 2009). This artefact however is an
acceptable pitfall of sample-based rarefaction with replacement, as without
replacement of samples confidence intervals would be meaningless in the upper
end of the rarefaction.
From examination of the species richness estimates the most complete list
of fungi for the forest types was from the Sitka spruce followed by the oak, Scot’s
pine and ash forest types with an estimated 77, 65, 52 and 45% of their fungal
species richness realized respectively. Schmit et al. (1999) tested the application
of a number of species richness estimators to macrofungal survey data from a
mixed oak and maple forest that included 177 identified species. They produced
richness estimates ranging from 193 to 348 species or somewhere between 51 and
91% of the species richness realised from two year’s sampling. They concluded
from their data that at that point in time there was no diversity estimator which
was suitable for use on fungal diversity data, but they did not include the ICE or
ACE estimators in their study. Unterseher et al. (2008) also tested fungal data
195
using species richness estimators. Out of the total 146 species they identified
(including 109 macrofungi) they produced diversity estimates ranging from 178 to
210 species or between 70 and 85% of the species discovered from their selected
wood samples. They concluded that the Chao2 estimator was the most applicable
as it gave a realistic figure for species richness and reached an asymptote before
100% sampling effort was reached.
From the data and analysis in this study, it can be concluded that, with
three years of sampling of the macrofungal communities in these temperate forest
types, none of the estimators fulfil the selection criteria set out by Magurran
(2004). The Chao2 estimator is used here as it has been identified as a useful
lower limit richness indicator when other estimators fail to meet the selection
criteria (Longino et al. 2002). The Chao2 which uses qualitative data was chosen
over similar estimators which take species abundance into account, because
fungal species, particularly ectomycorrhizal species, are known to be non-
randomly distributed (Taylor 2002; Tedersoo et al. 2003), and so the assumption
of homogeneous distribution of fungal species is not met. Patchy distributions
have been shown to severely diminish the ability of abundance-based
(quantitative) estimators such as ACE and Chao1, but the Chao2 estimator has
been shown to be rather robust when used on moderately patchy distributions
(Chazdon et al. 1998). It has been noted that richness estimates in hyperdiverse
communities such as ectomycorrhizal communities (Tedersoo et al. 2006), are
problematic when species richness estimators are used, due to the large number of
rare species. In these cases, the species richness estimate should be taken as a
lower estimate of diversity (Mao et al. 2005).
Comparing rarefied species richness values between the sites reveals that
Sitka spruce plots are amongst the five most species rich plots. The top five most
species-rich sites are Abbeyleix (oak), Dooary (SS), Raheen (oak), Bohatch (SS)
and Stanahely (SS). The fact that Sitka spruce sites rank in the top five most
species-rich sites shows the potential of Sitka spruce plantations as habitats for
forest fungi in Ireland, as has already been shown for spruce plantations in the
U.K. (Humphrey et al. 2000).
Also worthy of note is that the St John’s wood (ash) site ranks as the
seventh most species-rich site based on rarefied species richness. This site, which
is one of the few remaining semi-natural forest habitats in Ireland shows that even
196
though the site has very few ectomycorrhizal fungi, mature semi-natural ash
forests can have a very high diversity of macrofungi present. Straatsma and
Krisai-Greilhuber (2003) showed the high diversity of macrofungi which can be
present in old growth ash forests in Switzerland.
Another unexpected result to come from the analysis of rarefied species
richness values for the sites was that the old growth Scot’s pine forest at Torc,
which is believed to be one of the oldest in Ireland (Mitchell 1988) had such a low
species richness. The invasion of rhododendron in this site may well have
negative effects on the fungal species richness of this site. The presence of this
invasive plant in this plot makes comparisons between similar sites difficult
because based on vegetation present, the Torc site is most similar to the pine sites
at Annagh and Ballygawley. However, these sites are planted on different soil
types and are also much younger than the Torc site so comparisons of fungal
diversity between the sites are not reasonable. The Biodiversity in Britain’s
planted forests project (Humphrey et al. 2003; C. Quine, unpub. data) investigated
a total of 15 Scot’s pine plots, and found that their Scot’s pine plot at Strathspey
had the lowest species diversity of all of their pine plots with 48 species recorded.
Their site at Strathspey is the most similar to the Torc site in this project, an old
pine plot with a vegetation community consisting of dominant moss cover with
Calluna vulgaris also present corresponding to Vaccinium myrtillus-I. aquifolium
(Br. –Bl. Et Vlieger 1939).
The most species-rich Scot’s pine site in this project was the site at Brittas
which had 25 species. This site had oak (Quercus petraea) trees in the understory.
It is worth mentioning that in the Humphrey et al. (2003) study, the most species
rich Scot’s pine site was found to be a ~70 year old Scot’s pine site at New Forest
which also had a number of oak trees in its understory. Examination of the data
from the U.K. study (C. Quine, unpub. data) study show just how species rich
Scot’s pine plots can be if thorough systematic sampling is carried out. They
found an average of 68 species per Scot’s pine plot, with a range of species
richness from 48 to 124 species. However, as there are no pristine Scot’s pine
woodlands present in Ireland, the species richness of the Scot’s pine plots could
not be expected to be as high as those from the U.K. Humphrey et al. (2000)
found that the closer a forest plantation was to a pristine forest of similar tree type,
the higher the number of rare species found in that forest so it could be concluded
197
that the lower species richness in Irish Scot’s pine forests may be due to the lack
of pristine pine forests in Ireland.
Species richness (the total number of species in a given area) has become
the common currency in biodiversity research (Gaston and Spicer 2007). Species
richness is a straightforward measure, but does not convey any information about
the relative frequency of occurrence of species in an area or the probability of
finding a particular species in the area. For this, an abundance-based diversity
index is required. A conceptual difficulty with using such indices in assessment
of macrofungal diversity using sporocarps is that there is no correlation between
the occurrence of a sporocarp and an “individual” fungal mycelium. Nevertheless
such indices are often used in assessments of fungal diversity (Azul et al. 2009;
Berch et al. 2006; Humphrey et al. 2000; Gebhardt et al. 2007; Straatsma et al.
2001). One of the main conclusions that can be made from the diversity index
analysis of different forest types is that, overall Sitka spruce plantations can be
very diverse, almost equalling the fungal diversity of oak forests. However, they
are also the most uneven in terms of species distributions across the sites in this
study. Taking the values for the Simpson’s diversity index as the best and most
meaningful estimate of diversity (Magurran 2004), the Scot’s pine forest type is
the most diverse followed by the oak, Sitka spruce and ash forests.
Another method often used to estimate total macrofungal species richness
is to relate macrofungal and plant species richness (Villeneuve et al. 1989;
Hawksworth 1991; Watling 1995; Schmit and Mueller 2007). Estimates of
possible macrofungal species richness were made using an established 2:1 fungal
to plant species ratio in Section 3.3.5, Chapter 3.
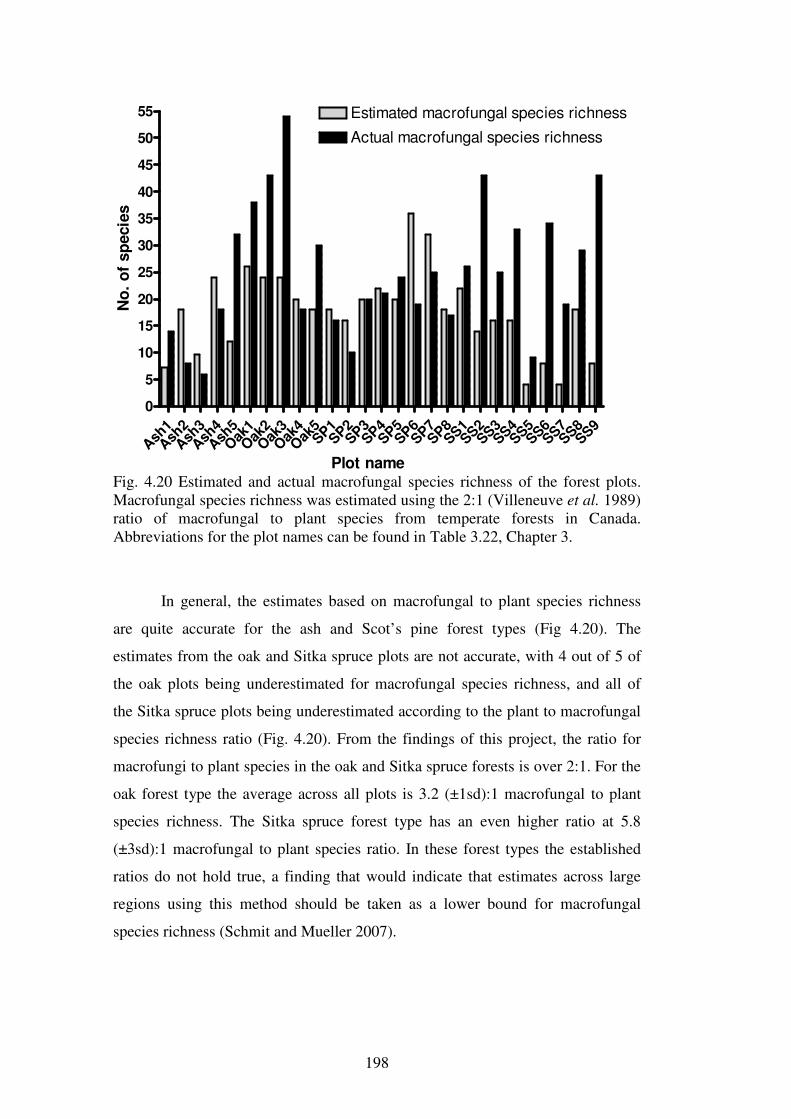
198
Ash
1
Ash
2
Ash
3
Ash
4
Ash
5
Oak
1
Oak
2
Oak
3
Oak
4
Oak
5SP
1SP
2SP
3SP
4SP
5SP
6SP
7SP
8SS
1SS
2SS
3SS
4SS
5SS
6SS
7SS
8SS
9
0
5
10
15
20
25
30
35
40
45
50
55 Estimated macrofungal species richness
Actual macrofungal species richness
Plot name
No
. o
f sp
ecie
s
Fig. 4.20 Estimated and actual macrofungal species richness of the forest plots. Macrofungal species richness was estimated using the 2:1 (Villeneuve et al. 1989) ratio of macrofungal to plant species from temperate forests in Canada. Abbreviations for the plot names can be found in Table 3.22, Chapter 3.
In general, the estimates based on macrofungal to plant species richness
are quite accurate for the ash and Scot’s pine forest types (Fig 4.20). The
estimates from the oak and Sitka spruce plots are not accurate, with 4 out of 5 of
the oak plots being underestimated for macrofungal species richness, and all of
the Sitka spruce plots being underestimated according to the plant to macrofungal
species richness ratio (Fig. 4.20). From the findings of this project, the ratio for
macrofungi to plant species in the oak and Sitka spruce forests is over 2:1. For the
oak forest type the average across all plots is 3.2 (±1sd):1 macrofungal to plant
species richness. The Sitka spruce forest type has an even higher ratio at 5.8
(±3sd):1 macrofungal to plant species ratio. In these forest types the established
ratios do not hold true, a finding that would indicate that estimates across large
regions using this method should be taken as a lower bound for macrofungal
species richness (Schmit and Mueller 2007).
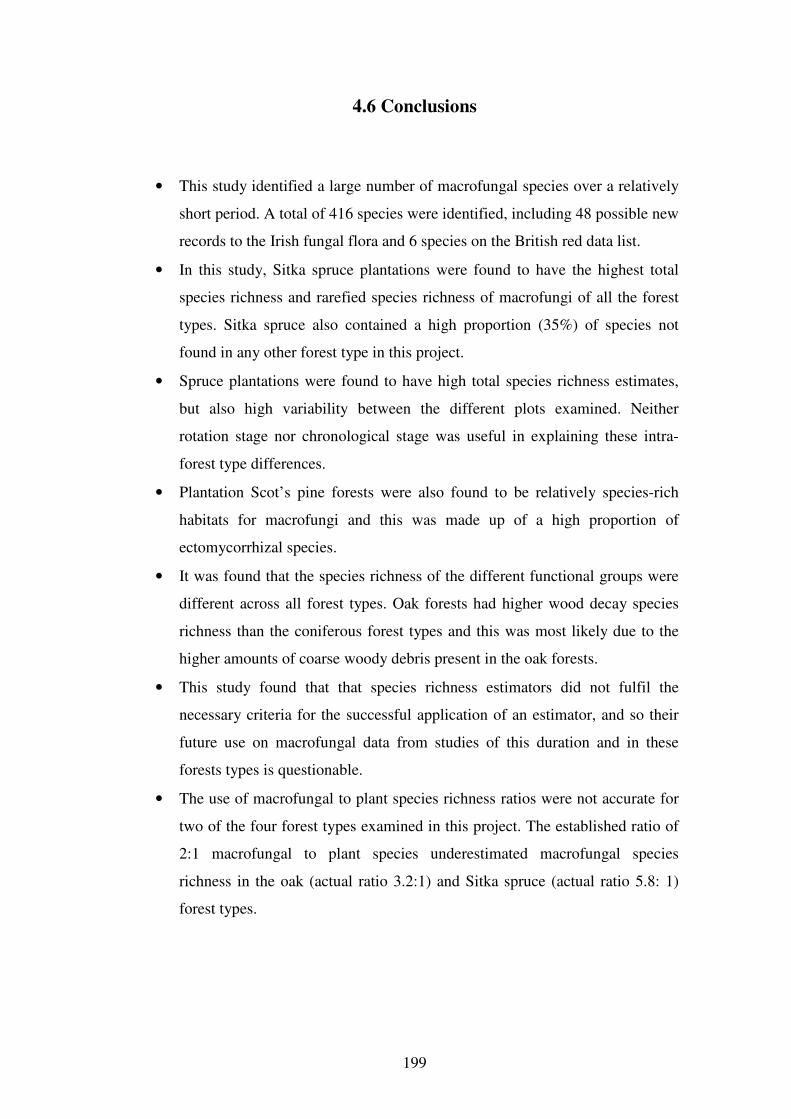
199
4.6 Conclusions
• This study identified a large number of macrofungal species over a relatively
short period. A total of 416 species were identified, including 48 possible new
records to the Irish fungal flora and 6 species on the British red data list.
• In this study, Sitka spruce plantations were found to have the highest total
species richness and rarefied species richness of macrofungi of all the forest
types. Sitka spruce also contained a high proportion (35%) of species not
found in any other forest type in this project.
• Spruce plantations were found to have high total species richness estimates,
but also high variability between the different plots examined. Neither
rotation stage nor chronological stage was useful in explaining these intra-
forest type differences.
• Plantation Scot’s pine forests were also found to be relatively species-rich
habitats for macrofungi and this was made up of a high proportion of
ectomycorrhizal species.
• It was found that the species richness of the different functional groups were
different across all forest types. Oak forests had higher wood decay species
richness than the coniferous forest types and this was most likely due to the
higher amounts of coarse woody debris present in the oak forests.
• This study found that that species richness estimators did not fulfil the
necessary criteria for the successful application of an estimator, and so their
future use on macrofungal data from studies of this duration and in these
forests types is questionable.
• The use of macrofungal to plant species richness ratios were not accurate for
two of the four forest types examined in this project. The established ratio of
2:1 macrofungal to plant species underestimated macrofungal species
richness in the oak (actual ratio 3.2:1) and Sitka spruce (actual ratio 5.8: 1)
forest types.

200
201
Chapter 5: Macrofungal communities of
the forest types

202
203
5.1 Introduction
5.1.1 Mycocoenological study methods
The primary aim of this chapter is to determine if there are discernable differences
in the distribution of macrofungi between the different forest types, such that
distinct assemblages or communities of macrofungi can be recognised. The study
of macrofungal communities (mycocoenology) of forest ecosystems is based on
the methods used to describe the plant communities (phytocoenology) of those
ecosystems (Arnolds 1981; Barkman 1976), and treats a fungal sporocarp as a
recording unit just as an individual plant may be considered a unit. The
application of community concepts and sampling methodologies to fungal
assemblages faces a number of difficulties, which are unique to fungi and
macrofungi in particular:
1) Although next generation DNA identification methods such as
pyrosequencing have significantly increased the ability to identify the large
diversity of macrofungal species present in ecosystems (Hibbett et al. 2011),
the identification of fungi by taxonomic examination of their sporocarps is
still the most common method. A pitfall of using sporocarps is that species
that do not produce macroscopic sporocarps or fruit irregularly are not
considered or are likely to be overlooked.
2) The lack of consistent patterns between the abundance of sporocarps above-
ground and the distribution of mycelium below-ground (Horton and Bruns
2001; Peter et al. 2001) means that it is not possible to quantify the actual
abundance of a species in real ecosystems.
3) The sporadic and variable annual fruiting patterns of macrofungi necessitate
extended studies spanning a number of years. Three years has been
recommended as a minimum (Hering 1966), but much longer periods may be
required for a full inventory of the macrofungi (Arnolds 1988; Watling 1995).
The effectiveness of a study is a function of duration by sampling frequency.
The former may be reduced if the latter is increased or vice versa for a
particular level of effectiveness. Sampling frequency should take account of
differences in the lifespan of different sporocarps. Intervals of 3-4 days have
204
been suggested (Watling 1995) if the entire macrofungal community is to be
described including the very transient sporocarps such as those of the genus
Mycena (Richardson 1970).
4) The concept of community when applied to fungi, poses a number of
conceptual and practical difficulties. The term fungal community is analogous
to the term plant community, i.e. it is a neutral term for any concrete
assemblage of fungi that grow together in a uniform habitat, without
considering any differences in resource exploitation among the assemblages’
members (Arnolds 1992). For example, the fungal community is not
functionally homogenous because it contains symbiotic, parasitic and
saprotrophic elements. The habitats occupied by these different groups could
hardly be considered uniform at a population level and most members of the
assemblage of the “community” probably do not interact in any significant
fashion. Dividing the fungal species into functional groups based on their
primary mode of nutrition (Section 4.3.2 Chapter 4) is one method used to
address this conceptual difficulty.
5) Difficulties also arise in the synthesis of mycocoenological data for
comparison between studies and even within studies. Because plots are
sampled several times per year it is necessary to calculate a synthetic measure
of species abundance. Unfortunately there is no general agreement on what
this measure should be and this has hampered comparison of results from
different mycocoenological studies. The range of synthetic measures has been
reviewed by Winterhoff (1984), Barkman (1987), Arnolds (1981) and more
recently by Zak and Willig (2004) and include measures of frequency of
occurrence and measures of average sporocarp production.
5.1.2 Macrofungal communities of forest ecosystems
A prime requirement for the formation of distinct assemblages of organisms or
communities is that populations of different species share a similar habitat, which
is defined by distinct abiotic and biotic conditions. The formation of communities
is also strongly influenced by the ecological amplitudes of individual species. In
205
the case of fungi, some have quite specific ecological requirements, while others
are more general in their requirements. For example, the ectomycorrhizal genus
Naucoria is largely confined to wet alder woods, because of its association with
Alnus (Molina et al. 1992), while the species Suillus grevillei associates
exclusively with larch. Marasmius hudsonii, which is very restricted worldwide,
grows only on fallen holly (Ilex aquifolium) leaves and is therefore restricted to
woodlands containing holly, such as Atlantic oak forests (Gill et al. 1948). In
contrast, ectomycorrhizal species such as Laccaria laccata and Russula
ochroleuca associate with a wide range of tree hosts and are consequently found
in a range of forest habitats. Such species would tend to be less useful in
discriminating macrofungal communities. The general consensus is that restriction
of a fungal species to a single habitat is rare, and it seems that in general
endemism in macrofungi is not common, at least in temperate regions (Mueller et
al. 2007).
For reasons outlined above, the macrofungal communities of forests
cannot be defined using restricted species alone. Wilkins et al. (1937) devised
guidelines to help define the “characteristic mycological flora” of any ecosystem.
The two grouping which can be applied to the macrofungi found are:
1) Relatively constant species
This group can be further sub-divided into (a) common species but are found
constantly in every community (e.g. Laccaria laccata with oak, Scot’s pine, Sitka
spruce and beech), (b) characteristic species which are found constantly in one
community and less frequently in other communities (e.g. Lactarius quietus with
oak) and (c) restricted species which are found in only one community (e.g.
Daldinia concentrica with ash).
2) Relatively inconstant species
These are the species which can appear sporadically in different ecosystem types
and thus their specific ecological requirements are difficult to determine. These
species are usually not specifically commented on, as their abundances in studies
are too low to draw any major conclusions concerning their ecology.
206
Using multivariate statistics and species abundance patterns from a
number of different forest types, recent studies (Humphrey et al. 2000; Ferris et
al. 2000a; Ishida et al. 2007; Buee et al. 2011) have shown that the fungal
communities of temperate forests can be clearly defined and delineated.
5.1.3 Past studies of macrofungal communities in temperate oak, ash, Scot’s
pine and Sitka spruce forest habitats
There have been no previous systematic studies of macrofungal communities in
Irish forest habitats. Habitats which have received intensive fungal community
analysis are the Burren area of western Ireland (Harrington and Mitchell 2005)
and Irish grasslands (Mc Hugh et al. 2001), and their fungal communities have
been well described. The closest studies examining macrofungal communities
have been carried out in the U.K.
The macrofungal communities of oak forests in Britain have been
described by several workers (Hering 1966; Watling 1974; Wilkins et al. 1937;
Humphrey et al. 2000). The list of ectomycorrhizal fungi from oak woods is often
very large. The macrofungal species Lactarius quietus, Russula cyanoxantha and
R. nigricans were found to be abundant in sessile oak forests while absent from
nearby ash (Fraxinus) forests by Hering (1966), and therefore are important
macrofungal components of these oak woods in Britain. Watling (1974) identified
several species from the ectomycorrhizal genera Boletus and Leccinum as being
somewhat restricted to oak forests in the U.K. Wilkins et al. (1937) found that
over 30% of the species found in their pedunculate oak woods were not found in
either their coniferous or beech plots, and these included species from the genus
Lactarius including L. glyciosmus, L. mitissimus, L. pyrogalus and L. vellereus.
The most recent study of macrofungal communities in British oak forests
(Humphrey et al. 2000) produced a clear separation of the of oak forests from the
other forests based on the ordination of the macrofungal species found. The
authors identified a distinctive group of Russula species (R. betularum, R.
nigricans, R. fragilis and R. cyanoxantha; C. Quine, unpub. data) as being
abundant in their oak plots but less common in their Scot’s pine, Sitka spruce and
Norway spruce plots.
207
Ash forests due to their lack of the ectomycorrhizal fungal element have
received much less study than other forest types in temperate regions. Studies
which examined the ash macrofungal communities have been conducted in Britain
(Hering 1966; Boddy et al. 1987) and Switzerland (Straatsma and Krisai-
Greilhuber 2003). The study by Boddy et al. (1987), examined the fungi which
formed on ash branches at different stages of decay. They identified species such
as Daldinia concentrica and Hypoxylon rubiginosum as being very common
macrofungal species on decaying ash wood. In a study of British deciduous
forests, Hering (1966) found that his ash plot had almost as high species richness
as his sessile oak plot and included the ash restricted species Coprinus micaceus
and Marasmius epiphyllus. The long term (seven years) study in the Swiss plot
(Straatsma and Krisai-Greilhuber 2003), identified 228 macrofungal species
present in an ash and elm forest plot. Although distinctive species were not
commented on, the species seem to follow the trend of other macrofungal
communities, in that they fruit infrequently and vary considerable from year to
year, with 41% of the species being found in only one year of the study and so
could be classified as relatively inconstant species according to the Wilkins et al.
(1937) framework above.
The macrofungal ecology of Scot’s pine forests has not been investigated
directly in Ireland, but the study by Harrington (2003) investigated the
macrofungal communities in Dryas habitats in the Burren, western Ireland. The
fungal community found in this habitat is said to have persisted in association
with Dryas roots since the ancient forests of Scot’s pine became extinct from the
area (Harrington 1996). The community is composed of profusely fruiting species
such as Craterellus lutescens and a number of Cortinarius species (including the
nationally rare C. odorifor, C. calochrous and C. infractus). Other common
woodland species are the normally forest based Mycena leptocephala and other
Mycena species, which function as wood- and litter-decay fungi in forest
ecosystems. The closest analysis of plantation Scot’s pine forests was conducted
in England (Ferris et al. 2000a). They found that the macrofungal communities of
lowland Scot’s pine forests was distinct, and separated the Scot’s pine plots from
Norway spruce forest plots based on the ordination of the macrofungal
community. Related data from the Biodiversity in Britain’s planted forests study
208
(C. Quine unpub. data), found that the macrofungal species Auriscalpium vulgare,
Hygrophorus hypothejus, Russula caerulea, Chroogomphus rutilus and
Gomphidius roseus were found frequently in the Scot’s pine forests and never in
any of the other investigated (oak, Norway spruce, Sitka spruce, Corsican pine)
forest types, possibly indicating that these macrofungal species are semi-restricted
to this forest type.
The fungal communities of Sitka spruce have been investigated in the
U.K. by Humphrey et al. (2000). They discovered that spruce plantations formed
a distinct group in ordination, according to the fungal species present and the
abundance of these species. They found that there were 130 species which were
only found in Sitka spruce habitats during the study, with three of these species
(Cortinarius bataillei, Micromphale perforans and Gloeophyllum sepiarium)
being found frequently in their Sitka spruce forests. In its home range of British
Columbia, Sitka spruce forests can be characterised as having high richness and
abundance of Mycena species including Mycena tenax, M. rosella and M. galopus
(Outerbridge 2002). Roberts et al. (2004) also noted a large abundance of Mycena
species (e.g. M. clavicularis, M. tenax and M. vulgaris) in Sitka spruce habitats in
British Columbia, and characterised the habitat as also having a high abundance
of Cortinarius (e.g. Cortinarius calochrous and C. duracinus) and Russula (e.g.
Russula sororia and R. brunneola) species.
The fungal community analysis of Irish natural and plantation forests is
necessary, as anthropogenic and other factors which disturb the natural cycle of
forests, may damage the habitats available for native fungi. Given that Ireland
does not currently have a red-data list, a comprehensive inventory of fungal
species or ecological information on the scarcity or commonness of the different
fungal species in its forests (O’Hanlon and Harrington in press), information on
fungal communities in Irish woodlands will be very informative and add to an
aging information base.
209
5.2 Aims of this chapter
The aims of this chapter are:
• To examine if the fungal community of the ash, oak, Scot’s pine and Sitka
spruce forests vary significantly. It is expected that plots of the same forest
type would be more similar than plots of a different forest type based on their
macrofungal communities (Humphrey et al. 2000). It may also be expected
that certain macrofungal species would be much more common and possibly
semi-restricted to a single forest type in this study, and thus may have
potential for use as indicator species of a certain forest type.
• To examine if relationships between certain macrofungal species and
environmental variables exist, as found in Ruhling and Tyler (1990). It is
expected that the fungal community of the sites will be affected by the
dominant tree type of the forest and also by abiotic soil variables. It may be
expected that pH will show significant correlations with the fungal
communities described (Ferris et al. 2000a).
• To examine if the macrofungal communities of the exotic conifer Sitka spruce
are composed of many species which are present in other forests types,
namely oak and Scot’s pine; as Sitka spruce has been noted as an
ectomycorrhizal generalist (Alexander and Watling 1987). Sitka spruce in
Ireland was imported as seed and therefore it has not had the opportunity of
bringing its usual macrofungal communities with it.
210
5.3 Materials and methods
5.3.1. Site list
The site list and map for the sites used can be found in Chapter 3 (Table 3.2). The
sites were visited from 2007-2009 inclusive during the autumn (August–
November), with a maximum of three visits per season attempted.
5.3.2 Macrofungal assessment
For macrofungal sampling methodology see Section 4.3.2 Chapter 4.
5.3.3 Abiotic variables
The abiotic variables recorded were pH, organic matter %, moisture content,
coarse woody debris amount and soil nutrient availability. The methods used to
record and measure these variables are given in Chapter 3, Section 3.2.2.
Climatic variables such as mean and total precipitation along with mean
temperature per month was acquired from the Irish meteorological service. The
weekly data for rainfall, temperature mean, temperature high and temperature low
for the period June 2007-december 2009 was also recorded.
5.3.4 Stand structural attributes
The number of tree and other plant species was recorded in each plot. Ground
floor vegetation was recorded including vascular plants, bryophytes and mosses.
The structure of the forest in each of its canopy layers was recorded according to
the method in Chapter 3 Section 3.2.2. The rotation stage, age and historical use
of the land were acquired from the local forester and from historical maps of
Ireland (www.osi.ie).
5.3.5 Statistical and multivariate analysis
A quantitative measure of species abundance (as distinct from sporocarp
abundance) was created by recording the presence/absence of the species in the
five sub-plots within each plot. This gives a maximum abundance of 5 per plot
visit. The sub-plot frequency of occurrence (range 0-1) of SpeciesX in Siten was
calculated as:
=Number of sub-plots containing SpeciesX in Siten/ Total number of sub-plots examined in Siten.
211
The data set used for this analysis was 213 species x 28 sites and will be referred
to as the species abundance matrix (Spreadsheet 1 in Folder 3, Appendix 1).
To assess relative macrofungal distributions within the macrofungal
communities, rank abundance plots (Whittaker 1965) were constructed following
Magurran (2004). The relative frequency of SpeciesX in forest typen was
calculated as:
=Number of appearances of SpeciesX in all sub-plots in forest typen / Number of appearances of all Species in all sub-plots in forest typen.
The fitting of the log-normal model was attempted in Microsoft Excel
version 12 (Microsoft, Redmond, WA) following Magurran (2004) after visual
inspection of the curves. A Kolmogorov-Smirnov goodness of fit test (Sokal and
Rohlf 1995) was used to test if the observed rank abundance distributions differed
significantly from the expected log-normal distributions. To analyse for
significant differences in the distributions of the rank abundance values between
the forest types, a Kolmogorov-Smirnov two sample test was used as described by
Magurran (2004). Relative cumulative frequency tables were calculated for each
forest type. Following Sokal and Rohlf (1995), the D statistic and D0.05 statistic
were calculated and compared. If D≥ D0.05 then the difference is significant at
P<0.05. The Kolmogorov-Smirnov goodness of fit test and the Kolmogorov-
Smirnov two sample test were both calculated following the methods in Magurran
(2004) using Microsoft Excel.
5.3.6 Multivariate analysis
Community similarity analysis
Similarity of the macrofungal community composition between plots was
determined by calculating the abundance-based Jaccard similarity index (Chao et
al. 2005) in Estimate-S (Colwell 2004) using the species abundance matrix. This
index is a modified form of the Jaccard index (JI), uses quantitative data and also
estimates the number of unseen taxa in the sample thus combining a species
richness estimator and a similarity index (Chao et al. 2005). Median values for the
Jaccard index (JI) were calculated by pooling the index values for individual sites
based on forest type. Median JI values and the minimum and maximum values

212
were calculated within forest types and between forest types. For example the
median value for similarity between oak and ash was calculated as the median
value of the JI index between all combinations of oak and ash plots. This was used
to highlight if certain forest types were similar based on their macrofungal
communities. The numbers of shared species were also calculated between all plot
combinations.
Ordination of macrofungal species data
Nonmetric multidimensional scaling (NMS) was used to compare composition of
the fungal communities in the forest types. NMS was run on the species
abundance matrix using PC-Ord version 4.36 (MjM Software Design, Gleneden
Beach, OR). A Sørensen distance measure was used for the data set. A random
seed started each analysis and included 40 runs of real data and 50 runs of
randomized data for use in a Monte Carlo permutation procedure (McCune and
Grace 2002). Results of a Monte Carlo test and examination of stress in a scree
plot were used to determine dimensionality. The amount of variance represented
by the ordination axes was calculated as the coefficient of determination (r2)
between the distances in the ordination space and the distances in the original
space (McCune and Grace 2002). The species abundance matrix was entered
along with the site variables into PC-ORD. Histograms and normal probability
plots showed that abiotic soil variables and the structural variables did not fit a
normal distribution and were incompatible with parametric statistics (Kent and
Coker 1992). The non-parametric Spearman’s rank correlation coefficient was
calculated for environmental variables, species richness and ordination scores in
PASW version 18 (SPSS inc., Chicago, Illinois). In ordinating the sites, NMS
ignores the environmental variables. Therefore the axes used in the ordination of
the sites were created using only the macrofungal species abundance data with
environmental data analysed then checked against these site ordinations to
identify significant correlations.
Multi-response permutation procedure
The homogeneity and distinctiveness of the macrofungal community of each
forest type was assessed using a multi-response permutation procedure (MRPP;
McCune and Grace 2002) in PC-Ord. MRPP is a non-parametric approach for
testing the hypothesis of no differences between two or more groups of entities;
213
i.e. in this case differences in fungal community composition between the
different forest types. The working hypothesis was that macrofungal species were
not randomly distributed between the different forest plots, but rather formed
distinct assemblages according to the dominant tree type of the forest plot. MRPP
constructs a distance matrix, calculates average within-group distances, and
compares these to a Pearson’s type III continuous distribution of all possible
partitions of the data (Peck 2003). With MRPP, the chance- corrected within-
group agreement (A) statistic describes effect size. A ranges from -1 to +1. When
A = -1, there is less agreement between groups than expected by chance. When A
=0, groups are no more or less different than expected by chance, and when A = 1,
groups are identical. The more positive A is, the more homogeneous groups are
and the greater confidence in the p-value, especially when the sample size is small
(Peck 2003). Groups were analyzed by forest type using PC-Ord. The Sørenson
distance measure was used for all analyses.
Indicator species analysis
Indicator species analysis was used to identify macrofungal species which are
indicative of a certain forest type. The method used was designed by Dufrene and
Legendre (1997). Indicator species analysis uses data on the concentration of
species abundances in a particular user set group (e.g. forest type) and also the
faithfulness of occurrence of a species to a particular group (McCune and Grace
2002). To identify macrofungal species that are indicative of the habitats
examined in this project, Indicator values (IV) for each species were calculated in
PC-ORD using the method by Dufrene and Legendre (1997) with statistical
significance calculated by a Monte Carlo test with 1000 runs. Indicator values
range from 0 (no indication) to 100 (perfect indication). Perfect indication means
that presence of a certain species points to a particular group without error
(McCune and Grace 2002).
5.3.7 Year to year variation
To test if the fungal communities were similar over the different years, the sub-
plot frequency of occurrence data from the sites which were sampled in the three
years of the project (Killough, St John’s Wood, Kilmacrea, Raheen, Bohatch,
Chevy chase M, Chevy chase Y, Quitrent and Stanahely) was analysed using a

214
Mantel test. The species x site matrix consisted of 155 species from 9 sites.
Similarity matrixes were created using the Sørenson distance index and were
compared using PC-Ord and evaluated for significant using a Monte Carlo test
with 9999 randomizations. If significantly different, the standardized Mantel
statistic (r; Sokal and Rohlf 1995) was used as a measure of effect size (McCune
and Grace 2002). The standardized Mantel statistic ranges from -1 to +1 and is a
measure of the correlation between the matrixes. A value of +1 indicates that the
two matrixes (communities) are very similar while a negative r statistic indicates
that the matrixes (communities) are very dissimilar.

215
5.4 Results
5.4.1 Species abundance patterns
In total 219 fungal species from 98 genera were found within the permanent plots.
The sub-plot frequency of occurrence of these species was calculated using the
species abundance matrix. Throughout the project a total of 2622 fruitbodies were
recorded, comprising 591, 891 and 1140 sporocarps in 2007, 2008 and 2009
respectively. Mycena leptocephala and Russula ochroleuca were the most prolific
producers of fruitbodies (Table 5.1). The majority of the most common
fruitbodies are of small delicate (typically <4cm height) species e.g. Mycena spp.
Many of the most commonly encountered species were also the most abundant
fruitbody producers. Fourteen of the most prolific sporocarp producers (Table 5.1)
were also amongst the most commonly found fungi (Table 4.6, Chapter 4). The
three species that produced large numbers of fruitbodies but were not common
across all forest types show varying levels of restriction to certain forest types i.e.
Hemimycena gracilis with Sitka spruce, Scleroderma citrinum with oak, and
Crepidotus mollis with oak and ash.
Table 5.1 The most prolific frutibody producers in each forest type. Column 6 (Total) is the total number of fruitbodies from that species recorded over all forest types. SP= Scot’s pine, SS= Sitka spruce. Species Ash Oak SP SS Total
Mycena leptocephala 2 6 200 263 471
Russula ochroleuca 0 33 115 251 399
Laccaria laccata 3 123 58 101 285
Hemimycena gracilis 0 0 0 279 279
Hypholoma fasciculare 15 30 34 186 265
Laccaria amethystina 1 134 48 53 236
Mycena vitilis 8 9 63 77 157
Xylaria hypoxylon 94 34 0 28 156
Mycena galopus 37 30 13 59 139
Collybia butyracea 0 1 8 127 136
Cortinarius flexipes 0 58 41 35 134
Marasmius hudsonii 6 58 36 4 104
Scleroderma citrinum 0 93 0 0 93
Lactarius hepaticus 0 6 78 1 85
Mycena rorida 19 0 6 38 63
Mycena polygramma 21 5 1 34 61
Crepidotus mollis 19 14 0 0 33
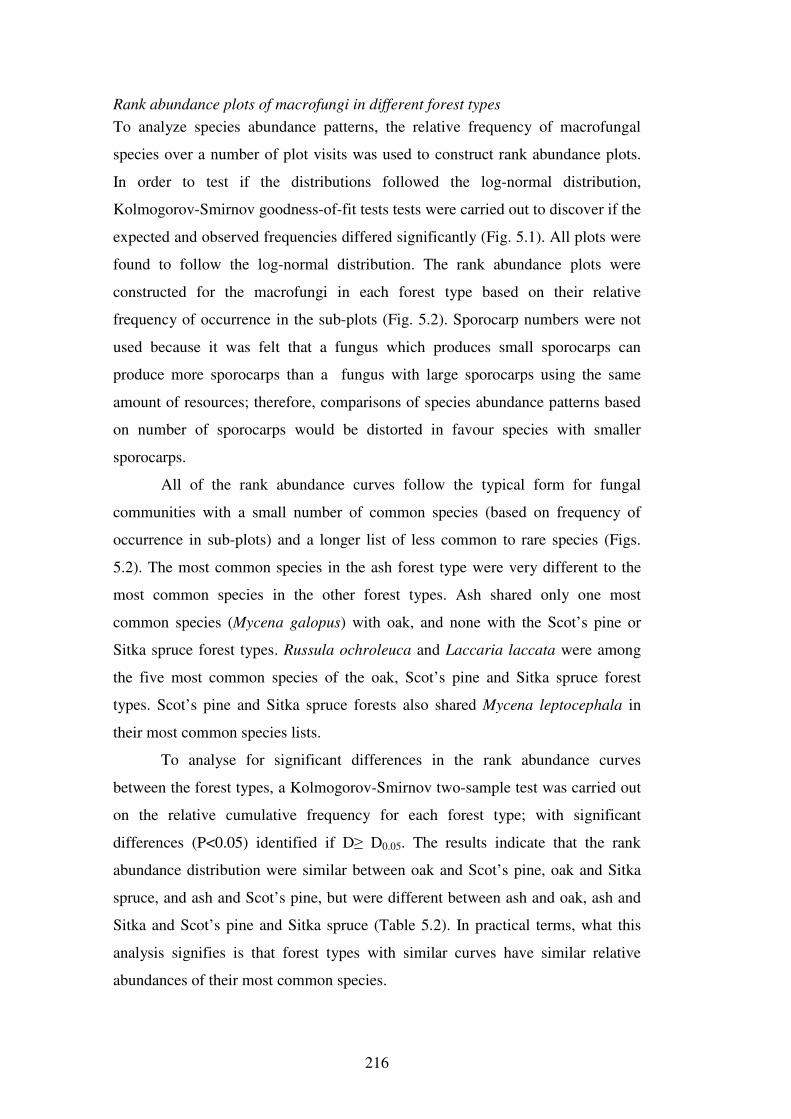
216
Rank abundance plots of macrofungi in different forest types
To analyze species abundance patterns, the relative frequency of macrofungal
species over a number of plot visits was used to construct rank abundance plots.
In order to test if the distributions followed the log-normal distribution,
Kolmogorov-Smirnov goodness-of-fit tests tests were carried out to discover if the
expected and observed frequencies differed significantly (Fig. 5.1). All plots were
found to follow the log-normal distribution. The rank abundance plots were
constructed for the macrofungi in each forest type based on their relative
frequency of occurrence in the sub-plots (Fig. 5.2). Sporocarp numbers were not
used because it was felt that a fungus which produces small sporocarps can
produce more sporocarps than a fungus with large sporocarps using the same
amount of resources; therefore, comparisons of species abundance patterns based
on number of sporocarps would be distorted in favour species with smaller
sporocarps.
All of the rank abundance curves follow the typical form for fungal
communities with a small number of common species (based on frequency of
occurrence in sub-plots) and a longer list of less common to rare species (Figs.
5.2). The most common species in the ash forest type were very different to the
most common species in the other forest types. Ash shared only one most
common species (Mycena galopus) with oak, and none with the Scot’s pine or
Sitka spruce forest types. Russula ochroleuca and Laccaria laccata were among
the five most common species of the oak, Scot’s pine and Sitka spruce forest
types. Scot’s pine and Sitka spruce forests also shared Mycena leptocephala in
their most common species lists.
To analyse for significant differences in the rank abundance curves
between the forest types, a Kolmogorov-Smirnov two-sample test was carried out
on the relative cumulative frequency for each forest type; with significant
differences (P<0.05) identified if D≥ D0.05. The results indicate that the rank
abundance distribution were similar between oak and Scot’s pine, oak and Sitka
spruce, and ash and Scot’s pine, but were different between ash and oak, ash and
Sitka and Scot’s pine and Sitka spruce (Table 5.2). In practical terms, what this
analysis signifies is that forest types with similar curves have similar relative
abundances of their most common species.
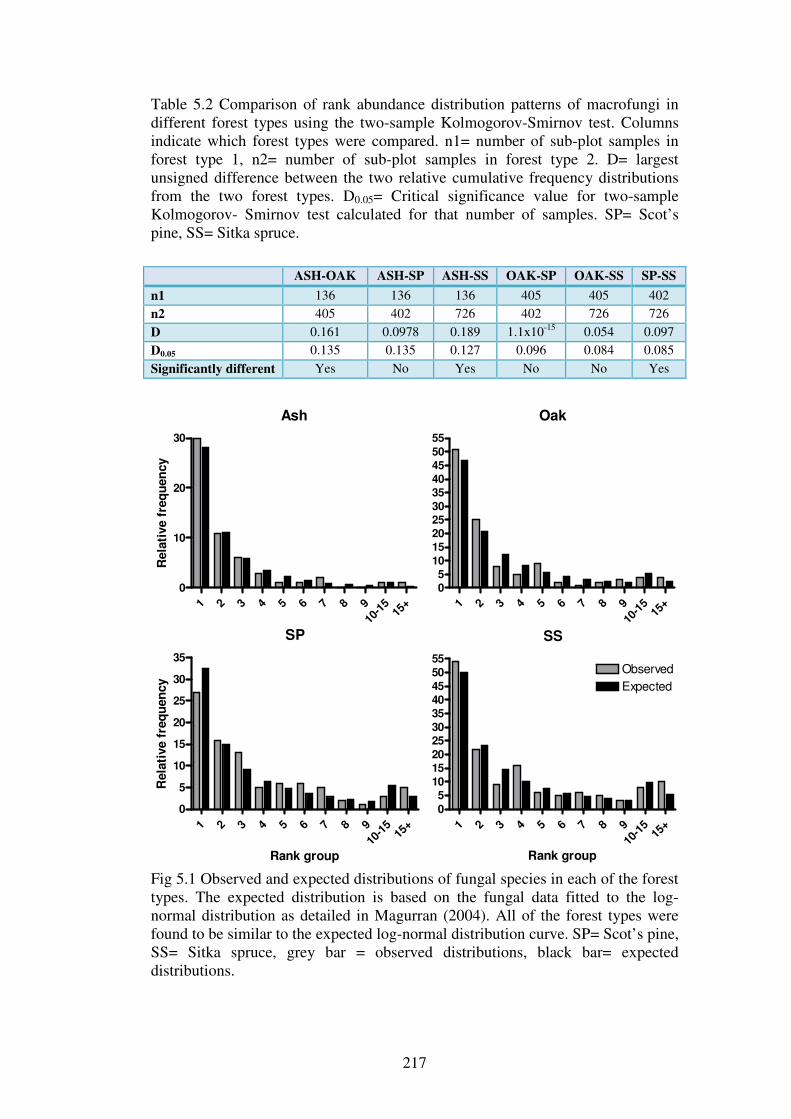
217
Table 5.2 Comparison of rank abundance distribution patterns of macrofungi in different forest types using the two-sample Kolmogorov-Smirnov test. Columns indicate which forest types were compared. n1= number of sub-plot samples in forest type 1, n2= number of sub-plot samples in forest type 2. D= largest unsigned difference between the two relative cumulative frequency distributions from the two forest types. D0.05= Critical significance value for two-sample Kolmogorov- Smirnov test calculated for that number of samples. SP= Scot’s pine, SS= Sitka spruce.
ASH-OAK ASH-SP ASH-SS OAK-SP OAK-SS SP-SS
n1 136 136 136 405 405 402
n2 405 402 726 402 726 726
D 0.161 0.0978 0.189 1.1x10⁻¹⁵ 0.054 0.097
D0.05 0.135 0.135 0.127 0.096 0.084 0.085
Significantly different Yes No Yes No No Yes
Ash
1 2 3 4 5 6 7 8 9
10-1
515
+
0
10
20
30
Rela
tive f
req
uen
cy
Oak
1 2 3 4 5 6 7 8 9
10-1
515
+
0
5
10
15
20
25
30
35
40
45
50
55
SP
1 2 3 4 5 6 7 8 9
10-1
515
+
0
5
10
15
20
25
30
35
Rank group
Rela
tive f
req
uen
cy
SS
1 2 3 4 5 6 7 8 9
10-1
515
+
0
510
1520
2530
3540
45
50
55ObservedExpected
Rank group
Fig 5.1 Observed and expected distributions of fungal species in each of the forest types. The expected distribution is based on the fungal data fitted to the log-normal distribution as detailed in Magurran (2004). All of the forest types were found to be similar to the expected log-normal distribution curve. SP= Scot’s pine, SS= Sitka spruce, grey bar = observed distributions, black bar= expected distributions.

218
ASH
0 10 20 30 40 50 600.001
0.01
0.1Xylaria hypoxylon
Mycena roridaMycena polygramma
Mycena galopus
Marasmius hudsonii
Rank
Rela
tive f
req
uen
cy
OAK
0 25 50 75 100 1250.001
0.01
0.1
Scleroderma citrinum
Laccaria laccataStereum hirsutum
Mycena galopus
Laccaria amethystina
Rank
Rela
tive f
req
uen
cy
SP
0 10 20 30 40 50 60 70 80 90 1000.001
0.01
0.1Russula ochroleuca
Laccaria laccataLactarius hepaticus
Mycena leptocephala
Trichaptum abietinum
Rank
Rela
tive f
req
uen
cy
SS
0 25 50 75 100 125 150 1750.001
0.01
0.1Russula ochroleuca
Mycena leptocephalaLaccaria laccata
Hypholoma fasciculare
Collybia butyracea
Rank
Rela
tive f
req
uen
cy
Fig 5.2 Rank abundance plot of macrofungal species in ash, oak, Scot’s pine (SP) and Sitka spruce (SS) forests. Also shown are the names of the top five most frequently encountered species.
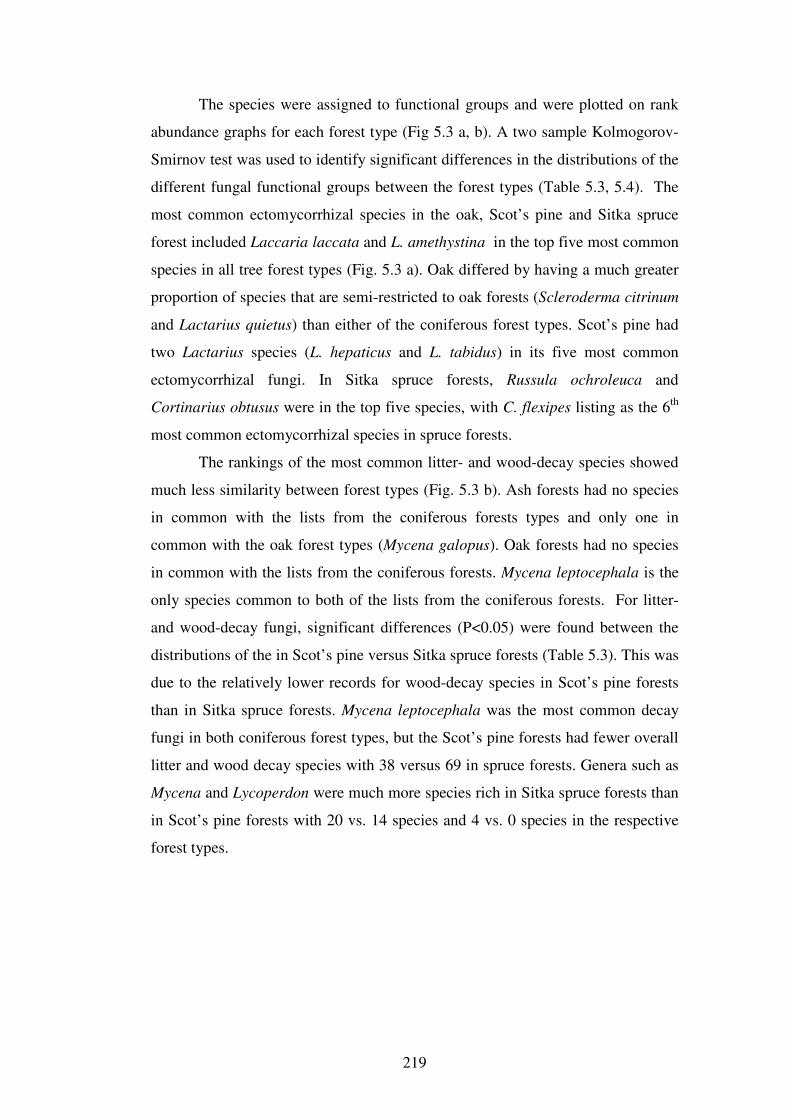
219
The species were assigned to functional groups and were plotted on rank
abundance graphs for each forest type (Fig 5.3 a, b). A two sample Kolmogorov-
Smirnov test was used to identify significant differences in the distributions of the
different fungal functional groups between the forest types (Table 5.3, 5.4). The
most common ectomycorrhizal species in the oak, Scot’s pine and Sitka spruce
forest included Laccaria laccata and L. amethystina in the top five most common
species in all tree forest types (Fig. 5.3 a). Oak differed by having a much greater
proportion of species that are semi-restricted to oak forests (Scleroderma citrinum
and Lactarius quietus) than either of the coniferous forest types. Scot’s pine had
two Lactarius species (L. hepaticus and L. tabidus) in its five most common
ectomycorrhizal fungi. In Sitka spruce forests, Russula ochroleuca and
Cortinarius obtusus were in the top five species, with C. flexipes listing as the 6th
most common ectomycorrhizal species in spruce forests.
The rankings of the most common litter- and wood-decay species showed
much less similarity between forest types (Fig. 5.3 b). Ash forests had no species
in common with the lists from the coniferous forests types and only one in
common with the oak forest types (Mycena galopus). Oak forests had no species
in common with the lists from the coniferous forests. Mycena leptocephala is the
only species common to both of the lists from the coniferous forests. For litter-
and wood-decay fungi, significant differences (P<0.05) were found between the
distributions of the in Scot’s pine versus Sitka spruce forests (Table 5.3). This was
due to the relatively lower records for wood-decay species in Scot’s pine forests
than in Sitka spruce forests. Mycena leptocephala was the most common decay
fungi in both coniferous forest types, but the Scot’s pine forests had fewer overall
litter and wood decay species with 38 versus 69 in spruce forests. Genera such as
Mycena and Lycoperdon were much more species rich in Sitka spruce forests than
in Scot’s pine forests with 20 vs. 14 species and 4 vs. 0 species in the respective
forest types.

220
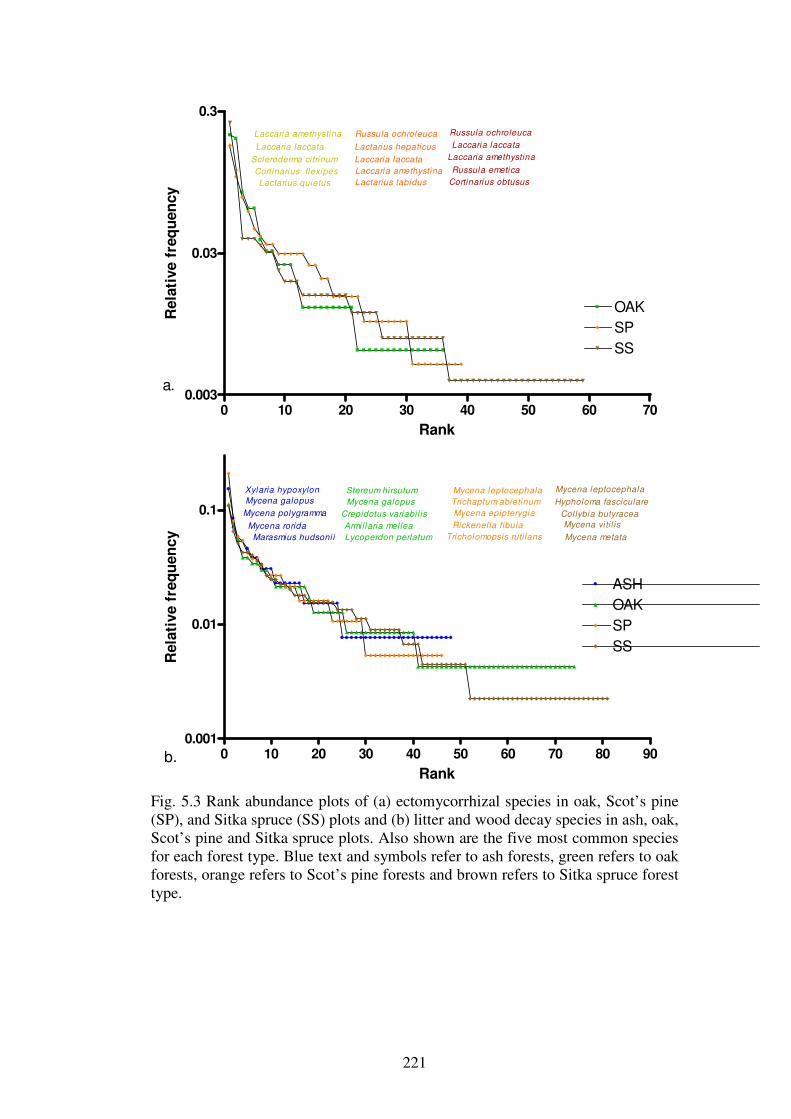
221
0 10 20 30 40 50 60 700.003
0.03
0.3
SPSS
OAK
Laccaria amethystina
Laccaria laccata
Scleroderma citrinum
Cortinarius flexipes
Lactarius quietus
Russula ochroleuca
Lactarius hepaticus
Laccaria laccata
Laccaria amethystina
Lactarius tabidus
Russula ochroleuca
Laccaria laccata
Laccaria amethystina
Cortinarius obtusus
Russula emetica
Rank
Rela
tive f
req
uen
cy
0 10 20 30 40 50 60 70 80 900.001
0.01
0.1
ASHOAKSPSS
Xylaria hypoxylon
Mycena galopus
Mycena polygramma
Mycena rorida
Marasmius hudsoni i
Stereum hirsutum
Mycena galopus
Crepidotus variabil is
Armillaria mel lea
Lycoperdon perlatum
Mycena leptocephala
Trichaptum abietinum
Mycena epipterygia
Rickenel la fibula
Tricholomopsis ruti lans
Mycena leptocephala
Hypholoma fasciculare
Col lybia butyracea
Mycena vi ti l is
Mycena metata
Rank
Rela
tive f
req
uen
cy
a.
b.
Fig. 5.3 Rank abundance plots of (a) ectomycorrhizal species in oak, Scot’s pine (SP), and Sitka spruce (SS) plots and (b) litter and wood decay species in ash, oak, Scot’s pine and Sitka spruce plots. Also shown are the five most common species for each forest type. Blue text and symbols refer to ash forests, green refers to oak forests, orange refers to Scot’s pine forests and brown refers to Sitka spruce forest type.

222
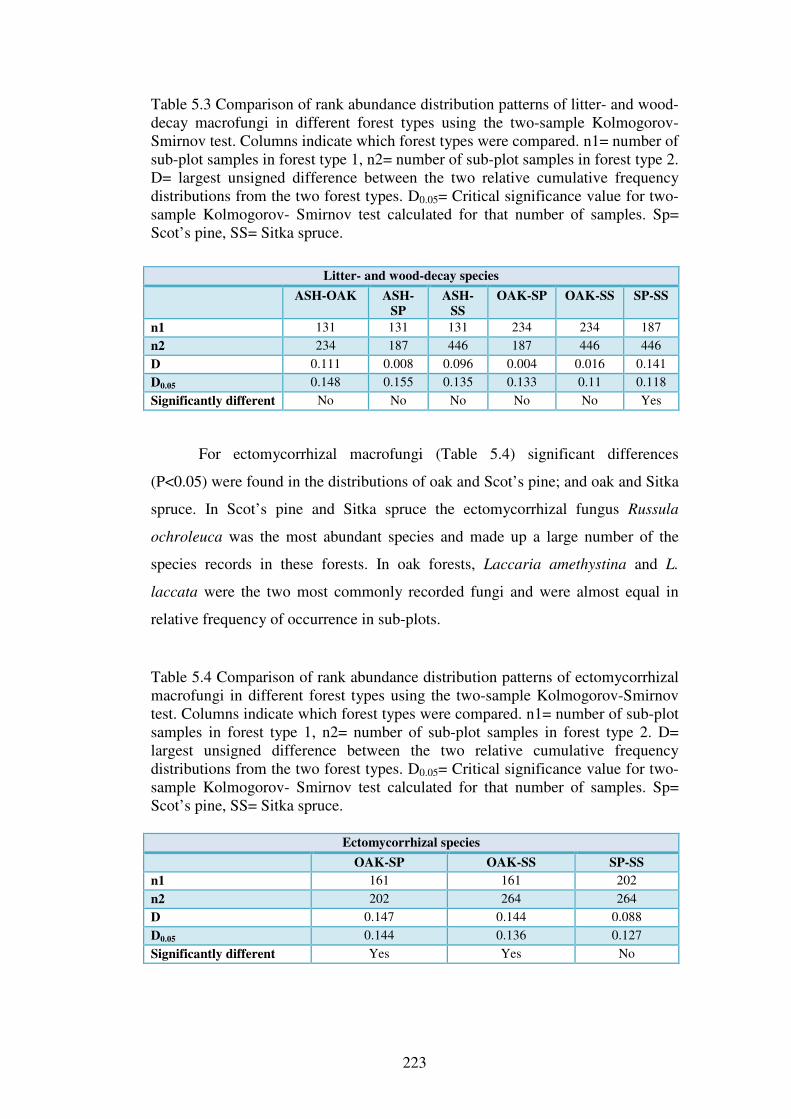
223
Table 5.3 Comparison of rank abundance distribution patterns of litter- and wood-decay macrofungi in different forest types using the two-sample Kolmogorov-Smirnov test. Columns indicate which forest types were compared. n1= number of sub-plot samples in forest type 1, n2= number of sub-plot samples in forest type 2. D= largest unsigned difference between the two relative cumulative frequency distributions from the two forest types. D0.05= Critical significance value for two-sample Kolmogorov- Smirnov test calculated for that number of samples. Sp= Scot’s pine, SS= Sitka spruce.
Litter- and wood-decay species
ASH-OAK ASH-
SP
ASH-
SS
OAK-SP OAK-SS SP-SS
n1 131 131 131 234 234 187
n2 234 187 446 187 446 446
D 0.111 0.008 0.096 0.004 0.016 0.141
D0.05 0.148 0.155 0.135 0.133 0.11 0.118
Significantly different No No No No No Yes
For ectomycorrhizal macrofungi (Table 5.4) significant differences
(P<0.05) were found in the distributions of oak and Scot’s pine; and oak and Sitka
spruce. In Scot’s pine and Sitka spruce the ectomycorrhizal fungus Russula
ochroleuca was the most abundant species and made up a large number of the
species records in these forests. In oak forests, Laccaria amethystina and L.
laccata were the two most commonly recorded fungi and were almost equal in
relative frequency of occurrence in sub-plots.
Table 5.4 Comparison of rank abundance distribution patterns of ectomycorrhizal macrofungi in different forest types using the two-sample Kolmogorov-Smirnov test. Columns indicate which forest types were compared. n1= number of sub-plot samples in forest type 1, n2= number of sub-plot samples in forest type 2. D= largest unsigned difference between the two relative cumulative frequency distributions from the two forest types. D0.05= Critical significance value for two-sample Kolmogorov- Smirnov test calculated for that number of samples. Sp= Scot’s pine, SS= Sitka spruce.
Ectomycorrhizal species
OAK-SP OAK-SS SP-SS
n1 161 161 202
n2 202 264 264
D 0.147 0.144 0.088
D0.05 0.144 0.136 0.127
Significantly different Yes Yes No
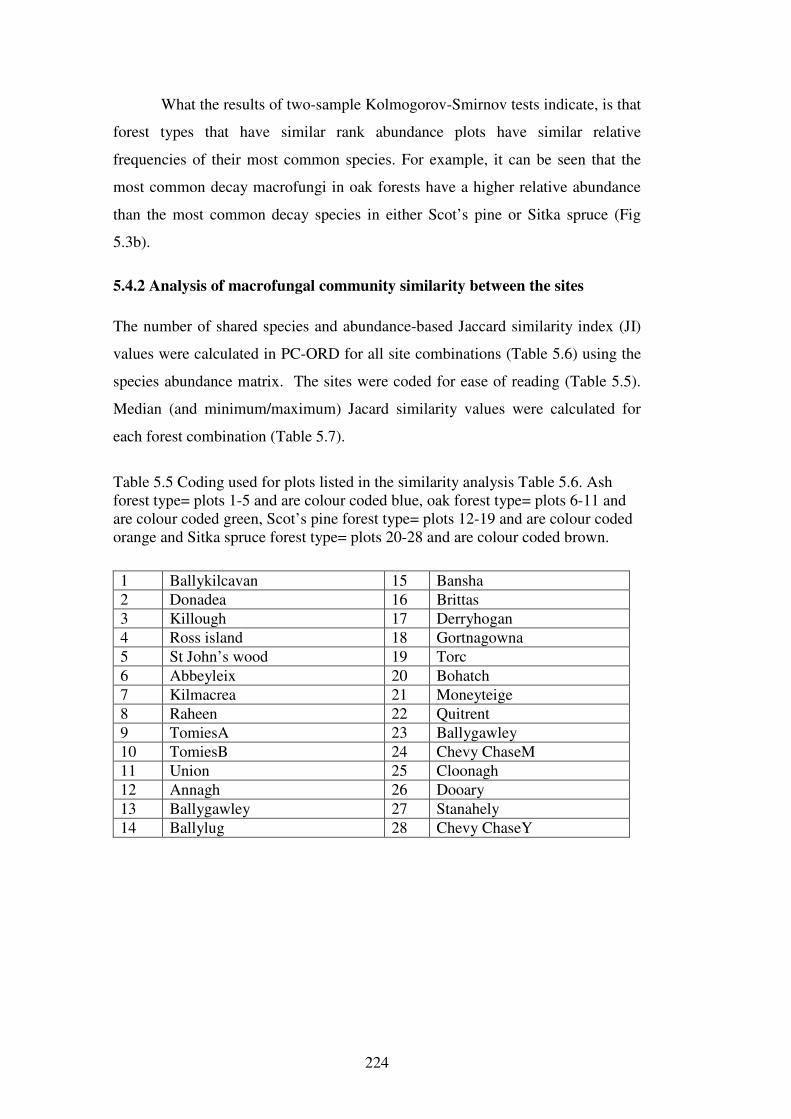
224
What the results of two-sample Kolmogorov-Smirnov tests indicate, is that
forest types that have similar rank abundance plots have similar relative
frequencies of their most common species. For example, it can be seen that the
most common decay macrofungi in oak forests have a higher relative abundance
than the most common decay species in either Scot’s pine or Sitka spruce (Fig
5.3b).
5.4.2 Analysis of macrofungal community similarity between the sites
The number of shared species and abundance-based Jaccard similarity index (JI)
values were calculated in PC-ORD for all site combinations (Table 5.6) using the
species abundance matrix. The sites were coded for ease of reading (Table 5.5).
Median (and minimum/maximum) Jacard similarity values were calculated for
each forest combination (Table 5.7).
Table 5.5 Coding used for plots listed in the similarity analysis Table 5.6. Ash forest type= plots 1-5 and are colour coded blue, oak forest type= plots 6-11 and are colour coded green, Scot’s pine forest type= plots 12-19 and are colour coded orange and Sitka spruce forest type= plots 20-28 and are colour coded brown.
1 Ballykilcavan 15 Bansha
2 Donadea 16 Brittas
3 Killough 17 Derryhogan
4 Ross island 18 Gortnagowna
5 St John’s wood 19 Torc
6 Abbeyleix 20 Bohatch
7 Kilmacrea 21 Moneyteige
8 Raheen 22 Quitrent
9 TomiesA 23 Ballygawley
10 TomiesB 24 Chevy ChaseM
11 Union 25 Cloonagh
12 Annagh 26 Dooary
13 Ballygawley 27 Stanahely
14 Ballylug 28 Chevy ChaseY

225
Table 5.6 Matrix of number of shared species (clear cells), and abundance-based Jaccard similarity values (grey cells) between the plots. Coloured cells in first column and first row correspond to forest type. Blue cells= ash, green cells= oak, orange= Scot’s pine, brown= Sitka spruce. Site codes are found in Table 5.5. 1 2 3 4 5 6 7 8 9 10 11 12 13 14 15 16 17 18 19 20 21 22 23 24 25 26 27 28
1 X
.08
.15
.14
.21
.13
.11
.07
.09
.13
.15 0
.02 0 0
.03 0 0 0 0
.08 0
.01
.07 0 0
.04
.01
2 2 X .1 0
.22
.05
.11
.15
.03
.16
.12
.03
.13
.17
.15
.05
.09
.16
.02
.03
.05
.24
.17
.06
.09
.21
.18
.13
3 2 2 X
.21
.19
.04
.09
.15 .1
.19
.08 0
.06
.07
.09
.04 0
.03 0
.07
.02
.05
.06
.12
.06
.09 .1 .1
4 2 0 2 X
.12 .1
.08
.08
.11
.13
.11 0
.03 0
.05 0 0 0 0 0 0 0 0
.05 0 0
.02
.01
5 6 4 5 2 X
.25
.23
.21
.31
.23
.28
.02
.07
.01
.18
.17
.05
.09 0 .1
.09 .1
.13
.26
.01
.17
.19
.16
6 6 3 3 3 11 X
.35
.18 .3
.21 .3
.06
.18
.06
.26
.19
.12
.14
.01
.17
.07
.18
.21
.19
.05
.16
.16
.18
7 5 4 6 3 12 13 X
.28
.32
.25 .3
.11
.28
.05
.29
.21
.15
.14
.02
.24
.09
.21
.26
.14
.01
.12 .2
.16
8 4 5 7 3 15 12 19 X
.29
.18 .3
.04
.11
.01
.15
.18
.07
.07
.06
.12
.11
.16
.18
.13
.09
.16
.21
.25
9 3 1 5 4 12 9 12 13 X .6
.29
.16
.16
.07
.31
.22
.11
.19
.02
.25
.07
.18
.32
.15
.03
.14
.08
.36
10 3 3 4 3 6 8 10 8 13 X
.14
.14
.13
.08
.19
.15 .1
.18
.02
.15
.07
.18
.28
.12
.04
.15
.14
.23
11 5 2 4 3 7 7 10 11 5 4 X 0
.08 0 .2
.16
.07
.07 0 .1
.06 .1
.15
.28
.03 .1
.14
.11
12 0 1 0 0 2 4 6 3 6 5 0 X
.27
.06
.06
.07
.25 .5
.05
.16
.01
.15 .2
.01
.03
.04
.08
.12
13 1 3 2 1 3 5 11 7 5 4 3 6 X
.27
.31
.07
.24
.45
.05
.28
.02
.35
.27
.03
.07
.16 .2
.11
14 0 2 2 0 1 4 2 1 2 2 0 2 4 X
.18
.08
.09
.19
.02
.22 0
.27
.21
.05 .1
.11
.15
.12
15 0 3 3 1 6 7 12 7 6 6 3 3 8 5 X
.18
.12
.16
.03 .3
.08
.42
.35 .1
.12
.23
.31
.19
16 1 2 2 0 8 7 9 14 6 5 4 3 3 2 5 X
.07
.15
.09
.14
.09
.17
.15
.25
.05
.15
.21
.13
17 0 2 0 0 2 6 6 5 4 3 2 6 7 2 4 4 X
.31
.06
.16 0
.25
.23
.09 .1
.12
.14
.11
18 0 3 2 0 4 5 6 7 7 5 2 10 11 4 5 6 8 X
.08
.24 0
.26
.33
.03
.09
.13
.16
.16
19 0 1 0 0 0 1 2 6 2 1 0 2 2 1 2 3 2 3 X
.08 0
.06 .1
.01
.12
.03
.08 .1
20 0 2 4 0 7 7 14 12 11 6 2 7 10 6 9 7 6 8 5 X
.09
.31
.27 .1
.03
.21
.37
.21

226
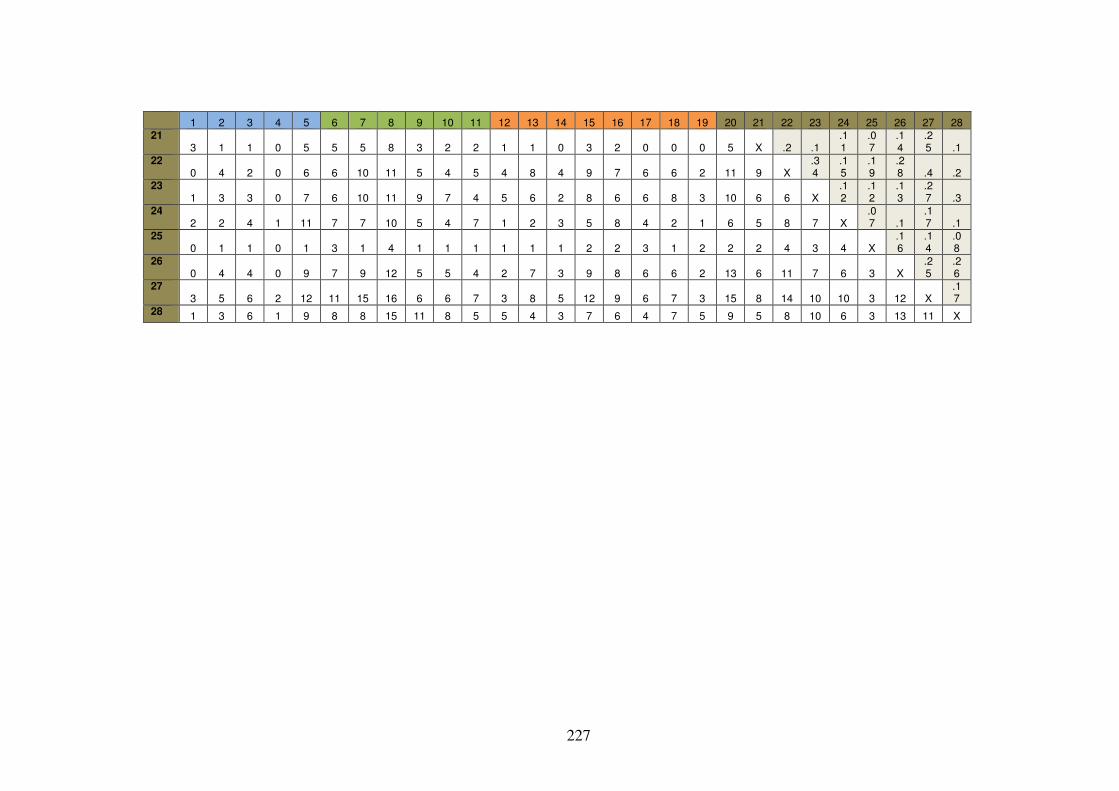
227
1 2 3 4 5 6 7 8 9 10 11 12 13 14 15 16 17 18 19 20 21 22 23 24 25 26 27 28 21
3 1 1 0 5 5 5 8 3 2 2 1 1 0 3 2 0 0 0 5 X .2 .1 .11
.07
.14
.25 .1
22 0 4 2 0 6 6 10 11 5 4 5 4 8 4 9 7 6 6 2 11 9 X
.34
.15
.19
.28 .4 .2
23 1 3 3 0 7 6 10 11 9 7 4 5 6 2 8 6 6 8 3 10 6 6 X
.12
.12
.13
.27 .3
24 2 2 4 1 11 7 7 10 5 4 7 1 2 3 5 8 4 2 1 6 5 8 7 X
.07 .1
.17 .1
25 0 1 1 0 1 3 1 4 1 1 1 1 1 1 2 2 3 1 2 2 2 4 3 4 X
.16
.14
.08
26 0 4 4 0 9 7 9 12 5 5 4 2 7 3 9 8 6 6 2 13 6 11 7 6 3 X
.25
.26
27 3 5 6 2 12 11 15 16 6 6 7 3 8 5 12 9 6 7 3 15 8 14 10 10 3 12 X
.17
28 1 3 6 1 9 8 8 15 11 8 5 5 4 3 7 6 4 7 5 9 5 8 10 6 3 13 11 X

228
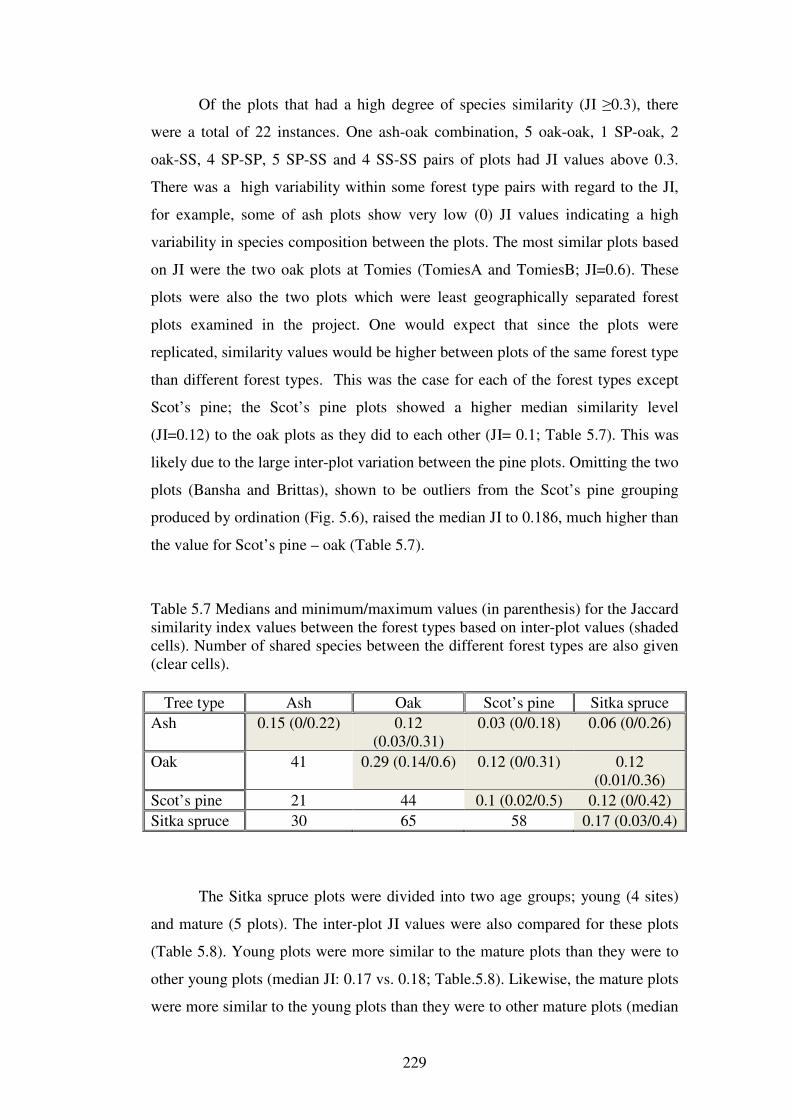
229
Of the plots that had a high degree of species similarity (JI ≥0.3), there
were a total of 22 instances. One ash-oak combination, 5 oak-oak, 1 SP-oak, 2
oak-SS, 4 SP-SP, 5 SP-SS and 4 SS-SS pairs of plots had JI values above 0.3.
There was a high variability within some forest type pairs with regard to the JI,
for example, some of ash plots show very low (0) JI values indicating a high
variability in species composition between the plots. The most similar plots based
on JI were the two oak plots at Tomies (TomiesA and TomiesB; JI=0.6). These
plots were also the two plots which were least geographically separated forest
plots examined in the project. One would expect that since the plots were
replicated, similarity values would be higher between plots of the same forest type
than different forest types. This was the case for each of the forest types except
Scot’s pine; the Scot’s pine plots showed a higher median similarity level
(JI=0.12) to the oak plots as they did to each other (JI= 0.1; Table 5.7). This was
likely due to the large inter-plot variation between the pine plots. Omitting the two
plots (Bansha and Brittas), shown to be outliers from the Scot’s pine grouping
produced by ordination (Fig. 5.6), raised the median JI to 0.186, much higher than
the value for Scot’s pine – oak (Table 5.7).
Table 5.7 Medians and minimum/maximum values (in parenthesis) for the Jaccard similarity index values between the forest types based on inter-plot values (shaded cells). Number of shared species between the different forest types are also given (clear cells).
Tree type Ash Oak Scot’s pine Sitka spruce
Ash 0.15 (0/0.22) 0.12 (0.03/0.31)
0.03 (0/0.18) 0.06 (0/0.26)
Oak 41 0.29 (0.14/0.6) 0.12 (0/0.31) 0.12 (0.01/0.36)
Scot’s pine 21 44 0.1 (0.02/0.5) 0.12 (0/0.42)
Sitka spruce 30 65 58 0.17 (0.03/0.4)
The Sitka spruce plots were divided into two age groups; young (4 sites)
and mature (5 plots). The inter-plot JI values were also compared for these plots
(Table 5.8). Young plots were more similar to the mature plots than they were to
other young plots (median JI: 0.17 vs. 0.18; Table.5.8). Likewise, the mature plots
were more similar to the young plots than they were to other mature plots (median
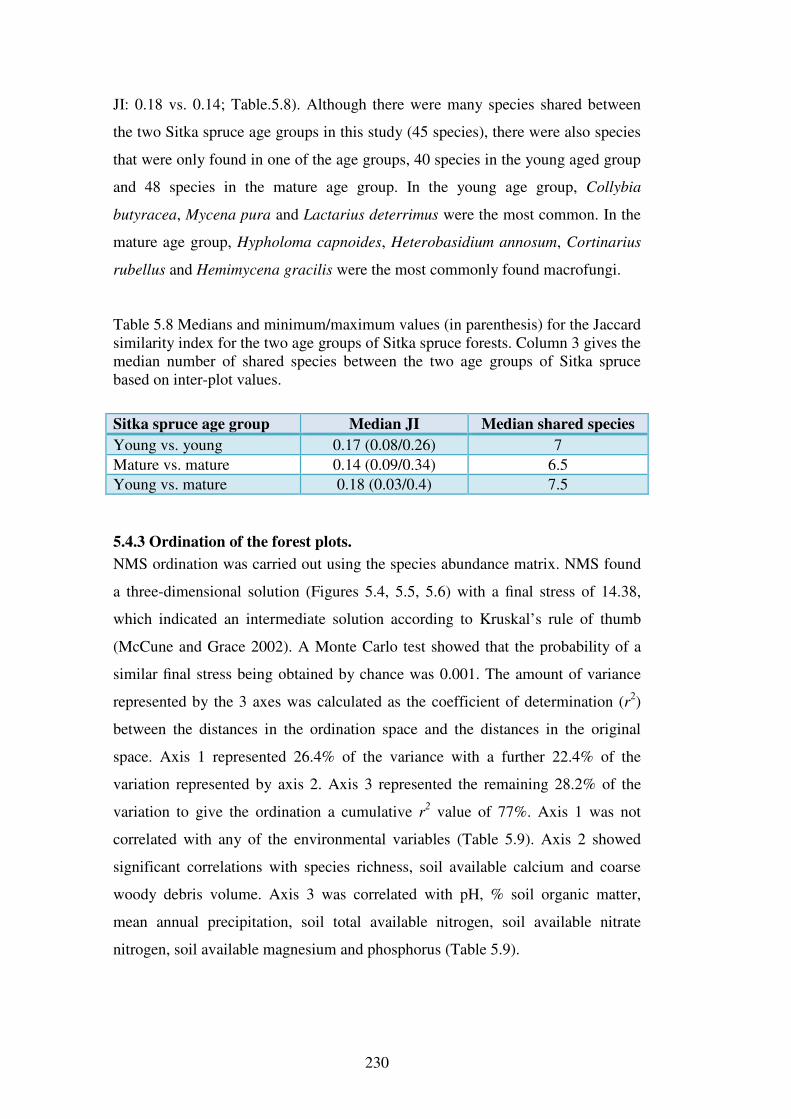
230
JI: 0.18 vs. 0.14; Table.5.8). Although there were many species shared between
the two Sitka spruce age groups in this study (45 species), there were also species
that were only found in one of the age groups, 40 species in the young aged group
and 48 species in the mature age group. In the young age group, Collybia
butyracea, Mycena pura and Lactarius deterrimus were the most common. In the
mature age group, Hypholoma capnoides, Heterobasidium annosum, Cortinarius
rubellus and Hemimycena gracilis were the most commonly found macrofungi.
Table 5.8 Medians and minimum/maximum values (in parenthesis) for the Jaccard similarity index for the two age groups of Sitka spruce forests. Column 3 gives the median number of shared species between the two age groups of Sitka spruce based on inter-plot values.
Sitka spruce age group Median JI Median shared species
Young vs. young 0.17 (0.08/0.26) 7
Mature vs. mature 0.14 (0.09/0.34) 6.5
Young vs. mature 0.18 (0.03/0.4) 7.5
5.4.3 Ordination of the forest plots.
NMS ordination was carried out using the species abundance matrix. NMS found
a three-dimensional solution (Figures 5.4, 5.5, 5.6) with a final stress of 14.38,
which indicated an intermediate solution according to Kruskal’s rule of thumb
(McCune and Grace 2002). A Monte Carlo test showed that the probability of a
similar final stress being obtained by chance was 0.001. The amount of variance
represented by the 3 axes was calculated as the coefficient of determination (r2)
between the distances in the ordination space and the distances in the original
space. Axis 1 represented 26.4% of the variance with a further 22.4% of the
variation represented by axis 2. Axis 3 represented the remaining 28.2% of the
variation to give the ordination a cumulative r2 value of 77%. Axis 1 was not
correlated with any of the environmental variables (Table 5.9). Axis 2 showed
significant correlations with species richness, soil available calcium and coarse
woody debris volume. Axis 3 was correlated with pH, % soil organic matter,
mean annual precipitation, soil total available nitrogen, soil available nitrate
nitrogen, soil available magnesium and phosphorus (Table 5.9).
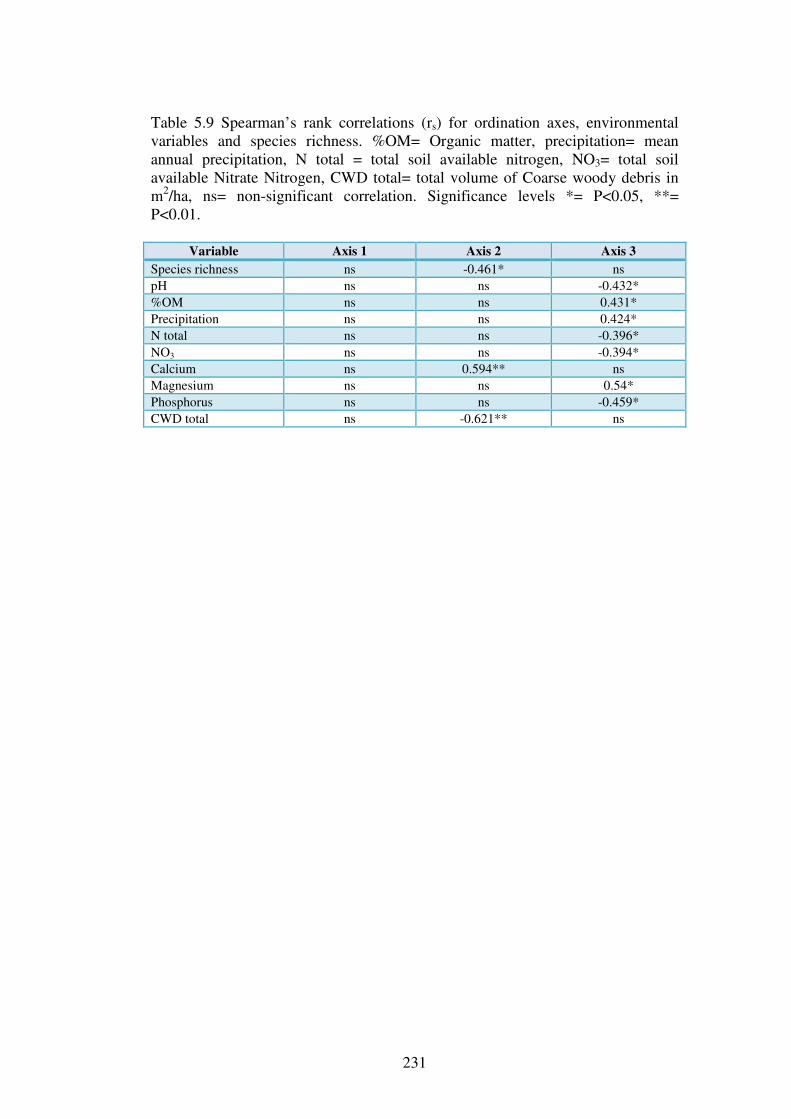
231
Table 5.9 Spearman’s rank correlations (rs) for ordination axes, environmental variables and species richness. %OM= Organic matter, precipitation= mean annual precipitation, N total = total soil available nitrogen, NO3= total soil available Nitrate Nitrogen, CWD total= total volume of Coarse woody debris in m2/ha, ns= non-significant correlation. Significance levels *= P<0.05, **= P<0.01.
Variable Axis 1 Axis 2 Axis 3
Species richness ns -0.461* ns
pH ns ns -0.432*
%OM ns ns 0.431*
Precipitation ns ns 0.424*
N total ns ns -0.396*
NO3 ns ns -0.394*
Calcium ns 0.594** ns
Magnesium ns ns 0.54*
Phosphorus ns ns -0.459*
CWD total ns -0.621** ns

232
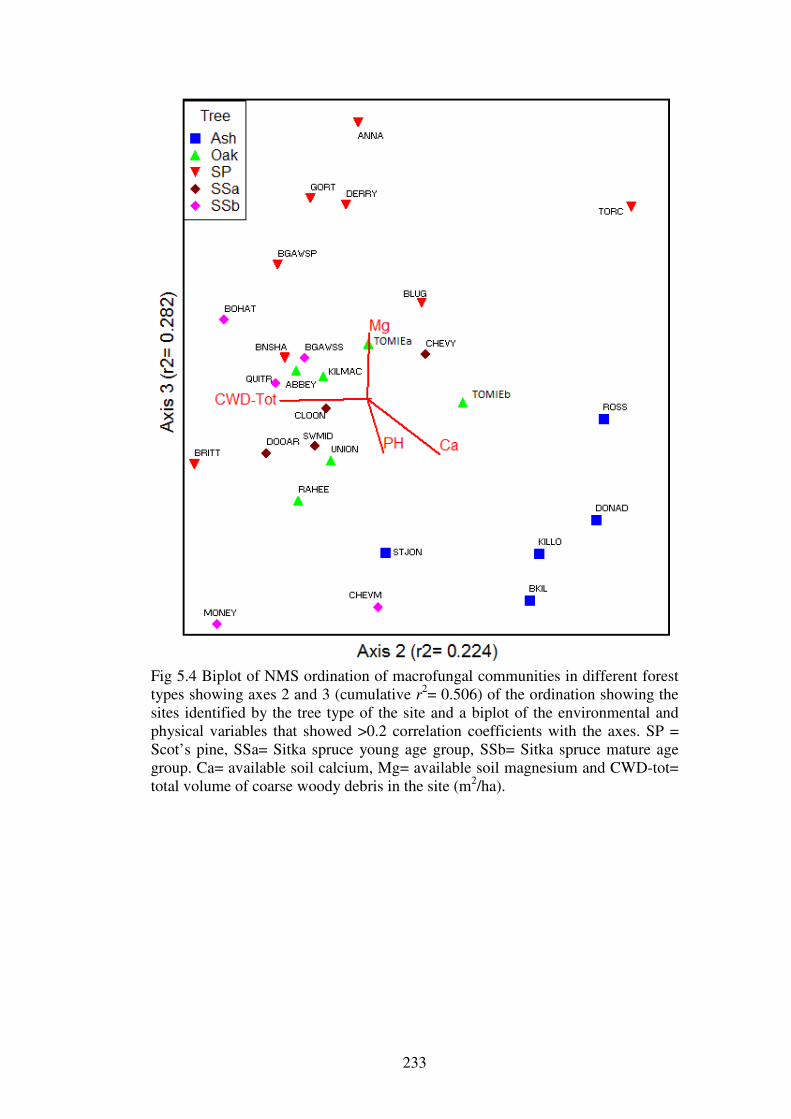
233
Fig 5.4 Biplot of NMS ordination of macrofungal communities in different forest types showing axes 2 and 3 (cumulative r2= 0.506) of the ordination showing the sites identified by the tree type of the site and a biplot of the environmental and physical variables that showed >0.2 correlation coefficients with the axes. SP = Scot’s pine, SSa= Sitka spruce young age group, SSb= Sitka spruce mature age group. Ca= available soil calcium, Mg= available soil magnesium and CWD-tot= total volume of coarse woody debris in the site (m2/ha).

234
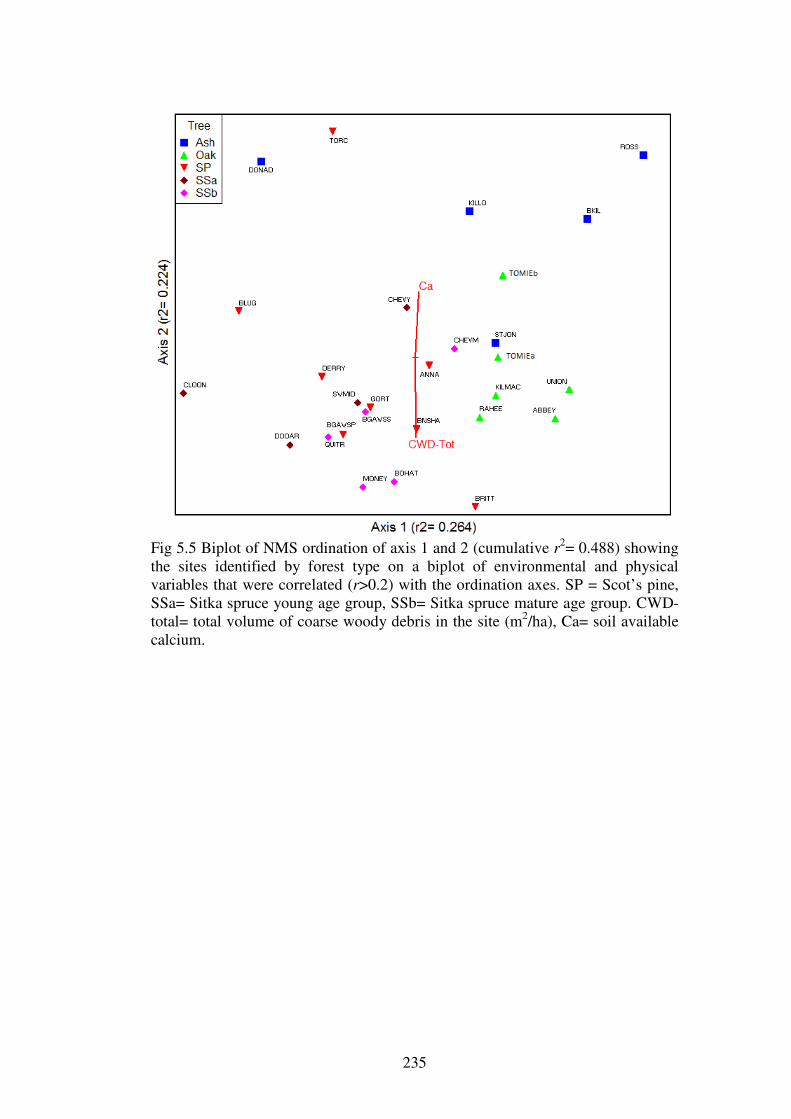
235
Fig 5.5 Biplot of NMS ordination of axis 1 and 2 (cumulative r2= 0.488) showing the sites identified by forest type on a biplot of environmental and physical variables that were correlated (r>0.2) with the ordination axes. SP = Scot’s pine, SSa= Sitka spruce young age group, SSb= Sitka spruce mature age group. CWD-total= total volume of coarse woody debris in the site (m2/ha), Ca= soil available calcium.

236
237
The ordination of axis 2 vs. axis 3 (Fig 5.4) is the most useful in separating
the ash plots from the other forest types as the axes used are correlated to soil
available calcium (axis 2= positive correlation) and pH (axis 3= negative
correlation). The Scot’s pine plots are also well delineated from the other forest
types based on their fungal communities. The two Scot’s pine plots (Britt= Brittas
and Bnsha= Bansha) are grouped closer to the oak plots than to the other Scot’s
pine plots. These two plots have oak trees in their understory and were also shown
to group closely with the oak plots based on their vegetation communities (Fig.
3.13; 3.16, Chapter 3). It is also noticeable that the Sitka spruce plots are
intimately mixed with the oak and Scot’s pine plots indicating a high level of
macrofungal community similarity between these forest types.
The NMS biplot using axes 1 and 2 (Fig. 5.5) is useful in producing close
groupings of the oak and the ash plots. The correlation of axis 2 with calcium and
coarse woody debris separates the ash plots from the other forest types as the ash
plots are characterised by high soil calcium levels and low coarse woody debris
quantity. It can be seen that the ash plot at St John’s Wood (STJON) is grouped
closely with the oak sites.
The ordination using axes 1 and 3 (fig. 5.6) produced noticeable groupings
of all of the plots into their respective forest types based on their macrofungal
communities. The ash plots (except Donadea= DONAD) all group in the bottom
left of the diagram along an increasing pH and soil available calcium gradient.
The Scot’s pine plots form a group at the top of the ordination along a gradient of
decreasing pH and soil calcium and increasing soil magnesium. As in Fig. 5.4, the
Scot’s pine plots at Bansha (BNSHA) and Brittas (BRITT) are grouped close to
the oak plots indicating a high level of community similarity between these plots
and the oak plots. The three Sitka spruce plots at Moneyteige (MONEY),
Cloonagh (CLOON) and Chevy Chase mature (CHEVM) are shown to be outliers
from the main Sitka spruce grouping.
5.4.4 Indicator species analysis
To identify fungal species which may be associated with particular forest types,
Indicator Values (IV) sensu Dufrene and Legendre (1997) were calculated in Pc-
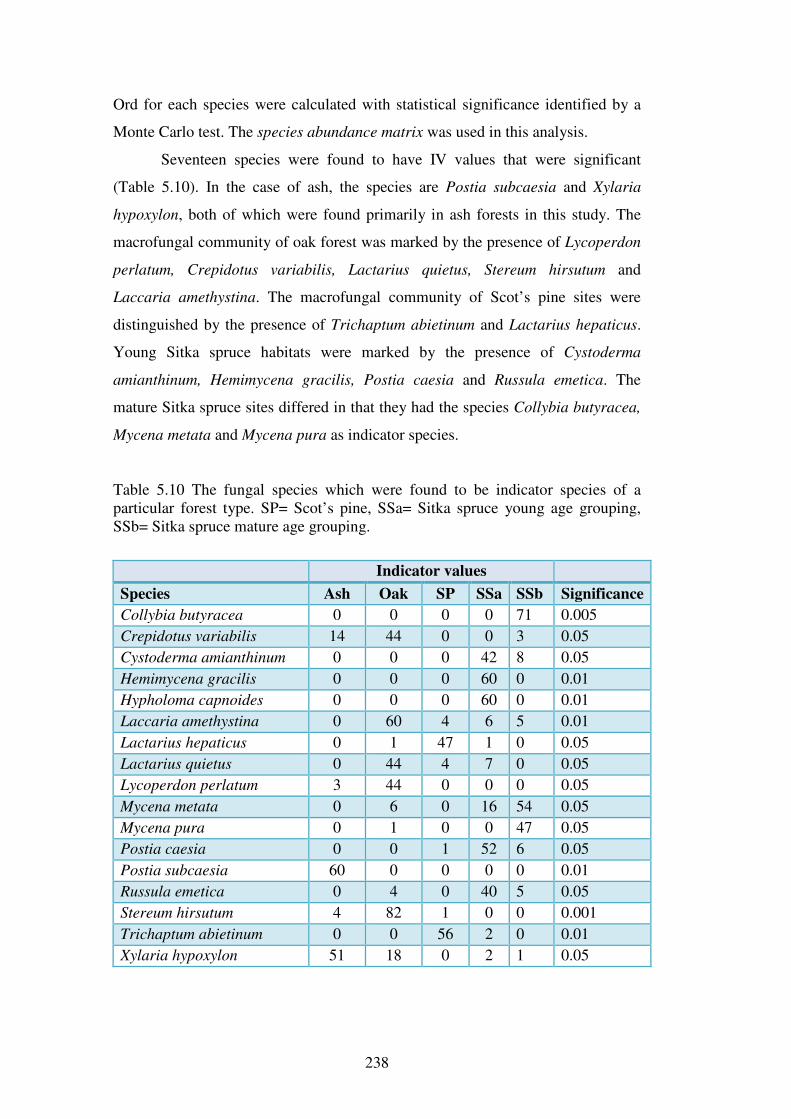
238
Ord for each species were calculated with statistical significance identified by a
Monte Carlo test. The species abundance matrix was used in this analysis.
Seventeen species were found to have IV values that were significant
(Table 5.10). In the case of ash, the species are Postia subcaesia and Xylaria
hypoxylon, both of which were found primarily in ash forests in this study. The
macrofungal community of oak forest was marked by the presence of Lycoperdon
perlatum, Crepidotus variabilis, Lactarius quietus, Stereum hirsutum and
Laccaria amethystina. The macrofungal community of Scot’s pine sites were
distinguished by the presence of Trichaptum abietinum and Lactarius hepaticus.
Young Sitka spruce habitats were marked by the presence of Cystoderma
amianthinum, Hemimycena gracilis, Postia caesia and Russula emetica. The
mature Sitka spruce sites differed in that they had the species Collybia butyracea,
Mycena metata and Mycena pura as indicator species.
Table 5.10 The fungal species which were found to be indicator species of a particular forest type. SP= Scot’s pine, SSa= Sitka spruce young age grouping, SSb= Sitka spruce mature age grouping.
Indicator values
Species Ash Oak SP SSa SSb Significance
Collybia butyracea 0 0 0 0 71 0.005
Crepidotus variabilis 14 44 0 0 3 0.05
Cystoderma amianthinum 0 0 0 42 8 0.05
Hemimycena gracilis 0 0 0 60 0 0.01
Hypholoma capnoides 0 0 0 60 0 0.01
Laccaria amethystina 0 60 4 6 5 0.01
Lactarius hepaticus 0 1 47 1 0 0.05
Lactarius quietus 0 44 4 7 0 0.05
Lycoperdon perlatum 3 44 0 0 0 0.05
Mycena metata 0 6 0 16 54 0.05
Mycena pura 0 1 0 0 47 0.05
Postia caesia 0 0 1 52 6 0.05
Postia subcaesia 60 0 0 0 0 0.01
Russula emetica 0 4 0 40 5 0.05
Stereum hirsutum 4 82 1 0 0 0.001
Trichaptum abietinum 0 0 56 2 0 0.01
Xylaria hypoxylon 51 18 0 2 1 0.05
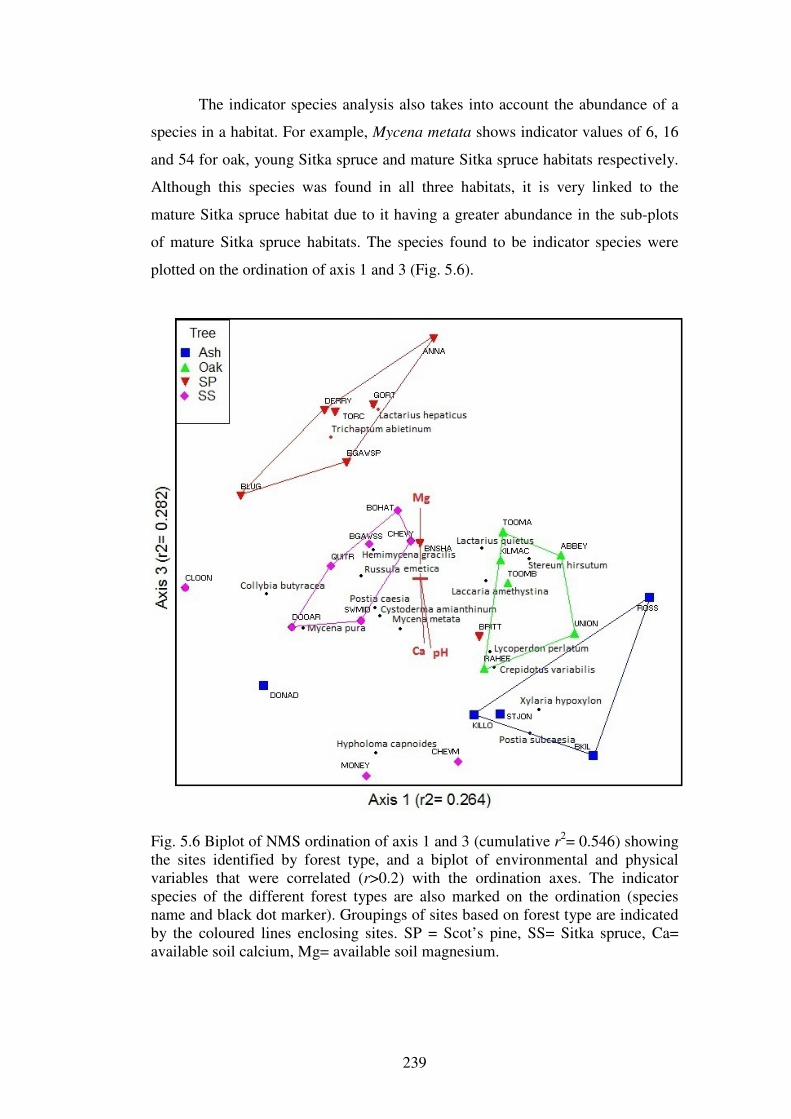
239
The indicator species analysis also takes into account the abundance of a
species in a habitat. For example, Mycena metata shows indicator values of 6, 16
and 54 for oak, young Sitka spruce and mature Sitka spruce habitats respectively.
Although this species was found in all three habitats, it is very linked to the
mature Sitka spruce habitat due to it having a greater abundance in the sub-plots
of mature Sitka spruce habitats. The species found to be indicator species were
plotted on the ordination of axis 1 and 3 (Fig. 5.6).
Fig. 5.6 Biplot of NMS ordination of axis 1 and 3 (cumulative r2= 0.546) showing the sites identified by forest type, and a biplot of environmental and physical variables that were correlated (r>0.2) with the ordination axes. The indicator species of the different forest types are also marked on the ordination (species name and black dot marker). Groupings of sites based on forest type are indicated by the coloured lines enclosing sites. SP = Scot’s pine, SS= Sitka spruce, Ca= available soil calcium, Mg= available soil magnesium.

240

241
The NMS ordination based on macrofungal communities differentiated the
plots into groups that corresponded approximately to the original classification of
the plots according to dominant tree type (Fig. 5.6). The NMS ordinations
separated the plots into the following groups based macrofungal community
assemblages:
1. The ash plots formed a fairly distinct group in the ordination (Fig. 5.6). The
macrofungal community in most of the ash plots is species-poor and lacking in
ectomycorrhizal species. The ash plots were ordinated along axis 2 which was
correlated with decreasing species richness (Table 5.9). The ash plots had the
highest levels of soil calcium, soil pH and low levels of coarse woody debris.
Macrofungal species such Postia subcaesia and the ascomycete Xylaria
hypoxylon were indicator species of this forest type. Other wood decay species
such as Crepidotus variabilis, Marasmius androsaceus, M. hudsonii and Stereum
hirsutum were also abundant species in some of the ash forests. The almost total
lack of ectomycorrhizal species in the ash forests also separated the ash sites from
the other forest types. The four ectomycorrhizal species (two Laccaria species and
two Lactarius species) found in the St John’s wood plot are almost certainly due
the presence in the plot of roots of nearby hazel trees. Other species which were
restricted to the ash sites but were found outside of the plots were the wood decay
ascomycete Daldinia concentrica and the litter decay species Camarophyllopsis
atropuncta. These two species were only found in the un-managed or semi-natural
ash plots at St John’s Wood and Killough.
2. The oak plots formed a distinct group in the centre of the ordination (Fig. 5.6),
indicating that the oak plots possessed a macrofungal community that was distinct
from that of the other forest types. Ectomycorrhizal species such as Laccaria
amethystina and Lactarius quietus were indicator species of the oak forest type.
The wood decay species Crepidotus variabilis and Stereum hirsutum and the litter
decay species Lycoperdon perlatum were also strong indicators of the oak forest
type. Other species found commonly in the oak sites were from the
ectomycorrhizal genera Amanita, Cortinarius, Inocybe, Lactarius and Russula
with 3, 7, 3, 8 and 7 species respectively in the oak plots. The earthball
242
Scleroderma citrinum was also abundant in all of the oak sites except Union,
which in general was the most species-poor oak plot and this is reflected in its
ordination at a slight distance from the rest of the oak plots. Marasmius hudsonii
was a common litter decay fungus found in the oak sites. This species only forms
on holly leaves, and holly was a common understory element in four of the oak
plots (Table 3.10, Chapter 3). Russula ochroleuca was very common in the oak
plots, along with Laccaria laccata and these species often fruited in great
abundance. The only hypogeous macrofungus found in this project, Elaphomyces
granulatus was found in four of the six oak plots. Hypogeous fungi were not
especially investigated in this project and were only encountered due to the
digging involved in ectomycorrhizal root sampling. That these truffle-type
macrofungi were encountered in 4 of the 6 plots suggests that they (and possibly
other hypogeous fungi) may be more common in Irish oak woods than previously
thought.
3. The Scot’s pine plots formed a discrete grouping in the ordination (Fig. 5.6).
Two of the Scot’s pine plots (Bansha: BNSHA and Brittas: BRITT) were grouped
closer to the oak sites probably because of the presence of the ectomycorrhizal
species Laccaria amethystina and Lactarius quietus in these plots. The finding of
these macrofungi in these plots is most likely due to the presence of sapling oak
trees in the understory of both of these plots. Most of the Scot’s pine plots
positioned at the extreme of Axis 3; which was negatively correlated with soil pH
and available calcium. The macrofungal species Lactarius hepaticus and
Trichaptum abietinum were identified as indicator species of the Scot’s pine forest
type (Table 5.10). In general the Scot’s pine plots were characterised by having
high numbers of the ectomycorrhizal species Cortinarius, Lactarius and Russula
with 9, 6 and 8 species respectively. Distinctive species such as Cortinarius
sanguineus, Lactarius rufus and the copper spike Chroogomphus rutulis were
only found in Scot’s pine plots. The first and last of these species were found in
pine plots at Brittas and Bansha, which had the most diverse vegetation of all the
Scot’s pine plots (Table 3.11, Chapter 3). Lactarius rufus was found in abundance
in the Scot’s pine plantations on boggy soil at Annagh, Derryhogan and
Gortnagowna.

243
4. The ordination of the macrofungal community in the Sitka spruce plots formed
a loose cluster in the ordination which indicated that this forest type has a fungal
community that differs in some ways from the other forest types examined (Fig.
5.6). It also indicates that macrofungal communities of Sitka spruce plots share
some similarities with those of the oak and Scot’s pine plots. The species-poor
Sitka spruce plots at Cloonagh (CLOON), Moneyteige (MONEY) and Chevy
Chase Mature (CHEVM) did not align with the other Sitka spruce plots, and can
be seen as outliers from their respective young and mature Sitka spruce site
groupings. These sites had the lowest levels of species richness of all the Sitka
spruce sites with a total of 9, 19 and 25 macrofungal species respectively. Another
factor these three sites had in common was a lack of species that were common in
other Sitka spruce plots. The species Russula ochroleuca, Cortinarius obtusus and
Mycena metata were common in the other spruce plots yet lacking in these three
plots and had an effect on the ordination of these plots.
With regard to the environmental variables, the spruce sites were grouped
between the ash and the Scot’s pine sites which corresponded to intermediate
levels of pH and soil calcium. They were also separated from the ash and the oak
sites by having high levels of coarse woody debris. Indicator species found to
signify Sitka spruce forests were Cystoderma amianthinum, Hemimycena gracilis,
Hypholoma capnoides, Postia caesia, Russula emetica, Collybia butyracea,
Mycena metata and M. pura with the first five species indicating young Sitka
spruce forests and the latter three species indicating mature Sitka spruce forests.
Sitka spruce forests in Ireland were very species-rich in the following genera,
Mycena (20 species), Cortinarius (13 species), Lactarius (10 species) and Russula
(11 species). The macrofungal species Collybia butyracea was found to be a very
abundant and widespread macrofungus in Sitka spruce plots. This species along
with Hypholoma fasciculare and Russula ochroleuca were probably the
macrofungal species with the highest biomass recorded in the Sitka spruce plots.
Multi-response permutation procedure MRPP analysis
The MRPP analysis found that fungal communities were significantly different
between the different forest types examined (Table 5.11). The significant P-value
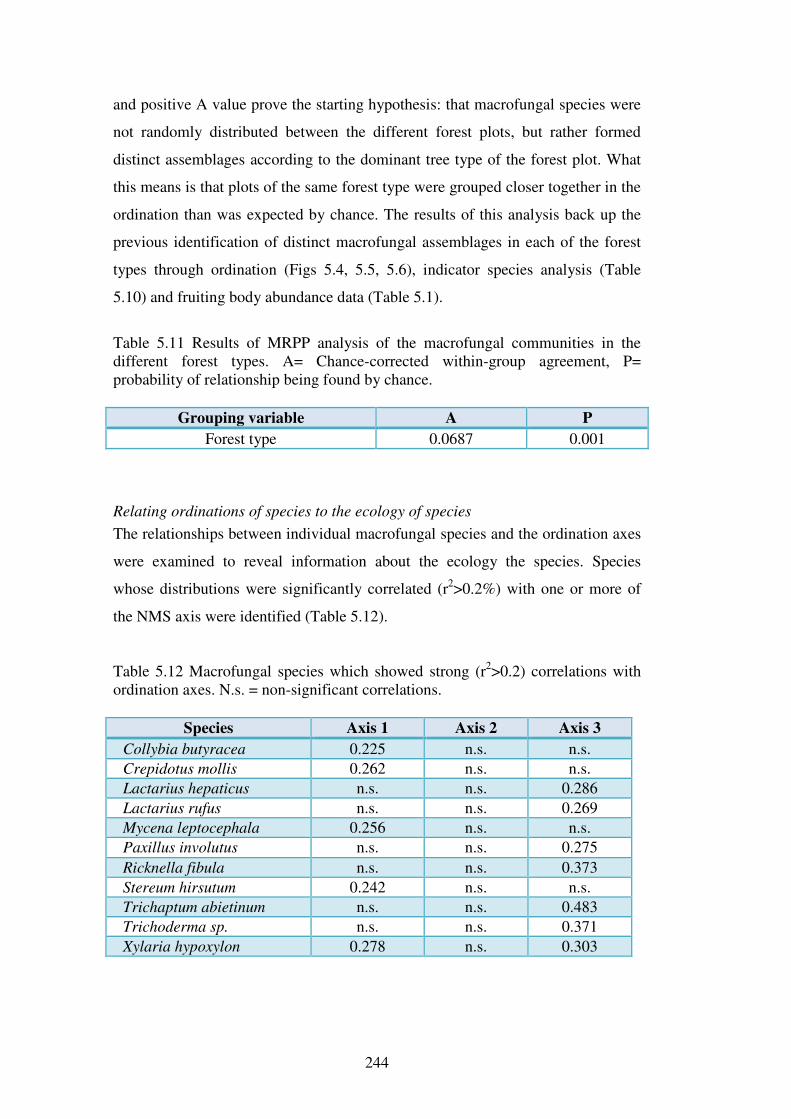
244
and positive A value prove the starting hypothesis: that macrofungal species were
not randomly distributed between the different forest plots, but rather formed
distinct assemblages according to the dominant tree type of the forest plot. What
this means is that plots of the same forest type were grouped closer together in the
ordination than was expected by chance. The results of this analysis back up the
previous identification of distinct macrofungal assemblages in each of the forest
types through ordination (Figs 5.4, 5.5, 5.6), indicator species analysis (Table
5.10) and fruiting body abundance data (Table 5.1).
Table 5.11 Results of MRPP analysis of the macrofungal communities in the different forest types. A= Chance-corrected within-group agreement, P= probability of relationship being found by chance.
Grouping variable A P
Forest type 0.0687 0.001
Relating ordinations of species to the ecology of species
The relationships between individual macrofungal species and the ordination axes
were examined to reveal information about the ecology the species. Species
whose distributions were significantly correlated (r2>0.2%) with one or more of
the NMS axis were identified (Table 5.12).
Table 5.12 Macrofungal species which showed strong (r2>0.2) correlations with ordination axes. N.s. = non-significant correlations.
Species Axis 1 Axis 2 Axis 3
Collybia butyracea 0.225 n.s. n.s.
Crepidotus mollis 0.262 n.s. n.s.
Lactarius hepaticus n.s. n.s. 0.286
Lactarius rufus n.s. n.s. 0.269
Mycena leptocephala 0.256 n.s. n.s.
Paxillus involutus n.s. n.s. 0.275
Ricknella fibula n.s. n.s. 0.373
Stereum hirsutum 0.242 n.s. n.s.
Trichaptum abietinum n.s. n.s. 0.483
Trichoderma sp. n.s. n.s. 0.371
Xylaria hypoxylon 0.278 n.s. 0.303
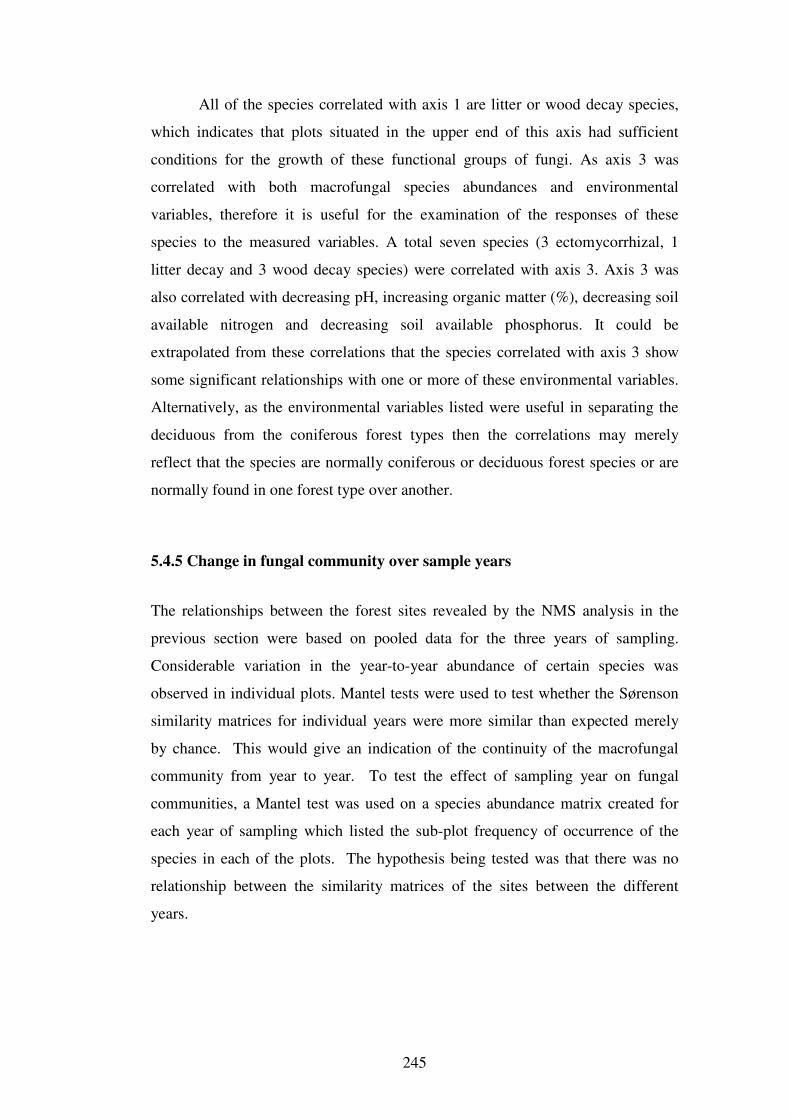
245
All of the species correlated with axis 1 are litter or wood decay species,
which indicates that plots situated in the upper end of this axis had sufficient
conditions for the growth of these functional groups of fungi. As axis 3 was
correlated with both macrofungal species abundances and environmental
variables, therefore it is useful for the examination of the responses of these
species to the measured variables. A total seven species (3 ectomycorrhizal, 1
litter decay and 3 wood decay species) were correlated with axis 3. Axis 3 was
also correlated with decreasing pH, increasing organic matter (%), decreasing soil
available nitrogen and decreasing soil available phosphorus. It could be
extrapolated from these correlations that the species correlated with axis 3 show
some significant relationships with one or more of these environmental variables.
Alternatively, as the environmental variables listed were useful in separating the
deciduous from the coniferous forest types then the correlations may merely
reflect that the species are normally coniferous or deciduous forest species or are
normally found in one forest type over another.
5.4.5 Change in fungal community over sample years
The relationships between the forest sites revealed by the NMS analysis in the
previous section were based on pooled data for the three years of sampling.
Considerable variation in the year-to-year abundance of certain species was
observed in individual plots. Mantel tests were used to test whether the Sørenson
similarity matrices for individual years were more similar than expected merely
by chance. This would give an indication of the continuity of the macrofungal
community from year to year. To test the effect of sampling year on fungal
communities, a Mantel test was used on a species abundance matrix created for
each year of sampling which listed the sub-plot frequency of occurrence of the
species in each of the plots. The hypothesis being tested was that there was no
relationship between the similarity matrices of the sites between the different
years.
246
2007 and 2008
The Monte Carlo test showed that the relationship between the two matrixes may
have been due to chance (P= 0.137). The effect size r (according to the
standardized Mantel statistic) was -0.169.
2007 and 2009
The Monte Carlo test showed that the relationship between the two matrixes was
likely due to chance (P= 0.45). The effect size r was 0.017.
2008 and 2009
The Monte Carlo test showed that the relationship between the two matrixes was
not due to chance (P<0.05). The effect size r was 0.321. The effect size is low to
medium at r= 0.321 and positive which shows that the communities are positively
related.
The Mantel test only identified a significant relationship between the years
2008 and 2009. This means that the similarities between the plots based on
macrofungal species abundances were statistically replicated between 2008 and
2009, suggesting a continuity of community composition between the years, but
not between 2007 and later years. In order to test if the use of a quantitative
measure (Sørenson) of community composition could have caused a type II error
(the failure to reject a null hypotheses when it was true) a qualitative measure
(Jaccard’s) of community similarity was also used in the Mantel tests. Similar to
the Mantel test using the Sørenson index, the only significant relationships found
were between 2008 and 2009 (r= 0.335, P<0.05). Therefore the fungal
communities of the plots did not show similar patterns over the years 2007 and
2008; and 2007 and 2009.
247
5.5 Discussion
5.5.1 Evidence for the existence of distinctive communities of macrofungi in
Irish forests
This study has shown that distinctive macrofungal communities exist in each of
the four forest types. By analyzing abundance data calculated from species
frequency over a number of sub-plots, it was found that plots of a similar forest
type were more similar to each other than to plots of a different forest type. It was
found that species with high fruiting abundance and species which were more
common in one forest type than in the others, were more important in defining the
communities than forest type restricted species. Wilkins et al. (1937) also found
that species which are truly restricted are so few in number that they are not useful
in defining macrofungal communities, and may often be missed unless the
sampling frequency is high.
Other studies of temperate forests have also found that the macrofungal
communities of forests can be used to identify plots, based on the dominant tree
species of the plots. In the U.K., Humphrey et al. (2000) found that the data on
macrofungal communities collected over three years could be used to produce
distinctive groupings of their Scot’s pine, Sitka spruce and oak plots, which
corresponded to the forest type of the plot. Buee et al. (2011) collected
macrofungal data over 7 years in coniferous and deciduous plots in France, and
found that the ordination of the recorded sporocarp abundances separated their
plots into their respective forest types. In forest plots in Switzerland, Straatsma
and Krisai-Greilhuber (2003) found that cluster analysis of the macrofungal
communities grouped plots with similar dominant tree species closer to each other
than plots that had a different dominant tree species. In North America, it has been
found that the macrofungal communities of hardwood and coniferous forests are
very different (Villeneuve et al. 1980; Bills et al. 1986), and these differences
may be due to host preferences of ectomycorrhizal fungi (Newton and Haigh
1998) or substrate specificity which is demonstrated by many decay macrofungi
(Boddy 2001; Ludley et al. 2008).
248
This study also indicated that there is a level of continuity in macrofungal
species between some of the sample years. The macrofungal communities of
forests are made up of two components:
a) Species that consistently produce sporocarps in every sample year. Forest
macrofungi are known to show large variation in species appearances and
abundances over different sampling years (Krebs et al. 2008; Courty et al.
2008), with the long term study by Straatsma et al. (2001) highlighting this
variation by finding that only 8 of the 408 species found during the 21-year
duration appeared in all years. Of the 8 species, 6 were ectomycorrhizal
(Lactarius blennius, Russula cyanoxantha, R. fellea, R. nobilis as “R.
fageticola”, R. ochroleuca, and Xerocomus badius) and 2 were litter-decay
species (Collybia butyracea var. asema and C. dryophila). It is known that
some fungi from the genera Lactarius and Russula (Redecker et al. 2001);
and also the species Laccaria amethystina (Gherbi et al. 1999) rely heavily
on spores for propagation, and therefore for their yearly continuity in an area
it may be vital that they produce sporocarps every season.
b) Species that infrequently produce sporocarps over some sample years. The
vast majority of forest macrofungal species do not produce sporocarps in
every year (Straatsma et al. 2001) and these are likely responsible for the
non-significant relationship between community composition in some of the
years. It has been found that the majority of forest macrofungal species
cannot produce bumper crops two years in a row (Krebs et al. 2008), and
therefore relationships in species abundances between subsequent years may
not exist.
If both species group a (annual fruiting species) and the majority of group b
(inconsistently fruiting species) above produced sporocarps, then relationships in
macrofungal community composition between years (as in 2008 and 2009) is not
surprising.
249
5.5.2 The macrofungal communities of the forest types
Macrofungal community of Ash forests
Ash shared only one of its most frequent species (Mycena galopus) with another
forest type (oak). This indicates that ash forests have a rather specific group of
common macrofungi, which are not as common in the other forest types, although
these fungi are not restricted to ash forests either. Examples of some macrofungal
species which are more commonly found in ash forests, but not restricted, are
Daldinia concentrica and Terana caerulea which are most often found on ash
woody debris, but are also known from other tree species (Phillips 2006). Ash
plots were more similar to other ash plots than they were to oak, SP or SS plots
based on fungal community composition. The ordination analysis produced a
clearly delineated grouping for the ash plots, which corresponded with the ash
forest type grouping. Postia subcaesia and Xylaria hypoxylon were indicator
species of ash forests, while Crepidotus variabilis, Marasmius androsaceus,
Stereum hirsutum, Camarophyllopsis atropuncta, and Daldinia concentrica were
found to be more common in ash forests than the other forest types. Macrofungal
studies in ash forests are rare, in one of the few studies examining this forest type,
Hering (1966) found that Mycena galopus and M. polygramma were two of the
most common fungi of the 59 recorded in total over three years. These species
were also the second and third most commonly recorded fungi from ash forests in
this study. The species Camarophyllopsis atropuncta, a new record to the
Republic of Ireland, was found only in the two unmanaged ash forests. It is listed
from Northern Ireland as being found commonly with hazel (NIFG 2010) and is
noted as being found in moist basic forest soils (Bas et al. 1990). The total
number of species recorded from ash forests in England (Hering 1966) is very
similar to the total for the same forest type in this study (56 species).
Macrofungal community of Oak forests
Oak sites had the highest inter-plot Jaccard similarity and shared a high number of
macrofungal species between its plots than the other forest types. High intra-forest
type similarity values indicate that the oak forests have a more distinct fungal
community than the other forest types. Ordination of the plots based on
macrofungal community assemblages produced a close grouping of the oak plots,
250
which was related to their forest type classification. The litter- and wood-decay
macrofungi Crepidotus variabilis, Lycoperdon perlatum and Stereum hirsutum,
and the ectomycorrhizal fungi Laccaria amethystina and Lactarius quietus were
shown to be indicators of the oak forest macrofungal community. Lactarius
quietus is also associated with oak forests in the U.K., as it was found in almost
twice the number of quadrats in oak than in any other forest type (C. Quine,
unpub. data). L. quietus is one of the few species pointed out as being a typical
oak forest fungus by Watling (2005) in Scotland and in England by Wilkins et al.
(1937) and Hering (1966). Heilmann-Clausen et al. (1998) list it as being a
Quercus associate in Europe.
In oak plots, Laccaria laccata and L. amethystina were very common and
were also the most prominent sporocarp producers. These two species had equally
high abundances in the oak forest type, a finding similar to oak forests in the U.K.
(Watling 1974; Humphrey et al. 2003), that highlights the similar ecological
requirements of both species. Stereum hirsutum and Mycena galopus were the 3rd
and 5th most common fungi in Irish oak forests in this study and of similar
abundance in oak forests in the U.K. (Humphrey et al. 2003; C. Quine, unpub.
data).
The earthball Scleroderma citrinum was not found in any of the oak plots
in the U.K. (Humphrey et al. 2003; C. Quine, unpub. data), while it was very
common in the Irish oak forests. S. citrinum was listed by Hering (1966) in
pedunculate oak woods in the U.K. under the previous name of Scleroderma
aurantium, although it was not one of the more common fungi. It is listed as being
a common associate of oak, beech and birch in the British Isles (Pegler et al.
1995). This species was common to both the pedunculate and sessile oak plots in
this project. Scleroderma species produce long distance exploration hyphae, and
therefore are more successful at colonising root space in areas of low root density
(Peay et al. 2011). The oak plots examined in the U.K. study were much younger
and probably more densely stocked than the plots examined in this project, so the
tree density of the plots may be the explanation for the lower frequency of
Scleroderma species in the oak forests in Humphrey et al. (2000) study than in
this study of mature oak plots.
Other species only found in oak forests in this project are Daedalea
quercina and Fistulina hepatica, both of which are noted as typical oak forest
251
fungi in Scotland (Watling 2005). Both of these species were only found in the
pedunculate oak forest (Abbeyleix), which might indicate that they are more
common in pedunculate than in sessile oak forests in the Republic of Ireland.
Fistulina hepatica was found in only one pedunculate oak plot in the study in the
U.K. (C. Quine, unpub. data), and the plot was also the oldest oak plot examined
at >177 years old. The oak plot where Fistulina hepatica was found in this study
has been noted as one of the oldest (>200 years old) oak stands remaining in
Ireland (Rackham 1995), and this may indicate a preference for old pedunculate
oak woods by the bracket fungus Fistulina hepatica.
Watling (1974) lists 29 species from Boletales that are common
ectomycorrhizal macrofungi found with oak in the U.K., but Humphrey et al.
(2003) only found 3 species of Boletus (Boletus appendiculatus, B. chrysenteron
and B. porosporus) in their pedunculate oak woods. This study agrees with the
previous study by Humphrey et al. in that very few boletes (4), were found in oak
plots and they had no preference for oak forests. The clade Boletales has been
noted as being under-recorded if not species poor in the Republic of Ireland
(O’Hanlon and Harrington in press), and therefore this study may indicate that the
clade is actually species poor in Ireland. The records from Northern Ireland also
indicate that the genus Boletus may be species poor in Ireland, with only 23
species of Boletus recorded (NIFG 2010) compared to 40 species in England
(O’Hanlon and Harrington in press).
A specific group of Russula species were identified as indicative of oak
forests in the U.K. (Humphrey et al. 2000; C. Quine, unpub. data), including the
species (R. betularum, R. nigricans, R. fragilis and R. cyanoxantha), but no such
grouping was found in this study for oak forests. R. nigricans was found outside
of the plots a number of times during this study while R. cyanoxantha was found
outside of the plots on even less occasions during the three years. Both of these
species show widespread distribution in Northern Ireland (FRDBI 2010) and
therefore their scarcity in this project may be due to infrequent fruiting pattern of
these species. Hering (1966) found these two species to be specific to their sessile
oak woods, although they were only found as 17 and 4 fruitbodies respectively
over three years of sampling.
In a macrofungal community study of British pedunculate oak woods
(Wilkins et al. 1937), the authors identified the genus Lactarius as very species
252
rich in pedunculate oak woods in Britain, especially the species Lactarius
glyciosmus, L. mitissimus, L. pyrogalus and L. vellereus, but no such grouping
was found in the oak forest type in this project indicating that these species may
be sessile oak specific macrofungi; or associated with one of the other tree species
present in the examined plots (e.g. L. pyrogalus with the hazel in the plots). The
parasitic macrofungus Armillaria mellea is a species that was frequent in the oak
plots of this project and in British pedunculate (Wilkins et al. 1937) and sessile
(Hering 1966) oak-woods. It is listed as a parasite of deciduous trees in Ireland
and Britain (Legon and Henrici 2005), being common in deciduous forests up to
Scotland, where it is less common.
Macrofungal community of Scot’s pine forests
Scot’s pine plots had the lowest inter-plot similarity values because of the large
inter-site variation in macrofungal species abundance. The macrofungal
communities of Scot’s pine plots on average had more in common with those of
oak plots than with other Scot’s pine plots, although this was shown to be an
artefact of two of the pine plots having oak saplings in their understory.
Nevertheless, NMS separated the pine plots into a clear grouping which
corresponded loosely to their forest type determined by dominant tree species.
In total Scot’s pine plots shared 21, 44 and 58 species with ash, oak and
Sitka spruce plots respectively. Russula ochroleuca and Laccaria laccata were
very common in Scot’s pine, oak and Sitka spruce plots. The litter-decay fungus
Myena leptocephala was very common in Scot’s pine and Sitka spruce plots, thus
highlighting the non-specific requirements of these forest macrofungi. These three
species (Russula ochroleuca, Laccaria laccata and Mycena leptocephala), along
with Lactarius hepaticus, were some of the most prominent sporocarp producers
in Scot’s pine plots. The first three of these species were some of the most
commonly found macrofungi in British forests (Humphrey et al. 2003), with
Lactarius hepaticus being noted as one of the few ectomycorrhizal species which
is increasing in abundance in Europe in recent years (Heilmann-Clausen et al.
1998).
Lactarius hepaticus and Paxillus involutus were two of the species which
showed significant correlations with the ordination axis 3. This axis was also
correlated with the available nitrogen in the plot. That these two species were
253
identified as ectomycorrhizal species which are broadly tolerant of high nitrogen
(Outerbridge 2002; Kranabetter et al. 2009) may indicate that they have a
preference for habitats high in soil available nitrogen.
The indicator species analysis for Scot’s pine forests identified L.
hepaticus and Trichaptum abietinum as species which show some fidelity to the
Scot’s pine forest type. Lactarius hepaticus is listed as being an ectomycorrhizal
associate of Pinus, but also known to occur with Picea in Europe (Heilmann-
Clausen et al. 1998), while Trichaptum abietinum is known to grow on Picea,
Pinus and Abies (Breitenbach and Kraenzlin 1985). Both of these species, along
with two species known to colonize pine cones, Baeospora myosura and
Auriscalpium vulgare, were also common to all of the plantation Scot’s pine sites
examined in England by Ferris et al. (2000a). The latter two species were only
found in the old growth sites at Torc, Bansha and Brittas in this project.
Auriscalpium vulgare is restricted to pine cones, while being found less often on
spruce cones in the U.K. (Pegler et al. 1997) and is known to be only rarely
collected across its entire range (Peterson and Cifuentes 1994). Baeospora
myosura is restricted to the cones of pine and spruce trees (Breitenbach and
Kraenzlin 1991) in Europe. Microhabitat-restricted fungi such as these pine cone
fungi, are restricted in distribution in Ireland probably because of the sporadic
occurrence of patches of old-growth pine forests, which act as the spore bank for
such fungi.
The species Russula emetica, Amanita cecilia (listed as Amanita inaurata)
and Hypholoma marginatum were found to be very common in plantation Scot’s
pine forests of England by Richardson (1970), while they were found to be totally
lacking from the pine plots in this project. It is likely that the first two species
were locally more common in the area investigated in the English study as
opposed to being absent from Scot’s pine forests in Ireland. The latter species
(Hypholoma marginatum) may be restricted in Irish plantations by the lack of
suitable coarse woody debris available in some Irish plantations (Sweeney et al.
2010a).
The work examining Dryas macrofungi in the Burren by Harrington
(2003) can be used as an indication of what macrofungi existed with Scot’s pine
in the Burren area of Ireland in the past. A large Cortinarius element (~10%
species) is present in the macrofungal communities of both this study and the
254
study of the Burren heaths (~18% species) by Harrington (2003), although the
individual species differ markedly with the Cortinarius species from Scot’s pine
forests in this study being found throughout Ireland while the species in the
Burren are very restricted in their distribution across Ireland.
Macrofungal community of Sitka spruce forests
The hypothesis that Sitka spruce forests would share many fungal species with the
other forest types was confirmed in this research, due to the high levels of
similarity between spruce and the other forest types and due to the ordination of
the spruce plots close to the oak and Scot’s pine plots. The Sitka spruce plots in
Humphrey et al. (2000) study were also ordinated close to the pine and oak plots,
indicating that spruce forests shared many similarities in their macrofungal
communities with oak and Scot’s pine forests.
The ordination and indicator species analysis indicate that there are
differences in the macrofungal communities of young and mature Sitka spruce
forests. As coniferous sites age, the build up of litter on the forest floor is likely to
affect many of the abiotic characteristics of the forest floor. This litter build-up
has been shown to have mixed effects on the growth of some ectomycorrhizal
fungi (Barr et al. 1994; Baar 1996). Dighton et al. (1986) examined a
chronosequence of Sitka spruce forests in England, and found that, although
species diversity (Shannon index) was not significantly related to forest age, there
were marked differences in the community composition in the different age
groups, and these differences were related to the successional stages of
ectomycorrhizal colonisation and with the build up of the litter layers.
This study is the second systematic published study on the macrofungi of
Irish Sitka spruce forests. The one other published description of macrofungal
assemblages in Irish Sitka spruce forests by Heslin et al. (1992) identified 17
macrofungi in their mixed species spruce plantations from one sampling occasion,
although quantifying of macrofungal diversity was not the main aim of their
investigation. The pure spruce plots in the Heslin et al. study only produced four
species of macrofungi (Cortinarius obtusus, C. croceus, C. tubarius as
“Dermocybe sphagneti” and an unidentified Cortinarius species). The first species
(C. obtusus) was found in four of the nine spruce plots in this project while the
255
other species were not found in the project. Of the species from the mixed Sitka
spruce/Japanese larch and Sitka spruce/lodgepole pine plots in the Heslin et al.
study, Amanita rubescens, Laccaria laccata, L. amethystina, Marasmius
androsaceus and Tricholomopsis rutilans were common to spruce plots in this
study.
Sitka spruce forests shared 30, 65 and 58 species with ash, oak and Scot’s
pine plots respectively. The most prominent sporocarp producer in Sitka spruce
forests (Hemimycena gracilis) was found in three of the nine spruce sites. The
second and third most abundant sporocarp producers (Mycena leptocephala and
Russula ochroleuca) were also abundant in oak and Scot’s pine forests.
Hypholoma fasciculare and Collybia butyracea are very common in Irish Sitka
spruce forests (4th and 5th most found in Sitka spruce sub-plots). Hypholoma
fasciculare was also common in the Sitka spruce forests of the U.K (Humphrey et
al. 2003). Collybia butyracea was found more often with Norway spruce than
with Sitka spruce in the U.K. study (C. Quine unpub. data) and was found in all of
the Norway spruce sites examined by Ferris et al. (2000a) in England.
Sitka spruce forests were found to be more similar to each other than to
sites of the other forest types. NMS clearly distinguished a Sitka spruce
macrofungal community and also detected differences in community composition
between the young and mature plots. The spruce plots at Cloonagh, Moneyteige
and Chevy Chase Mature were outliers from the spruce group in the ordination,
and the reason for this is that these plots lacked a number of species which were
abundant in the other spruce plots. Examples of species which were absent from
the communities of Cloonagh, Moneyteige and Chevy Chase mature while being
present in the majority of the remaining Sitka spruce plots are Mycena
archangelina, M. rorida, M. epipterygia, Russula ochroleuca, Lycoperdon
nigrescens, Marasmius androsaceus, Entoloma cetratum, Clitocybe vibecina and
Amanita rubescens. The first two of these plots were first rotation spruce plots
planted on previously unforested land, therefore the lack of some species from
these plots may be due to a lack of inoculum sources such as spores or mycelium
in the soil of the plots. The lack of sufficient spore and vegetative inoculum has
been shown to affect fungal communities in plantation forests (Kranabetter and
Wylie 1998; Jones et al. 2003). The apparent low species richness of the mature
site at Chevy Chase might be explained by the diverse but infrequently fruiting
256
ectomycorrhizal macrofungal found in many late stage coniferous forests (O’Dell
et al. 1999; Smith et al. 2003). Although the belowground examination of
ectomycorrhizal morphotypes also identified this plot as poor in ectomycorrhizal
species (Table 6.4, Chapter 6).
Indicator species analysis identified Collybia butyracea, Cystoderma
amianthinum, Hemimycena gracilis, Hypholoma capnoides, Mycena metata, M.
pura, Postia caesia and Russula emetica as indicators of the Sitka spruce
macrofungal community. None of these species except Mycena pura (Roberts et
al. 2004) were found with Sitka spruce in its home range in British Columbia
(Outerbridge 2002). However, Mycena rosella, Lycoperdon nigrescens, L.
pyriforme, L. perlatum and Clavulina rugosa, which were identified by
Outerbridge (2002) as indicator species from the Vancouver Sitka spruce forests,
were present in the Sitka spruce forest type in this project, but were also found in
at least one of the other forest types. The majority of the very frequent species in
Sitka spruce forests in British Columbia are not found in Sitka spruce forests in
Ireland. The species Cantharellus formosus, Inocybe sororia, Mycena tenax, M.
aurantiidisca, Guepiniopsis alpina, Xeromphalina campanella and X. fulvipes
were some of the most commonly found from quadrats of Sitka spruce in the
Outerbridge (2002) study. Only two of the aforementioned species (Guepiniopsis
alpina and Xeromphalina campanella) are present in the Checklist of
Basidiomycetes of Britain and Ireland (Legon and Henrici 2005).
There were strong similarities between Sitka spruce forests in different
locations in respect of certain biodiverse genera. Mycena, Cortinarius and Russula
were very species rich in this project (20, 13 and 11 species) and in similar studies
from the U.K. (28, 35 and 16 species; C. Quine, unpub. data) and Canada (22, 14
and 13 species; Roberts et al. 2004). Of the Cortinarius species found with spruce
during this project, Cortinarius flexipes, C. rubellus, C. evernius and C. stillatitius
were all found fruiting in large quantities, but showed very local distributions in
some cases. C. rubellus has been recorded with Sitka spruce in Ireland
(Harrington 1994), and is thought to be a species which has undergone a “host
shift” moving from its normal ectomycorrhizal host of Scot’s pine to Sitka spruce
in Scotland (Watling 1982) and Ireland (Harrington 1994). It is a known associate
of spruce and pine in Europe (Brandrud et al. 1990-1998) and has been recorded
in Northern Ireland with Sitka spruce and Birch (NIFG 2010), and from England
257
and Wales in association with pine and spruce in plantations (Legon and Henrici
2005).
Two Clavulina species (Clavulina rugosa and C. corraloides) were often
found fruiting in large abundances in the Sitka spruce forests in this project,
although they were not found to be indicator species. Both of these species were
also found in Sitka spruce plots in British Columbia (Outerbridge 2002), while C.
corraloides was very abundant in red spruce plots in Virginia (Bills et al. 1986),
thus highlighting this species, and possibly genera, as having a preference for
spruce/coniferous forests as indicated by Breitenbach and Kraenzlin (1985) from
Swiss data.
Of the edible fungi found to be capable of growing in Sitka spruce forests,
Cantharellus cibarius, C. tubaeformis and Boletus edulis are of note. Cantharellus
cibarius was found in a spruce plantation, near birch trees which probably
indicates that it was ectomycorrhizal with the birch. Both Cantharellus species are
known from Spruce forests in the U.K. (Pegler et al. 1997). The macrofungi C.
tubaeformis and Boletus edulis were found in spruce forests in areas with only
Sitka spruce present. B. edulis is known to be found in both deciduous and
coniferous forests around Europe including Norway spruce Picea abies (Muñoz
2005). In this project and from anecdotal records, a relationship has been observed
in the close proximity of sporocarps of B. edulis and of Amanita muscaria in the
field. This relationship has also been noticed before by many collectors in the
forests of America (Arora 1986) and New Zealand (Wang and Hall 2004). A
similar relationship between Chalciporus piperatus and Amanita muscaria was
recorded in this project and elsewhere (Tedersoo et al. 2010). A possible
explanation for the fruiting of these species in close proximity as proposed by
Wang and Hall (2004), is that they are in a biotrophic relationship. It has been
recorded that Boletus edulis and Amanita muscaria can form composite
ectomycorrhizal structures on roots, and the sharing of resources which may
follow such events could be vital for sporocarp production of either or both
species (Wang and Hall 2004). Cantharellus tubaeformis was often found
growing in great abundance in Sitka spruce forests in this project and a related
Cantharellus species, C. formosus was also noted as being a prolific sporocarp
producer in Sitka spruce forests in the Vancouver sites (Outerbridge 2002).
258
5.5.3 Host preference in macrofungi
It was found that species such as Mycena leptocephala, M. vitilis and M. galopus
were common to all forest types examined in this project. Other species with a
seemingly cosmopolitan distribution are Russula ochroleuca, Cortinarius obtusus,
C. flexipes, Hypholoma fasciculare, Laccaria laccata and L. amethystina, being
found in large abundances in a number of plots from different forest types. Five of
the species listed above were also in the most common list of fungi from the study
of British forests (Humphrey et al. 2003). The species Laccaria amethystina, L.
laccatta, Hypholoma fasciculare, Russula ochroleuca and Mycena galopus have
already been noted as species that show very low levels of host preference in
temperate forests (Buee et al. 2011). The vast majority of the species recorded in
this project would fall into the relatively inconstant species according to Wilkins
et al. (1937).
Relatively constant species found often in ash plots were the species
Marasmius androsaceus and Stereum hirsutum, while the species
Camarophyllopsis atropuncta, Daldinia concentrica, Postia subcaesia and
Terana caerulea were ash restricted species. Other studies have shown that all of
the previously listed species are also found with other hosts in Europe (Phillips
2006; Breitenbach and Kraenzlin 1985; Whalley and Watling 1982; Kuyper et al.
1990) and therefore are not entirely restricted to ash forests.
In oak plots the species Crepidotus variabilis, Lycoperdon perlatum,
Lactarius quietus, Stereum hirsutum and Armillaria mellea showed a preference
for oak plots, while the species Scleroderma citrinum was restricted to the oak
forest type. Scleroderma citrinum, Lycoperdon perlatum, Stereum hirsutum and
Armillaria mellea have been noted as showing a low level of forest type
specificity in temperate forests in France, while Lactarius quietus showed a very
high level of host specificity to oak forests (Buee et al. 2011).
In the pine plots, the species L. hepaticus and Trichaptum abietinum
showed a preference for the habitat, fruiting more in pine than in any other forest
type. The species Baeospora myosura, Auriscalpium vulgare, Lactarius rufus,
Hygrophoropsis aurantiaca and Chroogomphus rutilus were restricted to pine
plots in this project. The species Lactarius hepaticus, Trichaptum abietinum,

259
Baeospora myosura and Auriscalpium vulgare were found in all of the Scot’s pine
plots in the U.K. study (Ferris et al. 2000a), and therefore may show a high level
of specificity to Scot’s pine in Western Europe.
In the spruce plots the species Collybia butyracea, Hypholoma capnoides,
Mycena metata, M. pura, Postia caesia, Russula emetica, Clavulina corraloides
and C. cristata showed a preference for Sitka spruce forests over the other forests
types, while the species Cystoderma amianthinum, Cortinarius obtusus, C.
rubellus, and Hemimycena gracilis were restricted to the Sitka spruce plots. An
example of a possible host shift (Watling 1995) may be the association of
Cystoderma amianthinum with Sitka spruce in Ireland. In Sweden, Cystoderma
amianthinum has been identified as a strong indicator of oak (Quercus robur)
forests (Tyler 1992). In agreement with this project, the study of the U.K. forests
(C. Quine, unpub. data) found that C. amianthinum was much more common in
coniferous forests. Another example of a host shift is likely in the relationship
between Cortinarius rubellus and Sitka spruce in Ireland. Such a relationship has
already been proposed in Scotland (Watling 1982), where it is said that C.
rubellus has migrated from its usual host Scot’s pine to the exotic species Sitka
spruce.
260
5.6 Conclusions
• This study shows that specific macrofungal communities exist for Irish ash,
oak, Scot’s pine and Sitka spruce forests, and these communities are linked to
the dominant tree species of the forest.
• Species which were very abundant in one forest type compared to other forest
types were more important in defining the fungal communities than species
that were restricted to a single forest type.
• This study found that the Sitka spruce macrofungal community is similar in
many ways to that of oak and Scot’s pine forests, thus corroborating with
other studies which identified Sitka spruce as an ectomycorrhizal generalist in
western European forests.
• Mixed relationships were found between the macrofungal communities over
the sample years, and these were due to the inconsistent fruiting patterns of
the majority of macrofungal species.
• Information as to the lack of host preference is presented for nine
macrofungal species with high levels of host preference identified for several
macrofungal species.

261
Chapter 6: Ectomycorrhizal morphotype richness and community analysis of the
forest types

262
263
6.1 Introduction
6.1.1 Ectomycorrhizas in forest ecosystems
Up to 85% of the known angiosperm species alive today are mycorrhizal, with
some 72% of those species being obligatory mycorrhizal (Wang and Qui 2006).
Within the other groups of land plants, gymnosperms, pteridophytes and
bryophyte species, 90, 52 and 46% respectively of their species show mycorrhizal
associations. Indeed, the majority of land plants depend on mycorrhizal fungi with
80% of known plant species forming mycorrhizal associations (Wang and Qui
2006). Ectomycorrhizas are known to be highly diverse, even in relatively small
geographic areas (Ishida et al. 2007; Morris et al. 2008). Explanations for the
large diversity of ectomycorrhizal types on the limited space available in the root
zone are numerous, and have been proposed by numerous reviews on the subject
(Bruns 1995; Taylor 2002; Kennedy 2010), such as: ectomycorrhizas are both
horizontally (Dickie and Reich 2005; Pickles et al. 2010) and vertically (Dickie et
al. 2002) distributed in the soil layers, ectomycorrhizas show large temporal
variation (Courty et al. 2008) and certain species also show distinct preferences
toward different substrates such as ectomycorrhizas from the clade Thelephorales
with CWD and certain ascomycetes with mineral soil layers (Tedersoo et al.
2003). Ectomycorrhizal (ECM) assemblages may change over chronological
stages of the forest cycle (Tweig et al. 2009) in what has been referred to by some
workers as “EM succession” (Deacon and Fleming 1992). However, young trees
planted near established trees have been shown to form ectomycorrhizal linkages
with so called “late stage” ectomycorrhizal fungi (Kranabetter 1999). Soil abiotic
variables such as nitrogen (Avis et al. 2003) and pH (Kjoller and Clemonsson
2009) have large affects on the species richness and community structure of the
ectomycorrhizas present.
Ectomycorrhizas are particularly important for plant hosts that grow in
nutrient-poor soil conditions (Smith and Read 2008), for example boreal
coniferous forests, and also where tree species are introduced into new habitats
where they may not be suited to the particular soil and environmental conditions
264
(Nunez et al. 2009). Ectomycorrhizas have been shown to link multiple trees of
different chronological stages by common mycorrhizal networks (CMN) (Beiler
et al. 2010). These linkages may facilitate carbon transfer between connected trees
(Simard et al. 1997; Simard and Durall 2004) and allow for the absorption of
limiting nutrients (Smith and Read 2008) and water (Lehto and Zwiazek 2011) by
connected trees. These two functions of CMN promote structural heterogeneity in
forest ecosystems, by allowing young seedlings to survive in the presence of
much larger trees. Many ectomycorrhizas have also been shown to promote
disease resistance in trees (reviewed in Whipps 2004).
When ECM assemblages (communities) on roots are assessed by
examining relative numbers on roots tips, they are generally dominated by a few
species accompanied by a long tail of less common species (Taylor 2002; Jonnson
et al. 1999; Peter et al. 2001). Cenococcum geophilum is known to be extremely
common on tree roots in temperate forests in Europe (Richard et al. 2005; Buee et
al. 2007; Courty et al. 2008 Gebhardt et al. 2007) and North America (Valentine
et al. 2004; Walker et al. 2005; Morris et al. 2008). Other species are known to be
highly competitive for space and nutrients; inter-species ectomycorrhizal
competition has become an area of recent focus in ECM research (Kennedy 2010;
Pickles et al. 2010; Peay et al. 2011). An example of competitive interactions
between ectomycorrhizas has been identified between the hypogeous species pair
Rhizopogon occidentalis and R. salebrosus. In this interaction R. salebrosus was
found to be competitively inferior to R. occidentalis, only being present on roots
that were not already colonised by R. occidentalis; indicating the timing of
colonization as having a strong effect on ECM success (Kennedy and Bruns
2005).
6.1.2 Quantifying and recording ectomycorrhizal fungi in forests
Traditionally, studies of ectomycorrhizas in forests recorded presence either by
sporocarp studies or by morphological identification of EM root tips, based on
descriptions of ECM morphotypes by Agerer (1997-2002), Ingleby et al. (1990),
Goodman et al. (2000) and others. Assessments of ECM diversity based on
sporocarps alone usually cannot adequately describe ECM communities, because
many species may sporulate irregularly or not at all. There may in fact, be little
265
correlation between above- and below-ground ECM communities; species that are
poorly-represented underground on roots may sporulate prolifically and may be
over-represented above-ground as sporocarps, and vice versa (Gardes and Bruns
1996; Dahlberg et al. 1997; Jonsson et al. 1999; Peter et al. 2001; Durall et al.
2006). In addition, it can be difficult to distinguish species using ECM
morphotyping methods (Sakakibara et al. 2002), because many described
morphotypes (Agerer 1997-2002) have not been identified to species, and because
different species may have similar morphology, such as ECM mantle structure
which can lead to mis-identification of some morphotypes (Sakakibara et al.
2002).
PCR-based methodology has allowed investigators to overcome many of
these problems in recent years, and has permitted researchers to examine in
greater detail the diversity, distribution and ecology of ectomycorrhizal
communities (Horton and Bruns 2001). Combining molecular methods with
traditional morphotyping may be the most time and cost effective method of
garnering information about the below-ground communities in forest ecosystems
(Sakakibara et al. 2002). Combinations of morphological and molecular methods
have been used to reveal extremely high species richness in forest ectomycorrhizal
communities (Jonsson et al. 1999; Tedersoo et al. 2006; Morris et al. 2008).
6.1.3 Ectomycorrhizal research in Ireland and other temperate countries
There have been relatively few studies carried out examining the diversity of
ectomycorrhizas on roots of forest trees in Ireland. Some studies carried out in
Ireland which examined ECM fungi on roots by morphological classification are
the examination of pure culture synthesis of Sitka spruce ectomycorrhizal in the
80s by Schild et al. (1988) and the study of Heslin et al. (1992) which examined
the ectomycorrhizas present on the roots of Sitka spruce in a plantation forest. The
Heslin et al. study found that the ECM richness of Sitka spruce plantations was
rather poor when compared to its richness in its home range (Alexander and
Watling 1987) and that it shared many of its ectomycorrhizas with other
coniferous tree species, thus indicating that it may have a generalist
ectomycorrhizal mycota in Irish plantations. The distribution of forest ECM
species on the roots of Dryas octopetala and other shrubs in the Burren, Western
266
Ireland, has been investigated by Harrington and Mitchell (2002a; 2002b; 2005a;
2005b) and Liston and Harrington (unpublished).
In the U.K., there have been many more published studies examining the
below-ground ectomycorrhizal component of forests, with many of the older
studies listed in Harley and Harley (1987). The study by Palfner et al. (2005),
identified 13 morphotypes on the roots of Sitka spruce trees in England, and
reasons such as the non-native status of Sitka spruce and the destructive short
rotation cycles were proposed for the low ectomycorrhizal richness and
dominance of the community by a single morphotype (Tylospora fibrillosa).
Taylor and Alexander (1989) carried out one of the first examinations of the
ectomycorrhizas in plantation Sitka spruce stands in the U.K. and found that of
the 17 morphotypes present, the Tylospora fibrillosa morphotype was very
abundant, colonizing almost 70% of root tips while the rest of the morphotypes
were much less abundant. Thomas et al. (1983) investigated the changes in ECM
assemblages that occur after outplanting from nurseries to forest sites. They found
24 ECM morphotypes present in their mature Sitka spruce plots, including C.
geophyllum, Russula ochroleuca, Laccaria amethystina, Lactarius rufus and
Paxillus involutus; with P. involutus, Russula ochroleuca and Lactarius rufus
being present on both mature and young trees, indicating a lack of successional
stage specificity in these species. All of these species, except Cenococcum
geophyllum, are also common above-ground in Sitka spruce forests in the U.K.
(Humphrey et al. 2000).
The ECM assemblages present in sessile oak forests have been examined
in France by Buee et al. (2007) and Courty et al. (2008). Buee et al. (2007) found
thirty six ectomycorrhizal morphotypes, of which the majority (12 morphotypes)
were from the genus Tomentella, with lesser numbers from the genera Lactarius
(four morphotypes) and Russula (five morphotypes). Their study also found that
ECM assemblages vary according to niche effects in the forest. They found that
morphotypes from the genera Lactarius and Tomentella were much more common
and abundant in coarse woody debris, while morphotypes from the genus Russula
were more common in the upper soil layers. Courty et al. (2008) examined the
same oak forest, and found that the four morphotypes, Lactarius quietus,
Tomentella sublilacina, Cenococcum geophyllum and an unidentified Russula
morphotype were very common throughout the samples. Although the above-
267
ground sporocarps were not examined in either of the two studies by Buee et al.
(2007) or Courty et al. (2008); the genera Russula and Lactarius are known to be
very species rich and abundant in similar forests in England (Hering 1966),
indicating that these genera may show similar levels of abundance and diversity
above- and below-ground. The genus Tomentella is rarely found as sporocarps in
the U.K. (Humphrey et al. 2003), because it forms minute fruiting bodies on
coarse woody debris and may often be overlooked.
The ECM assemblages of Scot’s pine forests were investigated in Scotland
by Pickles et al. (2010). They identified 24 different ECM morphotypes, the
majority (8 morphotypes) of which belonged to the genus Cortinarius, with 2
morphotypes from the genera Russula and Suillus (S. bovinus and S. variegatus)
also present. They found that Cenococcum geophyllum was one of the most
abundant ectomycorrhizas in the samples, being found in >98% of the samples.
The above-ground analysis of a similar site to the Pickles et al. (2010) site, carried
out by (Humphrey et al. 2000), found that Cortinarius species were the most
abundant followed by Russula and also the two Suillus species (S. bovinus and S.
variegatus).
268
6.2 Aims of this chapter
The aims of this chapter are:
• To examine if the ECM assemblage of the oak, Scot’s pine and Sitka spruce
forests vary significantly. It is expected that plots of the same forest type
would be more similar than plots of a different forest type based on their
ECM assemblages. It may also be expected that certain ECM morphotypes
would be much more common and possibly semi-restricted to a single forest
type in this study and thus may have potential for use as indicator species of a
certain forest type.
• To examine if there is a relationship between above- and below-ground
species richness. A plot that is very species rich in ECM sporocarps might be
expected to have high levels of below-ground ECM morphotype richness.
• To investigate if the ECM assemblage present in Sitka spruce forests shares
many ECM morphotypes in common with oak and Scot’s pine forests. Sitka
spruce is known to be an ECM generalist in the UK with many known ECM
associates but few species restricted to spruce (Newton and Haigh 1998).

269
6.3 Methods
6.3.1 The plots
The three forest types were composed of (1) oak - four plots, Raheen, Tomies,
Kilmacrea (Q. petraea) and Abbeyleix (Quercus robur); (2) Scot’s pine Pinus
sylvestris – four plots Annagh, Brittas, Torc and Bansha; (3) Sitka spruce Picea
sitchensis – four plots Dooary, Bohatch, Chevy Chase (Young) and Chevy Chase
mature . Full details of the plots are given in Table 3.2, Section 3.3.1.
6.3.2 Sampling and enumeration
The sampling method was adapted from the intensive method of ECM sampling
and anlaysis employed by Menkis et al. (2005) in that it examined a large number
of roots from a small number of plants. A total of five soil cores, one from each
sub-plot, were taken from the upper soil layer in each plot using a 10cm diameter
soil corer which measured 15cm in length. The samples were kept at 4ºC until
counting and analysis could be undertaken. The cores were soaked in tap water for
15 min and washed through a 1mm sieve. Senescent roots, coarse woody debris
and large root segments were removed manually. The remaining roots were cut
into 2cm segments and divided randomly into 6 sub-samples, each in a separate
petri-dish. The length of the ECM roots in each petri dish was estimated using the
line intersect method (Tenant 1975). Each petri dish was examined at 30x
magnification using a Nikon stereo microscope and morphologically similar
morphotypes were distinguished. Morphotype richness (per plot) is the number of
distinct ectomycorrhizal morphotypes recorded from the 30 sub-samples (5 cores
x 6 sub-samples per core) taken from the plot. Morphotype abundance was
estimated in two ways:
(i) Morphotype abundance per forest type; the number of appearances of the
morphotype in the sub-sample from each forest type.
(ii) % frequency (per plot); this was calculated as:
Presence of the morphotype in 30 subsamples/30
* 100 = % frequency of morphotype in a plot
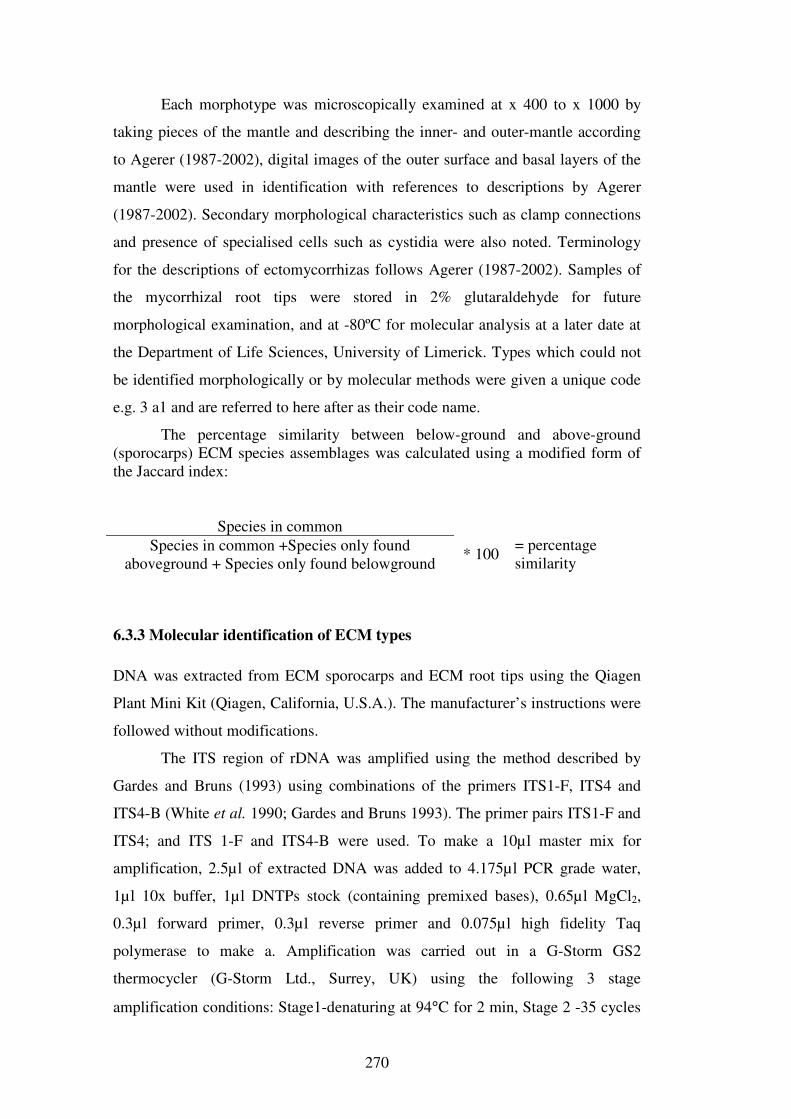
270
Each morphotype was microscopically examined at x 400 to x 1000 by
taking pieces of the mantle and describing the inner- and outer-mantle according
to Agerer (1987-2002), digital images of the outer surface and basal layers of the
mantle were used in identification with references to descriptions by Agerer
(1987-2002). Secondary morphological characteristics such as clamp connections
and presence of specialised cells such as cystidia were also noted. Terminology
for the descriptions of ectomycorrhizas follows Agerer (1987-2002). Samples of
the mycorrhizal root tips were stored in 2% glutaraldehyde for future
morphological examination, and at -80ºC for molecular analysis at a later date at
the Department of Life Sciences, University of Limerick. Types which could not
be identified morphologically or by molecular methods were given a unique code
e.g. 3 a1 and are referred to here after as their code name.
The percentage similarity between below-ground and above-ground (sporocarps) ECM species assemblages was calculated using a modified form of the Jaccard index:
Species in common
* 100 = percentage similarity
Species in common +Species only found aboveground + Species only found belowground
6.3.3 Molecular identification of ECM types
DNA was extracted from ECM sporocarps and ECM root tips using the Qiagen
Plant Mini Kit (Qiagen, California, U.S.A.). The manufacturer’s instructions were
followed without modifications.
The ITS region of rDNA was amplified using the method described by
Gardes and Bruns (1993) using combinations of the primers ITS1-F, ITS4 and
ITS4-B (White et al. 1990; Gardes and Bruns 1993). The primer pairs ITS1-F and
ITS4; and ITS 1-F and ITS4-B were used. To make a 10µl master mix for
amplification, 2.5µl of extracted DNA was added to 4.175µl PCR grade water,
1µl 10x buffer, 1µl DNTPs stock (containing premixed bases), 0.65µl MgCl2,
0.3µl forward primer, 0.3µl reverse primer and 0.075µl high fidelity Taq
polymerase to make a. Amplification was carried out in a G-Storm GS2
thermocycler (G-Storm Ltd., Surrey, UK) using the following 3 stage
amplification conditions: Stage1-denaturing at 94°C for 2 min, Stage 2 -35 cycles
271
of denaturation @ 94°C for 15 seconds, annealing @ 55°C for 30 seconds,
elongation @ 72°C for 60 seconds; Stage 3 -final elongation @ 72°C for 7 min
The resulting amplicon was visualized on a 2% Sybr-Safe agarose gel and
examined under ultraviolet light.
For RFLP analysis of the samples, the PCR fragments were digested with
the restriction endonucleases AluI and HinfI (Roche Applied Sciences, West
Sussex, U.K.). 10µl of amplified PCR product was incubated for 1.0 h with 1.5µl
of 10x buffer (supplied with restriction enzyme), 8.4µl PCR grade water and 0.1µl
restriction enzyme, at the specified temperature (AluI and HinfI 37ºC; Taq1 65ºC).
The resulting PCR-RFLP fragments were separated on a 2% Sybr-Safe agarose
gel with a negative control. The molecular sizes of the fragments were calculated
using the band analysis feature of the GeneTools software (Syngene UK,
Cambridge UK.) and recorded by measurement against a DNA molecular weight
marker (DNA molecular weight marker VIII, Roche Applied Sciences, West
Sussex, U.K.). This information was then entered into a database using the GERM
(Good Enough RFLP Matcher) excel tool (Dickie et al. 2003). Matches between
sporocarps and ectomycorrhizal tips were calculated using the recommended
settings for matches as advocated by Dickie et al. (2003); backward and forward
matches of the bands were accepted only if the molecular weights were within 25
base pairs (bp) of each other. If the sum of the differences between observed and
expected bands exceeds 100 bp, then the samples were not a match.
Sequencing of amplicons: PCR products were purified prior to sequencing
using the QiaQuick PCR purification kit (Qiagen, California, U.S.A). All
ectomycorrhizal samples that amplified were sent for sequencing to Eurofins
MWG Operon, London, U.K. The resulting sequences were entered into Bio-Edit
Software (Hall 1999) and all sequences were compared to identify matches with
the optimal global alignment option and their identity similarity index was
calculated according to the “IDENTIFY” matrix. Sequences with similarity values
greater than 0.98 were accepted as the same species. The identify matrix setting
was used because it has high penalties for mis-matches (BIOedit manual; Hall
2005) and is therefore useful for separating species within the same genus. The
un-edited sequence data was entered into the UNITE data base (Koljalg et al.
2005) and a Blast-n search was carried out using both the UNITE database and the
272
Genbank database. Sequences with identities above 98% were treated as species-
level matches, while identification at the genus level was based on Blast
consensus of over 90% (Barroetavena et al. 2010). The name suggested by
UNITE, a curated database for ECM fungi (Koljalg et al. 2005) was used
preferentially, and that of Genbank only if there was no entry in UNITE.
6.3.4 Statistical analysis
ANOVA with Tukey's post-hoc test was used to identify any significant
differences in the mean morphotype richness and mean morphotype abundance
between the forest types and individual forest plots.
Rarefaction and morphotype richness estimation
The length of roots sampled was used to compare the morphotype richness of the
different forest types at a similar sampling intensity, sample-based rarefaction
curves with 95% confidence intervals were calculated, using the computer
program EstimateS (Colwell 2004). The settings for the rarefaction analysis are
the same as those used in Section 4.3.4 Chapter 4, except that one thousand
permutations were carried out on the core data from the individual plots within a
specific forest type. Sample-based rarefaction was used instead of individual-
based rarefaction as fungal species have been shown to be non-randomly
distributed (Taylor 2002; Tedersoo et al. 2003).
Possible levels of morphotype richness were estimated using the Chao2,
Ace and Ice estimators. The settings for the richness estimation are the same as
those used in Section 4.3.4, Chapter 4. Rareness parameter was defined at 2; i.e.
any morphotype that was found in less than 2 cores was defined as rare.
Fungal species diversity was estimated using the species richness
estimators in EstimateS. The Simpson’s diversity and Simpson’s evenness
measure was calculated for each forest type. The settings used were similar to
those used in Section 4.3.5, Chapter 4.
6.3.5 Community similarity analysis
To assess relative ECM distributions within the forest type communities, rank
abundance plots (Whittaker 1965) were constructed following Magurran (2004).
The relative frequency of MorphotypeX in forest typen was calculated as:
273
=Number of appearances of MorphotypeX in all sub-samples in forest typen / Number of appearances of all Morphotypes in all sub-samples in forest typen. The fitting of log-normal distribution model was carried out as in Section 5.3.5,
Chapter 5.
To analyse the ECM community similarity between the different sites, the
abundance-based Jaccard similarity index (Chao et al. 2005) was calculated in
Estimate-S. Median values for the Jaccard index (JI) were calculated by pooling
the index values for individual sites based on tree type. Median JI values and the
minimum and maximum values were calculated within forest types and between
forest types.
To test if the fungal communities were similar above- and below-ground,
the data from the plots which were sampled for sporocarps and ECM roots was
analysed using a Mantel test. The above-ground species plot matrix consisted of
the sub-plot frequency (Section 5.3.5) data for 81 ECM species from 12 plots,
while the below-ground species plot matrix consisted of morphotype abundance
data for 56 morphotypes from the same plots. Similarity matrixes were created
using the Sørenson distance index and were compared using PC-Ord and
evaluated for significant using a Monte Carlo test with 9999 randomizations.
6.3.6 Multivariate community analysis
Nonmetric multidimensional scaling (NMS) was used to examine the relationship
between the different ECM assemblages. MRPP was used to assess whether the
ECM assemblages would group significantly according to dominant tree type. The
settings used for NMS in this chapter are identical to those used in Section 5.3.6,
Chapter 5. NMS was run on the morphotype abundance (% frequency) data from
all of the cores from each site thus producing a 51 x 12 species by plot matrix
using PC-Ord version 4.36 (MjM Software Design, Gleneden Beach, OR). A
statistical technique called Beals’ smoothing (Beals 1984) was carried out on the
ECM abundance matrix following the advice of McCune and Grace (2002) in
order to lessen the effect of zeros on the ordination. Beals’ smoothing is a
technique used to replace zero values in an ecological matrix with “probability of
occurrence” values calculated from the joint occurrences of the target species at a

274
given plot with the remaining species in the data table (Caceres and Legendre
2008).
275
6.4 Results
6.4.1 ECM morphotypes
In total 51 distinct morphotypes were collected from 12 forest plots (Table 6.4).
This included 16 morphotypes identified solely by morphotyping methods, 3
morphotype identified by RFLP, 17 morphotypes identified by sequencing and 15
morphotypes remaining unidentified. Twenty-one ECM types were found in oak,
20 in Scot’s pine and 18 in Sitka spruce.
Morphotyping of unknown ectomycorrhizal types
A total of 15 ECM types could not be identified to genus level and so were given
a code name. Both morphological and RFLP analysis allowed for the separation
of these types into their own morphotypes, but it was not possible to assign them
to genera or species either by RFLP-matching of sporocarps or sequencing of the
ITS region. The 15 types are described in the following section with
corresponding Figs. 1-36 available in Unidentified ECM folder, within Folder 4 in
attached disk in Appendix. The final three descriptions given in this section are of
identified ECM morphotypes that do not currently have descriptions in either
Agerer (1987-2002) or BCERN
Morphotype: 3a7 (Fig. 1; Appendix) Forest type: oak Morphology: White/beige colour, smooth texture with monopodial pinnate branching. Extramatrical hyphae inconspicuous; rhizomorphs absent.. Mantle anatomy: The mantle plectenchymatous with hyphae irregularly arranged; corresponding to mantle type B in Agerer’s types. No other microscopically distinguishing features were noted. Possible identification: Resembles Cantharellus cibarius morphotype. Morphotype: 3b7 (Fig. 2) Forest type: Oak Morphology: White weblike structure on a crème backround. Cottony texture with monopodial pinnate branching of the ectomycorrhiza. Mantle anatomy: The mantle was plectenchymatous with ring like arrangement of the hyphal bundles matching Agerer’s type A mantle. Possible identification: Possibly a Hebeloma species
276
Morphotype: 3c7 (Figs. 3, 4) Forest type: Oak Morphology: Light brown colour with a smooth texture. Short monopodial pinnate branching of the ectomycorrhiza give the morphotype a clumped structure. Mantle anatomy: Mantle was pseudoparencyhmatous made up of epidermoid cells creating a jig-saw like pattern. It corresponded to mantle type M according to Agerer’s types. Morphotype: 3c9 (Figs. 5, 6) Forest type: Sitka spruce Morphology: The ectomycorrhiza was grey in colour and had a felty appearance. It displayed monopodial pinnate branching and due to copious amounts of fine hyphal strands it held many soil particles in a hyphal mesh. Mantle anatomy: The mantle was plectenchymatous with the hyphae irregularly arranged and corresponded to mantle type B in Agerer’s types. No other microscopically distinguishing features were noted. Morphotype: 3e7 (Figs. 7, 8, 9) Forest type: Oak Morphology: This ectomycorrhiza had a golden colouring and due to abundant fine hyphal strands had a cottony appearance. It appeared to be dichotomously branched. Mantle anatomy: The inner mantle was plectenchymatous with the hyphae irregularly arranged and corresponded to mantle type B in Agerer’s types. The outer mantle was also plectenchymatous but with the hyphae arranged into ring like bundles corresponding to Agerer’s type A mantle. Morphotype: 3e9 (Figs. 10, 11, 12) Forest type: Sitka spruce Morphology: The morphotype colour was very light brown with a smooth texture. It showed monopodial pinnate branching with a twisted appearance to the individual branches. Mantle anatomy: The mantle was transitional between plectenchymatous and pseudoparenchymatous and matched Agerer’s type H mantle. Possible identification: Resembles a Laccaria species. Morphotype: 4c1 (Figs. 13, 14, 15) Forest type: Scot’s pine Morphology: The morphotype was dark brown in colour and had a smooth outer texture. It showed monopodial pinnate branching with the branches forming close together and giving the ectomycorrhiza a clustered appearance. . Mantle anatomy: Both the inner and outer mantles were pseudoparenchymatous with the former being composed of angular cells and the latter being composed of epidermoid cells. The two types corresponded to Agerer’s types L and M mantles. Possible identification: Possibly a Tomentella species.
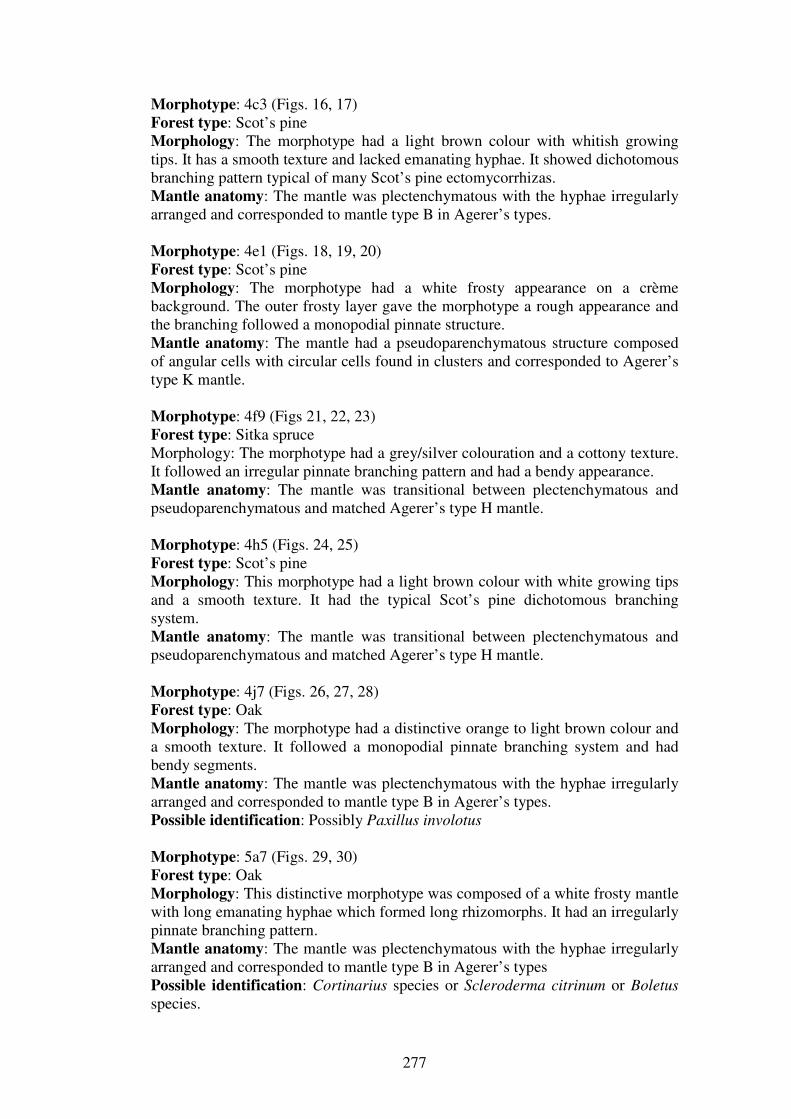
277
Morphotype: 4c3 (Figs. 16, 17) Forest type: Scot’s pine Morphology: The morphotype had a light brown colour with whitish growing tips. It has a smooth texture and lacked emanating hyphae. It showed dichotomous branching pattern typical of many Scot’s pine ectomycorrhizas. Mantle anatomy: The mantle was plectenchymatous with the hyphae irregularly arranged and corresponded to mantle type B in Agerer’s types. Morphotype: 4e1 (Figs. 18, 19, 20) Forest type: Scot’s pine Morphology: The morphotype had a white frosty appearance on a crème background. The outer frosty layer gave the morphotype a rough appearance and the branching followed a monopodial pinnate structure. Mantle anatomy: The mantle had a pseudoparenchymatous structure composed of angular cells with circular cells found in clusters and corresponded to Agerer’s type K mantle. Morphotype: 4f9 (Figs 21, 22, 23) Forest type: Sitka spruce Morphology: The morphotype had a grey/silver colouration and a cottony texture. It followed an irregular pinnate branching pattern and had a bendy appearance. Mantle anatomy: The mantle was transitional between plectenchymatous and pseudoparenchymatous and matched Agerer’s type H mantle. Morphotype: 4h5 (Figs. 24, 25) Forest type: Scot’s pine Morphology: This morphotype had a light brown colour with white growing tips and a smooth texture. It had the typical Scot’s pine dichotomous branching system. Mantle anatomy: The mantle was transitional between plectenchymatous and pseudoparenchymatous and matched Agerer’s type H mantle. Morphotype: 4j7 (Figs. 26, 27, 28) Forest type: Oak Morphology: The morphotype had a distinctive orange to light brown colour and a smooth texture. It followed a monopodial pinnate branching system and had bendy segments. Mantle anatomy: The mantle was plectenchymatous with the hyphae irregularly arranged and corresponded to mantle type B in Agerer’s types. Possible identification: Possibly Paxillus involotus Morphotype: 5a7 (Figs. 29, 30) Forest type: Oak Morphology: This distinctive morphotype was composed of a white frosty mantle with long emanating hyphae which formed long rhizomorphs. It had an irregularly pinnate branching pattern. Mantle anatomy: The mantle was plectenchymatous with the hyphae irregularly arranged and corresponded to mantle type B in Agerer’s types Possible identification: Cortinarius species or Scleroderma citrinum or Boletus species.
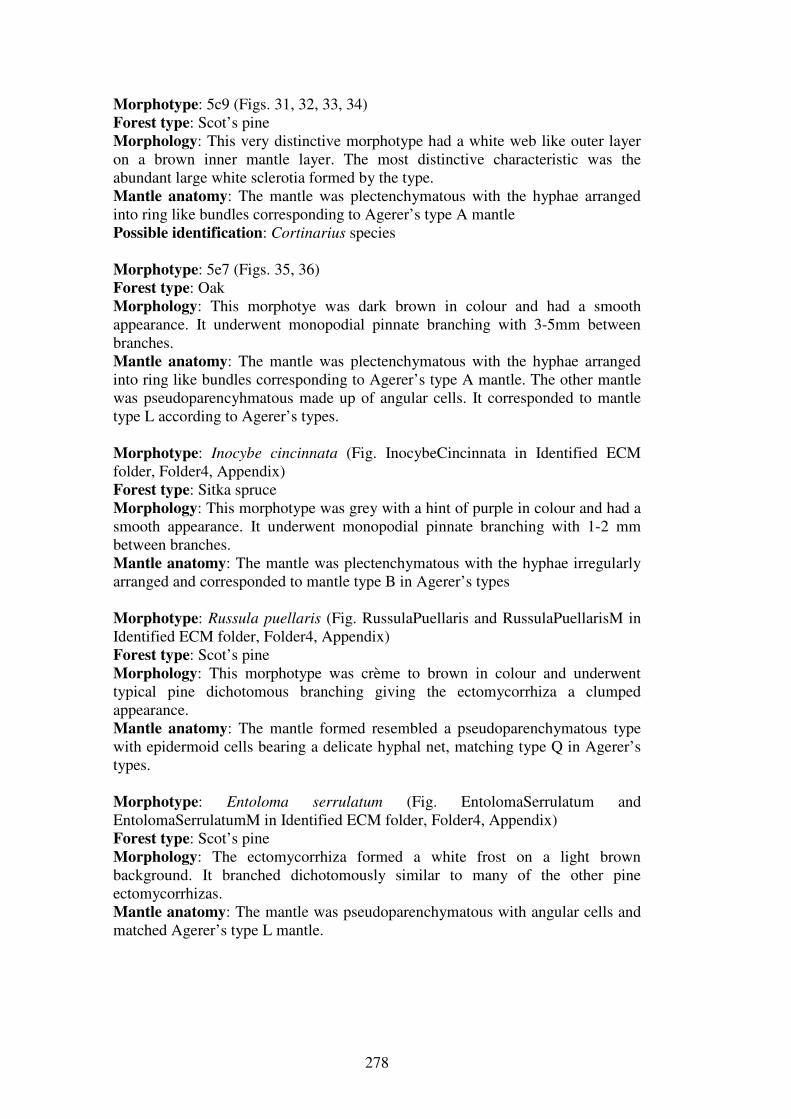
278
Morphotype: 5c9 (Figs. 31, 32, 33, 34) Forest type: Scot’s pine Morphology: This very distinctive morphotype had a white web like outer layer on a brown inner mantle layer. The most distinctive characteristic was the abundant large white sclerotia formed by the type. Mantle anatomy: The mantle was plectenchymatous with the hyphae arranged into ring like bundles corresponding to Agerer’s type A mantle Possible identification: Cortinarius species Morphotype: 5e7 (Figs. 35, 36) Forest type: Oak Morphology: This morphotye was dark brown in colour and had a smooth appearance. It underwent monopodial pinnate branching with 3-5mm between branches. Mantle anatomy: The mantle was plectenchymatous with the hyphae arranged into ring like bundles corresponding to Agerer’s type A mantle. The other mantle was pseudoparencyhmatous made up of angular cells. It corresponded to mantle type L according to Agerer’s types. Morphotype: Inocybe cincinnata (Fig. InocybeCincinnata in Identified ECM folder, Folder4, Appendix) Forest type: Sitka spruce Morphology: This morphotype was grey with a hint of purple in colour and had a smooth appearance. It underwent monopodial pinnate branching with 1-2 mm between branches. Mantle anatomy: The mantle was plectenchymatous with the hyphae irregularly arranged and corresponded to mantle type B in Agerer’s types Morphotype: Russula puellaris (Fig. RussulaPuellaris and RussulaPuellarisM in Identified ECM folder, Folder4, Appendix) Forest type: Scot’s pine Morphology: This morphotype was crème to brown in colour and underwent typical pine dichotomous branching giving the ectomycorrhiza a clumped appearance. Mantle anatomy: The mantle formed resembled a pseudoparenchymatous type with epidermoid cells bearing a delicate hyphal net, matching type Q in Agerer’s types. Morphotype: Entoloma serrulatum (Fig. EntolomaSerrulatum and EntolomaSerrulatumM in Identified ECM folder, Folder4, Appendix) Forest type: Scot’s pine Morphology: The ectomycorrhiza formed a white frost on a light brown background. It branched dichotomously similar to many of the other pine ectomycorrhizas. Mantle anatomy: The mantle was pseudoparenchymatous with angular cells and matched Agerer’s type L mantle.
279
RFLP –matching
A total of 35 ECM tips and 43 suspected ECM fruitbodies from the plots were
analysed using the restriction enzymes HinfI and AluI. The resulting restriction
fragments were visualised under ultraviolet light (Fig. 6.1). The molecular
weights of the resulting bands were calculated with reference to the standard
molecular weight marker MW VIII (Table 6.1). Using the GERM spreadsheet
based program, ECM tips were matched to similar tips and also to fruitbodies
based on their RFLP fragment lengths (Table 6.1). Morphotypes which were not
matched to fruitbodies by RFLP analysis were re-amplified and amplicons were
sequenced and sequences checked against online databases (Table 6.2).
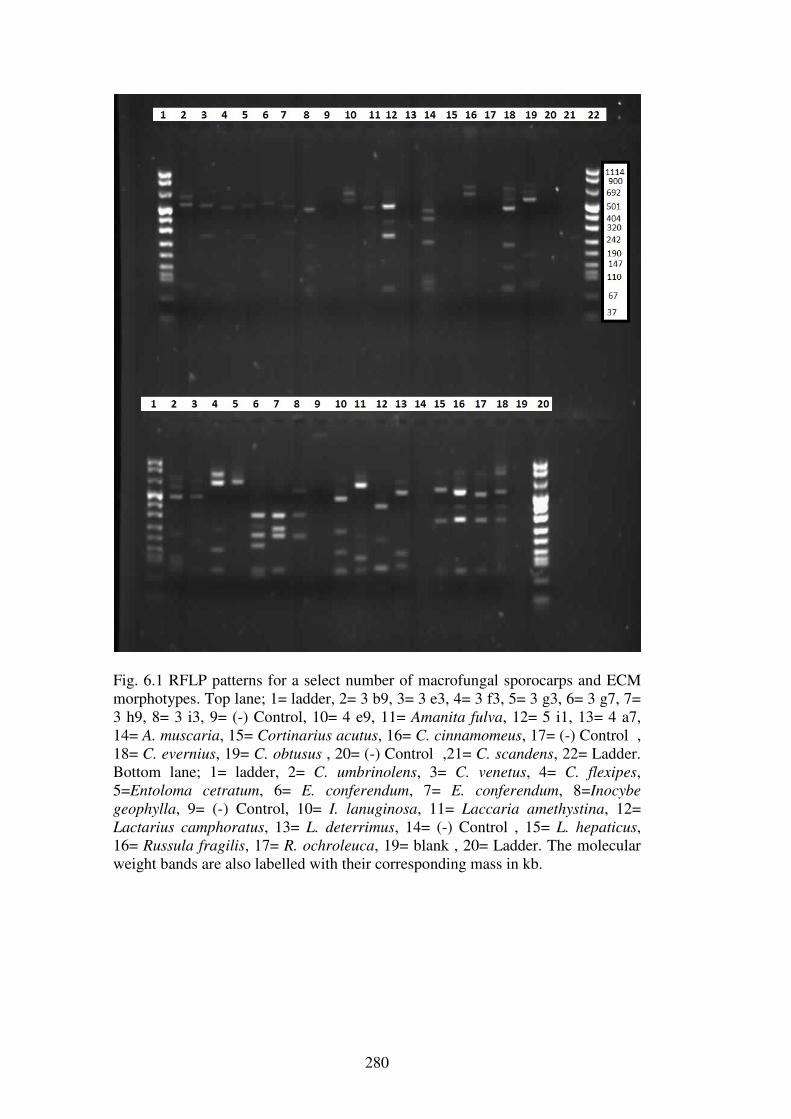
280
Fig. 6.1 RFLP patterns for a select number of macrofungal sporocarps and ECM morphotypes. Top lane; 1= ladder, 2= 3 b9, 3= 3 e3, 4= 3 f3, 5= 3 g3, 6= 3 g7, 7= 3 h9, 8= 3 i3, 9= (-) Control, 10= 4 e9, 11= Amanita fulva, 12= 5 i1, 13= 4 a7, 14= A. muscaria, 15= Cortinarius acutus, 16= C. cinnamomeus, 17= (-) Control , 18= C. evernius, 19= C. obtusus , 20= (-) Control ,21= C. scandens, 22= Ladder. Bottom lane; 1= ladder, 2= C. umbrinolens, 3= C. venetus, 4= C. flexipes, 5=Entoloma cetratum, 6= E. conferendum, 7= E. conferendum, 8=Inocybe
geophylla, 9= (-) Control, 10= I. lanuginosa, 11= Laccaria amethystina, 12= Lactarius camphoratus, 13= L. deterrimus, 14= (-) Control , 15= L. hepaticus, 16= Russula fragilis, 17= R. ochroleuca, 19= blank , 20= Ladder. The molecular weight bands are also labelled with their corresponding mass in kb.
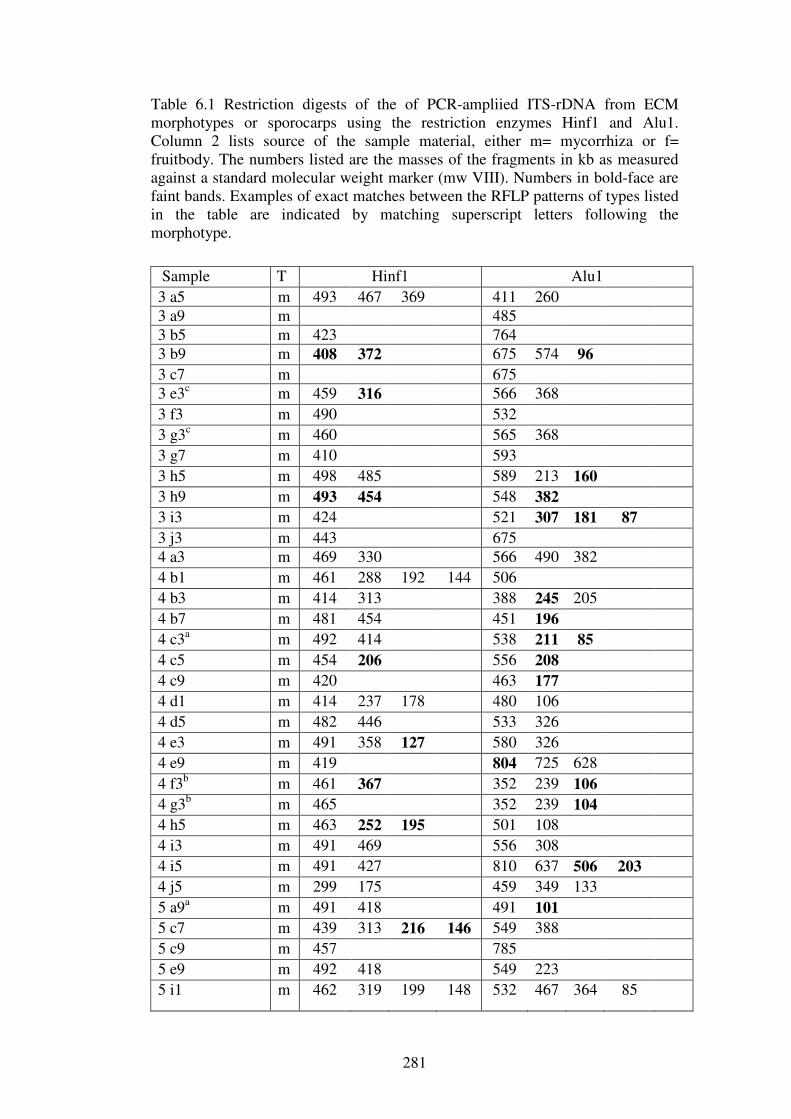
281
Table 6.1 Restriction digests of the of PCR-ampliied ITS-rDNA from ECM morphotypes or sporocarps using the restriction enzymes Hinf1 and Alu1. Column 2 lists source of the sample material, either m= mycorrhiza or f= fruitbody. The numbers listed are the masses of the fragments in kb as measured against a standard molecular weight marker (mw VIII). Numbers in bold-face are faint bands. Examples of exact matches between the RFLP patterns of types listed in the table are indicated by matching superscript letters following the morphotype.
Sample T Hinf1 Alu1
3 a5 m 493 467 369 411 260
3 a9 m 485
3 b5 m 423 764
3 b9 m 408 372 675 574 96
3 c7 m 675
3 e3c m 459 316 566 368
3 f3 m 490 532
3 g3c m 460 565 368
3 g7 m 410 593
3 h5 m 498 485 589 213 160
3 h9 m 493 454 548 382
3 i3 m 424 521 307 181 87
3 j3 m 443 675
4 a3 m 469 330 566 490 382
4 b1 m 461 288 192 144 506
4 b3 m 414 313 388 245 205
4 b7 m 481 454 451 196
4 c3a m 492 414 538 211 85
4 c5 m 454 206 556 208
4 c9 m 420 463 177
4 d1 m 414 237 178 480 106
4 d5 m 482 446 533 326
4 e3 m 491 358 127 580 326
4 e9 m 419 804 725 628
4 f3b m 461 367 352 239 106
4 g3b m 465 352 239 104
4 h5 m 463 252 195 501 108
4 i3 m 491 469 556 308
4 i5 m 491 427 810 637 506 203
4 j5 m 299 175 459 349 133
5 a9a m 491 418 491 101
5 c7 m 439 313 216 146 549 388
5 c9 m 457 785
5 e9 m 492 418 549 223
5 i1 m 462 319 199 148 532 467 364 85
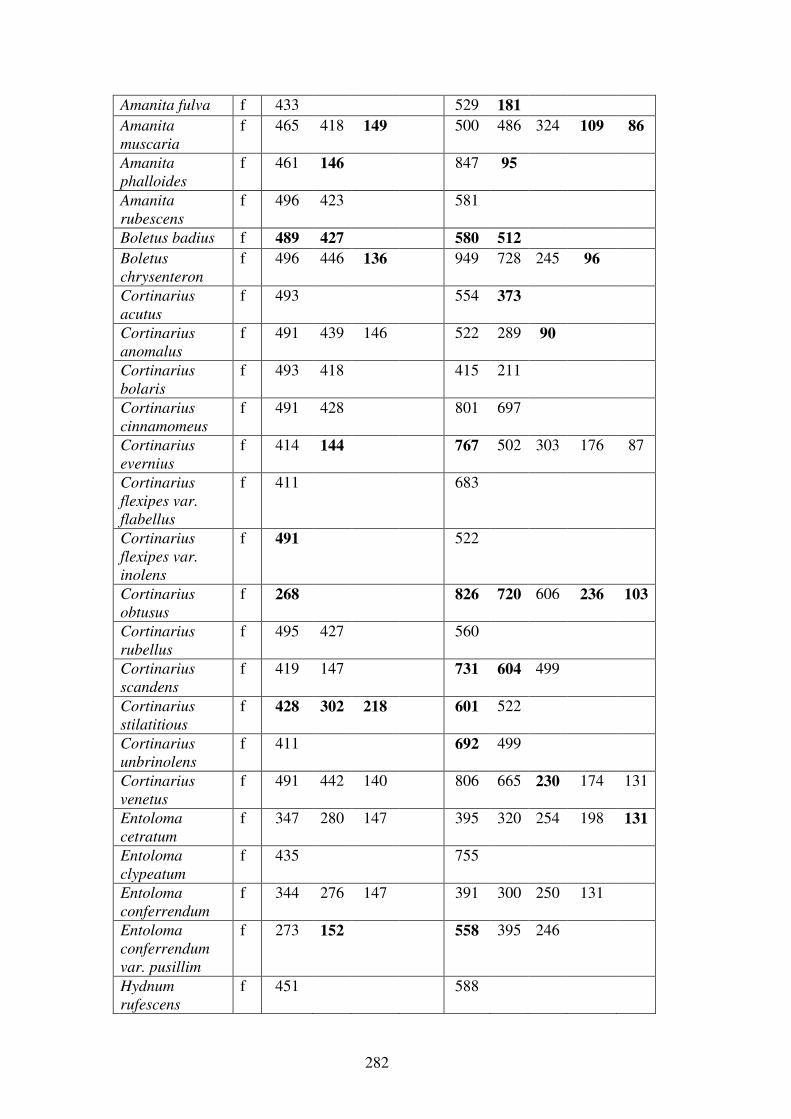
282
Amanita fulva f 433 529 181
Amanita
muscaria
f 465 418 149 500 486 324 109 86
Amanita
phalloides
f 461 146 847 95
Amanita
rubescens
f 496 423 581
Boletus badius f 489 427 580 512
Boletus
chrysenteron
f 496 446 136 949 728 245 96
Cortinarius
acutus
f 493 554 373
Cortinarius
anomalus
f 491 439 146 522 289 90
Cortinarius
bolaris
f 493 418 415 211
Cortinarius
cinnamomeus
f 491 428 801 697
Cortinarius
evernius
f 414 144 767 502 303 176 87
Cortinarius
flexipes var.
flabellus
f 411 683
Cortinarius
flexipes var.
inolens
f 491 522
Cortinarius
obtusus
f 268 826 720 606 236 103
Cortinarius
rubellus
f 495 427 560
Cortinarius
scandens
f 419 147 731 604 499
Cortinarius
stilatitious
f 428 302 218 601 522
Cortinarius
unbrinolens
f 411 692 499
Cortinarius
venetus
f 491 442 140 806 665 230 174 131
Entoloma
cetratum
f 347 280 147 395 320 254 198 131
Entoloma
clypeatum
f 435 755
Entoloma
conferrendum
f 344 276 147 391 300 250 131
Entoloma
conferrendum
var. pusillim
f 273 152 558 395 246
Hydnum
rufescens
f 451 588
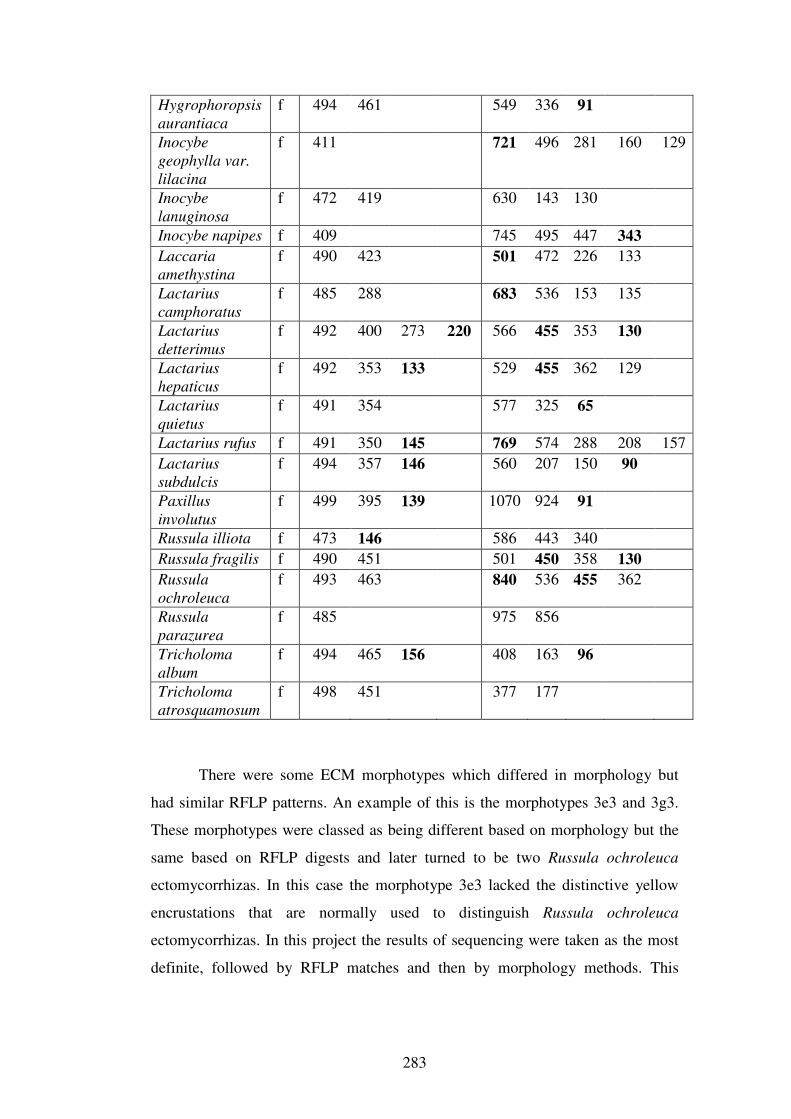
283
Hygrophoropsis
aurantiaca
f 494 461 549 336 91
Inocybe
geophylla var.
lilacina
f 411 721 496 281 160 129
Inocybe
lanuginosa
f 472 419 630 143 130
Inocybe napipes f 409 745 495 447 343
Laccaria
amethystina
f 490 423 501 472 226 133
Lactarius
camphoratus
f 485 288 683 536 153 135
Lactarius
detterimus
f 492 400 273 220 566 455 353 130
Lactarius
hepaticus
f 492 353 133 529 455 362 129
Lactarius
quietus
f 491 354 577 325 65
Lactarius rufus f 491 350 145 769 574 288 208 157
Lactarius
subdulcis
f 494 357 146 560 207 150 90
Paxillus
involutus
f 499 395 139 1070 924 91
Russula illiota f 473 146 586 443 340
Russula fragilis f 490 451 501 450 358 130
Russula
ochroleuca
f 493 463 840 536 455 362
Russula
parazurea
f 485 975 856
Tricholoma
album
f 494 465 156 408 163 96
Tricholoma
atrosquamosum
f 498 451 377 177
There were some ECM morphotypes which differed in morphology but
had similar RFLP patterns. An example of this is the morphotypes 3e3 and 3g3.
These morphotypes were classed as being different based on morphology but the
same based on RFLP digests and later turned to be two Russula ochroleuca
ectomycorrhizas. In this case the morphotype 3e3 lacked the distinctive yellow
encrustations that are normally used to distinguish Russula ochroleuca
ectomycorrhizas. In this project the results of sequencing were taken as the most
definite, followed by RFLP matches and then by morphology methods. This
284
means if samples appeared to be different morphologically but matched in their
RFLPs then they were taken to be the same morphotype.
Sequencing and online database comparisons
Poor sequences with small fragment lengths (<500 bases), did not show high
similarity when checked against the online databases (Table 6.2). A failed read is
defined as “when the number of bases is less than 100 after quality clipping is
carried out“ (Eurofins MWG 2011) and is set at this level due to quality controls
defined for the particular method of sequencing. If a sequence has less than 100
bases, then each mismatched base or missing base will reduce the overall
similarity of the match by a percentage point. Thirteen morphotypes were
identified to species level, with a further nine identified to genera. A total of nine
morphotypes from this project have their sequences added to the Genbank
database. These are Russula ochroleuca (HQ703019), Inocybe cincinnata
(HQ703020), Cortinarius obtusus (HQ703021), Tomentella sublilacina
(HQ703022), Lactarius hepaticus (HQ703023), Russula puellaris (HQ703024),
Tomentella badia (HQ703025), Pseudotomentella griseopergamacea
(HQ703026) and Suillus variegatus (HQ703027).

285
Table 6.2 Samples which were sequenced using the primer ITS1-F. All samples were first checked for sufficient (>98%) matches against the UNITE database. If no matches were found then the Genbank database was also searched. In some cases where the accession was locked for editing, the accession number was not available at the time of checking, and the accession number column is therefore marked with na (not available). In cases where the match is not very similar, the accession number is not given. e= sequence from ectomycorrhizal morphotypes, f= sequences from fruitbodies
Sample name Sequence
length
Closest
accession
match
Accession name Similarity
4i5 e 97 UDB001476 Amanita citrina 95%
3c5 e 567 na Amphinema sp. >90% (518
bits, e-148)
3g7 e 591 na Amphinema sp. >90% (601
bits, e-172)
Camarophyllopsis
atropuncta f
615 Camarophyllopsis spp. 91%
3f3 e 664 UDB000127 Cortinarius obtusus 99%
Cortinarius
rubellus f
661 UDB002427 Cortinarius rubellus 99%
Cortinarius
scandens f
142 Cortinarius (Telamonia
sp.)
92%
4d1 e 596 UDB000592 Entoloma serrulatum 98%
Entoloma
conferendum var.
pusillum f
786 GQ397990 Entoloma sp. cf cetratum 94%
3a9 e 824 AM882850 Inocybe cincinnata 99%
4 e3 e 665 UDB000861 Lactarius hepaticus 100%
Cordyceps
forquignoni f
638 AJ786562 Ophiocordyceps
forquignoni
99%
4g3 e 652 UDB001617 Pseudotomentella
griseopergamacea
99%
4d5 e 75 UDB000353 Russula caerulea 91%
Russula fellea f 834 UDB000110 Russula fellea 100%
Russula foetans f 806 DQ422024 Russula illiota 99%
3 e3 e 802 AY254880 Russula ochroleuca 99%
3g3 e 802 AY254880 Russula ochroleuca 99%
5i1 e 810 AY254880 Russula ochroleuca 99%
4a3 e 802 AY061709 Russula puellaris 99%
Russula fragilis f 27 UDB001637 Russula sardonia 84%
4j5 e 670 UDB000664 Suillus variegatus 100%
4b1 e 772 UDB001656 Tomentella badia 99%
3j3 e 719 UDB003349 Tomentella sublilacina 98%
3b5 e 56 Tylospora sp. 95%
There were also mismatches found after sequencing between
morphological identification, RFLP identifications and sequence identification.
Morphotype 3f3 was found to be Cortinarius obtusus according to sequencing of
286
the ITS region but this morphotype did not match the published description of
Agerer (1987-2002). The morphotype 3f3 was brown with a woolly texture.
Cortinarius obtusus in Agerer’s descriptions is white with many rhizomorphs. It is
likely that the morphotype 3f3 is an older sample of Cortinarius obtusus and thus
it has lost its distinctive colour and texture. An example of a mismatch between
RFLP and sequencing is found in the morphotype 4e3. Morphotype 4e3 was not
found to be a match to Lactarius hepaticus (sporocarp) through RFLP analysis but
it matched this species following sequencing and database searches.
Troubleshooting PCR and other molecular methods used.
Common problems encountered when carrying out PCR included non-
amplification of products, streaky products and contamination of genomic DNA
with DNA from multiple species. In order to solve the problem of non-
amplification of products, all extracted genomic DNA was run for 15 mins on an
agarose gel and visualised to identify if genomic DNA was present. In order to
test if the primers were functioning, the annealing temperature was lowered to
55ºC and genomic DNA was amplified. Lowering the annealing temperature
decreases the specificity of the primers and allows amplification of non-specific
products (Mc Phearson and Moller 2000). In order to reduce the streaking of
products, different concentrations of MgCl2 were tested until a satisfactory band
pattern was achieved. The problem of amplification of multiple samples of
genomic DNA was not solved by any methods. The band-stab method (Bjourson
and Cooper 1992) was attempted, but to no avail. As multiple ectomycorrhizas
can occupy the same root segment (Bruns 1995); amplification of multiple
products, or no products at all can be a common result. Effective sorting and
removal of extra ECM types was the only effective solution found for this
problem.
6.4.2 ECM richness and abundance in the forest types
Overall, 51 ECM morphotypes were collected from 12 forest plots of three forest
types (Table 6.4). Twenty-one ECM types were found in oak, 20 in Scot’s pine
and 18 in Sitka spruce. Two species, Cenococcum geophilum and Russula
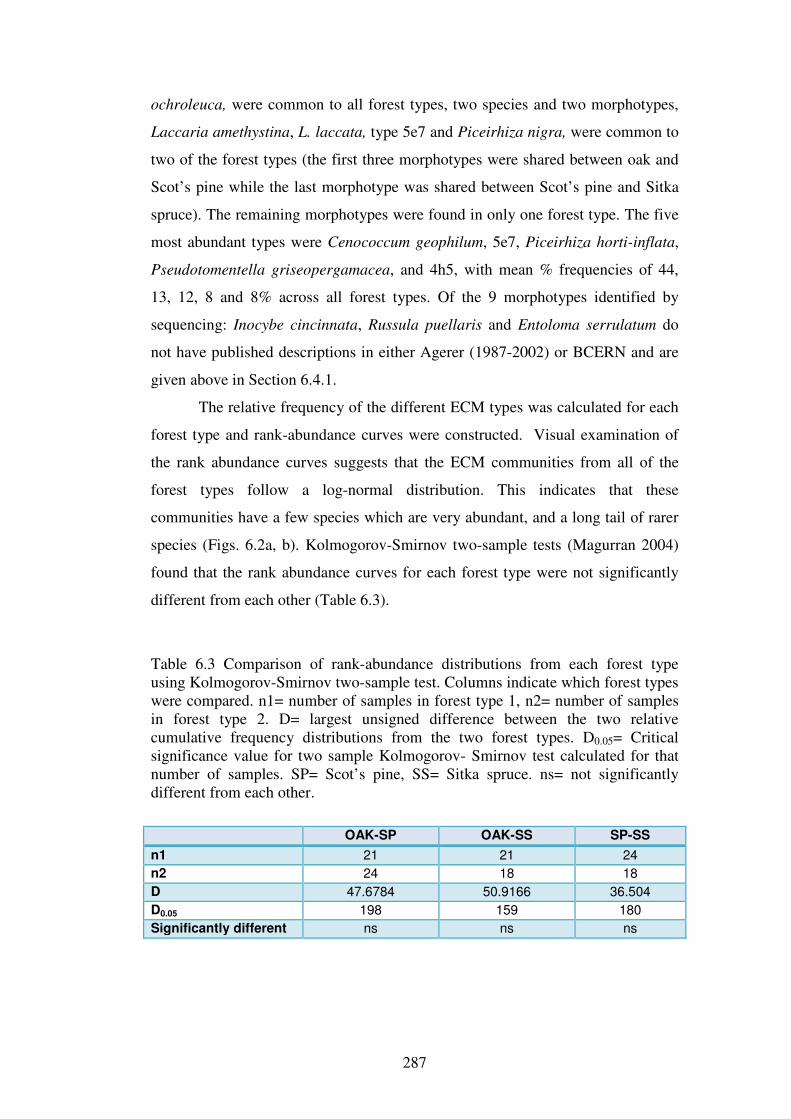
287
ochroleuca, were common to all forest types, two species and two morphotypes,
Laccaria amethystina, L. laccata, type 5e7 and Piceirhiza nigra, were common to
two of the forest types (the first three morphotypes were shared between oak and
Scot’s pine while the last morphotype was shared between Scot’s pine and Sitka
spruce). The remaining morphotypes were found in only one forest type. The five
most abundant types were Cenococcum geophilum, 5e7, Piceirhiza horti-inflata,
Pseudotomentella griseopergamacea, and 4h5, with mean % frequencies of 44,
13, 12, 8 and 8% across all forest types. Of the 9 morphotypes identified by
sequencing: Inocybe cincinnata, Russula puellaris and Entoloma serrulatum do
not have published descriptions in either Agerer (1987-2002) or BCERN and are
given above in Section 6.4.1.
The relative frequency of the different ECM types was calculated for each
forest type and rank-abundance curves were constructed. Visual examination of
the rank abundance curves suggests that the ECM communities from all of the
forest types follow a log-normal distribution. This indicates that these
communities have a few species which are very abundant, and a long tail of rarer
species (Figs. 6.2a, b). Kolmogorov-Smirnov two-sample tests (Magurran 2004)
found that the rank abundance curves for each forest type were not significantly
different from each other (Table 6.3).
Table 6.3 Comparison of rank-abundance distributions from each forest type using Kolmogorov-Smirnov two-sample test. Columns indicate which forest types were compared. n1= number of samples in forest type 1, n2= number of samples in forest type 2. D= largest unsigned difference between the two relative cumulative frequency distributions from the two forest types. D0.05= Critical significance value for two sample Kolmogorov- Smirnov test calculated for that number of samples. SP= Scot’s pine, SS= Sitka spruce. ns= not significantly different from each other.
OAK-SP OAK-SS SP-SS
n1 21 21 24 n2 24 18 18 D 47.6784 50.9166 36.504 D0.05 198 159 180 Significantly different ns ns ns
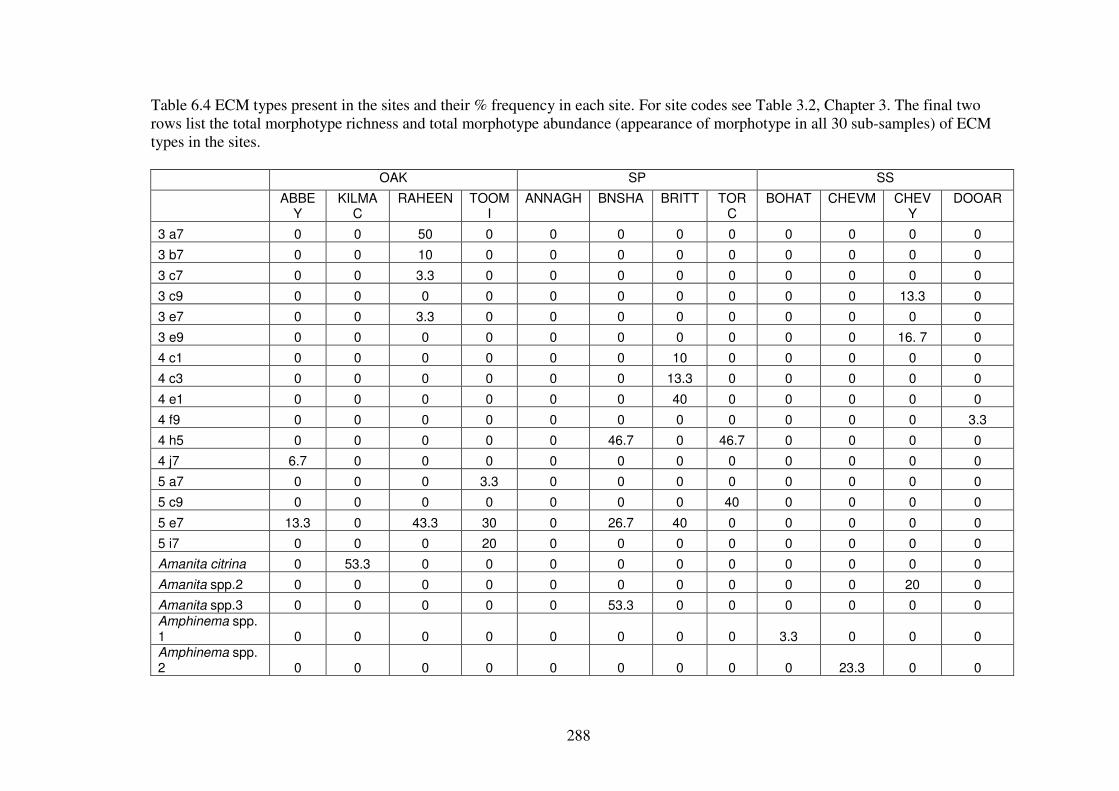
288
Table 6.4 ECM types present in the sites and their % frequency in each site. For site codes see Table 3.2, Chapter 3. The final two rows list the total morphotype richness and total morphotype abundance (appearance of morphotype in all 30 sub-samples) of ECM types in the sites. OAK SP SS
ABBEY
KILMAC
RAHEEN TOOMI
ANNAGH BNSHA BRITT TORC
BOHAT CHEVM CHEVY
DOOAR
3 a7 0 0 50 0 0 0 0 0 0 0 0 0
3 b7 0 0 10 0 0 0 0 0 0 0 0 0
3 c7 0 0 3.3 0 0 0 0 0 0 0 0 0
3 c9 0 0 0 0 0 0 0 0 0 0 13.3 0
3 e7 0 0 3.3 0 0 0 0 0 0 0 0 0
3 e9 0 0 0 0 0 0 0 0 0 0 16. 7 0
4 c1 0 0 0 0 0 0 10 0 0 0 0 0
4 c3 0 0 0 0 0 0 13.3 0 0 0 0 0
4 e1 0 0 0 0 0 0 40 0 0 0 0 0
4 f9 0 0 0 0 0 0 0 0 0 0 0 3.3
4 h5 0 0 0 0 0 46.7 0 46.7 0 0 0 0
4 j7 6.7 0 0 0 0 0 0 0 0 0 0 0
5 a7 0 0 0 3.3 0 0 0 0 0 0 0 0
5 c9 0 0 0 0 0 0 0 40 0 0 0 0
5 e7 13.3 0 43.3 30 0 26.7 40 0 0 0 0 0
5 i7 0 0 0 20 0 0 0 0 0 0 0 0
Amanita citrina 0 53.3 0 0 0 0 0 0 0 0 0 0
Amanita spp.2 0 0 0 0 0 0 0 0 0 0 20 0
Amanita spp.3 0 0 0 0 0 53.3 0 0 0 0 0 0 Amphinema spp. 1 0 0 0 0 0 0 0 0 3.3 0 0 0 Amphinema spp. 2 0 0 0 0 0 0 0 0 0 23.3 0 0
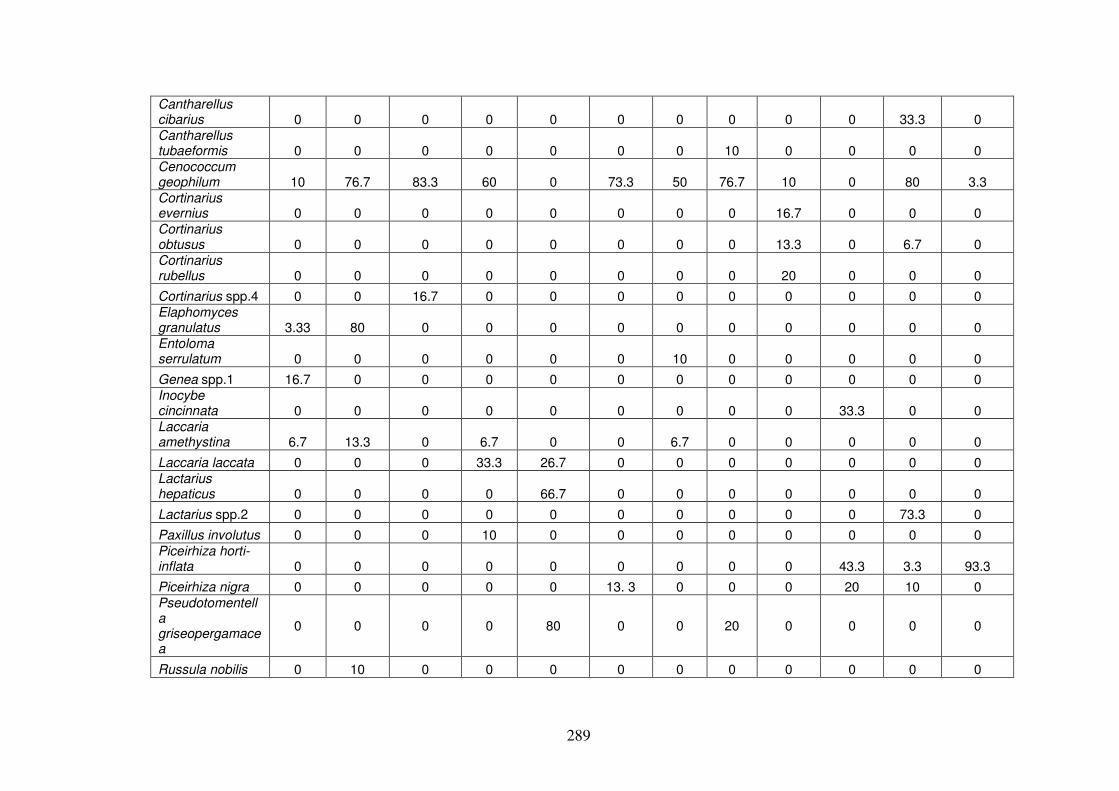
289
Cantharellus cibarius 0 0 0 0 0 0 0 0 0 0 33.3 0 Cantharellus tubaeformis 0 0 0 0 0 0 0 10 0 0 0 0 Cenococcum geophilum 10 76.7 83.3 60 0 73.3 50 76.7 10 0 80 3.3 Cortinarius evernius 0 0 0 0 0 0 0 0 16.7 0 0 0 Cortinarius obtusus 0 0 0 0 0 0 0 0 13.3 0 6.7 0 Cortinarius rubellus 0 0 0 0 0 0 0 0 20 0 0 0
Cortinarius spp.4 0 0 16.7 0 0 0 0 0 0 0 0 0 Elaphomyces granulatus 3.33 80 0 0 0 0 0 0 0 0 0 0 Entoloma serrulatum 0 0 0 0 0 0 10 0 0 0 0 0
Genea spp.1 16.7 0 0 0 0 0 0 0 0 0 0 0 Inocybe cincinnata 0 0 0 0 0 0 0 0 0 33.3 0 0 Laccaria amethystina 6.7 13.3 0 6.7 0 0 6.7 0 0 0 0 0
Laccaria laccata 0 0 0 33.3 26.7 0 0 0 0 0 0 0 Lactarius hepaticus 0 0 0 0 66.7 0 0 0 0 0 0 0
Lactarius spp.2 0 0 0 0 0 0 0 0 0 0 73.3 0
Paxillus involutus 0 0 0 10 0 0 0 0 0 0 0 0 Piceirhiza horti-inflata 0 0 0 0 0 0 0 0 0 43.3 3.3 93.3
Piceirhiza nigra 0 0 0 0 0 13. 3 0 0 0 20 10 0 Pseudotomentella griseopergamacea
0 0 0 0 80 0 0 20 0 0 0 0
Russula nobilis 0 10 0 0 0 0 0 0 0 0 0 0
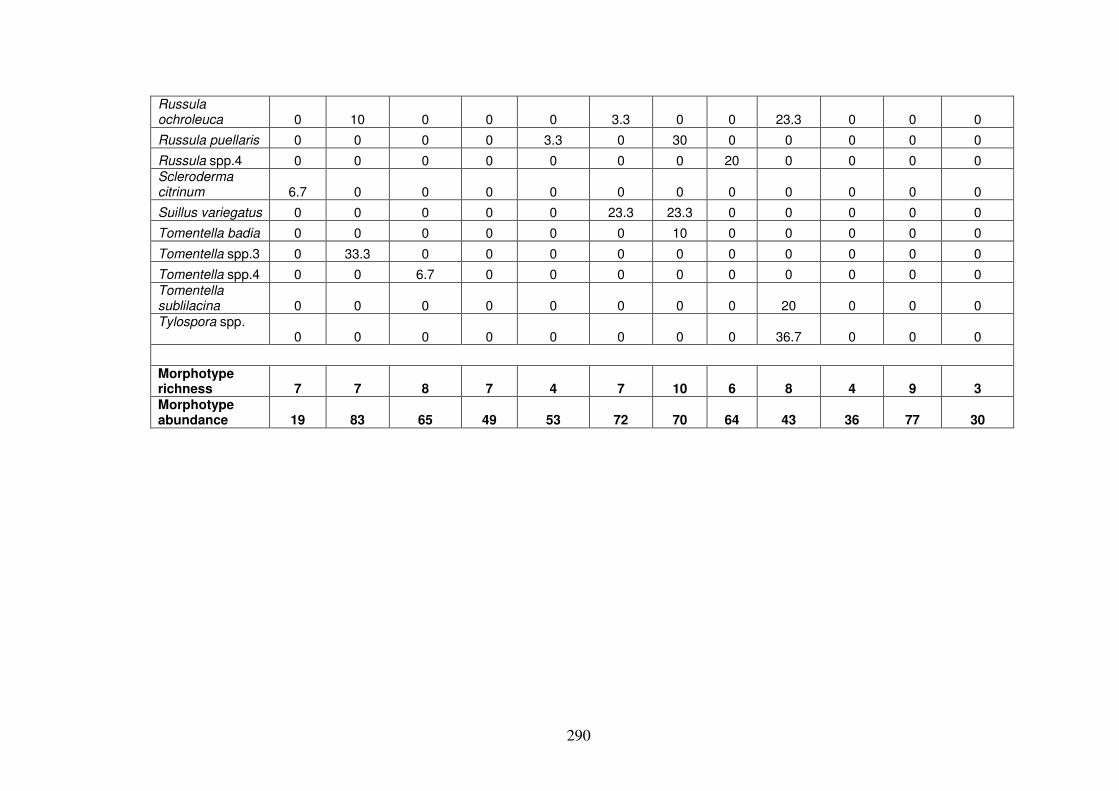
290
Russula ochroleuca 0 10 0 0 0 3.3 0 0 23.3 0 0 0
Russula puellaris 0 0 0 0 3.3 0 30 0 0 0 0 0
Russula spp.4 0 0 0 0 0 0 0 20 0 0 0 0 Scleroderma citrinum 6.7 0 0 0 0 0 0 0 0 0 0 0
Suillus variegatus 0 0 0 0 0 23.3 23.3 0 0 0 0 0
Tomentella badia 0 0 0 0 0 0 10 0 0 0 0 0
Tomentella spp.3 0 33.3 0 0 0 0 0 0 0 0 0 0
Tomentella spp.4 0 0 6.7 0 0 0 0 0 0 0 0 0 Tomentella sublilacina 0 0 0 0 0 0 0 0 20 0 0 0 Tylospora spp. 0 0 0 0 0 0 0 0 36.7 0 0 0
Morphotype richness 7 7 8 7 4 7 10 6 8 4 9 3
Morphotype abundance 19 83 65 49 53 72 70 64 43 36 77 30
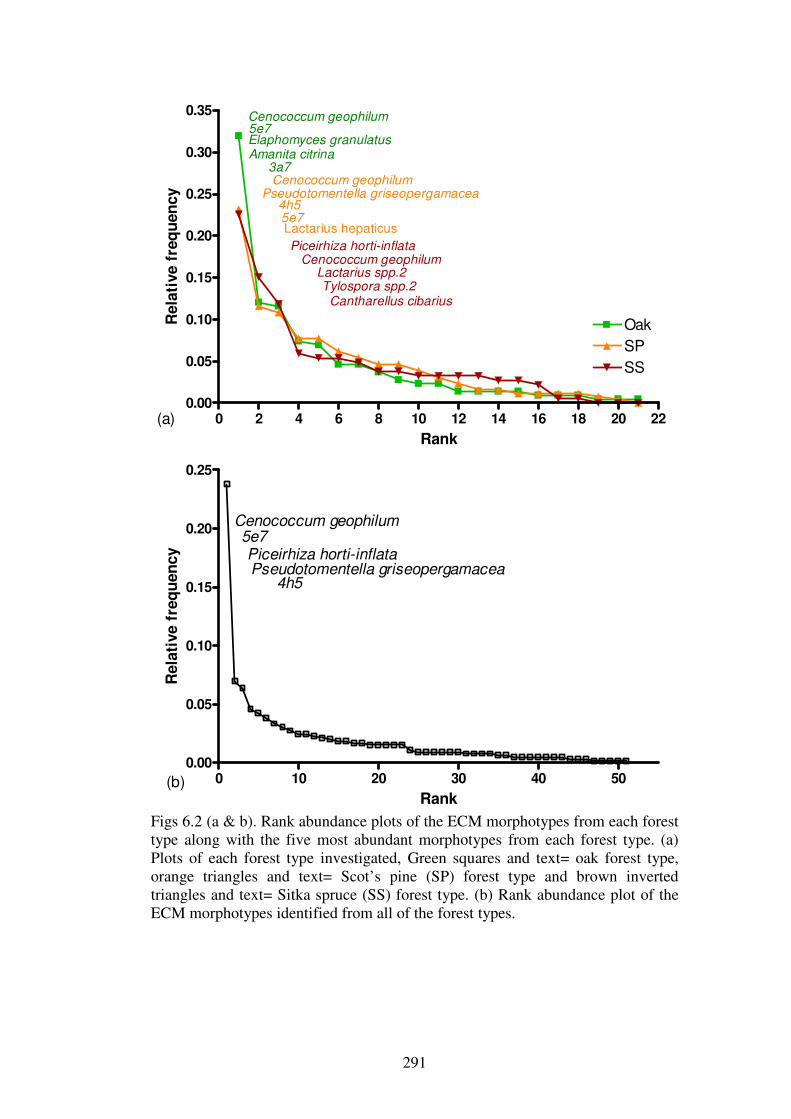
291
0 2 4 6 8 10 12 14 16 18 20 220.00
0.05
0.10
0.15
0.20
0.25
0.30
0.35
OakSPSS
Cenococcum geophilum5e7Elaphomyces granulatusAmanita citrina
3a7Cenococcum geophilum
Pseudotomentella griseopergamacea4h55e7Lactarius hepaticusPiceirhiza horti-inflata
Cenococcum geophilumLactarius spp.2Tylospora spp.2
Cantharellus cibarius
Rank
Rela
tive f
req
uen
cy
0 10 20 30 40 500.00
0.05
0.10
0.15
0.20
0.25
Cenococcum geophilum5e7Piceirhiza horti-inflataPseudotomentella griseopergamacea
4h5
Rank
Rela
tive f
req
uen
cy
(a)
(b)
Figs 6.2 (a & b). Rank abundance plots of the ECM morphotypes from each forest type along with the five most abundant morphotypes from each forest type. (a) Plots of each forest type investigated, Green squares and text= oak forest type, orange triangles and text= Scot’s pine (SP) forest type and brown inverted triangles and text= Sitka spruce (SS) forest type. (b) Rank abundance plot of the ECM morphotypes identified from all of the forest types.

292
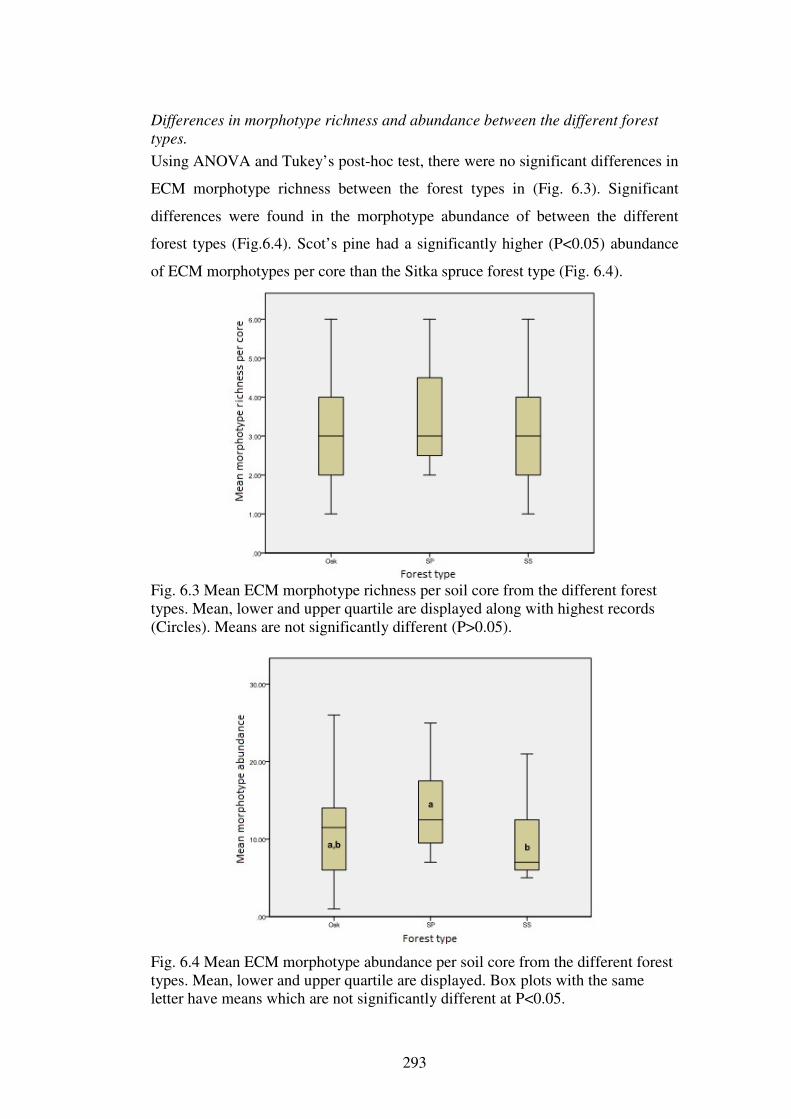
293
Differences in morphotype richness and abundance between the different forest
types.
Using ANOVA and Tukey’s post-hoc test, there were no significant differences in
ECM morphotype richness between the forest types in (Fig. 6.3). Significant
differences were found in the morphotype abundance of between the different
forest types (Fig.6.4). Scot’s pine had a significantly higher (P<0.05) abundance
of ECM morphotypes per core than the Sitka spruce forest type (Fig. 6.4).
Fig. 6.3 Mean ECM morphotype richness per soil core from the different forest types. Mean, lower and upper quartile are displayed along with highest records (Circles). Means are not significantly different (P>0.05).
Fig. 6.4 Mean ECM morphotype abundance per soil core from the different forest types. Mean, lower and upper quartile are displayed. Box plots with the same letter have means which are not significantly different at P<0.05.
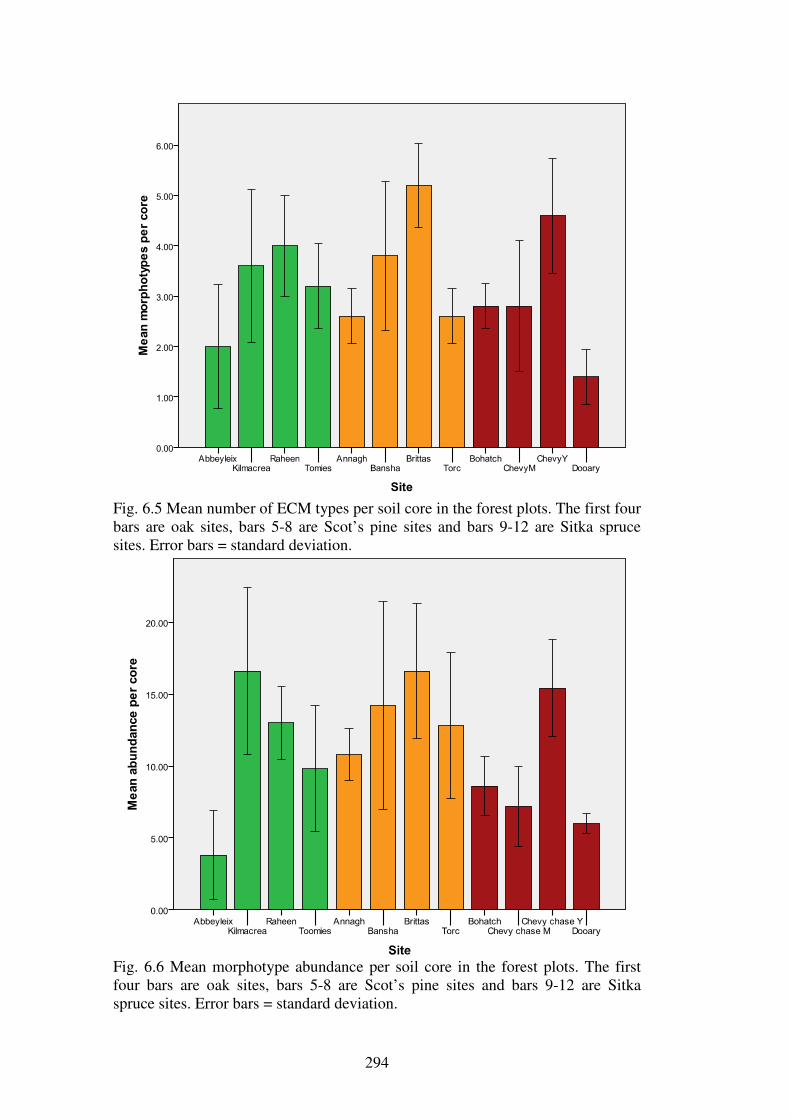
294
Fig. 6.5 Mean number of ECM types per soil core in the forest plots. The first four bars are oak sites, bars 5-8 are Scot’s pine sites and bars 9-12 are Sitka spruce sites. Error bars = standard deviation.
Fig. 6.6 Mean morphotype abundance per soil core in the forest plots. The first four bars are oak sites, bars 5-8 are Scot’s pine sites and bars 9-12 are Sitka spruce sites. Error bars = standard deviation.
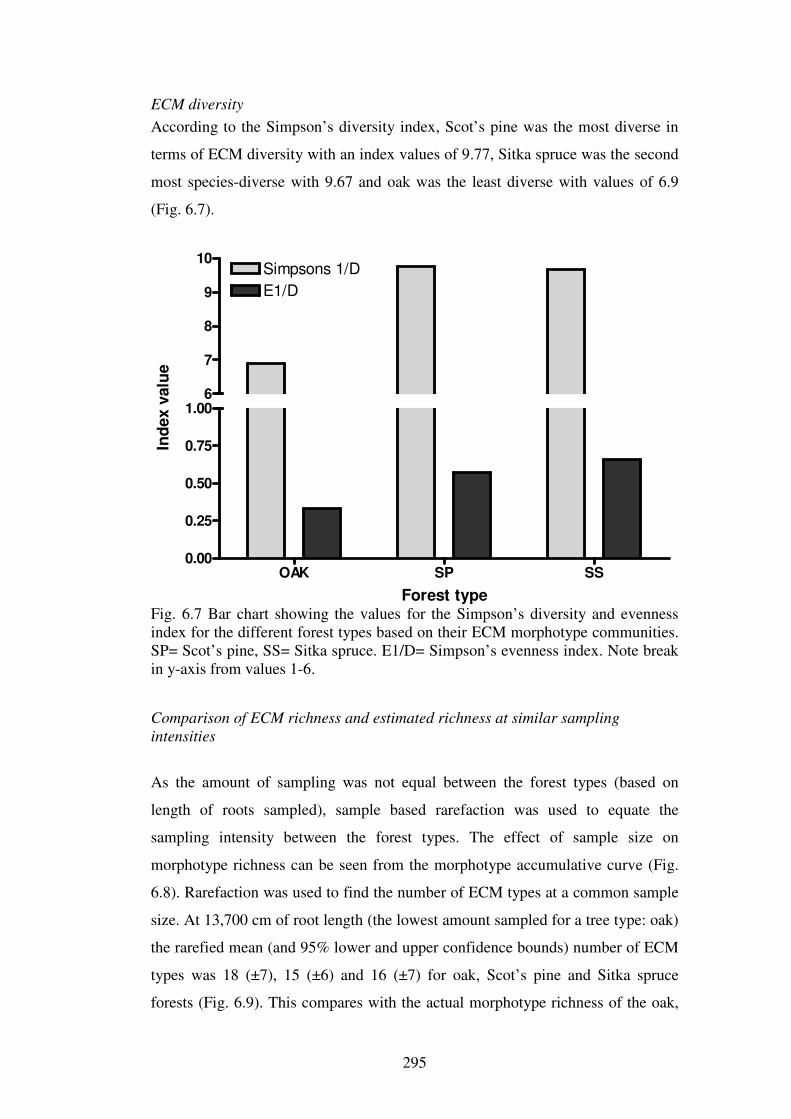
295
ECM diversity
According to the Simpson’s diversity index, Scot’s pine was the most diverse in
terms of ECM diversity with an index values of 9.77, Sitka spruce was the second
most species-diverse with 9.67 and oak was the least diverse with values of 6.9
(Fig. 6.7).
OAK SP SS0.00
0.25
0.50
0.75
1.00
Simpsons 1/DE1/D
6
7
8
9
10
Forest type
Ind
ex v
alu
e
Fig. 6.7 Bar chart showing the values for the Simpson’s diversity and evenness index for the different forest types based on their ECM morphotype communities. SP= Scot’s pine, SS= Sitka spruce. E1/D= Simpson’s evenness index. Note break in y-axis from values 1-6.
Comparison of ECM richness and estimated richness at similar sampling
intensities
As the amount of sampling was not equal between the forest types (based on
length of roots sampled), sample based rarefaction was used to equate the
sampling intensity between the forest types. The effect of sample size on
morphotype richness can be seen from the morphotype accumulative curve (Fig.
6.8). Rarefaction was used to find the number of ECM types at a common sample
size. At 13,700 cm of root length (the lowest amount sampled for a tree type: oak)
the rarefied mean (and 95% lower and upper confidence bounds) number of ECM
types was 18 (±7), 15 (±6) and 16 (±7) for oak, Scot’s pine and Sitka spruce
forests (Fig. 6.9). This compares with the actual morphotype richness of the oak,
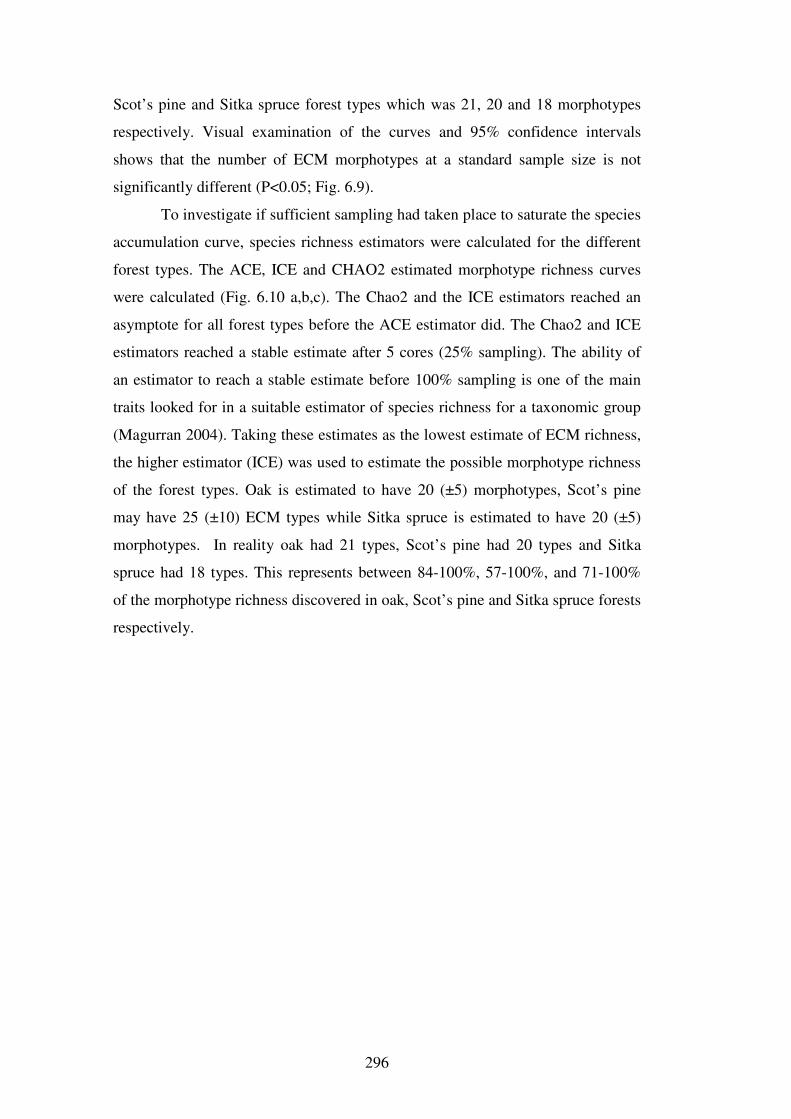
296
Scot’s pine and Sitka spruce forest types which was 21, 20 and 18 morphotypes
respectively. Visual examination of the curves and 95% confidence intervals
shows that the number of ECM morphotypes at a standard sample size is not
significantly different (P<0.05; Fig. 6.9).
To investigate if sufficient sampling had taken place to saturate the species
accumulation curve, species richness estimators were calculated for the different
forest types. The ACE, ICE and CHAO2 estimated morphotype richness curves
were calculated (Fig. 6.10 a,b,c). The Chao2 and the ICE estimators reached an
asymptote for all forest types before the ACE estimator did. The Chao2 and ICE
estimators reached a stable estimate after 5 cores (25% sampling). The ability of
an estimator to reach a stable estimate before 100% sampling is one of the main
traits looked for in a suitable estimator of species richness for a taxonomic group
(Magurran 2004). Taking these estimates as the lowest estimate of ECM richness,
the higher estimator (ICE) was used to estimate the possible morphotype richness
of the forest types. Oak is estimated to have 20 (±5) morphotypes, Scot’s pine
may have 25 (±10) ECM types while Sitka spruce is estimated to have 20 (±5)
morphotypes. In reality oak had 21 types, Scot’s pine had 20 types and Sitka
spruce had 18 types. This represents between 84-100%, 57-100%, and 71-100%
of the morphotype richness discovered in oak, Scot’s pine and Sitka spruce forests
respectively.
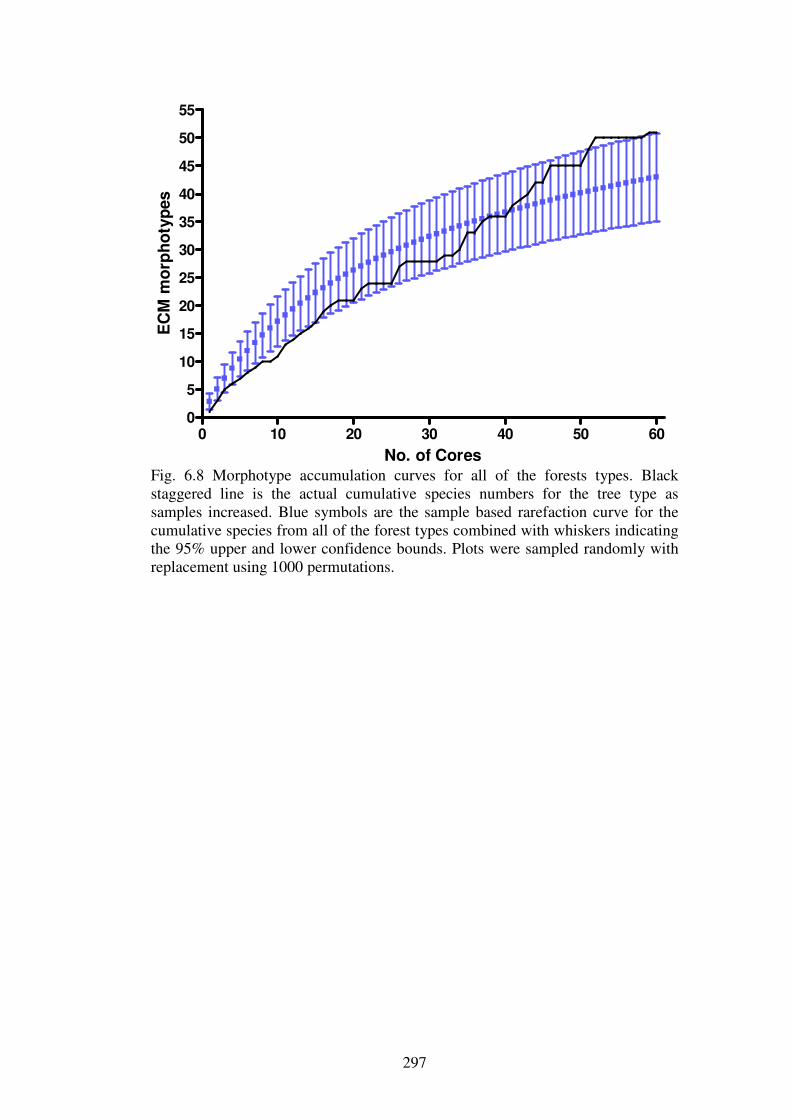
297
0 10 20 30 40 50 600
5
10
15
20
25
30
35
40
45
50
55
No. of Cores
EC
M m
orp
ho
typ
es
Fig. 6.8 Morphotype accumulation curves for all of the forests types. Black staggered line is the actual cumulative species numbers for the tree type as samples increased. Blue symbols are the sample based rarefaction curve for the cumulative species from all of the forest types combined with whiskers indicating the 95% upper and lower confidence bounds. Plots were sampled randomly with replacement using 1000 permutations.
298
1373
10
2500
5000
7500
1000
0
1250
0
1500
0
1750
0
2000
0
1373
1
0
5
10
15
20
25
OAKSPSS
Root lenght (cm)
No
. o
f m
orp
ho
typ
es
Fig. 6.9 Sample based rarefaction curves of mean (symbols) morphotypes with 95% upper and lower confidence intervals (whiskers) for oak (triangle symbols), SP= Scot’s pine (cross symbols) and SS= Sitka spruce (Circular symbols). Cores were sampled randomly with replacement using 500 permutations for each sample size.
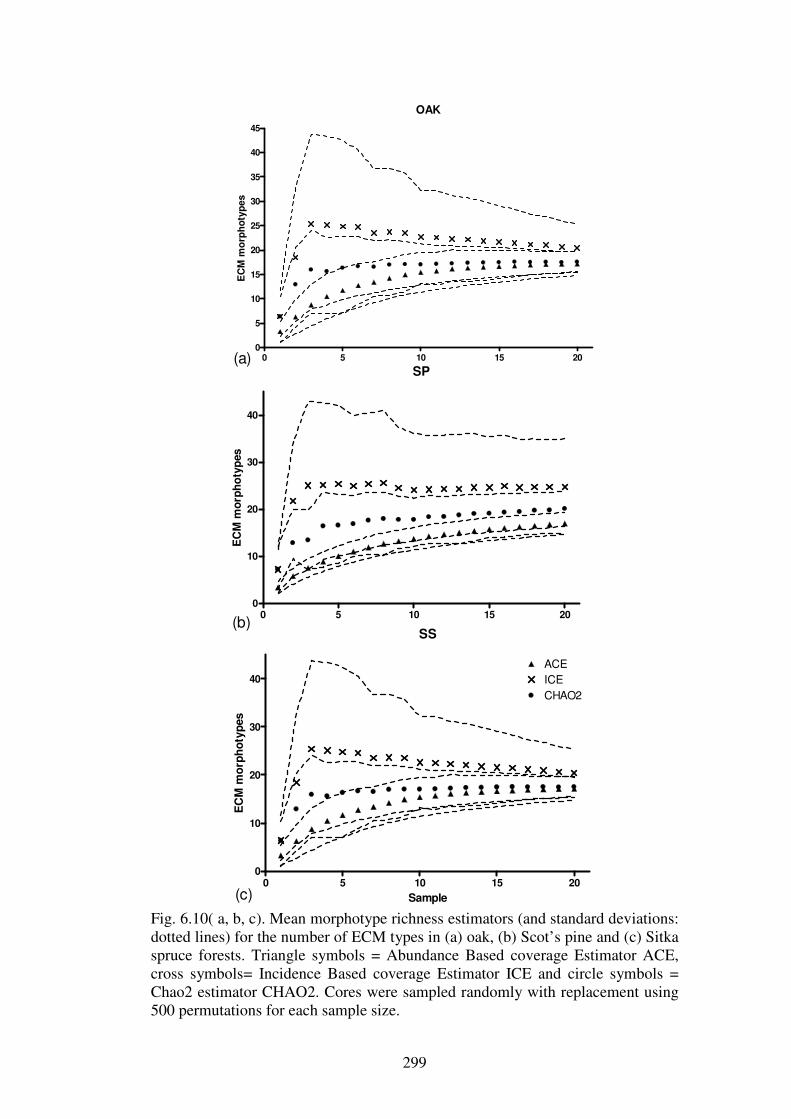
299
OAK
0 5 10 15 200
5
10
15
20
25
30
35
40
45
EC
M m
orp
ho
typ
es
SP
0 5 10 15 200
10
20
30
40
EC
M m
orp
ho
typ
es
SS
0 5 10 15 200
10
20
30
40
ACEICECHAO2
Sample
EC
M m
orp
ho
typ
es
(a)
(b)
(c)
Fig. 6.10( a, b, c). Mean morphotype richness estimators (and standard deviations: dotted lines) for the number of ECM types in (a) oak, (b) Scot’s pine and (c) Sitka spruce forests. Triangle symbols = Abundance Based coverage Estimator ACE, cross symbols= Incidence Based coverage Estimator ICE and circle symbols = Chao2 estimator CHAO2. Cores were sampled randomly with replacement using 500 permutations for each sample size.
300
The species richness estimator curves above all show levelling off of the
species accumulation curve. This would indicate that sufficient sampling had
taken place to estimate the number of ECM types in the forest sites.
6.4.3 Similarity of below-ground ECM assemblage and above-ground ECM
sporocarp assemblage
Using a modified form of the Jaccard similarity index, the similarity of the above-
ground ECM sporocarps and the below-ground ECM morphotypes was examined
(Tables 6.5; 6.6; 6.7). The similarity between the above- and below-ground ECM
assemblages was low. The 4 oak plots had a mean similarity value of 12±9%, the
Scot’s pine sites 7±1%, and the Sitka spruce sites 9±14% similarity (Table 6.8).
Over the entire project there was less than 10% similarity found between the ECM
fruitbodies and the ECM morphotypes in the 12 sites examined.
Spearman’s rank correlation was used to test for significant relationships
between the below-ground richness and abundance values and the above-ground
sporocarp richness and abundance values. No significant relationships (P>0.05)
found between these variables from the data from all of the forest types.
The abundance of certain sporocarps was in some cases useful in deciding
what species the ECM root tip belonged to. For example, the white “frosty”
morphotype recorded in the Abbeyleix oak plot was similar to Scleroderma
ectomycorrhizas described by Agerer (1987-2002). As Scleroderma citrinum was
also found as a sporocarp in this site, the presence of the fungal fruitbody helped
to indicate possible identities for the ECM morphotype. In other cases however,
many of the species found as sporocarps were not found belowground, and vice
versa for belowground species which were not found fruiting as sporocarps.
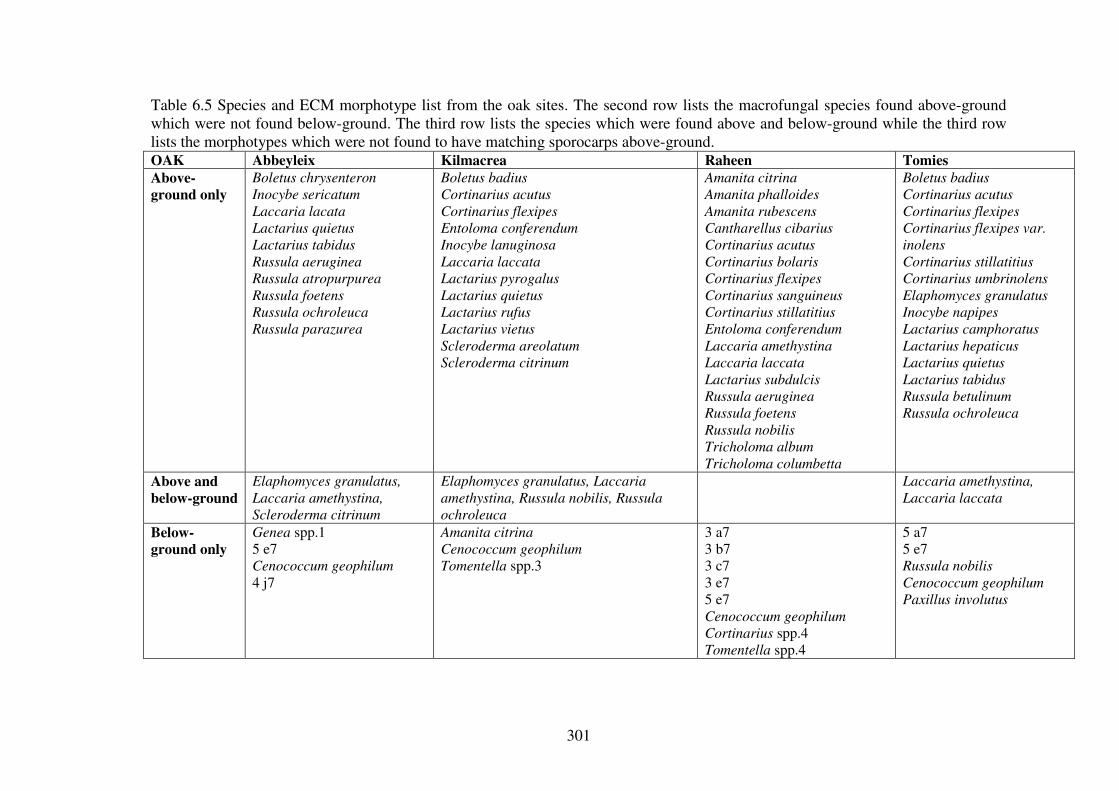
301
Table 6.5 Species and ECM morphotype list from the oak sites. The second row lists the macrofungal species found above-ground which were not found below-ground. The third row lists the species which were found above and below-ground while the third row lists the morphotypes which were not found to have matching sporocarps above-ground. OAK Abbeyleix Kilmacrea Raheen Tomies
Above-
ground only
Boletus chrysenteron
Inocybe sericatum
Laccaria lacata
Lactarius quietus
Lactarius tabidus
Russula aeruginea
Russula atropurpurea
Russula foetens
Russula ochroleuca
Russula parazurea
Boletus badius
Cortinarius acutus
Cortinarius flexipes
Entoloma conferendum
Inocybe lanuginosa
Laccaria laccata
Lactarius pyrogalus
Lactarius quietus
Lactarius rufus
Lactarius vietus
Scleroderma areolatum
Scleroderma citrinum
Amanita citrina
Amanita phalloides
Amanita rubescens
Cantharellus cibarius
Cortinarius acutus
Cortinarius bolaris
Cortinarius flexipes
Cortinarius sanguineus
Cortinarius stillatitius
Entoloma conferendum
Laccaria amethystina
Laccaria laccata
Lactarius subdulcis
Russula aeruginea
Russula foetens
Russula nobilis
Tricholoma album
Tricholoma columbetta
Boletus badius
Cortinarius acutus
Cortinarius flexipes
Cortinarius flexipes var.
inolens
Cortinarius stillatitius
Cortinarius umbrinolens
Elaphomyces granulatus
Inocybe napipes
Lactarius camphoratus
Lactarius hepaticus
Lactarius quietus
Lactarius tabidus
Russula betulinum
Russula ochroleuca
Above and
below-ground
Elaphomyces granulatus,
Laccaria amethystina,
Scleroderma citrinum
Elaphomyces granulatus, Laccaria
amethystina, Russula nobilis, Russula
ochroleuca
Laccaria amethystina,
Laccaria laccata
Below-
ground only
Genea spp.1 5 e7 Cenococcum geophilum
4 j7
Amanita citrina
Cenococcum geophilum
Tomentella spp.3
3 a7 3 b7 3 c7 3 e7 5 e7 Cenococcum geophilum
Cortinarius spp.4 Tomentella spp.4
5 a7 5 e7 Russula nobilis
Cenococcum geophilum
Paxillus involutus
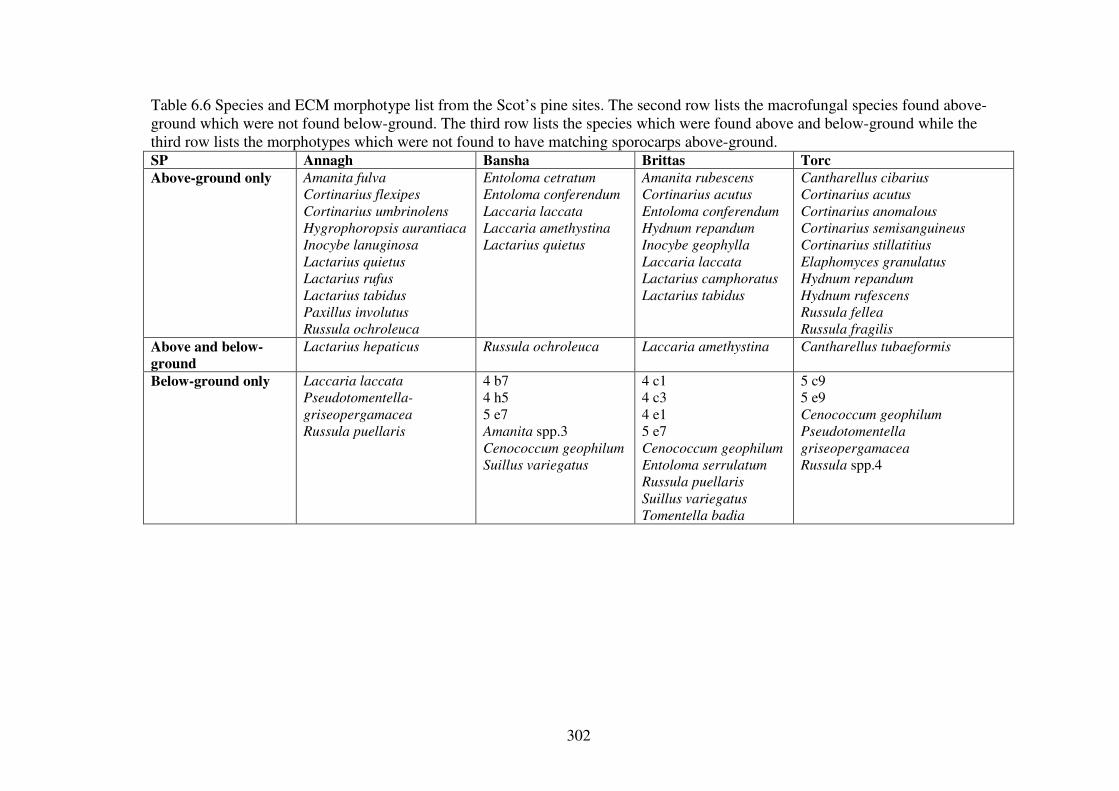
302
Table 6.6 Species and ECM morphotype list from the Scot’s pine sites. The second row lists the macrofungal species found above-ground which were not found below-ground. The third row lists the species which were found above and below-ground while the third row lists the morphotypes which were not found to have matching sporocarps above-ground. SP Annagh Bansha Brittas Torc
Above-ground only Amanita fulva
Cortinarius flexipes
Cortinarius umbrinolens
Hygrophoropsis aurantiaca
Inocybe lanuginosa
Lactarius quietus
Lactarius rufus
Lactarius tabidus
Paxillus involutus
Russula ochroleuca
Entoloma cetratum
Entoloma conferendum
Laccaria laccata
Laccaria amethystina
Lactarius quietus
Amanita rubescens
Cortinarius acutus
Entoloma conferendum
Hydnum repandum
Inocybe geophylla
Laccaria laccata
Lactarius camphoratus
Lactarius tabidus
Cantharellus cibarius
Cortinarius acutus
Cortinarius anomalous
Cortinarius semisanguineus
Cortinarius stillatitius
Elaphomyces granulatus
Hydnum repandum
Hydnum rufescens
Russula fellea
Russula fragilis
Above and below-
ground
Lactarius hepaticus Russula ochroleuca Laccaria amethystina Cantharellus tubaeformis
Below-ground only Laccaria laccata
Pseudotomentella-
griseopergamacea
Russula puellaris
4 b7 4 h5 5 e7 Amanita spp.3 Cenococcum geophilum
Suillus variegatus
4 c1 4 c3 4 e1 5 e7 Cenococcum geophilum
Entoloma serrulatum
Russula puellaris
Suillus variegatus
Tomentella badia
5 c9 5 e9 Cenococcum geophilum
Pseudotomentella
griseopergamacea
Russula spp.4
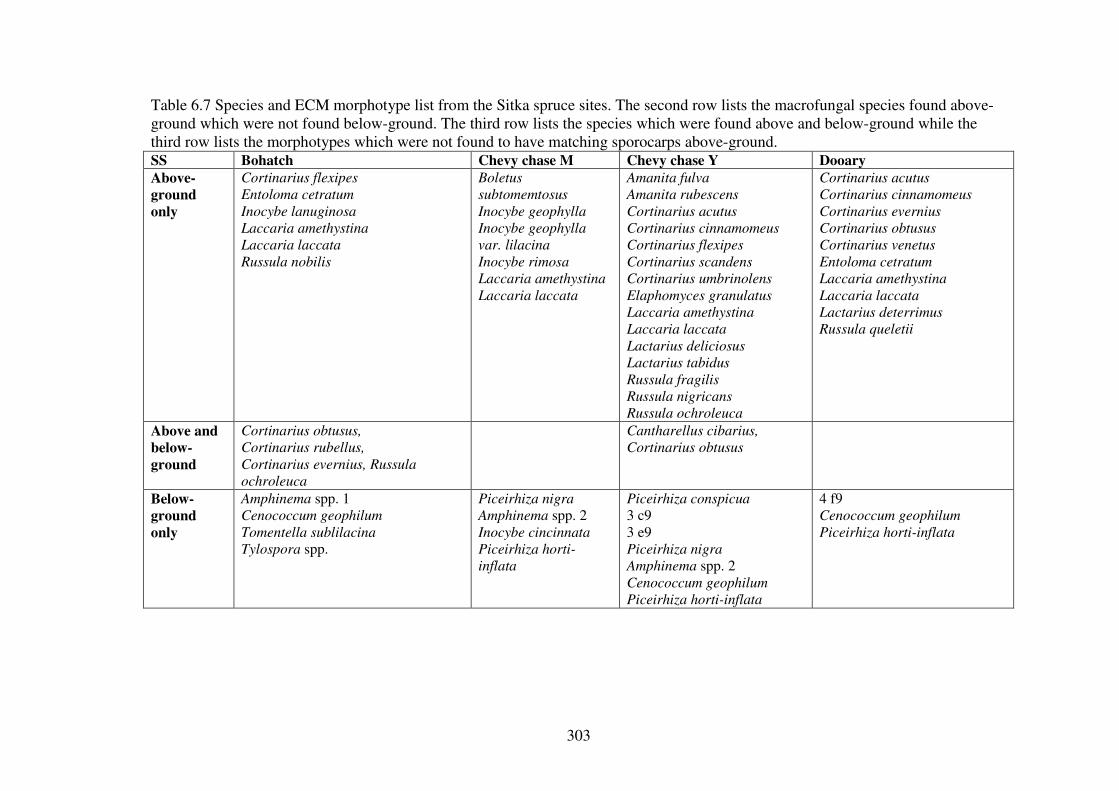
303
Table 6.7 Species and ECM morphotype list from the Sitka spruce sites. The second row lists the macrofungal species found above-ground which were not found below-ground. The third row lists the species which were found above and below-ground while the third row lists the morphotypes which were not found to have matching sporocarps above-ground. SS Bohatch Chevy chase M Chevy chase Y Dooary
Above-
ground
only
Cortinarius flexipes
Entoloma cetratum
Inocybe lanuginosa
Laccaria amethystina
Laccaria laccata
Russula nobilis
Boletus
subtomemtosus
Inocybe geophylla
Inocybe geophylla
var. lilacina
Inocybe rimosa
Laccaria amethystina
Laccaria laccata
Amanita fulva
Amanita rubescens
Cortinarius acutus
Cortinarius cinnamomeus
Cortinarius flexipes
Cortinarius scandens
Cortinarius umbrinolens
Elaphomyces granulatus
Laccaria amethystina
Laccaria laccata
Lactarius deliciosus
Lactarius tabidus
Russula fragilis
Russula nigricans
Russula ochroleuca
Cortinarius acutus
Cortinarius cinnamomeus
Cortinarius evernius
Cortinarius obtusus
Cortinarius venetus
Entoloma cetratum
Laccaria amethystina
Laccaria laccata
Lactarius deterrimus
Russula queletii
Above and
below-
ground
Cortinarius obtusus,
Cortinarius rubellus,
Cortinarius evernius, Russula
ochroleuca
Cantharellus cibarius,
Cortinarius obtusus
Below-
ground
only
Amphinema spp. 1 Cenococcum geophilum
Tomentella sublilacina
Tylospora spp.
Piceirhiza nigra
Amphinema spp. 2 Inocybe cincinnata
Piceirhiza horti-
inflata
Piceirhiza conspicua
3 c9 3 e9 Piceirhiza nigra
Amphinema spp. 2 Cenococcum geophilum
Piceirhiza horti-inflata
4 f9 Cenococcum geophilum
Piceirhiza horti-inflata
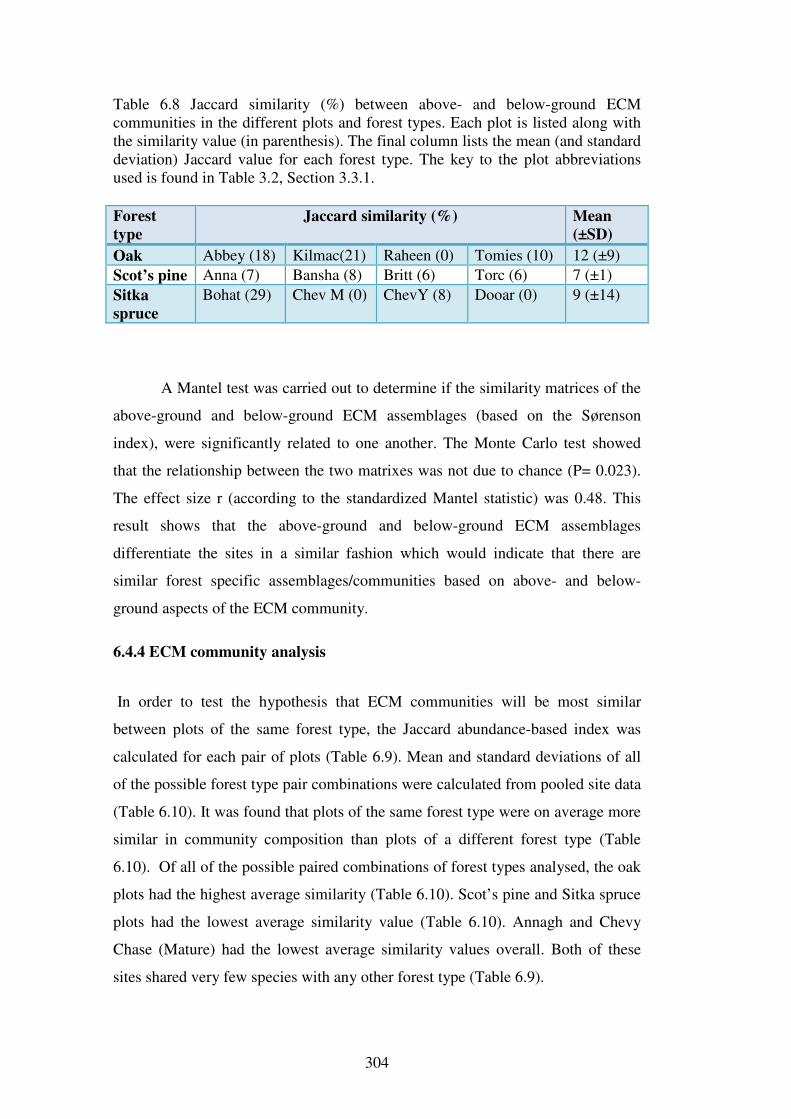
304
Table 6.8 Jaccard similarity (%) between above- and below-ground ECM communities in the different plots and forest types. Each plot is listed along with the similarity value (in parenthesis). The final column lists the mean (and standard deviation) Jaccard value for each forest type. The key to the plot abbreviations used is found in Table 3.2, Section 3.3.1.
Forest
type
Jaccard similarity (%) Mean
(±SD)
Oak Abbey (18) Kilmac(21) Raheen (0) Tomies (10) 12 (±9)
Scot’s pine Anna (7) Bansha (8) Britt (6) Torc (6) 7 (±1)
Sitka
spruce
Bohat (29) Chev M (0) ChevY (8) Dooar (0) 9 (±14)
A Mantel test was carried out to determine if the similarity matrices of the
above-ground and below-ground ECM assemblages (based on the Sørenson
index), were significantly related to one another. The Monte Carlo test showed
that the relationship between the two matrixes was not due to chance (P= 0.023).
The effect size r (according to the standardized Mantel statistic) was 0.48. This
result shows that the above-ground and below-ground ECM assemblages
differentiate the sites in a similar fashion which would indicate that there are
similar forest specific assemblages/communities based on above- and below-
ground aspects of the ECM community.
6.4.4 ECM community analysis
In order to test the hypothesis that ECM communities will be most similar
between plots of the same forest type, the Jaccard abundance-based index was
calculated for each pair of plots (Table 6.9). Mean and standard deviations of all
of the possible forest type pair combinations were calculated from pooled site data
(Table 6.10). It was found that plots of the same forest type were on average more
similar in community composition than plots of a different forest type (Table
6.10). Of all of the possible paired combinations of forest types analysed, the oak
plots had the highest average similarity (Table 6.10). Scot’s pine and Sitka spruce
plots had the lowest average similarity value (Table 6.10). Annagh and Chevy
Chase (Mature) had the lowest average similarity values overall. Both of these
sites shared very few species with any other forest type (Table 6.9).

305
Table 6.9 Jaccard estimated similarity index between the different plots (shaded cells) and the number of shared morphotypes in the clear cells. SP= Scot’s pine, SS= Sitka spruce.
Tree type OAK OAK OAK OAK SP SP SP SP SS SS SS SS
Site ABBEY KILMAC RAHEEN TOOMI ANNAGH BNSHA BRITT TORC BOHAT CHEVM CHEVY DOOAR
OAK ABBEY X 0.416 0.25 0.36 0 0.24 0.35 0.15 0.09 0 0.12 0.11
OAK KILMAC 3 X 0.13 0.21 0 0.19 0.18 0.16 0.21 0 0.12 0.11
OAK RAHEEN 2 1 X 0.26 0 0.24 0.26 0.18 0.1 0 0.13 0.11
OAK TOOMI 3 2 2 X 0.1 0.25 0.35 0.21 0.11 0 0.15 0.12
SP ANNAGH 0 0 0 1 X 0 0.06 0.07 0 0 0 0
SP BNSHA 2 2 2 2 0 X 0.33 0.37 0.23 0.08 0.19 0.12
SP BRITT 3 2 2 3 1 3 X 0.17 0.1 0 0.13 0.11
SP TORC 1 1 1 1 1 2 1 X 0.12 0 0.16 0.13
SS BOHAT 1 2 1 1 0 2 1 1 X 0 0.18 0.09
SS CHEVM 0 0 0 0 0 1 0 0 0 X 0.09 0.26
SS CHEVY 1 1 1 1 0 2 1 1 2 2 X 0.35
SS DOOAR 1 1 1 1 0 1 1 1 1 1 2 X

306
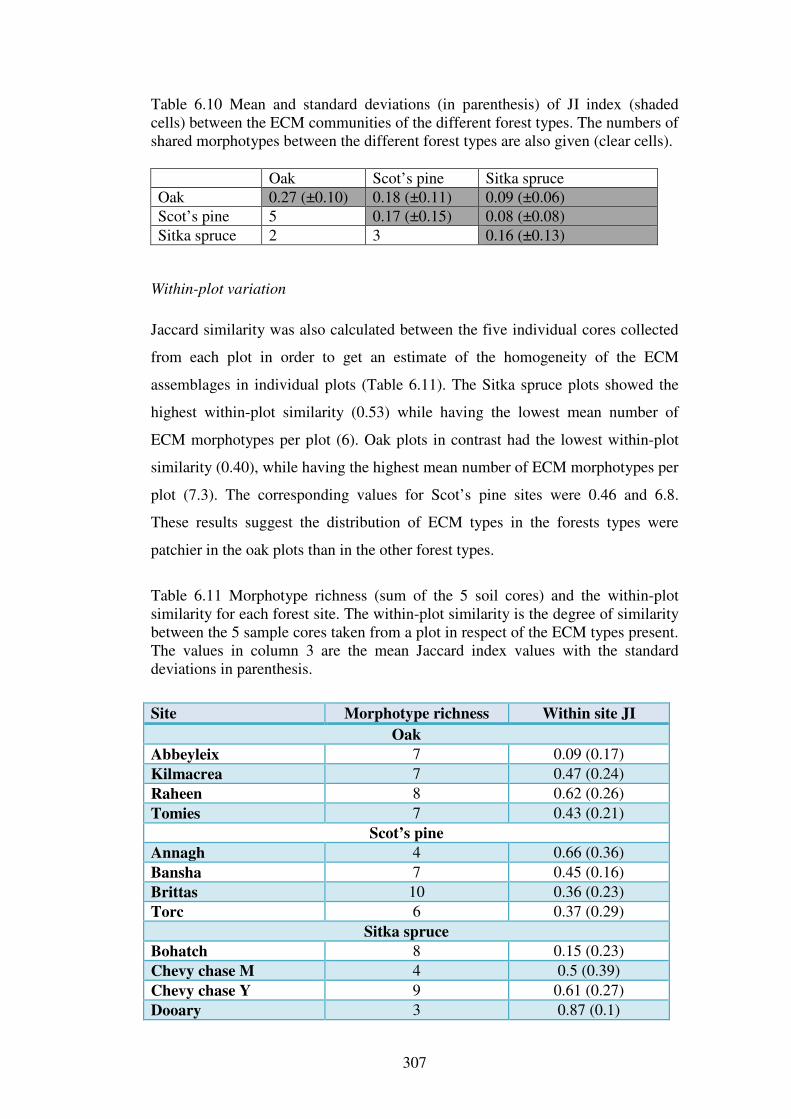
307
Table 6.10 Mean and standard deviations (in parenthesis) of JI index (shaded cells) between the ECM communities of the different forest types. The numbers of shared morphotypes between the different forest types are also given (clear cells).
Oak Scot’s pine Sitka spruce
Oak 0.27 (±0.10) 0.18 (±0.11) 0.09 (±0.06)
Scot’s pine 5 0.17 (±0.15) 0.08 (±0.08)
Sitka spruce 2 3 0.16 (±0.13)
Within-plot variation
Jaccard similarity was also calculated between the five individual cores collected
from each plot in order to get an estimate of the homogeneity of the ECM
assemblages in individual plots (Table 6.11). The Sitka spruce plots showed the
highest within-plot similarity (0.53) while having the lowest mean number of
ECM morphotypes per plot (6). Oak plots in contrast had the lowest within-plot
similarity (0.40), while having the highest mean number of ECM morphotypes per
plot (7.3). The corresponding values for Scot’s pine sites were 0.46 and 6.8.
These results suggest the distribution of ECM types in the forests types were
patchier in the oak plots than in the other forest types.
Table 6.11 Morphotype richness (sum of the 5 soil cores) and the within-plot similarity for each forest site. The within-plot similarity is the degree of similarity between the 5 sample cores taken from a plot in respect of the ECM types present. The values in column 3 are the mean Jaccard index values with the standard deviations in parenthesis.
Site Morphotype richness Within site JI
Oak
Abbeyleix 7 0.09 (0.17)
Kilmacrea 7 0.47 (0.24)
Raheen 8 0.62 (0.26)
Tomies 7 0.43 (0.21)
Scot’s pine
Annagh 4 0.66 (0.36)
Bansha 7 0.45 (0.16)
Brittas 10 0.36 (0.23)
Torc 6 0.37 (0.29)
Sitka spruce
Bohatch 8 0.15 (0.23)
Chevy chase M 4 0.5 (0.39)
Chevy chase Y 9 0.61 (0.27)
Dooary 3 0.87 (0.1)
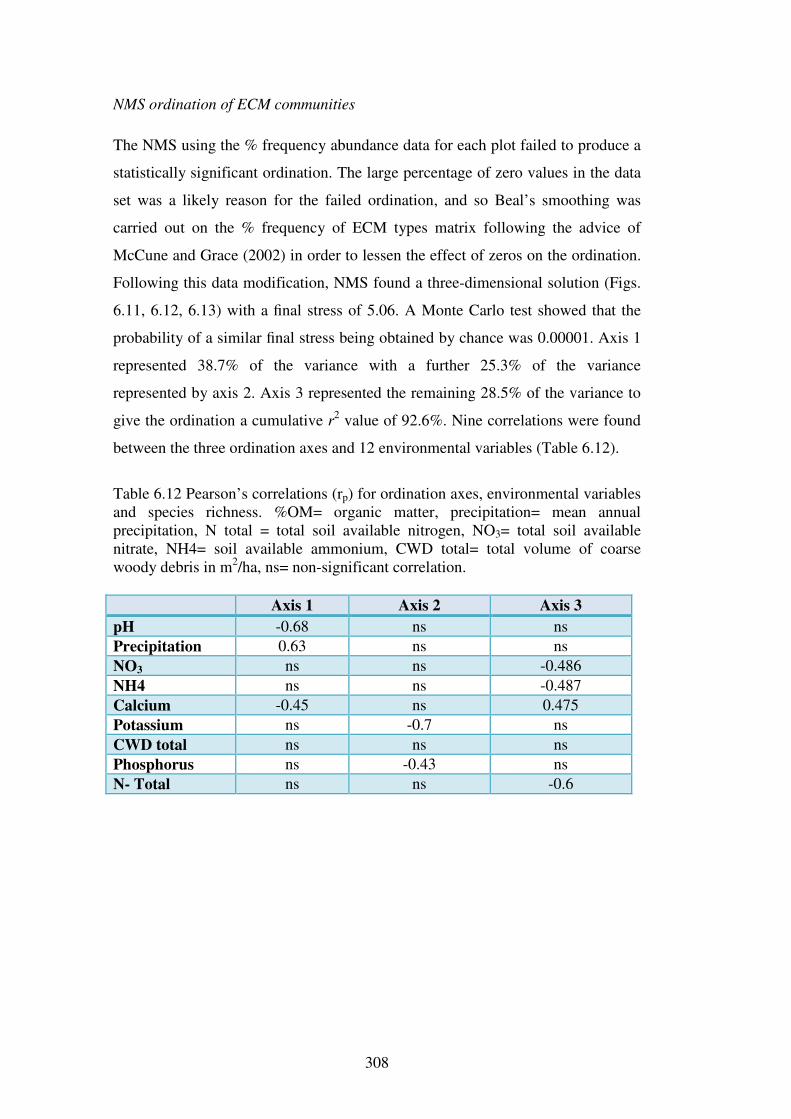
308
NMS ordination of ECM communities
The NMS using the % frequency abundance data for each plot failed to produce a
statistically significant ordination. The large percentage of zero values in the data
set was a likely reason for the failed ordination, and so Beal’s smoothing was
carried out on the % frequency of ECM types matrix following the advice of
McCune and Grace (2002) in order to lessen the effect of zeros on the ordination.
Following this data modification, NMS found a three-dimensional solution (Figs.
6.11, 6.12, 6.13) with a final stress of 5.06. A Monte Carlo test showed that the
probability of a similar final stress being obtained by chance was 0.00001. Axis 1
represented 38.7% of the variance with a further 25.3% of the variance
represented by axis 2. Axis 3 represented the remaining 28.5% of the variance to
give the ordination a cumulative r2 value of 92.6%. Nine correlations were found
between the three ordination axes and 12 environmental variables (Table 6.12).
Table 6.12 Pearson’s correlations (rp) for ordination axes, environmental variables and species richness. %OM= organic matter, precipitation= mean annual precipitation, N total = total soil available nitrogen, NO3= total soil available nitrate, NH4= soil available ammonium, CWD total= total volume of coarse woody debris in m2/ha, ns= non-significant correlation.
Axis 1 Axis 2 Axis 3
pH -0.68 ns ns
Precipitation 0.63 ns ns
NO3 ns ns -0.486
NH4 ns ns -0.487
Calcium -0.45 ns 0.475
Potassium ns -0.7 ns
CWD total ns ns ns
Phosphorus ns -0.43 ns
N- Total ns ns -0.6
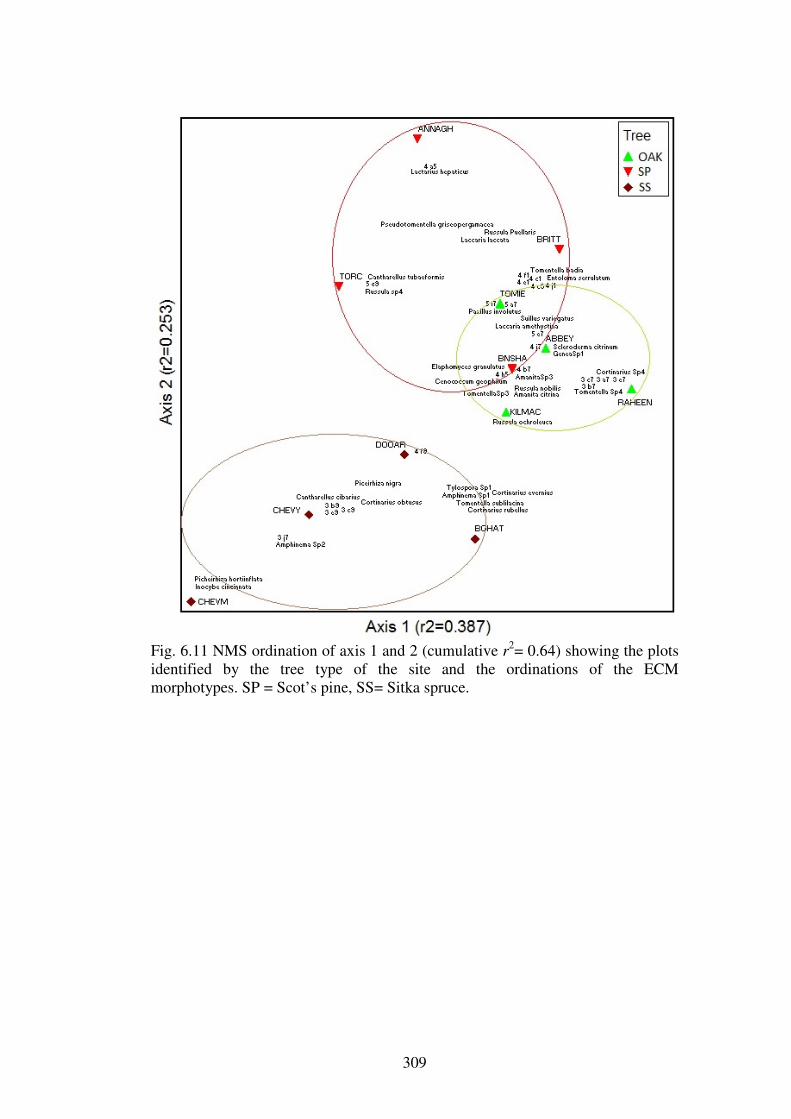
309
Fig. 6.11 NMS ordination of axis 1 and 2 (cumulative r2= 0.64) showing the plots identified by the tree type of the site and the ordinations of the ECM morphotypes. SP = Scot’s pine, SS= Sitka spruce.

310
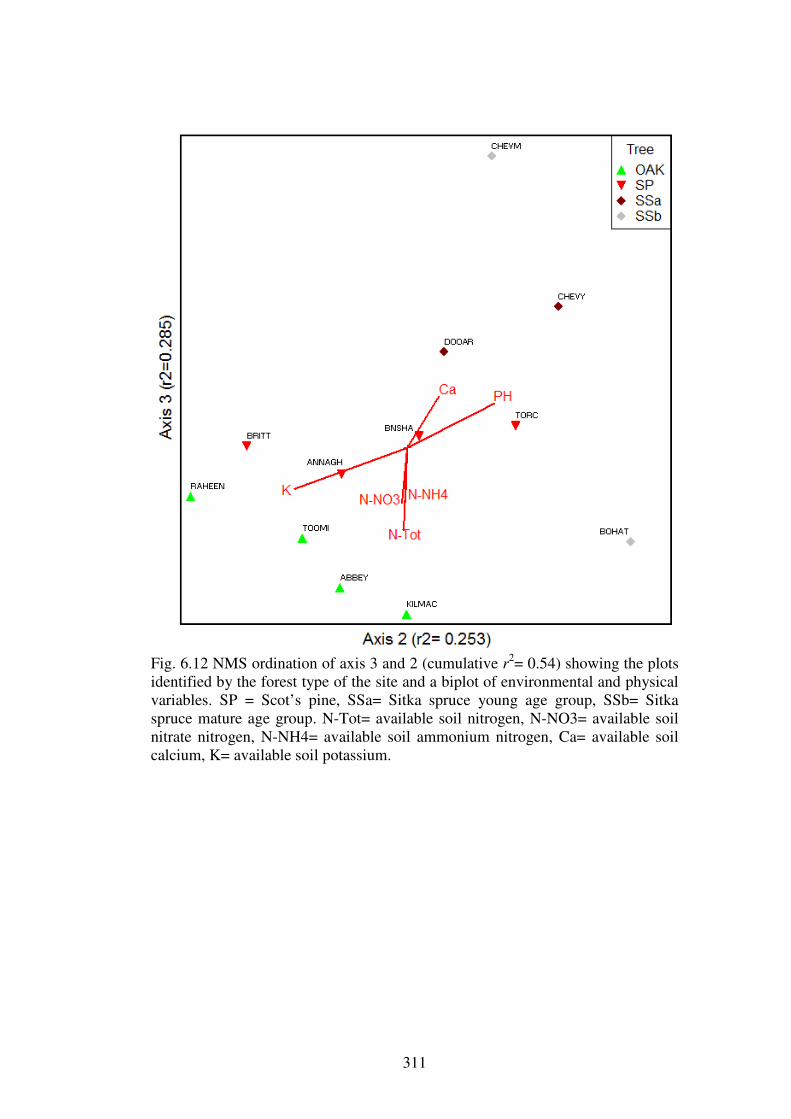
311
Fig. 6.12 NMS ordination of axis 3 and 2 (cumulative r2= 0.54) showing the plots identified by the forest type of the site and a biplot of environmental and physical variables. SP = Scot’s pine, SSa= Sitka spruce young age group, SSb= Sitka spruce mature age group. N-Tot= available soil nitrogen, N-NO3= available soil nitrate nitrogen, N-NH4= available soil ammonium nitrogen, Ca= available soil calcium, K= available soil potassium.

312
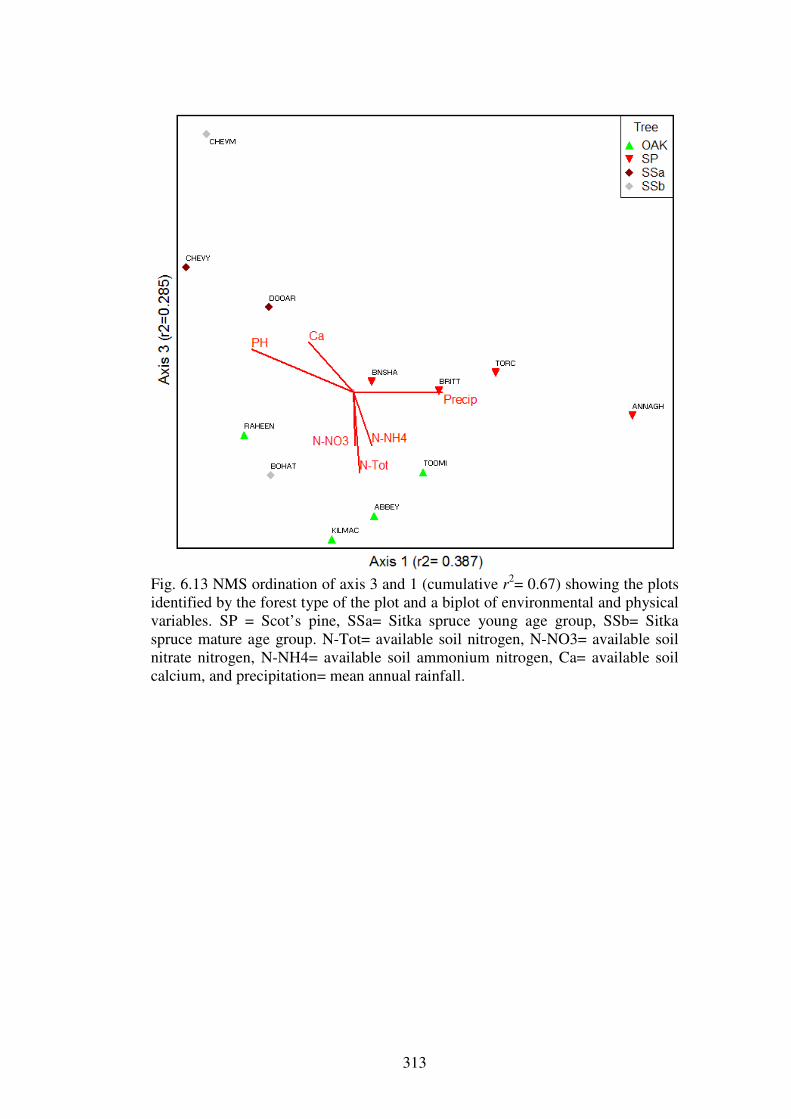
313
Fig. 6.13 NMS ordination of axis 3 and 1 (cumulative r2= 0.67) showing the plots identified by the forest type of the plot and a biplot of environmental and physical variables. SP = Scot’s pine, SSa= Sitka spruce young age group, SSb= Sitka spruce mature age group. N-Tot= available soil nitrogen, N-NO3= available soil nitrate nitrogen, N-NH4= available soil ammonium nitrogen, Ca= available soil calcium, and precipitation= mean annual rainfall.

314
315
The NMS ordinations of the ECM communities separated the plots into
groups that corresponded well to forest type, particularly axis 2 and 3 of the
ordination. MRPP analysis of the ECM communities in each forest type found
that the ECM communities did differ significantly between plots based on the
main dominant type of the plot and on the vegetation communities present at the
sites (A= 0.13, P< 0.05). These results indicate that distinct ECM communities are
found in each forest type. The oak plots were ordinated along a gradient of
increasing soil nutrient status (nitrogen, potassium and phosphorus) from the
coniferous plots.
The distribution of the different ECM morphotypes amongst the plots was
not equal. With many morphotypes only present in single plots (Fig. 6.11) and
others present in very large and very low abundances over the plots, correlations
between individual species and ordination axes are difficult to explain. One
species which was present in a large proportion of the plots and samples was
Cenococcum geophilum. It showed a strong negative (rp-0.58) correlation to axis
3. Axis 3 was also negatively correlated with available nitrogen and positively
correlated with available calcium (Table 6.12). This could indicate that the
abundance of C. geophilum morphotype is positively related to the amounts of
available nitrogen in the plot and negatively related to the available calcium in the
plots.
316
6.5 Discussion
6.5.1 Ectomycorrhizal diversity
The number of ECM types found in this study (51) is comparable to other studies
utilising both morphological and molecular methods for identification. Peter et al.
(2001) collected 79 morphotypes in a three-year study of ECM communities of
Norway spruce in Switzerland. Taylor (2002) identified 37 ECM types in his
Scot’s pine plots in Sweden. It was found that oak forests yielded the most
morphotypes, followed by Scot’s pine and Sitka spruce, but the mean numbers of
morphotypes per core were not significantly different between the forest types.
Oak forests revealed the highest number of unidentified morphotypes, followed
by Scot’s pine and Sitka spruce. This unequal distribution of unidentified
morphotypes between the forest types, is most likely due to the inequality in the
numbers of published descriptions of mycorrhizas between the different forest
types examined. For example, Agerer and Rambold (2004-2011) give 554
descriptions, of which 121 are of Picea ectomycorrhizas, 100 are of Pinus
ectomycorrhizas and only 74 are from Quercus ectomycorrhizas.
The species richness estimation identified the Scot’s pine forest type as
being potentially the most morphotype rich. This result agrees with the results
from the sporocarp study (Chapter 4), as Scot’s pine plots were found to have the
greatest proportion of ECM sporocarps of all the forest types. Scot’s pine forests
are known to be very ECM morphotype rich, as studies of the effect of fire on
ECM communities in Sweden revealed 135 morphotypes from four forest stands
(Jonsson et al. 1999). Species richness estimation revealed that between 57 and
100% of the ECM morphotype richness was found in these forest types. These
results are broadly similar to those found by Tedersoo et al. (2006), while
examining the ECM community in a tree species rich wooded meadow in Estonia.
They found that Chao2 estimates revealed that a possible 52% of the morphotype
richness was recorded by their study. However, their estimates were much higher
than in this study (325 vs. max 35 in this study). The higher actual and estimated
species richness in Tedersoo et al. study is not surprising, as the positive
relationship between tree species richness and ECM richness (Ishida et al. 2007),
317
and the positive effect of multi-species neighbouring trees on ECM diversity
(Hubert and Gehring 2008) has been recognised.
The fact that sample-based rarefaction showed no significant differences
between the number of morphotypes from each forest type, shows that plantation
forests of Sitka spruce and Scot’s pine can have similar levels of ECM richness
below-ground as the native oak woods of Ireland. The species richness estimation
also showed that the estimated number of morphotypes in these forest types are
comparable. A similar result has been found for macrofungal species richness
according to the sporocarp survey (Fig. 4.4, Section 4.4.2, Chapter 4).
The overall community structure with regard to the abundance of species
is similar to other studies of ectomycorrhizas on the roots in forests soils. The
rank abundance curves follow a log-normal distribution, which agrees with
previous studies in coniferous (Krannabetter 2004; Luoma et al. 2006a; Cline et
al. 2005) and deciduous (Courty et al. 2008) forests. This distribution is due to the
samples being dominated by a few ECM species with very high abundances, and
having a long “tail” of rare species with low abundances. Cenococcum geophilum
was a ubiquitous member of the ECM communities of all forest types in this
study. Many other studies have found that it is often the most abundant
ectomycorrhizal species below-ground in temperate forests (Molina and Trappe
1982; Goodman and Trofymow 1998; Luoma et al. 2006a; Ishida et al. 2007).
NMS and MRPP analysis showed that each forest type had a reasonably
specific ECM community, thus agreeing with previous studies identifying
distinctive ECM communities according to forest type in temperate forests
(Tedersoo et al. 2006; Ishida et al. 2007). There was considerably less within-plot
than between-plot variation. Two (one oak and one Sitka spruce) of the plots had
relatively low within-plot similarity, and this may have been caused by a number
of factors, but most likely by either:
(1) The presence of different niches within the site
(2) The functional morphology of some ectomycorrhizas.
318
(1) Bruns (1995) was the first to describe how niche partitioning may be one of
the reasons for the large diversity of ECM types in forest soils. This
hypothesis was later tested and added to by Dickie et al. (2002), Tedersoo et
al. (2003) and Buee et al. (2007), as it was shown that certain
ectomycorrhizas are more common on certain substrates (e.g. Thelephora
spp. on coarse woody debris).
(2) The functional morphology of ectomycorrhizas may also cause large variation
between ECM communities within plots. Agerer (2001) noted that many
ECM species produce copious amounts of hyphal strands, which could aid in
the exclusion of other ectomycorrhizas from the surrounding root systems.
These competitive interactions of many ECM fungi have been reviewed by
Kennedy (2010), and the author stresses that these competitive interactions
are environmentally context-dependant, and so the results of these
interactions in nature can be highly stochastic. The study of ECM
morphology has been reviewed by Peay et al. (2011), and the current
hypothesis is that it is the amounts of roots which determine the success of
the different ectomycorrhizas depending on their exploration type
morphology. Morphotypes with long range exploration types (i.e. Cortinarius
spp. with long emanating hyphae) are more effective at colonizing roots in the
low density root zone by “piggy-backing” to new roots using their long range
hyphae and already colonized roots as an exploration platform.
6.5.2 The ECM communities of the forest types
The oak ECM community
In this study oak had the highest within-plot Jaccard similarity values and were
also the most undisturbed forest type investigated. The long history of all of the
oak sites as oak woodlands would allow time for the formation of a particular
assemblage of ECM species on the oak roots. It is known from ECM sporocarp
studies in coniferous forests of British Columbia, that ECM communities of
mature stands are relatively stable in comparison to young stands and change very
little as the forest ages (Kranabetter et al. 2005).
319
The most common ECM morphotype in the oak sites was Cenococcum
geophilum. It was found in all of the oak plots, with abundances ranging from 10
to 83% of the samples from the different oak sites. Richard et al. (2005) also
found that the ECM community of Holm oak Quercus ilex woods was dominated
by Cenococcum geophilum. Indeed, C. geophilum has been found to be the most
abundant ECM type in many Quercus forests e.g. Q. petraea in France (Buee et
al. 2007), Q. garryana in Oregon (Valentine et al. 2004), Q.rubra/Q. prinus in
North America and Germany (Walker et al. 2005; Gebhardt et al. 2007) and Q.
douglasii/Q. wislizeni forests in California (Morris et al. 2008).
The next most common ECM types in this study were types 5e7 and
Elaphomyces granulatus. Type 5 e7 resembles ectomycorrhizas of the Russula or
Tomentella type, as it lacks emanating hyphae and its main colours consist of dark
earthy shades. Ectomycorrhizas of these genera were very common in the study of
Q. petraea woods by Buee et al. (2007). Elaphomyces granulatus is probably very
common in Irish oak sites, as sporocarps of the fungus have been found in three of
the five oak sites examined in this study (see Chapter 4). Elaphomyces species
were also found in the oak woodland study by Courty et al. (2008), and this genus
along with other hypogeous genera are known to have spatially restricted, but
highly structured genet sizes (Kretzer et al. 2004). Low spore dispersal ability, but
high spore concentrations where they are found mean that hypogeous species of
fungi can compete effectively with other species of ectomycorrhizas that have
high dispersal rates (Grubisha et al. 2007). This explains the very high abundance
of Elaphomyces granulatus at one oak site (80% of samples from Kilmacrea oak
site), and the total lack of the species in another oak site (Raheen). The coupling
of low dispersal, high spore counts per unit area and longevity of the spores of
many hypogeous fungi (Bruns et al. 2009), could make the presence of hypogeous
species in Irish woodlands a good indicator of ancient woodlands on a site.
The Scot’s pine ECM community
The Scot’s pine sites, Bansha, Brittas and Torc, were similar regarding their ECM
assemblages, while the plot at Annagh had less in common with the other pine
plots regarding its ECM community. Annagh is a first rotation Scot’s pine site
planted on a site which was previously a bog. The past land use of the forest has
320
large effects on the ectomycorrhizal community present, as many ectomycorrhizal
species colonise newly planted forests from retained mature trees or from the
spore bank built up during the site over a number of years (Jones et al. 2003). The
morphotype Cenococcum geophilum was present in abundance in three of the
Scot’s pine plots, yet absent from Annagh; while the morphotype Suillus
variegatus was present in two of the Scot’s pine plots yet absent from Annagh.
Suillus variegatus was found to be much more common in mature Scot’s pine
forests in Spain (Bonnet et al. 2004), possibly indicating that this species fits into
the “late stage” grouping (sensu Deacon and Fleming 1992). The “early stage”
morphotype Laccaria lacatta was present in Annagh, yet absent from the rest of
the Scot’s pine plots. Laccaria lacatta is known to be a pioneer species in forests
(Deacon and Fleming 1992), and this is confirmed by its presence in the young
and absence from the old pine plots investigated.
Morphotype 5c9 (probably Cortinarius subgenus Sericeocybe cf.
violaceus) was very common (100% frequency in sub-samples) in two of the
cores in Torc where it formed large sclerotia. These can aid in the proliferation
and perennation of ectomycorrhizas, because they are relatively stable against
environmental stresses such as drought (Carlisle and Watkinson 1994).
Fruitbodies of this fungus were found to be very common in the Torc site over the
years 2007-2010 (Chapter 4). The ectomycorrhizas of Suillus variegatus was
found exclusively in pine sites. The genus Suillus, which is a member of the
Suilloid group, which also includes the genera Rhizopogon, Truncocolumella,
Gomphidius and Chroogomphus, are well known to exhibit strong host
preferences to pine species (Bruns et al. 2002).
The ectomycorrhizas of Cenococcum geophilum were found in all three of
the four Scot’s pine plots except Annagh. The unknown dispersal methods of C.
geophilum, which are probably relatively short-range (LoBuglio and Taylor
2002), would make it very difficult for this ECM species to enter the site of a new
forest unless it is already present on the roots of the seedlings from the nursery
stock. Cenococcum geophilum has been recorded on the roots of Pinus sylvestris
seedlings in Lithuania by Menkis et al. (2005), and therefore its presence in
nursery soils may aid in its dispersal. Cenococcum geophilum is thought to be
mainly dispersed by water or animals (Trappe 1969), and the lack of forested land
use near the Annagh plot may have impeded its dispersal into the plot.
321
In the native Scot’s pine forests of Scotland, Pickles et al. (2010) also
found Cenococcum geophilum and Suillus variegatus in their pine plots, but no
other similarities in ectomycorrhizal morphotypes were found between their study
and this study. However, five of the morphoptypes found in the pine plots of
Pickles et al., were found as sporocarps in the pine plots of this study (Chapter 4).
Heinonsalo et al. (2007) also found S. variegatus and Cenococcum geophilum
morphotypes in their study of ECM colonization after clear-cutting, and therefore
it is possible these two ECM species may not be adversely effected by the short
rotation cycles of Scot’s pine forests in Ireland.
The Sitka spruce ECM community
The Sitka spruce plots were the most variable of all the forest types with regard to
their ECM communities. This mirrored similar variability in respect of above-
ground sporcarp communities. There are many possible reasons for this high intra-
forest type variability in the Sitka spruce forest type. For example, It is known that
clear-cutting alters the ECM communities of forests (Jones et al. 2003), therefore
the Sitka spruce forests would rarely develop the stable fungal communities
characteristic of late stage forests. Differences in the soil types and abiotic
variables of the Sitka spruce plots (Chapter 3), or the ectomycorrhizal generalist
nature of Sitka spruce (Alexander and Watling 1987) could all be reasons for high
intra-forest type variability. The above-ground macrofungal communities of Sitka
spruce and oak were more similar to each other than to other forest types, but this
was not found for the below-ground ECM communities in these two forest types.
Many of the ECM morphotypes found in the spruce plots are often found on
nursery saplings e.g. Piceirhiza horti-inflata, Piceirhiza nigra, Tylospora spp.,
and were not found in the oak ECM communities. The frequent occurrence of
nursery ECM fungi would be likely if there was a long delay between clear-cut
and the re-forestation of the site. Other ECM species that produce long-lived
reproductive structures, such as the chlamydospores produced by Wilcoxina
ectomycorrhizas (previously called E-strain mycorrhizas) (Egger et al. 1991),
would also be favoured in these short rotation clear-cut forests, as was found in
Sitka spruce forests in the U.K. (Thomas et al. 1983).
322
Ectomycorrhizas of Tylospora cf. fibrillosa, Paxillus involutus and
Russula ochroleuca were common in Sitka spruce sites in this project and in Sitka
spruce forests in England (Palfner et al. 2005). Paxillus involutus has been
recorded on Sitka spruce trees in Ireland before (Heslin et al. 1992), along with 9
other types, including Cenococcum geophilum and Cortinarius obtusus, which
were also found with Sitka spruce in this project. The species Cortinarius croceus
and Cortinarius tubarius (listed as Dermocybe croceus and Dermocybe sphagneti)
were found in both of Heslin’s pure Sitka spruce plots, yet were lacking from this
study. It is possible that these species were locally common to the sites
investigated by Helsin et al., as sporocarps of these species are listed as
widespread but rarely reported (Legon and Henrici 2005). An investigation into
the ECM fungi on Sitka spruce under natural regeneration in Scotland (Flynn et
al. 1998), revealed 13 morphotypes of which Tylospora fibrillosa, Russula
ochroleuca, Laccaria sp., ITE2 and Cenococcum geophilum were common to this
study. The study by Thomas et al. (1983) of Welch Sitka spruce forests, also
found Cenococcum geophilum and Russula ochroleuca, and in addition they also
identified two Amanita species and four Lactarius species, of which some may
match the unidentified Amanita and Lactarius species from Sitka spruce in this
study.
6.5.3 Relationship between above-ground ECM sporocarps and below-
ground ECM morphotypes
The overall similarity between the fruitbodies above-ground and ectomycorrhizas
below-ground was low, on average, less than 10% of the species occurred as both
sporocarps and ectomycorrhizas on roots. It is common in studies which examine
the above- and below-ground ECM fungi to find disparities between the two
systems, in respect of species identities and richness and similar results have been
found in many different forest types from many different countries (Dahlberg et
al. 1997, Gardes and Bruns 1996 ; Peter et al. 2001; Richard et al. 2005; Gebhardt
et al. 2007). Nonetheless, the Mantel tests identified that the relationship between
ECM communities above-ground (sporocarps) and below-ground (ECM
morphotypes) was statistically much greater than expected by chance. In Norway
323
spruce forests in Switzerland, large differences between above-ground and below-
ground ECM richness were also found, but nonetheless, Peter et al. (2001) found
a similar relationship between the above-ground and below-ground communities
using Mantel tests, although their significance was much weaker (Mantel’s r=
0.11) than in this study.
Of those species represented above both above- and below-ground,
Russula ochroleuca was more common above- than below-ground. Its sporocarps
were found in great abundance in three of the oak, two of the Scot’s pine and two
of the Sitka spruce forests, whereas the easily-recognisable ectomycorrhizas of R.
ochroleuca were found only in one oak, one Scot’s pine and one Sitka spruce plot.
Palfner et al. (2005) found a similar trend in their Sitka spruce plots, where R.
ochroleuca was found as sporocarps at two sites and as ectomycorrhizas at only
one site. In fact, this species and other Russula and Cortinarius species have been
noted in many studies to account in relative terms, for much more of the
sporocarp biomass above-ground than ECM types below-ground (Peter et al.
2001; Dahlberg et al. 1997).
There were many species that were only found as sporocarps and never as
ECM morphotypes. From the sporocarp survey a total of 33, 29 and 22 species of
Cortinarius, Russula and Lactarius were found in the forest types. Conversely
only 4, 4 and 2 species from these genera were found as ECM morphotypes.
Differences in above- and below-ground species richness and community
composition are often due to the larger amount of sampling devoted to sporocarp
study than the ECM root examination. This study like many others before it
(Dahlberg et al. 1997; Luoma et al. 2006a), devoted more time (>1 sampling
seasons) to the study of the above-ground sporocarps than to the below-ground
ECM types (1 sampling season), which may further deepen the rift between the
above and below ground species lists. Although this is the norm in previous
studies examining the above- and below-ground fungal component of forest
ecosystems, Horton and Bruns (2001) question the larger resources and time
dedicated to the above-ground collection of sporocarps at the expense of the
below-ground examination of the roots. However, it was pointed out by Taylor
(2002) that to equally sample above- and below-ground communities on an area
basis, the number of roots tips to be examined would be overwhelming (between 7
and 72 x 104 root tips per m2 forest floor). In order to examine if there was a
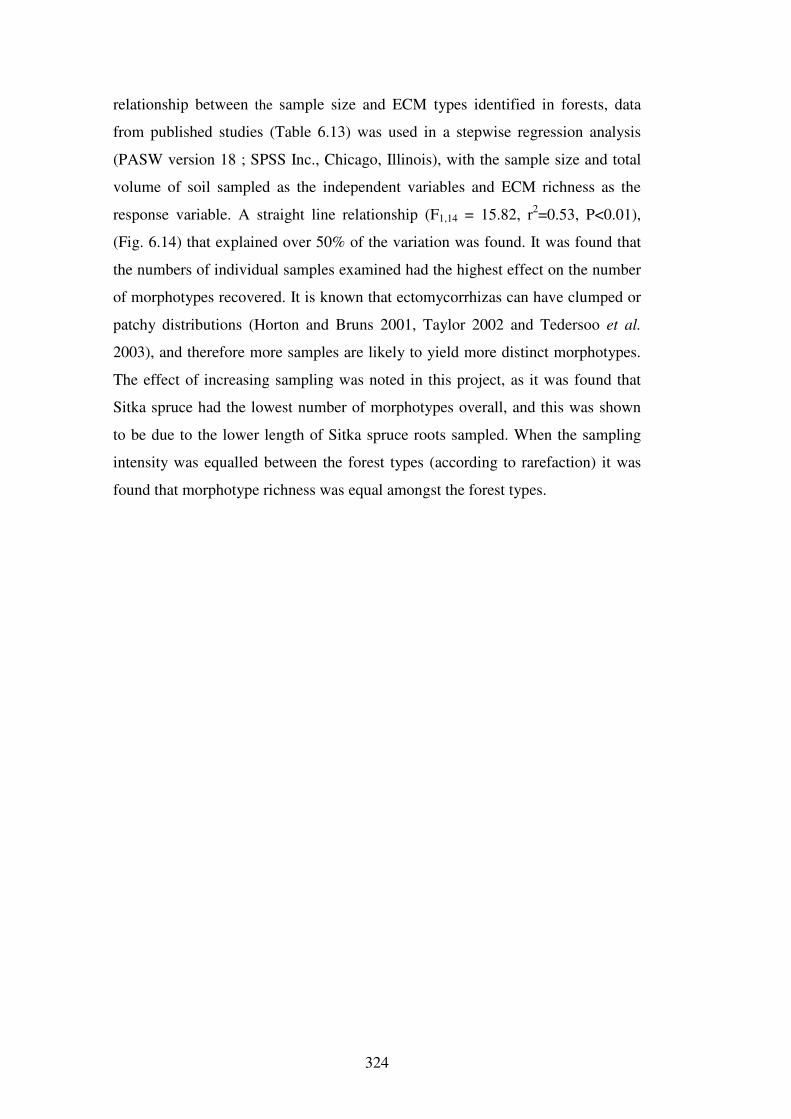
324
relationship between the sample size and ECM types identified in forests, data
from published studies (Table 6.13) was used in a stepwise regression analysis
(PASW version 18 ; SPSS Inc., Chicago, Illinois), with the sample size and total
volume of soil sampled as the independent variables and ECM richness as the
response variable. A straight line relationship (F1,14 = 15.82, r2=0.53, P<0.01),
(Fig. 6.14) that explained over 50% of the variation was found. It was found that
the numbers of individual samples examined had the highest effect on the number
of morphotypes recovered. It is known that ectomycorrhizas can have clumped or
patchy distributions (Horton and Bruns 2001, Taylor 2002 and Tedersoo et al.
2003), and therefore more samples are likely to yield more distinct morphotypes.
The effect of increasing sampling was noted in this project, as it was found that
Sitka spruce had the lowest number of morphotypes overall, and this was shown
to be due to the lower length of Sitka spruce roots sampled. When the sampling
intensity was equalled between the forest types (according to rarefaction) it was
found that morphotype richness was equal amongst the forest types.

325
Table 6.13 Details of below ground ECM studies carried out on oak, Scot’s pine and Sitka spruce forests. Column 3 refers to diversity of ECM fungi based on morphotyping or molecular methods. Column 4 lists the number of samples taken (cores or blocks of soil) and the volume of the sample unit (in parenthesis).
Country Tree type ECM
richness
Sample size Total
volume
sampled
Study objectives Reference
Ireland Oak (Quercus petraea, Q.
robur) 21 20 soil cores
(1178cm3) 47,124cm3 This project
France Oak (Q. petraea) 36 40 soil samples (2500cm3)
100,000cm3 Test of niche effect on ECM communities
Buee et al. 2007
France Oak (Q. petraea) 75 90 soil cores (1964cm3)
176,714cm3 Test of temporal variation on ECM communities
Courty et al. 2008
Germany Oak (Q. rubra) 61 128 soil cores (295cm3)
37,699cm3 Test of host age on ECM communities
Gebhardt et al. 2007
U.S.A. Oak (Q. rubra) 33 96 soil cores (196cm3)
18,850cm3 ECM communities of urban and rural oak forests
Baxter et al. 1999
U.S.A. Oak (2 species Q.
douglasii, Q. wislizeni) 140 64 soil cores
(900cm3) 57,600cm3 ECM communities of
different oak habitats Morris et al. 2008
Ireland Scot’s pine (Pinus
sylvestris) 20 20 soil cores
(1178cm3) 47,124cm3 This project
Scotland Scot’s pine (P.Sylvestris) 24 217 soil cores (393cm3)
85,216cm3 Spatial and temporal variation of ECM fungi
Pickles et al. 2010
Sweeden Scot’s pine (P.Sylvestris) 135 120 soil cores (92cm3)
11,084cm3 Response of ECM communities to fire
Jonsson et al. 1999
Finland Scot’s pine (P.sylvestris) 34 60 seedlings N/a Effect of clear-cut practice on ECM communities
Heinonsalo et al. 2007
Sweeden Scot’s pine (P.sylvestris) 37 30 cores (92cm3)
2771cm3 Relationship between sampling effort and ECM
Taylor 2002
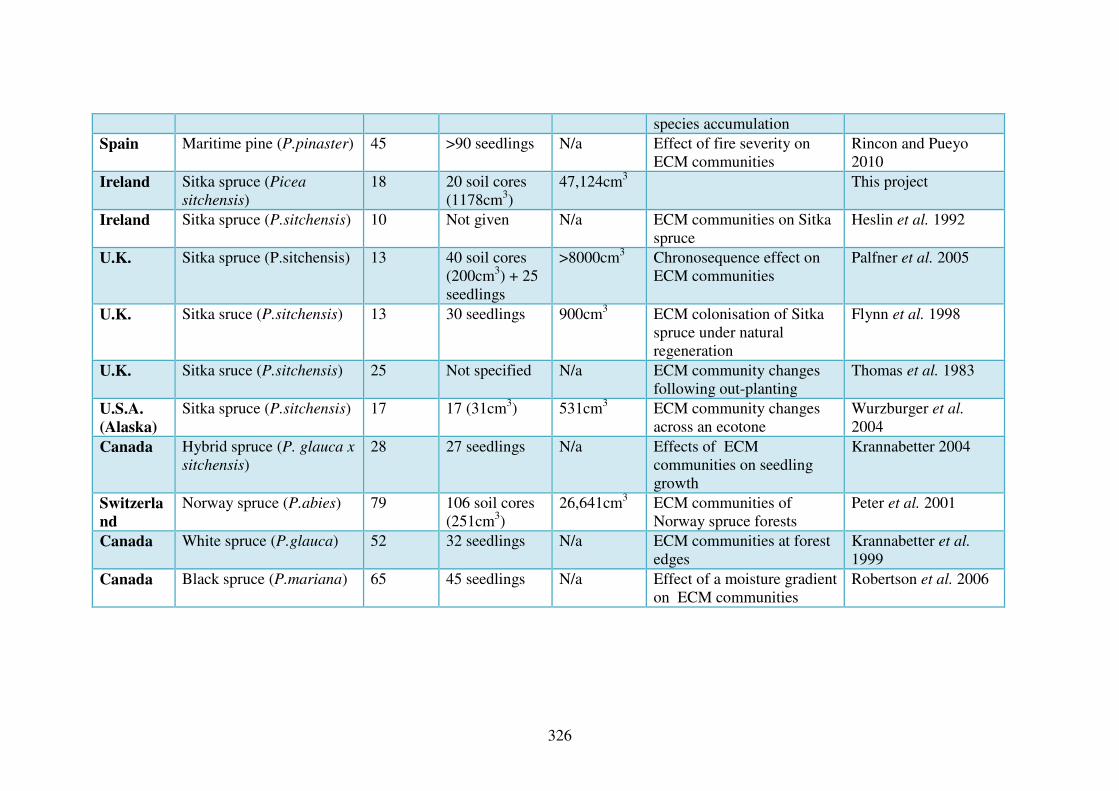
326
species accumulation
Spain Maritime pine (P.pinaster) 45 >90 seedlings N/a Effect of fire severity on ECM communities
Rincon and Pueyo 2010
Ireland Sitka spruce (Picea
sitchensis) 18 20 soil cores
(1178cm3) 47,124cm3 This project
Ireland Sitka spruce (P.sitchensis) 10 Not given N/a ECM communities on Sitka spruce
Heslin et al. 1992
U.K. Sitka spruce (P.sitchensis) 13 40 soil cores (200cm3) + 25 seedlings
>8000cm3 Chronosequence effect on ECM communities
Palfner et al. 2005
U.K. Sitka sruce (P.sitchensis) 13 30 seedlings 900cm3 ECM colonisation of Sitka spruce under natural regeneration
Flynn et al. 1998
U.K. Sitka sruce (P.sitchensis) 25 Not specified N/a ECM community changes following out-planting
Thomas et al. 1983
U.S.A.
(Alaska)
Sitka spruce (P.sitchensis) 17 17 (31cm3) 531cm3 ECM community changes across an ecotone
Wurzburger et al. 2004
Canada Hybrid spruce (P. glauca x
sitchensis) 28 27 seedlings N/a Effects of ECM
communities on seedling growth
Krannabetter 2004
Switzerla
nd
Norway spruce (P.abies) 79 106 soil cores (251cm3)
26,641cm3 ECM communities of Norway spruce forests
Peter et al. 2001
Canada White spruce (P.glauca) 52 32 seedlings N/a ECM communities at forest edges
Krannabetter et al. 1999
Canada Black spruce (P.mariana) 65 45 seedlings N/a Effect of a moisture gradient on ECM communities
Robertson et al. 2006
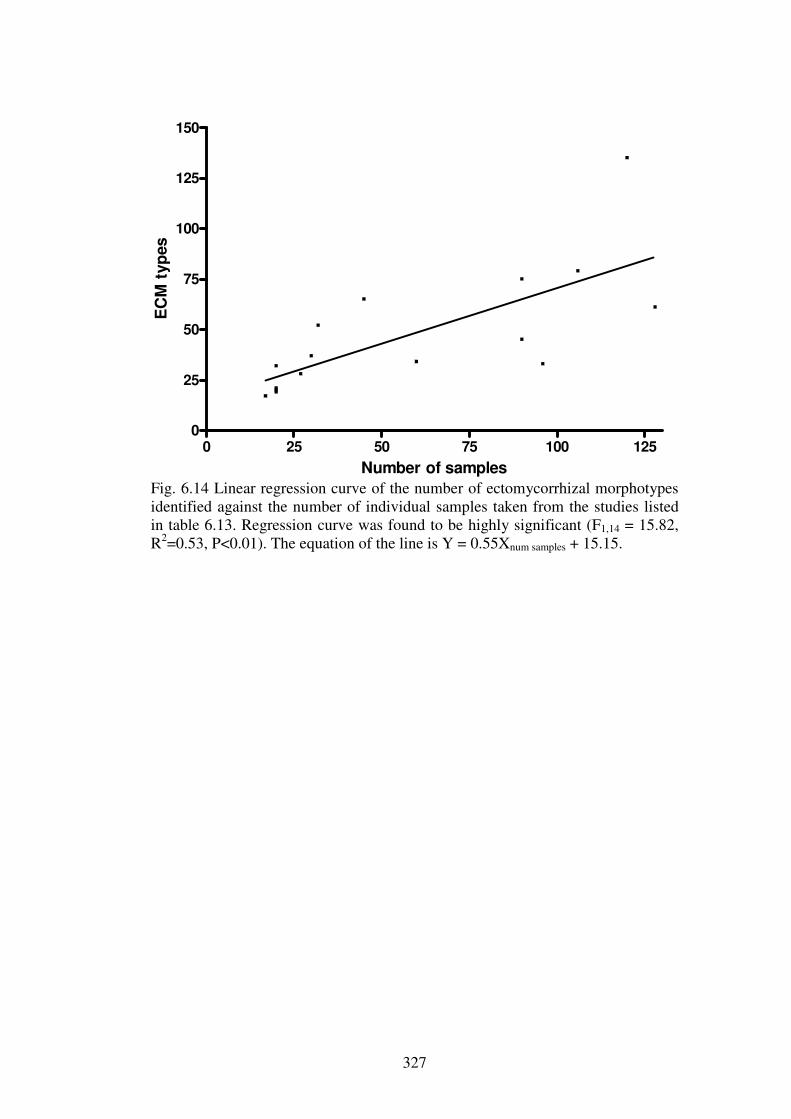
327
0 25 50 75 100 1250
25
50
75
100
125
150
Number of samples
EC
M t
yp
es
Fig. 6.14 Linear regression curve of the number of ectomycorrhizal morphotypes identified against the number of individual samples taken from the studies listed in table 6.13. Regression curve was found to be highly significant (F1,14 = 15.82, R2=0.53, P<0.01). The equation of the line is Y = 0.55Xnum samples + 15.15.

328
6.5 Conclusions
• The ECM communities of Irish forests showed a strong correspondence
with the dominant tree type of the forest.
• There were no significant differences between the total richness of ECM
types across the different forest types.
• Sitka spruce forests have an abundance of ECM morphotypes that are
normally found on nursery trees. The short rotation of Sitka spruce forests
in Ireland may favour these nursery ECM communities and also ECM
species that can form long-lived resistant propagules.
• The similarity of above- and below-ground ECM species was found to be
very low in this project with less than 10% of the ECM morphotypes
found as sporocarps.

329
Chapter 7: General discussion and
conclusions

330

331
7.1 Macrofungal diversity in Irish forest sites
Macrofungal diversity was assessed in this project from two different aspects: by
recording of sporocarps and identification of ectomycorrhizas on tree roots. A
large number (409) of macrofungal species were identified from sporocarps in the
three years of this project, including 48 species new to Ireland. These results
concur with the hypothesis of O’Hanlon and Harrington (in press), which suggests
that the majority of Ireland’s as yet undiscovered agaricomycete diversity may be
found in forests. Between 54% and 68% of the species, depending on forest type,
were only found on one plot visit and so would appear to sporulate irregularly.
Sitka spruce forests were found to contain the greatest species richness of
macrofungi of all the forest types, followed by oak, Scot’s pine and ash forests.
Sitka spruce forests in the U.K. have similarly been shown to support a high
species richness of macrofungi (Humphrey et al. 2003; C. Quine, unpub. data),
although not as high as the pedunculate oak forests also investigated in the U.K.
This project utilized sample-based rarefaction to overcome the methodological
issue of unequal numbers of plots (a similar non-orthogonal study design was
employed by Humphrey et al. 2003). Using sample-based rarefaction, it was
found that the species richness of the forest types was not significantly different
between oak, Scot’s pine and Sitka spruce forests. There was no significant
difference between the species richness of the young or mature Sitka spruce plots.
It is possible that the age of the mature site grouping was not old enough to allow
for the development of specific “late-successional” fungi as found in coniferous
forests in Canada (Krannabetter et al. 2005) and Spain (Bonnet et al. 2004).
Species-richness estimators (Chao2, Incidence based Coverage Estimator
[ICE], Abundance based Coverage Estimator [ACE]) produced the same results
for the ranking of the forest types based on species richness. Richness estimation
revealed that 45, 65, 52 and 77% of the species richness had been recorded in the
ash, oak, Scot’s pine and Sitka spruce forests types respectively. The use of
species-richness estimators in macrofungal studies is not common and the
reliability of such estimators in macrofungal studies has been questioned (Schmit
et al. 1999; Unterseher et al. 2008). However, Schmit et al. (1999) found that the
Chao and Jacknife estimators gave fairly accurate estimates of macrofungal
diversity in oak forest by estimating from data compiled in year 1 of the study, to
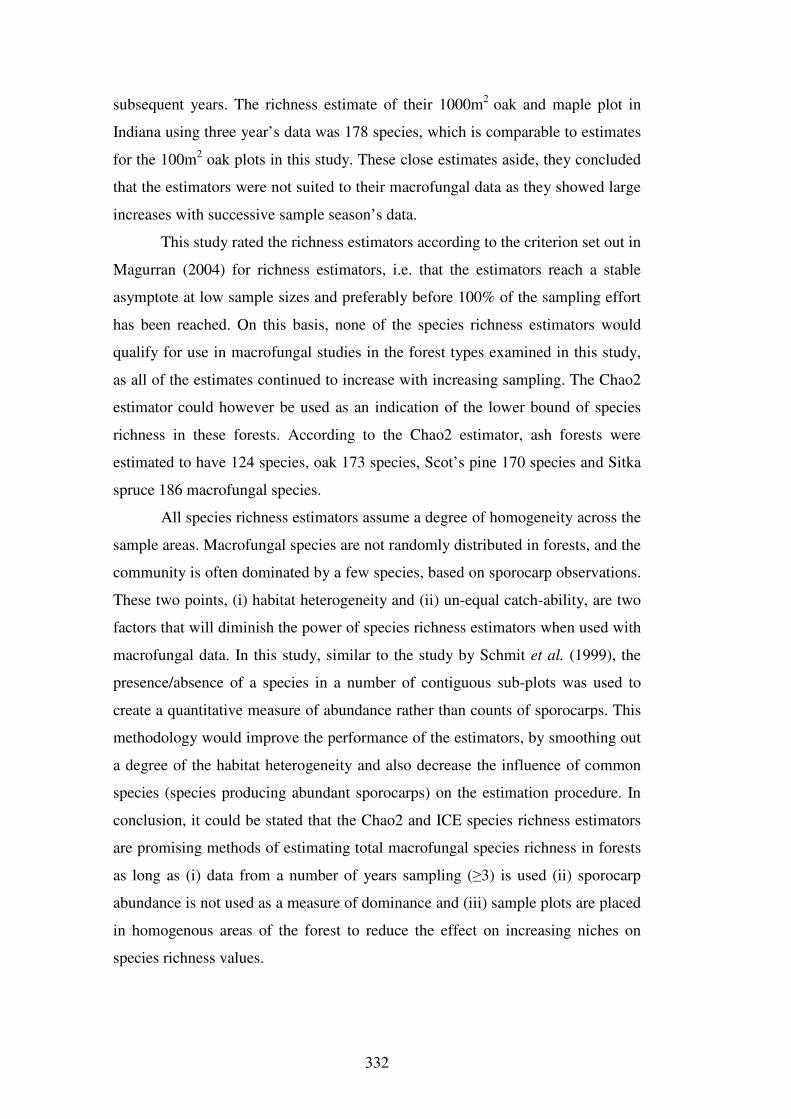
332
subsequent years. The richness estimate of their 1000m2 oak and maple plot in
Indiana using three year’s data was 178 species, which is comparable to estimates
for the 100m2 oak plots in this study. These close estimates aside, they concluded
that the estimators were not suited to their macrofungal data as they showed large
increases with successive sample season’s data.
This study rated the richness estimators according to the criterion set out in
Magurran (2004) for richness estimators, i.e. that the estimators reach a stable
asymptote at low sample sizes and preferably before 100% of the sampling effort
has been reached. On this basis, none of the species richness estimators would
qualify for use in macrofungal studies in the forest types examined in this study,
as all of the estimates continued to increase with increasing sampling. The Chao2
estimator could however be used as an indication of the lower bound of species
richness in these forests. According to the Chao2 estimator, ash forests were
estimated to have 124 species, oak 173 species, Scot’s pine 170 species and Sitka
spruce 186 macrofungal species.
All species richness estimators assume a degree of homogeneity across the
sample areas. Macrofungal species are not randomly distributed in forests, and the
community is often dominated by a few species, based on sporocarp observations.
These two points, (i) habitat heterogeneity and (ii) un-equal catch-ability, are two
factors that will diminish the power of species richness estimators when used with
macrofungal data. In this study, similar to the study by Schmit et al. (1999), the
presence/absence of a species in a number of contiguous sub-plots was used to
create a quantitative measure of abundance rather than counts of sporocarps. This
methodology would improve the performance of the estimators, by smoothing out
a degree of the habitat heterogeneity and also decrease the influence of common
species (species producing abundant sporocarps) on the estimation procedure. In
conclusion, it could be stated that the Chao2 and ICE species richness estimators
are promising methods of estimating total macrofungal species richness in forests
as long as (i) data from a number of years sampling (≥3) is used (ii) sporocarp
abundance is not used as a measure of dominance and (iii) sample plots are placed
in homogenous areas of the forest to reduce the effect on increasing niches on
species richness values.
333
7.2 Macrofungal functional group diversity
The proportions of the different functional group species in each forest type varied
significantly. Oak forests were found to have more wood-decay macrofungi than
the coniferous forests. A lack of coarse woody debris has been identified in the
past in Irish plantation forests (Sweeney et al. 2010a), and this was most likely the
cause for the inequalities in functional groups across the forest types. Previous
work in U.K. forests, has shown that the richness of wood-decay macrofungal
species was positively linked to the amount of coarse woody debris (Ferris et al.
2000a).
The Sitka spruce forest type was found to be the most species rich forest
type, with particularly high species richness in the litter-decay and
ectomycorrhizal functional groups. Sitka spruce forests are known to have high
species richness in some litter-decay genera, such as Mycena (Outerbridge 2002).
A reason for this may be the low levels of monoterpenes released from Sitka
spruce needles during decomposition (Ludley et al. 2008). Monoterpenes are
known to have anti-bacterial and anti-fungal properties, and their low levels in
Sitka spruce litter could allow for decomposition of the needles by many different
macrofungal species. Alexander and Watling (1987) offer the high tree species
diversity encountered by Sitka spruce in its home range, as a reason for the large
number of ectomycorrhizal species capable of forming ectomycorrhizas with
Sitka spruce. The ability to form ectomycorrhizas with more ectomycorrhizal
fungi would allow regenerating Sitka spruce seedlings to quickly tap into the
common mycorrhizal networks of the surrounding mature trees, and thus gain an
advantage over ectomycorrhizal selective tree species. A point that would agree
with Alexander and Watling’s hypothesis is that the most species rich genera of
ectomycorrhizal fungi in Sitka spruce forests were Cortinarius and Russula, both
of which were identified as ectomycorrhizal genera with low host specificity
(Molina et al. 1992).
When ectomycorrhizal species are excluded, forest type comparisons
including the ash forest type, show that Sitka spruce forests would be the most
species rich, followed by oak, ash and Scot’s pine. Although ash forest lack
ectomycorrhizal species, the old un-managed ash forests investigated in this
project had similar levels of rarefied species richness as many of the oak plots (21
species after four plot visits). Old ash forests can support very high species

334
richness of macrofungi (Hering 1966; Straatsma and Krisai-Greilhuber 2003),
with many species capable of sporulating on dry substrates (e.g. Xylaria
hypoxylon) selected for by the dry climate experienced in ash forests, particularly
after defoliation (Gibbs 1957).
The species richness of Scot’s pine forests may be adversely affected by
the lack of native Scot’s pine stands in Ireland. Distance to native pine woods was
positively related to the numbers of rare macrofungal species recorded in the U.K.
plots of Humphrey et al. (2000), and therefore it may be assumed that native
Scot’s pine forests provide a source of macrofungal inoculum for establishing
Scot’s pine forests. The retention of mature patches of forest stands after final
harvesting, as advocated by Peterken et al. (1992), would serve to provide a
source of macrofungal inoculum in the form of spores and mycelia, that could
then recolonise the newly planted forest and increase the functional diversity of
macrofungi in these forests.
7.3 Below-ground ectomycorrhizal diversity
Scot’s pine forests were found to have the highest proportional ectomycorrhizal
species richness, based on sporocarps, of all the forest types. The Scot’s pine
forest type was also the second most morphotype-rich forest type, according to
total morphotype richness and to the species richness estimators using below-
ground morphotype results. Pinus is known to associate with large numbers of
ectomycorrhizal species (Newton and Haigh 1998), few of which are restricted to
pine (~7%), in contrast to Betula (18%) and Quercus (13%), and this may help
increase the species richness of ectomycorrhizal morphotypes in Scot’s pine
forests.
The ectomycorrhizal community of Sitka spruce forests was found to be
composed of more “nursery type” ectomycorrhizas than oak forests. Nursery type
ectomycorrhizas are ectomycorrhizas that grow well in nursery conditions, with
relatively controlled environmental stresses and sufficient nutrients for tree
growth. The replacement of these ectomycorrhizas can begin soon after out-
planting (Palfner et al. 2005), as species found to colonise roots by mycelial
contact through emanating hyphae have been shown to be more common on roots
than species such as nursery-type ectomycorrhizas that colonise from spores, at
least in undisturbed mature forests (Pickles et al. 2010; Peter et al. 2001).
335
In this study as in others (Horton and Bruns 2001), the similarity between
below- and above-ground ECM communities was low. Some of the possible
explanations for the discrepancies between above- and below-ground abundance
are:
• Some species rely more on spores than mycelia contact to colonize new roots,
and therefore produce more sporocarps than species that rely on mycelial
contact in the rhizosphere (Peay et al. 2011). Peay et al. propose that species
which colonise readily from spores in lab experiments (e.g. Laccaria spp.,
Hebeloma spp.) often need to produce large amounts of fruitbodies in order to
ensure their survival in a habitat. Laccaria lacatta and L. amethystina were
two of the most common fruitbody producers in the three forest types in this
project, and these species are known to rely on spores for their continued
presence in the rhizosphere (Gherbi et al. 1999). Russula ochroleuca was also
very common as sporocarps in this project, and results of molecular marker
studies in pine forests in California have revealed that spore propagation
plays a large part in the colonization strategies of some Russula and Lactarius
species (Redecker et al. 2001). Colour plates 3, 4, 5 and 6 highlight the
prolific fruiting of some Russula and Lactarius species in this project, and
would lend support to the Peay et al. hypothesis about the relationship
between sporocarp production and ECM functional morphology.
• Insufficient below-ground sampling intensity (Taylor 2002). It is possible that
increased sampling would lessen the disparities between the above- and
below-ground species lists. It is unavoidable that some species that do not
form sporocarps will always be missed above-ground (e.g. Cenococcum
geophilum), but sample size, or more specifically the number of separate
samples taken, will increase the species richness discovered in the forest. The
difficulty with trying to give equal time and resources to the above- and
below-ground study of ectomycorrhizas has been commented upon by Taylor
(2002), and it is estimated that equal sampling of the above- and below-
ground communities is not feasible, at least not on an equal area basis.
7.4 The macrofungal communities of Irish forests
There were discontinuities in the distributions of macrofungi between the four
forest types, giving rise to distinct assemblages or communities. These
336
communities were composed of common species (e.g. Mycena leptocephala),
exclusive species (e.g. Daldinia concentrica with ash forests) and characteristic
species that were more common in one forest type than in other forest types (e.g.
Laccaria amethystina with oak forests). Wilkins et al. (1937) applied these
groupings to the macrofungi found in British deciduous forests, and noted that
they could be used to clearly define a macrofungal assemblage/community in
British oak and beech forests. Difficulties arise in using ephemeral and sporadic
sporocarps to distinguish macrofungal assemblages (Watling 1995). The unknown
relationship between sporocarp abundance and functional role in ecosystems, have
hampered the effectiveness of macrofungal sporocarps to describe functional
communities of fungi. This study utilized the presence of species in a number of
contiguous sub-plots as a measure of abundance, rather than using counts of
fruitbodies. Similar methods using sub-plots frequencies as quantitative measures
have been used by Bills et al. (1986) and Schmit et al. (1999), and their use is
more ecologically meaningful than that of sporocarp counts. Sporocarp production
is highly related to meteorological variables (Krebs et al. 2008), therefore, using
sporocarp abundance as a quantitative measure will produce data with large
seasonal fluctuations and may diminish the power of multi-variate statistical
techniques. However, the obvious pitfalls to using sporocarp presence as an
indicator of species presence have not reduced the significance of sporocarp based
studies; and these have successfully described distinctive macrofungal
communities in a wide range of forest types (Ferris et al. 2000a; Humphrey et al.
2000; Kranabetter et al. 2005; Buee et al. 2011). Information as to host
preference, species’ response to abiotic, biological and environmental variables,
and ectomycorrhizal richness response to forest management techniques, have all
been identified in the sporocarp only studies listed above.
This study revealed possible host preference for a number of macrofungal
species. Using indicator species analysis, seventeen species were identified that
showed some levels of preference for a certain forest type. The majority of the
species were decay species, with only four ectomycorrhizal species (oak:
Laccaria amethystina, Lactarius quietus; Scot’s pine: Lactarius hepaticus; Sitka
spruce: Russula emetica) showing preference for a specific forest type. The
resource specificity of certain decay macrofungi is well established through both
field-based (Frankland 1998; Unterseher and Tal 2006) and laboratory studies
337
(Boddy 2001; Ludley et al. 2008), so the fact that the majority of macrofungal
species found to strongly indicate tree species preference are wood- and litter-
decay species is not surprising. These species are more likely to discriminate
macrofungal communities, especially as levels of ectomycorrhizal specificity
world-wide (Molina et al. 1992) and in the U.K. (Newton and Haigh 1998) have
been noted as being low. The majority of species that showed restriction to a
single forest type in this study were decay fungi. Moreover, there are certain
species that can associate with several tree species, but often associate with one
tree species more than others. It is this quantitative aspect of macrofungal species
ecology that the community analysis of macrofungi should focus upon (Tyler
1992).
The results of this study found that the Scot’s pine and oak macrofungal
communities were the most distinctive. The plots of these two species formed
distinct groups in ordination and were also indicated strongly by certain wood-
decay species (e.g. Stereum hirsutum with oak and Trichaptum abietinum with
Scot’s pine). In a previous study of the macrofungal community of Scot’s pine
forests in the U.K. (Humphrey et al. 2003), it was found that both “old growth”
and plantation Scot’s pine forests formed distinct macrofungal assemblages. A
related study on plantation Scot’s pine forests in England (Ferris et al. 2000a),
found that the decay species Auriscalpium vulgare, Baeospora myosura,
Trichaptum abiteinum and ectomycorrhizal species Lactarius hepaticus were
common to all the Scot’s pine plots. These four species were also found to be
either exclusive or characteristic species of Scot’s pine forests in this study.
The finding that oak forests have a distinctive macrofungal community
appears to conflict with the existing information of oak forest macrofungal
communities (Tyler 1992; Wilkins et al. 1937; Watling 1974, 2005), which
identified oak communities as having a non-specific macrofungal community. It is
likely that differences in study design between this project and the previously
listed references are the reason for this conflict of results. The above studies all
investigated the macrofungal communities of oak plots and beech plots. When the
two are compared, the oak macrofungal community is much less distinctive than
that of a beech or birch forest. For example, Tyler (1992) noted 26 species as
showing some sort of affinity to beech forests, 24 with hornbeam, but only 12
species showed a significant relationship with oak forests in Sweden, based on the
338
relative frequency of species observations with a particular tree species. These
findings are in agreement with Watling (2005), that the Scottish oak wood mycota
may be an impoverished version of the English oak mycota, which in turn is an
impoverished form of the continental European mycota. Results from this study
and also from the meta-analysis by O’Hanlon and Harrington (in press), show that
the genera that are characteristically rich in British oak woods (e.g. Boletus), may
be nationally rare/extinct from Ireland (North and South). The historical removal
of Ireland’s oak forests may have caused extinction of oak associated species,
particularly ectomycorrhizal species, as these cannot survive when cut-off from a
host supply of carbohydrate.
The macrofungal community of Sitka spruce forests was found to share
many species similarities with Irish oak and Scot’s pine forests. The genus Picea
has been identified as an ectomycorrhizal generalist in the U.K. (Newton and
Haigh 1998), with Sitka spruce being especially noted as an ectomycorrhizal
generalist in its home range (Alexander and Waling 1987). Results of this study
would corroborate with Alexander and Watling’s hypothesis regarding the
ectomycorrhizal generalist nature of Sitka spruce. The results from the
Biodiversity in Britain’s planted forests (Humphrey et al. 2003; C. Quine, unpub.
data) would also indicate that in Western Europe, Sitka spruce is an
ectomycorrhizal generalist and forms ectomycorrhizas with many native
ectomycorrhizal fungi. Of the 111 ectomycorrhizal species found in British Sitka
spruce forests, 41 were also found in either oak or Scot’s pine forests and 31
species were common to oak, Scot’s pine and Sitka spruce forests. The
communities of other organisms in Sitka spruce forests in Ireland have also been
noted as being composed mainly of generalist species. Examinations of the
vascular species (French et al. 2007), spider communities (Oxbrough et al. 2006a)
and bird assemblages (Sweeney et al. 2010b) have shown that Sitka spruce
plantations are often dominated by generalist species. This stems from the fact
that Sitka spruce is not a native tree species to Ireland, and the species that
normally are found with it in its home range may not have reached Ireland. The
high species richness of native macrofungi in Sitka spruce forests in this study
therefore agree with the conclusions of Smith et al. (2006) for Ireland and Quine
and Humphreys (2010) for the U.K.: that Sitka spruce plantations in Ireland and
339
England are “complementary habitats” (Barlow et al. 2007) for the conservation
of native species groups.
Other researchers have also identified differences in abiotic variables
(Wilkins and Patrick 1939; Ruhling and Tyler 1990) and understory vegetation
(Wilkins et al. 1938; Baar 1996) as factors affecting the macrofungal communities
in forests. It is known that certain ectomycorrhizal species have preferences for
low or high pH (Hung and Trappe 1983), low or high soil nitrogen (Lilleskov et
al. 2002) and amounts of soil organic matter (Tyler 1985; Harrington and Mitchell
2005a). This research tested for correlations of the abiotic, understory cover and
soil organic matter, and the ordination axes derived from the multi-variate
analysis of the macrofungal communities. Although relationships between soil
abiotic variables and soil organic matter were found, it is believed that they were
not the main drivers of community structure in these forests types. This can be
stated because:
(i) Certain species were found to be just as common in all sites of a particular
forest type, despite differences in soil abiotic variables. The species Lactarius
hepaticus and L. rufus were of similar frequency in the Scot’s pine plots at
Annagh, Gortnagowna and Derryhogan. L. hepaticus is noted as a species that is
broadly tolerant of nitrogen and probably increasing in distribution due to
increasing levels of nitrogen deposition in European forests (Heilmann-Clausen et
al. 1998). Other species that are present in these three Scot’s pine plots are
Mycena leptocephala, Ricknella fibula, Trichaptum abietinum and Russula
ochroleuca. The frequencies of all these species are similar in the three
aforementioned Scot’s pine plots, despite differences in soil pH, available
nitrogen, calcium, magnesium and phosphorus. This finding would lend more
weight that macrofungal communities are more structured by the influence of the
dominant tree species than soil abiotic variables.
(ii) The data from Chapter 3 was used to classify the forest plots into their
woodland classifications according to Fossitt (2000). When an MRPP analysis
was run (as in Section 5.3.6, Chapter 5), two different grouping variables were
used to test if the macrofungal communities of the plots were not randomly
distributed between the different forest plots, but rather formed distinct
assemblages, according to the user-assigned grouping variable of the plots. In this
analysis, both the dominant tree species of the plots (ash, oak, Scot’s pine or Sitka
340
spruce) and the vegetation classification (five groupings: WN1, WN2, WN7,
WD1 and WD4) of the sites were used as grouping variables. Although both
grouping variables were significant at grouping the macrofungal communities, the
effect of dominant tree species was higher, according to a higher A statistic
(0.0687 for tree type vs. 0.0618 for vegetation type).
7.5 The value of plantation forests as habitats for macrofungal diversity
Other studies of plantation forests in Ireland have also found that plantation
forests could serve as habitats for native flora and fauna and so aid in the
conservation of native species. French et al. (2008) examined the vascular plant
communities of plantation Sitka spruce, larch and ash forests. They found that in
some plantation forests, low levels of plant diversity are found, due to competitive
exclusion by fast growing species, but that vascular species biodiversity can be
increased by increasing the CWD quantity and quality remaining on site and
through the promotion of chronologically heterogeneous forests. Oxbrough et al.
(2006a) found that the initial effects of afforestation on the spider communities of
grassland and bog habitats, was a reduction in species diversity due to the
replacement of habitat specialist species with more generalist species. However,
they did find that plantations supported a number of forest specialist species. In
related research, Oxbrough et al. (2006b) found that the inclusion of open spaces
(both glades and road/path verges) in the forest could be used to increase the
biodiversity of spiders found in plantation forests. These open spaces would
provide a different habitat type, to that of the forest canopy and forest floor, thus
increasing the range of habitats available in plantations. Research into the bird
communities of native and plantation forests in Ireland has also identified the
creation of a diversity of habitat types within plantation forests as important for
increasing bird species richness and diversity (Sweeney et al. 2010b). Sweeney et
al. compared the bird communities of oak, ash and plantation Sitka spruce forests,
and found that bird species richness was highest in oak, followed by ash and then
Sitka spruce forests. They related this decreasing species richness to the levels of
understory vegetation cover, and proposed that bird species richness and diversity
would increase, if management techniques that decreased canopy cover and
increase understory vegetation were applied to plantation forests.
341
The diversity and species richness of carabid beetles, in both first and
second rotation Sitka spruce plantations, was investigated by Oxbrough et al.
(2010). They found that beetle species richness and diversity increased as the
forest aged. This result is the opposite of that found for the spider assemblages in
the same sites, with spider species richness decreasing as the canopy closed and
the forest aged. They attribute this to the differing colonisation methods of beetles
from those of spiders. Beetles rely on flight to enter habitats, thus they take longer
to re-colonise a habitat after clearfelling of standing trees. Again, the creation of
chronological heterogeneity was identified as a management technique that would
lead to increased beetle richness and diversity in plantation forests. Arroyo et al.
(2010) examined the mesostigmetid mites of Irish Sitka spruce plantation forests.
They found that the mite species richness was lower than that recorded for Sitka
spruce in its home range of North America, but that there were species that were
restricted to specific niches (e.g. epiphytic moss habitat). Using Detrended
Correspondence Analysis they identified a number of different moss and bare
surface mite communities. Although not commented on in the research, it could
be hypothesised that by increasing canopy open-space and ground floor
vegetation, more micro-niches would be created and so increase the habitats for
more mite species.
The studies by French et al. (2008), Oxbrough et al. (2006b), Sweeney et
al. (2010b), Oxbrough et al. (2010) and Arroyo et al. (2010), all indicated that
management techniques that increase the number of different micro-habitats
within plantation forests would also increase biodiversity. The retention of mature
patches of forest stands after final harvesting, as advocated by Peterken et al.
(1992), Ferris et al. (2000a) and Humphrey (2005), would help in the creation of
many micro-habitats within the plantation forest. These retained patches would
also serve to provide a source of fungal inoculum in the form of spores and
mycelia, which could then recolonise the newly planted forest and increase the
functional diversity of macrofungi in these forests.
Biodiversity indicators are useful methods of estimating the biodiversity of
a forest site without having to examine the diversity of the individual taxonomic
groups (Noss 1999; Lindenmayer et al. 2000). It has been suggested that vascular
plant diversity in forests can be used to estimate macrofungal diversity (Schmit
and Mueller 2007). From previous studies that examined both vascular plant
342
species richness and macrofungal species richness, a 2:1 ratio for macrofungi to
vascular plants has been found in Canadian forests (Villeneuve et al. 1989); while
on the Hebrides, Scotland, a 1.5:1 ratio has been recorded (Dennis 1986). Results
from this study indicate that the macrofungi to vascular species richness was
similar to that of Villeneuve et al. (1989) (~2:1) for ash and Scot’s pine forests,
but higher for oak (~3:1) and Sitka spruce (~6:1) forests. There was also high
variability in the ratios between the individual sites in each forest type.
The estimate found for Sitka spruce forests using the macrofungal to plant
ratio, was much lower than the actual species richness of this forest type. Sitka
spruce plantations in Ireland constitute a “novel ecosystem” (sensu Hobbs et al.
2006). The ecosystem created by Sitka spruce plantations in Ireland is highly un-
natural, with a low species richness of vascular plants due to the closed canopy of
Sitka spruce monocultures. In an old-growth state in its home range, the Sitka
spruce forest type is characterised by a mixture of tree species, an abundance of
CWD (especially fallen mature trees) and a mixture of chronological stages of the
forest cycle (Peterson et al. 1997). These three factors have the effect of
increasing the diversity of vascular plant species in native Sitka spruce forests.
The application of estimation techniques created for natural ecosystems to these
novel ecosystems should be done with caution, as the new biotic assemblages of
these novel ecosystems are not fully understood. Changes in key interactions and
processes, such as plant–animal interactions, microbial communities and the
breaking down organic matter in soils are all important yet unknown factors in
these habitats. Young coniferous forests (e.g. Sitka spruce) can be poor in
vascular plants, but can have very high macrofungal species richness; while
deciduous forests (e.g. ash) can have high plant species richness, yet very low
macrofungal species richness. A greater understanding of these novel ecosystems
is needed before such broad-scale estimation is applied to native and plantation
forests.
7.6 Unanswered questions and future research directions
This study, the first systematic long-term study of macrofungal diversity in Irish
forests, will hopefully provide a basis for further investigations in the following
areas:
343
• This study primarily used sporocarp collection and identification as a means
of confirming a species presence in a plot. Recently, the focus is changing
from species which fruit in forests to species that are present as mycelium in
forests. The recent advances in next-generation sequencing techniques has
allowed for the identification of large levels (1000 operational taxonomic
units) of species richness from fungal DNA extracted directly from forest
soils in one year (Buee et al. 2009). Compare this to the ca. 900 species
identified from deciduous and coniferous plots in Switzerland over seven
years sampling by Straatsma and Krisai-Greilhuber (2003). In a pine forest in
the U.K. Orton (1987) identified 662 species of fungi over the course of 30
years. The large amount of species identified from a small sampling time
period is one of the main benefits of next-generation sequencing. However,
next generation sequencing methods are not without their disadvantages,
problems with the application of this relatively new method to fungal ecology
are discussed by Tedersoo et al. (2010), Ovaskainen et al. (2010) and Hibbett
et al. (2011). These authors unanimously agree that these methods will reveal
large amounts of important data on fungal distributions and community
composition, so long as the experimental procedures, data management and
sequence matching methods are standardised and a high quality sequence
database is used for identifications. This project has now set a baseline for
information for fungal species richness and community structure in these
plots and forest types. A follow up study using next-generation sequencing
methods should reveal links between the fungi that produce sporocarps, ECM
root fungi and the fungi present as mycelium in the soils of these forests.
• Many studies have shown that the cumulative species curve for macrofungi
can continue to increase after many years of sampling (Orton 1987; Tofts and
Orton 1998; Straatsma et al. 2003). Further periodic sampling in the plots
from this project will reveal even more information about the undiscovered
species and the fungal communities in these forests regarding the:
(1) Total species richness of macrofungi in these plots: including the species
where fruiting was missed, species with minute sporocarps and species
which only fruit on rare occasions.
344
(2) Validation of the species richness estimations that were generated for the
forest types and forest plots to be tested with real data.
(3) Information about the change in fungal community as the forest ages,
similar to studies by Deacon and Fleming (1992) and Kranabetter et al.
(2005).
• A logical follow up to this project would be to examine the macrofungal and
ectomycorrhizal communities of other tree species, such as beech and birch
woods. Other exotic species, i.e. lodgepole pine and Norway spruce, are also
widely planted in Ireland in commercial forests. It would be interesting to
investigate the macrofungal communities of beech and birch woods, as these
forests are known to have a rather specific macrofungal community, at least
in Scotland (Watling 2005). Following on from the investigation of the
macrofungal community of the other tree species widely planted in Ireland,
an investigation into the effect that mixed tree species forests have on
macrofungal diversity would reveal information relating the effects of tree
species composition on fungal biodiversity. It is known that mixing certain
tree species into forest plantations (e.g. birch trees mixed in with Spruce
woodlands in Scotland; Alexander and Watling 1987) can produce a
significant increase in fungal species richness of the forest, over
corresponding single species forests. Investigation into the differences in
macrofungal communities of very mature (>80 years old) stands would also
reveal interesting information about the late-stage fungal communities of
Sitka spruce forests in Ireland.
• The relationship of macrofungal diversity to that of other taxonomic groups
in these forest types needs to be investigated. This research was part of a
larger work-package which sought to examine the diversity of soil
decomposers and predatory and parasitic arthropods. The synthesis of the
work-package will draw together the results from fungi and soil-arthropods
and make conclusions about the relationship between the biodiversity of the
two groups and recommendations about ways to foster increases in the
biodiversity of both groups.
345
• A final recommendation that can be made from the results of this project is
that the knowledge revealed about Irish forest macrofungi in this project
should be built upon. In agreement with O’Hanlon and Harrington (in press),
two of the main points for future consideration should be the establishment of
a community of fungal recorders that conduct regular macrofungal surveying
in Irish forests and the promotion of a macrofungal recording database along
the lines of The National Biodiversity Data Centre Mapping System
(http://www.biodiversityireland.ie/). Once records of species are confirmed
by a trained taxonomist, their distribution and notes on ecology can be
entered into this database, which would serve as a valuable resource in
discovering the fungal part of Ireland’s biodiversity.
7.7 Final conclusions: Plantations as a habitat for native macrofungi
This project is foremost a follow-up to the investigation of the biodiversity of
other taxonomic groups in Irish plantation and native forests (Smith et al. 2005;
Iremonger et al. 2006; Smith et al. 2006). To date, the biodiversity of vascular
plants, bryophytes, hoverflies, spiders, birds, soil microarthropods, parasitoid
wasps, nematodes and fungi (macrofungi and ectomycorrhizal morphotypes) have
been investigated through COFORD projects. The results of this project are in
agreement with those investigating biodiversity of other taxonomic groups in
plantation forests (Humphrey et al. 2003; Smith et al. 2005); that plantation
forests can provide complementary habitats for macrofungi and so help in the
conservation of biodiversity in Ireland. This finding highlights the potential for
the use of plantation forests to conserve biodiversity, and help Ireland meet the
key condition of the new draft of the Conference of the Parties to the Convention
on Biological Diversity, which states that “by 2020, areas under agriculture,
aquaculture and forestry are managed sustainably, ensuring conservation of
biodiversity” (Anon. 2010).
346
7.8 Key findings of this project
• A total of 409 macrofungal species, 68 vascular plant species and 51 below-
ground ectomycorrhizal morphotypes were identified over the three years
sampling. Forty eight macrofungal species that are new to Ireland were
recorded.
• The four forest types formed distinctive communities of vascular plants,
macrofungi and ectomycorrhizal morphotypes, and this community formation
was driven by the dominant tree species of the forest.
• The macrofungal species richness of native oak and non-native Scot’s pine
and Sitka spruce forests was not significantly different.
• Significant differences were identified in the macrofungal functional group
richness between the different forest types.
• The below-ground ectomycorrhizal morphotype richness of the different
forest types was not significantly different.

347

348
References
349
Agarwala, M., Kumar, S., Treves, A., Naughton-Treves, L. (2010) Paying for wolves in Solapur, India and Wisconsin, USA: Comparing compensation rules and practice to understand the goals and politics of wolf conservation. Biological
Conservation, 143: 2945–2955. Agerer, R. (1987-2002). Colour Atlas of Ectomycorrhizae (1st-12th ed.). Schwäbisch Gmünd: Einhorn-Verlag. Agerer, R. and Rambolt, G. (2004-2011) DEEMY. [online], available: http://www.deemy.de/ [accessed 07/04/2011]. Agerer, R. (2001) Exploration types of ectomycorrhizae –A proposal to classify ectomycorrhizal mycelial systems according to their patterns of differentiation and putative ecological importance. Mycorrhiza, 11: 107-114. Alexander, I. and Watling, R. (1987) Macro fungi of Sitka spruce in Scotland. Proceedings of the Royal Society of Edinburgh, 93: 107-115. Allen, M.F. (1987) Restablishment of mycorrhizas on Mount St Helens: migration vectors. Transactions of the British Mycological Society, 88: 413-417. Allen, M.F. (1991) Ecology of Mycorrhizae. Cambridge: Cambridge University Press. Allen, M.F., Allen, E.B., Dahm, C.N. and Edwards, F.S. (1993) Preservation of biological diversity in mycorrhizal fungi: importance and human impacts, In: International symposium on human impacts on self recruiting populations, Sundnes, G. (ed.). Trondheim: Norwegian academy of sciences, pp 81-108. Allison, S.M. and Prosser, J.I. (1991) Urease activity in neutrophilic autotrophic ammonia-oxidizing bacteria isolated from acid soils. Soil Biology and
Biochemistry, 23: 45-51. Altschul, S. F., Madden, T. L., Schäffer, A. A., Zhang, J., Zhang, Z., Miller, W. and Lipman, D. J. (1997) Gapped BLAST and PSI-BLAST: a new generation of protein database search programs. Nucleic Acids Research, 25: 3389-3402. Amaranthus, M.P. (1992) Mycorrhizas, forest disturbance and regeneration in the pacific north west United States. In: Mycorrhizas in ecosystems, D.J. Read, D.H. Lewis, A.H. Fitter, and I.J. Alexander (eds.). Wallingford: CAB international. Amaranthus, M.P. and Perry, D.A. (1987) Effect of soil transfer on ectomycorrhizal formation and the survival and growth of conifer seedlings on old non-reforested clear-cuts. Canadian Journal of Forest Research, 17: 944-950.
350
Anderson, P., Brundrett, M., Grierson, P. and Robinson, R. (2010) Impact of severe forest dieback caused by Phytophthora cinnamomi on macrofungal diversity in the northern jarrah forest of Western Australia. Forest Ecology and
Management, 259: 1033–1040. Andersson, S., Jensen, P. and Soderstrom, B. (1996) Effects of mycorrhizal colonization by Paxillus involutus on uptake of Ca and P by Picea abies and Betula pendula grown in limed and unlimed peat. New Phytologist, 133: 695-704. Anon. (1996) Growing for the future. A strategic plan for the development of the
forestry sector in Ireland. Dublin: Department of Agriculture, Food and Forestry. Anon. (2000) Forest Biodiversity Guidelines. Department of Marine and Natural Resources. [online], available: http://www.agriculture.gov.ie/forestry/publications/biodiversity.pdf [accessed 08/11/2008]. Anon. (2005). Union Wood cSAC Site Code 638 Co. Sligo. National Parks and Wildlife service. [Online], available: http://www.npws.ie/en/media/Media,4666,en.pdf [accessed 03/09/10]. Anon. (2006) Sampling and soil analysis. [online], available: http://www.icp-forests.org/pdf/Chapt_3a_2006(2).pdf [accessed 08/11/2008]. Anon. (2009) Irish Standard for Forest Management Certification: DRAFT No. 4
for public consultation. Dublin: Irish Forestry Certification Initiative Ltd. Anon. (2010) Draft decisions for the tenth meeting of the conference of the parties
to the Convention on Biological Diversity, Nagoya, Japan. [online], available: http://www.cbd.int/cop10/doc/ [accessed 07/04/2011]. Arnolds, E. (1981) Ecology and coenology of macrofungi in grasslands and moist heathlands in Drenthe, the Netherlands. Bibliographica Mycology, 90: 1-501. Arnolds, E. (1991) Decline of ectomycorrhizal fungi in Europe. Agriculture
Ecosystems and Environment, 35: 209-244. Arnolds, E. (1992) The role of macrofungi in environmental conservation. Giornale Botanico Italiano, 126: 779-795. Arnolds, E. and de Vries, B. (1993) Conservation of fungi in Europe. In: Fungi of
Europe –investigation recording and mapping, Pegler, D.N., Boddy, L., Ing, I. and Kirk, P.M. (eds.). Kew: Royal Botanic Gardens, pp. 231–238. Arora, D. (1986) Mushrooms demystified. California: Ten speed press. Arroyo, J., Moraza, M.L. and Bolger, T. (2010) The mesostigmatid mite (Acari, Mesostigmata) community in canopies of Sitka spruce in Ireland and a comparison with ground moss habitats. Graellsia, 66: 29-37.
351
Ashkannejhad, S. and Horton, T.R. (2006) Ectomycorrhizal ecology under primary succession on the coastal sand dunes: interactions involving Pinus
contorta, suilloid fungi and deer. New Phytologist, 169: 345–354. Avis, P.G., McLaughlin, D.J., Dentinger, B.C. and Reich, P.B. (2003) Long-term increase in nitrogen supply alters above- and below-ground ectomycorrhizal communities and increases the dominance of Russula spp. in a temperate oak savanna. New Phytologist, 160: 239–253. Azul, A.M., Castro, P., Sousa, J.P. and Freitas, H. (2009) Diversity and fruiting patterns of ectomycorrhizal and saprobic fungi as indicators of land-use severity in managed woodlands dominated by Quercus suber--a case study from southern Portugal. Canadian Journal of Forest Research, 39: 2404-2417. Baar, J. (1996) The ectomycorrhizal flora of primary and secondary stands of Pinus sylvestris in relation to soil conditions and ectomycorrhizal succession. Journal of Vegetation Science, 7: 497-504. Baar, J. and Kuyper, T.W. (1993) Litter removal in forests and effect on mycorrhizal fungi. In: Fungi of Europe: Investigation, recording, and
conservation, D.N. Pegler, L. Boddy, B.Ing and P.M. Kirk (eds.) Kew: Royal Botanic Gardens, pp. 275-286. Baar, J. and ter Braak, C. J. F. (1996) Ectomycorrhizal sporocarp occurrence as affected by manipulation of litter and humus layers in Scot’s pine stands of different age. Applied Soil Ecology, 4: 61-73. Baar, J., Ozinga, W.A., Sweers, I.L. and Kuyper, T.W. (1994) Stimulatory and inhibitory effects of needle litter and grass extracts on the growth of some ectomycorrhizal fungi. Soil Biology and Biochemistry, 26: 1073-1079. Baath, E. (1981) Microfungi in a clear-cut pine forest soil in central Sweden. Canadian Journal of Botany, 59: 1331-1337. Bader, P., Jansson, S., Jonsson, B.G. (1995) Wood-inhabiting fungi and substrate decline in selectively logged boreal spruce forests. Biological Conservation, 72: 355-362. Baptista, P., Martins, A., Tavares, R.M. and Lino-Neto, T. (2010) Diversity and fruiting pattern of macrofungi associated with chestnut (Castanea sativa) in the Tras-os-Montes region (northeast Portugal). Fungal Ecology, 3: 9-19. Barkman, J. J. (1976) Terrestrische fungi in Jenever besstruwelen. Coolia, 19: 94-110.
352
Barlow, J., Gardner, T.A., Araujo, I.S., vila-Pires, T.C.A., Bonaldo, A.B., Costa, J.E., Esposito, M.C., Ferreira, L.V., Hawes, J., Hernandez, M.I.M., Hoogmoed, M.S., Leite, R.S., Lo-Man-Hung, N.F., Malcolm, J.R., Martins, M.B., Mestre, L.A.M., Miranda-Santos, R., Nunes-Gutjahr, A.L., Overal,W.L., Parry, L., Peters, S.L., Ribeiro-Junior, M.A., da Silva, M.N.F., da Silva Motta, C. and Peres, C.A. (2007) Quantifying the biodiversity value of tropical primary, secondary, and plantation forests. Proceedings of the National Academy of Sciences USA, 104: 18555–18560. Barreotavena, M.B., Pildain, M.B., Salgado, S. and Eberhart, J.L. (2010) Molecular identification of ectomycorrhizas associated with Ponderossa pine seedlings in Patagonian nurseries (Argentina). Canadian Journal of Forest
research, 40: 1940-1950. Bas, C., Kuyper, T.W., Noordeloos, M.E. and Vellinga, E.C. (1990) Flora
Agaricina Neerlandica, Vol 2. Holland: Balkema. Baxter, J.W. and Dighton, J. (2001) Ectomycorrhizal diversity alters growth and nutrient acquisition of grey birch (Betulla populifolia Marshall) seedlings in host-symbiont culture conditions. New Phytologist, 152: 139-149. Baxter, J.W., Steward, Pickett, S.T.A., Carreiro, M.M. and Dighton, J. (1999) Ectomycorrhizal diversity and community structure in oak forest stands exposed to contrasting anthropogenic impacts. Canadian Journal of Botany, 77: 771-782. Beiler, K.J., Durall, D.M., Simard, S.W., Maxwell, S.A. and Kretzer, A.M. (2009) Architecture of the wood-wide web: Rhizopogon spp. genets link multiple Douglas-fir cohorts. .New Phytologist, 185: 543–553. Berch, S.M., Baumbrough, B., Battigelli, J., Kroeger, P., Strub, N. and de Montigny, L. (2001) Preliminary Assessment of Selected Communities of Soil
Organisms under Different Conifer Species. Research report. Victoria, B.C: Ministry of Forests Research Program. Berch, S.M., Brockley, R.P., Battigelli, J.P., Hagerman, S. and Holl, B. (2006) Impacts of repeated fertilization on components of the soil biota under a young lodgepole pine stand in the interior of British Columbia. Canadian Journal of
Forest Research, 36: 1415-1426. Beschta, R.L., and W.J. Ripple (2010) Recovering riparian plant communities with wolves, in northern Yellowstone USA. Restoration Ecology, 18 (3): 380-389. Bever, J.D. (2003) Soil community feedback and the coexistance of competitors: conceptual frameworks and empiricle tests. New Phytologist, 157: 465-473. Bills, G., Holtzman, G., and Miller, O. (1986) Comparison of ectomycorrhizal- basidiomycete communities in red spruce versus northern hardwood forests of West Virginia. Canadian Journal of Botany, 64: 760-768.
353
Blasius, D. and Oberwinkler, F. (1989) Succession of Mycorrhizae: a matter of tree and stand age. Annals of Forest Science, 46: 758-761. Boddy, L. (2001) Fungal Community Ecology and Wood Decomposition Processes in Angiosperms: From Standing Tree to Complete Decay of Coarse Woody Debris. Ecological Bulletins, 49: 43-56. Boddy, L. and Rayner, A.D. (1983) Ecological roles of basidiomycetes forming decay communities in attached oak branches. New Phytologist, 93: 77-88. Boddy, L. and Watkinson, S.C. (1995) Wood decomposition, higher fungi, and their role in nutrient redistribution. Canadian Journal of Botany. 73(Suppl. 1): 1377-1383. Boddy, L. Bardsley, W. and Gibbon, O. (1987) Fungal communities in attached ash branches. New Phytologist, 107: 143-154. Bohus, G. (1984) Studies on pH requirement of soil inhabiting mushrooms: the R spectra of mushroom assemblages in deciduous forest communities. Annals of
Botany, 30: 155-171. Bolger, T. (2001). Functional value of species biodiversity. Biology and
Environment: Proceedings of the Royal Irish Academy, 101(3): 199-224. Bonet, J.A., Fisher, C.R. and Colinas, C. (2004) The relationship between forest age and aspect on the production of sporocarps of ectomycorrhizal fungi in Pinus
sylvestris forests of the central Pyrenees. Forest Ecology and Management, 203: 157–175. Borchers, S.L., and Perry, D.A. (1990) Growth and ectomycorrhizal formation of Douglas fir seedlings grown in soils collected at different distances from pioneering hardwoods in south west Oregon clear-cuts. Canadian Journal of
Forest Research, 20: 712-721. Boyle, G.M. and Farrell, E.P. (2005) Monitoring of Forest Ecosystems in Ireland, FOREM 9 project, Final Report. Forest Ecosystem Research Group Report Number 72 Department of Environmental Resource Management. Dublin: University College Dublin. Brady, N.C. and Weil, R.R. (2008) The Nature and Properties of Soils, 14th edition. New Jersey: Prentice Hall. Brandrud, T.E., Lindström, H., Marklund, H., Melot, J. and Muskos, S. (1990–1998) Cortinarius, Flora Photographica. Vols. 1 -4. Sweden: HB, Klövervägen, Matfors. Breda, N.J. (2003) Ground-based measurements of leaf area index: a review of methods, instruments and current controversies. Journal of Experimental Botany, 54: 2403-2417.
354
Breitenbach, J., and Känzlin, F. (1984-2005) Fungi of Switzerland. Vol 1-6. Lucerne: Verlag Mykologia Luzern Publishers. Brockerhoff, E.G., Jactel, H., Parrota, J.A., Quine, C.P. and Sayer, J. (2008) Plantation forests and biodiversity: oxymoron or opportunity? Biodiversity and
Conservation, 17: 925–951. Brokaw, N. V. and Lent, R.A. (1999) Vertical structure, In: Maintaining
biodiversity in forest ecosystems, M. L. Hunter Jr. (ed.). Cambridge: Cambridge University Press, pp. 373-399. Brown, N., Jennings, S., Wheeler, P., and Nabe-Nielson, J. (2000) An improved method for the rapid assessment of forest understorey light environments. Journal
of Applied Ecology, 37: 1044-1053. Brundrett, M.C. (2002) Coevolution of roots and Mycorrhizae of land plants. New
Phytologist, 154: 275-304. Bruns, T.D. (1995) Thoughts on the processes that maintain local species diversity of ectomycorrhizal fungi. Plant and Soil, 170: 63–73. Bruns, T.D., Bidartondo, M. and Taylor, D.L. (2002) Host specificity in ectomycorrhizal communities: what do the exceptions tell us?. Integrated and
Computational Biology, 42: 352–359. Bruns, T.D., Peay, K.G., Boynton, P.J., Grubisha, L.C., Hynson, N.A., Nguyen, N.H. and Rosenstock, N.P. (2009) Inoculum potential of Rhizopogon spores increases with time over the first 4 yr of a 99-yr spore burial experiment. New
Phytologist, 181: 463–470. Buee, M., Courty, P.E., Mignot, D., Garbaye, J. (2007) Soil niche effect on species diversity and catabolic activities in an ectomycorrhizal fungal community. Soil Biology and Biochemistry, 39: 1947-1955. Buee, M., Maurice, J.P., Zeller, B., Andrianarisoa, S., Ranger, J., Courtecuisse, R., Marçais, B. and Le Tacon, F. (2011) Influence of tree species on richness and diversity of epigeous fungal communities in a French temperate forest stand. Fungal Ecology, 4: 22-31. Burnham, K.P. and Overton, W.S. (1978) Estimation of the size of a closed population when capture probabilities vary among animals. Biometrika, 65: 623-633. Burton, R.F. (1998) Biology by Numbers. Cambridge: Cambridge university press. Carey, M., McCarthy, R. and Miller, H. (1988) More on nursing mixtures. Irish
Forestry, 45: 7-20.
355
Carlisle, M. J., and Watkinson, S. C. (1994) The fungi. London: Academic publishers. Carrier, P. (2003) Effects of water addition on biotic and abiotic components of a
dry boreal forest in the Yukon. Unpublished PhD. Thesis, Department of Zoology, University of British Columbia, Vancouver, B.C. Carter, G. (1998) The mycoflora of natural and semi-natural grasslands in
Ireland. Unpublished MSc. thesis, University College Dublin, Dublin. Chao, A. (1984) Nonparametric estimation of the number of classes in a population. Scandanavian Journal of Statistics, 11: 265-270. Chao, A. (1987) Estimating the population size for capture recapture data with unequal catchability. Biometrics, 43: 783-791. Chao, A. and Lee, S.M. (1992) Estimating the number of classes via sample coverage. Journal of the American Statistical Association, 87: 210-217. Chao, A., Chazdon, R.L., Colwell, R.K. and Shen, T. (2005) A new statistical approach for assessing similarity of species composition with incidence and abundance data. Ecology Letters, 8: 148–159. Chazdon, R.L., Colwell, R.K., Denslow, J.S., and Guariguata, M.K. (1998) Statistical methods for estimating species richness of woody regeneration in primary and secondary rain forests of northeastern Costa Rica. In: Forest
Biodiversity Research Monitoring, and Modeling: Conceptual Background and
Old World Case Studies, Dallmeier, F. and Comisky, J.A. (eds.). Paris: Parthenon Publishing. Christensen, M. and Emborg,J. (1996) Biodiversity in natural versus managed forests in Denmark. Forest Ecology and Management, 85: 47-51. Clapp, J.P., Young, J.P.W., Merryweather, J.W., and Fitter, A.H. (1995) Diversity of fungal symbionts in arbuscular mycorrhizas from a natural community. New
Phytologist, 130: 259-265. Clarke, D.A. and Clarke, D.B. (1992) Life history diversity of canopy and emergent trees in a neotropical rain forest. Ecological Monographs, 62: 315-344. Cline, E. T., Ammirati, J. F. and Edmonds, R.L. (2005) Does proximity to mature trees influence ectomycorrhizal fungus communities of Douglas-fir seedlings?. New Phytologist, 166: 993–1009. Colgan, W., Carey, A., Trappe, J., Molina, R., and Thysell, D. (1999) Diversity and productivity of hypogeous fungal sporocarps in variably thinned douglas fir forests. Canadian Journal of Forest Research, 29: 1259-1268.
356
Coll, L., Messier, C., Delagrange, S., and Berninger, F. (2007) Growth, allocation and leaf gas exchanges of hybrid poplar plants in the establishment phase on previously forested sites: effect of different vegetation management techniques. Annuls of Forest Science, 64: 1-11. Coll, M.T. and Bolger, T. (2007) Biodiversity and species composition of caribidae in irish coniferous forests: additional insight from the use of paored sites in comparison with the fauna of open habitats. Biology and Environment: Proceedings of the Royal Irish Academy, 107B: 1-11. Colwell, R.K. (2004) EstimateS: statistical estimate of species richness and shared species from samples, Version 7. [Online], available: http://viceroy.eeb.uconn.edu/estimates [accessed: 23/03/2011]. Colwell, R. K., and Coddington, J. A. (1994) Estimating terrestrial biodiversity through extrapolation. Philosophical Transactions of the Royal Society, 345B: 101-118. Colwell, R.K. (2009) Estimate S, users guide. [Online], available: http://viceroy.eeb.uconn.edu/EstimateSPages/EstSUsersGuide/EstimateSUsersGuide.htm [accessed 06/04/2011]. Colwell, R.K., Mao, C.X. and Chang, J. (2004) Interpolating, extrapolating, and comparing incidence-based species accumulation curves. Ecology, 85: 2717–2727. Coote, L., Smith, G.F., Kelly, D.L., O’Donoghue, S., Dowding, P., Iremonger, S. and Mitchell, F.J.G. (2008) Epiphytes of Sitka spruce (Picea sitchensis) plantations in Ireland and the effects of open spaces. Biodiversity and
Conservation, 17: 953–968. Courty, P., Franc, A., Pierrat, J. and Garbaye, J. (2008) Temporal Changes in the Ectomycorrhizal Community in Two Soil Horizons of a Temperate Oak Forest. Applied and Environmental Microbiology, 74: 5792–5801. Cripps, C. (2004) Ectomycorrhizal fungi above and below ground in a small Aspen stand: a simple system reveals fungal fruiting strategies and an edge effect. In: Fungi in Forest Ecosystems: Systematics, Diversity and Ecology, Cripps, C. (ed.). New York: New York Botanical Gardens. Crites, S. and Dale, M.R.T. (1998) Diversity and abundance of bryophytes, lichens, and fungi in relation to woody substrate and successional stage in aspen mixed wood boreal forests. Canadian Journal of Botany, 76: 641-651. Cross, J.R. (1998) An outline and map of the potential natural vegetation of Ireland. Applied Vegetation Science, 1: 241-245.
357
Cross, J.R. (2006) The potential natural vegetation of Ireland. Biology and
Environment: Proceedings of the Royal Irish Academy, 106B: 65-116. Cumming, J., R. (1996) Phosphate-limitation physiology in ectomycorrhizal pitch pine (Pinus rigida) seedlings. Tree Physiology, 16: 977-983. Curtis, T. G. F & McGough, N. (1988) The Irish Red Data Book: 1 Vascular
Plants. Wildlife Service Ireland, Dublin: The Stationery Office. Dahlberg A., Genny, D.R., Heilmann-Clausen, J. (2009) Developing a comprehensive strategy for fungal conservation in Europe: current status and future needs. Fungal Ecology, doi:10.1016/j.funeco.2009.10.004. Dahlberg, A., Jonssen, L. and Nylund, J (1997) Species diversity and distribution of biomass above and below ground among ectomycorrhizal fungi in an old-growth Norway spruce forest in south Sweden. Canadian Journal of Botany, 75: 1323- 1335. Danielson, R.M. (1984) Ectomycorrhizal associations in Jack pine stands in North eastern Alberta. Canadian Journal of Botany, 62: 932-939. Day, R. W. and G. P. Quinn. (1989) Comparisons of treatments after an analysis of variance in ecology. Ecological Monographs, 59: 433-463. De vries, B., Jansen, E., and Kuyper, T. (1995) Partial restoration of fungal and plant species diversity by removal of litter and humus layers in stands of Scot’s pine in the netherlands. Biodiversity and Conservation, 4: 156-164. Deacon, J.W. and Fleming, L.V. (1992) Interactions of ectomycorrhizal fungi. In: Mycorrhizal functioning: An integrative plant fungal process, Allen, M.F. (ed.). New York: Chapman and Hall. Dennis, R. W. G. (1986) Fungi of the Hebrides. Kew: Royal Botanic Gardens. Dickie, I.A, Bing, X., Koide, R. (2002) Vertical niche differentiation of ectomycorrhizal hyphae in soil as shown by T-RFLP analysis. New Phytologist, 156: 527–535. Dickie, I.A. and Reich, P.B. (2005) Ectomycorrhizal fungal communities at forest edges. Journal of Ecology, 93(2): 244-255. Dickie, I.A., Avis, P.G., McLaughlin, D.J. and Reich, P.B. (2003) Good-enough RFLP matcher (GERM) program. Mycorrhiza, 13: 171–172. Diekmann, M. (1994) Deciduous forest vegetation boreonemoral Scandinavia. Acta Phytogeographica Suecica, 80: 1-112. Diekmann, M. (1999) Southern deciduous forests. Acta Phytogeographica
Suecica, 84: 33-53.
358
Dighton, J., Poskitt, J.M., and Howard, D.M. (1986) Changes in occurrence of basidiomycete fruit bodies during forest stand development: with specific reference to mycorrhizal species. Transactions of the British Mycological Society, 87: 163-171. Dixon, K.W., Kell, S.P., Barrett, R.L. and Cribb, P.J. (2003) Orchid conservation. Kota Kinahalu: Natural History Publications. Duchesne, L.C., Peterson, R.L., and Ellis, B.E. (1998) Pine root exudates stimulate the synthesis of antifungal compounds by the ectomycorrhizal fungus Paxillus involutus. New Phytologist, 111: 693-698. Dufrene, M. and Legendre, P. (1997) Species assemblages and indicator species: the need for a flexible asymmetrical approach. Ecological Monographs, 67: 345-366. Durall, D.M., Gamiet, S., Simard, S.W., Kudrna, L. and Sakakibara, S.M. (2006) Effects of clearcut logging and tree species composition on the diversity and community composition of epigeous fruitbodies formed by ectomycorrhizal fungi. Canadian Journal of Botany, 84: 966-980. Edmonds, R. and Lebo, D. (1998) Diversity, production, and nutrient dynamics of fungal sporocarps on logs in an old-growth temperate rain forest, Olympic National Park, Washington. Canadian Journal of Forest Research, 28: 665-673. EEA (2010) Assessing biodiversity in Europe - the 2010 report. Luxemburg: European Environment Agency. Egger, K.N., Danielson, R.M., and Fortin, J.A. (1991) Taxonomy and population structure of E-strain mycorrhizal fungi inferred from ribosomal and mitochondria DNA polymorphisms. Mycological Research, 95: 866-872. Engelmark, O. and Hytteborn, H. (1999) Coniferous forests. Acta
Phytogeographica Suecica, 84: 33-55. English Nature (1998) The conservation of wild mushrooms. The wild mushroom
pickers code of conduct. Peterborough, U.K.: English Nature. Enttema, C.H. and Wardle, D.A. (2002). Spatial soil ecology. Trends in Ecology
and Evolution, 17: 177-183. Erland, S. and Taylor, A.F.S. (2002) Diversity of ectomycorrhizal communities in relation to the abiotic environment. In: The Ecology of Mycorrhizas, Ecological Studies Series. Volume. 157, M. Van der Heijden and . Sanders, I. (eds.). Germany: Springer-Verlag, pp163-200.
359
Esseen, P. A., Ehnstrdm, B., Ericson, L. and Sjoberg, K. (1992) Boreal forests - the focal habitats of Fennoscandia. In Ecological principles of Nature
conservation, Applications in temperate and boreal environments, L. Hansson (ed.). London : Elsevier Applied Science, pp. 252-325. EUROPA (2009). Annexed habitats, Atlantic region. [Online], available from: http://ec.europa.eu/environment/nature/natura2000/sites_hab/biogeog_regions/docs/ref_list_atlantic.pdf [accessed 11/05/2011]. Evans, S.E., Ing, B., Henrici, A. and Rotheroe, M. (2003) A Provisional Red Data
List of British Fungi. [Online], available: http://www.britmycolsoc.org.uk/files/RDL_of_Threatened_British_Fungi_Version_1.0.pdf [accessed 25/02/10]. Fahy, O. and Gormally, M. (1998) A comparison of plant and carabid beetle communities in an Irish oak woodland with a nearby conifer plantation and clearfelled site. Forest Ecology and Management, 110: 263-273. Felton, A., Lindbladh, M., Brunet, J. and Fritz, O. (2010) Replacing coniferous monocultures with mixed-species production stands: an assessment of the potential benefits for forest biodiversity in northern Europe. Forest Ecology and
Management, 260: 939–947. Fernandez, L.M., Agreda, T. and Olano, J.M. (2006) Stand age and sampling year effect on the fungal fruit body community in Pinus pinaster forests in central Spain. Canadian Journal of Botany, 84: 1249-1258. Ferris, R. Humphrey, J.W. (1999) A review of potential biodiversity indicators for application in British forests. Forestry, 72: 313-328. Ferris, R., Peace, A.J., Humphrey, J.W., Broome, A.C. (2000b) Relationships between vegetation, site type and stand structure in coniferous plantations in Britain. Forest Ecology and Management, 136: 35-51. Ferris, R., Peace, A.J., and Newton, A.C. (2000a) Macro fungal communities of low land Scot’s pine and Norway spruce plantations in England: relationships with site factors and stand structure. Forest Ecology and Management, 131: 255-267. Ferris-Kaan, R., Peace, A.J., and Humphreys, J.W. (1998) Assessing forest structure in managed forests. In: Assessment of forest biodiversity for improved
forest management, P. Bachmann, M. Kohl and R. Paivainenn (eds.). Dordrecht: Kluwer, pp 331-342. Fossitt, J.A. (2000) A guide to habitats in Ireland. [Online], available: http://www.heritagecouncil.ie/publications/habitats/Guide_to_Habitats.pdf [accessed 03/01/2009].
360
FRA (2010) Global Forest Resource Assessment 2010 Main report. Rome: Food and Agriculture Organisation. Franklin, J.F. and DeBell, D.S. (1973) Effects of various harvesting methods on forest regeneration. In: Proceedings of the Symposium on Even-Age Management,
School of Forestry, Oregon State University, Corvallis, 1 August 1972, Hermann, R.K., Lavender, D.P. (Eds.), pp. 29–57. Franklin, J.F., Shugart, H.H. and Harmon, M.E. (1987) Tree death as an ecological process. The causes, consequences, and variability of tree mortality. Bioscience, 37, 550-556. FRDBI (2010) Fungal records database of Britain and Ireland. [Online], available: http://www.fieldmycology.net/FRDBI/FRDBI.asp [accessed 23/03/2011]. French, L.J., Smith, G.F., Kelly, D.L., Mitchell, F.J.G., O’Donoghue, S., Iremonger, S.F., and McKee, A. (2008) Ground flora communities in temperate oceanic plantation forests and the influence of silvicultural, geographic and edaphic factors. Forest Ecology and Management, 255: 476-494. Friend, D.T. (1961) A simple method of measuring integrated light values in the field. Ecology, 42: 577-580. Gabel, A.C. and Gabel, M.L. (2007) Comparison of Diversity of Macrofungi and Vascular Plants at Seven Sites in the Black Hills of South Dakota. American
Midlands Naturalist, 157: 258-296. Gardener, M.J. and Radford, T. (1980) Soil Associations of Ireland and Their
Land Use Potential. Dublin, Ireland: An Foras Talúntais. Gardes, M., and Bruns, T.D. (1993) ITS primers with enhanced specificity for basidiomycetes - application to the identification of mycorrhizae and rusts. Molecular Ecology, 2: 113-118. Gardes, M., Bruns, T.D. (1996) Community structure of ectomycorrhizal fungi in a Pinus muricata forest: above- and below-ground views. Canadian Journal of
Botany, 74: 1572–1583. Garnica, S., Weis, M., Walther, G., and Oberwinkler, F. (2007) A framework for a phylogenetic classification in the genus Cortinarius (Basidiomycota, Agaricales) derived from morphological and molecular data. Canadian Journal of Botany, 83: 1457-1477. Garrison, G.A. (1949) Uses and modifcations for the Moosehorn crown closure estimator. Journal of Forestry, 47: 733-735. Gaston, K.J. (1994) Rarity. London: Chapman and Hall.
361
Gaston, K.J. and Spicer, J.I. (2004) Biodiversity: an introduction. Oxford: Blackwell publishing. Gebhardt, S., Neubert, K., Wöllecke, J., Münzenberger, B. and Hüttl, R.F. (2007) Ectomycorrhiza communities of red oak (Quercus rubra L.) of different age in the Lusatian lignite mining district, East Germany. Mycorrhiza, 17: 279–290. Gherbi, H., Delaruelle, C., Selosse, M.A. and Martin, F. (1999) High genetic diversity in a population of the ectomycorrhizal basidiomycete Laccaria
amethystina in a 150-year-old beech forest. Molecular Ecology, 8: 2003–2013. Gibbs, R.D. (1957) Patterns in the seasonal water content of trees. In: The
Physiology of Forest Trees, K.V. Thimann, W.B. Critchfield and M.H. Zimmerman (Eds.). New York: Ronald Press Co. Gill, G.E., Pearson, A.A., Dennis, R.W.G., Allen, C.W. and O’Connor, P. (1948) The fungal flora of county Kerry. Irish Naturalists’ Journal, 9: 181-185. Goodman, D.M. and Trofymow, J.A. (1998) Comparison of communities of ectomycorrhizal fungi in old growth and mature stands of Douglas fir at two sites on southern Vancouver Island. Canadian Journal of Forest Research, 28: 574-581. Goodman, D.M., Durall, D.M., Trofymow, J.A., and Berch, S.M. (1997) Concise
Descriptions of North American Ectomycorrhizae . Victoria, B.C.: Mycologue Publications. [Online], available: http://www.cfp.scf.rncan.gc.ca/biodiversity/bcern/manual/index_e.html [accessed 11/12/2008]. Grayston, S.J., Addison, J.A., Berch, S.M., DeMontigny, L.E., Durall, D.M., Egger, K., N., Jones, M.D., Modesto, R., Mohn, W.W., Panesar, T.S., Prescott, C.E. and Srivastava, D.S. (2006) Green tree retention: A tool to maintain soil function after harvest. BC Journal of Ecosystems and Management, 7: 9-12. Grebenc, T., Christensen, M., Vilhar, U., Cater, M., Martín, M.P., Simoncic, P. and Kraigher, H. (2009) Response of ectomycorrhizal community structure to gap opening in natural and managed temperate beech-dominated forests . Canadian
Journal of Forest Research, 39: 1375-1386. Griffith, G.W., Bratton, J.H. and Easton, G. (2004) Charismatic megafauna, the
conservation of waxcap grasslands. Britain: British wildlife. Grubisha, L.C., Bergemann, S.E. and Bruns, T.D. (2007) Host islands within the California northern Channel Islands create fine-scale genetic structure in two sympatric species of the symbiotic ectomycorrhizal fungus Rhizopogon. Molecular Ecology, 16: 1811–1822.
362
Gulden, G., Hoiland, K., Bendiksen, K., Brandrud, T., Foss, B., Jenssen, H., and Laber, D. (1992) Macromycetes and air pollution. Bibliotheca Mycologia. Berlin: Cramer, pp.144. Gunnar-Jonsson, B. and Jonsell, M. (1999) Exploring potential biodiversity indicators in boreal forests. Biodiversity and Conservation, 8: 1417-1433. Hall, T.A. (1999) BioEdit: a user-friendly biological sequence alignment editor and analysis program for Windows 95/98/NT. Nucleic Acids Symposium Series, 41: 95–98. Hall, T.A. (2005) BioEdit v7.0.5. [Online], available: http://www.mbio.ncsu.edu/bioedit/page1.html [accessed 07/04/2011]. Halme, P., Kotiaho, J., Ylisirniö, A.-L., Hottola, J., Junninen, J., Kouki, J., Lindgren, M., Mönkkönen, M., Penttilä, R., Renvall, P., Siitonen, J. and Similä, M. (2008). Perennial polypores as indicators of annual and red-listed polypores. Ecological Indicators, 9: 256–266. Hangs, R.D., Greer, K.J. and Sulewski, C.A. (2004) The effect of interspecific competition on conifer seedling growth and nitrogen availability measured using ion-exchange membranes. Canadian Journal of Forest Research, 34: 754-761. Hanson, P.A. (1988) Prediction of macrofungai occurrence in Swedish beech forests from soil and litter variable models. Vegetation, 78: 31-44. Harley, J.L. and Harley, E.L. (1987) A check-list of mycorrhiza in the British flora. New Phytologist, 105: 1–102. Harrington, T.J (1994) New Irish fungal records. Irish Naturalists’ Journal, 24: 413-414. Harrington, T.J. (1996) Observations on the macrofungi of Dryas communities in the Burren, Western Ireland. Irish Naturalists’ Journal, 25: 157-192. Harrington, T.J. (2003) Relationship between macrofungi and vegetation in the Burren. Biology and Environment: Proceedings of the Royal Irish Academy, 103B: 147-159. Harrington, T.J. and Mitchell, D.T. (2002) Characterization of Dryas octopetala ectomycorrhizas from limestone karst vegetation, Western Ireland. Canadian
Journal of Botany, 80: 970-982. Harrington, T.J. and Mitchell, D.T. (2005a) Ectomycorrhizas associated with a relict population of Dryas octopetala in the Burren, western Ireland I. Distribution of ectomycorrhizas in relation to vegetation and soil characteristics. Mycorrhiza, 15: 425-433.
363
Harrington, T.J. and Mitchell, D.T. (2005b) Ectomycorrhizas associated with a relict population of Dryas octopetala in the Burren, western Ireland II. Composition, structure and temporal variation in the ectomycorrhizal community. Mycorrhiza, 15: 435-445. Hartley, J., Cairney, J.W.G. and Meharg, A.A. (1997) Do ectomycorrhizal fungi exhibit adaptive tolerance to potentially toxic metals in the environment. Plant
Soil, 189: 303-319. Hassell, F.C. (1953) The fungi of North Bull Island, Co Dublin. Irish Naturalists’
Journal, 2: 3-7. Hawkins, D. (2009) Biomeasurement : a student's guide to biological statistics. Oxford: Oxford University Press. Hawksworth, D. L. (1991) The fungal dimension of biodiversity: magnitude, significance, and conservation. Mycological Research, 95: 641–655. Hawksworth, D.L. and Mueller, G.M. (2005) Fungal communities: their diversity and distribution. In: The fungal community: its organization and role in the
ecosystem, Dighton. J., White, J.F. and Oudemans, P. (eds) 3rd edn. Boca Raton: Taylor & Francis. Hawksworth, D.L. and Rossman, A.Y. (1997) Where are all the undescribed fungi. Phytopathology, 87: 888-891. Heilmann-Clausen, J. and Christensen, M. (2005) Wood inhabiting fungi in Danish beech forests conflicting diversity patterns and their implications in a conservation perspective. Biological Conservation, 122: 633-642. Heilmann-Clausen, J., Christensen, M. (2003) Fungal diversity on decaying beech logs – implications for sustainable forestry. Biodiversity and Conservation, 12: 953–973. Heilmann-Clausen, J., Verbeken, A. and Vesterholt, J. (1998) The genus
Lactarius. Fungi of Northern Europe, Vol. 3. Denmark: Svampetryk. Heinonsalo, J., Koskiahde, I. and Sen, R. (2007) Scot’s pine bait seedling performance and root colonizing ectomycorrhizal fungal community dynamics before and during the 4 years after forest clear-cut logging, Canadian Journal of
Forest Research, 37: 415–429. Heinze, E., Boch, S., Fischer, M., Hessenmoller, D., Klenk, B., Muller, J., Prati, D., Detlef Schulze, E., Seele, C., Socher, S., Halle, S. (2011) Habitat use of large ungulates in northeastern Germany in relation to forest management. Forest
Ecology and Management, 261: 288-296.

364
Hermy, M., Honnay, O., Firbank, L., Grashof-Bokdam, C.J. & Lawesson, J.-E. (1999) An ecological comparison between ancient and other forest plant species of Europe and the implications for forest conservation. Biological Conservation, 91: 9-22. Hering, T. (1966) The terricolous higher fungi of the four Lake District woodlands. Transactions of the British Mycological Society, 49: 369-383. Heslin, M.C., Blasius, D., McElhinney, C. and Mitchell, D.T. (1992) Mycorrhizal and associated fungi of Sitka spruce in Irish forest mixed stands. European
Journal of Forest Pathology, 22: 46-57. Hibbett, D.S., Ohman, A., Glotzer, D., Nuhn, M., Kirk, P. and Nilsson, R.H. (2011) Progress in molecular and morphological taxon discover in Fungi and options for formal classification of environmental sequences. Fungal Biology
Reviews, 25: 38-47. Hickey, K.R. (2000) A geographical perspective on the decline and extermination of the Irish wolf Canis lupus— an initial ssessment. Irish Geography, 33: 185-198. Hill, M.O. (1979) The development of a flora in even-aged plantations. In: The
Ecology of Even-Aged Forest Plantations, E.D. Ford, D.C. Malcolm and J. Atterson (eds). Cambridge: Institute of Terrestrial Ecology Hill, M.O. (1986) Ground flora and succession in commercial forests. In: Trees
and Wildlife in the Scottish Uplands, Jenkins, D. (Ed.). Cambridge: Institute of Terrestrial Ecology. Hobbie, E.A. (2006) Carbon allocation to ectomycorrhizal fungi correlates with total belowground allocation in culture studies. Ecology, 87: 563–569. Hobbs, R.J., Arico S. Aronson J., Jill S. Baron, J.S., Bridgewater, P., Cramer, V.A., Epstein, P.R., Ewel, J.J., Klink, C.A., Lugo, A.E., Norton, D., Ojima, D., Richardson, D., Sanderson, E.W., Valladares, F., Vilà, M., Zamora, R. and Zobel, M. (2006) Novel ecosystems: theoretical and management aspects of the new ecological world order. Global Ecology and Biogeography, 15: 1–7. Hoiland, K., and Bendiksen, E. (1996) Biodiversity of wood inhabiting fungi in a boreal coniferous forest in Sor-Trondelag county, Central Norway. Nordic
Journal of Botany, 16: 643-659. Horgan, T., Keane, M., McCarthy, R., Lally, M. and Thompson, D. (2004) A
guide to forest tree species selection and silviculture in Ireland. Dublin: COFORD. Horton, T.R. and Bruns, T.D. (2001) The molecular revolution in ectomycorrhizal ecology: Peeking into the black-box. Molecular Ecology, 10: 1855-1871.
365
Huang, W.Z. and Schoenau, J.J. (1996) Forms, amounts and distribution of carbon, nitrogen, phosphorus, and sulfur in a boreal aspen forest soil. Canadian
Journal of Soil Science, 76: 373-385. Hubert, N.A. and Gehring, C.A. (2008) Neighboring trees affect ectomycorrhizal fungal community composition in a woodland-forest ecotone. Mycorrhiza, 18: 363-374. Huhta, V., Karppinen, E. Nurminen, M. and Valpas, A. (1967) Effect of silvicultural practices upon arthropod, annelid and nematode populations in coniferous forest soil. Annales Zoologici Fennici, 4: 87-143. Huhta, V., Nurminen, M. and Valpas, A. (1969). Further notes on the effect of silvicultural practices upon the fauna of coniferous forest soil. Annales Zoologici
Fennici, 6: 327-334. Huhta, V. (1971). Succession in the spider communities of the forest floor after clear-cutting and prescribed burning. Annales Zoologici Fennici, 8: 483-542. Huhta, V. (1976) Effects of clear-cutting on numbers, biomass and community respiration of soil invertebrates. Annales Zoologici Fennici, 13: 63-80. Humphrey, J.W. (2005) Benefits to biodiversity from developing old-growth conditions in British upland spruce plantations: a review and recommendations. Forestry, 78: 33-53. Humphrey, J.W. and Coombs, E.L. (1997) Effects of forest management on understorey vegetation in a Pinus sylvestris L. Plantation in NE Scotland. Botanical Journal of Scotland, 49: 479- 488. Humphrey, J.W., Ferris, R. and Quine, C. (2003) Biodiversity in Britain’s planted
forests. Edinburgh: Forestry commission. Humphrey, J.W., Holl, K., Broome, A.C., (1998) Birch in Spruce Plantations:
Management for Biodiversity. Forestry Commission Technical Paper 26. Edinburgh: Forestry Commission. Humphrey, J.W., Newton, A.C., Peace, A.J., and Holden, E. (2000) The importance of conifer plantations in northern Britain as a habitat for native fungi. Biological Conservation, 96: 241-252. Ing, B. (1992) A provisional red data list of British fungi. Mycologist, 6: 124-128. Ingleby, K., Mason, P.A., Last, F.T. and Fleming L.V. (1990) Identification of
Ectomycorrhizas. Institute of terrestrial ecology. Research publication no 5. London: Her Majesty’s Stationary Office. Iremonger, S. (1999) Guidelines for Forestry and Biodiversity. Dublin: Forest Service, Department of the Marine and Natural Resources.
366
Iremonger, S., Gittings, T., Smith, G.F., Wilson, M.W., Oxbrough, A., Coote, L., Pithon, J., O'Donoghue, S., McKee, A., O'Halloran, J., Kelly, D.L., Giller, P.S., O'Sullivan, A., Neville, P., Mitchell, F.J.G., O'Donnell, V., Kelly, T.C. and Dowding, P. (2006) Investigation of experimental methods to enhance biodiversity in plantation forests. BIOFOREST Project 3.1.3 Final Report to COFORD. [Online], available: http://bioforest.ucc.ie/pages/project_three.htm [Accessed 09/03/09]. Ishida, T.A., Nara, K. and Hogetsu, T. (2007) Host effects on ectomycorrhizal fungal communities: insight from eight host species in mixed conifer–broadleaf Forests. New Phytologist, 174: 430–440. Jennings, S.B., Brown, N.D. and Sheil, D. (1999) Assessing forest canopies and understory illumination: canopy closure, canopy cover and other methods. Forestry, 72: 59-73. Jiang, Q.Q. and Bakken, L.R. (1999) Comparison of Nitrosospira strains isolated from terrestrial environments. FEMS Microbial Ecology, 30: 171-186. Johnson, D.W., Hungate, B.A., Dijkstra, P., Hymus, G. and Drake, B. (2001) Landscape and Watershed Processes: Effects of Elevated Carbon Dioxide on Soils in a Florida Scrub Oak Ecosystem. Journal of Environmental Quality, 30: 501-507. Jones, M.D, Durall, D.M., and Cairney, J. (2003) Ectomycorrhizal fungal communities in young forest stands regenerating after clearcut logging. New
Phytologist, 157: 399-422. Jongmans, J.G., Van Breeman, N., Lundstrom, U., Van Hees, P.A., Finlay, R.D., Srinivasan, M., Unestam, T., Giesler, R., Melkerud, P.A. and Olsson, M. (1997) Rock eating fungi. Nature, 389: 682-683. Jonsson, L., Dahlberg, A., Nilsson, M.C., Zackrisson, O., and Karen, O. (1999) Ectomycorrhizal fungal communities in late successional Swedish boreal forests and their composition following wildfire. Molecular Ecology, 8: 205-215. Jowkin, V. and Schoenau, J.J. (1998) Impact of tillage and landscape position on nitrogen availability and yield of spring wheat in the brown soil zone in southwestern Saskatchewan. Canadian Journal of Soil Science, 78: 563-572. Joyce, P. and O’Carroll, N. (2002) Sitka spruce in Ireland. Dublin: COFORD. Jumpponen, A., Trappe, J.A., Cazares, E. (2002) Occurrence of ectomycorrhizal fungi on the forefront of retreating Lyman Glacier (Washington, USA) in relation to time since deglaciation. Mycorrhiza, 12: 43-49. Kaldorf, M., Renker, C., Fladung, M. and Buscot, F. (2004) Characterization and spatial distribution of ectomycorrhizas colonizing aspen clones released in an experimental field. Mycorrhiza, 14: 295-306.

367
Kappes, H., Catalano, C., Topp, W. (2007) Coarse woody debris ameliorates chemical and biotic soil parameters of acidified broad-leaved forests. Applied Soil
Ecology, 36: 190–198. Keil, P., Dziock, F., and Storch, D. (2008) Geographical patterns of hoverfl y (Diptera, Syrphidae) functional groups in Europe: inconsistency in environmental correlates and latitudinal trends. Ecological Entomology. 33:748-757 Keil, P., Dziock, F., and Storch, D. (2008) Geographical patterns of hoverfly (Diptera, Syrphidae) functional groups in Europe: inconsistency in environmental correlates and latitudinal trends. Ecological Entomology, 33: 748-757. Kelly, D.L. and Iremonger, S.F. (1997) Irish wetland woods: the plant communities and their ecology. Biology and Environment: Proceedings of the
Royal Irish Academy 97B: 1-32. Kelly, D.L. and Kirby, E.N. (1982). Irish native woodlands over limestone. In: Studies on Irish Vegetation (ed. J. White). Dublin: Royal Dublin Society, pp. 181-198. Kelly, D.L. and Moore, J.J. (1975) A preliminary sketch of the Irish acidophilous oakwoods. In: Colloques Phytosociologiques III: La Vegetation des Forets
Caducifoliees Acidophiles (ed. J. M. Gehu). Vaduz: J. Cramer, pp. 375-387. Kelly, D.L. (2002) The regeneration of Quercus petraea. (Sessile oak) in southwest Ireland: a 25-year experimental study. Forest Ecology and
Management, 166: 207-226. Kelly, D.L. (2005) Woodland on the Western Fringe: Irish Oakwood Diversity and the Challenges of Conservation. Botanical Journal of Scotland, 57: 21-40. Kelly, D.L. and Kirby, E.N. (1982) Irish native woodlands over limestone. Journal of Life Science Royal Dublin Society, 3: 181–198. Kennedy, P. (2010) Ectomycorrhizal fungi and interspecific competition: species interactions, community structure, coexistence mechanisms, and future research directions. New Phytologist, 187: 895-910. Kennedy, P.G. and Bruns, T.D. (2005) Priority effects determine the outcome of ectomycorrhizal competition between two Rhizopogon species colonizing Pinus
muricata seedlings. New Phytologist, 166: 631-638. Kent, M. and Coker, P. (1992) Vegetation description and analysis: a practical
approach. London: Belhaven Press. Kernaghan, G. and Harper, K. A. (2001) Community structure of ectomycorrhizal fungi across an alpine/subalpine ecotone. Ecography, 24: 181–188.
368
Kilbride, C.A., Byrne, K.A. and Gardiner, J.J. (1999) Carbon sequestration and
Irish forests. Dublin: COFORD. Kirby, K.J., Reid, C.M., Thomas, R.C. and Goldsmith, F.B. (1998) Preliminary Estimates of Fallen Dead Wood and Standing Dead Trees in Managed and Unmanaged Forests in Britain. Journal of Applied Ecology, 35: 148-155. Kirk, P., Cannon, P. and Stalpers, J. (2008) Dictionary of the Fungi, 10th ed. Wallingford: CABI. Kjoller, R. and Clemmensen, K.E. (2009) Belowground ectomycorrhizal fungal communities respond to liming in three southern Swedish coniferous forest stands. Forest Ecology and Management, 257: 2217-2225. Klironomos, J.N., and Hart, M.M. (2001) Food web dynamics- animal nitrogen swap for plant carbon. Nature, 410: 651-652. Kohl, M. (1996) Assessing and monitoring forest biodiversity in Switzerland and Germany. In: Assessment of Biodiversity for Improved Forest Management. EFl Proceedings No 6. Joensuu: European Forest Institute, pp. 95-104. Kohm, K.A., and Franklin, J.F. (1997) Creating a forestry for the 21st century. Washington, D.C.: Island Press. Kõljalg, U., Larsson, K-H,, Abarenkov, K., Nilsson, R.H., Alexander, I.J., Eberhardt, U., Erland, S., Høiland, K., Kjøller, R., Larsson, E. Pennanen, T., Sen, R., Taylor, A.F.S, Tedersoo, L., Vrålstad, T. and Ursing, B.M. (2005) UNITE: a database providing web-based methods for the molecular identification of ectomycorrhizal fungi. New Phytologist, 166: 1063–1068. Korhonen, K., Capretti, P., Karjalainen, R., Stenlid, J. (1998) Distribution of Heterobasidion annosum intersterility groups in Europe. In: Heterobasidion
annosum. Biology, Ecology, Impact and Control. Woodward, S.; Stenlid, J.; Huttermann, A.; Karjalainen and R. Oxon (eds). New York: CAB International. Kranabetter , J.M. and Wylie, T. (1998) Ectomycorrhizal community structure across forest openings on naturally regenerated western hemlock seedlings. Canadian Journal of Botany, 76: 189-196. Kranabetter, J.M. (1999) The effect of refuge trees on a paper birch ectomycorrhiza community. Canadian Journal of Botany, 77: 1523–1528. Kranabetter, J.M. (2004) Ectomycorrhizal community effects on hybrid spruce seedling growth and nutrition in clearcuts. Canadian Journal of Botany, 82: 983-991.
369
Kranabetter, J.M., Friesen, J., Gamiet, S., Kroeger, P. (2005) Ectomycorrhizal mushroom distribution by stand age in western hemlock lodgepole pine forests of northwestern British Columbia. Canadian Journal of Forest Research, 35: 1527–1539. Krannabetter, J.M., Hayden, S., and Wright, E.F. (1999) A comparison of ectomycorrhiza communities from three conifer species planted. Canadian
Journal of Botany, 77: 1193-1198. Krebs, C.J., Carrier, P., Boutin, S., Boonstra, R., and Hofer, E. (2008) Mushroom crops in relation to the weather in southwestern Yukon. Botany, 86: 1497-1502. Kretzer, A.M., Dunham, S., Molina, R. and Spatafora, J.W. (2004) Microsatellite markers reveal the below ground distribution of genets in two species of Rhizopogon forming tuberculate ectomycorrhizas on Douglas fir. New
Phytologist, 161: 313–320. Kruys, N., Fries, C., Gunnar Jonsson, B., Lamas, T. and Stahl, G. (1999) Wood-inhabiting cryptogams on dead Norway spruce (Picea abies) trees in managed Swedish boreal forests. Canadian Journal of Forest Research, 29: 178–186. Lagana, A., Loppi, S. and De Dominicis, V. (1999) Relationship between environmental factors and the proportions of fungal trophic groups in forest ecosystems of the central Mediterranean area. Forest Ecology and Management, 124: 145-151. Landeweert, R., Hoffland, E., Finlay, R.D., Kuyper, T.W. and van Breemen, N. (2001) Linking plants to rocks: ectomycorrhizal fungi mobilize nutrients from minerals. Trends in Ecology and Evolution, 16: 248-254. Landy, E.T. (2001) A study of the fungi present on temperate salt marsh at North
Bull Island, Co. Dublin. Unpublished PhD thesis, University College Dublin. Lang, R. (1915). Versuch einer exakten Klassifikation der Boden in klimatischer und geologischer Hinsicht. Internationalen Mitteilungen fur Bodenkunde 5, 312. Last, F.T., Dighton. J. and Mason. P.A. (1987). Successions of sheathing Mycorrhizal fungi. Trends in Ecology and Evolution, 2: 157-161. Leake, J.R., and Read, D.J. (1997) Mycorrhizal fungi in terrestrial habitats. In: The Mycota, IV, Environmental and microbial relationships. Berlin: Springer-Verlag. Leake, J.R., Johnson, D., Donnelly, D., Muckle, G.E., Boddy, L. and Read D.J. (2004) Networks of power and influence: The role of mycorrhizal mycelium in controlling plant communities and agro-ecosystem functioning. Canadian Journal
of Botany, 82: 1016-1045.
370
Lee, K.J. and Lee, H. (2004) Fungal diversity and fruitbody production in relation to vegetation structure, topography and soil properties in a Quercus mongolica forest in central Korea. In: Fungi in forest ecosystems: Systematics, diversity and
ecology, Cripps, C. (ed). New York: The New York Botanical Gardens. Legon N.W. and Henrici A. (2005) Checklist of the British and Irish
Basidiomycota. Kew: Royal Botanic Gardens. Lehto, T. and Zwiazek, J.J. (2011) Ectomycorrhizas and water relations of trees: a review. Mycorrhiza, 21: 71–90. Liang, J. and Schoenau, J.J. (1995) Development of resin membranes as a sensitive indicator of heavy metal toxicity in the soil environment. International
Journal of Environmental and Analtical Chemistry, 59: 265-275. Lilleskov, E.A., Fahey, T.J., Horton, T.R. and Lovett, G.M. (2002) Belowground ectomycorrhizal fungal community change over a nitrogen deposition gradient in Alaska. Ecology, 83: 104-115. Lindenmayer, D. B., Fischer, J, Felton, A., Crane, M., Michael, R., Macgregor, C., Montague-Drake, R., Manning, A. and Hobbs, R.J. (2008) Novel ecosystems resulting from landscape transformation create dilemmas for modern conservation practice. Conservation Letters, 1: 129–135. Lindenmayer, D.B., Margules, C.R. and Botkin, D. (2000) Indicators of Biodiversity for Ecologically Sustainable Forest Management. Conservation
Biology, 14: 941–950. LoBuglio, K.L. and Taylor, J.W. (2002) Recombination and genetic differentiation in the mycorrhizal fungus Cenococcum geophilum Fr. Mycologia, 94: 772-780. Longino, J.T., Colwell, J. and Coddington, R.K. (2002) The ant fauna of a tropical rainforest: estimating species richness three different ways. Ecology, 83: 689-702. Loreau, M., Naeem, S. and Inchausti, P. (2007) Biodiversity and ecosystem
functioning. Oxford: Oxford University Press. Ludley, K.E., Robinson, C.H., Jickell, S., Chamberlain, P.M. and Whitaker, J. (2008) Differential response of ectomycorrhizal and saprotrophic fungal mycelium from coniferous forest soils to selected monoterpenes. Soil Biology and
Biochemistry, 40: 669–678. Lugo, A.E. (1997) The Apparent Paradox of Re-establishing Species Richness on Degraded Lands with Tree Monocultures. Forest Ecology and Management, 99: 9-19. Luoma, D.L., Eberhart, J.L., Molina, R., and Amaranthus, M.P. (2004) Response of ectomycorrhizal fungus sporocarp production to varying levels and patterns of green-tree retention. Forest Ecology and Management, 202: 337–354.
371
Luoma, D.L., Eberhart, J.L., Molina, R., Stockdale, C.A. (2006a) The spatial influence of Psuedotsuga menziessi retention trees on ectomycorrhizal diversity. Canadian Journal of Forest Research, 36: 2651-2573. Luoma, D.L., Eberhart, J.L., Abbott, R., Moore, A., Amaranthus, M.P., and Pilz, D. (2006b) Effects of mushroom harvest technique on subsequent American matsutake production. Forest Ecology and Management, 236: 65–75. MacAurthur, R. and Wilson, O. (1969) The Theory of Island Biogeography. Princeton: Princeton University Press. MacAurthur, R.H. (1964) Environmental factors affecting bird species diversity. American Nature, 98: 387-397. Magurran, A.E. (2004) Measuring Biological diversity. Oxford, UK: Wiley Publishing. Manachère, G., (1980) Conditions essential for controlled fruiting of macromycetes—a review. Transactions of the British Mycological Society, 75: 255–270. Mao, C.X., Colwell, R.K. and Chang, J. (2005) Estimating species accumulation curves using mixtures. Biometrics, 61: 433–441. Markkola, A.M., Ohtonen, A., Ahonen-Jonnarth, U. and Ohtonen, R. (1996) Scot’s pine responses to CO2 enrichment. I. Ectomycorrhizal fungi and soil fauna. Environmental Pollution, 94(3): 309-316. Mason, P.A., Last, F.T., Wilson, J. Deacon, J.W., Fleming. L.V. and Fox. F.M. (1987) Fruiting and succession of ectomycorrhizal fungi. In: Fungal infection of
plants, Pegg, G.F. and Ayres, P.G. (eds.). Cambridge: Cambridge University Press, pp. 253-268. Massicotte, H.B., Molina, R., Tackaberry, L.E., Smith, J.E. and Amaranthus, M.P. (1999) Diversity and host specificity of ectomycorrhizal fungi retrieved from three adjacent forest sites by five host species. Canadian Journal of Botany, 77: 1053-1076. McCarthy, B.C. and Bailey, D.R. (1996) Composition, structure, and disturbance history of Crabtree Woods: an old-growth forest of western Maryland. Bulletin of
the Torrey Botany Club, 123: 350-365. McComb, W. C. and Lindenmayer, D. (1999) Dying, Dead, and Down Trees. In: Maintaining Biodiversity in Forest Ecosystems, Hunter, M. L., Jr., (ed). Cambridge: Cambridge University Press. McCullagh, P. and Nelder, J. (1989) Generalized Linear Models, Second Edition. Boca Raton: Chapman and Hall/CRC.
372
McCune, B. and Grace, J.B. (2002) Analysis of ecological communities. Oregon: MjM Software Design. McHugh, R., Mitchel, D., Wright, M. and Anderson, R. (2001) The Fungi of Irish grasslands and their value for nature conservation. Biology and Environment:
Proceedings of the Royal Irish Academy, 101B: 225–242. Menkis, A., Vasiliauskas, R., Taylor, A.F., Stenlid, J. and Finlay, R. (2005) Fungal communities in mycorrhizal roots of conifer seedlings in forest nurseries under different cultivation systems, assessed by morphotyping, direct sequencing and mycelial isolation. Mycorrhiza, 16: 33–41. Millennium Ecosystem Assessment (2005) Ecosystems and Human Well-being:
Biodiversity Synthesis. Washington, DC: World Resources Institute. Mitchel, D. (2006) Survey of the Grassland Fungi of County Clare. Dublin: The Heritage Council. Mitchel, D. (2007) Survey of the Grassland Fungi of the Vice County of West
Cork. Dublin: The Heritage Council. Mitchel, D. (2008) Survey of the Grassland Fungi of the Vice County of West
Mayo. Dublin: The Heritage Council. Mitchel, D. (2009) Survey of the Grassland Fungi of the Vice County of West
Donegal. Dublin: The Heritage Council. Mitchell, F.J.G. (1988) The vegetational history of the Killarney Oakwoods, S. W. Ireland: evidence from fine spatial resolution pollen analysis. Journal of
Ecology, 76: 415-436. Mitchell, F.J.G. (1995) The dynamics of Irish post-glacial forests. In: Wood’s, Trees and Forests in Ireland, Pilcher, J.R. and Mac an tSoir, S. (eds.). Royal Irish Academy, Dublin. Molina, R. and Trappe, J. (1982) Lack of mycorrhizal specificity by the ericaceous host Abrutus menziesii and Arctostaphylus uva-ursi. New Phytologist, 90: 495-509. Molina, R., Trappe, J.M. (1982) Pattern of ectomycorrhizal host specificity and potential amoung pacific northwest conifors and fungi. Forest Science, 28: 423-458. Molina, R.J., Massicotte, H.B., Trappe, J.M., (1992) Specificity phenomena in mycorrhizal symbioses: Community-ecological consequences and practical implications. In: Mycorrhizal Functioning, an Integrative Plant-fungal Process, Allen, M.F. (Ed.). New York: Routledge, Chapman and Hall, pp. 357–423.
373
Moore, D., Nauta, M., Evans, S., and Rotheroe, M. (2001) Fungal conservation-
Issues and solutions, Cambridge: Cambridge University Press. Morris, M.H., Smith, M.E., Rizzo, D.M., Rejmanek, M. and Bledsoe, C.S. (2008) Contrasting ectomycorrhizal fungal communites on the roots of co-occuring oaks (Quercus spp.) in a California woodland. New Phytologist, 178: 167–176. Moser, M. (1983) Keys to Agarics and Boleti. 4th ed. London: Roger Phillips. Mueller, M.G., J.P. Schmit, P.R. Leacock, B. Buyck,. Cifuentes, J., Desjardin, D.E., Halling, R.E., Hjortstam, K., Iturriaga, T., Larsson, k., Lodge, J., May, T.W., Minter, D., Rajchenberg, M., Redhead, S.A., Ryvarden, L., Trappe, J.M., Watling, R. and Wu, Q. (2007) Global diversity and distribution of macrofungi. Biodiversity and Conservation, 16: 37-48. Muller, M. and Hallaksela, A. (1998) Diversity of Norway spruce endophytes in various mixed and pure Norway spruce stands. Mycological Research, 102: 1183-1189. Muñoz, J.A. (2005) Boletus: Fungi Europaei. Vol. 1. Alassio: Edizioni Candusso. Muskett, A.E. and Malone, J.P. (1978) Catalogue of Irish fungi – I. Gasteromycetes. Proceeding of the Royal Irish Academy, B78, 1-11. Muskett, A.E. and Malone, J.P. (1980) Catalogue of Irish fungi – II. Hymenomycetes. Proceeding of the Royal Irish Academy, B80: 197-276. Naeem, S. (1999) Power behind Nature’s throne. Nature, 401: 653–654. Nantel, P. and Neumann, P. (1992) Ecology of ectomycorrhizal-basidiomycete communities on a local vegetation gradient. Ecology, 73: 99–117. National Forest Inventory (2006) [online], available: http://www.agriculture.gov.ie/index.jsp?file=forestry/NFI/NFI_results.xml [accessed 16 Feb. 2009]. NBDC (2010). Data Centre Mapping System. [online], available: http://maps.biodiversityireland.ie/ [accessed 22/03/2011]. Newton, A. C. and Pigott, C. D. (1991) Mineral nutrition and mycorrhizal infection of seedling oak and birch I. Nutrient uptake and the development of mycorrhizal infection during seedling establishment. New Phytologist, 117: 37–44. Newton, A.C. (2007) Forest ecology and conservation. Oxford: Oxford University Press.
374
Newton, A.C. and Haigh, J. (1998) Diversity of ectomycorrhizal fungi in the UK: a test of the species-area relationship and the role of host preference. New
Phytologist, 138: 619-627. Newton, A.C., Holden, E., Davy, L.M., Ward, S.D., Fleming, L.V. and Watling, R. (2002) Status and distribution of stipitate hydnoid fungi in Scottish coniferous forests. Biological Conservation, 107: 181-192. Nihlgard, B., and Lindgreen, L. (1977) Plant biomass, primary production and bioelements of three mature beech forests in southern Sweden. Oikos, 28: 95-104. Noordeloos, M.E. (1992). Entolomataceae. In Knudsen & Hansen (eds.) Nordic
Macromycetes, vol. 2. Copenhagen: Nordsvamp, pp.341-359. Noordeloos, M.E. (2005) General Part. In: Flora Agaricina Neerlandica,
Noordeloos, M.E., Kuyper, T.W. and Vellinga , E.C. (eds.) vol. 6. Rotterdam: Balkema publishers, pp. 1-19. Norden, B., Gotmark, F., Ryberg, M., Paltto, H., Allmer, J. (2008) Partial cutting reduces species richness of fungi on woody debris in oak-rich forests. Canadian
Journal of Forest Research, 38: 1807–1816. Norden, B., Gotmark, F., Tonnberg, M., and Ryberg, M. (2004) Dead wood in semi-natural temperate broadleaved woodland: contribution of coarse and fine dead wood, attached dead wood and stumps. Forest Ecology and Management, 194: 235–248. Norden, B., Paltto, H., Gotmark, F. and Wallin, K. (2007) Indicators of biodiversity, what do they indicate? - Lessons for conservation of cryptogams in oak-rich forest. Biological Conservation, 135: 369-379. Noss, R.F. (1999). Assessing and monitoring forest biodiversity: a suggested framework and indicators. Forest Ecology and Management, 115: 135–146. Nuñez, M.A., Horton, T.R. and Simberloff, D. (2009) Lack of belowground mutualisms hinders Pinaceae invasions. Ecology, 90: 2352–2359. O’Carroll, M. (1978) The nursing of Sitka spruce I. Japanese larch. Irish Forestry, 35: 60-65. O’ Connell, T. and Bolger, T. (1997) Stability, ephemerality and dispersal ability: microarthropod assemblages on fungal sporophores. Biological Journal of the
Linnean Society, 62: 111–131. O’ Connell, T. and Bolger, T. (2007) Fungal fruiting bodies and the structure of the fungus micro-arthropod assemblages. Biology and Environment: Proceedings
of the Royal Irish Academy 97B: 249–262.
375
O’Dell, T.E., Ammirati, J.F., and Schreiner, E.G. (1999) Species richness and abundance of ectomycorrhizal basidiomycete sporocarps on a moisture gradient in the Tsuga heterophylla zone. Canadian Journal of Botany, 77: 1699-1711. O’Hanlon, R. and Harrington, T.J. (2011; Appendix 2 this volume) Diversity and distribution of mushroom forming fungi (Agaricomycetes) in Ireland. Biology and
Environment: Proceedings of the Royal Irish Academy
O’Toole, L., Fielding, A.H. and Haworth, P.F. (2002) Re-introduction of the golden eagle into the Republic of Ireland. Biological Conservation, 103: 303–312. Odor, P., Heilmann-Clausen, J., Christensen, M., Aude, E., van Dort, K.W., Piltaver, A., Siller, I., Veerkamp, M.T., Walleyn, R., Standovar, T., van Hees, A.F.M., Kosec, J., Matocec, N., Kraigher, H. and Grebenc, T. (2006) Diversity of dead wood inhabiting fungi and bryophytes in semi-natural beech forests in Europe. Biological Conservation, 131: 58–71. Ohenoja, E. (1993) Effect of weather conditions on the larger fungi at different
forest sites in northern Finland in 1976-1988. Unpublished Ph.D. thesis, Department of Botany, Oulu University, Oulu, Finland. Okland, B., Gotmark, F., and Norden, B. (2008) Oak woodland restoration: testing the effects on biodiversity of mycetophilids in Sweden. Biodiversity and
Conservation, 17: 2599-2616. Okland, B., Gotmark, F., Norden, B., Franc, N., Kurina, O., and Polevoi, A. (2005). Regional diversity of Mycetophilids (Diptera: Sciaroidea) in Scandinavian oak-dominated forests. Biological Conservation, 121: 9–20. Ortega , A. and Lorite, J. (2007) Macrofungi diversity in cork-oak and holm-oak forests in Andalusia (southern Spain); an efficient parameter for establishing priorities for its evaluation and conservation. Central European Journal of
Botany, 2: 276–296. Orton, P.D. (1987) Fungi of northern Pine and Birch woods. Bulletin of the British
Mycological Society, 20: 130-145. Orton, P.D. (1994) Some comments on ‘A provisional red data list for British Fungi’. Mycologist, 8: 66-67. Osono, T., Fukasawa, Y. and Takeda, H. (2003). Roles of diverse fungi in larch needle-litter decomposition. Mycologia, 95: 820-826. Ostry, M.E., and Laflamme, G. (2009) Fungi and diseases- natural components of healthy forests. Botany, 87: 22-25.
376
Outerbridge, R.A., and Trofymow, J. (2004) Diversity of ectomycorrhizae on experimentally planted Douglas-fir seedlings. Canadian Journal of Botany, 82: 1671-1681. Outerbridge, R.A. (2002) Macrofungus ecology and diversity under different
conifer monocultures on southern Vancouver Island. Unpublished PhD Dissertation, University of Victoria, BC. Ovaskainen, O., Nokso-koivisto, J., Hottola, J., Rajala, T., Pennanen, T., Ali-kovero, H., Miettinen, O., Oinonen, P., Auvinen, P., Paulin, L., Larsson, K. and Makip, R. (2010) Identifying wood-inhabiting fungi with 454 sequencing –what is the probability that BLAST gives the correct species?. Fungal Ecology, 3: 274–283. Oxbrough, A.G., Gittings, T., O’Halloran, J., Giller, P.S. and Smith, G.F. (2005) Structural indicators of spider communities across the forest plantation cycle. Forest Ecology and Management, 21: 171-183. Oxbrough, A.G., Gittings, T., O’Halloran, J., Giller, P.S., and Kelly, T.C. (2006b) The influence of open space on ground-dwelling spider assemblages within plantation forests. Forest Ecology and Management, 237: 404-417. Oxbrough, A.G., Gittings, T., O’Halloran, J., Giller, P.S., and Kelly, T.C. (2006a) The initial effects of afforestation on the ground-dwelling spider fauna of Irish peatlands and grasslands. Forest Ecology and Management, 237: 478-491. Oxbrough, A.G., Irwin, S., Kelly, T.C. and O’Halloran, J. (2010) Ground-dwelling invertebrates in reforested conifer plantations. Forest Ecology and
Management, 259: 2111–2121. Paletto, A. and Tosi, V. (2009) Forest canopy cover and canopy closure: comparison of assessment techniques. European Journal of Forest Research, 128: 265–272. Palfner, G., Angélica Casanova-Katny, M. and Read, D.J. (2005) The mycorrhizal community in a forest chronosequence of Sitka spruce [Picea sitchensis (Bong.) Carr.] in Northern England. Mycorrhiza, 15: 571-579. Paul, E.A. (2007) Soil Microbiology, Ecology and Biochemistry. Massachusetts: Academic press. Peay, K.G., Bruns, T.D., Kennedy, P.G., Bergemann, S.E. and Garbelotto, M. (2007). A strong species–area relationship for eukaryotic soil microbes: island size matters for ectomycorrhizal fungi. Ecology Letters, 10: 470–480. Peay, K.G., Kennedy, P.G., Bruns, T.D. (2011) Rethinking ectomycorrhizal succession: are root density and hyphal exploration types drivers of spatial and temporal zonation?. Fungal Ecology, 4: 233-240.
377
Peck, J.E. (2003) Using PC-ORD for Multivariate Data Analysis. Minneapolis, MN, USA: PC-ORD Workshop, pp. 11. Pegler, D.N., Roberts, P.J. and Spooner, B.M. (1997) British Chanterelles and Tooth Fungi. Kew, Richmond: Royal Botanic Gardens. Perez-Moreno, J. and Read, D.J. (2001) Nutrient transfer from nematodes to plants: a direct pathway provided by the mycorrhizal mycelial network. Plant,
Cell and Environment, 24: 1219-1226. Perini, C., Barluzzi, C. and De Dominicis, V. (1989) Mycocoenological research on evergreen oak wood in the hills adjacent to the Maremma coastline (NW of Grosseto, Italy). Phytocoenologia, 17: 289-306. Perrin, P., Martin, J., Barron, S., O’Neill, F., McNutt, K. and Delaney, A. (2008a) National survey of Native Woodlands 2003–2008: Volume I main report. Dublin: National Parks & Wildlife Service. Perrin, P., Martin, J., Barron, S., O’Neill, F., McNutt, K. and Delaney, A. (2008b) National survey of Native Woodlands 2003–2008: volume II woodland classification. Dublin: National Parks & Wildlife Service. Perrin, P., Kelly, D.L. and Mitchell, F.J.G. (2006b) Long-term deer exclusion in yew-wood and oakwood habitats in southwest Ireland: Natural regeneration and stand dynamics. Forest Ecology and Management, 236: 356–367. Perrin, P.M., Barron, S.J. & Martin, J.R. (2006a) National Survey of Native
Woodlands in Ireland: Second Phase Report. Dublin: National Parks & Wildlife Service. Perry, D. A., Oren, R. & Hart, S. (2008) Forest ecosystems. Baltimore, MD: John Hopkins University Press. Perry, D.A., Borchers, J.G., Borchers, S.L. and Amaranthus, M.P. (1990) Species migrations and ecosystem stability during climate change: the belowground connection. Conservation Biology, 4: 266-274. Peter, M., Ayer, F., Egli, S. and Honegger, R. (2001) Above and belowground community structure of ectomycorrhizal fungi in three Norway spruce (Picea
abies) stands in Switzerland. Canadian Journal of Botany, 79: 1134–1151. Peterken, G.F. and Jones, E.W. (1989) Forty years of change in Lady ParkWood: the young-growth stands. Journal of Ecology, 77: 401–429. Peterken, G.F., Ausherman, D., Buchanan, M. and Forman, R.T.T. (1992) Old-growth conservation within British upland conifer plantations. Forestry, 65: 127-144.
378
Peterson, E. B., Peterson, N. M., Weetman, G. F. and Martin, P. J. (1997) Ecology
and management of Sitka spruce, emphasizing its natural range in British
Columbia. Vancouver, B.C.: University of British Colmbia. Peterson, R.H. and Cifuentes, J. (1994) Notes on mating systems of Auriscalpium
vulgare and A. villipes. Mycological Research, 98: 1427-1430. Phillips, R. (2006) Mushrooms. UK: Pan Macmillian. Pickles, B.J., Genney, D.R., Potts, J.P., Lennon, J.J., Anderson, I.C. and Alexander, I.J. (2010) Spatial and temporal ecology of Scot’s pine ectomycorrhizas. New Phytologist, 186: 755–768. Pilz, D. and Perry, D. (1984) Impact of clearcutting and slash burning on ectomycorrhizal associations of Douglas fir seedlings. Canadian Journal of
Forest Research, 14: 94-100. Pim, G. (1898) The fungi of counties Dublin and Wicklow. Irish Naturalists’
Journal, 2: 173-185. Pinna, S., Gévry, M.F., Côté, M. and Sirois, L. (2010) Factors influencing fructification phenology of edible mushrooms in a boreal mixed forest of Eastern Canad. Forest Ecology and Management, 260: 294–301. Qian, P., and Schoenau, J.J. (2002) Practical applications of ion exchange resins in agriculture and environmental soil research. Canadian Journal of Soil Science 82: 9–21. Quine, C.P. and Humphrey, J.W. (2010) Plantations of exotic tree species in Britain: irrelevant for biodiversity or novel habitat for native species?. Biodiversity and Conservation, 19: 1503–1512. Raaijmakers, J.G. (1987) Statistical analysis of the Michaelis–Menten equation. Biometrics, 43: 793–803. Rackham, O. (1995) Looking for ancient woodland in Ireland. In: Wood’s, Trees
and Forests in Ireland, Pilcher, J.R. and Mac an tSoir, S. (Eds.). Dublin: Royal Irish Academy. Ramsbottom, J. (1936) The Killarney foray: 20–26 September, 1936. Transactions of the British Mycological Society, 22: 5-11. Redecker, D., T. M. Szaro, J. R. Bowman, and T. D. Bruns. (2001) Small genets of Lactarius xanthogalactus, Russula cremoricolor, and Amanita francheti in late stage ectomycorrhizal successions. Molecular Ecology, 10: 1025–1034. Renvall, P. (1995) Community structure and dynamics of woodrotting Basidiomycetes on decomposing conifer trunks in northern Finland. Karstenia, 35: 1-51.
379
Richard, F., Millot, S., Gardes, M. and Selosse, M.A. (2005) Diversity and specificity of ectomycorrhizal fungi retrieved from an old-growth Mediterranean forest dominated by Quercus ilex. New Phytologist, 166: 1011–1023. Richardson, M. J. (1970) Studies on Russula emetica and other agarics in a Scot’s pine plantation. Transactions of the British Mycological Society 55: 217-229. Ries, L., Robert, J., Fletcher, J., Battin, J. and Sisk, T.D. (2004) Ecological responses to habitat edges: mechanisms, models, and variability explained. Annual Review of Ecology Evololution and Systematics, 35: 491–522. Rincón, A. and Pueyo, J.J. (2010) Effect of fire severity and site slope on diversity and structure of the ectomycorrhizal fungal community associated with post-fire regenerated Pinus pinaster Ait. seedlings. Forest Ecology and Management, 260: 361–369. Riva, A. (2003) Tricholoma, Fungi Europaei 3. Alassio: Edizioni Candusso. Roberts, C., Ceska, O., Kroeger, P. and Kendrick, B. (2004) Macrofungi from six habitats over five years in Clayoquot Sound, Vancouver Island. Canadian Journal
of Botany, 82: 1518–1538. Robertson, S.J., Tackaberry, L.E., Egger, K.N. and Massicotte, H.B. (2006) Ectomycorrhizal fungal communities of black spruce differ between wetland and upland forests. Canadian Journal of Forest Research, 36: 972–985. Roche, J.R., Mitchell, F.J.G. and Waldren, S. (2009) Plant community ecology of Pinus sylvestris, an extirpated species reintroduced to Ireland. Biodiversity and
Conservation, 18: 2185-2203. Rodin, L.E., and Basilevic, N.I. (1968) World distribution of plant biomass. In: Functioning of terrestrial ecosystems at the primary production level. F.E. Eckardt (ed.). Paris: UNESCO. pp. 45 -52. Rodwell, J.S. and Cooper, E.A. (1995) Scottish pinewoods in a European context. In: Our pinewood heritage, Aldhous, J.R. (ed). Inverness: Forestry Commission, The Royal Society for the Protection of Birds, Scottish Natural Heritage. Rogerson, T.L., (1976) Soil water deficits under forested and clearcut areas in northern Arkansas. Soil Science Society of America, 40: 802–805. Rosenwald, R. and Lõhmus, A. (2008) For what, when and where is green-tree retention better than clear-cutting? A review of the biodiversity aspects. Forest
Ecology and Management, 255: 1–15. Rosling, A., Landeweert, R., Lindahl, B.D., Larsson, K-H., Kuyper, T.W., Taylor, A.F.S. and Finlay, R.D. (2003) Vertical distribution of ectomycorrhizal fungal taxa in a podzol profile determined by morphotyping and genetic verification. New Phytologist, 159: 775–783.
380
Ruhling, A., and Tyler, G. (1990) Soil factors influencing the distribution of macrofungi in oak forests of sounthern Sweden. Holartic Ecology, 13: 11-18. Sakakibara, S.M., Jones, M.D., Gillespie, M., Hagerman, S.M., Forrest, M.E., Simard, M.E., Durall, D.M. (2002) A comparison of ectomycorrhiza identification based on morphotyping and PCR-RFLP analysis. Mycological Research, 106: 868–878. Sakura, T., Gimingham, C.G. and Miller, C.S. (1985). Effect of tree density on ground vegetation in a Japanese larch plantation. Scottish Forests, 39: 191-198. Salo, K. (1993) The composition and structure of macrofungus communities in boreal upland type forests and peatlands in north Karelia, Finland. Karstenia, 33: 61-99. Sarrionandia, E., Rodriguez, N. and Salcedo, I. (2009) A study of the macrofungal community in the beech forests of Altube (Basque Country, Northern Spain). Cryptogamie Mycologie, 30: 67-83. Såstad, S. (1995) Fungi-vegetation relationships in a Pinus sylvestris forest in central Norway. Canadian Journal of Botany, 73: 807-816. Scherer-Lorenzen, M., Korner, C., and Schulze, E. (2005) Forest Diversity and
Function. Berlin: Springer-Verlag. Schild, D.E., Kennedy, A. and Stuart, M.R. (1988) Isolation of symbiont and associated fungi from ectomycorrhizas of Sitka spruce. European Journal of
Forest Pathology, 18: 51-61. Schmit, J. P. and G. M. Mueller (2007) An estimate of the lower limit of global fungal diversity. Biodiversity and Conservation, 16: 99–111. Schmit, J.P., Mueller, G.M., Leacock, P.R., Mata, J.L., Wu, Q. and Huang, Y. (2005) Assessment of tree species richness as a surrogate for macrofungal species richness. Biological Conservation, 121: 99–110. Schmit, J.P., Murphy, J.F., and Mueller, G.M., (1999) Macrofungal diversity of a temperate oak forest: a test of species richness estimators. Canadian Journal of
Botany, 77: 1014– 1027. Schweiger, O., Musche, M., Bailey, D., Billeter, R., Diekotter, T., Hendrickx, F., Herzog, F., Liira, J., Malfait, J., Speelmans, J. and Dziock, F. (2007) Functional richness of local hoverfly communities (Diptera, Syrphidae) in response to land use across temperate Europe. Oikos, 116: 461-472.
381
Senn-Irle, B., Heilmann-Clausen, J., Genney, D., Dahlberg, A. (2007) Guidance
for the conservation of Fungi. Prepared for the Convention on the Conservation
of European and natural habitats. European Council. Document T-PVS (2007) 13 (rev). Strasbourg 17 Oct 2007. [Online], available: www.coe.int/t/dg4/cultureheritage/conventions/bern/T-PVS/sc27_tpvs13_en.pdf. [accessed 10/06/09]. Senn-Irlet, B. and Bieri, G. (1999) Sporocarp succession of soil-inhabiting macrofungi in an autochothonous subalpine Norway spruce forest of Switzerland. Forest Ecology and Management, 124: 169-175. Shannon, C.E. and Weaver, W. (1949) The Mathematical Theory of
Communication. Urbana: University of Illinois Press. Siitonen, P., Lehtinen, A. and Siitonen, M. (2005) Effects of Forest Edges on the Distribution, Abundance, and Regional Persistence of Wood-Rotting Fungi. Conservation Biology, 19: 250-260. Simard, S.W. and Durall, D.M. (2004) Mycorrhizal networks: a review of their extent, function, and importance. Canadian Journal of Botany, 82: 1140-1165. Simard, S.W., Perry, D.A., Jones, M.D., Myrold, D.P., Durall, D.M., and Molina, R., (1997) Net transfer of carbon between ectomycorrhizal trees species in the field. Nature, 388: 579-582. Simard, S.W., Perry, D.A., Jones, M.D., Smith, J.E. and Molina, R., (1997b) Shared compatibility of ectomycorrhizae on Psuedotsuga menziesii and Betula
papyrifera seedlings grown in mixture in soils from southern British Columbia. Canadian Journal of Forest Research, 27: 331-342. Simpson, E.H. (1949) Measurements of diversity. Nature, 163: 668. Sippola, A., Renvall, P. (1999) Wood-decomposing fungi and seed-tree cutting: A 40-year perspective. Forest Ecology and Management, 115: 183-201. Smith, E.P. and Belle, G.V. (1984) Nonparametric estimation of species richness. Biometrics, 40: 119–129. Smith, G.F., Iremonger, S., Kelly, D.L., O’Donoghue, S. and Mitchell, F.J.G. (2007) Enhancing vegetation diversity in glades, rides and roads in plantation forests Biological Conservation, 136: 283-294. Smith, G.F., Gittings, T., Wilson, M.W., Oxbrough, A., Iremonger, S., O'Donoghue, S., McKee, A.M., O'Halloran, J., Kelly, D.L., Pithon, J., O'Sullivan, A., Neville, P., Mitchell, F.J.G., Giller, P.S., O'Donnell, V. and Kelly, T.C. (2006). Biodiversity Assessment of Afforestation Sites. BIOFOREST Project 3.1.1 Final Report to COFORD. [Online], available: http://www.coford.ie/iopen24/pub/pub/Reports/BIOFOREST312text.PDF. [accessed 06/08/08].
382
Smith, G.F., Gittings, T., Wilson, M.W., French, L., Oxbrough, A., O’Donoghue, S., Pithon,. O’Donnell, V., McKee, A.M., Iremonger, S., O’Halloran, J., Kelly, D.L., Mitchell, F.J.G., Giller, P.S. and Kelly, T. (2005) Assessment of biodiversity
at different stages of the forest cycle. BIOFOREST Project 3.1.2 Final Report to COFORD. [Online], available: http://bioforest.ucc.ie/pages/project_two.htm [accessed 09/03/09]. Smith, J.E., Molina, R., and Perry, D.A. (1995) Occurance of ectomycorrhizas on ericaceous and coniferous seedlings grown in soils from the Oregon coast range. New Phytologist, 129: 73-81. Smith, J.E., Molina, R., Huso, M.M.P., Luoma, D.L., McKay, D., Castellano, M.A., Lebel, T., Valachovic, Y., (2002) Species richness, abundance, and composition of hypogeous and epigeous ectomycorrhizal fungal sporocarps in young, rotation-age, and old-growth stands of Douglas-fir (Pseudotsuga
menziesii) in the Cascade Range of Oregon USA. Canadian Journal of Botany, 80: 186–204. Smith, S.E. and Read, D.J. (2008) Mycorrhizal symbiosis, 3rd edition. London: Acedemic Press. Sokal, R.R. and Rohlf, F.J. (1995) Biometry, 3rd edition. New York: W.H. Freeman and Co. Stark, N.M. (1982) Soil fertility after logging in the northern Rocky Mountains. Canadian Journal of Forest Research, 12: 679–686. Stendell, E.R., Horton, T.R. and Bruns, T.D. (1999) Early effects of prescribed fire on the structure of the ectomycorrhizal fungus community in a Sierra Nevada ponderosa pine forest. Mycological Research, 103:1353–1359. Straatsma, G. and Krisai-Greilhuber, I. (2003) Assemblage structure, species richness, abundance, and distribution of fungal fruiting bodies in a seven year plot based survey near Vienna. Mycological Research, 107: 632-640. Straatsma, G., Ayer, F. and Egli, S. (2001) Species richness, abundance and phylogeny of fungal fruit bodies over 21 years in a Swiss forest plot. Mycological
Research, 105: 512-523. Strong, D.R. and Levin, D.A. (1975) Species Richness of the Parasitic Fungi of British Trees. Proceedings of the National Academy of Sciences, 72: 2116-2119. Stubblefield, S.P. and Taylor, T.N. (1988) Recent advances in paleomycology. New Phytologist, 108: 3-25. Su, Q., Maclean, D. and Needham, T. (1996) The influence of hardwood content on balsam fir defoliation by spruce budworm. Canadian Journal of Forest
Research, 26: 1620-1628.
383
Sweeney, O.F., Martin, R.D., Irwin, S., Kelly, T.C., O’Halloran, J., Wilson, M.W. and McEvoy, P.M. (2010a). A lack of large-diameter logs and snags characterises dead wood patterns in Irish forests. Forest Ecology and Management, 259: 2056-2064. Sweeney, O.F., Wilson, M.W., Irwin, S., Kelly, T.C. and O’Halloran, J. (2010b) Are bird density, species richness and community structure similar between native woodlands and non-native plantations in an area with a generalist bird fauna?. Biodiversity and Conservation, 19: 2329–2342. Tarvainen, O., Markkola, A.M. and Strömmer, R. (2003) Diversity of macrofungi and plants in Scot’s pine forests along an urban pollution gradient. Basic and
Applied Ecology, 4: 547–556. Taylor, A.F.S. (2002) Fungal diversity in ectomycorrhizal communities: sampling effort and species detection. Plant and Soil, 244: 19-28. Taylor, A.F.S. and Alexander, I.J. (1989) Demography and population dynamics of ectomycorrhizas of Sitka spruce fertilized with N. Agriculture, Ecosystems and
Environment, 28: 493–496. Taylor, D.L. and Bruns, T.D. (1999) Community structure of ectomycorrhizal fungi in a Pinus muricata forest: minimal overlap between the mature forest and resistant propagule communities. Molecular Ecology, 8: 1837–1850. Teagasc (2005) Irish Agriculture and Food Development Authority. [Online], available: www.teagasc.ie [Accessed 11/05/11]. Tedersoo, L., Koljalg, U., Hallenberg, N. and Larsson, K. (2003) Fine scale distribution of ectomycorrhizal fungi and roots across substrate layers including coarse woody debris in a mixed forest. New Phytologist, 159: 153–165. Tedersoo, L., May, T.W. and Smith, M.E. (2010) Ectomycorrhizal lifestyle in fungi: global diversity, distribution, and evolution of phylogenetic lineages. Mycorrhiza, 20: 217-263. Tedersoo, L., Nilsson, R.H., Abarenkov, K., Jairus, T., Sadam, A., Saar, I., Bahram, M., Bechem, E., Chuyong, G. and Kõljalg, U. (2010) 454 Pyrosequencing and Sanger sequencing of tropical mycorrhizal fungi provide similar results but reveal substantial methodological biases. New Phytologist, 188: 291–301. Tedersoo, L., Suvi, T., Larsson, E., and Koljalg, U. (2006) Diversity and community structure of ectomycorrhizal fungi in a wooded meadow. Mycological
Research, 110:734-748. Tennant, D. (1975). A test of a modified line intersect method of estimating root length. Journal of Ecology, 63: 995-1001.
384
Termorshuizen, A.J. (1991) Succession of Mycorrhizal fungi in stands of Pinus
sylvestris in the Netherlands. Journal of Vegetation Science, 2: 555–564. Thomas, G.W., Rogers, D. and Jackson, R. (1983) Changes in the mycorrhizal status of Sitka spruce following outplanting. Plant and Soil, 71: 319-323. Tofts, R.J. and Orton, P. D. (1998) The species accumulation curve for agarics and boleti from a Caledonian pine wood. Mycologist, 12: 98-102. Tomppo, E. (1996) Biodiversity monitoring in Finnish forest inventories. In: Assessment of Biodiversity for Improved Forest Management. EFI Proceedings No 6. Joensuu: European Forest Institute, pp. 87-94. Topp, W., Kappes, H., Kulfan, J., Zach, P. (2006) Distribution pattern of woodlice (Isopoda) and millipedes (Diplopoda) in four primeval forests of the Western Carpathians (central Slovakia). Soil Biology and Biochemistry, 38: 43–50. Trappe, J.M. (1969) Studies on Cenococcum graniforme I. An efficient method for isolation from sclerotia. Canadian Journal of Botany, 47: 1389–1390. Twieg, B.D., Durall, D.M., Simard, S.W. and Jones, M.D. (2009) Influence of soil nutrients on ectomycorrhizal communities in a chronosequence of mixed temperate forests. Mycorrhiza, 19: 305–316. Tyler, G. (1985) Macrofungal flora of swedish beech forest related to soil organic mattes and acidity characteristics. Forest Ecology and Management, 10: 13-29. Tyler, G. (1989) Edaphical distribution patterns of macrofungal species in deciduous forest in South Sweden. Acta Ecology, 10: 309-326. Tyler, G. (1992) Tree species affinity of decomposer and ectomycorrhizal macrofungi in beech (Fagus sylvatica L.), oak (Quercus robur L.) and hornbeam (Carpinus betulus L.) forests. Forest Ecology and Management, 47: 269–284. UNECE (2003) State of Europe’s Forests 2003: The MCPFE’s Report on
Sustainable Forest Management in Europe. 4th Ministerial conference on the protection of forests in Europe. Vienna: MCPFE Liason Unit. Unterseher, M., and Tal, O. (2006) Influence of small scale conditions on the diversity of wood decay fungi in a temperate, mixed deciduous forest canopy. Mycological Research, 110: 169-178. Unterseher, M., Otto, P. and Morawetz, W. (2005) Species richness and substrate specificity of lignicolous fungi in the canopy of a temperate, mixed deciduous forest. Mycological Progress, 4: 117–132. Unterseher, M., Schnittler, M., Dormann, C. and Sickert, A. (2008) Application of species richness estimators for the assessment of fungal diversity. FEMS
Microbiology Letters, 282: 205–213.

385
Valentine, L.L., Fiedler, T.L., Hart, A.N., Petersen, C.A., Berninghausen, H.K. and Southworth D. (2004) Biodiversity of ectomycorrhizal fungi associated with Quercus garryana. Canadian Journal of Botany, 82: 123–135. Vare, H., Ohenoja, E., Ohtonen, R. (1996) Macrofungi of oligotrophic Scot’s pine forests in northern Finland. Karstenia, 36:, 1–18. Vesterdal, L., Dalsgaard, M., Felby, C., Raulund-Rasmussen, K. and Jùrgensen, B.B., (1995) Effects of thinning and soil properties on accumulation of carbon, nitrogen and phosphorus in the forest floor of Norway spruce stands. Forest
Ecology and Management, 77: 1-10. Villeneuve, N., Grandtner, M.M. and Fortin, J.A. (1989) Frequency and diversity of ectomycorrhizal and saprophytic macrofungi in the Laurentide Mountains of Quebec. Canadian Journal of Botany, 67: 2616-2629. Waksman, S.A. (1916) Do fungi live and produce mycelium in the soil?. Science, 44: 320-322. Walker, J.F., Miller, O.K. and Horton, J.L. (2005) Hyperdiversity of ectomycorrhizal fungus assemblages on oak seedlings in mixed forests in the southern Appalachian Mountains. Molecular Ecology, 14: 829–838. Wallace, H.L., Good, J.E.G. and Williams, T.G., (1992). The effects of afforestation on upland plant communities: an application of the British National Vegetation Classification. Journal of Applied Ecology, 29: 180-194. Wang, B. and Qiu, Y.L. (2006) Phylogenetic distribution and evolution of mycorrhizas in land plants. Mycorrhiza, 16: 299–363. Wang, H., Dai, L.M., Yang, B.S., Lang, Q.L. and Gu, H.Y. (2005). Occurrence and culture of Mycorrhizal fungi associated with oaks in Dandong Region, Limning Province. Pedosphere, 15(2): 232-237. Wang, Y. and Hall, I.R. (2004) Edible ectomycorrhizal mushrooms: challenges and achievements. Canadian Journal of Botany, 82: 1063–1073. Warren W.G. and Olsen P.E. (1964) A line intersect technique for assessing logging waste. Forest Science, 10: 267-276. Waters, J., McKelvey, K., Zabel, C., and Oliver, W. (1994) The effects of thinning and broadcast burning on sporocarp production of hypogeous fungi. Canadian Journal of Forest Research, 24: 1516-1522. Watling, R, (1995) Assessment of fungal diversity: macromycetes, the problems. Canadian Journal of Botany (Suppl. 1) 73: S15-S24. Watling, R. (1974) Macrofungi in oak woods in Britain. In: The British Oak, M.G. Morris & F.H. Perring(eds.). Berkshire, UK: BSBI. pp. 235-249.
386
Watling, R. (1997). Biodiversity of lichenised and non-lichenised fungi in Scotland. In: Biodiversity in Scotland: Status, Trends and Initiatives, Fleming, L.V., Newton, A.C., Vickery, J.A., Usher, M.B. (Eds.). Scottish Natural Heritage, The University of Edinburgh. Edinburgh: The Stationery Office. pp 77-88. Watling, R. (2005) The fungi of Scottish Western oakwoods. Botanical Journal of
Scotland, 57: 155-165. Watson, K. (2007) Soils illustrated: Field descriptions. British Columbia: International remote sensing surveys ltd. Webber, J.F., Mullett, M. and Brasier, C.M. (2010) Dieback and mortality of plantation Japanese larch (Larix kaempferi) associated with infection by Phytophthora ramorum. New Disease Reports, 22: 19. Whalley, A.J.S. and Watling, R. (1982) Distribution of Daldinia concentrica in the British Isles. Transactions of the British Mycological Society, 78: 47–53. Whipps, J.M. (2004) Prospects and limitations for mycorrhizas in biocontrol of root pathogens. Canadian Journal of Botany, 82: 1198–1227. White tailed eagle project (2010) [Online], available: http://www.goldeneagle.ie/portal.php?z=9 [accessed 22/03/2011]. White, J. & Doyle, G. (1982). The vegetation of Ireland: a catalogue raisonne In: Studies on Irish vegetation, J. White (ed.),. Dublin: Royal Dublin Society, pp. 289-368. White, T.J., Bruns, T., Lee, S., Taylor, J.W. (1990) Amplification and direct sequencing of fungal ribosomal RNA genes for phylogenetics. In: PCR Protocols:
A Guide to Methods and Applications, Innis MA, Gelfand DH, Sninsky JJ, White TJ (eds.). New York: Academic Press Inc. Whittaker, R. H. (1965) Dominance and diversity in plant communities. Science, 147, 250–260. Wilkins, W.H., Ellis, E.M. and Harley, J.L. (1937) The Ecology of the Larger Fungi 1. Constancy and frequency of fungal species in relation to certain vegetation communities, particularly oak and beech. Annals of Applied Biology, 24: 703-732. Williams, S.E. and Hero, J.M. (2001) Multiple determinants of Australian tropical frog biodiversity. Biological Conservation, 98: 1-10. Winterhoff, W. (1984). Analyse der Pilze in Pflanzengesellschaften, insbesondere der Makrornyzeten. In: Sampling Methods and Taxon Analysis in Vegetation
Science, R. Knapp(ed.). Amsterdam: Hague, pp. 227-248.

387
Witt, C. (2010) Characteristics of aspen infected with heartrot: Implications for cavity-nesting birds. Forest Ecology and Management, 260: 1010–1016. Wurzburger, N., Hartshorn, A.S. and Hendrick, R.L. (2004) Ectomycorrhizal fungal community structure across a bog-forest ecotone in southeastern Alaska. Mycorrhiza, 14: 383–389. Zak, J.C. and Willig, M.R. (2004) Fungal Biodiversity patterns. In: Biodviersity of
fungi: inventory and monitoring methods, Mueller, G.M., Bills, G.F., Foster, M.S. (eds.). New york: Academic press. Zinko, U., Seibert, J., Dynesius, M. and Nilsson, C. (2005) Plant species numbers predicted by a topography based groundwater flow index. Ecosystems, 8: 430-441.