Refining the Economic Dimension of Carroll's CSR Pyramid ...
Upload
independentCategory
view
1download
0
Global central banks (GCB) have artificially raised the NPV of income-producing assets for 34 years, by persistently cutting interest rates (I.1, p7). Yet, rate intervention bred asset/liability value gaps vs. natural rates (V.3, p92), which ultimately, grew until crushing asset prices (1987, 1997/98 & 2007/08). As each crisis devalued richly-priced collaterals guaranteeing loans held by Global Systemically Important Banks (GSIBs), it impaired them, which led GCB to swap them for newly-issued sovereign debt (see p3-4) “to avoid systemic events.” Over three decades, this mechanism has helped G-7 debt grow by 500% (I.2, p8) taking GCB balance-sheets (IV-center, p67) and rate-cuts to their limits (bottom). Similarly, for the third time in 15 years, intervention has driven stock valuation
to two standard deviations over the mean, a level reached only once the prior 100 years and that always ended in losses of 20%-50% of market value. Finally, rate-driven valuation explains why, at extreme market events, asset price correlations shift towards one, spiking spot volatility, while forward volatility stays underpriced, as market participants have grown to expect radical GCB policy action. All of the above has led to volatility being so mispriced, from a risk-reward perspective, that a strategy of acquiring it, may profit massively, while keeping losses restrained, as confirmed by our three-year track record.
SRAF highlights: August 2015 net performance: +49.60% 2015 YTD net performance: +55.52% 2014 net performance: +0.07% 2013 net performance: +15.12% 2012 net performance: +19.71% 3 Year CAGR: +21.3% Annualized Return Since Inception (July 1, 2012): +22.01%
Since inception, Systemic Risk Averse Funds SPC LTD. (SRAF) has incurred significantly less risk than most hedge funds, while surpassing many of them in performance. Certainly, if volatility continues reaching the levels achieved in the past two months, an investment manager might consider allocating 15% to 20% of his portfolio’s AUM to SRAF: As charts created with ZephyrStyleADVISOR™ show below, by reducing draw-downs during peak-volatility events, such allocations would have dramatically increased capital preservation in a balanced growth fund and thus, enhanced its annualized return by over 200 and 300 bps, respectively.
"Morpheus opens a container which
holds two pills: a blue one, and a red
one. He puts one in each hand, and
holds them out to Neo.
Morpheus: This is your last chance.
After this, there is no turning back....
You take the blue pill, the story
ends. You wake up and
believe...whatever you want to
believe. You take the red pill….
You stay in wonderland...and I show
you just how deep the rabbit hole
goes.
Neo pauses for an instant, then
reaches for the red pill. He swallows
it down with a glass of water, and
looks at Morpheus.
Morpheus: Remember...all I'm
offering you is the truth: nothing
more."
THE DISCOUNT-RATE PYRAMID SCHEME
This communication may contain information that is legally privileged, confidential or exempt from disclosure. No confidentiality or privilege is lost or
waived by mistransmission. If you are not the intended recipient, please notify the sender via return email immediately and delete this message from
your system. Disclosure, use, distribution or copying this message, any attachments thereto or their contents is strictly prohibited.
NOTE ON PERFORMANCE:
Any reference to performance figures, statistics or comparison should be considered for illustrative purposes only, they come from the referenced
manager as estimates and are not independently verified. All information should be verified by appropriate legal documentation, official audits or
otherwise independently by the reader of this email or any follow up materials.
NOT AN OFFER OR SOLICITATION:
Nothing in this email or any attachments thereto is an offer to sell or solicitation to buy any product or service. Any investment should be made subject
to legal documentation thereof and based upon independent review of the merits, as well as risks, of such an investment on its own and in context of a
broader investment portfolio. Any investment should also consider the specific financial position and goals of the individual or institution and take into
account the overall economic environment.

1
Zephyr StyleADVISOR
Growth of $100September 2012 - August 2015 (Single Computation)
100
105
110
115
120
125
130
135
Aug 2012 Dec 2012 Jun 2013 Dec 2013 Jun 2014 Dec 2014 Aug 2015
Balanced Growth
Balanced Growth w SRAF
Balanced Growth w SRAF2
60% MSCI ACWI40% Citi World Gov't Bond IX
Portfolio Performance vs. 60% MSCI ACWI40% Citi World Gov't Bond IX
Balanced Growth
AnnualizedReturn (%)
CumulativeReturn (%)
Std Dev(%)
AnnualizedExcess
Return (%)
CumulativeExcess
Return (%)
InfoRatio
SignificanceLevel (%)
ExplainedVariance (%)
TrackingError (%)
6.75 21.65 6.08 1.90 6.38 1.01 91.02 92.23 1.89
Balanced Growth w SRAF 8.98 29.43 5.23 4.13 14.15 0.73 85.21 32.57 5.66
Balanced Growth w SRAF2 9.80 32.36 5.99 4.94 17.08 0.68 83.82 11.92 7.27
Created with Zephyr StyleADVISOR. Manager returns supplied by: Morningstar, Inc.

2
Zephyr StyleADVISORZephyr StyleADVISOR: Zephyr Associates
Blend WeightsAs of August 31, 2015
Balanced Growth Balanced Growth w SRAF
Balanced Growth w SRAF2
7.0% 6.4%7.0% 5.1%7.1% 5.0%4.0%7.4% 1.5%
10.0% 15.2%12.2% 12.2%
5.1%5.1% 5.0%5.4% 5.0%7.0% 4.6%4.1%8.0% 1.5%
10.2% 14.8%12.2% 12.2%
5.0%5.0% 5.0%5.1% 5.0%5.1%4.6%5.4%
4.1%1.5%
10.2%
19.7%12.2%12.2%
Fidelity® Cash Mgmt Fds Tax-Free MMktRussell Tax Exempt Bond SVanguard Interm-Term Tx-Ex InvRussell Global Infrastructure SFidelity® Real Estate IncomeLegg Mason BW Absolute Return Opp IRussell Multi-Strategy Alternative SVanguard S&P 500 ETF (NAV)Russell US Small Cap Equity SVanguard FTSE Developed Markets ETF (NAV)Oakmark Global IMFS® Global Equity IRussell Emerging Markets SSRAF Fund
Created with Zephyr StyleADVISOR. Manager returns supplied by: Morningstar, Inc.

3
Zephyr StyleADVISOR
Mgr. vs. BM ReturnsSeptember 2012 - August 2015 (not annualized if less than 1 year)
Ret
urn
-8
-6
-4
-2
0
2
4
6
8
10
YTD 1 year 1 year 1 quarter 1 year 2 quarters 1 year 3 quarters 2 years 2 years 1 quarter 2 years 2 quarters 2 years 3 quarters 3 years SinceInception
Balanced Growth
Balanced Growth w SRAF
Balanced Growth w SRAF2
60% MSCI ACWI40% Citi World Gov't Bond IX
Zephyr StyleADVISORSeptember 2012 - August 2015 (not annualized if less than 1 year)
Balanced Growth
Balanced Growth w SRAF
Balanced Growth w SRAF2
YTD 1 year 1 year 1 quarter 1 year 2 quarters 1 year 3 quarters 2 years 2 years 1 quarter 2 years 2 quarters 2 years 3 quarters 3 years SinceInception
-2.75% -3.63% -1.39% 0.68% 1.89% 5.17% 3.98% 4.81% 6.30% 6.75% 6.75%
4.46% 5.48% 5.94% 6.38% 5.96% 8.11% 5.88% 7.12% 8.57% 8.98% 8.98%
6.66% 8.53% 8.49% 8.34% 7.36% 9.18% 6.59% 8.02% 9.45% 9.80% 9.80%
60% MSCI ACWI40% Citi World Gov't Bond IX -3.06% -6.47% -3.76% -1.35% 0.11% 3.70% 3.25% 3.63% 4.36% 4.85% 4.85%
Created with Zephyr StyleADVISOR. Manager returns supplied by: Morningstar, Inc.

4
Zephyr StyleADVISORZephyr StyleADVISOR: Zephyr Associates
Manager StyleSeptember 2012 - August 2015 (12-Month Moving Windows, Computed Monthly)
S&P 500 MSCI EAFE Index
Barclays U.S. AggregateBarclays GlobalTreasury ex-U.S.
BofA Merrill Lynch US EmergingMarkets Sovereign & Credit
Dow Jones Emerging Markets
Equity
-1
0
1
Fixed
Domestic -1 0 1 Eur
Balanced Growth
Balanced Growth w SRAF
Balanced Growth w SRAF2
60% MSCI ACWI40% Citi World Gov't Bond IX
Equity vs. Fix Inc - Global
Performance AttributionSeptember 2012 - August 2015 (Single Computation)
Balanced Growth Balanced Growth w SRAF
Balanced Growth w SRAF2
97.4%
2.6%
36.4%
63.6%
83.3%
16.7%
ResidualR-Squared to Style Benchmark
Created with Zephyr StyleADVISOR. Manager returns supplied by: Morningstar, Inc.

5
Zephyr StyleADVISOR
Zephyr StyleADVISORSeptember 2012 - August 2015
-7%
-6%
-5%
-4%
-3%
-2%
-1%
0%
Aug 2012 Dec 2012 Jun 2013 Dec 2013 Jun 2014 Dec 2014 Aug 2015
Balanced Growth
Balanced Growth w SRAF
Balanced Growth w SRAF2
60% MSCI ACWI40% Citi World Gov't Bond IX
Balanced Growth
Balanced Growth w SRAF
Balanced Growth w SRAF2
MaxDrawdown
MaxDrawdownBegin Date
MaxDrawdownEnd Date
MaxDrawdown
Length
MaxDrawdown
Recovery Date
PainIndex
PainRatio
Omega(MAR = 0.00%)
Gainto LossRatio
High WaterMark Date
To HighWater Mark
-5.43% May 2015 Aug 2015 4 N/A 0.63% 10.60 2.17 1.22 Apr 2015 5.74%
-2.72% Jun 2013 Aug 2013 3 Oct 2013 0.47% 18.91 3.25 1.43 Aug 2015 0.00%
-3.14% Jun 2013 Aug 2013 3 Oct 2013 0.56% 17.53 3.46 1.52 Aug 2015 0.00%
60% MSCI ACWI40% Citi World Gov't Bond IX -6.47% Sep 2014 Aug 2015 12 N/A 1.31% 3.68 1.67 1.06 Aug 2014 6.92%
Created with Zephyr StyleADVISOR. Manager returns supplied by: Morningstar, Inc.

6
Zephyr StyleADVISOR
Upside / DownsideJanuary 2015 - August 2015 (Single Computation)
Ups
ide%
-100
-50
0
50
100
150
200
250
300
Downside%
-100 -50 0 50 100 150 200 250 300
Balanced Growth
Balanced Growth w SRAF
Balanced Growth w SRAF2
60% MSCI ACWI40% Citi World Gov't Bond IX
Balanced Growth
Balanced Growth w SRAF
Return(%)
Std Dev(%)
Downside Risk(%)
SharpeRatio Observs.
6.75 6.08 4.54 1.1039 36
8.98 5.23 3.82 1.7100 36
Balanced Growth w SRAF2 9.80 5.99 3.98 1.6271 36
60% MSCI ACWI40% Citi World Gov't Bond IX 4.85 6.67 4.77 0.7213 36
Created with Zephyr StyleADVISOR. Manager returns supplied by: Morningstar, Inc.
7
Zephyr StyleADVISOR
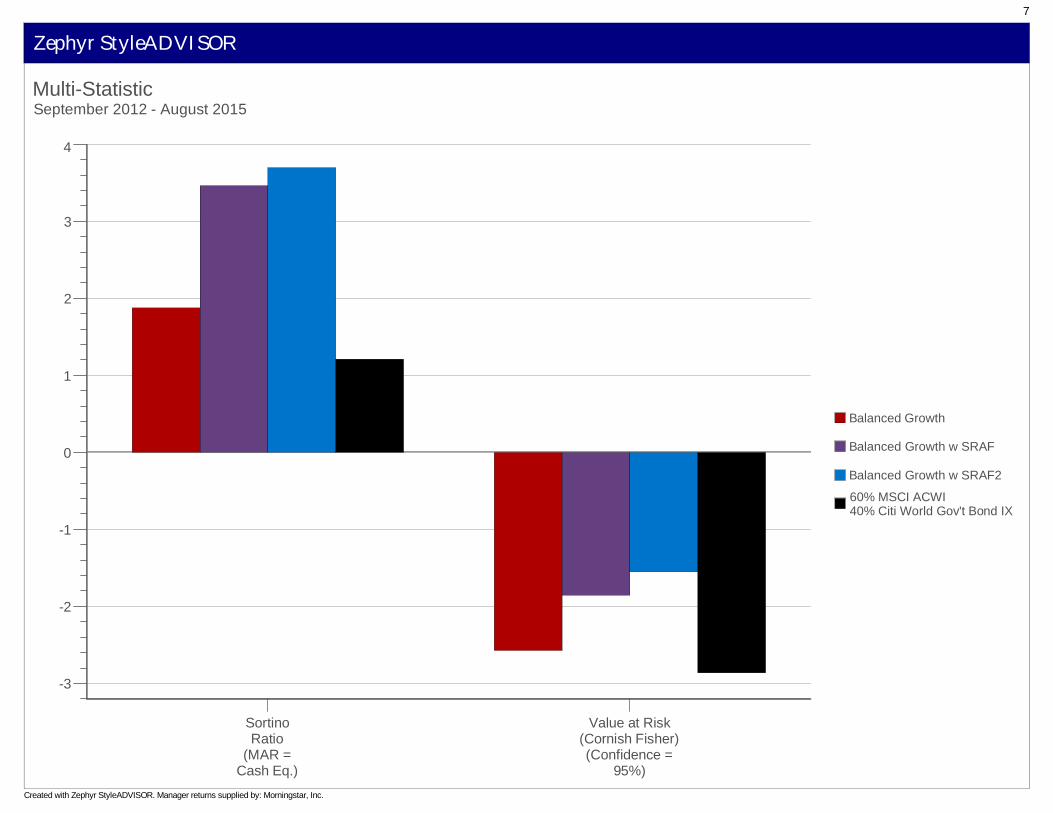
Multi-StatisticSeptember 2012 - August 2015
-3
-2
-1
0
1
2
3
4
SortinoRatio
(MAR =Cash Eq.)
Value at Risk(Cornish Fisher)(Confidence =
95%)
Balanced Growth
Balanced Growth w SRAF
Balanced Growth w SRAF2
60% MSCI ACWI40% Citi World Gov't Bond IX
Created with Zephyr StyleADVISOR. Manager returns supplied by: Morningstar, Inc.

8
Zephyr StyleADVISOR
Correlation Matrix
1) SRAF Fund
2) MSCI EAFE Index
3) Dow Jones Emerging Markets
(1) (2) (3)
1.00
-0.37 1.00
-0.33 0.74 1.00
4) Global Government Bond -0.22 0.29 0.33
5) HFRI Macro (Total) Index -0.14 0.37 0.22
6) HFRX Macro/CTA Index -0.28 0.11 -0.04
7) S&P GSCI Precious Metals 0.05 0.08 0.18
8) 60% MSCI ACWI40% Citi World Gov't Bond IX -0.36 0.94 0.80
(4)
1.00
0.33
0.24
0.40
0.41
(5)
1.00
0.78
0.20
0.36
(6)
1.00
-0.11
0.08
(7)
1.00
0.15
(8)
1.00
Created with Zephyr StyleADVISOR. Manager returns supplied by: Morningstar, Inc.

9
Zephyr StyleADVISOR
Correlation Matrix
1) Balanced Growth w SRAF2
2) MSCI EAFE Index
3) Dow Jones Emerging Markets
4) Global Government Bond
5) HFRI Macro (Total) Index
6) HFRX Macro/CTA Index
7) S&P GSCI Precious Metals
8) 60% MSCI ACWI40% Citi World Gov't Bond IX
(1) (2) (3) (4) (5) (6) (7) (8)
1.00
0.30 1.00
0.26 0.74 1.00
0.04 0.29 0.32 1.00
0.23 0.39 0.21 0.28 1.00
-0.12 0.11 -0.06 0.19 0.77 1.00
0.09 0.06 0.19 0.40 0.22 -0.13 1.00
0.35 0.94 0.80 0.40 0.37 0.07 0.13 1.00
Created with Zephyr StyleADVISOR. Manager returns supplied by: Morningstar, Inc.

10
Zephyr StyleADVISOR
Correlation vs. Market Benchmark / TimeSeptember 2012 - August 2015 (12-Month Moving Windows, Computed Monthly)
Cor
rela
tion
vs.6
0%M
SCIA
CW
I40
%C
itiW
orld
Gov
'tBo
ndIX
-0.2
0
0.2
0.4
0.6
0.8
1
1.2
Time
Aug 2013 Dec 2013 Mar 2014 Jun 2014 Sep 2014 Dec 2014 Mar 2015 Aug 2015
Balanced GrowthBalanced Growth w SRAFBalanced Growth w SRAF2
Created with Zephyr StyleADVISOR. Manager returns supplied by: Morningstar, Inc.

11
Zephyr StyleADVISORMulti StatisticsSeptember 2012 - August 2015
0
2
4
6
8
10
Alphavs.
Market
Excess Returnvs.
Market
Omega(MAR = 0%)
Balanced Growth
Balanced Growth w SRAF
Balanced Growth w SRAF2
60% MSCI ACWI40% Citi World Gov't Bond IX
Zephyr StyleADVISORSeptember 2012 - August 2015: Summary Statistics
Balanced Growth
Balanced Growth w SRAF
Balanced Growth w SRAF2
Alphavs.
Market
Betavs.
Market
Excess Returnvs.
Market
PainRatio
Omega(MAR = 0.00%)
SortinoRatio
(MAR =Cash Eq.)
BattingAverage
vs.Market
2.41% 0.88 1.90% 10.60 2.17 1.88 55.56%
6.74% 0.45 4.13% 18.91 3.25 3.46 61.11%
8.31% 0.31 4.94% 17.53 3.46 3.70 61.11%
60% MSCI ACWI40% Citi World Gov't Bond IX 0.00% 1.00 0.00% 3.68 1.67 1.21 0.00%
Created with Zephyr StyleADVISOR. Manager returns supplied by: Morningstar, Inc.

12
Zephyr StyleADVISORA
lpha
0.00%
2.00%
4.00%
6.00%
8.00%
10.00%
YTD 1 year 1 year 1 quarter 1 year 2 quarters 1 year 3 quarters 2 years 2 years 1 quarter 2 years 2 quarters 2 years 3 quarters 3 years
Balanced Growth
Balanced Growth w SRAF
Balanced Growth w SRAF2
60% MSCI ACWI40% Citi World Gov't Bond IX
Beta
-0.60
-0.40
-0.20
0.00
0.20
0.40
0.60
0.80
1.00
YTD 1 year 1 year 1 quarter 1 year 2 quarters 1 year 3 quarters 2 years 2 years 1 quarter 2 years 2 quarters 2 years 3 quarters 3 years
Balanced Growth
Balanced Growth w SRAF
Balanced Growth w SRAF2
60% MSCI ACWI40% Citi World Gov't Bond IX
Created with Zephyr StyleADVISOR. Manager returns supplied by: Morningstar, Inc.

13
Zephyr StyleADVISORD
own
Cap
ture
-60.00%
-40.00%
-20.00%
0.00%
20.00%
40.00%
60.00%
80.00%
100.00%
YTD 1 year 1 year 1 quarter 1 year 2 quarters 1 year 3 quarters 2 years 2 years 1 quarter 2 years 2 quarters 2 years 3 quarters 3 years
Balanced Growth
Balanced Growth w SRAF
Balanced Growth w SRAF2
60% MSCI ACWI40% Citi World Gov't Bond IX
Sor
tino
Rat
io(M
AR
=C
ash
Eq.
)
-1.00
0.00
1.00
2.00
3.00
4.00
5.00
6.00
YTD 1 year 1 year 1 quarter 1 year 2 quarters 1 year 3 quarters 2 years 2 years 1 quarter 2 years 2 quarters 2 years 3 quarters 3 years
Balanced Growth
Balanced Growth w SRAF
Balanced Growth w SRAF2
60% MSCI ACWI40% Citi World Gov't Bond IX
Created with Zephyr StyleADVISOR. Manager returns supplied by: Morningstar, Inc.

14
Zephyr StyleADVISORA
vera
geD
own
Ret
urn
-3.50%
-3.00%
-2.50%
-2.00%
-1.50%
-1.00%
-0.50%
0.00%
YTD 1 year 1 year 1 quarter 1 year 2 quarters 1 year 3 quarters 2 years 2 years 1 quarter 2 years 2 quarters 2 years 3 quarters 3 years
Balanced Growth
Balanced Growth w SRAF
Balanced Growth w SRAF2
60% MSCI ACWI40% Citi World Gov't Bond IX
5th to 25th Percentile
25th Percentile to Median
Median to 75th Percentile
75th to 95th Percentile
Sor
tino
Rat
io(M
AR
=C
ash
Eq.
)
-1.00
0.00
1.00
2.00
3.00
4.00
5.00
6.00
YTD 1 year 1 year 1 quarter 1 year 2 quarters 1 year 3 quarters 2 years 2 years 1 quarter 2 years 2 quarters 2 years 3 quarters 3 years
Balanced Growth
Balanced Growth w SRAF
Balanced Growth w SRAF2
60% MSCI ACWI40% Citi World Gov't Bond IX
5th to 25th Percentile
25th Percentile to Median
Median to 75th Percentile
75th to 95th Percentile
Created with Zephyr StyleADVISOR. Manager returns supplied by: Morningstar, Inc.

15
Zephyr StyleADVISOR
OmegaSeptember 2012 - August 2015
Om
ega
0
0.5
1
1.5
2
2.5
3
3.5
4
Annual MAR
0% 5% 10% 15% 20% 25%
Balanced Growth
Balanced Growth w SRAF
Balanced Growth w SRAF2
60% MSCI ACWI40% Citi World Gov't Bond IX
Created with Zephyr StyleADVISOR. Manager returns supplied by: Morningstar, Inc.
Copyright © 2022 FDOKUMEN