
The Direct Assignment Option as a Modular Design Component: An Example for the Setting of Two...
7
Research Article The Direct Assignment Option as a Modular Design Component: An Example for the Setting of Two Predefined Subgroups Ming-Wen An, 1 Xin Lu, 2 Daniel J. Sargent, 3 and Sumithra J. Mandrekar 3 1 Department of Mathematics, Vassar College, 124 Raymond Avenue, Poughkeepsie, NY 12604, USA 2 Emory University, Atlanta, GA 30322, USA 3 Mayo Clinic, Rochester, MN 55905, USA Correspondence should be addressed to Ming-Wen An; [email protected] Received 25 November 2014; Revised 29 December 2014; Accepted 29 December 2014 Academic Editor: Maria N. D. S. Cordeiro Copyright © 2015 Ming-Wen An et al. is is an open access article distributed under the Creative Commons Attribution License, which permits unrestricted use, distribution, and reproduction in any medium, provided the original work is properly cited. Background. A phase II design with an option for direct assignment (stop randomization and assign all patients to experimental treatment based on interim analysis, IA) for a predefined subgroup was previously proposed. Here, we illustrate the modularity of the direct assignment option by applying it to the setting of two predefined subgroups and testing for separate subgroup main effects. Methods. We power the 2-subgroup direct assignment option design with 1 IA (DAD-1) to test for separate subgroup main effects, with assessment of power to detect an interaction in a post-hoc test. Simulations assessed the statistical properties of this design compared to the 2-subgroup balanced randomized design with 1 IA, BRD-1. Different response rates for treatment/control in subgroup 1 (0.4/0.2) and in subgroup 2 (0.1/0.2, 0.4/0.2) were considered. Results. e 2-subgroup DAD-1 preserves power and type I error rate compared to the 2-subgroup BRD-1, while exhibiting reasonable power in a post-hoc test for interaction. Conclusion. e direct assignment option is a flexible design component that can be incorporated into broader design frameworks, while maintaining desirable statistical properties, clinical appeal, and logistical simplicity. 1. Introduction e primary goal of phase II clinical trials is to better understand a treatment’s efficacy and safety profile to inform a phase III go/no-go decision. e phase II design with option for direct assignment (i.e., stop randomization and assign all patients to the experimental arm based on one or two interim analyses (IA)) for a single predefined subgroup was previously proposed [1]. In theory, such a design can be readily incorporated into existing and broader design frameworks. Specifically, the option for direct assignment can be integrated into any design with an IA where a decision must be made for how to allocate treatment to patients (typically the decision is between continuing to randomize patients to one of the treatments and stopping the trial due to either efficacy or futility). In this paper, we present the direct assignment option as a modular design component by applying it to the setting of two predefined subgroups. In some therapeutic settings, we may expect treatment heterogeneity across subpopulations identified by some fac- tor, for example, biomarker status. Specifically, the treatment may be effective in one subgroup but ineffective in another (qualitative treatment-subgroup interaction), or the treat- ment may be effective in both subgroups but with different magnitude (quantitative treatment-subgroup interaction). In either case, primary interest may be in both subgroups, and the design should enroll patients in both subgroups into a single trial. Such a design could allow for prospective planning of a design to identify predictive markers. For example, KRAS mutations were identified in a retrospective analysis to be predictive for overall survival response to cetuximab in colon cancer [2]. We could imagine having instead proposed a prospective phase II direct assignment design enrolling two subgroups to enable the KRAS discovery in phase II. Alternatively in some settings, primary interest may only be in one of the subgroups. However, there may Hindawi Publishing Corporation Computational and Mathematical Methods in Medicine Volume 2015, Article ID 210817, 6 pages http://dx.doi.org/10.1155/2015/210817
Transcript of The Direct Assignment Option as a Modular Design Component: An Example for the Setting of Two...

Research ArticleThe Direct Assignment Option as a Modular Design Component:An Example for the Setting of Two Predefined Subgroups
Ming-Wen An,1 Xin Lu,2 Daniel J. Sargent,3 and Sumithra J. Mandrekar3
1Department of Mathematics, Vassar College, 124 Raymond Avenue, Poughkeepsie, NY 12604, USA2Emory University, Atlanta, GA 30322, USA3Mayo Clinic, Rochester, MN 55905, USA
Correspondence should be addressed to Ming-Wen An; [email protected]
Received 25 November 2014; Revised 29 December 2014; Accepted 29 December 2014
Academic Editor: Maria N. D. S. Cordeiro
Copyright © 2015 Ming-Wen An et al. This is an open access article distributed under the Creative Commons Attribution License,which permits unrestricted use, distribution, and reproduction in any medium, provided the original work is properly cited.
Background. A phase II design with an option for direct assignment (stop randomization and assign all patients to experimentaltreatment based on interim analysis, IA) for a predefined subgroup was previously proposed. Here, we illustrate the modularityof the direct assignment option by applying it to the setting of two predefined subgroups and testing for separate subgroup maineffects.Methods. We power the 2-subgroup direct assignment option design with 1 IA (DAD-1) to test for separate subgroup maineffects, with assessment of power to detect an interaction in a post-hoc test. Simulations assessed the statistical properties of thisdesign compared to the 2-subgroup balanced randomized design with 1 IA, BRD-1. Different response rates for treatment/controlin subgroup 1 (0.4/0.2) and in subgroup 2 (0.1/0.2, 0.4/0.2) were considered. Results. The 2-subgroup DAD-1 preserves powerand type I error rate compared to the 2-subgroup BRD-1, while exhibiting reasonable power in a post-hoc test for interaction.Conclusion. The direct assignment option is a flexible design component that can be incorporated into broader design frameworks,while maintaining desirable statistical properties, clinical appeal, and logistical simplicity.
1. Introduction
The primary goal of phase II clinical trials is to betterunderstand a treatment’s efficacy and safety profile to informa phase III go/no-go decision. The phase II design withoption for direct assignment (i.e., stop randomization andassign all patients to the experimental arm based on one ortwo interim analyses (IA)) for a single predefined subgroupwas previously proposed [1]. In theory, such a design canbe readily incorporated into existing and broader designframeworks. Specifically, the option for direct assignment canbe integrated into any design with an IA where a decisionmust be made for how to allocate treatment to patients(typically the decision is between continuing to randomizepatients to one of the treatments and stopping the trial dueto either efficacy or futility). In this paper, we present thedirect assignment option as a modular design component byapplying it to the setting of two predefined subgroups.
In some therapeutic settings, we may expect treatmentheterogeneity across subpopulations identified by some fac-tor, for example, biomarker status. Specifically, the treatmentmay be effective in one subgroup but ineffective in another(qualitative treatment-subgroup interaction), or the treat-ment may be effective in both subgroups but with differentmagnitude (quantitative treatment-subgroup interaction). Ineither case, primary interest may be in both subgroups, andthe design should enroll patients in both subgroups intoa single trial. Such a design could allow for prospectiveplanning of a design to identify predictive markers. Forexample, KRAS mutations were identified in a retrospectiveanalysis to be predictive for overall survival response tocetuximab in colon cancer [2]. We could imagine havinginstead proposed a prospective phase II direct assignmentdesign enrolling two subgroups to enable theKRAS discoveryin phase II. Alternatively in some settings, primary interestmay only be in one of the subgroups. However, there may
Hindawi Publishing CorporationComputational and Mathematical Methods in MedicineVolume 2015, Article ID 210817, 6 pageshttp://dx.doi.org/10.1155/2015/210817

2 Computational and Mathematical Methods in Medicine
be secondary interest in the second subgroup, and dependingon available resources and the clinical setting, one may wishto enroll the second subgroup as well. One design option forthis setting is a stratified balanced randomized design. Thisdesign could be readily modified to incorporate and enjoythe benefits of the direct assignment option introduced in Anet al. [1].
In this paper therefore, we consider a design with directassignment option for the setting of two predefined sub-groups of patients. The proposed design is a 2-subgroupdirect assignment design with 1 IA (DAD-1), enrolling thesubgroups in parallel, each using a DAD-1 with the options tostop early for futility, continue with randomization, continuewith direct assignment, or stop early for efficacy at IA(Table 1). We power the design to test for separate subgrouptreatment effects, where the direction of treatment effect isprespecified, and also include a post-hoc assessment of powerto detect a treatment-subgroup interaction. We compare the2-subgroup DAD-1 with a 2-subgroup balanced randomizeddesign with 1 IA (BRD-1), with options to stop early for futil-ity, continue with randomization, or stop early for efficacy atIA. We perform a simulation study to examine the statisticalproperties of the designs, under a variety of response ratesettings. Finally, we discuss a planning exercise for enrollinga second subgroup, when primary interest is only in onesubgroup.
2. Methods
2.1. When Both Subgroups Are of Primary Interest. Weconsider a binary outcome, such as response, as the trialendpoint, and two patient subgroups, which we call M+ andM−. Since we are interested in separate treatment effects inthe two subgroups, we consider two independent primaryhypotheses. Let Δ
+and Δ
−denote the ratio of response rates
for treated versus control groups (i.e., treatment effect) inthe M+ and M− subgroups, respectively. We assume thatΔ
+is positive (i.e., treatment is beneficial) and assume thatΔ
−is specified a priori as either positive or negative by the
investigator based on expert knowledge. Thus in the M+subgroup, we are interested in the one-sided test H
0+: Δ+=
1 versus H1+: Δ+> 1; in the M− subgroup, we are also
interested in a one-sided test H0−:Δ−= 1 versus H
1−:Δ−> 1
or H0−: Δ−= 1 versus H
1−: Δ−< 1, depending on whether
Δ
−is specified a priori to be greater or less than 1.Wemake no
assumption on the relationship of treatment effect betweenthe two subgroups. Specifically, we do not assume that thetreatment will be beneficial in the M− subgroup only if it isfirst beneficial in the M+ subgroup. Since this is the phaseII setting, a treatment-subgroup interaction is typically notof primary interest. However, we include an assessment ofpower to detect a treatment-subgroup interaction in a post-hoc test: H
0,Int: Δ+/Δ− = 1 versus H0,Int: Δ+/Δ− = 1.We specify a desired treatment effect size Δ
𝑖, (𝑖 = +
or −) for each subgroup, an acceptable type I error rate(𝛼; the probability of rejecting the subgroup-specific null,when the null is true), and the desired power to detect thetreatment effect size Δ
𝑖(i.e., 1−𝛽, the probability of rejecting
the subgroup-specific null, when the alternative Δ𝑖is true).
We assume common 𝛼 and 𝛽, but possibly different Δ𝑖, for
the two subgroups. Sample sizes are calculated separately ineach subgroup. Specifically, we calculate sample size based ona one-sided 2-sample test for proportions for a 2-stage designwith 1 : 1 randomization, 1 interim analysis, and O’Brien-Fleming stopping rules using EAST software, as in theoriginal design with direct assignment option (for details, see[1]).
Simulation Study. To understand the statistical properties ofthe 2-subgroup direct assignment option design with 1-IA(DAD-1), we conducted a simulation study. For testing thesubgroup main effects, we specified 1 − 𝛽 = 0.80 and 𝛼 =0.20, corresponding to widely recommended and acceptedstandards in the phase II setting [3]. In the M+ subgroup,we considered a control arm response rate of 0.2 versusa treatment arm response rate of 0.4. That is, we assumethat the treatment is effective in the M+ subgroup (Δ
+=
2.0), based on preliminary studies. In the M− subgroup, weconsider a control arm response rate of 0.2 versus treatmentarm response rates of 0.1, 0.2, and 0.4, reflecting 3 possiblescenarios: a reverse treatment effect (Δ
−= 0.5), no treatment
effect (Δ−= 1), and a treatment benefit (Δ
−= 2.0),
respectively. Note that, here, a treatment arm response ratein the M− subgroup of either 0.1 or 0.2 corresponds to atreatment-subgroup interaction. The resulting sample sizecalculations are summarized in Table 2.
We simulated 500 trials for each of the two cases (Table 2).In Case I (no interaction), we consider a treatment effect inboth subgroups (i.e., treatment versus control response rates:0.4 versus 0.2, in both M+ and M−); in Case II (interaction),we consider a treatment effect in M+ (treatment versuscontrol response rates: 0.4 versus 0.2) and a reverse treatmenteffect in M− (treatment versus control response rates: 0.1versus 0.2). For each trial, we tested main effects separatelyin each subgroup and an interaction effect and recorded theresults for testing each of the three independent hypotheses:one-sided tests for main effects—H
0+: Δ+= 1 versus H
1+:
Δ
+> 1; H
0−: Δ−= 1 versus H
1−: Δ−> 1 or H
1−:
Δ
−< 1 (depending on the a priori hypothesized treatment
effect) and the two-sided test for an interaction effect—H0,Int:
Δ
+/Δ
−= 1 versusH
0,Int:Δ+/Δ− = 1. For the post-hoc test forinteraction, we used a conservative𝛼-level of 0.10 (two-sided)for rejecting the null hypothesis of no interaction. Averagingthese outcomes over the 500 simulated trials, we obtainedestimates of type I error rate and power for each hypothesis.For comparison, we also studied the outcomes under a 2-subgroup balanced randomized (1 : 1) design with 1 IA and nooption for direct assignment (BRD-1), based on the O’Brien-Fleming stopping rules.
2.2. When One Subgroup Is of Primary Interest: ProspectivePlanning Exercise for Enrolling a Second Subgroup. In somesettings, interest may be only in one subgroup, say M+.However, instead of altogether excluding the other subgroup,M−, if resources are available, a design could include the M−subgroup (as long as there are no safety or efficacy concerns)by accruing to the M− subgroup while the M+ subgroup isaccruing. An exploratory analysis in the M− subgroup could

Computational and Mathematical Methods in Medicine 3
Table 1: Options available at interim analysis (IA) in a 2-subgroup direct assignment design with 1 IA (DAD-1) versus a 2-subgroup balancedrandomized design with 1 IA (BRD-1). The decisions are independently made in each subgroup at the time of IA. Some cells in the BRD-1table are intentionally left blank, to highlight the missing option of direct assignment in this design. The options in bold are those that areavailable only in the design with direct assignment option.
Options at interim analysis (IA)2-subgroup direct assignment design with 1 IA (DAD-1) 2-subgroup balanced randomized design with 1 IA (BRD-1)M− M+ M− M+
Stop, futility
Stop, futility
Stop, futility
Stop, futilityContinue, randomize Continue, randomizeContinue, directStop, efficacy Stop, efficacy
Continue, randomize
Stop, futility
Continue, randomize
Stop, futilityContinue, randomize Continue, randomizeContinue, directStop, efficacy Stop, efficacy
Continue, direct
Stop, futilityContinue, randomize
Continue, directStop, efficacy
Stop, efficacy
Stop, futility
Stop, efficacy
Stop, futilityContinue, randomize Continue, randomizeContinue, directStop, efficacy Stop, efficacy
Table 2: Sample size calculations for 1-sided 𝛼 = 0.20 and 1 − 𝛽 = 0.80, for different treatment effects in the two subgroups. RRtrt is theresponse rate in the treatment group, RRcontrol is the response rate in the control group, and RRRtrt:control is the ratio of response rates in thetreatment versus control groups (i.e., treatment effect).
Case M+ subgroup M− subgroupTreatment effect, RRRtrt:control RRtrt/RRcontrol 𝑁 Treatment effect, RRRtrt:control RRtrt/RRcontrol 𝑁
I (no interaction) 2 0.4/0.2 65 2 0.4/0.2 65II (interaction) 2 0.4/0.2 65 0.5 (i.e., reverse benefit) 0.1/0.2 161
then yield preliminary indication of treatment effect in theM− subgroup.
To decide between enrolling M+ patients only andadditionally enrolling the M− subgroup as an exploratorycompanion group, a prospective planning simulation exercisecould be conducted. Since the M− subgroup is not ofprimary interest, it is likely that there is no precise prelimi-nary information about the treatment effect in the M− sub-group. Instead, one might specify in the M− subgroup theresponse rate in the control arm (RRcontrol) to be uniformlydistributed over some interval [RR
𝐿,control,RR𝑈,control] andthe response rate ratio comparing treated versus controlarms (RRRtrt:control) to be uniformly distributed over anotherinterval [RRR
𝐿,trt:control,RRR𝑈,trt:control]. If the interval for theRRRtrt:control includes 0, then such a specification would allowfor the treatment to have a negative (RRRtrt:control < 0),neutral (RRRtrt:control = 0), or positive (RRRtrt:control > 0)effect in the M− subgroup, thus reflecting vague knowledgeabout the treatment activity in theM− subgroup. It is possiblethen to simulate a trial and record the observed differencein response rates. Averaging across the simulated trials, onecan obtain a probability of observing a difference in response
rates that exceeds some threshold, say 𝛿, that is of clinicalinterest. Of course this probability will depend on the samplesize. Since accrual to M− will occur while accrual to M+ isopen, the sample size forM−will depend on the accrual ratesto both M+ and M− and the prevalence of the subgroupsand may not be known in advance. Probabilities that thedifference exceeds 𝛿 can be generated, under a variety ofplausible settings. The investigator can use the probabilitydistributions as a guide to decide whether to enroll the M−subgroup as an exploratory companion group, depending onwhether he or she believes the probability to be sufficientlyhigh to make enrollment into M− worthwhile.
As an example of the prospective planning exercise, weconsidered 𝛿 = 0.15. That is, an observed difference inresponse rates comparing treated versus control of 15%wouldbe considered clinically relevant. We further specified thecontrol group response rate to be uniformly distributed over[0.1, 0.3] and RRRtrt:control to be uniformly distributed over[0.5, 1.5]. We considered sample sizes of 𝑁
1,−= 6, 16,
and 48 patients for the first stage in the M− group. Thesecorrespond to M+/M− prevalence of 𝑁
1,+/6, 𝑁
1,+/16, and
𝑁
1,+/48, assuming a sample size of 𝑁
1,+in the first stage for
4 Computational and Mathematical Methods in Medicine
Table 3: Simulation study results based on 500 simulated trials. Sample size and treatment effects as specified in Table 2. Statistical propertiesof the 2-subgroup direct assignment option designwith 1 IA (DAD-1) versus a 2-subgroup balanced randomized designwith 1 interim analysis(BRD-1). One-sided 𝛼 = 0.20 and 1 − 𝛽 = 0.80 for the subgroup main effects; two-sided 𝛼int = 0.10 for the post-hoc test for an interactioneffect.
(a)
Separate subgroup main effects
CaseM+ subgroup M− subgroup
Power Type I error rate Power Type I error rateDAD-1 BRD-1 DAD-1 BRD-1 DAD-1 BRD-1 DAD-1 BRD-1
I (no interaction) 78.4 78.8 23.8 20.6 79.8 81.8 20.8 18.6II (interaction) 78.4 78.8 23.8 20.6 82.8 84.4 19.0 18.2
(b)
Subgroup-treatment interaction effect
Case Power Type I error rateDAD-1 BRD-1 DAD-1 BRD-1
I (no interaction) — — 11.3 11.4II (interaction) 64.3 67.6 — —
the M+ group. For each sample size, we simulated 500 trials.We created histograms of the observed treatment differencesand recorded the proportion of trials where the absoluteobserved treatment difference in response rates exceeded 𝛿 =0.15.
3. Results
3.1. When Both Subgroups Are of Primary Interest. Thenominal power and type I error rate are preserved in the 2-subgroup DAD-1, relative to a 2-subgroup BRD-1 (Table 3).In particular, for the M+ group, the power to detect aRRRtrt:control of 2 for DAD-1 is 78.4% (versus 78.8% for a BRD-1), and the type I error rate is 23.8% (versus 20.6% for a BRD-1). For theM− group, the power to detect a RRRtrt:control of 0.5for the DAD-1 is 82.8% (versus 84.4% for a BRD-1), and thetype I error rate is 19.0% (versus 18.2% for a BRD-1).
We were also interested in the properties of a post-hoctest for an interaction effect. Type I error rate is preservedat the nominal rate, and power decreases slightly relative tothe nominal rate. Specifically, for Case I (no interaction), thetype I error rate is 11.3% for the DAD-1, compared with 11.4%for a BRD-1. For Case II (interaction), the power to detect aninteraction effect at a two-sided alpha level of 0.10 for 2 versus0.5 is 64.3% for theDAD-1, comparedwith 67.6% for a BRD-1.
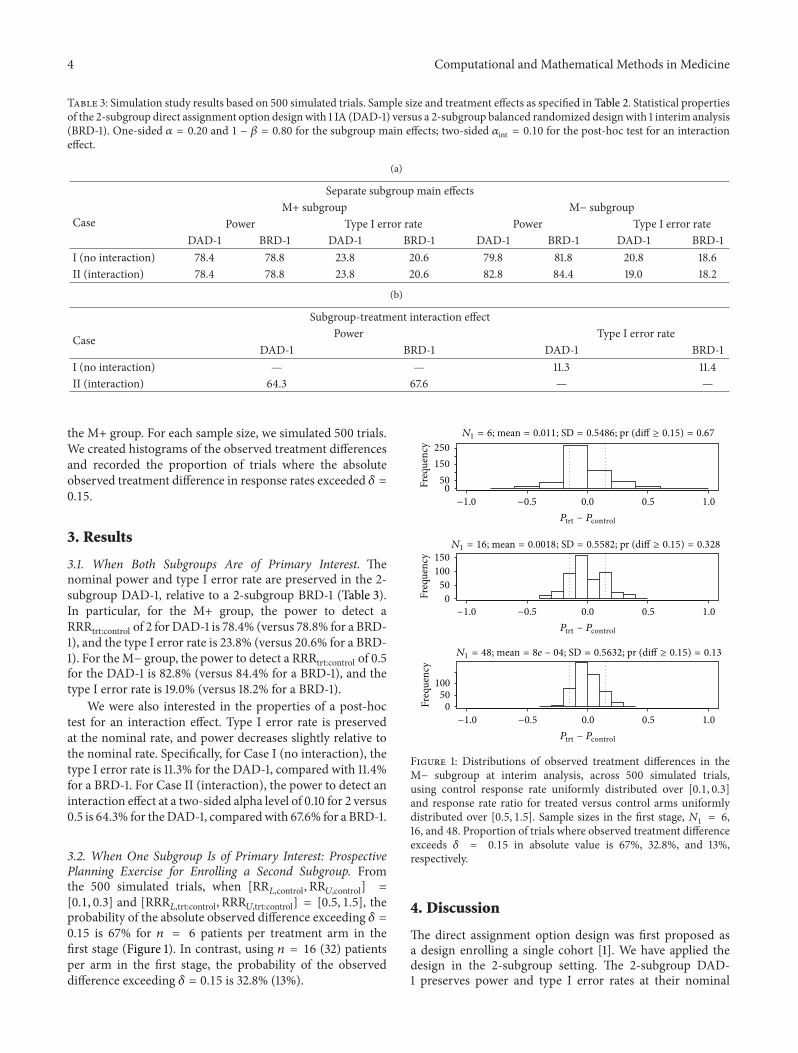
3.2. When One Subgroup Is of Primary Interest: ProspectivePlanning Exercise for Enrolling a Second Subgroup. Fromthe 500 simulated trials, when [RR
𝐿,control,RR𝑈,control] =[0.1, 0.3] and [RRR
𝐿,trt:control,RRR𝑈,trt:control] = [0.5, 1.5], theprobability of the absolute observed difference exceeding 𝛿 =0.15 is 67% for 𝑛 = 6 patients per treatment arm in thefirst stage (Figure 1). In contrast, using 𝑛 = 16 (32) patientsper arm in the first stage, the probability of the observeddifference exceeding 𝛿 = 0.15 is 32.8% (13%).
Freq
uenc
yFr
eque
ncy
Freq
uenc
y
0.0 0.5 1.0
0.0 0.5 1.0
0.0 0.5 1.0
N1 = 6; mean = 0.011; SD = 0.5486; pr (diff ≥ 0.15) = 0.67
N1 = 16; mean = 0.0018; SD = 0.5582; pr (diff ≥ 0.15) = 0.328
250
150
500
150
100
50
0
100
50
0
Ptrt − Pcontrol
Ptrt − Pcontrol
Ptrt − Pcontrol
−1.0 −0.5
−1.0 −0.5
−1.0 −0.5
N1 = 48; mean = 8e − 04; SD = 0.5632; pr (diff ≥ 0.15) = 0.13
Figure 1: Distributions of observed treatment differences in theM− subgroup at interim analysis, across 500 simulated trials,using control response rate uniformly distributed over [0.1, 0.3]and response rate ratio for treated versus control arms uniformlydistributed over [0.5, 1.5]. Sample sizes in the first stage, 𝑁
1= 6,
16, and 48. Proportion of trials where observed treatment differenceexceeds 𝛿 = 0.15 in absolute value is 67%, 32.8%, and 13%,respectively.
4. Discussion
The direct assignment option design was first proposed asa design enrolling a single cohort [1]. We have applied thedesign in the 2-subgroup setting. The 2-subgroup DAD-1 preserves power and type I error rates at their nominal

Computational and Mathematical Methods in Medicine 5
levels. Further, this design has reasonable power for planningpurposes for a post-hoc test for detecting a treatment-subgroup interaction.The first finding is to be expected sincethe 2-subgroup DAD-1 applies the direct assignment optiondesign in parallel to each subgroup. However, the secondresult that there is reasonable (post-hoc) power to detect atreatment-subgroup interaction is previously unexplored andis of potential interest.
The assessment of power to detect an interaction in apost-hoc test using the 2-subgroup DAD-1 and an 𝛼-level of0.10 suggests reasonable power (64.3% to detect a responserate of 2.0 in M+ versus response rate of 0.5 in M−). Werecognize that this 𝛼-level is conservative for an interactiontest when the main effects use a one-sided 𝛼-level of 0.20.The sample size that was used to detect the interaction waslarger than that of a typical phase II trial (65 patients inM+ and 161 patients in M−). However, the reality is that nophase II trial can reliably detect interaction effects of the sizeexplored in this simulation study using small sample sizes. Infact, an alternative strategy of prospectively planning for aninteraction test would have similarly yielded a large samplesize (214 total patients, based on a balanced randomizeddesign with no IA). Our strategy therefore has no sample sizedisadvantage in detecting an interaction effect relative to onethat prospectively plans for a similarly sized interaction effectin a phase II setting.
The 2-subgroup DAD-1 could be applied in any settingwhere there are two subpopulations of interest. A naturalsetting is that of targeted, biomarker-based therapies. Otherso-called integrated biomarker designs have previously beenproposed.We highlight a couple of such designs; comprehen-sive reviews of such designs are available elsewhere (e.g., [4,5]). The parallel subgroup-specific design [6] evaluates treat-ment effects separately in two subgroups.When the treatmenteffect is homogeneous across subgroups, this design has lesspower for detecting a treatment benefit, compared to a designthat tests for an overall treatment effect. In an attempt toaddress the lack of power in a homogeneous treatment set-ting, other designs have adopted a sequential testing strategy.Specifically, the Marker Sequential Test (MaST) design firsttests for a treatment effect in the M+ subgroup [7]. If thistest is statistically significant, then theM− subgroup is tested.However, if the test is not statistically significant, then anoverall population is tested. MaST increases power to detecttreatment benefit when the treatment effect is homogeneousacross subgroups and preserves power when the treatment iseffective in the M+ subgroup but not the M− subgroup, ascompared to a parallel subgroup-specific design.
At first glance, the proposed design resembles a parallelsubgroup-specific design in spirit. As noted in Freidlin etal. [7], under the case of homogeneous treatment effect, theparallel subgroup-specific design lacks power relative to a testfor overall treatment effect and the MaST design. However,the proposed design differs from the setting consideredby Freidlin et al. [7] in two important ways. First, theproposed design is for the phase II setting and not the phaseIII setting. At this early exploratory stage, it is importantto first understand the treatment effect in each subgroupseparately without necessarily examining overall treatment
effects.That is, although a test for overall treatment effectmaybe more powerful than separate tests for subgroup-specifictreatment benefit when the treatment effect is homogeneousacross subgroups, an overall treatment effect would not be ofprimary interest in the phase II setting. Second, the MaSTdesign’s property of improving power in the homogeneoustreatment setting rests on a key assumption: if the treatmentdoes not work in the M+ subgroup, then it cannot workin the M− subgroup. We refer to this as the treatmentmonotonicity assumption and do not invoke this assumptionfor the proposed design setting. Rather, we allow for thesubgroup-specific treatment effects to be independent of eachother.
It is not always the case that primary interest is in twosubgroups. However, even if primary interest is only in onesubgroup, it may be informative to enroll a second subgroupas an exploratory companion group (if ethical) in earlyphase trials. The decision to enroll a second subgroup willdepend on the tradeoff among available resources, the clinicalimportance of the difference in response rates 𝛿, and theestimated probability of the observed difference exceeding 𝛿.The results from the prospective planning exercise, therefore,could aid the study design team in this decision.
5. Conclusion
In summary, we have illustrated at a practical level a 2-subgroup design with direct assignment option for the phaseII setting where primary interest is in separate subgrouptreatment effects. Such a design not only preserves thenominal type I error rate and power for testing for separatesubgroup treatment effects but also enjoys reasonable post-hoc power to detect a treatment-subgroup interaction, if oneexists, as well as clinical appeal and logistical simplicity. Inthe case where primary interest is only in one subgroup butresources may be available to enroll the second subgroup, wehave proposed a planning exercise for aiding the study designteam in deciding to enroll the second subgroup, using theframework of the direct assignment option design.
Conflict of Interests
The authors declare that there is no conflict of interestsregarding the publication of this paper.
Acknowledgment
Sumithra J. Mandrekar and Daniel J. Sargent are supportedin part by the National Cancer Institute Grant no. CA-15083(Mayo Clinic Cancer Center).
References
[1] M.-W. An, S. J. Mandrekar, and D. J. Sargent, “A 2-stage phaseII design with direct assignment option in stage II for initialmarker validation,” Clinical Cancer Research, vol. 18, no. 16, pp.4225–4233, 2012.
[2] A. Lievre, J.-B. Bachet, V. Boige et al., “KRAS mutations asan independent prognostic factor in patients with advanced

6 Computational and Mathematical Methods in Medicine
colorectal cancer treated with Cetuximab,” Journal of ClinicalOncology, vol. 26, no. 3, pp. 374–379, 2008.
[3] L. V. Rubinstein, E. L. Korn, B. Freidlin, S. Hunsberger, S. PercyIvy, and M. A. Smith, “Design issues of randomized phase IItrials and a proposal for phase II screening trials,” Journal ofClinical Oncology, vol. 23, no. 28, pp. 7199–7206, 2005.
[4] S. J. Mandrekar and D. J. Sargent, “Predictive biomarker valida-tion in practice: lessons from real trials,” Clinical Trials, vol. 7,no. 5, pp. 567–573, 2010.
[5] B. Freidlin, L. M. McShane, and E. L. Korn, “Randomizedclinical trials with biomarkers: design issues,” Journal of theNational Cancer Institute, vol. 102, no. 3, pp. 152–160, 2010.
[6] B. Freidlin, Z. Sun, R. Gray, and E. L. Korn, “Phase III clinicaltrials that integrate treatment and biomarker evaluation,” Jour-nal of Clinical Oncology, vol. 31, no. 25, pp. 3158–3161, 2013.
[7] B. Freidlin, E. L. Korn, and R. Gray, “Marker Sequential Test(MaST) design,” Clinical Trials, vol. 11, no. 1, pp. 19–27, 2014.

Submit your manuscripts athttp://www.hindawi.com
Stem CellsInternational
Hindawi Publishing Corporationhttp://www.hindawi.com Volume 2014
Hindawi Publishing Corporationhttp://www.hindawi.com Volume 2014
MEDIATORSINFLAMMATION
of
Hindawi Publishing Corporationhttp://www.hindawi.com Volume 2014
Behavioural Neurology
EndocrinologyInternational Journal of
Hindawi Publishing Corporationhttp://www.hindawi.com Volume 2014
Hindawi Publishing Corporationhttp://www.hindawi.com Volume 2014
Disease Markers
Hindawi Publishing Corporationhttp://www.hindawi.com Volume 2014
BioMed Research International
OncologyJournal of
Hindawi Publishing Corporationhttp://www.hindawi.com Volume 2014
Hindawi Publishing Corporationhttp://www.hindawi.com Volume 2014
Oxidative Medicine and Cellular Longevity
Hindawi Publishing Corporationhttp://www.hindawi.com Volume 2014
PPAR Research
The Scientific World JournalHindawi Publishing Corporation http://www.hindawi.com Volume 2014
Immunology ResearchHindawi Publishing Corporationhttp://www.hindawi.com Volume 2014
Journal of
ObesityJournal of
Hindawi Publishing Corporationhttp://www.hindawi.com Volume 2014
Hindawi Publishing Corporationhttp://www.hindawi.com Volume 2014
Computational and Mathematical Methods in Medicine
OphthalmologyJournal of
Hindawi Publishing Corporationhttp://www.hindawi.com Volume 2014
Diabetes ResearchJournal of
Hindawi Publishing Corporationhttp://www.hindawi.com Volume 2014
Hindawi Publishing Corporationhttp://www.hindawi.com Volume 2014
Research and TreatmentAIDS
Hindawi Publishing Corporationhttp://www.hindawi.com Volume 2014
Gastroenterology Research and Practice
Hindawi Publishing Corporationhttp://www.hindawi.com Volume 2014
Parkinson’s Disease
Evidence-Based Complementary and Alternative Medicine
Volume 2014Hindawi Publishing Corporationhttp://www.hindawi.com