The Development of Children's Perception of Hierarchical ...
146
Université de Bourgogne Laboratoire d‘Etude de l‘Apprentissage et du Développement C.N.R.S. – U.M.R 5022 Ecole Doctorale Environnement, Santé, STIC (E2S) The Development of Children’s Perception of Hierarchical Patterns: An investigation across tasks and populations Thèse de Doctorat de l’Université de Bourgogne - Mention Psychologie – Présentée par Ira PUSPITAWATI Sous la direction du Professeur Annie VINTER Membres du Jury : Professeur Pierre BARROUILLET (Université de Genève – Suisse) Professeur Michel FAYOL (Université de Clermont-Ferrand – France) Docteur Pierre PERRUCHET (Université de Bourgogne– France) Professeur Sri Hartati R. SOERADIJONO (Université de Indonésie – Indonésie) Professeur Annie VINTER (Directeur de Thèse, Université de Bourgogne – France) - 07 Octobre 2011 -
-
Upload
khangminh22 -
Category
Documents
-
view
3 -
download
0
Transcript of The Development of Children's Perception of Hierarchical ...

Université de Bourgogne
Laboratoire d‘Etude de l‘Apprentissage et du Développement
C.N.R.S. – U.M.R 5022
Ecole Doctorale Environnement, Santé, STIC (E2S)
The Development of Children’s Perception of Hierarchical Patterns:
An investigation across tasks and populations
Thèse de Doctorat de l’Université de Bourgogne
- Mention Psychologie –
Présentée par Ira PUSPITAWATI
Sous la direction du Professeur Annie VINTER
Membres du Jury :
Professeur Pierre BARROUILLET (Université de Genève – Suisse)
Professeur Michel FAYOL (Université de Clermont-Ferrand – France)
Docteur Pierre PERRUCHET (Université de Bourgogne– France)
Professeur Sri Hartati R. SOERADIJONO (Université de Indonésie – Indonésie)
Professeur Annie VINTER (Directeur de Thèse, Université de Bourgogne – France)
- 07 Octobre 2011 -

Acknowledgements
I wish to express my gratitude to Professeur Annie Vinter, who served as director of
my dissertation. You are unfailingly available for my questions and concerns, large or small,
and always ready with thoughtful suggestions and valuable insights. Supporting and
encouraging, yet giving me the time and opportunity to grow and develop in my own way.
A great appreciation to the members of my committee and jury, Professeur Pierre
Barrouillet, Professeur Michel Fayol, Docteur Pierre Perruchet, Professeur Sri Hartati R,
Soeradijono, MA., PhD.,. Each of you, with your special expertise, provided me with
invaluable advice, encouragement, and careful guidance. I also wish to thank Dr. Rita Djohan
for clarifying my English grammar and enriched my vocabulary in writing the thesis.
A great appreciation to Professeur Dr. E.S. Margianti, S.E., MM as my Rector at
Gunadarma University. Your support makes everything possible.
Another great appreciation to the Indonesian Ministry of Education, especially to the
Directorate General of Higher Education who supports with the scholarship.
To my friends and colleagues in LEAD through this great adventure, I appreciate
your encouragement, support, and assistance. Your companionship made difficult times
enjoyable.
To the Franco-Indonesian community in Dijon and my Indonesian brothers and
sisters at Université de Bourgogne, what else do you expect besides the sense of kinship when
you are alone?.
I also wish to acknowledge the support of my colleagues and students at Gunadarma
University who always stand by me during the hardest time in collecting the data : Wahyu
Rahardjo, Tryda Cynthia, Dina Kusumastuti, Rahmat Sutrisno, Saadatun Nisa, Satria Ajie,
Rahma Khairani, Gita Andria Puspita, Andhita Anna Syarof, Nandie Hayati, Ratih Dwi
Aryani, Reny Yulianti, Vidya Nurina Hadi, Quroyzhin Kartika Rini, and students from
Gadjah Mada Univeristy who helped so much during the data collection in Yogyakarta,
Klaten and Solo : Darma Setya, Siti Rahma, Ajeng Cahyani, Agung Handoko and Annisa
Rahma. To the directors of the different institutions who accepted to participate in the study :
Djaka Kunandjaya, SH., MM, Dra. Sri Rahayu, Yani Suryani, SPd., M. Wachid Al
Wakhidan, S.Pd, MM., Drs. Endang Wiharsa, Drs. Subagya, MSi., Drs. Bambang Supriyadi,
Tito Suharwanto, S.Pd, S.IP, MSi., Dra. Agustyawati, M.Phil, SNE, Drs. Agus Suryabto,
MPd, Dra. Agustina Kaban, MSi.
A million thanks to the children who participated in the study, in particular in
Indonesia, SLB-C Angkasa Jakarta, SLB-C Asih Budi Jakarta, SLB- Negeri C Lenteng
Agung Jakarta, SLB-C Merpati Jakarta, SLB Negeri A Pembina Jakarta, SLB A Cahaya Batin

Jakarta, SLB Tan Miyat Bekasi, SLB A Wiyata Guna Bandung, SLB YAAT Klaten, SLB
Yaketunis Yogyakarta, SLB-A YKAB Solo, SLB Negeri A Cimahi.
Lastly, I wish to thank my great family, my dearest husband, Colonel Tri Bowo Budi
Santoso, Ir., MM. and my wonderful children, Hafidz Bagus Prasetyo Adi, and Ratriana Naila
Syafira. Your continuous support and encouragement is the reason to hold on and to reach
the goals. I appreciate you more than words can express.

Table of Contents
General Introduction
Chapter I. General Introduction
Preamble ………………………………………………………………………………. 1
I. Perceptual Organization : Some Historical Points ……………………………. 3
II. Perceptual Organization : Towards Contemporary Questions ………………. 7
III. Perceptual Organization : The Navon‘s Approach ……………………..…….. 11
IV. Global and Local Processing in Hierarchical Patterns : State of the Art ……... 16
A. Neuropsychological Studies in Global-Local Processing ………………... 20
B. Developmental Studies in Global-Local Processing ……………………… 21
V. Our Approach ………………………………………………………………… 22
Experimental Section
Chapter II. Children’s spatial analysis of hierarchical patterns: Construction
and perception
Introduction ………...…………………….………………………………………...…. 26
A. Experiment 1: Drawing hierarchical patterns in children
Method …………………………………………………………………… 30
Results ……………………….…………………………………………… 33
B. Experiment 2: Perceptual similarity judgments of hierarchical patterns in
children
Method …………………………………………………………………… 36
Results ……………………………………………………….…………… 39
Discussion ………………………………………………………………………..……. 41
A. Qualitative Changes in the Relationships Between the Local and Global
Modes of Processing ……………………………………………………...
41
B. Sensitivity to Pattern Consistency and Target‘s Exposure Time ………… 43
Chapter III. Children’s Spatial Analysis of Simple and Complex Hierarchical
Patterns in a Drawing and Similarity Judgment Task
Introduction ………...…………………….………………………………………...…. 45
A. Experiment 3: Drawing simple and complex hierarchical patterns in
children 4-10 years of age
Method …………………………………………………………………… 45
Result
1. Results of the frame-part analysis of drawing ……………………... 49
2. Results of categorization analysis of drawing ……………………..… 53
B. Experiment 4: Similarity judgement task with simple and complex
hierarchical patterns
Method …………………………………………………………………… 57
Results ………………….………………………………………………..... 59
Discussion ……………………………………………………………………………... 62
Chapter IV. Spatial Analysis of Hierarchical Meaningful Patterns in Children
with Mental Retardation: Naming task and Drawing Task
Introduction ………...…………………….………………………………………...…. 65
Method ………………………………………………………………………………… 67
Result
A. Results from the naming task
1. Analysis as a function of age ………………………....……………….. 72
2. Analysis as a function of IQ ….…………………..……...……………..
75

B. Results from the drawing task
1. Analysis as a function of age ……………………..…………..……….. 78
2. Analysis as a function of IQ ….…………………..………………...….. 80
Discussion ……………………………………………………………………………... 82
Chapter V. Global and Local Processing in Early Blind Children in a Naming
and Drawing Task
Introduction …………………………………………………………………………… 84
Pilot Studies …………………………………………………………………………… 87
Method ………………………………………………………………………………… 89
Result
A. Results from the naming task …………………………………………...... 95
B. Results from the drawing task …………………………………………..... 97
Discussion ……………………………………………………………………………... 100
Chapter VI. General Discussion & Conclusion
I. General Discussion ……………………………………………………………. 105
A. What about the age effect on local and global perception ? ……………… 106
B. Contextual effects on local and global processing ……………………….. 111
Effects of different pattern properties …………………………………………. 111
Gender effect …………………………………………………………………….. 115
II. Conclusion …………………………………………………………................. 116
References …………………………………………………………………………….. 119

List of Tables
Table 1. Age distribution of participants in the drawing hierarchical patterns
experiment ……………………….……………………………………..
30
Table 2. Age distribution of participants in the perceptual similarity judgment
task ……………………………………………………………………...
37
Table 3. Age distribution of participants in Experiment 3 …………………..... 46
Table 4. Age distribution of the participants in Experiment 4 …………………. 57
Table 5. Age distribution of participants in the naming task ………………….. 67
Table 6. IQ distribution of participants in the naming task ................................. 67
Table 7. Age distribution of participants of the drawing task .............................. 68
Table 8. IQ distribution of participants of the drawing task …………………... 68
Table 9. Age distribution of EB participants in the naming task ......................... 89
Table 10. Age distribution of EB participants who completed test performance in
the drawing task ………………………………………………………...
90
Table 11. Distribution of the profiles in the naming task ………………………… 97
Table 12. Distribution of the profiles in the drawing task ………………………... 99

List of Figures
Figure 1. Example of the principle of proximity …………………………...……. 4
Figure 2. Example of the principle of similarity ……………………………….… 5
Figure 3. Example of the principle of good continuation ……………………...… 5
Figure 4. Example of the principle of closure …………………………………… 6
Figure 5. General Model of Cognitive Procedure in Perception ………………… 6
Figure 6. Template-based matching model ……………………………………… 7
Figure 7. Prototype-based matching model …………………………………...…. 8
Figure 8. Feature Based Matching Model as in Pandemonium Model …………. 9
Figure 9. Example of geometric icons (geons) in Recognition-by-Components
Theory …………………………………………………………....…….
10
Figure 10. Navon‘s Compound Letter ……………………………………………... 10
Figure 11. A Schematization of the experimental task in Navon‘s
first experiment ........................................................................................
12
Figure 12. A. The set of stimuli in Navon‘s second experiment (part 1)
B. The set of stimuli in Navon‘s second experiment (part 2) ................
13
Figure 13. Set of stimuli in Navon‘s fourth experiment ........................................... 14
Figure 14. Examples of the displays in each condition and session of Navon‘s
fourth experiment .....................................................................................
15
Figure 15. Illustration of stimulus in the relational properties experiment ............... 19
Figure 16. Illustration of the target hierarchical patterns used in Experiment 1 …. 31
Figure 17. Illustration of categories of responses in the drawing task ….…………. 32
Figure 18. Percentages of responses in the drawing task as a function of age and
consistency ……………………………………………………………..
34
Figure 19. Percentage of responses in the drawing task in Experiment 1 as a
function of age and duration …………………………………………
35
Figure 20. Example of choices in perceptual similarity judgment task for
experiment 1 ……………………………………………………………
38
Figure 21. Percentage of responses in the similarity judgment task in Experiment 2
as a function of age and consistency ……………………………………
39
Figure 22. Illustration of the target hierarchical patterns used in Experiment 3 …… 46
Figure 23. Illustration of the types of responses coded
in the frame/parts analysis ……………………………………………...
48
Figure 24. Illustration of the types of responses categorized in drawing
Simple and complex hierarchical patterns …………..…………………
48
Figure 25. Percentages of responses in the frame-part analysis as a function of age
for the simple and complex hierarchical patterns ………………………
50
Figure 26. Percentage of responses in the frame-part analysis as a function of age
and duration ……………………………………………………………
52
Figure 27. Percentages of the different types of drawing responses
in the categorization analysis as a function of age ……………………
54
Figure 28. Percentage of responses in drawing for categorization analysis
as a function of duration and age ………………………………………
55
Figure 29. Illustrations of the response choices in the similarity judgement
task ………………………………………………………………...……
58
Figure 30. Percentage of responses as a function of age and patterns in the
similarity judgment task .........................................................................
59
Figure 31. Percentages of responses as a function of age and duration in the
similarity judgment task ...........................................................................
61
Figure 32. Pictures of objects and non-objects used in the preliminary
experiment ……………………………………………………………...
68
Figure 33. Stimuli used in the main experiment …………...…………………….... 69
Figure 34. Examples of drawings for data coding ………………………………. 71
Figure 35. Percentages of responses (global, local, integrated and non-integrated)
in the naming task as a function of age ...................................................
73
Figure 36. Percentages of responses as a function of patterns and age in the
naming task ..............................................................................................
73
Figure 37. Percentages of responses in the naming task as a function of IQ ............ 76
Figure 38. Percentages of responses in the naming task as a function of IQ ............. 76
Figure 39. Percentages of responses (global, local, integrated and non-integrated)
in the drawing task as a function of age ..................................................
78
Figure 40. Percentage of responses as a function of patterns and age in the
drawing task ............................................................................................
79
Figure 41. Percentage of responses in the drawing task by IQs ............................... 80
Figure 42. Percentages of responses as a function of patterns and IQ in the
drawing task .............................................................................................
81
Figure 43. Examples of stimuli in the pilot studies ……………...………………... 88
Figure 44. Examples of children‘s drawing based on the categorization in data
coding …………………………………………………………………..
94
Figure 45. Percentage of responses in the naming task as a function of age and
consistency ……………………………………………………………..
95
Figure 46. Percentages of responses in the drawing task as a function of age and
consistency ……………………………………………………………..
97

GENERAL INTRODUCTION

PREAMBLE
The Development of Children’s Perception of Hierarchical Patterns:
An investigation across tasks and populations
Perception of hierarchical patterns has its roots in Navon‘s experiment that used
patterns which present at a double level of organisation, a global one (the whole shape) and a
local one (the elements that constitute the whole). Navon (1977) proposed that shape
description is first constructed and recognized at the level of overall or global shape while the
detailed processing of the smaller components would intervene later, as confirmed by the
global precedence effect.
Nowadays, a growing body of research has expanded the concept and has confirmed
the relative dominance of global processing over local processing. In our thesis, we
investigated the relative dominance of these processes by considering the effect of age,
stimuli properties, duration of exposure to the stimuli and gender in a perceptual task and a
drawing task, and we tested these effects mainly from a typical and atypical developmental
perspectives. Our objectives were to understand more comprehensively the developmental
characteristics of children‘s perception through the global and local processing of hierarchical
patterns.
Typical developing children as young as 3 years of age, until 10 years of age,
participated in our first, second, third and fourth experiments. We investigated global/local
processing at these ages since research in young children in this domain are still scarce and
the results are mostly contradictory. Manipulation of the patterns, such as consistent vs.
inconsistent and simple vs. complex, and also their durations of exposure (3 seconds for long
duration and 300 msec for short duration) were meant to investigate in what extent these
variables affected the relative dominance of global/local processing in children, in order to
reveal the developmental milestones of children‘s global/local processing.
Our objective with regard to the involvement of atypical developing children with
mental retardation as employed in our fifth experiment, was to investigate whether their
global dominance responses which have been proved in other studies, could interfere with the
automatic identification of familiar objects in meaningful patterns when they are located at
the local level. We also aimed at analyzing whether the developmental aspects in processing
at the global/local level were similar in these children to what was observed in typical
developing children.
The last experiments of our thesis concerned the global/local processing in haptic
perception in early blind children. To our knowledge, this is the first study concerning the
global local processing in early blind children using Navon‘s stimuli. We aimed at revealing
Preamble
1

whether these children showed a local tendency as reported in the adults with blindness. The
results will also illustrate the developmental trajectories of global/local processing in haptic
perception, since early blind children at 6 to 18 years of age participated in the study.
Preamble
2

CHAPTER 1. General Introduction
I. Perceptual Organization : Some Historical Points
The history of perceptual organization started centuries ago when philosophers raised
questions about the sources and validity of human knowledge. Epistemologists attempted to
understand how things could be learned, whether there were innate ideas (as supported by
rationalism) or whether the experience as the result of human‘s contact with physical world
through senses would independently caused the learning process (as supported by
empiricism), or whether both of them originated human knowledge (as supported by
Kantianism).
Immanuel Kant (1781), in his work entitled The Critique of Pure Reason, stated that
our understanding of the external world had its foundation in both the experience and a priori
concepts. This led to the beliefs that our senses which were viewed as passive receptors, were
actually active agents and pre-consciously attempted to make sense of their input as a result of
brain‘s perceptual systems. Perceptual systems enabled organism to interpret and organize
sensations to produce a meaningful experience of the world (Lindsay & Norman, 1977).
While sensation points to the immediate and tends to be an unprocessed result of stimulation
in our sensory receptors, perception refers to the process whereby sensory stimulation is
translated into organized experience.
The organized experience, or percept, is the result of the joint product of sensory
stimulations, and of the processing itself. The brain‘s perceptual systems are structured in a
modular way, with different areas of the brain which process different kinds of sensory
information, and these different modules are interconnected and influenced each other.
In general, there are two main approaches in explaining the process of perception,
i.e.:
Bottom-Up Approach: Perception is built from a set of primary features to a
representation in our cognitive system without involving higher cognitive processes. It
assumes a passive and automatic processing during perception. This approach which was also
known as a data-driven approach was supported by Gibson (1979) with the direct perception
approach and also by Marr (1982) who argued that high level perceptual experiences were
derived from computations based on low level perceptions (such as edges and intensity
changes).
Top-Down Approach: Perception starts with a set of primary features but it is influenced
by higher cognitive processes (such as knowledge, past experience and context). It assumes
an active and volitional process at the basis of perception. This approach was supported by
von Goethe, Mach and von Ehrenfels with a series of research by Wertheimer, Köhler,
Chapter 1 : General Introduction
3

Koffka, and Lewin, who proposed the gestalt principle. Gregory (1997) also supported this
approach with the constructivist approach, which stated that perception involves a process of
constructing inferences from what we see. It involves an attempt of making a best guess or
hypothesis about what we see. Prior knowledge and past experience are crucial in perception
because when we look at something, we develop a perceptual hypothesis (which is based on
prior knowledge and past experience), and the hypothesis can be confirmed or disconfirmed
by the data we perceive.
The hypothesis referred to in the top-down approach triggered many researches to
investigate the functional processes in the cognitive system. The most well-known research in
the top-down approach was made by a group of psychologists who systematically studied
perceptual organization in 1920‘s, in Germany. The concept of Gestalt was first introduced by
Christian von Ehrenfels (1890), who proposed the concept of Gestalt-Qualität which refers to
―form quality‖ or extra elements that accompanied the sensory processes and add bounding to
the perceived object. This idea was then developed by Max Wertheimer in 1910, who
concluded that the eye merely receives all the visual stimuli and the sensations are arranged
by the brain into a coherent image. The law of prägnanz stated that the sensations are
arranged in a manner that is regular, orderly, symmetric, and simple.
Gestalt psychologists, such as Wolfgang Köhler, Kurt Koffka, and Kurt Lewin,
further refined Wertheimer‘s work to conclude that visual perception results from a process of
organizing elements of sensations into various laws of grouping. The most important are the
following :
1) The principle of Proximity. The principle of proximity or contiguity states that things
which are closer together will be seen as belonging together as seen in Figure 1.
Figure 1. Example of the principle of proximity
A. 1 and 2 as one group,
3 and 4 as one group
because of the proximity
B. The dots will tend to be
grouped in rows
C. The dots will tend to be
grouped in columns
Chapter 1 : General Introduction
4

2) The principle of Similarity. Similarity means a tendency to see groups which have the
same characteristics. The principle of similarity states that things which share the same
visual characteristics as shape, size, color, texture, value, or orientation are seen as
belonging together to the same entity as described by Figure 2.
Figure 2. Example of the principle of similarity
A. Color characteristics will be seen as group
B. Shape characteristics will be seen as group
3) The Principle of Common Fate. The principle of Common Fate stated that elements in
the same moving direction are perceived as collective or as unit. An example of common
fate can happen when someone perceives a green snake lying on the grass. When it
doesn‘t make any movements, it will not be noticed. As soon as the snake begins to
move, our brain organizes it as a figure against a background, so we can notice it
immediately.
4) The principle of Good Continuation. The principle of continuity predicts the
preference for continuous figures. People tend to perceive a figure as two crossed lines
instead of 4 lines meeting at the center, when a cross pattern presented. Figure 3
illustrates this principle :
Figure 3. Example of the principle of good continuation
5) The principle of Closure. The principle of closure suggests that we tend to see complete
figures even when part of the information is missing. This principle is related to the
principle of good continuation when there is a tendency to fill-in missing information to
make a whole. Figure 4 depicts an example of the Gestalt law of closure.
Chapter 1 : General Introduction
5

Figure 4. Example of the principle of closure
White triangle and three gray circles tend to be seen although they do not exist.
These gestalt principles are well-known for their ability to clarify the phenomenon of
perception. But with the development of cognitive psychology and computational
neuroscience in the 1950s and 1960s, the gestalt theory has been criticized for being
descriptive rather than explanatory. The operating principle of Gestalt which states that the
brain is holistic, parallel, and analog with self-organizing tendencies was also against the idea
proposed by cognitive psychology which stressed the importance of past experience and
knowledge as well as the reality stimulation about the outside world in generating the process
of perception. Indeed, cognitive psychology sustains that bottom up processing (data driven
processing) and top-down processing (concept-driven processing) are mutually included in
the process of perception (Palmer, 1975; Norman & Bobrow, 1976; Lindsay & Norman,
1977). A general model of the cognitive procedure is reported in Figure 5 (Wang, 2002).
Figure 5. General Model of Cognitive Procedure in Perception (Wang, 2002, p.75)
Empirical evidences have supported the idea that perceptual processing must include
both data-driven processing and concept-driven processing, so perception researches in
cognitive psychology have mainly concentrated on the issue of pattern recognition. Human‘s
pattern recognition can be treated as a typical perception process which depends on human‘s
Chapter 1 : General Introduction
6

available knowledge and experience and cannot be just innate and self-organized as in the
gestalt‘s view.
II. Perceptual Organization : Towards Contemporary Questions
Modern cognitive psychology has proposed several theoretical models about human‘s
pattern recognition, some of which are greatly affected by artificial intelligence. Among these
models, we can mention the following :
1) The Template-based Matching Model. Human‘s memory stored plenty of various
duplicates of real world patterns (templates). In the process of pattern recognition, the
incoming sensory information is compared directly to the templates that have been stored
in the memory. However, the real world patterns are various and may be different from
the characteristics of the templates. If a corresponding template does not exist, the
recognition of the pattern fails. Figure 6 depicts a template-based matching model.
Figure 6. Template-based matching model (Wang, 2002, p. 76)
2) The Prototype-based Matching Model. This model is also called the component-based
matching model. This model was proposed in order to overcome the template-based
matching because it is hard to explain an indisputable fact that people can rapidly
recognize a new, unfamiliar pattern. With the prototype-matching, outside stimulation is
only needed to approximately match the prototype, and a perfect matching is not required.
Figure 7 describes the prototype-based matching model, which also shows a drawback
since it is only contains bottom-up processing, so this is still being a dispute now.
Chapter 1 : General Introduction
7
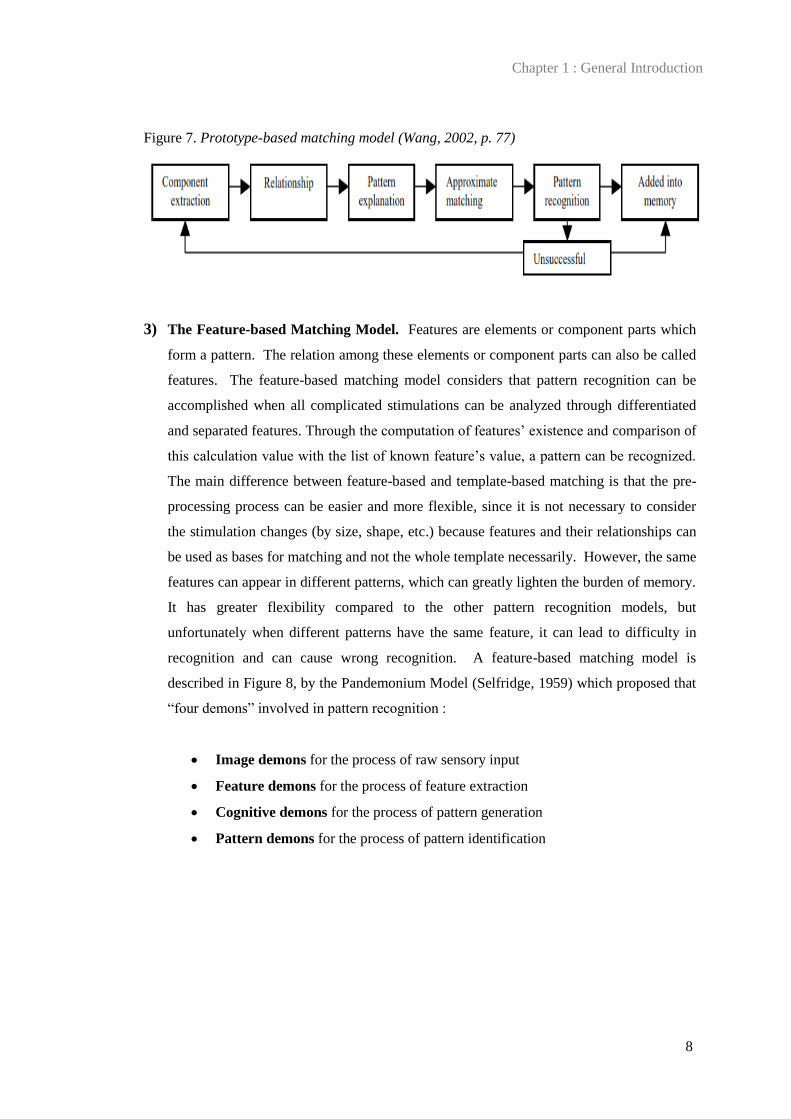
Figure 7. Prototype-based matching model (Wang, 2002, p. 77)
3) The Feature-based Matching Model. Features are elements or component parts which
form a pattern. The relation among these elements or component parts can also be called
features. The feature-based matching model considers that pattern recognition can be
accomplished when all complicated stimulations can be analyzed through differentiated
and separated features. Through the computation of features‘ existence and comparison of
this calculation value with the list of known feature‘s value, a pattern can be recognized.
The main difference between feature-based and template-based matching is that the pre-
processing process can be easier and more flexible, since it is not necessary to consider
the stimulation changes (by size, shape, etc.) because features and their relationships can
be used as bases for matching and not the whole template necessarily. However, the same
features can appear in different patterns, which can greatly lighten the burden of memory.
It has greater flexibility compared to the other pattern recognition models, but
unfortunately when different patterns have the same feature, it can lead to difficulty in
recognition and can cause wrong recognition. A feature-based matching model is
described in Figure 8, by the Pandemonium Model (Selfridge, 1959) which proposed that
―four demons‖ involved in pattern recognition :
Image demons for the process of raw sensory input
Feature demons for the process of feature extraction
Cognitive demons for the process of pattern generation
Pattern demons for the process of pattern identification
Chapter 1 : General Introduction
8

Figure 8. Feature Based Matching Model as in Pandemonium Model
(Figure taken from http://www.psych.utah.edu/psych3120-classroom/pandemon.gif)
In this overview, it is interesting to mention a last model, that leads to the idea
that pattern recognition (the whole) derived from an analogy of the combination of parts
(local structures). Irving Biederman (1987) proposed the Recognition-by-Components
Theory (RBC) that can relate the classic principles of perceptual organization and pattern
recognition. RBC theory states that perceptual recognition of object is conceptualized as
a process of segmenting the image of the input into an arrangement of simple 3D
geometric components such as blocks, cylinders, wedges, and cones as described in
Figure 9. A modest set of generalized-cone components called geons (geometrical-icons)
can be derived from contrasts of five readily detectable properties of edges in two-
dimensional image, which are:
Curvature (various points of curves)
Collinearity (points branching from a common line)
Symmetry, and Asymmetry
Parallelism (two or more points which follow same direction)
Contermination (a point at which two points meet and therefore cease to
continue)
Chapter 1 : General Introduction
9

These properties are generally invariant over any viewing position, image quality,
and consequently allows robust object perception when the image is projected from a
novel viewpoint when it is degraded. This is known as viewpoint invariance which
enables us to recognize objects regardless of the viewing angle.
Figure 9. Example of geometric icons (geons) in Recognition-by-Components Theory
(Picture taken from :
http://eco.psy.ruhr-uni-bochum.de/download/Guski-Lehrbuch/Abbildungen/Abb_6-82.jpg)
Geons Object
The RBC theory states that structural descriptions of objects are stored in human
memory. It involved an analysis of the relations between the parts of the object, followed
by an analysis of its structure and a search for the best structural match to recognize an
object. This approach proposes that recognition of the overall configuration of ―parts‖ of
a scene could facilitate the recognition of the objects.
This idea seems contra-intuitive with the phenomenon of global precedence
described by Navon (1977). In his experiment using hierarchical letters as shown in
Figure 10, Navon (1977) reported a priority of processing the global structure rather than
the local details.
Figure 10. Navon’s Compound Letter
Navon (1977) found that the nature of the large letter could interfere with decisions
about the small letters, but the small letters had no effect on decisions about the identity of the
large one. These findings propose that shape descriptions might be first constructed and
recognized at the level of overall or global shape while the detailed processing of the smaller
components would intervene later.
1 2 3
4 5
Chapter 1 : General Introduction
10
III. Perceptual Organization : The Navon’s Approach
Navon‘s approach is based on the early studies of Aktualgenese which referred to the
actualization of cognition that retraces growth patterns in phylo-ontogeny. Flavell and
Draguns (1957) stated that thoughts and perceptions undergo a microdevelopment which is
very brief, but theoretically important. This is an important point which differentiates
Navon‘s theory of global-to-local processing from the previous Gestalt theory, although at the
surface, they seem to deal with the same idea that perception is a top-down process. Gestalt
theory fails to elaborate on the developmental aspect in perception, as some criticism
conveyed (Ash, 1998).
The functional importance of global-to-local processing lays on the fact that human
perceptual processors do not passively receive input but actively select which parts of the
surrounding stimulation is worth to be received, attended and processed, or in other words,
perception is basically dynamic. An empirical evidence that laid the global/local processing
approach of Navon was the word-letter phenomenon which was an excellent demonstration of
how word improves recognition of letters (Reicher, 1969; Wheeler, 1970). The pandemonium
approach by Selfridge (1959) showed that similar patterns can be interpreted as two different
letters depending on the context, which proves that the perceptual system ignores the details
that are inconsistent with the interpretation indicated by the context. It supported the work by
Pillsbury (1897) who demonstrated that readers might not be disturbed by omission or the
substitution of letters in the text they read. Palmer (1975) showed that interpretation of
ambiguous elements of a picture tended to the semantic structure of the whole scene even
when it was distorted or when some details were deleted.
Navon evidenced that global features are perceived before the local ones because
there are indications that people can take advantage of peripheral information (Williams,
1966; Rayner, 1975) and within the angular span that can be perceived with high acuity in just
one fixation, there seems to be a progression with exposure time from a very gross to very
fine-grained recognition.
Motion perception also led Navon to the conclusion that the global is processed
before the local. In his experiment (Navon, 1976), it was found that in situations of
ambiguous apparent motion, the global features had the effect of determining the type of
motion experienced, while figural identity of the elements did not give the same effect.
Research by Meili-Dsworetzki (1956) with children at different ages responding at
several ambiguous figures (e.g. a man made out of fruits), supported Navon‘s hypothesis
because the results showed that children perceived wholes at an earlier age than parts.
However, the work of Elkind, Koegler and Go (1964) found opposite effects with different set
Chapter 1 : General Introduction
11

of figures. These empirical evidences led Navon to a conclusion that the general problem with
these experiments was the lack of proper control over the stimulus material since global and
local structures might differ in complexity, salience, familiarity, recognizability or relative
diagnosticity for determining the identity of the whole (Navon, 1977, p.358). To overcome
that problem, Navon proposed two major principles in his experiment, i.e. (a) control the
global and local features and (b) independence of global and local features, so that the whole
cannot be predicted from the elements and vice versa. In his seminal work, Navon (1977)
conducted 4 experiments to prove the global precedence effect. He constructed tasks in which
visual perception was restricted by visibility conditions and by limited attention in perceiving
a compound letter (large letters that were made out of small letters).
In the first experiment, the participants were presented with letters on a Tektronix
oscilloscope with a fast decay phosphor while listening to the utterances of the name of the
letters H and S randomly (auditory stimuli vs. visual stimuli). Each subject faced three
conditions of temporal overlap between the auditory and the visual stimuli : -40 msec, 0, or
40 msec. There were also three consistency levels (a) consistent, if the auditory stimulus
consisted of the same letter than the visual stimulus; (b) conflicting, if the auditory stimulus
differed from the visual stimulus; (c) neutral, if the visual stimulus was a rectangle. A
schematization of the experimental task in Experiment 1 is described in Figure 11.
Figure 11. A Schematization of the experimental task in Navon’s first experiment
(Navon, 1977; p. 360)
SET OF VISUAL STIMULI
Chapter 1 : General Introduction
12

The results showed that the conflicting level led to increases of the reaction times in
the auditory condition while the consistent levels led to the lowest reaction times.
The second experiment had the main characteristics as Experiment 1 (procedure,
apparatus, and setting). The difference was in the set of visual stimuli used, because the
stimuli had a global shape made of local characters. The subjects were given three
consistency levels like in Experiment 1, with patterns illustrated in Figure 12.
Figure 12. A. The set of stimuli in Navon’s second experiment (part 1)
B. The set of stimuli in Navon’s second experiment (part 2)
(taken from Navon, 1977, page 365)
A
B
The second experiment included 2 parts; the first part used the global and local
characters as described above, and the second part employed only one small letter (same size
as local character) or one large bold letter (same size as the global level). When the subject
was exposed to the global/local character, the results showed the high impact of the effect of
consistency of auditory stimuli at the global level, but not at the local level. In the second
part, the results showed that the effect of consistency was still highly significant, but it did not
interact with the type of stimuli (small or large), demonstrating that it was not the smaller size
of the elements per se that made them relatively or absolutely unnoticed in the global
precedence effect (Navon, 1977, p.368).
Chapter 1 : General Introduction
13
The third experiment was designed to reveal whether the subjects had control on their
own perceptual processes if any supplementary demand was employed during the experiment.
The auditory stimuli were removed in the third experiment. In the global-directed condition,
the subject was supposed to indicate whether the global character was H or S (the rectangle
global shapes were not used). In the local-directed condition, the subject was supposed to
indicate whether the local character was H or S (the rectangle local shapes were not used).
The results showed that the global character was recognized faster than the elements.
Subjects processed the global pattern without being affected by the local features while they
were not able to process the local patterns without being aware of the global character. This
revealed that attention could not be efficiently diverted from the whole and proved that global
processing was a necessary stage of perception. The local features could still be processed if a
strong effort was made.
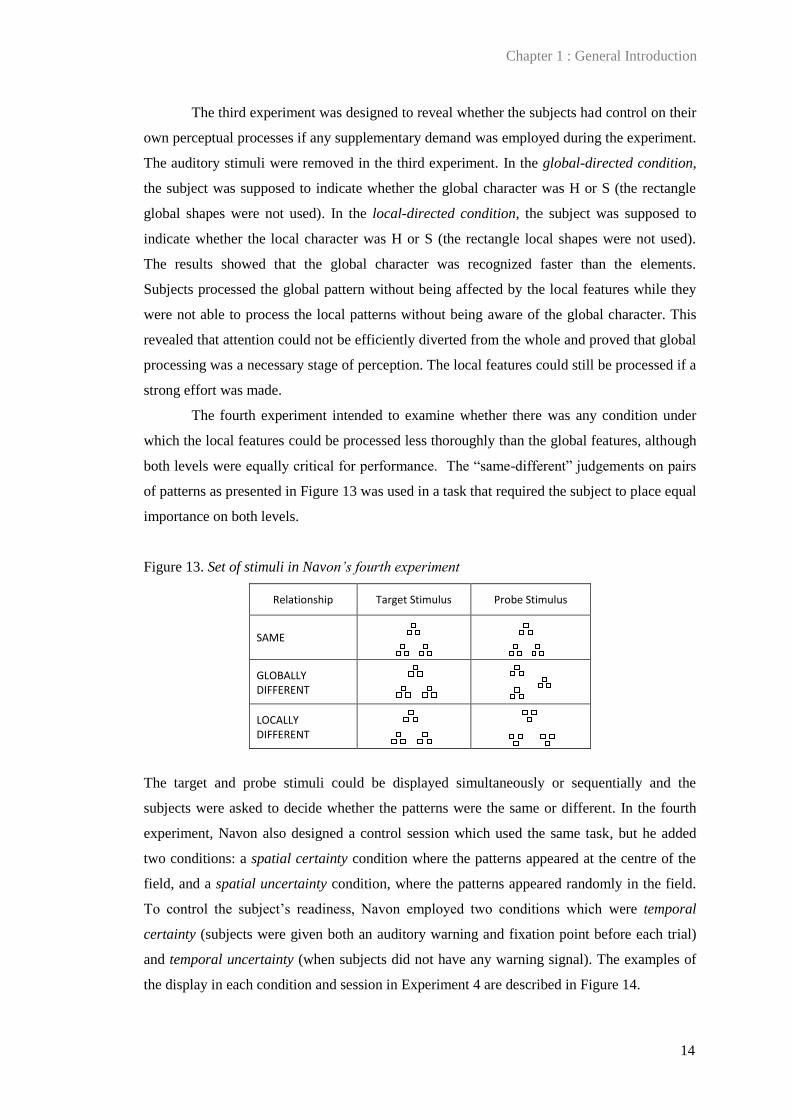
The fourth experiment intended to examine whether there was any condition under
which the local features could be processed less thoroughly than the global features, although
both levels were equally critical for performance. The ―same-different‖ judgements on pairs
of patterns as presented in Figure 13 was used in a task that required the subject to place equal
importance on both levels.
Figure 13. Set of stimuli in Navon’s fourth experiment
Relationship Target Stimulus Probe Stimulus
SAME
GLOBALLY DIFFERENT
LOCALLY DIFFERENT
The target and probe stimuli could be displayed simultaneously or sequentially and the
subjects were asked to decide whether the patterns were the same or different. In the fourth
experiment, Navon also designed a control session which used the same task, but he added
two conditions: a spatial certainty condition where the patterns appeared at the centre of the
field, and a spatial uncertainty condition, where the patterns appeared randomly in the field.
To control the subject‘s readiness, Navon employed two conditions which were temporal
certainty (subjects were given both an auditory warning and fixation point before each trial)
and temporal uncertainty (when subjects did not have any warning signal). The examples of
the display in each condition and session in Experiment 4 are described in Figure 14.
Chapter 1 : General Introduction
14

Figure 14. Examples of the displays in each condition and session of Navon’s fourth
experiment 4 (Navon, 1977, p. 374)
Sequential Presentation Simultaneous Presentation
Large Size Small Size Horizontal Comparison
Vertical Comparison
Prototypical display in test or practice sessions
Prototypical display in control session with spatial certainty
Prototypical display in control session with spatial uncertainty
The results indicated clearly that the global differences were detected more frequently
than the local differences. The short exposure resulted in a difficulty in processing the local
elements despite that the spatial and temporal certainty conditions were meant to motivate the
subjects to process at the local level. In the conditions of spatial uncertainty and temporal
uncertainty, the longer exposures also led to more global than local processing. So the effect
was not due to the fact that the global patterns were more likely to be perceived in case of
brief exposure, since longer exposure also led benefitted to global processing.
On the basis of these four experiments, Navon suggested that only the global level
was subject to interference by the auditory discrimination response. This global precedence
effect is not an inherent property of visual perception because when subjects had to respond
either just to the global level or just to the local level, the identity of the global cues that
conflicted with the local ones inhibited the response to the local level, while the recognition of
the local identity had no effect on global recognition. This confirms that people cannot skip
global processing. Processing at the local level could operate if a deliberate attempt was made
as shown in the last experiment, but the global differences were detected more often than the
local ones. These results support the idea that global processing is done before more local
analysis is completed and they constitute a body of evidence supporting the notion of global
precedence.
The work of Navon (1977) has opened a new beginning in the history of perceptual
organization. It opened a broad area of research in perceptual organization in cognitive,
developmental, and clinical psychology.
Chapter 1 : General Introduction
15

IV. Global and Local Processing in Hierarchical Patterns : State of the Art
Many researches have been performed in the domain of hierarchical stimuli to reveal
the global precedence effect since it has been proposed by Navon (1977). Hierarchical stimuli
are patterns which present a double level of organisation, a global one (the whole shape) and a
local one (the elements that constitute the whole). The global precedence effect refers to the
tendency to process the whole before the parts.
The global precedence hypothesis proposed by Navon (1977) had also been
developed from the earlier assumption on serial processing (processing resources were first
engaged with global information, and processing of local information was optional) but later
the possibility of parallel processing of global and local information was suggested (including
Navon, 1981), with the global information being processed faster and thus being available
earlier than the local one.
Global precedence hypothesis has been confirmed in a large body of research
although it could depend on retinal location (Pomerantz,1983; Grice, Canham, & Boroughs,
1983), on the type of stimuli (Kimchi & Palmer, 1982; Martin, 1979; Kimchi, 1988; Lamb &
Robertson, 1988; Lamb, Yund, 1993; Love, Rouder, & Wisniewski, 1999; Poirel, Pineau, &
Mellet, 2008), on the task given at test (Martin, 1979; Hoffman, 1980; Navon, 1983;
Kimchi, 1988; Farran, Jarrold, & Gathercole, 2003), on the duration of exposure of the
stimuli (Pomerantz, 1983; Paquet & Merikle, 1984; Ninose & Gyoba, 2003), and on
developmental aspects (Dukette & Stiles, 1996; Kramer, Ellenberg, Leonard, & Share, 1996;
Tada & Stiles, 1996; Burack, Enns, Iarocci, & Randolph, 2000; Mondloch, Geldart, Maurer,
& de Schonen, 2003; Porporino, Shore, Iarocci, & Burack, 2004).
The nature of the stimuli in the global/local paradigm remains an interesting subject
of research (Navon, 1983; Kimchi, 1988; Dukette & Stiles, 1996; Love et al, 1999; Dukette &
Stiles, 2001; Grill-Spector & Kanwisher, 2005; Poirel, Pineau, & Mellet, 2006, 2008), as the
task given during the experiment (Kinchla & Wolfe, 1979; Grice et al, 1983; Pomerantz,
1983; Kimchi, 1988; Sanocki, 1993; Weber, Schwarz, Kneifel, Treyer, & Buck, 2000; Ninose
& Gyoba, 2003). We will envisage these two aspects in our thesis.
Nowadays, the global/local paradigm has broaden its field of application; not only in
the field of visual processing but also in auditory processing (List, Justus, Robertson, &
Bentin, 2007; Sanders & Poeppel, 2007), including music perception (Deruelle, Schön,
Rondan, & Mancini, 2005). It has also been applied to different cultures (Davidoff,
Fonteneau, & Fagot, 2008; McKone, Davies, Fernando, Aalders, Leung, Wickramariyaratna,
& Platow, 2010) and different individuals, especially older adults (Georgiou-Karistianis,
Tang, Mehmedbegovic, Farrow, Bradshaw, & Sheppard, 2006) and psychopathological cases
Chapter 1 : General Introduction
16

like prosopagnosia (Duchaine, Yovel, & Nakayama, 2007), individuals with mental
retardation (Birhle, Bellugi, Delis & Marks, 1989; Porter & Coltheart, 2006; Dulaney, Marks,
& Devine, 1994) and individuals with schizophrenia (Poirel, Brazo, Turbelin, Lecardeur,
Simon, Houdé, Pineau, & Dolfus, 2010). However, the global precedence hypothesis was not
confirmed in individuals with early and late blindness by using haptic perception of form
(Heller & Clyburn, 1993), individuals with autism and Asperger Syndrom (Iarocci, Burack,
Shore, Mottron, & Enns, 2006; Behrmann & Kimchi, 2003; Deruelle, Rondan, Gepner, &
Fagot, 2006; Rondan & Deruelle, 2007; Scherf, Luna, Kimchi, Minshew, & Behrmann,
2008), individuals with William Syndrome (Rondan, Santos, Mancini, Livet, & Deruelle,
2007; Farran et al., 2003), with Alzheimer‘s disease (Slavin, Mattingley, Bradshaw, & Storey,
2002), individuals with obsessive compulsive personality (Yovel, Revelle, & Mineka, 2005),
individuals with simultanagnosia (Jackson, Swainson, Mort, Masud, & Jackson, 2004;
Dalrymple, Kingstone, & Barton, 2006) and individuals with visual agnosia (Aviezer,
Landau, Robertson, Peterson, Soroker, Sacher, Bonneh, & Bentin, 2007).
In the last thirty-years, many researchers have investigated the issue of local-global
processing with Navon‘s stimuli and they have concluded that a variety of factors affect the
global advantage effect. These factors are related to the stimulus and to the type task given at
test. The main factors that have been investigated are the following :
1) Overall Visual Angle. The works of Kinchla & Wolfe (1979), Navon & Norman (1983),
and Lamb & Robertson (1990) found that global and local reaction times depended on
the set of visual angles presented. Global advantage was found with patterns subtending
less than 7° of visual angle and a local advantage was found with larger patterns, of about
more than 10° of visual angle.
2) Retinal Location (foveal vs. peripheral). Pomerantz (1983), Grice et al.(1983) and
Lamb & Robertson (1988) concluded that retinal location could affect the relative speed
of processing. Global advantage was obtained with peripheral presentation, but not with
central presentation. This result concerning retinal location indicated that there are
relations between the foveal (central) vs peripheral location and spatial uncertainty (this
resembled to Navon‘s fourth experiment). Spatial uncertainty led a global search through
the peripheral area although the stimuli were presented in the fovea (central). This result
led to broader studies because other aspects like eccentricity and acuity of the stimuli
were suspected to influence the results in retinal location (Navon & Norman, 1983).
Chapter 1 : General Introduction
17

3) Sparsity and number of local elements. Martin (1979), Navon (1983), and Kimchi
(1988) examined the effect of sparsity (the spacing between local elements) using a
stroop-like task, a same-different task, and a simultaneous comparison task. Martin
(1979) reported global advantage with less sparse elements while local advantage
emerged with the sparse ones. This result supported Navon (1983) although the shape of
the elements appeared to play an important role (the triangular patterns were influenced
by sparsity but not the rectangular patterns). Kimchi (1988) suggested that sparsity and
the number of local elements, other factor such as the contours of the global figure, the
task demands and the ―goodness‖ of the global figure might have an effect.
4) Goodness of form. The ―goodness‖ of the shape of the figure might have an effect in the
global advantage effect and it has been investigated by Hoffman (1980), Secbrechts &
Fragala (1985), and Poirel et al. (2006) using several tasks (e.g. memory scanning task,
sequential same-different task, identifying the identically pairs of items). ―Good patterns‖
were processed faster when they constituted the relevant level and when the level of
processing was irrelevant, good patterns slowed down the responses because of stronger
response competition (Sebrechts & Fragala, 1985). The stimuli could also be either
objects or non-objects (meaningfulness of the stimuli) and the results with children
showed that the development of children‘s visual perceptual processing progressively
evolved from a local preference at age of 4 to a global preference at age of 9 when objects
or non-objects stimuli were used (Poirel, Mellet, Houdé & Pineau, 2008).
5) Duration of exposure to the stimuli. Pomerantz (1983) and Paquet & Merikle (1984)
showed that interference between the global and local letters was affected by exposure
duration. When they presented compound letters for 10, 40, or 100 msec, unidirectional
global to local interference was found at the shortest exposure duration.
6) Attention Allocation. According to the work of Hoffman (1980), Ward (1982), Kinchla,
Solis-Marcia & Hoffman (1983), Paquet & Merikle (1984), Robertson (1996), and Ninose
and Gyoba (2003), the direction of attention to the global and local level of an object
determined which level was processed first (global or local). So, it was concluded that
attention played a role in the effect of global advantage.
7) Conspicuity of the stimuli. There are several works related to the role of conspicuity of
the stimuli with regard to the global advantage effect. Many studies related conspicuity to
the difference of spatial frequency caused by the size of the elements (of the local and
Chapter 1 : General Introduction
18

global elements) or their contrast-luminance (Hoffman, 1980; Schyns & Oliva, 1994;
Lamb & Yund, 1996). Hoffman (1980), Sanocki (1993) and Schyns and Oliva (1994)
manipulated the sizes of stimuli and found that when the subject was presented with small
and medium sizes, then a global advantage was obtained with the small sizes and a local
advantage with the medium sizes. When the subject was presented with medium and
large sizes, then a global advantage was obtained with the medium sizes and a local
advantage with the large sizes. This proved that medium size stimulus could be processed
both locally and globally. Other research has relied on the conspicuity of the stimuli
based on contrast balanced theory (Lamb & Yund, 1993, 1996; Lamb, London, Pond, &
Whitt, 1998). Contrast balanced stimuli are stimuli in which the low spatial frequencies
are eliminated so both the local and global forms must be identified using high spatial
frequency information. The results showed that the global advantage in the nested letter
was achieved if the nested letter stimuli were written on grey paper and the letter‘s colour
was white, while the global advantage was not achieved if the white letter was outlined
with black colour. The black outline is called contrast balancing and the effect reduced
the spatial frequency (lower spatial frequency).
8) Structure or relational properties. In the Gestalt theory, similarity and proximity elicit
processes which confirm that the processing of the global pattern precedes the processing
of the local pattern. In the work of Love et al. (1999), geometrical shapes were used as
local elements to reveal the role of relational properties. Using a same-different task,
subjects had to decide whether the two patterns were the same or different. Figure 15
illustrated the stimuli.
Figure 15. Illustration of stimulus in the relational properties experiment (from Love at
al, 1999, p. 293)
(A) (B) (C)
A and B have the same diagonal relational properties while C has vertical
relational properties. When the stimuli are presented, the subjects should answer ―the
same‖ for A and B and ―different‖ for A and C or B and C in case of global advantage.
The results confirmed that global advantage is a process of grouping.
Chapter 1 : General Introduction
19
Let‘s examine now more precisely the works done in a neuropsychological and
developmental perspectives.
A. Neuropsychological Studies in Global-Local Processing
The aims of the studies in neuropsychology that have investigated the global-local
paradigm were not only to reveal which processes in the brain are activated when perceiving
the global figure and local elements, e.g. the mapping location of the activated brain, as in the
work of Han, Liu, Yund & Woods (2000), Lamb, Robertson & Knight (1990) and Robertson,
Lamb & Zaidel (1993). They also aimed at revealing the neural substrates (Han, Yi, & Hua,
2004) and the development of hemispheric lateralization of these processes (Moses, Roe,
Buxton, Wong, Frank, & Stiles, 2002; Kimchi, Hadad, Behrmann, & Palmer, 2005).
With regard to hemispheric differences in the perception of global/local information,
some authors concluded that the right hemisphere (RH) was faster and more accurate in the
identification of global components of the input and the left hemisphere (LH) was faster and
more accurate in the identification of the local components (Lamb & Robertson, 1988;
Robertson et al., 1993; Yovel, Yovel, & Levy, 2001). Evidence from a variety of different
methodologies supported this hypothesis that the RH is biased toward the processing of global
input characteristics while the LH is biased toward the processing of local input
characteristics. The spatial frequency characteristics of the stimuli could also explain the
difference in processing global/local information. Lamb and Yund (1993) examined the role
of spatial frequency using the contrast balanced stimuli as explained before. Contrast
balancing selectively removes low spatial frequency information. Thus, both local and global
processing of the stimuli must be performed on the basis of high spatial frequency
information alone. Removal of low spatial frequencies significantly disrupted global level
processing, suggesting that the global advantage might result from a temporal advantage in
the processing of low spatial frequency information.
The results proved that both hemispheres seem to be able to process a large range of
stimuli, with differences arising between hemispheres for certain types of stimuli and/or
greater efficiency for certain processes. In general, the RH seems to be biased to distribute
attention over larger portions of the visual input than the LH, which seems to process object
‗parts‘ more effectively. Together then, spatial frequency and attention consideration predict
that the RH will create categories on the basis of more ‗holistic‘ similarity (whole-object,
whole-shape, etc), while, in contrast, the LH seems likely to categorize more readily on the
basis of distinctive features (similarity of parts, details).
Chapter 1 : General Introduction
20

The work by Han et al. (2004) regarding the substrates involved in global/local
processing showed that attention to the global level of bilateral visual inputs induced stronger
activation in the left and right temporal cortices. Attention to the local level generated
stronger activation in bilateral superior parietal cortices. These results suggested that distinct
neural substrates in the temporal (for global) and parietal cortices (for local) were
preferentially engaged in the global and local processing of bilateral visual inputs.
In relation with the development of the brain, Moses et al. (2002) found that children
of 7 to 14 years of age demonstrated an emerging pattern of hemispheric differences.
Children‘s development was characterized by a left hemisphere advantage for the local level
processing that resembled the adult‘s one and a trend towards a right hemisphere advantage
for global processing. Children with Immature Bilateral (IB) hemisphere showed greater
overall activation for local level processing, balanced activation across the two hemispheres
for the global condition, and a trend of greater activation for local processing in the right than
the left hemisphere. In contrast, in children with Mature-Lateralized (ML) hemisphere, the
right hemisphere showed greater activation than that in the left one during global analysis and
the opposite during local processing. This demonstrated a shift from undifferentiated bilateral
processing toward hemispheric lateralization in children from 7 to about 12 to14 years of age
where a period of notable transition was marked. This confirmed previous studies of spatial
cognition in children which noted that children are capable to process at global and local level
of analysis and that the relative use of these processes changes with age (Moses et al, 2002).
B. Developmental Studies in Global-Local Processing
Issues concerning the development of local and global perception were typically
centred on the question of the priority of hierarchical level. One early view was that children
are primarily holistic or global processors, evidenced by infants‘ initial focus on the external
contours of line drawings and later inclusion of interior details (Quinn & Eimas, 1998;
Porporino et al., 2004). This notion of global precedence supported the evidence that young
children tended to categorise objects on the basis of their overall similarity rather than on the
similarity of the components (Smith & Kemler, 1977).
However, the developmental sequence between local and global processing is more
complex than originally suggested (Burack et al, 2000). Young children could attend to both
global and local attributes under appropriate conditions (Tada & Stiles, 1989; Stiles, Delis, &
Tada, 1991, Dukette & Stiles, 1996), but they showed impairments under certain conditions.
For example, Prather & Bacon (1986) found that children between the ages of 2 years 7
months and 5 years 7 months were able to name both parts and whole of simple pictures, but
Chapter 1 : General Introduction
21

were less efficient in the naming of both aspects in more difficult pictures. This indicated that
the capacity to perceive multiple aspects of a display could depend on the stimulus or task
complexity.
Dukette and Stiles (1996) examined the development of young children‘s analysis of
spatial patterns, specifically hierarchical letters and geometrical forms. With a forced choice
task, specific stimulus manipulations were introduced to assess children‘s ability to segment
and integrate hierarchically organized information under different conditions (computerized
version vs. pencil and paper version). The results showed that children as young as 4 years of
age demonstrated substantial analytic competence. However, although they were able to
integrate the parts of the spatial array to form a coherent whole, the ability was weaker and
more easily disrupted than in older children and in adults.
This result was also supported by the work of Tada and Stiles (1996) that examined
the early development of spatial patterns analysis and focused on how pre-school children
segmented and integrated the parts of simple spatial forms. They showed that young children
analyzed spatial patterns in ways that differed systematically from older children and adults.
The youngest children segmented out simple, well-formed, spatially independent parts and
used simple relational structures to bind these parts together. With development, children
constructed forms that included increasingly complex parts and relations.
Kramer et al. (1996) investigated the developmental sex differences in global-local
perceptual bias. Previous developmental studies showed that boys tended to perform better
than girls on tasks associated with the right hemisphere (spatial task), whereas girls performed
better on tasks associated with left hemisphere (verbal task) (Denckla & Rudel, 1974; Kirk,
1992). Kramer et al. (1996) showed that boys were significantly better at processing global
information than girls at all ages (4 – 12 years) and younger children of both gender were less
capable at processing global information than older children. This is consistent with
developmental models that suggest an early left-hemisphere advantage for girls and a right-
hemisphere advantage for boys.
V. Our approach
The growing body of research around Navon‘s global-local paradigm testifies for the
interest of this paradigm in the understanding of human‘s perception. In the domain of
cognitive psychology and developmental psychology, there are still a lot of questions that
need further research.
The study of perceptual organization of parts versus whole in developmental
psychology was originally triggered by questions regarding the development of general visual
Chapter 1 : General Introduction
22

processing. Some early studies proposed that young children had limited ability in perceiving
objects, so they would be able to attend to either only the whole, without the analysis of the
local parts (Gibson, 1979; Vurpillot, 1976), or only to the parts without a comprehensive
picture of the global shape (Diamond & Carey, 1977; Elkind et al,1964). The results of recent
studies have indicated that these contradictory conclusions were more likely due to variations
in stimulus complexity rather than to the limitations in children‘s perception. Indeed,
preschool-age children seem able to attend to both the part elements and the whole shape in
visual perception task (Dukette & Stiles, 1996; Prather & Bacon, 1986; Tada & Stiles, 1996;
Tada & Stiles-Davis, 1989). Some studies indicate that part and whole processing, developed
throughout early ages until late adolescent (Harrison & Stiles, 2009; Mondloch et al., 2003;
Porporino et al., 2004; Scherf et al., 2009), but studies with younger children at pre-school
ages are scarce (Hadad & Kimchi, 2006; Farran & Cole, 2008).
Previous studies also showed that children‘s perception seems to be influenced by
stimulus complexity and by the type of task administered during the experiment (Prather &
Bacon, 1986; Kinchla & Wolfe, 1979; Grice et al., 1983; Pomerantz, 1983; Kimchi, 1988;
Sanocki, 1993; Weber et al., 2000; Ninose & Gyoba, 2003). Further systematic investigations
are still worth conducting, in particular with regard to the effect of the task used. We will
systematically introduce drawing tasks because they have been very rarely used in children
within this domain of research, although drawing was proposed to be an effective task in
revealing the visual perception of typically and atypically developing children (Dukette &
Stiles, 2001; Lange-Küttner, 2000; Porter & Coltheart, 2006).
Inter-individual characteristics affect children‘s visual perception. Some early studies
showed that atypically developing children develop different patterns of visual perception
compared to typically developing children. Children with Perinatal Right Hemisphere Focal
Brain Lesions (RPL) were selectively impaired on global accuracy and children with Perinatal
Left Hemisphere Focal Brain Lesions (LPL) on local accuracy (Stiles, Stern, Appelbaum,
Naas, Hesselink, & Trauner, 2008). Individuals with WS (William Syndrome) do not have a
local or a global processing bias when asked to identify stimuli, but do show a local bias in
their drawing abilities (Farran et al., 2003). However, while Porter and Coltheart (2006)
reported a local advantage in the drawings of individuals with WS, and also a local bias in a
non-constructional task, individuals with Down Syndrome (DS) performed better in drawing
the global shape than the local elements (Bellugi, Birhle, Jeringan, Trauner & Doherty, 1990;
Bellugi, Lichtenberger, Jones, Lai, & St George, 2000), and children with autism displayed
normal global processing but not normal local processing (Plaisted, Swettenham, & Rees,
1999). The literature in children with Down Syndrome is contradictory, and nothing is known
about the local/global processing in blind children.
Chapter 1 : General Introduction
23

The experiments that have been done in the present thesis are an extension of those
previous works to reveal further characteristics of the development of children‘s perception in
hierarchical patterns across tasks and populations. Perceptual tasks (a similarity-judgment
task or a naming task) and drawing tasks have been implemented in all four experiments.
Manipulation of duration of exposure to the stimuli was also introduced in
Experiment 1 to Experiment 4 since previous studies showed that interference between the
global and local patterns was affected by duration of exposure in adults (Pomerantz, 1983;
Paquet & Merikle, 1984). A long duration (3 seconds) and short duration (300 msec) were
applied with the typically developing children in Experiment 1 to Experiment 4, but no time
restrictions were given to atypically developing children in Experiment 5 and Experiment 6.
We assumed that, in a drawing task, longer duration elicited more local-global integrated or
correct responses in children across ages while short durations directed these children to
respond with more non-integrated responses. Prolonged exposure seemed to reduce the
efficiency of global processing (Ninose & Gyoba, 2003), so we expected that, in a perceptual
task, longer durations will also elicit local preference, while global preference will be more
produced by the short durations.
Consistent and inconsistent visual hierarchical patterns were studied in Experiment 1
to Experiment 4 to reveal the interference effects between the global and local level. Similar
consistent and inconsistent hierarchical patterns were used in Experiment 6, but in the form of
haptically explored hierarchical patterns since early blind subjects participated in the
experiment. Our hypothesis was that the interference effect by the inconsistent stimuli will
inhibit the integrated responses in children, while the integrated responses will be more
produced by the influence of consistent stimuli.
Simple and complex hierarchical patterns were conveyed in Experiment 3 and
Experiment 4 with typically developing children, since previous studies proposed that
younger children segmented out simple, well-formed, spatially independent parts and used
simple relational structures to bind these parts together (Tada & Stiles, 1996). Based on this
assumption, we expected that older children will process globally the complex hierarchical
patterns more efficiently than the younger children. Since this comparison between simple
and complex stimuli in the studies of hierarchical patterns was new in the literature, we
considered this part of our experimental work as highly exploratory.
Meaningful (familiar objects) patterns and non-meaning (non-objects) patterns were
applied in Experiment 5 in order to reveal whether meaning elicited local preference and local
interference as proposed by Poirel et al. (2006,2008). Children with mental retardation
participated in this experiment. Considering that global responses were dominant in children
with mental retardation (Birhle et al., 1989; Bellugi et al., 1990, 2000; Porter & Coltheart,
Chapter 1 : General Introduction
24

2006), we expected that meaning would elicit local preference in these children when
meaningful objects were used as local elements.
The contradictory results in the literature regarding typically and atypically
developing children also lead to an urge to study children‘s visual perception across
populations. Typically developing children aged 3 to 10 years participated in Experiment 1 to
Experiment 4, children with mental retardation aged 6 to 14 years participated in Experiment
5, and early blind children aged 6 to 18 years participated in Experiment 6. Typically
developing children can attend to both the local and global level at younger ages, but the
ability was more easily disrupted compared to older children or adults. This led to an
expectation that there is an effect of age in children‘s responses to hierarchical stimuli. The
local preference should be often found in the younger children compared to the older children
and then global and more integrated responses should dominate. On the other hand, we
expected that the atypically developing children with mental retardation would follow a
global to a local analysis as age increased and should combine these analyses into integrated
responses at older ages. Contradictory results were expected in atypically developing children
with early blindness. Early blind adults were suggested to have dominant local responses
(Heller & Clyburn, 1993), so we expected that early blind children would develop from non-
integrated responses to local responses, and then, with the developing ability to respond at the
global level, children should be able to integrate these responses in older ages.
Chapter 1 : General Introduction
25

EXPERIMENTAL SECTION

CHAPTER 2. Children’s spatial analysis of hierarchical patterns: Construction and
perception1
Introduction
In this chapter, two experiments are reported that aimed at investigating the
development of spatial analysis of hierarchical patterns in children between 3 and 9 years of
age, using a drawing and a similarity-judgment task.
Drawing behavior has attracted the interest of developmental psychologists from the
turn of the last century (e.g., Freeman, 1980; Lange-Küttner & Vinter, 2008; Luquet, 1927;
Willats, 2005). An original use of this nonverbal behavior was to investigate the development
of spatial analysis of hierarchical patterns in children (Dukette & Stiles, 2001; Lange-Küttner,
2000; Porter & Coltheart, 2006). The concept of hierarchical patterns can be traced back to
Navon (1977), who designed compound figures made of large global letters (e.g., a large H
that constitutes the global level) composed of small local letters that could be consistent (e.g.,
small Hs) or inconsistent (e.g., small Ss) with the global level to test the so-called ―global
precedence effect‖ (see also Kimchi, 1992; Martin, 1979; Navon, 2003). Indeed, Navon
(1977, p. 354) argued that ―perceptual processes are temporally organized so that they
proceed from global structuring toward more and more fine-grained analysis.‖ This
hypothesis claims that when processing a visual object or a visual scene, the global properties
are processed first, and the local properties are analyzed later. The originality of envisaging
this issue through drawing behavior relies on the fact that drawing a hierarchical pattern, from
memory or in a copying task, requires the integration of both processes, regardless of their
respective priority in the very act of perceiving.
To our knowledge, only two studies have investigated how typically developing
children draw hierarchical patterns. Lange-Küttner (2000) asked children 5, 6, or 11 years of
age and adults to copy an inconsistent hierarchical letter pattern (a large H made of small Ss).
She reported that 5-year-old children drew only the global shape of the pattern (H) in more
than 70% of the cases and that correct reproduction of both levels was observed at 11 years of
age. Dukette and Stiles (2001) asked children 4–8 years of age and adults to copy inconsistent
hierarchical patterns or to draw them from memory. Under constrained task conditions (a
memory condition compared with a copying condition), the youngest children had more
difficulties in reproducing the global shape than the local elements, though they were able to
attend to both levels of analysis. When making the local level more salient by decreasing the
1 This chapter has been published in Developmental Psychology, 2010, Vol. 46 , No. 6, pages
1621-1631. We reproduced here most part of this paper.
Chapter 2 : Children‘s spatial analysis of hierarchical pattern
Chapter 1 : General Introduction
26

density of elements, the local advantage increased and was still observed at 8 years of age.
These results diverge from those by Lange-Küttner (2000). It is thus yet unclear whether
young children would manifest an initial local or global bias in their drawing of hierarchical
patterns and to what extent both levels would be present in the drawings.
The other studies that have used drawing behavior for investigating this question were
concerned with neuropsychological issues. Several authors reported that children with
William syndrome (WS) were more accurate in drawing the elements than the global shape of
patterns (Bellugi, Sabo, & Vaid, 1988; Birhle, Bellugi, Delis, & Marks, 1989), whereas
individuals with Down syndrome performed better in drawing the global shape than the local
elements (Bellugi, Bihrle, Jeringan, Trauner, & Doherty, 1990; Bellugi, Lichtenberger, Jones,
Lai, & St. George, 2000). Farran, Jarrold, and Gathercole (2003) confirmed the finding with
individuals with WS and reported another interesting result: This local bias was shown only
in drawing, not in a perceptual task requiring stimulus identification. Farran et al. suggested
that the local bias observed in drawing was not due to perceptual processing but from a
difficulty in integrating the parts into a whole when producing a drawing. However, Porter
and Coltheart (2006) reported a local advantage in the drawings of individuals with WS and
also a local bias in a nonconstructional task. This latter result questions the hypothesis that the
local bias in drawing could be due to the constructional nature of this task. To our knowledge,
there is no study with typically developing children in which performance was compared in a
perceptual and in a constructional drawing task using the same hierarchical patterns and
manipulating the same factors. In the present two studies, we aimed at investigating whether
young children would display a global or a local bias in drawing hierarchical patterns and
whether this bias would be specific to the constructional nature of the drawing task or would
be identical in a perceptual task. Note that it was necessary to use a between-subjects design
to prevent practice and priming effects between the drawing and perceptual tasks, yet limiting
the comparison between drawing and perception.
The studies that have investigated this question of perceptual processing in typically
developing children using perceptual tasks are more numerous than those based on drawing
behavior. Most of them have concluded in favor of an initial local processing bias. In a force-
choice matching task, Kramer, Ellenberg, Leonard, and Share (1996) asked children from 4 to
12 years of age to express similarity judgments by designating which of two geometrical
figures was most like the target hierarchical pattern. Under 7 years of age, children tended to
display a local preference bias. In Dukette and Stiles‘s (1996) study, 4- to 6-year-olds and
adults had to select the figure most similar to the target among two possibilities in four
different conditions: one in which a global bias was expected, one in which a local bias was
induced, and two conditions that did not intend to induce any specific choice because the two
choice items presented provided equivalent matches to the global and local levels of the
Chapter 2 : Children‘s spatial analysis of hierarchical pattern
Chapter 1 : General Introduction
27

target. All participants selected global responses, except in the local-induced condition, in
which they showed a local bias. When the density of elements in the whole figure was
reduced, the 4-year-old children did express more local choices than older children in the two
conditions that did not intend to induce any specific choice. These results suggested that
young children were capable of processing both levels of organization, though local
processing had an initial advantage. Finally, Burack, Enns, Iarocci, and Randolph (2000)
showed that age related performance improvements in a visual search task were more
important in global than in local processing between 6 and 10 years of age.
However, the reverse finding of an initial global bias has also been revealed in the
literature. When children were asked to decide under short exposure times whether two
patterns were the same on the basis of the local elements or of the global shape, 6- and 10-
year-olds demonstrated a strong global bias, stronger than the one showed by adults
(Mondloch, Geldart, Maurer, & de Schonen, 2003). Children were also less accurate on local
than on global trials, contrary to adults. At 14 years of age, performance looked adult-like.
This developmental pattern suggests a slower improvement with age in local than in global
processing. Kimchi, Hadad, Behrmann, and Palmer (2005) demonstrated that both
developmental trends were indeed likely to emerge, depending on contextual and task factors,
in particular whether local elements in the hierarchical patterns were few large or many small.
More recently, Scherf, Behrmann, Kimchi, and Luna (2009) argued that it is the formation of
a precise integrated shape representation that would develop until late in adolescence. Finally,
Poirel, Mellet, Houdé, and Pineau (2008) showed that a developmental change in preferential
processing level occurred early in the first years of life, revealing a clear local preference at 4
years of age, followed by a global preference at 6 years of age.
What the literature makes clear is that many parameters determine whether a local or
global bias emerges at the different ages in a perceptual task. In particular, the exposure
duration of the patterns seems especially relevant to differences in the findings (Kimchi,
1992). None of the drawing studies carried out with typically developing children has tested
the effect of stimulus duration. Yet, several studies have shown that short exposure times
facilitated global precedence in adults when the density of local elements was standard (e.g.,
Kinchla & Wolfe, 1979; Martin, 1979; Navon, 1977; Paquet & Merikle, 1984). We therefore
decided to present the hierarchical patterns under short or long exposure durations in both the
drawing and perceptual tasks. Furthermore, Navon (1977) tested the interference effects
between local and global levels comparing performance when consistent or inconsistent
patterns were shown to the participants and revealed global-to-local interference (see also
Kimchi, 1988, 1992; Martin, 1979). None of the drawing studies run with typically
developing children has compared performance with consistent and inconsistent patterns.
Thus, the question is still open as to know whether typically developing children would
Chapter 2 : Children‘s spatial analysis of hierarchical pattern
Chapter 1 : General Introduction
28

manifest possible interference effects in their drawings of inconsistent hierarchical patterns.
Finally, Poirel et al. (2008) demonstrated that a change in perceptual bias occurred early,
between 4 and 6 years of age. We included children as young as possible in our experiments.
Children at 3 years of age are able to draw circles and squares. We built hierarchical patterns
using these two shapes and tested children between 3 and 9 years of age.
Drawing hierarchical patterns requires children to process both levels of organization
and to integrate one to the other. We focused on these two aspects and not on the accuracy
with which each level was reproduced. Accuracy in drawing depends on several factors that
do not all relate to how information is encoded (e.g., Miyahara, Piek, & Barrett, 2008; Vinter
& Mounoud, 1991). Thus, we performed an analysis based on the categories of drawings
made by children at the different ages. Young children seem able to attend to both the global
and local levels (Dukette & Stiles, 2001). However, if these levels are introduced in their
drawings, we expected that young children would not be able to integrate them but would
produce drawings with the local elements and the global shape juxtaposed or combined
following other topological relationships. Several drawing studies have indeed revealed
convergent findings showing that young children parse compound spatial patterns in
independent parts, entertaining simple topological relationships (e.g., Akshoomoff & Stiles,
1995; Picard & Vinter, 1999; Tada & Stiles, 1996; Vinter & Marot, 2007). Thus, young
children should draw preferentially isolated elements rather than the global shape. However,
consistent patterns should enhance the production of integrated drawings, and short pattern
durations should reinforce global processing.
Finally, our sample of children included both girls and boys because boys have been
reported to make significantly more global perceptual judgments than girls (Cahill, 2003;
Kramer et al., 1996). This finding is consistent with developmental models that suggest an
early left-hemisphere advantage for girls and a right hemisphere advantage for boys
(Coluccia, Iosue, & Brandimonte, 2007). However, Dukette and Stiles (1996) mentioned
exactly the reverse result in 4- to 6-year-olds and in adults in a force-choice matching task,
with female participants making more global level matches than male participants. Gender
differences were therefore worth investigating.
Chapter 2 : Children‘s spatial analysis of hierarchical pattern
Chapter 1 : General Introduction
29

A. Experiment 1: Drawing hierarchical patterns in children
Method
Participants.
A total of 108 right-handed Caucasian children (55 girls, 53 boys), between 3 and 9
years of age, participated in the experiment. They were divided into seven age groups with
age distribution as illustrated in Table 1.
Table 1. Age distribution of participants in the drawing experiment
No Age group N M / F Mean SD
1 3 15 6 / 9 3.3 0.30
2 4 16 8 / 8 4.6 0.28
3 5 15 7 / 8 5.6 0.31
4 6 15 8 / 7 6.4 0.32
5 7 15 8 / 7 7.5 0.28
6 8 16 8 / 8 8.6 0.27
7 9 16 8 / 8 9.4 0.33
Total 108 53 / 55
Each age group corresponded to one school level (3- to 5-year-olds: nursery and
kindergarten levels). Handedness was assessed by testing children on eight items from
Bryden‘s (1977) test, four unimanual items (drawing, throwing a ball, holding scissors, and
brushing teeth), and four bimanual items (closing a bottle, hitting a nail with a hammer,
lighting a match, and drying a plate with a tea cloth). Only children who obtained a score
above 6 were selected. The handedness test was carried out in a pre-experimental session and
completed 1 week before the experiment. None of the children were educationally advanced
or retarded, and their vision was normal. Children were largely from middle socioeconomic
status families. They were tested individually in a quiet room at their schools. Informed
written consent was obtained from parents of each child participating in the study.
Material.
Stimuli were displayed as bitmap files and were presented on a 36-cm - 27-cm
computer screen. Four targets were used in the familiarization phase: a big circle or square
(diameter/side‘s length: 4 cm) and a set of five randomly arranged small circles or squares
(diameter/side‘s length: 3 mm); all four targets were traced in a dashed line. The four targets
shown in the test were as follows: a square made of small squares (consistent stimulus) or of
small circles (inconsistent stimulus), and a circle made of small circles or of small squares.
Illustrations of the targets can be seen in Figure 16. The global shape was 4 cm of height and
Chapter 2 : Children‘s spatial analysis of hierarchical pattern
Chapter 1 : General Introduction
30

width. Each small local shape was 3 mm high and 3 mm wide. There were 26 local elements
in each larger shape, which corresponded to a standard condition with respect to the density
effect (Kimchi, 1988; Martin, 1979). The target appeared centered in the upper half of the
monitor screen. The location of the monitor was adjusted so that the viewing distance was at
60 cm. The middle of the screen corresponded to the participant‘s body midline.
Figure 16. Illustration of the target hierarchical patterns used in Experiment 1.
A. Consistent Stimuli 1
B. Consistent Stimuli 2
C. Inconsistent Stimuli 1
D. Inconsistent Stimuli 2
Procedure.
In a short familiarization phase, the children were introduced to the instructions and
experimental conditions. They were instructed to copy as accurately as possible the model
that appeared on the screen. They were told to concentrate their attention on the screen
because the models would stay visible for a very short time on some trials. The experimenter
gave them a sheet of paper (A5 format) and a black pencil and asked them to adopt a
comfortable and stable posture for drawing. The four familiarization targets appeared for
either a long (3-s) or short (300-ms) duration. The order of presentation of the stimuli was
randomized. When the model disappeared, the participants were asked to make their drawing
without any time constraints. When the drawing was finished, the experimenter took away the
sheet of paper, gave a new one to the participants, and waited for their ready-signal before
triggering the display of the next model. The children produced eight drawings in the
familiarization phase. All children noticed the difference in size of the figures and reproduced
a big and a small circle or square.
The procedure was basically the same in the experimental phase. The children were
told that they would now see patterns such as a big square or circle made of small squares or
circles. The experimenter showed them an example of the patterns to ensure that they were
aware of the presence of the two levels of organization. The children were asked to focus
Chapter 2 : Children‘s spatial analysis of hierarchical pattern
Chapter 1 : General Introduction
31

their attention on the monitor screen and to copy the pattern as accurately as possible. They
produced a total of 16 drawings (2 consistent and 2 inconsistent patterns X 2 durations X 2
trials). A complete random order was used for the targets‘ presentation.
Data coding.
The drawings were sorted into five categories, illustrated in Figure 17.
• Correct integrated response: The overall global shape as well as the local elements were
correctly reproduced (we did not code whether the size or the number of elements or the
regularity of the distance between elements or the accuracy of the right angles in the squares
were correct).
Figure 17. Illustration of the categories of responses in the drawing task.
Correct integrated responses
Inaccurate integrated responses
Global responses
Local responses
Non-integrated responses
• Inaccurate integrated response: The drawings comprised a global shape made of small
elements (the two levels were present and integrated). However, the global shape was
deformed or the local shapes were deformed or both the global and local shapes were
Chapter 2 : Children‘s spatial analysis of hierarchical pattern
Chapter 1 : General Introduction
32

deformed (they were ellipses or rectangles, for instance). Only shape deformations were
considered here.
• Global response: The overall global shape was reproduced with a continuous line, and the
local elements were absent. We did not differentiate the cases in which the shape was
deformed (the 3-year-old children were not all able to draw squares correctly).
• Local response: A series of small circles or squares was reproduced. The overall global
shape was absent. The elements were either isolated or linked one to the other, or they formed
a part of the target. The shape of the local elements was not coded. As illustrated in Figure 16,
most of the drawings were ambiguous, mixing circles, ellipses, deformed squares, or
rectangles.
• Nonintegrated response: The local elements were either juxtaposed or superposed to the
global shape or nested (the superposed drawings were rare).
Two judges coded the drawings independently. They were naive to the experimental
conditions (type of model shown, duration of exposure) in which each drawing was produced.
Their percentage of agreement was 91%. The disagreements were settled by the two judges
working together, before data analysis.
The data were analyzed with nonparametric tests because homoscedasticity was not
held in most of the cases. The Kruskal–Wallis test (H value) was used to test overall age
differences, the Mann–Whitney test (U value) was used to test gender differences or age
differences between two groups, and the Wilcoxon signed-rank test (T value) was used to test
consistency and duration effects. We followed Neuhaüser and Ruxton‘s (2009) advice for the
use of appropriately rounded mean frequencies prior to the ranking procedure.
Results
Gender did not yield significant differences (all ps >.10) and was ignored in the
reported analyses. Figure 18 depicts the results as a function of age and consistency for the
integrated and nonintegrated responses.
Chapter 2 : Children‘s spatial analysis of hierarchical pattern
Chapter 1 : General Introduction
33

Figure 18. Percentages of responses in the drawing task as a function of age and consistency
The frequency of correct integrated responses varied significantly across the age
groups, H(6, N=108) = 83.8, p < .01, increasing between 3 and 9 years of age. The transitions
between 3 and 4 years of age (U = 36.5, n1 = 15, n2 = 16), then between 5 and 6 years of age
(U = 40, n1 = n2 =15), and finally between 6 and 9 years of age (U = 4, n1 = 15, n2 = 16) were
significant (all ps < .01). Children produced more frequently correct integrated drawings in
response to consistent (M=64.1%, SD=39.4) than to inconsistent (M=56.9%, SD=37.1)
targets, T(N=108)=406, p<.01. No other significant differences were found (all ps > .30). The
occurrence of inaccurate integrated responses differed across ages, H(6, N = 108) = 46.3, p < .01,
increasing between 3 (M = 4.3%, SD = 10.9) and 5 (M = 40.8%, SD = 23.9) years of age (U =
23, n1 = n2 = 15, p < .001), then diminishing as depicted in Figure 18B. The decrease between
5 and 7 years of age was already significant (U = 44.5, n1 = n2 = 15, p < .001). These
inaccurate integrated responses were more frequently produced when drawing inconsistent (M
=21.2%, SD = 23.3) than consistent (M = 14.3%, SD = 20.8) targets, T(N = 108) = 466, p < .01.
No other significant differences were reported. Note that a qualitative analysis of the shape
deformations did not reveal any systematic deformations of one level (local or global) as a
function of the other (as, e.g., diffusion from the global shape to the local one or vice-versa).
Chapter 2 : Children‘s spatial analysis of hierarchical pattern
Chapter 1 : General Introduction
34
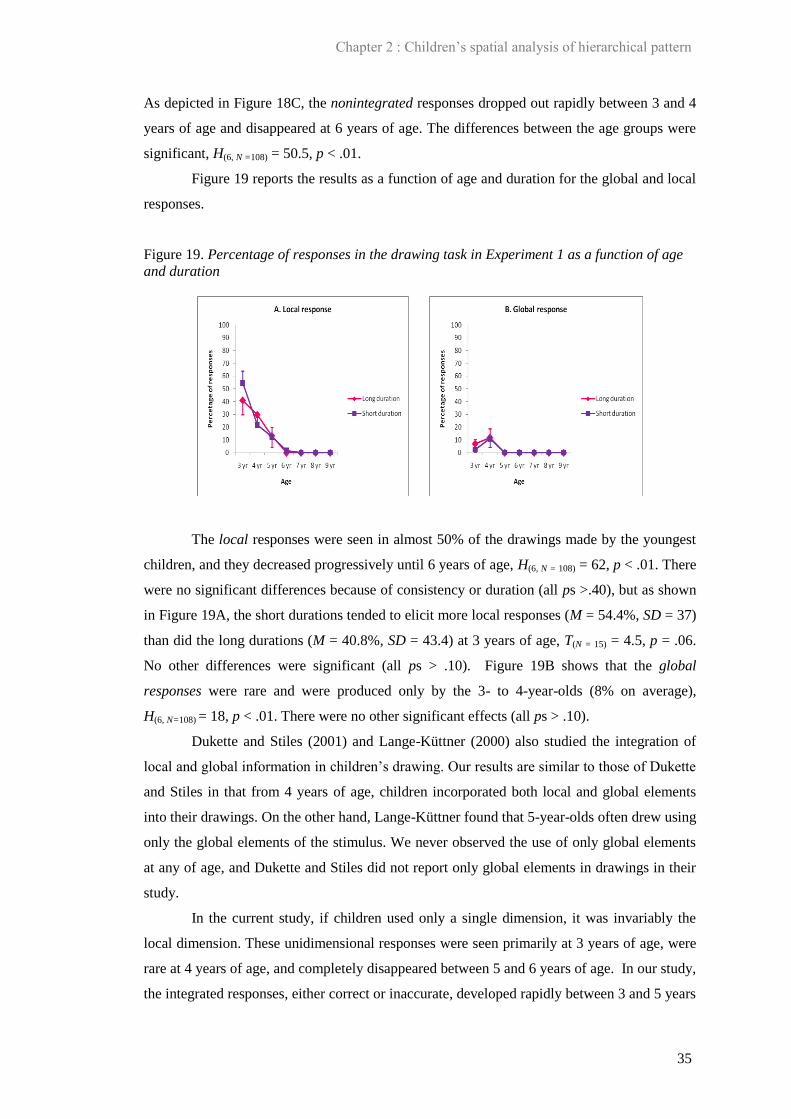
As depicted in Figure 18C, the nonintegrated responses dropped out rapidly between 3 and 4
years of age and disappeared at 6 years of age. The differences between the age groups were
significant, H(6, N =108) = 50.5, p < .01.
Figure 19 reports the results as a function of age and duration for the global and local
responses.
Figure 19. Percentage of responses in the drawing task in Experiment 1 as a function of age
and duration
The local responses were seen in almost 50% of the drawings made by the youngest
children, and they decreased progressively until 6 years of age, H(6, N = 108) = 62, p < .01. There
were no significant differences because of consistency or duration (all ps >.40), but as shown
in Figure 19A, the short durations tended to elicit more local responses (M = 54.4%, SD = 37)
than did the long durations (M = 40.8%, SD = 43.4) at 3 years of age, T(N = 15) = 4.5, p = .06.
No other differences were significant (all ps > .10). Figure 19B shows that the global
responses were rare and were produced only by the 3- to 4-year-olds (8% on average),
H(6, N=108) = 18, p < .01. There were no other significant effects (all ps > .10).
Dukette and Stiles (2001) and Lange-Küttner (2000) also studied the integration of
local and global information in children‘s drawing. Our results are similar to those of Dukette
and Stiles in that from 4 years of age, children incorporated both local and global elements
into their drawings. On the other hand, Lange-Küttner found that 5-year-olds often drew using
only the global elements of the stimulus. We never observed the use of only global elements
at any of age, and Dukette and Stiles did not report only global elements in drawings in their
study.
In the current study, if children used only a single dimension, it was invariably the
local dimension. These unidimensional responses were seen primarily at 3 years of age, were
rare at 4 years of age, and completely disappeared between 5 and 6 years of age. In our study,
the integrated responses, either correct or inaccurate, developed rapidly between 3 and 5 years
Chapter 2 : Children‘s spatial analysis of hierarchical pattern
Chapter 1 : General Introduction
35

of age. At 6 years of age, children produced correct integrated responses in more than 70% of
the cases, and these responses characterized almost 100% of the drawing production at 9
years of age. Would the developmental trajectory shown in this drawing experiment be
revealed in a perceptual task? The perceptual task used in Experiment 2 was based on
patterns‘ similarity judgments.
B. Experiment 2: Perceptual similarity judgments of hierarchical patterns in children
The results of Experiment 1 suggest that local processing dominated first and that
local and global processing started to be integrated at 5 years of age. Would a similarity
judgment task show that global processing preference emerged somewhere around 5 years of
age? We designed the similarity judgment task so that it was as similar as possible to the
drawing task. The same consistent or inconsistent target patterns that were used in Experiment
1 were shown to children in Experiment 2 under the same exposure duration conditions.
Children had to decide which figure, among four choices, was the most similar to the target.
Following Poirel et al. (2008) and our findings in Experiment 1, we expected to observe a
local bias in the choices made by the youngest children, which should be stronger under long
than short target exposure durations. The results of Experiment 1 suggest that this local bias
decreased in strength rapidly between 3 and 5 years of age. Dukette and Stiles (1996) reported
a preference for global responses from 4 years of age. We expected the transition between
local and global preference processing to be located somewhere between 4 and 5 years of age.
As we have seen in Experiment 1 that consistent targets enhanced the integration between
local and global processing in young children, the preference for global responses should be
reinforced by pattern consistency.
Method
Participants.
A total of 224 right-handed Caucasian children (112 girls, 112 boys), between 3 and 9
years of age, participated in the experiment. They were divided into seven age groups of 32
children each, half female and half male as described in Table 2.
Chapter 2 : Children‘s spatial analysis of hierarchical pattern
Chapter 1 : General Introduction
36

Table 2. Age distribution of participants in the perceptual similarity judgment task
No Age group N M / F Mean SD
1 3 32 16 / 16 3.5 0.29
2 4 32 16 / 16 4.6 0.27
3 5 32 16 / 16 5.5 0.27
4 6 32 16 / 16 6.6 0.30
5 7 32 16 / 16 7.5 0.28
6 8 32 16 / 16 8.4 0.29
7 9 32 16 / 16 9.5 0.30
Total 224 112 / 112
The criteria used to select the children were exactly the same as those described in
Experiment 1. Participants in Experiment 2 were not in Experiment 1.
Material.
As in Experiment 1, the stimuli were displayed as bitmap files and were presented on
a 36-cm x 27-cm computer screen. Two targets were shown in the familiarization phase: a
circle and a square (diameter/side‘s length: 4 cm), traced in a continuous line. The same
stimuli traced in a dashed line, together with a cross and a star (same size, traced in a dashed
line), were used for the responses‘ choices. When the circle (or square) was presented, for
instance, a dashed circle (or square), a dashed square (or circle), the cross, and the star were
the choices.
The four targets shown in test were exactly the same as those used in Experiment 1.
The responses‘ choices included a square, a circle— both traced in a continuous line
(height/width of 4 cm)—a set of seven small squares (3 mm), and a set of seven small circles
(3 mm), traced in a continuous line and randomly arranged within a virtual 4-cm x 4-cm
frame. Pilot testing showed that several local elements randomly displayed were a much more
efficient stimulus than only two or three local elements. We used seven elements because we
observed that young children drew on average seven elements in Experiment 1 when they
produced local responses. The target appeared centered in the upper half of the screen, and the
four responses appeared below the target, centered in the lower half. The location of the
computer monitor was adjusted so that the viewing distance was at 60 cm, and the middle of
the screen corresponded to the participant‘s body midline.
Procedure.
During the initial phase children were familiarized to the material and the
instructions. They were presented with a target stimulus (circle or square) and were asked to
select, among four choices (see Figure 20), the stimulus that was the most similar to the
target.
Chapter 2 : Children‘s spatial analysis of hierarchical pattern
Chapter 1 : General Introduction
37

Figure 20. Example of choices in perceptual similarity judgment task for experiment 1
Global response or Erroneous global response
if the target is a pattern with a big square as a global shape, then the choice is considered as global response
if the target is a pattern with small squares as local elements, then this choice is considered as erroneous global response
Global response or Erroneous global response
if the target is a pattern with a big circle as a global shape, then the choice is considered as global response
if the target is a pattern with small circles as local elements, then this choice is considered as erroneous global response
Local Response or Erroneous local response
if the target is a pattern with small circle as local elements, then the choice is considered as local response
if the target is a pattern with other than small circles as local elements (eg. big circle or big square, or small squares), then this choice is considered as erroneous local response
Local Response or Erroneous local response
if the target is a pattern with small squares as local elements, then the choice is considered as local response
if the target is a pattern with other than small squares as local elements (eg. big square, big circle or small circles), then this choice is considered as erroneous local response
The experimenter told the participants to focus their attention to the screen because
the target would appear for a very short time in some cases. This phase included four trials
(circle or square, presented in the two durations), and it was repeated once when children
selected the wrong choices. The target remained visible for 3 s or for 300 ms, followed by an
800-ms blank screen, which was followed by the four choices. Children used a mouse to
select the stimulus they considered most similar to the target, with children who were unable
to use the mouse using their index finger to indicate their choice. In this last case, the
experimenter clicked on the choice that the child has pointed to. The participants were asked
to keep their position constant throughout the experiment. The experimenter checked the
participant‘s position before triggering the next trial. Most children 3 years of age and some
of the 4-year-olds needed a repetition of the familiarization phase.
The instructions given in the test phase were identical to those in the familiarization
phase. Four targets were shown in the test phase: Two were consistent stimuli (circle made of
small circles or square made of small squares), and two were inconsistent stimuli (circle made
of small squares or square made of small circles). They were displayed either for 3 s (long
duration) or for 300 ms (short duration), and the four choices appeared after a blank screen of
800 ms and remained visible on the screen until the children selected one response. The
experimenter waited for the participants‘ ready signal before triggering the next trial. Each
target was presented twice at each duration. The targets as well as the durations were
randomized across the 16 trials. Four choices were presented to the participants: a circle, a
square, a set of small circles, and a set of small squares. One corresponded to a global
response (e.g., choice for the square when a square made of circles or squares was shown),
one was a local response (e.g., choice for the set of squares when a square made of squares or
a circle made of squares was presented), one was an erroneous global response (e.g., selection
of the circle when the square made of squares or circles was displayed), and one was an
Chapter 2 : Children‘s spatial analysis of hierarchical pattern
Chapter 1 : General Introduction
38
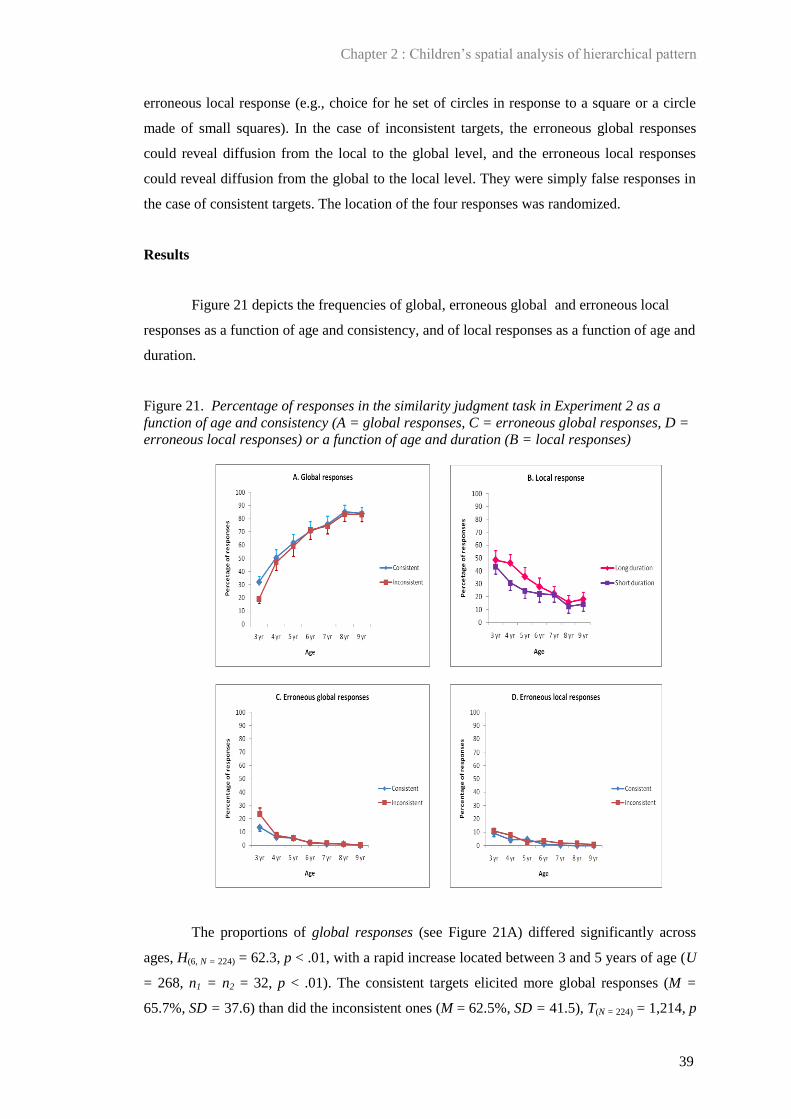
erroneous local response (e.g., choice for he set of circles in response to a square or a circle
made of small squares). In the case of inconsistent targets, the erroneous global responses
could reveal diffusion from the local to the global level, and the erroneous local responses
could reveal diffusion from the global to the local level. They were simply false responses in
the case of consistent targets. The location of the four responses was randomized.
Results
Figure 21 depicts the frequencies of global, erroneous global and erroneous local
responses as a function of age and consistency, and of local responses as a function of age and
duration.
Figure 21. Percentage of responses in the similarity judgment task in Experiment 2 as a
function of age and consistency (A = global responses, C = erroneous global responses, D =
erroneous local responses) or a function of age and duration (B = local responses)
The proportions of global responses (see Figure 21A) differed significantly across
ages, H(6, N = 224) = 62.3, p < .01, with a rapid increase located between 3 and 5 years of age (U
= 268, n1 = n2 = 32, p < .01). The consistent targets elicited more global responses (M =
65.7%, SD = 37.6) than did the inconsistent ones (M = 62.5%, SD = 41.5), T(N = 224) = 1,214, p
Chapter 2 : Children‘s spatial analysis of hierarchical pattern
Chapter 1 : General Introduction
39

< .05. It was only at 3 years of age that significant differences related to consistency were
observed, T(N = 32) = 20, p < .01. No other differences were significant, whether duration or
gender was concerned (all ps > .20). Figure 21B shows that the local responses decreased
progressively with age, with the 3-year-olds selecting them in 46% of the cases and the oldest
children selecting them in 16% of the cases. The differences between ages were significant,
H(6, N = 224) = 35.7, p < .01. These responses were more frequent when the targets remained
visible for long (M = 35.5%, SD = 41) rather than short (M = 24.2%, SD = 34.1) durations,
T(N = 224) = 1,127, p < .01. This effect of duration was significant at all ages between 3 and 6
years of age (all ps < .05). There were no significant differences as regards to consistency or
to gender (all ps > .40).
As shown by Figure 21C, the choice for erroneous global responses differed
significantly between the age groups, H(6, N = 224) = 56.8, p < .01, being observed essentially at
3 years of age. These responses were also less frequent when the duration was long (M =
3.7%, SD = 11.9) rather than short (M = 6.5%, SD = 13.6), T(N = 224) = 449, p < .01. Finally,
the choice for erroneous local responses also differed significantly along ages, H(6, N = 224) =
45.9, p < .01, decreasing progressively with age. On average, the inconsistent targets (M =
4.2%, SD = 8.7) elicited more erroneous local responses than the consistent targets (M =
2.8%, SD = 8.6), T(N =224) = 502, p < .05, as well as the short durations (M = 4.9%, SD = 10.7)
in comparison with the long ones (M = 2.1%, SD =7.6), T(N = 224) = 428, p < .01. Again, we
failed to find significant gender differences (all ps > .10).
The errors produced by the 3-year-olds are worth focusing. These children pointed
significantly more often to the erroneous global responses for the inconsistent targets (M =
23.4%, SD =27.2) than for the consistent ones (M = 13.6%, SD = 16.6), T(N =32) = 48, p < .05.
The occurrence of erroneous global responses for the inconsistent targets was also
significantly higher than the frequency of the other error types, whether the erroneous local
responses associated to the inconsistent patterns (M = 10.9%, SD = 12.2), T(N = 32) = 89,
p < .05, or whether the erroneous local responses associated to the consistent targets (M =
9.3%, SD = 15), T(N = 32) = 84, p < .05, were concerned. Thus, the inconsistent targets
provoked specifically the production of erroneous global responses in the 3-year-old children.
In summary, the results show that when children had to decide whether a compound
figure bore more similarity with its global shape or with an arrangement made of its local
elements, they tended to select more and more often the global shape and less and less often
the local elements as age progressed. At 3 years of age, the local responses dominated over
the global responses, T(N = 32) = 152, p < .05. At 4 years of age, no significant differences
appeared between these responses, T(N = 32) = 216, p > .30, and at 5 years of age, the global
responses were selected twice as often than the local responses, T(N = 32) = 144, p < .05. The
choice for the global responses was facilitated by pattern consistency at 3 years of age. The
Chapter 2 : Children‘s spatial analysis of hierarchical pattern
Chapter 1 : General Introduction
40

local responses were more frequent when the targets remained visible for longer durations in
the children less than 7 years of age. Erroneous responses were rare, except at 3 years of age.
At this age, the erroneous global responses were largely the most frequent errors, and they
occurred significantly more often with inconsistent figures. This result is important because it
reveals a phenomenon of diffusion from the local to the global level. Finally, like in the
drawing experiment, no significant gender differences emerged in the present experiment.
This finding corroborates the results reported in a recent study in which no gender differences
in perceptual processing biases were found (Scherf et al., 2009).
Discussion
The aim of the present studies was to investigate the development of children‘s
spatial analysis of hierarchical patterns in a constructional and a perceptual task. The
similarity judgment task revealed at which age local or global preferences emerged, and the
drawing task, with its additional requirements in planning and motor demands (van Sommers,
1989), showed to what extent children were able to integrate a global and local analysis of the
patterns. Two main findings emerged from these experiments. First, there were clear
qualitative changes in the course of development in the relationships between the global and
local modes of processing. Second, children‘s performance was sensitive to both pattern‘s
consistency and target‘s exposure time in the two tasks.
A. Qualitative Changes in the Relationships Between the Local and Global Modes of
Processing
The results are congruent with regard to the type of processing that dominated at the
youngest age. When the 3-year-olds were asked to draw the compound models, they
reproduced only local elements in 50% of the cases. It was with approximately the same
frequency that they selected the local responses in the similarity judgment task. These
findings support the view that the local bias in drawing was not due to the constructional
nature of the task (Porter & Coltheart, 2006), though evidence obtained with a within-subjects
design would be still more convincing. They also confirm that local processing dominates the
global one in young children (Dukette & Stiles, 1996; Kramer et al., 1996; Poirel et al., 2008).
This could be related to differential rates of development between the left and right
hemispheres (Molfese & Segalowitz, 1988), to reduced oculomotor exploration involving
incomplete processing of visual scenes (Kowler & Martins, 1982; Poirel et al., 2008), or to
attentional functioning in young children who put more attention to parts than to the whole
(Tada & Stiles, 1996). The extent to which top-down processes, such as identification or
Chapter 2 : Children‘s spatial analysis of hierarchical pattern
Chapter 1 : General Introduction
41

naming processes (Poirel et al., 2008), were involved was not clear in our task, as young
children might have a tendency to name the most numerous elements (thus, the local
elements).
However, the drawing task showed that even at 3 years of age children were capable
to attend to both levels of pattern organization, as shown by Dukette and Stiles (2001) in the
4-year-olds. In around 40% of the cases, the 3-year-old children produced drawings in which
both levels were present, but these were either juxtaposed or superimposed or nested. Tada
and Stiles (1996) reported similar results in the copying of compound figures. Likewise,
Vinter and Marot (2007) mentioned that young children tended to copy stairs-like patterns
(made of embedded rectangles) as a series of independent and juxtaposed rectangles. Thus, at
3 years of age, children were capable of perceiving both the local and global organization of
compound patterns, but these modes of spatial information processing operated
independently, as if they did not refer to a unique entity. If we assume that global processing
tends to rely on the right hemisphere and local processing on the left hemisphere (e.g., Moses
et al., 2002), this independent functioning may be a consequence of the still immature
interhemispheric communication in the integration of visual information. It is indeed only at
around 2 years of age that processing between the two hemispheres starts to be coordinated
(Liegeois, Bentejac, & de Schonen, 2000). However, other accounts for the nonintegrated
drawings can be proposed. They may denote the difficulties encountered by young children
when they have to combine basic geometrical shapes in their drawings (Freeman, 1980). The
nonintegrated drawings can also reveal the difficulties encountered by young children in the
understanding of parts–whole relationships, as shown in drawing studies (Picard & Vinter,
2007; Tada & Stiles, 1996; Vinter, 1999; Vinter & Marot, 2007) or in cognitive tasks (e.g.,
Inhelder & Piaget, 1964).
Important changes occurred after 3 years of age. The nonintegrated responses
dropped abruptly between 3 and 4 years of age, whereas the production of integrated
responses, whether correct or inaccurate, increased significantly. Whereas the 3-year-olds
either considered only one component of the target (the local one) or one component at a time
(nonintegrated responses), the 4-year-olds started to process the two components together. A
second developmental change occurred between 4 and 5–6 years of age. It was indeed from 5
to 6 years of age onwards that children produced correct integrated responses more frequently
than local responses. The global bias in drawing, as reported by Lange-Küttner (2000), was
not observed at all in our own drawing study. Children at this age clearly attended to both
levels of organization, and they were able to successfully plan their drawing behavior,
integrating accurately the two components. No further qualitative change occurred, but a
progressive performance refinement was shown between 6 and 9 years of age.
Chapter 2 : Children‘s spatial analysis of hierarchical pattern
Chapter 1 : General Introduction
42

Congruent with this developmental sequence, the local bias shown in the perceptual
task in the youngest children disappeared when both levels of organization started to be
integrated. A global processing preference emerged at 5 years of age in this perceptual task.
This evolution with age found in the similarity judgment task appeared in line with previous
findings, though some divergences were worth pointing out. The local bias lasted until 5
years of age in Poirel et al.‘s (2008) study, until 6 years of age in Kramer et al.‘s (1996) study,
and was obtained only under low elements density in Dukette and Stiles‘s (1996) study. It
was obtained under normal elements‘ density conditions and disappeared between 4 and 5
years of age in our study. However, none of these studies used the same experimental
conditions. Note that the global processing preference as measured by similarity judgments
does not mean that children process the global shape first and then the local elements. Other
types of tasks are needed to trace the time course of each process. Using appropriate tasks,
Scherf et al. (2009) have indeed shown that it is only late into adolescence that evidence of
global precedence can be found. This perceptual global bias means that children are more
likely to base their similarity judgments between two patterns on their global shapes than on
their local elements, these two levels of organization being perfectly attended to, as shown by
the drawing task.
B. Sensitivity to Pattern Consistency and Target’s Exposure Time
As could be expected, correct integrated drawings were facilitated by consistent
patterns as well as the choice at young ages for global responses in the similarity judgment
task. More important, the most frequent errors in the perceptual task were the erroneous
global responses made by the 3-year-olds in the face of inconsistent patterns. Adults were
shown to be subject to interference effects revealing diffusion from the global (dominant
level) to the local level in the face of inconsistent patterns (Kimchi, 1988; Martin, 1979;
Navon, 1977). Our results suggest that a similar but reversed effect occurred at 3 years of age:
Children‘s errors revealed diffusion from the local (dominant level) to the global level. To
our knowledge, this is the first time in the literature that this effect is reported in young
children. It should be further investigated, adapting the methods used with adults to these
young children. Interestingly, insofar as erroneous local responses to inconsistent targets
revealed global to local diffusion, this effect emerged only on average across ages, congruent
with the fact that on average, global processing dominated over local processing.
In the case of drawing, pattern consistency had an impact on the integrated responses,
not on the local or global responses. The inconsistent patterns elicited an increase of
inaccurate integrated drawings. If we assume that these patterns required more effortful
Chapter 2 : Children‘s spatial analysis of hierarchical pattern
Chapter 1 : General Introduction
43
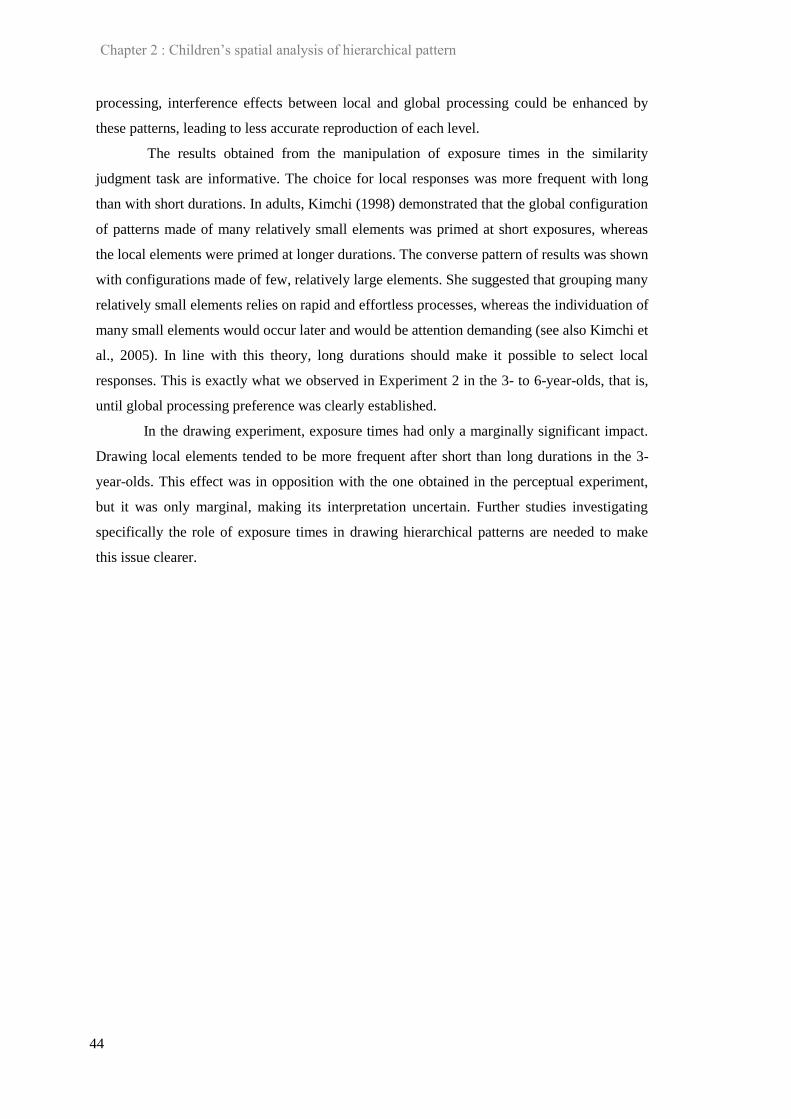
processing, interference effects between local and global processing could be enhanced by
these patterns, leading to less accurate reproduction of each level.
The results obtained from the manipulation of exposure times in the similarity
judgment task are informative. The choice for local responses was more frequent with long
than with short durations. In adults, Kimchi (1998) demonstrated that the global configuration
of patterns made of many relatively small elements was primed at short exposures, whereas
the local elements were primed at longer durations. The converse pattern of results was shown
with configurations made of few, relatively large elements. She suggested that grouping many
relatively small elements relies on rapid and effortless processes, whereas the individuation of
many small elements would occur later and would be attention demanding (see also Kimchi et
al., 2005). In line with this theory, long durations should make it possible to select local
responses. This is exactly what we observed in Experiment 2 in the 3- to 6-year-olds, that is,
until global processing preference was clearly established.
In the drawing experiment, exposure times had only a marginally significant impact.
Drawing local elements tended to be more frequent after short than long durations in the 3-
year-olds. This effect was in opposition with the one obtained in the perceptual experiment,
but it was only marginal, making its interpretation uncertain. Further studies investigating
specifically the role of exposure times in drawing hierarchical patterns are needed to make
this issue clearer.
Chapter 2 : Children‘s spatial analysis of hierarchical pattern
Chapter 1 : General Introduction
44
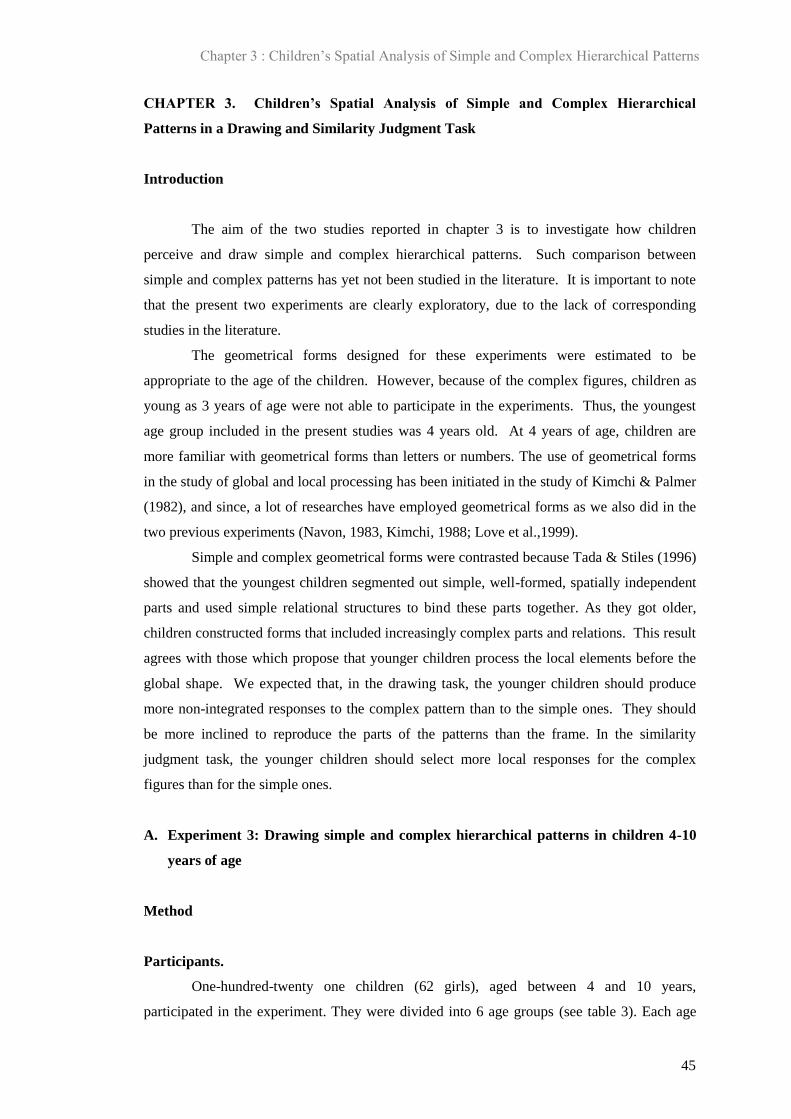
CHAPTER 3. Children’s Spatial Analysis of Simple and Complex Hierarchical
Patterns in a Drawing and Similarity Judgment Task
Introduction
The aim of the two studies reported in chapter 3 is to investigate how children
perceive and draw simple and complex hierarchical patterns. Such comparison between
simple and complex patterns has yet not been studied in the literature. It is important to note
that the present two experiments are clearly exploratory, due to the lack of corresponding
studies in the literature.
The geometrical forms designed for these experiments were estimated to be
appropriate to the age of the children. However, because of the complex figures, children as
young as 3 years of age were not able to participate in the experiments. Thus, the youngest
age group included in the present studies was 4 years old. At 4 years of age, children are
more familiar with geometrical forms than letters or numbers. The use of geometrical forms
in the study of global and local processing has been initiated in the study of Kimchi & Palmer
(1982), and since, a lot of researches have employed geometrical forms as we also did in the
two previous experiments (Navon, 1983, Kimchi, 1988; Love et al.,1999).
Simple and complex geometrical forms were contrasted because Tada & Stiles (1996)
showed that the youngest children segmented out simple, well-formed, spatially independent
parts and used simple relational structures to bind these parts together. As they got older,
children constructed forms that included increasingly complex parts and relations. This result
agrees with those which propose that younger children process the local elements before the
global shape. We expected that, in the drawing task, the younger children should produce
more non-integrated responses to the complex pattern than to the simple ones. They should
be more inclined to reproduce the parts of the patterns than the frame. In the similarity
judgment task, the younger children should select more local responses for the complex
figures than for the simple ones.
A. Experiment 3: Drawing simple and complex hierarchical patterns in children 4-10
years of age
Method
Participants.
One-hundred-twenty one children (62 girls), aged between 4 and 10 years,
participated in the experiment. They were divided into 6 age groups (see table 3). Each age
Chapter 3 : Children‘s Spatial Analysis of Simple and Complex Hierarchical Patterns
Chapter 1 : General Introduction
45

group corresponded to one school level (4-5-year-olds: nursery and kindergarten levels).
Their vision was normal or corrected to normal and none of these children were educationally
advanced or retarded. Children essentially come from families with middle socioeconomic
status. They were all monolingual French-native speakers. They were observed individually
in a quiet room at their schools. Informed written consent was obtained from parents of each
child participating in the study.
Table 3. Age distribution of participants in Experiment 3
No Age group N M / F Mean Range
1 4 20 10 / 10 4.5 3 yr 11 mo-4 yr 9 mo
2 5 21 10 / 11 5.3 4 yr 9 mo-5 yr 9 mo
3 6 20 10 / 10 6.5 6 yr 0 mo-6 yr 9 mo
4 7 20 10 / 10 7.4 6 yr 11 mo-7 yr 9 mo
5 8 20 10 / 10 8.3 7 yr 10 mo-8 yr 8 mo
6 10 20 10 / 10 10.5 9 yr 11 mo-10 yr 10 mo
Total 121 60 / 61
Material.
Stimuli were displayed as bitmap files and were presented on a 36 cm x 27 cm PC
screen. Four targets were used in the familiarization phase: a big circle or square
(diameter/side‘s length: 4 cm). A set of 5 small circles or squares, randomly arranged
(diameter/side‘s length: 0,3 cm), traced in dashed line.
The four targets in the experiment were: a square divided into 2 rectangles or into 2
triangles (figures with simple internal parts, hereafter called ―simple figures‖), or into 4
squares or into 4 triangles (figures with complex internal parts, hereafter called ―complex
figures‖) as shown in Figure 22.
Figure 22. Illustration of the target hierarchical patterns used in Experiment 3
A. Simple Stimuli 1
B. Simple Stimuli 2
C. Complex Stimuli 1
D. Complex Stimuli 2
Chapter 3 : Children‘s Spatial Analysis of Simple and Complex Hierarchical Patterns
Chapter 1 : General Introduction
46

The global shape‘s height and width were 4 cm. Each small local shape‘s height and
width were 0.3 cm. There were 26 local elements in each larger, global level shape, which
corresponded to a standard condition with respect to the density effect (Kimchi, 1988; Martin,
1979; Navon, 1983). The target appeared centered on the top of a monitor screen. The
location of the PC monitor was adjusted so that the viewing distance was 60 cm, and the
middle of the screen corresponded to the participant‘s body midline. The visual angle for the
global shape was 11° and the visual angle for the local shape was 0.87°.
Procedure.
In a short familiarization phase, the children were introduced to the instructions and
experimental conditions. They were instructed ―to copy as accurately as possible the model
which appeared on the screen‖. They were told to concentrate their attention on the screen,
because the models to copy would stay visible for a very short time on some trials. The
experimenter gave them a sheet of paper (half of A4 format) and a black pencil, and asked
them to adopt a comfortable and stable posture for drawing. Four familiarization targets
appeared, either with a long (3 sec) or a short duration (300 msec). The order between these
stimuli was randomized. When the model disappeared, the participants were asked to make
their drawing, without any time constraints. When the drawing was finished, the experimenter
took away the response sheet of paper, gave a new one to the participants, and waited for their
ready-signal before launching the appearance of the next model. The children produced 8
drawings in this familiarization phase. All children noticed the difference in size of the figures
and reproduced a big and a small circle or square (though the square shape was often
deformed by the youngest children).
The procedure was basically the same for the experimental phase. The children were
told that they would now see patterns like a big shape made of small shapes. The
experimenter showed them an example of these patterns, to ensure that they were aware of the
presence of the two levels in the patterns. They were asked to focus their attention on the
monitor screen and to copy the pattern as accurately as possible. Every child received 2 trials
with each pattern in 2 durations, so in overall, each child produced 16 drawings (4 targets x 2
durations x 2 trials). The order of presentation of these trials was randomized.
Data Coding.
A close inspection of the entire set of drawings showed that a double coding of the
data was necessary: a coding of the reproduction of the frame/parts of the targets on the one
hand and a coding of the presence/absence of the local elements or global shape on the other
hand. The first data coding will be mentioned as frame-part analysis and the second data
coding will be mentioned as categorization analysis. The two codings were introduced to get
Chapter 3 : Children‘s Spatial Analysis of Simple and Complex Hierarchical Patterns
Chapter 1 : General Introduction
47

a more comprehensive view on children‘s ability to integrate spatial information into their
drawing ability.
The coding of the reproduction of the frame/parts structure necessitated 7 categories,
with examples depicted in Figure 23.
Figure 23. Illustration of the types of responses coded in the frame/parts analysis
Frame Correct
Part Correct Frame Incorrect
Part Incorrect
Frame Absent
Part Absent
Partial Response
Ex.
Ex.
Ex.
Ex.
Ex.
Ex.
Ex.
Frame correct : the frame was correctly reproduced
Part correct: the parts were correctly drawn
Frame incorrect: the frame was wrong or the shape was deformed. For instance, a circle
was reproduced instead of a square.
Part incorrect : the parts were not correct or the shape was deformed. For instance, the
internal diagonal inside the simple target pattern was reproduced as a vertical or the internal
―×‖ parts inside the complex target pattern was reproduced as a ―+‖.
Frame absent: the frame was not present in the drawing (only the part was reproduced).
Part absent : the parts were absent (only the frame was reproduced).
Partial response : only a part of the frame was drawn (partial frame), the internal parts
were partially reproduced (partial response). For instance, the internal ―×‖ part inside a
complex pattern target was reproduced as a unique diagonal.
The second type of coding (categorization analysis) was largely inspired by the
drawing experiment reported in chapter 2; only one category of drawing was new. There were
thus 5 categories as illustrated in Figure 24.
Figure 24. Illustration of the types of responses categorized in drawing simple and complex
hierarchical patterns
Correct Integrated Response
Non-Integrated Respomse
Combined Response
Global Response
Local Response
Ex.
Ex.
Ex.
Ex.
Ex.
Chapter 3 : Children‘s Spatial Analysis of Simple and Complex Hierarchical Patterns
Chapter 1 : General Introduction
48

Correct integrated response: the global shape as well as the local elements was
reproduced. The precise shape of the global or local structure was sometimes inaccurately
reproduced, above all when data from young children were analyzed.
Non-integrated response: the local elements were either juxtaposed or superposed to the
global shape, or included into it.
Global response: the global shape was reproduced with a continuous line, more or less
accurately, the local elements are absent.
Local response: a series of small circles was reproduced on a line or on two lines
connected by a more or less right angle or as agglomerates. The elements were either isolated
or juxtaposed one to the other.
Combined response: this category did not appear in Experiment 1 and 2. The frame was
reproduced in a continuous line, without the local elements while the local elements were
drawn for the internal parts or vice-versa as depicted in Figure 24.
Results
Non-parametric tests were used for data analysis because the assumption on normal
distribution and homoskedasticity was not met in most of the cases, although the data set was
large. The Kruskal-Wallis test (H value) was applied to test overall age differences, the Mann-
Whitney test (U value) to test age and sex differences between two groups and the Wilcoxon
signed-rank test (T value) to test differences in the complexity of the pattern and duration.
The frame-part analysis will be reported before the categorization analysis.
1. Results of the frame-part analysis of drawing
Figure 25 depicted the results as the function of age for the simple and complex
stimuli. A significant effect of age for the production of frame correct responses was found
in this study (H(5, N=121) = 63.31, p < .01). The frame correct responses increased significantly
rapidly between 4 and 5 years of age (U=69, n1=20; n2=21), p < .01 as described in Figure
25A and then seemed stable after the age of 5 years. No significant effect of complexity was
found for the frame correct responses (all ps > .05).
Chapter 3 : Children‘s Spatial Analysis of Simple and Complex Hierarchical Patterns
Chapter 1 : General Introduction
49

Figure 25. Percentages of responses in the frame-part analysis as a function of age for the
simple and complex hierarchical patterns.
Chapter 3 : Children‘s Spatial Analysis of Simple and Complex Hierarchical Patterns
Chapter 1 : General Introduction
50
Figure 25B represents the frame incorrect responses, which evolved significantly
with age, (H(5, N=121) = 45.75, p < .01). A significant decline was observed between 4 and 5
years of age (U=127.5, n1=20; n2=21), p < .05, and none of the children gave frame incorrect
responses after 6 years of age. No effect of complexity was found in all ages (all ps > .05).
The age evolution for the part correct responses was significant, H(5, N=121) = 49.83, p
< .01 as depicted in Figure 25C. A significant transition was also found between 4 and 5
years of age (U=71, n1=20; n2=21), p < .01, the part correct responses increasing abruptly
between the two ages. The simple patterns elicited more part correct responses (62.80%) than
the complex ones (52.4%) at 4-5 years of age, T(N = 41) = 49.5, p < .05, while the reverse
tended to occur at 7-8 years of age, T(N = 40) = 70, p = .06.
A significant effect of age was also found in the production of part incorrect
responses as described in Figure 25D, H(5, N=121) = 18.88, p < .01. The part incorrect responses
decreased as age increased. A significant transition emerged between 4 and 7 years of age
(U=112.5, n1=n2=20), p < .01. The complex patterns tended to elicit more part incorrect
responses than the simple ones at 4-5 years of age, T(N = 41) = 71.5, p = .07
Figure 25E depicted the results for the frame absent responses and it also showed a
significant decrease of these responses when age increased, H(5, N=121) = 44.06, p < .01. The
significant transition was found between 4 and 5 years of age, (U=111.5, n1=20; n2=21), p <
.05, and there was no significant effect of complexity (all ps > .10).
Figure 25F depicted the results for the part absent responses. The figure showed a
radical decline between 4 and 5 years of age, H(5, N=121) = 40.34, p < .01. These responses
decreased progressively from 4 years to 5 years of age, (U=76.5, n1=20; n2=21), p < .01, and
remained at a low level in children at older ages. No effect of complexity was reported (all ps
> .10).
The partial responses, illustrated in Figure 25G, were rare in each age group, but the
slight decline of the responses as age increased still showed a significant effect, H(5, N=121) =
33.71, p < .01. An effect of complexity was found between 4 and 6 years of age, T(N = 61) =
58.5, p < .05, where complex patterns aroused more partial responses (13.55%) than the
simple patterns (7.4%).
What about the effect of stimulus duration on these responses? Figure 26 depicted
these results as the function of age and duration.
Chapter 3 : Children‘s Spatial Analysis of Simple and Complex Hierarchical Patterns
Chapter 1 : General Introduction
51

Figure 26. Percentage of responses in the frame-part analysis as a function of age and
duration (A = Frame-correct response, B =Frame-incorrect response, C = Part-correct
response, D = Part-incorrect response, E = Frame-absent response, F = Part=absent
response, G = Partial response)
Chapter 3 : Children‘s Spatial Analysis of Simple and Complex Hierarchical Patterns
Chapter 1 : General Introduction
52

The effect of duration was not significant for three drawing responses, which were :
the frame correct responses (all ps > .10), the frame incorrect responses (all ps > .10) and the
frame absent responses (all ps > .10), even at 4 years of age as shown in Figure 26A, 26B and
26E respectively. In all the other cases, duration had an impact on the responses produced by
the children. As illustrated in Figure 26C, the part correct responses were more frequently
produced with the long durations (88.1%) than the short durations (67.85%). The effect of
duration was significant, T(N = 121) = 69, p < .01, except at 4 years of age and at 9 years of age
(all ps > .10).
For the part incorrect responses displayed in Figure 26D, a significant effect of
duration was found in all ages, T(N = 121) = 198, p < .01, with the short durations eliciting more
these responses (14.9%) than the long durations (5.8%), except at 4 years of age and at 9
years of age (all ps > .10).
Figure 26F depicted the results for the part absent responses, where an effect of
duration was again found, T(N = 121) = 21, p < .01. Short durations yielded more these
responses (10.5%) than the long durations (4.75%). The effect of duration was found at 4
years of age, T(N = 20) = 8, p < .05, but not at 9 years of age (p < .10).
Finally, the partial responses (Figure 26G) were more induced by the short durations
(7%) than by the long durations (3.7%), T(N = 121) = 48, p < .05. This occurred particularly at
5-6 years of age, T(N = 41) = 0, Z = 2.6, p < .01, where the short durations (12.1%) elicited more
these responses than the long durations (3.6%).
Note that the effect of sex on the frame-part analysis was never significant, regardless
of the type of responses (all ps < .10). So this factor was ignored in the rest of the analysis.
2. Results of the categorization analysis of the drawing responses
Let‘s examine now the results issued from the categorization analysis of the drawing
responses in global, local, integrated, non integrated and combined responses. Figure 27
depicts these results as a function of age for the simple and complex stimuli.
Chapter 3 : Children‘s Spatial Analysis of Simple and Complex Hierarchical Patterns
Chapter 1 : General Introduction
53
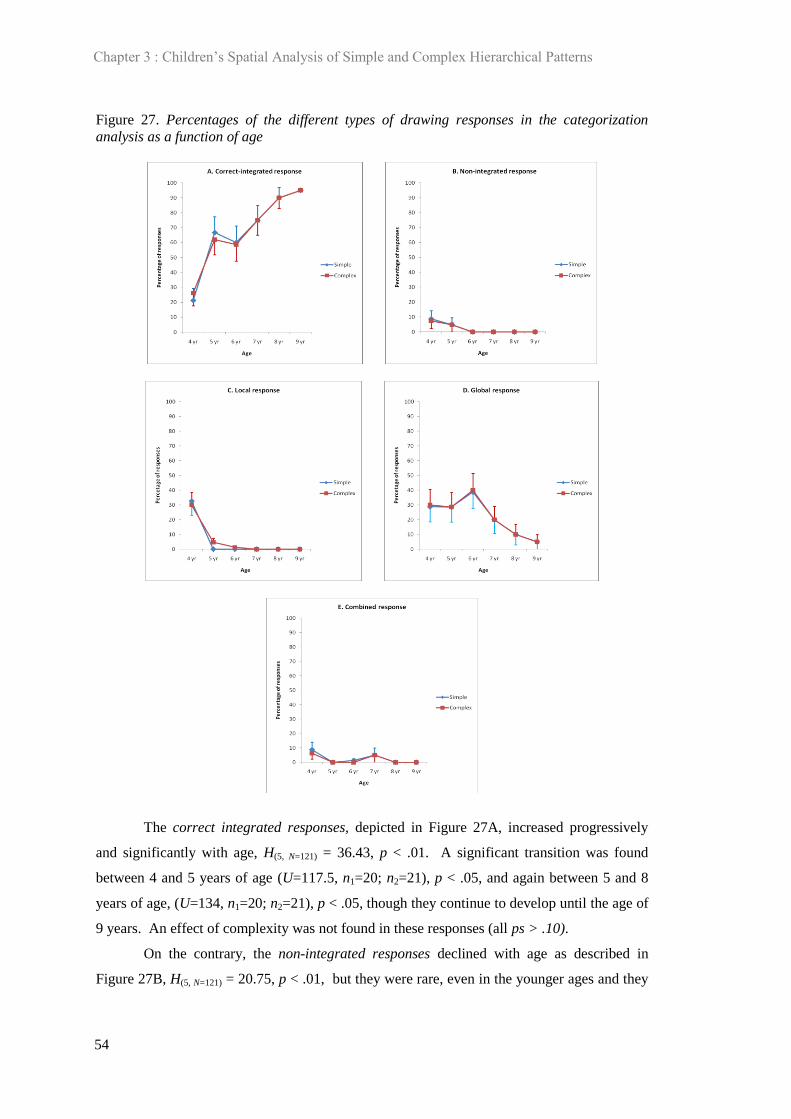
Figure 27. Percentages of the different types of drawing responses in the categorization
analysis as a function of age
The correct integrated responses, depicted in Figure 27A, increased progressively
and significantly with age, H(5, N=121) = 36.43, p < .01. A significant transition was found
between 4 and 5 years of age (U=117.5, n1=20; n2=21), p < .05, and again between 5 and 8
years of age, (U=134, n1=20; n2=21), p < .05, though they continue to develop until the age of
9 years. An effect of complexity was not found in these responses (all ps > .10).
On the contrary, the non-integrated responses declined with age as described in
Figure 27B, H(5, N=121) = 20.75, p < .01, but they were rare, even in the younger ages and they
Chapter 3 : Children‘s Spatial Analysis of Simple and Complex Hierarchical Patterns
Chapter 1 : General Introduction
54

disappeared by the age of 6 years. No effect of complexity was significant at all ages (all ps
> .10).
Figure 27C depicted the significantly decreasing local responses when age increased,
H(5, N=121) = 39.30, p < .01. A significant transition appeared between 4 and 5 years of age
(U=123, n1=20; n2=21), p < .05, and after the age of 6 years, none of the children produced
local responses. No effect of complexity was found across ages (all ps >.10).
The global responses showed a marginally significant effect of age, H(5, N=121) = 9.60,
p = .08, as illustrated in Figure 27D. Indeed, if we compared the 4-5-6 year-old children to
the 8-9 year-old children, we find that the former produced more global responses (32.4%)
than the later (11.7%), (U=914, n1=61; n2=40), p < .01. The effect of complexity was again
not significant (all ps > .10).
Figure 27E described the combined responses which showed a significant effect of
age, H(5, N=121) = 12.612, p < .05, with these responses decreasing with age although they
remained at low frequencies (2.1%), compared to the other responses. No effect of
complexity was found (all ps > .05).
Figure 28 expressed the frequencies of these categories of drawing responses as a
function of duration for the different age groups.
Figure 28. Percentage of responses in drawing for categorization analysis as a function of
duration and age
Chapter 3 : Children‘s Spatial Analysis of Simple and Complex Hierarchical Patterns
Chapter 1 : General Introduction
55

Figure 28. (continued)
The long or short pattern durations showed no significant effect on the production of
integrated responses as depicted by Figure 28A, as well as the production of non-integrated
responses, as seen in Figure 28B (all ps > .10). Duration had a significant effect only on the
production of local responses, T (N = 121) = 0, Z = 2.66, p < .01, with the local responses elicited
more often by the short durations (7.2%) than by the long durations (4.1%). This significant
difference was due to the younger children aged 4 years, T (N = 21) = 0, Z = 2.2, p < .05.
Duration failed to have an impact on the other types of drawing responses (all ps > .10).
B. Experiment 4: Similarity judgment task with simple and complex hierarchical
patterns
Experiment 3 suggested that children were constructing independently an analysis of
the frame and the part before they were able to draw an integrated response, associating
correctly the two analyses. The frame-correct analysis increased more rapidly than the part-
correct analysis; it emerged between 4 and 5 years of age, and it seemed stable. The
complexity of stimuli influenced only the part analysis, with the complex figures less well
reproduced than the simple ones at younger ages. It did not influence the other responses.
Duration had also a greater impact on part analysis than on frame analysis. With regard to the
issue of local-global processing, the results showed that local processing dominated at
younger ages and that local and global processing started being integrated at the age of 5.
In Experiment 4, a similarity judgment task was employed to test whether global
processing preference would emerge somewhere near 5 years of age, and whether the
complexity of the hierarchical patterns would have an impact on this preference. The
similarity judgment task was designed so that it was as similar as possible to the drawing task.
Chapter 3 : Children‘s Spatial Analysis of Simple and Complex Hierarchical Patterns
Chapter 1 : General Introduction
56

The same simple and complex target patterns as used in Experiment 3 were shown to children
in Experiment 4 under the same exposure duration conditions. Children had to decide which
figure, among four alternatives, was the most similar to the target. We expected to observe a
local bias in the choices made by the youngest children, which should be stronger under long
rather than short target exposure durations. Experiment 3 did not show any important
influence of complexity of the hierarchical patterns on the drawing responses; we expected
similar findings in the similarity judgment task. However, the effect of stimulus duration
should be greater than to the one seen in Experiment 3.
Method
Participants.
One-hundred children (49 girls), aged between 4 and 10 years, participated in the
experiment. They were divided into 5 age groups as described in table 4.
Table 4. Age distribution of the participants in Experiment 4.
No Age group N M / F Mean Range
1 4 yrs 20 13 / 7 4 yr 4 mo 3 yr 10 mo - 4 yr 7 mo
2 5 yrs 20 8 / 12 5 yr 5 mo 4 yr 11 mo - 5 yr 9mo
3 6 yrs 20 9 / 11 6 yr 5 mo 6 yr 0 mo - 6 yr 10 mo
4 8 yrs 20 9 / 11 8 yr 4 mo 7 yr 10 mo – 8 yr 9 mo
5 10 yrs 20 12 / 8 10 yr 4 mo 9 yr 10 mo – 10 yr 9 mo
Total 100 51 / 49
Each age group corresponded to one school level (4-5-year-olds: nursery and
kindergarten levels). The criteria used to select the children were exactly the same as those
described in the previous experiments and none of them participated in these previous
experiments.
Material.
Like in Experiment 3, the global shape was 4 cm of height and width and each small
local shape was 0.3 cm of height and width. The density of local elements was identical to the
one used in the previous experiments. As shown by Figure 22, the 4 targets were a square
divided into 2 rectangles or into 2 triangles (figures with simple internal parts, hereafter called
―simple figures‖), or into 4 squares or into 4 triangles (figures with complex internal parts,
hereafter called ―complex figures‖). The stimuli presented as responses‘ choices series
included a global response (1), a local response (2), a global-partial response (3) and an
integrated partial response (4) as seen in Figure 29.
Chapter 3 : Children‘s Spatial Analysis of Simple and Complex Hierarchical Patterns
Chapter 1 : General Introduction
57

Figure 29. Illustrations of the response choices in the similarity judgment task
SIMPLE STIMULI 1
Global - Total
Local – Total
Global Partial
Integrated Partial
COMPLEX STIMULI 1
Global - Total
Local – Total
Global Partial
Integrated Partial
SIMPLE STIMULI 2
Global - Total
Local – Total
Global Partial
Integrated Partial
COMPLEX STIMULI 2
Global - Total
Local - Total
Global Partial
Integrated Partial
Procedure.
During an initial familiarization phase, children got used with the material and the
instructions. They were presented with a target stimulus (circle or square) and were asked to
select, among four choices (see Figure 29), the stimulus ―which was the most similar‖ to the
target, ―which looked most alike‖. The experimenter told the participants to focus their
attention on the screen because, in some cases, the target would appear for a very short time.
This phase included 4 trials (circle or square, presented in two durations), and was likely to be
repeated once if children selected the wrong choices. The target remained visible for 3 sec or
for 300 msec, followed by a blank screen during 800 msec before the 4 choices appeared. The
children clicked with the mouse on the stimulus they considered as most alike to the target.
The participants were asked to keep their position constant throughout the
experiment. The experimenter checked this point each time before launching the next trial.
The familiarization phase was useful to make the children familiar with the pace of the
presentation of the targets and with the instructions. Some of the children aged 4 years needed
a repetition of the familiarization phase.
Chapter 3 : Children‘s Spatial Analysis of Simple and Complex Hierarchical Patterns
Chapter 1 : General Introduction
58

The instructions given in the experimental phase were identical to those in the
familiarization phase. Four targets were shown in the test phase: 2 were simple stimuli and 2
were complex stimuli. They were displayed either for 3 sec (long duration) or for 300 msec
(short duration), and the 4 responses‘ choices appeared after a blank screen of 800 msec and
remained visible on the screen until the children selected one response. The experimenter
waited for the participants‘ ready-signal before launching the next trial. Each target was
presented twice in each duration. The targets (simple or complex) as well as the durations
(short or long) were randomized across the 16 trials. Four choices were presented to the
participants in each of simple and complex target as shown in Figure 29.
For each stimulus, the choices corresponded to a global response (for instance, choice
for the square divided by a diagonal), a local response (for instance, choice for the set of small
circles), a global partial response (for instance, selection of the triangle as part of square that
was divided by a diagonal) and integrated partial response (for instance, choice for the set of
circles that resembled to global partial choice). The location of the four responses‘ choices at
the bottom of the screen (left, right or middle) was randomized.
Results
The results are depicted in Figure 30 (A=global responses, B=local responses,
C=global-partial responses, D=integrated-partial responses) as a function of age for the
simple and complex patterns.
Figure 30. Percentage of responses as a function of age and patterns in the similarity
judgment task
Chapter 3 : Children‘s Spatial Analysis of Simple and Complex Hierarchical Patterns
Chapter 1 : General Introduction
59

Figure 30. (continued)
Figure 30A showed that the choice for the global responses increased significantly
with age, H(4, N = 100) = 23.70, p < .01, though the youngest children pointed to these responses
in already a noticeable number of cases (62.5%). A first significant difference was found
between 4 and 6 years of age, (U = 96.5, n1 = n2 = 20), p < .01. A slight decrease in the
occurrence of these responses was observed between 8 (95%) and 10 years of age (89.7%),
but no significant difference was found. An effect of the complexity of the stimuli was
significantly found between age 4 and 6 years of age, T (N = 60) = 125, Z = 3.11, p > .01 with
the complex stimuli eliciting more global responses (79.58%) than the simple stimuli (71%).
A marginally significant effect of complexity was found at 10 years of age, T (N = 20) = 1.88, p
= .059, but contrarily to the former result in older children, the global responses were more
aroused by the simple stimuli (37.5%) than by the complex stimuli (25%).
The children selected the local responses rarely, on average only in 4% of the cases.
Nevertheless, the youngest children did it more often than the oldest ones, H(4, N = 100) = 25.41,
p < .01 as illustrated in Figure 30B. The choice for these responses vanished at 8 years of age
and the shift in the local responses between 4 and 8 years of age yielded significance, (U =
76, n1 = n2 = 20), p < .01. An effect of stimulus complexity was significant at 5 and 6 years
of age, T (N = 40) = 9, Z = 2.35, p > .05, the simple patterns eliciting more local responses
(8.1%) than the complex patterns (4.1%).
The choice for the global-partial responses diminished significantly with age as seen
in Figure 30C, the youngest children opting for them in 14.4% of the cases while this
percentage dropped to 1.6% at 10 years of age, H(4, N = 100) = 21.76, p < .01. Between 4 and 6
years of age, there was a marginally significant drop of these responses, (U = 132, n1 = n2 =
20), p = .065. The effect of stimulus complexity yielded no significance for the global-partial
responses (all ps >.10).
Finally, the integrated partial responses (Figure 30D) displayed the more interesting
significant evolution with age, H(4, N = 100) = 19.65, p < .01. They decreased between 4-5-6
Chapter 3 : Children‘s Spatial Analysis of Simple and Complex Hierarchical Patterns
Chapter 1 : General Introduction
60

years of age (U = 85.5, n1 = n2 = 20), p < .01, but after 8 years of age, a significant tendency
to increase was observed (U = 126.5, n1 = n2 = 20), p < .05. At 5 and 6 years of age, a
significant effect of stimulus complexity was found, T (N = 40) = 35, Z = 2.19, p < .05, with the
simple stimuli eliciting more integrated partial responses (8.1%) than the complex stimuli
(3.8%).
Let‘s examine now the impact of pattern duration. The results are shown in Figure 31.
Figure 31. Percentages of responses as a function of age and duration in the similarity
judgment task
Figure 31A illustrated the percentage of global responses as a function of age and
duration. A marginally significant difference was found in these responses at 8 years of age,
T (N = 20) = 1.5, Z = 1.8, p = .059, where the global responses were more elicited by the short
durations (97.5%) than by the long durations (92.5%).
Another significant difference as regard to duration was found in the global-partial
responses at 5 years of age, T (N = 20) = 3.5, Z = 2.25, p < .05, as illustrated in Figure 31C. The
long durations elicited more global-partial responses (10.6%) than the short durations (4.4%).
No effect of duration were found in the local responses as depicted in Figure 31B and
also in the integrated-partial responses as illustrated in Figure 31D (all ps > .10).
Chapter 3 : Children‘s Spatial Analysis of Simple and Complex Hierarchical Patterns
Chapter 1 : General Introduction
61

Discussion
In this study, the frame and part analysis yielded new findings on how children
integrated spatial information in the drawing of hierarchical patterns. Before they reproduced
an integrated, a local or a global response, children were constructing the frame and part
analysis.
In overall, the results showed that age had an important impact on the development of
frame-part analysis. Frame correct responses increased rapidly between 4 and 5 year of age,
and then it seemed stable. Part correct responses also increased with age but less rapidly than
the frame correct responses. A reverse result was shown for all the incorrect frame-part and
absent frame-part responses, as these responses tended to decrease as age increased. The
significant shift in the frequencies of these responses was also found between 4 and 5 years of
age.
Complexity of the stimuli significantly influenced the part-correct responses, the part-
incorrect responses and the partial responses and did not influence any frame responses. A
similar result was observed for the effect of duration that was found only in the production of
part-responses. Long durations triggered more part-correct responses, while the part-
incorrect, the part-absent and the partial responses were more produced under of short
durations, which could mean that short durations caused more defaults in the drawing of the
parts than of the frame.
Age had also an important effect in the categorization analysis. The correct
integrated responses increased progressively and significantly with age, while the other
responses (non-integrated, global and local responses) significantly tended to decrease as age
increased. As compared to the local responses, the global responses dominated, and they
decreased after 6 years of age. This shows that children at younger ages can attend to both
the local and global level but these responses tended to decrease as children get older and
began to integrate the local and global level into an integrated response.
Duration had an effect on the local responses, with the short durations eliciting more
local responses than the long durations. It occurred at younger ages (4 years of age) and this
might support other findings which proposed that local preference existed in children at
younger ages.
This study suggests that the integration between local and global levels of
organization in drawing seems to emerge at 5 years of age. Before 5 years of age, children
are able to focus on the global level or local level, but they cannot coordinate and integrate
the two levels (76.25% of drawing performance at the age of 4 was either local, or global, or
non-integrated). The dominance of global processing accounted for the more rapid
development of the drawing of the frame, as compared to the drawing of the parts, evidenced
Chapter 3 : Children‘s Spatial Analysis of Simple and Complex Hierarchical Patterns
Chapter 1 : General Introduction
62

by 42.5% of the children who showed frame-correct responses at the age of 4 (100% at the
age of 7). Part-correct responses were shown by 36.25% of the children at the age of 4 and
gradually increased to 90.6% at the age of 7 without reaching 100% at the age of 9 (it
presumably continued to develop after the age of 9).
In this study, the development of spatial analysis in drawing was globally not
influenced by the complexity of the pattern and by the duration of the display. The effect of
complexity and duration only significantly influenced the reproduction of parts.
The findings obtained in the similarity judgment task confirmed that that age had a
significant effect on global responses, local responses, global-partial responses and integrated-
partial responses. The predominant responses were clearly the global responses: at 4 years of
age, children selected these responses in already more than 60% of the cases. A peak was
reached at 8 years, followed by a slight but not significant decline at 10 years. Furthermore,
these global responses were more enhanced by the complex figures in children between 4 to 6
years of age, but at older ages (8 years of age and henceforth), the simple figures elicited
more the global responses than the complex figures. The choice for the local responses was
very rare in the present experiment, even at the youngest ages (less than 10% of the cases).
They were no longer observed at 8 and 10 years of age. The global-partial responses showed
a similar evolution, disappearing at older ages, and on the contrary, the integrated-partial
responses showed a tendency to increase in older children.
The effect of complexity was evidenced in the choice for local responses and for
integrated-partial responses. The simple patterns elicited more these responses than the
complex ones. No effect of complexity was found in the global-partial responses.
Duration on the other hand had a significant impact only on the global responses and
global-partial responses. The short durations elicited more global responses although it only
occurred at 8 years of age. On the contrary, the long durations elicited more global-partial
responses in children at 5 years of age.
From these two explanatory experiments, we can conclude that the children‘s spatial
analysis of simple and complex hierarchical patterns developed from local to global at
younger ages (between 4 to 5 years of age), these local and global responses beginning to
integrate at between 6 to 7 years of age. These conclusions were supported by the evidence
that younger children produced more local responses than older children in the drawing task
and in the similarity-judgment task. The frame-part analysis ensured this idea since children
at younger ages gave more incorrect responses in drawing the global level or the frame.
The global responses were dominant after 5 years of age in the similarity-judgment
task, illustrating the global advantage effect. In the drawing task, they showed a tendency to
decrease as age increased, because this task required an integration of the tow processes to be
successfully achieved. Indeed, when the global responses decreased, responses based on
Chapter 3 : Children‘s Spatial Analysis of Simple and Complex Hierarchical Patterns
Chapter 1 : General Introduction
63

integration began to consistently increased, as evidenced by the production of more frame and
part-correct responses in the drawing task and of correct-integrated responses in the
similarity-judgment task.
Complexity of the patterns enhanced the production of incorrect and partial
responses, both in the drawing task and in the similarity-judgment task in children at younger
ages. On the contrary, after 6 years of age, complexity of the patterns elicited more part
correct responses. This finding might support the idea that children at older ages attended to
more detailed information in order to integrate the two levels of analysis (global and local) in
the responses. This conclusion is coherent with the evidence that long durations elicited more
part-correct responses in children. The significant effect of durations was also consistently
found in the production of incorrect part responses and partial responses in the drawing task
where short durations elicited more incorrect and partial responses.
Chapter 3 : Children‘s Spatial Analysis of Simple and Complex Hierarchical Patterns
Chapter 1 : General Introduction
64
CHAPTER 4. Spatial Analysis of Hierarchical Meaningful Patterns in Children with
Mental Retardation: Naming task and Drawing Task
Introduction
The aim of this research was to study spatial analysis abilities in children with Mental
Retardation (MR) in a naming task and a drawing task, using hierarchical meaningful
patterns. We expected that meaning would interact with the global precedence principle
advocated by Navon (1977), enhancing therefore a local analysis when meaning was
identified at the local level, not at the global level. Furthermore, we aimed at confirming a
major global bias in children with mental retardation, though some contradictory results exist
in the literature.
There are several studies in the literature that had investigated the perception of
hierarchical patterns in people with mental retardation. Some authors working with children
with William Syndrom (WS) reported that these children were more accurate in drawing the
local elements than they were in drawing the global shape (Bellugi et al., 2000; Rondan et al.,
2007; Nakamura, Mizuno, Douyuu, Matsumoto, Kumagai, Watanabe & Kakigi, 2009). Other
studies in children with Down Syndrome (DS) revealed that these individuals performed
better in drawing the global shape than the local elements (Birhle, et al., 1989; Bellugi et
al.,1990; Bellugi, Lichtenberger, Mills, Garaburda & Korenberg, 1999). Farran et al. (2003),
reported that individuals with WS showed local bias only in drawing and not in a perceptual
task requiring stimulus identification. They suggested that the local bias was not due to
perceptual processing but from difficulties in integrating the parts into a whole when
producing the drawing. This work was supported by Porter and Coltheart (2006), who
reported local advantage in the drawings of individuals with WS, while global advantage was
found in individuals with DS. These different findings showed that further investigation of
spatial analysis in hierarchical stimuli in children with mental retardation was needed.
A drawing task was used in this research since studies investigating the global-local
preference in a drawing task were scarce and showed contradictory results (Lange-Küttner,
2000; Dukette & Stiles, 2001; Vinter et al., 2010). According to Lange-Küttner (2000), most
children in younger ages (5 year-olds) tended to draw global shapes when they were asked to
copy hierarchical patterns, while older children (11 year-olds) produced correct drawings both
at the local and global level. A study by Dukette and Stiles (2001) with children aged 4 to 8
years and adults showed that the youngest children had more difficulties in reproducing the
global shape than the local elements if they drew under constrained task conditions (like
drawing from memory rather in copying condition), although they were able to attend to both
levels of analysis.
Chapter 4 : Spatial Analysis of Hierarchical Meaningful Patterns in Children with Mental Retardation
Chapter 3 : Children‘s Spatial Analysis of Simple and Complex Hierarchical Patterns
Chapter 1 : General Introduction
65
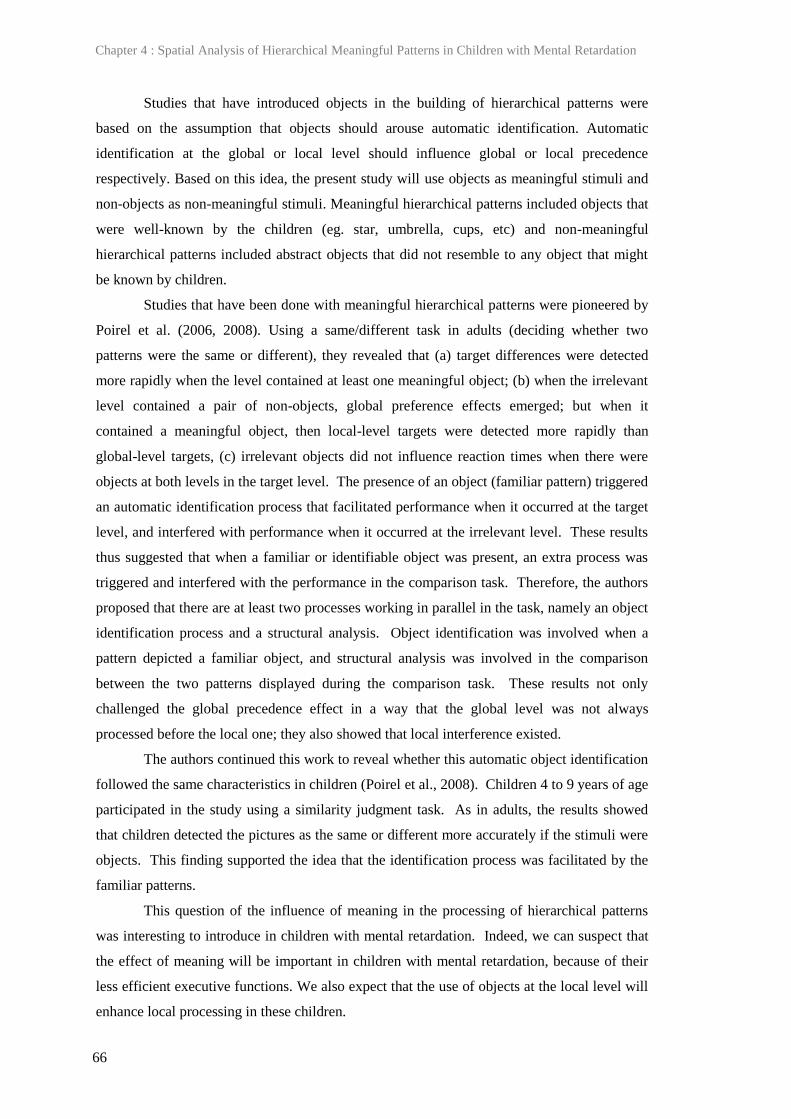
Studies that have introduced objects in the building of hierarchical patterns were
based on the assumption that objects should arouse automatic identification. Automatic
identification at the global or local level should influence global or local precedence
respectively. Based on this idea, the present study will use objects as meaningful stimuli and
non-objects as non-meaningful stimuli. Meaningful hierarchical patterns included objects that
were well-known by the children (eg. star, umbrella, cups, etc) and non-meaningful
hierarchical patterns included abstract objects that did not resemble to any object that might
be known by children.
Studies that have been done with meaningful hierarchical patterns were pioneered by
Poirel et al. (2006, 2008). Using a same/different task in adults (deciding whether two
patterns were the same or different), they revealed that (a) target differences were detected
more rapidly when the level contained at least one meaningful object; (b) when the irrelevant
level contained a pair of non-objects, global preference effects emerged; but when it
contained a meaningful object, then local-level targets were detected more rapidly than
global-level targets, (c) irrelevant objects did not influence reaction times when there were
objects at both levels in the target level. The presence of an object (familiar pattern) triggered
an automatic identification process that facilitated performance when it occurred at the target
level, and interfered with performance when it occurred at the irrelevant level. These results
thus suggested that when a familiar or identifiable object was present, an extra process was
triggered and interfered with the performance in the comparison task. Therefore, the authors
proposed that there are at least two processes working in parallel in the task, namely an object
identification process and a structural analysis. Object identification was involved when a
pattern depicted a familiar object, and structural analysis was involved in the comparison
between the two patterns displayed during the comparison task. These results not only
challenged the global precedence effect in a way that the global level was not always
processed before the local one; they also showed that local interference existed.
The authors continued this work to reveal whether this automatic object identification
followed the same characteristics in children (Poirel et al., 2008). Children 4 to 9 years of age
participated in the study using a similarity judgment task. As in adults, the results showed
that children detected the pictures as the same or different more accurately if the stimuli were
objects. This finding supported the idea that the identification process was facilitated by the
familiar patterns.
This question of the influence of meaning in the processing of hierarchical patterns
was interesting to introduce in children with mental retardation. Indeed, we can suspect that
the effect of meaning will be important in children with mental retardation, because of their
less efficient executive functions. We also expect that the use of objects at the local level will
enhance local processing in these children.
Chapter 4 : Spatial Analysis of Hierarchical Meaningful Patterns in Children with Mental Retardation
Chapter 3 : Children‘s Spatial Analysis of Simple and Complex Hierarchical Patterns
Chapter 1 : General Introduction
66

Thus, the objective of utilizing a naming task and a drawing task of hierarchical
patterns with meaningful and non-meaningful objects was to investigate whether the meaning
of objects at the local level would challenge the global advantage‘s tendency in children with
mental retardation.
Method
Participants.
Ninety-four children (36 girls) with mental retardation aged 6 to 14 years participated
in the experiment. They were divided into 3 groups of age (see table 5). There was no clear
information about the etiology of mental retardation for each child, but most of them showed
mental retardation due to organic causes. None of them had a William Syndrome, however.
Three groups of IQ were used in this experiment (see table 6). All participants attended
specific educational schools in Jakarta (Indonesia) and they were all monolingual Indonesian-
native speakers. Children came from families with low to middle-high socioeconomic status.
They were observed individually by an experimenter in a quiet room in their school. Informed
consent was obtained from parents of each child participating in the study.
Table 5. Age distribution of participants in the naming task
No Age group N M / F Mean SD Range
1 6-10 yrs 37 21 / 16 9 yr 4 mo 1 yr 3 mo 6 yr 5 mo-10 yr 11 mo
2 11-12 yrs 26 14 / 12 12 yr 0 mo 0 yr 6 mo 11 yr 0 mo-12 yr 11mo
3 13-14 yrs 31 23 / 8 13 yr 10 mo 0 yr 7 mo 13 yr 0 mo-14 yr 10 mo
Total 94 58 / 36
Table 6. IQ distribution of participants in the naming task
No IQ group N M / F Mean SD
1 50-60 37 24 / 13 54.13 4.00
2 61-65 31 20 / 11 62.96 1.30
3 66-70 26 14 / 12 68.34 1.85
Total 94 58 / 36
In the drawing task, some children (N = 8) did not participate because they felt that
they were not able to complete the task and they refused to be persuaded. Eighty-six children
aged between 6 and 14 years (33 girls) completed the drawing task. They were also divided
into three age groups (see table 7) and into three groups of IQ‘s as described in table 8.
Chapter 4 : Spatial Analysis of Hierarchical Meaningful Patterns in Children with Mental Retardation
Chapter 3 : Children‘s Spatial Analysis of Simple and Complex Hierarchical Patterns
Chapter 1 : General Introduction
67

Table 7. Age distribution of participants of the drawing task
No Age group N M / F Mean SD Range
1 6-10 yrs 35 20 / 15 9 yr 3 mo 1 yr 4 mo 6 yr 5 mo-10 yr 11 mo
2 11-12 yrs 23 11 / 12 11 yr 10 mo 0 yr 6 mo 11 yr 0 mo-12 yr 11mo
3 13-14 yrs 28 22 / 6 14 yr 0 mo 0 yr 7 mo 13 yr 0 mo-14 yr 10 mo
Total 86 53 / 33
Table 8. IQ distribution of participants of the drawing task
No IQ group N M / F Mean SD
1 50-60 34 22 / 12 54.38 4.07
2 61-65 29 19 / 10 62.96 1.32
3 66-70 23 12 / 11 68.56 1.82
Total 86 53 / 33
Material.
The hierarchical meaningful stimuli were built running a preliminary experiment.
Thirty-five children with MR aged 7 to 14 years were asked to name or identify 16 pictures
(Figure 32). Twelve object pictures were chosen from educational books for pre-school
children and also designed by us, and 4 non-object pictures were designed by us using the
object design from Microsoft-Word 2007. When children named the object correctly or
understood what the object was, explaining the use of the object, they got a score of 1 (0 for
incorrect response). They got a score of 0 if they could not explain or did not understand what
a non-object was and 1 if they confused the non-object with some object that they knew.
Figure 32. Pictures of objects and non-objects used in the preliminary experiment
Non-Object 1
Non-Object 2
Non-Object 3
Non-Object 4
Chapter 4 : Spatial Analysis of Hierarchical Meaningful Patterns in Children with Mental Retardation
Chapter 3 : Children‘s Spatial Analysis of Simple and Complex Hierarchical Patterns
Chapter 1 : General Introduction
68

Object pictures with the highest percentages of recognition were chosen as
meaningful stimuli, while the non-object pictures with the lowest percentages were chosen as
non-meaningful stimuli. Seven objects (boat, eyeglass, umbrella, cup, fork, star, and spoon)
had the highest percentages (88.57% to 97.14%) and 2 non objects (Non-Object 1 and Non-
Object 2) had the lowest percentages of recognition (11.43% and 5.72%).
Eight hierarchical stimuli were assessed to determine the validity of the task. The
global shape consisted of 40 local elements (Poirel, 2006). The designs were: 2 global shapes
of meaningful object with non-meaningful objects at the local level (global bias-induced
pattern); 2 global shapes of non-meaningful objects with meaningful objects at the local level
(local bias-induced pattern); 2 global shapes of meaningful object with meaningful objects at
the local level (competition-induced pattern) and 2 global shapes of non-meaningful objects
with non-meaningful objects at the local level (neutral pattern).
Six judges were involved in the validity phase. They gave ranks of suitability for
each stimulus whether it had the characteristic of ―wholeness‖. The ranking score extended
from 1 = not suitable at all to 5 = very suitable. The results showed that four hierarchical
stimuli had individually higher mean of ranking scores (range from 3.66 to 4.16) than the total
mean of ranking score (3.104). Those four hierarchical stimuli were utilized in the main
experiment (Figure 33).
Figure 33. Stimuli used in the main experiment
A. Global bias-induced pattern B. Local bias-induced pattern
C. Competition-induced pattern D. Neutral pattern
Chapter 4 : Spatial Analysis of Hierarchical Meaningful Patterns in Children with Mental Retardation
Chapter 3 : Children‘s Spatial Analysis of Simple and Complex Hierarchical Patterns
Chapter 1 : General Introduction
69

Procedure.
The four stimuli were presented to the children using a Power Point Presentation in
15 inch screen laptop. The local elements fit within rectangles of 1.26o height and 1.26
o width,
in terms of visual field, so the global shape, the hierarchical patterns were approximately
11.4o in width and 8.5
o in height.
In a short familiarization phase, the children were introduced to the instructions and
experimental conditions. They were instructed to identify the pattern they were being to see
on the screen and then ―to copy as accurately as possible the model which appeared on the
screen‖. They were told to concentrate their attention to the screen. One hierarchical pattern
was used in the familiarization phase (a triangle for the global shape and circles as local
elements) to train the participants with the instructions. The experimenter gave them one
sheet of paper (A4 format) and a black pencil, and asked them to sit comfortably at a distance
of about 60 cm from the screen. The participant‘s body midline corresponded to the middle
of the screen. There was no time constraint although the experimenter noted how much time
the children needed to finish every pattern. When the pattern on the screen was identified, the
children were instructed to draw the pattern. A further probing was applied by the
experimenter before the drawing task, if the children did not answer very clearly, especially
for the non-object patterns. As drawing was finished, the experimenter took away the
response paper and gave a new one to the participants. The experimenter waited for the
participant‘s readiness signal before displaying the next hierarchical stimulus.
Data Coding.
We proceeded to a close inspection of the entire set of data in the naming task and in
the drawing task. This enabled us to sort the responses into different categories as follows for
the naming task first :
Integrated response : Children named the local elements as well as the whole shape. Since
the patterns contained non-objects, a probing was needed, for the responses not being
confused with non-integrated responses. When children could not described clearly a non-
object but they mentioned the shape of this non-object, then the answer will be considered as
integrated response. The same condition applied if children named the non-object pattern
using the name of an object that resembled to the non-object pattern (eg. a boat made of little
stars for the local bias-induced pattern or a flag made of small shoes for the neutral pattern).
Non-integrated response : Children responded with objects which did not correspond to
the given pattern. For the non-objects, children‘s answer was considered as non-integrated if
Chapter 4 : Spatial Analysis of Hierarchical Meaningful Patterns in Children with Mental Retardation
Chapter 3 : Children‘s Spatial Analysis of Simple and Complex Hierarchical Patterns
Chapter 1 : General Introduction
70

they didn‘t answer at all or when they answered with objects which had very different
characteristics from the given pattern (eg. a ball for the local bias-induced pattern).
Global response : Global bias-induced pattern and competition-induced pattern which have
clear definition for the global response, did not need any further probing, but for the global
patterns which were non-objects (as in the case of local bias-induced pattern and neutral
pattern), a probing was needed. The experimenter asked children about the size of the pattern
and the number of patterns that they mentioned to determine whether it was a global response
or a local response (e.g. Consider children said ―star‖ for the local bias-induced pattern, then
the experimenter asked, ―is it a big star or a small star?‖ or ―how many stars do you see in the
picture?‖).
Local Response : As for the global responses, the patterns composed of clear small object
patterns were easy to categorize (as in local bias-induced pattern and competition-induced
pattern), but the non-object local figures needed further clarification. The experimenter again
asked about the size and the number of local elements that the children perceived in the
pattern to determine whether it was a global or a local response.
The drawings were also classified into 4 categories as illustrated in Figure 34. The
categories were:
Figure 34. Examples of drawings for data coding
Integrated (accurate)
Integrated (inaccurate)
Undifferentiated/ Syncretic
Global
Local
Chapter 4 : Spatial Analysis of Hierarchical Meaningful Patterns in Children with Mental Retardation
Chapter 3 : Children‘s Spatial Analysis of Simple and Complex Hierarchical Patterns
Chapter 1 : General Introduction
71

Integrated response: the global shape as well as the local elements was reproduced.
Accurate (good shape) and inaccurate (deformed) responses were not distinguished since we
were not interested in the accuracy of the reproduction of the local and global shapes, but in
their integration.
Undifferentiated/Syncretic response: neither the global shape nor the local elements were
reproduced and the responses were only scribbles of syncretic lines and curves.
Global response: global shapes were reproduced, but the local elements were absent.
Local response : a series of local elements were reproduced, but they were either isolated
or linked one to the other, yet forming only a part of the target, so that the global shape was
absent.
Two judges coded the drawings independently. The percentages of agreement
between the two judges were 86% for the integrated responses, 97.2% for the
undifferentiated/syncretic responses, 97.3% for global responses and 84.2% for the local
responses. Since there should only be one score for each hierarchical stimulus in the analysis,
the judges had to settle any disagreement in their scoring.
Results
C. Results from the naming task
The data were analyzed by using non-parametric tests because the assumption for the
homoscedasticity was not met in most of the cases. The Kruskal-Wallis test (H value) was
applied to test overall age differences, the Mann-Whitney test (U value) to test age and IQ
differences between two groups, the Friedman Anova test (F value) was used to test the
effects induced for the different patterns and the Wilcoxon signed-rank test (T value) was
employed to test differences between two patterns. Two analysis of the data were completed :
one taking age as the main independent factor, and one taking IQ as the main factor. They are
presented separately.
1. Analysis as a function of age
Figure 35 illustrated the overall responses of children across meaningful and non-
meaningful hierarchical patterns in the naming task as a function of age.
Chapter 4 : Spatial Analysis of Hierarchical Meaningful Patterns in Children with Mental Retardation
Chapter 3 : Children‘s Spatial Analysis of Simple and Complex Hierarchical Patterns
Chapter 1 : General Introduction
72

Figure 35. Percentages of responses (global, local, integrated and non-integrated) in the
naming task as a function of age
No significant effect of age was found in these responses (all ps >.10), despite the
tendency of global responses to decrease between 11-12 and 13-14 years of age and the
tendency of integrated response to increase during these ages. The frequency of these
responses differed significantly, F(N = 94, df = 3) = 79.68, p < .01. The global responses were
dominantly performed by the children with mental retardation (58.8%), followed by the local
responses (23.4%). The integrated responses and non-integrated responses remained at a low
level (9.6% for the integrated responses and 8.2% for the non-integrated responses),
A more detailed view of the data can be obtained by examining how the responses
evolved as a function of the type of patterns shown to children. These results are illustrated in
Figure 36.
Figure 36. Percentages of responses as a function of patterns and age in the naming task
Chapter 4 : Spatial Analysis of Hierarchical Meaningful Patterns in Children with Mental Retardation
Chapter 3 : Children‘s Spatial Analysis of Simple and Complex Hierarchical Patterns
Chapter 1 : General Introduction
73

Figure 36. (continued)
Figure 36A depicted the frequencies of the global responses across the patterns. No
significant age effects were found for the global bias-induced pattern, the local bias-induced
pattern, and the competition-induced pattern (all ps >.10). A marginally significant effect of
age only emerged for the neutral pattern, H(2, N = 94) = 5.30, p =.07, with the global responses
decreasing as age increased.
The differences of effects induced by the different patterns were also found
significant, F(N = 94, df = 3) = 17.04, p < .01. The global responses were more induced by the
global-bias pattern (68.1%) and neutral pattern (61.7%), while less global responses were
elicited by the competition-induced pattern (54.25%) and the local bias-induced pattern
(51.1%) although these frequencies of global responses remained high, compared to the other
responses.
A significant difference was also found between the global responses elicited by the
global bias-induced pattern and the local bias-induced pattern, T(N = 94) = 50, Z = 2.84, p < .01.
The global bias-induced pattern elicited more global responses (67.45%) than the local bias-
induced pattern (51.8%). This difference was mainly found at age 6-10 years, T(N = 37) = 6.5, Z
= 2.54, p < .05. A similar significant difference was found in the production of global
responses elicited by the global bias-induced pattern compared to the competition-induced
pattern, T(N = 94) = 44, Z = 2.84, p < .05. The global bias-induced pattern elicited more global
responses (67.45%) than the competition-induced pattern (54.5%). This difference was
significant in children aged 6-10 years, T(N = 37) = 0, Z = 2.36, p < .05.
The local responses as illustrated in Figure 36B, showed no significant age effects
across the different patterns (all ps > .10), but these frequencies differed significantly as a
function of the type of patterns, F(N = 37, df = 3) = 33.38, p < .01. The local responses were not
only more induced by the local bias-induced pattern, but also by the competition-induced
figure (both indicated that children gave local responses in 31.9% of the cases).
Chapter 4 : Spatial Analysis of Hierarchical Meaningful Patterns in Children with Mental Retardation
Chapter 3 : Children‘s Spatial Analysis of Simple and Complex Hierarchical Patterns
Chapter 1 : General Introduction
74

The local responses were more produced in face of the local bias-induced pattern
(31.9%) compared to the global bias-induced pattern (9.5%), T(N = 37) = 0, Z = 4.01, p < .01.
A similar result was found comparing the local responses induced by the competition-induced
pattern and the global–bias pattern, T(N = 37) = 12, Z = 3.84, p < .01. The competition-induced
figure elicited more local responses (31.9%) than the global bias-induced figure (9.5%).
The local-bias patterns induced more local responses (31.9%) than the neutral pattern
(20.2%), T(N = 37) = 40, Z = 2.21, p < .01. Thus, a local preference emerged when a
meaningful object was used at local level, although the global responses dominated most of
the responses in children with mental retardation.
The integrated responses illustrated in Figure 36C showed a significant age effect
when they were produced by the global bias-induced pattern, H(2, N = 94) = 6.38, p <.05. The
integrated responses were more frequent in older children (22.6%) than in the younger ones
(1.2%).
The non-integrated responses, shown in Figure 36D, were rare at all ages, and they
did not show any interesting effects as a function of age or patterns (all ps > .10).
2. Analysis as a function of IQ
The same analysis was applied grouping the data as a function of IQ, as illustrated in
Figure 37. Three groups of IQs were reported in the analysis. The first group was composed
of children with IQs (Wechsler scale) = 50-60 (henceforth called lower IQ-group), the second
group were made of children with IQs = 61-65 (henceforth called middle IQ-group) and the
third group included children with IQs = 66-70 (henceforth called higher IQ-group).
Children‘s responses grouped by IQs showed a dominance of global responses. A
significant effect of IQ was marginally found in the integrated responses, H(2, N = 94) = 5.27, p
=.071 and non-integrated responses, H(2, N = 94) = 5.38, p =.067. Children in the lower IQ-
group produced less integrated responses (4.3%) than children in the higher IQ-group
(17.3%).
Chapter 4 : Spatial Analysis of Hierarchical Meaningful Patterns in Children with Mental Retardation
Chapter 3 : Children‘s Spatial Analysis of Simple and Complex Hierarchical Patterns
Chapter 1 : General Introduction
75
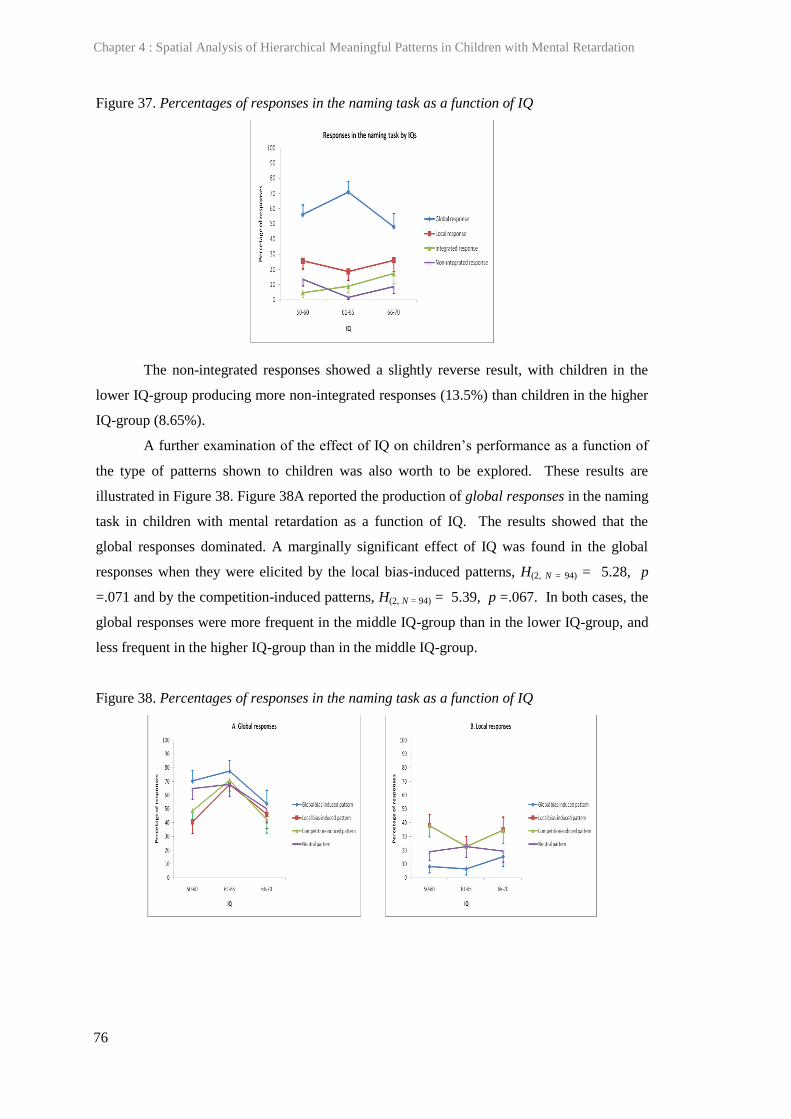
Figure 37. Percentages of responses in the naming task as a function of IQ
The non-integrated responses showed a slightly reverse result, with children in the
lower IQ-group producing more non-integrated responses (13.5%) than children in the higher
IQ-group (8.65%).
A further examination of the effect of IQ on children‘s performance as a function of
the type of patterns shown to children was also worth to be explored. These results are
illustrated in Figure 38. Figure 38A reported the production of global responses in the naming
task in children with mental retardation as a function of IQ. The results showed that the
global responses dominated. A marginally significant effect of IQ was found in the global
responses when they were elicited by the local bias-induced patterns, H(2, N = 94) = 5.28, p
=.071 and by the competition-induced patterns, H(2, N = 94) = 5.39, p =.067. In both cases, the
global responses were more frequent in the middle IQ-group than in the lower IQ-group, and
less frequent in the higher IQ-group than in the middle IQ-group.
Figure 38. Percentages of responses in the naming task as a function of IQ
Chapter 4 : Spatial Analysis of Hierarchical Meaningful Patterns in Children with Mental Retardation
Chapter 3 : Children‘s Spatial Analysis of Simple and Complex Hierarchical Patterns
Chapter 1 : General Introduction
76
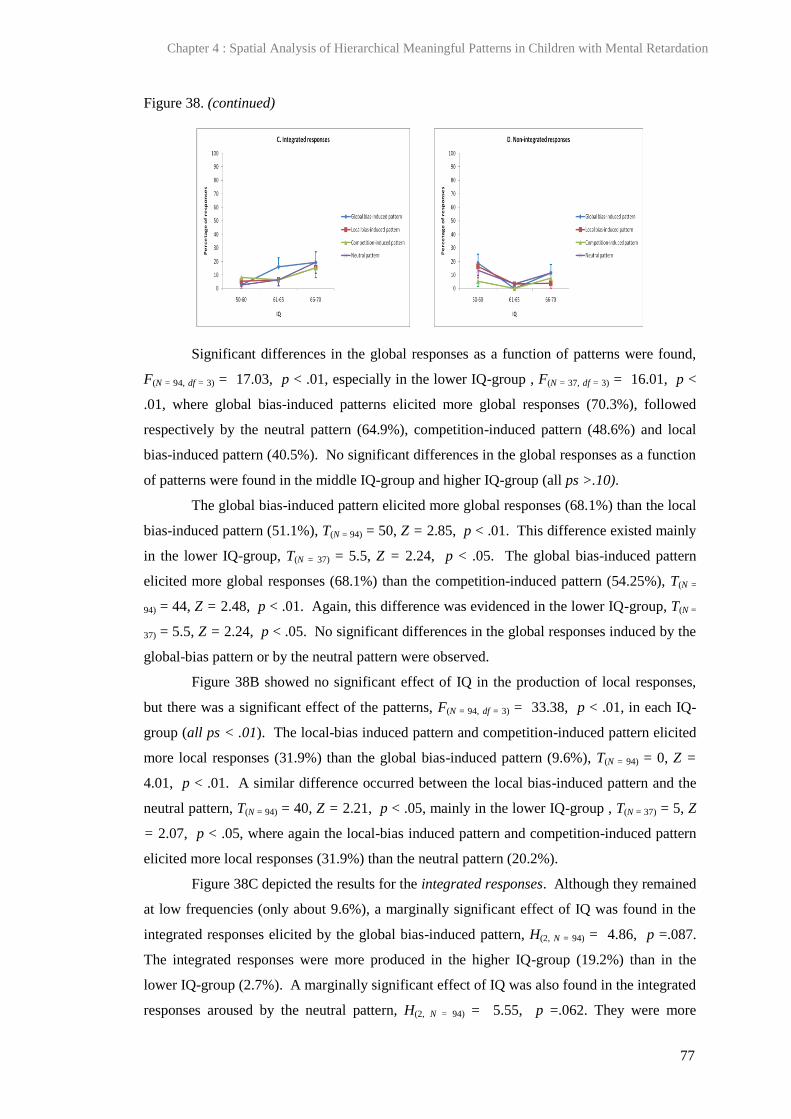
Figure 38. (continued)
Significant differences in the global responses as a function of patterns were found,
F(N = 94, df = 3) = 17.03, p < .01, especially in the lower IQ-group , F(N = 37, df = 3) = 16.01, p <
.01, where global bias-induced patterns elicited more global responses (70.3%), followed
respectively by the neutral pattern (64.9%), competition-induced pattern (48.6%) and local
bias-induced pattern (40.5%). No significant differences in the global responses as a function
of patterns were found in the middle IQ-group and higher IQ-group (all ps >.10).
The global bias-induced pattern elicited more global responses (68.1%) than the local
bias-induced pattern (51.1%), T(N = 94) = 50, Z = 2.85, p < .01. This difference existed mainly
in the lower IQ-group, T(N = 37) = 5.5, Z = 2.24, p < .05. The global bias-induced pattern
elicited more global responses (68.1%) than the competition-induced pattern (54.25%), T(N =
94) = 44, Z = 2.48, p < .01. Again, this difference was evidenced in the lower IQ-group, T(N =
37) = 5.5, Z = 2.24, p < .05. No significant differences in the global responses induced by the
global-bias pattern or by the neutral pattern were observed.
Figure 38B showed no significant effect of IQ in the production of local responses,
but there was a significant effect of the patterns, F(N = 94, df = 3) = 33.38, p < .01, in each IQ-
group (all ps < .01). The local-bias induced pattern and competition-induced pattern elicited
more local responses (31.9%) than the global bias-induced pattern (9.6%), T(N = 94) = 0, Z =
4.01, p < .01. A similar difference occurred between the local bias-induced pattern and the
neutral pattern, T(N = 94) = 40, Z = 2.21, p < .05, mainly in the lower IQ-group , T(N = 37) = 5, Z
= 2.07, p < .05, where again the local-bias induced pattern and competition-induced pattern
elicited more local responses (31.9%) than the neutral pattern (20.2%).
Figure 38C depicted the results for the integrated responses. Although they remained
at low frequencies (only about 9.6%), a marginally significant effect of IQ was found in the
integrated responses elicited by the global bias-induced pattern, H(2, N = 94) = 4.86, p =.087.
The integrated responses were more produced in the higher IQ-group (19.2%) than in the
lower IQ-group (2.7%). A marginally significant effect of IQ was also found in the integrated
responses aroused by the neutral pattern, H(2, N = 94) = 5.55, p =.062. They were more
Chapter 4 : Spatial Analysis of Hierarchical Meaningful Patterns in Children with Mental Retardation
Chapter 3 : Children‘s Spatial Analysis of Simple and Complex Hierarchical Patterns
Chapter 1 : General Introduction
77

produced by the children in the higher IQ-group (19.2%) than in the lower IQ-group (2.7%).
No significant effect of patterns was found in the production of integrated responses (all ps
>.10).
The non-integrated responses illustrated in Figure 38D showed a significant effect of
IQ for the global bias-induced pattern, H(2, N = 94) = 6.31, p < .05. The frequency of the
responses was lower in the higher IQ-group (11.5%) than in the lower IQ-group (18.9%).
In this study, sex was worth to be investigated since it was considered as a factor that
may contribute in children‘s perceptual analysis. However, no significant sex differences
emerged in the present experiment (all ps > .01), so no further analysis was reported in this
study.
D. Results from the Drawing Task
1. Analysis as a function of age
Figure 39 illustrated the responses of children across meaningful and non-meaningful
hierarchical patterns in the drawing task as a function of age.
Figure 39. Percentages of responses (global, local, integrated and non-integrated) in the
drawing task as a function of age
No effects of age were found for the different responses (all ps > .10) but the
interesting finding was the fact that the global responses were still dominant (56.7%) in the
drawing task as in the naming task, compared to the other responses.
The total-integrated responses tended to increase as age increased (15.7% in children
at younger ages and 27.7% in older ages), On the contrary, the undifferentiated/syncretic
response showed a tendency to decrease as age increased (10% in children at younger ages
Chapter 4 : Spatial Analysis of Hierarchical Meaningful Patterns in Children with Mental Retardation
Chapter 3 : Children‘s Spatial Analysis of Simple and Complex Hierarchical Patterns
Chapter 1 : General Introduction
78

and 4.5% at older ages), but no significant effect of age was found in both responses (all ps <
.01).
Sex had no significant effects on the drawing responses (all ps >.10), so it will not be
reported further in this study.
A more detailed examination of the data was needed in order to understand how these
responses developed as a function of the type of patterns. Figure 40 illustrated these results.
Figure 40. Percentage of responses as a function of patterns and age in the drawing task
The global responses depicted in Figure 40A showed no significant effect of age (all
ps > .10), but a significant effect of pattern was found, F(N = 86, df = 3) = 15.43, p < .01. The
global bias-induced pattern elicited more global responses (65.1%) than the local bias-induced
pattern (54.65%), T(N = 86) = 6, Z = 2.4, p <.05. It also elicited more global responses (65.1%)
than the competition-induced pattern (53.4%), T(N = 86) = 6.5, Z = 2.54, p <.05 and the neutral
pattern (53.5%), T(N = 86) = 0, Z = 2.80, p <.01.
Figure 40B illustrated the local responses. The competition-induced pattern elicited
more local responses (20.9%) compared to the neutral pattern (18.6%), to the global bias-
induced pattern (10.4%) and even to the local bias-induced pattern (16.3%), F(N = 86, df = 3) =
7.56, p < .05. However, considered separately, only the difference between the global bias-
Chapter 4 : Spatial Analysis of Hierarchical Meaningful Patterns in Children with Mental Retardation
Chapter 3 : Children‘s Spatial Analysis of Simple and Complex Hierarchical Patterns
Chapter 1 : General Introduction
79

induced pattern and the competition-induced pattern was significant, T(N = 86) = 24, Z = 2.04, p
< .05.
The integrated responses depicted by Figure 40C, showed no significant effect of
age. The differences as a function of patterns were not significant (all ps > .10), except in
children aged 11-12 years of age, F(N = 23, df = 3) = 8.57, p < .05. Children at these ages
produced more integrated responses when they were shown with the local bias-induced
pattern (30.4%) than the global bias-induced pattern (26.1%), the neutral pattern (17.4%) and
the competition-induced pattern (13%).
Figure 40D illustrated the undifferentiated/syncretic responses in function of age. No
significant results were found, whether they concerned age or patterns (all ps > .10). The
percentage of these responses remained low across ages and patterns (5.5%).
2. Analysis as a function of IQ
Figure 41 described the frequency of the drawing responses as a function of IQ.
Figure 41. Percentage of responses in the drawing task by IQs
Figure 41 illustrated the frequency of total-integrated responses, syncretic responses,
global responses and local responses as a function of IQ. Although the total-integrated
responses seemed to increase in the higher IQ-group, no significant results supported this
outcome. A significant IQ effect was only found for the syncretic responses, H(2, N = 86) = 9.73,
p < .01, the lower IQ-group performing more frequently these responses (14%) than the other
groups, since they disappeared with IQ increasing.
The global responses still dominated (56.7%) and they showed significant differences
with the other responses, F(N = 86, df = 3) = 54.42, p < .01. They were more frequent than the
local responses, T(N = 86) = 307.5, Z = 4.89, p <.01, the integrated responses, T(N = 86) = 694.5 ,
Chapter 4 : Spatial Analysis of Hierarchical Meaningful Patterns in Children with Mental Retardation
Chapter 3 : Children‘s Spatial Analysis of Simple and Complex Hierarchical Patterns
Chapter 1 : General Introduction
80

Z = 3.85, p <.01 and the syncretic responses, T(N = 86) = 147.5, Z = 5.73, p < .01. Figure 42
illustrated these data as a function of pattern.
Figure 42. Percentages of responses as a function of pattern and IQ in the drawing task
Figure 42A revealed that the global responses showed high percentages across all
patterns (56.7%), but significant differences as a result of the patterns shown to children was
found, F(N = 86, df = 3) = 15.43, p < .01. The global bias-induced pattern elicited more global
responses (65.1%) than the local bias-induced pattern (54.6%), T(N = 86) = 6, Z = 2.4, p < .05.
This difference was mainly found in the lower IQ-group, T(N = 34) = 0 , Z = 2.52, p < .05,
where the global responses attained 70.6% with the global bias-induced pattern and 47.05%
with the local bias-induced pattern. No effect of IQ yielded significant results (ps > .10).
Figure 42B illustrated the local responses. An effect of pattern was obtained, F(N = 86,
df = 3) = 7.56, p < .05. Surprisingly, the local responses were more induced by the competition
pattern (20.9%), followed by the neutral pattern (18.6%) and afterwards by the local bias-
induced figure (16.3%). No other significant results were found (all ps >.10).
The integrated responses as a function of pattern were shown in Figure 42C.
Significant effects of IQ were found for almost all patterns. Integrated responses elicited by
Chapter 4 : Spatial Analysis of Hierarchical Meaningful Patterns in Children with Mental Retardation
Chapter 3 : Children‘s Spatial Analysis of Simple and Complex Hierarchical Patterns
Chapter 1 : General Introduction
81

the global bias-induced pattern showed a significant effect of IQ, H(2, N = 86) = 7.52, p < .05,
with children in the higher IQ-group producing more integrated responses (39.1%) than the
children in the lower IQ-group (8.8%). A significant effect of IQ was also found for the
competition-induced pattern, H(2, N = 86) = 5.578, p < .05, and for the neutral pattern, H(2, N = 86)
= 6.49, p < .05 where again children in the higher IQ-group produced more integrated
responses than the children in the lower IQ-group. No differences between patterns appeared
(all ps > .10), which means that the use of meaningful or non-meaningful patterns might not
affect the integration of local and global processing in the children‘s drawing.
Figure 42D represents the syncretic responses as a function of patterns. No
significant effects of pattern were found (all ps > .10) but a significant effect of IQ was found
except for the responses elicited by the global bias-induced pattern. Syncretic responses
elicited by the competition-induced pattern and by the local bias-induced pattern, showed
significant result, H(2, N = 86) = 8.02, p < .05, where none of the children in the higher IQ-
group produced syncretic responses, while 14.7% of children in the lower IQ-group
performed these responses. Syncretic responses elicited by the neutral pattern also showed
significant result, H(2, N = 86) = 9.75, p < .01, where 17.64% children in the lower IQ-group
produced syncretic responses (17.64%) and none of the children in the higher IQ-group
produced it.
Discussion
The aim of the study was to analyze spatial analysis of hierarchical meaningful
stimuli in children with MR using a naming task and a drawing task. Previous studies with
meaningful stimuli showed that objects with meaning elicited an automatic identification
process and promoted a global/local bias depending on the level at which the meaning was
affected. Many studies in global/local processing that involved children with mental
retardation showed contradictory results (Birhle, et al., 1989; Nakamura et al., 2009, Bellugi
et al., 1990; Bellugi et al., 2000). By using hierarchical meaningful stimuli in a drawing task,
we aimed to investigate whether meaning would interfere with the global/local processing in
children with MR.
Four patterns were utilized in this study. The results showed that the global responses
dominated largely, not only for the global bias-induced pattern, but also for the other patterns
presented in the study. Even when global processing was clearly not enhanced by the pattern
(e.g. with the local bias-induced pattern), the global responses were still dominating. This
result fits with other findings, showing that children with mental retardation performed better
in drawing the global shape than the local elements (Birhle, 1989; Bellugi et al., 1990;
Bellugi et al., 2000).
Chapter 4 : Spatial Analysis of Hierarchical Meaningful Patterns in Children with Mental Retardation
Chapter 3 : Children‘s Spatial Analysis of Simple and Complex Hierarchical Patterns
Chapter 1 : General Introduction
82
In our experiment, age showed no effect in the naming task, neither in the drawing
task of meaningful hierarchical patterns. This result could be well understood since the
psychological development of children with mental retardation is more based on their mental
age rather than on chronological age as used in this study. On the other hand, IQ was found
significant in the production of non-integrated responses in the naming task and in the
production of undifferentiated/syncretic responses in the drawing task, these responses being
less frequent in the higher IQ-group than in the lower IQ-group. IQ also appeared significant
in the production of total-integrated responses (naming-task) and integrated responses
(drawing-task), where the integrated responses were more produced in the higher IQ-group.
These results are coherent with other findings concerning the involvement of cognitive
mechanisms in the perceptual analysis (Poirel et al, 2008; Singh & O‘Boyle, 2004)
Although the global responses dominated the childrens‘ responses as mentioned
before, our study found pattern‘s effects on the production of global and local responses. The
global bias-induced pattern and the neutral pattern elicited more global responses, both in the
naming task and drawing task, while the local responses were more elicited by the local bias-
induced pattern and the competition-induced figure. In the drawing task, the competition-
induced pattern elicited more local responses than the local bias-induced pattern. This result
supports the fact that local interference was manifest, because interference of local elements
with the global pattern was evidenced.
These findings are coherent with the work by Poirel et al (2006,2008) who suggested
that meaningful objects could elicit global or local preference depending on the level at which
they were assigned. Global preference occurred when the hierarchical pattern involved
meaningful objects at the global level (this corresponds to the global bias-induced pattern and
competition-induced pattern in our study) or when the pattern consisted of non-meaningful
objects at both the global level and local level (corresponding to the neutral pattern in this
study). On the other hand, local preference occurred when the meaningful objects were
designed as local components (corresponding to the local bias-induced pattern and
competition-induced pattern in our study).
Chapter 4 : Spatial Analysis of Hierarchical Meaningful Patterns in Children with Mental Retardation
Chapter 3 : Children‘s Spatial Analysis of Simple and Complex Hierarchical Patterns
Chapter 1 : General Introduction
83

CHAPTER 5. Global and Local Processing in Early Blind Children in a Naming and
Drawing Task2
Introduction
Much of the research conducted in the domain of haptic perception has compared
normal sighted, late blind, and early blind individuals in order to reveal the role of visual
experience and visual imagery in haptic perception (e.g., D‘Angiulli & Kennedy, 2001;
Norman, Norman, Clayton, Lianekhammy, & Zielke, 2004; Dulin & Serrière, 2009). These
studies have concentrated on comparing behavioral performances –for instance, naming
pictures in raised-line drawings (Heller, 2002; Heller, McCarthy, & Clark, 2005)- as well as
on comparative approaches to the neural substrates (Streri, Dion, & Mertz, 1996; James, Kim,
& Fisher, 2007) or comparisons of contextual or individual effects, such as gender effects
(Vecchi, 2001; Zuidhoek, Kappers, & Postma, 2007). Another interesting issue in the
comparison between haptic and visual perception relates to the respective roles of global and
local processing (Garner, 1974; Cook & Odom, 1988). Berger and Hatwell (1993) showed
that analytical strategies predominate over holistic strategies in haptic perception.
Developmental trends were also examined by Berger and Hatwell (1996) whose results
contradicted those obtained in visual studies. In visual perception, access to the local
dimensional structure takes longer and demands more attention than access to the global
structure and, consequently, occurs later in the course of information processing. In haptic
perception, in contrast, access to the global structure of the object should occur at a later stage
of processing. Indeed, the sequential local exploratory movements prevent blind people from
accessing global information, which therefore needs to be mentally reconstructed later by
combining and integrating the precise information gathered locally. This idea that global
processing develops later than local processing in haptic perception has found support in the
work of Lakatos and Marks (1999) who reported that the ability to distinguish between 3D
objects was increasingly based on local features as the exploration time decreased.
Consequently, at the developmental level, younger children should exhibit a local processing
bias in haptic perception, whereas a global bias should develop at older ages, a prediction that
has received support from a number of studies (Berger & Hatwell, 1996; Schellingerhout,
Smitsman, & Cox, 2005; Streri & Féron, 2005). To our knowledge, no previous
developmental study has as yet addressed this issue in blind individuals.
2 This chapter has been submitted for publication in Child Development. We
reproduced most part of this paper here.
Chapter 5 : Global and Local Processing in Early Blind Children
84
Furthermore, contradictory findings were reported by Norman et al. (2004) who
argued that both touch and vision are sensitive to an object‘s global or overall shape. Pinneau
and Streri (1990) found that 5-month-old infants are able to process haptically both the
contour of an object and its local features. In this study, the children seemed to prefer to use
the right hand (left hemisphere control) to discriminate features or local elements and the left
hand (right hemisphere control) for the global contour. Thus, the extent to which haptic
perception can inform individuals about both the global structure and the local organization of
an object is still uncertain.
The aim of the present study was to investigate this issue in haptic perception in blind
children by using hierarchical patterns of the type initially proposed by Navon (1977). Many
researchers have used hierarchical patterns in order to study visual perception in both adults
(e.g., Navon & Norman, 1983; Kimchi, 1988; Kramer, Ellenberg, Leonard, & Share, 1996;
Love, Rouder, & Wisniewski, 1999; Lamb & Yund, 2000; Davidoff, Fonteneau, & Fagot,
2008) and children (e.g., Dukette & Stiles, 1996; Tada & Stiles, 1996; Burack, Enns, Iarocci,
& Randolph, 2000; Kimchi, Hadad, Behrmann, & Palmer, 2005; Vinter, Puspitawati, & Witt,
2010). However, to our knowledge, only one study has focused on the haptic perception of
hierarchical patterns in early-blind (EB) and late-blind (LB) participants (Heller & Clyburn,
1993). These authors employed two types of hierarchical stimuli, i.e. large Braille patterns
(e.g., ―R‖) made up of smaller standard-size Braille letters (e.g., ―c‖s) and large geometrical
forms made of embossed dots. The participants were asked to name the explored shapes. The
results obtained with the compound Braille stimuli showed that the LB and EB adults mainly
gave local responses, although these responses were less frequent in LB (72.5%) than in EB
participants (93.8%). LB participants processed information both locally and globally in 25%
of cases, whereas none of the EB individuals did so. With the embossed geometrical patterns
made of dots, the LB individuals primarily produced local responses (55.5%) and gave global
responses at only a lower level (22.2%). By contrast, the EB individuals produced more
global (50%) than local responses (27.7%), while blindfolded sighted participants produced
integrated (both global and local) responses (61.1%), followed by global (16.6%) and local
responses (11.1%). This study demonstrated the interference produced during a tactile Braille
reading experience in EB individuals who had been asked to explore spatial patterns. It also
revealed the important role played by the material given to blind participants in enhancing
either local or global processing. However, only adults were tested and the question remains
as to whether EB children also produce predominantly global responses when required to
name hierarchical geometrical patterns. We considered this to be quite unlikely, considering
that the haptic system attributes a greater weight to local then global features during the initial
steps of processing (Lakatos & Marks, 1999).
Chapter 5 : Global and Local Processing in Early Blind Children
85

The present study is the first to investigate the issue of local and global processing
using tactile versions of Navon figures in a large corpus of EB children. We employed
consistent and inconsistent geometrical hierarchical stimuli in order to reveal potential
interference effects between the two types of processing, as has been observed in some
studies dealing with visual perception (Navon, 1977; Martin, 1979; Kimchi, 1988, 1992;
Mondloch, Geldart, Maurer, & de Schonen, 2003; Vinter et al, 2010). Indeed, the use of
inconsistent patterns enabled Vinter et al. (2010) to observe local-to-global interference in
young sighted children in a pattern similarity judgment task in which these young children
exhibited a clear local processing dominance. Thus, presenting inconsistent patterns should
enable us to observe whether EB children manifest interference effects in their haptic
perception in the same way that sighted children do in visual perception.
In order to investigate in depth the capacity of blind people to process information
locally and globally, we used both a naming task, as in Heller and Clyburn (1993), and a
drawing task. During haptic perception, humans base their classification of an object on its
various parts (Lederman & Klatzky, 1990, 1993; Klatzky, Lederman, & Mankinen, 2005;
Vinter & Chartrel, 2008). Haptic classification is initially based on separate dimensional
features, thus indicating analytical processing, before these local features are subsequently
integrated during a global processing stage (Berger & Hatwell, 1993, 1996). We therefore
expected children in the younger age groups to produce primarily local responses in the
naming task whereas the older children should produce either more global responses, as can
be predicted from the Heller and Clyburn‘s results, or more integrated responses. A drawing
task, which is associated with considerable planning and motor requirements (van Sommers,
1989), was used to reveal the extent to which the children were able to coordinate a global
and a local analysis of the patterns. Children may indeed attend to these two components
without, however, being able to coordinate them (Dukette & Stiles, 1996; Vinter & Marot,
2007; Vinter et al., 2010). The ability of blind people to draw was reported in 1939 when
Löwenfeld explored creativity in blind children. This ability was studied in more detail by
Kennedy and his colleagues (D‘Angiulli, Kennedy, & Heller, 1998, Kennedy, 2003; Kennedy
& Juricevic, 2003, D‘Angiulli, Miller, & Callaghan, 2008), who demonstrated that
congenitally blind individuals are able to produce contour line drawings that capture the
global shape of models. However, Vinter, Fernandes and Claudet (2009) reported that in
around half of the drawings of familiar objects collected from EB children aged between 6
and 14 years, the elements making up the whole depicted object were drawn in a disconnected
or juxtaposed way. This may indicate that blind individuals experience a specific difficulty in
integrating local elements to produce a global shape. We therefore expected young blind
children to mainly draw the local features of the patterns since only late in childhood would
they be able to integrate local and global information in their drawings. Finally, since gender
Chapter 5 : Global and Local Processing in Early Blind Children
86

may play a significant role in haptic perception in blind individuals (Vecchi, 2001), we
decided to include, as far as this was possible, an equal number of EB boys and girls. Vecchi
(2001) showed that blind females tended to develop less efficient strategies than blind males
when active processing was required in a complex task. This suggests that blind females
might process information differently from males when confronted with inconsistent
hierarchical patterns.
As revealed by the Heller and Clyburn study (1993), it is very likely that the material
used to build tactile versions of geometrical Navon figures greatly affects blind people's
ability to identify local or global components. We therefore ran a series of preliminary studies
in order to test different materials. The results of these pilot studies are worth reporting
because they provide important information about how to build tactile versions of Navon
figures, and also because they can account for some of the differences obtained in our main
experiment as well as in the Heller and Clyburn study (1993).
Pilot Studies
The stimuli tested in the first preliminary experiment were designed using Braille
characters that formed squares or circles as local elements. As can be seen in Figure 43A, the
standard-size Braille letters f, d, j and h were combined to form square local elements, while
Figure 43B illustrates how the Braille letters i, c, e, e, c, i were combined to form circular
local elements. There were 12 local elements in the overall global shape which was printed
with a Braille printer so that the size and the space between elements were standard in the
same way as in Braille text. The length of the sides of the square local elements was 1 cm x
1.25 cm (6.25 cm x 7.25 cm for the global shape). The diameter of the circular local elements
was 1.5 cm (10 cm for the global shape). Thirty EB children aged between 6 and 16 years
participated in this first preliminary study. There were 14 girls (mean age = 11.14 yrs, SD =
3.9) and 16 boys (mean age = 11.42 yrs, SD = 3.3). All the children involved in the pilot
studies came from the same institutions and presented the same types of etiologies as those
participating in the main experiment (see the method section). The children were asked to
accurately explore the patterns in order to name them. The results showed that all the
participants were puzzled by the patterns. Most of them (93.3%) perceived the Braille
characters (and in particular the combination of f, d, j and h), but none of them recognized the
global form or the local shapes. They therefore recognized the Braille material and used
exploratory Braille reading procedures just as they do when reading Braille. Furthermore,
because of the constraints linked to the use of a Braille printer, the density of elements was
not high in these patterns. This may have reinforced local processing, although the current
Chapter 5 : Global and Local Processing in Early Blind Children
87

literature is mute with regard to the possible role of elements density in haptic perception of
Navon‘s figures.
Figure 43. Examples of stimuli in the pilot studies
A. Stimuli made of the combination of Braille-letters f, d , j, h at the local level.
B. Stimuli made of the combination of Braille letters i, c, e, e, c, i, at the local level.
C. Stimuli made of
embossed dot-patterns at the local level.
D. Stimuli made of embossed line-pattern at the local level.
E. Stimuli made of embossed block-
patterns at the local level.
The second preliminary study used shapes made of embossed dots as described in the
Heller and Clyburn study (1993). The local elements used as stimuli had a diameter or side
length of 1 cm and were made up of small dots as illustrated in Figure 43C. The diameter or
side length of the global shape was 6 cm. The density of elements was increased in
comparison with the previous patterns. The square global shape consisted of 16 local elements
and the circular global shape of 14 local elements. The same participants as in the first
preliminary study were asked to identify the shapes three weeks after the previous pilot study.
62.5% of them failed to identify the shapes (either local or global) because of a difficulty in
perceiving an overall organization on the basis of a set of dots. 22.5% of the participants
detected the global shape by perceiving the outline of the figure, 5% identified the local
shapes and 10% identified both components.
In the third preliminary study, the thermoformed patterns were of the same size and
density as in the second study, but the dots were replaced by lines. The stimuli are illustrated
in Figure 43D. A number of studies of haptic perception have shown that blind children
explore the contours of 2D patterns in order to perceive shape (D‘Angiulli et al., 1998; Heller
et al, 2005; Lederman, Klatzky, Rennert-May, Lee, Ng, & Hamilton, 2008) and a line
configuration should enhance contour exploration. Thirty EB children, aged between 6 and 16
Chapter 5 : Global and Local Processing in Early Blind Children
88
years, took part in this third pilot study: 15 boys (mean age = 10.64 yrs, SD = 3.4) and 15
girls (mean age = 11.85, SD = 3.5). As expected, performance was better in this study: 37.5%
of the participants perceived both components in the patterns, 24.5% identified the local
shapes, while 15% correctly identified the global shape. Nevertheless, 23.3% still had
difficulty in identifying the shapes.
Since there were a large number of errors in this third preliminary experiment, we
decided to use a different design after listening to the participants' accounts in the debriefing
session during which they expressed the difficulties they experienced in perceiving a coherent
shape on the basis of lines interspersed with blank spaces. This finding mirrors the
observation made by Overvliet, Mayer, Smeets and Brenner (2008) that haptic searches are
more efficient when the stimuli are interpreted as consisting of fewer items. Consequently, in
the fourth preliminary study, the local elements consisted of block patterns instead of lines in
an attempt to reinforce the impression that the local elements constituted complete entities
(see Figure 1E). Another group of 30 blind children aged 6 to 16 years participated in the
fourth preliminary study, 14 girls (mean age = 12.02, SD = 3.22) and 16 boys (mean age =
11.46, SD = 2.4). The results revealed that only 2.6% of them gave erroneous identification
responses, 45% identified the two components, 18.3% the global shape only and 34.2% the
local elements only. This design using thermoformed block patterns was selected for use in
the main experiment since it appeared to be the one best suited to the haptic sensitivity of EB
children.
Method
Participants.
One hundred and ten blind children aged 6 to 18 years (50 girls, 60 boys) participated
in the experiment. They were totally blind or with minimal light perception (OMS categories:
4 and 5) from birth or early infancy under14 month-age. They were divided into five age
groups (see table 9). None of them participated in any earlier preliminary studies.
Table 9. Age distribution of EB participants in the naming task
No Age group N M / F Mean SD
1 6-8 15 10 / 5 7.5 0.88
2 9-10 23 7 / 16 9.11 0.47
3 11-12 20 12 / 8 11.11 0.53
4 13-15 24 16 / 8 14.4 0.93
5 16-18 28 15 / 13 17.6 0.88
Total 110 60 / 50
Chapter 5 : Global and Local Processing in Early Blind Children
89

Some of the children (N = 17) refused to draw the patterns because they did not feel
able to perform this task and wanted to avoid being placed in a difficult situation. The number
of participants who performed the drawing task was consequently lower than that reported
earlier. Ninety-three children aged between 6 and 18 years (40 girls, 53 boys) completed the
drawing task. They were also divided into five age groups (see table 10).
Table 10. Age distribution of EB participants who completed test performance in the
drawing task.
No Age group N M / F Mean SD
1 6-8 12 8 / 4 7.6 0.76
2 9-10 15 4 / 11 9.11 0.50
3 11-12 16 11 / 5 12.0 0.51
4 13-15 22 15 / 7 14.4 0.91
5 16-18 28 15 / 13 17.6 0.88
Total 93 53 / 40
None of these children performed drawing activities very frequently: around 20% of
them drew on an occasional or regular basis while 80% drew only rarely or infrequently. The
youngest children (6-8 years of age) were learning Braille, while those in the other age groups
regularly practiced Braille reading and writing.
All the participants were attending special schools for blind and visually impaired
children in six large cities in Indonesia (Jakarta, Bandung, Cimahi, Yogyakarta, Klaten and
Solo). None of them presented any associated disorders of relevance for our study, in
particular psychiatric, cognitive or neurological disorders. Indeed, they were all enrolled in
the school grade that corresponded to their age (none of them were educationally advanced or
retarded). Their blindness was due to congenital glaucoma, congenital cataract, Leber‘s
congenital amaurosis, retrolental fibroplasia, retinoblastoma, microphthalmia, optic nerve
atrophy, glioma, or anophtalmia. Most of the participants came from families with a medium
or low socioeconomic status. However, all the children from low socioeconomic status
families were living in school-organized hostels rather than with their families. The schools
which took part in the study were supported either by the Ministry of Social Services in
Indonesia or by other social organizations. Informed written consent was obtained from the
parents as well as from the directors of the hostels in the case of the children who lived there.
The experiment was conducted in accordance with the tenets of the World Medical
Association Declaration of Helsinki on Ethical Principles for Medical Research Involving
Human Subjects.
Chapter 5 : Global and Local Processing in Early Blind Children
90

Material.
Four hierarchical patterns printed as block patterns using thermoformed shapes were
employed (see Figure 1E) for the naming and drawing tasks. The consistent stimuli were a big
square made up of small squares and a big circle made up of small circles. The inconsistent
stimuli were a big square made up of small circles and a big circle made up of small squares.
The patterns were printed individually on A5 format cards. The length of the sides of the
square local elements was 1 cm, and the length of the side of the global shape was 6 cm. The
diameter of the circular local elements was 1 cm and that of the global shape was 6 cm. The
patterns consisted of 14 local circles and 16 local squares, respectively.
In the drawing task, the children were given a raised-line drawing kit. The drawings
were produced using ballpoint pen on plastic sheets (21 cm x 14.7 cm) placed on a rubberized
board. The pressure of the ballpoint pen on the plastic sheet produced a raised line, thus
making it possible to provide haptic feedback during drawing execution.
Procedure.
The experiment began with an initial familiarization phase. There were 4
familiarization stimuli (thermoformed shapes) which consisted of one big circle of 6 cm in
diameter, one big square with a side length of 6 cm, 5 randomly arranged small circles with a
diameter of 1 cm and 5 small squares with a side length of 1 cm, also arranged randomly. The
children were asked to name the shape of the explored patterns and, during the second part of
the familiarization phase, draw them as accurately as possible using the raised-line drawing
kit. Guidance was given by the experimenter if needed (guidance in moving the pen during
drawing, verbal guidance during the exploration and also the naming of the shape, especially
for the youngest children). During this familiarization phase, the experimenter made sure that
the children named the patterns of 6 cm diameter/side length ―big‖ and those of 1 cm
diameter/side length ―small‖. The experimenter allowed the children to practice drawing
circles and squares if they were not satisfied with their performance. It was during this
familiarization phase that the experimenter identified the children who refused to draw the
patterns. After the children had named and drawn the four stimuli once, the experimenter
tested the participants‘ understanding by presenting them with the four familiarization
patterns again, in a random order, and asking them to name the shape that they perceived
together with its size (i.e., big circle, small circles, big square, small squares). All the children
succeeded in this examination phase. The familiarization phase took between 20 and 30
minutes. Each child was tested individually in a quiet classroom.
The experimental phase involved a very similar procedure. The children were
comfortably seated at a table, and the experimenter placed the card on which the
thermoformed pattern was printed on the table at a location aligned with the midline of each
Chapter 5 : Global and Local Processing in Early Blind Children
91

child's body. The experimenter helped the children place their hands on the card and asked
them to explore the shape of the printed pattern accurately in order to name it using precise
terminology. The card was then removed and a second pattern was presented for naming. The
patterns were presented in a random order. The responses given by the children were recorded
by a second experimenter who could not see which pattern was placed in front of the child.
The naming task was followed by an interval of 10-15 minutes. The experimenter informed
the children who were willing to participate in the drawing task that they would now be
required to explore patterns accurately in order to be able to draw them. They were not
informed that the patterns were the same as those already explored in the naming task. The
cards were again placed on the table one at a time for exploration. When the children said that
they were ready to start drawing, the card was removed, the drawing material was placed at
the same location, and the experimenter asked the children to reproduce the pattern as
accurately as possible. The four stimuli were presented randomly, one at a time. No guidance
or feedback was given during the naming or drawing task. The order of the two tasks was
fixed. This was firstly due to the fact that during the familiarization phase, we had seen that
fewer children were willing to draw than to name the patterns, and secondly because the
literature reports that sketching explored line drawings facilitates their identification, thus
suggesting that drawing could have a subsequent positive effect on naming (Witjntjes, van
Lienen, Verstijnen, & Kappers, 2008).
Data Coding.
The verbal responses given by the children in the naming task were coded into four
categories as described below:
Integrated Response: The children correctly identified both the global and local shapes
and their integration, stating that the pattern was a big square made up of small
squares/circles, or a big circle made up of small circles/squares.
Global Response: The children correctly identified the global shape but did not mention
or describe the local elements. Once the response was provided, the experimenter
systematically asked ―is there anything else you can perceive in this pattern?‖. When the
identification response was global, some of the children said that there was a hole or a space
inside the square/circle, whereas others did not report perceiving anything else. When the
children did not spontaneously specify the size of the shape they perceived, the experimenter
systematically asked them: ―can you tell me about the size of the square/circle?‖. The
response was considered global when the children only mentioned a big square or circle, often
accompanied by finger movements tracing the outline of the global shape.
Chapter 5 : Global and Local Processing in Early Blind Children
92

Local Response: The children were able to name the local elements without noticing any
other shape resulting from the arrangement of these local elements. We used the same process
to categorize responses as local as is described above for the global responses. The response
was considered local when the children only reported perceiving small circles or small
squares.
Erroneous Response: In a very few cases, the children produced erroneous responses.
This response category was too rare to be analyzed further. In the case of consistent patterns,
4 children (one of 6 years of age, 1 aged 9 years, 2 aged 10 years) identified small squares
even though the pattern contained small circles or, in contrast, small circles when only small
squares were present. In the case of inconsistent patterns, 2 children (1 of 9 years of age, 1
aged 10 years) named a big circle after being presented with a big square made up of small
circles, or a big square after exploring a big circle made up of small squares. If such errors
had occurred more frequently it would have been interesting to analyze them because they
could reveal a phenomenon of diffusion from the local to the global level, as reported in
Vinter et al. (2010).
The results in the drawing task were sorted into 6 categories as described below and
illustrated in Figure 44. Two judges coded the drawings independently. The percentages
agreement between them was 89%. Disagreements were settled before data analysis.
Integrated Response. The children drew the overall global shape and the local elements in
a correctly integrated response. The sizes, number of elements, regularity of the distance
between elements, accuracy of the angles, were not coded, and neither was the accuracy of the
global or local shapes.
Partially Integrated Response. The local elements, partially integrated with the global
shape, were present in the drawing. The global shape was frequently left open, or only parts
of it were drawn. The local and global shapes were generally greatly distorted.
Global Response. The global shape was correctly reproduced as a continuous line and no
local elements were drawn. The size of the shape was unambiguously big, when compared to
the size of the patterns drawn by the children during the familiarization phase.
Local Response. The children reproduced a series of small circles or small squares and
the overall global shape was absent. The local elements were either randomly arranged or
sometimes drawn in lines. There were always at least three elements and these were clearly
small in size when compared to the drawings produced by the children during familiarization.
Non-integrated Response. The local elements were drawn juxtaposed with or
superimposed on the global shape.
Scribbled Response. The drawings were simply scribbled.
Chapter 5 : Global and Local Processing in Early Blind Children
93

Figure 44. Examples of children’s drawing based on the categorization in data coding
Chapter 5 : Global and Local Processing in Early Blind Children
94

Results
Non-parametric tests were used for the data analysis because homoscedasticity did
not apply in most cases. The Kruskal-Wallis test (H value) was employed to test overall age
differences, the Mann-Whitney test (U value) to test sex or age differences between two
groups, and the Wilcoxon signed-rank test (T value) to test differences relating to pattern
consistency.
A. Results from the naming task.
Figure 45 indicates the frequencies of integrated, global and local naming responses
as a function of age and pattern consistency. As shown in Figure 45A, the number of
integrated responses varied significantly across ages, H(4, N=110) = 30.1, p < .01, becoming
more frequent with increasing age. From 23% (SD = 37) at 6-8 years of age, the number of
such responses reached 48% (SD = 43) at 13-15 years of age and represented 81% (SD = 30)
of the responses given by the oldest adolescents. The transition that occurs between 9-10 and
13-15 years of age reached significance, U = 180.5, n1 = 23, n2 = 24, p < .05. Boys produced
integrated responses more often (M = 54%, SD = 44) than girls (M = 37%, SD = 42), U =
1179, n1 = 50, n2 = 60, p < .05, and this gender difference was more pronounced in the case
of inconsistent patterns (p = .03) than consistent patterns (p = .07). No significant effect of
pattern consistency appeared, T (N = 110) = 192, p > .50.
Figure 45. Percentage of responses in the naming task as a function of age and consistency
Chapter 5 : Global and Local Processing in Early Blind Children
95
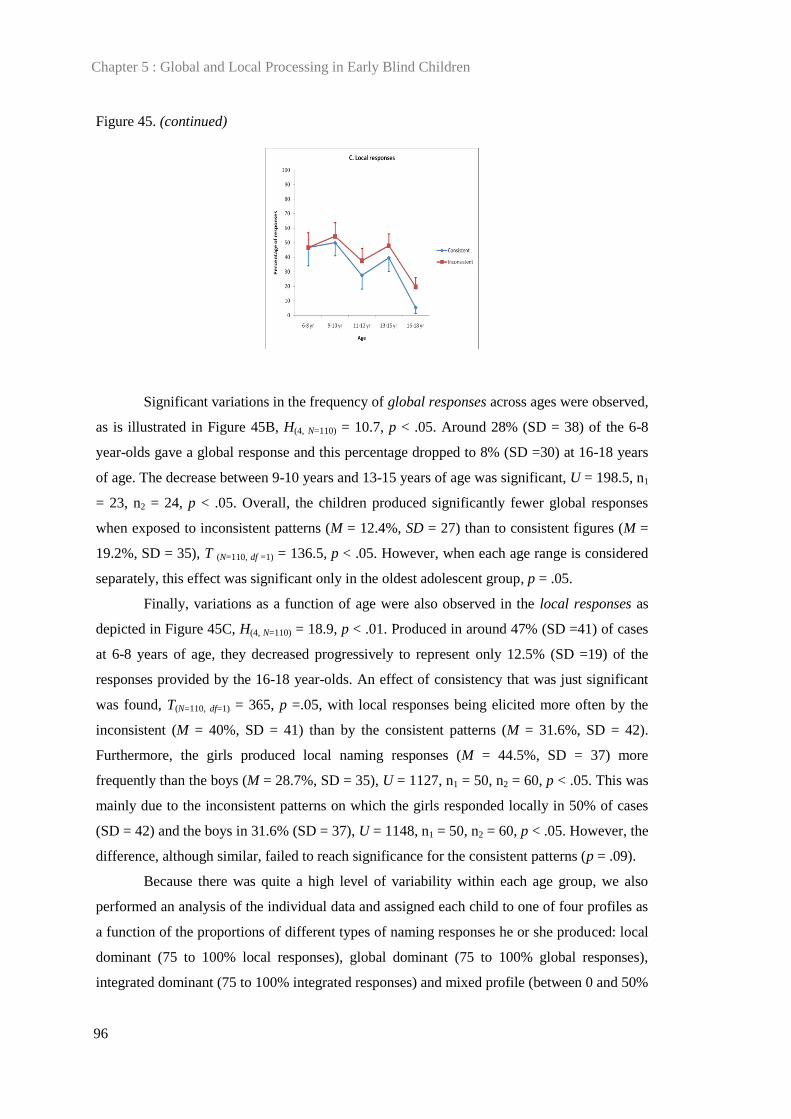
Figure 45. (continued)
Significant variations in the frequency of global responses across ages were observed,
as is illustrated in Figure 45B, H(4, N=110) = 10.7, p < .05. Around 28% (SD = 38) of the 6-8
year-olds gave a global response and this percentage dropped to 8% (SD =30) at 16-18 years
of age. The decrease between 9-10 years and 13-15 years of age was significant, U = 198.5, n1
= 23, n2 = 24, p < .05. Overall, the children produced significantly fewer global responses
when exposed to inconsistent patterns (M = 12.4%, SD = 27) than to consistent figures (M =
19.2%, SD = 35), T (N=110, df =1) = 136.5, p < .05. However, when each age range is considered
separately, this effect was significant only in the oldest adolescent group, p = .05.
Finally, variations as a function of age were also observed in the local responses as
depicted in Figure 45C, H(4, N=110) = 18.9, p < .01. Produced in around 47% (SD =41) of cases
at 6-8 years of age, they decreased progressively to represent only 12.5% (SD =19) of the
responses provided by the 16-18 year-olds. An effect of consistency that was just significant
was found, T(N=110, df=1) = 365, p =.05, with local responses being elicited more often by the
inconsistent (M = 40%, SD = 41) than by the consistent patterns (M = 31.6%, SD = 42).
Furthermore, the girls produced local naming responses (M = 44.5%, SD = 37) more
frequently than the boys (M = 28.7%, SD = 35), U = 1127, n1 = 50, n2 = 60, p < .05. This was
mainly due to the inconsistent patterns on which the girls responded locally in 50% of cases
(SD = 42) and the boys in 31.6% (SD = 37), U = 1148, n1 = 50, n2 = 60, p < .05. However, the
difference, although similar, failed to reach significance for the consistent patterns (p = .09).
Because there was quite a high level of variability within each age group, we also
performed an analysis of the individual data and assigned each child to one of four profiles as
a function of the proportions of different types of naming responses he or she produced: local
dominant (75 to 100% local responses), global dominant (75 to 100% global responses),
integrated dominant (75 to 100% integrated responses) and mixed profile (between 0 and 50%
Chapter 5 : Global and Local Processing in Early Blind Children
96

local and/or global and/or integrated responses). Table 11 indicates the assignment of the EB
children to these profiles as a function of their age.
Table 11. Distribution of the profiles in the naming task
Age group (yrs)
Local Global Integrated Mixed profile Total
6-8 7 (46,7%) 4 (26,6%) 3 (20%) 1 (6,7%) 15 9-10 10 (43,5%) 4 (17,4%) 4 (17,4%) 5 (21,7%) 23
11-12 5 (25%) 5 (25%) 8 (40%) 2 (20%) 20 13-15 8 (33,33%) 1 (4,2%) 11 (45,8%) 4 (16,66%) 24 16-18 0 (0%) 0 (0%) 21 (75%) 7 (25%) 28
Total 30 14 47 19 110
This table confirms the predominance of local processing in the youngest age groups.
More children in the first two age groups (6 to 10 years of age) exhibited a local profile (n =
17) than an integrated profile (n = 7), chi-square (1) = 6.1, p < .05, or a global profile (n = 8),
chi-square (1) = 4.83, p < .05. It was not until the period between 13 and 15 years of age that
the integrated profile (n = 11) predominated over the global one (n = 1), chi-square (1) = 11.1,
p < .01, and 16 to 18 years of age for the integrated profile (n = 21) to predominate over the
local profile (n = 0), chi-square (1) = 33.6, p < .01.
B. Results from the drawing task.
Figure 46 presents the frequencies of occurrence of the different response categories
obtained in the drawing task as a function of age and consistency.
Figure 46. Percentages of responses in the drawing task as a function of age and consistency
Chapter 5 : Global and Local Processing in Early Blind Children
97

Figure 46. (continued)
Significant differences between ages were obtained for the integrated responses
(Figure 46A), H(4, N=93) = 23.03, p < .01. None of the 6-8 year-olds drew integrated patterns,
while 48.4% (SD = 37) of the drawings produced by the 11-12 year-olds were integrated (U =
24, n1 = 12, n2 = 16, p < .01). This percentage then increased slowly to reach 62.5% (SD = 43)
at 16-18 years of age. Although there was a slight but constant tendency across ages for
inconsistent patterns to elicit integrated responses more frequently than consistent patterns,
the consistency effect did not reach significance, T(N = 93) = 77, p = .18. The occurrences of
partially integrated responses (Figure 46B) were, on average, very low (M = 3.2%, SD = 10)
and reached a maximum value of only 10% in the 11-12 year age group for the drawing of
consistent patterns. They did not vary as a function of age, consistency or gender (ps > .60).
The age-related change in the frequencies of global responses was more interesting as
far as the consistent patterns are concerned (Figure 46C). This type of response increased
significantly between 6-8 years (no occurrences) and 11-12 years of age (U = 66, n1 = 12, n2 =
16, p < .05), reaching 25% (SD = 40) in the latter group, before decreasing significantly up to
16-18 years of age (M = 7.1%, SD = 26), U = 172, n1 = 16, n2 = 28, p < .05. In the case of
inconsistent patterns, the age-related change in the global responses was much less clear,
Chapter 5 : Global and Local Processing in Early Blind Children
98

although the overall production of these responses did not differ significantly from that of the
consistent patterns, p > .50. No effect of gender was reported (p > .60).
Local responses (Figure 46D) were significantly more frequent (M = 30.1%, SD = 38)
than global ones (M = 11.5%, SD = 26), T(N = 93) = 244.5, p < .05, especially in the youngest
age group. Despite this, they did not vary significantly across ages, H(4, N = 93) = 3.3, p = .50.
The level of local responses was still 23.2 % at 16-18 years of age (SD = 35). Their decrease
between 6-8 years and 16-18 years of age in the presence of inconsistent patterns just failed to
reach significance (U = 120, n1 =12, n2 = 28, p = .07). The girls produced this type of drawing
more often (M = 45%, SD = 39) than the boys (M= 18.9%, SD = 33), U= 663, n1 = 53, n2 =
40, p < .01, in response to both the consistent (p = .01) and the inconsistent (p = .02) patterns.
No effect of consistency was found, T (N = 93)= 115, p = .12.
Non-integrated responses (Figure 46E) were produced only rarely (M = 2.4%, SD =
12), reaching a peak value of only 8.3% (SD = 26) at 9-10 years of age. Age, consistency and
gender all failed to induce any significant differences (ps > .20).
Finally, the frequency of scribbling responses (Figure 46F) varied significantly as a
function of age, H(4, N=93) = 36, p < .01, being quite frequent at 6-8 years of age (M = 50%, SD
= 46) and then declining abruptly to reach a low level of occurrence at 9-10 years of age (M =
6.7%, SD = 25), U= 37.5, n1 = 12, n2 = 15, p < .05. Boys produced more scribbles (M=15.1%,
SD = 34) than girls (M=1.9%, SD = 8.7), as the significant gender effect shows, U = 906.5, n1
= 53, n2 = 40, p < .05. No other significant differences were found (p > .20).
The children were considered individually and assigned to one of 6 different profiles
depending on their performance in the drawing task: scribbling dominant (we applied the
same criteria as in the naming task, 75 to 100% of scribbling responses), local dominant,
global dominant, integrated dominant, non-integrated dominant or mixed profile. The
assignment of the children to these profiles is indicated in Table 12.
Table 12: Distribution of the profiles in the drawing task
Age group (yrs)
Scribbling Local Global Integrated Non- integrated
Mixed profile
Total
6-8 5 (41,6%) 5 (41,6%) 0 (0%) 0 (0%) 0 (0%) 2 (16.7%) 12 9-10 1 (6,66%) 6 (40%) 2(13,33%) 3 (20%) 1(6,66%) 2 (13,33%) 15
11-12 0 (0%) 4 (25%) 2 (12.5%) 6 (37.5%) 0 (0%) 4 (25%) 16 13-15 1 (4,54%) 5 (22.7%) 1 (4.54%) 11 (50%) 0 (0%) 4 (18.2%) 22 16-18 0 (0%) 6 (21.4%) 2 (7.1%) 16 (57.1%) 0 (0%) 4 (14.3%) 28
Total 7 26 7 36 1 16 93
In the same way as for the naming task, this table confirms that more of the children
in the first two age groups exhibited local processing dominance (n = 11) than integrated
Chapter 5 : Global and Local Processing in Early Blind Children
99

processing dominance (n = 3), chi-square (1) = 7, p < .01. The level of dominance of these two
types of processing was reversed from 13-15 years of age onwards, chi-square (1) = 3.54, p =
.06. The fact that only a small number of children exhibited a global dominance profile in the
different age groups indicates that this response was quite infrequent.
Finally, we computed the Spearman-rank correlations between performance in the
naming and drawing tasks. To do this, we limited the number of participants considered in the
naming task to those who also drew the patterns. The 3 response categories that were common
to both tasks were considered. The children who produced integrated, global or local
responses in the naming task also tended to provide integrated (r = .50, p < .01), global (r =
.26, p < .05) or local (r = .29, p < .01) responses in the drawing task.
Discussion
The aim of the present study was to build tactile versions of Navon's geometrical
patterns in order to investigate the type of processing – local or global – that is predominant at
different ages in EB children and the age at which these visually disabled children are able to
integrate and coordinate the two types of information. To our knowledge, this study is the first
to adopt a developmental approach to the assessment of local and global processing in EB
children by using tactile Navon figures. We employed both a naming task, as in the Heller and
Clyburn study (1993) investigating EB and LB adults, and a drawing task as used in a small
number of studies involving sighted children (Dukette & Stiles, 2001; Lange-Küttner, 2000;
Vinter et al., 2010) or children with mental retardation (Birhle, Bellugi, Delis, & Marks,
1989; Farran, Jarrold, & Gathercole, 2003; Porter & Coltheart, 2006). The results yielded by
these two tasks were quite similar results across ages, as the significant inter-task correlations
attest. This finding confirms the validity of the drawing task as a way of addressing this issue,
even in blind individuals.
Indeed, the two tasks revealed that EB children mainly produced local responses at
ages of between 6 and 10 years and that the proportion of local responses decreased with age.
These findings were replicated when the data were analyzed at an individual level in which a
predominant processing profile was assigned to each participant. The initial dominance of
local processing appears to be consistent with the work conducted by Berger and Hatwell
(1996), who concluded that dimensional local relations organize haptic perceptual
classification in young sighted children. Similarly, Lakatos and Marks (1999) reported that
blindfolded sighted adults, who were asked to judge whether two objects were the same or
not, relied more heavily on local than on global features during the initial stages of haptic
exploration. In a study of blind individuals, Heller and Clyburn (1993) showed that adults
produced more local than global responses when required to name compound Braille stimuli.
Chapter 5 : Global and Local Processing in Early Blind Children
100

Our study extended this investigation to EB children, and confirmed the initial dominance of
local processing in haptic perception up to the age of around 10 years. It is worth pointing out
that when young sighted children are required to perform the visual exploration of
hierarchical patterns, they also display an initial bias toward local processing which, however,
continues until only about 6 years of age (e.g., Poirel, Mellet, Houdé, & Pineau, 2008; Vinter
et al., 2010). The protracted dominance of local processing in the development of EB children
is probably due to the sequential nature of the exploratory manual movements that are used by
blind people to process shapes and prevent fast access to the global shape. Access to the
global shape of unknown patterns requires highly developed mental capabilities for the
coordination and integration of information and these capabilities need time to develop.
In both the naming and the drawing task, the younger participants produced fewer
global than local responses. However, the fact that the latter type of response was still present
shows that young EB children can attend to both local and global information. At the age of
about 11-12 years, the frequencies of the two types of responses were quite similar before
decreasing in both tasks as the number of integrated responses increased. Unlike Heller and
Clyburn (1993) who reported that EB adults named the global shape more often than the local
elements when exploring embossed dot patterns, at no stage during our study did we observe
a predominance of global over local responses. Furthermore, the older children tended to
provide integrated rather than global responses in the naming task. These discrepancies
between our study and that conducted by Heller and Clyburn are very probably due to the
material used to build the tactile Navon patterns. Indeed, in our second pilot experiment in
which we used material identical to that employed by Heller and Clyburn (1993), EB children
again produced more global responses than local or integrated ones. The tactile versions of
the Navon figures employed in the present experiment were probably more similar to their
usual visual counterparts than those used in the Heller and Clyburn study (1993) or our first
three pilot studies because they reinforce the impression that the local elements are complete
entities and make it possible to interpret the tactile information as consisting of fewer items
(Overvliet et al., 2008).
In line with the fact that the global shape is harder to access during haptic exploration
our study confirms this ability emerges at a later stage of development. It is possible to argue
that the greater difficulty in accessing the global shape of tactile images experienced by EB
children is related to the way they explore the patterns. More specifically, the enclosure
procedure could be beneficial to global shape processing, while the encoding of local shape
information could be facilitated by the use of the contour-following procedure. However,
Lakatos and Marks (1999) noted that neither contour-following nor enclosure were associated
with a predominant emphasis on either local or global features when adults were required to
judge whether two haptically explored patterns were identical or not. This observation might,
Chapter 5 : Global and Local Processing in Early Blind Children
101

of course, be different in the case of children. However, our informal observations of how
children explored the Navon figures point to the same conclusion since our participants
always made use of enclosure and frequently had recourse to contour-following. This in no
way means that the procedure adopted for haptic exploration is of little relevance for shape
and object recognition, as has been clearly shown by Kalagher and Jones (2011) and
D‘Angiulli and Kennedy (2000, 2001). However, it does indicate that the enclosure and
contour-following procedures, which are suitable for the extraction of the properties of a
shape (Lederman & Klatzky, 1993), probably do not account for the dominance of one or
other type of processing, in the same way that oculomotor activity is possibly not sufficient to
account for local or global dominance in visual tasks. This suggests that the dominance of
local over global processing in haptic perception in EB children is probably due more to the
integrative steps involved in the processing of shapes and objects than to more peripheral
information gathering activities.
Absent in the drawing task and present at a low level in the naming task at 6-8 years
of age, the integrated responses increased with age. They became the predominant response
category as of 11-12 years of age in both tasks, thus demonstrating that the difficulty in
producing integrated responses was not due to specific graphic difficulties experienced by EB
children. The short period of training provided during the familiarization phase was efficient
enough to permit all the children who agreed to produce drawings to draw small and big
circles and squares (although often with considerable distortions). Although there were very
few non-integrated responses in which the local and global components were present but
juxtaposed, it is interesting to note that these occurred primarily at 9-10 years of age and
disappeared at 13-15 years of age. Young sighted children who were asked to copy similar
geometrical Navon figures also primarily produced local or non-integrated responses before
integrated responses became dominant at 6 years of age (Vinter et al., 2010). This suggests
that the development of local and global processing generally proceeds in the same way in
sighted and blind children and that there is a protracted period during which local processing
dominates in blind children, with the result that they exhibit a developmental lag when the
performances of the two populations are compared in a drawing task. The non-integrated
drawings may indicate difficulties in the understanding of part-whole relationships as certain
drawing studies have indicated (e.g., Tada & Stiles, 1996; Vinter & Marot, 2007). Indeed, a
recent study assessing the tactile functioning of children with congenital blindness reported
that items measuring the understanding of part-whole relationships were among those that
these children found difficult to master (Withagen, Vervloed, Janssen, Knoors, & Verhoeven,
2010).
In the present experiment, the EB children had to name and draw consistent and
inconsistent tactile Navon figures. A small number of significant effects relating to pattern
Chapter 5 : Global and Local Processing in Early Blind Children
102

consistency were observed in the naming task only. Local responses were more frequent for
inconsistent than consistent figures, while global responses occurred more frequently in the
case of consistent than inconsistent patterns. These findings may illustrate the use of a
hypothesis testing strategy as described by Alexander, Johnson and Schreiber (2002) in their
study of haptic exploration in children aged 4-9 years. These authors reported that whereas
children who had considerable knowledge of the explored object domain (dinosaurs)
identified the objects correctly, they also made more errors associated with the use of a
hypothesis testing strategy. Their identification of highly pertinent local features that they
knew to be critical for the identification of a specific type of dinosaur sometimes led them to
draw incorrect conclusions when asked to judge whether or not two dinosaurs were identical.
Instead of fully exploring the two models, these children displayed a confirmatory bias based
on the identification of distinctive local features. Perhaps the EB children in our study tended
to make the assumption that the pattern was unique when they perceived that the local
elements had the same shape as the global configuration. In contrast, when there was a
mismatch between the local shapes and the global configuration, the assumption was in favor
of the dominant local information. If this account is correct, it would suggest that the way
pattern consistency is manipulated differs greatly between haptic and visual exploration. It is
unlikely that interference effects would occur during haptic exploration, as they do in the
visual mode, because of the extended timecourse of global information processing in the
haptic mode. This would explain why we observed only a small number of erroneous
responses in the drawing task when compared to a similar experiment run with sighted
children (Vinter et al., 2010).
Finally, some differences between EB girls and boys were observed in the
experiment. In both the naming and drawing tasks, the girls produced local responses more
frequently than the boys. This result provides support for the findings reported by Steri et al.
(1996) which suggest that girls process haptic information analytically and discriminate
details, especially when employing the right hand. It is also consistent with developmental
models that suggest that the left hemisphere is favored early in girls (Collucia, Iosue, &
Brandimonte, 2007), as the left hemisphere has been found more efficient than the right one
for local information processing (e.g., Lamb, Robertson, & Knight, 1989). Furthermore, in the
naming task, the boys produced integrated responses more frequently than the girls. Vecchi
(2001) found that blind males developed more efficient strategies than females when active
processing was required in a complex task. The gender differences we observed might
primarily be due to similar differences in information processing strategies, with the boys
deploying more efficient strategies for the coordination of local and global information in
response to the more complex patterns (the inconsistent patterns). However, they may also be
due to more basic differences in haptic perception, given that Zuidhoek et al. (2007) found
Chapter 5 : Global and Local Processing in Early Blind Children
103

that males performed better than females in a variety of tasks assessing the haptic perception
of orientationDefining more precisely what may underlie the gender differences observed in
our experiment appears therefore delicate, and further research on this topic is needed for
clarification. The only gender difference that is coherent with the overall literature was
obtained in the drawing task, where the boys produced more scribbled drawings than the girls.
Many studies have revealed that girls achieve better performances than boys in tasks requiring
fine motor abilities (e.g., Fairweather, 1976; Kraft & Nickel, 1995).
In conclusion, it is important to recall that this experiment is the first to investigate
how EB children process local and global information in tactile Navon figures. For this
reason, we tested a large sample of children on the basis of two different tasks. Replications
will be needed in order to confirm our main finding that the development of local and global
processing seems to proceed in similar ways in sighted and EB children even though there is a
protracted period during which local processing dominates in blind children.
Chapter 5 : Global and Local Processing in Early Blind Children
104

GENERAL DISCUSSION & CONCLUSION

CHAPTER 6 : GENERAL DISCUSSION and CONCLUSION
The experiments that have been done in this study were aimed at understanding more
comprehensively the characteristics of children‘s perception, through their way to process
hierarchical patterns at a global and local level. These characteristics were revealed
employing different stimuli, different tasks and involving typical and atypical children in
order to examine which aspects marked the genuine milestones of children‘s development in
processing hierarchical patterns, and how these milestones can be sensitive to contextual
factors.
Since Navon (1977) introduced the concept of examining perceptual processes
through hierarchical patterns more than thirty years ago, a lot of research has been done in
this domain. The global/local advantage or global/local precedence effect refers to the
availability of one level of information before the other level (most authors studied the global
precedence effect because the global shape was generally found to be processed before the
local elements). The global/local interference effect refers to the disturbances of the global
shape or the local elements. Many results from previous studies suggested that the
identification of the global shape did not interfere with the disturbances of the local elements,
while the identification of the local elements was interfered by the identity of the global shape
(global interference effect). These Navon‘s terms were developed by other authors who
extended his work on global /local processing. One of them, commonly used, is global/local
preference which refers to the tendency to prefer one level of processing than the other level.
The term of global/local processing bias described the same phenomenon where the global
processing bias refers to the preference for the whole pattern and local processing bias
described the preference for detail-level information or preference for the local elements
(Farran et al., 2003; Johnson, Blaha, Houpt, & Townsend, 2010).
Our studies did not only concern the process of perception but also involved the
integration of the perceptual processes into the drawing ability. Studies on drawing behavior
showed that changes during development result from changes in the mental representations
used to plan behavior and in the capacity to manage part-whole relationships (Vinter, Picard
& Fernandes, 2008). Although a drawing task may be more complex than a perceptual task as
it needs additional requirements in terms of planning and motor demands (van Sommers,
1989), some studies confirmed that drawing hierarchical patterns constitutes a way to
approaching how children perceive these patterns (Feeney & Stiles, 1996; Bouaziz &
Magnan, 2007; Tada & Stiles, 1996; Dukette & Stiles, 1996).
However, these studies showed contradictory results because some authors suggested
that the whole object is segmented into parts in a similar way both in perception and drawing
Chapter 6 : General Discussion and Conclusion
105

tasks (Feeney & Stiles, 1996), while some others stated that depending on the children‘s age,
perceptual and drawing tasks may provide different results in terms of children‘s capacity to
segment a whole pattern (Bouaziz & Magnan, 2007). Farran and Cole (2008) supported also
this idea as their study proved that the cognitive demands of drawing and construction tasks
led participants to correctly perceive an image before reproducing it part by part until a
complete reproduction has been achieved, while the perceptual forced-choice task showed an
opposite result, with children tending to process the pattern from global to local. This
contradictory literature showed that it was worth including perceptual and drawing tasks in
our thesis in order to achieve a more comprehensive understanding about children‘s spatial
analysis of the hierarchical patterns.
In overall, we employed three kinds of tasks, which were a similarity judgment task, a
naming task and a drawing task. The similarity judgment task of hierarchical patterns was
first used by Kimchi & Palmer (1982). Goldmeier (1972) stated that similarity cannot always
be defined as partial identity, neither as identity of relational proportions because similarity is
often based on the singular whole qualities which determine the phenomenal appearance of a
figure. Thus, the similarity judgment task can illustrate the tendency to global and local
preference (as in the work of Farran and Cole, 2008) but is mute to the question of how one
process can be integrated with the other. In order to apprehend the integration question, we
introduced the drawing task that precisely necessitated that children combined a local and
global analysis of the patterns, since drawing task required planned behavior with the capacity
to manage part-whole relationships (Vinter et al, 2008). The naming task was more similar to
the drawing task than to the similarity-judgment task following this line of reasoning. Porter
and Coltheart (2006) used such a naming task to study global-local processing in atypical
developing children. We also employed this task with the two populations of atypical children
we have studied, children with mental retardation and blind children.
We suggest discussing our results in terms of global/local preference or advantage,
global/local interference and local-global integration with regard to the effect of age, stimuli,
duration and gender across typical and atypical developing children.
A. What about the age effect on local and global perception ?
Let‘s consider first the developmental trends evidenced in typically developing
children. Previous studies suggested that age matters in the processing the hierarchical
patterns, so children at various ages were involved in our experiments. Research with infants
(between 3 to 13 months of age) analyzed haptic abilities (Streri, 2002), eye fixations
(Colombo, Freeseman, Coldren, & Frick, 1995; Stoecker, Colombo, Frickm, & Allen, 1998)
and visual-evoked potentials (Norcia, Pei, Bonneh, Hou, Sampath, & Pettet, 2005). Face
Chapter 6 : General Discussion and Conclusion
106

stimuli were also used to reveal this global-local processing in babies (Schwarzer & Zauner,
2003). Research with children at older ages (from 3 to 14 years of age) utilized tasks more
similar to the ones used with adults. Similarity judgment tasks (Neiworth, Gleichman,
Olinick, & Lamp, 2006; Rondan et al., 2008; Poirel et al, 2008; Deruelle et al, 2006;
Mondloch et al, 2003, Faran & Cole, 2008), orientation judgment tasks (Stiles, Delis, & Tada,
1991), divided and selective attention tasks (Plaisted et al.,1999; Porporino et al, 2004),
naming or indicating tasks (Iarocci, Burack, Shore, & Mottron, 2006; Scherf, Behrman,
Kimchi, & Luna, 2009; Rinehart, Bradshaw, Moss, Brereton, & Tonge, 2000), matching
forced choice tasks (Harisson & Stiles, 2009, De Lillo, Spinozzi, Truppa, & Naylor, 2005;
Plaisted, Dobler, Bell, & Davis, 2006; Vinter et al, 2010) and drawing tasks (Stiles, Stern,
Appelbaum, Nass, Trauner, & Hesselink, 2008; Rondan et al, 2008; Abreu, French, Cowell,
& deSchonen, 2006; Faran & Cole, 2008; Vinter et al, 2010).
This body of research showed contradictory results. Some authors proposed that
children at younger ages attended to local information more than children at older ages
(Colombo et al., 1995; Kramer et al., 1996; Dukette & Stiles, 1996; Frick, Colombo, & Allen,
2000; Burack et al., 2000; Poirel et al., 2008) but some others showed the same global
precedence effect as in adults (Stoecker, Colombo, Frick, & Allen, 1998; Mondloch et al.,
2003) and still others proposed that children can attend to both the local and global level,
depending on contextual and task factors, the integration between the two levels of analysis
developing until late in adolescence (Kimchi et al., 2005; Schref et al., 2009). Our results
showed that local and global processing co-exist first without integration, this period being
accompanied by a dominance of local processing, and then when they start to be integrated,
this is accompanied by a global dominance effect.
Only Experiments 1 and 2 with typically developing children included children as
young as 3 years of age. Our results revealed that children at 3 years of age showed a
dominance of local performance, both in the similarity judgment task and in the drawing task.
These results confirmed that that local processing dominates the global one in young children
(Dukette & Stiles, 1996; Kramer et al., 1996; Poirel et al., 2008). Interestingly, the local
dominance period was associated with the demonstration of local to global interference, the
erroneous global responses in the drawing task being largely the most frequent errors, and
they occurred significantly more often with inconsistent figures. This association paralleled
the one shown in adults of global dominance with global to local interference effects.
However, if local processing dominated first, the drawing task showed that children as young
as 3 years of age actually attended to both the global and local level, but these modes of
spatial information processing operated independently, as if they did not refer to a unique
entity, as shown by the high percentages of non-integrated responses. If we assume that
global processing tends to rely on the right hemisphere and local processing on the left
Chapter 6 : General Discussion and Conclusion
107

hemisphere (e.g., Moses et al., 2002), this independent functioning may be a consequence of
the still immature interhemispheric communication in the integration of visual information. It
is indeed only at around 2 years of age that processing from the two hemispheres starts to be
coordinated (Liegeois, Bentejac, & de Schonen, 2000).
After 3 years of age, an important change occurred as testified by the results obtained
in the similarity judgment task with global processing preference emerging at 4 years of age
and these responses increasing as children get older. It can be said that when children had to
decide whether a compound figure bore more similarity with its global shape or with an
arrangement made of its local elements, they tended to select more and more often the global
shape and less and less often the local elements as age progressed. These tendencies were
found across different stimuli (consistent vs inconsistent and simple vs complex),
independently also to the duration of exposure of the targets. Note that the complexity of the
figures tended to reinforce this global processing preference, as could be seen when the
results from the two first experiments are compared with those of Experiments 3 and 4.
Indeed, the patterns used in the two first experiments are even simpler than the so-called
―simple‖ patterns employed in Experiments 3 and 4. And our results showed that global
processing preference was on average higher in these two last experiments. The same trend
emerged in the drawing task, since the global responses were produced at a quite high level in
Experiment 3 when compared to Experiment 2. However, the tendency of the two levels of
perceptual analysis to operate independently was still evidenced in children at 4 years of age,
as revealed by the frame-part analysis in the drawing task (Experiment 3) that showed more
part-absent and frame-absent responses at this age.
Note that this schema of two levels of analysis, independent, with the local level
stronger in a first step (3-4 years), and then the global level increasing (4-5 yrs), may seem in
contradiction with the results obtained in Experiment 3 (drawing task), concerning the frame-
part analysis. Indeed these results suggest that the frame-correct analysis develops earlier and
faster than the part-correct analysis. It is important to point out that these results cannot be
compared directly to those obtained in the perceptual task. Drawing correctly the frame in
Experiment 3 means drawing a square, while drawing correctly the parts means drawing
crossed lines, obliques or triangles, that is figures more complex to reproduce. The sensitivity
of part-correct analysis to the duration of exposure of the targets, and not of the frame-part
analysis, is coherent with this suggestion of higher complexity of the former as compared to
the later.
To continue with development, our results indicate that once global processing
preference emerged (as revealed by the similarity judgment task), the integration between the
two levels of perceptual analysis developed (as revealed by the drawing task). Indeed, in
Experiment 1 and 3, the integrated responses, either correct or inaccurate, developed rapidly
Chapter 6 : General Discussion and Conclusion
108

between 4 and 5 years of age. At 5 years of age, children produced correct integrated
responses in about 70% of the cases, and these responses characterized almost 100% of the
drawing production at 9 years of age. Furthermore, none of these 9 years-old children
displayed any more non-integrated responses or partial or absent responses. These
developmental changes in the integration between the global and local processing were
significantly confirmed across stimuli (consistent vs inconsistent, simple vs. complex).
Do these developmental trends also characterize the atypically developing children
studied in our thesis? Of course, the comparison cannot be direct between these populations,
mainly because only the drawing task was common to all studies. Instead of a similarity
judgment task, relevant to reveal processing preferences, we adopted a naming task with the
blind children and those with mental retardation. The naming task does not indicate directly
processing preferences. It is closer to the drawing task, requiring integration between the two
levels of processing, without the procedural constraints linked to drawing in se. Furthermore,
we did not include children as young as 3 to 5 years of age in the blind study and the mental
retardation study, thus limiting our comprehension of early development in these atypical
populations.
Keeping in mind these limits, the answer to the question of knowing whether
development proceeds similarly to what was observed in typically developing children is
―yes‖ for what concerns the blind children, although large differences appeared with regard to
the ages of the main milestones. We noted that local processing, enhanced by haptic
perception, decreased as age increased, as well as global processing, to the benefit of
integrated responses. This was observed as well in the naming as in the drawing task.
However, there was a clear protracted period of local processing dominance in blind children.
The protracted dominance of local processing in the development of blind children is
certainly due to the sequential nature of the exploratory manual movements that are used by
blind people to process shapes and prevent fast access to the global shape. Access to the
global shape of unknown patterns requires highly developed mental capabilities for the
coordination and integration of information and these capabilities need time to develop. At the
age of about 11-12 years, the frequencies of global and local responses were quite similar
(thus proved that EB children can attend to both local and global information) before
decreasing in both tasks as the number of integrated responses increased in children at older
ages. The integrated responses became the predominant response category at 11-12 years of
age in both tasks, thus demonstrating that the difficulty in producing integrated responses was
not due to specific graphic difficulties experienced by EB children. Although there were very
few non-integrated responses in which the local and global components were present but
juxtaposed, it is interesting to note that these occurred primarily at 9-10 years of age, that is
Chapter 6 : General Discussion and Conclusion
109

just before the integrated responses became more frequent than the local responses, and they
disappeared at 13-15 years of age.
By contrast, the study with children with mental retardation did not provide results as
clear as those with blind children with respect to development. Global processing dominance
characterized these children with intellectual impairment whatever the age, the task, and the
type of pattern (even the local bias-induced pattern elicited on average more global responses). This
result fits with other findings, showing that children with mental retardation performed better in
drawing the global shape than the local elements (Bellugi et al, 1990; Bellugi et al., 2000,
Porter & Coltheart, 2006). Only one age effect was significant in the naming task: when
children were exposed to the global-bias induced pattern, the integrated responses were more
frequent in older children than in the younger ones. Although this age effect goes in the
―good‖ direction (increase of integrated responses as age increases), it seems too isolated to
be meaningful. One can argue that this result could be expected since the psychological
development of children with mental retardation is more based on their mental age than on
their chronological age. Indeed, we found more significant IQ effects in our study. The non-
integrated responses (naming task) and the syncretic responses (drawing task) were less
frequent in the higher IQ-group than in the lower IQ-group. Inversely, the production of total-
integrated responses in the naming-task and of integrated responses in the drawing task was
larger in the higher IQ-group than in the lower IQ-group. These results are coherent with
findings concerning the involvement of cognitive mechanisms in the perceptual analysis
(Poirel et al, 2008; Singh & O‘Boyle, 2004).
However, these results tended to indicate that between 6-10 and 13-14 years of age,
there is almost no development of perceptual analysis in these children with mental handicap.
In one way, we could say that this demonstrates that children with mental retardation do not
differ from typically developing individuals: they display a large global preference effect.
This is what Dulaney, Marks and Devine (1994) concluded in their own study. However, the
absence of significant evolution in the range of ages we studied continues to borrow us3.
3 We decided to run other analyses that were lacking in Chapter 4, testing for age effects inside each
IQ group, despite that the distribution of the participants across ages was not regular. The higher IQ
group included 7 children aged 6-10 years, 8 aged 11-12 years and 11 aged 13-14 years in the naming
task, 7/7/9 in the drawing task. The lower IQ group included 20/7/10 children in the naming task,
19/6/9 in the drawing task. No age effects emerged in the low IQ group, whether the production of
local, global and integrated responses were considered in the naming or drawing task (all ps >.50). The
results were a little bit more positive with the higher IQ group, but only at a descriptive level. The
global responses decreased between 11-12 and 13-14 years of age and the integrated responses
increased in the same period, in the naming and drawing tasks, but the differences failed to reach
significance (ps > .20). It is nevertheless encouraging, because the low number of participants par age
group may be the reason why statistical significance was not reached.
Chapter 6 : General Discussion and Conclusion
110

The literature is not clear about the precise reason why people with mental retardation display
this large global dominance effect. What seems clear is that the way visual information is
processed in people with mental retardation is affected as compared to normally developing
people, and also as compared to individuals with William Syndrome. Indeed, Bellugi et al.
(1999) reported that the functioning of both the ventral and dorsal visual systems is affected
in adults with Down Syndrome.
Let‘s see now to what extent these trends in local-global processing could be affected
by different contextual factors.
B. Contextual effects on local and global processing
Our studies demonstrated that local and global processing in children were sensitive
to contextual effects, as also revealed in the literature (Prather & Bacon, 1986; Kinchla &
Wolfe, 1979; Grice, Canham, & Boroughs, 1983; Pomerantz, 1983; Kimchi, 1988; Sanocki,
1993; Weber et al., 2000; Ninose & Gyoba, 2003). We tested two types of contextual effects:
effects related to pattern properties (consistency, complexity, meaningfulness, duration) and
effects related to gender.
Effects of different pattern properties
We investigated the effect of consistency of the hierarchical patterns in the two first
experiments. The use of consistent and inconsistent stimuli had its roots in Navon‘s
experiment (1977) with compound letter stimuli, followed by other studies using other forms
of hierarchical patterns as geometrical or numerical patterns (Kimchi, 1992; Han & Xiao,
1999; Tanaka, Onoe, Tsukada & Fujita, 2001; Mondloch et al., 2003; Kimchi et al., 2005;
Vinter et al., 2010). The pattern is defined as consistent when the global and local levels are
matched and the pattern is considered as inconsistent when the global and local levels do not
match. The aim of introducing consistent and inconsistent stimuli is to reveal interference
effects between global and local processing. Global interference refers to the reaction time
delay for local identification caused by the inconsistency at the global level. Local
interference refers to the reaction time delay for global identification caused by the
inconsistency at the local level. Previous studies suggested that these interferences are
modulated, in part, by interhemispheric transfer (Robertson et al.1993; Weissman & Banich
1999; Christman, 2001). These interference effects were worth investigating in children, in
particular in young children who still have immature interhemispheric communication (Moses
et al., 2002). Consistent and inconsistent haptic hierarchical patterns were also introduced to
the early blind children with the same objective as in typical developing children.
Chapter 6 : General Discussion and Conclusion
111

In relation to the similarity-judgment task, our study found that the consistent stimuli
elicited more global responses at young ages in typically developing children. Typically
developing children produced more integrated responses in face of consistent than
inconsistent patterns in a drawing task. These two effects are in line with the literature and
suggest that pattern consistency reinforces global processing dominance and facilitated the
integration with local processing. Coherently, the inconsistent patterns elicited an increase of
inaccurate integrated drawings. If we assume that these patterns required more effortful
processing, interference effects between local and global processing could be enhanced by
these patterns, leading to less accurate reproduction of each level. More interestingly,
inconsistent patterns elicited erroneous global responses in the similarity judgment task at 3
years of age, this result evidencing an apparently reverse interference effect with regard to the
one reported in adults. Indeed, adults were shown to be subject to interference effects
revealing diffusion from the global (dominant level) to the local level in the face of
inconsistent patterns (Kimchi, 1988; Martin, 1979; Navon, 1977), while in our results,
children‘s errors at 3 years of age revealed diffusion from the local (dominant level) to the
global level. In our view, the opposition between the adults‘ results and the young children‘s
results (global to local versus local to global interference) is only apparent because in the two
cases, there is interference from the dominant to the non dominant level of analysis. The
errors demonstrated by older children in the drawing task in face of inconsistent patterns
(erroneous local responses) confirmed this analysis. Indeed, insofar as erroneous local
responses to inconsistent targets revealed global to local diffusion, this effect emerged only on
average across ages, congruent with the fact that on average, global processing dominated
over local processing.
Consistency appears to have some effect also in haptic perception of hierarchical
patterns. Consistent patterns induced more global responses in a naming task from early blind
children, while more local responses were reported in case of inconsistent patterns. We have
suggested that these findings may illustrate the use of a hypothesis testing strategy as
described by Alexander, Johnson and Schreiber (2002) in their study of haptic exploration in
children aged 4-9 years. Perhaps, EB children in our study tended to make the assumption that
the pattern was unique when they perceived that the local elements had the same shape as the
global configuration. In contrast, when there was a mismatch between the local shapes and the
global configuration, the assumption was in favor of the dominant local information. If this
account is correct, it would suggest that the way pattern consistency is manipulated differs
greatly between haptic and visual exploration. It is unlikely that interference effects would
occur during haptic exploration, as they do in the visual mode, because of the extended time
course of global information processing in the haptic mode.
Chapter 6 : General Discussion and Conclusion
112

The second pattern property that was investigated in this thesis was related to the
potential effect of pattern complexity with regard to global-local processing. We must
recognize that we did not have a lot of expectations about the effect of this factor, due to the
lack of corresponding studies in the literature. Our intuition was that the more complex the
pattern was, the stronger global processing should be. Our results confirmed partially this
intuition. In the similarity judgment task, more global responses were indeed provided in face
of complex patterns but only by the younger children aged below 8 years. The reverse result
emerged in the older children, with more global responses in face of simple patterns. The
results from the drawing task pointed also to an opposition between younger and older
children. More part-correct responses were obtained in face of simple patterns at younger
ages, while in older children, the complex patterns did elicit better part-correct analysis.
Young children produced also more partial responses in face of complex than simple patterns.
Taking together, these results may suggest that complexity drew attention to the parts in the
older children, enhancing a correct part analysis and diminishing slightly global dominance.
In younger children, complexity acted negatively on part analysis, thus enhancing global
dominance.
The third pattern property investigated in our experiments concerned the
meaningfulness of the shapes located at the global or local level in hierarchical patterns.
Previous studies that have introduced objects in the building of hierarchical patterns,
suggested that objects should arouse automatic identification. Automatic identification at the
global or local level should influence global or local precedence respectively (Poirel et al.,
2006, 2008). These authors proposed that introducing objects at global or local level should
not only challenged the global precedence effect in a way that the global level should not
always be processed before the local one (depending on which level the meaningful objects
were located), but they also showed that local interference existed. Their results confirmed
that the presence of an object (familiar pattern) triggered an automatic identification process
that facilitated performance when it occurred at the target level, and interfered with
performance when it occurred at the irrelevant level. Our aims were similar to those suggested
by Poirel et al. (2006, 2008) in using meaningful (familiar object) and non-meaningful (non-
object) stimuli at both the global and/or local level in a naming task and a drawing task
administered to children with mental retardation. Previous studies indicated that children with
mental retardation showed global bias in attention with difficulties in processing at the local
level (Birhle et al., 1989; Porter & Coltheart, 2006). By introducing meaningful objects at the
local level, we expected to enhance local analysis in children with mental retardation.
Our results showed that global processing dominated the children‘s responses both in
the naming and drawing tasks. This was not particularly reinforced by the presence of
meaningful objects at the global level (global bias-induced patterns), since the global
Chapter 6 : General Discussion and Conclusion
113

responses were also highly induced by the neutral pattern (non-object figures at both levels).
More interestingly, as expected, in the naming task, the local responses were more elicited by
the local bias-induced pattern (meaningful objects at the local level) and also by the
competition-induced pattern (meaningful objects both at the global and local level), in
comparison to the neutral pattern. Although the frequencies of the local responses were low as
compared to the global responses, these findings evidenced the emergence of a local
preference when meaningful objects were present at the local level. The results obtained in
the drawing task were less clear in this respect. The competition-induced pattern elicited more
local responses than the local bias-induced pattern, but this was observed only in one age
group. Whatsoever, it testifies for the fact that local interference can exist in children with
mental retardation. Otherwise, the global responses were more frequent for the global bias-
induced pattern than for the neutral pattern, thus showing that global processing could still be
reinforced in children with mental retardation.
Finally, the fourth pattern property that was tested in our experiments concerned the
duration of exposure of the hierarchical patterns. Previous studies showed that interference
between the global and local levels was affected by exposure duration (Pomerantz, 1983;
Paquet & Merickle, 1984, 1988; Mottron & Belleville, 1993; Plaisted et al. 1999; Kimchi,
2005). More precisely, these authors presented compound letters at various durations of
exposure and reported that a unidirectional global to local interference was found at the
shortest exposure duration. Longer exposure durations were found to elicit more local
responses since prolonged viewing reduces the efficiency of global processing (Ninose &
Gyoba, 2003) and short durations on the other hand, were found to facilitate the global
precedence and global interference effects (Allison & Fernandes, 2006; Wang, Mottron, Peng,
Berthiaume, & Dawson, 2007; Hibi, Takeda, & Yagi, 2002). Some authors suggested that
duration related to attentionnal processes in the analysis of hierarchical patterns. Inhibitory
mechanisms (suppression of distraction derived from the analysis of unattended objects) to
local elements would be present when subjects directed their attention to the global level with
the short durations, whereas at the long exposure durations, inhibitory mechanisms to local
elements would not be present, thus leading to a more local advantage (Robertson, 1996; Hibi
et al., 2002).
In our thesis, manipulations of durations of exposure were introduced in Experiment
1 to Experiment 4 with the typically developing children. A long duration (3 seconds) and
short duration (300 msec) was applied. Our study confirmed that when children were
presented with patterns at long and short durations in the similarity judgment task, their
choices for local responses was more frequent with long than with short durations. This result
was mainly found in children aged 3 to 6-years, that is, until global processing preference was
clearly established. It is interesting to note that the higher production of local responses under
Chapter 6 : General Discussion and Conclusion
114

long stimulus durations in comparison with short durations clearly argues against the
oculomotor hypothesis evoked by some authors to account for the local dominance at early
ages (Kowler & Martins, 1982; Poirel et al., 2008). These effects of duration were much less
clear in the experiment involving complex hierarchical patterns.
Manipulation of duration in the drawing task with consistent and inconsistent stimuli
showed only a marginally significant impact. Short durations tended to elicit more local
responses, mainly in the 3-year-olds. This effect was in opposition with the one obtained in
the perceptual experiment, but it was confirmed by our third experiment concerning the
simple and complex stimuli, where short durations tended to elicit more local responses in the
younger children (4-year-olds). This opposition points to the difference between the similarity
judgment task and the drawing task. Only the drawing task requires the formation of a
representation of the stimulus. In the similarity task, different possible choices are provided.
Thus, duration may have an effect on the formation of a complete representation of the
perceived pattern particularly in young children. This interpretation is coherent with the
results obtained in the experiment concerned with the complex hierarchical patterns. Indeed,
they showed that a correct part-whole analysis was better achieved when the patterns were
presented at long durations.
Gender effect
Gender was the last variable that we included in the study because the literature
seems to be quite contradictory with regard to the impact of sex on local/global processing: In
some studies, boys have been reported to make significantly more global perceptual
judgments than girls (Cahill, 2003; Kramer et al., 1996). This is consistent with
developmental models that suggest an early left-hemisphere advantage for girls and a right-
hemisphere advantage for boys (Denckla & Rudel, 1974; Kirk, 1992; Coluccia et al., 2007).
However, Dukette and Stiles (1996) mentioned exactly the reverse result in 4- to 6-year-olds
and in adults in a force-choice matching task, with female participants making more global
level matches than male participants. For their own, Kimchi, Amishav and Sulitzeanu-Kenan
(2009) did not report any gender differences in global-local processing. Gender differences
were therefore worth investigating.
Unfortunately, most of our results showed that the effects of gender were not
significant. Only in our last experiment concerning the haptic global-local processing with
early blind children, significant effects of gender were reported. Some authors have
investigated gender effects in haptic perception (Vecchi, 2001; Zuidhoek et al., 2007). Vecchi
(2001) showed that blind females tended to develop less efficient strategies than blind males
when active processing was required in a complex task. This could suggest that blind females
Chapter 6 : General Discussion and Conclusion
115

might process information differently from males when confronted with inconsistent
hierarchical patterns.
In both the naming and drawing tasks, the girls produced local responses more
frequently than the boys. This result provides support for the findings reported by Steri et al.
(1996) which suggest that girls process haptic information analytically and discriminate
details, especially when employing the right hand. It is also consistent with developmental
models that suggest that the left hemisphere is favored early in girls (Collucia et al., 2007), as
the left hemisphere has been found more efficient than the right one for local information
processing (e.g., Lamb et al., 1989). Furthermore, in the naming task, the boys produced
integrated responses more frequently than the girls. Vecchi (2001) found that blind males
developed more efficient strategies than females when active processing was required in a
complex task. The gender differences we observed might primarily be due to similar
differences in information processing strategies, with the boys deploying more efficient
strategies for the coordination of local and global information in response to the more
complex patterns (the inconsistent patterns). However, they may also be due to more basic
differences in haptic perception, given that Zuidhoek et al. (2007) found that males performed
better than females in a variety of tasks assessing the haptic perception of orientation. It is
worth pointing out that this issue on gender differences remains quite confused. Kimchi,
Amishav, and Sulitzeanu-Kenan (2009) did not report any gender differences in global-local
processing, but their study concerned adults and included visual tasks. Furthermore, the
literature shows that gender differences exhibited in visual tasks (for instance, in the rod-and-
frame task or in the water-level task, Voyer & Bryden, 1993, Robert & Ohlmann, 1994) are
eliminated in tactile versions of these tasks (e.g., Walker, 1972; Robert, Pelletier, St Onge, &
Berhiaume, 1994). Defining more precisely what may underlie the gender differences
observed in our experiment appears therefore delicate, and further research on this topic is
needed for clarification. The only gender difference that is coherent with the overall literature
was obtained in the drawing task, where the boys produced more scribbled drawings than the
girls. Many studies have revealed that girls achieve better performances than boys in tasks
requiring fine motor abilities (e.g., Fairweather, 1976; Kraft & Nickel, 1995).
Conclusion
The effects of age, pattern properties, duration and gender showed that there were
quite clear evidences that there are different characteristics that marked the milestone of
children‘s development of global-local processing. Concerning age, we can conclude that
until 3 years of age, typical developing children showed local preference. The move to global
Chapter 6 : General Discussion and Conclusion
116

preference emerged at 4 years of age, and then the two levels of processing begin to integrate
at 5 years of age, followed by further refinement until 9 years of age, and probably still later.
Before 5 years of age, children can actually attend to both levels of perceptual analysis, but it
seems that these processes operate independently, as could be suspected from the immature
interhemispheric communication (Liegeois et al., 2000). This is also highly congruent with
predictions that can be drawn from some of the neo-Piagetian theories that claim that 3-year-
olds can focus only a single dimension of a task, whereas 5-year-olds can focus on two (Case
& Okamoto, 1996; Halford, 1993; Pascual-Leone & Johnson, 2005), and also related to the
difficulties encountered by young children in the understanding of parts–whole relationships,
as shown in drawing studies (Picard & Vinter, 2007; Tada & Stiles, 1996; Vinter, 1999;
Vinter & Marot, 2007) or in cognitive tasks (e.g., Inhelder & Piaget, 1964). This
developmental sequence of local-global processing was similar between the typical
developing children and early blind children, although there is a protracted period of local
processing dominance in EB children. According to our study, the local processing
dominance in EB children continued until about 10 years of age and, at the age of about 11-12
years, the frequencies of global responses increased and were quite similar to the frequencies
of local responses (thus proving that EB children can attend to both local and global
information). Both of these responses decreased as the number of integrated responses
increased in children at older ages, so that the integrated responses became the predominant
response category and still continued to increase in children at older ages.
These age changes were only suitable to describe the development in typical
developing children and early blind children, but not in children with mental retardation.
Indeed, in these children, no age effect emerged, only IQ effects, and these last effects were
not as strong as age effects in typically developing children. There was a clear global
processing dominance in these children across ages and also across IQs, though the integrated
responses developed as a function of IQ in the drawing task. However, interference effects
existed in these children, as shown by the increase of local processing when meaningful
objects were located at the local level. This means that these children are able to attend to
both processes, but local processing needs to be enhanced by external cues. Dulaney et al.
(1994) also showed that local processing can be enhanced in persons with mental handicap by
appropriate training. Of course, we can wonder to what extent the heterogeneity of our
population of children with mental retardation did not prevent to obtain clearer developmental
trends in these children. Replications with better control of the etiology of the intellectual
impairment seem necessary. The age range of our sample of children with mental retardation
was also not sufficient, as it did not include young children, who could more inclined to
process at a local level if development of perceptual analysis bears some similarity between
typically developing children and children with mental retardation. We can also wonder to
Chapter 6 : General Discussion and Conclusion
117

what extent potential cultural differences did not interfere in our studies involving only
Indonesian participants (with mental retardation, with visual impairments). Indeed, some
cross-cultural studies reported that east Asian individuals showed a strong global advantage
relative to Caucasian persons (McKone et al., 2010). It thus could be that the global advantage
observed in our sample of children with mental retardation may be somewhat greater than
could be observed in western participants. All these arguments contribute to suggest that
further research is needed on this topic with children with mental retardation.
Chapter 6 : General Discussion and Conclusion
118

LIST OF REFERENCES

List of references
Abreu, A.M., French, R.M., Cowell, R.A., deSchonen, (2006). Local-global visual deficit in
Williams syndrome : Stimulus presence contributes to diminished performance on
image-reproduction. Scania : Psychologica Belgica, 46, 269-281.
Akshoomoff, N. A., & Stiles, J. (1995). Developmental trends in visuospatial analysis and
planning: I. Copying a complex figure. Neuropsychology, 9, 364-377.
Alexander, J.M., Johnson, K.E., & Schreiber, J.B. (2002). Knowledge is not everything :
Analysis of children‘s performance on a haptic comparison task. Journal of
Experimental Child Psychology, 82, 341-366.
Allison, J.D., & Fernandes, M.A. (2006). Effect of short and long exposure duration and dual-
tasking on a global-local task. Acta Psychologica, 122, 247-266.
Ash, M.G. (1998). Gestalt Psychology in German Culture, 1890-1967: Holism and the Quest
for Objectivity. Woodwart, W.R. (series editor). London : Cambridge University
Press.
Aviezer, H., Landau, A.N., Robertson, L.C., Peterson, M.A., Soroker, N., Sacher, Y., Bonneh,
Y., & Bentin, S. (2007). Implicit integration in a case of integrative visual agnosia.
Neuropsychologia, 45, 2066-2077.
Behrmann, M. & Kimchi, R. (2003). What Does Visual Agnosia Tell Us About Perceptual
Organization and Its Relationship to Object Perception?. Journal of Experimental
Psychology: Human Perception and Performance, 29, 19–42
Bellugi, U., Sabo, H., & Vaid, J. (1988). Spatial deficits in children with Williams syndrome.
In J. Stiles, M. Davis & U. Bellugi (Eds.), Spatial cognition: Brain bases and
development (pp. 156-184). Hillsdale, NJ: Erlbaum.
Bellugi U., Bihrle, A., Jeringan, T., Trauner, D., & Doherty, S. (1990). Neuropsychological,
neurological and neuroanatomical profile of Williams syndrome, American Journal
of Medical Genetics, 1990, 115-25.
Bellugi, U., Lichtenberger, L., Mills, D., Galaburda, A. & Korenberg, J.R. (1999). Bridging
cognition, the brain and molecular genetics : evidence from William syndrome.
Trends in Neurosciences, 22, 197-207.
Bellugi, U., Lichtenberger, L., Jones, W., Lai, Z., & St George, M. (2000). The
neurocognitive profile of Williams syndrome: A complex pattern of strengths and
weakenesses. Journal of Cognitive Neuroscience, 12(Suppl.), 1-6.
Berger, C., & Hatwell, Y. (1993). Dimensional and overall similarity classification in haptics:
A developmental study. Cognitive Development, 8, 495-516.
References
119

Berger, C., & Hatwell, Y. (1996). Developmental trends in haptic and visual free
classifications : Influence of stimulus structure and exploration on decisional Process.
Journal of Experimental Child Psychology, 63, 447-465.
Biederman, I. (1987). Recognition-by-Components : A Theory of Human Image
Understanding. Psychological Review, 94, 115-147.
Birhle, A. M., Bellugi, U., Delis, D., & Marks, S. (1989). Seeing either the forest or the trees:
Dissociation in visuospatial processing. Brain and Cognition, 11, 37-49.
Bouaziz, S., & Magnan, A. (2007). Contribution of the visual perception and graphic
production systems to the copying of complex geometrical drawings: A
developmental study. Cognitive Development. 22, 5-15.
Bryden, M. P. (1977). Measuring handedness with questionnaires. Neuropsychologia, 15,
617-624.
Burack, J.A., Enns, J.T., Iarocci, G., & Randolph, B. (2000). Age Differences in Visual
Search for Compound Patterns: Long vs. Short Range Grouping. Developmental
Psychology, 36, 731-740.
Cahill, L. (2003). Sex- and Hemisphere-Related Influences on the Neurobiology of
Emotionally Influenced Memory. Progress in Neuro-Psychopharmacology &
Biological Psychiatry, 27, 1235-1241.
Case, R., & Okamoto, Y. (1996). The role of central conceptual structures in the development
of children‘s thought. Monographs of the Society for Research in Child Development, 61, v-
265.
Christman, S.D. (2001). Individual Differences in Stroop and Local-Global Processing: A
Possible Role of Interhemispheric Interaction. Brain and Cognition, 45, 97-118.
Colombo, J., Freeseman, L.J., Coldren, J.T. & Frick, J.E. (1995). Individual Differences in
Infant Fixation Duration : Dominance of Global versus Local Stimulus Properties.
Cognitive Development, 10, 271-285.
Coluccia, E., Iosue, G., & Brandimone, M. A. (2007). The relationship between map drawing
and spatial orientation abilities: A study of gender differences. Journal of
Environmental Psychology, 27, 135-144.
Cook, G.L. & Odom, R.D. (1988). Perceptual sensitivity to dimensional and similarity
relations in free and rule-governed classification. Journal of Experimental Child
Psychology, 45, 319-338.
D‘Angiulli, A., Kennedy, J.M. & Heller, M.A. (1998). Blind children recognizing tactile
pictures respond like sighted children given guidance in exploration, Scandinavian
Journal of Psychology, 39, 187-190.
References
120

D‘Angiulli, A., & Kennedy, J.M. (2000). Guided exploration enhances tactual picture
recognition in blindfolded sighted children: implications for blind children.
International Journal of Rehabilitation Research, 23, 319-320.
D‘Angiulli, A., & Kennedy, J.M. (2001). Children‘s tactual exploration and copying without
vision. International Journal of Rehabilitation Research, 24, 233-234.
D‘Angiulli, A., Miller, C., & Callaghan, K. (2008). Structural equivalence are essential,
pictorial conventions are not: Evidence from haptic drawing development in children
born completely blind. Psychology of Aesthetics, Creativity and the Arts, 2, 20-33.
Dalrymple, K.A., Kingstone, S. & Barton, J.S. (2007). Seeing tress or seeing forests in
simultanagnosia : Attentional capture can be local or global. Neuropsychologia, 45,
871-875.
Davidoff, J., Fonteneau, E., & Fagot, J. (2008). Local and global processing: Observations
from a remote culture. Cognition, 108, 702-709.
De Lillo, C., Spinozzi, G., Truppa, V. & Naylor, D.M. (2005). A Comparative Analysis of
Global and Local Processing of Hierarchical Visual Stimuli in Young Children
(Homo sapiens) and Monkeys (Cebus apella). Journal of Comparative Psychology,
119, 155-165.
Denckla, M., & Rudel, R. (1974). Rapid "automatized" naming of pictured objects, colors,
letters, and numbers by normal children, Cortex, 10, 186-202.
Deruelle, C., Schön, D., Rondan, C., & Mancini. J. (2005). Global and local music perception
in children with Williams syndrome. NeuroReport: For Rapid Communication of
Neuroscience Research, 16, 631-634.
Deruelle, C., Rondan, C., Gepner, B. & Fagot, J. (2006). Processing of compound visual
stimuli by children with autism and Asperger syndrome. International Journal of
Psychology, 41, 97-106.
Diamond, R., & Carey, S. (1977). Developmental changes in the representation of faces.
Journal of Exeperimental Child Psychology, 23, 1-22.
Duchaine, B., Yovel, G., & Nakayama, K. (2007). No global processing deficit in Navon task
in 14 developmental prosopagnosics. Social Cognitive & Affective Neuroscience, 2,
104-113.
Dukette, D., & Stiles, J. (1996). Children‘s analysis of hierarchical patterns: Evidence from a
similarity judgment task. Journal of Experimental Child Psychology, 63, 103-140.
Dukette, D. & Stiles, J. (2001). The effects of stimulus density on children‘s analysis of
hierarchical patterns. Developmental Science, 4, 233-251.
Dulaney, C.L., Marks, W., & Devine, C. (1994). Global/local processing in mentally retarded
and nonretarded persons. Intelligence, 19, 245-261.
References
121

Dulin, D., & Serrière, C. (2009). Special needs education in the blind population : Effects of
prior expertise in raised line drawings on blind people‘s cognition. Procedia Social
and Behavioral Sciences, 1, 549-553.
Elkind, D., Koegler, R.R. & Go, E., (1964). Studies in perceptual development II : Part-whole
perception. Child Development, 35, 81-90.
Fairweather, H. (1976). Sex differences in cognition. Cognition, 4, 231-280.
Farran, E. K., Jarrold, C., & Gathercole, S. E. (2003). Divided attention, selective attention
and drawing: Processing preferences in Williams Syndrome are dependent on the task
administered. Neuropsychologia, 41, 676-687.
Farran, E.K., & Cole, V.L. (2008). Perceptual grouping and distance estimates in typical and
atypical development : Comparing performance across perception, drawing and
construction tasks. Brain and Cognition, 68, 157-165.
Feeney, S.M., & Stiles, J. (1996). Spatial analysis : An examination of preschoolers‘
perception and construction of geometric patterns. Developmental Psychology, 32,
933-941.
Flavell, J.H. & Draguns, J. (1957). A microgenetic approach to perception and thought.
Psychological Bulletin, 54, 197-217.
Freeman, N. H. (1980). Strategies of representation in young children. London: Academic
Press.
Frick, J.E., Colombo, J., & Allen, J.R. (2000). Temporal sequence of global-local processing
in 3-month-old infants. Infancy, 1, 375-386.
Garner, W.R. (1974). The processing of information and structure. Hillsdale, NJ:Erlbaum.
Georgiou-Karistianis, N., Tang, J., Mehmedbegovic, F., Farrow, M., Bradshaw, J. &
Sheppard, D. (2006). Age-related differences in cognitive function using a global
local paradigm. Brain Research, 1124, 86-95.
Gibson, J.J. (1979). The Ecological Approach to Visual Perception. Boston : Houghton
Mifflin.
Goldmeier, E. (1972). Similarity in visually perceived forms, Psychological Issues, 8, 1-136.
Goodwin, J.C. 2008. A History of Modern Psychology. USA : John Willy & Sons.
Gregory, R. (1997). Mirrors in mind. Oxford : W.H. Freeman/Spektrum.
Grice, G.R., Canham, L., & Boroughs, J.M. (1983). Forests before trees? It depends where
you look. Perception and Psychophysics, 33, 121-128.
Grill-Spector, K. & Kanwisher, N. (2005). Visual recognition : As soon as you know it is
there, you know what it is. Psychological Science, 16, 152-160.
References
122

Hadad, B., & Kimchi, R. (2006). Developmental trends in utilizing perceptual closure for
grouping of shape : Effects of spatial proximity and collinearity. Perception &
Psychophysics, 68, 1264-1273.
Halford, G. (1993). Children’s understanding: The development of mental models. Hilsdale,
NJ: Lawrence Erlbaum.
Han, S., & Xiao, F. (1999). Factors affecting the global and local processing of visual
compound stimuli. Acta Psychologica Sinica, 31, 274-283.
Han, S., Liu, W., Yund, W., & Woods, D.L. (2000). Interactions between spatial attention and
global/local feature selection : an ERP study. Cognitive Neuroscience and
Neuropsychology, 11, 2753-2758.
Han, S., Yi, J., & Hua, G. (2004). Neural Substrates Differentiating Global/local Processing
of Bilateral Visual Inputs. Human Brain Mapping, 22, 321-328.
Harrison, T.B., & Stiles, J. (2009). Hierarchical forms processing in adults and children.
Journal of Experimental Child Psychology, 103, 222-240.
Heller, M.A., & Clyburn, S. (1993). Global versus local processing in haptic perception of
form. Bulletin of the Psychonomic Society, 31, 574-576.
Heller, M.A. (2002). Tactile picture perception in sighted and blind people. Behavioral Brain
Research, 135, 65-68.
Heller, M.A., McCarthy, M., & Clark, A. (2005). Pattern Perception and Pictures for the
Blind. Psicológica, 26, 161-171.
Hibi, Y., Takeda, Y. & Yagi, A. (2002). Attentional level and negative priming in hierarchical
patterns. Japanese Psychological Research, 44, 241-246.
Hoffman, J.E. (1980). Interaction between global and local levels of a form. Journal of
Experimental Psychology : Human Perception and Performance, 6, 222-234.
Hothersall, D. 2004. History of Psychology, 4th edition. New York : McGraw-Hill Inc.
Iarocci, G., Burack, J.A., Shore, D.I., Mottron, L., & Enns, J.T. (2006), Global-local visual
processing in high functioning children with autism : structural versus implicit task
biases. Journal of Autism and Developmental Disorders, 36, 117-129.
Inhelder, B., & Piaget, J. (1964). The early growth of logic in the child: Classification and
seriation. London: Routledge and Kegan Paul.
Jackson, G.M., Swainson, R., Mort, D., Masud, H., & Jackson, S.R. (2004). Implicit
processing of global information in Balint‘s syndrome. Cortex : A Journal Devoted to
the Study of the Nervous System and Behavior, 40, 179-180,
James, T,W., Kim, S. & Fisher, J.S. (2007). The neural basis of haptic object processing.
Canadian Journal of Experimental Psychology, 61, 219-229.
References
123

Johnson, S.A., Blaha, L.M., Houpt, J.W., & Townsend, J.T. (2010). System factorial
technology provides new insights on global-local information processing in autism
spectrum disorders. Journal of Mathematical Psychology, 54, 53-72.
Kalagher, H., & Jones, S.S. (2011). Developmental change in young children‘s use of haptic
information in a visual task : The role of hand movements. Journal of Experimental
Child Psychology. 108, 293-307.
Kant, Immanuel, 1781. The critique of Pure Reason. http://www.e-
text.org/text/Kant%20Immanuel%20-
%20The%20Critique%20of%20Pure%20Reason.pdf
Kennedy, J.M. (2003). Drawings from Gaia, a blind girl. Perception, 32, 321-340.
Kennedy, J.M., & Juricevic, I. (2003). Haptics and Projection : Drawings by Tracy, a blind
adult. Perception, 32, 1059-1071.
Kimchi, R., & Palmer, S. (1982). Form and Texture in Hierarchically Constructed Patterns.
Journal of Experimental Psychology : Human Perception and Performance, 8, 521-
535.
Kimchi, R. Palmer,E.S. (1985). Separability and Integrality of Global and Local Levels of
Hierarchical Patterns. Journal of Experimental Psychology : Human Perception and
Performance. 11, 673 – 688.
Kimchi, R. (1988). Selective attention to global and local levels in the comparison of
hierarchical patterns. Perception and Psychophysics, 43, 189-198.
Kimchi, R. (1992). Primacy of wholistic processing and global/local paradigm: A critical
review. Psychological Bulletin, 112, 24-38.
Kimchi, R. (1998). Uniform connectedness and grouping in the perceptual organization
of hierarchical patterns. Journal of Experimental Psychology : Human Perception
and Performance, 24, 1105-1118.
Kimchi, R., Hadad, B., Behrmann, M., & Palmer, S. E. (2005). Microgenesis and ontogenesis
of perceptual organization: Evidence from global and local processing of hierarchical
patterns. Psychological Science, 16, 282-290.
Kimchi, R., Amishav, R., & Sulitzeanu-Kenan, A. (2009). Gender differences in global-local
perception? Evidence from orientation and shape judgments. Acta Psychologica, 130,
64-71.
Kinchla, R.A., & Wolfe, J.M. (1979). The Order of visual processing: ―Top-Down‖,
―Bottom-Up‖ or ―Middle-Out‖. Perception and Psychophysics, 25, 225-231.
Kinchla, R.A., Solis-Marcia, V. & Hoffman, J. (1983). Attending to different levels of
structure in a visual image. Perception &Psychophysics, 33, 1-10.
References
124
Kirk, U. (1992). Evidence for early acquisition of visual organization ability: A
developmental study, Clinical Neuropsychologist, 6, 171-177.
Klatzky, R.L., Lederman, S.J., & Mankinen, J.M. (2005). Visual and haptic exploratory in
children‘s judgements about tool function. Infant Behavior and Development, 28, 3,
240-249.
Kowler, E. & Martins, A.J,. (1982). Eye movements of preschool children. Science, 215,
997-999.
Kraft, R.H. & Nickel, L.D. (1995). Sex-related differences in cognition : Development during
early childhood. Learning and Individual Differences, 7, 249-271.
Kramer, J. H., Ellenberg, L., Leonard, J., & Share, L. J. (1996). Developmental sex
differences in global-local perceptual bias. Neuropsychology, 10, 402-407.
Lakatos, S., & Marks, L.E. (1999). Haptic form perception : relative salience of local and
global features. Perception & Psychophysics, 61, 895-908.
Lamb, M.R. & Robertson, L.C. (1988). The processing of hierarchical stimuli : Effect of
retical locos, locational uncertainty and stimulus identity. Perception and
Psychophysics, 44, 172-181.
Lamb, M.R., Robertson, L,C, & Knight, R.T. (1989). Attention and interference in the
processing of global and local information : Effects of Unilateral Temporal-Parietal
Junction Lesions. Neuropsychologia, 27, 471-483.
Lamb, M.R., Robertson, L.C., & Knight, R.T. (1990). Components mechanisms underlying
the processing of hierarchically organized patterns : Inferences from patients with
unilateral cortical lesions. Journal of Experimental Psychology : Learning, Memory,
and Cognition, 16, 471-483.
Lamb, M.R, & Robertson, L.C. (1990). The Effect of visual angle on global and local reaction
times depends on the set of visual angle presented. Perception and Psychophysics,
47, 489-496
Lamb, M.R., & Yund, E.W. (1993). The Role of Spatial Frequency in the Processing of
Hierarchically Organized Stimuli. Perception and Psychophysics, 54, 773-784.
Lamb, M.R., & Yund, E.W. (1996). Spatial Frequency and attention : Effects of level,
target,and location-repetition on the processing of global and local forms.
Perception and Psychophysics, 58, 363-373.
Lamb, M.R., London, B., Pond, H.M. & Whitt, K.A. (1998). Automatic and controlled
process in the analysis of Hierarchical Structure, Psychological Science, 9, 14-19.
Lamb, M.R., Yund, E.W., & Pond, H.M., (1999). Is Attentional Selection to Different Levels
of Hierarchical Structure Based on Spatial Frequency?. Journal of Experimental
Psychology: General, 128, 88-94.
References
125

Lamb., M.R. & Yund, W.E. (2000). The Role of Spatial Frequency in cued shift of attention
between global and local forms. Perception and Psychophysics, 62, 753-761.
Lange-Küttner, C. (2000). The role of object violations in the development of visual analysis.
Perceptual and Motor Skills, 90, 3-24.
Lange-Küttner, C., & Vinter, A. (2008). Drawing and the Non-Verbal Mind. Cambridge:
Cambridge University Press.
Lederman, S.J., & Klatzky, R.L. (1990). Haptic Classification of common objects :
Knowledge-driven exploration. Cognitive psychology, 22, 421-459.
Lederman, S.J., & Klatzky, R.L. (1993). Extracting object properties through haptic
exploration. Acta Psychologica, 84, 29-40.
Lederman, S.J., Klatzky, R.L., Rennert-May, E., Lee, J.H., Ng, K., & Hamilton, C. (2008).
Haptic Processing of Facial Expressions of Emotion in 2D Raised-Line Drawings.
IEEE Transaction on Haptics, 1, 27-38.
Liegeois, F., Bentejac, L., & de Schonen, S. (2000). When does interhemispheric coordination
integration of visual events emerge in infancy? A developmental study on 19- to 28-
month-old infants. Neuropsychologia, 38, 1382-1389.
Lindsay, P. H, Norman, D. A. (1977). Human Information Processing. New York : Academic
Press.
List, A., Justus, T., Robertson, L.C. & Bentin, S. (2007). A mismatch negativity study of
local-global auditory processing. Brain Research, 1153, 122-133.
Love, B.C., Rouder, J.N., & Wisniewski, E.J. (1999). A Structural account of global and local
processing. Cognitive Psychology, 38, 291-316.
Löwenfeld, V. (1939). The Nature of Creative Activity. New York : Harcourt, Brace and
Company.
Luquet, G. H. (1927). Le dessin enfantin [Children’s drawing]. Paris : Alcan.
Marr, D. (1982). Vision : A computational investigation into the human representation and
processing of visual information. New York : Freeman.
Martin, M. (1979). Local and global processing : The role of sparsity. Memory and Cognition,
7, 476-484.
McKone, E., Davies, A.A., Fernando, D., Aalders, R., Leung, H., Wickramariyaratna, T., &
Platow, M.J. (2010). Asia has the global advantage : Race and Visual Attention,
Vision Research, 50, 1540-1549.
Meili-Dworetzki, G. (1956). The development of perception in the Rorschach, in B. Klopfer
(ed). Development in the Rorschach technique. Vol. II, New York : Harcourt, Brace
& World.
References
126
Miyahara, M., Piek, J.P., & Barrett, N.C. (2008). Effects of postural instability on drawing
errors in children: A synchronized kinematic analysis of head drawing and body
motion. Human Movement Science, 27, 705-713.
Molfese, D. L., & Segalowitz, S. J. (1988, Eds.). Brain lateralization in children. New York:
Guilford Publications.
Mondloch, C.J., Geldart, S., Maurer, D., & de Schonen, S. (2003). Developmental Changes in
the Processing of Hierarchical Shapes Continue into Adolescent. Journal of
Experimental Child Psychology, 84, 20-40.
Morra, S. (2008). Spatial structures in children‘s drawing: How do they develop ? In C.
Lange-Küttner & A. Vinter (Eds.), Drawing and the Non-Verbal Mind (pp. 159-194).
Cambridge: Cambridge University Press.
Moses, P., Roe, K., Buxton, R. B., Wong, E. C., Frank, L. R., & Stiles, J. (2002). Functional
MRI of global and local processing in children. Neuroimage, 16, 415-424
Mottron, L. & Belleville, S. (1993). A study of perceptual analysis in a high-level autistic
subject with exceptional graphic abilities. Brain and Cognition, 23, 279-309.
Nakamura, M., Mitzuno, S., Douyuu, S., Matsumoto, A., Kumagai, T., Watanabe, S & kakigi,
R. (2009). Development of Visuospatial Ability and Kanji Copying in Williams
Syndrome. Pediatric Neurology, 41, 95-100.
Nakamura, M., Mizuno, S., Douyuu, S., Matsumoto, A., Kumagai, T., Watanabe, S., &
Kakigi, R. (2009). Development of visuospatial ability and kanji copying in Williams
Syndrome. Pediatric Neurology, 41, 95 – 100.
Navon, D. (1976). Irrelevance of figural identity for resolving ambiguities in apparent motion,
Journal of Experimental Psychology : Perception, 2, 130-138.
Navon, D. (1977). Forest before the trees: The precedence of global features in visual
perception. Cognitive Psychology, 9, 353-383.
Navon, D. (1981). The forest revisited: More on global precedence. Psychological Research,
43, 1–32
Navon, D. (1983). How many trees does it take to make a forest. Perception, 12, 239-254.
Navon, D., & Norman, J. (1983). Does global precedence really depend on visual angle?.
Journal of Experimental Psychology : Human Perception and Performance, 9, 955-
965.
Navon, D. (2003). What does a compound letter tell the psychologist‘s mind? Acta
Psychologica, 114, 273-309.
References
127

Neiworth, J.J., Gleichman, A.J., Olinick, A.S. & Lamp, K.E. (2006). Global and local
processing in adult humans (Homo sapiens), 5-year-old children (Homo sapiens), and
adult cotton-top tamarins (Saguinus oedipus). Journal of Comparative Psychology,
12, 323-330.
Neuhaüser, M., & Ruxton, G.D. (2009). Round your numbers in rank tests: exact and
asymptotic inference and ties. Behavioral Ecology and Sociobiology, 64, 297-303.
Ninose, Y., & Gyoba, J. (2003). The effect of prolonged viewing on the recognition of global
and local levels of hierarchically constructed patterns. Acta Psychologica, 112, 233-
242.
Norcia, A.M., Pei, F., Bonneh, Y., Hou, C., Sampath, V., & Pettet, M.W. Development of
Sensitivity to Texture and Countour Information in the Human Infant. Journal of
Cognitive Neuroscience, 17, 569-579.
Norman, D.A., & Bobrow, D.G. (1976). On the role of active memory process in perception
and cognition. In C.N. Cofer (ed) . The structure of Human memory. San Francisco :
Freeman.
Norman, J.F., Norman, H.F., Clayton, A.M., Lianekhammy, J.L., & Zielke, G. (2004). The
visual and haptic perception of natural object shape. Perception & Psychophysics, 66,
342-351.
Overvliet, K.E., Mayer, K.M., Smeets, J.B.J., & Brenner, E. (2008). Haptic search is more
efficient when the stimulus can be interpreted as consisting of fewer items. Acta
Psychologica, 127, 51-56.
Palmer, S.E. (1975). Visual Perception and World Knowledge : Notes on a model of Sensory-
Cognitive Interaction. In D.A. Norman, D.E. Rumelhart & the LNR Research Group.
Explorations in Cognition. San Francisco : Freeman.
Paquet, L., & Merikle, P. M. (1984). Global precedence: The effect of exposure duration.
Canadian Journal of Psychology, 38, 45-53.
Pascual-Leone, J., & Johnson, J. (2005). A dialectical constructivist view of developmental
intelligence. In O. Wilhelm and R. Engle (Eds.), Handbook of understanding and
measuring intelligence (pp. 177-201). Thousand Oaks, CA: Sage.
Piaget, J., & Inhelder, B. (1956). The child’s conception of space. London: Routledge and
Kegan Paul.
Picard, D., & Vinter, A. (1999). Representational flexibility in chidren‘s drawing: effects of
age and verbal instructions. British Journal of Developmental Psychology, 17, 605-
622.
Picard, D., & Vinter, A. (2007). The development of context sensitivity in children‘s graphic
copying strategies. Developmental Psychology, 43, 94-110.
References
128

Pillsbury, W.B. (1897). A Study in apperception. American Journal Psychology, 8, 315-393.
Pinneau, A., & Streri, A. (1990). Intermodal transfer of spatial arrangement of the
components parts of an object in 4-5 month-old infants. Perception, 19, 785-804.
Plaisted, K., Dobler, V, Bell, S. & Davis, G. (2006). The Microgenesis of Global Perception
in Autism. Journal of Autism and Developmental Disorders, 36, 107-116.
Plaisted, K., Swettenham, J., & Rees, L. (1999). Children with Autism Show Local
Precedence in a Divided Attention Task and Global Precedence in a Selective
Attention Task. Journal of Child Psychology, 40, 733-742.
Poirel, N., Pineau, A., & Mellet, E. (2006). Implicit identification of irrelevant local objects
interacts with global/local processing of hierarchical stimuli, Acta Psychologica, 122,
321-336.
Poirel, N., Pineau, A., & Mellet, E. (2008). What does the nature of the stimuli tell us about
the Global Precedence Effect?, Acta Psychologica, 127, 1-11.
Poirel, N., Mellet, E., Houdé, O., & Pineau, A. (2008). First came the trees, then the forest:
Developmental changes during childhood in the processing of visual local-global
patterns according to the meaningfulness of the stimuli. Developmental Psychology,
44, 245-253.
Poirel, N., Brazo, P., Turbelin,M., Lecardeur,L., Simon,G., Houdé, O., Pineau, A. & Dolfus,
S. (2010). Meaningfulness and global-local processing in schizophrenia,
Neuropsychologia, 48, 3062-3068.
Pomerantz, J.R. (1983). Global and local precedence : Selective attention in form and motion
perception. Journal of Experimental Psychology, 112, 511-535.
Porporino, M., Shore, D.I., Iarocci, G. & Burack, J.A., (2004). A developmental change in
selective attention and global form perception. International Journal of Behavioral
Development, 28, 358–364
Porter, M.A., & Coltheart, M. (2006). Global and local processing in William syndrome,
autism, and Down Syndrome : Perception, attention, and construction. Developmental
Neuropsychology, 30, 771-789.
Prather, P.A. & Bacon, J. (1986). Developmental differences in part/whole identification.
Child development, 57, 549-558.
Quinn, P.C. & Eimas, P.D. (1998). Evidence for a Global Categorical Representation of
Humans by Young Infants. Journal of Experimental Child Psychology, 69, 151-174.
Rayner, K. (1975). The perceptual span and peripheral cues in reading. Cognitive Psychology,
7, 65-81.
Reicher, G.M. (1969). Perceptual recognition as a function of meaningfulness of stimulus
material. Journal of Experimental Psychology, 81, 275-280.
References
129

Rinehart, N.J., Bradshaw, J.L., Moss, S.A., Brereton, A.V., & Tonge, B.J. (2000). Atypical
interference of local detail on global processing in high-functioning autism and
Asperger‘s disorder. Journal of Child Psychology and Psychiatry, 41, 769-778.
Robert, M., & Ohlmann, T. (1994). Water-level representation by men and women as a
function of rod-and-frame test proficiency and visual and postural information.
Perception, 23, 1321-1333.
Robert, M., Pelletier, J., St Onge, R., & Berthiaume, F. (1994). Women‘s deficiency in water-
level representation: Present in visual condition yet absent in haptic contexts. Acta
Psychologica, 87, 19-32.
Robertson, L.C., Lamb, M.R. & Zaidel, E. (1993). Interhemispheric Relations in Processing
Hierarchical Petterns : Evidence from Normal and Commissurotomized Subjects.
Neuropsychology, 7, 325-342.
Robertson, L.C. (1996). Attentional Persistence for Features of Hierarchical Patterns. Journal
of Experimental Psychology : General. 125, 227-249.
Rondan, C. & Deruelle, C. (2007). Global and configural visual proceesing in adults with
autism and Asperger syndrome. Research in Developmental Disabilities, 28, 197-
206.
Rondan, C., Santos, A., Mancini, J., Livet, M.O. & Deruelle, C. (2007). Global and Local
processing in Williams Syndrome : Drawing versus Perceiving. Child
Neuropsychology, 14, 237-248.
Sanders, L.D., & Poeppel, D. (2007). Local and global auditory processing : Behavioral and
ERP Evidence. Neuropsychologia, 45, 1172-1186.
Sanocki, T. (1993). Time course of object identification : Evidence for a global to local
contingency. Journal of Experimental Psychology : Human Perception and
Performance, 19, 878-898.
Schellingerhout, R., Smitsman, Ad.W., & Cox, R.F.A. (2005). Evolving patterns of haptic
exploration in visually impaired infants. Infant Behavior & Development, 28, 360-
388.
Scherf, K.S., Luna, B., Kimchi, R., Minshew, N., & Behrmann, M. (2008) Missing the Big
Picture : Impaired Development of Global Shape Proceesing in Autism. Autism
Reserach. 1, 114-129.
Scherf, K. S., Behrmann, M., Kimchi, R., & Luna, B. (2009). Emergence of global shape
processing continues through adolescence. Child Development, 80, 162-177.
Schwarzer, G., Zaune, N. (2003). Face processing in 8-month-old infants : evidence for
configural and analytical processing. Vision Research, 43, 2783-2793.
References
130

Schyns, P.G., & Oliva. A. (1994). From blobs to boundary edges : Evidence for time and
spatial scale dependent scene recognition. Psychological Sciences, 5, 195-200.
Secbrechts, M.M., & Fragala, J.J. (1985). Variation on parts and wholes : Infomration
precedence vs. global precedence. Proceedings of the Seventh Annual Conference of
the Cognitive Science Society, 11-18.
Selfridge, O. G. (1959). Pandemonium: A Paradigm for Learning. In: Proceedings of the
Symposium on Mechanisation of Thought Process : National Physics Laboratory.
London : Her Majesty‘s Stationery Office.
Singh, H. & O‘Boyle, M.W. (2004). Interhemispheric Interaction During Global-Local
Processing in Mathematically Gifted Adolescents, Average-Ability Youth, and
College Students. Neuropsychology, 18, 371-377.
Slavin, M. J., Mattingley, J.B., Bradshaw, J.L., & Storey, E. (2002). Local-global processing
in Alzheimer‘s disease : An examination of interference, inhibition and priming.
Neuropsychologia, 40, 1173-1186.
Smith, L.B., & Kemler, D.G. (1977). Developmental trends in free classification : Evidence
for a new conceptualization of perceptual development. Journal of Exeperimental
Child Psychology, 24, 279-298.
Stiles, J., Delis, D.C. & Tada, W.L. (1991). Global-Local Processing in Preschool Children.
Child Development, 62, 1258-1275.
Stiles, J., Stern, C., Appelbaum, M., Naas, R., Hesselink, J., & Trauner, D. (2008). Effects of
Early Focal Brain Injury on Memory for Visuospatial Patterns : Selective Deficits of
Global – Local Processing. Neuropsychology. 22., 61-73.
Stoecker, J. J., Colombo, J., Frick, J.E. & Allen, J.R. (1998). Long-and Short-Looking
Infants‗ Recognition of Symmetrical and Asymmetrical Forms. Journal Experimental
Child Psychology, 71, 63-78.
Streri, A., Dion, A., & Mertz, C. (1996). Hemispheric asymmetry in infancy : Global or local
processing of objects in the haptic mode. Infant Behavior and Development, 19,
Supplement 1, 766.
Streri, A. (2002). Hand preferences in 4-month-old infants : Global or local processing of
objects in the haptic mode. Current Psychology Letters : Behaviour, Brain &
Cognition, 39-50.
Streri, A., & Féron, J. (2005). The development of haptic abilities in very young infants :
From perception to cognition. Infant Behavior & Development, 28, 290-304.
Tada, W.L. Stiles-Davis, J. (1989). Children‘s Analysis of Spatial Patterns : An Assessment
of their ―errors‖ in copying geometric forms, Cognitive Development, 4, 117-195.
References
131

Tada, W.L. & Stiles, J. (1996). Developmental Change in Children‘s Analysis of Spatial
Patterns, Developmental Psychology, 32, 951-970.
Tanaka, H., Onoe, H., Tsukada, H., & Fujita, I. (2001). Attentional modulation of neural
activity in the macaque inferior temporal cortex during global and local processing,
Neuroscience Research, 39, 469-472.
van Sommers, P. (1989). A system for drawing and drawing-related neuropsychology.
Cognitive Neuropsychology, 6, 117-164.
Vecchi,T. (2001). Visuo-spatial processing in congenitally blind people : Is there a gender-
related preference?. Personality and Individual Differences, 30, 1361-1370.
Vinter, A., & Mounoud, P. (1991). Isochrony and accuracy of drawing movements in
children: effects of age and context. In J. Wann, A. Wing & N. Sovik (Eds.),
Development of graphic skills (pp. 113-134). New York: Academic Press.
Vinter, A. (1999). How meaning modifies drawing behaviour in children. Child Development,
70, 33-49.
Vinter, A., & Marot, V. (2007). The development of context sensitivity in children‘s graphic
copying strategies. Developmental Psychology, 43, 94-110.
Vinter, A., & Chartrel, E. (2008). Visual and proprioceptive recognition of cursive letters in
young children. Acta Psychologica, 129, 147-156.
Vinter, A., Picard, D., & Fernandes, V. (2008). Graphic syntax and representational
development. In : Drawing and the non-verbal mind : A life-span perspective, Lange
Kütner, C. (ed); Vinter, A. (ed). New York : Cambridge University Press, 139-158.
Vinter, A., Fernandes, V., & Claudet, Ph. (2009). Drawing in blind and visually impaired
children. In A. Vinter & J.L. Velay (Eds.), Advances in Graphonomics, Proceedings
of the 14th Biennal Conference of IGS, pp. 133-136.
Vinter, A., Puspitawati, I., & Witt, A. (2010). Children‘s Spatial Analysis of Hierarchical
Patterns : Construction and Perception. Developmental Psychology, 46, 1621-1631.
von Ehrenfels, C. (1890). About Gestalt Qualities. Quarterly for Scientific Philisophy.
http://scriptorium.hfg-karlsruhe.de/ehrenfels.html
Voyer, D., & Bryden, M.P. (1990). Gender, level of spatial ability, and lateralization of
mental rotation. Brain and Cognition, 13, 18-29.
Vurpillot, E. (1976). The visual world of the Child. New York : International Univesity Press.
Walker, J.T. (1972). Tactual field dependence. Psychonomic Science, 26, 311-313.
Wang, S. (2002). Framework of Pattern Recognition Model Based on the Cognitive
Psychology. Geo-Spatial Information Science (Quarterly), 5, 74-48.
References
132

Wang, L., Mottron, L., Peng, D., Berthiaume, C. & Dawson, M. (2007). Local bias and local-
to-global interference without global deficit : A robust finding in autism under
various conditions of attention, exposure time, and visual angle. Cognitive
Neuropsychologym 24, 550-574.
Ward, L.M. (1982). Determinants of Attention to Local and Global Features of Visual Forms.
Journal of Experimental Psychology : Human Perception and Performance, 8, 562-
581.
Weber, B., Schwarz, U., Kneifel, S., Treyer, V., & Buck, A. (2000). Hierarchical visual
processing is dependent on the oculomotor system. Cognitive Neuroscience, 11, 241-
247.
Weissman. D.H., & Banich, M.T. (1999). Global-Local Interference Modulated by
Communication Between the Hemispheres. Journal of Experimental Psychology :
General, 128, 283-308.
Wheeler D.D. (1970). Processes in word recognition. Cognitive Psychology, 1, 59-85.
Wijntjes, M.W.A., van Lienen, T., Verstijnen, I.M., & Kappers, A.M.L. (2008). Look what I
have felt : Unidentified haptic line drawings are identified after sketching. Acta
Psychologica, 128, 255-263.
Willats, J. (2005). Making sense of children’s drawings. New York: Lawrence Erlbaum.
Williams, L.G. (1966). The effect of target specification on objects fixed during visual search.
Perception and Psychophysics, 1, 315-318
Withagen, A., Vervloed, M.P.J., Janssen, N.M., Knoors, H., & Verhoeven, L. (2010). Tactile
Functioning in Children Who are Blind : A Clinical Perspective. Journal of Visual
Impairment & Blindness, 43-54.
Yovel, G., Yovel, I., & Levy, J. (2001). Hemispheric Asymmetries for Global and Local
Visual Perception: Effects of Stimulus and Task Factors, Journal of Experimental
Psychology: Human Perception and Performance, 27, 1369-1385.
Yovel, I., Revelle, W., & Mineka, S. (2005). Who Sees Tress Before Forest? – The
Obsessive-Compulsive Style of Visual Attention
Zuidhoek, S., Kappers, A.M.L. & Postma, A. (2007). Haptic Orientation Perception : Sex
differences and latelarization of functions. Neuropsychologia, 45, 332-341.
References
133

Abstract : The thesis investigated the development of children‘s global/local processing
hierarchical patterns introduced by Navon (1977). The objectives were to understand more
comprehensively the developmental characteristics of children‘s perception through their
global and local processing of hierarchical patterns, by considering the effects of age, stimuli
properties, duration of exposure to the stimuli and gender in a perceptual task and a drawing
task. These effects were tested in 3 different populations: typically developing children,
children with mental retardation and early blind children. The results revealed that typically
developing children attended to both the local and global level of processing but these modes
of spatial information processing operated independently. In a first step, children before 4
years of age showed dominance of local processing and then a more global processing
developed at 4 years of age, and at 5 years of age integrated responses began to emerge.
Early blind children showed similar developmental characteristics, although there was a
protracted period of local processing dominance. Indeed, these children mainly produced
local responses at ages of between 6 and 10 years, and then developed more global responses
at 11-12 years and continued to integrate the two levels of analysis at later ages. On the other
hand, global dominance was shown in children with mental retardation and their development
was affected more by mental age than by chronological age. Moreover, their responses were
shown to be sensitive to the fact that meaningful object could be located at the local level,
enhancing local processing in this case. These results need further confirmations as the studies
of global/local processing in atypical children are not numerous. In particular, the effect of
duration of exposure to the stimuli should be further analyzed, because this factor did not
seem to have a great effect in our experiments while it seemed more powerful in other studies
carried out with adults. Replication of the study with children with mental retardation appears
also important to plan for future work, because we can have some doubt relatively the absence
of modification through ages of the way these children perceive hierarchical patterns. Finally,
defining more precisely what may underlie the gender differences seems also worth to explore
since gender did not show a major effect in our results.
Keywords : global processing, local processing, hierarchical patterns, typically developing
children, children with mental retardation, early blind children, drawing task, naming task,
similarity-judgment task.