
The development and application of hearth voidage ...
202
University of Wollongong Research Online University of Wollongong esis Collection University of Wollongong esis Collections 2000 e development and application of hearth voidage estimation and Deadman Cleanliness Index for the control of blast furnace hearth operation Robert John Nightingale University of Wollongong Research Online is the open access institutional repository for the University of Wollongong. For further information contact Manager Repository Services: [email protected]. Recommended Citation Nightingale, Robert John, e development and application of hearth voidage estimation and Deadman Cleanliness Index for the control of blast furnace hearth operation, Doctor of Philosophy thesis, Department of Materials Engineering, University of Wollongong, 2000. hp://ro.uow.edu.au/theses/1522
-
Upload
khangminh22 -
Category
Documents
-
view
2 -
download
0
Transcript of The development and application of hearth voidage ...
University of WollongongResearch Online
University of Wollongong Thesis Collection University of Wollongong Thesis Collections
2000
The development and application of hearth voidageestimation and Deadman Cleanliness Index for thecontrol of blast furnace hearth operationRobert John NightingaleUniversity of Wollongong
Research Online is the open access institutional repository for theUniversity of Wollongong. For further information contact ManagerRepository Services: [email protected].
Recommended CitationNightingale, Robert John, The development and application of hearth voidage estimation and Deadman Cleanliness Index for thecontrol of blast furnace hearth operation, Doctor of Philosophy thesis, Department of Materials Engineering, University ofWollongong, 2000. http://ro.uow.edu.au/theses/1522

The Development and Application of Hearth Voidage Estimation and Deadman Cleanliness
Index for the Control of Blast Furnace Hearth Operation
A thesis submitted in fulfillment of the requirements for the award of the degree
Doctor of Philosophy
from
UNIVERSITY OF W O L L O N G O N G
by
Robert John Nightingale, B.Met.(Hons.), M.Sc.
Materials Engineering
2000

Candidate's Certificate
This is to certify that the work contained in this thesis was carried out by the candidate,
and has not been submitted to any other university or institution for a higher degree.
Robert John

1
Dedication
This work is dedicated to the memory of Dave Mellor and to the Ironmakers of Port
Kembla w h o m he inspired to strive to have their best day every day.
2
Acknowledgments
I am indebted to a great many people for their contributions, support and
encouragement during the course of this work.
The contribution and generosity of my supervisor and long term guide, Professor
Wei-Kao Lu of McMaster University cannot be overstated. His interest and
encouragement in this work has spanned several years. His perceptive scrutiny and wise
council have been critically important to the development of this work and it is a delight
to be his student still.
The role of Professor Rian Dippenaar in initiating and sustaining the development of
this work into its current form is greatly appreciated,
The warm friendship and hospitality of Annette and Patrick Boudreau turned the
wonderful prospect of further study at McMaster University into a fulfilling reality.
The support of the Ironmaking Management Team at Port Kembla has been greatly
appreciated, especially that of Dave Mellor for his role in making study in Canada a
possibility.
Special mention must be made of three of my colleagues: Kevin Price for his assistance
in data management and council in matters statistical, Francis Tanzil for his assistance
m mathematical modeling activities and in critical aspects of hearth drainage
phenomena, and Fernando Bahamondes for assistance in preparation of the document.

3
Many technical operators at Port Kembla have also contributed to the slow and
incremental development of the concepts involved in this work. Some made active
contributions of new ideas or questions; many more listened and gave frank feedback as
new ideas were proposed or tested. Such contributions from Paul Sullivan, Jeff
Dunning, Steve Vardy and Brian Rooney were the most frequent, but others by people
too numerous to mention have also certainly been valuable.
The high levels of skill and enthusiasm demonstrated by John Simpson in his work to
analyse the tuyere coke probe samples reported in this work have made his contribution
most rewarding to me in both the technical and the personal sense.
Finally, my most sincere thanks must go to my family. To my wife Sharon, whose love
and encouragement have sustained me throughout, especially in the final stages of this
project. Thanks also to my sons Craig and Jabe for the inspiration that they provide and
to my parents, Roy and Beryl for their support throughout all that I have undertaken in
life.

4
Synopsis
The lower part of the blast furnace contains a coke bed, which is of fundamental
importance to the process and its stability. The properties of this bed are determined by
the qualities of the coke lumps charged to the process, their response to the harsh
furnace environment and the deposition of debris particles generated within the system.
The coke bed may also retain solid slag residues or kish graphite.
Accordingly, the properties of the coke bed, particularly its permeability to fluids, vary
dynamically in response to operational changes. The present work is the first attempting
to find methods for the routine monitoring of these critical process dynamics.
A method for estimating the hearth coke bed voidage in the plane of the taphole has
been developed which employs data routinely collected in the course of furnace casting
operations. It is shown that casting practice itself can influence this voidage due to the
ability of high buoyancy forces, as experienced by coke particles in an iron bath, to
cleanse the coke bed of small particles when the iron bath height is high.
The Deadman Cleanliness Index (DCI) has been developed for routine monitoring of
the status of the coke bed in this crucial region. Calculation of this index relies on the
fact that metal dripping through the deadman coke bed does not generally reach
chemical equilibrium with the bed. Accordingly, the degree of departure from
saturation with carbon is influenced by the permeability of the bed and provides one
basis for estimating the bed's cleanliness. This is reinforced by a term recognising the

5
risk associated when insufficient superheat is available to the dripping slag phase,
which must also percolate through the bed.
Several operational and raw material influences on deadman cleanliness have been
identified. Practical process improvement strategies for stable operation and long lining
life based on these learnings are presented and discussed.

6
Table of Contents
DEDICATION l
>
ACKNOWLEDGMENTS 2
SYNOPSIS „ 4
TABLE OF CONTENTS 6
FIGURES 9
1 INTRODUCTION 14
2 LITERATURE SURVEY 16
2.1 INTERNAL STATE OF THE BLAST FURNACE 16
2.2 STRUCTURE OF THE HEARTH COKE BED 18
2.3 FORM AND RENEWAL OF THE DEADMAN COKE BED 24
2.4 THE INFLUENCE OF COKE QUALITY ON THE HEARTH AND DEADMAN 29
2.5 THE BEHAVIOUR OF PORT KEMBLA COKE 42
2.6 THE CARBURISATION OF HOT METAL 49
3 THE DEVELOPMENT OF NEW INDICES 61
3.1 THE HEARTH VOIDAGE ESTIMATION 61
3.2 THE DEADMAN CLEANLINESS INDEX 64
3.2.1 Deadman Solids 65
3.2.2 Deadman Liquids 67
3.2.3 Deadman Reactions 67
3.2.4Defining the Index (DCI) 70
4 DATA SOURCES - THEIR MANAGEMENT AND INTEGRITY 73
4.1 HEARTH VOIDAGE ESTIMATION 73
4.2 EVALUATION OF THE DEADMAN CLEANLINESS ENDEX 76
7
4.3 TUYERE COKE PROBES 80
4.4 DETAILS OF BHP'S BLAST FURNACES 83
5 OBSERVATIONS AND DISCUSSION 84
5.1 INTRODUCTION 84
5.2 HEARTH VOIDAGE 85
5.2.1 Reline observations - Port Kembla No.5 Blast Furnace - 1991 85
5.2.2 The influence of hearth filling level and its variation 87
5.2.3 Variation in hearth bottom temperature at Port Kembla No. 5 Blast Furnace 92
5.2.5 The stable deadman 99
5.2.5 The unstable deadman 100
5.2.7 Sidewall damage at Port Kembla No.5 Blast Furnace 102
5.2.8 Summary. 707
5.3 THE APPLICATION OF THE DEADMAN CLEANLINESS INDEX 108
5.3.1 Coke quality and the influence of coarse inert particles 108
5.3.2 The rate of inert debris generation at the raceway 117
5.3.3 Tuyere Velocity 722
5.3.4 Furnace Shutdowns 724
5.3.5 Resolidification of primary slags 725
5.3.6 Other threats to deadman cleanliness 72t5
5.3.7 Cleaning the deadman and hearth. 132
5.3.8 Summary 135
5.4 BEHAVIOUR OF METALLOIDS AND SULPHUR 136
5.4.1 Monitoring by equilibrium partition ratios. 136
5.4.2 Partition ratios andDCI 138
5.4.3 Partition ratios and primary slag mobility 140
5.4.4 Statistical analysis at Port Kembla 144
5.4.5 Summary. 145
6 CONTRD3UTIONS OF THIS WORK 147
6.1 THE GENERAL VALIDITY OF DCI 147

8
6.2 QUALITY OF RAW MATERIALS 149
6.3 TUYERE PRACTICE 151
6.4 CASTING PRACTICE 152
6.5 THE DYNAMIC NATURE OF THE DEADMAN AND BLAST FURNACE STABILITY 154
6.6 THE CONTINUING DEVELOPMENT OF DCI 156
7 CONCLUSIONS 158
REFERENCES 161
APPENDIX 1A SPECIFICATIONS OF METAL SAMPLER 166
APPENDDX IB SPECIFICATIONS OF THERMOCOUPLES 169
APPENDIX 2 CORRECTION OF TUYERE PROBE SAMPLE INCREMENT LOCATIONS 171
APPENDIX 3 CHARACTERISATION OF TUYERE COKE FINES 175
APPENDDX 4A ESTIMATION OF THE CRITICAL SIZE OF INERTS GENERATING RACEWAY DEBRIS 192
APPENDED 4B RACEWAY DEBRIS GENERATION AS A FUNCTION OF TUYERE VELOCITY 195
APPENDED 5 LIST OF PUBLICATIONS ARISING OUT OF THIS WORK 197

9
Figures
Figure 1 Schematic diagram showing internal blast furnace state as influenced by coke quality (from Nakamura et al.2)
Figure 2 Vertical section of blast furnace bottoms estimated from core boring (from Kanbara et al.3)
Figure 3 Hearth diameter and critical bottom of hearth depth to ensure cross hearth flow (from Vogelpoth, Still and Peters4)
Figure 4 Comparison of test results conducted with liquid model and electric simulator (from Peters, Gudenau and Still7)
Figure 5 Effect of coke free layer thickness on velocity at the centre of the hearth bottom (from Shibata et al.8)
Figure 6 Temperature and blast volume distribution at tuyere level in Hokkai No.2 blast furnace (from Okada et al.16)
Figure 7 Patterns of gas flow in the blast furnace with various void fractions in the cohesive zone and deadman17
Figure 8 Changes in coke properties in NSC blast furnaces (from Nakamura et al.2)
Figure 9 Results of coke strength tests at high temperatures (from Nakamura et al.2)
Figure 10 Vertical section of Kukioa No.4 Blast Furnace in front of tuyere (from Nakamura et al.2)
Figure 11 Ternary diagram showing the longitudinal change in coke texture (from Iwanaga and Takatani28)
Figure 12 Difference of estimated temperature between fine coke and lump coke (from Iwanaga and Takatani )
Figure 13 Effect of blast velocity on the degradation of coke (from Iwanaga and Takatani28)
Figure 14 Change in estimated temperature of coke due to blast velocity (from Iwanaga and Takatani28)
Figure 15 Radial distribution of -6.3mm coke with and without coal injection (from Beppler et al.29)

10
Figure 16 Coal rate affecting coke rate for combustion, solution loss of coke and the residence time of coke and burden in the blast furnace (from Beppler et al.29)
Figure 17 Relationship between free alkali pick-up and change in abrasion resistance (from Wilmers and Poultney31)
Figure 18 Technical problems with increasing PCI rate - Kobe Steel 1991 (from Yoshidaetal.32)
Figure 19 Distribution of powder hold-up in a blast furnace (from Yoshida et al.32)
Figure 20 Flow chart showing anticipated problems of low coke rate operation and countermeasures to be taken - Kobe Steel 1997 (from Matsuo et al.33)
Figure 21 Relationship between heat loss from wall and -3mm fine coke in deadman (from Matsuo et al.33)
Figure 22 Typical microstructure of Port Kembla feed coke
Figure 23 Typical microstructure of Port Kembla tuyere coke
Figure 24 Results of textural point count analysis Port Kembla No.4 Blast Furnace tuyere probe analysis (from Gill and Coin35)
Figure 25 Change in composition of dripping materials - Hfroshima No. 1 Blast Furnace (fromSasaki et al. as reviewed in Reference 1)
Figure 26 Structure of softening - melting layers in Hirohata No. 1 Blast Furnace (fromSasaki et al as reviewed in Reference 1)
Figure 27 Comparison of actual carbon content in hot metal with values calculated by various means(from Volovik, Kotev and Kalashnyuk42)
Figure 28 Caburization and dissolution behaviour of different raw cokes (from Gudenau, Meier and Shemmann46)
Figure 29 Carburization behaviour of coke from tuyere level due to distance from furnace wall (from Gudenau, Meier and Shemmann46)
Figure 30 Carbon dissolution into hot metal as a function of temperature, dripping height, particle diameter, carbon type and surface coverage by ash (from Dengetal48)
Figure 31 The levels of iron/slag interface used in estimating hearth coke bed voidage.
Figure 32 Schematic representations of carbon dissolution in hot metal and its implications.

11
Figure 33 Estimated hearth voidage trends for Port Kembla Nos. 2 and 4 Blast Furnaces showing raw (a,b) and smoothed (c) outputs
Figure 34 Diagram of tuyere coke probing equipment
Figure 35 Sectioned tuyere coke probe sample
Figure 36 Hearth skull coke bed voidage - Port Kembla No. 5 Blast Furnace 1991 reline (from Plat, Brown and Price51)
Figure 37 Hearth skull coke size distribution - Port Kembla No.5 Blast Furnace 1991 reline (from Plat, Brown and Price51)
Figure 38 Casting parameters for Whyalla No.2 Blast Furnace 1982-1999
Figure 39 Modeling output for casting of Whyalla No.2 Blast Furnace 1988 - 1990
Figure 40 Modeling output for casting of Whyalla No.2 Blast Furnace 1991-1994
Figure 41 Hearth voidage trend for Whyalla No.2 Blast Furnace 1988 - 1994
Figure 42 Mathematical modeling results for Port Kembla No.5 Blast Furnace with a coke free layer and varying hearth voidage (from Panjkovic and Truelove13)
Figure 43 Hearth refractory construction Port Kembla No.5 Blast Furnace (1991- )
Figure 44 Temperature trend for thermocouple A - Port Kembla No.5 Blast Furnace
Figure 45 Hearth bottom centreline temperatures - Port Kembla No.5 Blast Furnace
Figure 46 Simplified representation of the force balance on the deadman
Figure 47 Relationships between the deadman and the cohesive zone a) not engaged b) engaged
Figure 48 Estimated hearth voidage trend for Port Kembla No.5 Blast Furnace (1991 -1999)
Figure 49 Rate of sidewall refractory growth - Port Kembla No.5 Blast Furnace (1991 -1999)
Figure 50 Circumferential variation of sidewall refractory growth - Port Kembla No.5 Blast Furnace (1991 - 1999)
Figure 51 Correlation plots for hearth bottom thermocouples A-D - Port Kembla No.5 Blast Furnace (1991 - 1999)
3 0009 03256532 2
12
Figure 52 Trends of hearth bottom temperature, hearth sidewall heat load and hearth coke bed relocations - Port Kembla No.5 Blast Furnace (1991 - 1999)
Figure 53 Trend of %+6.3mm coal inerts in coking blend - 1991-99
Figure 54 Extended recovery of Port Kembla No.6 Blast Furnace from a period of poor coke quality and an extended shutdown
Figure 55 Summary sheet - Tuyere probe - No.6 Blast Furnace - 22/2/97
Figure 56 Summary sheet - Tuyere probe - No.6 Blast Furnace - 30/6/97
Figure 57 Summary sheet - Tuyere probe - No.6 Blast Furnace - 28/10/97
Figure 58 Material types in -8mm coke from samples at 2m from the tuyere nose -Port Kembla No.6 Blast Furnace - 22/2/97
Figure 59 Photograph of a coke lump raked from a tuyere of Port Kembla No.6 Blast Furnace in February 1997 showing inert particles exposed by preferential reaction of reactive macerals
Figure 60 Photomicrographs showing particle types in tuyere coke probe fines
Figure 61 Trend of %+6.3mm coal in coking coal blend - Port Kembla August-September, 1999
Figure 62 Trends of DCI and AC for Port Kembla No.5 Blast Furnace August-September, 1999
Figure 63 Trends of DCI and AC for Port Kembla No.6 Blast Furnace August-September, 1999
Figure 64 DCI responses to periods of increased tuyere velocity - Port Kembla Nos.5 & 6 Blast Furnaces
Figure 65 Summary sheet - Tuyere probe - No.5 Blast Furnace -19/8/97
Figure 66 DCI response to charging of titania ore - Port Kembla No.5 Blast Furnace
Figure 67 Influence of sinter basicity on softening/ melting first drip temperature
Figure 68 Influence of sinter basicity on softening/ melting residue
Figure 69 Influence of sinter bacisity on first drip metal carbon content
Figure 70 AC frequency distributions for Port Kembla Blast Furnaces
13
Figure 71 Comparison between DCI and partition ratios for manganese and titanium - Port Kembla No.5 Blast Furnace
Figure 72 Responses of DCI and titanium partition ratio to decreased metal temperature - Port Kembla No.5 Blast Furnace
Figure 73 Responses of DCI and manganese partition ratio to decreased metal temperature - Port Kembla No.5 Blast Furnace
Figure 74 Comparison between DCI and key operating indices - Port Kembla No.5 Blast Furnace
Figure 75 Trends of %-3.35mm and its standard deviation in coking coal blend at Port Kembla 1991-1999
Figure 76 DCI trends for individual tapholes - Port Kembla No.5 Blast Furnace

14
1 Introduction
Business realities continue to demand that the ironmaking blast furnace process be
operated at increasing standards of process safety, stability, hot metal quality and
frequently, at increased productivity. Strong competition for any available capital
expenditure ensures that campaign life extension is also a paramount concern in any
viable operation.
The hearth is the most critical part of the blast furnace when aiming for extended
campaign life. This dictates the need to develop both methods for understanding the
flow of iron and the means to exercise control so as to avoid potentially damaging
circumstances.
Modern furnaces are characterised by large diameters, which hinder the flow of gas as
well as liquid metal and slag through the deadman and the hearth. In these most
challenging zones of the furnace, which may occupy up to 30% of the furnace volume,
operating conditions of temperature and pressure make the on-line use of retractable
probes prohibitively expensive.
Probing of the coke bed through the tuyeres at shutdown, however, is widely practiced.
At Port Kembla and elsewhere these off-line efforts confirm the 'aliveness' and critical
importance of the deadman through observed, and all too often, inadequately explained
variations in condition. These probes provide a good snapshot but they are costly and
sample processing is so time consuming that the acquired data cannot be used for any
real-time process control.

15
Undoubtedly, the greatest and largely unaddressed challenges are those associated with
the understanding and management of the condition and flow of the coke bed in the
furnace deadman and hearth. The fundamental properties of this process stream are
critical but the literature contains little or no discussion on measured change in these
properties over time nor on modeling of responses to temporal fluctuation in voidage or
cleanliness (fines contamination) of this coke bed.
The goal of the present work has been the development, appraisal and application of
new tools capable of on-line monitoring of the dynamic status of the coke bed in the
blast furnace deadman and hearth.
These new tools employ data relating to the quality and removal circumstances of the
metal and slag streams. These data are already routinely gathered. Therefore, without
any new or additional expense, analysis of historical and current data has allowed study
of the dynamic variation of the critical permeability of the coke bed to all fluid streams.
From these investigations, significant learnings in relation to operating practice and raw
material quality have been derived. Strategic improvement initiatives implemented on
the basis of these new understandings are discussed,
16
2 Literature Survey
2.1 Internal state of the blast furnace
In the 1970s, Japanese investigators disected blast furnaces, which had been water
quenched at the conclusion of their operating campaigns in order to determine the
internal status of the process. These endeavours allowed huge advances in both
understanding and practice.
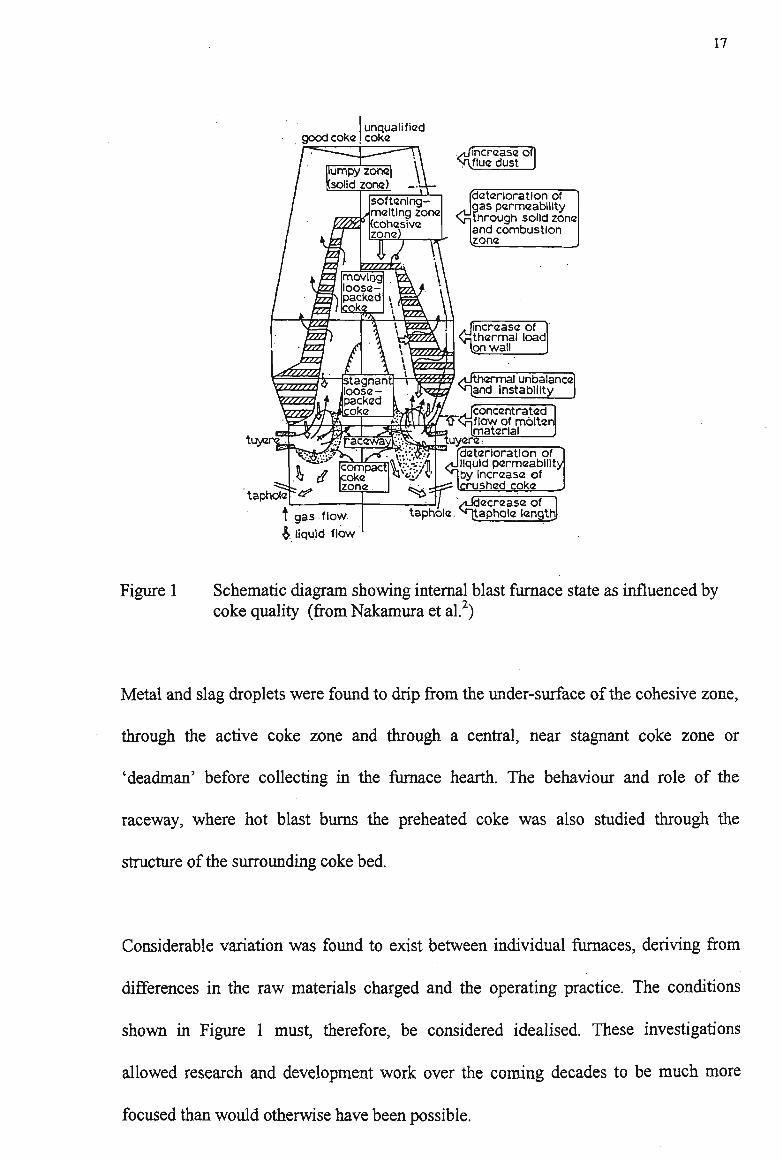
The findings from these investigations have been extensively reviewed1. Figure 1 shows
a simplified representation with the importance of coke quality to the structural and
operational condition being illustrated2.
At the top of the furnace, a Tumpy' zone was found, where discrete layers of coke and
ferrous materials are retained during descent. The existence, form and behaviour of the
cohesive zone, where softening and melting of the layers of reduced ferrous burden
materials occurs, were the principal issues of interest in this quenched furnace work.
Beneath the cohesive zone, a loose packed (active) coke zone, through which coke
moved towards the tuyeres where most of it would be consumed, was identified. Little
was reported about this zone - probably since the dynamics of quenching were
insufficient to freeze the process instantaneously. Some analyses of recovered materials
have, however, been reported.
17
taphota
t gas flow & liquid flow
rdeterioration of
liquid permeability by Increase of
- icrushed coke /iJdecrease of
taphole. ntaphole length
Figure 1 Schematic diagram showing internal blast furnace state as influenced by coke quality (from Nakamura et al.2)
Metal and slag droplets were found to drip from the under-surface of the cohesive zone,
through the active coke zone and through a central, near stagnant coke zone or
'deadman' before collecting in the furnace hearth. The behaviour and role of the
raceway, where hot blast burns the preheated coke was also studied through the
structure of the surrounding coke bed.
Considerable variation was found to exist between individual furnaces, deriving from
differences in the raw materials charged and the operating practice. The conditions
shown in Figure 1 must, therefore, be considered idealised. These investigations
allowed research and development work over the coming decades to be much more
focused than would otherwise have been possible.

18
2.2 Structure of the hearth coke bed
The first concrete evidence for the existence of a packed coke bed extending below the
level of the taphole came from the Japanese quenched furnace studies1,2. Prior to this,
anecdotal evidence had existed in the form of occasional coke runs from the taphole
during casting.
From the dissection of Higashida No. 5 Blast Furnace, Kanbara et al.3 reported the coke
bed to be floating in the metal pool, not contacting the hearth bottom at any point. In the
case of Kukioka No. 4 Blast Furnace, however, the coke bed extended to the hearth
bottom in the furnace centre and almost to the bottom on one side. Both furnaces are
shown in Figure 2. The authors reported a voidage of 0.47 - 0.55 for the immersed
shutdown coke bed and suggested that the shape and position of the bed were governed
by such factors as the depth of the furnace bottom (sump), ore/coke ratio of the burden
and the magnitude of the load on the hearth coke bed due to the location and shape of
the softening-melting zone. They also noted that the coke bed was important to slag and
metal drainage and probably to the wear state of the furnace bottom refractories. No
spatial variation of the bed's voidage was reported.
cinder notch K —.— LU
Figure 2 Vertical section of blast furnace bottoms estimated from core boring (from Kanbara et al.3)

19
Vogelpoth, Still and Peters4 also recognised that the voidage of the coke bed itself must
play a role in the force balance which determines the penetration of the coke bed into
the collected iron bath. These authors studied the wear profiles of over thirty blown out
furnaces in conjunction with operational hearth thermocouple data. They deduced that
campaign life determining, excessive lower sidewall wear was associated with
peripheral iron flow occurring when the coke bed sat on the hearth bottom at the
furnace centre but a coke free layer existed at the wallside. These conclusions were
ratified by plant and laboratory tracer experiments and by mathematical modeling.
From observation and calculation, the authors proposed the existance of a critical pool
depth required to ensure the floating of the coke bed at the furnace centre. This was
proposed to be necessary in order to ensure cross-hearth rather than peripheral flow.
The critical depth was proposed to be a function of hearth diameter as shown in
Figure 3. The possibility and acceptability of a completely sitting coke bed was
recognised but seems to have been disregarded without elaboration. A number of
operational techniques for promoting complete floating of the coke bed to create a coke
free layer were discussed. These techniques included reducing the voidage of the coke
bed but this was considered to be in conflict with the fundamental hearth drainage
requirements of the blast furnace process itself. Other techniques were considered
impractical. It was concluded that the only available method to ensure hearth wall
protection by maintaining a complete coke free layer was to provide sufficient or excess
sump depth in the hearth at relining.

20
From hearth bottom thermocouple data for two operating furnaces, the authors deduced
changes in the iron flow over extended time. These changes were ascribed to wear of
the refractories. The possibility of contribution due to some change in the voidage
condition (either uniform or non-uniform) or to production level was not considered.
3,5
3,0
-. 2,5 p. CO.
•o G
fi 2.° cu
a CD
e. fc 1,5
o
float! f
critical bott sn of the hear th depth
r jstlng
10 11 12 13 14 15 16
hearth diameter (m)
Figure 3 Hearth diameter and critical bottom of hearth depth to ensure cross hearth flow (from Vogelpoth, Still and Peters4)
Two and three dimensional cold modeling liquid flow experiments by Hara and
Tachimori5'6 showed preferential flow across the hearth bottom when a complete coke
free layer was imposed. These results were confirmed by Peters, Gudenau and Still
who used an electrical simulator employing highly homogenous electrically conductive
paper. This simplified apparatus allowed greater simulative flexibility. Their results,
and those of the previous authors are compared in Figure 4 where liquid flow paths for
conditions with and without coke free layers are shown. These authors found that the
flow in the coke free layer became intensified when the depth of the imposed layer was
reduced. Once a coke free layer existed, the shape of the hearth coke bed's bottom (flat

21
or convex) was found to be of little significance to the liquid flow. In further tests to
explore operational means to protect the hearth refractories, they found that reducing
the iron bath height (the degree of filling above taphole level) and extending the taphole
length were of only marginal value. They also concluded that the best defense was a
deep hearth sump.
with liquid models with electric simulator
Figure 4 Comparison of test results conducted with a liquid model and an electric simulator (from Peters, Gudenau and Still7)
o
Shibata et al. , who also performed cold laboratory and mathematical modeling,
predicted high temperatures at the bottom centreline and at the sidewall beneath the
taphole when a coke free layer existed. They also reported increased thermal loading at
the hearth bottom when a reduction of the coke free layer thickness was imposed. This
was due to increased liquid velocity and they even identified a critical value at which
maximum velocity and thermal loading should be expected as shown in Figure 5. It
should, however, be noted that some of their imposed experimental conditions may not

22
arise in practice. Whenever a coke free layer forms, it is the result of a balance between
opposing forces. Cases of high flow through thin coke free layers are not favoured since
the energy loss of such a system is likely to be reduced by increased coke free layer
depth with correspondingly reduced velocity.
1.5
§ w
D 05
°o as i.o 1.5
H Cm)
Figure 5 Effect of coke free layer thickness on velocity at the centre of the hearth bottom (from Shibata et al.8)
Kurita and Ogawa9 developed a three dimensional liquid flow and heat transfer model
to study hearth liquid flow dynamics. They reported on a variety of experimental
conditions including coke free layers and cases involving radial variations in bed
voidage. Specifically, decreased voidage was imposed in the bed centre to reflect
observed tuyere probe results where coke fines accumulation was observed near the
furnace centre. They concluded that poor central permeability was significantly more
threatening to the hearth refractories than a peripheral coke free layer alone and that
such a threat must be countered by increasing the coke particle diameter or decreasing
the fines accumulation in the centre.
23
Modeling work by others10'11 extended study into hearth protection strategies based on
managed liquid flow and the injection of titania bearing materials in order to protect
refractories through the precipitation and accumulation of titanium compounds. Both
studies report practical validation of the models developed.
The area of hearth liquid flow modeling remains active today as individual companies
strive to develop tools for operational control purposes and as enhanced data processing
abilities allow greater sophistication such as the consideration of simultaneous heat
transfer and of convective flow
Until now, the literature contains no reference to any method for estimating the voidage
of the coke bed in the hearth of an operating blast furnace. However, it is likely that the
method developed by Desai14 to monitor hearth liquid contents could, in principal,
yield useful information. In this technique a hollow steel bar is inserted through the
refractory of an out of service taphole. A continuous flow of nitrogen, just sufficient to
keep the bar from melting away or freezing over is then passed through the bar. The
back pressure to maintain constant flow is measured and used to estimate the height of
accumulated liquids in the furnace by assuming a constant value for coke bed voidage.
If mass balance details had been assumed (as might reasonably have been done) on the
basis of known production rates and casting observations, then the voidage could have
been calculated instead. The Desai method itself is somewhat cumbersome and raises
some safety concerns. It has not found continued use even for its originally intended
purpose at its (BHP Whyalla) site of development.
24
2.3 Form and renewal of the deadman coke bed
Following the confirmation of its existence in quenched blast furnaces, the formation
and renewal of the deadman have been studied. This important zone of the furnace is
extremely difficult to probe and indeed only one facility, at Nippon Steel Corporation's
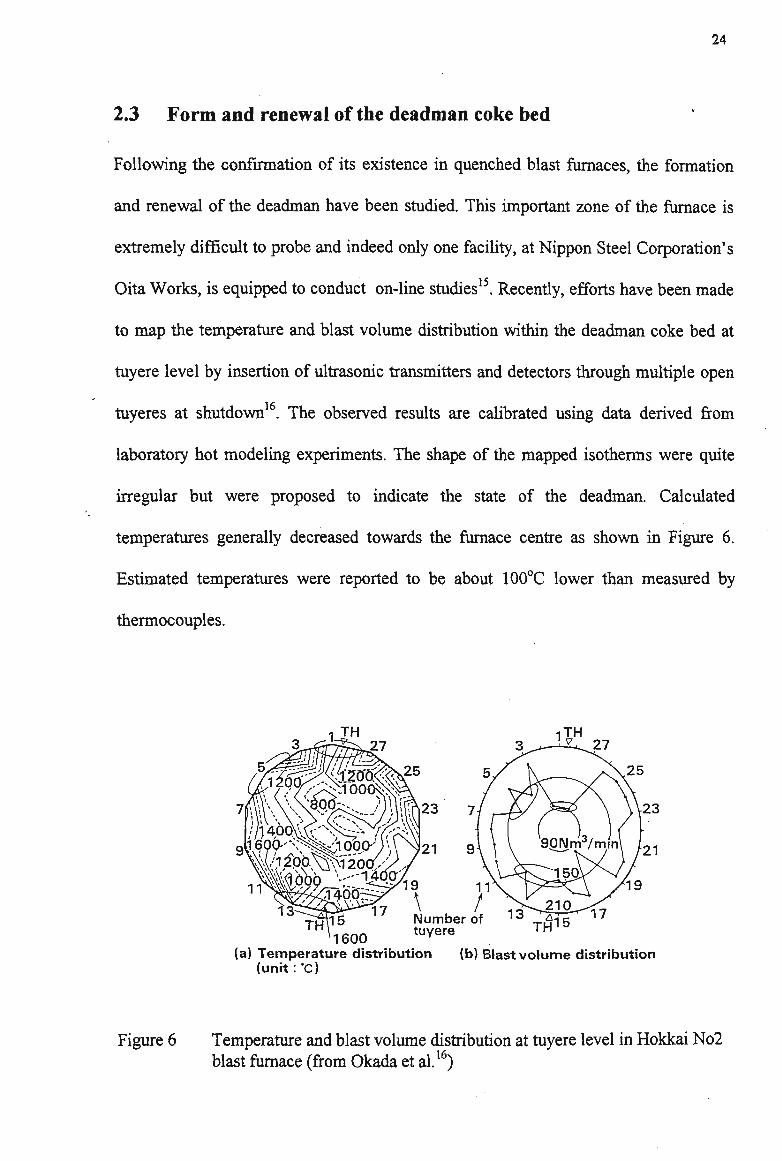
Oita Works, is equipped to conduct on-line studies15. Recently, efforts have been made
to map the temperature and blast volume distribution within the deadman coke bed at
tuyere level by insertion of ultrasonic transmitters and detectors through multiple open
tuyeres at shutdown16. The observed results are calibrated using data derived from
laboratory hot modeling experiments. The shape of the mapped isotherms were quite
irregular but were proposed to indicate the state of the deadman. Calculated
temperatures generally decreased towards the furnace centre as shown in Figure 6.
Estimated temperatures were reported to be about 100°C lower than measured by
thermocouples.
(a) Temperature distribution (b) Blast volume distribution (unit : *cj
Figure 6 Temperature and blast volume distribution at tuyere level in Hokkai N o 2 blast furnace (from Okada et al.16)
25
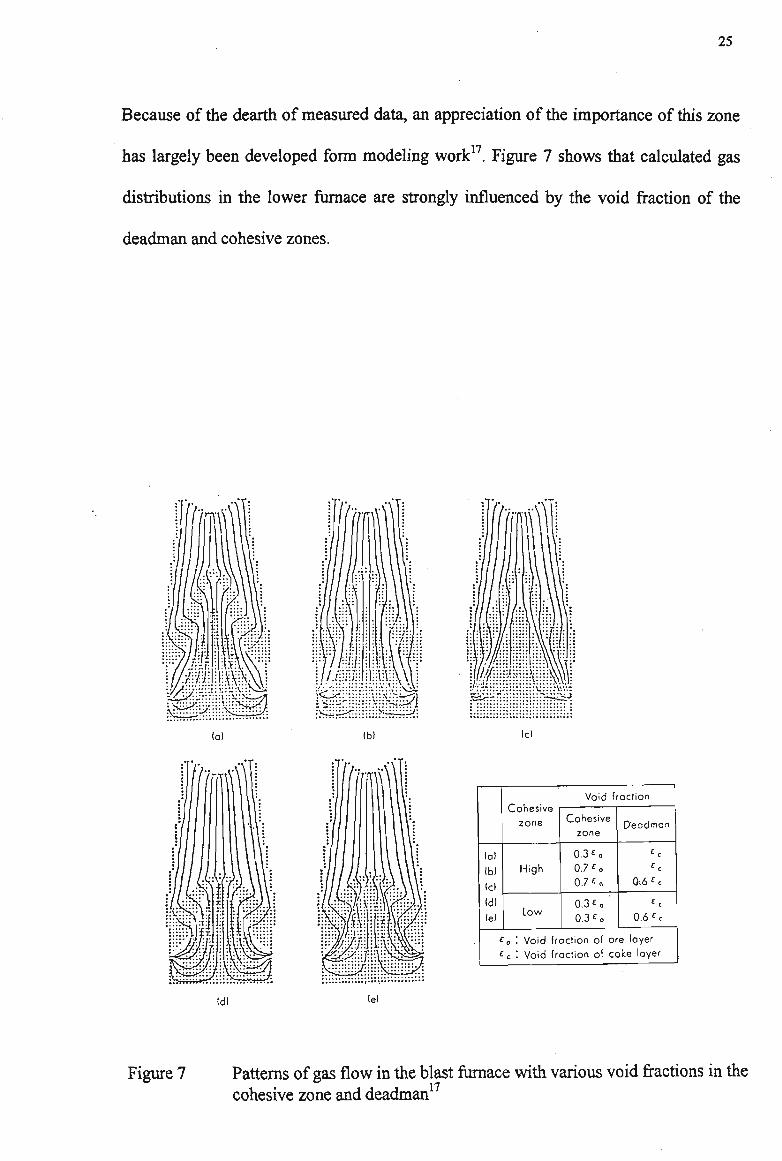
Because of the dearth of measured data, an appreciation of the importance of this zone
1*7
has largely been developed form modeling work . Figure 7 shows that calculated gas
distributions in the lower furnace are strongly influenced by the void fraction of the
deadman and cohesive zones.
a) Ibl Icl
(a)
Ibl
Ic)
Idl
lei
Cohesive
zone
High
low
Void fraction
Cohesive
zone
0.3 «o
0.7 «„
0.7 e„
0.3 £» '
0.3 e 0
Deadmcn
0-.6 «c
0.6 £c
£ 0 • Void fraction of ore layer
s c '• Void fraction of coke layer
Figure 7 Patterns of gas flow in the blast furnace with various void fractions in the cohesive zone and deadman
26
The formation of the deadman zone itself has been explained by Nishio, Wenzel and
Gudenau18 and by Shimizu et al.19. The former suggested that the zone was so named
because the coke within it played no active role in the functioning of the process. Their
investigation was chiefly concerned with the possible influence of buoyancy force
induced upward movements of the bed as a result of liquid accumulation in the hearth.
They calculated that the zone should extend to greater height and occupy a
proportionally larger volume as the size (diameter) of the blast furnace increases. Under
their assumed conditions, they found that the deadman could be shifted upwards by up
to 1.2 meters by the buoyancy due to iron and slag accumulation. They reasoned that
cyclical accumulation and removal of liquid at the hearth due to the casting cycle would
therefore cause continued replenishment of the coke bed at and near the conical head of
the deadman and so ensure good permeability at this location. Full details of their
calculations are not given but there appears to be no allowance for load bearing and
transfer by the cohesive zone to the bosh walls of the furnace proper. There remains no
satisfactorily comprehensive treatment of this crucial force balance in the literature.
Shimizu et al.20 studied the form of the deadman's upper boundary theoretically and this
work was extended by Takahashi and Komatsu21 who also showed the formation of a
surrounding quasi-stagnant zone. The latter used a two dimensional model which
allowed removal of material to simulate coke combustion at the tuyeres but none from
the deadman itself. This work showed that the deadman size would be sensitive to
whether the furnace used pulverised coke injection or not and that the renewal of the
deadman coke could occur only from a small central inflow region. Material in the
quasi-stagnant zone moved eventually to the raceway and the consistency of this
movement was dependent on tuyere location, injection practice and blast volume.

27
Using a two dimensional model allowing raceway consumption and coke removal
within the deadman, Takahashi,Tanno and Katayama confirmed the findings of prior
studies made without deadman renewal and showed that renewal was derived from only
a small central inflow region. They also showed that if the deadman moved down for
some (unspecified) reason, material could flow down from the raceway bottom into
outer regions of the lower deadman.
The replenishment of coke via the deadman apex was further studied by Jung, Lee and
Chung23 in a cold model allowing coke consumption at the tuyeres and within the
deadman. This work was undertaken to clarify the effectiveness of central coke
charging which aims to improve the quality of coke reaching the deadman by limiting
the degree of its prior exposure to damage by solution loss reaction. The authors noted
an expected sensitivity to pulverised coal injection practice in that fine powder
accumulation within the deadman increased the internal friction angle of the packed
coke. This acted to increase the height of the deadman. This work confirmed renewal
from only a small area at the centreline of the furnace and showed that the radius
contributing to replenishment increased as the renewal rate of the deadman itself was
increased. The volume of the deadman was shown to decrease as renewal rate
increased. The authors noted deadman renewal by coke combustion at the raceway
following displacement from the upper surface under the influence of buoyancy forces
arising due to liquid accumulation prior to tapping. They found that this mode was more
significant than by combustion in the raceway after upward movement forced coke into
the raceway bottom, also as the result of buoyancy forces. The latter had been proposed
by Takeda, Sawa and Takuchi2.4 It was suggested that deadman renewal was likely to

28
occur more rapidly than the commonly held three to four week period and that central
coke charging could activate the hearth coke bed. The possibility of renewal by means
of residual slag FeO reduction or metal carburisation were not acknowledged by any of
the workers simulating deadman renewal in physical models.
Deadman replenishment only by carbon consumption in the reduction of residual FeO
from dripping slag was examined by Sunahara, Inada and Iwanaga25 in fundamental
experiments and mathematical simulation. These studies considered the deadman to be
a um-dimensional bed and assumed an interfacial reaction to be rate detennining. The
work showed that at the elevated temperatures (1400 - 1600°C) and with large particle
size, the renewal was not sensitive to the solution loss reactivity (CRT) of the coke. By
modeling with realistic blast furnace conditions, the authors concluded that deadman
coke consumption by FeO reduction could not be ignored. Their calculations indicated
replacement periods of about two weeks. The possibility of carbon consumption by
metal carburisation was again not mentioned.
More recently, Kasai et al. have compared lump coke degradation by FeO bearing
slags and CO2 in laboratory conditions simulating the cohesive zone and the dripping
zones below. They found that coke reacted with molten FeO forms only a thin reaction
layer and results in little fines generation. Dimpling of the surface was also reported in
this case. Coke reacted with C02 bearing gas developed relatively thick affected layers
and this resulted in more fines generation. Cokes of low reactivity (CRT) and higher
strength formed fewer fines. The authors did not discuss the amount of degradation
occurring by each mechanism in the blast furnace.

29
The inflow of fines to the deadman from above has been studied by Kasai et al.27 using
a two dimensional scale model. They found that coke fines originating at the stockline,
produced from solution loss weakening or ejected from the raceway can enter the upper
surface of the deadman by a screening/percolation type behaviour. This can be avoided
if the flow of gases through the deadman is sufficiently high, with the fines returning to
the raceway for combustion. However, they noted that the increase of deadman coke
void dimension by charging of large central coke could increase fines entry to the
deadman.
The possibility for coke fines from the deadman and hearth to be cleansed from the
furnace by entrainment in the slag or metal is not explicitly addressed in the literature.
Perhaps this is not surprising in light of the significant practical difficulties which
would be encountered in any attempt to quantify such removal. Despite this,
considerable anecdotal evidence for the removal of (kish) graphite with the liquid
streams exists for BHP's Port Kembla operations. Such effluxes are sporadic and are
sometimes associated with signs of changing temperature distribution and cleaning of
the hearth as inferred from hearth plug and sidewall thermocouples.
2.4 The influence of coke quality on the hearth and deadman
A very comprehensive review of the coke related findings from quenched
furnace investigations has been provided by Nakamura et al.2 In Figure 8, the evolution
of coke properties during transit through the furnace are shown for three Nippon Steel
Corporation furnaces. Little change is seen for any parameter down to the mid to lower
shaft. However, beyond this level where the solution loss reaction becomes important,

30
• Kukioka no. 4 blast furnace o Higashida no.5 blast furnace x Hlrohata no.1 blast furnaca
60 80 i r
J L
T 1—TT
4
REACTIVITY, •/. 20 40 60
J-
l r i r
TOTAL SULPHUR,*/. 0-3 0-4
20 40 60 20 40 MEAN SIZE,mm MICROSTRENGTH,
.10 30 ASH ,7.
T
Figure 8 Changes in coke properties in N S C blast furnaces (from Nakamura et al.2)
considerable decrease is observed in mean size and cold strength (DI1501 ). The authors
explain the increase in microstrength as being related to a hardening effect of elevated
temperature and the smaller particle size. The increase in reactivity was attributed to the
action of alkalis from the furnace gas stream. Analysis of samples from close to the
raceway indicated that changes in coke properties in this area were remarkable and
contributed greatly to determining the stability of the furnace operation. The loss of
coke strength at temperatures up to 1500°C was reproduced in the laboratory and is
shown in Figure 9.

31
Figure 9 Results of coke strength tests at high temperatures(from Nakamura et al.2)
The structure around a raceway is illustrated in Figure 10. It should be noted that this is
a generalised form and that great variation was observed from tuyere to tuyere as a
number of changes to blast and injectant conditions were imposed at shutdown and
quench. Individual raceways remained discrete, separated by lumpy coke. The principal
feature was the accumulation of fine coke ahead of the raceway and the entrapment of
metal and slag droplets within this low permeability zone at levels of and below the
tuyere. It had thus become clear that the weakening of coke before entry to the raceway,
the generation of breakage (and perhaps reaction) debris and the entrapment of this
debris in the surrounding area were key to the distribution of gaseous products from the
raceway to the deadman and beyond. This crucial requirement of good coke quality to
ensure adequacy of heat transfer to the furnace core and its increased significance in
large furnaces was clearly stated. The possibility for fine coke debris to compromise
voidage of the hearth coke bed (as well as the deadman) and to adversely affect
drainage performance of the furnace was also recognised. The authors also reviewed
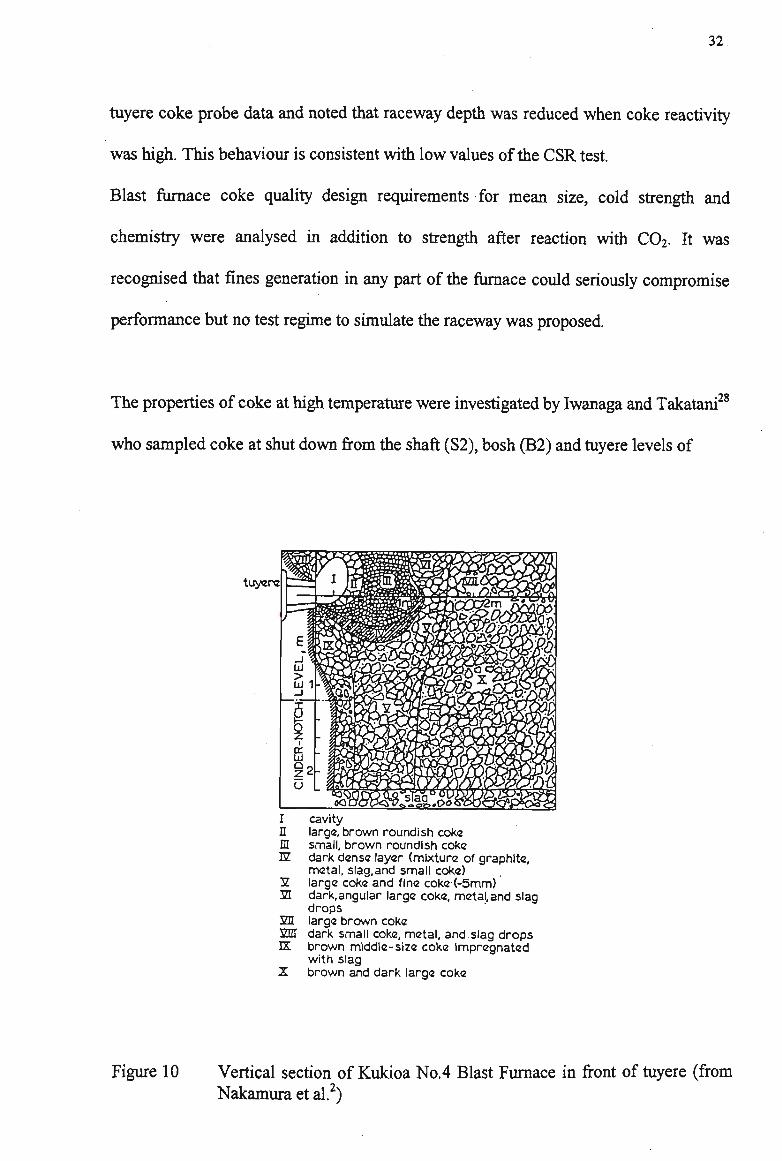
32
tuyere coke probe data and noted that raceway depth was reduced when coke reactivity
was high. This behaviour is consistent with low values of the CSR test.
Blast furnace coke quality design requirements for mean size, cold strength and
chemistry were analysed in addition to strength after reaction with C02. It was
recognised that fines generation in any part of the furnace could seriously compromise
performance but no test regime to simulate the raceway was proposed.
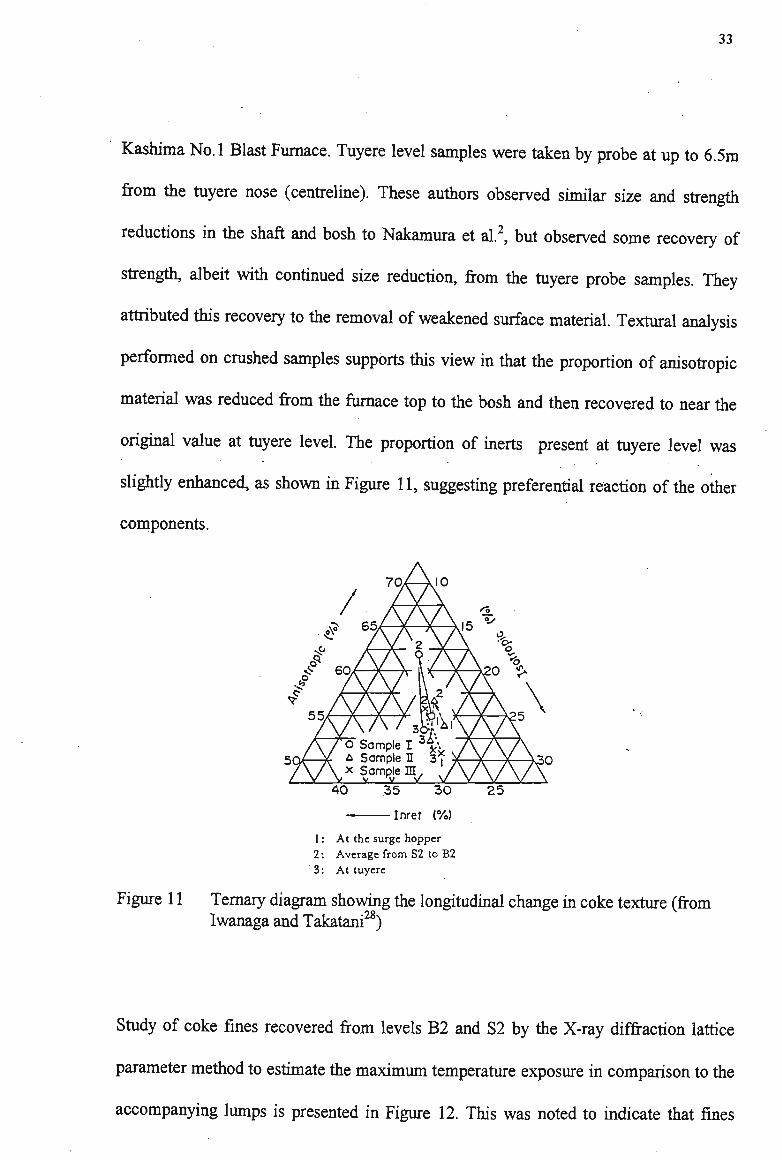
The properties of coke at high temperature were investigated by Iwanaga and Takatani
who sampled coke at shut down from the shaft (S2), bosh (B2) and tuyere levels of
I cavity E large, brown roundish coke EI small, brown roundish coke 32 dark dense layer (mixture of graphite,
metal, slag, and small coke) 3Z large coke and fine coke (-5mm) 3ZI dark,angular large coke, metal,and slag
drops 2H large brown coke 2HI dark small coke, metal, and slag drops E brown middle-size coke impregnated ___ with slag X brown and dark large coke
Figure 10 Vertical section of Kukioa No.4 Blast Furnace in front of tuyere (from Nakamura et al.2)
33
Kashima No.l Blast Furnace. Tuyere level samples were taken by probe at up to 6.5m
from the tuyere nose (centreline). These authors observed similar size and strength
reductions in the shaft and bosh to Nakamura et al.2, but observed some recovery of
strength, albeit with continued size reduction, from the tuyere probe samples. They
attributed this recovery to the removal of weakened surface material. Textural analysis
performed on crushed samples supports this view in that the proportion of anisotropic
material was reduced from the furnace top to the bosh and then recovered to near the
original value at tuyere level. The proportion of inerts present at tuyere level was
slightly enhanced, as shown in Figure 11, suggesting preferential reaction of the other
components.
40 35 30 25
Inret (%)
I: At the surge hopper 2: Average from S2 to B2 3: At tuyere
Figure 11 Ternary diagram showing the longitudinal change in coke texture (from Iwanaga and Takatani28)
Study of coke fines recovered from levels B2 and S2 by the X-ray diffraction lattice
parameter method to estimate the maximum temperature exposure in comparison to the
accompanying lumps is presented in Figure 12. This was noted to indicate that fines

34
produced by abrasion of weakened surface material are carried upwards by the furnace
gas stream or deposited in the deadman.
£ 2000
$ * 1800
„ 1600
s | 1400 s
5 1200 o E
w 1000 1000 1200 1400 1600 1800 2000
Estimated temperature of lump coke CO
Figure 12 Difference of estimated temperature between fine coke and lump coke (from Iwanaga and Takatani )
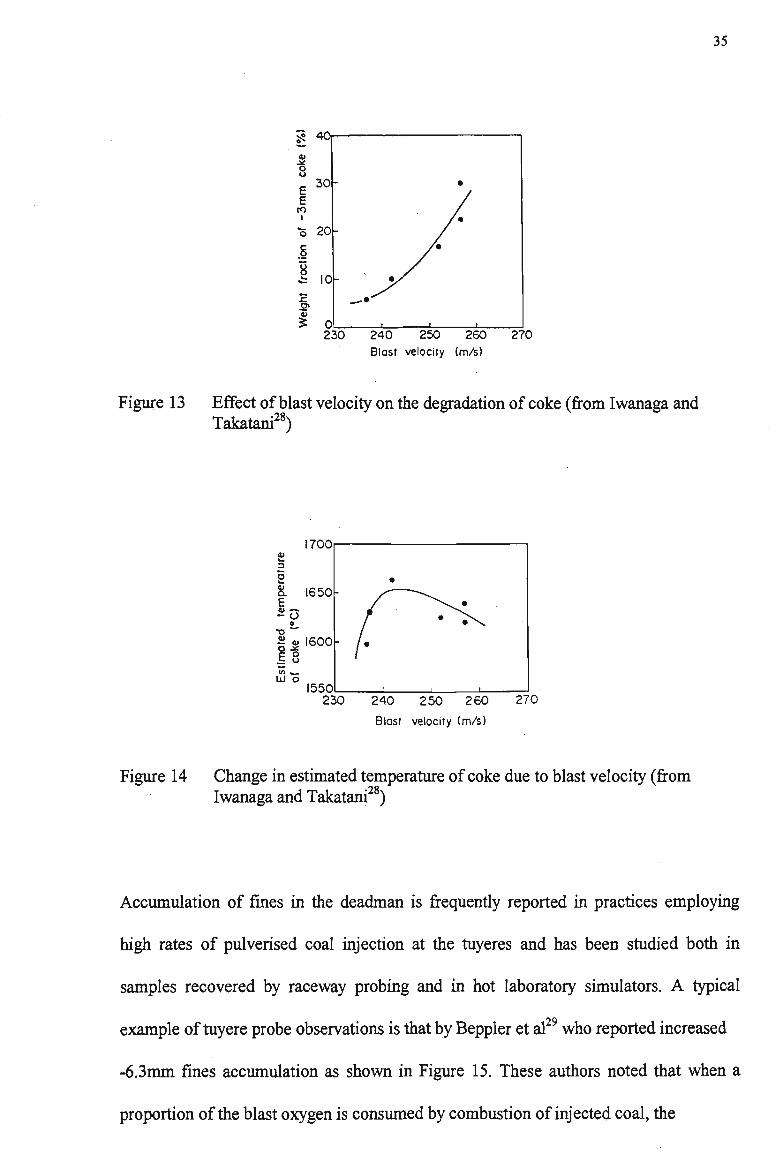
The results of tuyere probing investigations over an extended period were also reported
and indicate that increased blast velocity causes increased raceway breakage with debris
relocation to the deadman. Figure 13 shows the fraction of -3 mm coke recovered in
deadman coke samples as a function of blast velocity. The authors were careful to point
out that this indicates that an optimum value for blast velocity exists at which gas/solid
heat transfer is maximised. This is illustrated in Figure 14 which presents deadman coke
temperatures estimated by the lattice parameter technique.
In laboratory experiments the authors showed that in addition to surface weakening and
fines generation by solution loss reaction, thermal stresses which develop at high
temperatures (up to 1500°C) can cause both surface breakage and volume breakage by
exfoliation. This damage can arise out of thermal expansion stresses due to high intra-
particle temperature gradients such as might be expected in or near the furnace
raceway.
SnafKSZ)
Bosh(B2) •'...'' ••"He»v •>"•''
35
230 240 250 260 270 Blast velocity (m/s)
Figure 13 Effect of blast velocity on the degradation of coke (from Iwanaga and Takatani28)
1700
1650
CD 3
3 8. E J o | g 1600
f 8 ui o
240 250 260
Blast velocity (m/s)
270
Figure 14 Change in estimated temperature of coke due to blast velocity (from Iwanaga and Takatani28)
Accumulation of fines in the deadman is frequently reported in practices employing
high rates of pulverised coal injection at the tuyeres and has been studied both in
samples recovered by raceway probing and in hot laboratory simulators. A typical
example of tuyere probe observations is that by Beppler et al who reported increased
-6.3mm fines accumulation as shown in Figure 15. These authors noted that when a
proportion of the blast oxygen is consumed by combustion of injected coal, the

36
—
t
1 1 II 1 II Coke Coal rate n Stabilization
(kgrtHM) degnw(%) O AT 0 4 98.7 a AT 120 2 98.7 B RAGI 1G9 3 89,7 • RAGII 148 4 853
2 71 ^
ft
U h f I g
h r J mp n
-m
3 7 ] t
J <
<
w
^ H ^ .
f
0 100 200 300 400 500
E m to V
1 81
c3
70
65
60
55
50
45
40
35
30
25
20
15
10
Distance from tuyere tip (cm)
Figure 15 Radial distribution of-6.3mm coke with and without coal injection (from Beppler et al.29)
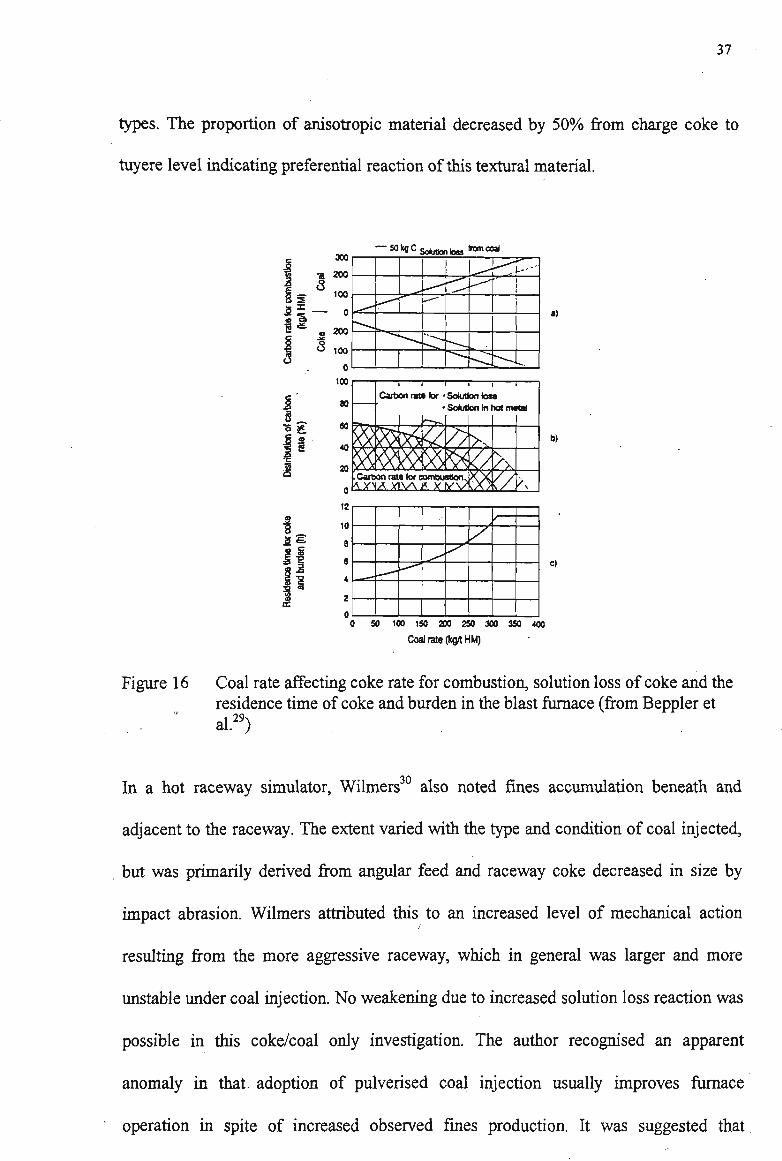
proportion of the coke charged to the furnace which is burnt at the tuyeres reduces
while the proportion consumed in direct reduction increases. Of course, these trends are
also true for other injectant types. These affects are illustrated in Figure 16 which shows
that the coke also experiences increased residence time and therefore increased alkali
exposure as the injection rate increases. Alkali contents of deadman coke were reported
to be higher with coal injection despite reduced alkali loading rates to the furnace in the
case studied The authors attributed the additional fines generation principally to
increased direct reduction and alkali attack, but also noted high degrees of
graphitisation of fine coke in the outer deadman. They attributed this to catalysis by hot
metal retained in this zone and suggested some further weakening"of coke by the
graphitisation. Microstructural investigation of charge and tuyere coke samples showed
highly differing proportions of flow (anisotropic), isotropic and coarse mosaic textural
37
types. The proportion of anisotropic material decreased by 5 0 % from charge coke to
tuyere level indicating preferential reaction of this textural material.
It
•3 £. £ ©
•c
I
1„
II §1
300
200
100
0
200
100
0
too
80
60
40
20
0
12
10
a
9
4
2
0
S ^ 0 Solution beg lf°m«»'
l^^tT'l"'
Carbon rata (or • Solution toss > Solution In hot metai
A
y / • —
0 50 100 150 2 0 0 2 5 0 3 0 0 3 5 0 4 0 0
Coal rate (kg/t H M )
Figure 16 Coal rate affecting coke rate for combustion, solution loss of coke and the residence time of coke and burden in the blast furnace (from Beppler et
" al.29)
In a hot raceway simulator, Wilmers also noted fines accumulation beneath and
adjacent to the raceway. The extent varied with the type and condition of coal injected,
but was primarily derived from angular feed and raceway coke decreased in size by
impact abrasion. Wilmers attributed this to an increased level of mechanical action
resulting from the more aggressive raceway, which in general was larger and more
unstable under coal injection. N o weakening due to increased solution loss reaction was
possible in this coke/coal only investigation. The author recognised an apparent
anomaly in that adoption of pulverised coal injection usually improves furnace
operation in spite of increased observed fines production. It was suggested that

38
problems might be encountered at higher injectant rates, thus making injectant coal
selection and the optimisation of injection lance design essential.
In a separate study, Wilmers and Poultney31 examined coke that had been raked from
blast furnace tuyeres at shut downs over a prolonged period. This method is simple but
effective in obtaining a bosh coke sample, most probably from the previously active
coke zone or upper deadman surface. They observed a decrease of raked coke strength
with alkali pick up (Figure 17) and reported that the permeability resistance coefficient,
heat flux to the cooling system and top gas utilisation all deteriorated very significantly
with decreased mean size of bosh coke.
i — i — i — i — i — i
02 0.4 0.6 08 1.0 1.2 1.4 Change in Micum Slope
Figure 17 Relationship between free alkali pick-up and change in abrasion resistance (from Wilmers and Poultney31)

39
The rates at which pulverised coal is injected to the blast furnace has increased
dramatically over recent years. Kobe Steel have been leaders throughout this period.
Pulverised coal injection has come to represent up to 40% of the fuel input into the
furnace. In a 1991 review, Yoshida et al32 presented their experience up to a rate of
170kg/thm. Their understanding of the problematic issues is presented in Figure 18.
H
In creasing the PC Rate
Increosed ore/coke !h Inferior permeability at the lumpy zone
. Inferior gas flow
K Increased the P C . combustion
Dccrecsed the heat content ratio
Increased the bosh J gas volume P Increosed the gas volume in the tuyeres and blow-pipes
Increased the upper and middle pressure drop
Increased the shaft gas volume
_J Increased the top gas temperature
Decreased the excess oxygen coefficient
Increosed the unburnt P C
Increased the lower pressure drop
r — F
I In
Increased the heat loss from the furnace wall
Increased the heat loss from the furnace top
Inactivity of the deodmon
Figure 18 Technical problems with increasing PCI rate - Kobe Steel 1991 (from Yoshida etal.32)
Inactivity of the deadman was proposed to be the result of increased rates of coal char
entering the furnace after incomplete raceway combustion. Their mathematical
modeling indicated that hold-up of this material would occur in and around the cohesive
zone as shown in Figure 19 and would compromise furnace permeability and
performance. Some six years later, another Kobe Steel team33, including one of the
1991 authors, presented their new state of understanding as shown in Figure 20. On this

40
A %£&vK. ( g ^ x"
1>\ A - shape
zone
1 1
m m m ;p=-0.5
1.5 :*—-2.5
v£kMax. j 10.1%
cohesive ,
A'
32-Figure 19 Distribution of powder hold-up in a blast furnace (from Yoshida et al. )
(Problems j Counter-measures lor forming the stabilized Inverse V cohesive zone r*
Reduction of coke rate;
Lowering ol hut content
Iratlo
Increase ol lumace temperature,
Increase olO/C
Increase ol peripheral p/C
Formation of low temperature reserved zone . (Inverse U)
Increase of heat loss from wall
r Control of } "1 heat content I ratio J I
Reduction of coke amount
Increase of coke degradation by solution loss
Increase of degradation ratio at deadman
[increase ol permeability resistance
Decrease ol coke layer thickness
Destatrttlzation of burden distribution
Increase of blast pressure fluctuation
():Form ol the cohesive zone
Improvement of1
peripheral permeability
Prevention otcoke degradation
revenclonof deadman enlargement j
Stabilization ol radial 0/C distribution _
Ad|ustment of oxygen Unrlchment^
Reduction ot sinter RDI
Increase ol ] coke strength]
Center coke charging 3 Securing tuyere vel locltyj
feoft ore charging)
Reinforcement ol control for .terrace length
Figure 20 Flow chart showing anticipated problems of low coke rate operation and countermeasures to be taken - Kobe Steel 1997 (from Matsuo et al. )
41
occasion there is no mention of difficulty due to fine char accumulation. Rather, actions
designed to preclude its accumulation and to secure the deadman condition (avoiding
enlargement and increased coke degradation ratio) include increasing coke quality, the
use of central coke charging and securing the tuyere velocity. As mentioned previously,
central coke charging is practised to ensure that the coke which renews the deadman is
minimally damaged by solution loss as the centre of the furnace has a very low ore/coke
ratio under this regime. At Kobe Steel, tuyere velocity has been limited to a maximum
value of 215m/s, a value which had in the past been found to be too low to give stable
operation. The change was thought to be due to pulverised coal and oxygen injection
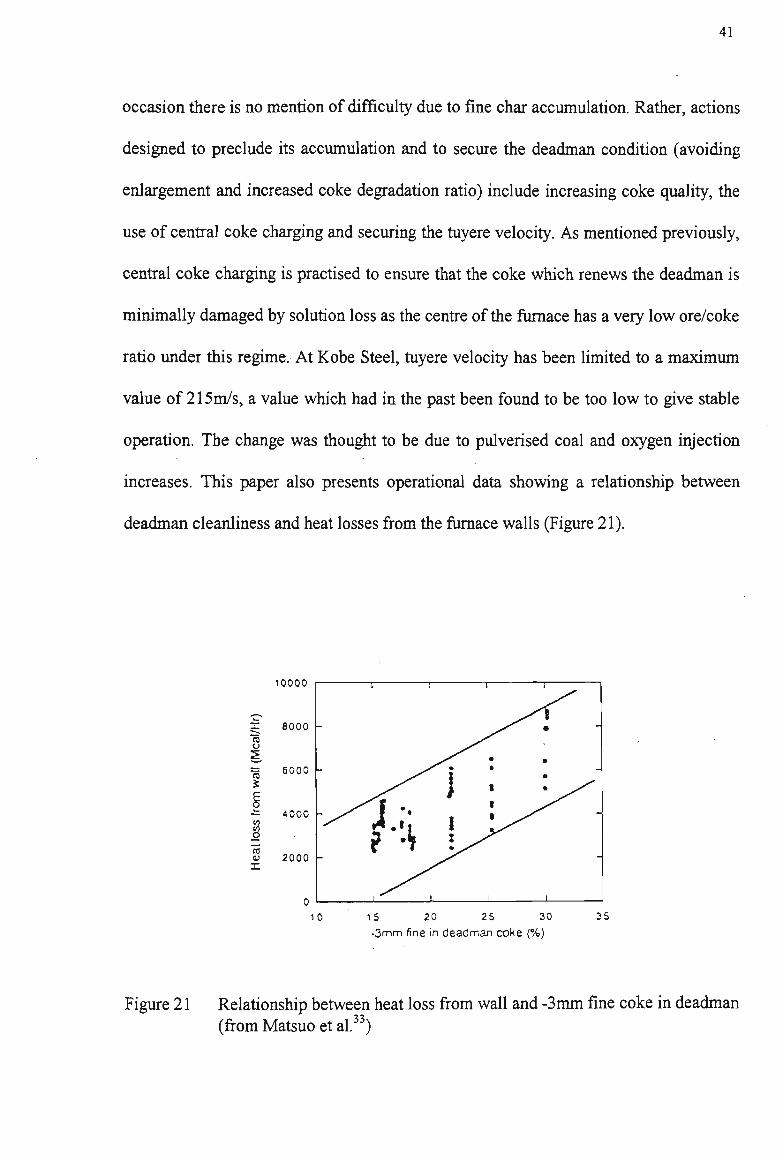
increases. This paper also presents operational data showing a relationship between
deadman cleanliness and heat losses from the furnace walls (Figure 21).
toooo
10 15 20 25 30 -3mm fine in deadman coke (%)
Figure 21 Relationship between heat loss from wall and -3mm fine coke in deadman (from Matsuo et al.33)
Recently, Kerkkonnen has reported on the roles of the carbon structure and ash
phases in coke degradation as observed in samples recovered from a shut down Finnish
blast furnace. He noted that the gasification rates of different carbon types did not
inherently appear to be significantly different from each other, but that the distribution
of internal porosity and finely disseminated minerals appeared to be more significant.
He also noted that non-molten (inert) carbon particles could be seen to gasify more in
the shaft due to carbonate breakdown, but otherwise tended to survive well, all the way
down to the hearth. The mosaic carbon disappeared in the raceway, being catalysed by
disseminated silicate. This evaporation of silica created micro-porosity making the
carbon mechanically weak. This was found to accelerate surface reaction, specifically
in the areas of mosaic carbon texture. This paper also gives a detailed account of alkali
interactions with various clay species within the ash, and explains that the internal coke
structure can be weakened by volume changes associated with phase changes and
slagging of the ash. These reactions were observed to occur mainly in the cohesive and
active coke zones.
2.5 The behaviour of Port Kembla coke
The blend of coking coals employed at Port Kembla has been quite stable for many
years. The blend comprises mainly a mix of coals from the Bulli and Wongawilli seams
in proportions of about 75% and 20% respectively. The high inertinite content of the
former, and so of the whole blend, is very unusual. Details of the Bulli and Wongawilli
coals are given in Table 1.

43
Table 1: Typical Properties of Port Kembla Feed Coals
Ash(db) % Volatile Matter (db) % Sulphur (db) % Phosphorus (db) % K 2 0 + Na20 % Romax Vitrinite (vol%) Inerts (%) Gieseler Fluidity (ddpm) CSN Blend Proportion (%)
Wongawilli Seam 10.0 24.6 0.56 0.008 0.18 1.21 77 20 5000 9 20
Bulli Seam
8.9 23.4 0.37 0.055 0.12 1.27 52 45 1700 7 45
Battery Feed
9.1 23.0 0.46 0.048 0.14 1.25 53 43 1500 7.5 43
This uncommonly simple blend has been supplemented by small additions of petroleum
coke or coal from other seams but the rate has generally not exceeded about 5% of the
total blend. The coke produced is dense and strong under conventional testing
conditions as shown in Table 2. The reactivity and strength after reaction (CRI and
CSR) are respectively unusually low and unusually high.
Table 2: Typical Properties of Port Kembla Coke
Ash (%) Moisture (%) Sulphur (%) Phosphorus (%) Mean Size (mm) A S T M Stability A S T M Hardness DI 150/15
CSR CRI
11.4 3.0 0.43 0.055 49.5 61 67 83.5
72 19

44
The behaviour of this coke has been reported by Gill and Coin 35 on the basis of tuyere
coke probing of the deadman during shutdown and from laboratory simulations. Figure
22 shows a typical microstructure of Port Kembla feed coke in which the reactive
maceral derived component (RMDC) consists of highly coloured medium grained
mosaic which surrounds and binds the inert maceral derived components (IMDC) which
are of a uniform brown colour and are generally isotropic. Figure 23 shows reacted coke
removed from a deadman probe in which a typically unaltered IMDC (or inert) particle
is surrounded by much reacted material (RMDC) and only small quantities of residual
unaltered RMDC.
Figure 22 Typical microstructure of Port Kembla feed coke
The results of their quantitative microstructural analysis of material from Port Kembla
No.4 Blast Furnace are shown in Figure 24. These indicate that there has been

45
preferential degradation of the R M D C to such an extent that the amount of I M D C has
not altered until all the RMDC has reacted. The path of degradation for non-preferential
reaction is marked in the diagram. Hexagons indicate standard counting error and
sample numbers indicate sample position along the recovered probe. Sample No. 1
corresponds to a location at a depth of 2.4m from the tuyere tip of this 9.1m hearth
diameter furnace. Other sample locations are evenly spaced back to No. 8, which came
from immediately in front of the tuyere nose. It should be noted that microscopic
analysis was performed on lumps of coke rather than fines. Fines were more prevalent
in samples from beyond 1.8m depth but no attempt to separately characterise these was
reported.
Figure 23 Typical microstructure of Port Kembla tuyere coke

46
Figure 24 Results of textural point count analysis Port Kembla No.4 Blast Furnace tuyere probe analysis (from Gill and Coin35)
In the same paper, reports of similar studies on coke recovered from BHP blast furnaces
at Newcastle clearly indicate degradation along a path corresponding to non-preferential
reaction. Newcastle cokes were derived from very different coals but still contained a
significant amount of (anisotropic) inerts.
In laboratory simulation studies, core drilled samples from Port Kembla coke lumps
were heated to a range of temperatures up to 1250°C and under various gas conditions
to produce samples analogous to the blast furnace materials. By careful management,

47
identical sites were able to be photographed before and after reaction and could also be
sectioned to allow the depth of reaction to be examined. In all cases, microtextural
analysis showed that reaction behaviours similar to the material from the blast furnace
were being observed. However, degradation occurred to only a small depth in contrast
to recovered samples where there was little or no contrast between the edge and centre
of lumps. This indicated that the reactions had been pervasive throughout the lumps.
It was found that similar degradation textures could be produced by heating coke
samples to temperature in a nitrogen atmosphere without the addition of reagent gases.
It was determined from chemical analyses of tuyere coke probe samples that significant
silicon depletion occurred at all sites with essentially complete removal from coke
recovered from near the end of the raceway. It appeared that ash-carbon reactions had
played a significant role in the degradation behaviour.
In similar circumstances, Lakshmanan, Ma and Lu36 observed that the product gas from
ash- carbon reactions was not CO but CO2. They observed a marked increase of the rate
of such reactions at temperatures in excess of 1500°C. Similar behaviour may also have
contributed to the rapid loss of strength reported by Nakamura et al.2 at high
temperatures, as seen in Figure 9.
Gill and Coin35 examined the distribution of mineral phases in coke recovered from the
Port Kembla blast furnaces. At depths beyond the end of the raceway, corundum
(A1203) and spinel (MgAl204) were identified but no cristobalite (Si02) or mullite
(3Al203.2Si02). The latter were detected in their stead in samples from the Newcastle
48
furnaces. Quantities of gehlenite (Ca2Al2Si07) were also found in Port Kembla samples.
The mineralogy and distribution of mineral phases in feed coals were not reported by
these authors.
Older records ' indicate that the Bulli seam coals contain clay minerals in both inert
and reactive macerals while the Wongawilli seam coals contain clays in their inerts but
silica as quartz in their reactive components.
McCarthy et al.39 studied Port Kembla and Newcastle cokes in a hot raceway simulator.
Their quantitative microstructural examinations found degradation of Port Kembla
cokes to be similar to that observed in tuyere coke probe samples, being pervasive and
preferential. When the Port Kembla coke bed was excavated, they found fine material
distributed throughout the bed. These fines were widely distributed with only minor
areas of high concentration. For Newcastle coke, fines were concentrated near or just
below the tuyere with little fines blown through the bed. The nature of the fines was not
reported.
The benefits of applying selective crushing to a coal blend such as Port Kembla's have
been documented. For example, the CPC-P process employed at Nippon Steel's
Hirohata plant40 was claimed to deliver an increase of 1.2% in DI150/15. This was
achieved by crashing the larger (+5mm) material, which was predominantly inertinite in
closed circuit to less than 3mm. An undocumented evaluation of this process at Port
Kembla confirmed the benefit in pilot oven testing to be at least as great as that reported
by Nippon Steel.

49
2.6 The carburisation of hot metal
Metal and slag chemistries for the main species of ironmaking interest in samples from
Hirohata No. 1 Blast Furnace are shown in Figure 25l. Even with water as the quenching
medium, the rate of furnace cool down was such as to make the representivity of carbon
content in iron droplets collected from sites beneath the cohesive zone quite
problematic. Within the cohesive zone (Figure 26), carbon contents of about 0.2% were
reported in the upper portions of the masses of semi molten iron. Carbon contents of
0.1-0.5% were reported at the underside of this material. This carbon was considered to
have come from reaction with the gas stream.
Sampling position
( Metal portion)
CaO/SiOz AlzOj S
0 2 40 2 4 0 Ql 0.20 0.6 1.2 (Slag portion)
Na K
Q8L0L2 I0I2I4I605I0 1.5 20005LOO051.0 Content 1%)
Figure 25 Change in composition of dripping materials - Hiroshima No. 1 Blast Furnace (from Sasaki et al. as reviewed in Reference 1)
50
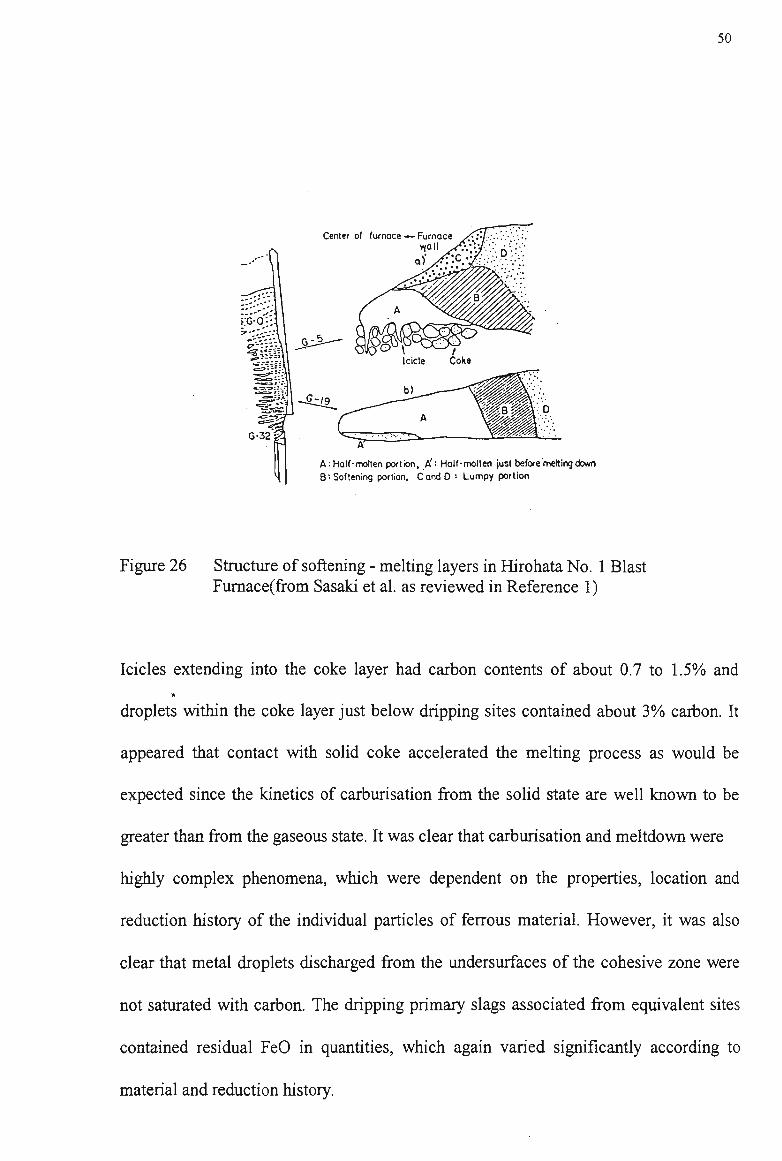
Figure 26 Structure of softening - melting layers in Hirohata No. 1 Blast Furnace(from Sasaki et al. as reviewed in Reference 1)
Icicles extending into the coke layer had carbon contents of about 0.7 to 1.5% and
droplets within the coke layer just below dripping sites contained about 3% carbon. It
appeared that contact with solid coke accelerated the melting process as would be
expected since the kinetics of carburisation from the solid state are well known to be
greater than from the gaseous state. It was clear that carburisation and meltdown were
highly complex phenomena, which were dependent on the properties, location and
reduction history of the individual particles of ferrous material. However, it was also
clear that metal droplets discharged from the undersurfaces of the cohesive zone were
not saturated with carbon. The dripping primary slags associated from equivalent sites
contained residual FeO in quantities, which again varied significantly according to
material and reduction history.

51
Investigations by Lakshmanan, M a and Lu examined the reduction of synthetic
primary slags and pre-reduced ironmaking materials in crucibles made from
commercial cokes. They concluded that the final stages of reduction were not only
highly complex but were strongly influenced by the basicity of the system. In isothermal
experiments, distinct reaction peaks were observed for slag-coke and for subsequent
slag-metal reactions. The latter involved carbon dissolved in the iron. High basicity was
noted to aid FeO reduction by increasing the activity of FeO in slags and to delay
carburisation by increasing the melting temperature of the slag. The authors pointed out
that where burdens were comprised of diverse, distinctly acidic and basic components,
best results should be anticipated where each charged layer was evenly mixed. It was
also observed that the presence of sulphur in primary slags hindered melting by
delaying carburisation.
Final carburisation in the blast furnace occurs within those zones which are the most
inaccessible. After accumulation, the hot liquid iron remains resident and in close
company with solid coke within the hearth for a period generally averaging about two
hours in modern furnaces. Therefore it is perhaps not surprising that the vast store of
anecdotal evidence and some published information are based on the assumption that
the hot metal becomes carbon saturated before being tapped from the furnace.
Buklan et al.41 reported carbon contents at various sites throughout the furnace volume
and determined statistical relationships allowing carbon content of the metal phase to
be estimated at any site. They considered carbon content of the hot metal in the hearth
to be a function of the presence of other elements (silicon, phosphorous, sulphur,
52
titanium and manganese), temperature, residence time, coke size and coke
dissolvability.
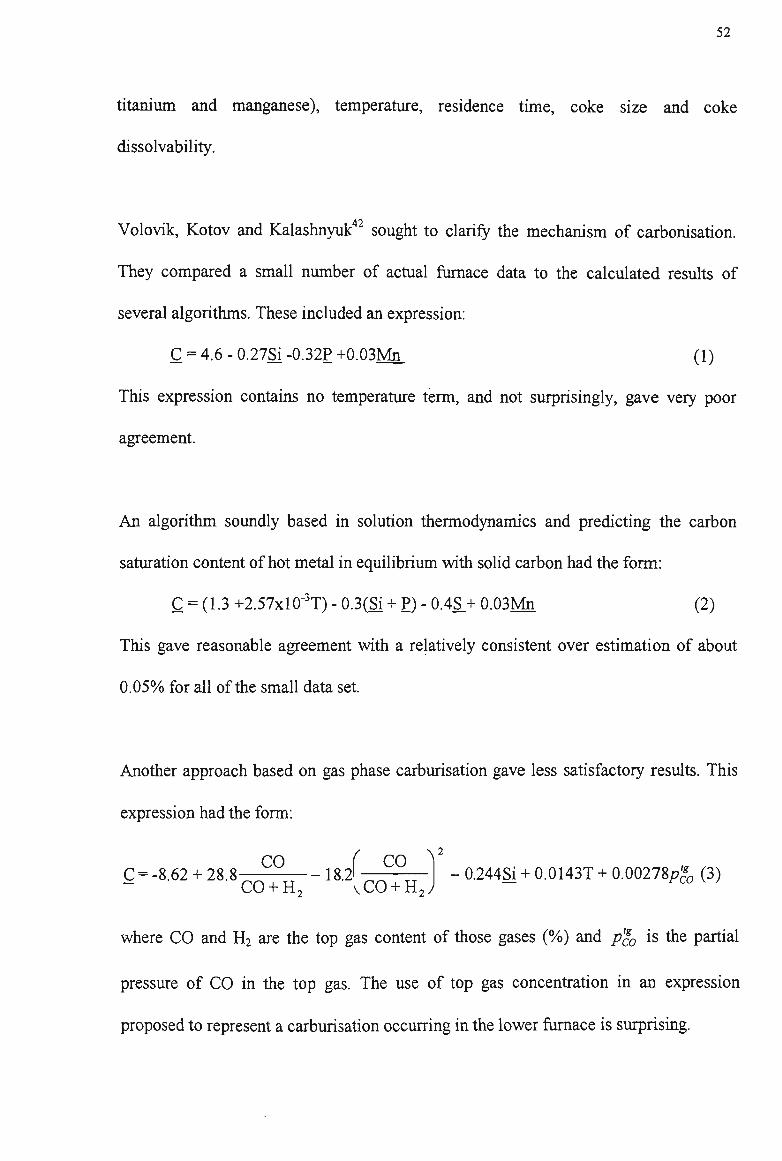
Volovik, Kotov and Kalashnyuk42 sought to clarify the mechanism of carbonisation.
They compared a small number of actual furnace data to the calculated results of
several algorithms. These included an expression:
C = 4.6 - 0.27SJ -0.32P +0.03Mn (1)
This expression contains no temperature term, and not surprisingly, gave very poor
agreement.
An algorithm soundly based in solution thermodynamics and predicting the carbon
saturation content of hot metal in equilibrium with solid carbon had the form:
C = (1.3 +2.57xlO"3T) - 0.3(Si + P) - 0.4S_+ 0.03Mn (2)
This gave reasonable agreement with a relatively consistent over estimation of about
0.05% for all of the small data set.
Another approach based on gas phase carburisation gave less satisfactory results. This
expression had the form:
C O C = -8.62 + 2 8 . 8 — 18.2
CO + H
( co 2
- 0.244SJ + 0.0143T + 0.00278;?*, (3) L2 VCO+H2;
where CO and H2 are the top gas content of those gases (%) and p'g0 is the partial
pressure of CO in the top gas. The use of top gas concentration in an expression
proposed to represent a carburisation occurring in the lower furnace is surprising.

53
These expressions were tested for a very small data set only and the authors concluded
that carburisation did not occur by the formation of carbides from the gas phase. The
results of their work are reproduced in Figure 27.
Comparison Carbon Contents
4.0 J ; , ; . . . . ,
1450 1460 1470 1480 1490 1500 1510
Temperature °C
Figure 27 Comparison of actual carbon content in hot metal with values calculated by various means (from Volovik, Kotev and Kalashnyuk42)
Using laboratory data, Neumann et al.43 ratified an expression of similarly sound origin
and very similar form to that of Equation (2). Their expression had the form
%Csat = 1.3 + 2.57xlO"3T -0.31%Sj -0.33%P -0.4%S + 0.028%Mn (4)
They obtained very good agreement with a laboratory data set comprising over twenty
melts.
In order to evaluate the possibility of forcing hot metal to conform to increasingly
difficult steelmaker's specifications through manipulation based on partitioning of
solute elements in the iron, Ponghis44 started with an approach rigorously based in
54
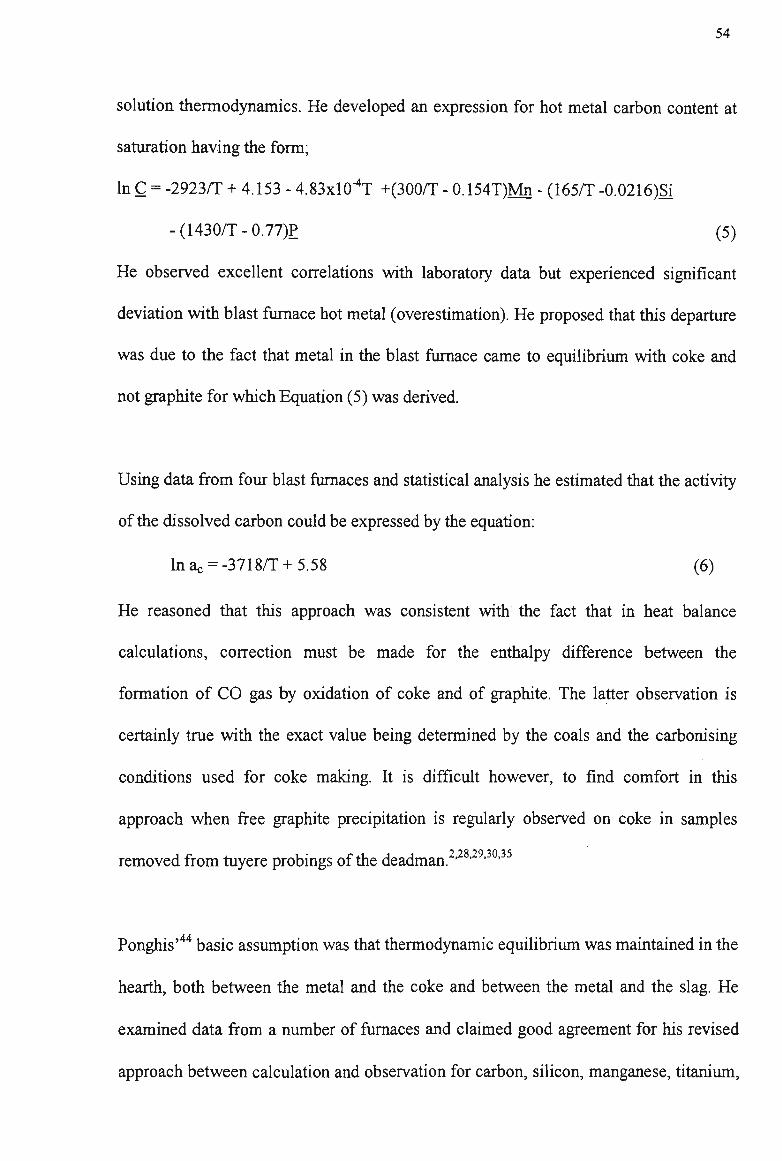
solution thermodynamics. He developed an expression for hot metal carbon content at
saturation having the form;
In C = -2923/T + 4.153 - 4.83x10^ +(300/T - 0.154T)Mn - (165/T -0.0216)Si
- (1430/T - 0.77)P (5)
He observed excellent correlations with laboratory data but experienced significant
deviation with blast furnace hot metal (overestimation). He proposed that this departure
was due to the fact that metal in the blast furnace came to equilibrium with coke and
not graphite for which Equation (5) was derived.
Using data from four blast furnaces and statistical analysis he estimated that the activity
of the dissolved carbon could be expressed by the equation:
lnac = -3718/T + 5.58 (6)
He reasoned that this approach was consistent with the fact that in heat balance
calculations, correction must be made for the enthalpy difference between the
formation of CO gas by oxidation of coke and of graphite. The latter observation is
certainly true with the exact value being determined by the coals and the carbonising
conditions used for coke making. It is difficult however, to find comfort in this
approach when free graphite precipitation is regularly observed on coke in samples
removed from tuyere probings of the deadman.2,28'29,30'35
Ponghis'44 basic assumption was that thermodynamic equilibrium was maintained in the
hearth, both between the metal and the coke and between the metal and the slag. He
examined data from a number of furnaces and claimed good agreement for his revised
approach between calculation and observation for carbon, silicon, manganese, titanium,

55
sulphur and even nitrogen. N o discussion is offered relating to trend deviations between
calculated and observed data.
Gudenau, Mulanza and Sharma45 studied the carburisation of hot metal in laboratory
experiments employing a range of industrial and special (doped) coke samples using the
rotating cylinder method. Starting from the observation that coke carburises hot metal
more slowly than graphite and being conscious of the need to protect blast furnace
hearth carbon refractories which are commonly of carbon or graphite, they set out to
clarify the influence of coke ash. They gave theoretical consideration to the mass
transfer system pertaining and developed an expression describing the carbon
dissolution into metal, viz;
(CES-CE) ( K\n'\
f—- r = e x p - k 0 v " x — — (7) (CES-CE0) \ ° V J w
This expression is relatively sound since CE represents the carbon equivalent of the
melt i.e. when corrected for the influences and interactions of solute elements on carbon
content relative to saturation. The subscripts 'S' and '0' refer to the saturated and initial
states and the work of Neumann et al43 provides the basis. Other symbols have the
following meanings;
ko is a constant
v is the velocity of the rotating cylinder (cm/s)
n is a constant usually between 0.5 and 0.75 in laminar flow conditions
A is the area of carbon diffusion (cm )
t is the reaction time (s)
n* is the ash factor (a constant)
V is the volume of the bath (cm3)

56
Since the surface area of the sample decreases with reaction, the values for A and v are
the arithmetic mean between times 0 and t. The ash factor n* was proposed as a
satisfactory indicator of coke quality with respect to carbon dissolution.
The results obtained for industrial and special cokes are shown in Tables 3 and 4
respectively and show values of the ash factor generally above 0.8 for commercial
cokes with the exception of a low value for a Chinese coke. Special cokes doped with
reagent grade oxides showed much greater variation with Al203 and MgO most
impeding the dissolution of a Thyssen Steel based test coke.
Name
Thyssen coke Saar coke Ruhr coke Foreign coke H K + carbob. G K + carbob. English coke H K 40P2 GK4P2 China coke CCCR coke FK1 (FS95) FK2 (FS96)
ash factor
n*
0,8639 0,8990 0,8713
0,8367 0,9231 0,9050 0,8821
0,8099 0,9436 0,6389 0,9372
0,8220 0,9197
C(%) at 11 min
1,50 1,72 1,55
1,17 1,59 1,54 1,44 1,13 1,62
0,61 1,89 1,25
1,50
Fe203
(%)
12,770 9,223 15,730 10,167 16,589 15,301 10,528 11,354 14,143 1,759 9,924
9,930 11,640
7s [°C] ash
1314
1274 1224 1324 1251 1219 1436
1293 1269 1509 1329
1435
1419
Table 3: Ash Factor results for industrial cokes (from Gudenau, Mulanza and Sharma )
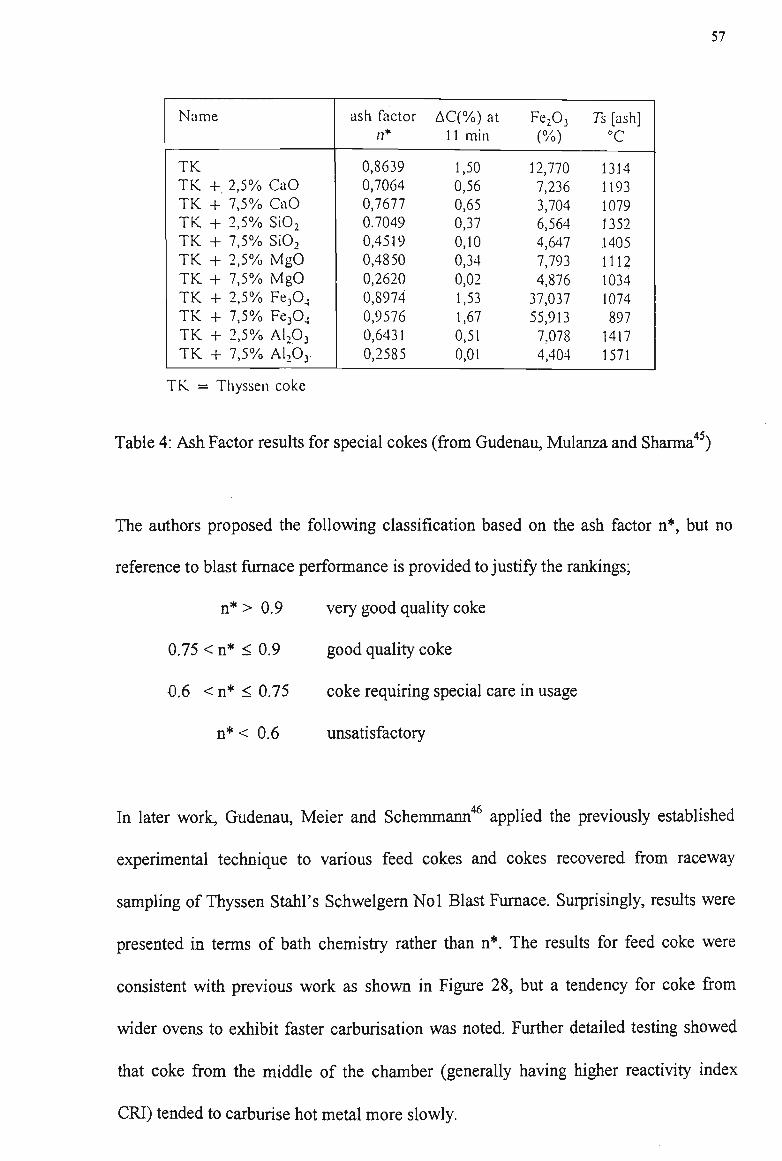
57
Name
TK TK + 2,5% CaO TK + 7,5% CaO TK + 2,5% Si02 TK + 7,5% Si02 TK 4- 2,5% MgO TK + 7,5% MgO TK + 2,5% Fe304 TK + 7,5% Fe304 TK + 2,5% AU03
TK + 7,5% Al,63-
ash factor
n*
0,8639 0,7064 0,7677 0.7049 0,4519 0,4850 0,2620 0,8974 0,9576 0,6431 0,2585
AC(%) at 11 min
1,50 0,56 0,65 0,37 0,10 0,34 0,02 1,53 1,67 0,51 0,01
FeA (%)
12,770 7,236 3,704 6,564 4,647 7,793 4,876 37,037 55,913 7,078 4,404
7s [ash] °C
1314 1193 1079 1352 1405 1112 1034 1074 897 1417 1571
T K = Thyssen coke
45s Table 4: Ash Factor results for special cokes (from Gudenau, Mulanza and Sharma )
The authors proposed the following classification based on the ash factor n*, but no
reference to blast furnace performance is provided to justify the rankings;
n* > 0.9 very good quality coke
0.75 < n* < 0.9 good quality coke
0.6 < n* < 0.75 coke requiring special care in usage
n* < 0.6 unsatisfactory
In later work, Gudenau, Meier and Schemmann applied the previously established
experimental technique to various feed cokes and cokes recovered from raceway
sampling of Thyssen Stahl's Schwelgern Nol Blast Furnace. Surprisingly, results were
presented in terms of bath chemistry rather than n*. The results for feed coke were
consistent with previous work as shown in Figure 28, but a tendency for coke from
wider ovens to exhibit faster carburisation was noted. Further detailed testing showed
that coke from the middle of the chamber (generally having higher reactivity index
CRI) tended to carburise hot metal more slowly.

58
C
| 1,5
V 1 i U 0,5|
0
— Lohberg, conv. — Lohberg, SCS — HKM, SCS — HKM, conv. — Kaiserstuhl — Thyssen — China
i I I | I I , I | I I M | I . , , | I I . , I I I I | I i I i | I M I
0 5 10 15 20 25 30 35 40
time [min]
Figure 28 Caburisation and dissolution behaviour of different raw cokes (from 46x Gudenau, Meier and Shemmann )
Results obtained with coke from tuyere coke probing are shown in Figure 29 with
considerable variations of carburising ability for cokes recovered from different depths
into the raceway and deadman. No explanation is offered for this behaviour. The low
carburisation rate of the Chinese coke was claimed to necessitate blending with other
coke of higher reactivity in practice.
U 1 =
0,5 i 0
— 300-325 cm — 150- 175 cm — China 2
— 25-40cm — China 1 — 175 - 200 cm
, i i i i i i i i i i i i i i . i . i i . i • i i i i i ' i i i i • i i i
0 5 10 15 20 25 30 35 40 time [min]
Figure 29 Carburization behaviour of coke from tuyere level due to distance from furnace wall (from Gudenau, Meier and Shemmann )
59
Olivares, Mahoney and Greedy have used a similar technique to that of Gudenau,
Mulanza and Sharma45 to examine the behaviour of Port Kembla feed coke and bosh
coke. In their work, spinning discs replaced the cylinders in order to prevent change in
available reaction area due to sample consumption. They obtained n* values of 0.42 for
feed coke and up to 0.49 for bosh coke. Both values are grossly below those previously
proposed for good quality coke. However, Port Kembla furnaces regularly achieve
productivity of 2.2 t/m3/dIV and fuel rates of 490 kg/thm or less. While some
difficulties associated with Port Kembla coke will be reported in this work, the
objectivity of the classification proposed by Gudenau, Mulanza and Sharma must be
questioned.
Lakshmanan, Ma and Lu36 also found that the reduction rates of primary slag FeO could
be significantly retarded by higher concentrations of coke ash.
Deng et al.48 made laboratory studies to simulate carburisation in the lower part of the
blast furnace. Initial studies confirmed that blast furnace hot metal samples were not
saturated and would still absorb carbon from graphite laboratory crucibles at operating
temperatures. The influences of temperature, particle size, carbon source and surface
coverage by ash (by use of partially pre-gasified coke samples) are shown in Figure 30.
These results were obtained by heating iron granules (of melting point 1450°C) placed
on top of a bed of test coke. The molten liquids were allowed to drip through the bed
for collection and measurement. The expected increases of carburisation rate with
temperature and bed height were exhibited. Carbon is seen to be progressively more
easily dissolved from charcoal, coke and graphite. Increased particle size and increased

60
surface ash coverage both reduced the rate. The authors proposed that these results were
relevant to the conditions prevailing between the cohesive zone and the hearth.
u
O O O O O O O O O O O O O O O O O rt
20 1
5-8
1
Charcoal
40
1
8-
1
Coke
1
10
60
1
12- 15
1
Graphite
1
C
1 Type
h (mm)
d (mm
of Carbon
30 40 50
As % of surface of coke covered by ash
Figure 30 Carbon dissolution into hot metal as a function of temperature, dripping height, particle diameter, carbon type and surface coverage by ash (from Deng et al.48)

61
3 The development of new indices
In this chapter, new indices are described which allow the dynamic conditions in the
hearth and deadman of an operating blast furnace to be routinely monitored. In this and
following sections of this work, the term 'hearth coke bed' refers to that mass of coke
located below a level mid way between taphole and tuyere elevations. The 'deadman
coke bed' or 'deadman' refers to the bed located above that same level. Whenever
vertical movement occurs, the two beds remain fully engaged.
3.1 The hearth voidage estimation
A method for estimating the voidage of the coke bed at the level of the taphole has been
developed by using information collected during casting. This method employs data
relating to any period of iron only flow occurring at the beginning of casting, in
combination with the preceding intercast period and the production rate during these
periods. Naturally a number of assumptions are necessary and these are listed here:
• Coke bed voidage is assumed to be isotropic and uniform and to change only
very slightly from cast to cast.
• The angle of the taphole and its length are assumed to be constant over time.
This means that the location of the "in-furnace" end of the taphole remains
constant.
• It is assumed that the molten iron-slag interface is flat and that slag starts to flow
from the taphole when the iron-slag interface reaches the taphole. This is valid
since only a very small area adjacent to the casting taphole is not flat.

62
• Measured (or estimated) iron flow rates, production rates and casting times are
assumed to be of adequate accuracy.
The voidage of the coke bed at the level of the taphole can be calculated whenever
successive casts display periods of "iron first" casting before the concurrent flow of
metal and slag. The calculation is achieved by solving simultaneous equations for the
height of the metal/slag interface at the start of the second cast.
The situation is illustrated for casts n and n+1 in Figure 31. For cast n, a mass balance
for the iron only casting period can be written. The amount of iron removed during iron
only casting from the taphole equals the initial amount of iron above the taphole, plus
the iron production during the iron only flow from the taphole, minus the residual
amount of iron above the taphole.
Taphole
. A H'i»L i He M.
Taphole
. AX- ~~.:.^.^:-M
^ ^
i <
f Hl(n+1)
"••'.•7--.J'<?Vr™ |
Cast n Cast n+1
Figure 31 The levels of iron/slag interface used in estimating hearth coke bed voidage.
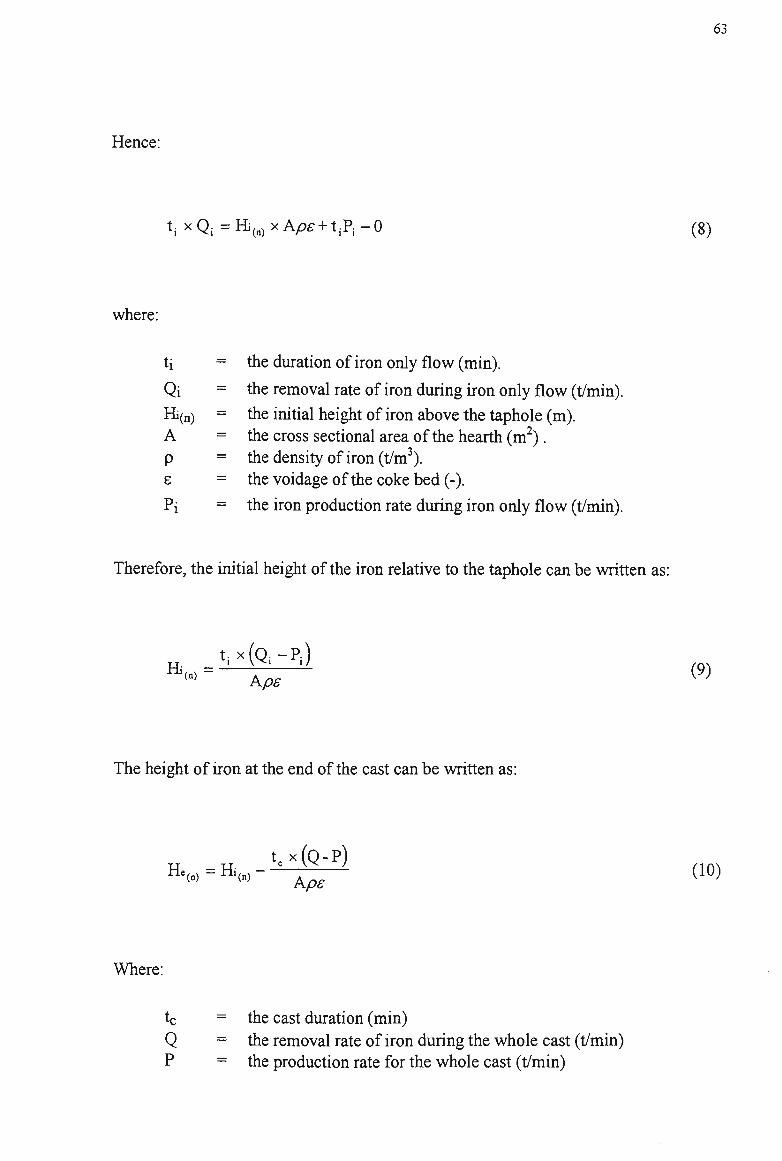
Hence:
t i x Q i = H i ( n ) x A ^ + tiPi-0
where:
ti = the duration of iron only flow (min).
Qi = the removal rate of iron during iron only flow (t/min),
Hi(n) = the initial height of iron above the taphole (m). A = the cross sectional area of the hearth (m 2 ) . p = the density of iron (t/m3). e = the voidage of the coke bed (-).
Pi = the iron production rate during iron only flow (t/min).
Therefore, the initial height of the iron relative to the taphole can be written as:
a'"» ~ hp~8
The height of iron at the end of the cast can be written as:
H -H ^X(Q-P) H*(n) " » „ " Ap£
Where:
tc = the cast duration (min) Q = the removal rate of iron during the whole cast (t/min) P = the production rate for the whole cast (t/min)
64
For cast n+1, the initial metal height may be written in similar form to that of equation
(9). The metal height can also be written as:
t x P HVD = He(n) +
WA^
W (11)
where:
tw = the intercast period between casts n and n+1 (min). Pw = the production rate during the intercast period (t/min).
By equating equation (11) and equation (9) for cast n+1, and rearranging, an expression
for the voidage of the coke bed is obtained:
* = '' ' (12) He(n)Ap
where Qi, P; and ti relate to the n+1 cast.
3.2 The Deadman Cleanliness Index
Following discharge from the lower surface of the cohesive zone, metal and slag
droplets drain through a packed coke bed before collecting in the furnace hearth. Coke
bed contact continues for a finite but different duration for each collected phase before
removal from the furnace hearth.

65
3.2.1 Deadman Solids
The coke lumps in this part of the furnace are the survivors of the physical and chemical
rigours of prior handling and passage through the upper parts of the furnace. As such,
the coke bed is expected to dynamically reflect changes in input coke quality. These are
usually derived from variations in the coal blend and its preparation and to changes in
coke battery operating practice. Adjustments to blast furnace feed conditions (eg. alkali
loadings) and operating intensity may also influence coke degradation. The level of
process stability required for viable contemporary operation dictates that changes such
as these occur infrequently.
As a result, changes in the coke bed of the blast furnace deadman and hearth generally
occur over days and weeks. This behaviour is reinforced by the solid flow dynamics of
the process itself and this has been confirmed by quenched furnace investigations,1 use
of radioactive isotopes,49 and laboratory modeling22 in addition to widespread anecdotal
evidence.
The presence of fine solid particles impairs the permeability of a fixed or slow moving
bed by increasing the fluid-solid contact area and friction forces. In the case of the blast
furnace deadman, three sources of fine material may broadly be identified. The first is
fines carried down from above where they may have been introduced with the charge,
They may also be the result of volume and surface breakage responses to the forces of
the lumpy and cohesive zones. In the case of coke there may also be the abraded
products of surface weakening due to the carbon solution loss reaction,

66
The second potential source of fines is the unfluxed oxide particles. Species such as
Si02, A1203, Ti02, CaO and MgO or particles extremely rich in these species are
generally solid at deadman temperatures. Solid particles may be deposited from
dripping slags which still contain a dispersed solid phase at discharge. Additionally,
oxide particles may be precipitated by dripping slags where FeO serves as the flux. In
such cases, subsequent removal of the FeO on reaction with contacted coke particles
raises the liquidus temperature of the remaining slag until solidification occurs. This
behaviour is possible with both highly acidic and highly basic slags, but is more likely
to be a problem with highly acidic Si02 or Ti02 based slags due to the much greater
reducibility of highly basic slags which are likely to drip with very low residual FeO
contents. Solid oxide particles can be dynamically removed by dissolution into
compositionally suitable contacting slag droplets. This mechanism also serves to
dissolve solid ash from the surface of coke particles.
The third source of solids is the raceways. These carbonaceous fines may be coke debris
or incompletely combusted char from pulverised coal injection. Raceway gases carry
these particles into the deadman and the active coke zone. The behaviour of these
particles may vary widely depending on their size, the chemical reactivity of the carbon
and the nature of associated oxide (ash) phases. Because gas velocities in the deadman
are lower than in the active coke zone (especially near the furnace centre) the
deposition of larger particles, often those derived from coke, is a particular threat in this
region. The deposition of graphite (kish) from tiny droplets of iron expelled from the
furnace raceway is also possible since sites remote from the raceway are at considerably
lower temperature. Graphite is variably observed in shutdown tuyere coke probings and

67
this may reflect the fact that the probability of its deposition is greater in an operation
with unstable heat balance.
3.2.2 Deadman Liquids
The blast furnace ferrous burden is most commonly a mixture of up to five discrete
materials. Of these, the most commonly used is sinter which is itself an inhomogeneous
agglomerate of diverse fine ores and fluxes. While some mixing of these materials
always occurs (and is often promoted) individual solid particles generally give rise to
separate liquid dripping products. Therefore the furnace deadman represents a highly
heterogeneous reaction environment as droplets of metal and slag move through the
coke bed and through gradients of temperature and reduction potential. While
laboratory experiments have been devised to study the meltdown behaviour of
individual and mixed ferrous materials, very little is known about the behaviour or
mixing of molten products within the deadman.
The collected pools of metal and slag in the furnace hearth represent a much more
homogeneous condition but still the opportunity for heterogeneous reaction exists as the
metal droplets pass through the slag layer, at the interfacial surface and at contact
surfaces with the coke.
3.2.3 Deadman Reactions
When the coke bed in the blast furnace deadman has high permeability, the dripping
metal and slag products move rapidly into the hearth under the influence of gravity. The
individual transit time may, of course, vary with viscosity in the case of slag droplets.

68
W h e n liquids pass through the coke bed in the deadman/hearth there are five possible
types of reaction; i.e. coke/metal, coke/slag, metal/slag, gas/metal and gas/slag
reactions. In these heterogeneous reactions, the kinetics of reaction depend on the area
of contact and the time of contact of reacting phases. Proper treatment of these
heterogeneous reactions may be found elsewhere. 50 At the present point, only the
coke/metal reaction will be considered. Phenomena arising from the other four reaction
types will be considered in Section 5.4.
The carburisation reaction may be written:
C (coke) + Fe (1) -• Hot metal
When this reaction is completed, hot metal becomes saturated with carbon for a given
temperature.
Within the volume below the cohesive zone, a condition of supply and demand exists
for carbon. The demand or saturation limit is determined by the temperature of the hot
metal and the presence of other solute elements. The carbon supply is determined by the
initial dripping content of the hot metal (ie. burden mix dependent), the reactivity of the
carbon sources present45 and the available contact time and surface area of contact.
Dripping metal, while derived from all the ferrous burden materials is relatively
uniform at the time of discharge when compared to the often highly diverse dripping
slags. The high density and low viscosity of the metal also minimise the opportunity for
factors other than the nature of the coke bed to influence kinetics of carburisation.
69
In a blast furnace regime characterised by stable coke quality, injectant load, burden
mix, tuyere conditions, casting and burden distribution practices, it is to be expected
that the supply/demand balance will be essentially maintained. Until recently, it has
been widely assumed that the driving force and time available for carbon dissolution are
sufficient to ensure that saturation is the norm if not the rule. In fact, hot metal tapped
from the blast furnace is almost always not saturated, and in general the greater the
departure from saturation, the better the internal condition and performance of the
furnace. Carbon sub-saturation of 0.2% or greater is observed for a clean deadman.
Once this non-saturated state is recognised, the degree of departure from equilibrium
may be used to study the furnace response to a change in any of the previously listed
variables determining carbon supply and demand.
In order to maintain high deadman permeability it is necessary that dripping metal
consistently consumes fine carbonaceous material. Of course, dripping metal contacts
survivor coke particles as well, and dissolves carbon from these too. It follows that
when metal drains rapidly through the clean deadman it does little damage to the
deadman coke lumps and arrives in the hearth with a carbon appetite able to promote
hearth cleanliness and renewal with sound coke. When the dripping metal is retained in
a low permeability deadman, it causes damage to the deadman coke and arrives in the
hearth with little appetite to remove any fines. The hearth coke bed renewal is retarded
and when it is renewed it is by previously damaged deadman coke. Therefore, once the
deadman is dirtied recovery is often very difficult and prolonged. The situation is
illustrated in Figure 32.
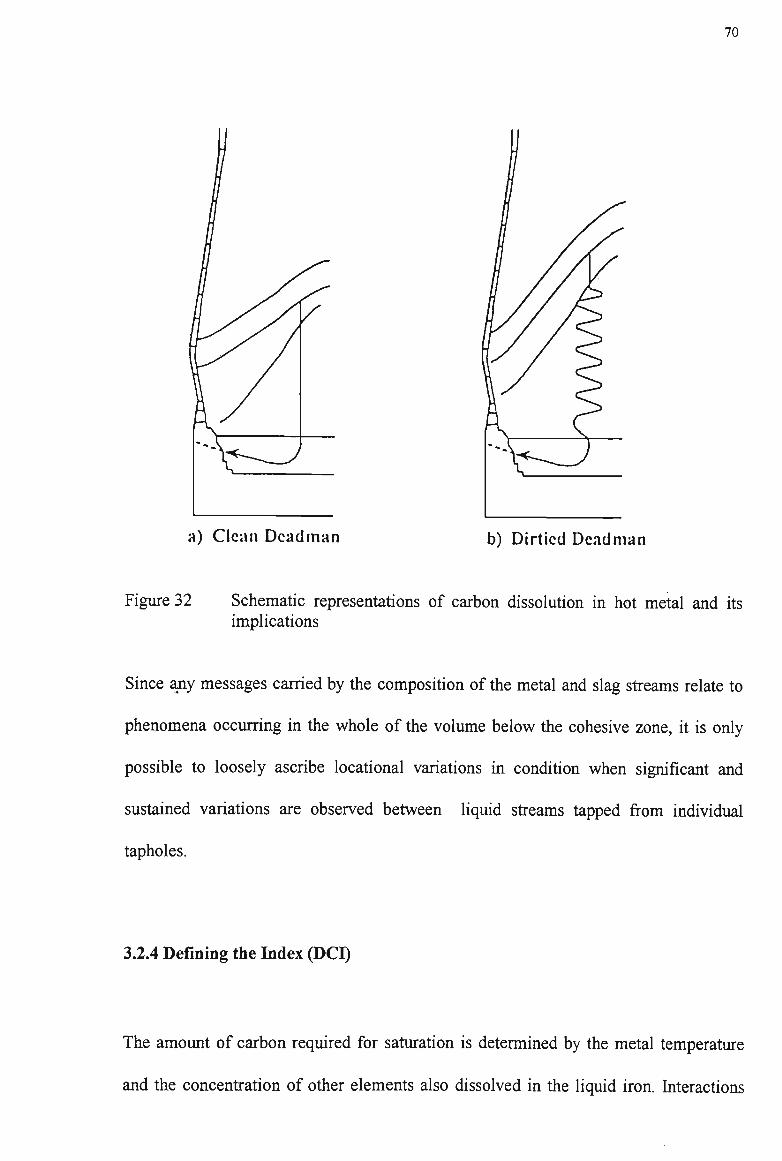
70
a) Clean D e a d m a n b) Dirtied D e a d m a n
Figure 32 Schematic representations of carbon dissolution in hot metal and its implications
Since any messages carried by the composition of the metal and slag streams relate to
phenomena occurring in the whole of the volume below the cohesive zone, it is only
possible to loosely ascribe locational variations in condition when significant and
sustained variations are observed between liquid streams tapped from individual
tapholes.
3.2.4 Defining the Index (DCI)
The amount of carbon required for saturation is determined by the metal temperature
and the concentration of other elements also dissolved in the liquid iron. Interactions

71
between solute species occur at the atomic level and marked changes in solute activities
can arise. However, a linear approximation has been found to be adequate.
At Port Kembla, the expression developed by Neumann et al43 which considers carbon
saturation in iron containing small amounts of silicon, sulphur, phosphorous and
manganese is used to determine the carbon content at saturation. This expression has
the form:
%C_sat = 1.3 + 2.57xlO-3.T -0.31%Si - 0.33%P - 0.4%S + 0.028%Mn (4)
All concentrations are in weight percent and temperature is in degrees Celsius.
Although variations in the concentration of the other elements such as titanium must be
acknowledged as potential sources of error, these have not proven to have a debilitating
effect on the application of this expression.
The departure of hot metal carbon content from the saturation value, AC is readily
determined.
AC= %Csat-%Cactuai (13)
Because dirtying of the deadman by slag is also possible, the hybrid Deadman
Cleanliness Index (DCI) has been developed by combining the temperature sensitive

72
term of Equation (4) and the A C value with an expression describing sensitivity of the
liquidus temperature of the Port Kembla tapped slag to its lime/silica basicity index.
DC/ = HMT + ^7^rAC-(l430-190*(l.23-^)) (14)
where; HMT = hot metal temperature, and
C/S = the CaO/Si02 ratio of the tapped slag.
The constant 2.57* 10"3 is a conversion factor from the unit of concentration to the unit
of temperature; the slag liquidus temperature at C/S = 1.23 is 1430°C.
While there is little doubt that information on the primary or dripping slags would be
preferable, this information is not readily available. The above expression has proven to
be of greater utility in the Port Kembla circumstance than the AC value alone.
Once it is understood that the status of the deadman coke bed is implicated in the hot
metal carbon content, other messages about the behaviour of dripping slags can be
inferred from the partitioning behaviour of certain elements. These behaviours also
depend on the condition of the coke bed through which the slag must also drip and are
discussed in Section 5.4.

73
4 Data sources - their management and integrity
4.1 Hearth voidage estimation
In addition to the assumptions listed in Section 3.1, a number of real and potential data
measurement errors must be recognised. Cast duration, metal only casting duration and
iron removal rate all depend on the correct entry of event times to the relevant data base
systems by unskilled casthouse operators. The use of time differences between separate
events may compound the associated errors. Port Kembla No.6 Blast Furnace is
equipped with calibrated load cells for the weighing of tapped hot metal. Naturally,
some errors exist with this equipment but they are less than at all other BHP furnaces
where torpedo ladle contents are determined by remote weighbridges on emptying. At
furnaces other than Port Kembla No.6, the mass of iron cast before the commencement
of slag flow can only be determined by operator estimation.
The refractories of the main iron/slag separation trough, into which liquids initially are
tapped wear over a period of days. Therefore, observed iron only casting periods may
vary for the same actual period of iron only discharge as a quantity of slag accumulates
in the trough before overflowing to allow initial slag flow observation.
Variations in taphole length are commonly of the order of + 0.3m about the mean. The
effect of this variation is greatly reduced by the 10° inclination of the tapholes from the
horizontal. This angle is quite stable and errors derived from taphole variation are
believed to be minor.

74
The possibility for the real hearth diameter of the furnace to increase over the course of
a campaign must be acknowledged but such wear is anticipated to be gradual and the
matter can generally be reasonably ignored. Decrease due to skull build up is also
possible but is also ignored in this treatment.
On furnaces with continuous or near continuous casting from multiple tapholes,
simultaneous discharge of metal and slag from the commencement of a tapping is often
observed Since sequential casts displaying iron first discharge are required for a
successful estimation of hearth voidage, the success rate on such furnaces can be very
low. The rate for Port Kembla No.5 Blast Furnace has been <10% since 1997.
Successful estimates falling outside the range 0.2 < s < 0.5 are edited out on the basis
that such values are considered highly likely to reflect faulty data (most probably time).
Finally, because of the slow turnover of coke in the hearth, a 30 day moving average
smoothing is applied to the calculated outputs. The utility of this practice is
demonstrated in Figure 33 where data for Nos. 2 and 4 Blast Furnaces at Port Kembla
are shown in unsmoothed and smoothed form. The unsmoothed data shows large day to
day variations attributable to the factors mentioned above.
Figure 33 shows data for a one year period. After smoothing, similar trends are
exhibited by each furnace with the most likely cause for this similarity being the
common coke supply to the furnaces. (Both furnaces also had the same ferrous burdens
and supervisional philosophy.) The slightly lower average voidage calculated for No.2
Blast Furnace may be explained by the use of "probability" screens which give a less
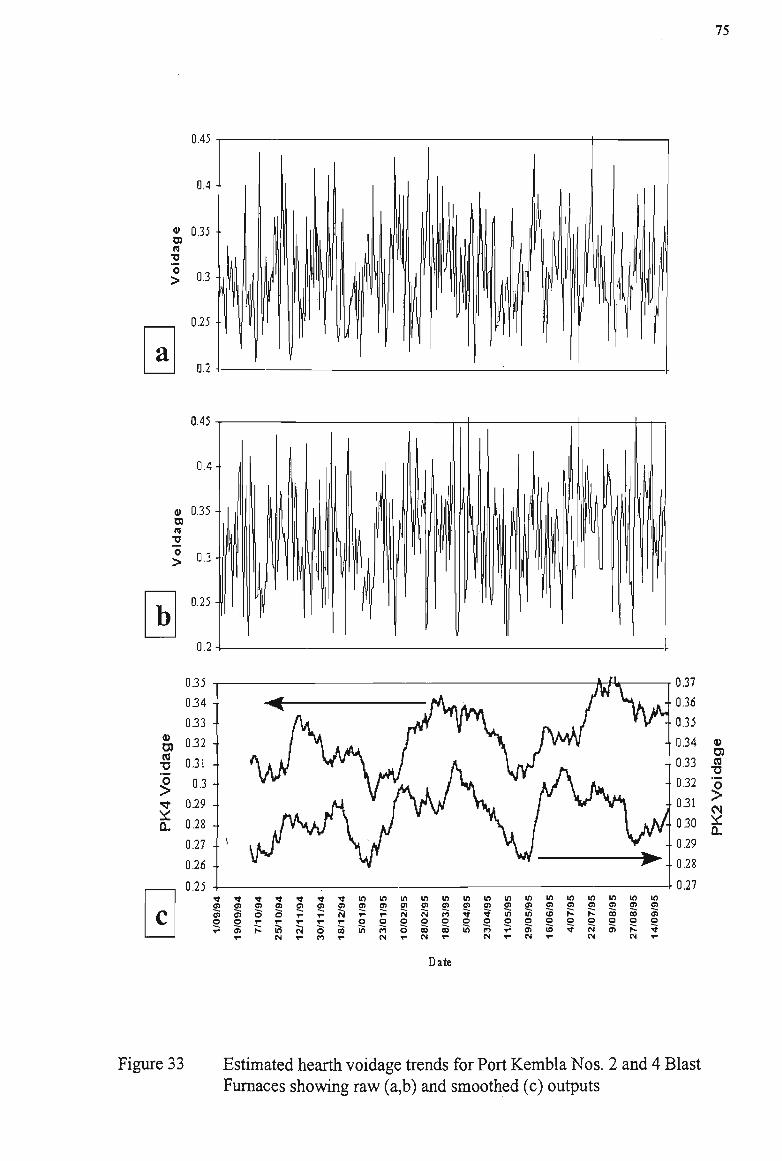
75
0.45
03 5
CD
CI (0 T3
§ T V CL
034 -
033 -
032 •
031 -
0.3 -
0.29 -
0.28 -
0.27 -•
0.26 -•
0.25
4) 01 ra •u
I a.
Date
Figure 33 Estimated hearth voidage trends for Port Kembla Nos. 2 and 4 Blast Furnaces showing raw (a,b) and smoothed (c) outputs
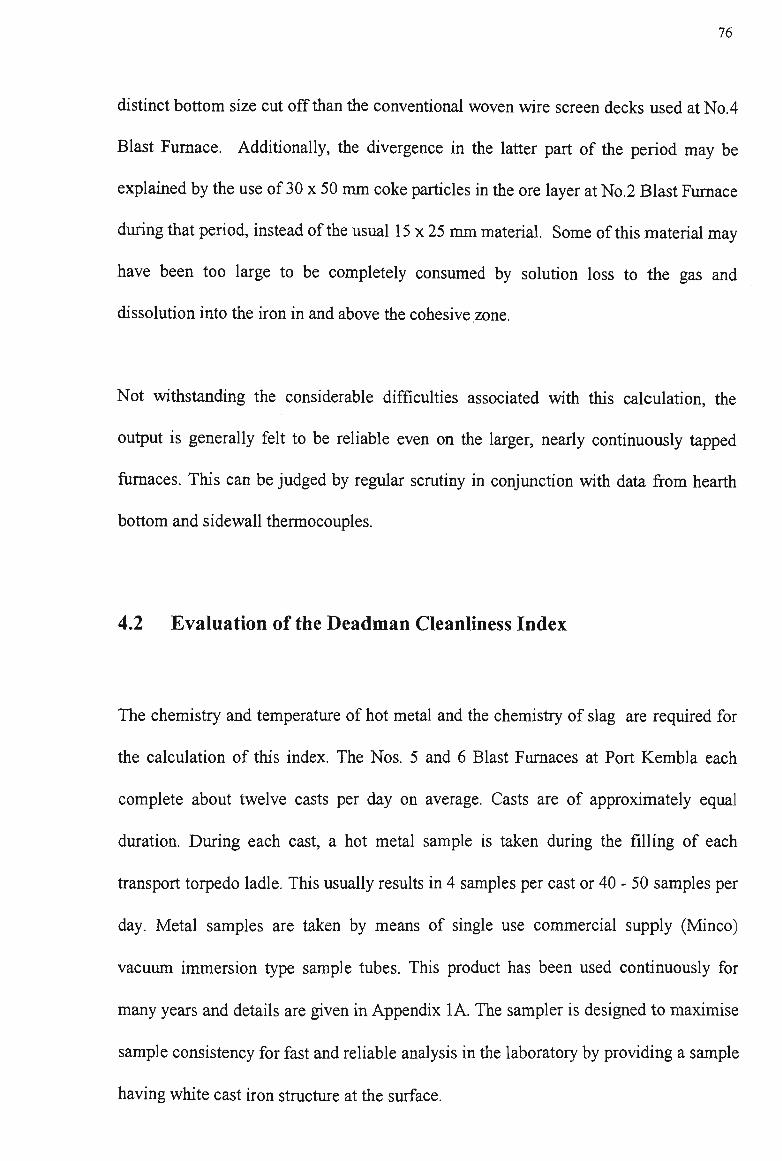
76
distinct bottom size cut off than the conventional woven wire screen decks used at No.4
Blast Furnace. Additionally, the divergence in the latter part of the period may be
explained by the use of 30 x 50 mm coke particles in the ore layer at No.2 Blast Furnace
during that period, instead of the usual 15 x 25 mm material. Some of this material may
have been too large to be completely consumed by solution loss to the gas and
dissolution into the iron in and above the cohesive zone.
Not withstanding the considerable difficulties associated with this calculation, the
output is generally felt to be reliable even on the larger, nearly continuously tapped
furnaces. This can be judged by regular scrutiny in conjunction with data from hearth
bottom and sidewall thermocouples.
4.2 Evaluation of the Deadman Cleanliness Index
The chemistry and temperature of hot metal and the chemistry of slag are required for
the calculation of this index. The Nos. 5 and 6 Blast Furnaces at Port Kembla each
complete about twelve casts per day on average. Casts are of approximately equal
duration. During each cast, a hot metal sample is taken during the filling of each
transport torpedo ladle. This usually results in 4 samples per cast or 40 - 50 samples per
day. Metal samples are taken by means of single use commercial supply (Minco)
vacuum immersion type sample tubes. This product has been used continuously for
many years and details are given in Appendix 1 A. The sampler is designed to maximise
sample consistency for fast and reliable analysis in the laboratory by providing a sample
having white cast iron structure at the surface.
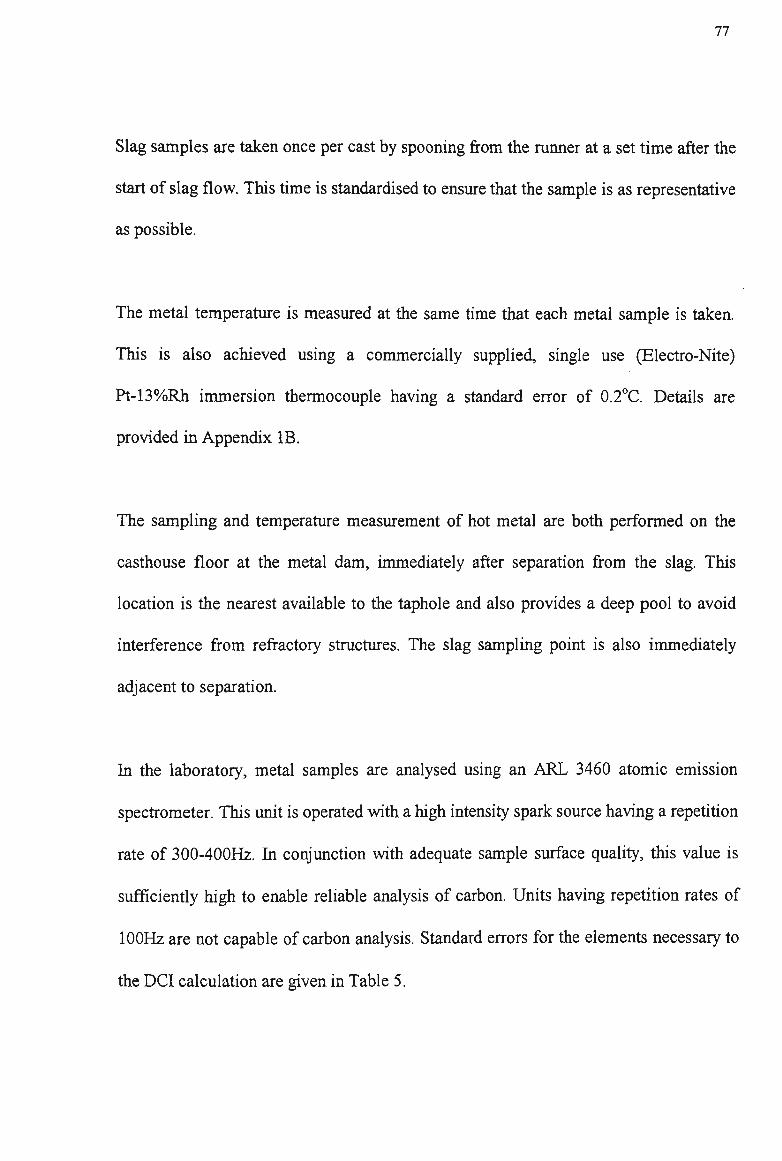
77
Slag samples are taken once per cast by spooning from the runner at a set time after the
start of slag flow. This time is standardised to ensure that the sample is as representative
as possible.
The metal temperature is measured at the same time that each metal sample is taken.
This is also achieved using a commercially supplied, single use (Electro-Nite)
Pt-13%Rh immersion thermocouple having a standard error of 0.2°C. Details are
provided in Appendix IB.
The sampling and temperature measurement of hot metal are both performed on the
casthouse floor at the metal dam, immediately after separation from the slag. This
location is the nearest available to the taphole and also provides a deep pool to avoid
interference from refractory structures. The slag sampling point is also immediately
adjacent to separation.
In the laboratory, metal samples are analysed using an ARL 3460 atomic emission
spectrometer. This unit is operated with a high intensity spark source having a repetition
rate of 300-400Hz. In conjunction with adequate sample surface quality, this value is
sufficiently high to enable reliable analysis of carbon. Units having repetition rates of
100Hz are not capable of carbon analysis. Standard errors for the elements necessary to
the DCI calculation are given in Table 5.

78
Table 5: Standard errors of iron analysis - Port Kembla
Element C Si P S Mn
Standard Error (%) 0.046 0.010 0.002 0.0002 0.006
Slag samples are analysed with an A R L 8480 X-ray fluorescence spectrometer.
Standard errors for principal slag components are shown in Table 6.
Table 6: Standard errors of slag analysis - Port Kembla
Component Si02 FeQ A1203 MnO CaO MgO S K20 P
Standard Error (%) 0.051 0.012 0.032 0.011 0.110 0.020 0.006 0.010 0.0007
High frequency sampling trials have shown that the repeatability of hot metal
temperature measurement is about 4.1°C and that the repeatability of hot metal and slag
chemistry sampling are as listed in Table 7.
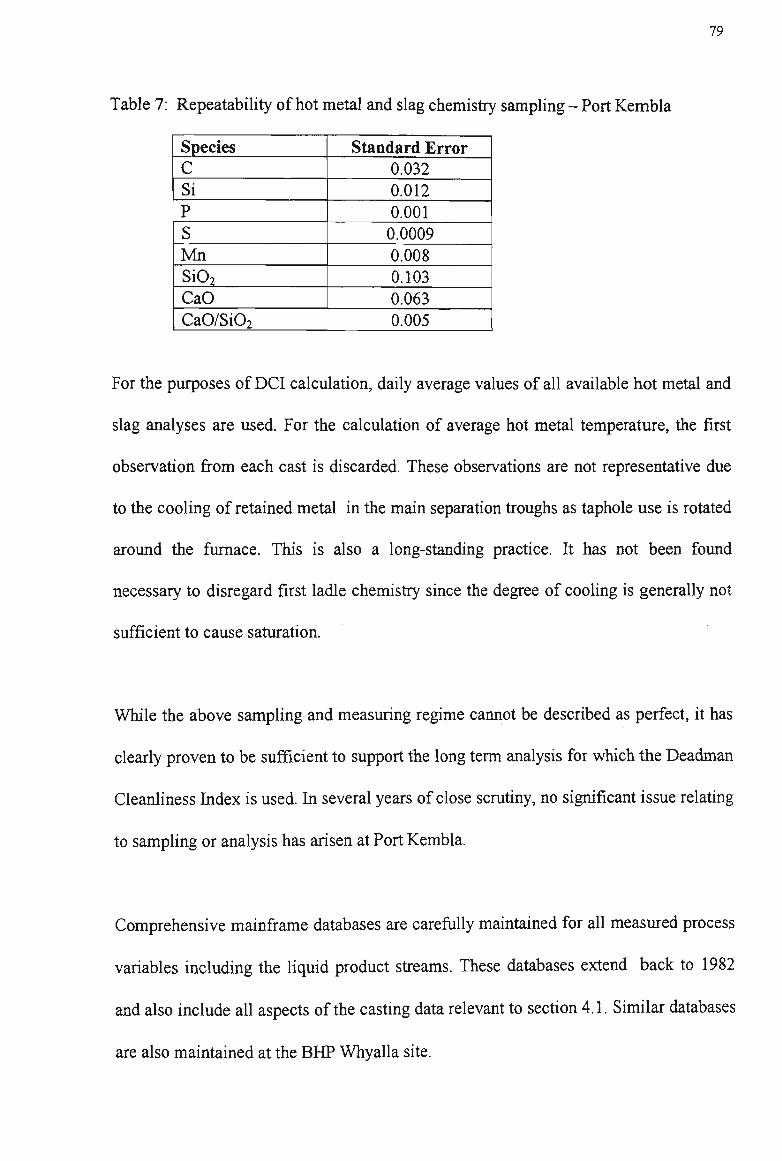
79
Table 7: Repeatability of hot metal and slag chemistry sampling - Port Kembla
Species C Si P S Mn Si02
C a O CaO/Si02
Standard Error 0.032 0.012 0.001 0.0009 0.008 0.103 0.063 0.005
For the purposes of D C I calculation, daily average values of all available hot metal and
slag analyses are used. For the calculation of average hot metal temperature, the first
observation from each cast is discarded. These observations are not representative due
to the cooling of retained metal in the main separation troughs as taphole use is rotated
around the furnace. This is also a long-standing practice. It has not been found
necessary to disregard first ladle chemistry since the degree of cooling is generally not
sufficient to cause saturation.
While the above sampling and measuring regime cannot be described as perfect, it has
clearly proven to be sufficient to support the long term analysis for which the Deadman
Cleanliness Index is used. In several years of close scrutiny, no significant issue relating
to sampling or analysis has arisen at Port Kembla.
Comprehensive mainframe databases are carefully maintained for all measured process
variables including the liquid product streams. These databases extend back to 1982
and also include all aspects of the casting data relevant to section 4.1. Similar databases
are also maintained at the BHP Whyalla site.

80
4.3 Tuyere coke probes
Tuyere coke probing of the deadman coke bed was conducted at a number of scheduled
shutdowns of Port Kembla Nos. 5 and 6 Blast Furnaces during 1997/8 using apparatus
similar to that shown in Figure 34. An open ended steel tube of 200mm diameter was
inserted through a tuyere opening after removal of the tuyere. Attempts were made to
standardise the time delay from shutdown to sampling in order to allow comparison
between the amounts of liquid metal and slag held up in the coke bed.
Figure 34 Diagram of tuyere coke probing equipment
The external end of the tube remained sealed at all times and the tube was inserted to
the maximum possible depth before retraction. On removal, the open end of the tube
was immediately sealed with a clay plug and the whole tube was rapidly cooled with
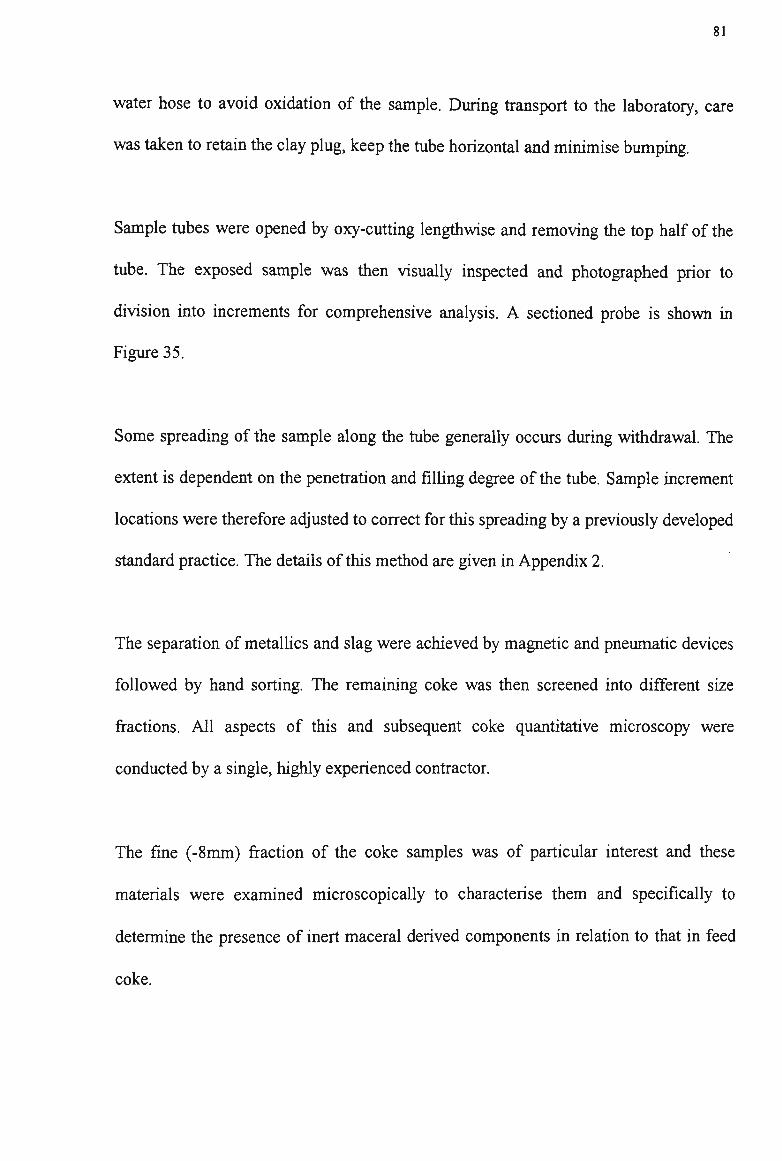
81
water hose to avoid oxidation of the sample. During transport to the laboratory, care
was taken to retain the clay plug, keep the tube horizontal and minimise bumping.
Sample tubes were opened by oxy-cutting lengthwise and removing the top half of the
tube. The exposed sample was then visually inspected and photographed prior to
division into increments for comprehensive analysis. A sectioned probe is shown in
Figure 35.
Some spreading of the sample along the tube generally occurs during withdrawal. The
extent is dependent on the penetration and filling degree of the tube. Sample increment
locations were therefore adjusted to correct for this spreading by a previously developed
standard practice. The details of this method are given in Appendix 2.
The separation of metallics and slag were achieved by magnetic and pneumatic devices
followed by hand sorting. The remaining coke was then screened into different size
fractions. All aspects of this and subsequent coke quantitative microscopy were
conducted by a single, highly experienced contractor.
The fine (-8mm) fraction of the coke samples was of particular interest and these
materials were examined microscopically to characterise them and specifically to
determine the presence of inert maceral derived components in relation to that in feed
coke.
82
Figure 35 Sectioned tuyere coke probe sample
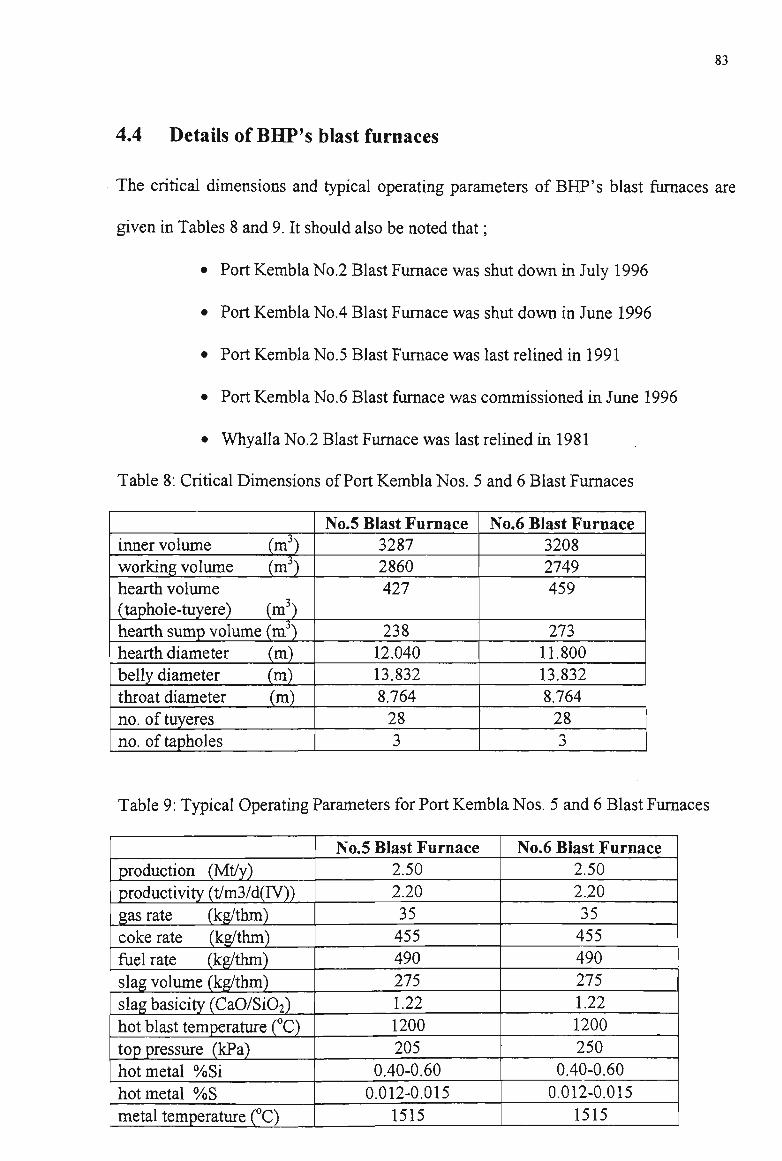
4.4 Details of BHP's blast furnaces
The critical dimensions and typical operating parameters of BHP's blast furnaces
given in Tables 8 and 9. It should also be noted that;
• Port Kembla No.2 Blast Furnace was shut down in July 1996
• Port Kembla No.4 Blast Furnace was shut down in June 1996
• Port Kembla No. 5 Blast Furnace was last relined in 1991
• Port Kembla No.6 Blast furnace was commissioned in June 1996
• Whyalla No.2 Blast Furnace was last relined in 1981
Table 8: Critical Dimensions of Port Kembla Nos. 5 and 6 Blast Furnaces
•5
inner volume (m ) working volume (m3) hearth volume (taphole-tuyere) (m3) hearth sump volume (m3) hearth diameter (m) belly diameter (m) throat diameter (m) no. of tuyeres no. of tapholes
No.5 Blast Furnace 3287 2860 427
238 12.040 13.832 8.764 28 3
No.6 Blast Furnace 3208 2749 459
273 11.800 13.832 8.764 28 3
Table 9: Typical Operating Parameters for Port Kembla Nos. 5 and 6 Blast Furnaces
production (Mt/y) productivity (t/m3/d(TV)) gas rate (kg/thm) coke rate (kg/thm) fuel rate (kg/thm) slag volume (kg/thm) slag basicity (CaO/Si02) hot blast temperature (°C) top pressure (kPa) hot metal %Si hot metal % S
metal temperature (°C)
No.5 Blast Furnace 2.50 2.20 35 455 490 275 _j 1.22 1200 205
0.40-0.60 0.012-0.015
1515
No.6 Blast Furnace 2.50 2.20 35 455 490 275 1.22 1200 250
0.40-0.60
0.012-0.015 1515

84
5 Observations and discussion
5.1 Introduction
This chapter demonstrates the utility of the hearth voidage estimation and Deadman
Cleanliness Index by review of operating data from Australian blast furnaces.
In Section 5.2, the causes and implications of dynamic variation of hearth coke bed
voidage are explored. In the literature, the prior lack of any monitoring method has
caused the voidage to be generally assumed to be of constant value. Once the voidage is
recognised to be variable, it follows that the fundamentals of the force balance, which
determines the location and stability of the coke bed, must also vary due to change in
the buoyancy of the bed. The ability for effective hearth permeability to be influenced
by casting practice is presented. The role of poor hearth coke bed voidage in one case of
penetration damage of hearth sidewall refractory is also reviewed.
In Section 5.3, discussion is presented to illustrate that a number of raw materials and
operating practice issues can dynamically influence the supply and demand for carbon
that occurs below the cohesive zone
In Section 5.4, the consequences of coke/slag, metal/slag, gas/metal and gas/slag
interactions which occur below the cohesive zone are also reviewed. These
observations confirm that permeability to all forms of fluid flow can be compromised
by the accumulation of fines in the deadman coke bed.
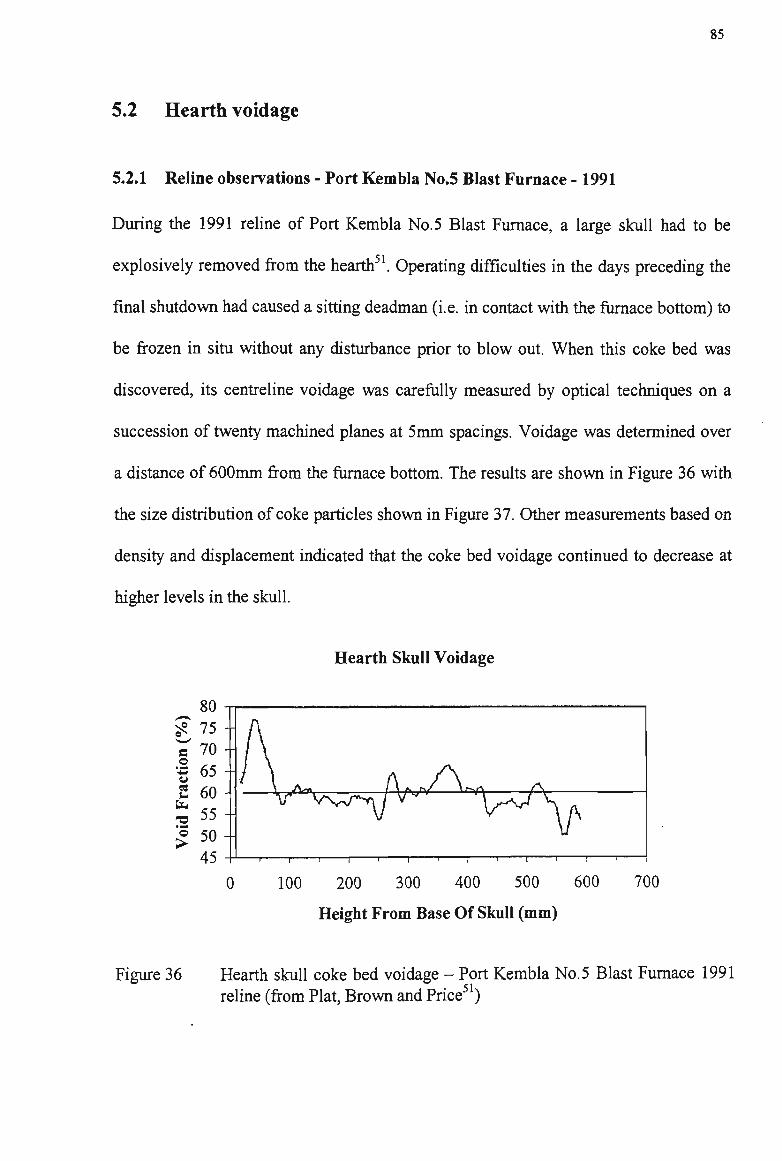
85
5.2 Hearth voidage
5.2.1 Reline observations - Port Kembla No.5 Blast Furnace -1991
During the 1991 reline of Port Kembla No.5 Blast Furnace, a large skull had to be
explosively removed from the hearth51. Operating difficulties in the days preceding the
final shutdown had caused a sitting deadman (i.e. in contact with the furnace bottom) to
be frozen in situ without any disturbance prior to blow out. When this coke bed was
discovered, its centreline voidage was carefully measured by optical techniques on a
succession of twenty machined planes at 5mm spacings. Voidage was determined over
a distance of 600mm from the furnace bottom. The results are shown in Figure 36 with
the size distribution of coke particles shown in Figure 37. Other measurements based on
density and displacement indicated that the coke bed voidage continued to decrease at
higher levels in the skull.
Hearth Skull Voidage
£ 50--I 1 1 1 1 1 1 1 1 1 1 r
100 200 300 400 500 600 700
Height From Base Of Skull (mm)
Figure 36 Hearth skull coke bed voidage - Port Kembla No.5 Blast Furnace 1991 reline (from Plat, Brown and Price51)

86
Coke Size Distribution In Skull
^
25
20
•S 15 «
^ 10 4>
a 5 • Hlllll. 6 12 18 24 30 36 42 48 54 60 66
Particle Diameter
Figure 37 Hearth skull coke size distribution - Port Kembla No.5 Blast Furnace 1991 reline (from Plat, Brown and Price51)
It should be noted that the pores of the coke lumps from levels below the taphole were
filled with slag. This is consistent with previous observations1 and the presence of slag
rather than iron serves to increase the net buoyancy force acting on the coke bed.
The lack of fine particles in the bottom of the coke bed is important and consistent with
their being floated out of the bed as a result of high buoyancy forces in the much denser
iron. Buoyancy forces in a slag bath would be much lower and for this reason a
significant decrease in voidage might be expected about the level where the metal slag
interface usually exists in the blast furnace hearth. For near continuous casting (as is
common on most large furnaces), this interface is usually located close to the taphole
level and changes little over time. Such immobility is unlikely be good for maintaining
and promoting the cleanliness of the hearth coke bed since a certain amount of agitation
is probably needed to liberate fines from within the bed.
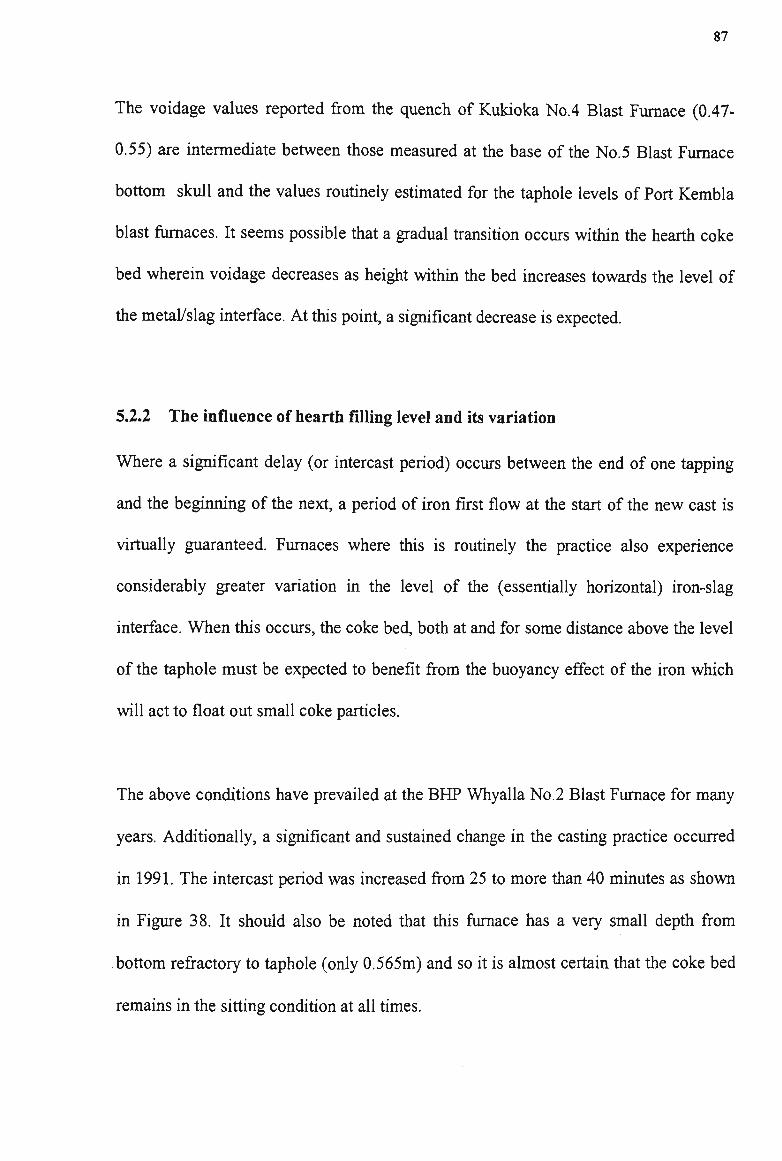
87
The voidage values reported from the quench of Kukioka No.4 Blast Furnace (0.47-
0.55) are intermediate between those measured at the base of the No.5 Blast Furnace
bottom skull and the values routinely estimated for the taphole levels of Port Kembla
blast furnaces. It seems possible that a gradual transition occurs within the hearth coke
bed wherein voidage decreases as height within the bed increases towards the level of
the metal/slag interface. At this point, a significant decrease is expected.
5.2.2 The influence of hearth filling level and its variation
Where a significant delay (or intercast period) occurs between the end of one tapping
and the beginning of the next, a period of iron first flow at the start of the new cast is
virtually guaranteed. Furnaces where this is routinely the practice also experience
considerably greater variation in the level of the (essentially horizontal) iron-slag
interface. When this occurs, the coke bed, both at and for some distance above the level
of the taphole must be expected to benefit from the buoyancy effect of the iron which
will act to float out small coke particles.
The above conditions have prevailed at the BHP Whyalla No.2 Blast Furnace for many
years. Additionally, a significant and sustained change in the casting practice occurred
in 1991. The intercast period was increased from 25 to more than 40 minutes as shown
in Figure 38. It should also be noted that this furnace has a very small depth from
bottom refractory to taphole (only 0.565m) and so it is almost certain that the coke bed
remains in the sitting condition at all times.
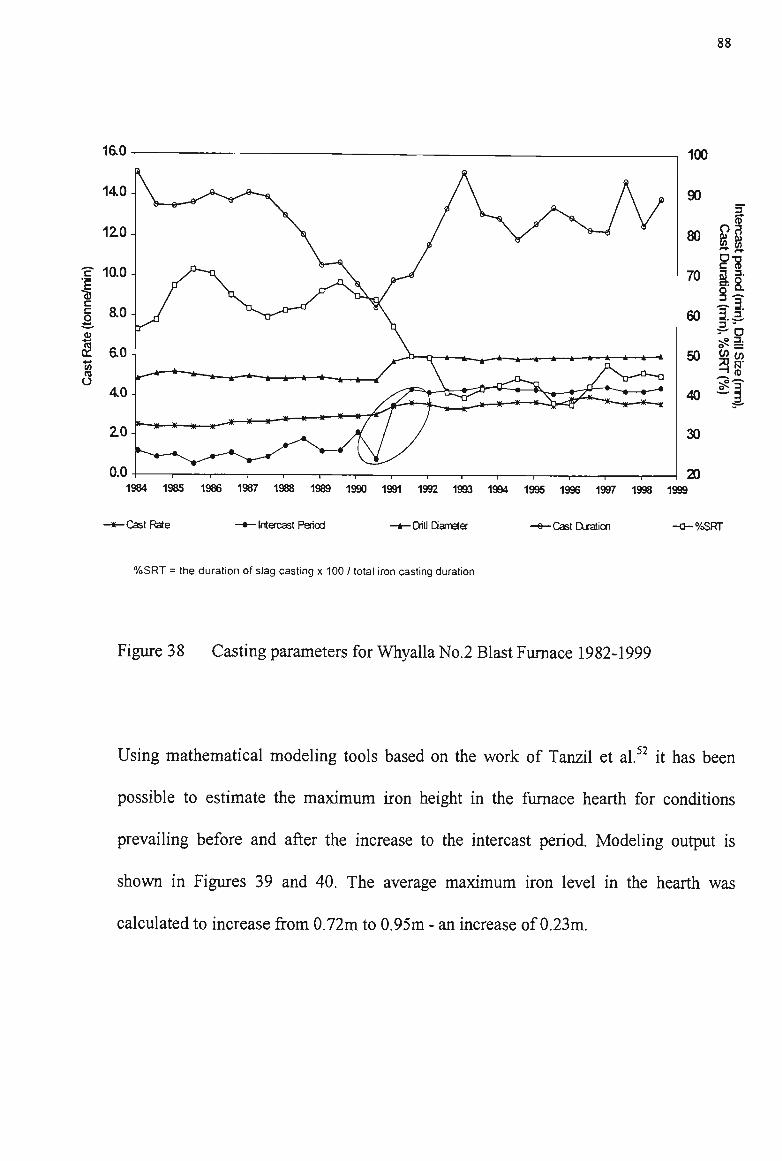
88
16.0 100
90 3
s » 2 70 ||
60 3.1
50 fgco ^ CD
40 ~3
30
i i i i i i 1 1 1 1 1 1 1 1 —
1984 1985 1986 1987 1988 1989 1990 1991 1992 1993 1994 1995 1996 1997 1998 1999 20
-Cast Rate - Intercast Period -Drill Diameter -Cast Oration •%SRT
% S R T = the duration of slag casting x 100 / total iron casting duration
Figure 38 Casting parameters for Whyalla No.2 Blast Furnace 1982-1999
Using mathematical modeling tools based on the work of Tanzil et al. it has been
possible to estimate the maximum iron height in the furnace hearth for conditions
prevailing before and after the increase to the intercast period. Modeling output is
shown in Figures 39 and 40. The average maximum iron level in the hearth was
calculated to increase from 0.72m to 0.95m - an increase of 0.23m.

89
(u[iufl) ejej p i n b n
1 h
1 y
"~r /
/
/
r \
\ \ i \
h-4 H-
ta:-
p !--
J;l-1 'v
Si' 1 '
•1 m CNi
(IU) |8AO| p m b p
E
in d
<u
E
S o i
«2l «o
*<f>
• 1.-S
1° JD O C Q. ££
Eg "I c/><
. £ ? £ s « t f : £ E E l E E E S S S S
c c e
-Jin.
ON ON
00 00 ON
co
u
E 2 E E E E £ E E
N t o c o e o e o c n w o o
*-
CO
V
CO
n in CM
CM
o o
CO
n a
LO IN CM
II 0)
i H I o n <g o» oi
n
TO = c S •=
•§ J ° s s 1 £ ° S ° -H a = ff E •£ I •
ll
o t= II
c 5 O 5=
c S1 II O «
C o o « C C " II c O O X c
._ 53 ™ ro .—
« 2 2 S S re 3 3 en m
o a a i i
c 01
II II o, O CO en ro TO A XI o>
II
0)
o o c
II .2 co <5 i £ < IU
« 52 -
<o .2 = „ .2
sal*' 1? « £ *=. x <5 — n O ) ro
<*J
CD > o 2 CO
en ro
a) > o XI CD O) ro en
o g . e e E co — «*-s ro « u o s «- xi —
£ .§ E - - o c x "R S & a. -S-i to ro ~ o « «
S S S = O P I
II 0> || CO 0) •O XI
cu ,g
£ I cu r= > co
S *-XI £
co g > "3 '3 > x: £ a o. £ l- s
'I II 0) u
ss s 5 «o •o XI
» 0
n •*• £ *• • S> <«
-1 ° D) x: £ .2 .E> ra w a> "3
I*1
I £ £ x x c
TO TO .= E S E
CD o
"3 o
U p at — iS < to
Figure 39 Modeling output for casting of Whyalla No.2 Blast Furnace 1988 - 1990

90
(U|UJA) e*ej pjnbn
_ H , 1—HHT-fr
' \ ' \
7 \ / \ , \
"f: in l'\ V
i M i i M'(
— i — i — } — i — i
¥ • L
1 1 in n
(ui) |«Ae| p i n b n
*<•
0
oi
o
a 2 c? !?e to W-<
I I
3 co
I | o .5
£i-eo<
• i I
E
ON ON
ON ON
CN U
e c c
S £ S S „ 1 I I £ -E E E E E E E 2 s i i E Z E
E E E E E E E E
•* <-) CM O
K CM ID CO CO O
e o CM
10
o 10
(0 CO CM
et o m
n m to oi m
II II C **
o " !8
Si ° o o £ a > xi
= 5? E O J2 3 Js </> z
II D) C
to to u 0)
E *rf SB
ll CD
E •w
Ol c to CO u Ol ro m *
II
o
2 3 •a 4->
CO CO O
II
s o 5= II c 5 o c:
= P? o 2 t*. ffi
- i M
= .2 u
o B » •2 B c
s s s 3 10 tfl
a x i
n II 0) CD 10 co to ro xt
II to
I <
II c Q>
"o
E CD O
O
c o to 0 u UI
II
a CO c 0 k. c
n 8 ro c 0
ii
u
re
O)
re to fc 3
E X to
S S S
hole dia
mete
r =
porosity=
Q. •O re « ** XI
itia
oke
= O
XI 0
0> £ •>
x: ** tu
above t
g above
the bas
engt
h=
max
slag
init
ial sla
vel above
— ife. * ^ fl)
a> o o —
re a> » 3 h- X X l-
n
S
i o "ro £ _oi
'3 X Ol to
en X re
xi S
ght =
ove the
3ve th
e
init
ial slag hei
Iron Hei
ght ab
ron He
ight ab
X X - . re co .-
s s s s
II *-» X Ol 0)
X c 0 u
<
II
CO
o o CO
> Ol re (O
\
Figure 40 Modeling output for casting of Whyalla No.2 Blast Furnace 1991 - 1994
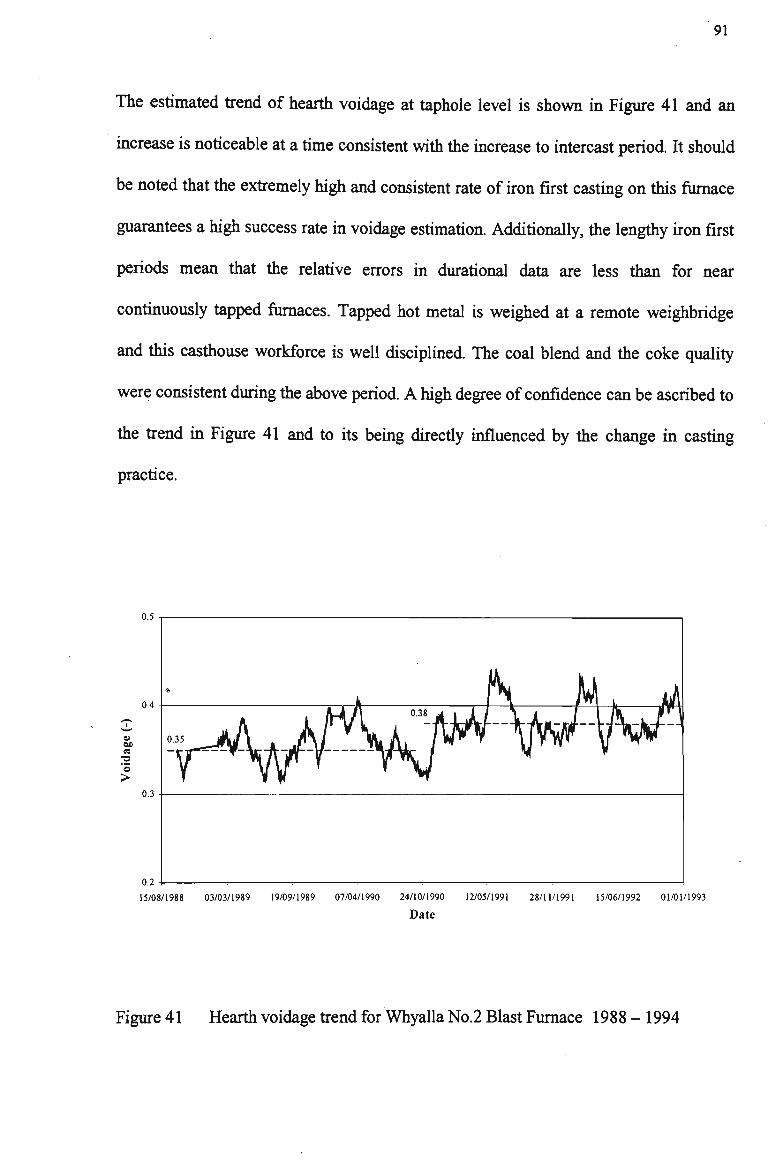
91
The estimated trend of hearth voidage at taphole level is shown in Figure 41 and an
increase is noticeable at a time consistent with the increase to intercast period. It should
be noted that the extremely high and consistent rate of iron first casting on this furnace
guarantees a high success rate in voidage estimation. Additionally, the lengthy iron first
periods mean that the relative errors in durational data are less than for near
continuously tapped furnaces. Tapped hot metal is weighed at a remote weighbridge
and this casthouse workforce is well disciplined. The coal blend and the coke quality
were consistent during the above period. A high degree of confidence can be ascribed to
the trend in Figure 41 and to its being directly influenced by the change in casting
practice.
u M
a 'o >
15/08/1988 03/03/1989 19/09/1989 07/04/1990 24/10/1990 12/05/1991 28/11/1991 15/06/1992 01/01/1993
Date
Figure 41 Hearth voidage trend for Whyalla No.2 Blast Furnace 1988 - 1994
92
5.23 Variation in hearth bottom temperature at Port Kembla No.5 Blast Furnace
The complex nature of the force balance which determines the location of the deadman
and the formation of any coke free layer has previously been recognised.4 The voidage
and density of the bed of coke particles is a key variable in this force balance with
higher voidage increasing the propensity for the bed to sink and also allowing easier
liquid passage through the bed itself.
Sophisticated mathematical modeling by BHP Research of liquid iron flow in the blast
furnace hearth has been able to draw on data from the 1991 reline discovery in order to
define validation experiments. This work has shown that the preferred drainage paths
for iron in the hearth are those of minimal length at or near taphole height. This is true
even in cases with high voidage values in the bottom of the bed or with a coke free layer
as shown in Figure 42 where a small portion of the total liquid flow towards the taphole
is via the low resistance but lengthy coke free layer route.
For any given wear state, the velocity of liquid iron flowing across the hearth bottom
refractory determines the temperature of the thermocouple whether the flow be through
a coke free space or through the pores of a sitting coke bed. Iron velocities occurring
through a coke free layer are always greater than those through the bed.
The hearth refractory construction of Port Kembla No.5 Blast Furnace is shown in
Figure 43, with the location of some of the thermocouples in the hearth bottom marked.
The feed water to the underhearth cooling system of this furnace is maintained at
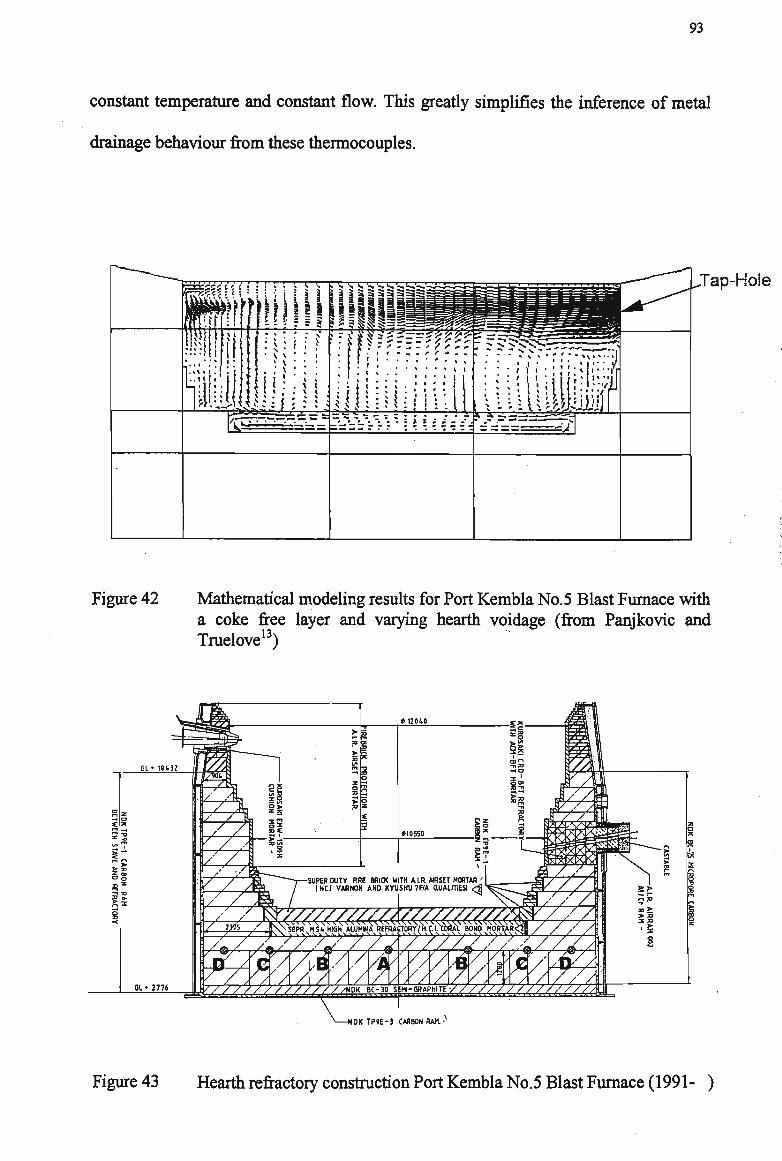
93
constant temperature and constant flow. This greatly simplifies the inference of metal
drainage behaviour from these thermocouples.
T . 5 3 £ 3 i n iiillHH
n
Jap-Hole
Figure 42 Mathematical modeling results for Port Kembla No.5 Blast Furnace with a coke free layer and varying hearth voidage (from Panjkovic and Truelove13)
NDK TP9E-3 CARBON RAM. -
Figure 43 Hearth refractory construction Port Kembla No. 5 Blast Furnace (1991 - )
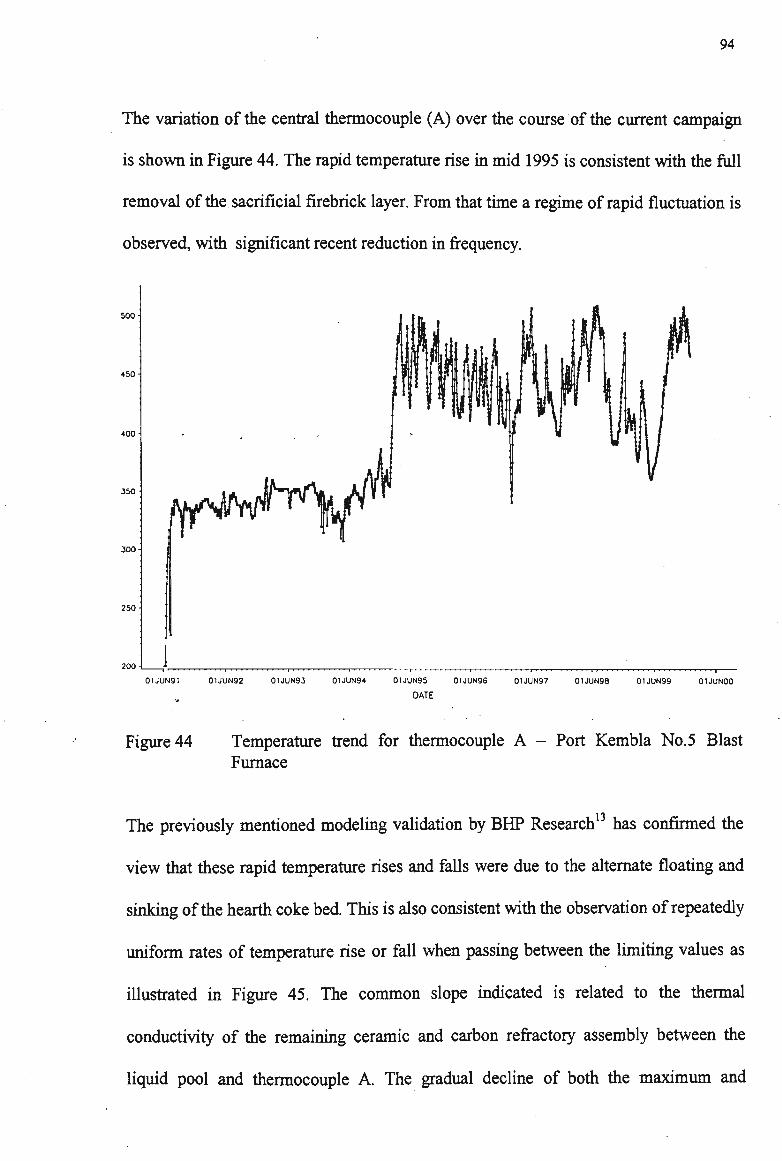
94
The variation of the central thermocouple (A) over the course of the current campaign
is shown in Figure 44. The rapid temperature rise in mid 1995 is consistent with the full
removal of the sacrificial firebrick layer. From that time a regime of rapid fluctuation is
observed, with significant recent reduction in frequency.
500-
450-
400-
300-
250-
taW"1^
ZOO \ i
01JUN91 01JUN92 01JUN93 01JUN94 01JUN9S
DATE 01JUN96 0IJUN97 01JUN98 01JUN99 OIJUNOO
Figure 44 Temperature trend for thermocouple A - Port Kembla No.5 Blast Furnace
The previously mentioned modeling validation by B H P Research13 has corifirmed the
view that these rapid temperature rises and falls were due to the alternate floating and
sinking of the hearth coke bed. This is also consistent with the observation of repeatedly
uniform rates of temperature rise or fall when passing between the limiting values as
illustrated in Figure 45. The common slope indicated is related to the thermal
conductivity of the remaining ceramic and carbon refractory assembly between the
liquid pool and thermocouple A. The gradual decline of both the maximum and

95
minimum temperatures during 1995-6 (Figure 44) may be reasonably explained in any
of three ways;
• gradual and steady decrease to the hearth coke bed permeability -whether floating or
sinking. (This is not consistent with other evidence.)
• gradual decrease in the conductivity of the refractory by thermal or penetration
influence. (This is the favoured explanation but note that the declining trend is not
consistent with simple thinning of the refractory.)
• the possible influence of hearth volume increase by sidewall erosion. Other evidence
suggests that this is not the cause.
490
460
430
400
I I 1 1 1 (1 1 1 1 I I t i l l A tt ' • i i t i /\
A 11 A 1 » 1 1 1 .1 1 j \
\ / w A 1-1 i I1 /1 'IV -J\ I VI ' _ . _
\l V l\l \ 1 ' " " l\ / \ 1 \
1/01/96 1/04/96 1/07/96 30/09/96 30/12/96
Figure 45 Hearth bottom centreline temperatures - Port Kembla No.5 Blast Furnace
In Figure 45, temperatures above 460°C correspond to a floating deadman with the
excess above this value corresponding to velocity above the threshold value of the
floating condition. Temperatures below 430°C and below correspond to a sitting
deadman with lower temperatures indicating reduced velocity through the packed coke
bed. Temperatures between these values are always transitory, reflecting the response to

96
a floating or sinking event. The previously mentioned BHP Research validation work
utilised data from just after the removal of the sacrificial firebrick layer when greatest
confidence about the hearth refractory condition existed.
5.2.4 Floating and sinking of the deadman
The considerations of Vogelpoth, Still and Peters4 relating to hearth sump geometry, as
shown in Figure 3 are relevant but the additional influences of productivity and hearth
voidage must also be considered.
A simplified representation, which extends the treatment of Nishio et al.18 by
considering the friction at the shaft walls and the transfer of burden force to the bosh
walls by the cohesive zone is shown in Figure 46. Computation of the force balance will
not be attempted here but clearly the balance must vary with radial location. This is
consistent with the conical deadman shapes calculated by Nishio et al.
To simplify the present discussion, two cases for a uni-dimensional element will be
considered as shown in Figure 47. For further simplification, the existence of the slag
phase will be ignored.
In Figure 47a, the upper surface of the deadman is separated from the cohesive zone by
the active coke zone. Transfer of the full weight force of the lumpy zone and the
cohesive zone burden to the deadman, as assumed by Nishio et al. seems improbable if
a truly 'active' coke zone is to exist. Assuming the limiting condition, where these
weight forces are fully transferred by the cohesive zone to the bosh walls, the extent of

97
^ Wi=3
:W2i
W4-
:W3
ft Ws
Wi : burden weight Wa.." friction resistance for the
inner face of shaft W 3 : the force from bosh W * : pressure loss between blast pressure =••• and top gas pressure
Ws'.: buoyancy at the metal bath
'lumpy zone ' cohesive zone •dead man -slag hot metal
Figure 46 Simplified representation of the force balance on the deadman
coke bed projection into the hearth metal pool will be determined as the point where the
mass (height and density) of the deadman coke bed balances the buoyancy force arising
due to the voidage of the coke bed and metal pool in the hearth. Variation of this
penetration by the previously described mechanism (or by other variation to the nature
of the deadman and hearth coke beds) is free to occur.
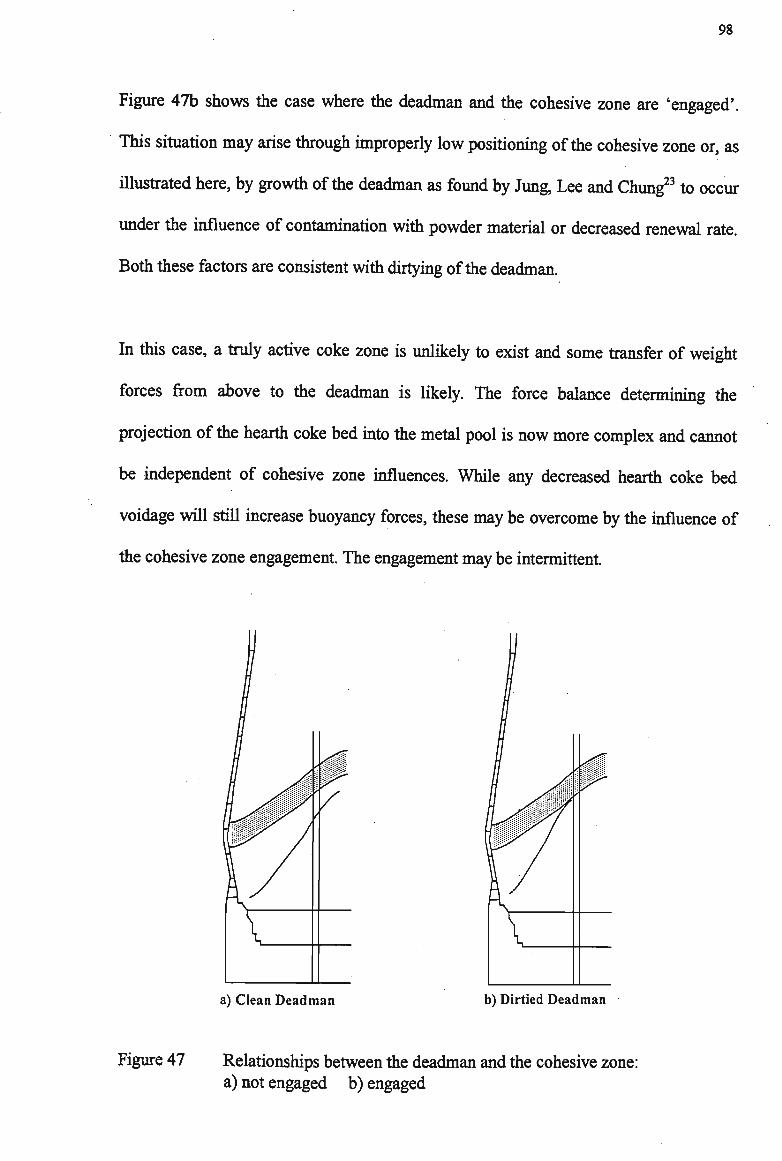
98
Figure 47b shows the case where the deadman and the cohesive zone are 'engaged'.
This situation may arise through improperly low positioning of the cohesive zone or, as
illustrated here, by growth of the deadman as found by Jung, Lee and Chung23 to occur
under the influence of contamination with powder material or decreased renewal rate.
Both these factors are consistent with dirtying of the deadman.
In this case, a truly active coke zone is unlikely to exist and some transfer of weight
forces from above to the deadman is likely. The force balance determining the
projection of the hearth coke bed into the metal pool is now more complex and cannot
be independent of cohesive zone influences. While any decreased hearth coke bed
voidage will still increase buoyancy forces, these may be overcome by the influence of
the cohesive zone engagement. The engagement may be intermittent.
a) Clean Deadman b) Dirtied Deadman
Figure 47 Relationships between the deadman and the cohesive zone: a) not engaged b) engaged

99
5.2.5 The stable deadman
The condition of a stable deadman may arise in either the floating or sitting state. A
sitting deadman is likely to be stable where the productivity is very low or where the
hearth voidage is high or through suitable combination of these parameters. Low
refractory heat loads on the furnace bottom and sidewalls will result. This condition
was observed on Port Kembla No.5 Blast Furnace in early 1999 when productivity was
restrained by market conditions (Figure 44).
A floating deadman is likely to be stable when productivity is high, when hearth
voidage is low, or again, in suitable combination of these factors. Such a condition is
characterised by high (but stable) heat loads on hearth refractories and existed at Port
Kembla No.5 Blast Furnace in mid 1998 and again in early 2000.
Either of the above conditions is viable for extended campaign life due to the thermal
stability of the refractories. While the former gives lower heat loads, the coke bed is
relatively stagnant and not agitated by the casting cycle. The latter is probably the more
desirable in most operations since it carries the ability for minor movement of the bed
itself, and of particles within the coke bed to prevent its becoming stagnant. These
movements are caused by casting induced buoyancy force variations and will be further
discussed in later sections.
100
5.2.5 The unstable deadman
This condition may also arise in either of two ways.
The first occurs where the deadman and cohesive zone behave independently as shown
in Figure 47a, but the values of hearth voidage and/or productivity vary significantly
with time and substantially alter the buoyancy component of the force balance.
Whenever a transition between a floating and sitting condition occurs, a significant
change in voidage at the critical taphole level of the coke bed is to be expected as
discussed in a preceding section.
When the hearth coke bed is floated, coke from lower in the furnace, which has been
cleansed of fines by buoyancy forces, is moved into the taphole level and provides
greater permeability to the iron. This easier drainage reduces the need for a relieving
coke free layer to provide a low resistance path and the coke bed may now sink again.
When the coke bed sinks, coke which has not been submerged in iron for some time
(and hence has not had the fines floated out of it by buoyancy forces) moves into the
taphole plane. This acts to compromise the preferred flow path, reducing overall
voidage and increasing the buoyancy forces. These factors are all now consistent with
the need to relieve the drainage task by re-floating the coke bed.
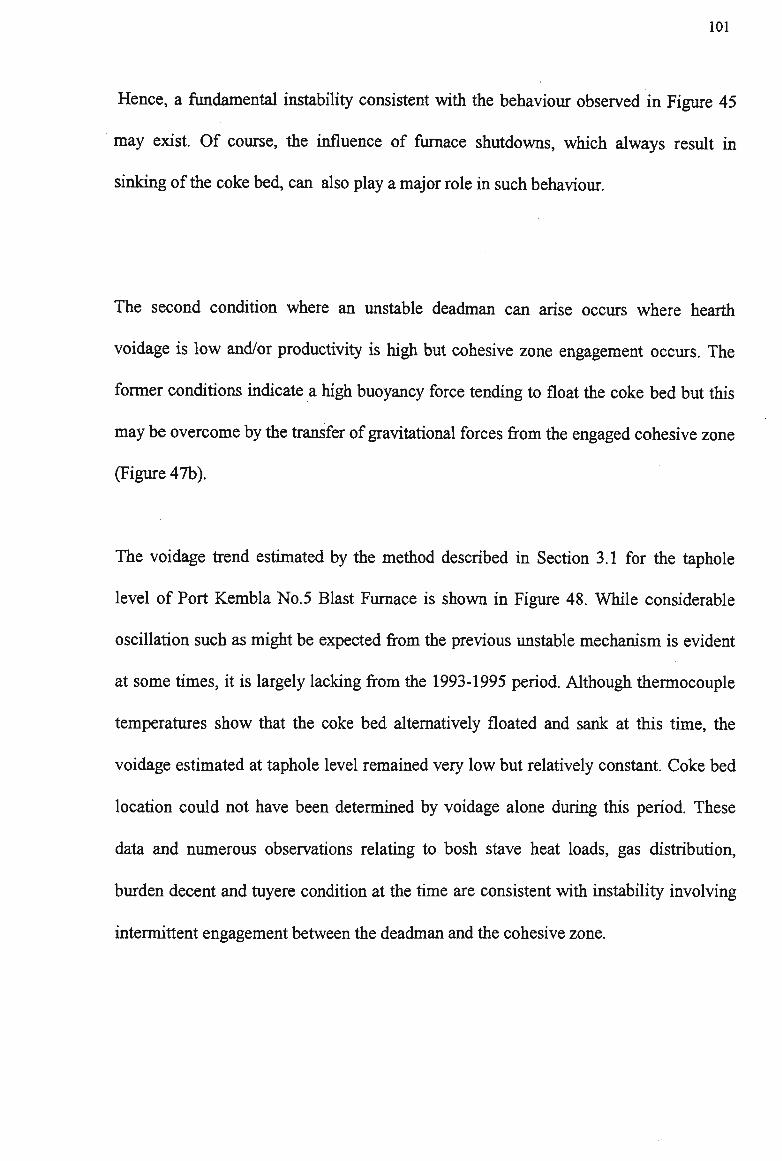
101
Hence, a fundamental instability consistent with the behaviour observed in Figure 45
may exist. Of course, the influence of furnace shutdowns, which always result in
sinking of the coke bed, can also play a major role in such behaviour.
The second condition where an unstable deadman can arise occurs where hearth
voidage is low and/or productivity is high but cohesive zone engagement occurs. The
former conditions indicate a high buoyancy force tending to float the coke bed but this
may be overcome by the transfer of gravitational forces from the engaged cohesive zone
(Figure 47b).
The voidage trend estimated by the method described in Section 3.1 for the taphole
level of Port Kembla No.5 Blast Furnace is shown in Figure 48. While considerable
oscillation such as might be expected from the previous unstable mechanism is evident
at some times, it is largely lacking from the 1993-1995 period. Although thermocouple
temperatures show that the coke bed alternatively floated and sank at this time, the
voidage estimated at taphole level remained very low but relatively constant. Coke bed
location could not have been determined by voidage alone during this period. These
data and numerous observations relating to bosh stave heat loads, gas distribution,
burden decent and tuyere condition at the time are consistent with instability involving
intermittent engagement between the deadman and the cohesive zone.

VOIDAGE ESTIMATE
102
. DATE
Figure 48 Estimated hearth voidage trend for Port Kembla No.5 Blast Furnace (1991 -1999)
5.2.7 Sidewall damage at Port Kembla No.5 Blast Furnace
During, the current campaign of Port Kembla No.5 Blast Furnace, significant damage
has been incurred to the hearth sidewall refractories in the form of vertical 'growth' of
as much as 260mm at tuyere level. Visual inspection at the available sites clearly
indicates that this has occurred by joint penetration rather than by uniform damage to
the large carbon blocks. Mathematical modeling13,53 indicates the high probability that
this penetrative growth has occurred as the result of thermal cycling such as may be
expected as a result of liquid flow instability when the hearth coke bed frequently
alternates between floating and sinking conditions. Figure 49 shows the rate of this
refractory movement as detected by direct brickwork measurement at each tuyere
cooler replacement during scheduled shutdowns. Since mid 1997 only one cooler has
been replaced. It has therefore been necessary to introduce survey-based measurements,

103
90.0 -j
80.0 - •
-> 70.0 ->N
g 60.0 - •
E
J 5 0 ° " 2 40.0-JZ
1 30.0 -•
o o> 20.0 - -
10.0 -0.0
01/31/93
Figure 49 Rate of sidewall refractory growth - Port Kembla No.5 Blast Furnace (1991-1999)
which confirm that refractory growth has ceased since that time. The rate is clearly
greatest in the periods of maximal thermal cycling (Figure 44) and minimum voidage
(Figure 48). Furthermore, Figure 50 shows the circumferential variation of growth along
with taphole locations which are areas of intensified metal flow during periods of full or
partial floating of the coke bed. The latter are also the areas of greatest thermal
variation during cyclical behaviour. The low flow and low variability site opposite No.3
taphole displays the minimum damage.
Figure 51 shows correlation plots for average temperatures at thermocouples located at
positions A to D in the hearth bottom refractory (Figure 43). Adjacent inner and outer
combinations (A-B and C-D) are highly correlated, while B-C are less so and A-D least
correlated. This indicates that when the hearth coke bed floats or sinks, it is a gradual
event but that in general floating eventually occurs over the full diameter. Clearly,
however, the force balance varies radially and can also be further complicated if any
engagement between deadman and cohesive zone occurs at only some radial locations.
•
•
• •
• •
t • •
+tl • • • • • • y •
•
06/15/94 10/28/95 03/11/97 07/24/98 12/06/99
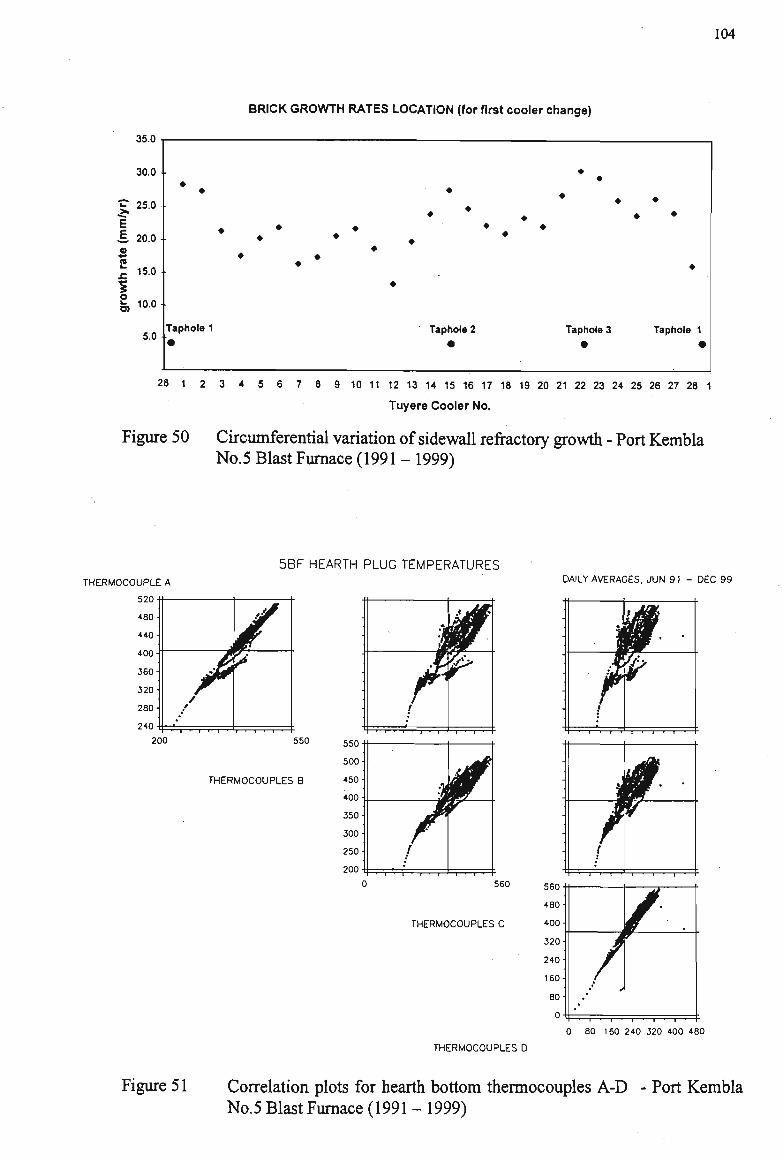
104
BRICK GROWTH RATES LOCATION (for first cooler change)
35.0
30.0
E 2S0 E •E 20.0 a 2 Z. 15.0
O) 10.0
5.0 •
• • • •
• •
• •
Taphole 1 Taphole 2
m Taphole 3 Taphole 1
28 1 2 3 4 5 6 7 8 9 10 11 12 13 14 15 16 17 18 19 20 21 22 23 24 25 26 27 28 1
Tuyere Cooler No.
Figure 50 Circumferential variation of sidewall refractory growth - Port Kembla No.5 Blast Furnace (1991 - 1999)
5BF HEARTH PLUG TEMPERATURES THERMOCOUPLE A DAILY AVERAGES. JUN 91 - DEC 99
wu-480-
440-
400-
360-
320-
280-
2+0 -
i /
J* r .*
i — ' — i — • — i — • — i — , —
M
j? ¥ Zi r"
T — • — i — r - i — • — r
200 550
THERMOCOUPLES B si
1 — ' — 1 — < — I — r
*kw *
560 560
480 H
THERMOCOUPLES C 400
320
240-
160
0 80 160 240 320 400 480
THERMOCOUPLES D
Figure 51 Correlation plots for hearth bottom thermocouples A-D - Port Kembla No.5 Blast Furnace (1991 - 1999)

105
In Figure 52, the hearth bottom thermal history and total sidewall heatload are shown
along with a cumulative count of the hearth coke bed relocations (sit to float or float to
sit) inferred by transit of central plug temperature between threshold floating and
sinking temperatures (as per Section 5.2.3) since February 1995. When compared with
sidewall growth as shown in Figure 49, the cessation of growth is clearly coincident
with the greatly reduced frequency of coke bed relocations. Relocations did occur
prior to 1995 but were significantly disguised by the extra insulation of the firebrick
layer. The peaking of sidewall heat flux during the period of maximum instability is
also confirmed by Figures 49 and 52 . However, data from this location cannot be used
to count coke bed relocations due to the additional influences of refractory maintenance
grouting.
600
500
400
300
200
100
60000
40000
20000
Hearth Plug Upper T/C
^ ^ ^ A ^ ^ K k ^ ^ /LjJ/*T
Hearth Sidewall Heat Load 0 10 20 30 40
1/06/91 1/06/92 1/06/93 1/06/94 1/06/95 1/06/96 1/06/97 1/06/98 1/06/99
Figure 52 Trends of hearth bottom temperature, hearth sidewall heat load and hearth coke bed relocations - Port Kembla No.5 Blast Furnace (1991 - 1999)
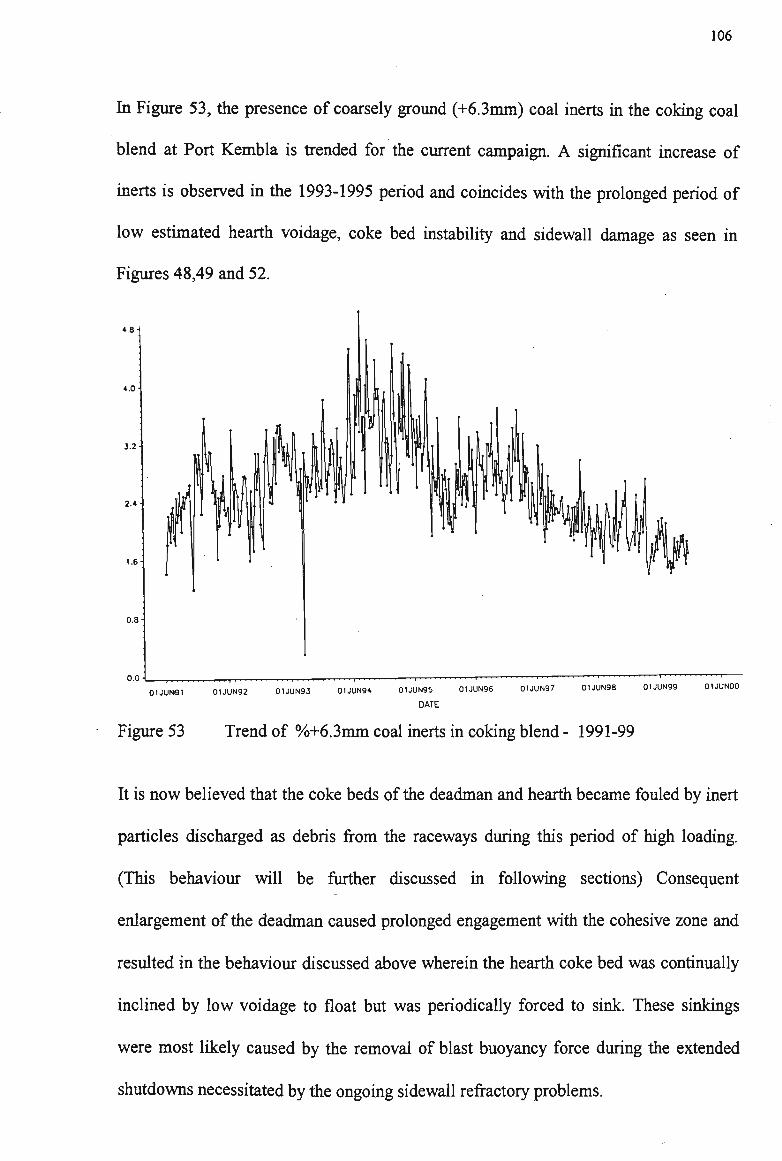
106
In Figure 53, the presence of coarsely ground (+6.3mm) coal inerts in the coking coal
blend at Port Kembla is trended for the current campaign. A significant increase of
inerts is observed in the 1993-1995 period and coincides with the prolonged period of
low estimated hearth voidage, coke bed instability and sidewall damage as seen in
Figures 48,49 and 52.
4.8
4.0-
3.2
0.8
0.0-I
01JUN91 01JUN92 0UUN93 01JUN94 01JUN95
DATE
01JUN96 0IJUN97 01JUN98 01JUN99 01JUNO0
Figure 53 Trend of % + 6 . 3 m m coal inerts in coking blend - 1991-99
It is n o w believed that the coke beds of the deadman and hearth became fouled by inert
particles discharged as debris from the raceways during this period of high loading.
(This behaviour will be further discussed in following sections) Consequent
enlargement of the deadman caused prolonged engagement with the cohesive zone and
resulted in the behaviour discussed above wherein the hearth coke bed was continually
inclined by low voidage to float but was periodically forced to sink. These sinkings
were most likely caused by the removal of blast buoyancy force during the extended
shutdowns necessitated by the ongoing sidewall refractory problems.
107
The much reduced heat fluxes and thermal cycling of sidewall refractories seen in
Figure 52 since 1997 are believed to be primarily the result of intentional reduction in
the loading of coarse inerts in the coal blend as seen in Figure 53. Although significant
variations in voidage at taphole level are being experienced (Figure 48), values are
generally higher than during the period of greatest difficulty. The hearth bottom
temperatures indicate that a stable deadman condition now generally exists with the
location being primarily determined by production level which was at reduced levels
during late 1998 and early 1999.
5.2.8 Summary
Blast furnace hearth voidage is not constant but varies under the influence of raw
material quality and operating practice.
Changes in positional status of the hearth coke bed can be inferred from refractory
thermocouple data. Conditions leading to stable and unstable deadman behaviour have
been identified. Mechanisms and factors which result in unstable behaviour and which
can, therefore, be inconsistent with extended campaign life have been identified. The
significant damage which has been sustained by the hearth sidewalls of Port Kembla
No.5 Blast Furnace has been substantially explained by reference to these behavioural
modes and to the properties of the coking coal blend.
To promote hearth voidage, fines ingress to the hearth coke bed should be avoided. The
average level of the iron bath surface should be kept as far above the taphole level as is
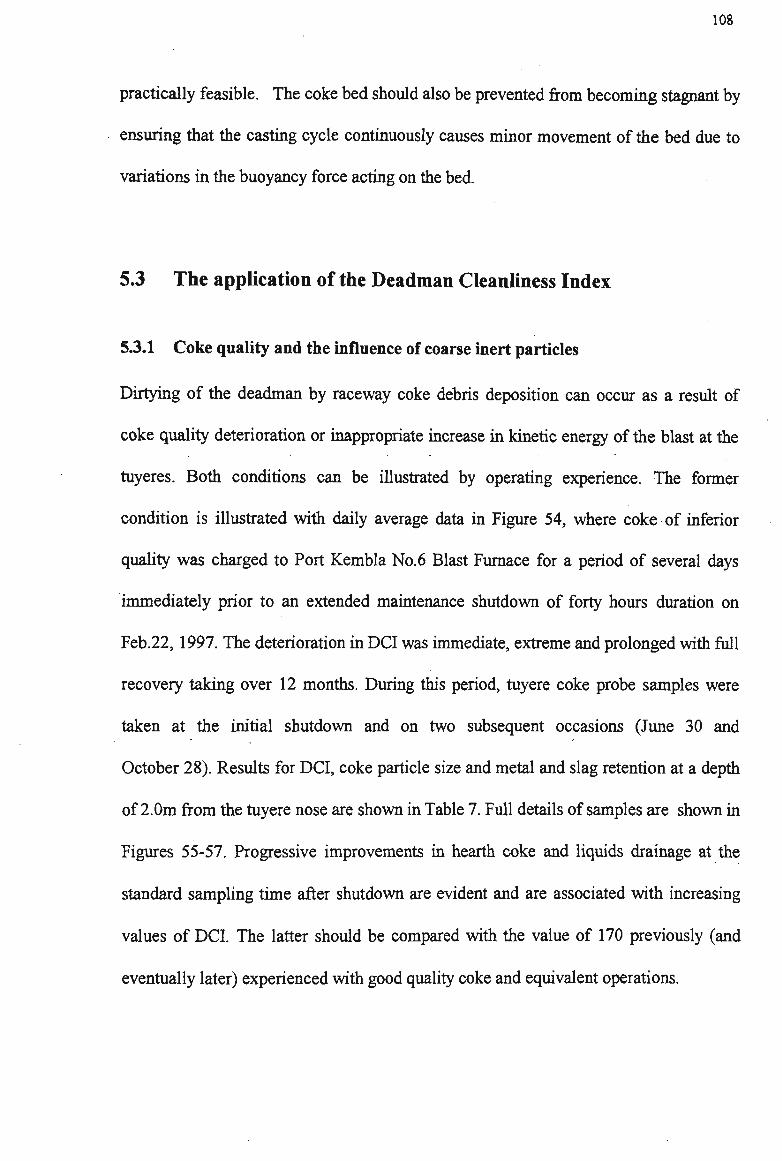
108
practically feasible. The coke bed should also be prevented from becoming stagnant by
ensuring that the casting cycle continuously causes minor movement of the bed due to
variations in the buoyancy force acting on the bed.
5.3 The application of the Deadman Cleanliness Index
53.1 Coke quality and the influence of coarse inert particles
Dirtying of the deadman by raceway coke debris deposition can occur as a result of
coke quality deterioration or inappropriate increase in kinetic energy of the blast at the
tuyeres. Both conditions can be illustrated by operating experience. The former
condition is illustrated with daily average data in Figure 54, where coke of inferior
quality was charged to Port Kembla No.6 Blast Furnace for a period of several days
immediately prior to an extended maintenance shutdown of forty hours duration on
Feb.22,1997. The deterioration in DCI was immediate, extreme and prolonged with full
recovery taking over 12 months. During this period, tuyere coke probe samples were
taken at the initial shutdown and on two subsequent occasions (June 30 and
October 28). Results for DCI, coke particle size and metal and slag retention at a depth
of 2.0m from the tuyere nose are shown in Table 7. Full details of samples are shown in
Figures 55-57. Progressive improvements in hearth coke and liquids drainage at the
standard sampling time after shutdown are evident and are associated with increasing
values of DCI. The latter should be compared with the value of 170 previously (and
eventually later) experienced with good quality coke and equivalent operations.

109
Deadman Cleanliness Index (DCI)
87.0
83.0
79.0
Coke Dl 150/15 (%)
km 0f0f-01/10/1996 01/02/1997 01/06/1997 01/10/1997 01/02/1998 01/06/1998
Figure 54 Extended recovery of Port Kembla No.6 Blast Furnace from a period of poor coke quality and an extended shutdown (circled)
Characterisations of the fine coke found in the tuyere probe samples was performed to
clarify the role of the inert particles. Samples from each probe were examined at the
following sizes: -8+4mm, -4+2mm, -2+lmm and -l+0.5mm. Full details of the
characterisation are to be found in Appendix 3.
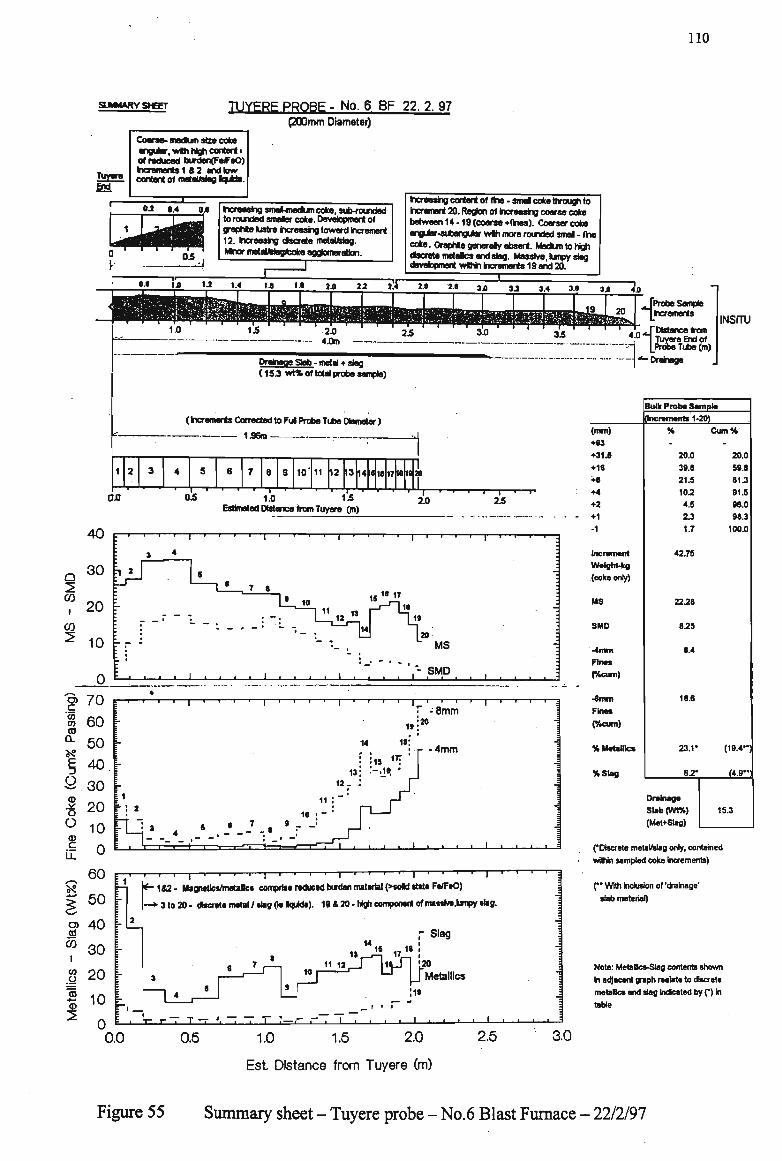
110
SUMMARY SHBT TUYERE PROBE - No. 6 BF 22. 2. 97 pOOmm Diameter)
Tuyere End
Coorse)-medum stco coke angular, w t h high content i of reduced burden(F*FeO) Increments 1 S 2 and tow
of
IE 03 0.4 o.e
? 05 ,
twreastig smdMnedum coke, sub-rounded to rounded smeier coke. Development of graphite Metre Increasing toward Increment 12. hcreealng dscrete metaUsbg. MkwrnwtalWsgfcokeaaQtotneraBon.
r T
hereastig content of the-smal coke through to Increment 20, Region of ixreeslng coarse coke between 14 -19 (coarse +flnes). Coarser coke angutar-subangularwih more rounded smsJ- fine coke. Oraphlageneraly absent. Medumtohigh dscrete metefcs and stag. Massive, lumpy slag devetopment wlhin Increments 19 and 20.
" <2 " '* ? 'f " " ** " '" » " »4 " »J 3i)
Drainage Slab-metal •stew C1S.3 wt%oftotal probe sample)
(txrements Corrected to Fii Probe Tube Dimeter)
1 J96m -
10 11 12 13
0\0 OS 1.0 '—T-
1 5
14 l« 1710 1(20
Estimated Distance from Tuyere (m)
i
2.0 - • — i — i — r -
25
w I
CO
40
30
20
10
Illllll
1*
niJ :_l
r ~ *
: i • •
- • ! " ,
4
- _ .
•
«
- -
•
I »
_i i
1 1 1 1 1 i 1 1 r I 1 | 1 1 1 1 |- 1
- 1 •
Li_ io
- - ' - - _ _ 14
16 " « I_r-
r|l8 |19
20
" *•_ . "" MS
. . '"' ' * '.-- SMD 1 1 L . 1 . l l l l l l l l l l . i l .
— i ' r — :
-
-.
-
i , , -
c '«) CO
co 0.
O CD X. O
o co c LL
*?
en CO
I
CO
o
2
60
50
40.
30 20
10 A
j — i
-
1
-i
— - i
2
H
r—i
1
1
4
1
• h — i —
l r
1
I —
7
1 i i
S
r-
10
*—r-
r- -8mm i.!20 i
H i»:
: in ":' ! is; '-.1». '
f|||||lllllllll|lllllll
E E
12 r '• J '••
' • I l l l l l l . 1 1 i 1 1 1 1 1 :
60
50
40
30
20
10
: 1 t 1 t 2 - Mag
• 3 to 20-
T" T~ T i i — | — i — i — i — i — | — • — i — i
Magnetfcs/metaflcs eomprita reduced burden material (>sold date Fa/FtO)
discrete metal / slag (is tquids). ig&20-r^cornpanantofma(«he,kinpytlag.
f Slag
0.0 1.0 1.5 2.0
Est Distance from Tuyere (m)
2.5 3.0
{ Probe Sample Increments
Distance from ""j- I Tuyere End of H LProbeTube(m) -•]•«-Drehege
iNsrru
(mm) •S3
•31.5
•18 ••
•4 •2 •1 -1
Increment
Welght-kg
(coke only)
MS
SMO
-4mm Fines
(•/.cum)
-8mm
Fines
(%cum)
% Metallic*
%Slag
Bulk Probe Sample
(Increments 1-20)
% -20.0
39.8
21.9
102 4.5 2.3
1.7
42.75
22.28
825
8.4
18.6
23.1'
ST
Drainage
SIab(Wt%)
(Met+Slag)
Cum%
-20.0
59.8
81J 91.5
98.0
98.3
100.0
(19.4")
(4.9-1
15.3
1 ('Discrete metal/slag only, contained
within sampled coke increments)
(** With Inclusion of 'drainage'
•lab material)
Note: MetaBcs-Steg contents shown
In adjacent graph reelate to discrete
metaBcs and slag kidcated by (") In
table
Figure 55 Summary sheet - Tuyere probe - No.6 Blast Furnace - 22/2/97

Ill
SUHMAKY ShEET TUYERE PROBE - No. 6 BF 30. 6. 97 (200mm Diameter)
Mknr coke,
inetslcMeg win
day ccnteinlnetlon.
Tuyere
End
Dul, brownish coke, wide
SOS CiSnaDUDOn, QfigUBr -
subongutar, moderate sieg * * • - — - i — " •
jnterai ocfissions win minor cota&MtaUslag aggtomerotion.
fr o_« i-w ift
07 1.0
rtgh content of smal to fine
coke, rounded -subrounded.
Dark g/ey black wih
skjntflcent surface grephle.
Subangukr-subrounded
mod. to hkjh surface
grapnte. hcreessig
content of smal coke.
hcrease In coke stxe, decreasing suface graphle, subengukv
to subrounded, coke becoming dul w i h sight brownish colouration In 15.
J
Dark subanguler coke, m e d u m
to large wth relotlvety high
content of smal to fine coke
1.80 1.70 1.80 2JS 130 238 jm in 3.M 3J> 330 3,80 3.70 3.W 4.10 438 4.M
Drakjgcje Stab * metal + slag
( 6 5 w t % of total probe sample)
(Increments Corrected to FiJ Probe Tube Diameter)
'. 2.12m
10 11 12 13 14 15 16
00 05 1.0
17 IC IS 5 21 T ~ 2.0
— I — 25
Estimated Distance from Tuyere (m)
CO I
CO
40
30
20
10
T — i — i — i — i — i — i — i — i — i — i — r - i — | — i 1 1 — i — | 1 r-
U " 18 1«
. - J L T ^ fclTji MS
i . _ SMO
c '•m in
& •
E
g "co o
O CD C
L L
*S
en CO i
co o
OJ
2
0
70 E
_i L _i 1_
-i 1 r—i p* -T 1 r" -1 1 1- -i r 1 r-
60 I
50
40
30
20
10
0
60
;|ija_4 _» j T _» ,'—W— to ii !• ' • • i i
50 I
40
30
20
10
- i — i — i — i - - T — i — i — r -
8 4
10
11 12
:i _ j
0.0 0.5
. — Metallic* 1 I I -L I 1 —
Probe Sample Increments
'Distance from Tuyere
.End of Probe Tube (m)
Drainage
INSITU
[Increments. 1-21)
(mm)
•83
•31.8
•18
•8
•4
•2
•1
-1
Increment
Welght-kg
(cokeonty)
MS
SMD
-4mm Fine* (%cum)
4mm
Fines
(%cum)
% Metallic*
KSlag
Bulk Probe Sample
Cum%
34.3
42.5
11.3
4.8
3.9
1.9
1.3
34.3
76.7
88.1
92.9
96.8
96.7
100.0
42.77
28.1
10.4
7.1
11.9
18.3*
4.7'
Drainage
Slab (WW)
(Met*Slag)
(17.1")
(4.4-)
6.5
(* Discrete metal/slag only, contained
within sampled coke hcrements)
(** With inclusion of 'drainage'
slab material)
Note: MetaBes -Slag contents shown In adjacent graph relate to discrete metallic* snd slag indicated by (*) in table above.
2.5 3.0
Est. Distance from Tuyere (m)
Figure 56 Summary sheet - Tuyere probe - No.6 Blast Furnace - 30/6/97
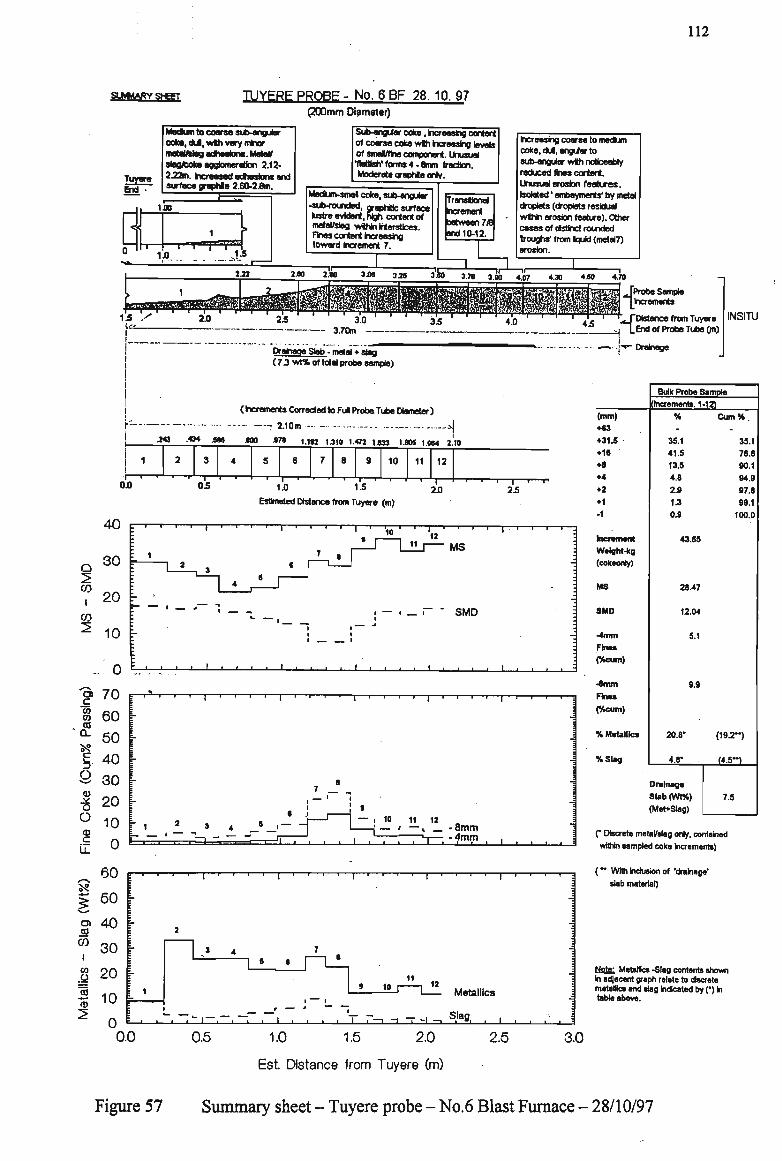
112
SUMAARY SHEET TUYERE PROBE - No. 6 BF 28. 10. 97 (200mm Diameter)
Tuyere End •
Medum to coarse sub-angular coke, dul, wth very minor metetrsleg adhesions. Metal/ sncUcoke agglomeration 2.12-2.22m. ixreejed adhesions end surface grephle 2.60-2.6m.
Sue-engUer coke, hcreeolny content of coarse coke wih Increasing levels of smalfttie component. Unusual •flatfish'forms 4 - 8mm fracbon. Moderate qraphle only.
1.00
HI i l i i i "i j.
Medum-smal coke, sub-angular -sub-rounded, graphitic surface kistre evident, high content of metel/stag wthin interstices. Fines content increasing toward increment 7.
TransHona) ncrement between 7X and 10-12.
Increasinu coarse to medum coke, dm, angular to sub-angular wih nooceebty reduced fines content. Unusuel erosion featkres. Isolated' embayments' by metal droplets (droplets residual within erosion feature). Other cases of dsbnct rounded troughs' from Iquid (metaJT) erosion.
Drainage Stab - metal • stag ( 7 3 w t % of total probe sample)
SB Jprobe Sample |hcremenls
'Distance from Tuyere End of Probe Tube (m)
—«- -j-*- Drainage
iNsiru
| (hcrernertsCorrededtoFulFTobttTubeDtometer)
j.: — T 2.10m i|
! J43 .434 .ess too an i.m )J|n i,«» xe33 IMs I.BM i.'to
6 9
on 05 1.0 i —
15
10 11 12
I 28
Estimated Distance from Tuyere (m)
40
3 0 I-
CO
I
CO
20 r
10
C8 c 'co 03 CO Q .
o Q)
o CD
c
.. 0
70
60
50
40
30
20
10
0
n^J-SMD
-1 I I I L - -I 1 1 — 1 1 I I ' ' ' •
-I 1 1 1 1 1 1 I ~T 1 1 1 1 1 1 1 1 1 P*
8
8 . —
9
— i 10
T-J\
11 12
— L - omm s — -4mm
25
~ i — i — :
j L
(mm)
•63
•31.S
•16 •8
•4
•2
•1 -1
ncraiiMnt
Weight-kg
(cokeonty)
MS
SMD
*4mni
Fines
(Scum)
4fflin
Fines
(%cum)
% Metalllcs
KSlag
Bulk Probe Sample
[Increments. 1
% -
35.1
41.5
13.5
4.8
2.9 1.3
0.9
43.65
28.47
12.04
5.1
9.9
20.8*
4.8*
Drainage
Slab(Wt%)
(Met+Slag)
•12)
Cum%. -
35.1
76.6
90.1
94.9
97.8
99.1
100.0
(19.2")
(4.5~)
7.5
(* Discrete metal/slag only, contained
within sampled coke Increments)
a*
CO
co O
60
50
40
30
20
2 ~ 10 V
0 L-0.0
I I I I - T 1 1 r -
6 I
» 10 Metalllcs
, . . , V r-, -, -7 - -. Slag,
0.5 1.0 1.5 2.0
Est Distance from Tuyere (m)
2.5 _ i • »
(~ With inclusion of 'drainage'
slab material)
J Ngj£. Metafiles -Slsg contents shown In adjacent graph relate to discrete metalllcs and slag Indicated by f) In table above.
3.0
Figure 57 Summary sheet - Tuyere probe - No.6 Blast Furnace - 28/10/97

113
Fine coke characterisation was performed according to the following classification
groupings.
ID Particle comprised almost wholly of a single or discrete inert (IMDC)
(>90% inert content)
IM Particle dominated by a single inert particle with minor but significant
associated RMDC, nature of particle tends to be defined by inert. (>60% inert
content)
T,. Both IMDC and RMDC are present with IMDC content relatively high, but
consisting of a number of variably sized inerts as opposed to single inert.
(Localised segregation of inert particles)
T2 Distribution and content of IMDC/RMDC is typical of normal coke texture.
Where any graphitisation of coke occurs it is treated as part of normal
RMDC/IMDC component.
G Discrete graphite particles
PC Discrete petroleum coke component, treated as normal IMDC where occurring
within normal coke texture.
Table 7: Results of Tuyere Coke Probe Sampling - Port Kembla No. 6 Blast Furnace
Shutdown Date DCI %-8mm coke %-4mm coke Mean coke size (mm) % metallics % slag
22/02/97 126 53 32 14 17 17
30/06/97 144 26 17 26 3 8
28/10/97 157 7 5 37 11 2

114
Figure 58 shows the presence of each particle type in samples corresponding to
Table 7 for each of the three shutdowns. The over-representation of inert materials,
especially in the smaller size fractions, is readily apparent.
6BF 22/02/97
-8+4 -4+2 -2 + 1 -1+0.5
6BF 30/06/97
-8 + 4 -4 + 2 -2+1 -1+0.5
-8+4
6BF 28/10/97
-4+2 -2+1 -1+0.5
• ID Him BT1 ET2 EG DPC
Figure 58 Material types in -8mm coke from samples at 2m from the tuyere nose Port Kembla No.6 Blast Furnace - 22/2/97

115
The structure of feed coke and of lump coke that fell into the raceway cavity on
shutdown was similar to that already reported at previous probings and shown in
Figures 22 and 23. Figure 59 shows a lump of coke raked from a tuyere of No. 6 Blast
Furnace at the February 1997 shutdown. Inert particles are seen protruding from the
surface, the surrounding matrix of RMDC material having been preferentially removed.
Release of one inert particle is imminent
«mimi|nii|i ^ ^ « r 1 v
SPECIMEN_
Figure 59 Photograph of a coke lump raked from a tuyere of Port Kembla No.6 Blast Furnace in February 1997 showing inert particles exposed by preferential reaction of reactive macerals
The nature of fine particles reported in Figure 58 are shown in Figure 60. The high
degree of rounding evident in these particles is consistent with their having been

116
* & V Y J*. a'Ss%* *'W^ «»
'^*:'^&^ * V- ^ \' ••i:-:LT-*"*-.*-*;-.
assr** '!&**&£ •V'jrvT" ••»*• ,V •--.- .^iie1
' -^^4- *:¥i^,'--«'•*£* ••%«-/•'?*»'••>•:?' •Lai '•^.*/tm^Sj^*«S»^^JriP *«-.^;- s.
Figure 60 a) Particle types ID (discrete IMDC- whiet) at lower left with typical coke texture (T2) as remaining particles shown.(Scale: 1 cm = 200um, x50, R/L)
iJS,-*iVf;
:^wm .
O '.'4, • %-si- >"* ,*.
?'?^ %tf**s*;-' -ir»: .";•*££&. •
^ : . : ^ * .
1 •>•
^„'X*^/
w^;»»-^V„i • »\ TS*.C ••.•>» v-»x
. ' • , * ' .
'-•3.
at I t i» i -3''
* ** y •
lL' N J' - t
Figure 60 b) Particle type ID at lower left and upper right (marginal between ID and IM) Remaining particles are type T2 (Scale: 1 cm = 200um, x50, R/L)

117
subjected to considerable abrasion. These particles tend also to have relatively little
porosity and hence low surface area, as expected for low reactivity particles surviving
the hostile conditions of the raceway to be expelled as debris. Clearly, such particles are
a major threat to the maintenance of deadman cleanliness.
The injection of pulverised coal is not yet practiced at Port Kembla, but will commence
in early 2002. Since the rate of coke combustion at the tuyeres (kg/thm) is significantly
reduced when large quantities of coal are injected, it is to be expected that the
subsequent load of fine coke inert debris entering the deadman will also decrease. This
must provide some opportunity for improved furnace performance. However, since
unburnt chars leaving the raceway can themselves decrease deadman permeability and
compete with coke debris for dissolution into the dripping metal, it will be important to
maximise coal burnout in the raceway through proper coal selection, lance design and
the optimisation of oxygen injection rate.
5.3.2 The rate of inert debris generation at the raceway
In August-September 1999, an attempt was made to improve blast furnace operation at
Port Kembla by further reduction of the rate of large (+6.3mm) coal inerts in the coking
blend.
Hammer mills were adjusted and finer grinding was achieved. After only about 2 weeks
these actions had to be reversed for reasons associated with environmental compliance
at the coke ovens. Accordingly, two step changes in coking coal feed quality occurred.
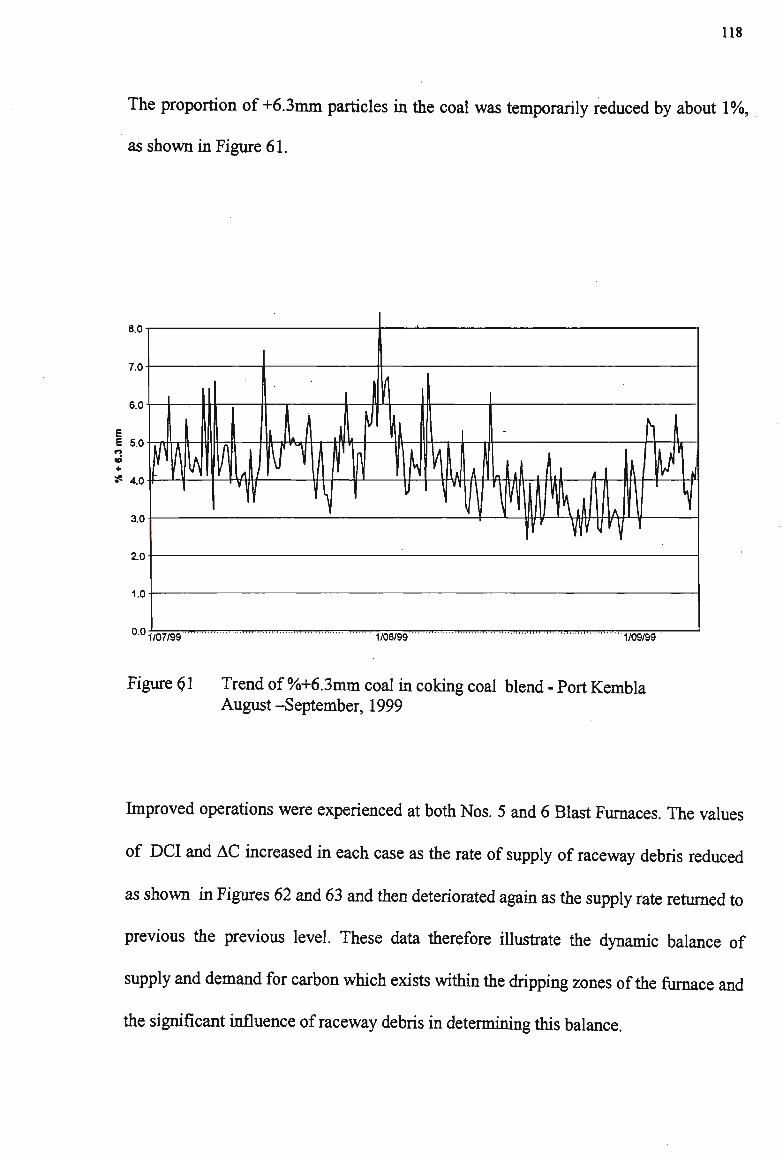
118
The proportion of+6.3mm particles in the coal was temporarily reduced by about 1%,
as shown in Figure 61.
' 1/07/99 1/06V99 1/09/99
Figure 61 Trend of %+6.3mm coal in coking coal blend - Port Kembla August-September, 1999
Improved operations were experienced at both Nos. 5 and 6 Blast Furnaces. The values
of DCI and AC increased in each case as the rate of supply of raceway debris reduced
as shown in Figures 62 and 63 and then deteriorated again as the supply rate returned to
previous the previous level. These data therefore illustrate the dynamic balance of
supply and demand for carbon which exists within the dripping zones of the furnace and
the significant influence of raceway debris in determining this balance.

119
140
135
130-
110
105
1 0 0 -I ' ' — ' — ' — I — i — I — I — i _ * — I — I — • — I — > — I — I — I — r — I — I — I l l l l l l l — ! I I I — I I I I I — I I I - I — I — I — I — I — I I I I 1-Aug-99 1-Sep-99
0.10
0.09
0.08
0.07
f 0.06 |
0.05 to
£f Q
0.04 e
o
i 0.03 5 0.02 0.01
0.00
Figure 62 Trends of DCI and A C for Port Kembla No.5 Blast Furnace August-September, 1999
150
145
O 140 T
o •a c - 135
i 130 E •a
125
•0.14 =•
0.16
0.11
1 9 0 I I — I — I — I — I — I — I — I — I — I — I — I — I — I — I — I — I — I — I — I — I — I — I — — * — i — I — I — I — I I I I — I — i — I — I — I — I — I — I — I — I — I — i — I — I — I — I I I 0 . 1 0 1 Z U l-Aug-99 1-Sep-99
Figure 63 Trends of DCI and A C for Port Kembla No.6 Blast Furnace August -September, 1999
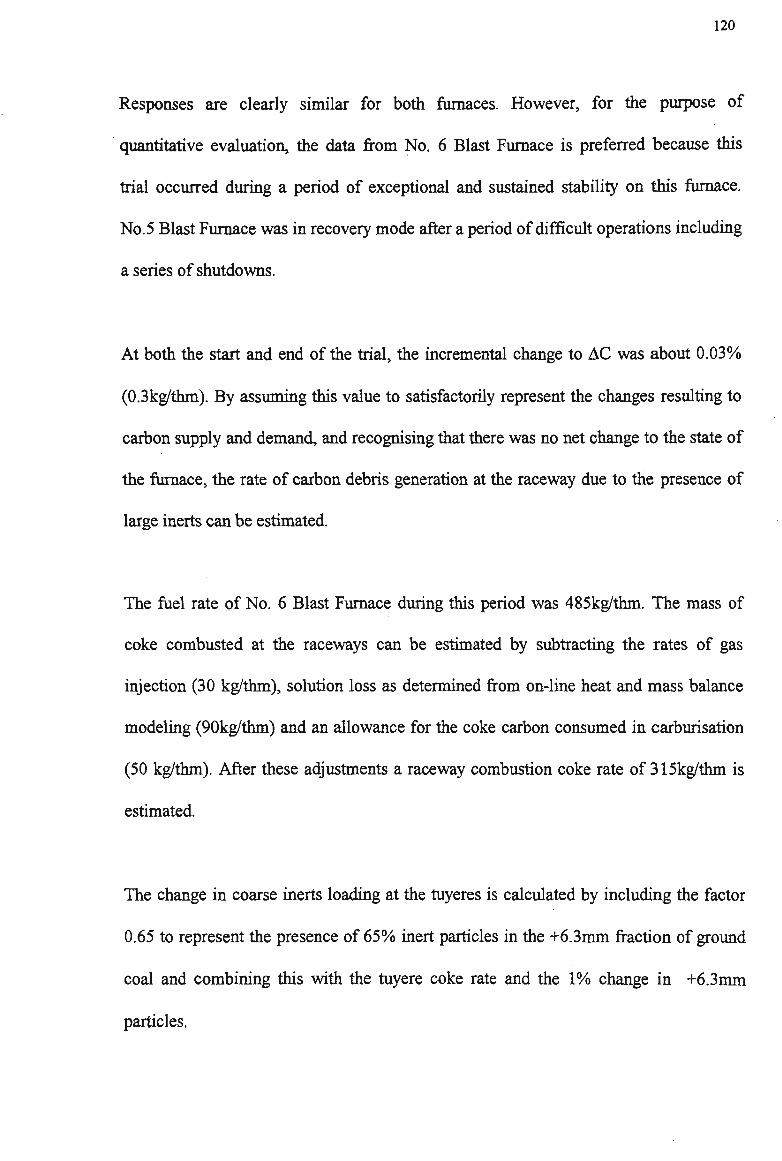
120
Responses are clearly similar for both furnaces. However, for the purpose of
quantitative evaluation, the data from No. 6 Blast Furnace is preferred because this
trial occurred during a period of exceptional and sustained stability on this furnace.
No.5 Blast Furnace was in recovery mode after a period of difficult operations including
a series of shutdowns.
At both the start and end of the trial, the incremental change to AC was about 0.03%
(0.3kg/thm). By assuming this value to satisfactorily represent the changes resulting to
carbon supply and demand, and recognising that there was no net change to the state of
the furnace, the rate of carbon debris generation at the raceway due to the presence of
large inerts can be estimated.
The fuel rate of No. 6 Blast Furnace during this period was 485kg/thm. The mass of
coke combusted at the raceways can be estimated by subtracting the rates of gas
injection (30 kg/thm), solution loss as determined from on-line heat and mass balance
modeling (90kg/thm) and an allowance for the coke carbon consumed in carburisation
(50 kg/thm). After these adjustments a raceway combustion coke rate of 315kg/thm is
estimated.
The change in coarse inerts loading at the tuyeres is calculated by including the factor
0.65 to represent the presence of 65% inert particles in the +6.3mm fraction of ground
coal and combining this with the tuyere coke rate and the 1% change in +6.3mm
particles.
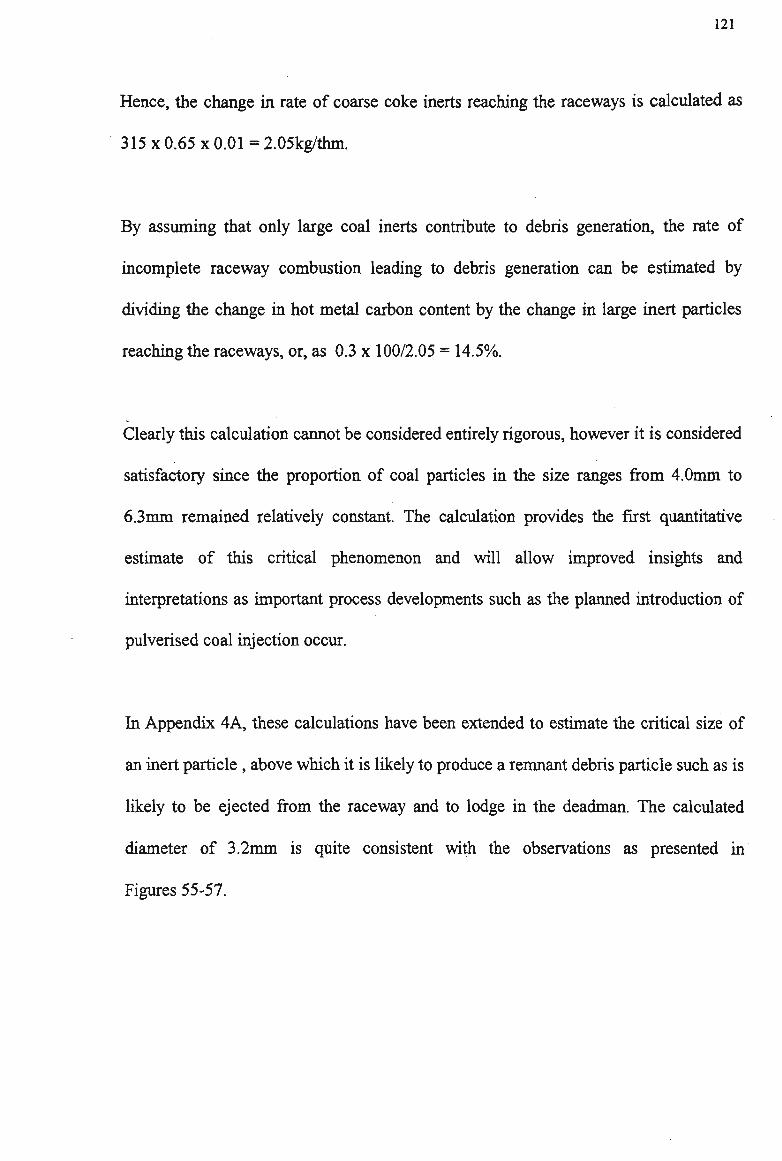
121
Hence, the change in rate of coarse coke inerts reaching the raceways is calculated as
315 x 0.65 x 0.01 = 2.05kg/thm.
By assuming that only large coal inerts contribute to debris generation, the rate of
incomplete raceway combustion leading to debris generation can be estimated by
dividing the change in hot metal carbon content by the change in large inert particles
reaching the raceways, or, as 0.3 x 100/2.05 = 14.5%.
Clearly this calculation cannot be considered entirely rigorous, however it is considered
satisfactory since the proportion of coal particles in the size ranges from 4.0mm to
6.3mm remained relatively constant. The calculation provides the first quantitative
estimate of this critical phenomenon and will allow improved insights and
interpretations as important process developments such as the planned introduction of
pulverised coal injection occur.
In Appendix 4A, these calculations have been extended to estimate the critical size of
an inert particle, above which it is likely to produce a remnant debris particle such as is
likely to be ejected from the raceway and to lodge in the deadman. The calculated
diameter of 3.2mm is quite consistent with the observations as presented in
Figures 55-57.

122
5.3 3 Tuyere Velocity
The influence of excessive blast kinetic energy is illustrated with daily average data in
Figure 64 where operational data for both Port Kembla furnaces are presented. In each
case, deadman cleanliness suffered immediately from the time when increased tuyere
velocity occurred as the result of operating with small back-up blowing engines during
maintenance outages for the main engines.
No. 5 Blast Furnace
07/08/1997 17/08/1997 27/08/1997
I—a—Tuyere Velocity e DCI | i i i !• • i •
06/09/1997
195
175
155
135
115
95
75
No. 6 Blast Furnace
250
2? o 230 o a g 210 01
>. * 190
170
l^S P: Small blowing engine usage
w I • Tuyere Velocity 9 DCI l
195
175
155
135
115
95
75
26/08/1998 05/09/1998 15/09/1998 25/09/1998
Figure 64 D C I responses to periods of increased tuyere velocity - Port Kembla Nos.5 & 6 Blast Furnaces
Tuyere coke probing was performed during a No. 5 Blast Furnace shutdown on
August 19, 1997, at the end of the high tuyere velocity period. The results are shown in
Figure 65. From the form of the plots of mean size (MS) and Sauter mean diameter
(SMD), it is apparent that a bimodal size distribution was encountered in the deadman.

123
StAsXARVSHHT TUYERE P R O B E - No. 5 BF 19.8.97 p O O m m Diameter)
Pert, dul, medum size coke, subangUer, low rnetaUsleg edhealon wtti lowlrace level of surface graphle.
Tuyere End
Snal to rnedum coke, deft wih terease in surfoce graphle. Sub-rounded to tub-angular wth m e w slegMietol odheslons.
Dark, smal to medum sized coke tereeshg coarser coke towards. Sub-engutarto sub-rounded, low adhesions end surface graphte.
Medum coke with Increasing smal coke content from 4 to 7. Sub-rounded -sub-angular Derk w«h 'sooty surface toward 7. Minor adhesions.
Subjugular to angUar coke, mostly duWeck In appearance, medum to large sties wih Incressfig content of smeJ and fine coke toward 13.
2.71m '*'»"• . TDIstance from Tuyere
" J " Bid of Probe Tube (m)
Drainage Drainage Stab - metal * slag (5.5 w t % of total probe sample)
j (Increments Corrected to Ful Probe Tube Diameter) |t 1.37m-- •-.- ..._
INSITU
1
13» 1.439 \&j
10
djo OS 1.0
11
782 1.07
12 13
2J0 -I 1 1—
2.5 Esttneted Distance from Tuyere (m)
o CO i
CO
2
40
30
20
10
c <o m a a. Vs O
o 03 C
CO
<n
•4-^
2
0
70 60 50 40 30 20 10 0
60
LL, a
r 1 | r-
4
3 1 1 8
1 ~*
. . t .
s
—
1 1
~~ 1
1 1
f-l
a
1
' ' - " - - 1 — ' — ' — < -
1 0 11
» r ^ ! 12r-
1 r
, . . 1 . . .
• 1 ' ' ' '" I' ' , " - 1 —
1 3
MS
- SMD , i . • . . i . . .
- i 1 1 1 1 r -
10 . — 11'
12 ,— i 13
— - omm -4mm
5 0 j-
40 j-
30 |-
20 \
10 f
-"—r - > — r - i — i — r -
L1
^ Metallic*
Q c- • •---!- •-» -I J L
(mm)
+«3 +31.8
•1«
+8 +4
•2
•1 -1
tncranwnt
Wekjht-kg
(cokeonly)
MS
SMD
>4nini
Fine*
(%cum)
4mm
Fines
(%cum)
% Metalllcs
KSlag
Bulk Probe Sample
(Increments. 1-13)
% -
20.8
42.6
20.3
7.4 4.9
2.9
1.3
41.6
22.92
8.72
9.1
16.5
14.6*
5.4*
Drainage
Slab(Wt%)
(Met+Slag)
Cum%
-20.6
63.1
83.5
90.9
95.8
98.7
100.0
(13.8~)
<5.1~>
5.5
(* Discrete metal/slag only, contained within sampled coke ktcrements)
(" With Inclusion of 'drainage' slab material)
tlfitei Metalllcs -Slag contents shown In adjacent graph relate to discrete metalllcs and slag Indicated by (•) In table
0.0 0.5 1.0 1.5 2.0 2.5 3.0
Est. Distance from Tuyere (m)
Figure 65 Summary sheet - Tuyere probe - No. 5 Blast Furnace - 19/8/97

124
This accumulation occurred as fines from the increased raceway debris generation
exceeded the hot metal demand for carbon and accumulated in the bed of larger
particles. The loading of large inerts in the coke at this time was not excessive. These
observations are quite in keeping with those of other workers28,33 and have led to the
implementation of a programme to progressively reduce tuyere velocity at Port Kembla
by the installation of larger diameter tuyeres.
In the case of the 1998 period of increased tuyere velocity on No. 6 Blast Furnace, the
metal generally did not reach carbon saturation. Appendix 4B shows that for Port
Kembla coke, an increase of 1 m/s in tuyere velocity (within this range) causes
approximately 0.24t/d of additional raceway debris generation at normal production
levels.
5.3.4 Furnace Shutdowns
During any blast furnace shutdown, compaction of the burden materials occurs after the
upward force of the gas flow is removed. Maintenance shutdowns at Port Kembla are
typically of 36 or more hours duration. During this time a significant decrease in burden
level is always observed.
During a shutdown of Port Kembla No. 6 Blast Furnace in October 1999, a decrease of
2.1m was observed over a period of 45.9 hours. The filling level was already reduced at
shutdown and this reduction represented 10% of the distance between tuyere level and
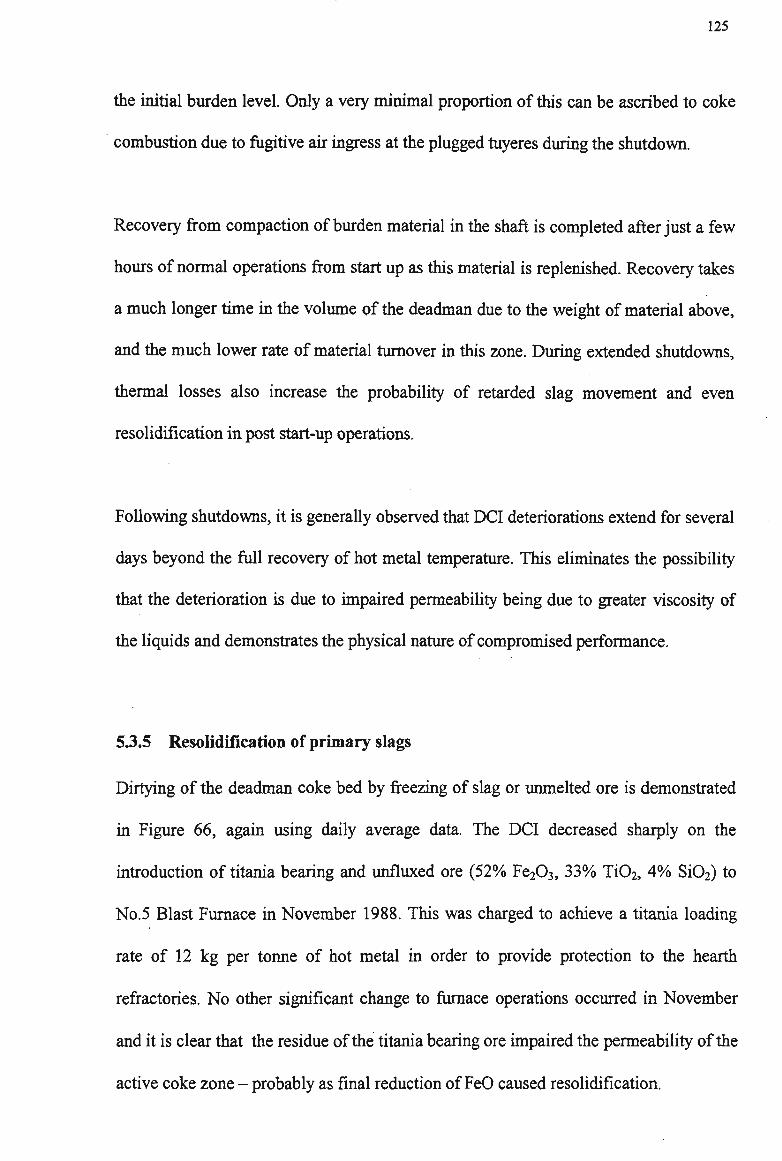
125
the initial burden level. Only a very rninimal proportion of this can be ascribed to coke
combustion due to fugitive air ingress at the plugged tuyeres during the shutdown.
Recovery from compaction of burden material in the shaft is completed after just a few
hours of normal operations from start up as this material is replenished. Recovery takes
a much longer time in the volume of the deadman due to the weight of material above,
and the much lower rate of material turnover in this zone. During extended shutdowns,
thermal losses also increase the probability of retarded slag movement and even
resolidification in post start-up operations.
Following shutdowns, it is generally observed that DCI deteriorations extend for several
days beyond the full recovery of hot metal temperature. This eliminates the possibility
that the deterioration is due to impaired permeability being due to greater viscosity of
the liquids and demonstrates the physical nature of compromised performance.
5.3.5 Resolidification of primary slags
Dirtying of the deadman coke bed by freezing of slag or unmelted ore is demonstrated
in Figure 66, again using daily average data. The DCI decreased sharply on the
introduction of titania bearing and unfluxed ore (52% Fe203, 33% Ti02, 4% Si02) to
No.5 Blast Furnace in November 1988. This was charged to achieve a titania loading
rate of 12 kg per tonne of hot metal in order to provide protection to the hearth
refractories. No other significant change to furnace operations occurred in November
and it is clear that the residue of the titania bearing ore impaired the permeability of the
active coke zone - probably as final reduction of FeO caused resolidification.
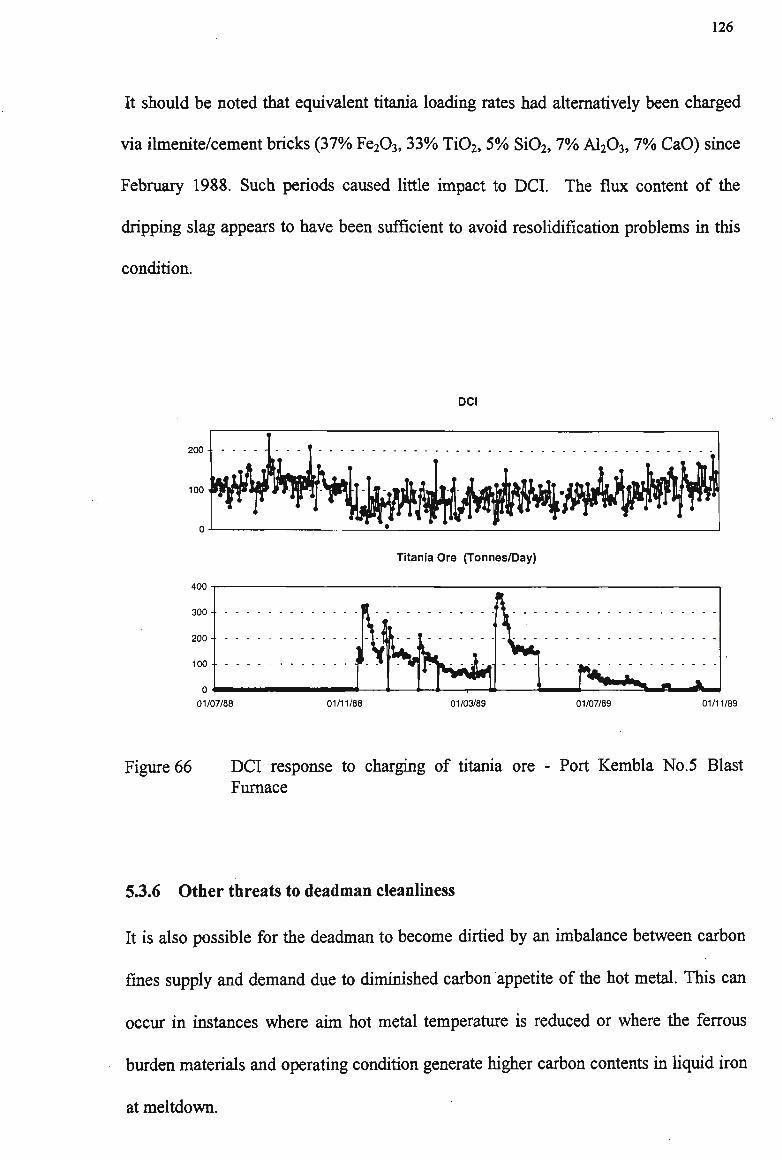
126
It should be noted that equivalent titania loading rates had alternatively been charged
via ilmenite/cement bricks (37% Fe203,33% Ti02, 5% Si02,7% A1203,7% CaO) since
February 1988. Such periods caused little impact to DCI. The flux content of the
dripping slag appears to have been sufficient to avoid resolidification problems in this
condition.
200
100
DCI
Titania Ore (Tonnes/Day)
01/07/88 01/11/88 01/03/89 01/07/89 01/11/89
Figure 66 D C I response to charging of titania ore - Port Kembla No.5 Blast Furnace
5.3.6 Other threats to deadman cleanliness
It is also possible for the deadman to become dirtied by an imbalance between carbon
fines supply and demand due to diminished carbon appetite of the hot metal. This can
occur in instances where aim hot metal temperature is reduced or where the ferrous
burden materials and operating condition generate higher carbon contents in liquid iron
at meltdown.

127
Table 11 shows data on the temperature and carbon content of the first dripping
material from softening/melting experiments in BHP laboratories. In these experiments,
beds of individual ferrous burden material are packed between coke layers and reduced
under mechanical load and conditions of temperature and gas composition which
simulate actual furnace conditions. Reduction, compaction, and permeability are
monitored throughout and dripping products are gathered as meltdown progresses. Full
details of test conditions are to be found elsewhere54.
Table 11: First Drip Temperatures and Carbon Contents for a Range of Port Kembla R a w Materials (BHP test conditions)
Material Lump ore A Lump ore B
Pellet A Pellet B Pellet C Pellet D Pellet E Pellet F Pellet G
i.
Various Sinters CaO/Si02 1.7-2.6 MgO 1.1-1.3% A1203 1.5-1.8%
First Drip Temperature (°C) 1492 1410
1421 1458 1500 1496 1506 1414 1409
1480-1540
First Drip Carbon (%) 4.50 2.05
2.86 2.56 2.14 2.14 1.97 4.60 2.39
4.7-5.3
Some variation is inherent from the sensitivity of the test method to the size, shape,
placement (and in the case of burden mix simulations, juxtapositioning) of individual
particles. However, the opportunity for burden mix to play an important role in
determining the appetite of dripping metal is clear. Almost certainly, the gangue
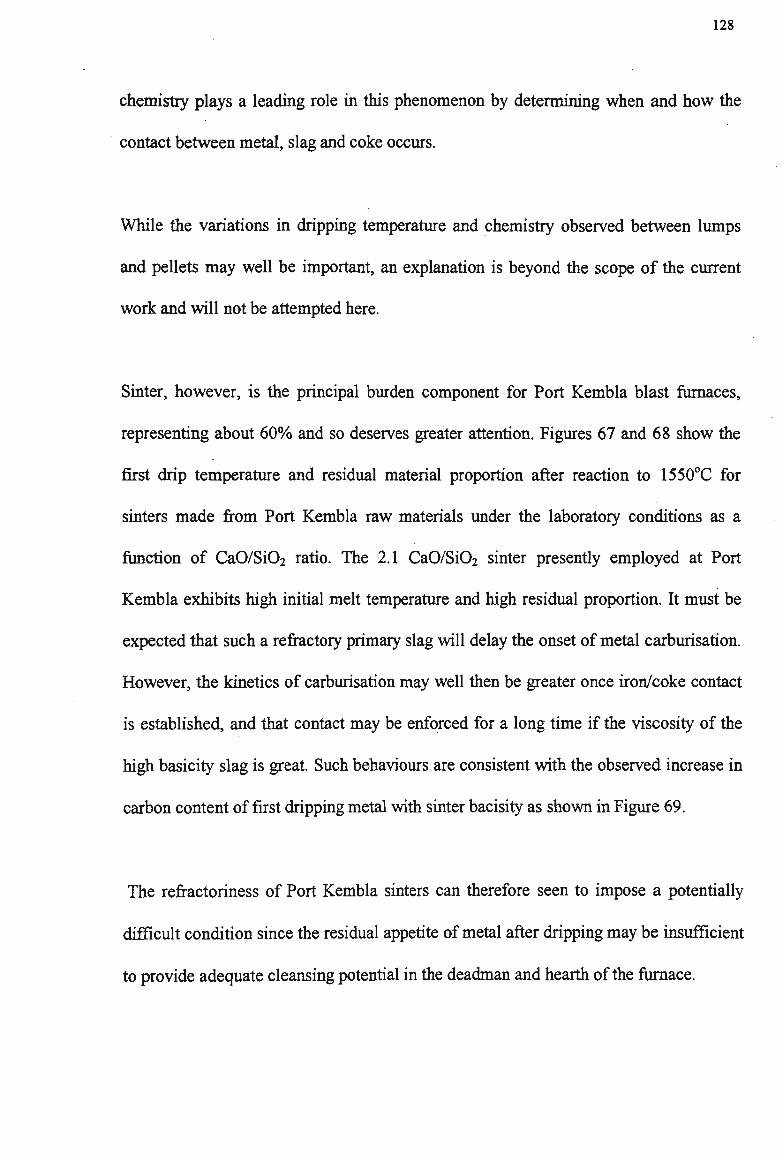
128
chemistry plays a leading role in this phenomenon by detenninmg when and h o w the
contact between metal, slag and coke occurs.
While the variations in dripping temperature and chemistry observed between lumps
and pellets may well be important, an explanation is beyond the scope of the current
work and will not be attempted here.
Sinter, however, is the principal burden component for Port Kembla blast furnaces,
representing about 60% and so deserves greater attention. Figures 67 and 68 show the
first drip temperature and residual material proportion after reaction to 1550°C for
sinters made from Port Kembla raw materials under the laboratory conditions as a
function of CaO/Si02 ratio. The 2.1 CaO/Si02 sinter presently employed at Port
Kembla exhibits high initial melt temperature and high residual proportion. It must be
expected that such a refractory primary slag will delay the onset of metal carburisation.
However, the kinetics of carburisation may well then be greater once iron/coke contact
is established, and that contact may be enforced for a long time if the viscosity of the
high basicity slag is great. Such behaviours are consistent with the observed increase in
carbon content of first dripping metal with sinter bacisity as shown in Figure 69.
The refractoriness of Port Kembla sinters can therefore seen to impose a potentially
difficult condition since the residual appetite of metal after dripping may be insufficient
to provide adequate cleansing potential in the deadman and hearth of the furnace.

1560
2.70
Figure 67 Influence of sinter basicity on softening/ melting first drip temperature
••8 c>-<D 3
•a 'm u.
u.w -
70.00 -
65.00 -
60.00 •
55.00 -
50.00 -
45.00 -
•
•
— I
•
•
•
1
•
•
— I
•
•
1 —
• •
1 _
•
•
•
1.50 1.70 1.90 2.10
Basicity
2.30 2.50 2.70
Figure 68 Influence of sinter basicity on softening/ melting residue
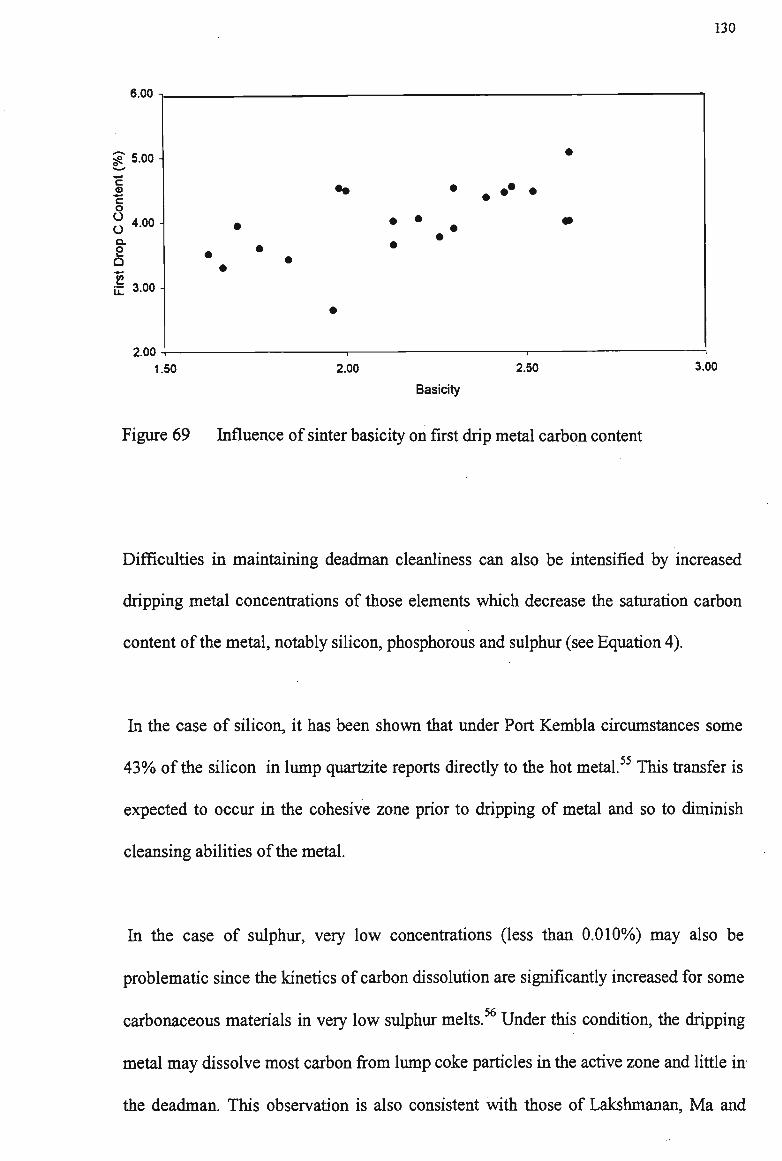
130
6.00
3.00
Figure 69 Influence of sinter basicity on first drip metal carbon content
Difficulties in maintaining deadman cleanliness can also be intensified by increased
dripping metal concentrations of those elements which decrease the saturation carbon
content of the metal, notably silicon, phosphorous and sulphur (see Equation 4).
In the case of silicon, it has been shown that under Port Kembla circumstances some
43% of the silicon in lump quartzite reports directly to the hot metal.55 This transfer is
expected to occur in the cohesive zone prior to dripping of metal and so to diminish
cleansing abilities of the metal.
In the case of sulphur, very low concentrations (less than 0.010%) may also be
problematic since the kinetics of carbon dissolution are significantly increased for some
carbonaceous materials in very low sulphur melts.56 Under this condition, the dripping
metal may dissolve most carbon from lump coke particles in the active zone and little in
the deadman. This observation is also consistent with those of Lakshmanan, Ma and
131
Lu . The average hot metal sulphur level at Port Kembla is very low by world standards
at 0.014% and reduced levels of DCI are often observed when hot metal sulphur levels
are at minimal levels.
The ash of the coke can also play a role as discussed by others36,45,46. Ideally, the ash
should physically impede carbon dissolution in the early stages of dripping to ensure
that the metal carries a healthy carbon appetite into the deadman and hearth. It would
also be desirable for coke in these lower regions to be possessed of ash having
compositions which do not impede dissolution of carbon - especially from small
particles.
The possibility for coke ash to alter in composition during transit through the furnace
due to reduction of iron oxides, absorption/reaction with alkalis or reaction gasification
of species such as silica have been previously mentioned. However, no report of
investigation into ash behaviour as a function of coal maceral origin is available. The
findings of Gill and Coin35 indicated the presence of the highly refractory phases
corundum (A1203) and spinel (MgAl204) in lump samples from Port Kembla furnaces
but the question of what mineral phases are present in fine inert particles recovered
from the tuyere probings of the deadman at Port Kembla has yet to be investigated.
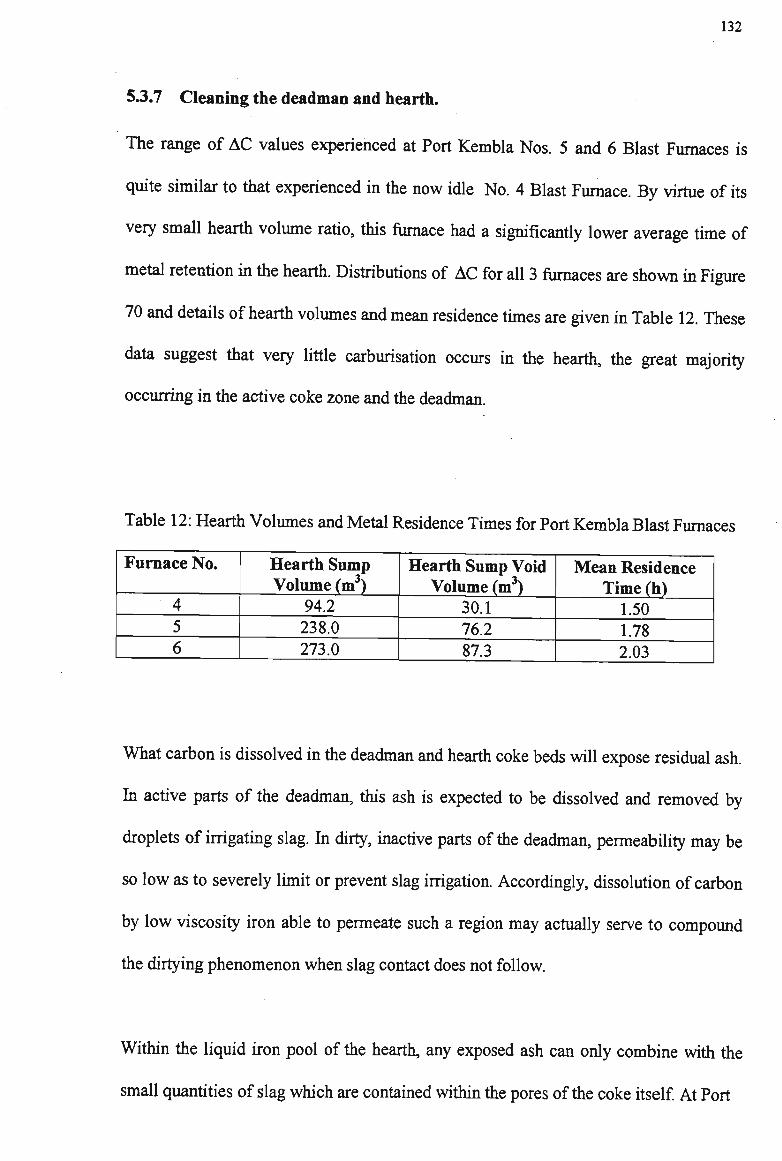
132
5.3.7 Cleaning the deadman and hearth.
The range of AC values experienced at Port Kembla Nos. 5 and 6 Blast Furnaces is
quite similar to that experienced in the now idle No. 4 Blast Furnace. By virtue of its
very small hearth volume ratio, this furnace had a significantly lower average time of
metal retention in the hearth. Distributions of AC for all 3 furnaces are shown in Figure
70 and details of hearth volumes and mean residence times are given in Table 12. These
data suggest that very little carburisation occurs in the hearth, the great majority
occurring in the active coke zone and the deadman.
Table 12: Hearth Volumes and Metal Residence Times for Port Kembla Blast Furnaces
Furnace No.
4 5 6
Hearth Sump Volume (m3)
94.2 238.0 273.0
Hearth Sump Void Volume (m3)
30.1 76.2 87.3
Mean Residence Time (h)
1.50 1.78 2.03
What carbon is dissolved in the deadman and hearth coke beds will expose residual ash.
In active parts of the deadman, this ash is expected to be dissolved and removed by
droplets of irrigating slag. In dirty, inactive parts of the deadman, permeability may be
so low as to severely limit or prevent slag irrigation. Accordingly, dissolution of carbon
by low viscosity iron able to permeate such a region may actually serve to compound
the dirtying phenomenon when slag contact does not follow.
Within the liquid iron pool of the hearth, any exposed ash can only combine with the
small quantities of slag which are contained within the pores of the coke itself. At Port

No. 4BF Jan - Dec 1995
1
I
631 aU*-*'!
No. 5BF Jan-Dec 1997
*****
N0.6BF Jan - Dec 1997
_ j — 1 _ m 4.40
— r 4.50
T" 4.60 4.70
Metal % C
4.80 4.90 I
5.00
Figure 70 A C frequency distributions for Port Kembla Blast Furnaces

134
Kembla, this slag already contains about 1 5 % A120 3 and any reaction product is likely
to contain 20% or more A1203 and therefore to be of high viscosity. Such slag would be
unlikely to be sufficiently mobile at hearth temperature to allow iron/carbon contact to
be readily re-established.
An extended period with a sitting hearth coke bed condition was experienced at Port
Kembla No.5 Blast Furnace from December 1998 to July 1999. After refloating of the
deadman, several periods of high A1203 efflux were noted wherein A1203 removal rates
in slag were calculated to exceed 105% of daily raw materials input for several days in
succession. These efflux events accompanied altered iron drainage patterns and
represented removal of accumulated ash after disturbance of the coke bed in the hearth
and lower deadman. This pattern of behaviour has been observed several times and the
cleansing of the hearth coke bed usually requires a number of such events before the
full volume is reactivated.
Once the deadman and hearth are dirtied by coke fines, cleansing can only occur by
'contact' with both metal and slag. It is little wonder that recoveries from serious
dirtying events are extremely difficult and may take in excess of a year. Avoidance of
such circumstances is much the preferred mode of operation.

135
5.3.8 Summary
The two terms comprising the Deadman Cleanliness Index recognize that the deadman
coke bed must be permeable to both metal and slag phases. The magnitude of the AC
term varies primarily according to the residence time of the metal in intimate contact
with the coke bed irrigated by metal and slag. To maintain a healthy furnace, a surfeit of
hot metal carbon demand should always exist over supply. This is best achieved by
avoiding the accumulation of fine carbon particles in the deadman. However, where an
accumulation has occurred or is occuring, the best defence is secured by raising the aim
hot metal temperature and so increasing the (saturation) appetite of the dripping hot
metal. Such action also improves slag drainage by decreasing viscosity and increasing
the superheat 'margin for error' in a process characterised by thermal fluctuation.
The second or superheat term in DCI can also be adjusted by compositional adjustment
of the slag. This may also modify fluidity to advantage. In Port Kembla conditions this
dictates reduction of aim CaO/Si02 ratio of the tapped slag as the short term action to
address deadman deterioration. Undoubtedly, actions directed towards improving the
mobility of primary or dripping slags would be superior but these slags are difficult to
monitor and are better suited to long term or strategic manipulation.
The Deadman Cleanliness Index has been found to faithfully report furnace condition as
influenced by a wide range of process variables. This results from its basis in the
fundamentals of the metal/coke interaction and the importance of slag properties to the
permeability of the whole system.

136
5.4 Behaviour of metalloids and sulphur
5.4.1 Monitoring by equilibrium partition ratios.
The carburisation of metal as it passes through the coke bed has already been discussed.
The other notable reactions which occur as metal and slag descend from the cohesive
zone to the hearth are the reduction of metalloid oxides from the slag.
C(coke) + MnO(slag) -• [Mn](hot metal) + CO(gas)
and
C(coke) + V2 Ti02(slag) -> ^[^(hot metal) + CO(gas).
It is well known that these reactions do not reach equilibrium in the blast furnace
hearth.
The extent of completion of these reactions depends on many factors, mainly the
properties of the coke bed and reaction conditions such as temperature, contact time
and chemical composition of each phase.
Slag/metal reactions are mainly replacement reactions, i.e. cations such as Mn2+ in slag
is replaced by a solute in hot metal (eg. Vi Si4+) or the anion O2' is replaced by S and two
electrons from hot metal. The coke bed affects slag/metal reactions by promoting the
mixing of the two reacting phases and/or lengthening the time available for reaction.

137
W h e n the deadman coke bed is dirtied, the transit of all liquids is prolonged and the
opportunities for gas/metal, coke/metal and metal/slag reactions to proceed toward
equilibrium are increased.
Analysis techniques based on the extent of departure from equilibrium states can yield
valuable information on the state of the coke bed in the furnace deadman and hearth.
Previous studies, most notably those of Tsuchiya et al57 have related departures from
equilibrium for the partition of silicon, manganese and sulphur between metal and slag
phases to the internal state of the furnace without making any reference to the state or
variation of the deadman coke bed. Their effort appeared to be aimed at minimisation
of the fuel rate rather than process monitoring and control as in the present work.
Tsuchiya et al define partition reaction attainment to equilibrium ratios,
RSi = (WL^O-lOO, RMn = 0WLOMB).100, and Rs= (Ls/L°s).100 , where Li is the
partitioning ratio calculated from the process data and L°i the equilibrium ratio. They
used the tapping slag composition and explained Rsi behaviour in terms of the height of
the furnace coke reserve zone and the resultant reaction opportunity for silicon transfer
to the hot metal by the accepted primary mechanism involving SiO gas. This
explanation is undoubtedly viable. However, kinetic considerations for heterogeneous
reactions in the coke bed in the hearth were not included. The possibility of influence
by dripping time rather than dripping height was not considered.
In the cases of R^ and Rs, Tsuchiya et al observed that the behaviours of manganese
and sulphur transfer reactions:

138
(Mn2+) + 2e — • [Mn] and
[S] + 2e —• (S2_)
are retarded when slag containing more residual FeO enters the hearth to result in more
of the following reaction:
(Fe2+) + 2e —• Fe
Under the observed conditions, they therefore related observed variation in these
indices to variations in burden descent stability and the consequent occasional
introduction of unreduced materials containing FeO to the hearth. Again, the
explanations made are sound in fundamental terms and in the case of sulphur,
consistency with laboratory results is noted. However, the authors did not discuss the
possibility for variation in permeability of the deadman coke bed to cause variable
extents of reaction during dripping of metal and slag and so, to influence manganese
and sulphur transfer directly or to influence the FeO load on the hearth.
5.4.2 Partition ratios and DCI
Droplets of metal and slag must pass through the same coke bed to reach the furnace
hearth. Figure 71 shows daily average data indicating that the partition ratios for
manganese and titanium are highly correlated with DCI. For each index data is
presented in daily average form. The behaviour displayed is typical and is clearly
consistent with the proposal that all these indices can be used to routinely monitor
changes to the permeability of the coke bed that is common to the passage of both

139
phases. A drop in D C I value corresponds to a closer approach towards the equilibrium
condition for both carburisation and the reduction of metal oxides from slag. Changes
occurring due to variations in the coke quality and operational disruption may be
monitored in this way.
180 -
Deadman Cleanliness Index (DCI)
0.24 A C % (Sat - Actual)
1.6, Metal/Slag Mn/MnO
0.15
0.12 -
0.09
0.06 • -
0.03
01/04/1998
Metal/Slag Ti/Ti02
01/10/1998 01/04/1999
Figure 71 Comparison between DCI and partition ratios for manganese and titanium Port Kembla No.5 Blast Furnace
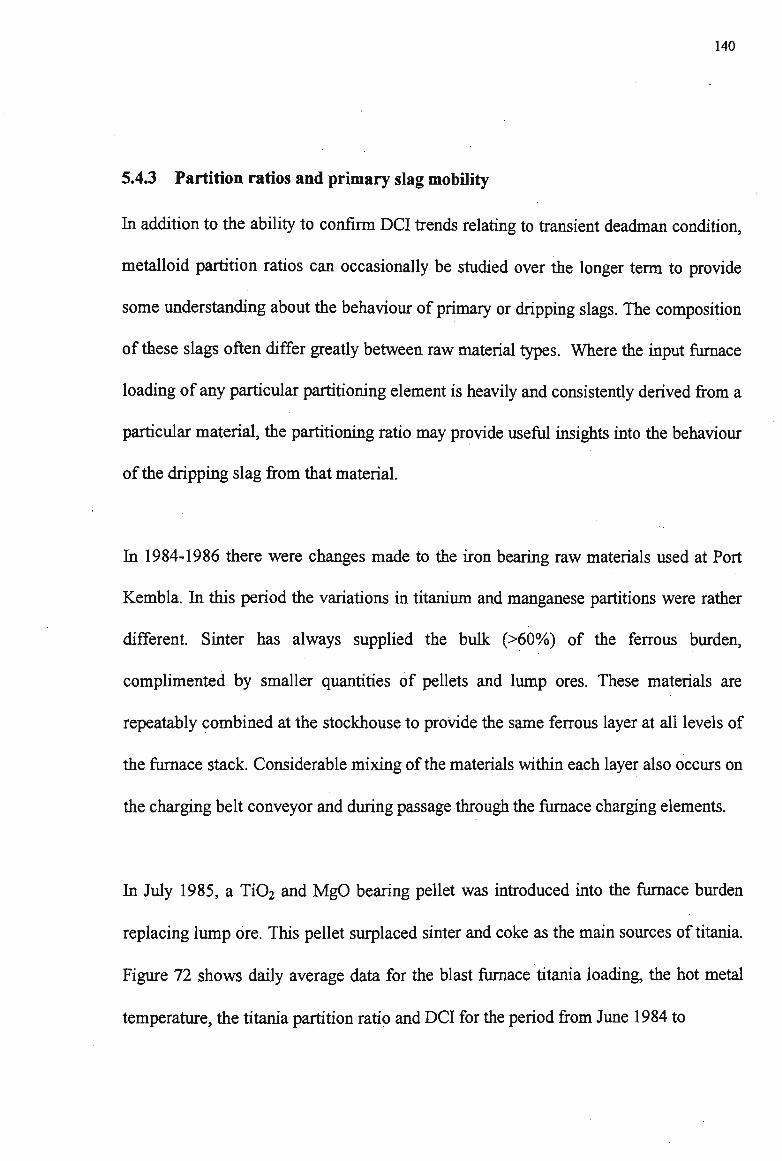
140
5.4.3 Partition ratios and primary slag mobility
In addition to the ability to confirm DCI trends relating to transient deadman condition,
metalloid partition ratios can occasionally be studied over the longer term to provide
some understanding about the behaviour of primary or dripping slags. The composition
of these slags often differ greatly between raw material types. Where the input furnace
loading of any particular partitioning element is heavily and consistently derived from a
particular material, the partitioning ratio may provide useful insights into the behaviour
of the dripping slag from that material.
In 1984-1986 there were changes made to the iron bearing raw materials used at Port
Kembla. In this period the variations in titanium and manganese partitions were rather
different. Sinter has always supplied the bulk (>60%) of the ferrous burden,
complimented by smaller quantities of pellets and lump ores. These materials are
repeatably combined at the stockhouse to provide the same ferrous layer at all levels of
the furnace stack. Considerable mixing of the materials within each layer also occurs on
the charging belt conveyor and during passage through the furnace charging elements.
In July 1985, a Ti02 and MgO bearing pellet was introduced into the furnace burden
replacing lump ore. This pellet surplaced sinter and coke as the main sources of titania.
Figure 72 shows daily average data for the blast furnace titania loading, the hot metal
temperature, the titania partition ratio and DCI for the period from June 1984 to
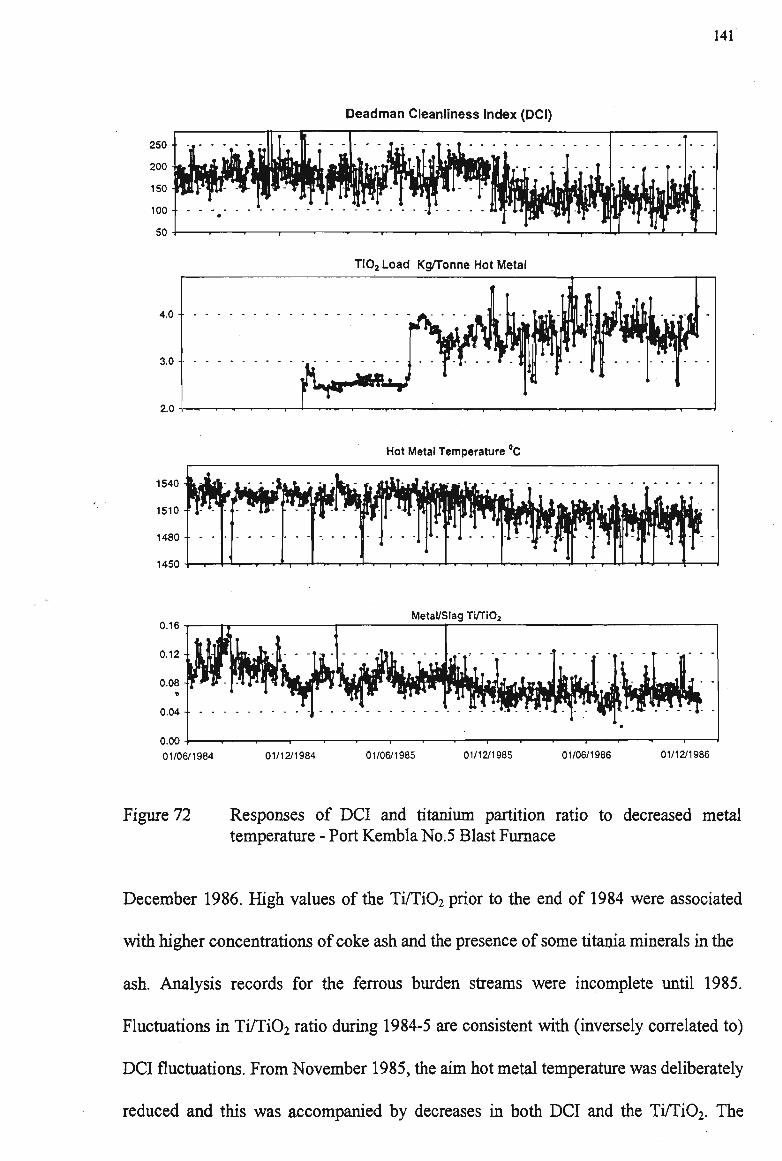
141
Deadman Cleanliness Index (DCI)
4.0-
o.oo4 01/06/1984
Ti02 Load Kg/Tonne Hot Metal
Hot Metal Temperature C
Metal/Slag Ti/TiQ2
01/12/1984 01/06/1985 01/12/1985
i i
01/06/1986 01/12/1986
Figure 72 Responses of D C I and titanium partition ratio to decreased metal temperature - Port Kembla No.5 Blast Furnace
December 1986. High values of the Ti/Ti02 prior to the end of 1984 were associated
with higher concentrations of coke ash and the presence of some titania minerals in the
ash. Analysis records for the ferrous burden streams were incomplete until 1985.
Fluctuations in Ti/Ti02 ratio during 1984-5 are consistent with (inversely correlated to)
DCI fluctuations. From November 1985, the aim hot metal temperature was deliberately
reduced and this was accompanied by decreases in both DCI and the Ti/Ti02. The
142
former is to be anticipated from Equation 14, while the latter is consistent with the
reduced thermodynamic driving force resulting from lower operating temperatures.
Some increased variability of both the hot metal temperature and the partition ratio are
evident throughout 1986.
The DCI, the partition ratio for MnO, and metal temperature are shown in Figure 73.
Contrary to that of titania, the reduction of manganese was at least maintained or
slightly increased despite the lower operating temperature. In this case, the clear
increase in partitioning variability from October 1985 was caused by decommissioning
of the hot return fines loop on the sinter machine. This reduced to opportunity for the
relatively large manganese ore particles to be fully digested into the sinter. The loading
of manganese was not altered.
Therefore, these data suggest that the mobility of primary slags derived from the Ti02
bearing pellet were not unduly compromised by the lowered operating temperature.
However, the mobility of those derived from the MnO bearing sinter may have been
compromised. This would probably be as a result of higher viscosity of the highly basic
dripping slag at the reduced temperature. The independence of these coincident results
suggests that relatively little mixing of the primary slags derived from the different Ti02
and MnO bearing materials occured during passage through the deadman with most
mixing occurring in the hearth slag pool.
These observations are consistent with the site for retardation of the sinter primary slag
being relatively close to the cohesive zone where temperatures are still fairly low and
droplet mixing opportunities are least.
143
It becomes apparent, therefore, that partition ratios of certain metalloids may provide
insights into both the status of the deadman coke bed and the behaviour of the primary
slags derived from particular burden materials where those materials dominate supply
of the species in question.
Deadman Cleanliness Index (DCI)
Hot Metal Temperature °C
2.00 i
1.50
1.00
0.50
0.00 \
WwL^ Mi
Metal/Slag
--J t
Mn/MnO
""if" Kt'i" • - - 1" " V
Hi*
t"" n
1/06/84 1/12/84 1/06/85 1/12/85 1/06/86 1/12/86
Figure 73 Responses of DCI and manganese partition ratio to decreased metal temperature - Port Kembla No.5 Blast Furnace

144
5.4.4 Statistical analysis at Port Kembla
When retardation of liquid flow through the deadman increases, so does the
opportunity for contact between the liquid streams and the gases leaving the raceway.
The important role of gaseous SiO in transferring silicon to the hot metal has been
established1. The role of lump quartzite has also been described55. At Port Kembla, a
series of regression equations have recently been developed which account for large
proportions of the process variation in the elements silicon, sulphur, and manganese.
The derived relationships are:
Si = -7.6915 + 0.0176Qtz + 0.0302Ash + 0.0046T - 0.0026DCI - 0.01390FP ,
(0.3974) (0.0007) (0.0021) (0.0003) (0.0002) (0.0019) ^=0.68
Seff = -0.1530 + 0.2283C/S + 0.000494Tp +0.00035SV-0.000236DCI
(0.0267) (0.0047) (0.00002) (0.00001) (0.000009) ^=0.58
Mn^ = -63.4776-0.0647SV-0.0697DCI + 26.1277C/S + 0.0913Tp
(6.6993) (0.0032) (0.0023) (1.1667) (0.0041) ^=0.47
where the bracketed figures represent one standard error of the relevant coefficient, and:
Si = the silicon content of the hot metal (%)
Seff- the proportion of hot metal reporting to the slag (%)
Mnrec = the proportion of manganese reporting to the metal (%)
Qtz = the rate of quartzite flux charged to the furnace (kg/thm)
Ash = the ash load charged to the furnace (kg/thm)
Tp = the temperature of the hot metal
DCI = Deadman Cleanliness Index
OFPm/w= Ore Fraction Placement ratio which describes the placement of ore when charged at the furnace stockline

145
S V = slag volume (kg/thm)
C/S = slag basicity CaO/Si02
Silicon, sulphur and manganese can all vaporise or form gaseous reaction products to a
significant degree under raceway conditions and may therefore be expected to contact
the dripping liquids in deadman regions nearest the raceway. The extent of this contact
will be determined by deadman permeability. The presence of the DCI term in all 3
relationships confirms that the permeability of the deadman is a contributor to metal
quality. In the case of silicon, entry of the OFP term58 is consistent with the presence of
higher concentrations of SiO in the high temperature zones nearest the raceways. When
large proportions of liquids are reduced and drip peripherally, SiO-hot metal contact is
enhanced.
5.4.5 Summary
The behaviour of partitioning elements, being based on the intimacy and duration of
two phase contacts, confirm the ability of DCI to report the permeability of the
deadman coke bed to the flow of process fluids. Additionally, since permeability
depends on the fluid properties as well as those of the bed, partitioning data may, in
some circumstances yield useful insights into the viability of a particular primary slag.
Such viability may usefully be modified by temperature or composition and so such
data may provide the basis for strategic modification of aim process temperature or
fluxing of individual raw materials.

146
The role of the deadman in the determination of hot metal quality is demonstrated to be
greater than previously thought.

147
6 Contributions of this work
The monitoring tools developed in this work allow new insights into a range of blast
furnace lower zone phenomena. The applicability of these tools is completely general
but implementation of strategies based on newly derived learnings is already under way
at Port Kembla. Both improved operational stability and extended campaign life are
being targeted.
6.1 The general validity of DCI
In addition to providing the first continuous means for monitoring the condition of the
region core to the blast furnace process, the Deadman Cleanliness Index provides an
indicator of overall furnace performance. This is demonstrated by the unedited monthly
data for the current campaign of Port Kembla No. 5 Blast Furnace as presented in
Figure 74. Hot metal silicon, and in particular, its standard deviation are generally
acknowledged as the best available indicators of process and thermal stability. The
significant correlation of the latter with DCI is particularly constructive. Some degree
of correlation is also evident with fuel rate, the most complete available measure of
process efficiency, and with total stave heat load which measures not only an important
component of process energy losses but is also a significant determinant of campaign
life. Weaker correlations are to be expected with these latter parameters due to
additional variation of factors such as slag volume and the deliberate actions taken by
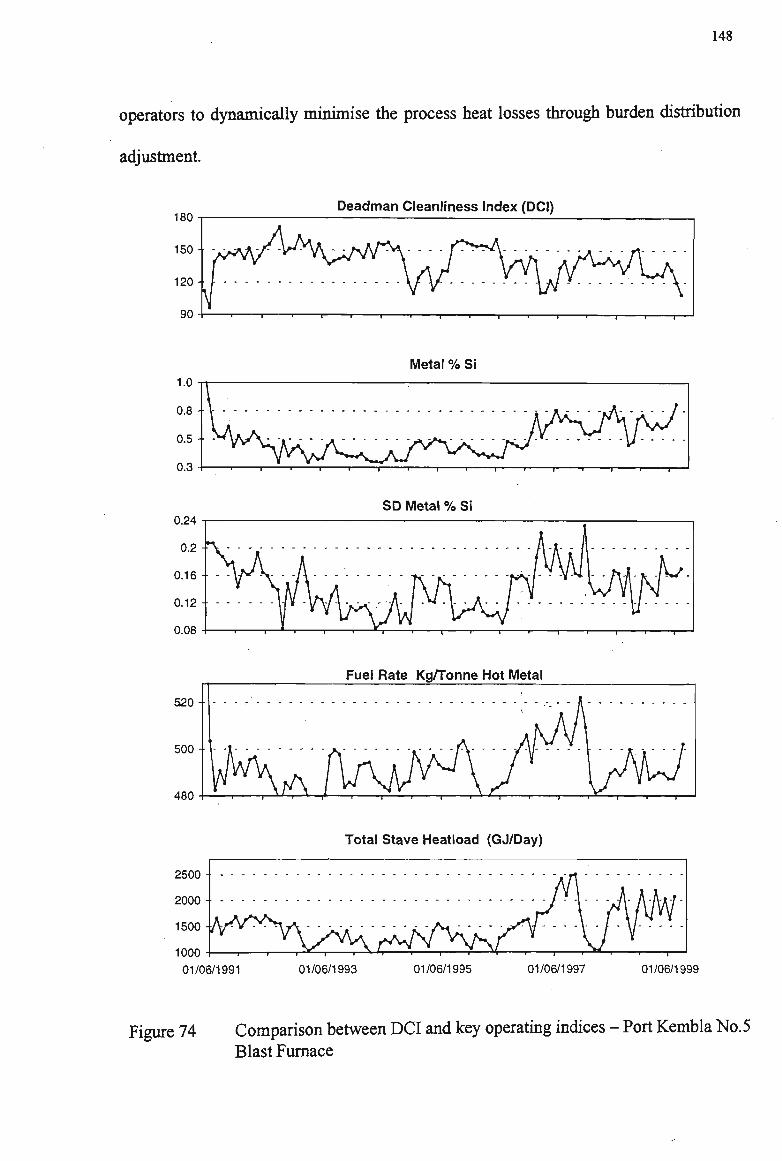
148
operators to dynamically minimise the process heat losses through burden distribution
adjustment.
180 Deadman Cleanliness Index (DCI)
Metal % Si
0.24 SD Metal % Si
Fuel Rate Kg/Tonne Hot Metal
520-
500
480
2500
2000
1500
1000
01/06/1991
Total Stave Heatload (GJ/Day)
01/06/1993 01/06/1995 01/06/1997 01/06/1999
Figure 74 Comparison between DCI and key operating indices Blast Furnace
-Port Kembla No.5
149
6.2 Quality of raw materials
While the potential for difficulties to arise out of high loading of inert particles in Port
Kembla coke had previously been recognised, no way to dynamically monitor the
influence nor to quantify the effect on blast furnace performance had been available
until the introduction of DCI.
Since 1997, coal blending practice has been modified to limit or exclude coals highest
in inert loading. Coal grinding practice has also been progressively modified to
significantly reduce the presence of those large particles which pose the greatest risk to
deaman permeability by accumulation after ejection from the furnace raceways as the
result of incomplete combustion. The control target parameter of %-3.35mm in battery
feed coal has been increased from 82% to 84% and 86%. Attempts are currently under
way to sustain a level of 87%. The standard deviation of %-3.35mm coal has decreased
from 3.4% to 1.4% over the same period. These improvements are shown in Figure 75.
The recent recognition that only inert particles greater than about 3.2mm in diameter
pose a threat to deadman cleanliness as ejected raceway debris has necessitated the re
assessment the coal grinding facilities. The existing hammer mills in their open circuit
are considered unlikely to be able to eliminate all such particles. Equipment
modification alternatives are being assessed.
Since the coking coals employed at Port Kembla are all washed on or very close to the
site, serious consideration is now being given to the removal from the coking blend of

150
that washery stream containing the greatest concentration of inert particles. This stream
may then be used as an injection coal. In this situation, although the inerts will still
reach the raceway, they will do so only as very fine particles of about 80 urn diameter.
These are expected to achieve sufficiently rapid and complete combustion to pose only
minimal threat to the permeability of the deadman.
5,6 & 7 BATT COAL GRIND (»-3MM)
01JUN91 01JUN92 01JUN93 01JUN94 01JUN9S 01JUN96 01JUN97 0IJUN9B 01JUN99
DATE
Figure 75 Trends of %-3.35mm and its standard deviation in coking coal blend at Port Kembla 1991-1999
The recent recognition of the role of carbon content of the dripping iron in determining
carbon appetite and, therefore, the iron's ability to clean and maintain the deadman has
led to new assessments of ferrous raw materials. Efforts are now underway to improve
the current position at Port Kembla by increasing the productivity and reliability of the

151
single sinter plant. This will allow reduction of the refractoriness of sinter derived
primary slag by lowering of the CaO/Si02 ratio of the sinter while still avoiding the use
of lump fluxstones for anything more than trimming purposes. As shown in Figure 69,
this is expected to reduce dripping carbon content. Comprehensive laboratory softening
and melting test programs are also underway to examine the roles of A1203 and MgO in
these sinters and their primary slags. This will be complimented by detailed study of the
partitioning behaviour of the manganese.
The proportions of pellets having low dripping iron carbon contents in the ferrous
burden mix have also been increased at the expense of pellets and lump ores having
higher dripping contents of carbon in the iron. Work is now underway to more fully
assess the remaining pellet types. Each contains MgO and the opportunity exists to
optimise the introduction of this species into the furnace. If this optimisation can be
achieved principally through the pellets, then the production and quality of sinter will
again be improved and the carbon appetite of the dripping iron can be further increased.
In this work, laboratory studies will be complimented by assessment of the partition
behaviour of slags as each pellet carries a sufficiently high loading of a suitable
'signature, element.
6.3 Tuyere practice
The role of the raceway as a coke and injected fuel gassifier has been long understood.
Quenched furnace investigations made clear the general nature of the threats associated
with the generation of coke debris from the raceway to both the drainage of metal and
slag through the hearth and to the supply of heat to the furnace core.
152
Monitoring by D C I has allowed the consequences of high rates of coke breakage in the
raceway under the influence of excessive blast velocity to be recognised and quantified.
These difficulties are magnified when coke behaves not as a simple and uniform
material, but rather as a composite material including some proportion of relatively
unreactive material such as the inert maceral derived components in Port Kembla coke.
Operating practices for periods when backup blowers must be used have been modified
to minimise the increase of blast velocity and so to minimise the additional rates of
coke debris ejection from the raceways during these unavoidable circumstances.
A separate programme to gradually decrease average blast velocity by progressively
installing tuyeres of larger diameter is now also well under way on both Port Kembla
blast furnaces.
6*4 Casting practice
The inherent requirements for hearth permeability and satisfactory furnace drainage
have been known in sufficient detail to support complex mathematical modeling for
some time. However, no tool allowing routine monitoring of the most fundamentally
important parameter, voidage, has been available until now.
If the ideal situation prevailed wherein no fines ever entered the hearth, then renewal of
the hearth coke bed would not be important.

153
Realistically, however, it is important that renewal occurs and so a sufficient residual
carbon appetite is required in hot metal entering the hearth. Additionally, it is necessary
for the hearth bed to be cleansed of any ash residue created in such consumption of
coke carbon. This requires either the existence an (unlikely) non-refractory ash, which
may also give poor raceway performance, or that the hearth coke bed be sufficiently and
consistently agitated in order to allow liberation and removal of the ash. This situation
can most readily be promoted by ensuring a consistently floating coke bed and that
buoyancy induced movements of the bed are sustained by controlled fluctuation of the
hearth iron level under the managed influence of the casting cycle. This matter is more
difficult on large furnaces, which generally operate under continuous or near continuous
casting regimes.
At Port Kembla, current efforts focus on the development of a 100% reliability in rapid
opening of the taphole. Once achieved, this will represent an important advance in
process capability, allowing the move away from continuous casting ( where a second
taphole is generally opened before closure of the first for security reasons) to a practice
incorporating an inter-cast delay of a few minutes. This will significantly increase the
buoyancy induced movement of the hearth and deadman coke beds. The resulting
improved permeability to irrigating streams of both metal and slag droplets will then
further promote cleanliness by dissolution of coke (including fines and raceway debris)
and ash respectively. The hearth voidage calculation and DCI will allow this this
development to be monitored and may assist in optimisation of the inter-cast period.
154
6.5 The dynamic nature of the deadman and blast furnace stability
The deadman is the natural source of renewal coke to the hearth and must itself not be
allowed to become stagnant nor contaminated with fine carbonaceous material or solid
slag.
The deadman must also be cleansed of raceway debris and fines from abrasion in the
shaft and cohesive zone. For the former, adequate cleanliness must exist to allow
irrigation by hot metal and slag. For the latter, it is best to promote continuous renewal
of the upper boundary of the deadman - again by buoyancy induced fluctuations
associated with a closely managed casting cycle which ensures sufficient variation in
maximum iron bath height.
At Port Kembla, aim metal temperatures have been raised from 1490 to 1515°C since
1996 in order to increase the carbon appetite of dripping metal and the superheat and
fluidity of dripping slag. Maximum levels of slag CaO/Si02 ratio have also been
reduced to secure slag superheat. In addition to these general trends, these parameters
are now recognised as key tools in maintenance and recovery of deadman cleanliness
and are used proactively in periods around extended furnace shutdowns
Renewal of lump deadman coke occurs from an area close to the furnace centreline and
the use of central coke charging to protect renewal coke from excessive damage by
solution loss is logical. The technique is already employed on one Port Kembla blast
furnace and will be commissioned on the other furnace during 2000,

155
As previously discussed, the deadman can be rapidly dirtied, but cleansing is always a
gradual process. Figure 76 demonstrates that deadman deterioration and cleansing can
occur unevenly through the furnace volume. The figure shows D C I calculated
independently for each taphole of Port Kembla No.5 Blast Furnace during 1998/9. Gaps
in data occur during taphole out of service periods. The knowledge that a particular
portion of the furnace hearth is lagging in the recovery of cleanliness may allow
patterns of taphole use to be modified to accelerate local cleansing.
ISO
165
150-
135
120
105-
90
180-
165-
150-
135 -
120-
105-
90-
DCI TAPHOLE 1
DCI TAPHOLE 2
DCI TAPHOLE 3
01JAN98 01APR9B 01JUL98 010CT98 01JAN99
DATE
01APR99 01JUL99 010CT99 01JAN00
Figure 76 D C I trends for individual tapholes - Port Kembla No.5 Blast Furnace
156
Clearly the deadman is extremely dynamic, being influenced by many and varied
factors. Equally, its influence is dynamic and is directly related to process stability and
furnace longevity. The availability of DCI, a tool allowing continuous monitoring at no
additional expense has proven invaluable in understanding these behaviours. New
applications for the tool continue to be identified both in current practice and by study
of extensive databases.
6.6 The Continuing Development of DCI
The new understanding of blast furnace phenomena gained through the evolution of
DCI as presented in this work is preliminary. However, along with the hearth voidage
estimation, it provides a physical basis for further development of mathematical models
of the process.
DCI is designed to characterise the kinetic state of the the central part of the lower
furnace, therefore it should be subject to further improvement as new and/or more
reliable process measurements and observations become available. The, advent of any
new operating condition such as the introduction of pulverised coal injection (planned
for February 2002 at Port Kembla) must also be expected to provide learning
opportunities.
Efforts made in this work provide the basis for acquiring new knowledge of blast
furnace lower zone phenomena. By application of these tools, this previously rather

157
opaque part of the process is expected to be more transparent, allowing improved
process understanding and performance.

158
7 Conclusions
A novel method for the routine estimation of the voidage of the coke bed at the critical
taphole level in the blast furnace hearth has been developed. The method employs data
that generally are routinely collected.
Analysis of operational hearth voidage estimation data demonstrates that this most
critical determinant of hearth permeability varies dynamically and can be influenced
both by raw materials quality and by casting practice.
Using operational data, factors influential to the force balance on the hearth/deadman
coke bed have been examined to identify stable and unstable behaviours with respect to
floating and sinking of the deadman. Unstable conditions giving rise to high and
variable heat loads in hearth sidewall refractories have been linked to significant
damage in one industrial blast furnace.
The Deadman Cleanliness Index has been developed to routinely monitor the state of a
region fundamental to the permeability and stability of the process yet previously
inaccessible to probing or other on-line means of observation. This hybrid index relies
on the relationship between metal/coke contact time and the degree of carburization
attained by hot metal dripping towards the hearth as the main indicator of coke bed
status. A second indication is inferred from the superheat estimated to be available to
the dripping slag and so recognises that the bed must be permeable to both liquids.
159
The ability for generation and discharge of excessive coke debris from the raceways and
its subsequent accumulation in the deadman to quickly impair cleanliness has been
established. An over abundance of coarse IMDC particles, which exhibit relatively
unreactive behaviour in the raceway, or the use of excessive blast velocity can both give
rise to such high ratios of debris generation.
Fouling of the deadman by resolidification of primary slag also has been identified and
a number of other operational threats to deadman cleanliness have been discussed.
The partitioning behaviour of elements such as manganese and titanium can provide a
valuable confirmation of DCI indications since the relevant heterogeneous reactions are
also dependent on interphase contact durations. Additionally, where a partitioning
element is primarily derived from a single raw material, the partitioning response to
some operational changes may provide insights into the character and viability of the
primary slag generated by the raw material in question. Primary slags from different
ferrous burden materials may experience little mixing before collection in the hearth
slag pool.
Statistical analysis has indicated that the permeability of the deadman to all fluid phases
plays an important role in determining hot metal quality.
Learnings derived from study of DCI at Port Kembla continue to be gathered and are
providing the basis for strategic modification to raw materials preparation and selection
and to process control modification. It is expected that DCI will provide a valuable

monitoring tool for the future implementation and optimisation of pulverised coal
injection to the blast furnace tuyeres.
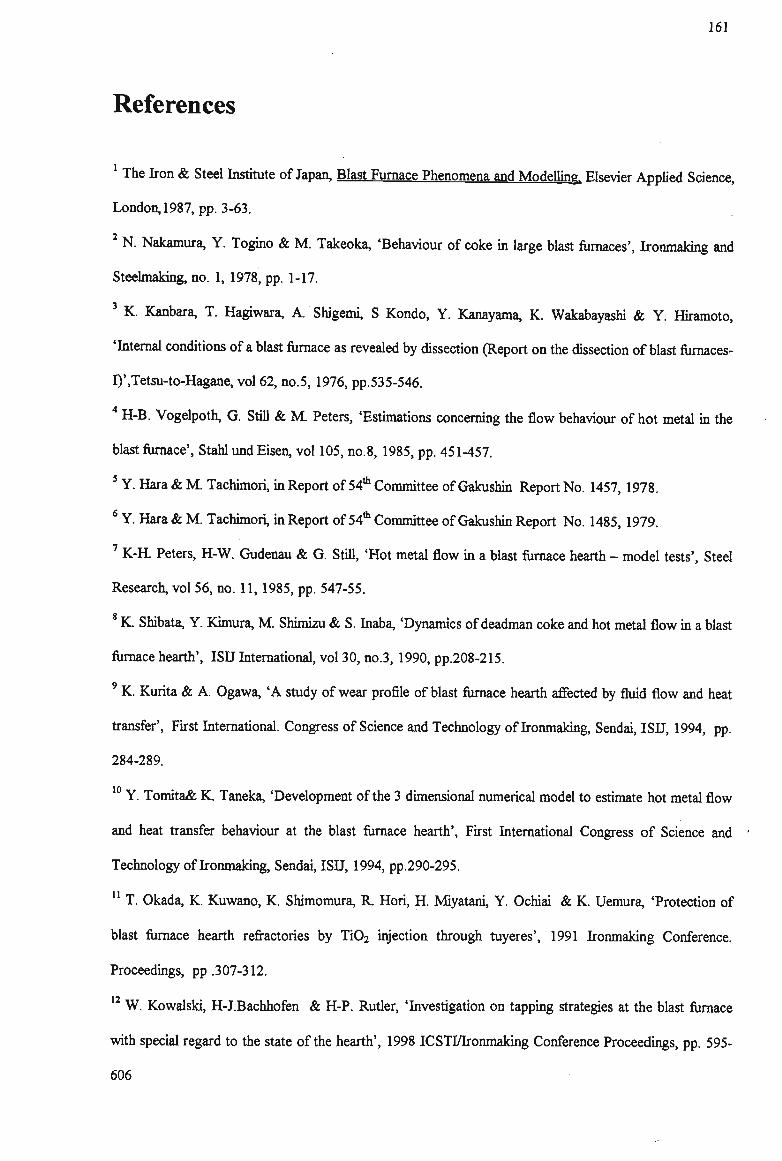
161
References
The Iron & Steel Institute of Japan, Blast Furnace Phenomena and Modelling. Elsevier Applied Science,
London, 1987, pp. 3-63.
2 N. Nakamura, Y. Togino & M. Takeoka, 'Behaviour of coke in large blast furnaces', Ironmaking and
Steelmaking, no. 1,1978, pp. 1-17.
3 K. Kanbara, T. Hagiwara, A. Shigemi, S Kondo, Y. Kanayama, K. Wakabayashi & Y. Hiramoto,
'Internal conditions of a blast furnace as revealed by dissection (Report on the dissection of blast furnaces-
I)',Tetsu-to-Hagane, vol 62, no.5,1976, pp.535-546.
H-B. Vogelpoth, G. Still & M. Peters, 'Estimations concerning the flow behaviour of hot metal in the
blast furnace', Stahl und Eisen, vol 105, no.8, 1985, pp. 451-457.
5 Y. Hara & M. Tachimori, in Report of 54th Committee of Gakushin Report No. 1457,1978.
6 Y. Hara & M. Tachimori, in Report of 54th Committee of Gakushin Report No. 1485,1979.
7 K-H. Peters, H-W. Gudenau & G. Still, 'Hot metal flow in a blast furnace hearth - model tests', Steel
Research, vol 56, no. 11,1985, pp. 547-55.
K. Shibata, Y. Kimura, M. Shimizu & S. Inaba, 'Dynamics of deadman coke and hot metal flow in a blast
furnace hearth', ISU International, vol 30, no.3, 1990, pp.208-215.
K. Kurita & A. Ogawa, 'A study of wear profile of blast furnace hearth affected by fluid flow and heat
transfer', First International. Congress of Science and Technology of Ironmaking, Sendai, ISU, 1994, pp.
284-289.
10 Y. Tomita& K. Taneka, 'Development of the 3 dimensional numerical model to estimate hot metal flow
and heat transfer behaviour at the blast furnace hearth', First International Congress of Science and •
Technology of Ironmaking, Sendai, ISU, 1994, pp.290-295.
11 T. Okada, K. Kuwano, K. Shimomura, R Hori, H. Miyatani, Y. Ochiai & K. Uemura, 'Protection of
blast furnace hearth refractories by Ti02 injection through tuyeres', 1991 Ironmaking Conference.
Proceedings, pp .307-312.
12 W. Kowalski, H-IBachhofen & H-P. Rutler, 'Investigation on tapping strategies at the blast furnace
with special regard to the state of the hearth', 1998 ICSTI/Ironmaking Conference Proceedings, pp. 595-
606
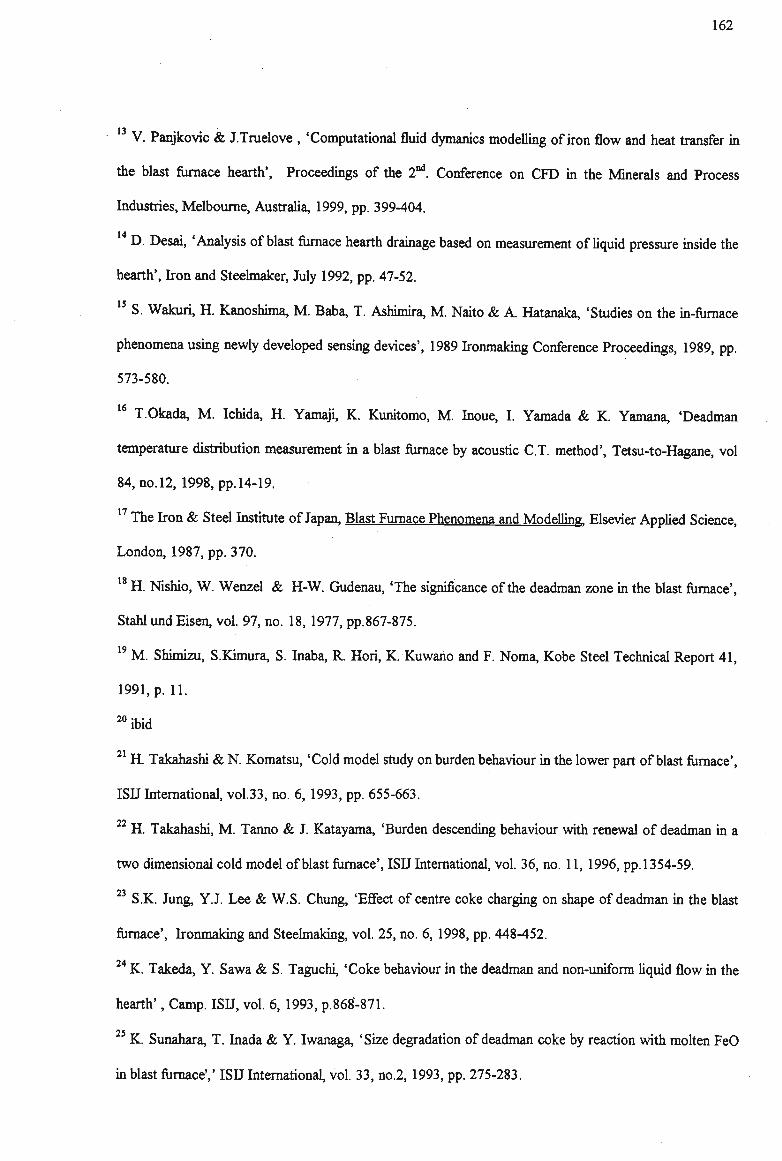
162
V. Panjkovic & J.Truelove , 'Computational fluid dymanics modelling of iron flow and heat transfer in
the blast furnace hearth', Proceedings of the 2nd. Conference on CFD in the Minerals and Process
Industries, Melbourne, Australia, 1999, pp. 399-404.
D. Desai, 'Analysis of blast furnace hearth drainage based on measurement of liquid pressure inside the
hearth', Iron and Steelmaker, July 1992, pp. 47-52.
15 S. Wakuri, H. Kanoshima, M. Baba, T. Asbimira, M. Naito & A Hatanaka, 'Studies on the in-furnace
phenomena using newly developed sensing devices', 1989 Ironmaking Conference Proceedings, 1989, pp.
573-580.
T.Okada, M. Ichida, H. Yamaji, K. Kunitomo, M. Inoue, I. Yamada & K. Yamana, 'Deadman
temperature distribution measurement in a blast furnace by acoustic C.T. method', Tetsu-to-Hagane, vol
84,no.l2, 1998, pp.14-19.
The Iron & Steel Institute of Japan, Blast Furnace Phenomena and Modelling. Elsevier Applied Science,
London, 1987, pp. 370.
18 H. Nishio, W. Wenzel & H-W. Gudenau, 'The significance of the deadman zone in the blast furnace',
StahlundEisen, vol. 97, no. 18, 1977, pp.867-875.
19 M. Shimizu, S.Kimura, S. Inaba, R Hori, K. Kuwano and F. Noma, Kobe Steel Technical Report 41,
1991, p. 11.
20 ibid
21 FL Takahashi & N. Komatsu, 'Cold model study on burden behaviour in the lower part of blast furnace',
ISU International, vol.33, no. 6, 1993, pp. 655-663.
22 H. Takahashi, M. Tanno & J. Katayama, 'Burden descending behaviour with renewal of deadman in a
two dimensional cold model of blast furnace', ISU International, vol. 36, no. 11,1996, pp.1354-59.
23 S.K. Jung, Y.J. Lee & W.S. Chung, 'Effect of centre coke charging on shape of deadman in the blast
furnace', Ironmaking and Steelmaking, vol. 25, no. 6,1998, pp. 448-452.
24 K. Takeda, Y. Sawa & S. Taguchi, 'Coke behaviour in the deadman and non-uniform liquid flow in the
hearth', Camp. ISU, vol. 6, 1993, p.868'-871.
25 K. Sunahara, T. Inada & Y. Iwanaga, 'Size degradation of deadman coke by reaction with molten FeO
in blast furnace',' ISU International, vol. 33, no.2,1993, pp. 275-283.
163
AKasai, J.Kiguchi,T.Kamijo & M Shimizu, 'Degradation of coke by molten iron oxide in the cohesive
zone and dripping zone of a blast furnace', Tetsu-to-Hagane, vol. 84, no. 10. 1998,pp. 9-13.
A Kasai, H. Iwakiri, T. Kamizo & M. Shimizu, "The inflow to a deadman of fine coke generated near
the lower part of the shaft in a blast furnace', Tetsu-to-Hagane, vol. 83, no. 9,1997, pp.13-18.
Y. Iwanaga & K. Takatani, 'Degradation behaviour of coke at high temperature zone in blast furnace',
Trans. ISU, vol. 28,1988, p. 991.
E. Beppler, B. Gerstenberg, U. Jabnsen & M. Peters, 'Requirements on coke properties especially when
injecting high coal rates', 1992 Ironmaking Conference Proceedings, pp. 171-184.
R.R. Wilmers, "The effect of blast furnace coal injection on bosh coke properties, coke combustion and
furnace permeability' 1989 Ironmaking Conference Proceedings, pp. 395-402.
31RR Wilmers and R Poultney, 'Coke in the blast furnace', Cokemaking International, vol. 4, no.l, 1992,
pp. 69-78.
32 Y. Yoshida, K Tanaka, S. Tada & K. Kuwano, 'High coal injection rate in Kobe No.3 Blast Furnace',
1991 Ironmaking Proceedings, pp. 517-522.
33 T. Matsuo, Y. Kanazuka, K. Hoshino, Y. Yoshida, S. Katayana & S. Ishiwaki, 'Low coke rate
operation under high PCI at Kobe No.3 Blast Furnace', 1997 Ironmaking Conference Proceedings, pp.
203-206.
34 O. Kerkkonen, 'Influence of ash reactions on feed coke degradation in the blast furnace' , Cokemaking
International, vol. 9, no. 2,1997, pp.34-41.
35 W.W. Gill & C.D.A Coin, 'Coke reactions and structural changes in the high temperature region of
Australian blast furnaces', International Blast Furnace Hearth and Raceway Symposium, Newcastle,
Australia, 1981. AusIMM Symposium Series, No. 26, pp 21-1 to 21-13.
36 V.K. Lakshmanan, D. Ma & W-K. Lu, 'Iron blast furnace primary slag - coke reactions',
W.O. Philbrook Memorial Symposium Conference Proceedings, 1988, pp.77-90.
37 'Inorganic constituents of Australian coals' CSIRO Coal Research, no. 9,1963
38 M. Shibaoka, 'Silica/alumina ratios of the ashes from some Australian coals', Fuel, vol. 51, 1972,
pp.278-283.

164
M.J. McCarthy, I.J. Taggart, H. Rogers, P.C. Goldsworthy & J.M. Burgess, 'Effect of blast parameters
and coke properties on raceway geometry in a hot model', Ironmaking Proceedings 1983, pp.555-565,
A Tayama, S. Murakami, Y. Yone, Y. Miura, T. Yamaguchi, 'The coal preparation control process in
the manufacture of metallurgical coke', 1981 Ironmaking Proceedings, pp. 111-117.
411.Z.Buklan, I.D.Balon,U.F.Nikulin, V.N.Murav'ev, & N.MMischenko, 'Carburisation and reduction of
silicon during pig iron formation in a blast furnace', Stal, vol. 7,1973, pp. 583-589.
G.A Volovik, V.I. Kotov & P.G. Kalashnyuk, 'Carburisation of iron in blast furnace smelting', Steel in
the USSR, vol. 21, 1991, pp.247-48.
43 F. Neumann, H. Schenck & W. Polleson, 'Eisen-Kohlenstoff-hiegeringen in Thermodynamischer
Betractung', Geiserei-Tech Wiss. Beihefte, vol. 23,1959, pp. 1217-46.
N. Ponghis, 'Limits and constraints for the production of hot metal with low contents in silicon, sulphur
and nitrogen', 1991 Ironmaking Conference Proceedings, pp.457-64.
45 H-W. Gudenau, J.P. Mulanza & D.G. R Sharma, 'Carburisation of hot metal by industrial and special
cokes', Steel Research, vol. 61, no.3,1990, pp. 97-104.
H-W. Gudenau, L. Meier & V. Schemmann, 'Coke quality requirements for modern blast furnace
operations', 1998 ICSTI/Ironmaking Proceedings, pp. 1067-1072.
Rl.Olivares, M.Mahoney &L.Greedy, 'The carburisation of hot metal by cokes and their wettability',
BHPR/N/1998/116
48 S.J. Deng, Y.X. Shi, Q.Wang & C.Y. Li, 'Studies of carburisation of hot metal in the lower part of the
blast furnace',Iron and Steel (China) vol. 27, no. 11, pp.5-9.
49 Y. Shimomura, YKushima & S.Arino, Report of 54th Committee of Gakushin (Japan Society for
Promotion of Science), Report No. 1484,1979.
50 W-K Lu, "Heterogeneous Kinetics", a chapter in the book "Advances in physical chemistry of process
metallurgy", eds. N.Sano, W-K. Lu, & P. Riboud, Academic Press, London, 1997, pp.219-247,
51P.Plat, G.Brown & KPrice, 'PK5BF hearth investigation : hearth refractory and hearth skull
investigation (1992), BHP Steel, Slab & Plate Products, rTD-Rep/RD/92.033.
S2 W.B.U. Tanzil, P. Zulli, J.M. Burgess & W.V. Pinczewski, 'Experimental model study of the physical
mechanisms governing blast furnace hearth drainage', Trans. ISU, vol. 24,1984, pp. 197-205.

165
B.L. Fraser, personal communication - email 26/4/00.
54 P.R Dawson, 'Determination of high temperature properties of blast furnace burden materials', SEAISI
Quarterly, Jan. 1987,pp.23-42.
55 K.P. Galvin, R.J. Nightingale & AG. Waters, 'Impact of quartzite additions on hot metal silicon',
AusIMM Proceedings, vol. 299 no. 2, 1994, pp. 107-111.
56 B. McDonald, C. Wu, V. Sahajwalla, K. Farrell & T. Wall, 'Dissolution studies of carbonaceous
materials in blast furnace hot metal during pulverised coal injection', ICSTI /Ironmaking Conference
Proceedings, 1998, pp. 1889-1900.
57 N. Tsuchiya, S. Taguchi, Y. Takada & K. Okabe, 'Influence of operational factors on thermal and
chemical conditions at lower part of blast furnace', Tetsu-to-Hagane vol. 63,1977, pp. 1791-1798.
58 N. Di Giorgio, 'More on characterising charging patterns, allocating rings to centre, mid-radial and
wall', BHP Steel, ITD-BF-Note-96-035.

166
Appendix 1A
Specifications of Metal Sampler

167
MINCO Midwest Instrument
P.O. Box 208,487 Princes Highway, Fairy Meadow, 2519 N.S.W. Australia. Web Site: www.miiico.com.au Phone:+61 2 4283 7366 Fax:+61 2 4283 2690
PRODUCT INFORMATION SHEET
Product Name: Minco Non-Boil White Iron Sampler
Other Names: NBWI, 40,000 Non-splash
Product Code: 40M-HC-1Q-NB-350
The Minco 40,000 series Iron Samplers are immersion type samplers used to sample molten iron for quality and process control purposes.
The Minco NBWI Sampler consists of a ceramic mould encased in a sand-filled refractory fibre outer sleeve. This outer sleeve is of non-boil design, which protects the user from molten metal splash The N B W I produces a white iron structured sample which is desirable for spectrographic and X-Ray analysis.
Features:
• Wide sample fill area to allow for quick filling • Ceramic mould provides easy sample release • Quick chill properties producing a desired white iron structure • Adequate mould venting ensure complete filling (no voids) • Samples through slag • One person operation - minimal sampling time/short immersion time • Ideally suited for induction furnace, ladle, tundish, runner applications • Options: The N B W I Sampler can be manufactured to suit any customer specifications
Product Details:
• Sample size: 3 2 m m diameter x 10mm thick Disc. • Packaging'. 24 samplers/carton
Carton weight 18 K g approximately
Product Usage:
Fit the sampler onto a steel rod of suitable length and immerse for 5 to 10 seconds (specific immersion time should be determined for the application) into the molten iron, remove, then break open to retrieve sample disc. Refer to attached diagram.
Minco N B W I Product S W i
Ui Tech Production & Control Products for the Metals Industry
GROUP ompa n y (Australia) Pty. Ltd.
32 mm -«=—______—>
Disc size
OuaiRy Endorsed Company
OlNU ISO MU9 3u«4»«v

168
GROUP MINCO Midwest Instrument Company (Australia) Pty. Ltd.
P.O. Box 208, 487 Princes Highway, Fairy Meadow, 2519 N.S.W. Australia. Web Site: www.minco.com.au Phone: +612 4283 7366 Fax +61 2 4283 2690
Wtldod Baid
approx 50 m m
f
Vent Holes
Sample Holder
Iron Level
direction of iron stream
Hi Tech Production & Control Products for the Metals Industry
Quality Endorsed Compe/iy
A&wttt «o low u» .a.

169
Appendix IB
Specifications of Thermocouples
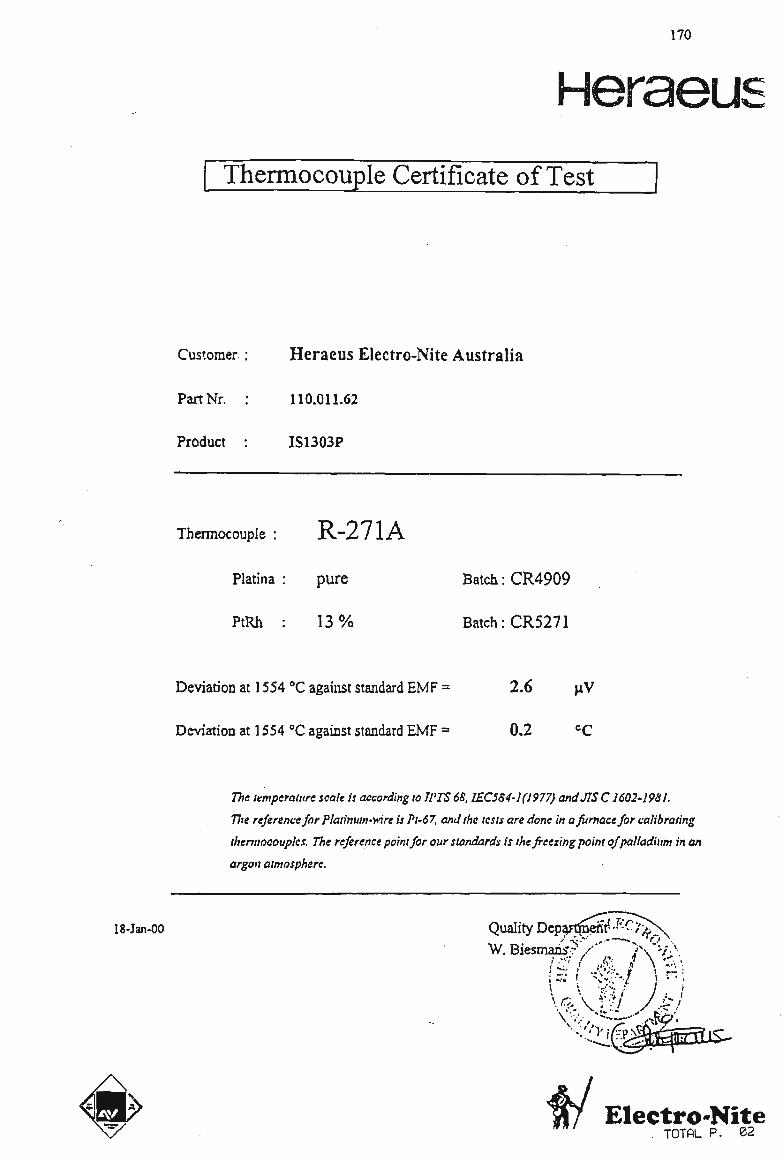
170
Heraeus Thermocouple Certificate of Test
Customer Heraeus Electro-Nite Australia
PartNr. 110.011.62
Product IS1303P
Thermocouple : J V - 2 7 1 A
Platina
PtRh
pure
13%
Batch: CR4909
Batch: CR5271
Deviation at 1554 °C against standard E M F =
Deviation at 1554 °C against standard E M F =
2.6 uV
0.2
The temperature scale is according 10 Il'TS 68, IEC5S4-1(1977) andJISC 1602-198J.
77ie reference for Platinum-wire is Pt-67, and the tests are done in a furnace for calibrating
thermocouples. The reference point for our standards is the freezing point of palladium in an
argon atmosphere.
-00 Quality
W. Biesmansr ty Departing •r':0>X
/•<•>• .-••—»» rO\
lesmansrV /\ '-/ x 1 ^V .' .-•/'.••'. i l -r :
i/ Electro-Nite . TOTfiL P. 02
171
Appendix 2
Correction of Tuyere Probe Sample Increment Locations
172
Correction of Tuyere Probe Sample Increment Locations
Tuyere probe samples are taken by insertion of a steel tube through the open tuyere port
during shutdown. Samples are carefully sealed and cooled immediately on withdrawal
from the furnace and then carefully transported to the laboratory for opening.
When opened, samples may fail to occupy the full volume of the tube. This occurs
when full penetration of the sample tube cannot be achieved and is followed by
spreading of the sample during withdrawal. This causes some doubt as to the true
location from which the sampled particles are derived. There is, however, no doubt that
the sequential relationship between particles is maintained.
During the period 1979-1984, a significant number of tuyere probe samples were
extracted from the Port Kembla blast furnaces. At that time, a method for correcting for
this spreading phenomenon was developed.
On opening of the sample, it was visually inspected and divided into increments which
preserved any visually identifiable changes along the sample. These increments were
then processed individually to remove any entrained particles of metal and slag. These
were weighed separately. The remaining coke from each increment was then weighed
and sized by standard practice. From the sizing data, the Sauter mean diameter (SMD)
for coke in each increment was determined. The bulk density of coke from each
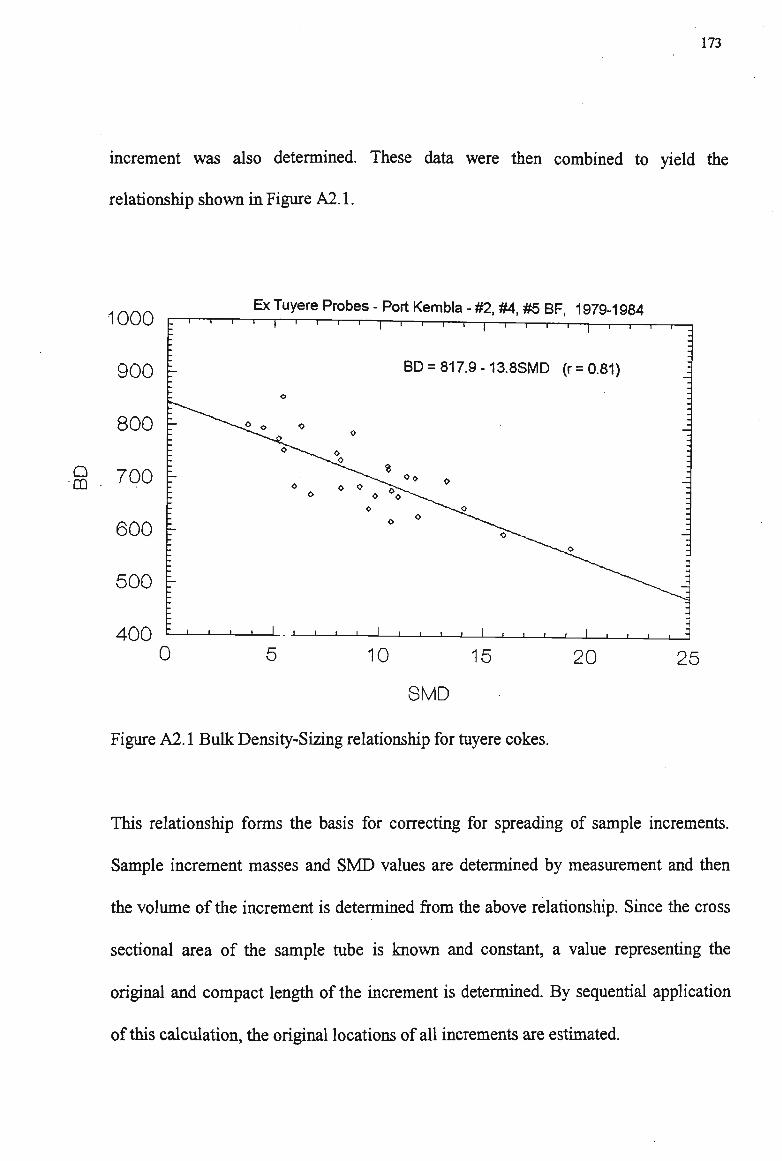
173
increment was also determined. These data were then combined to yield the
relationship shown in Figure A2.1.
A r\r\rs & Tuyere Probes - p°rt Kembla - #2, #4, #5 BF, 1979-1984 lUUU F—" 1 1 1 1 1 1 1 r
Q •m
400
' i i i I i i 1 1 1 1 1 1 r
BD = 817.9-13.8SMD (r=0.81)
- i — i i i i i i _
0 — I 1 1 1 I I I l l l l l l l .
10 15 20
SMD
25
Figure A2.1 Bulk Density-Sizing relationship for tuyere cokes.
This relationship forms the basis for correcting for spreading of sample increments.
Sample increment masses and SMD values are determined by measurement and then
the volume of the increment is determined from the above relationship. Since the cross
sectional area of the sample tube is known and constant, a value representing the
original and compact length of the increment is determined. By sequential application
of this calculation, the original locations of all increments are estimated.

174
W h e n this method was applied to the range of tuyere probe samples examined in the
1979-1984 period, sufficient consistency was observed between corrected results and
with those not requiring any correction to provide confidence in the technique.
This method was originally developed and applied by the same contractor who
performed the sample characterisations in this work.

175
Appendix 3
Characterisation of tuyere coke fines
(Copy of contractor's report)
Prominco Pty Ltd - March 1998 - PMC/416/98
Result Summary:-
Characterisation of Tuyere Coke Fines
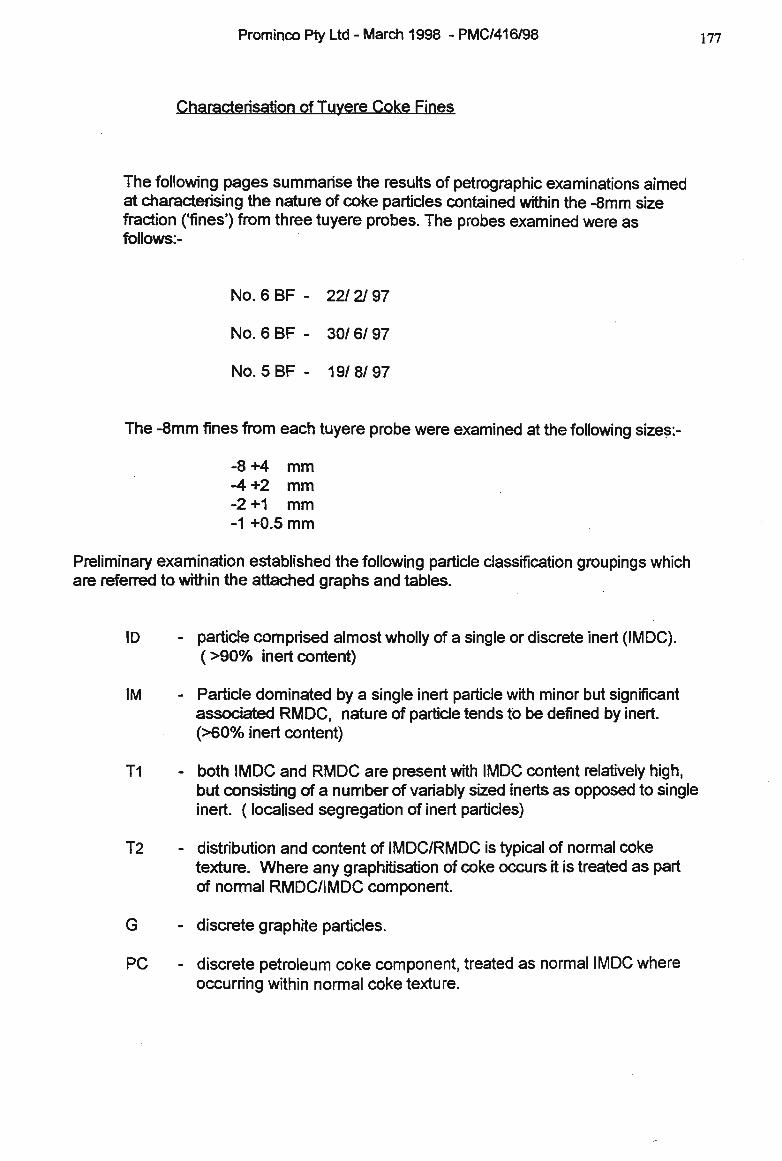
Prominco Pty Ltd - March 1998 - PMC/416/98
Characterisation of Tuyere Coke Fines
The following pages summarise the results of petrographic examinations aimed at characterising the nature of coke particles contained within the -8mm size fraction (fines') from three tuyere probes. The probes examined were as follows:-
N 0 . 6 B F - 22/2/97
No. 6 BF - 30/ 6/ 97
No. 5BF - 19/8/97
The -8mm fines from each tuyere probe were examined at the following sizes:-
-8 +4 mm -4+2 mm -2 +1 mm -1 +0.5 mm
Preliminary examination established the following particle classification groupings which are referred to within the attached graphs and tables.
ID - particle comprised almost wholly of a single or discrete inert (IMDC). ( > 9 0 % inert content)
IM - Particle dominated by a single inert particle with minor but significant associated R M D C , nature of particle tends to be defined by inert. (>60% inert content)
T1 - both IMDC and RMDC are present with IMDC content relatively high, but consisting of a number of variably sized inerts as opposed to single inert. (localised segregation of inert particles)
T2 - distribution and content of IMDC/RMDC is typical of normal coke texture. Where any graphitisation of coke occurs it is treated as part of normal RMDC/IMDC component.
G - discrete graphite particles.
PC - discrete petroleum coke component, treated as normal IMDC where occurring within normal coke texture.

Tuyere Probe - N0.6BF- 22/2/97
70 11 1 [i 1 t 1 1 1 1 1 1 1 1 1 1 1 1 1 1 1 1
60
50
40
30
20
10
I
:
—
•8+4
•4+2
-2+1
-1+.S
2 O
2
6,4
3.8
2.7
t.t
I
6
6.7
0.5
0.4
O.S
r
tt t7
wt %
14.1 14.5
1.8 13.0
0.7 S.9
0.4 4.1
6 0 , ..
1 rJ
11 O
17 0
0 J I I I I I I 1 L . - 1 — I — I — I — I — I — I — I I L _ l I I 1 I I I 1 I 1 1 1 1 I I 1 1 1 -
00 05 1.0 1.5 20 2.5
Tuyere Probe - No. 6 BF -30/6/97
70
60
50
40
30
20
10
0
: r 1 1 1 r
:
:
L .8+4
: -4+2
'- -2+1
I -1+.5
E-
l 4
141 Lo_ - 1 1 1 1 1
I v 1
4
0.4
0.3
0.6
0.6
1 1- T 1
•j—r-r r-r 1 -r
9 14
Wt%
2.7 7.0
0.7 2.8
0.3 1.1
0.3 0.6
9
O 1 '
I I I I I I I
t 1 1 | j
18
6.5
12.7
5.7
2.3
1 1 1 1 1
1 1 i i 1 1 1 < I 1 i 1
14
f |p , 1
_l 1..J 1 1 1 ! 1 1 1 1 1
1 1 I 1
18 6
• 1 1 1 1
1 1 1 1 1 1
p
1 1 1 1 1 1
•I I 1 " I 1 -
\
:
4 =
•z
:
-=
mimiilnii
00 0.5 1.0 1.5 2.0 2.5
Tuyere Probe- No.5BF- 19/8/97
70
60
50
40
30
20
10
0
rr
=-:
r
:
\
z
1 T T II
•8+4
•4+2
*H
1 1
2
4.6
1.2
t>£
-t+^ 0 ^
- 1 1 I I • 1 • < • 1
I I I I I I I I
6 8 10
Wl%
8.8 6.3 12.S
(.9 22. 9.1
0.7 \Z AS
0-2 t.1 ZZ
6
_o
— 1 . . . 1 . 1 . 1 t 1 1 1
1 1 1 1 1 1 1 i i
13
. 1 1 . 1
4.5
11.5
10.0
4-2 10 r
1
R . _
0
1 I 1 1 1 1
u
I 1 1 1 . 1 1 1
1 1 1 1 1 1 1 1 1 1
. 13
1 0
1 1 1 1 1 1 1 1 1 1
1111
11I1
1111
1111
• =
:
— ;
:
:
I I I I I I I "
0.0 0.5 1.0 1.5 20
Est. Distance from Tuyere (m)
25
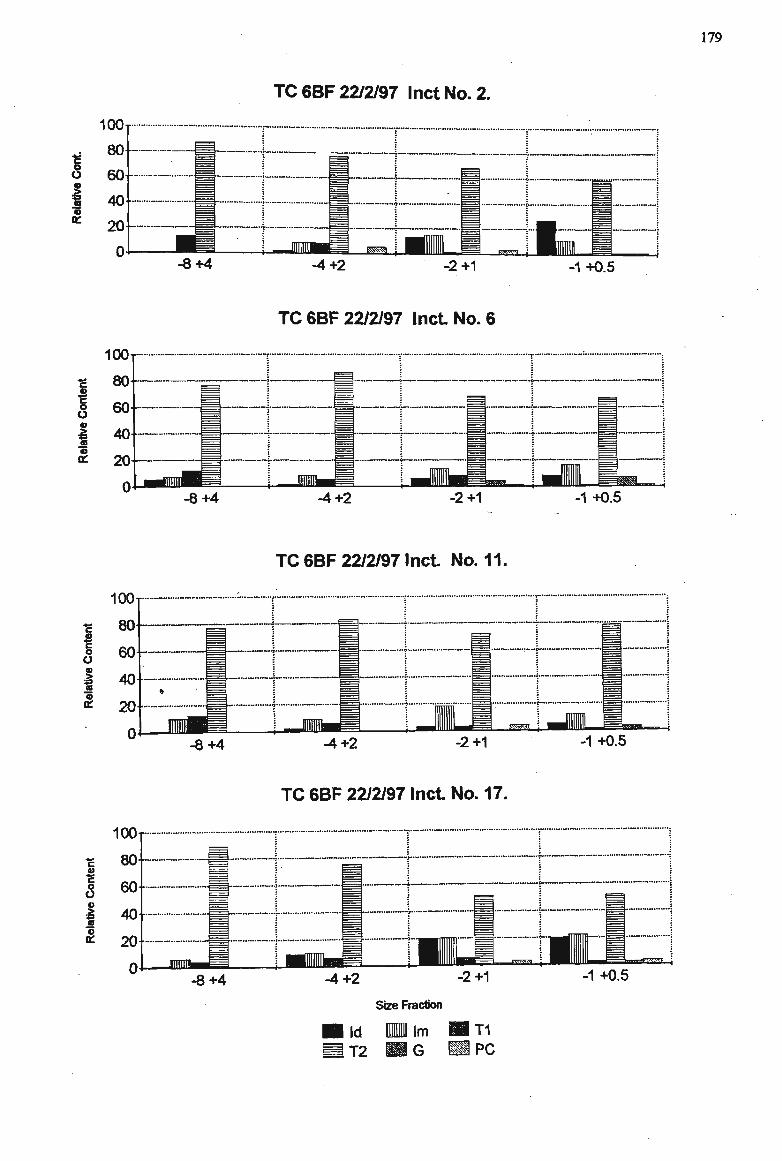
TC6BF 22/2/97 lnctNo.2.
I o
K
-8+4 -4+2 -2+1 -1+0.5
TC6BF 2272/97 I net No. 6
c 4>
U
i « or
-8+4 -4+2 2+1 -1+0.5
TC 6BF 22/2/97 Inct. No. 11.
£ c o O 1 or
•
100i
80
60
40
20
0 -8+4 -4+2 -2+1 1 +0.5
TC 6BF 2272/97 Inct No. 17.
c 4) O
O o e or
-8+4 -4+2
Id T2
Size Fraction
lm G
2+1
T1 PC
-1+0.5

0 0 13 87 0 0
2 8 8 77 0 5
13 15 1 68 0 3
27 11 1 59 1 1
5 7 12 76 0 0
1 8 5 86 0 0
6 13 8 68 4 1
8 16 1 67 7 1
TC 6BF 22/2/97 Inct No. 2 (Vol. %)
• -8+4 -4+2 -2+1 -1 +0.5 Id Im T1 T2 G PC
TC 6BF 22/2/97 Inct No. 6 (Vol. %)
-8+4 -4+2 -2 +1 -1 +0.5 Id Im T1 T2 G PC
TC 6BF 22/2/97 Inct No. 11 (Vol. %)
-8+4 -4+2 -2+1 -1+0.5 Id Im T1 T2 G PC
TC 6BF 22/2797 Inct No. 17 (Vol. %)
-8+4 -4+2 -2 +1 -1 +0.5 Id Im T1 T2 G PC
1 10 12 77 0 0
2 9 6 83 0 0
3 18 3 72 0 4
5 12 1 78 3 1
1 6 4 89 0 0
9 10 6 75 0 0
20 20 5 51 1 3
20 22 2 51 2 3
m. A^ M 1<ty
Ti
Tv
^
^
lo
ITS
1
l*L
*\
1Z-
O
\ "*- 10

TC6BF 30/6/97 Inct No. 4
100T
1 o
o £ 0T
-8+4 -4+2 -2+1 -1+0.5
c S o O
or
100T
80
60
40
20
0 -8+4
TC 6BF 30/6/97 Inct No. 9A
-4+2 —nrnrr^p^j | ,
-2+1 -1+0.5
TC 6BF 30/6/97 Inct No. 14.
100
c I" c o
n o
s (B V
or
80
60
40
20
0 -8+4 -4+2 -2+1
:
==* 1—m»m SEES
i ] i
•B!LJl - •Gil I g>™-T»-i -1 +0.5
TC 6BF 30/6/97 Inct No. 18.
100T
r 4)
"S o O o i « 4> or
80
60
40
20
0 -8+4 -4 +2 -2 +1
Size Fraction
Im WWW G HPC
I ; _
I ..111 wm - |
' ^^ ; -1 +0.5
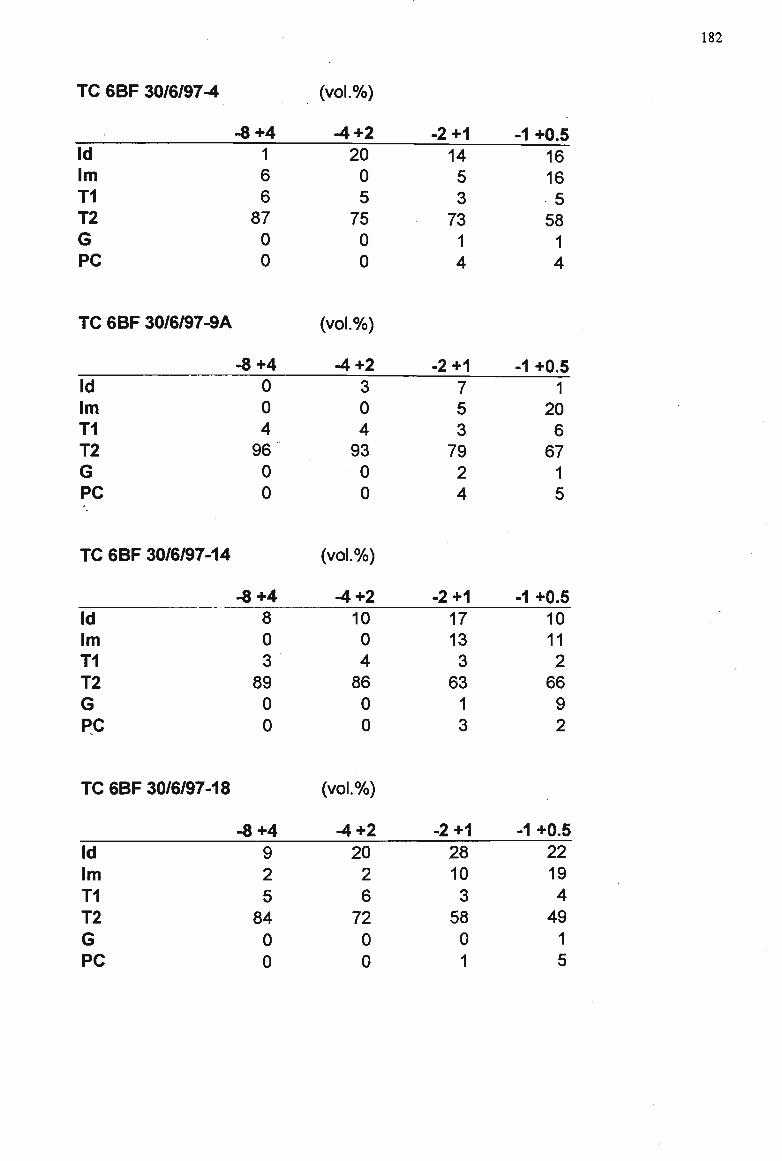
TC 6BF 30/6/97-4 (vol.%)
1 6 6 1 0 0
20 0 5 75 0 0
14 5 3 73 1 4
16 16 5 58 1 4
0 0 4 96 0 0
3 0 4 93 0 0
7 5 3 79 2 4
1 20 6 67 1 5
• -8+4 -4+2 -2 +1 -1 +0.5 Id Im T1 T2 G PC
TC 6BF 30/6/97-9A (vol.%)
-8+4 -4+2 -2 +1 -1 +0.5 Id Im T1 T2 G PC
TC 6BF 30/6/97-14 (vol.%)
-8+4 -4+2 -2+1 -1+0.5 Id Im T1 T2 G PC
TC 6BF 30/6/97-18 (vol.%)
-8+4 -4+2 -2+1 -1+0.5 Id Im T1 T2 G PC
8 0 3 89 0 0
10 0 4 86 0 0
17 13 3 63 1 3
10 11 2 66 9 2
9 2 5 84 0 0
20 2 6 72 0 0
28 10 3 58 0 1
22 19 4 49 1 5
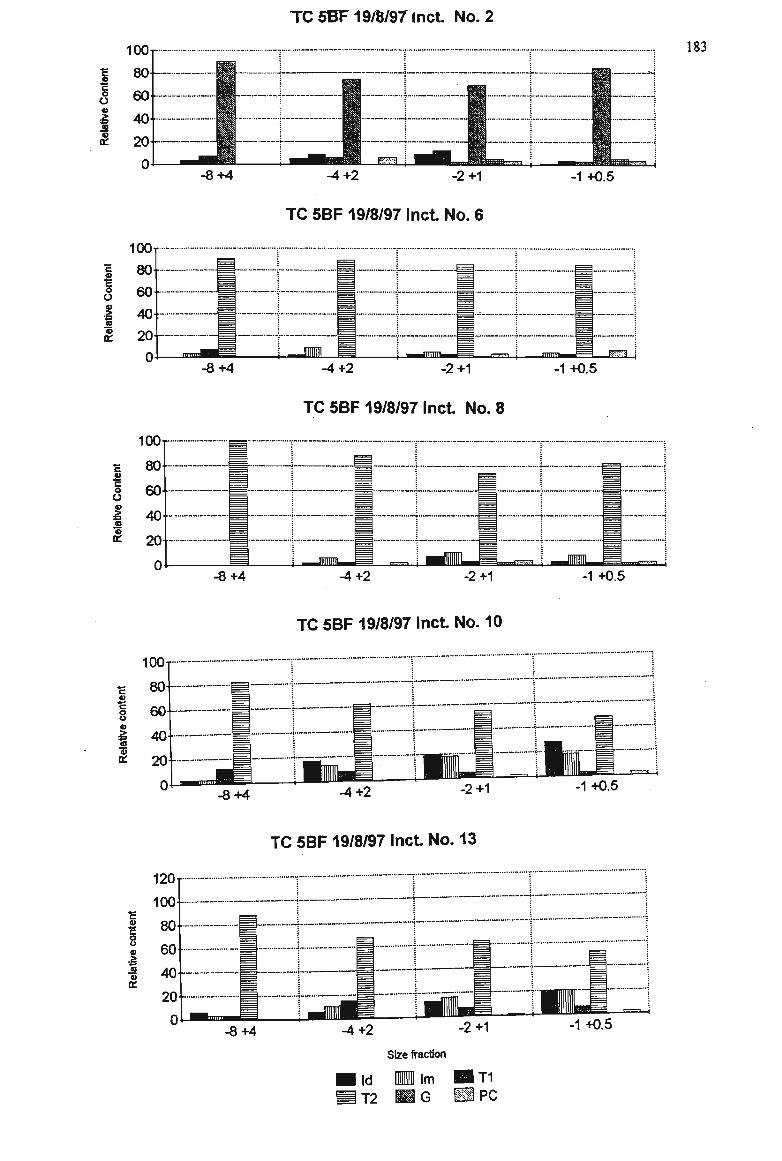
TC5BF19/8/97 Inct No.2
1 c a O 4J <0
or
-8+4 -4+2 -2+1 -1+0.5
TC 5BF 19/8/97 Inct No. 6
c
1 o O o •s Bj
o or
100i
80
60-40...
20--. .iiruN.'HiWl L.
-8+4 -1
-4+2 -2+1 Jr~1
-1+0.5
TC 5BF 19/8/97 Inct No. 8
1 o O o
s (B
-8+4 -2+1 -1 +0.5
TC 5BF 19/8/97 Inct No. 10
c
I o o <o
i IU
or -8+4 -4+2 2+1 -1+0.5
TC 5BF 19/8/97 Inct No. 13
c o u o -J or
-8+4 -4+2 -2+1
Size fraction
• id MJ2
Im BT1 G HI PC
-1+0.5

9 12 2 69 5 3
1 4 3 84 5 3
3 5 3 85 1 3
1 4 3 85 1 6
TC5BF19/8tt7lncNo.2 (vol.%)
-8+4 -4+2 -2 +1 -1 +0.5 Id 0 5 Im 3 9 T1 7 6 T2 90 74 G 0 0 PC 0 6
TC 5BF 19/8/97 Inc. No. 6 (vol.%)
-8 +4 -4 +2 -2+1 -1 +0.5 Id 0 2 Im 3 9 T1 7 0 T2 90 89 G 0 0 PC 0 0
TC 5BF 19/8/97 Inc. No.8 (vol.%)
_^_ -8+4 -4+2 -2+1 -1+0.5 Id 0 2 Im 0 6 T1 0 2 T2 100 88 G 0 0 PC 0 2
TC 5BF 19/8/97 Inc. No.10 (vol.%)
-8+4 -4+2 -2+1 -1+0.5 Id 3 Im 3 T1 12 T2 82 G 0 PC 0
TC 5BF 19/8/97 Inc. No.13 (vol.%)
-8+4 -4+2 -2+1 -1+0.5 Id 6 6 Im 3 11 T1 3 15 T2 88 68 G 0 0 PC 0 0
7 10 3 74 2 4
3 8 2 82 2 3
17 13 8 62 0 0
20 18 5 55 0 2
28 18 3 48 0 3
13 16 7 63 0 1
20 20 6 52 0 2

185
Typical Feed Coke Tuyere Coke
Figure 1 (a) Tuyer Probe, 22/2/97, 6BF - +16mm coke ex increment # 2 (RHS). (Scale: 1cm = 100um, x100, R/L)
Typical Feed Coke Tuyere Coke
Figure 1 (b) Tuyer Probe, 22/2/97, 6BF - +16mm coke ex increment # 6 (RHS). (Scale: 1cm = 100um, x100, R/L)

Figure 1 (c)
Typical Feed Coke Tuyere Coke
Tuyer Probe, 22/2/97, 6BF - +16mm coke ex increment # 11 (RHS). (Scale: 1cm = 100um, x100, R/L)
mm
Typical Feed Coke Tuyere Coke
Figure 1(d) Tuyer Probe, 22/2/97, 6BF - +16mm coke ex increment # 17 (RHS). (Scale: 1cm = 100um, x100, R/L)

Figure 2(a) Particle types - ID (discrete IMDC - white) at lower left with typical coke texture (T2) as remaining particles shown. (Scale: 1cm = 200um, x50, R/L)
.; K * ? W -i<t?-.; ;':rf
%M&& .-.•-
Figure 2(b) Particle types. |D At lower left and upper right (marginal between Id and IM). Remaining particles are Tz. (Scale: 1cm = 200um, x50, R/L)

Figure 3fa) Particle types - T2 (typical coke texture, RMDC/IMDC) on LHS, with a IM shown on RHS( IMDC-white, R M D C - brown) (Scale: 1cm = 200um, x50, R/L)
Figure 3(b) Particlejypes - |M particle shown on R H S with T2 particle on LHS. (Scale: 1cm = 200um, x50; R/L)

189
Figure 3(c) Particle types - two particles of the U type showing what appears as progressive 'attrition' of R M D C (brown) with the IMDC (white) dominating the particle form.(Scale: 1cm = 200um, x50, R/L)
Figure 4(a) Particle types - typical of the Ti particles showing high content of IMDC, at variable size (white) bound by reacted R M D C (brown). (Scale: 1cm = 200um, x50, R/L)

190
•Wi
HH^uJ^T^.sluH
In^^ • "r t-' "* i
B^!$LW-%-WBBm&a
"^*i&'yffi£C^iaSss>1*
^*^^r
-^SP^ iB3^ffi®',";,--::.-'"'>-'',^CT-:;-"'. :- T
;
,...::V '• •
• •:•:•.••:• •
4 • & ' *• ;. •--*r''*i:il
M S ^ J S ^
Us :<S>:
5&&21
•..' #i3W
Figure 4 (b) Further example of the Ti particle type.(Scale: 1cm = 200um, x50, R/L)
Figure 5 Particle (Ti type), showing characteristic nature of 'petroleum coke' inclusion on R H S (concentric structure form), with associated R M D C /IMDC. Remaining particles of T2 type. (Scale: 1cm = 200um, x50, R/L)

Figure 6 (a) Discrete graphite (G) on R H S with heavily graphitized T2 particle on LHS. (Scale: 1cm = 200um, x50, R/L)
Figure 6 (b) Detail of section of T2 particle from above showing predominant development of graphite (blue-'yeliowish mosaic) within R M D C region of coke texture. (Scale: 1cm = 50um, x200, Pol- R/L)

192
Appendix 4A
Estimation of the critical size of inerts generating raceway debris
193
Estimation of the critical size of inerts generating raceway debris
In Section 5.3.3, it was estimated that 14.5% of the +6.3mm inert maceral derived
material reaching the tuyeres is ejected from the raceway as debris. This value may be
used to estimate that critical size for such a particle below which it will be entirely
combusted and not contribute to the generation of debris.
To make such an estimation, it must be assumed that all inert derived particles react
similarly and that their combustion occurs in such a way that their radii are reduced at a
constant rate, independent of their size.
Figure A4.1 shows a Rosin-Rammler for the size distribution of Port Kembla battery
feed coal. When the proportion of +6.3mm material is 4.5%, the corresponding
percentages of+5mm and +4mm material are 7.0% and 10.1% respectively. If the
+6.3mm, 5 x 6.3mm and 4 x 5mm size fractions are assumed to be characterised by
spheres of 7.0, 5.65 and 4.5mm respectively, it can be shown by simple calculations of
simultaneous volume reduction, that a residue having a volume equal to 14.5% of the
original occurs when the 7.0mm diameter particle is reduced to 3.2mm diameter. The
5.65 and 4.5mm particles are simultaneously reduced to 1.85 and 0.7mm in diameter
respectively. Particles with initial diameter less than 3.2mm are fully combusted under
these assumptions.
For the normal battery coal feed size distribution and at a production rate of 7200t/d,
inert derived particles of 7.0mm in diameter reaching the raceways are calculated to
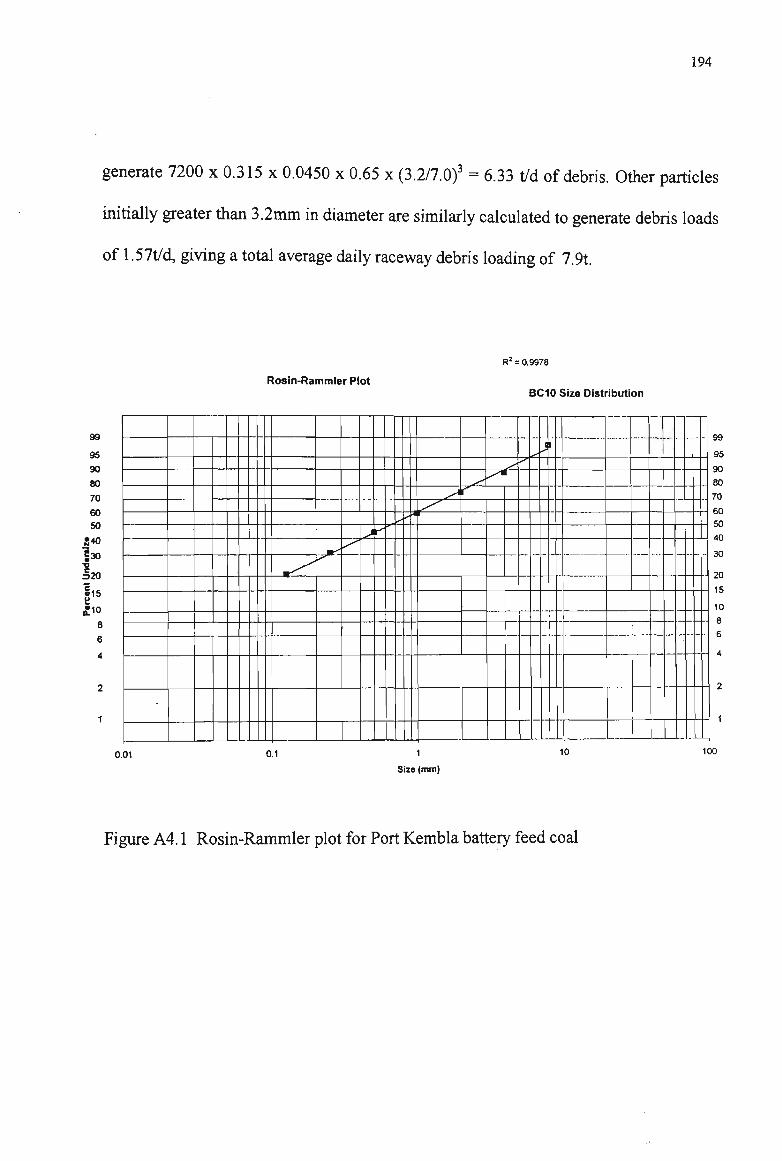
194
generate 7200 x 0.315 x 0.0450 x 0.65 x (3.2/7.0)3 = 6.33 t/d of debris. Other particles
initially greater than 3.2mm in diameter are similarly calculated to generate debris loads
of 1.57t/d, giving a total average daily raceway debris loading of 7.9t.
95
90
80
ro 60
so
g30 •o
I15 £10
8 6 4
Rosin-Rammler Plot
R2 = 0.9978
BC10 Size Distribution
n [ 99
95
90
80
70
60
50
40
30
20
15
10
8
6
4
0.01 0.1 1
Size (mm)
10 100
Figure A4.1 Rosin-Rammler plot for Port Kembla battery feed coal
195
Appendix 4B
Raceway debris generation as a function of tuyere velocity
196
Raceway debris generation as a function of tuyere velocity
The data from No6 Blast Furnace shown in Figure 64 can be used to quantify the
influence of increased tuyere velocity. This is so because the furnace's supply and
demand condition returned to its previous condition again soon after the period and
since the hot metal did not reach carbon saturation during the period. The average
increase in tuyere velocity was 12m/s and AC decreased by an average of 0.04%. Hence,
each additional 1 m/s in tuyere velocity increases the supply of raceway debris
sufficiently to decrease AC by 0.0033%. For an average daily production rate of 7200
tonnes, this represents an increase of 7200 x 0.0033/100 = 0.24 tonnes/day per lm/s of
tuyere velocity. Raceway debris load during the small blower period therefore increased
from approximately 7.9 tonnes/day to about 10.8 tonnes/day.
197
Appendix 5
Listfff publications arising out of this work
198
List of publications arising out of this work
R.J. Nightingale & F.W.B.U. Tanzil, 'A novel approach to the estimation of blast
furnace hearth voidage', Iron and Steelmaker, vol 24, Feb 1997, pp 11-13
RJ.Nightingale, F.W.B.U. Tanzil, AJ.G. Beck, J.D. Dunning & S.K. Vardy, 'Operation
guidance techniques for blast furnace casting and liquids management', Proceedings of
die 2nd International Congress on the Science and Technology of Ironmaking and 57th
Ironmaking Conference, Toronto, 1998, pp567-580.
(This paper was awarded the Josef S Kapitan Award for the best paper presented at
the conference)
RJ. Nightingale, R. J. Dippenaar & W-K. Lu, 'Developments in blast furnace process
control at Port Kembla based on process fundamentals', Proceedings of the Belton
Memorial Symposium, ISS, Sydney, 2000, pp 227-240.
(This paper is has also been accepted for publication in Metallurgical Transactions B
and will appear in Volume 3 IB, No5)
RJ. Nightingale, F.W.B.U. Tanzil, AJ.G. Beck & K.Price, 'Blast furnace hearth
condition monitoring and taphole management techniques', Proceedings of the 4th
European Coke & Irnomaking Congress, Paris, 2000, pp604-609.
K.R.S. Horrocks, J.F. Ellison, RB. Cunningham & RJ. Nightingale, 'Coke quality at
B H P Steel, Port Kembla', Proceedings of the 4th European Coke & Ironmaking
Congress, Paris, 2000, ppl67-173.