The determination of Mpumalanga's competitive economic ...
163
The determination of Mpumalanga’s competitive economic sectors for effective export promotion M. VISSER 20268645 Dissertation submitted in partial fulfilment of the requirements for the degree Magister Commercii (M.Com.) in International Trade at the School of Economics, Potchefstroom Campus of the North-West University Supervisor: Prof. Dr. E.P.J. Kleynhans Co-supervisor: Mr. R. Wait September 2012
-
Upload
khangminh22 -
Category
Documents
-
view
1 -
download
0
Transcript of The determination of Mpumalanga's competitive economic ...
The determination of Mpumalanga’s
competitive economic sectors for effective
export promotion
M. VISSER
20268645
Dissertation submitted in partial fulfilment of the requirements for the
degree Magister Commercii (M.Com.) in International Trade at the
School of Economics, Potchefstroom Campus of the
North-West University
Supervisor: Prof. Dr. E.P.J. Kleynhans
Co-supervisor: Mr. R. Wait
September 2012

ii
ACKNOWLEDGEMENTS
I hereby acknowledge the following persons for their assistance in the completion of
this study:
Firstly, I would like to thank my supervisors, Professor Ewert Kleynhans and Mr.
Requier Wait for all their hard work, ideas, guidance and support during the past
three years.
I would also like to extend a special thanks to Noleen Pisa (neé Sithole). Your
friendship, guidance and advice over the past four years have kept me going
throughout this study.
Thank you to Corna Nel for the language editing.
There are others that I wish to thank on a more personal note – such as my parents
for the opportunity to study. Even in difficult times, you never failed to support me in
my studies.
Thank you to my four siblings, Helouise, Amorie, Philip and Hentie and his wife Anria
for their ongoing support throughout the duration of this study, as well as in my
previous years of study.
To my close friends, Lorinda, Elrické, Corné and Hannari: I am truly blessed with
understanding, supportive and loving friends like you.
I also extend a special thanks to old and new colleagues and colleagues that became
friends. Thank you for providing a shoulder to lean (or cry on) when I needed it.
Lastly, I thank God for giving me the strength and endurance to complete my study
throughout difficult times.
Monique Visser
Potchefstroom
September 2012
iii
ABSTRACT
Research has shown that South African regions have been experiencing reasonable
export growth, as well as growth in the gross domestic product (GDP), population
and skills level. South Africa’s provinces have been experiencing difficulties
allocating resources for effective export enhancement and promotion. Through
effective targeting of specific sectors and industries within the South African
provinces, provincial government entities would be able to determine from which
sector or industry they could gain the most through effective targeting of certain
sectors. The overall focus of this study was on the Mpumalanga Province. By using
the Revealed Comparative Advantage Index (RCA), the potential priority export
products in each industry or sector in the Mpumalanga Province were determined.
The products identified were matched to the export opportunities identified by the
Decision Support Model (DSM) to determine if products are seen as viable export
opportunities for the province. The composition of the Mpumalanga Province’s
economic activities and an economic profile was also determined and discussed.
The three products with the highest potential export opportunities identified by the
RCA and successfully matched to the DSM, were manganese products, salted
bovine meat (beef) and tomatoes. These results concluded that products identified
by the RCA and matched to the DSM, are potential export opportunities for the
Mpumalanga Province and South Africa.
Key words: Trade, Export Promotion, Economic growth, Comparative Advantage,
Decision Support Model (DSM), Revealed Comparative Advantage (RCA), South
Africa, Mpumalanga Province
iv
OPSOMMING
Navorsing het getoon dat Suid-Afrika se provinsies 'n redelike groei in uitvoer, sowel
as groei in die bruto binnelandse produk (BBP), bevolking en vaardigheidsvlak ervaar
het. Suid-Afrika se provinsies het egter probleme ondervind met die toekenning van
hulpbronne vir die effektiewe verbetering en bevordering van uitvoer. Deur middel
van effektiewe identifisering van spesifieke sektore en bedrywe in die Suid-
Afrikaanse provinsies, sal provinsiale regeringsentiteite in staat wees om te bepaal
watter sektore of industrieë ‘n mededingende voordeel het. Die oorkoepelende fokus
van hierdie studie is gerig op die Mpumalanga Provinsie. Deur gebruik te maak van
die “Revealed Comparative Advantage Index (RCA)”, is die potensiële
prioriteitsprodukte in elke bedryf of sektor in die provinsie van Mpumalanga
geïdentifiseer. Die produkte wat geïdentifiseer is, is vergelyk met uitvoergeleenthede
wat deur die “Decision Support Model (DSM)” geïdentifiseer was, om te bepaal of
produkte gesien word as ware uitvoergeleenthede vir die provinsie. Die samestelling
van die provinsie van Mpumalanga se ekonomiese aktiwiteite en 'n ekonomiese
profiel is ook bepaal en bespreek. Die drie produkte wat die hoogste moontlike
uitvoergeleenthede bied, is mangaanprodukte, gesoute beesvleis en tamaties. Die
resultate het gevolglik getoon dat die produkte wat deur die RCA geïdentifiseer en
met die DSM vergelyk is, moontlike uitvoergeleenthede bied vir die Mpumalanga
Provinsie en vir Suid-Afrika.
Sleutelwoorde: Handel, Uitvoerbevordering, Mededingende voordeel, Ekonomiese
Groei, Decision Support Model (DSM), Revealed Comparative Advantage (RCA),
Suid-Afrika, Mpumalanga Provinsie
v
TABLE OF CONTENTS
ACKNOWLEDGEMENTS .......................................................................................... ii
ABSTRACT ............................................................................................................... iii
OPSOMMING ............................................................................................................ iv
TABLE OF CONTENTS ............................................................................................. v
LIST OF TABLES ...................................................................................................... x
LIST OF FIGURES ................................................................................................... xii
LIST OF ABBREVIATIONS .................................................................................... xiv
CHAPTER 1: INTRODUCTION .................................................................................. 1
1.1 INTRODUCTION ................................................................................................ 1
1.2 BACKGROUND ................................................................................................. 3
1.3 PROBLEM STATEMENT AND MOTIVATION ................................................... 6
1.4 RESEARCH QUESTION ................................................................................... 6
1.5 RESEARCH OBJECTIVES ................................................................................ 6
1.5.1 Primary objectives ...................................................................................................... 6
1.5.2 Secondary objectives ................................................................................................. 7
1.6 RESEARCH METHOD ....................................................................................... 7
1.7 DIVISION OF CHAPTERS ................................................................................. 8
CHAPTER 2: THE THEORETICAL OVERVIEW OF THE DETERMINANTS OF
ECONOMIC GROWTH............................................................................................... 9
2.1 INTRODUCTION ................................................................................................ 9
2.2 THEORY OF THE DETERMINANTS OF ECONOMIC GROWTH ..................... 9
2.2.1 The aggregate demand and supply model and equilibrium in the economy ............... 9
2.2.1.1 Aggregate demand (AD) ...................................................................................................... 10
2.2.1.2 Aggregate supply (AS) ........................................................................................................ 10
2.2.1.3 Equilibrium between the AS and AD curve ......................................................................... 11
2.2.2 Neo-Classical Model of Solow ...................................................................................12
2.2.2.1 The Basic Growth Model ..................................................................................................... 12
2.2.2.2 The Solow Growth model .................................................................................................... 13
2.2.2.2.1 The production function ................................................................................................ 14
vi
2.2.2.2.2 Saving and investment in the Solow Growth model ...................................................... 15
2.2.2.2.3 Population growth and depreciation ............................................................................. 17
2.2.2.2.4 Balanced growth investment ......................................................................................... 17
2.2.2.2.5 Equilibrium in the Solow Growth model ........................................................................ 18
2.2.3 Endogenous growth theory .......................................................................................19
2.3 THE DETERMINANTS OF ECONOMIC GROWTH AND ECONOMIC
PERFORMANCE ............................................................................................. 22
2.3.1 Investment ................................................................................................................22
2.3.2 Human capital ...........................................................................................................23
2.3.3 Innovation and Research and Development activities ...............................................23
2.3.4 Macro-economic policies ...........................................................................................24
2.3.5 Openness to trade ....................................................................................................24
2.3.6 Foreign direct investment (FDI) .................................................................................25
2.3.7 Political issues ..........................................................................................................26
2.4 EXPORT PROMOTION ................................................................................... 26
2.4.1 Public and private institutions in export promotion .....................................................27
2.4.2 The efficiency of export promotion programs ............................................................27
2.4.3 The allocation problem ..............................................................................................28
2.5 THE DECISION SUPPORT MODEL (DSM) FOR THE ALLOCATION OF
REALISTIC EXPORT OPPORTUNITIES ......................................................... 29
2.5.1 The importance of the DSM ......................................................................................29
2.5.2 Caution against the DSM ..........................................................................................30
2.5.3 The Process of the DSM ...........................................................................................30
2.6 SUMMARY AND CONCLUSION ..................................................................... 31
CHAPTER 3: AN OVERVIEW OF THE ECONOMIC ACTIVITY IN THE
MPUMALANGA PROVINCE .................................................................................... 33
3.1 INTRODUCTION .............................................................................................. 33
3.2 GEOGRAPHIC BACKGROUND OF THE MPUMALANGA PROVINCE .......... 33
3.3 SOCIO-ECONOMIC PROFILE OF THE MPUMALANGA PROVINCE ............ 35
3.3.1 Demographics ...........................................................................................................35
3.3.1.1 Population ............................................................................................................................ 35
3.3.2 Labour profile ............................................................................................................36
3.3.2.1 Employment ......................................................................................................................... 37
3.3.2.2 Unemployment .................................................................................................................... 38
vii
3.3.3 Education ..................................................................................................................39
3.3.4 Development aspects................................................................................................40
3.3.4.1 Human Development Index (HDI) ....................................................................................... 40
3.3.4.2 Gini-coefficient ..................................................................................................................... 42
3.3.4.3 Poverty................................................................................................................................. 43
3.4 ECONOMIC ACTIVITY AND SECTOR PERFORMANCE OF THE
MPUMALANGA PROVINCE ............................................................................ 44
3.4.1 Economic performance of the Mpumalanga Province ...............................................44
3.4.1.1 Gross Domestic Product (GDP) growth .............................................................................. 44
3.4.1.2 Gross Value Added (GVA) growth by Mpumalanga ............................................................ 45
3.4.1.3 Sectoral contribution and performance ............................................................................... 46
3.4.1.4 Trade within the Mpumalanga Province .............................................................................. 47
3.5 ECONOMIC SECTORS OF THE MPUMALANGA PROVINCE ....................... 50
3.5.1 Economic sectors ......................................................................................................51
3.5.1.1 Agriculture............................................................................................................................ 51
3.5.1.2 Mining .................................................................................................................................. 52
3.5.1.3 Manufacturing ...................................................................................................................... 54
3.5.1.4 Utilities (Electricity, gas and water) ..................................................................................... 56
3.5.1.5 Construction ........................................................................................................................ 57
3.5.1.6 Transport ............................................................................................................................. 58
3.5.1.7 Financial Sector ................................................................................................................... 59
3.5.2 Infrastructure in Mpumalanga ....................................................................................61
3.5.2.1 Maputo Development Corridor ............................................................................................ 61
3.5.2.2 Kruger Mpumalanga International Airport ........................................................................... 62
3.6 SUMMARY AND CONCLUSION ..................................................................... 63
CHAPTER 4: THE THEORETICAL FRAMEWORK OF THE REVEALED
COMPARATIVE ADVANTAGE INDEX ................................................................... 65
4.1 INTRODUCTION .............................................................................................. 65
4.2 DESCRIPTIVE EXPLANATION OF THE RCA INDEX ..................................... 67
4.2.1 Trade theory .............................................................................................................68
4.2.2 The RCA equation ....................................................................................................69
4.2.3 Measurement of the RCA ..........................................................................................70
4.3 DATA DESCRIPTION ...................................................................................... 70
4.3.1 Post office code description ......................................................................................71
4.3.2 The harmonised system codes – tariff headings .......................................................71
viii
4.3.2.1 Section and Chapter Headings ........................................................................................... 71
4.3.2.2 Headings and Subheadings ................................................................................................ 74
4.3.3 District office codes ...................................................................................................74
4.3.4 The Final Compilation of the Data .............................................................................76
4.3.5 Decision Support Model (DSM) .................................................................................76
4.4 SUMMARY AND CONCLUSION ..................................................................... 78
CHAPTER 5: RESULTS OF THE REVEALED COMPARATIVE ADVANTAGE
(RCA) FOR THE MPUMALANGA PROVINCE ........................................................ 80
5.1 INTRODUCTION .............................................................................................. 80
5.2 THE MOST COMPETITIVE PRODUCTS AND THE LEAST COMPETITIVE
PRODUCTS OF THE MPUMALANGA PROVINCE ......................................... 81
5.3 ANALYSIS OF THE RCA IN THE MPUMALANGA PROVINCE ACCORDING
TO SECTORS .................................................................................................. 85
5.3.1 Animals and animal products ....................................................................................85
5.3.2 Vegetable products ...................................................................................................86
5.3.3 Foodstuff ...................................................................................................................87
5.3.4 Mineral products .......................................................................................................89
5.3.5 Chemicals and allied industries .................................................................................90
5.3.6 Plastic and Rubber ....................................................................................................91
5.3.7 Raw hides, skins, leather, furs and hunting industries ...............................................93
5.3.8 Wood and wood products .........................................................................................94
5.3.9 Textiles .....................................................................................................................95
5.3.10 Footwear and Headgear ...........................................................................................96
5.3.11 Stone and glass ........................................................................................................98
5.3.12 Metals .......................................................................................................................99
5.3.13 Electrical machinery ................................................................................................ 100
5.3.14 Transportation ......................................................................................................... 101
5.3.15 Miscellaneous ......................................................................................................... 103
5.4 TOP COMPETITORS IN THE MPUMALANGA PROVINCE .......................... 104
5.5 MATCHING INDUSTRIES WITH THE DSM .................................................. 108
5.6 SUMMARY AND CONCLUSION ................................................................... 113
ix
CHAPTER 6: SUMMARY, CONCLUSION AND RECOMMENDATIONS ............. 117
6.1 INTRODUCTION ............................................................................................ 117
6.2 SUMMARY AND CONCLUSION ................................................................... 117
6.3 RECOMMENDATIONS .................................................................................. 120
LIST OF REFERENCES ........................................................................................ 123
ANNEXURE ........................................................................................................... 133
x
LIST OF TABLES
Table 3.1: Population figures in Mpumalanga, 1996, 2000, 2005 & 2010 ................ 35
Table 3.2: Human Development Index (HDI) figures for Mpumalanga and race
groups, 1996-2010 ................................................................................................... 41
Table 3.3: Trade balance figures for Mpumalanga, 1996-2009 (R1000 values) ....... 48
Table 4.1: Post Office Outline ................................................................................... 72
Table 4.2: HS Code outline ....................................................................................... 73
Table 4.3: Heading and Sub-heading outline............................................................ 74
Table 4.4: District office codes in South Africa ......................................................... 75
Table 4.5: District office codes of the Mpumalanga Province ................................... 75
Table 4.6: Compiled data.......................................................................................... 76
Table 5.1: Harmonised standard code chapter division ............................................ 81
Table 5.2: The Mpumalanga Province’s ten largest competitive products ................ 82
Table 5.3: The Mpumalanga Province’s ten least competitive products ................... 84
Table 5.4: The Mpumalanga Province’s ten largest competitive products in animals
and the animal product chapter ................................................................................ 86
Table 5.5: The Mpumalanga Province’s ten largest competitive products in the
vegetable product chapter ........................................................................................ 87
Table 5.6: The Mpumalanga Province’s ten largest competitive products in the
foodstuff chapter ....................................................................................................... 88
Table 5.7: The Mpumalanga Province’s ten largest competitive products in the
mineral product chapter ............................................................................................ 89
Table 5.8: The Mpumalanga Province’s ten largest competitive products in the
chemical and allied industry chapter ......................................................................... 91
Table 5.9: The Mpumalanga Province’s ten largest competitive products in the plastic
and rubber chapter ................................................................................................... 92
xi
Table 5.10: The Mpumalanga Province’s ten largest competitive products in the Raw
Hide, Skin, Leather, Furs and Hunting industry chapter ........................................... 93
Table 5.11: The Mpumalanga Province’s ten largest competitive products in the wood
and wood product chapter ........................................................................................ 94
Table 5.12: The Mpumalanga Province’s ten largest competitive products in the
textile industry chapter .............................................................................................. 96
Table 5.13: The Mpumalanga Province’s ten largest competitive products in the
footwear and headgear chapter ................................................................................ 97
Table 5.14: The Mpumalanga Province’s ten largest competitive products in the
stone and glass chapter ........................................................................................... 98
Table 5.15: The Mpumalanga Province’s ten largest competitive products in the
metals chapter ........................................................................................................ 100
Table 5.16: The Mpumalanga Province’s ten largest competitive products in the
electrical machinery chapter ................................................................................... 101
Table 5.17: The Mpumalanga Province’s ten largest competitive products in the
transportation sector ............................................................................................... 102
Table 5.18: The Mpumalanga Province’s 10 highest competitive products in the
miscellaneous sector .............................................................................................. 103
Table 5.19: The Mpumalanga Province’s highest exportable products .................. 105
xii
LIST OF FIGURES
Figure 2.1: Aggregate demand ................................................................................. 10
Figure 2.2: Aggregate supply .................................................................................... 11
Figure 2.3: Equilibrium .............................................................................................. 11
Figure 2.4: Production function per person ............................................................... 15
Figure 2.5: Saving and investment per worker ......................................................... 16
Figure 2.6: Balanced growth investment line ............................................................ 18
Figure 2.7: Steady-state equilibrium ......................................................................... 18
Figure 2.8: Endogenous growth ................................................................................ 20
Figure 3.1: Map of Mpumalanga ............................................................................... 34
Figure 3.2: Population growth by race group in Mpumalanga, 1997-2010 ............... 36
Figure 3.3: Economically Active Population (EAP) in Mpumalanga, 1996-2010 ....... 37
Figure 3.4: Unemployment rate in Mpumalanga, 1996-2010 .................................... 38
Figure 3.5: Highest level of education (age 15+) in Mpumalanga, 1996, 2000, 2005 &
2010 ......................................................................................................................... 39
Figure 3.6: Gini-Coefficient for Mpumalanga, 1996, 2000, 2005 & 2010 .................. 42
Figure 3.7: People living in poverty in Mpumalanga, 1996, 2000, 2005 & 2010 ....... 43
Figure 3.8: GDP growth in Mpumalanga, 1997-2010 ............................................... 45
Figure 3.9: GVA growth in Mpumalanga, 1997-2010 ................................................ 46
Figure 3.10: Mpumalanga’s contribution to South Africa’s GVA (constant prices) by
sector, 2000 & 2008 ................................................................................................. 47
Figure 3.11: Exports and Imports of Mpumalanga, 1996, 2000, 2005 & 2009 .......... 48
Figure 3.12: Trade balance of Mpumalanga, 1996-2008 .......................................... 49
xiii
Figure 3.13: International trade in Mpumalanga, 1996-2009 .................................... 50
Figure 3.14: Average annual growth (%) of agriculture in Mpumalanga, 1997-2010 52
Figure 3.15: Average annual growth (%) of mining in Mpumalanga, 1997-2010 ...... 54
Figure 3.16: Average annual growth (%) of manufacturing in Mpumalanga, 1997-
2010 ......................................................................................................................... 56
Figure 3.17: Average annual growth (%) of electricity in Mpumalanga, 1997-2010 .. 57
Figure 3.18: Average annual growth (%) of construction in Mpumalanga, 1997-2010
................................................................................................................................. 58
Figure 3.19: Average annual growth (%) of transport in Mpumalanga, 1997-2010 ... 59
Figure 3.20: Average annual growth (%) of the financial sector in Mpumalanga, 1997-
2010 ......................................................................................................................... 60
xiv
LIST OF ABBREVIATIONS
AS – Aggregate Supply
AD – Aggregate Demand
DTI – Department of Trade and Industry
DSM – Decision Support Model
EAP – Economically Active Population
Eskom – Electricity Supply Commission
ETSG – European Trade Study Group
EU – European Union
FDI – Foreign Direct Investment
GVA – Gross Value Addition
GDP – Gross Domestic Product
HDI – Human Development Index
HS – Harmonised Standard
ITC – International Trade Centre
KMIA – Kruger Mpumalanga International Airport
MDC – Maputo Development Corridor
mm – millimetre
OECD – Organisation for Economic Co-Operation and Development
Ph.D. – Philosophiae Doctor
RCA – Revealed Comparative Advantage
ReX Regional Explorer
R&D – Research and Development
REOs – Realistic Export Opportunities
SARS – South African Revenue Services
xv
US – United States
USA – United States of America
UK – United Kingdom
WCO – World Customs Organization
WTO – World Trade Organisation
1
CHAPTER 1: INTRODUCTION
1.1 INTRODUCTION
International trade has a vital impact on a country’s economic growth rate, income
distribution, the use of natural resources and a country’s political relationship with
foreign countries (Lindhauer, Perkins & Radelet, 2006:651). International trade
benefits a country in the following ways: it provides firms’ access to new markets,
creates new opportunities for employment and gives a consumer a better variety of
choices when it comes to products (Lindhauer, et al., 2006:651).
Adam Smith and David Ricardo’s theories stated that in an open and closed
economy, specialisation and exchange deliver benefits (Greenaway & Kneller,
2004:100). With the introduction of the absolute and comparative1 advantage
theories, Smith (1776:481-485) and Ricardo (1817:96-97) theoretically justified the
importance of exports. An important difference is that in an open economy some
fraction of the net benefits is absorbed in trade costs (Greenaway & Kneller,
2004:100). By specialising in accordance with comparative advantage the
specialisation and exchange gains are identified (Greenaway & Kneller, 2004:100)
and global economic integration is indeed advantageous for economic performance
(Graff & Plümper, 2001:661).
Exports are vital to a country and exports and economic growth are positively
correlated. This argument has a viewpoint from two sides. New endogenous growth
theory found a constructive connection between economic growth, international trade
and development in the long-run (Romer, 1986:4; Lucas, 1988:1034). Salvatore
(2004:360) argued that by reducing trade barriers, the rate of economic growth and
development can be influenced by adopting technology from high industrialised
countries. Benefits from research and development, as well as from economies of
scale, can also influence the rate of economic growth and development (Salvatore,
1 Although a theoretical distinction can be made between the terms “comparative” and “competitive”,
these terms will be treated as synonymous in this dissertation.
2
2004:360). Other influences include: the reduction of price distortions, the efficient
allocation of domestic resources, greater specialisation and the rapid introduction of
new products to the market (Salvatore, 2004:360).
Pearson (2007:23) further asserts that overall growth improves competitive
advantage and in turn promotes exports. Yamanda’s (1998:111-112) viewpoint on
the issue of exports increasing economic growth is that there is causality because
economic growth could also be responsible for increased exports. Another viewpoint
from Khalafalla and Webb (2001:1704) is that structural changes that influence
exports and imports result in economic growth. Therefore, Pearson (2007:24) states
that exports are seen as a determinant of economic growth. A country could benefit
from increased exports if exports are stimulated and this in turn could lead to an
increase in economic growth (Pearson, 2007:24).
Exposure to foreign markets caused by positive externalities has had a positive
impact on the relationship between exports and economic growth. In three ways
exports are viewed as an engine of growth (Awokuse, 2008:162). Firstly, output
growth can be channelled directly through export expansion as a part of total output.
An increase in international demand for domestic products could cause a total growth
in output, through and consequent increases in income and employment in the export
sector. Secondly, due to exposure to competition in the international market, export
growth could have an indirect impact on growth through efficient resource allocation,
greater capacity utilisation, exploitation of economies of scale and upgrading
technology (Helpman & Krugman, 1985:31-40). Finally, expanding exports that
provide foreign exchange can finance increasing levels of imports of intermediate
goods (Awokuse, 2008:162).
The expansion of exports, exposure to international competition and increasing
foreign exchange can effectively enhance a country’s exports as well as serve as
important factors when countries need to expand their exports. Through effectively
enhancing and applying the latter, countries will be able to determine what products
need to be effectively promoted through international competition to increase the
country’s foreign exchange, thus increasing exports of the country.
3
1.2 BACKGROUND
Over the past thirty years South Africa has been experiencing sluggish export
performance and a reason given for this is that South Africa is seen as a natural
resource exporter. Therefore, it could be that the structure of production might affect
export diversification and economic growth (Hausmann & Klinger, 2008:609).
Moving to structural transformation, introducing new exports products can be
complicated for various reasons. Market failures can be created by various factors,
including industry externalities (Jaffe, 1986:996-998). Contrary to this view,
information externalities are caused by the process of predicting which products
more effectively express a country’s constantly changing comparative advantage
(Hausmann & Rodrik, 2003:614-615).
An investigation of the determinants of the development of a country’s exports level
of sophistication by Hidalgo, Klinger, Barabási and Hausmann (2007:482), showed
that barriers are less binding when moving to spatially nearby products in a region.
According to Hidalgo et al. (2007:482–487) the idea is based on the fact that every
spatially nearby product involves highly specific inputs. These inputs include:
knowledge, physical assets, intermediate inputs, labour training requirements and
infrastructure needs. By focusing on these inputs, South Africa could enhance its
export performance by increasing competitive advantage amongst exporters to gain
maximum access to the international market, increase the total of exporters and
increase the value and volume of exports (DTI, 2005:85).
A region’s infrastructure (ports, roads) and skills (human capital) are also important
determinants for export growth (Edwards & Alves, 2006:496). Krugell and Matthee
(2009:474) state that the location of a region is also an important factor for export
growth. According to Matthee and Naudé (2008:17) South African regions that have
been experiencing rapid export growth, were those regions with a high gross
domestic product (GDP), fast population growth, high level of skills, great export
diversification and shorter distances to ports.
South Africa, being a developing country as well an open economy, has been
experiencing difficulties to allocate the necessary resources to enhance trade.
4
Therefore, the need for a decision support model (DSM) exists. A decision support
model (DSM) was developed in Belgium and was adapted to South African data and
circumstances (Cuyvers, De Pelsmacker, Rayp & Roozen, 1995:173). The DSM is
used for the planning and assessment of export promotion activities and a sequential
filtering process to identify products and markets with the most realistic opportunities
for an economy (Cuyvers et al., 1995:173-174). From an export promotional point of
view, the DSM assists the Department of Trade and Industry (DTI) with a powerful
tool to identify realistic export opportunities for South Africa (Pearson, 2007:37-38).
The DSM helps to prioritise export assistance for potentially successful exporters for
South Africa (Pearson, 2007:37-38).
Even though a country could benefit from applying the DSM, Cuyvers et al.
(1995:174) states that a country must not base all their export promotion decisions
on the DSM, because the DSM relies on historical data and provides a short-term
scope; therefore, other relevant and important export opportunities might go to waste.
The DSM will show these opportunities as sub-optimal, whereas on the long-term,
these export opportunities might deliver promising results (Cuyvers et al., 1995:174).
The need exists to target specific sectors within South African provinces. By
targeting specific sectors, provincial government entities would know from which
sector they could gain the most (Graff & Plümper, 2001:678). Another point of
interest is the Gross Domestic Product (GDP) benefits that could be gained from
sectoral targeting. Kohli (2003:102) highlighted that a growth in GDP might lead to
an increase in employment, technological progress and production effort. On the
other hand the cost of implementing strategic trade policies must also be taken into
consideration. Additionally, the implications of implementing strategic trade policies
must be evaluated by governments beforehand (Graff & Plümper, 2001:678).
To effectively implement such strategic trade policies, government must have control
over the following four factors. Firstly, a government needs to be in possession of
reliable policy tools, thus having some control over international competitive
advantage within a specific sector. Secondly, comparative advantage must have a
vital impact on macro-economic performance. Thirdly, a government must have a
future outlook on which industries will impact economic performance. Finally, a
5
country must benefit form strategic trade regardless of the measures taken by other
countries to counter competition.
The gains from exchange and maximising welfare and free trade, which will result in
world economic prosperity, form the basis of Classical theory (Bender, 2002:1).
Different trade theories exist for comparative advantage, which includes the
Ricardian theory, Heckser-Ohlin-Samuelson theory and the Neo-Factor-Proportion,
for example. Costs and technological differences of comparative disadvantages are
explained by the Ricardian Theory, factor price differences by the Hecksher-Ohlin-
Samuelson theory and the factor efficiency is linked to the Neo-Factor-Proportion
theory (Bender, 2002:1).
For the purpose of this study, the Revealed Comparative Advantage theory is the
most suited index. According to Russu (2011:52) RCA represents the export
weight of a certain sector in the export amount of ensemble, including the
respective sector relative to the export weight of the same sector in the world export
value. Revealed Comparative Advantage (RCA) is an important measure in
comparative advantage and relates to this study due to the fact of this index is able
to identify products or sectors with comparative advantage.
The overall focus of this study will be on the Mpumalanga Province. Over the past
fifteen years, the Mpumalanga Province has made its mark as a province rich in
natural endowments, well-established infrastructure and moderate economic
performance (Mpumalanga Department of Economic Development and Planning,
2009). Mpumalanga’s economic growth performance from 1996 to 2010 was 2.7%,
only 0.5% lower than the national total of 3.2%. Mpumalanga’s Human Development
Index (HDI) have been experiencing favourable growth, signifying an improvement in
the standard of living. The Gini coefficient level of disparity in 2010 was 0.64 and
Mpumalanga’s total trade as a percentage of GDP in 2009 was 7.3%. The above
statistics gives scope for added development; therefore, it is important to determine
this region’s export capacity and to determine in which sectors these exports come
from.
6
1.3 PROBLEM STATEMENT AND MOTIVATION
Mpumalanga’s contribution to South Africa’s economy over the past fifteen years was
small and ranked fifth overall of the nine provinces. Mpumalanga’s GDP contribution
to South Africa was 8.8% in 2008, which was higher than in 1996 (6.9%).
Mpumalanga’s exports as a percentage of GDP were 5.3% in 1996 and 7.1% in 2008
which indicated a growing trend (see Table 3.8). From these figures it can be
derived that Mpumalanga’s contribution to the South African economy showed a
decrease 2.8% in 1997 to minus 1.6% in 2009.
Mpumalanga’s export as a percentage of GDP was experiencing fluctuations over
the time period 1996 to 2007. Export rates fluctuated and grew until 2002. Since
2002 Mpumalanga experienced deteriorating export rates (Mpumalanga Department
of Economic Development and Planning, 2009). Therefore, it is important to
determine the composition of GDP and the dominant sectors in the Mpumalanga
Province. It is important to conduct and in-depth study into Mpumalanga’s export
sector to determine which products show potential export possibilities.
1.4 RESEARCH QUESTION
The research question of this study is twofold:
1. Which are the potential priority export sectors of the Mpumalanga Province?
2. To what extent do the outcomes of this study match the opportunities presented
by the DSM?
1.5 RESEARCH OBJECTIVES
1.5.1 Primary objectives
The primary objective of this study is to analyse the composition of the Mpumalanga
Province’s economic activity to determine where the comparative advantage lies
regarding exports. Secondly this study proposes to match the results of the DSM
with the findings of the economic composition of the Mpumalanga Province.
7
1.5.2 Secondary objectives
The primary objectives will be achieved through the following secondary objectives:
Give an economic profile of the Mpumalanga Province.
Analyse production figures and other relevant data to determine the
products/sectors with the highest contribution to the province’s GDP.
Determination of the priority export sectors with the highest Revealed
Comparative Advantage (RCA).
To evaluate whether the products chosen with the highest export potential in the
Mpumalanga Province reflect the export opportunities identified by the DSM.
1.6 RESEARCH METHOD
At first, a literature review will be conducted to discuss the economic theory and
practice of exports. Economic growth determinants and how this link with exports will
also be investigated. The literature review will also include an economic profile of
Mpumalanga Province and its priority export sectors. An overview on why
Mpumalanga has been experiencing declining growth rates and whether this is still
the case, will also be researched. By conducting desk research the above objectives
into the economic composition of the Mpumalanga Province’s GDP will be achieved.
The empirical analysis will focus on determining the composition of Mpumalanga’s
GDP. This will be achieved by assessing the contribution of the different sectors in
the province to provincial GDP. Short-term and medium-term growth rates, exports
as a percentage of GDP, as well as gross value addition (GVA) of each sector will be
calculated to depict the change in contribution by industry sectors to GDP, over the
time period 2000 to 2010. In addition, these sector growth rates will be compared to
the Mpumalanga Province’s economic growth rate. The data will be obtained from
the following sources: The Municipal Demarcation Board website, Mpumalanga
Department of Economic Development, Mpumalanga Department of Finance,
Environment and Tourism, Statistics South Africa, the South African Revenue
Service (SARS) and the Mpumalanga Provincial government website. The data will
be analysed in Microsoft Excel.
8
The results will be presented by using tables and discussions. The data will then be
analysed and the RCA index of the various sectors will be determined. Finally, the
results of the DSM will be matched with the findings of the composition of economic
activity and RCA in the Mpumalanga Province. The DSM will then be discussed to
determine whether it was relevant in targeting exportable products in South Africa.
Export opportunities will be evaluated and recommendations will be made.
1.7 DIVISION OF CHAPTERS
The study is structured as follow. Chapter 2 will provide a theoretical overview of the
determinants of economic growth. An overview of the economic activity of in the
Mpumalanga will be discussed in Chapter 3. Chapter 4 will provide a theoretical
framework of the RCA. The results of the RCA from the Mpumalanga province will be
analysed in Chapter 5. The summary and conclusion of this study as well as
recommendations for further research will be discussed in Chapter 6.
9
CHAPTER 2: THE THEORETICAL OVERVIEW OF THE
DETERMINANTS OF ECONOMIC GROWTH
2.1 INTRODUCTION
The focal point of this chapter will be on the theoretical determinants of economic
growth. Economic growth may lead to higher levels of wealth for individuals, lower
poverty levels, better economic development and job creation. This chapter is also
going to consider export promotion, RCA and the DSM. Through the description of
the latter, a clearer perceptive of the determinants of economic growth can be given,
as well as a reason why it is important in the Mpumalanga Province to finally
conclude exports as the solution to enhancing exports in the province.
2.2 THEORY OF THE DETERMINANTS OF ECONOMIC GROWTH
Over the past two centuries, economists have been investigating a wide range of
studies into the determinants of economic growth. Theoretical and applied research
of the determinants of economic growth has also been receiving more notice
amongst economists. Although uncertainty exists about the process underlying
economic performance, theories exist that the role of an array of factors determines
economic growth. A wide variety of growth models exist, but the focus will only be on
the main theories and determinants of economic growth. At the end this chapter will
focus on applied research. How various sectors of the economy fit together first
needs to be understood; therefore, the following section will explain the general
framework of the economy and what functions represent which sector.
2.2.1 The aggregate demand and supply model and equilibrium in the
economy
The aggregate supply (AS) and aggregate demand (AD) model is widely used to
describe production and expenditure and what the effect of this is on the price level
(Colander & Gamber, 2002:110). The aggregate demand curve represents the
expenditure side of the economy, whereas the aggregate supply curve represents
the production side of the economy.
10
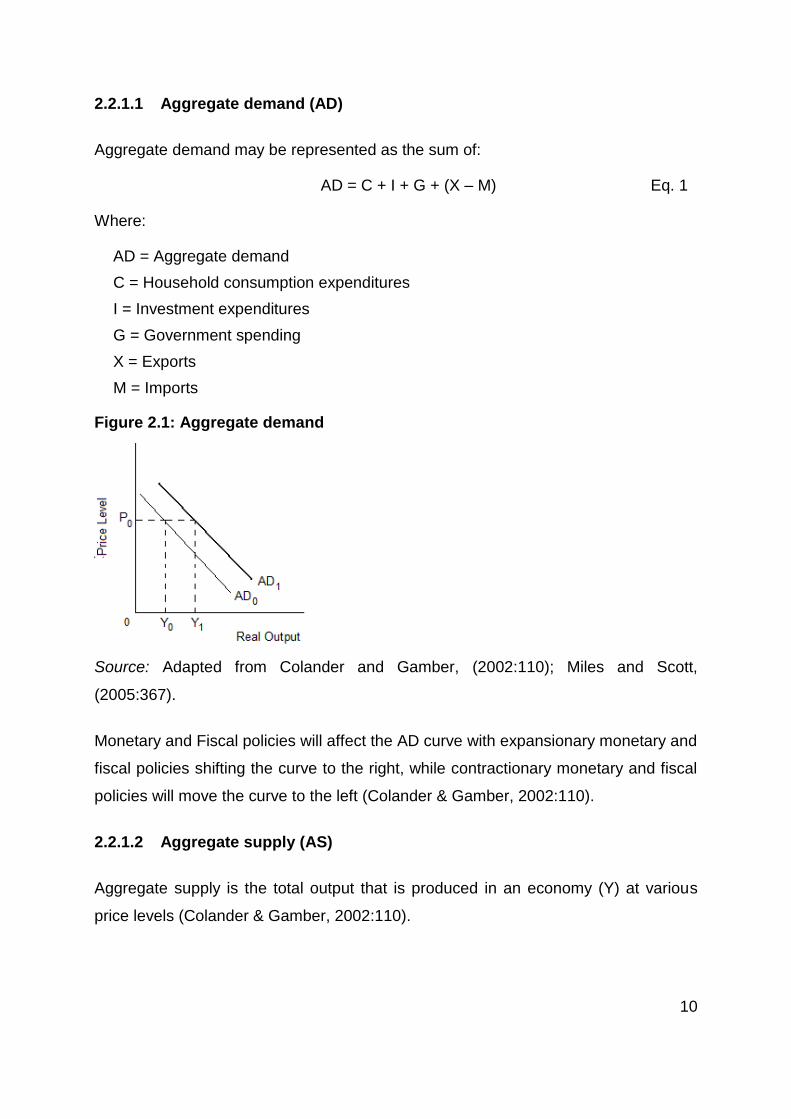
2.2.1.1 Aggregate demand (AD)
Aggregate demand may be represented as the sum of:
AD = C + I + G + (X – M) Eq. 1
Where:
AD = Aggregate demand
C = Household consumption expenditures
I = Investment expenditures
G = Government spending
X = Exports
M = Imports
Figure 2.1: Aggregate demand
Source: Adapted from Colander and Gamber, (2002:110); Miles and Scott,
(2005:367).
Monetary and Fiscal policies will affect the AD curve with expansionary monetary and
fiscal policies shifting the curve to the right, while contractionary monetary and fiscal
policies will move the curve to the left (Colander & Gamber, 2002:110).
2.2.1.2 Aggregate supply (AS)
Aggregate supply is the total output that is produced in an economy (Y) at various
price levels (Colander & Gamber, 2002:110).
11
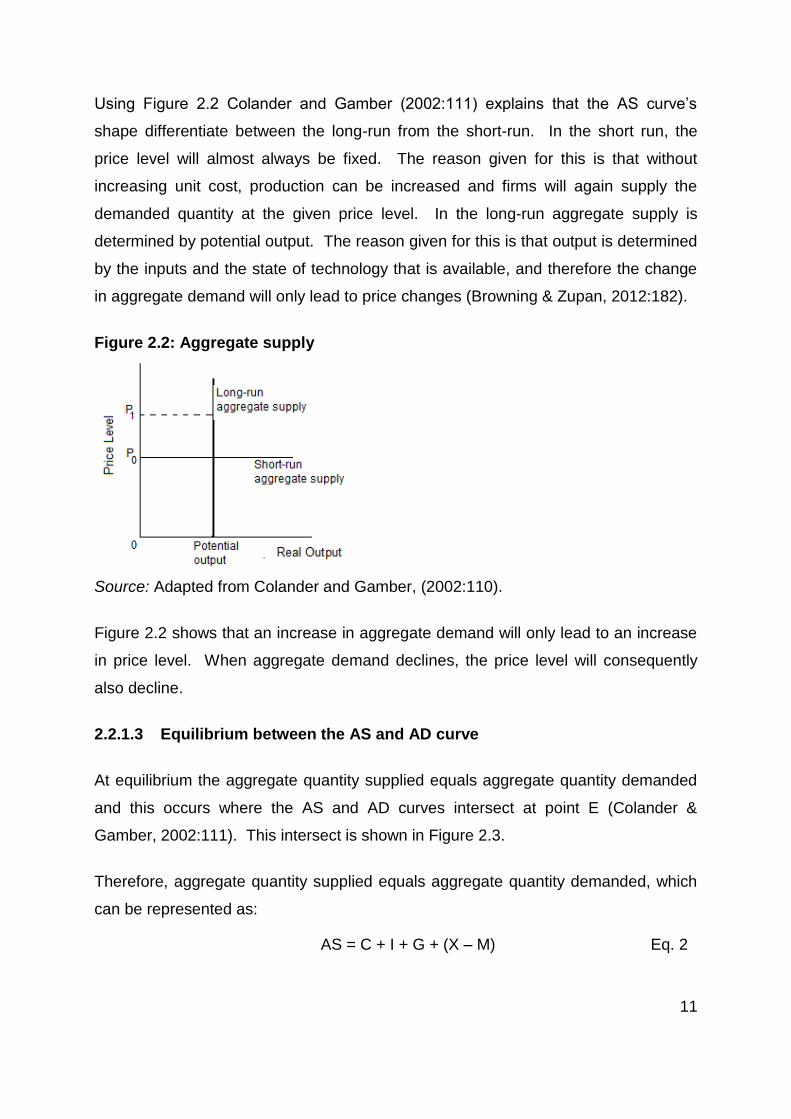
Using Figure 2.2 Colander and Gamber (2002:111) explains that the AS curve’s
shape differentiate between the long-run from the short-run. In the short run, the
price level will almost always be fixed. The reason given for this is that without
increasing unit cost, production can be increased and firms will again supply the
demanded quantity at the given price level. In the long-run aggregate supply is
determined by potential output. The reason given for this is that output is determined
by the inputs and the state of technology that is available, and therefore the change
in aggregate demand will only lead to price changes (Browning & Zupan, 2012:182).
Figure 2.2: Aggregate supply
Source: Adapted from Colander and Gamber, (2002:110).
Figure 2.2 shows that an increase in aggregate demand will only lead to an increase
in price level. When aggregate demand declines, the price level will consequently
also decline.
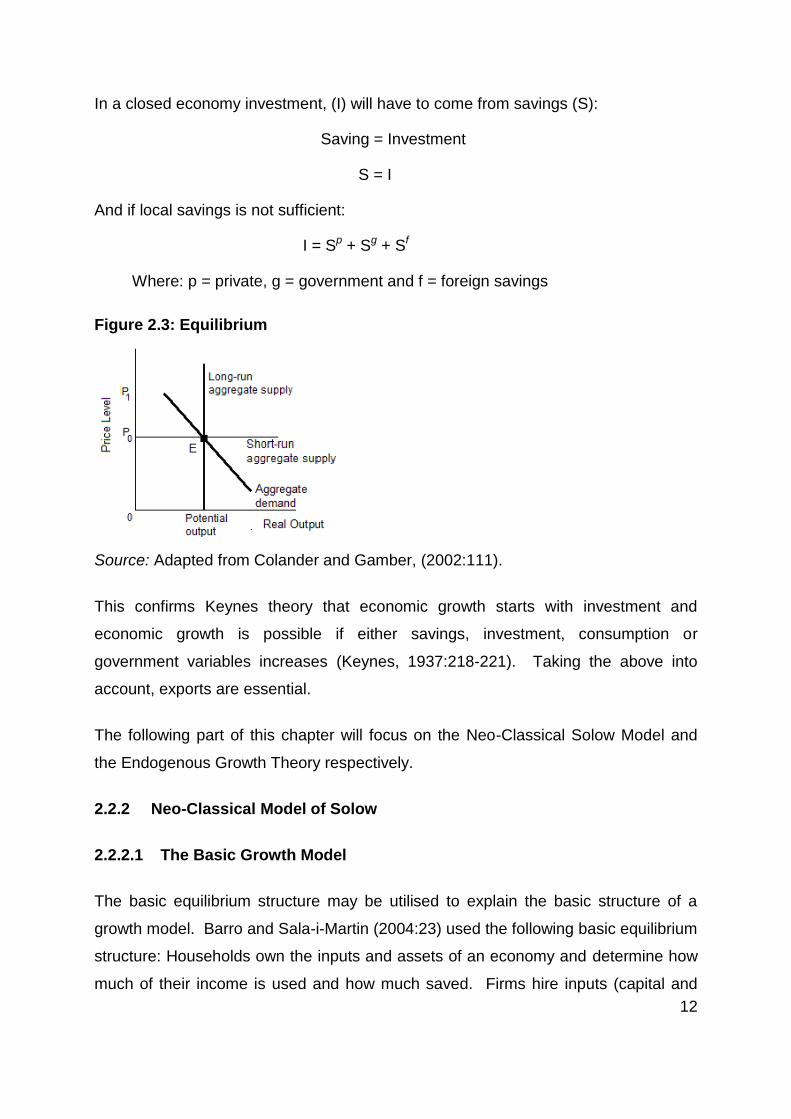
2.2.1.3 Equilibrium between the AS and AD curve
At equilibrium the aggregate quantity supplied equals aggregate quantity demanded
and this occurs where the AS and AD curves intersect at point E (Colander &
Gamber, 2002:111). This intersect is shown in Figure 2.3.
Therefore, aggregate quantity supplied equals aggregate quantity demanded, which
can be represented as:
AS = C + I + G + (X – M) Eq. 2
12
In a closed economy investment, (I) will have to come from savings (S):
Saving = Investment
S = I
And if local savings is not sufficient:
I = Sp + Sg + Sf
Where: p = private, g = government and f = foreign savings
Figure 2.3: Equilibrium
Source: Adapted from Colander and Gamber, (2002:111).
This confirms Keynes theory that economic growth starts with investment and
economic growth is possible if either savings, investment, consumption or
government variables increases (Keynes, 1937:218-221). Taking the above into
account, exports are essential.
The following part of this chapter will focus on the Neo-Classical Solow Model and
the Endogenous Growth Theory respectively.
2.2.2 Neo-Classical Model of Solow
2.2.2.1 The Basic Growth Model
The basic equilibrium structure may be utilised to explain the basic structure of a
growth model. Barro and Sala-i-Martin (2004:23) used the following basic equilibrium
structure: Households own the inputs and assets of an economy and determine how
much of their income is used and how much saved. Firms hire inputs (capital and
13
labour) and use them to produce goods which are sold to households and other
firms. Finally, markets exist through firms who sell goods to households and other
firms and the households who sell their inputs to the firms, all with the aim of
achieving a profit. Barro and Sala-i-Martin (2004:23) used the example of a person
who owns their inputs and who also manages technology that transforms these
inputs into outputs. Therefore the production function takes on the following form
(Barro & Sala-i-Martin, 2003:24):
Y(t) = F[K(t), L(t), T(t)] Eq. 6
Where,
Y(t) = the flow of output produced at time t
K(t) = Capital goods: the durable physical inputs (such as machinery and buildings)
L(t) = Labour: the inputs associated with human effort (such as the number of workers)
T(t) = Technology and knowledge used to provide workers with the ability to do the work.
The Solow model builds further on this concept and will be considered next.
2.2.2.2 The Solow Growth model
The history of the Solow Model dates back to 1956 and made a great contribution to
conventional economic growth theories (Farmer, 2010:56). The Solow growth model
shows how technological innovation, saving, depreciation and population growth
determine steady-state economic growth (Colander & Gamber, 2002:129). This
model is based on the basic assumptions of constant returns to scale, diminishing
marginal productivity of capital, exogenously determined technical progress and
substitutability between capital and labour (Petrakos & Arvantitidis, 2008:12).
Snowdon and Vane (2005:602-603) highlight that the Solow model focuses on the
impact that growth has on saving, population growth, and technological progress and
consequently depicting that the starting point of the discussion of economic growth
starts with the Solow model. For the means of this study only the basic production
function of the Solow Growth model will be discussed.
14
2.2.2.2.1 The production function
A Neo-Classical aggregate production function determines the Solow Model and
focuses on the adjacent causes of growth. The basic production function is
structured as:
Y = Af(K, L) Eq. 4
Where:
Y = output
A = technology
f(K , L) = capital and labour
This function may be a simplified progress, so that the relationship between output
per worker and capital per worker can be distinguished.
Y = f(K, L) Eq. 5
Here it is assumed that this basic production function has constant returns to scale
and to diminishing marginal product for both capital and labour. Diminishing returns
is a result of positive functions from output per worker. Constant return to scale
highlight that an economy will be large and because labour and specialisation are
exhausted, explain why the size of the economy does not influence output per worker
(Snowdon & Vane, 2005:604).
The Solow Growth Model Production Model is a per person or per capita production
function; therefore, along with the assumption of constant returns to scale, output and
all the other inputs, can be divided by labour (Lindhauer, et al., 2006:119):
Y/L = A•f(K/L, 1) Eq. 5
Therefore:
y = A•f(k)
Where:
y = output per person
k = capital per person
A = the measure of technology per person
15
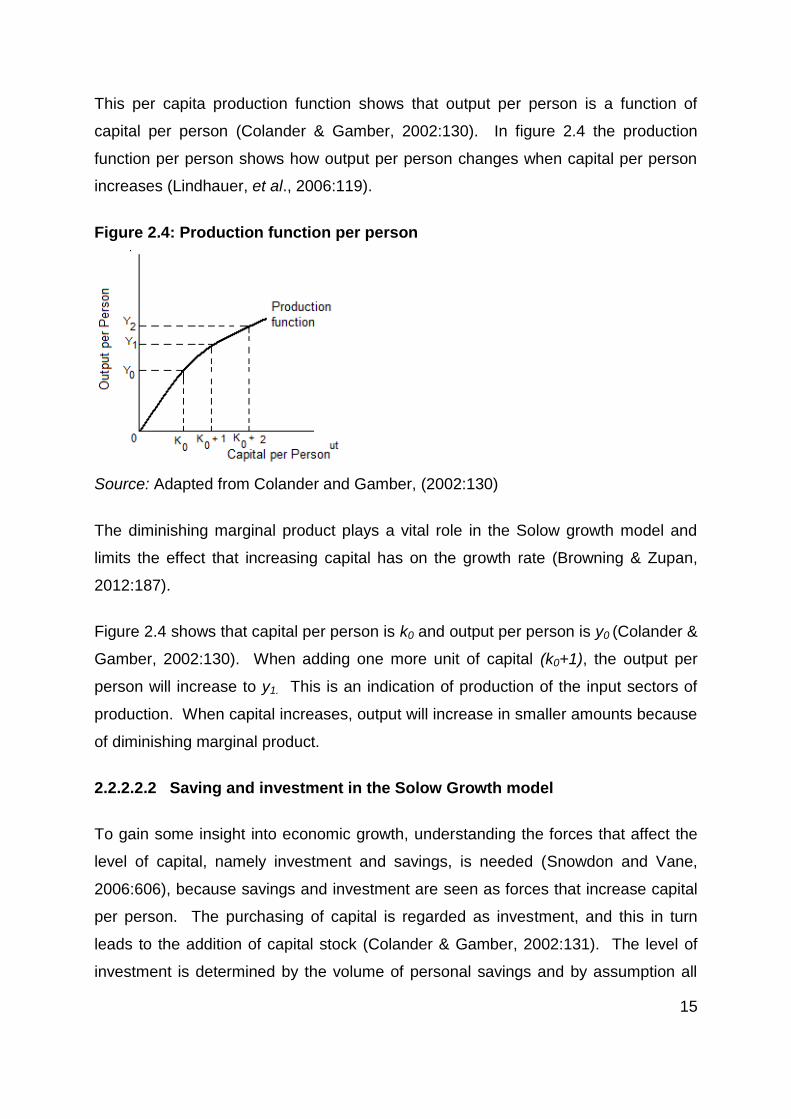
This per capita production function shows that output per person is a function of
capital per person (Colander & Gamber, 2002:130). In figure 2.4 the production
function per person shows how output per person changes when capital per person
increases (Lindhauer, et al., 2006:119).
Figure 2.4: Production function per person
Source: Adapted from Colander and Gamber, (2002:130)
The diminishing marginal product plays a vital role in the Solow growth model and
limits the effect that increasing capital has on the growth rate (Browning & Zupan,
2012:187).
Figure 2.4 shows that capital per person is k0 and output per person is y0 (Colander &
Gamber, 2002:130). When adding one more unit of capital (k0+1), the output per
person will increase to y1. This is an indication of production of the input sectors of
production. When capital increases, output will increase in smaller amounts because
of diminishing marginal product.
2.2.2.2.2 Saving and investment in the Solow Growth model
To gain some insight into economic growth, understanding the forces that affect the
level of capital, namely investment and savings, is needed (Snowdon and Vane,
2006:606), because savings and investment are seen as forces that increase capital
per person. The purchasing of capital is regarded as investment, and this in turn
leads to the addition of capital stock (Colander & Gamber, 2002:131). The level of
investment is determined by the volume of personal savings and by assumption all
16
savings are transformed into investment (Snowdon and Vane, 2006:606). This
function can be expressed as:
I = S = vY Eq. 6
Where:
S = saving
I = investment
vY = saving and investment is a constant fraction of income
By dividing it by labour (L), it is once against transformed into a per capita
relationship,
i = s =vy Eq. 7
Where:
I = investment per person
S = saving per person
Vy = saving per person is a fraction, v of income per person
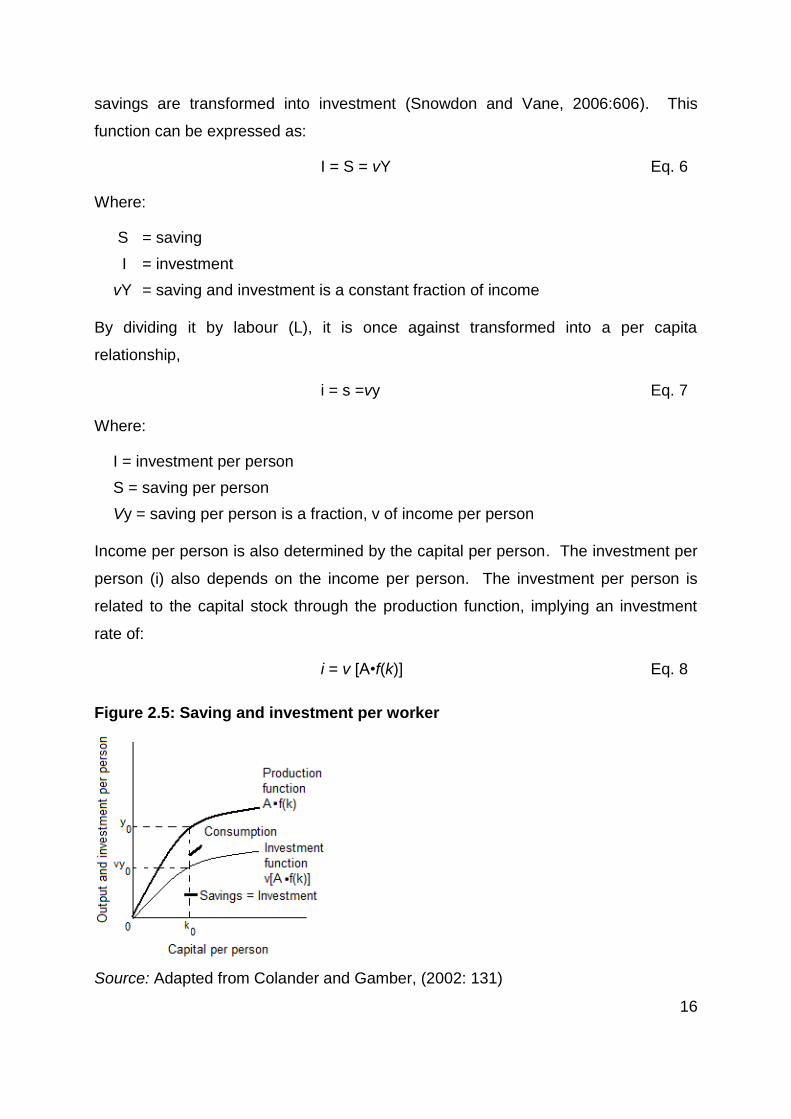
Income per person is also determined by the capital per person. The investment per
person (i) also depends on the income per person. The investment per person is
related to the capital stock through the production function, implying an investment
rate of:
i = v [A•f(k)] Eq. 8
Figure 2.5: Saving and investment per worker
Source: Adapted from Colander and Gamber, (2002: 131)
17
2.2.2.2.3 Population growth and depreciation
Savings and investment are seen as forces that increase capital per person. On the
contrary, population growth and depreciation are seen as the two forces that
decrease the capital per person (Colander & Gamber, 2002:132). The first force,
depreciation (d), is the rate at which capital depreciates or loses its value due to wear
and tear. Depreciation then reduces the capital per person by the rate of
depreciation: by multiplying it with capital per person, dk.
The second force is population growth. If population growth increases, the capital
per person declines, implying a decline in the wealth of all individuals. This is
because one unit of capital is divided by the greater number of people. Population
growth therefore reduces the capital per person (k) by the rate of population growth
(n) multiplied by the capital per person, nk (Colander & Gamber, 2002:132;
Samuelson & Nordhaus, 2010:222).
2.2.2.2.4 Balanced growth investment
Balanced growth investment (ib) is the amount of investment that keeps capital per
person constant at a level that is about enough to cover depreciation and population
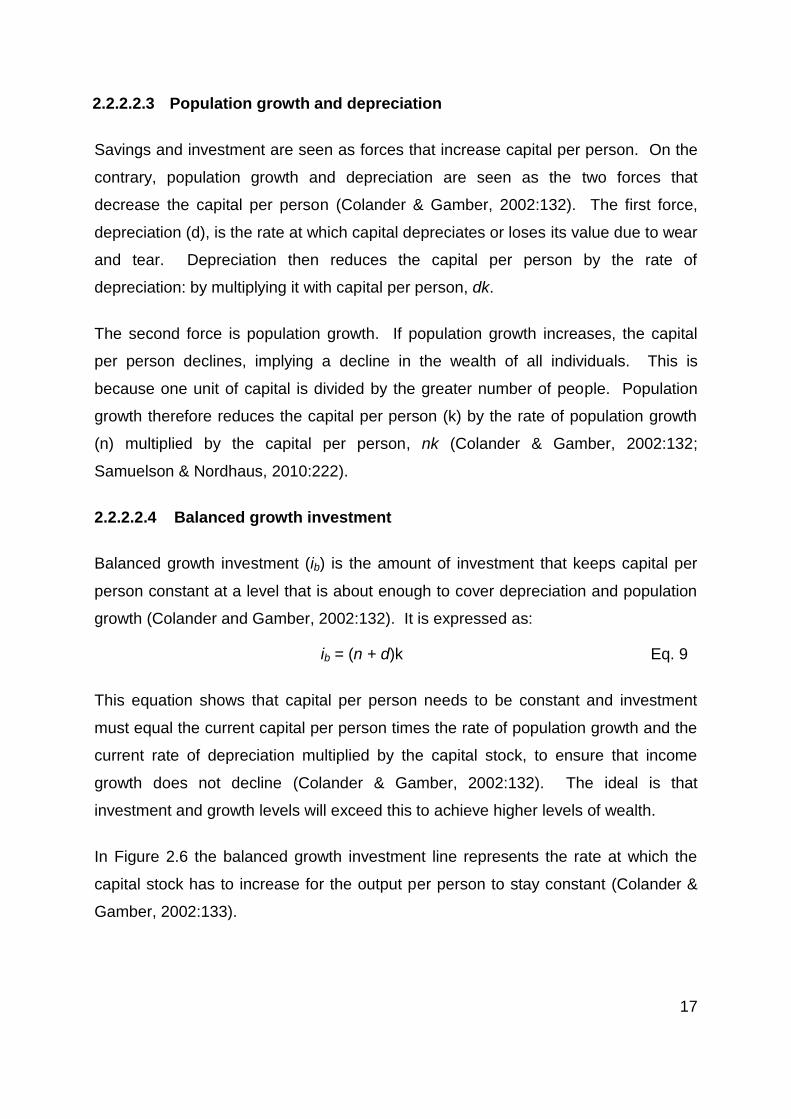
growth (Colander and Gamber, 2002:132). It is expressed as:
ib = (n + d)k Eq. 9
This equation shows that capital per person needs to be constant and investment
must equal the current capital per person times the rate of population growth and the
current rate of depreciation multiplied by the capital stock, to ensure that income
growth does not decline (Colander & Gamber, 2002:132). The ideal is that
investment and growth levels will exceed this to achieve higher levels of wealth.
In Figure 2.6 the balanced growth investment line represents the rate at which the
capital stock has to increase for the output per person to stay constant (Colander &
Gamber, 2002:133).
18
Figure 2.6: Balanced growth investment line
Source: Adapted from Colander and Gamber, (2002: 132).
2.2.2.2.5 Equilibrium in the Solow Growth model
The conclusion of the Solow growth model is that the economy will always be driven
towards an equilibrium in which the level of output per person does not change
(Colander & Gamber, 2002:133).
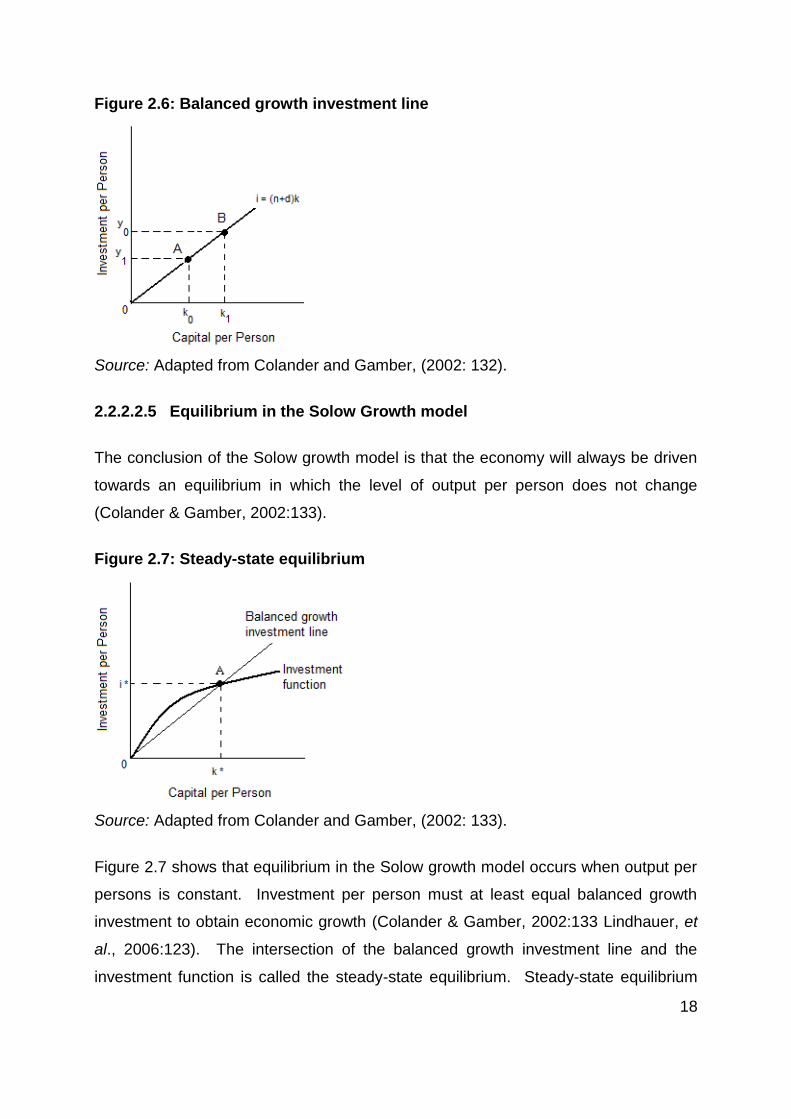
Figure 2.7: Steady-state equilibrium
Source: Adapted from Colander and Gamber, (2002: 133).
Figure 2.7 shows that equilibrium in the Solow growth model occurs when output per
persons is constant. Investment per person must at least equal balanced growth
investment to obtain economic growth (Colander & Gamber, 2002:133 Lindhauer, et
al., 2006:123). The intersection of the balanced growth investment line and the
investment function is called the steady-state equilibrium. Steady-state equilibrium
19
occurs where the investment function intersects the balance growth investment line
(Lindhauer, et al., 2006:123). What this means for the Solow Growth Model is that
capital and output per person can remain constant, even though the population is
increasing and the capital is depreciating (Colander & Gamber, 2002:134; Lindhauer,
et al., 2006:123). The ideal is that investment and production levels will be achieved
where production and employment will move higher than this steady state and
achieve higher levels of wealth and lower levels of poverty. The Solow Model further
implies that higher levels of growth require technological development and higher
productivity (Colander & Gamber, 2002:134; Lindhauer, et al., 2006:123).
2.2.3 Endogenous growth theory
The Neo-Classical Growth Model dominated the thoughts of economists for
centuries. Since the 1980’s there was a renewed interest in other growth theories,
introducing new growth theories. The most important one of these is the
Endogenous Growth Theory. The Endogenous Growth Theory highlights different
growth opportunities in physical and knowledge capital (Dornbusch, Fischer & Startz;
2008:78). The main idea of Endogenous Growth Theory is that increased investment
in knowledge increases growth. The key here is to link higher saving rates to higher
equilibrium rates (Dornbusch et al., 2008:79). It was realised that with the same
levels of capital and labour, higher levels of output and economic growth could be
achieved (Cypher & Dietz, 2009:239). This is especially important for regions whose
levels of capital are limited, like in Africa and the Mpumalanga Province.
The basic version of the production function is to assume a function with a constant
marginal product of capital with capital as the only factor:
Y = aK Eq. 9
Where:
Y = output
a = marginal product of capital
K = capital stock
20
Furthermore, the model assumes that the savings rate is constant at s, and that no
population growth or depreciation exists. This means all the saving goes to
increasing the capital stock (Dornbusch et al., 2008:79).
K = sY = saK or K/K = sa
This means that the capital growth rate is proportional to the saving rate; and output
is proportional to capital; therefore, the growth rate of output is:
Y/Y = sa
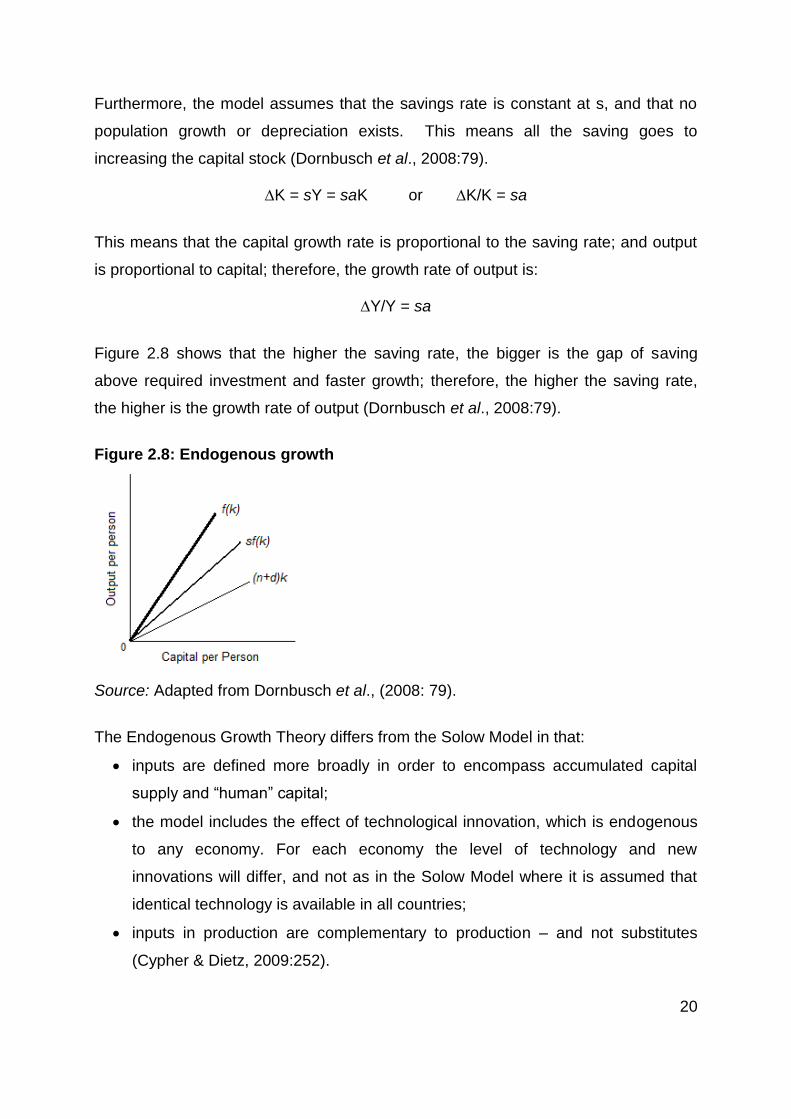
Figure 2.8 shows that the higher the saving rate, the bigger is the gap of saving
above required investment and faster growth; therefore, the higher the saving rate,
the higher is the growth rate of output (Dornbusch et al., 2008:79).
Figure 2.8: Endogenous growth
Source: Adapted from Dornbusch et al., (2008: 79).
The Endogenous Growth Theory differs from the Solow Model in that:
inputs are defined more broadly in order to encompass accumulated capital
supply and “human” capital;
the model includes the effect of technological innovation, which is endogenous
to any economy. For each economy the level of technology and new
innovations will differ, and not as in the Solow Model where it is assumed that
identical technology is available in all countries;
inputs in production are complementary to production – and not substitutes
(Cypher & Dietz, 2009:252).
21
In the Endogenous Growth Theory there are no decreasing returns to scale;
increases in inputs will always lead to increases in output. The effect of increasing
technology and innovation, however, is that economic growth can occur without the
amounts of capital and labour increasing. The increase, however, is not exogenous
to the economy, but is endogenous because the size of technology in specific
countries should be determined by:
the level and kind of education and training in the labour market;
the type of investment which the community makes in research and
development;
the state’s policies with regard to research and development, education and
training, intellectual property rights and patents;
the institutional capabilities of the economy in both the private and public
sectors (Cypher & Dietz, 2009:262).
The implications of the Endogenous Growth Theory are that:
economic growth does not necessarily lead to convergence in per capita
income between countries;
a lengthy recession in one country can lead to a permanent per capita income
gap between itself and other countries;
countries where more research and development are done, will experience
more rapid economic growth compared to countries which do not invest in such;
international financial capital can in fact flow from less-developed countries to
developed countries, because complementary investment in human capital,
research and infrastructure is higher in such countries. The high rates on
(scarce) capital investment in less-developed countries are thus eroded by
deficient complementary investment;
purely market-based approaches to economic growth will be sub-optimal
(Kleynhans & Naudé, 2003:100).
The latter conclusion is an important result in the endogenous-based literature. It is
based on the fact that education and training, research and development and
learning-through-doing experiences of workers, are all characterised by externalities
(spill-over effects).
22
The following section will focus on the theory behind the determinants of economic
growth.
2.3 THE DETERMINANTS OF ECONOMIC GROWTH AND ECONOMIC
PERFORMANCE
This section will focus on the theoretical determinants of economic growth, whereas
the previous section focused more on the theoretical foundations. As previously
mentioned, theoretical research into the determinants of economic growth has been
receiving a wide range of increased attention in previous years. Factors that have an
impact on economic growth differ from conceptual and methodological viewpoints
(Petrakos & Arvantitidis, 2008:14). The most important determinants are investment,
human capital and openness to trade, foreign direct investment, political issues, as
well as innovation and research and development activities. The sources of
economic growth each have a set of explanatory parameters and therefore the rest of
this section will focus on each source separately.
2.3.1 Investment
The Neo-Classical and Endogenous Growth Models have identified investment as
the most essential determinant of economic growth. The Neo-Classical Model and
the Endogenous Growth Model differ on their views on investment; however the Neo-
Classical Model considers the impact of investment in the transitional period. The
Endogenous Growth Model argues for more permanent effects of investment
(Petrakos & Arvantitidis, 2008:14). It is also necessary to distinguish between public
and private types of investment that are required for economic growth and
development (Lindhauer, et al., 2006:428).
Public investment is investment in roads, ports, telecommunication, schools and
health facilities and is mostly funded by the government. Private investment is
investment in new employment, capital goods, technologies and growth in economic
output and receives more investment than public investment. The main factors
influencing investment are those that influence the quality of both investment and
productivity (Lindhauer, et al., 2006:428). These factors affect economic growth by
23
improving productivity in the economy. These factors also include macro-economic
and political stability, infrastructure, economic openness, institutional quality, as well
as governance and regulatory quality.
2.3.2 Human capital
The main source of economic growth in many Neo-Classical and Endogenous
Growth Models is human capital (Petrakos & Arvantitidis, 2008:14). The definition of
human capital is given as: “the knowledge and ability to produce that is embodied in
the labour force” (Dornbusch et al., 2008:29). Even though human capital is seen as
a source of economic growth, Hers (1998:36) states that the mechanisms through
which human capital stimulates growth still remain unclear. A wide range of studies
have measured the quality of human capital and its relationship with education and
most of these studies found that education (educated labour force) is a key
determinant of economic growth (Petrakos & Arvantitidis, 2008:14; Barro and Sala-i-
Marin, 1995: 247-251; Hers, 1998:37-39).
2.3.3 Innovation and Research and Development activities
Innovation and Research and Development activities (R&D) are seen as key factors
in economic progress through increased productivity and growth (Petrakos &
Arvantitidis, 2008:14). According to Yanyun and Mingqian (2004:2) theoretical
literature suggest that R&D is seen as an engine of growth, but other studies have
shown that technological adaption does not come without its relevant costs.
Therefore, it is important for countries to adopt “absorptive” and a “national learning”
capacity that will in turn be functions of spending on R&D (Yanyun & Mingqian,
2004:2). In the late 1990’s endogenous R&D growth models made its appearance.
These models consisted of intensive and extensive innovations (Caminati,
2003:237).
Intensive innovations cause an increase in productivity of intermediate goods. In
contrast, extensive innovations increase output, which is the number of intermediate
goods produced. Therefore, the role of R&D activities showed a strong relationship
between innovation, R&D and economic growth (Petrakos & Arvantitidis, 2008:14).
24
The idea is to be so competent using scientific knowledge and existing technologies
and to be so proficient that a country can develop its own indigenous technology that
is in line with its own needs and level of development (Kleynhans, 2004:185). New
technologies always have the best value and provide the highest income and growth
(Cypher & Dietz, 2009:422).
2.3.4 Macro-economic policies
According to Petrakos and Arvantitidis (2008:15) the existent literature suggests that
there is little consensus on which policies is more conductive to growth. A stable
macro-economic condition is, however, always seen as necessary for economic
growth (Fischer, 1993:485-486). According to Fischer (1993:485-486) macro-
economic stability is needed to constructively affect growth. This is achieved through
reducing price uncertainty, moderating public deficit and public debt levels. By doing
this, the crowding out effect and the likelihood of tax increases is reduced (Fischer
1993, 1993:485-486). Macro-economic instability could cause a negative impact on
growth because of its effects on productivity and investment (Petrakos & Arvantitidis,
2008:15).
2.3.5 Openness to trade
A country’s openness to trade has a positive link with economic growth. Openness
to trade facilitates the movement of technology and the diffusion of knowledge
(Petrakos & Arvantitidis, 2008:15). Being open to trade also means more exposure
to competition and contributes to the exploitation of comparative advantage.
According to Salvatore (2004:360) a more open economy can have an important
influence on the rate of economic growth and development. This is done in the
following ways:
Adopting technology from advanced nations faster
Benefiting from R&D
Benefiting from economies of scale
Allocating domestic resources more efficiently as well as from price distortion
reductions
Achieving greater specialisation and production efficiencies and
25
Introducing new products onto the market faster
The Endogenous Growth Theory postulates that technological change is the cause of
most externalities. These externalities can “offset any propensity to diminishing
returns to capital accumulation” (Salvatore, 2004:360). Some empirical studies have
shown that a positive correlation exists between economies which are more open to
trade, their manufactured exports and economic growth (Pearson, 2007:21).
According to Wacziarg (2001:395-401):
“The openness of an economy can influence economic growth through six
potential channels: macroeconomic policy quality, government size, price
distortions, investment share of gross domestic product, technology, and
foreign direct investment.”
2.3.6 Foreign direct investment (FDI)
Foreign direct investment has potential to enhance economic growth. FDI generates
import benefits for a country, such as technological spill-overs and skills transfers
that increase productivity (Krugell & Matthee, 2008:2). FDI distributes highly
developed types of technology. FDI facilitates the diffusion of advanced technology
into the economy. This is also achieved through capital goods imports that are later
imitated or through the diffusion of knowledge and expertise (Wacziarg, 2001:398).
Foreign firms that invest in another country can enjoy higher productive efficiency
and lower costs (Borensztein, De Gregorio, & Lee, 1998:135). In the case of
developing countries, Borensztein et al., (1998:133) stated that higher efficiency is
achieved from receiving FDI, advanced skills and more modern technology.
However, FDI may also result in economic distortions.
FDI is the means through which technology transfers and protectionist trade policies
can cause problems. FDI is the only means domestic firms often have to enable
them to export to other countries (Borensztein et al., 1998:133-136). FDI has also
played an important role in internationalising global economic activity. This role is
stressed in several models of Endogenous Growth Theory (Petrakos & Arvantitidis,
2008:15).
26
2.3.7 Political issues
Research shows that political issues affect the economy and its potential for growth
to a great extent (Kormendi & Meguire, 1985:156-157). An example is when political
instability occurs. When residents do not have access to the productive resources of
an economy, conflicts arising amongst residents over distribution will most likely
harm economic growth (Alesina & Rodrik, 1994:484-485).
The problem of land redistribution is also negatively correlated with economic growth.
When a political circumstance is uncertain in a country, investment is discouraged
and this hinders economic potential (Petrakos & Arvantitidis, 2008:16). Political
stability in a country is important to growth. A country that manages political stability
is more likely to receive investment from foreign investors. Therefore, the level of
democracy found in a country also plays an important role in enhancing growth.
The factors and determinants of economic growth have an impact on how growth in a
country can be sustained. Exports contribute to economic growth and therefore
governments drive to promote exports in order to increase exports. The following
section will discuss the theoretical consideration of export promotion and the way that
countries can utilise in an effort to enhance their export towards the rest of the world.
2.4 EXPORT PROMOTION
Countries used a variety of export promotion programmes and schemes to enhance
their own export performance in the past and there seems to be no clear answer to
which programme works the best. Export promotion is a development characteristic
for countries that tend to have its own set of export incentives (Van Aarde & Viviers,
2008:2). According to the Department of Trade and Industry (2006) of South Africa,
export promotion organisations uses various marketing and information services
designed to support and encourage domestic firms to export their goods and
services.
This section will consider public and private institutions, effectiveness of export
programs and the allocation problem.
27
2.4.1 Public and private institutions in export promotion
Cuyvers et al., (1995:173) stated that export promotion activities are conducted by
both private and public institutions. Private and public institutions gather information
regarding foreign markets, competitors and their relevant products and barriers to
entry, where competitors are situated. This information is gathered from libraries,
publications, internet resources and journals, to name a few. This information is then
passed on to potential exporters. Another important duty these institutions provide is
multi-sectoral economic missions to international countries. These institutions
provide exporters with the opportunity to participate at trade fairs and they also have
trade officers that assist exporters in market research, prospecting and market
penetration (Cuyvers et al., 1995:173-174).
2.4.2 The efficiency of export promotion programs
Governments regularly provide export promotion assistance in the form of export
promotion programmes. Criticism exists; however, as it is often alleged that publicly
funded export promotion programmes only benefit large companies (Pearson,
2007:29). Richards, Van Ispelen and Kagan (1997:336) found that when export
promotion activities are aimed at manufactured goods, these promotion programmes
seem to be more effective, as they are mostly focused on individual products, and
these forms of export promotion should be promoted.
Czinkota (2002:123-126) defines organisational capability as knowledge and
advanced research with interactive connections between the market and
technological and human resources. Managerial competencies are defined as
education, exposure to foreign markets and expertise of export products. The
assumption is made that governments can improve export performance by the
successful use of their export promotion programmes. Arguments against the use of
government export promotion programmes, as a measure to enhance a country’s
economic growth and performance, do however still exist.
28
2.4.3 The allocation problem
The allocation problem is a main cause of concern for export promotion institutions,
because it is difficult to devote scarce resources to a variety of activities (Cuyvers et
al., 1995:173). These include a range of export markets and export promotion
instruments. In his case study on Thailand, Cuyvers (2004:255) suggested that
developing countries should be concerned with export promotion as a public good to
enhance knowledge. This can improve capabilities in the international trade relations
arena (Cuyvers, 2004:255). Enhanced international trade relations could be
accomplished through a variety of tools, such as centralised information gathering
and distribution, the organisation of outgoing trade missions and finally the provision
of incentives to obtain more market knowledge through companies that participate in
trade fairs (Cuyvers, 2004:255). When these obligations are fulfilled, the public
export promotion institutions that pursue these activities can improve national welfare
through a resulting increase in export volumes. With the welfare-increasing effect,
come issues such as social costs dependable on the competence and personal
interest of civil servants, the degree of organisational flexibility and the
communication channel quality within the private sector (Cuyvers, 2004:255).
Finding new markets has therefore become more important to export promotion
organisations and exporting companies.
National Governments generate interest in the standard task of export promotion.
National governments stimulate exports using subsidies, tax exceptions, and special
credit lines as their most important export promotion instruments (Anon, 2007:1).
The involvement of governments in designing export promotion programmes to
promote specific sectors has become more important after the export successes of
the so-called Asian “Tiger Economies” (Glenday & Ndii, 2000). Cuyvers (2004:256)
highlights that scarce national resources are a problem, as well as the need to
develop and implement export promotion strategies and activities.
Governments find it difficult to choose specific sectors for export promotion and to
allocate their scarce resources in these sectors (Shankarmahesh, Olsen, &
Honeycutt, 2005:204). Gencturk and Kotabe (2001:51-72) highlights government
involvement where the competitive position of firms did improve through export
29
support, which resulted in export success. The decision support model is such a
tool.
South Africa has developed its own Decision Support Model (DSM) in recent years.
This model enables the government to promote export of commodities for which
international market demand exists and where South Africa has a competitive
advantage. The following section will consider this decision support model.
2.5 THE DECISION SUPPORT MODEL (DSM) FOR THE ALLOCATION
OF REALISTIC EXPORT OPPORTUNITIES
A Decision Support Model (DSM) was developed and applied in Belgium and now
adopted, refined and extended for South Africa (Cuyvers et al., 1995). This model
can be used for the planning and assessment of export promotion activities (Cuyvers
et al., 1995).
2.5.1 The importance of the DSM
Governments frequently have limited resources to allocate between export
promotional instruments and different export activities (Cuyvers et al., 1995:173).
From an export promotion point of view, the Decision Support Model (DSM) provides
a powerful tool that can identify realistic export opportunities for South Africa
(Pearson, 2007:37-38). Export promotion organisations can identify and justify the
allocation of export promotion resources. The DSM also helps to prioritise export
assistance to potentially successful exporters from South Africa (Pearson, 2007:37-
38).
In order to address this problem, the DSM was applied to the South African economy
to identify products with high export potential. This support will help exporters in
South Africa in various ways. It enables exporters to access foreign business
opportunities that will lead to realistic export markets for their products and increase
a firm’s export profitability and export volumes (Pearson, 2007:37-38). In the past
the South African government often promoted exports, without any scientific base,
which often lead to misallocation and a waste of resources. The DSM is used to help
30
governments to assign their scarce resources into markets with the highest export
potential (Cuyvers et al., 1995:174). Steenkamp, Rossouw, Vivers and Cuyvers
(2009:14) highlighted that the priority exportable products for each specific market
that is provided by the DSM can be useful for an export promotion agency.
2.5.2 Caution against the DSM
Even though a country could benefit from applying the DSM, Cuyvers et al.,
(1995:174) states that a country must not base all their export promotion decisions
on the DSM, because the DSM relies on historical data and has a short term scope.
This could cause other relevant and important export opportunities to be lost,
because the DSM will indicate these opportunities as sub-optimal, whereas in the
long-term, these export opportunities might deliver promising results (Cuyvers et al.,
1995:174; Steenkamp et al., 2009:31)). Criticisms and feedback from foreign trade
officers and export councils should also be taken into deliberation (Steenkamp et al.,
2009:31).
2.5.3 The Process of the DSM
The DSM works through a process of four filters and each filter is used for a certain
task. The first filter includes all the countries of the world as potential target markets.
This filter gathers information regarding the political and commercial risk of doing
business with countries to assess markets that do not show sufficient general export
potential (Cuyvers, 2004:256). The market potential of each of the products for the
remaining countries is then assessed in a second filter and this is done by product-
related criteria of market potential. Filter three involves an in-depth study into the
remaining potential export opportunities. Markets that are complicated to access due
to barriers of entry are then eliminated. Finally, the fourth filter determines the most
practical export opportunities that came out of the third filter. This is done by
parameters that assess the strengths and weaknesses of the exporting country in the
specific market (Cuyvers, 2004:257).
31
2.6 SUMMARY AND CONCLUSION
The theoretical determinants of economic growth, export promotion, Revealed
Comparative Advantage (RCA) and the Decision Support Model (DSM) were
discussed during the course of this chapter.
Theoretical aspects were studied first. The Keynesian theory highlighted the fact that
increases in savings, investment consumption and government variables that lead to
economic growth, starts with investment. Economic growth will follow and thus
concludes that exports are sustainable. The Neo-Classical Model depicted that a
steady state-economic growth is determined by technological innovation, saving,
depreciation and population growth. The Endogenous Growth Theory concludes that
economic growth and high levels of output can be achieved with constant levels of
capital and labour.
The public and private institutions in export promotion, effective s of export promotion
programs and the allocation problems that exist within export promotion were also
discussed in this chapter. Investment, human capital, openness to trade, foreign
direct investment, political issues and export-led growth are determinants of
economic growth and economic performance. Without these determinants it will be
difficult to indicate and understand economic growth and performance. A country
with its own set of export incentives specifies export promotion as a development
characteristic.
Finally the Decision Support Model (DSM) were discussed in this chapter. The
Decision Support Model (DSM) was developed to prioritise export assistance to
potentially successful exporters from South Africa and to identify products with high
export potential. Caution against the DSM is its application of historical data and it
has a short-term scope predicament. Finally the four filters through which the DSM
focuses were discussed. The first filter includes all the countries of the world as
potential target markets and through the process of elimination countries without
sufficient export potential are excluded. Market potential of each product is then
assessed in filter two and some countries are once again eliminated in this filter.
Filter three consists of an in-depth study done on the remainder of the export
32
opportunities and filtered again. Finally, the fourth filter determines the most practical
export opportunities that came through the third filter.
The following chapter will provide an economic overview of the Mpumalanga
Province. A socio-economic outlook and a general overview of the Mpumalanga
Province will be given. The economic activity and trade of the province will also be
discussed subsequently.
33
CHAPTER 3: AN OVERVIEW OF THE ECONOMIC ACTIVITY
IN THE MPUMALANGA PROVINCE
3.1 INTRODUCTION
The focus of this chapter is to provide an economic overview of the Mpumalanga
Province. This chapter will provide a socio-economic outlook of the Mpumalanga
Province to offer a realistic picture of the socio-economic conditions of the province.
By providing an overview of the province, one will come to a better understanding of
the province and its importance to the country.
The main focus of this chapter will be on the economic activity and trade of the
province. Additionally this chapter will give a brief description of the following
relevant aspects: demographics, labour, education, infrastructure and investment
projects. Before the latter is discussed, a brief geographic background of the
Mpumalanga Province will subsequently be given in Section 3.2.
3.2 GEOGRAPHIC BACKGROUND OF THE MPUMALANGA PROVINCE
The Mpumalanga Province is rich in natural endowments, well-established
infrastructure and moderate economic performance (Mpumalanga Department of
Economic Development and Planning, 2009). Mpumalanga is known by many South
Africans as the “place where the sun rises” and is situated north of KwaZulu-Natal
and borders Swaziland and Mozambique in the east (see figure 3.1). Its location is
one of the main benefits of the Mpumalanga Province when one considers
investment in this province. The province with its abundance of resources is an
active trade and investment environment for domestic and local investors (Adlam,
2009).
Rich agricultural land and the suitable climate conditions for agriculture ensure this
province is the nationwide leader in producing an assortment of agricultural products
and forestry products. The high quality agricultural land in the Lowveld area
specialises in the production of sugar cane, subtropical fruit, citrus fruit, nuts and
vegetables.
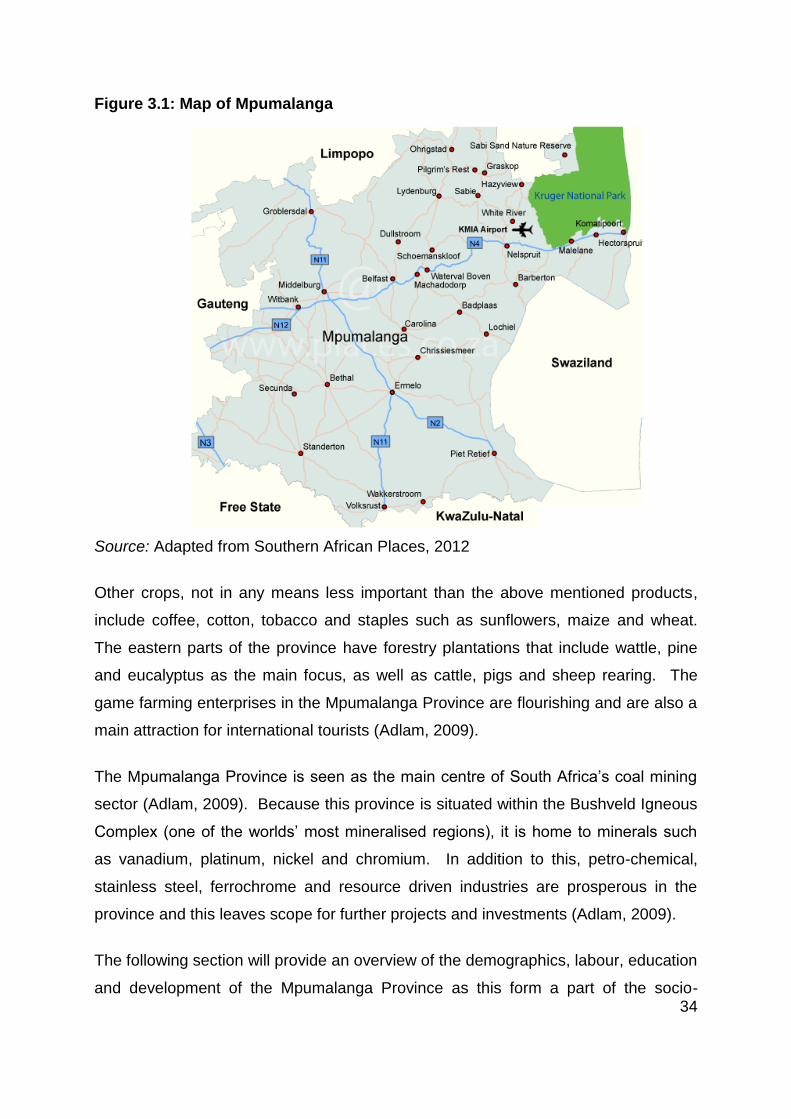
34
Figure 3.1: Map of Mpumalanga
Source: Adapted from Southern African Places, 2012
Other crops, not in any means less important than the above mentioned products,
include coffee, cotton, tobacco and staples such as sunflowers, maize and wheat.
The eastern parts of the province have forestry plantations that include wattle, pine
and eucalyptus as the main focus, as well as cattle, pigs and sheep rearing. The
game farming enterprises in the Mpumalanga Province are flourishing and are also a
main attraction for international tourists (Adlam, 2009).
The Mpumalanga Province is seen as the main centre of South Africa’s coal mining
sector (Adlam, 2009). Because this province is situated within the Bushveld Igneous
Complex (one of the worlds’ most mineralised regions), it is home to minerals such
as vanadium, platinum, nickel and chromium. In addition to this, petro-chemical,
stainless steel, ferrochrome and resource driven industries are prosperous in the
province and this leaves scope for further projects and investments (Adlam, 2009).
The following section will provide an overview of the demographics, labour, education
and development of the Mpumalanga Province as this form a part of the socio-
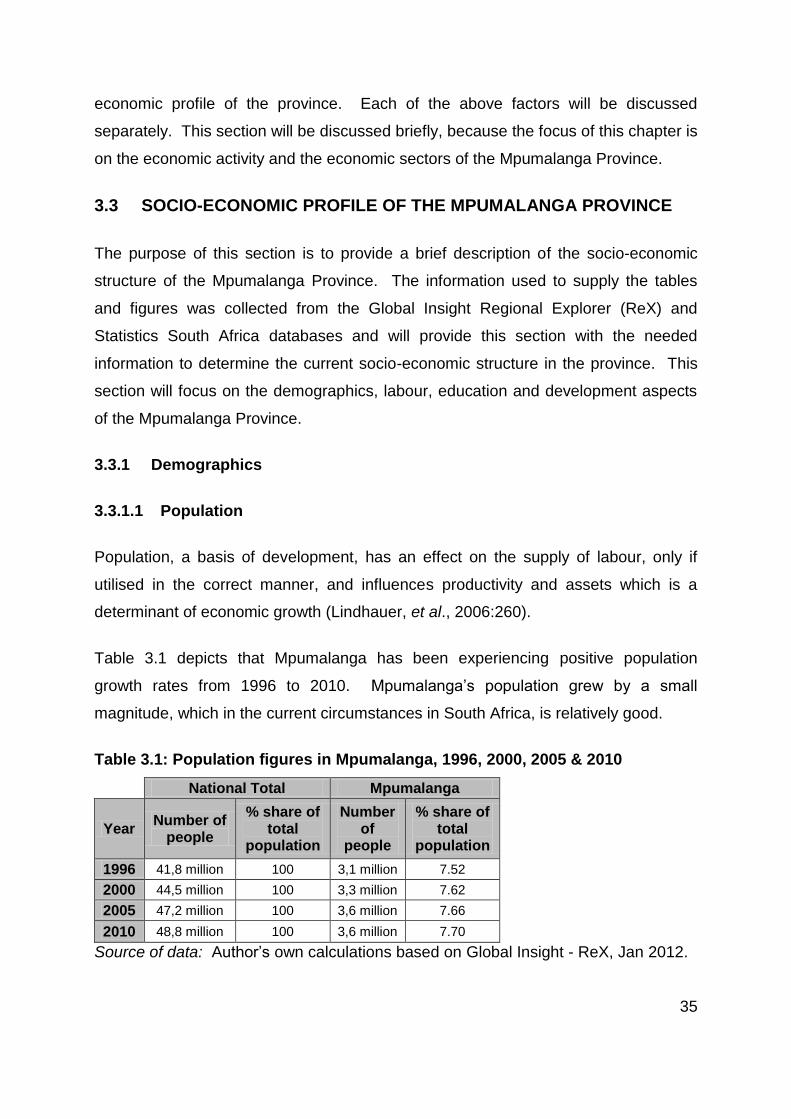
35
economic profile of the province. Each of the above factors will be discussed
separately. This section will be discussed briefly, because the focus of this chapter is
on the economic activity and the economic sectors of the Mpumalanga Province.
3.3 SOCIO-ECONOMIC PROFILE OF THE MPUMALANGA PROVINCE
The purpose of this section is to provide a brief description of the socio-economic
structure of the Mpumalanga Province. The information used to supply the tables
and figures was collected from the Global Insight Regional Explorer (ReX) and
Statistics South Africa databases and will provide this section with the needed
information to determine the current socio-economic structure in the province. This
section will focus on the demographics, labour, education and development aspects
of the Mpumalanga Province.
3.3.1 Demographics
3.3.1.1 Population
Population, a basis of development, has an effect on the supply of labour, only if
utilised in the correct manner, and influences productivity and assets which is a
determinant of economic growth (Lindhauer, et al., 2006:260).
Table 3.1 depicts that Mpumalanga has been experiencing positive population
growth rates from 1996 to 2010. Mpumalanga’s population grew by a small
magnitude, which in the current circumstances in South Africa, is relatively good.
Table 3.1: Population figures in Mpumalanga, 1996, 2000, 2005 & 2010
National Total Mpumalanga
Year Number of
people
% share of total
population
Number of
people
% share of total
population
1996 41,8 million 100 3,1 million 7.52
2000 44,5 million 100 3,3 million 7.62
2005 47,2 million 100 3,6 million 7.66
2010 48,8 million 100 3,6 million 7.70
Source of data: Author’s own calculations based on Global Insight - ReX, Jan 2012.
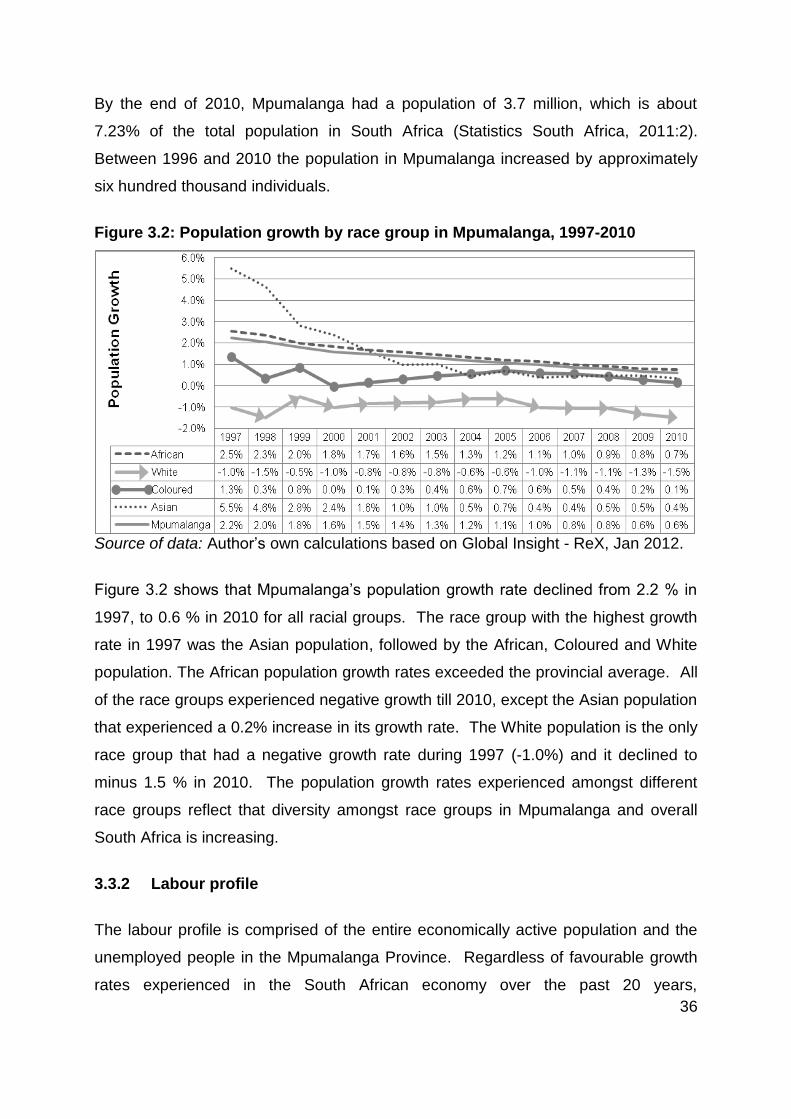
36
By the end of 2010, Mpumalanga had a population of 3.7 million, which is about
7.23% of the total population in South Africa (Statistics South Africa, 2011:2).
Between 1996 and 2010 the population in Mpumalanga increased by approximately
six hundred thousand individuals.
Figure 3.2: Population growth by race group in Mpumalanga, 1997-2010
Source of data: Author’s own calculations based on Global Insight - ReX, Jan 2012.
Figure 3.2 shows that Mpumalanga’s population growth rate declined from 2.2 % in
1997, to 0.6 % in 2010 for all racial groups. The race group with the highest growth
rate in 1997 was the Asian population, followed by the African, Coloured and White
population. The African population growth rates exceeded the provincial average. All
of the race groups experienced negative growth till 2010, except the Asian population
that experienced a 0.2% increase in its growth rate. The White population is the only
race group that had a negative growth rate during 1997 (-1.0%) and it declined to
minus 1.5 % in 2010. The population growth rates experienced amongst different
race groups reflect that diversity amongst race groups in Mpumalanga and overall
South Africa is increasing.
3.3.2 Labour profile
The labour profile is comprised of the entire economically active population and the
unemployed people in the Mpumalanga Province. Regardless of favourable growth
rates experienced in the South African economy over the past 20 years,
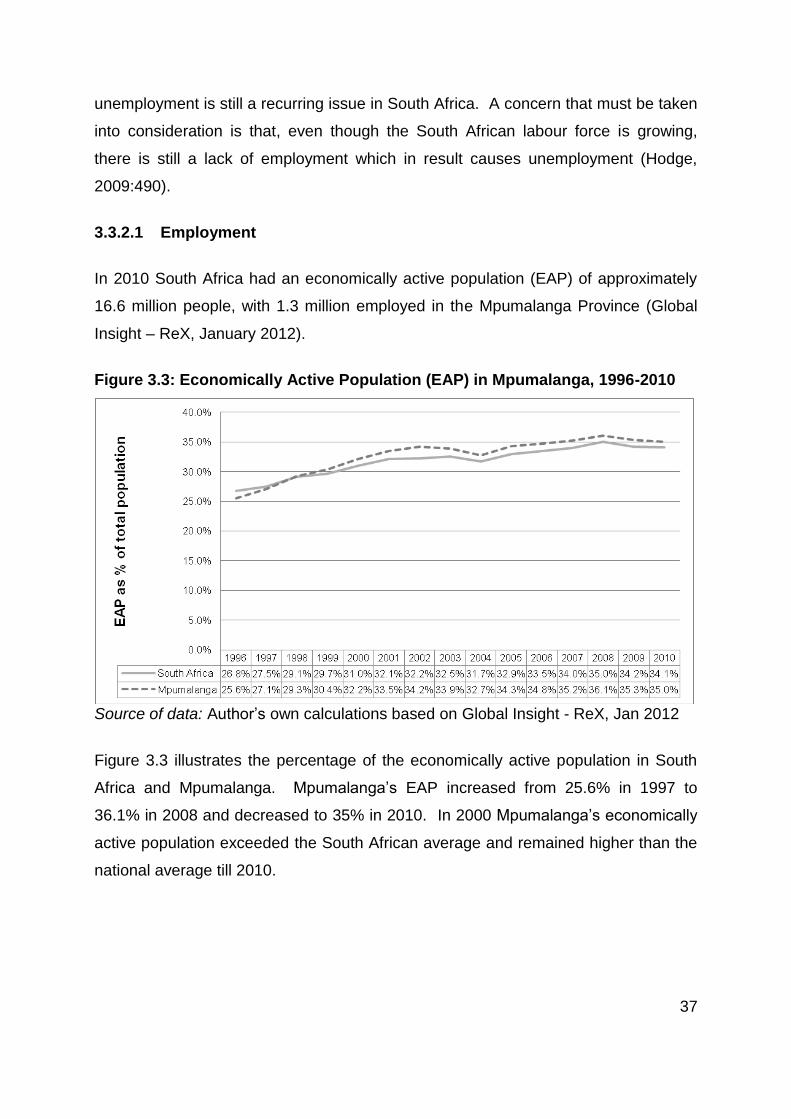
37
unemployment is still a recurring issue in South Africa. A concern that must be taken
into consideration is that, even though the South African labour force is growing,
there is still a lack of employment which in result causes unemployment (Hodge,
2009:490).
3.3.2.1 Employment
In 2010 South Africa had an economically active population (EAP) of approximately
16.6 million people, with 1.3 million employed in the Mpumalanga Province (Global
Insight – ReX, January 2012).
Figure 3.3: Economically Active Population (EAP) in Mpumalanga, 1996-2010
Source of data: Author’s own calculations based on Global Insight - ReX, Jan 2012
Figure 3.3 illustrates the percentage of the economically active population in South
Africa and Mpumalanga. Mpumalanga’s EAP increased from 25.6% in 1997 to
36.1% in 2008 and decreased to 35% in 2010. In 2000 Mpumalanga’s economically
active population exceeded the South African average and remained higher than the
national average till 2010.
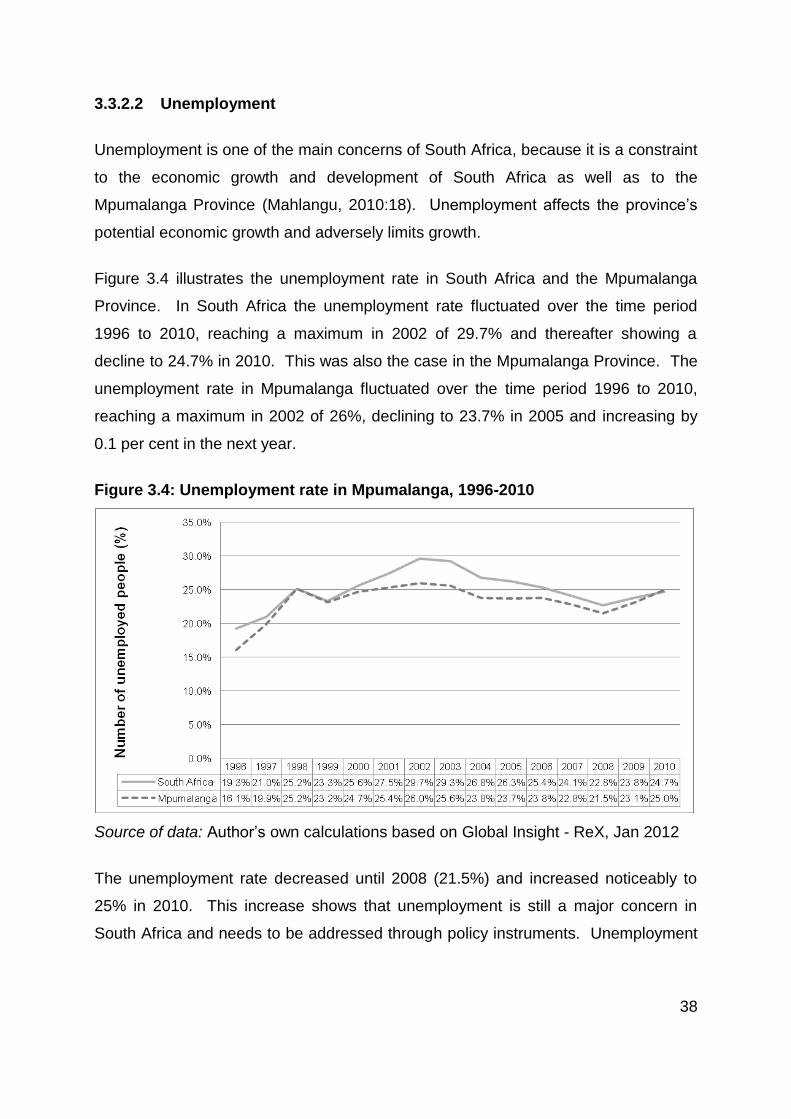
38
3.3.2.2 Unemployment
Unemployment is one of the main concerns of South Africa, because it is a constraint
to the economic growth and development of South Africa as well as to the
Mpumalanga Province (Mahlangu, 2010:18). Unemployment affects the province’s
potential economic growth and adversely limits growth.
Figure 3.4 illustrates the unemployment rate in South Africa and the Mpumalanga
Province. In South Africa the unemployment rate fluctuated over the time period
1996 to 2010, reaching a maximum in 2002 of 29.7% and thereafter showing a
decline to 24.7% in 2010. This was also the case in the Mpumalanga Province. The
unemployment rate in Mpumalanga fluctuated over the time period 1996 to 2010,
reaching a maximum in 2002 of 26%, declining to 23.7% in 2005 and increasing by
0.1 per cent in the next year.
Figure 3.4: Unemployment rate in Mpumalanga, 1996-2010
Source of data: Author’s own calculations based on Global Insight - ReX, Jan 2012
The unemployment rate decreased until 2008 (21.5%) and increased noticeably to
25% in 2010. This increase shows that unemployment is still a major concern in
South Africa and needs to be addressed through policy instruments. Unemployment
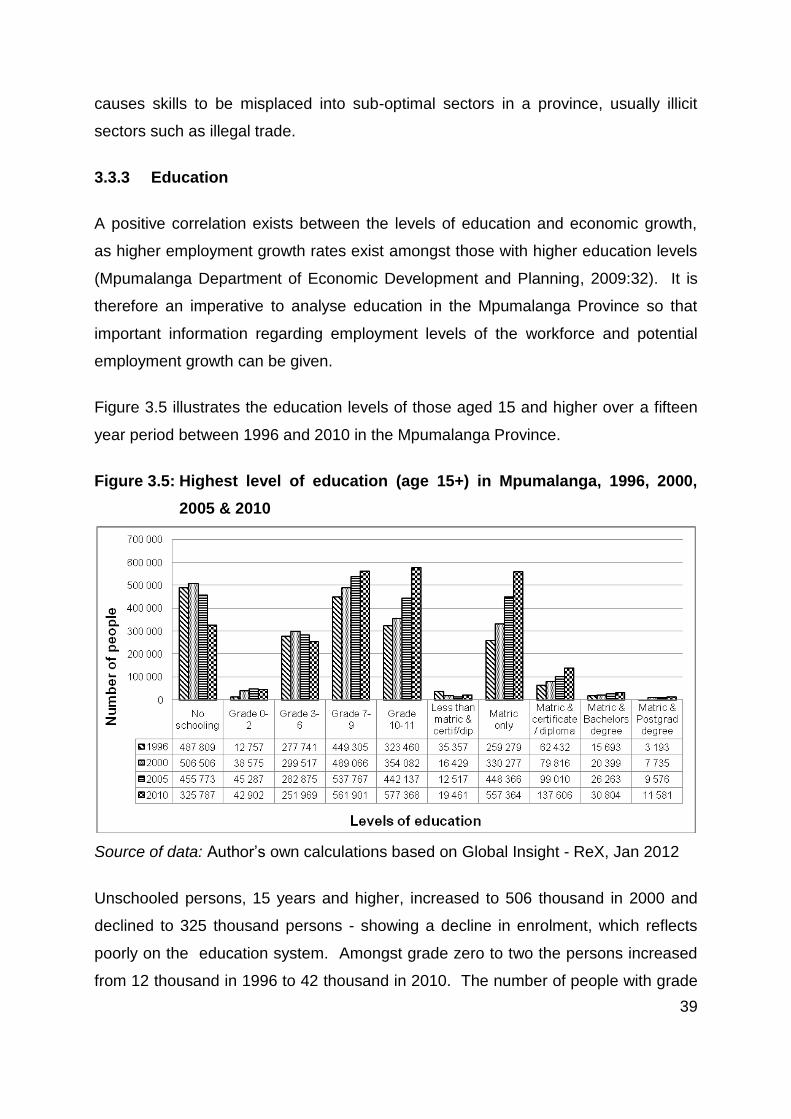
39
causes skills to be misplaced into sub-optimal sectors in a province, usually illicit
sectors such as illegal trade.
3.3.3 Education
A positive correlation exists between the levels of education and economic growth,
as higher employment growth rates exist amongst those with higher education levels
(Mpumalanga Department of Economic Development and Planning, 2009:32). It is
therefore an imperative to analyse education in the Mpumalanga Province so that
important information regarding employment levels of the workforce and potential
employment growth can be given.
Figure 3.5 illustrates the education levels of those aged 15 and higher over a fifteen
year period between 1996 and 2010 in the Mpumalanga Province.
Figure 3.5: Highest level of education (age 15+) in Mpumalanga, 1996, 2000,
2005 & 2010
Source of data: Author’s own calculations based on Global Insight - ReX, Jan 2012
Unschooled persons, 15 years and higher, increased to 506 thousand in 2000 and
declined to 325 thousand persons - showing a decline in enrolment, which reflects
poorly on the education system. Amongst grade zero to two the persons increased
from 12 thousand in 1996 to 42 thousand in 2010. The number of people with grade
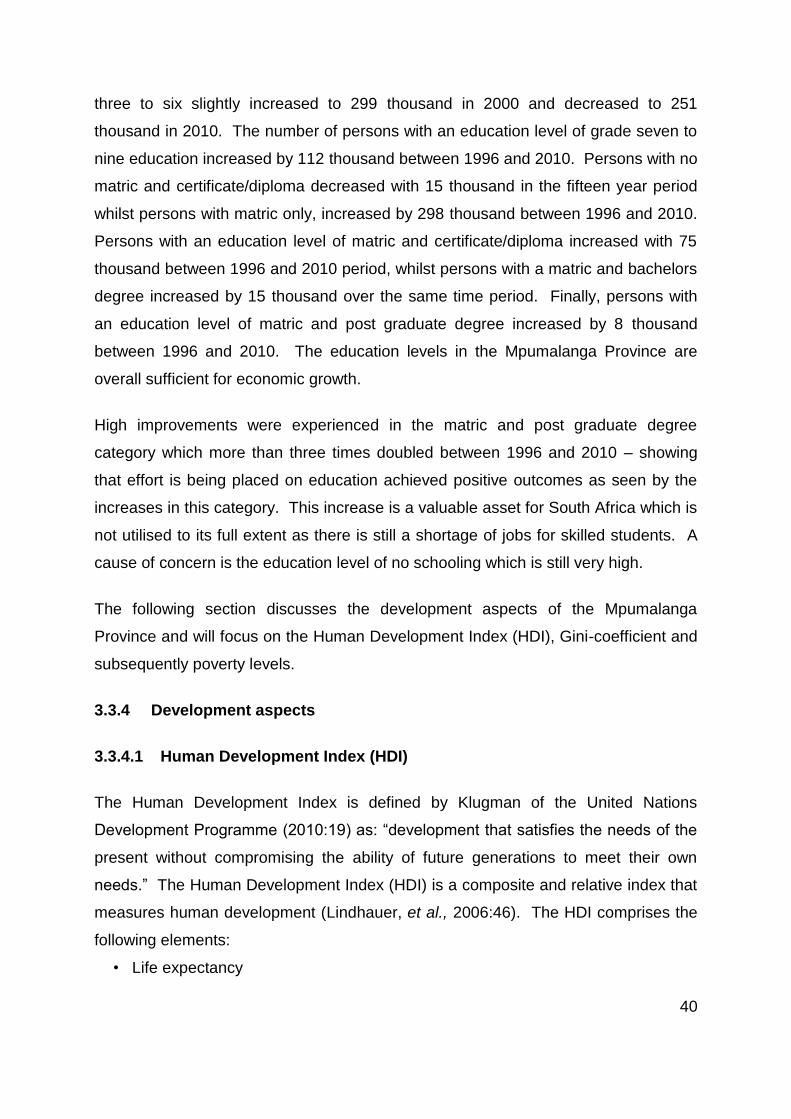
40
three to six slightly increased to 299 thousand in 2000 and decreased to 251
thousand in 2010. The number of persons with an education level of grade seven to
nine education increased by 112 thousand between 1996 and 2010. Persons with no
matric and certificate/diploma decreased with 15 thousand in the fifteen year period
whilst persons with matric only, increased by 298 thousand between 1996 and 2010.
Persons with an education level of matric and certificate/diploma increased with 75
thousand between 1996 and 2010 period, whilst persons with a matric and bachelors
degree increased by 15 thousand over the same time period. Finally, persons with
an education level of matric and post graduate degree increased by 8 thousand
between 1996 and 2010. The education levels in the Mpumalanga Province are
overall sufficient for economic growth.
High improvements were experienced in the matric and post graduate degree
category which more than three times doubled between 1996 and 2010 – showing
that effort is being placed on education achieved positive outcomes as seen by the
increases in this category. This increase is a valuable asset for South Africa which is
not utilised to its full extent as there is still a shortage of jobs for skilled students. A
cause of concern is the education level of no schooling which is still very high.
The following section discusses the development aspects of the Mpumalanga
Province and will focus on the Human Development Index (HDI), Gini-coefficient and
subsequently poverty levels.
3.3.4 Development aspects
3.3.4.1 Human Development Index (HDI)
The Human Development Index is defined by Klugman of the United Nations
Development Programme (2010:19) as: “development that satisfies the needs of the
present without compromising the ability of future generations to meet their own
needs.” The Human Development Index (HDI) is a composite and relative index that
measures human development (Lindhauer, et al., 2006:46). The HDI comprises the
following elements:
• Life expectancy
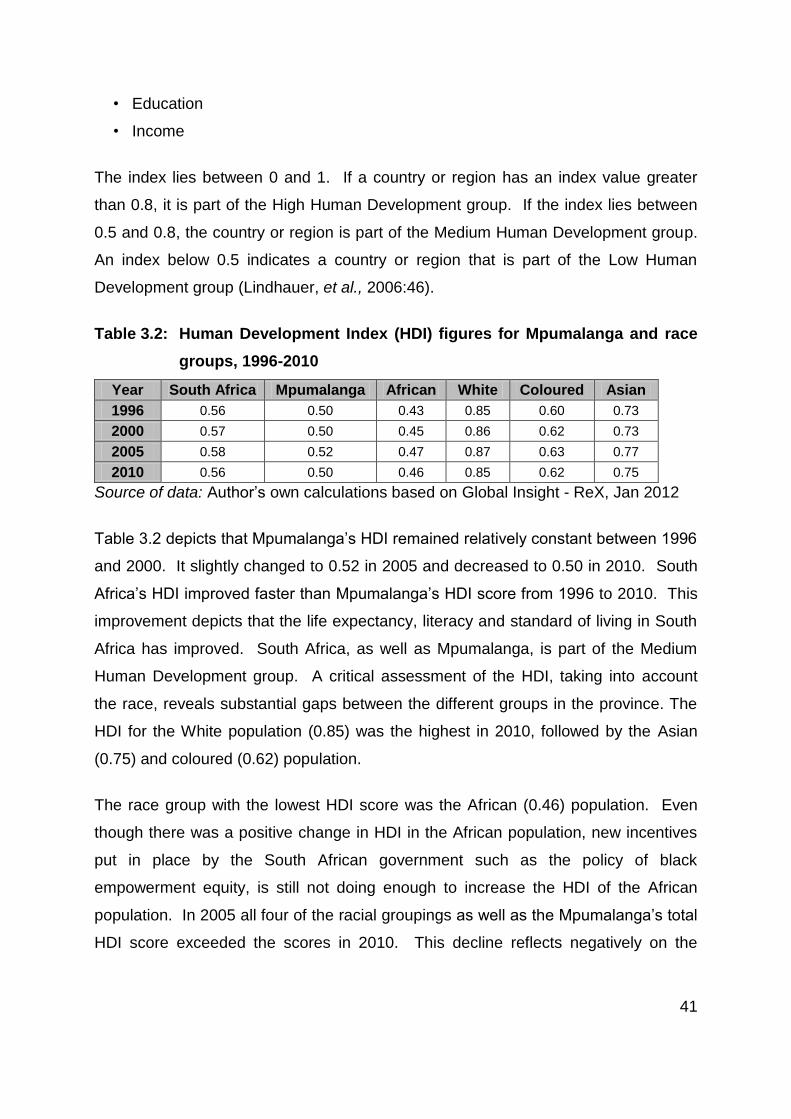
41
• Education
• Income
The index lies between 0 and 1. If a country or region has an index value greater
than 0.8, it is part of the High Human Development group. If the index lies between
0.5 and 0.8, the country or region is part of the Medium Human Development group.
An index below 0.5 indicates a country or region that is part of the Low Human
Development group (Lindhauer, et al., 2006:46).
Table 3.2: Human Development Index (HDI) figures for Mpumalanga and race
groups, 1996-2010
Year South Africa Mpumalanga African White Coloured Asian
1996 0.56 0.50 0.43 0.85 0.60 0.73
2000 0.57 0.50 0.45 0.86 0.62 0.73
2005 0.58 0.52 0.47 0.87 0.63 0.77
2010 0.56 0.50 0.46 0.85 0.62 0.75
Source of data: Author’s own calculations based on Global Insight - ReX, Jan 2012
Table 3.2 depicts that Mpumalanga’s HDI remained relatively constant between 1996
and 2000. It slightly changed to 0.52 in 2005 and decreased to 0.50 in 2010. South
Africa’s HDI improved faster than Mpumalanga’s HDI score from 1996 to 2010. This
improvement depicts that the life expectancy, literacy and standard of living in South
Africa has improved. South Africa, as well as Mpumalanga, is part of the Medium
Human Development group. A critical assessment of the HDI, taking into account
the race, reveals substantial gaps between the different groups in the province. The
HDI for the White population (0.85) was the highest in 2010, followed by the Asian
(0.75) and coloured (0.62) population.
The race group with the lowest HDI score was the African (0.46) population. Even
though there was a positive change in HDI in the African population, new incentives
put in place by the South African government such as the policy of black
empowerment equity, is still not doing enough to increase the HDI of the African
population. In 2005 all four of the racial groupings as well as the Mpumalanga’s total
HDI score exceeded the scores in 2010. This decline reflects negatively on the
42
Mpumalanga Province and overall in South Africa, showing that literacy, income and
life expectancy has declined.
3.3.4.2 Gini-coefficient
The Gini-coefficient is a measure of income or wealth distributions amongst the
population. The coefficient varies from 0 to 1. If there is perfect income distribution
or equality, all households earn equal income and the Gini-coefficient will be zero.
The Gini-coefficient will be one (Lindhauer, et al., 2006:196) if one household earns
all the income and another household earns nothing (perfectly unequal).
The Gini-coefficient of both South Africa and Mpumalanga stayed close together
between 1996 and 2010. The Gini-coefficient for Mpumalanga increased from 0.61
in 2006 to 0.64 to 2010. Because all of the scores are nearer to one, this shows that
most of the wealth or income is earned by only a fewer households relative to the
population.
Figure 3.6: Gini-Coefficient for Mpumalanga, 1996, 2000, 2005 & 2010
Source of data: Author’s own calculations based on Global Insight - ReX, Jan 2012
The issue of unequal wealth distribution amongst households is a difficult issue to
address as different points of view exist amongst households. For example, the
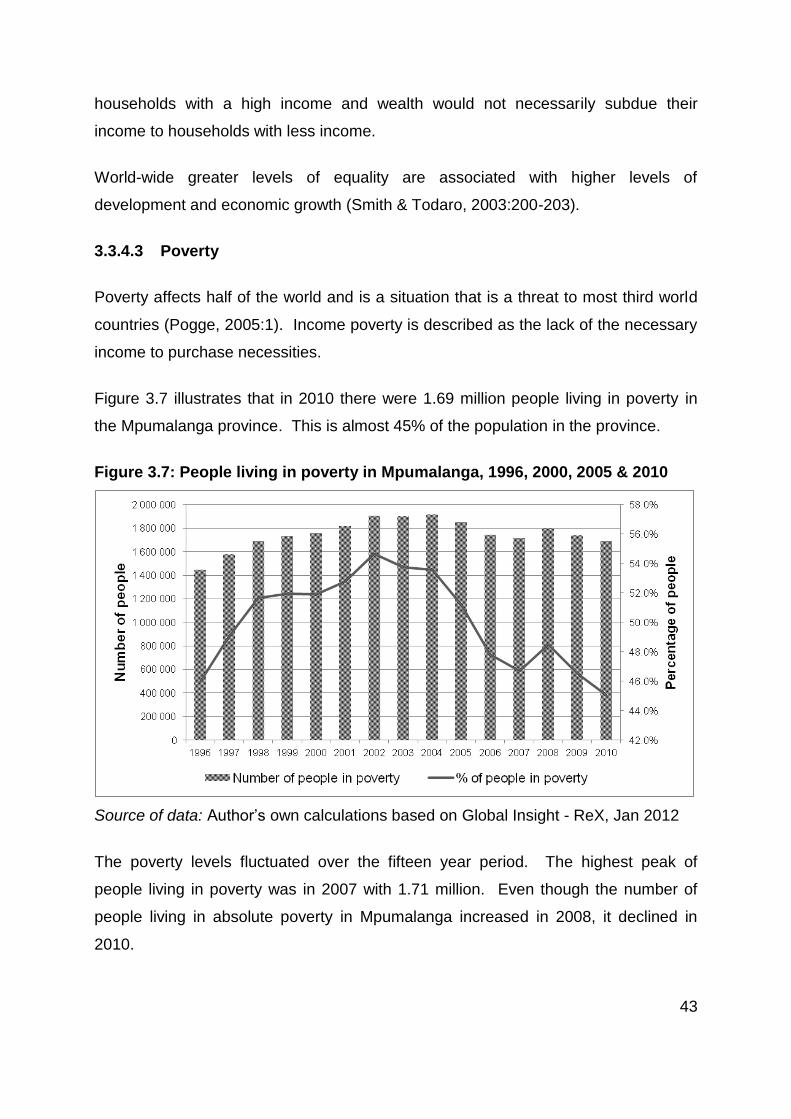
43
households with a high income and wealth would not necessarily subdue their
income to households with less income.
World-wide greater levels of equality are associated with higher levels of
development and economic growth (Smith & Todaro, 2003:200-203).
3.3.4.3 Poverty
Poverty affects half of the world and is a situation that is a threat to most third world
countries (Pogge, 2005:1). Income poverty is described as the lack of the necessary
income to purchase necessities.
Figure 3.7 illustrates that in 2010 there were 1.69 million people living in poverty in
the Mpumalanga province. This is almost 45% of the population in the province.
Figure 3.7: People living in poverty in Mpumalanga, 1996, 2000, 2005 & 2010
Source of data: Author’s own calculations based on Global Insight - ReX, Jan 2012
The poverty levels fluctuated over the fifteen year period. The highest peak of
people living in poverty was in 2007 with 1.71 million. Even though the number of
people living in absolute poverty in Mpumalanga increased in 2008, it declined in
2010.
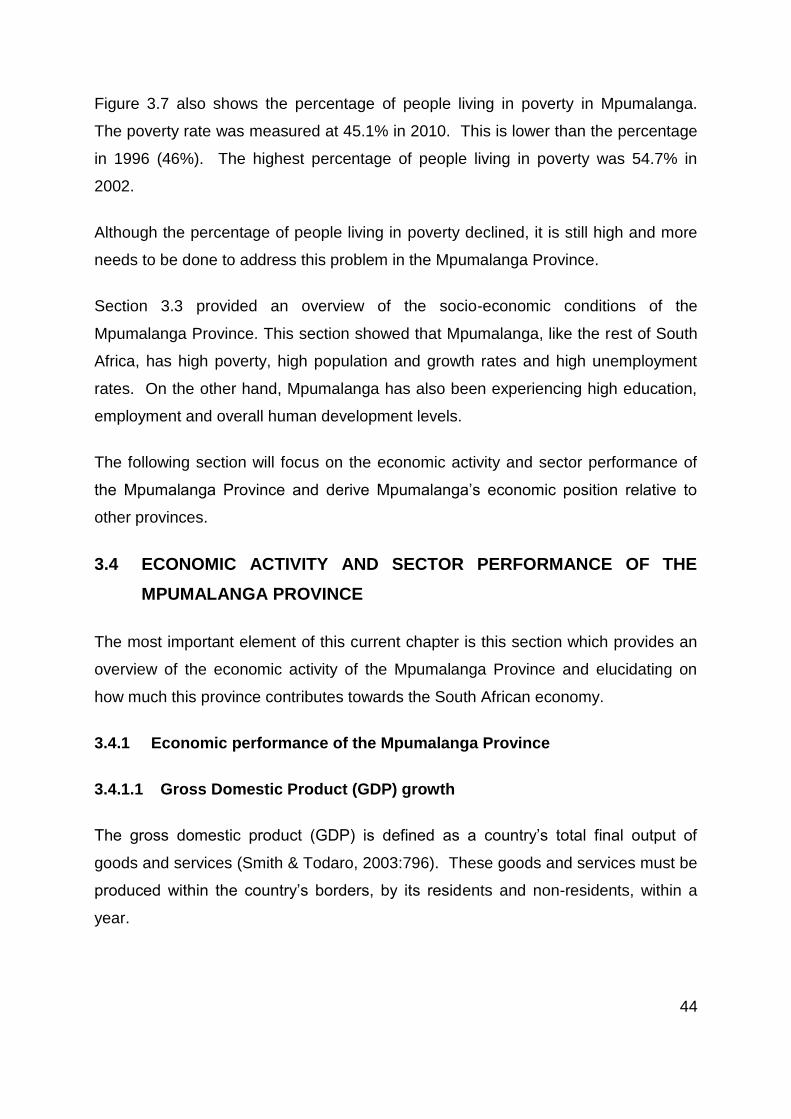
44
Figure 3.7 also shows the percentage of people living in poverty in Mpumalanga.
The poverty rate was measured at 45.1% in 2010. This is lower than the percentage
in 1996 (46%). The highest percentage of people living in poverty was 54.7% in
2002.
Although the percentage of people living in poverty declined, it is still high and more
needs to be done to address this problem in the Mpumalanga Province.
Section 3.3 provided an overview of the socio-economic conditions of the
Mpumalanga Province. This section showed that Mpumalanga, like the rest of South
Africa, has high poverty, high population and growth rates and high unemployment
rates. On the other hand, Mpumalanga has also been experiencing high education,
employment and overall human development levels.
The following section will focus on the economic activity and sector performance of
the Mpumalanga Province and derive Mpumalanga’s economic position relative to
other provinces.
3.4 ECONOMIC ACTIVITY AND SECTOR PERFORMANCE OF THE
MPUMALANGA PROVINCE
The most important element of this current chapter is this section which provides an
overview of the economic activity of the Mpumalanga Province and elucidating on
how much this province contributes towards the South African economy.
3.4.1 Economic performance of the Mpumalanga Province
3.4.1.1 Gross Domestic Product (GDP) growth
The gross domestic product (GDP) is defined as a country’s total final output of
goods and services (Smith & Todaro, 2003:796). These goods and services must be
produced within the country’s borders, by its residents and non-residents, within a
year.
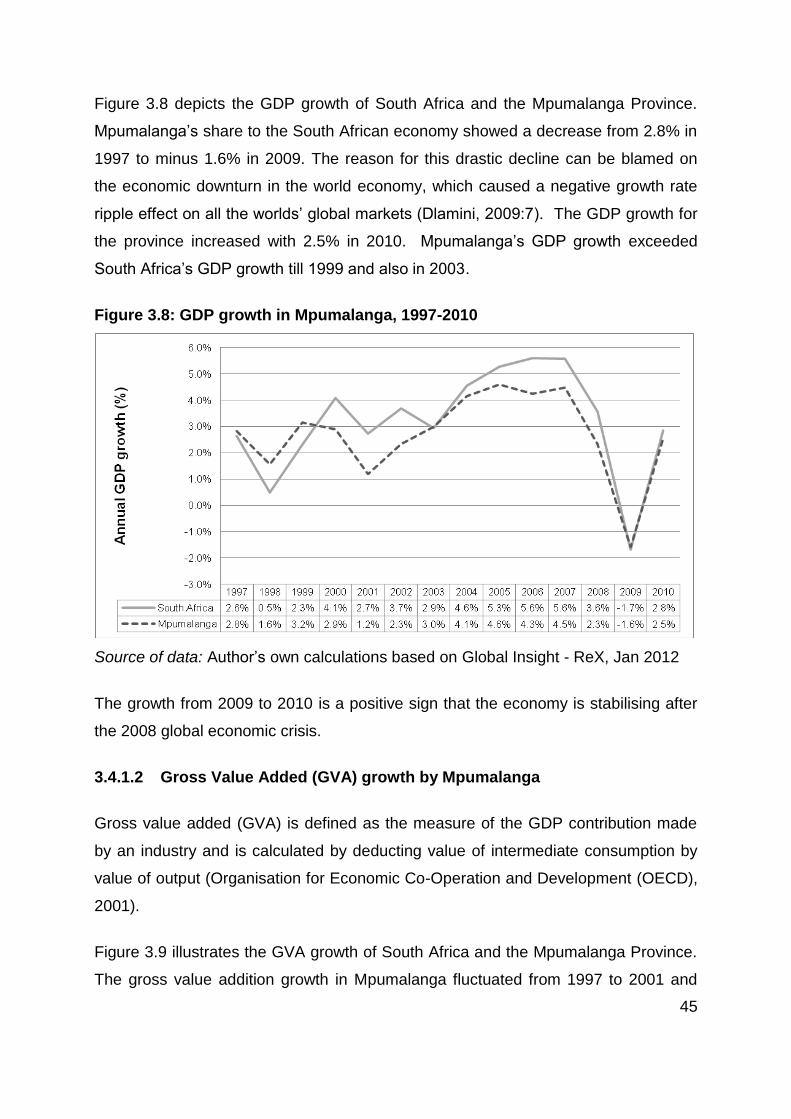
45
Figure 3.8 depicts the GDP growth of South Africa and the Mpumalanga Province.
Mpumalanga’s share to the South African economy showed a decrease from 2.8% in
1997 to minus 1.6% in 2009. The reason for this drastic decline can be blamed on
the economic downturn in the world economy, which caused a negative growth rate
ripple effect on all the worlds’ global markets (Dlamini, 2009:7). The GDP growth for
the province increased with 2.5% in 2010. Mpumalanga’s GDP growth exceeded
South Africa’s GDP growth till 1999 and also in 2003.
Figure 3.8: GDP growth in Mpumalanga, 1997-2010
Source of data: Author’s own calculations based on Global Insight - ReX, Jan 2012
The growth from 2009 to 2010 is a positive sign that the economy is stabilising after
the 2008 global economic crisis.
3.4.1.2 Gross Value Added (GVA) growth by Mpumalanga
Gross value added (GVA) is defined as the measure of the GDP contribution made
by an industry and is calculated by deducting value of intermediate consumption by
value of output (Organisation for Economic Co-Operation and Development (OECD),
2001).
Figure 3.9 illustrates the GVA growth of South Africa and the Mpumalanga Province.
The gross value addition growth in Mpumalanga fluctuated from 1997 to 2001 and
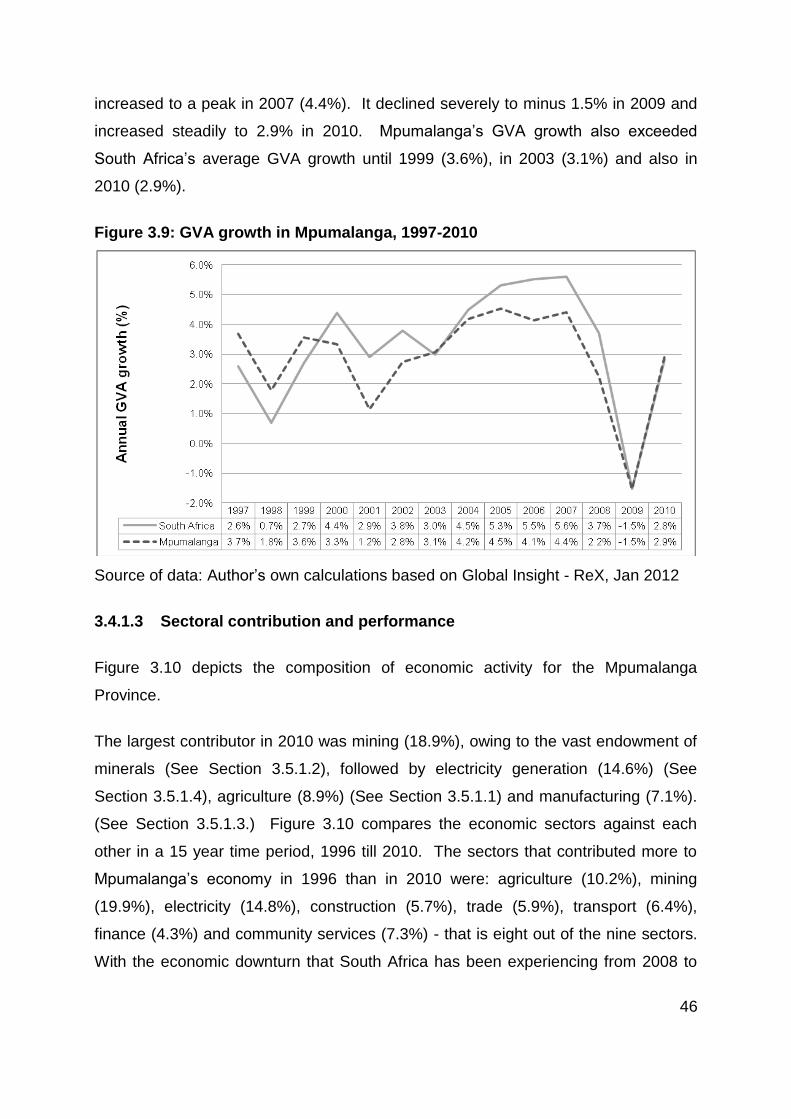
46
increased to a peak in 2007 (4.4%). It declined severely to minus 1.5% in 2009 and
increased steadily to 2.9% in 2010. Mpumalanga’s GVA growth also exceeded
South Africa’s average GVA growth until 1999 (3.6%), in 2003 (3.1%) and also in
2010 (2.9%).
Figure 3.9: GVA growth in Mpumalanga, 1997-2010
Source of data: Author’s own calculations based on Global Insight - ReX, Jan 2012
3.4.1.3 Sectoral contribution and performance
Figure 3.10 depicts the composition of economic activity for the Mpumalanga
Province.
The largest contributor in 2010 was mining (18.9%), owing to the vast endowment of
minerals (See Section 3.5.1.2), followed by electricity generation (14.6%) (See
Section 3.5.1.4), agriculture (8.9%) (See Section 3.5.1.1) and manufacturing (7.1%).
(See Section 3.5.1.3.) Figure 3.10 compares the economic sectors against each
other in a 15 year time period, 1996 till 2010. The sectors that contributed more to
Mpumalanga’s economy in 1996 than in 2010 were: agriculture (10.2%), mining
(19.9%), electricity (14.8%), construction (5.7%), trade (5.9%), transport (6.4%),
finance (4.3%) and community services (7.3%) - that is eight out of the nine sectors.
With the economic downturn that South Africa has been experiencing from 2008 to
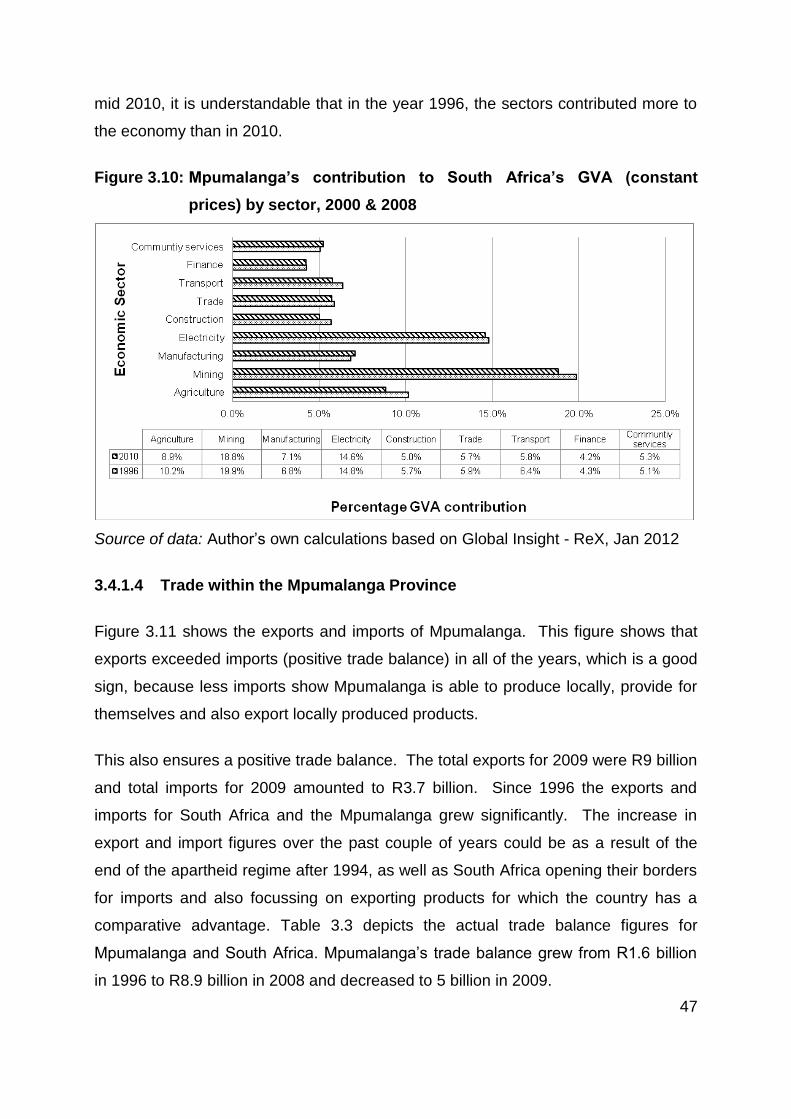
47
mid 2010, it is understandable that in the year 1996, the sectors contributed more to
the economy than in 2010.
Figure 3.10: Mpumalanga’s contribution to South Africa’s GVA (constant
prices) by sector, 2000 & 2008
Source of data: Author’s own calculations based on Global Insight - ReX, Jan 2012
3.4.1.4 Trade within the Mpumalanga Province
Figure 3.11 shows the exports and imports of Mpumalanga. This figure shows that
exports exceeded imports (positive trade balance) in all of the years, which is a good
sign, because less imports show Mpumalanga is able to produce locally, provide for
themselves and also export locally produced products.
This also ensures a positive trade balance. The total exports for 2009 were R9 billion
and total imports for 2009 amounted to R3.7 billion. Since 1996 the exports and
imports for South Africa and the Mpumalanga grew significantly. The increase in
export and import figures over the past couple of years could be as a result of the
end of the apartheid regime after 1994, as well as South Africa opening their borders
for imports and also focussing on exporting products for which the country has a
comparative advantage. Table 3.3 depicts the actual trade balance figures for
Mpumalanga and South Africa. Mpumalanga’s trade balance grew from R1.6 billion
in 1996 to R8.9 billion in 2008 and decreased to 5 billion in 2009.
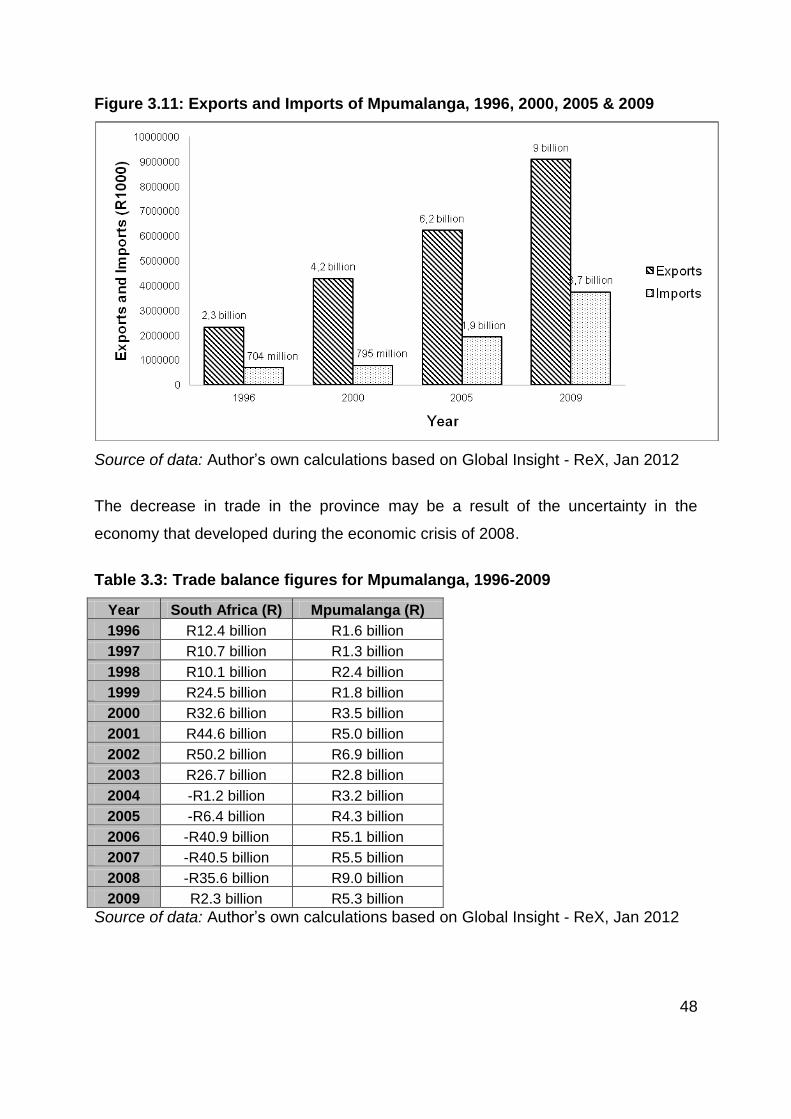
48
Figure 3.11: Exports and Imports of Mpumalanga, 1996, 2000, 2005 & 2009
Source of data: Author’s own calculations based on Global Insight - ReX, Jan 2012
The decrease in trade in the province may be a result of the uncertainty in the
economy that developed during the economic crisis of 2008.
Table 3.3: Trade balance figures for Mpumalanga, 1996-2009
Year South Africa (R) Mpumalanga (R)
1996 R12.4 billion R1.6 billion
1997 R10.7 billion R1.3 billion
1998 R10.1 billion R2.4 billion
1999 R24.5 billion R1.8 billion
2000 R32.6 billion R3.5 billion
2001 R44.6 billion R5.0 billion
2002 R50.2 billion R6.9 billion
2003 R26.7 billion R2.8 billion
2004 -R1.2 billion R3.2 billion
2005 -R6.4 billion R4.3 billion
2006 -R40.9 billion R5.1 billion
2007 -R40.5 billion R5.5 billion
2008 -R35.6 billion R9.0 billion
2009 R2.3 billion R5.3 billion
Source of data: Author’s own calculations based on Global Insight - ReX, Jan 2012
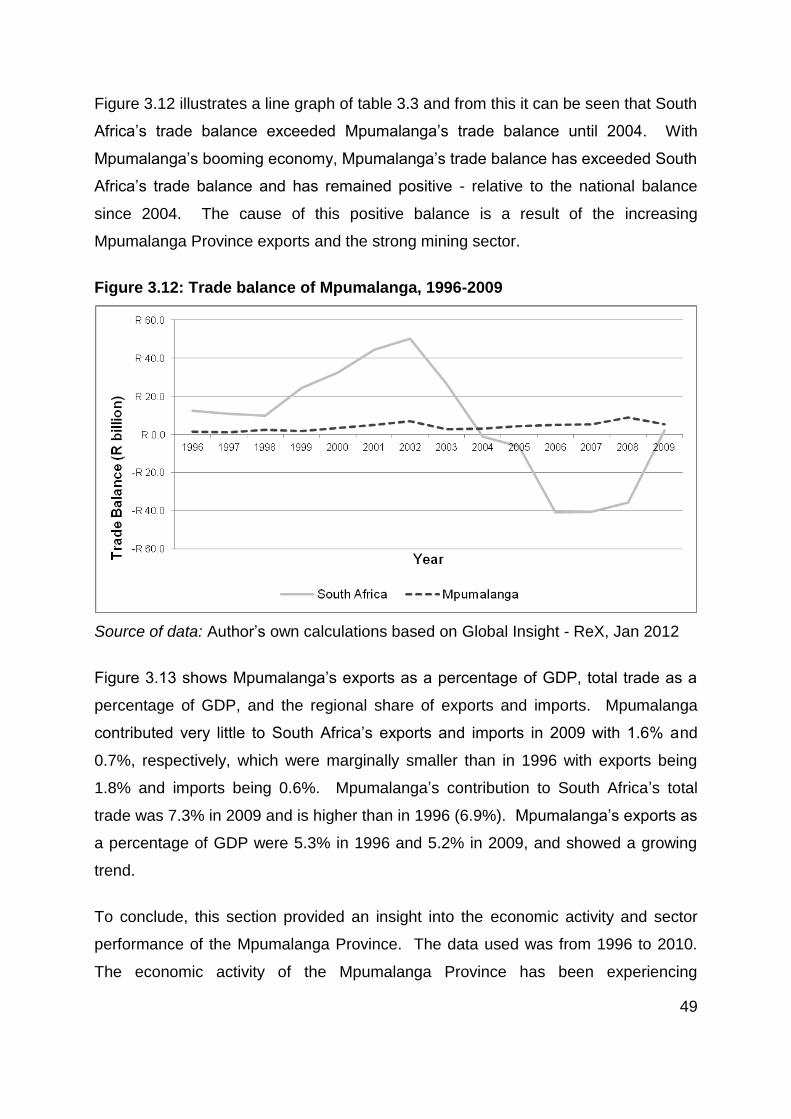
49
Figure 3.12 illustrates a line graph of table 3.3 and from this it can be seen that South
Africa’s trade balance exceeded Mpumalanga’s trade balance until 2004. With
Mpumalanga’s booming economy, Mpumalanga’s trade balance has exceeded South
Africa’s trade balance and has remained positive - relative to the national balance
since 2004. The cause of this positive balance is a result of the increasing
Mpumalanga Province exports and the strong mining sector.
Figure 3.12: Trade balance of Mpumalanga, 1996-2009
Source of data: Author’s own calculations based on Global Insight - ReX, Jan 2012
Figure 3.13 shows Mpumalanga’s exports as a percentage of GDP, total trade as a
percentage of GDP, and the regional share of exports and imports. Mpumalanga
contributed very little to South Africa’s exports and imports in 2009 with 1.6% and
0.7%, respectively, which were marginally smaller than in 1996 with exports being
1.8% and imports being 0.6%. Mpumalanga’s contribution to South Africa’s total
trade was 7.3% in 2009 and is higher than in 1996 (6.9%). Mpumalanga’s exports as
a percentage of GDP were 5.3% in 1996 and 5.2% in 2009, and showed a growing
trend.
To conclude, this section provided an insight into the economic activity and sector
performance of the Mpumalanga Province. The data used was from 1996 to 2010.
The economic activity of the Mpumalanga Province has been experiencing
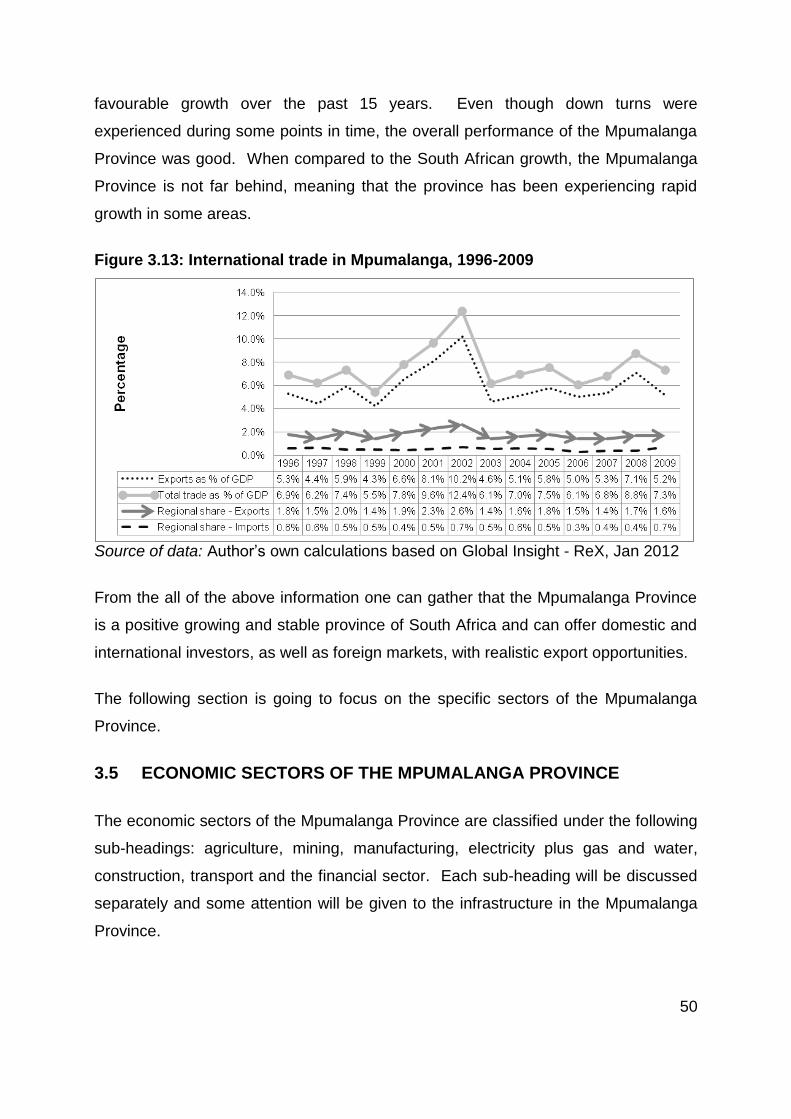
50
favourable growth over the past 15 years. Even though down turns were
experienced during some points in time, the overall performance of the Mpumalanga
Province was good. When compared to the South African growth, the Mpumalanga
Province is not far behind, meaning that the province has been experiencing rapid
growth in some areas.
Figure 3.13: International trade in Mpumalanga, 1996-2009
Source of data: Author’s own calculations based on Global Insight - ReX, Jan 2012
From the all of the above information one can gather that the Mpumalanga Province
is a positive growing and stable province of South Africa and can offer domestic and
international investors, as well as foreign markets, with realistic export opportunities.
The following section is going to focus on the specific sectors of the Mpumalanga
Province.
3.5 ECONOMIC SECTORS OF THE MPUMALANGA PROVINCE
The economic sectors of the Mpumalanga Province are classified under the following
sub-headings: agriculture, mining, manufacturing, electricity plus gas and water,
construction, transport and the financial sector. Each sub-heading will be discussed
separately and some attention will be given to the infrastructure in the Mpumalanga
Province.
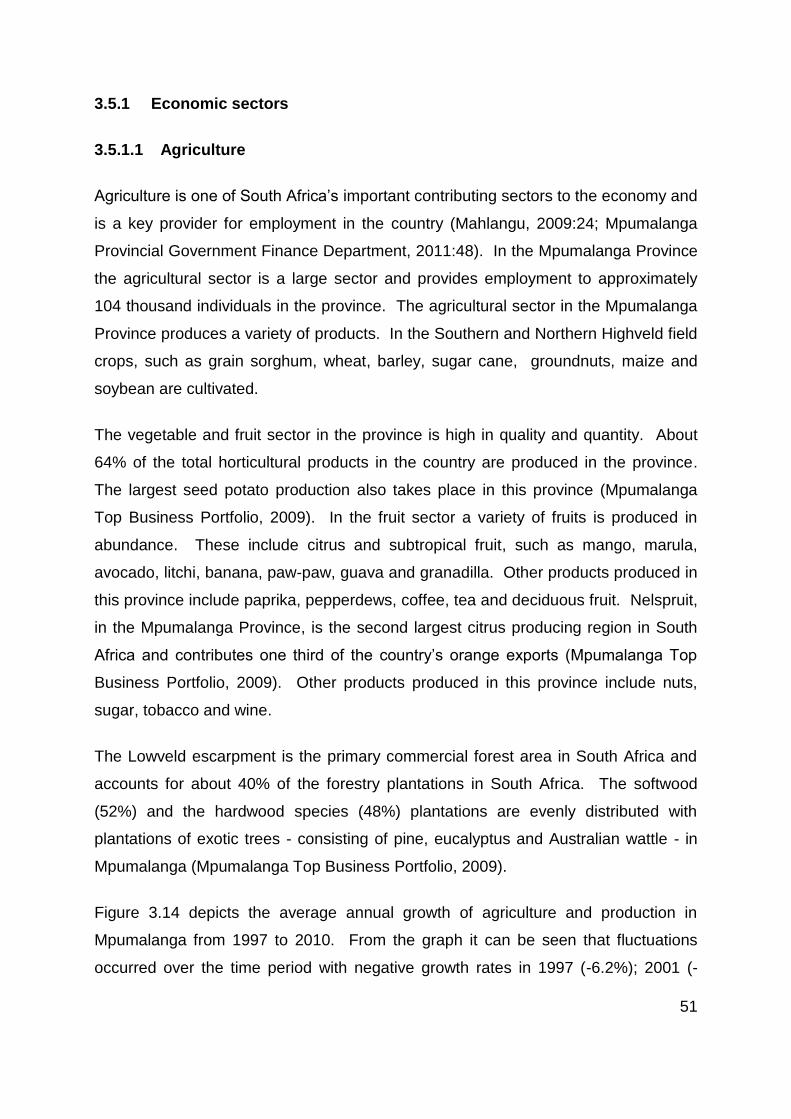
51
3.5.1 Economic sectors
3.5.1.1 Agriculture
Agriculture is one of South Africa’s important contributing sectors to the economy and
is a key provider for employment in the country (Mahlangu, 2009:24; Mpumalanga
Provincial Government Finance Department, 2011:48). In the Mpumalanga Province
the agricultural sector is a large sector and provides employment to approximately
104 thousand individuals in the province. The agricultural sector in the Mpumalanga
Province produces a variety of products. In the Southern and Northern Highveld field
crops, such as grain sorghum, wheat, barley, sugar cane, groundnuts, maize and
soybean are cultivated.
The vegetable and fruit sector in the province is high in quality and quantity. About
64% of the total horticultural products in the country are produced in the province.
The largest seed potato production also takes place in this province (Mpumalanga
Top Business Portfolio, 2009). In the fruit sector a variety of fruits is produced in
abundance. These include citrus and subtropical fruit, such as mango, marula,
avocado, litchi, banana, paw-paw, guava and granadilla. Other products produced in
this province include paprika, pepperdews, coffee, tea and deciduous fruit. Nelspruit,
in the Mpumalanga Province, is the second largest citrus producing region in South
Africa and contributes one third of the country’s orange exports (Mpumalanga Top
Business Portfolio, 2009). Other products produced in this province include nuts,
sugar, tobacco and wine.
The Lowveld escarpment is the primary commercial forest area in South Africa and
accounts for about 40% of the forestry plantations in South Africa. The softwood
(52%) and the hardwood species (48%) plantations are evenly distributed with
plantations of exotic trees - consisting of pine, eucalyptus and Australian wattle - in
Mpumalanga (Mpumalanga Top Business Portfolio, 2009).
Figure 3.14 depicts the average annual growth of agriculture and production in
Mpumalanga from 1997 to 2010. From the graph it can be seen that fluctuations
occurred over the time period with negative growth rates in 1997 (-6.2%); 2001 (-
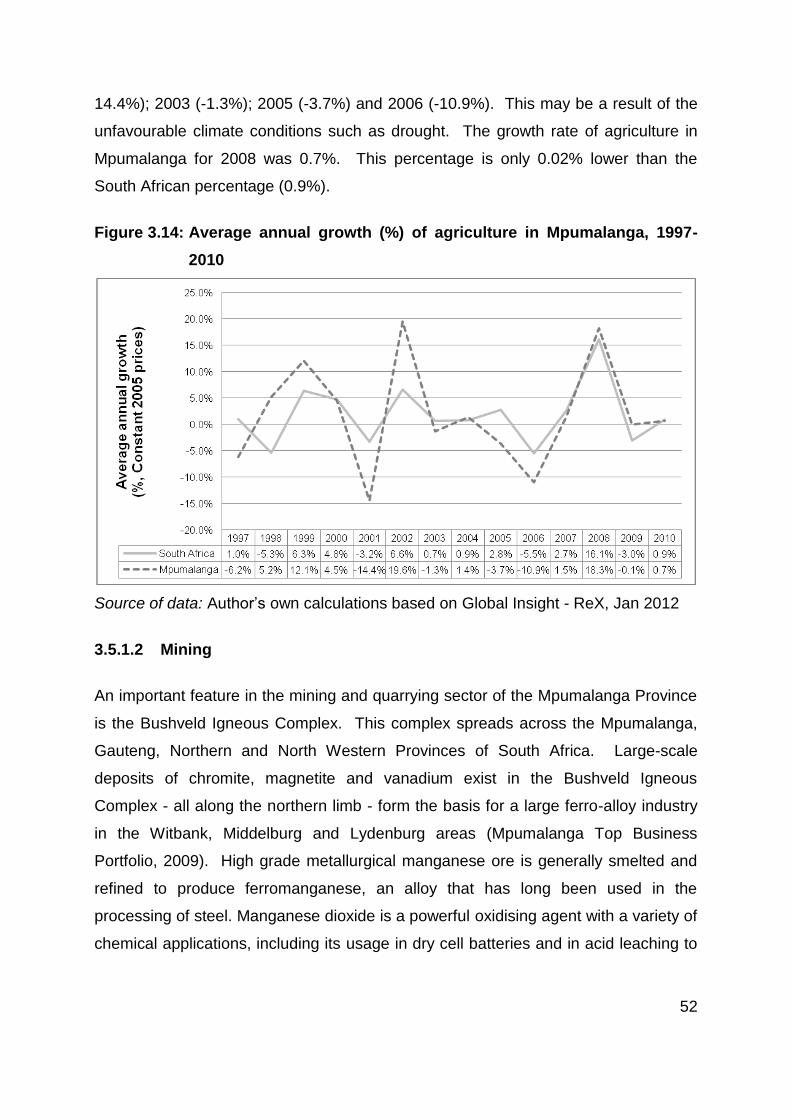
52
14.4%); 2003 (-1.3%); 2005 (-3.7%) and 2006 (-10.9%). This may be a result of the
unfavourable climate conditions such as drought. The growth rate of agriculture in
Mpumalanga for 2008 was 0.7%. This percentage is only 0.02% lower than the
South African percentage (0.9%).
Figure 3.14: Average annual growth (%) of agriculture in Mpumalanga, 1997-
2010
Source of data: Author’s own calculations based on Global Insight - ReX, Jan 2012
3.5.1.2 Mining
An important feature in the mining and quarrying sector of the Mpumalanga Province
is the Bushveld Igneous Complex. This complex spreads across the Mpumalanga,
Gauteng, Northern and North Western Provinces of South Africa. Large-scale
deposits of chromite, magnetite and vanadium exist in the Bushveld Igneous
Complex - all along the northern limb - form the basis for a large ferro-alloy industry
in the Witbank, Middelburg and Lydenburg areas (Mpumalanga Top Business
Portfolio, 2009). High grade metallurgical manganese ore is generally smelted and
refined to produce ferromanganese, an alloy that has long been used in the
processing of steel. Manganese dioxide is a powerful oxidising agent with a variety of
chemical applications, including its usage in dry cell batteries and in acid leaching to
53
recover uranium and zinc from their ores (Mpumalanga Top Business Portfolio,
2009).
Small-scale mining of gold is still taking place in the Barberton area and recent
exploration in the area unearthed carlin-type deposits that have the potential for gold
extraction using low-cost, low-risk heap leach technology (Mpumalanga Top
Business Portfolio, 2009).
Coal mining in the Mpumalanga Province accounts for 83% of South African coal
production and exports account for 28% of production (Mpumalanga Top Business
Portfolio, 2009). Witbank, in the Mpumalanga Province, is the biggest coal producer
in all of Africa (Mpumalanga Top Business Portfolio, 2009). South Africa has 19
official coal fields and almost 70% of recoverable reserves lie in the Highveld,
Waterberg, and Witbank fields of the Mpumalanga Province (Mpumalanga Top
Business Portfolio, 2009). A driving force in the province is the demand for coal for
electricity generation and exploration of other minerals. This demand is placing
enormous increasing pressure on the natural environment, such as the mining of
non-renewable fossil fuels and burning of coal to generate electricity (Cowden,
2005).
The mining industry is an important contributor to Mpumalanga’s economy in terms of
economic production, export and local sales revenues and employment. Mining will
continue to be an important sector either independently, or as a result of its linkages
with other critical sectors, such as electricity and manufacturing. There are a variety
of opportunities for the establishment of new mines in the province, as well as for the
further beneficiation of the minerals being mined (Mpumalanga Top Business
Portfolio, 2009).
The mining industry also has negative environmental impacts and this includes the
loss of biodiversity due to the transformation of natural habitats and ecosystems
(Cowden, 2005). Because the mining processes usually require large amounts of
water, this creates a huge strain on the available water resources. In addition,
surface and groundwater pollution often results from acid mine drainage. Other
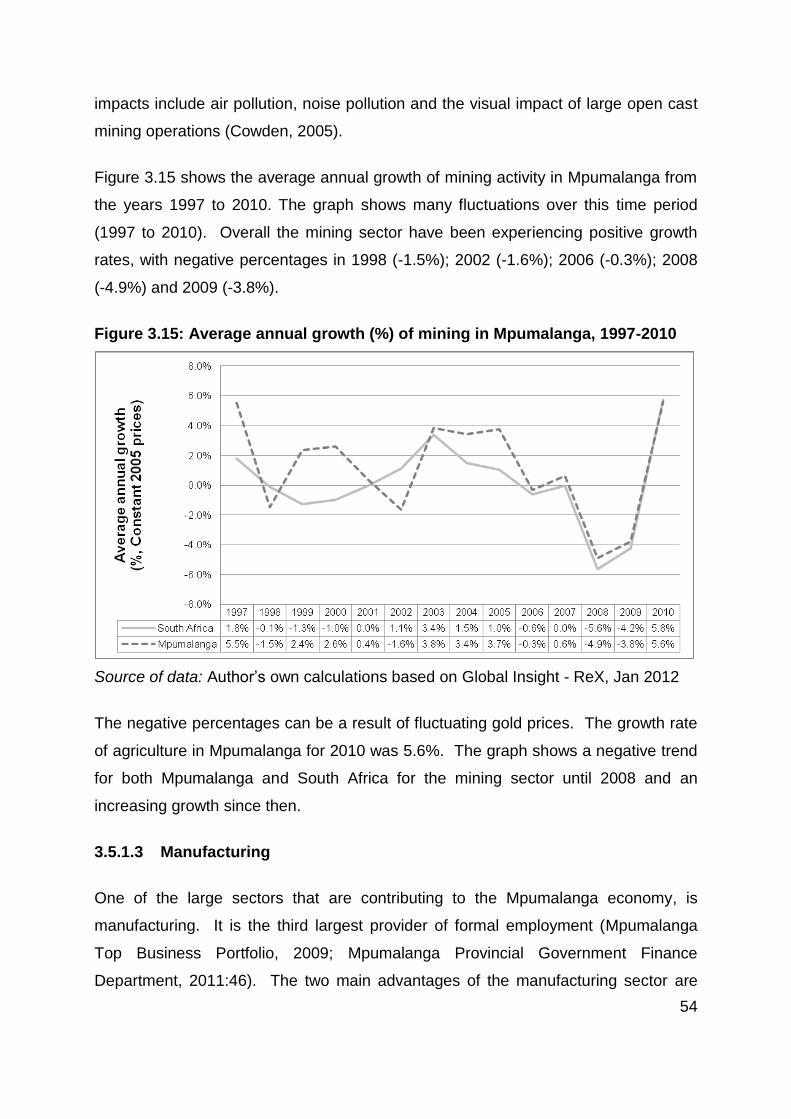
54
impacts include air pollution, noise pollution and the visual impact of large open cast
mining operations (Cowden, 2005).
Figure 3.15 shows the average annual growth of mining activity in Mpumalanga from
the years 1997 to 2010. The graph shows many fluctuations over this time period
(1997 to 2010). Overall the mining sector have been experiencing positive growth
rates, with negative percentages in 1998 (-1.5%); 2002 (-1.6%); 2006 (-0.3%); 2008
(-4.9%) and 2009 (-3.8%).
Figure 3.15: Average annual growth (%) of mining in Mpumalanga, 1997-2010
Source of data: Author’s own calculations based on Global Insight - ReX, Jan 2012
The negative percentages can be a result of fluctuating gold prices. The growth rate
of agriculture in Mpumalanga for 2010 was 5.6%. The graph shows a negative trend
for both Mpumalanga and South Africa for the mining sector until 2008 and an
increasing growth since then.
3.5.1.3 Manufacturing
One of the large sectors that are contributing to the Mpumalanga economy, is
manufacturing. It is the third largest provider of formal employment (Mpumalanga
Top Business Portfolio, 2009; Mpumalanga Provincial Government Finance
Department, 2011:46). The two main advantages of the manufacturing sector are
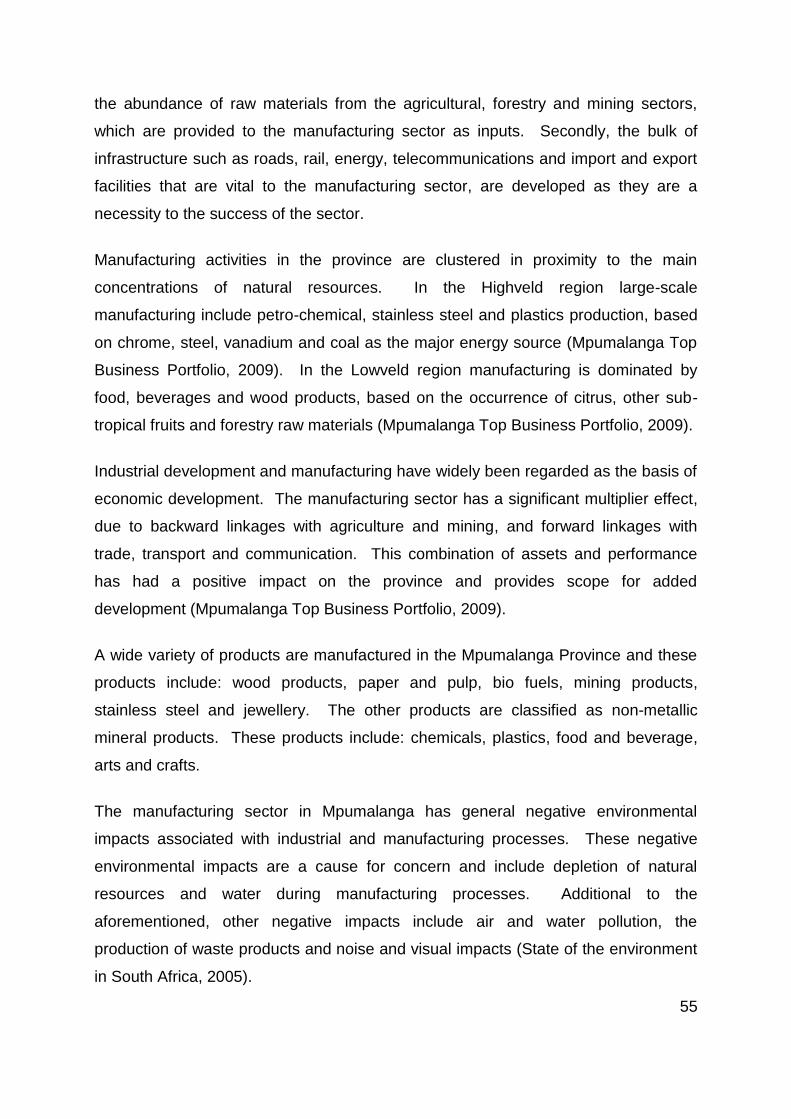
55
the abundance of raw materials from the agricultural, forestry and mining sectors,
which are provided to the manufacturing sector as inputs. Secondly, the bulk of
infrastructure such as roads, rail, energy, telecommunications and import and export
facilities that are vital to the manufacturing sector, are developed as they are a
necessity to the success of the sector.
Manufacturing activities in the province are clustered in proximity to the main
concentrations of natural resources. In the Highveld region large-scale
manufacturing include petro-chemical, stainless steel and plastics production, based
on chrome, steel, vanadium and coal as the major energy source (Mpumalanga Top
Business Portfolio, 2009). In the Lowveld region manufacturing is dominated by
food, beverages and wood products, based on the occurrence of citrus, other sub-
tropical fruits and forestry raw materials (Mpumalanga Top Business Portfolio, 2009).
Industrial development and manufacturing have widely been regarded as the basis of
economic development. The manufacturing sector has a significant multiplier effect,
due to backward linkages with agriculture and mining, and forward linkages with
trade, transport and communication. This combination of assets and performance
has had a positive impact on the province and provides scope for added
development (Mpumalanga Top Business Portfolio, 2009).
A wide variety of products are manufactured in the Mpumalanga Province and these
products include: wood products, paper and pulp, bio fuels, mining products,
stainless steel and jewellery. The other products are classified as non-metallic
mineral products. These products include: chemicals, plastics, food and beverage,
arts and crafts.
The manufacturing sector in Mpumalanga has general negative environmental
impacts associated with industrial and manufacturing processes. These negative
environmental impacts are a cause for concern and include depletion of natural
resources and water during manufacturing processes. Additional to the
aforementioned, other negative impacts include air and water pollution, the
production of waste products and noise and visual impacts (State of the environment
in South Africa, 2005).
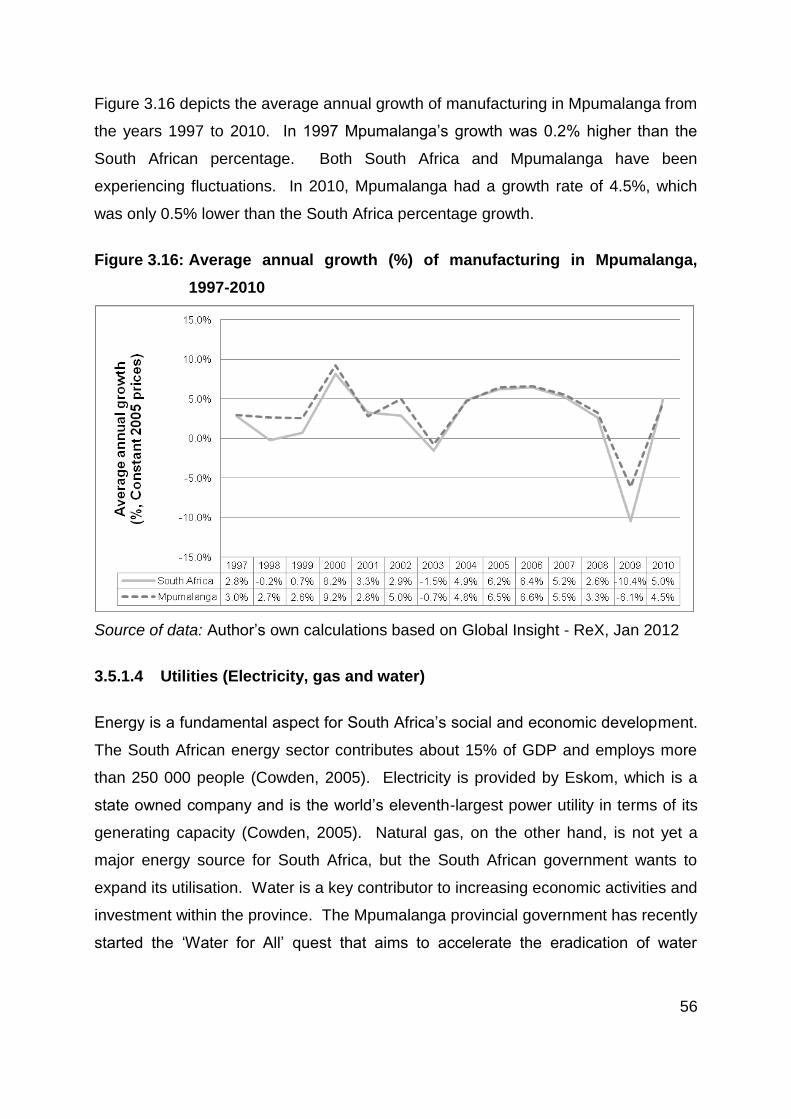
56
Figure 3.16 depicts the average annual growth of manufacturing in Mpumalanga from
the years 1997 to 2010. In 1997 Mpumalanga’s growth was 0.2% higher than the
South African percentage. Both South Africa and Mpumalanga have been
experiencing fluctuations. In 2010, Mpumalanga had a growth rate of 4.5%, which
was only 0.5% lower than the South Africa percentage growth.
Figure 3.16: Average annual growth (%) of manufacturing in Mpumalanga,
1997-2010
Source of data: Author’s own calculations based on Global Insight - ReX, Jan 2012
3.5.1.4 Utilities (Electricity, gas and water)
Energy is a fundamental aspect for South Africa’s social and economic development.
The South African energy sector contributes about 15% of GDP and employs more
than 250 000 people (Cowden, 2005). Electricity is provided by Eskom, which is a
state owned company and is the world’s eleventh-largest power utility in terms of its
generating capacity (Cowden, 2005). Natural gas, on the other hand, is not yet a
major energy source for South Africa, but the South African government wants to
expand its utilisation. Water is a key contributor to increasing economic activities and
investment within the province. The Mpumalanga provincial government has recently
started the ‘Water for All’ quest that aims to accelerate the eradication of water
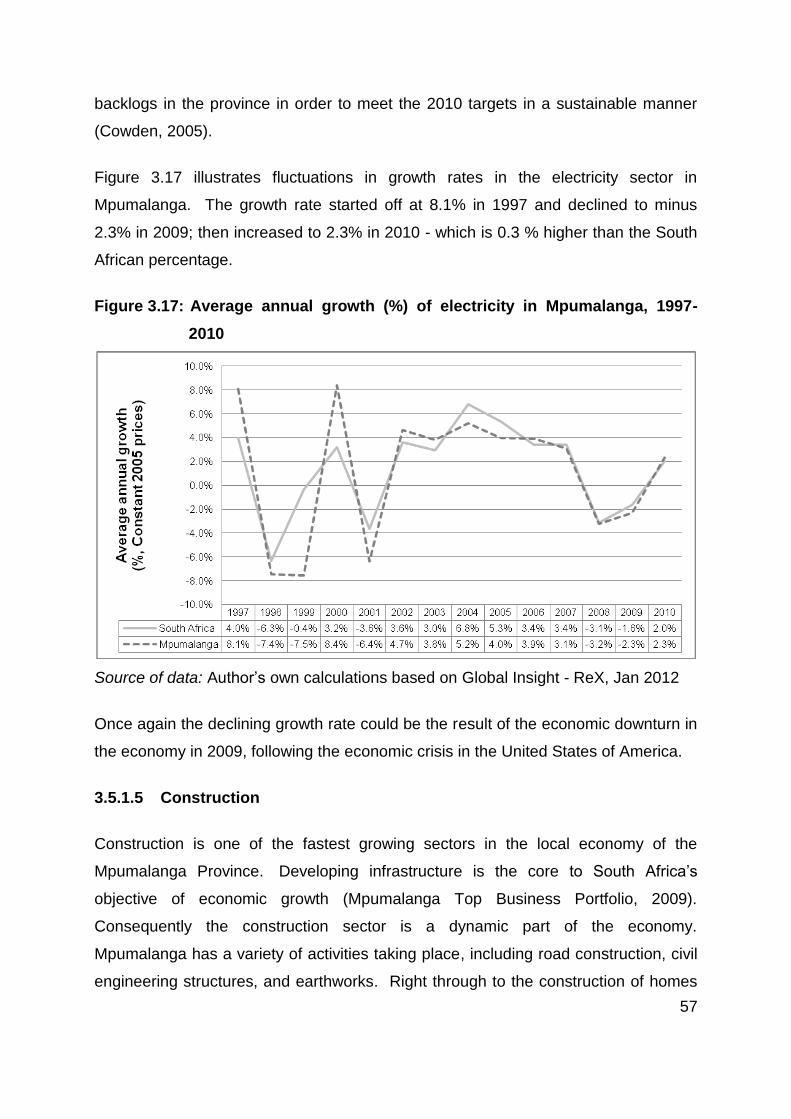
57
backlogs in the province in order to meet the 2010 targets in a sustainable manner
(Cowden, 2005).
Figure 3.17 illustrates fluctuations in growth rates in the electricity sector in
Mpumalanga. The growth rate started off at 8.1% in 1997 and declined to minus
2.3% in 2009; then increased to 2.3% in 2010 - which is 0.3 % higher than the South
African percentage.
Figure 3.17: Average annual growth (%) of electricity in Mpumalanga, 1997-
2010
Source of data: Author’s own calculations based on Global Insight - ReX, Jan 2012
Once again the declining growth rate could be the result of the economic downturn in
the economy in 2009, following the economic crisis in the United States of America.
3.5.1.5 Construction
Construction is one of the fastest growing sectors in the local economy of the
Mpumalanga Province. Developing infrastructure is the core to South Africa’s
objective of economic growth (Mpumalanga Top Business Portfolio, 2009).
Consequently the construction sector is a dynamic part of the economy.
Mpumalanga has a variety of activities taking place, including road construction, civil
engineering structures, and earthworks. Right through to the construction of homes
58
and offices, the provincial government of Mpumalanga has an infrastructural
investment drive in place which will sustain this sector despite the challenge of
private investment that could slow down this sector in the current economic cycle.
Figure 3.18 shows the average annual growth of the construction sector in
Mpumalanga from the years 1997 to 2010.
Figure 3.18: Average annual growth (%) of construction in Mpumalanga, 1997-
2010
Source of data: Author’s own calculations based on Global Insight - ReX, Jan 2012
In 1997 Mpumalanga had a growth rate of 9.0% and shows a peak of 14.9% in 2007.
Overall the construction sector has experienced a negative growth with a low point of
minus 23.4% in 2000. The negative growth rate may be a result of the down turn in
the property market during the time period. The construction sector in Mpumalanga
exceeded the growth rate of South Africa only once, in 2001, with almost ten per cent
and also in 2009, with one per cent.
3.5.1.6 Transport
The transport, storage and communication sector is the fourth biggest industry
contributor to the South African Gross Domestic Product (GDP). This industry
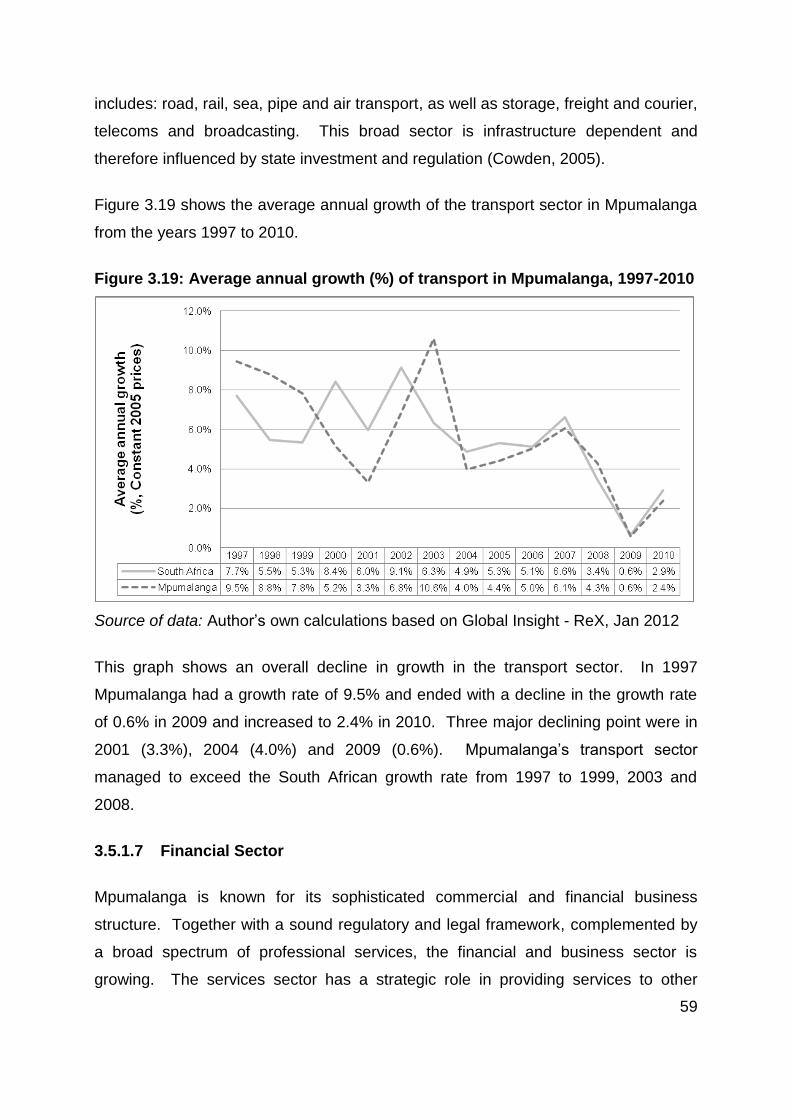
59
includes: road, rail, sea, pipe and air transport, as well as storage, freight and courier,
telecoms and broadcasting. This broad sector is infrastructure dependent and
therefore influenced by state investment and regulation (Cowden, 2005).
Figure 3.19 shows the average annual growth of the transport sector in Mpumalanga
from the years 1997 to 2010.
Figure 3.19: Average annual growth (%) of transport in Mpumalanga, 1997-2010
Source of data: Author’s own calculations based on Global Insight - ReX, Jan 2012
This graph shows an overall decline in growth in the transport sector. In 1997
Mpumalanga had a growth rate of 9.5% and ended with a decline in the growth rate
of 0.6% in 2009 and increased to 2.4% in 2010. Three major declining point were in
2001 (3.3%), 2004 (4.0%) and 2009 (0.6%). Mpumalanga’s transport sector
managed to exceed the South African growth rate from 1997 to 1999, 2003 and
2008.
3.5.1.7 Financial Sector
Mpumalanga is known for its sophisticated commercial and financial business
structure. Together with a sound regulatory and legal framework, complemented by
a broad spectrum of professional services, the financial and business sector is
growing. The services sector has a strategic role in providing services to other
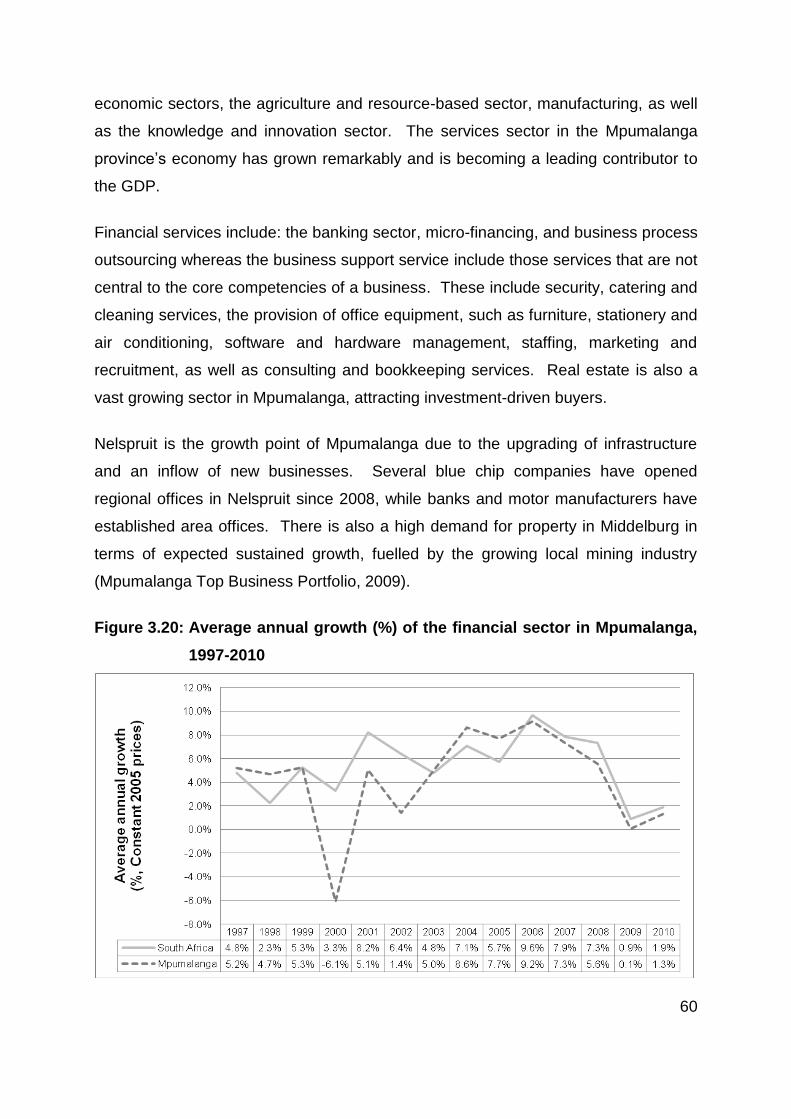
60
economic sectors, the agriculture and resource-based sector, manufacturing, as well
as the knowledge and innovation sector. The services sector in the Mpumalanga
province’s economy has grown remarkably and is becoming a leading contributor to
the GDP.
Financial services include: the banking sector, micro-financing, and business process
outsourcing whereas the business support service include those services that are not
central to the core competencies of a business. These include security, catering and
cleaning services, the provision of office equipment, such as furniture, stationery and
air conditioning, software and hardware management, staffing, marketing and
recruitment, as well as consulting and bookkeeping services. Real estate is also a
vast growing sector in Mpumalanga, attracting investment-driven buyers.
Nelspruit is the growth point of Mpumalanga due to the upgrading of infrastructure
and an inflow of new businesses. Several blue chip companies have opened
regional offices in Nelspruit since 2008, while banks and motor manufacturers have
established area offices. There is also a high demand for property in Middelburg in
terms of expected sustained growth, fuelled by the growing local mining industry
(Mpumalanga Top Business Portfolio, 2009).
Figure 3.20: Average annual growth (%) of the financial sector in Mpumalanga,
1997-2010
61
Source of data: Author’s own calculations based on Global Insight - ReX, Jan 2012
Figure 3.23 shows the average annual growth of the financial and business sector in
Mpumalanga from the years 1997 to 2010. This graph showed more fluctuations
than the transport graph (See Figure 3.22). In 1997 Mpumalanga had a growth rate
of 5.2% and ended with a low growth rate of 1.3% in 2010. The financial and
business sector experienced an ultimate low in 2000 with a declining growth rate of
minus 6.1%. Afterwards, the sector experienced growth, although not high, but
favourable. The highest peak of this sector was 9.2% in 2006.
The subsequent sector will give an overview of the infrastructure in the Mpumalanga
Province.
3.5.2 Infrastructure in Mpumalanga
In his 2012 budget speech Mr Pravin Gordhan (2012:5) stated the main focus for
South Africa is an expansion in infrastructure investment. The Maputo Development
Corridor (MDC) and the Kruger Mpumalanga International Airport (KMIA) are two of
the Mpumalanga Province’s important infrastructures.
3.5.2.1 Maputo Development Corridor
The Maputo Development Corridor (MDC) is a Spatial Development Initiative from
the South African government and links the Mpumalanga Province and the Gauteng
province with the deep water port of Maputo in Mozambique. Easy access to export
markets in Asia and the Indian Ocean Rim is provided to local and international
investors (Jourdan, 1998:717). The MDC focuses attention on the Mpumalanga
Province, creating investor confidence and growth in Nelspruit. This economic
development corridor was seen as under-performing (Willoughby, 2007:5). Five key
infrastructure anchor projects were initiated to enhance investment and development
in the provinces along this corridor:
The toll road from Witbank (in the Mpumalanga Province) to Maputo (in
Mozambique).
The upgrading of the railway line from Ressano Garcia to Maputo.
62
The upgrading of the port of Maputo.
The upgrading of the border post between South Africa and Mozambique.
The upgrading of the telecommunication linkages between South Africa and
Maputo.
3.5.2.2 Kruger Mpumalanga International Airport
In November 2002 the Kruger Mpumalanga International Airport (KMIA) was opened.
The airport is situated 22km north of Nelspruit and has a runway of 3.2 km. This
airport was designed to handle large cargoes and passengers and is currently
handling international charter flights. In 2009 acting Premier Thabang Makwetla
announced in his State of the Province address that negotiations surrounding
government ownership of KMIA has been concluded. A feasibility study conducted in
2007 shows that KMIA has the economic development potential if KMIA includes the
development of an industrial park. This park will be increased from 19ha in 2010 to
73ha in 2025 and will consist of the following related industries (Mpumalanga
Department of Economic Development and Planning, 2009):
Food, beverages and tobacco.
Wood and paper, as well as publishing and printing.
Textiles clothing and leather goods.
Furniture and other manufacturing.
Petroleum products, chemicals, rubber and plastic.
Other non-metal mineral products.
Metals, metal products, machinery and equipment.
Radio, TV, instruments, watches and clocks.
Electrical machinery and apparatus.
Transport equipment and food processing.
From all the above information it can be gathered that the Mpumalanga Province is
becoming an important province in the South African economy. All off the economic
sectors have experienced growth, even with some negative growth rates. All of the
sectors are growing and sustainable. Most of the investment projects in the
Mpumalanga Province seem capable to provide its own resources and capital to fund
63
these projects. Mpumalanga also has a stable infrastructure, which enables easy
access to the province.
3.6 SUMMARY AND CONCLUSION
This chapter provided an overview of socio-economic outlook and infrastructure of
the Mpumalanga Province. This overview highlights that Mpumalanga is developing
in the South African economy. The location of the Mpumalanga Province is one of
the main benefits when one considers investing in this province.
An overview of the socio-economic structure of the province highlights that
Mpumalanga has been experiencing a high population growth, poverty, and
unemployment growth rates on the negative side. On the positive side the
Mpumalanga Province has been experiencing a favourable growth in the
economically active sectors and education.
The economic activity in the Mpumalanga Province shows a favourable GDP and
GVA growth. The province experienced some declining growth rates with a trough of
minus 1.6% in 2009, but increased to 2.5% in 2010. It was the same case with GVA
growth; declining growth rates were experienced with a trough of minus 1.5% in
2009, but increased steadily to 1.9% in 2010. In the economic sectors the main
contributors in 2010 were mining, electricity, agriculture and manufacturing. The
trade sector also experienced a favourable growth. Mpumalanga’s exports as a
percentage of GDP, total trade as a percentage of GDP, and the regional share of
exports and imports, experienced positive growth rates.
Agriculture is one of South Africa’s main contributing sectors to the economy and is a
key provider of employment in the country. In the Mpumalanga Province the
agriculture sector provides employment to the largest number of people in the
province. Over the time period 1997 to 2010, the sector experienced many
fluctuations but ended with 18.3% in 2008 and decreased to 0.7% in 2010. The
mining sector in the Mpumalanga sector is growing because of its abundance in
mineral resources. This sector experienced favourable growth rates and ended with
a growth rate of 5.6% in 2010. The energy sector of South Africa contributes about
64
15% of (GDP) and employs more than 16 thousand people in the Mpumalanga
province (Mahlangu, 2009:16). This sector had a negative growth rate in 2008 (-
3.2%).
The fastest growing sector is the construction sector in Mpumalanga and is important
for the development of infrastructure. Proof of this is the positive growth rate of
10.5% in 2008 and the decline to 0.8% in 2010. The fourth biggest contributing
sector to GDP was the transport sector. This sector experienced negative growth
rates for most of the time period, ending with 0.6% in 2009 and increased steadily to
2.4% in 2010. Mpumalanga is known for its sophisticated commercial and financial
business structure. The services sector in the country’s economy has grown
remarkable and is becoming a leading contributor to the GDP. The highest peak of
this sector was 9.2% in 2006 but decreased to 1.3% in 2010.
Chapter 4 will provide an analysis of the estimation method of Revealed Comparative
advantage (RCA) index of each product that Mpumalanga Province specialises in.
The products will then be compared to the Realistic Export Opportunities (REOs)
identified by the Decision Support Model (DSM).
65
CHAPTER 4: THE THEORETICAL FRAMEWORK OF
THE REVEALED COMPARATIVE ADVANTAGE INDEX
4.1 INTRODUCTION
In this chapter the theory and practice behind the Revealed Comparative Advantage
(RCA) will be discussed. The focus of this study is based on comparative advantage
and how products with high RCA will enhance the Mpumalanga Province’s exports;
therefore, highlighting the RCA as the suited index for this study. The RCA
equations along with its measurement will be explained. Subsequently the post
office code description, harmonised system of codes and codes of the district office
will be explained. Finally the chapter will be concluded with a description of the
Decision Support Model (DSM) and the final compilation of the data.
Adam Smith and David Ricardo in theory justified and highlighted export importance
with their theories of, respectively, absolute and comparative advantage theories.
Ricardo (1817:8) uses an example of a large amount of goods that is exchanged for
a product. In modern economics this is known as trading. Ricardo (1817:8) states
that it is essential for a country to have commodities, but equally important is how
these countries should use it. Through the utility embedded in a commodity,
exchange value could derive from two sources: the shortage of the commodity and
the amount of labour required to obtain it (Ricardo, 1817:8).
Developments from these theories by Smith and Ricardo helped to identify export
industries that could be a benefit to a nation (Pearson, 2007:19-20). The Classical
theory of comparative advantage, Ricardian, Heckscher-Ohlin-Samuelson theory and
the Neo-factor-proportion theory are theories which put the understanding of
comparative advantage more in perspective (Bender & Li 2002:1). Free trade, cost
and technological differences, factor price differences and factor efficiencies are
examples of how determinants of comparative advantage have differed amongst
these four theories (Bender & Li, 2002:1). The diamond theory of Porter, based on
national advantage, also provides a valuable and a simplified explanation on factors
determining the competitiveness of export industries (Kleynhans, 2003:107). The
66
diamond theory is based on factor conditions, demand conditions, related and
supporting industries, as well as firm strategy, structure and rivalry (Porter, 1998:16).
Factor conditions involve the four production factors that are land, labour, capital and
natural resources.
A country will experience comparative advantage and positive trade flows if all four
production factors are located in the country (Porter, 1980:79). If a country
possesses the necessary skills to predict future buyer needs or buyer demands in a
specific product locally, the country will experience a comparative advantage in the
demand condition factor (Porter, 1980:82). Industries that are competitive on
international level provide comparative advantage to the related and supporting
industry factors by providing advantages in cost effective inputs, research and
development as well as the industries’ location (Porter, 1998:17). Finally, a firm’s
strategy, structure and rivalry provide a comparative advantage for a country in the
way the firm is created, organised and managed (Porter 1980:83). A country will
benefit from comparative advantage if the diamond introduced by Porter is utilised
correctly and efficiently.
Since 1994 South Africa worked hard to gain successful entry into international
markets. South Africa gained accelerated exports, which supported a favourable
economic growth rate (Pearson, 2007:6). Even though the growth rate has
increased, there is still a need to establish comparative advantage for South African
products. According to Sanidas and Shin (2010:5) comparative advantage is a
determinant of the patterns of growth. Even though comparative advantage fuels
economic growth, a complexity exists amongst the concept of empirical analysis and
comparative advantage (Sanidas & Shin, 2010:5).
Taking the above into account, the Revealed Comparative Advantage (RCA) is the
most suited index for this study. The accessible data from the South African
Revenue Services (SARS) and the basic analysis and calculations of the RCA
justifies the latter. The RCA index is constructed on post-trade variables, for
example autarkic variables to indicate the patterns of comparative advantage
(Sanidas & Shin, 2010:5). Measurement of comparative advantage is hindered by
non-observable autarkic price relationships (Bender & Li, 2002:2). According to
67
Bender and Li (2002:2) post-trade data observes the true patterns of comparative
advantage. The one disadvantage is however that government policy distortions
cause data at different levels to be biased. Regardless of the above, Balassa’s
thesis highlighted the process where economies are shifted from one competitive
position to another (Bender & Li, 2002:2). Balassa and Stoutjesdijk (1984:39) depicts
that a competitive position consists of the following assumptions. An economy that
provides industries with an incentive to export will ensure that foreign markets’ sales
are increased. Countries in close proximity to one another will enhance exports by
means of regional integration and finally, preferential incentives such as rebates and
discounts, will fuel exports in the specific country.
For the purpose of this study, the Revealed Comparative Advantage (RCA) approach
will be used to determine Mpumalanga Province’s potential exportable products. The
next section will focus on the RCA index and its use.
4.2 DESCRIPTIVE EXPLANATION OF THE RCA INDEX
Bela Balassa is seen as the originator of the RCA index. According to Utkulu and
Seymen (2004:8) the concept of RCA refers to the relative trade performances of
individual countries in particular commodities and is based on the theory of Balassa.
On the assumption that the commodity pattern of trade reflects a country’s
differences in relative costs, as well as in non-price factors, this is assumed to reveal
the comparative advantage of trading countries (Balassa, 1977:327). The RCA
definition has been modified to such an extent that multiple measures of the RCA
now exists (Utkulu & Seymen 2004:8). Vollrath (1991:270-272) states that RCA are
measured on global or sub-global levels, while Dimelis and Gatsios depict that the
measurements reveal bilateral trade between two or more countries (Utkulu &
Seymen, 2004:8).
The next section will provide a description of trade theory of the RCA, a clarification
of the RCA equation and how the RCA is measured.
68
4.2.1 Trade theory
Liesner’s (1958:314) design of relative export performance was developed through
the application of Balassa’s innovation on the measurement of comparative
advantage. Liesner (1958:314) used the idea of relative export performance and
adopted the ratio of export shares. From this, the index for comparative advantage
was developed (Sanidas & Shin, 2010:12). The RCA is outlined by the identification
of exports, specific countries and specific commodities. By identifying the
advantages and disadvantages of a country that has a specific class of goods being
traded, the RCA is calculated.
Batra and Khan (2005:5-6) list the advantage and disadvantage of a comparative
advantage index. The benefit of this index is that the factor endowment and
productivity of an economy is consistent with the intrinsic advantage of specific
exportable products. Sanidas and Shin (2010:12) explain that comparative
advantage of a country’s commodities are measured when the export market size of
the commodity in terms of export market size is bigger than the commodity’s market
size, in terms of world total export market size.
The disadvantage of the comparative advantage of a country can on the other hand
be measured when the export market size of the commodity, in terms of export
market size, is smaller than the commodities market size, in terms of world total
export market size (Sanidas & Shin, 2010:12). When the commodities market in a
certain country is as large as the world export market, this is viewed as the
comparative advantage focus point.
The disadvantage of this index is that it is complicated to determine, when changes
need to be made to factor endowments in order to apply suitable trade policies to a
country (Batra & Khan, 2005:5-6). Bowen (1983:465) states that world exports of a
specific product are dispersed amongst different countries if it is proportional to the
world export share. A comparison can then be made towards a specific country’s
sector export performance.
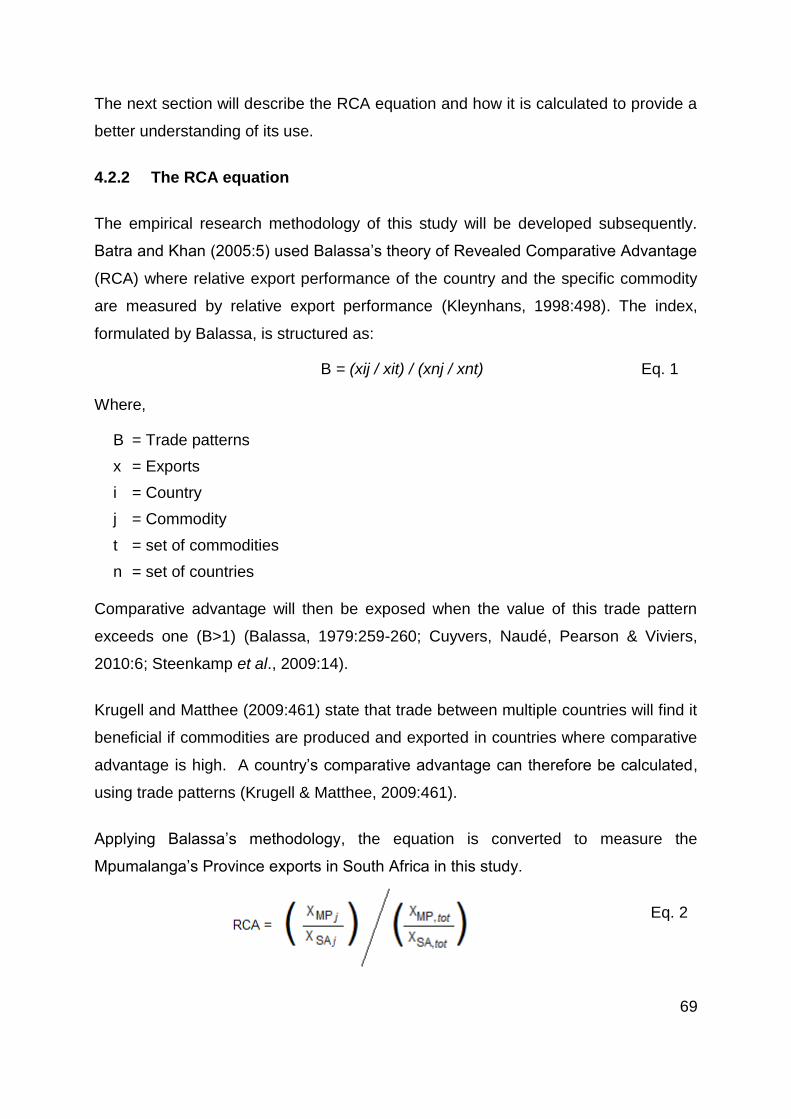
69
The next section will describe the RCA equation and how it is calculated to provide a
better understanding of its use.
4.2.2 The RCA equation
The empirical research methodology of this study will be developed subsequently.
Batra and Khan (2005:5) used Balassa’s theory of Revealed Comparative Advantage
(RCA) where relative export performance of the country and the specific commodity
are measured by relative export performance (Kleynhans, 1998:498). The index,
formulated by Balassa, is structured as:
B = (xij / xit) / (xnj / xnt) Eq. 1
Where,
B = Trade patterns
x = Exports
i = Country
j = Commodity
t = set of commodities
n = set of countries
Comparative advantage will then be exposed when the value of this trade pattern
exceeds one (B>1) (Balassa, 1979:259-260; Cuyvers, Naudé, Pearson & Viviers,
2010:6; Steenkamp et al., 2009:14).
Krugell and Matthee (2009:461) state that trade between multiple countries will find it
beneficial if commodities are produced and exported in countries where comparative
advantage is high. A country’s comparative advantage can therefore be calculated,
using trade patterns (Krugell & Matthee, 2009:461).
Applying Balassa’s methodology, the equation is converted to measure the
Mpumalanga’s Province exports in South Africa in this study.
Eq. 2
70
Where,
RCA = Revealed Comparative Advantage
XMPj = Mpumalanga’s export of the specific product
XMP,tot = Mpumalanga’s total exports
XSAj = South Africa’s export of a specific product
XSA,tot = South Africa’s total exports
This implies that the RCA index relates the relative share of the country’s production
of a particular product or industry to the province’s exports; relative to the share of
total export that the province exports in total.
This adapted measure of Balassa’s RCA index will be used to calculate the empirical
data in Chapter 5 to determine the export potential of sectors and industries in the
Mpumalanga Province. In the following section it will be explained how the results
will be interpreted.
4.2.3 Measurement of the RCA
If the estimated RCA is larger than one, it will indicate that Mpumalanga is relatively
specialised in a specific product. This then implies that Mpumalanga will have a
revealed comparative advantage in that specific product (Batra & Khan, 2005:5). In
contrast, Mpumalanga will have a comparative disadvantage when the RCA is
smaller than one (Faustino, 2008:7).
The subsequent part of this study will provide an overview and analysis regarding the
data that will be used in the empirical analysis of this study.
4.3 DATA DESCRIPTION
Data obtained from the South African Revenue Service (SARS) was used for the
purpose of this study. This export data from SARS was processed by using the post
office codes of each province. Along with the SARS data, the export data was sorted
under the Harmonized System Tariff Codes, Tariff code description, as well as
District offices and Custom values of the United Nations.
71
4.3.1 Post office code description
In the database used, each post office code has specific export data linked to it.
Representing the area is a four digit code, ranging between 0001 and 9999. The
ranges are divided into post-box and street codes and the codes correspond to place
names, sorting centres and provinces. Table 4.1 outlines the post office code system
of South Africa. Since the data available from SARS is sorted along the post office
codes system, a wide variety of data is available. A disadvantage of this data is that
the South African provincial boundaries and the post office distribution areas do not
always match perfectly (Lombaard, 2005:1).
The following section will explain the harmonised system of codes and tariff headings
to provide a clearer understanding of how it works and is used.
4.3.2 The harmonised system codes – tariff headings
The Harmonised System of Codes (HS Codes) is an international standard
classification for the categorisation and description of the coding of goods of the
world (Yu, 2008:1). HS codes were introduced on 1 January 1988 by the World
Customs Organization (WCO) and are reviewed or amended every four to six years
to take into account new product innovations that are introduced into the market each
year (Pierce & Schott, 2010:3; Yu, 2008:1). The Harmonised System is divided into
97 “chapters” and 21 “sections”. These “chapters” and “sections” are described in
the following paragraphs.
4.3.2.1 Section and Chapter Headings
The 21 Sections of the HS codes provide an explanation of the 97 Chapter headings
which is outlined in Table 4.2. The harmonised system of codes ranges from live
stock and animal products in section 1, to chemical products in section 6 (Chapter
28-38), plastic and rubber products in section 7 (Chapter 39-40), textiles in section 11
(Chapter 50-63), metal objects in section 15 (Chapter 72-83), vehicles and aircraft in
section 17 (chapter 86-89) and arms and ammunition in section 19 (Chapter ‘93), to
name a few.
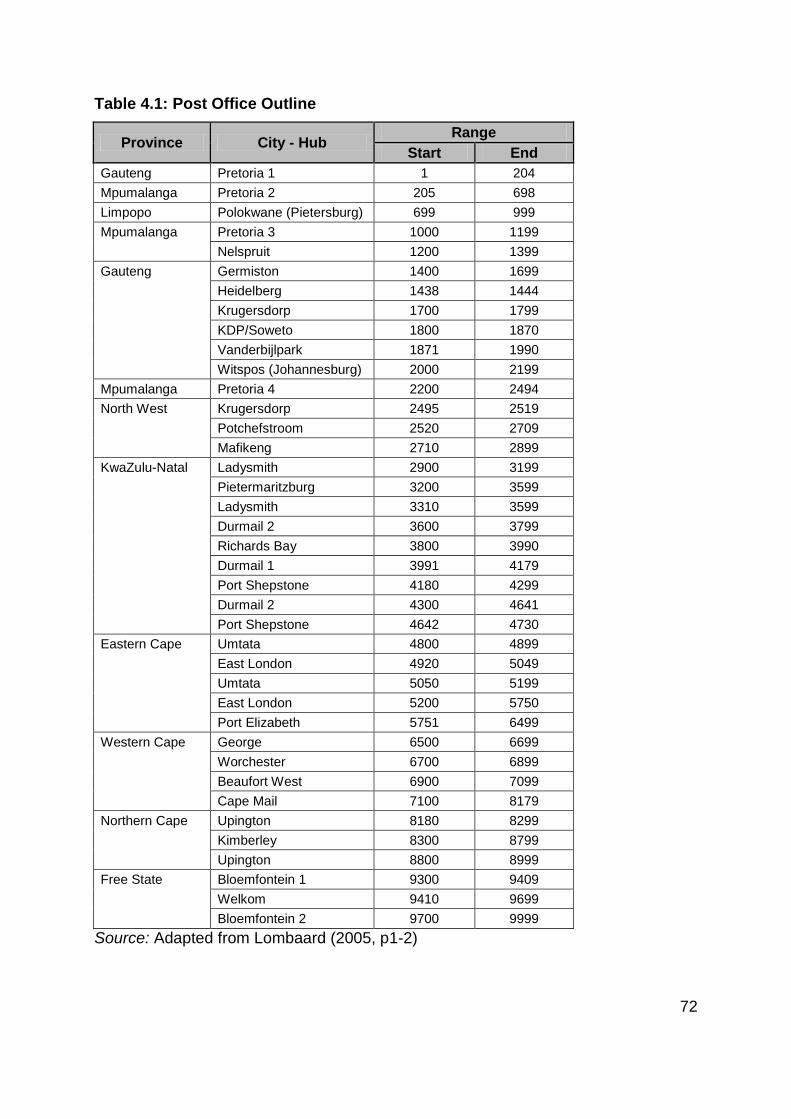
72
Table 4.1: Post Office Outline
Province City - Hub Range
Start End
Gauteng Pretoria 1 1 204
Mpumalanga Pretoria 2 205 698
Limpopo Polokwane (Pietersburg) 699 999
Mpumalanga Pretoria 3 1000 1199
Nelspruit 1200 1399
Gauteng Germiston 1400 1699
Heidelberg 1438 1444
Krugersdorp 1700 1799
KDP/Soweto 1800 1870
Vanderbijlpark 1871 1990
Witspos (Johannesburg) 2000 2199
Mpumalanga Pretoria 4 2200 2494
North West Krugersdorp 2495 2519
Potchefstroom 2520 2709
Mafikeng 2710 2899
KwaZulu-Natal Ladysmith 2900 3199
Pietermaritzburg 3200 3599
Ladysmith 3310 3599
Durmail 2 3600 3799
Richards Bay 3800 3990
Durmail 1 3991 4179
Port Shepstone 4180 4299
Durmail 2 4300 4641
Port Shepstone 4642 4730
Eastern Cape Umtata 4800 4899
East London 4920 5049
Umtata 5050 5199
East London 5200 5750
Port Elizabeth 5751 6499
Western Cape George 6500 6699
Worchester 6700 6899
Beaufort West 6900 7099
Cape Mail 7100 8179
Northern Cape Upington 8180 8299
Kimberley 8300 8799
Upington 8800 8999
Free State Bloemfontein 1 9300 9409
Welkom 9410 9699
Bloemfontein 2 9700 9999
Source: Adapted from Lombaard (2005, p1-2)
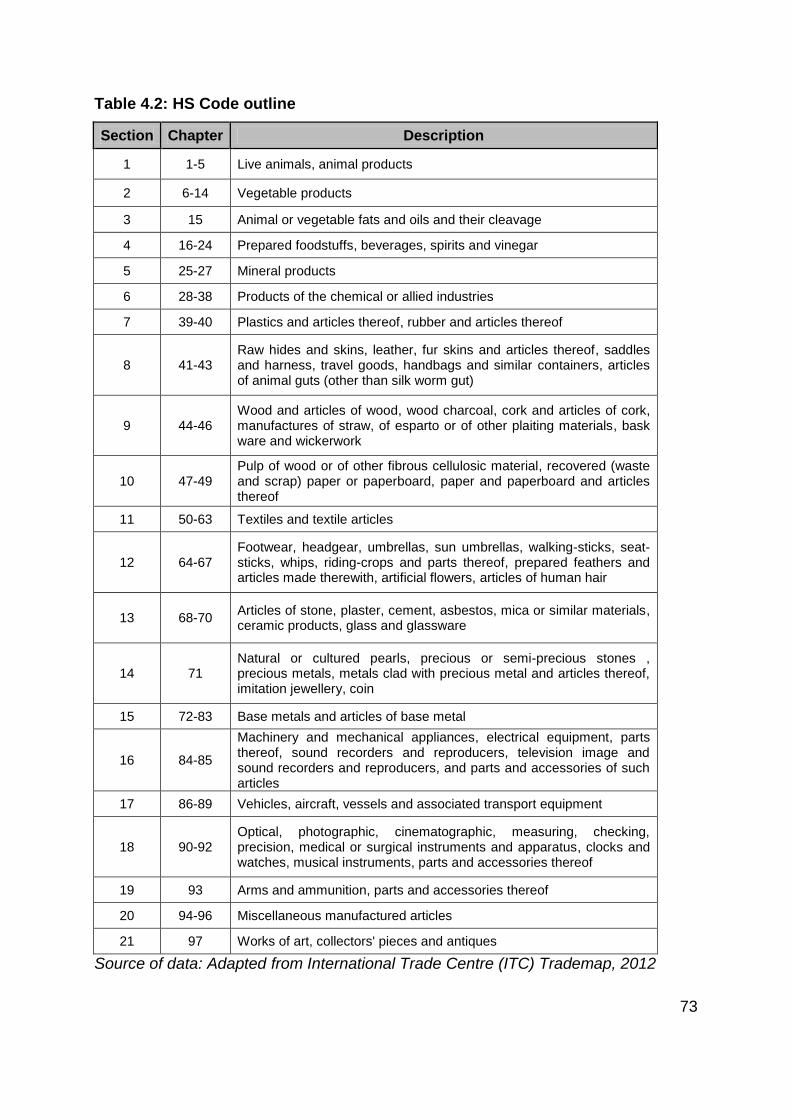
73
Table 4.2: HS Code outline
Section Chapter Description
1 1-5 Live animals, animal products
2 6-14 Vegetable products
3 15 Animal or vegetable fats and oils and their cleavage
4 16-24 Prepared foodstuffs, beverages, spirits and vinegar
5 25-27 Mineral products
6 28-38 Products of the chemical or allied industries
7 39-40 Plastics and articles thereof, rubber and articles thereof
8 41-43 Raw hides and skins, leather, fur skins and articles thereof, saddles and harness, travel goods, handbags and similar containers, articles of animal guts (other than silk worm gut)
9 44-46 Wood and articles of wood, wood charcoal, cork and articles of cork, manufactures of straw, of esparto or of other plaiting materials, bask ware and wickerwork
10 47-49 Pulp of wood or of other fibrous cellulosic material, recovered (waste and scrap) paper or paperboard, paper and paperboard and articles thereof
11 50-63 Textiles and textile articles
12 64-67 Footwear, headgear, umbrellas, sun umbrellas, walking-sticks, seat-sticks, whips, riding-crops and parts thereof, prepared feathers and articles made therewith, artificial flowers, articles of human hair
13 68-70 Articles of stone, plaster, cement, asbestos, mica or similar materials, ceramic products, glass and glassware
14 71 Natural or cultured pearls, precious or semi-precious stones , precious metals, metals clad with precious metal and articles thereof, imitation jewellery, coin
15 72-83 Base metals and articles of base metal
16 84-85
Machinery and mechanical appliances, electrical equipment, parts thereof, sound recorders and reproducers, television image and sound recorders and reproducers, and parts and accessories of such articles
17 86-89 Vehicles, aircraft, vessels and associated transport equipment
18 90-92 Optical, photographic, cinematographic, measuring, checking, precision, medical or surgical instruments and apparatus, clocks and watches, musical instruments, parts and accessories thereof
19 93 Arms and ammunition, parts and accessories thereof
20 94-96 Miscellaneous manufactured articles
21 97 Works of art, collectors' pieces and antiques
Source of data: Adapted from International Trade Centre (ITC) Trademap, 2012
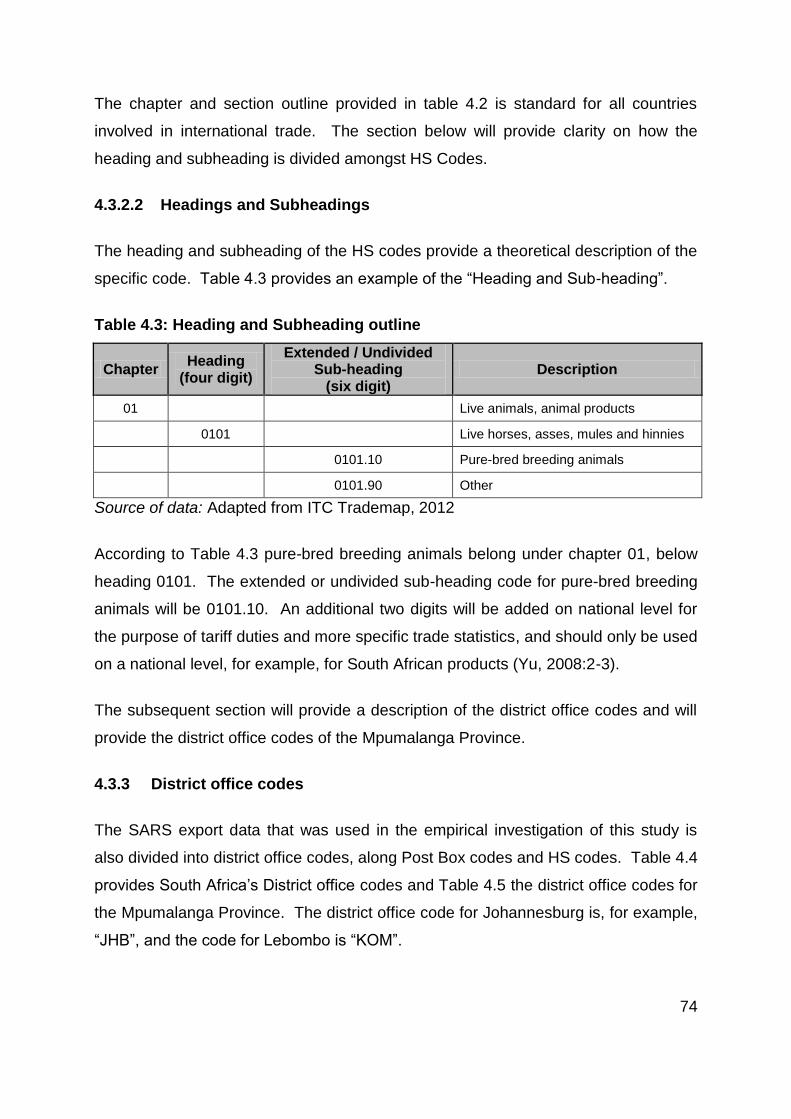
74
The chapter and section outline provided in table 4.2 is standard for all countries
involved in international trade. The section below will provide clarity on how the
heading and subheading is divided amongst HS Codes.
4.3.2.2 Headings and Subheadings
The heading and subheading of the HS codes provide a theoretical description of the
specific code. Table 4.3 provides an example of the “Heading and Sub-heading”.
Table 4.3: Heading and Subheading outline
Chapter Heading
(four digit)
Extended / Undivided Sub-heading
(six digit) Description
01
Live animals, animal products
0101
Live horses, asses, mules and hinnies
0101.10 Pure-bred breeding animals
0101.90 Other
Source of data: Adapted from ITC Trademap, 2012
According to Table 4.3 pure-bred breeding animals belong under chapter 01, below
heading 0101. The extended or undivided sub-heading code for pure-bred breeding
animals will be 0101.10. An additional two digits will be added on national level for
the purpose of tariff duties and more specific trade statistics, and should only be used
on a national level, for example, for South African products (Yu, 2008:2-3).
The subsequent section will provide a description of the district office codes and will
provide the district office codes of the Mpumalanga Province.
4.3.3 District office codes
The SARS export data that was used in the empirical investigation of this study is
also divided into district office codes, along Post Box codes and HS codes. Table 4.4
provides South Africa’s District office codes and Table 4.5 the district office codes for
the Mpumalanga Province. The district office code for Johannesburg is, for example,
“JHB”, and the code for Lebombo is “KOM”.
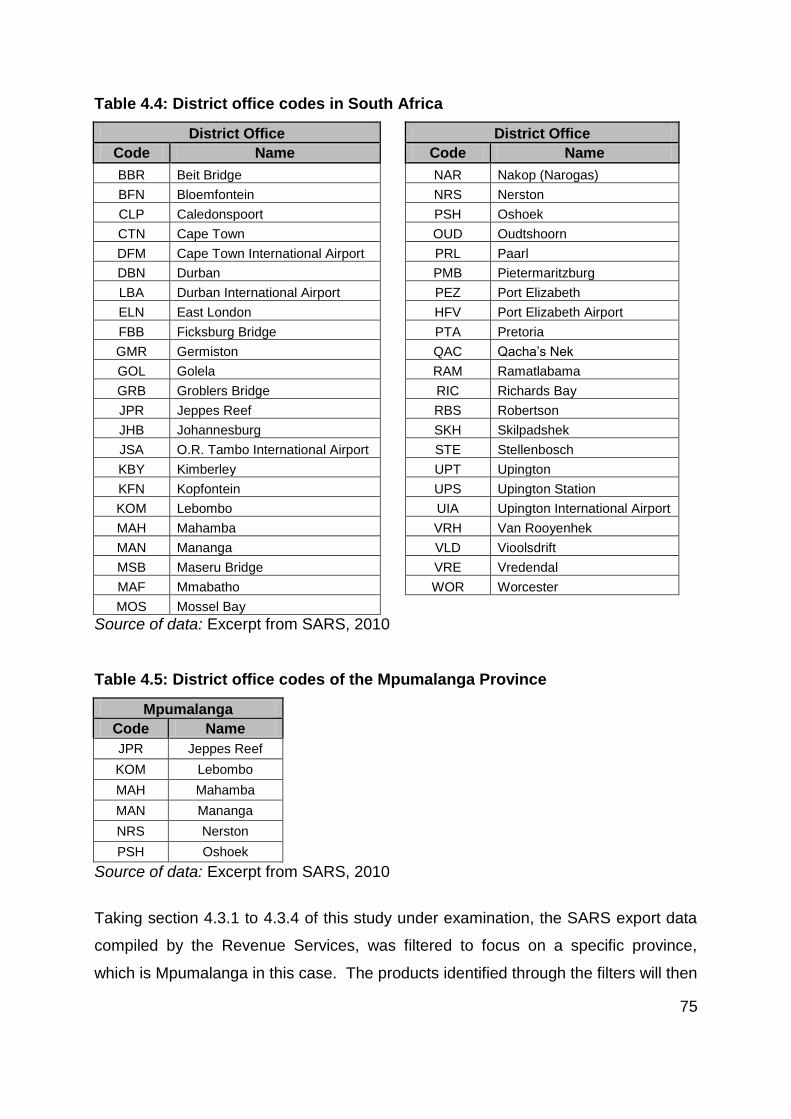
75
Table 4.4: District office codes in South Africa
District Office
District Office
Code Name
Code Name
BBR Beit Bridge
NAR Nakop (Narogas)
BFN Bloemfontein
NRS Nerston
CLP Caledonspoort
PSH Oshoek
CTN Cape Town
OUD Oudtshoorn
DFM Cape Town International Airport
PRL Paarl
DBN Durban
PMB Pietermaritzburg
LBA Durban International Airport
PEZ Port Elizabeth
ELN East London
HFV Port Elizabeth Airport
FBB Ficksburg Bridge
PTA Pretoria
GMR Germiston
QAC Qacha’s Nek
GOL Golela
RAM Ramatlabama
GRB Groblers Bridge
RIC Richards Bay
JPR Jeppes Reef
RBS Robertson
JHB Johannesburg
SKH Skilpadshek
JSA O.R. Tambo International Airport
STE Stellenbosch
KBY Kimberley
UPT Upington
KFN Kopfontein
UPS Upington Station
KOM Lebombo
UIA Upington International Airport
MAH Mahamba
VRH Van Rooyenhek
MAN Mananga
VLD Vioolsdrift
MSB Maseru Bridge
VRE Vredendal
MAF Mmabatho
WOR Worcester
MOS Mossel Bay Source of data: Excerpt from SARS, 2010
Table 4.5: District office codes of the Mpumalanga Province
Mpumalanga
Code Name
JPR Jeppes Reef
KOM Lebombo
MAH Mahamba
MAN Mananga
NRS Nerston
PSH Oshoek
Source of data: Excerpt from SARS, 2010
Taking section 4.3.1 to 4.3.4 of this study under examination, the SARS export data
compiled by the Revenue Services, was filtered to focus on a specific province,
which is Mpumalanga in this case. The products identified through the filters will then
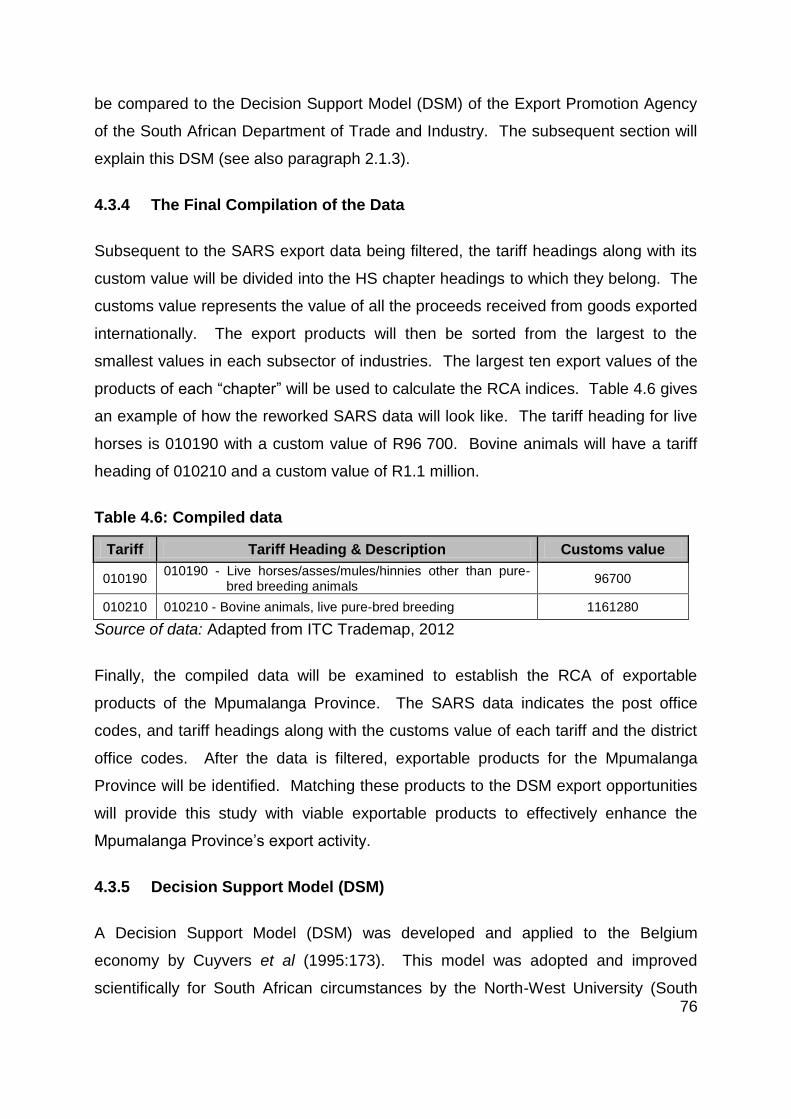
76
be compared to the Decision Support Model (DSM) of the Export Promotion Agency
of the South African Department of Trade and Industry. The subsequent section will
explain this DSM (see also paragraph 2.1.3).
4.3.4 The Final Compilation of the Data
Subsequent to the SARS export data being filtered, the tariff headings along with its
custom value will be divided into the HS chapter headings to which they belong. The
customs value represents the value of all the proceeds received from goods exported
internationally. The export products will then be sorted from the largest to the
smallest values in each subsector of industries. The largest ten export values of the
products of each “chapter” will be used to calculate the RCA indices. Table 4.6 gives
an example of how the reworked SARS data will look like. The tariff heading for live
horses is 010190 with a custom value of R96 700. Bovine animals will have a tariff
heading of 010210 and a custom value of R1.1 million.
Table 4.6: Compiled data
Tariff Tariff Heading & Description Customs value
010190 010190 - Live horses/asses/mules/hinnies other than pure- bred breeding animals
96700
010210 010210 - Bovine animals, live pure-bred breeding 1161280
Source of data: Adapted from ITC Trademap, 2012
Finally, the compiled data will be examined to establish the RCA of exportable
products of the Mpumalanga Province. The SARS data indicates the post office
codes, and tariff headings along with the customs value of each tariff and the district
office codes. After the data is filtered, exportable products for the Mpumalanga
Province will be identified. Matching these products to the DSM export opportunities
will provide this study with viable exportable products to effectively enhance the
Mpumalanga Province’s export activity.
4.3.5 Decision Support Model (DSM)
A Decision Support Model (DSM) was developed and applied to the Belgium
economy by Cuyvers et al (1995:173). This model was adopted and improved
scientifically for South African circumstances by the North-West University (South
77
Africa) in collaboration with Dr. Pearson, Prof Cuyvers and the Department of Trade
and Industry (DTI). The DSM is used for the planning and assessment of export
promotion activities. Governments frequently have limited resources to allocate
between export promotional instruments and different export activities. The DSM is a
useful instrument in this regard (Cuyvers et al., 1995:173). From an export
promotion point of view, the DSM presents the Department of Trade and Industry
with a powerful tool to identify realistic export opportunities for South African products
so that South Africa has an international competitive advantage (Pearson, 2007:37-
38).
The DSM also helps to prioritize export assistance to potentially successful exporters
in South Africa (Pearson, 2007:37-38). In order to address this problem, the DSM
was applied to the South African economy in identifying products with high export
potential (Pearson, J.J.A., Cuyvers, L. & Viviers, W., 2006:3). This instrument assists
exporters in South Africa in various ways. Exporters now have the ability to access
foreign business opportunities that will lead to realistic sustainable export markets for
their products and which will increase a firm’s export profitability and export volumes
(Pearson, 2007:37-38). The DSM is therefore used to help governments to optimally
assign their scarce resources to markets, which have the highest export potential
(Cuyvers et al., 1995:174).
The DSM works through a process of four filters and each filter is used for a certain
task (Cuyvers, 2004:256). The first filter includes all the countries of the world as
potential target markets. This filter gathers information regarding the political and
commercial risk of doing business with countries and determines which markets have
sufficient general export potential.
The market potential of all the products of the countries that came through the first
filter are then assessed in the second filter and this is done by product-related criteria
of market potential. Filter three involves an in-depth study into the remaining
potential export opportunities and markets that are too complicated to access - due to
entry barriers – and are then eliminated. Finally, the fourth filter determines the most
practical export opportunities. This is done by parameters that assess the strengths
and weaknesses of the exporting country in the specific market.
78
The practical export opportunities identified by the DSM will then be compared to the
RCA estimations. The RCA calculation will be used to identify exportable products
with comparative advantage in the Mpumalanga Province.
4.4 SUMMARY AND CONCLUSION
This chapter provided an overview and analysis of the Revealed Comparative
Advantage (RCA) Index and the data from the South African Revenue Service that
will be used for the empirical analysis of this study. This chapter also provided
insight into the Decision Support Model (DSM) that will be utilised.
South Africa has gained successful entry into international markets and had
accelerated exports, which led to a favourable economic growth rate. Even when the
accelerated export and growth rate are improving, a country’s comparative
advantage needs to be determined and developed. For the purpose of this study, the
most suited index chosen was RCA, where advantage in a specific commodity in a
country is identified. If the RCA is larger than one, it indicates that the Mpumalanga
Province will be relatively specialised in the specific product, superior to others,
implying that Mpumalanga has a revealed comparative advantage in the specific
product, but a comparative disadvantage when the RCA is smaller than one.
Export data from the South African Revenue Service (SARS) was used. The SARS
data provides post office codes and tariff headings, along with the customs value of
each tariff and district office codes. After filtering the data, exportable products for
the Mpumalanga Province will be indentified. The products identified will then be
compared to the DSM exportable products to determine exportable opportunities that
may effectively enhance the Mpumalanga Province’s export activities.
The DSM is used for the planning and assessment of export promotion activities and
works through a process of four filters and each filter is used for a specific task.
Through a process of elimination, practical export opportunities are identified by the
DSM and then compared to the SARS export data. The RCA calculation will then be
used to identify exportable products with comparative advantage in the Mpumalanga
Province.
79
The subsequent chapter will conduct an empirical investigation and examine the
RCA results to identify export products that will effectively enhance Mpumalanga’s
trade and export promotion.
80
CHAPTER 5: RESULTS OF THE REVEALED COMPARATIVE
ADVANTAGE (RCA) FOR THE MPUMALANGA PROVINCE
5.1 INTRODUCTION
It is the aim of this study to determine potential exportable products for the
Mpumalanga Province. Following the Revealed Comparative Advantage (RCA) and
the Decision Support Model (DSM) that was explained in Chapter 4, a Revealed
Comparative Advantage index was compiled for the Mpumalanga Province in South
Africa, with data compiled from the South African Revenue Service (SARS).
Together with the identified exportable products from the DSM, a structured index
was compiled to determine the exportable products for the Mpumalanga Province
and the results of this analysis are reported in this study.
This study only focuses on one of the nine provinces in South Africa; therefore, only
the Mpumalanga Province was used to construct the index. Using the SARS data on
postal code level, 2671 different products at tariff heading level, from a total of the
5402 different products from the DSM, were identified. The gathered products on
tariff heading value, together with their custom value, were then categorised
underneath the Harmonised Standard (HS) code divisions, known as “chapters”.
Table 5.1 provides the chapter sections of the harmonised standard and overall
heading of the products in each chapter. The product in each chapter division was
then used to estimate the RCA of the specific product. As explained in Chapter 4,
the purpose for these calculations is to determine which products in Mpumalanga
have an RCA value bigger than one. This will indicate that the Mpumalanga
Province will be relatively specialised in the specific product, which implies that
Mpumalanga has a revealed comparative advantage in that specific product, but a
comparative disadvantage when the RCA is smaller than one.
The subsequent part of this study will provide the Mpumalanga Province’s ten
industries in which this province has the highest competitive advantage, as well as
those industries with the lowest competitive advantage.
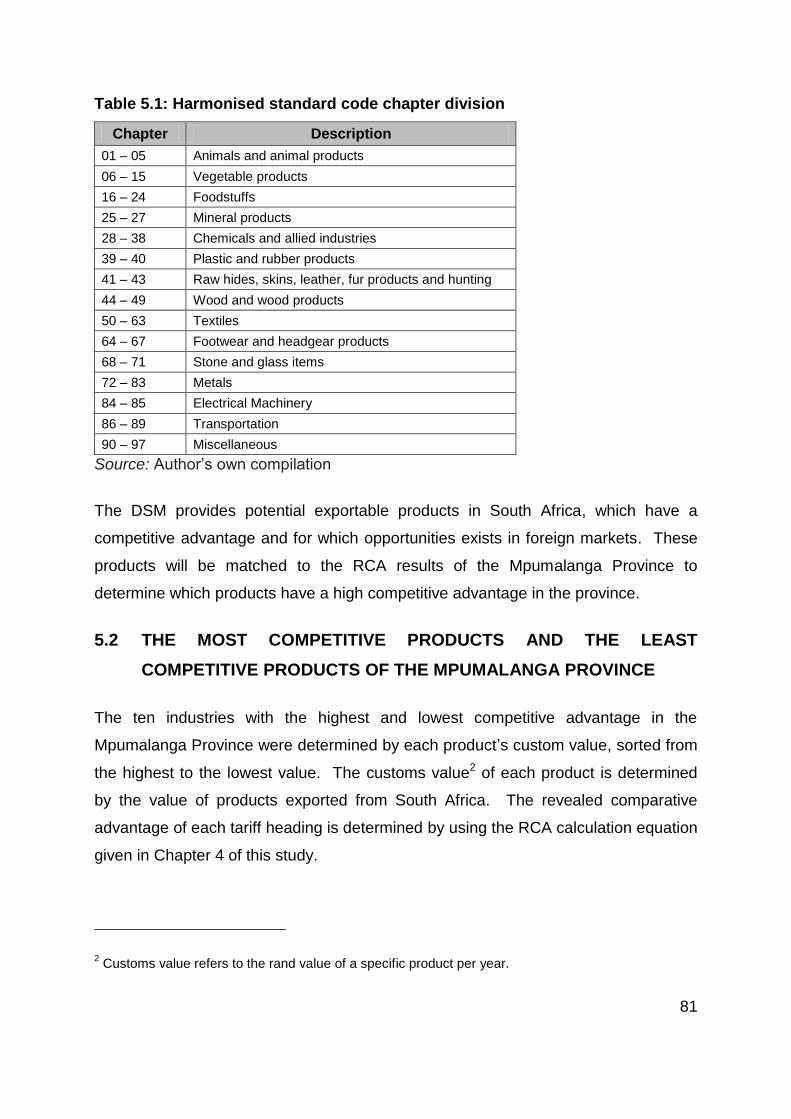
81
Table 5.1: Harmonised standard code chapter division
Chapter Description
01 – 05 Animals and animal products
06 – 15 Vegetable products
16 – 24 Foodstuffs
25 – 27 Mineral products
28 – 38 Chemicals and allied industries
39 – 40 Plastic and rubber products
41 – 43 Raw hides, skins, leather, fur products and hunting
44 – 49 Wood and wood products
50 – 63 Textiles
64 – 67 Footwear and headgear products
68 – 71 Stone and glass items
72 – 83 Metals
84 – 85 Electrical Machinery
86 – 89 Transportation
90 – 97 Miscellaneous
Source: Author’s own compilation
The DSM provides potential exportable products in South Africa, which have a
competitive advantage and for which opportunities exists in foreign markets. These
products will be matched to the RCA results of the Mpumalanga Province to
determine which products have a high competitive advantage in the province.
5.2 THE MOST COMPETITIVE PRODUCTS AND THE LEAST
COMPETITIVE PRODUCTS OF THE MPUMALANGA PROVINCE
The ten industries with the highest and lowest competitive advantage in the
Mpumalanga Province were determined by each product’s custom value, sorted from
the highest to the lowest value. The customs value2 of each product is determined
by the value of products exported from South Africa. The revealed comparative
advantage of each tariff heading is determined by using the RCA calculation equation
given in Chapter 4 of this study.
2 Customs value refers to the rand value of a specific product per year.
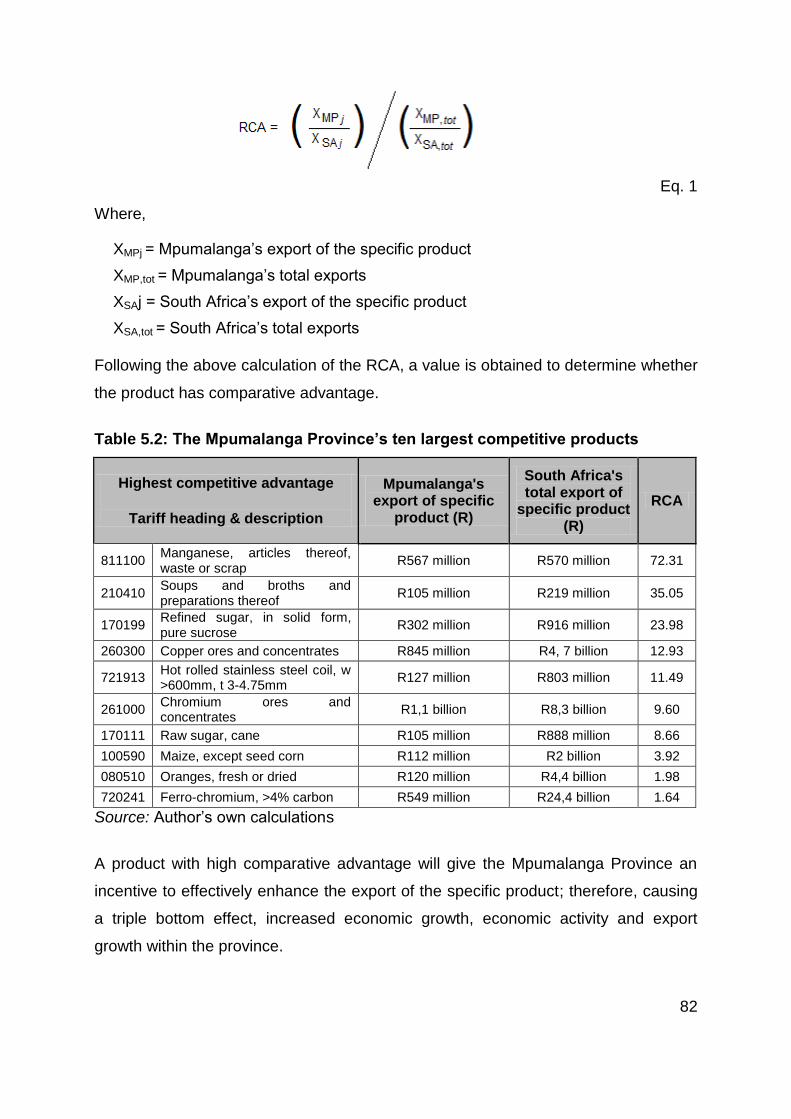
82
Eq. 1
Where,
XMPj = Mpumalanga’s export of the specific product
XMP,tot = Mpumalanga’s total exports
XSAj = South Africa’s export of the specific product
XSA,tot = South Africa’s total exports
Following the above calculation of the RCA, a value is obtained to determine whether
the product has comparative advantage.
Table 5.2: The Mpumalanga Province’s ten largest competitive products
Highest competitive advantage
Tariff heading & description
Mpumalanga's export of specific
product (R)
South Africa's total export of
specific product (R)
RCA
811100 Manganese, articles thereof, waste or scrap
R567 million R570 million 72.31
210410 Soups and broths and preparations thereof
R105 million R219 million 35.05
170199 Refined sugar, in solid form, pure sucrose
R302 million R916 million 23.98
260300 Copper ores and concentrates R845 million R4, 7 billion 12.93
721913 Hot rolled stainless steel coil, w >600mm, t 3-4.75mm
R127 million R803 million 11.49
261000 Chromium ores and concentrates
R1,1 billion R8,3 billion 9.60
170111 Raw sugar, cane R105 million R888 million 8.66
100590 Maize, except seed corn R112 million R2 billion 3.92
080510 Oranges, fresh or dried R120 million R4,4 billion 1.98
720241 Ferro-chromium, >4% carbon R549 million R24,4 billion 1.64
Source: Author’s own calculations
A product with high comparative advantage will give the Mpumalanga Province an
incentive to effectively enhance the export of the specific product; therefore, causing
a triple bottom effect, increased economic growth, economic activity and export
growth within the province.
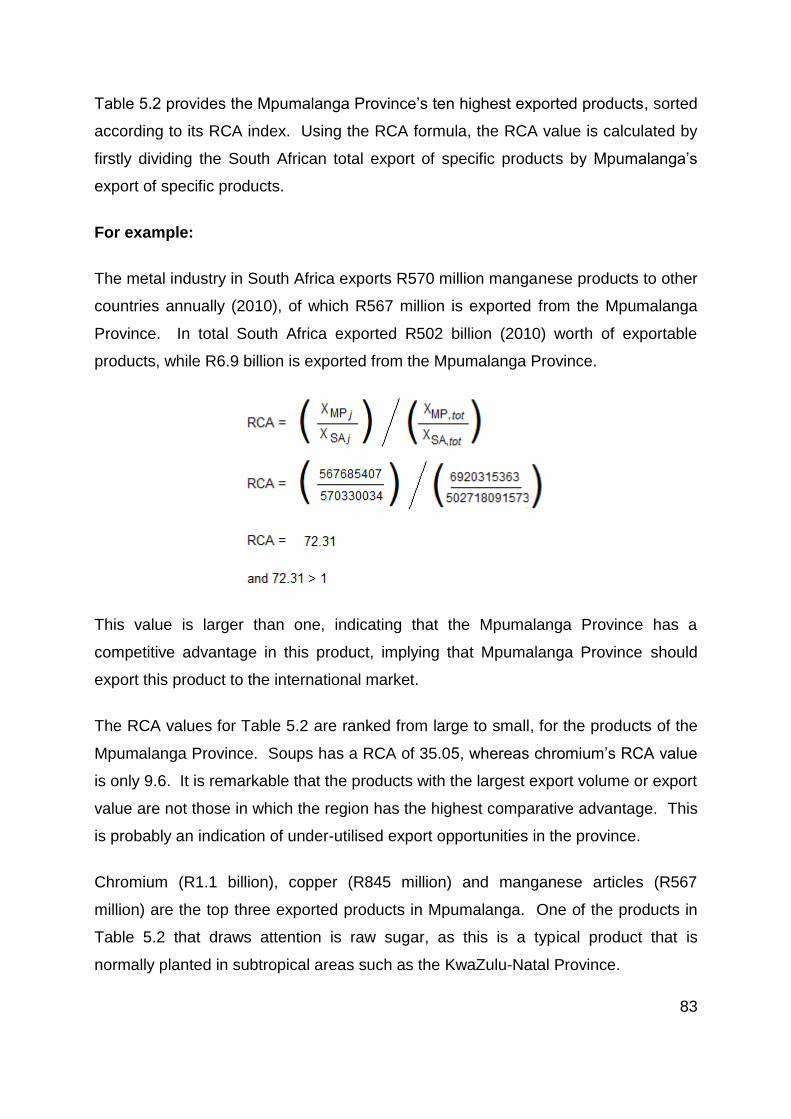
83
Table 5.2 provides the Mpumalanga Province’s ten highest exported products, sorted
according to its RCA index. Using the RCA formula, the RCA value is calculated by
firstly dividing the South African total export of specific products by Mpumalanga’s
export of specific products.
For example:
The metal industry in South Africa exports R570 million manganese products to other
countries annually (2010), of which R567 million is exported from the Mpumalanga
Province. In total South Africa exported R502 billion (2010) worth of exportable
products, while R6.9 billion is exported from the Mpumalanga Province.
This value is larger than one, indicating that the Mpumalanga Province has a
competitive advantage in this product, implying that Mpumalanga Province should
export this product to the international market.
The RCA values for Table 5.2 are ranked from large to small, for the products of the
Mpumalanga Province. Soups has a RCA of 35.05, whereas chromium’s RCA value
is only 9.6. It is remarkable that the products with the largest export volume or export
value are not those in which the region has the highest comparative advantage. This
is probably an indication of under-utilised export opportunities in the province.
Chromium (R1.1 billion), copper (R845 million) and manganese articles (R567
million) are the top three exported products in Mpumalanga. One of the products in
Table 5.2 that draws attention is raw sugar, as this is a typical product that is
normally planted in subtropical areas such as the KwaZulu-Natal Province.
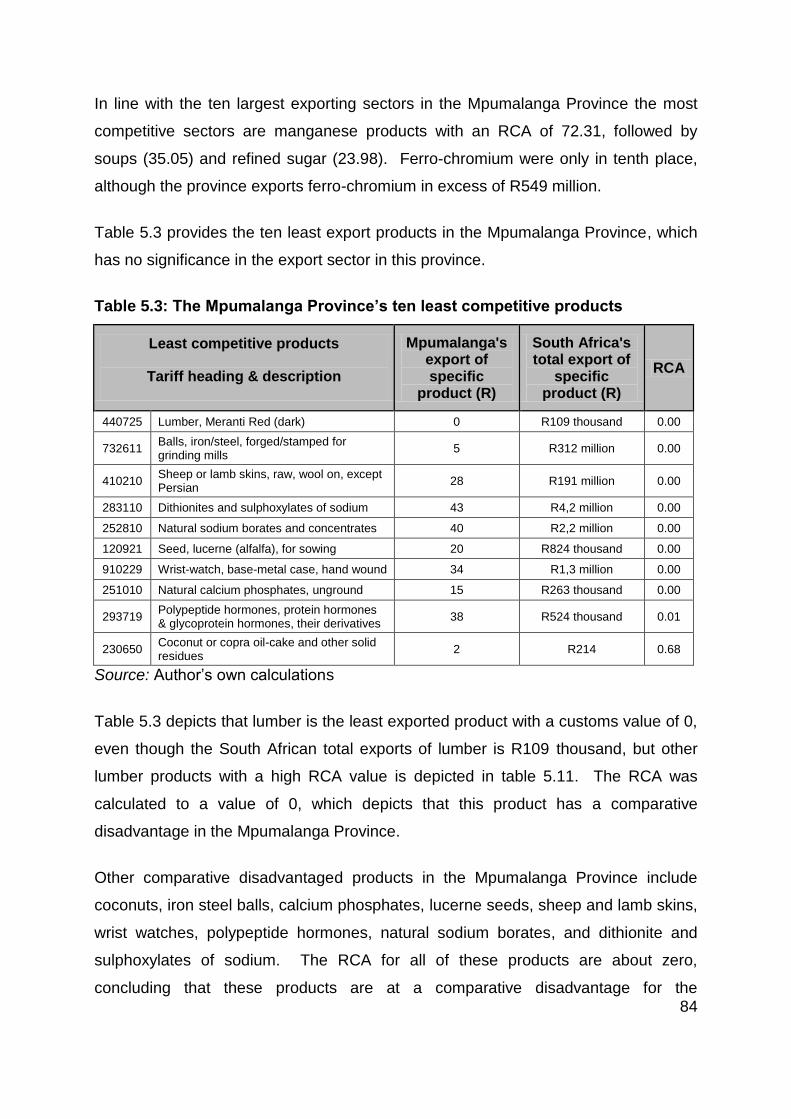
84
In line with the ten largest exporting sectors in the Mpumalanga Province the most
competitive sectors are manganese products with an RCA of 72.31, followed by
soups (35.05) and refined sugar (23.98). Ferro-chromium were only in tenth place,
although the province exports ferro-chromium in excess of R549 million.
Table 5.3 provides the ten least export products in the Mpumalanga Province, which
has no significance in the export sector in this province.
Table 5.3: The Mpumalanga Province’s ten least competitive products
Least competitive products
Tariff heading & description
Mpumalanga's export of specific
product (R)
South Africa's total export of
specific product (R)
RCA
440725 Lumber, Meranti Red (dark) 0 R109 thousand 0.00
732611 Balls, iron/steel, forged/stamped for grinding mills
5 R312 million 0.00
410210 Sheep or lamb skins, raw, wool on, except Persian
28 R191 million 0.00
283110 Dithionites and sulphoxylates of sodium 43 R4,2 million 0.00
252810 Natural sodium borates and concentrates 40 R2,2 million 0.00
120921 Seed, lucerne (alfalfa), for sowing 20 R824 thousand 0.00
910229 Wrist-watch, base-metal case, hand wound 34 R1,3 million 0.00
251010 Natural calcium phosphates, unground 15 R263 thousand 0.00
293719 Polypeptide hormones, protein hormones & glycoprotein hormones, their derivatives
38 R524 thousand 0.01
230650 Coconut or copra oil-cake and other solid residues
2 R214 0.68
Source: Author’s own calculations
Table 5.3 depicts that lumber is the least exported product with a customs value of 0,
even though the South African total exports of lumber is R109 thousand, but other
lumber products with a high RCA value is depicted in table 5.11. The RCA was
calculated to a value of 0, which depicts that this product has a comparative
disadvantage in the Mpumalanga Province.
Other comparative disadvantaged products in the Mpumalanga Province include
coconuts, iron steel balls, calcium phosphates, lucerne seeds, sheep and lamb skins,
wrist watches, polypeptide hormones, natural sodium borates, and dithionite and
sulphoxylates of sodium. The RCA for all of these products are about zero,
concluding that these products are at a comparative disadvantage for the
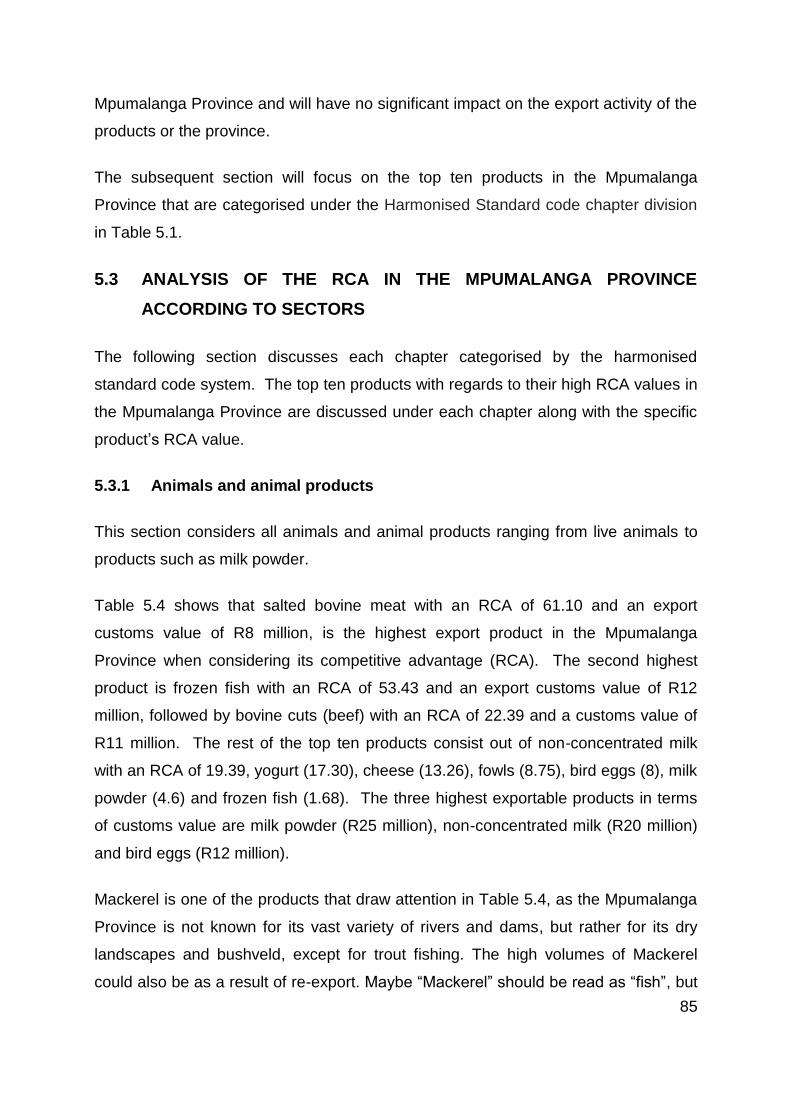
85
Mpumalanga Province and will have no significant impact on the export activity of the
products or the province.
The subsequent section will focus on the top ten products in the Mpumalanga
Province that are categorised under the Harmonised Standard code chapter division
in Table 5.1.
5.3 ANALYSIS OF THE RCA IN THE MPUMALANGA PROVINCE
ACCORDING TO SECTORS
The following section discusses each chapter categorised by the harmonised
standard code system. The top ten products with regards to their high RCA values in
the Mpumalanga Province are discussed under each chapter along with the specific
product’s RCA value.
5.3.1 Animals and animal products
This section considers all animals and animal products ranging from live animals to
products such as milk powder.
Table 5.4 shows that salted bovine meat with an RCA of 61.10 and an export
customs value of R8 million, is the highest export product in the Mpumalanga
Province when considering its competitive advantage (RCA). The second highest
product is frozen fish with an RCA of 53.43 and an export customs value of R12
million, followed by bovine cuts (beef) with an RCA of 22.39 and a customs value of
R11 million. The rest of the top ten products consist out of non-concentrated milk
with an RCA of 19.39, yogurt (17.30), cheese (13.26), fowls (8.75), bird eggs (8), milk
powder (4.6) and frozen fish (1.68). The three highest exportable products in terms
of customs value are milk powder (R25 million), non-concentrated milk (R20 million)
and bird eggs (R12 million).
Mackerel is one of the products that draw attention in Table 5.4, as the Mpumalanga
Province is not known for its vast variety of rivers and dams, but rather for its dry
landscapes and bushveld, except for trout fishing. The high volumes of Mackerel
could also be as a result of re-export. Maybe “Mackerel” should be read as “fish”, but
86
the province is not known for producing large numbers of trout and other freshwater
fish either.
Table 5.4: The Mpumalanga Province’s ten largest competitive products in the
animals and animal product chapter
Animals & animal products
Tariff heading & description
Mpumalanga's export of specific
product (R)
South Africa’s total export of
specific product (R)
RCA
021020 Bovine meat salted, dried or smoked R8 million R9,6 million 61.10
030374 Mackerel, frozen, whole R12 million R16,3 million 53.43
020120 Bovine cuts bone in, fresh or chilled R11,1 million R36 million 22.39
040120 Milk not concentrated nor sweetened 1-6% fat
R20,2 million R75,6 million 19.39
040310 Yogurt R10,5 million R44,2 million 17.30
040690 Cheese except fresh, grated, processed or blue-veined
R8,1 million R44,3 million 13.26
020714 Fowls, cuts & offal, frozen R9,7 million R80,8 million 8.75
040700 Bird eggs, in shell, fresh, preserved or cooked
R12,4 million R113,2 million 8.00
040210 Milk powder < 1.5% fat R25,5 million R403,1 million 4.60
030379 Fish, frozen, whole R8 million R345,3 million 1.68
Source: Author’s own calculations
5.3.2 Vegetable products
This section includes all vegetables and fruits, as well as a variety of crops with
nutritional value to households in the Mpumalanga Province. Products such as tea,
nuts and other products, which fall under the vegetable category, are listed in this
chapter.
Table 5.5 shows that tomatoes with an RCA value of 60.20 and an export customs
value of R8.7 million is the highest exported product in the Mpumalanga Province
when considering its comparative advantage (RCA). The second highest product is
maize flour with an RCA of 12.98 and exporting products totalling a customs value of
R120 million. It is followed by pearled maize with an RCA of 12.84 and a customs
value of R7.9 million.
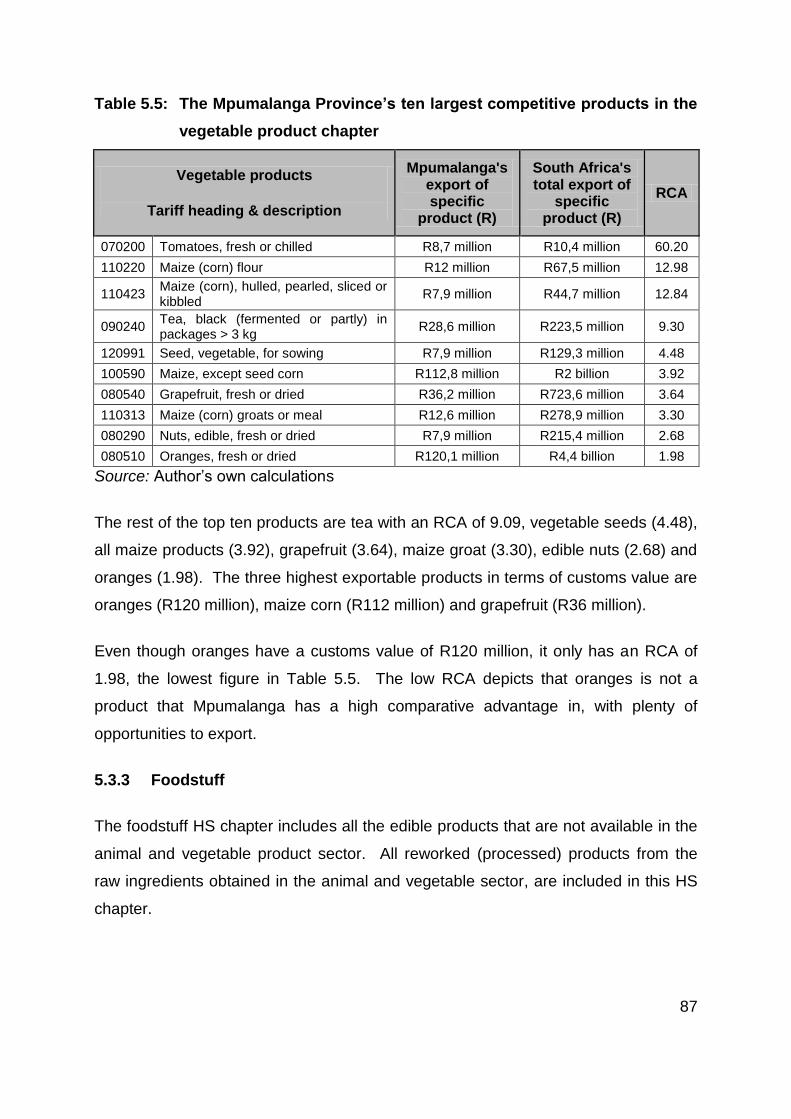
87
Table 5.5: The Mpumalanga Province’s ten largest competitive products in the
vegetable product chapter
Vegetable products
Tariff heading & description
Mpumalanga's export of specific
product (R)
South Africa's total export of
specific product (R)
RCA
070200 Tomatoes, fresh or chilled R8,7 million R10,4 million 60.20
110220 Maize (corn) flour R12 million R67,5 million 12.98
110423 Maize (corn), hulled, pearled, sliced or kibbled
R7,9 million R44,7 million 12.84
090240 Tea, black (fermented or partly) in packages > 3 kg
R28,6 million R223,5 million 9.30
120991 Seed, vegetable, for sowing R7,9 million R129,3 million 4.48
100590 Maize, except seed corn R112,8 million R2 billion 3.92
080540 Grapefruit, fresh or dried R36,2 million R723,6 million 3.64
110313 Maize (corn) groats or meal R12,6 million R278,9 million 3.30
080290 Nuts, edible, fresh or dried R7,9 million R215,4 million 2.68
080510 Oranges, fresh or dried R120,1 million R4,4 billion 1.98
Source: Author’s own calculations
The rest of the top ten products are tea with an RCA of 9.09, vegetable seeds (4.48),
all maize products (3.92), grapefruit (3.64), maize groat (3.30), edible nuts (2.68) and
oranges (1.98). The three highest exportable products in terms of customs value are
oranges (R120 million), maize corn (R112 million) and grapefruit (R36 million).
Even though oranges have a customs value of R120 million, it only has an RCA of
1.98, the lowest figure in Table 5.5. The low RCA depicts that oranges is not a
product that Mpumalanga has a high comparative advantage in, with plenty of
opportunities to export.
5.3.3 Foodstuff
The foodstuff HS chapter includes all the edible products that are not available in the
animal and vegetable product sector. All reworked (processed) products from the
raw ingredients obtained in the animal and vegetable sector, are included in this HS
chapter.
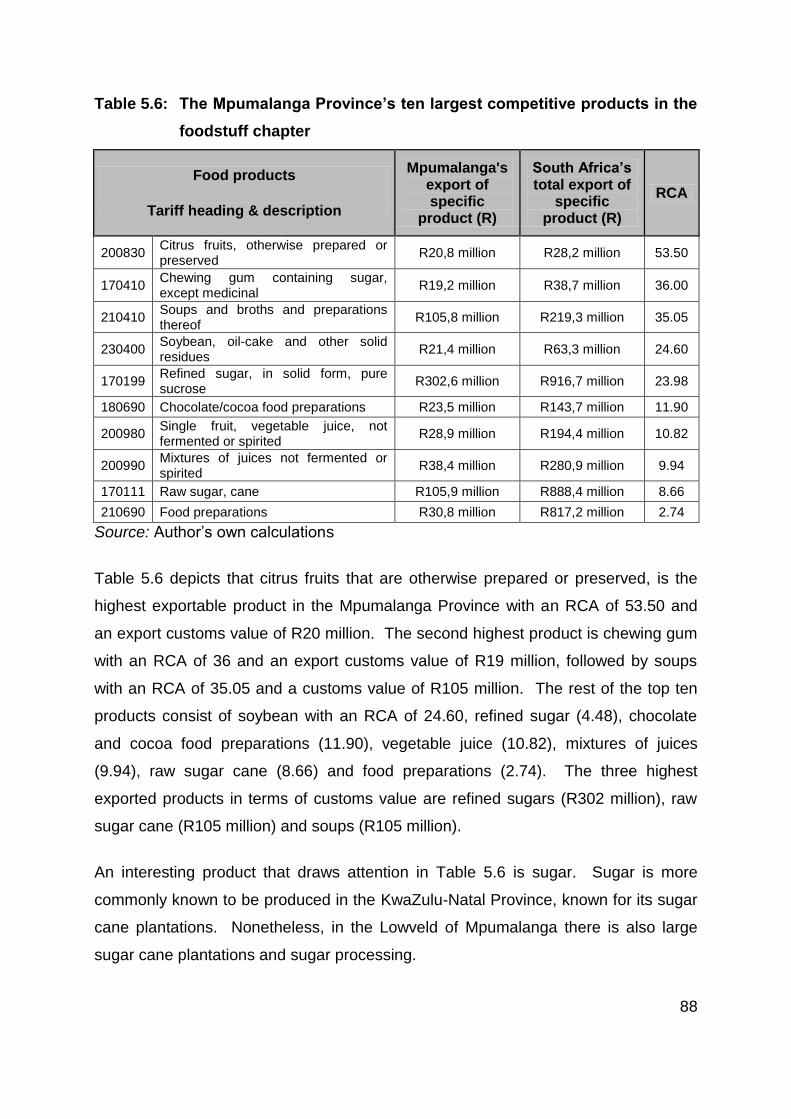
88
Table 5.6: The Mpumalanga Province’s ten largest competitive products in the
foodstuff chapter
Food products
Tariff heading & description
Mpumalanga's export of specific
product (R)
South Africa’s total export of
specific product (R)
RCA
200830 Citrus fruits, otherwise prepared or preserved
R20,8 million R28,2 million 53.50
170410 Chewing gum containing sugar, except medicinal
R19,2 million R38,7 million 36.00
210410 Soups and broths and preparations thereof
R105,8 million R219,3 million 35.05
230400 Soybean, oil-cake and other solid residues
R21,4 million R63,3 million 24.60
170199 Refined sugar, in solid form, pure sucrose
R302,6 million R916,7 million 23.98
180690 Chocolate/cocoa food preparations R23,5 million R143,7 million 11.90
200980 Single fruit, vegetable juice, not fermented or spirited
R28,9 million R194,4 million 10.82
200990 Mixtures of juices not fermented or spirited
R38,4 million R280,9 million 9.94
170111 Raw sugar, cane R105,9 million R888,4 million 8.66
210690 Food preparations R30,8 million R817,2 million 2.74
Source: Author’s own calculations
Table 5.6 depicts that citrus fruits that are otherwise prepared or preserved, is the
highest exportable product in the Mpumalanga Province with an RCA of 53.50 and
an export customs value of R20 million. The second highest product is chewing gum
with an RCA of 36 and an export customs value of R19 million, followed by soups
with an RCA of 35.05 and a customs value of R105 million. The rest of the top ten
products consist of soybean with an RCA of 24.60, refined sugar (4.48), chocolate
and cocoa food preparations (11.90), vegetable juice (10.82), mixtures of juices
(9.94), raw sugar cane (8.66) and food preparations (2.74). The three highest
exported products in terms of customs value are refined sugars (R302 million), raw
sugar cane (R105 million) and soups (R105 million).
An interesting product that draws attention in Table 5.6 is sugar. Sugar is more
commonly known to be produced in the KwaZulu-Natal Province, known for its sugar
cane plantations. Nonetheless, in the Lowveld of Mpumalanga there is also large
sugar cane plantations and sugar processing.
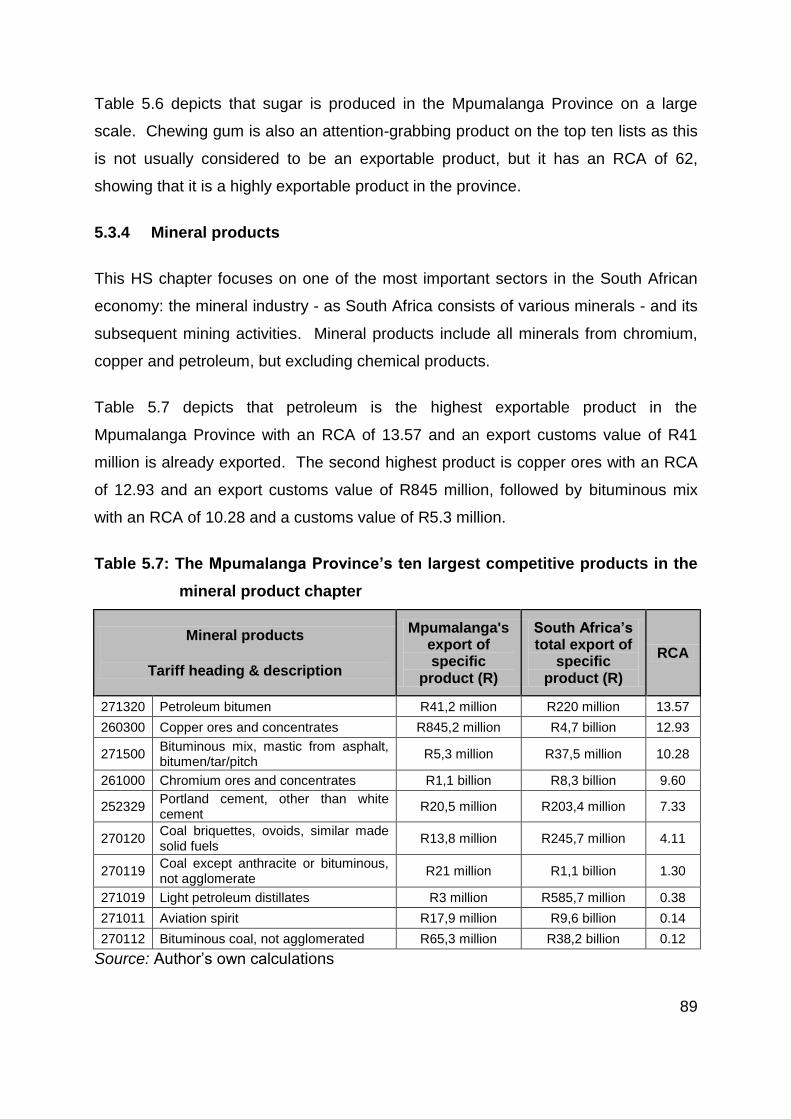
89
Table 5.6 depicts that sugar is produced in the Mpumalanga Province on a large
scale. Chewing gum is also an attention-grabbing product on the top ten lists as this
is not usually considered to be an exportable product, but it has an RCA of 62,
showing that it is a highly exportable product in the province.
5.3.4 Mineral products
This HS chapter focuses on one of the most important sectors in the South African
economy: the mineral industry - as South Africa consists of various minerals - and its
subsequent mining activities. Mineral products include all minerals from chromium,
copper and petroleum, but excluding chemical products.
Table 5.7 depicts that petroleum is the highest exportable product in the
Mpumalanga Province with an RCA of 13.57 and an export customs value of R41
million is already exported. The second highest product is copper ores with an RCA
of 12.93 and an export customs value of R845 million, followed by bituminous mix
with an RCA of 10.28 and a customs value of R5.3 million.
Table 5.7: The Mpumalanga Province’s ten largest competitive products in the
mineral product chapter
Mineral products
Tariff heading & description
Mpumalanga's export of specific
product (R)
South Africa’s total export of
specific product (R)
RCA
271320 Petroleum bitumen R41,2 million R220 million 13.57
260300 Copper ores and concentrates R845,2 million R4,7 billion 12.93
271500 Bituminous mix, mastic from asphalt, bitumen/tar/pitch
R5,3 million R37,5 million 10.28
261000 Chromium ores and concentrates R1,1 billion R8,3 billion 9.60
252329 Portland cement, other than white cement
R20,5 million R203,4 million 7.33
270120 Coal briquettes, ovoids, similar made solid fuels
R13,8 million R245,7 million 4.11
270119 Coal except anthracite or bituminous, not agglomerate
R21 million R1,1 billion 1.30
271019 Light petroleum distillates R3 million R585,7 million 0.38
271011 Aviation spirit R17,9 million R9,6 billion 0.14
270112 Bituminous coal, not agglomerated R65,3 million R38,2 billion 0.12
Source: Author’s own calculations
90
The rest of the top ten products consist of chromium ores with an RCA of 9.60,
Portland cement (7.33), coal briquettes (4.11), coal (1.30), light petroleum distillates
(0.38), aviation spirit (0.14) and bituminous coal (0.12). The three highest exportable
products in terms of customs value are chromium ores (R1.1 billion), copper ores
(R845 million) and bituminous coal (R65 million).
Two discussion points in Table 5.7 are petroleum bitumen and aviation spirit. These
two products both have an RCA below 1, showing that these two products are seen
as comparative disadvantaged in the Mpumalanga Province. Petroleum bitumen and
aviation spirit are only listed amongst the ten highest export products with
comparative advantage, because of their high export values. Petroleum bitumen has
a custom value of R41 million and aviation spirit has a value of R17 million. The
RCA value of petroleum bitumen is 13.57, while aviation spirit is only 0.14. There is
also a large difference in the RCA of petroleum bitumen (13.57) and light petroleum
distillates (0.38).
The mineral sector in the Mpumalanga Province is the drive behind economy activity
in the province due the amount of copper mined and industries that are situated in
the province.
5.3.5 Chemicals and allied industries
The chemical products and allied industries sector covers all products and industries
in the washing and cleaning preparations, oral and dental hygiene soaps, paints and
matches.
Table 5.8 shows that manganese oxide is the highest exportable chemical product in
the Mpumalanga Province with an RCA of 28.60 and an export customs value of R28
million.
The second highest product is oral and dental hygiene preparations with an RCA of
25.76 and an export customs value of R39 million, followed by washing and cleaning
preparations with an RCA of 23.45 and a customs value of R39 million. The rest of
the top ten products consist of organic surfactant washing and cleaning preparations
with an RCA of 19.81, polyester based paints (18.58), acrylic and vinyl polymer
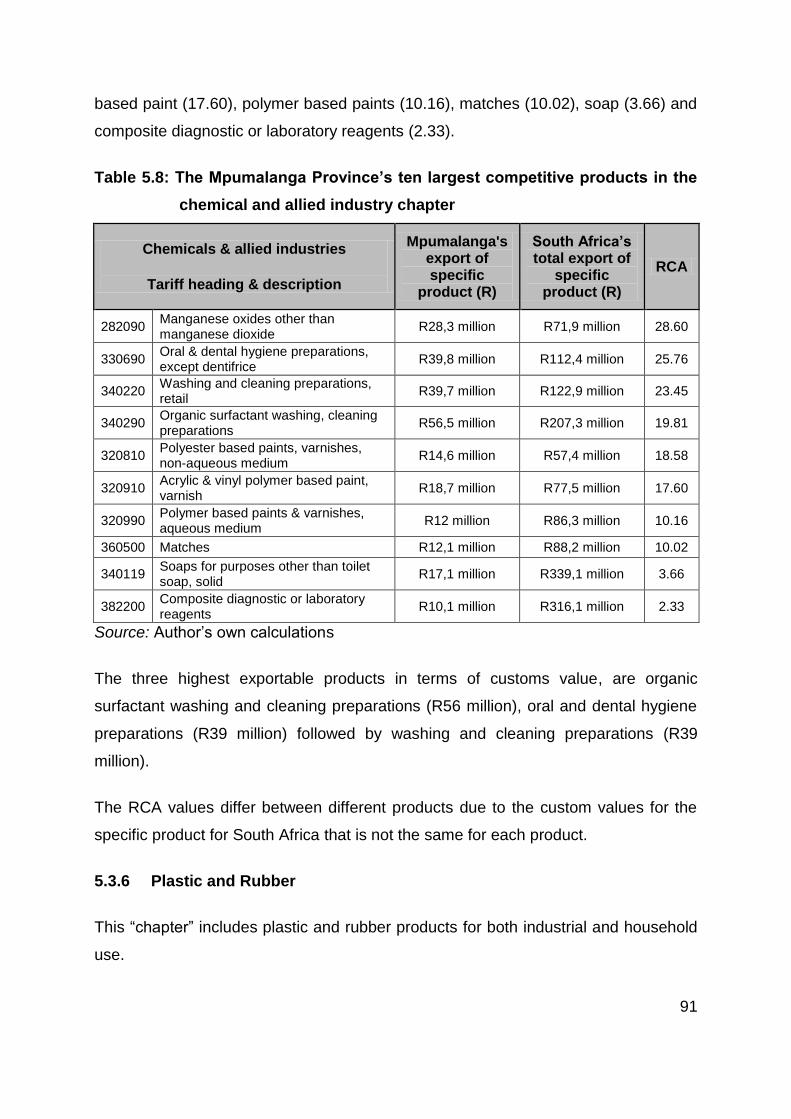
91
based paint (17.60), polymer based paints (10.16), matches (10.02), soap (3.66) and
composite diagnostic or laboratory reagents (2.33).
Table 5.8: The Mpumalanga Province’s ten largest competitive products in the
chemical and allied industry chapter
Chemicals & allied industries
Tariff heading & description
Mpumalanga's export of specific
product (R)
South Africa’s total export of
specific product (R)
RCA
282090 Manganese oxides other than manganese dioxide
R28,3 million R71,9 million 28.60
330690 Oral & dental hygiene preparations, except dentifrice
R39,8 million R112,4 million 25.76
340220 Washing and cleaning preparations, retail
R39,7 million R122,9 million 23.45
340290 Organic surfactant washing, cleaning preparations
R56,5 million R207,3 million 19.81
320810 Polyester based paints, varnishes, non-aqueous medium
R14,6 million R57,4 million 18.58
320910 Acrylic & vinyl polymer based paint, varnish
R18,7 million R77,5 million 17.60
320990 Polymer based paints & varnishes, aqueous medium
R12 million R86,3 million 10.16
360500 Matches R12,1 million R88,2 million 10.02
340119 Soaps for purposes other than toilet soap, solid
R17,1 million R339,1 million 3.66
382200 Composite diagnostic or laboratory reagents
R10,1 million R316,1 million 2.33
Source: Author’s own calculations
The three highest exportable products in terms of customs value, are organic
surfactant washing and cleaning preparations (R56 million), oral and dental hygiene
preparations (R39 million) followed by washing and cleaning preparations (R39
million).
The RCA values differ between different products due to the custom values for the
specific product for South Africa that is not the same for each product.
5.3.6 Plastic and Rubber
This “chapter” includes plastic and rubber products for both industrial and household
use.
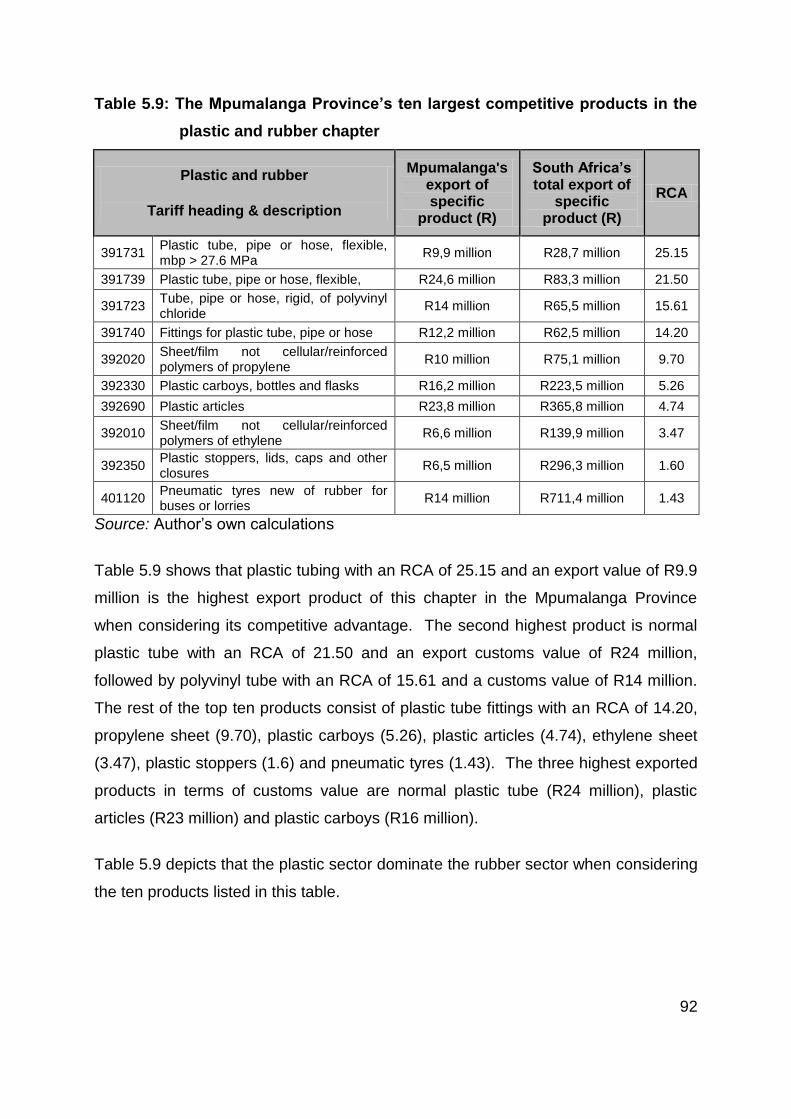
92
Table 5.9: The Mpumalanga Province’s ten largest competitive products in the
plastic and rubber chapter
Plastic and rubber
Tariff heading & description
Mpumalanga's export of specific
product (R)
South Africa’s total export of
specific product (R)
RCA
391731 Plastic tube, pipe or hose, flexible, mbp > 27.6 MPa
R9,9 million R28,7 million 25.15
391739 Plastic tube, pipe or hose, flexible, R24,6 million R83,3 million 21.50
391723 Tube, pipe or hose, rigid, of polyvinyl chloride
R14 million R65,5 million 15.61
391740 Fittings for plastic tube, pipe or hose R12,2 million R62,5 million 14.20
392020 Sheet/film not cellular/reinforced polymers of propylene
R10 million R75,1 million 9.70
392330 Plastic carboys, bottles and flasks R16,2 million R223,5 million 5.26
392690 Plastic articles R23,8 million R365,8 million 4.74
392010 Sheet/film not cellular/reinforced polymers of ethylene
R6,6 million R139,9 million 3.47
392350 Plastic stoppers, lids, caps and other closures
R6,5 million R296,3 million 1.60
401120 Pneumatic tyres new of rubber for buses or lorries
R14 million R711,4 million 1.43
Source: Author’s own calculations
Table 5.9 shows that plastic tubing with an RCA of 25.15 and an export value of R9.9
million is the highest export product of this chapter in the Mpumalanga Province
when considering its competitive advantage. The second highest product is normal
plastic tube with an RCA of 21.50 and an export customs value of R24 million,
followed by polyvinyl tube with an RCA of 15.61 and a customs value of R14 million.
The rest of the top ten products consist of plastic tube fittings with an RCA of 14.20,
propylene sheet (9.70), plastic carboys (5.26), plastic articles (4.74), ethylene sheet
(3.47), plastic stoppers (1.6) and pneumatic tyres (1.43). The three highest exported
products in terms of customs value are normal plastic tube (R24 million), plastic
articles (R23 million) and plastic carboys (R16 million).
Table 5.9 depicts that the plastic sector dominate the rubber sector when considering
the ten products listed in this table.
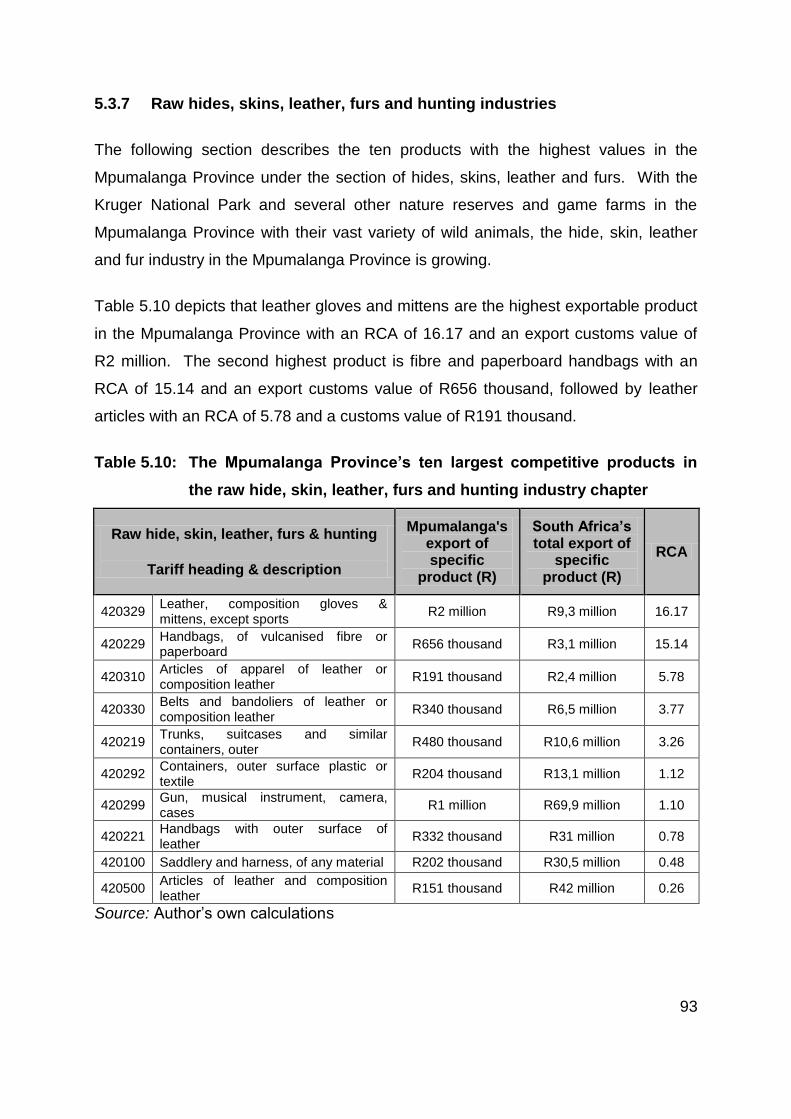
93
5.3.7 Raw hides, skins, leather, furs and hunting industries
The following section describes the ten products with the highest values in the
Mpumalanga Province under the section of hides, skins, leather and furs. With the
Kruger National Park and several other nature reserves and game farms in the
Mpumalanga Province with their vast variety of wild animals, the hide, skin, leather
and fur industry in the Mpumalanga Province is growing.
Table 5.10 depicts that leather gloves and mittens are the highest exportable product
in the Mpumalanga Province with an RCA of 16.17 and an export customs value of
R2 million. The second highest product is fibre and paperboard handbags with an
RCA of 15.14 and an export customs value of R656 thousand, followed by leather
articles with an RCA of 5.78 and a customs value of R191 thousand.
Table 5.10: The Mpumalanga Province’s ten largest competitive products in
the raw hide, skin, leather, furs and hunting industry chapter
Raw hide, skin, leather, furs & hunting
Tariff heading & description
Mpumalanga's export of specific
product (R)
South Africa’s total export of
specific product (R)
RCA
420329 Leather, composition gloves & mittens, except sports
R2 million R9,3 million 16.17
420229 Handbags, of vulcanised fibre or paperboard
R656 thousand R3,1 million 15.14
420310 Articles of apparel of leather or composition leather
R191 thousand R2,4 million 5.78
420330 Belts and bandoliers of leather or composition leather
R340 thousand R6,5 million 3.77
420219 Trunks, suitcases and similar containers, outer
R480 thousand R10,6 million 3.26
420292 Containers, outer surface plastic or textile
R204 thousand R13,1 million 1.12
420299 Gun, musical instrument, camera, cases
R1 million R69,9 million 1.10
420221 Handbags with outer surface of leather
R332 thousand R31 million 0.78
420100 Saddlery and harness, of any material R202 thousand R30,5 million 0.48
420500 Articles of leather and composition leather
R151 thousand R42 million 0.26
Source: Author’s own calculations
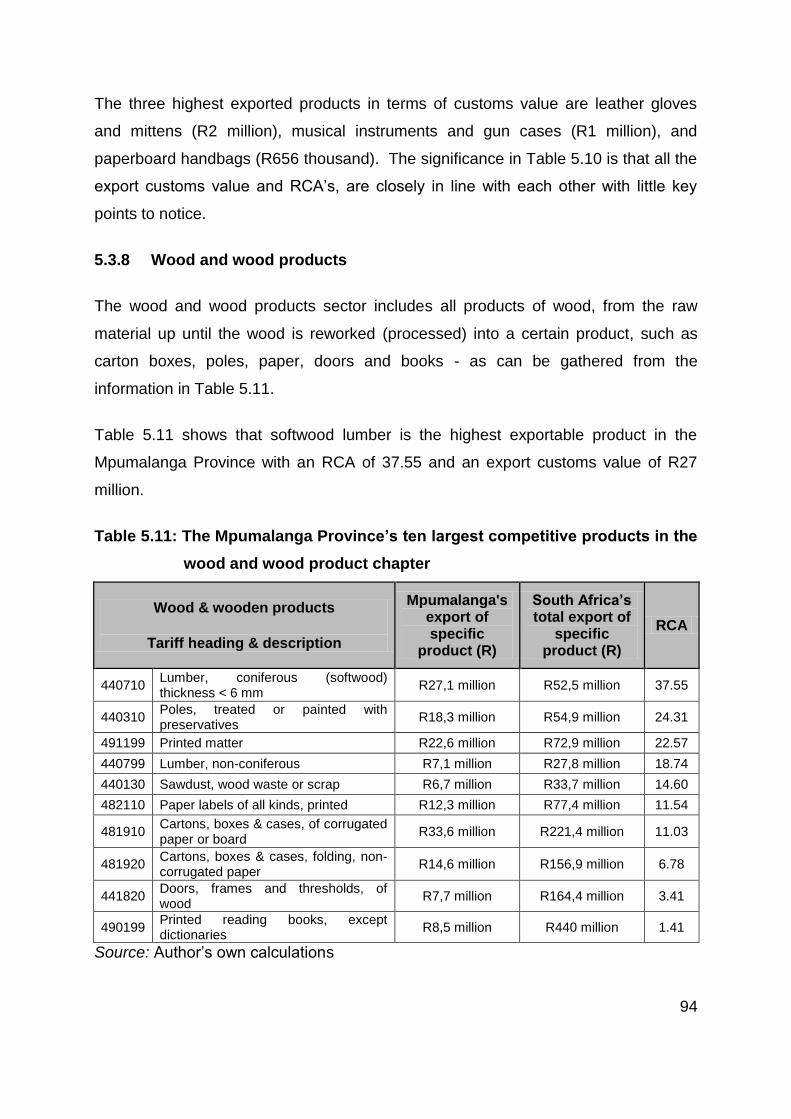
94
The three highest exported products in terms of customs value are leather gloves
and mittens (R2 million), musical instruments and gun cases (R1 million), and
paperboard handbags (R656 thousand). The significance in Table 5.10 is that all the
export customs value and RCA’s, are closely in line with each other with little key
points to notice.
5.3.8 Wood and wood products
The wood and wood products sector includes all products of wood, from the raw
material up until the wood is reworked (processed) into a certain product, such as
carton boxes, poles, paper, doors and books - as can be gathered from the
information in Table 5.11.
Table 5.11 shows that softwood lumber is the highest exportable product in the
Mpumalanga Province with an RCA of 37.55 and an export customs value of R27
million.
Table 5.11: The Mpumalanga Province’s ten largest competitive products in the
wood and wood product chapter
Wood & wooden products
Tariff heading & description
Mpumalanga's export of specific
product (R)
South Africa’s total export of
specific product (R)
RCA
440710 Lumber, coniferous (softwood) thickness < 6 mm
R27,1 million R52,5 million 37.55
440310 Poles, treated or painted with preservatives
R18,3 million R54,9 million 24.31
491199 Printed matter R22,6 million R72,9 million 22.57
440799 Lumber, non-coniferous R7,1 million R27,8 million 18.74
440130 Sawdust, wood waste or scrap R6,7 million R33,7 million 14.60
482110 Paper labels of all kinds, printed R12,3 million R77,4 million 11.54
481910 Cartons, boxes & cases, of corrugated paper or board
R33,6 million R221,4 million 11.03
481920 Cartons, boxes & cases, folding, non-corrugated paper
R14,6 million R156,9 million 6.78
441820 Doors, frames and thresholds, of wood
R7,7 million R164,4 million 3.41
490199 Printed reading books, except dictionaries
R8,5 million R440 million 1.41
Source: Author’s own calculations
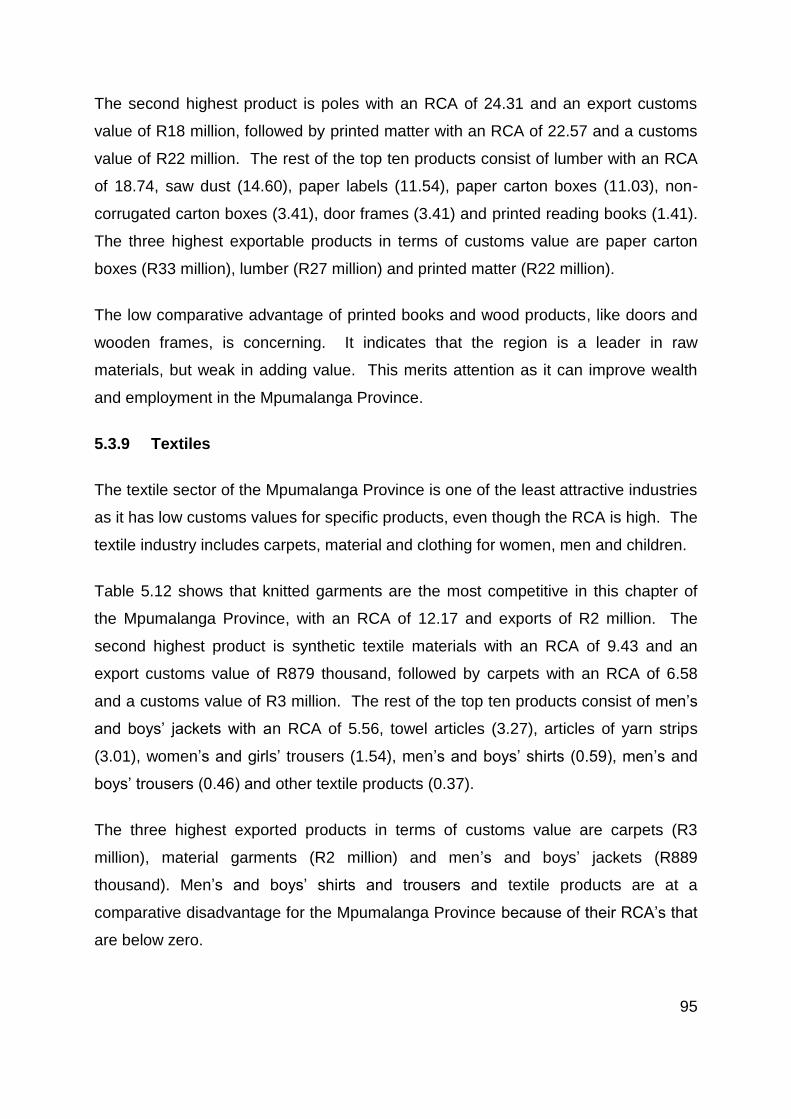
95
The second highest product is poles with an RCA of 24.31 and an export customs
value of R18 million, followed by printed matter with an RCA of 22.57 and a customs
value of R22 million. The rest of the top ten products consist of lumber with an RCA
of 18.74, saw dust (14.60), paper labels (11.54), paper carton boxes (11.03), non-
corrugated carton boxes (3.41), door frames (3.41) and printed reading books (1.41).
The three highest exportable products in terms of customs value are paper carton
boxes (R33 million), lumber (R27 million) and printed matter (R22 million).
The low comparative advantage of printed books and wood products, like doors and
wooden frames, is concerning. It indicates that the region is a leader in raw
materials, but weak in adding value. This merits attention as it can improve wealth
and employment in the Mpumalanga Province.
5.3.9 Textiles
The textile sector of the Mpumalanga Province is one of the least attractive industries
as it has low customs values for specific products, even though the RCA is high. The
textile industry includes carpets, material and clothing for women, men and children.
Table 5.12 shows that knitted garments are the most competitive in this chapter of
the Mpumalanga Province, with an RCA of 12.17 and exports of R2 million. The
second highest product is synthetic textile materials with an RCA of 9.43 and an
export customs value of R879 thousand, followed by carpets with an RCA of 6.58
and a customs value of R3 million. The rest of the top ten products consist of men’s
and boys’ jackets with an RCA of 5.56, towel articles (3.27), articles of yarn strips
(3.01), women’s and girls’ trousers (1.54), men’s and boys’ shirts (0.59), men’s and
boys’ trousers (0.46) and other textile products (0.37).
The three highest exported products in terms of customs value are carpets (R3
million), material garments (R2 million) and men’s and boys’ jackets (R889
thousand). Men’s and boys’ shirts and trousers and textile products are at a
comparative disadvantage for the Mpumalanga Province because of their RCA’s that
are below zero.
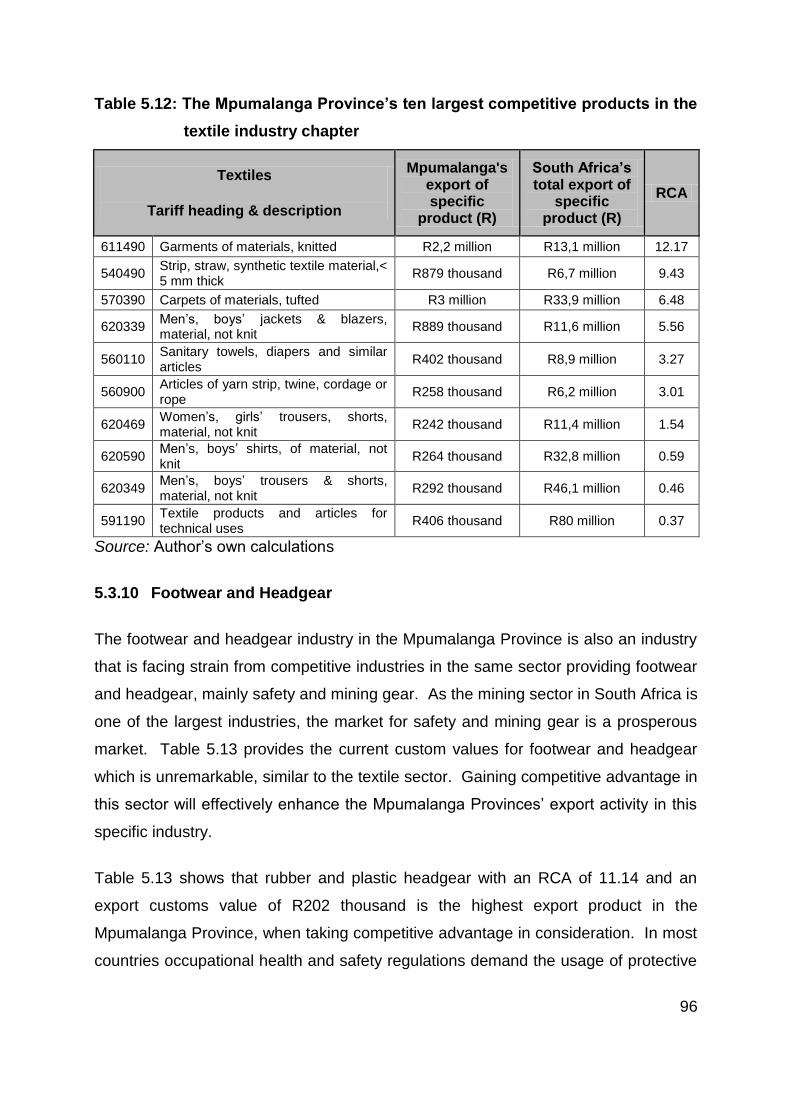
96
Table 5.12: The Mpumalanga Province’s ten largest competitive products in the
textile industry chapter
Textiles
Tariff heading & description
Mpumalanga's export of specific
product (R)
South Africa’s total export of
specific product (R)
RCA
611490 Garments of materials, knitted R2,2 million R13,1 million 12.17
540490 Strip, straw, synthetic textile material,< 5 mm thick
R879 thousand R6,7 million 9.43
570390 Carpets of materials, tufted R3 million R33,9 million 6.48
620339 Men’s, boys’ jackets & blazers, material, not knit
R889 thousand R11,6 million 5.56
560110 Sanitary towels, diapers and similar articles
R402 thousand R8,9 million 3.27
560900 Articles of yarn strip, twine, cordage or rope
R258 thousand R6,2 million 3.01
620469 Women’s, girls’ trousers, shorts, material, not knit
R242 thousand R11,4 million 1.54
620590 Men’s, boys’ shirts, of material, not knit
R264 thousand R32,8 million 0.59
620349 Men’s, boys’ trousers & shorts, material, not knit
R292 thousand R46,1 million 0.46
591190 Textile products and articles for technical uses
R406 thousand R80 million 0.37
Source: Author’s own calculations
5.3.10 Footwear and Headgear
The footwear and headgear industry in the Mpumalanga Province is also an industry
that is facing strain from competitive industries in the same sector providing footwear
and headgear, mainly safety and mining gear. As the mining sector in South Africa is
one of the largest industries, the market for safety and mining gear is a prosperous
market. Table 5.13 provides the current custom values for footwear and headgear
which is unremarkable, similar to the textile sector. Gaining competitive advantage in
this sector will effectively enhance the Mpumalanga Provinces’ export activity in this
specific industry.
Table 5.13 shows that rubber and plastic headgear with an RCA of 11.14 and an
export customs value of R202 thousand is the highest export product in the
Mpumalanga Province, when taking competitive advantage in consideration. In most
countries occupational health and safety regulations demand the usage of protective
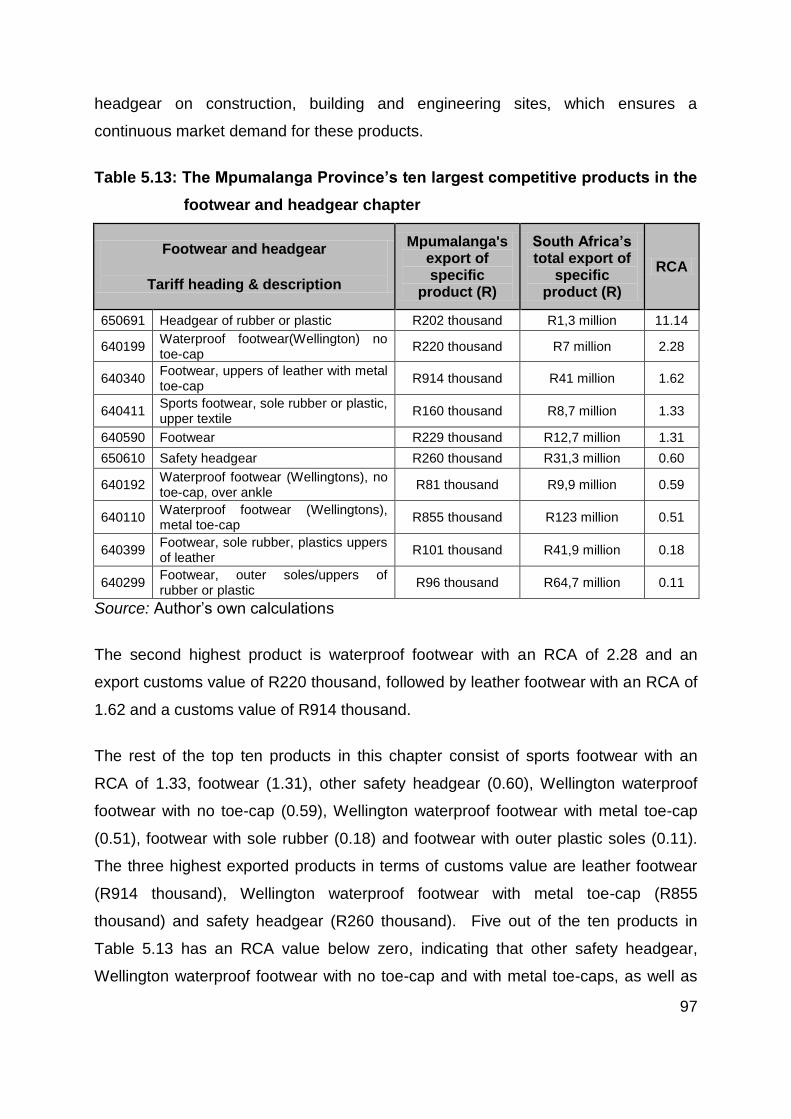
97
headgear on construction, building and engineering sites, which ensures a
continuous market demand for these products.
Table 5.13: The Mpumalanga Province’s ten largest competitive products in the
footwear and headgear chapter
Footwear and headgear
Tariff heading & description
Mpumalanga's export of specific
product (R)
South Africa’s total export of
specific product (R)
RCA
650691 Headgear of rubber or plastic R202 thousand R1,3 million 11.14
640199 Waterproof footwear(Wellington) no toe-cap
R220 thousand R7 million 2.28
640340 Footwear, uppers of leather with metal toe-cap
R914 thousand R41 million 1.62
640411 Sports footwear, sole rubber or plastic, upper textile
R160 thousand R8,7 million 1.33
640590 Footwear R229 thousand R12,7 million 1.31
650610 Safety headgear R260 thousand R31,3 million 0.60
640192 Waterproof footwear (Wellingtons), no toe-cap, over ankle
R81 thousand R9,9 million 0.59
640110 Waterproof footwear (Wellingtons), metal toe-cap
R855 thousand R123 million 0.51
640399 Footwear, sole rubber, plastics uppers of leather
R101 thousand R41,9 million 0.18
640299 Footwear, outer soles/uppers of rubber or plastic
R96 thousand R64,7 million 0.11
Source: Author’s own calculations
The second highest product is waterproof footwear with an RCA of 2.28 and an
export customs value of R220 thousand, followed by leather footwear with an RCA of
1.62 and a customs value of R914 thousand.
The rest of the top ten products in this chapter consist of sports footwear with an
RCA of 1.33, footwear (1.31), other safety headgear (0.60), Wellington waterproof
footwear with no toe-cap (0.59), Wellington waterproof footwear with metal toe-cap
(0.51), footwear with sole rubber (0.18) and footwear with outer plastic soles (0.11).
The three highest exported products in terms of customs value are leather footwear
(R914 thousand), Wellington waterproof footwear with metal toe-cap (R855
thousand) and safety headgear (R260 thousand). Five out of the ten products in
Table 5.13 has an RCA value below zero, indicating that other safety headgear,
Wellington waterproof footwear with no toe-cap and with metal toe-caps, as well as
98
footwear with rubber soles and plastic soles, have no comparative advantage in the
Mpumalanga Province.
5.3.11 Stone and glass
This industry includes all glass and stone articles. This industry, taken into account
the low custom values for textiles, as well as the footwear and headgear industry,
has significantly improved its custom values. Table 5.14 depicts all glassware and
stone products, such as glass containers, ceramic bathroom items and also safety
glass for windscreens.
Table 5.14 depicts that insulating units of glass, with an RCA of 25.06 and an export
customs value of R2 million, is the highest exported product in the Mpumalanga
Province, and also the most competitive when considering the RCA value.
Table 5.14: The Mpumalanga Province’s ten largest competitive products in the
stone and glass chapter
Stone & glassware
Tariff heading & description
Mpumalanga's export of specific
product (R)
South Africa’s total export of
specific product (R)
RCA
700800 Multiple-walled insulating units of glass
R2 million R6 million 25.06
680919 Plaster boards etc not ornamental, reinforced
R728 thousand R4,6 million 11.34
680690 Mineral heat or sound insulating materials & articles
R739 thousand R6,7 million 7.92
701090 Glass containers for packing or conveyance goods
R14,8 million R200,8 million 5.36
700729 Safety glass, laminated, non vehicle use
R689 thousand R18,3 million 2.73
700510 Float glass sheets, absorbent or reflecting layer
R1,2 million R39,1 million 2.23
691090 Ceramic bathroom & kitchen sanitary items, not porcelain
R1,3 million R54,5 million 1.83
690290 Refractory bricks R594 thousand R26,1 million 1.65
701990 Glass fibres, glass wool and articles thereof
R589 thousand R45,3 million 0.94
690890 Glazed ceramic flags, tiles wider than 7 cm
R1,3 million R143,2 million 0.68
Source: Author’s own calculations
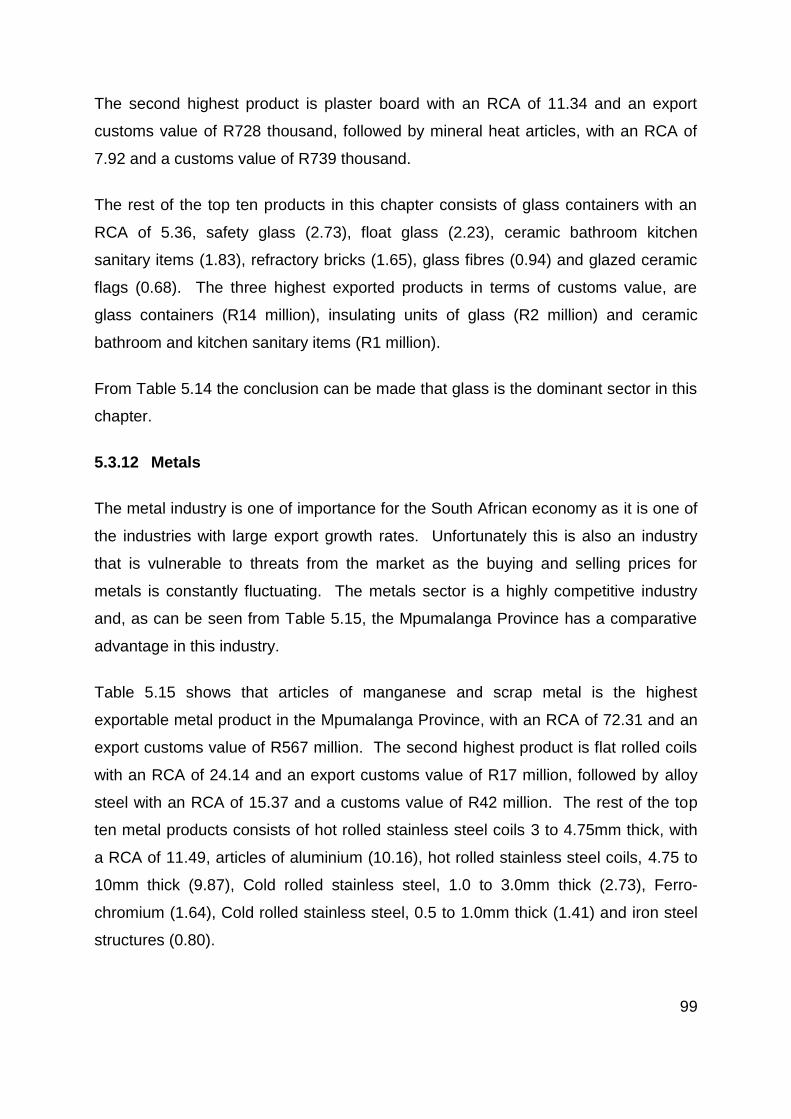
99
The second highest product is plaster board with an RCA of 11.34 and an export
customs value of R728 thousand, followed by mineral heat articles, with an RCA of
7.92 and a customs value of R739 thousand.
The rest of the top ten products in this chapter consists of glass containers with an
RCA of 5.36, safety glass (2.73), float glass (2.23), ceramic bathroom kitchen
sanitary items (1.83), refractory bricks (1.65), glass fibres (0.94) and glazed ceramic
flags (0.68). The three highest exported products in terms of customs value, are
glass containers (R14 million), insulating units of glass (R2 million) and ceramic
bathroom and kitchen sanitary items (R1 million).
From Table 5.14 the conclusion can be made that glass is the dominant sector in this
chapter.
5.3.12 Metals
The metal industry is one of importance for the South African economy as it is one of
the industries with large export growth rates. Unfortunately this is also an industry
that is vulnerable to threats from the market as the buying and selling prices for
metals is constantly fluctuating. The metals sector is a highly competitive industry
and, as can be seen from Table 5.15, the Mpumalanga Province has a comparative
advantage in this industry.
Table 5.15 shows that articles of manganese and scrap metal is the highest
exportable metal product in the Mpumalanga Province, with an RCA of 72.31 and an
export customs value of R567 million. The second highest product is flat rolled coils
with an RCA of 24.14 and an export customs value of R17 million, followed by alloy
steel with an RCA of 15.37 and a customs value of R42 million. The rest of the top
ten metal products consists of hot rolled stainless steel coils 3 to 4.75mm thick, with
a RCA of 11.49, articles of aluminium (10.16), hot rolled stainless steel coils, 4.75 to
10mm thick (9.87), Cold rolled stainless steel, 1.0 to 3.0mm thick (2.73), Ferro-
chromium (1.64), Cold rolled stainless steel, 0.5 to 1.0mm thick (1.41) and iron steel
structures (0.80).
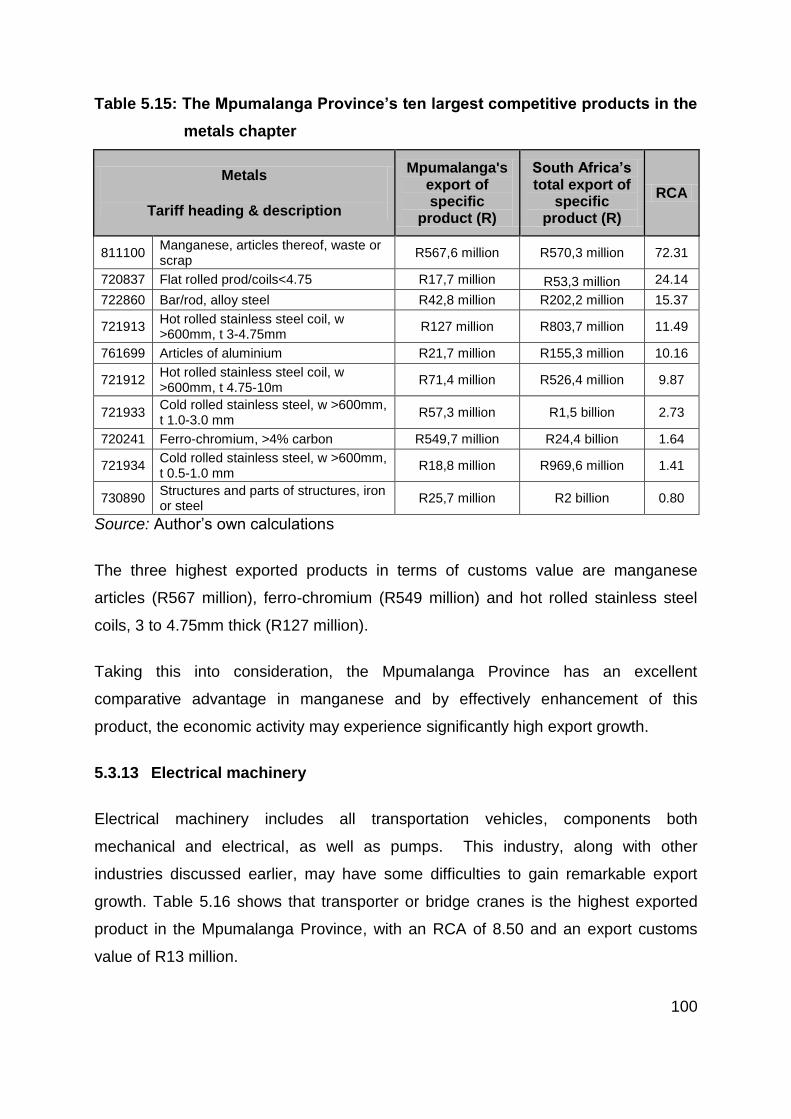
100
Table 5.15: The Mpumalanga Province’s ten largest competitive products in the
metals chapter
Metals
Tariff heading & description
Mpumalanga's export of specific
product (R)
South Africa’s total export of
specific product (R)
RCA
811100 Manganese, articles thereof, waste or scrap
R567,6 million R570,3 million 72.31
720837 Flat rolled prod/coils<4.75 R17,7 million R53,3 million 24.14
722860 Bar/rod, alloy steel R42,8 million R202,2 million 15.37
721913 Hot rolled stainless steel coil, w >600mm, t 3-4.75mm
R127 million R803,7 million 11.49
761699 Articles of aluminium R21,7 million R155,3 million 10.16
721912 Hot rolled stainless steel coil, w >600mm, t 4.75-10m
R71,4 million R526,4 million 9.87
721933 Cold rolled stainless steel, w >600mm, t 1.0-3.0 mm
R57,3 million R1,5 billion 2.73
720241 Ferro-chromium, >4% carbon R549,7 million R24,4 billion 1.64
721934 Cold rolled stainless steel, w >600mm, t 0.5-1.0 mm
R18,8 million R969,6 million 1.41
730890 Structures and parts of structures, iron or steel
R25,7 million R2 billion 0.80
Source: Author’s own calculations
The three highest exported products in terms of customs value are manganese
articles (R567 million), ferro-chromium (R549 million) and hot rolled stainless steel
coils, 3 to 4.75mm thick (R127 million).
Taking this into consideration, the Mpumalanga Province has an excellent
comparative advantage in manganese and by effectively enhancement of this
product, the economic activity may experience significantly high export growth.
5.3.13 Electrical machinery
Electrical machinery includes all transportation vehicles, components both
mechanical and electrical, as well as pumps. This industry, along with other
industries discussed earlier, may have some difficulties to gain remarkable export
growth. Table 5.16 shows that transporter or bridge cranes is the highest exported
product in the Mpumalanga Province, with an RCA of 8.50 and an export customs
value of R13 million.
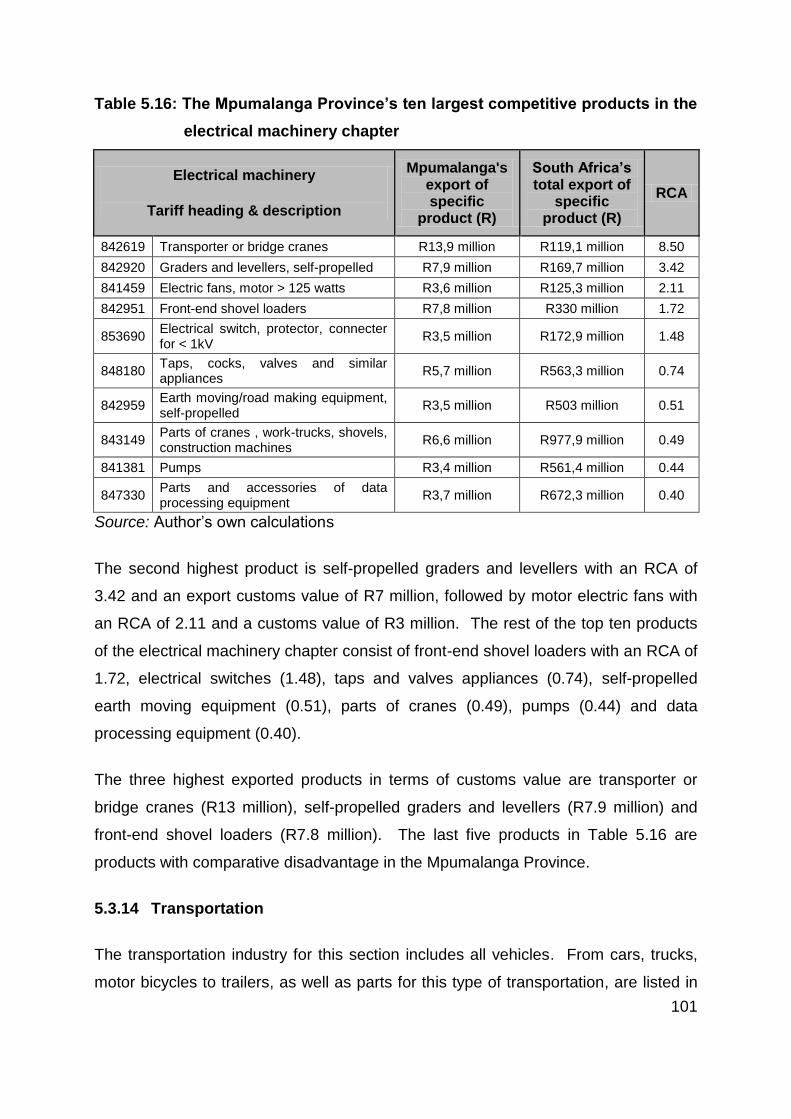
101
Table 5.16: The Mpumalanga Province’s ten largest competitive products in the
electrical machinery chapter
Electrical machinery
Tariff heading & description
Mpumalanga's export of specific
product (R)
South Africa’s total export of
specific product (R)
RCA
842619 Transporter or bridge cranes R13,9 million R119,1 million 8.50
842920 Graders and levellers, self-propelled R7,9 million R169,7 million 3.42
841459 Electric fans, motor > 125 watts R3,6 million R125,3 million 2.11
842951 Front-end shovel loaders R7,8 million R330 million 1.72
853690 Electrical switch, protector, connecter for < 1kV
R3,5 million R172,9 million 1.48
848180 Taps, cocks, valves and similar appliances
R5,7 million R563,3 million 0.74
842959 Earth moving/road making equipment, self-propelled
R3,5 million R503 million 0.51
843149 Parts of cranes , work-trucks, shovels, construction machines
R6,6 million R977,9 million 0.49
841381 Pumps R3,4 million R561,4 million 0.44
847330 Parts and accessories of data processing equipment
R3,7 million R672,3 million 0.40
Source: Author’s own calculations
The second highest product is self-propelled graders and levellers with an RCA of
3.42 and an export customs value of R7 million, followed by motor electric fans with
an RCA of 2.11 and a customs value of R3 million. The rest of the top ten products
of the electrical machinery chapter consist of front-end shovel loaders with an RCA of
1.72, electrical switches (1.48), taps and valves appliances (0.74), self-propelled
earth moving equipment (0.51), parts of cranes (0.49), pumps (0.44) and data
processing equipment (0.40).
The three highest exported products in terms of customs value are transporter or
bridge cranes (R13 million), self-propelled graders and levellers (R7.9 million) and
front-end shovel loaders (R7.8 million). The last five products in Table 5.16 are
products with comparative disadvantage in the Mpumalanga Province.
5.3.14 Transportation
The transportation industry for this section includes all vehicles. From cars, trucks,
motor bicycles to trailers, as well as parts for this type of transportation, are listed in
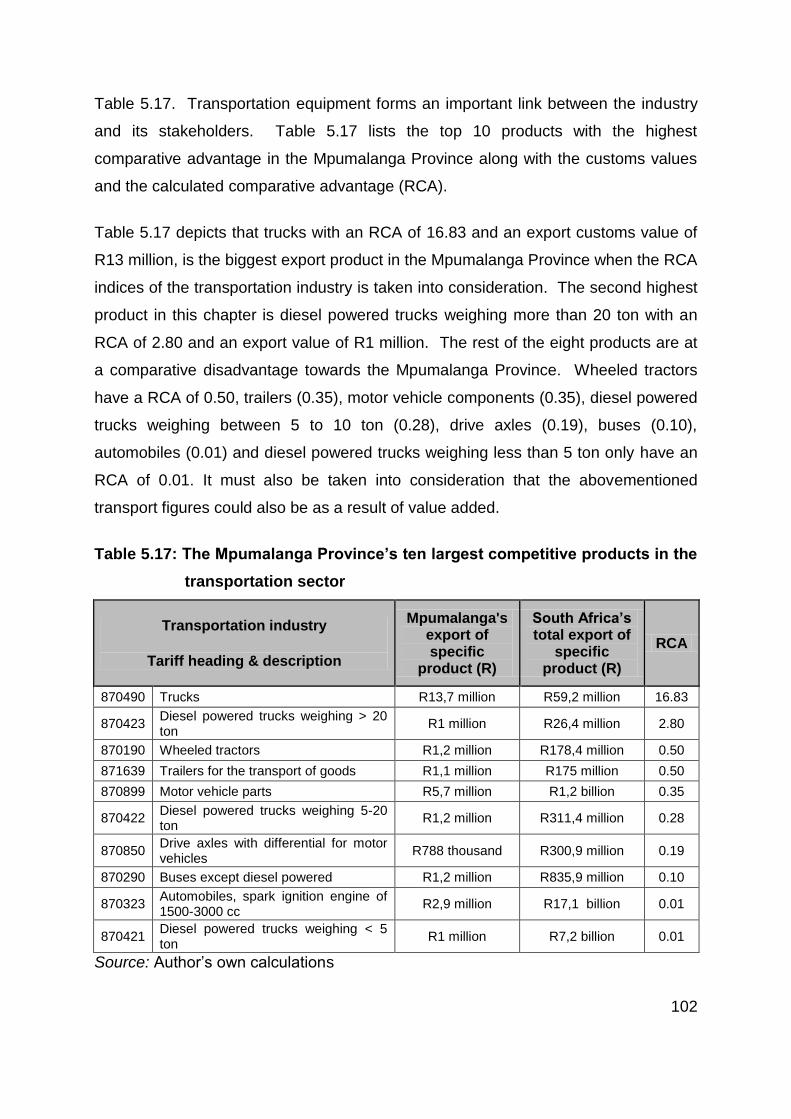
102
Table 5.17. Transportation equipment forms an important link between the industry
and its stakeholders. Table 5.17 lists the top 10 products with the highest
comparative advantage in the Mpumalanga Province along with the customs values
and the calculated comparative advantage (RCA).
Table 5.17 depicts that trucks with an RCA of 16.83 and an export customs value of
R13 million, is the biggest export product in the Mpumalanga Province when the RCA
indices of the transportation industry is taken into consideration. The second highest
product in this chapter is diesel powered trucks weighing more than 20 ton with an
RCA of 2.80 and an export value of R1 million. The rest of the eight products are at
a comparative disadvantage towards the Mpumalanga Province. Wheeled tractors
have a RCA of 0.50, trailers (0.35), motor vehicle components (0.35), diesel powered
trucks weighing between 5 to 10 ton (0.28), drive axles (0.19), buses (0.10),
automobiles (0.01) and diesel powered trucks weighing less than 5 ton only have an
RCA of 0.01. It must also be taken into consideration that the abovementioned
transport figures could also be as a result of value added.
Table 5.17: The Mpumalanga Province’s ten largest competitive products in the
transportation sector
Transportation industry
Tariff heading & description
Mpumalanga's export of specific
product (R)
South Africa’s total export of
specific product (R)
RCA
870490 Trucks R13,7 million R59,2 million 16.83
870423 Diesel powered trucks weighing > 20 ton
R1 million R26,4 million 2.80
870190 Wheeled tractors R1,2 million R178,4 million 0.50
871639 Trailers for the transport of goods R1,1 million R175 million 0.50
870899 Motor vehicle parts R5,7 million R1,2 billion 0.35
870422 Diesel powered trucks weighing 5-20 ton
R1,2 million R311,4 million 0.28
870850 Drive axles with differential for motor vehicles
R788 thousand R300,9 million 0.19
870290 Buses except diesel powered R1,2 million R835,9 million 0.10
870323 Automobiles, spark ignition engine of 1500-3000 cc
R2,9 million R17,1 billion 0.01
870421 Diesel powered trucks weighing < 5 ton
R1 million R7,2 billion 0.01
Source: Author’s own calculations
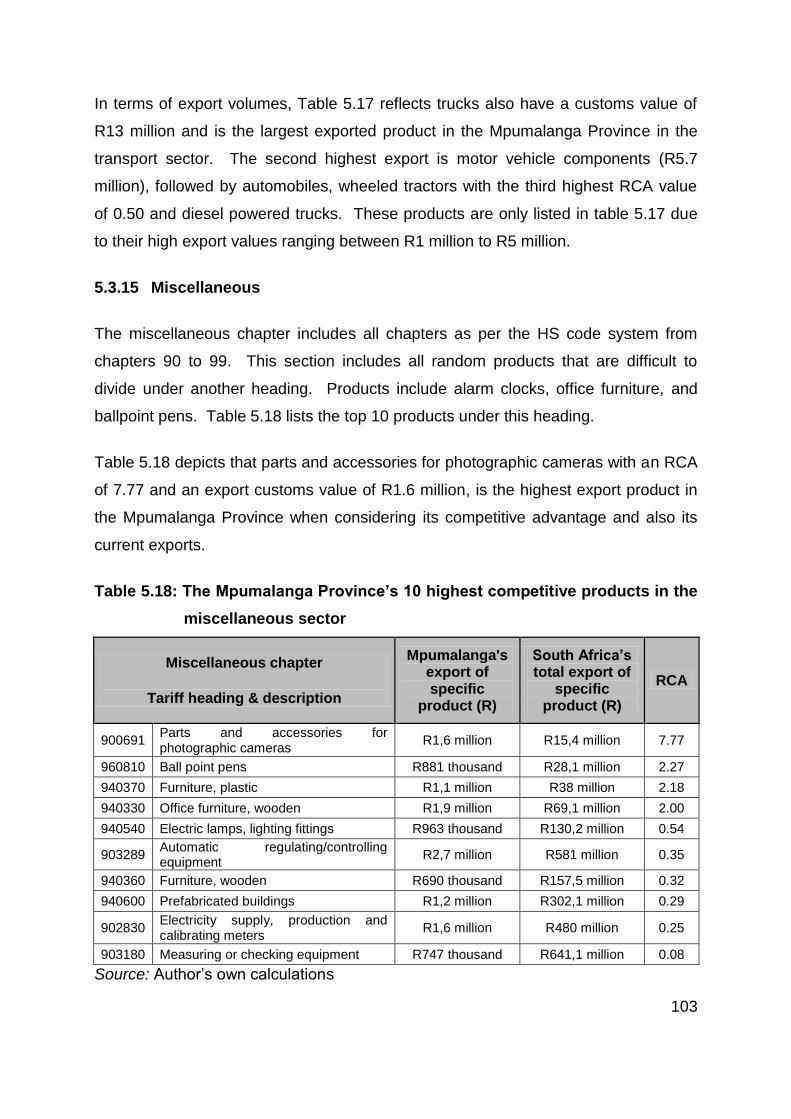
103
In terms of export volumes, Table 5.17 reflects trucks also have a customs value of
R13 million and is the largest exported product in the Mpumalanga Province in the
transport sector. The second highest export is motor vehicle components (R5.7
million), followed by automobiles, wheeled tractors with the third highest RCA value
of 0.50 and diesel powered trucks. These products are only listed in table 5.17 due
to their high export values ranging between R1 million to R5 million.
5.3.15 Miscellaneous
The miscellaneous chapter includes all chapters as per the HS code system from
chapters 90 to 99. This section includes all random products that are difficult to
divide under another heading. Products include alarm clocks, office furniture, and
ballpoint pens. Table 5.18 lists the top 10 products under this heading.
Table 5.18 depicts that parts and accessories for photographic cameras with an RCA
of 7.77 and an export customs value of R1.6 million, is the highest export product in
the Mpumalanga Province when considering its competitive advantage and also its
current exports.
Table 5.18: The Mpumalanga Province’s 10 highest competitive products in the
miscellaneous sector
Miscellaneous chapter
Tariff heading & description
Mpumalanga's export of specific
product (R)
South Africa’s total export of
specific product (R)
RCA
900691 Parts and accessories for photographic cameras
R1,6 million R15,4 million 7.77
960810 Ball point pens R881 thousand R28,1 million 2.27
940370 Furniture, plastic R1,1 million R38 million 2.18
940330 Office furniture, wooden R1,9 million R69,1 million 2.00
940540 Electric lamps, lighting fittings R963 thousand R130,2 million 0.54
903289 Automatic regulating/controlling equipment
R2,7 million R581 million 0.35
940360 Furniture, wooden R690 thousand R157,5 million 0.32
940600 Prefabricated buildings R1,2 million R302,1 million 0.29
902830 Electricity supply, production and calibrating meters
R1,6 million R480 million 0.25
903180 Measuring or checking equipment R747 thousand R641,1 million 0.08
Source: Author’s own calculations
104
The second highest product is ball point pens with an RCA of 2.27 and an export
customs value of R881 thousand, followed by plastic furniture with an RCA of 2.18
and an export customs value of R1.1 million. The rest of the seven products have a
comparative disadvantage in the Mpumalanga Province concerning exports.
Wooden office furniture with an RCA equal to 2, electrical lamps (0.54), automatic
regulating equipment (0.35), wooden furniture (0.32), prefabricated buildings (0.29),
electricity supply meters (0.25) and measuring or checking equipment (0.08) all have
a competitive disadvantage. These products are only listed in table 5.18 due to their
high custom values ranging between R700 thousand and R2 million. Table 5.18
shows the custom values and RCA values that are less significant and not vital for
export promotion. Except for parts and accessories for photographic cameras, the
competitive position of all these industries in this chapter is insignificant.
This section focused on the specific products in the Mpumalanga Province. Each
product, along with its competitive position (RCA value) and custom value (current
size of exports), has been interpreted under each chapter division. The subsequent
section will emphasize each chapter’s top product and will be discussed next.
5.4 TOP COMPETITORS IN THE MPUMALANGA PROVINCE
The top competitors in the Mpumalanga Province, with the highest comparative
advantage (RCA), were taken from all the estimations and compared to the other
products with a high comparative advantage. Each one of these products plays a
significant role in enhancing the Mpumalanga Province’s trade in each important
sector of the province. These top achiever industries, products or sectors are shown
in Table 5.19. It should be noted that Table 5.2 only considered the ten largest
exporters, whether they were internationally competitive or not. Table 5.19 now
considers the products or industries that are overall most competitive in the province
and have the potential to experience sustained export growth in the long-run. These
are not just the top industries in every chapter, but the top 15 competitors,
irrespective of their chapters.
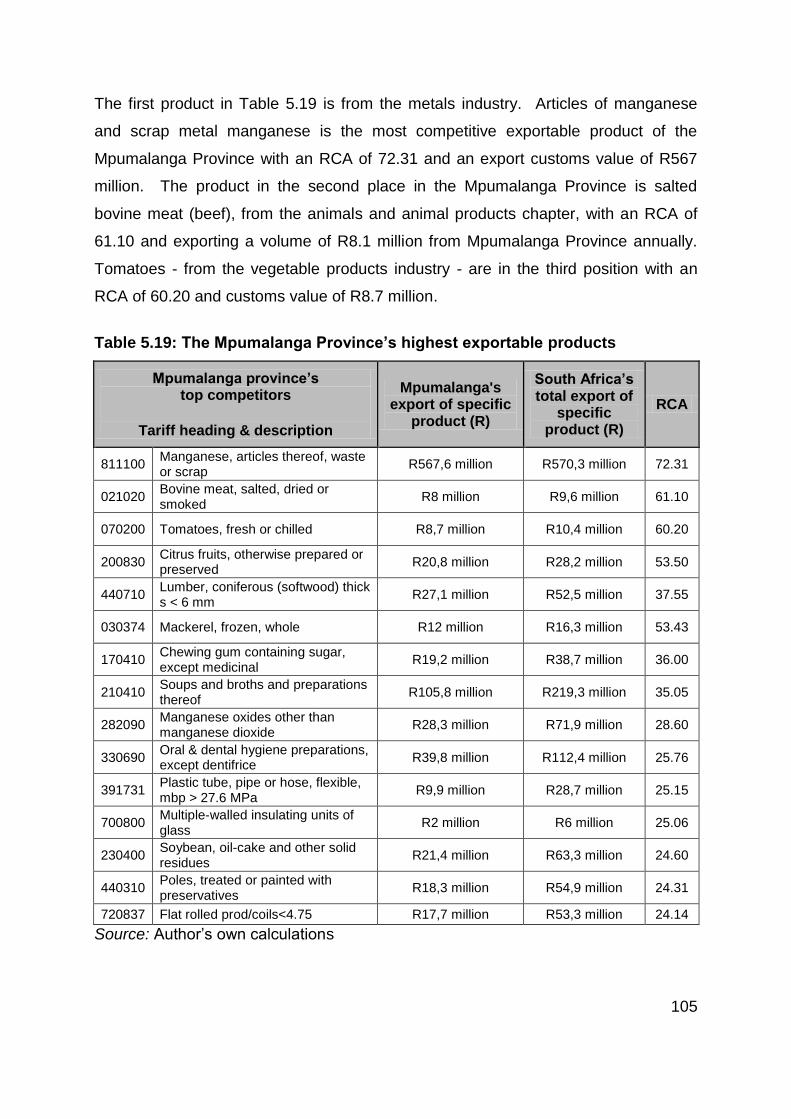
105
The first product in Table 5.19 is from the metals industry. Articles of manganese
and scrap metal manganese is the most competitive exportable product of the
Mpumalanga Province with an RCA of 72.31 and an export customs value of R567
million. The product in the second place in the Mpumalanga Province is salted
bovine meat (beef), from the animals and animal products chapter, with an RCA of
61.10 and exporting a volume of R8.1 million from Mpumalanga Province annually.
Tomatoes - from the vegetable products industry - are in the third position with an
RCA of 60.20 and customs value of R8.7 million.
Table 5.19: The Mpumalanga Province’s highest exportable products
Mpumalanga province’s top competitors
Tariff heading & description
Mpumalanga's export of specific
product (R)
South Africa’s total export of
specific product (R)
RCA
811100 Manganese, articles thereof, waste or scrap
R567,6 million R570,3 million 72.31
021020 Bovine meat, salted, dried or smoked
R8 million R9,6 million 61.10
070200 Tomatoes, fresh or chilled R8,7 million R10,4 million 60.20
200830 Citrus fruits, otherwise prepared or preserved
R20,8 million R28,2 million 53.50
440710 Lumber, coniferous (softwood) thick s < 6 mm
R27,1 million R52,5 million 37.55
030374 Mackerel, frozen, whole R12 million R16,3 million 53.43
170410 Chewing gum containing sugar, except medicinal
R19,2 million R38,7 million 36.00
210410 Soups and broths and preparations thereof
R105,8 million R219,3 million 35.05
282090 Manganese oxides other than manganese dioxide
R28,3 million R71,9 million 28.60
330690 Oral & dental hygiene preparations, except dentifrice
R39,8 million R112,4 million 25.76
391731 Plastic tube, pipe or hose, flexible, mbp > 27.6 MPa
R9,9 million R28,7 million 25.15
700800 Multiple-walled insulating units of glass
R2 million R6 million 25.06
230400 Soybean, oil-cake and other solid residues
R21,4 million R63,3 million 24.60
440310 Poles, treated or painted with preservatives
R18,3 million R54,9 million 24.31
720837 Flat rolled prod/coils<4.75 R17,7 million R53,3 million 24.14
Source: Author’s own calculations
106
Citrus fruit products are from the foodstuff industry and is the fourth highest
exportable product in the Mpumalanga Province with an RCA of 53.50 and an export
customs value of R20 million, followed by softwood lumber. Softwood lumber – from
the wood and wood product industry - is the highest exportable product in the
Mpumalanga Province and has an RCA of 37.55 and an export customs value of R27
million.
In the sixth place is frozen fish with an RCA of 35.5, followed by chewing gum which
contains sugar. The Mpumalanga Province exports annually chewing gum in excess
of R19 million. This product has a high competitive advantage, with an RCA equal to
36. Next to this chapter are soups and broths with an RCA of 35.05, which is still
internationally very competitive.
Manganese oxides from the chemical and allied industry, with an RCA of 28.60, is
the highest exportable product in the Mpumalanga Province from this chapter and
exports customs value of R28 million annually. There are two manganese products
in Table 5.19: manganese products, waste and scrap (metals industry) and
manganese oxides (chemicals and allied industry). Manganese products and waste
are most commonly used in mining and factories, whereas manganese oxides are
most commonly seen as an alloying agent.
Number 10 of top achievers in relation to competitive export positions is oral and
dental hygiene preparations with an RCA of 25.76 and exporting nearly R40 million
annually.
Eleventh is plastic tubing with an RCA of 25.15 and an export customs value of R9.9
million, which is the highest export product in the plastic and rubber industry. This is
followed by units of insulating glass. Insulating glass from the stone and glass
industry is the most exportable product within this industry and the province, with an
RCA of 25.06 and an export customs value of R2 million annually.
Ranked in the 13th and 14th position of potentially most competitive exportable
product lines in the Mpumalanga Province are both from the food industries.
Soybean oil-cake and other solid residues have an RCA index of 24.60 and export
107
about R21.4 million annually, while poles have an RCA equal to 24.31 and export in
excess of R183.9 million annually. This represents about a third of South Africa’s
total production of treated or painted poles.
Listed 15th on the list of top achievers in Table 5.19 is flat rolled metal and coils with a
revealed comparative advantage index of 24.14 and already exporting R177.2 million
annually.
Other potential exporters that merit attention, due to their high ranking in their
particular chapter, are trucks in the transport industry, which has an RCA of 16.83
and an export customs value of R13 million. It is a highly exportable product.
Leather gloves and mittens, in the raw hide and leather industry, is the highest
exportable product in its chapter in the Mpumalanga Province, with an RCA of 16.17
and an export customs value of R2 million.
Petroleum is the highest exportable product in the mineral product industry with an
RCA of 13.57 and an export customs value of R41 million. Knitted garments of
material is the highest exportable product in the textile industry with an RCA of 12.17
and an export customs value of R2 million. Rubber and plastic headgear with an
RCA of 11.14 and an export customs value of R202 thousand is the highest export
product in the Mpumalanga Province and in the footwear and headgear industry.
Transporter or bridge cranes is the highest exportable product in the Mpumalanga
Province and in the electrical machinery industry with an RCA of 8.50 and an export
customs value of R13 million. The last industry in Table 5.19 is miscellaneous
articles with accessories for photographic cameras the product with the highest
exportable value with an RCA of 7.77 and an export customs value of R1.6 million.
The fifteen products listed in Table 5.19 are Mpumalanga’s highest exportable
products. The highest exportable product in terms of RCA and customs value is
manganese articles, waste and scraps. It is the product with the highest comparative
advantage in the province.
108
The subsequent section will match the products identified by the RCA index with the
DSM model to determine whether the products indentified are realistic exportable
products with export opportunities abroad for the Mpumalanga Province.
5.5 MATCHING INDUSTRIES WITH THE DSM
Analysis from Decision Support Model (DSM) identified numerous exportable product
opportunities for South Africa. In section 5.4 the comparative advantage of products
of the Mpumalanga Province were identified through the Revealed Comparative
Advantage (RCA) index. The identified products will be matched against the results
identified by the DSM over the time period 2001 to 2005. The matching of these
products from the RCA to the DSM results will be listed and only the products with
the highest RCA value in each table will be discussed as an exportable opportunity.
Table 5.4 lists the products with the highest RCA in the animals and animal product
industry. Analysis from the DSM indicates that the following products from Table 5.4
have several opportunities to export to other countries: salted bovine meat, milk,
yogurt, cheese, fowls, bird eggs, milk powder and frozen fish. Analysis from the
DSM indicates that the following products from Table 5.5 have several opportunities
to export to other countries: tomatoes, maize flour, pearled maize, tea, vegetable
seed, maize, grapefruit, maize groat, nuts and oranges. These products have the
highest RCA in the vegetable product industry. The DSM identified that the most
significant importers (the nations with large export values) of salted bovine meat were
France (US$ 10 million), the United States of America (USA) (US$ 5.6 million) and
Germany (US$ 3.4 million) (Note: Not all this data is depicted on table 5.4. See
Annexure A at the end of this dissertation).
Table 5.6 lists the products with the highest RCA in the foodstuff industry. Analysis
from the DSM indicates that the following products from Table 5.6 have several
opportunities to export to other countries: citrus fruits, chewing gum, soups, soy-
bean, refined sugars, chocolate, vegetable juice, juices, raw sugar and food
preparations.
109
Analysis from the DSM indicates that the following products from Table 5.7 have
several opportunities to export to other countries: petroleum bitumen, copper ores
and concentrates, bituminous mix, chromium ores, Portland cement and bituminous
coal. These products have the highest RCA in the mineral product industry.
Table 5.8 lists the products with the highest RCA in the chemicals and allied
industries. Analysis from the DSM indicates that the following products from Table
5.8 have several opportunities to export to other countries: manganese oxides, oral
and dental hygiene preparations, washing and cleaning preparations, organic
surfactant washing and cleaning preparations, polyester based paints, acrylic and
vinyl polymer based paint, polymer based paints, matches, soaps and laboratory
reagents.
Analysis from the DSM indicates that the following products from Table 5.9 have
several opportunities to export to other countries: plastic tube, normal plastic tube,
polyvinyl tube, plastic tube fittings, propylene sheet, plastic carboys, plastic articles,
ethylene sheet, plastic stoppers and pneumatic tyres. These products have the
highest RCA in the plastic and rubber industry.
Table 5.10 lists the products with the highest RCA in the raw hides, skins, leather,
furs and hunting industry. Analysis from the DSM indicates that the following
products from Table 5.10 have several opportunities to export to other countries:
leather gloves and mittens, fibre or paperboard handbags, leather articles, leather
belts, suitcases and trunks, containers, musical instruments and gun cases, leather
handbags, saddles and harnesses of any material and leather.
Analysis from the DSM indicates that the following products from Table 5.11 have
several opportunities to export to other countries: softwood lumber, poles, printed
matter, lumber, saw dust, paper labels, paper carton boxes, non-corrugated carton
boxes, door frames and printed reading books. These products have the highest
RCA in the wood and wood product industry.
Table 5.12 lists the products with the highest RCA in the textile industry. Analysis
from the DSM indicates that the following products from Table 5.12 have several
110
opportunities to export to other countries: knitted garments of material, synthetic
textile materials, carpets, men’s and boys’ jackets, towel articles, articles of yarn
strip, women’s and girls’ trousers, men’s and boys’ shirts, men’s and boys’ trousers
and textile products.
Analysis from the DSM indicates that the following products from Table 5.13 have
several opportunities to export to other countries: rubber and plastic headgear,
waterproof footwear, leather footwear, sport footwear, footwear, safety headgear,
Wellington waterproof footwear with no toe-cap, Wellington waterproof footwear with
metal toe-cap, footwear with sole rubber and footwear with outer plastic soles.
These products have the highest RCA in the footwear and headgear industry.
Table 5.14 lists the products with the highest RCA in the stone and glass industry.
Analysis from the DSM indicates that the following products from Table 5.14 have
several opportunities to export to other countries: insulating units of glass, plaster
board, mineral heat, glass containers, glass, float glass, ceramic bathroom and
kitchen sanitary items, refractory bricks, glass fibres and glazed ceramic flags.
Analysis from the DSM indicates that the following products from Table 5.15 have
several opportunities to export to other countries: manganese waste, flat rolled
product coils, alloy steel, hot rolled stainless steel coil 3 to 4.75mm thick, articles of
aluminium, hot rolled stainless steel coil, 4.75 to 10mm thick, cold rolled stainless
steel, 1.0 to 3.0 mm thick, ferro-chromium, cold rolled stainless steel, 0.5 to 1.0 mm
thick and iron steel structure. These products have the highest RCA’s in the metal
industry.
Table 5.16 lists the products with the highest RCA in the electrical machinery
industry. Analysis from the DSM indicates that the following products from Table
5.16 have several opportunities to export to other countries: transporter or bridge
cranes, self-propelled graders and levellers, motor electric fans, front-end shovel
loaders, electrical switches, taps and valves appliances, self-propelled earth moving
equipment, parts of cranes, pumps and data processing equipment.
111
Analysis from the DSM indicates that the following products from Table 5.17 have
several opportunities to export to other countries: trucks and diesel powered trucks
weighing more than 20 tonnes. These products have the highest RCA in the
transportation industry. The rest of the eight products in Table 5.17 are in a
comparative disadvantage towards the Mpumalanga Province but is still found as a
match in the analysis of the DSM. The products include: wheeled tractors, trailers,
motor vehicle parts, diesel powered trucks weighing between 5 to 10 ton, drive axles,
buses, automobiles and diesel powered trucks weighing less than 5 ton.
Table 5.18 lists the products with the highest RCA in the miscellaneous industry.
Analysis from the DSM indicates that the following products from Table 5.18 have
several opportunities to export to other countries: parts and accessories for
photographic cameras, ball point pens and plastic furniture. These products have the
highest RCA in the miscellaneous industry. The rest of the seven products in Table
5.18 are in a comparative disadvantage towards the Mpumalanga Province but is still
found as a match in the analysis of the DSM. The products include: wooden office
furniture, electrical lamps, automatic regulating equipment, wooden furniture,
prefabricated buildings, electricity supply meters and measuring or checking
equipment.
Table 5.19 listed the exportable products with the highest competitive advantage,
according to their RCA values. A list of importing countries and their subsequent
export value from the Mpumalanga Province was identified by the DSM. The three
importing countries with the highest export value from the province will be discussed
next. From Table 5.19 the following conclusions can be drawn:
The three highest importing countries (the nations with large import values) of
manganese articles is Austria (US$ 29.6 million), France (US$ 10.8 million) and
Canada (US$ 9.9 million) (Not all the data is depicted in table 5.19. See the
Annexure at the end of this dissertation).
The three highest importing countries (the nations with large import values) of
salted bovine meat were France (US$ 10 million), the United States of America
(USA) (US$ 5.6 million) and Germany (US$ 3.4 million). (Not all the data is
depicted on table 5.19. See Annexure.)
112
The three highest importing countries (the nations with large import values) of
tomatoes were France (US$ 314.7 million), Canada (US$ 133.5 million) and
Romania (US$ 31.9 million). (Not all the data is depicted on table 5.19. See
Annexure.)
The three highest importing countries (the nations with large import values) of
citrus fruits were Germany (US$ 44.8 million), China (US$ 18.5 million) and the
United Kingdom (UK) (US$ 9 million). (Not all the data is depicted on table
5.19. See Annexure.)
The three highest importing countries (the nations with large import values) of
softwood lumber were Japan (US$ 387.3 million), Egypt (US$ 318.7 million) and
the UK (US$ 206.6 million). (Not all the data is depicted on table 5.19. See
Annexure.)
Frozen mackerel was not identified by the DSM as a potential exportable
opportunity for South Africa.
The three highest importing countries (the nations with large import values) of
chewing gum were the UK (US$ 6.3 million), Slovakia (US$ 2.9 million) and the
United Arab Emirates (US$ 2.4 million). (Not all the data is depicted on table
5.19. See Annexure.)
The three highest importing countries (the nations with large import values) of
soups and broths were the US (US$ 44.1 million), Germany (US$ 39.3 million)
and Japan (US$ 13.7 million). (Not all the data is depicted on table 5.19. See
Annexure.)
The three highest importing countries (the nations with large import values) of
manganese oxides were Belgium (US$ 2.4 million), Japan (US$ 2 million) and
the UK (US$ 1.4 million). (Not all the data is depicted on table 5.19. See
Annexure.)
The three highest importing countries (the nations with large import values) of
oral and dental hygiene preparations were the US (US$ 27.5 million), Japan
(US$ 18 million) and Germany (US$ 15.6 million). (Not all the data is depicted
on table 5.19. See Annexure.)
The three highest importing countries (the nations with large import values) of
plastic tube were the US (US$ 10.5 million), China (US$ 10 million) and Hong
113
Kong (US$ 9 million). (Not all the data is depicted on table 5.19. See
Annexure.)
The three highest importing countries (the nations with large import values) of
insulating glass were the US (US$ 71.5 million), Switzerland (US$ 33.9 million)
and Sweden (US$ 8.2 million). (Not all the data is depicted on table 5.19. See
Annexure.)
The three highest importing countries (the nations with large import values) of
soybean and oil-cake residues were France (US$ 528.7 million), Netherlands
(US$ 384.9 million) and Germany (US$ 336 million). (Not all the data is
depicted on table 5.19. See Annexure.)
The three highest importing countries (the nations with large import values) of
poles were Oman (US$ 3.9 million), Qatar (US$ 2.4 million) and Vietnam (US$
1.7 million). (Not all the data is depicted on table 5.19. See Annexure.)
The three highest importing countries (the nations with large import values) of
flat rolled metal and coils were Turkey (US$ 97.9 million), Belgium (US$ 76.1
million) and Italy (US$ 72.4 million). (Not all the data is depicted on table 5.19.
See Annexure.)
The DSM analysis identified potential exportable products for South Africa, for which
the country has a competitive advantage and for which realistic international export
opportunities exists. These were matched to the industries in the Mpumalanga
Province identified in this study to determine whether these products of Mpumalanga
Province have international export potential. The above matching of products
between the DSM Model and industries with the highest RCA index values has been
proven successful. Specific products have been identified with export potential and
existing opportunities.
5.6 SUMMARY AND CONCLUSION
A Revealed Comparative Advantage (RCA) index was estimated for the industries of
the Mpumalanga Province of South Africa. Data compiled from the South African
Revenue Service (SARS) was used, along with the results for the Decision Support
114
Model (DSM). A structured index was compiled to determine the exportable products
for the Mpumalanga Province.
Considering the largest exporters in Mpumalanga (those with the highest customs
values), the three products with the highest RCA values across all industries are
articles of manganese and waste products (72.31), soups (35.05) and refined sugars
(23.98), and they also are the three items with the highest comparative advantage.
The three products with the lowest RCA values as well as customs values are
lumber, coconuts and iron steel balls. These products all have an RCA value of zero
and are seen as a comparative disadvantage toward international exports from the
Mpumalanga Province.
In the animals and animal product industry, the three products with the highest RCA
values, and thus the products with a high comparative advantage in the Mpumalanga
Province, are salted bovine beef meat (61.10), frozen fish (53.43) and bovine cuts
(22.39). In the vegetable products chapter the three largest products in terms of
RCA consist of tomatoes (60.20), maize flour (12.98) and pearled maize (12.84). In
the foodstuff sector the three products with the highest RCA values are citrus fruits
(53.50), chewing gum (36) and soups (35.05). In the mineral products industry,
petroleum (13.57), copper ores (12.93) and bituminous mix (10.28) are the three
products with the highest RCA values.
In the chemical and allied industries the highest exportable products are manganese
oxides with an RCA of 28.60, oral and dental hygiene preparations with an RCA of
25.76 and washing and cleaning preparations with an RCA of 23.45. In the plastic
and rubber product industry plastic tube (25.15), normal plastic tube (21.50) and
polyvinyl tube (15.61) are the three highest exportable products in the Mpumalanga
Province. Leather gloves and mittens (16.17), fibre or paperboard handbags (15.14)
and leather articles (5.78) are the three highest exportable products in the
Mpumalanga Province in the raw hides and leather industry when comparing the
RCA’s of these products.
In the textile industry, knitted garments of material is the highest exportable product
in the Mpumalanga Province with an RCA of 12.17, followed by synthetic textile
115
materials with an RCA of 9.43 and carpets with an RCA of 6.58. They are the three
highest exportable textile products in the Mpumalanga Province, when comparing
their RCA values. Units of insulating glass with an RCA of 25.06, plaster board with
an RCA of 11.34 and mineral heat articles with an RCA of 7.92, are the three
products with the highest RCA’s in the stone and glass industry. In the metals
industry, manganese articles is the highest exportable product in the Mpumalanga
Province with an RCA of 72.31 followed by flat rolled product coils with an RCA of
24.14 and alloy steel with an RCA of 15.37 - implying that they are the highest
exportable products in the province and the industry.
Transporter or bridge cranes are the most competitive product in the Mpumalanga
Province with an RCA of 8.50. The second highest are self-propelled graders and
levellers, with an RCA of 3.42, followed by motor electric fans of the electrical
machinery industry, with an RCA of 2.11.
The three highest exportable products in the transport industry of Mpumalanga
Province, according to their high RCA values, are trucks (16.83), diesel powered
trucks weighing more than 20 ton (2.80) and wheeled tractors (0.50). In the
miscellaneous industries the three products with the highest RCA values are
accessories for photographic cameras with an RCA of 7.77, ball point pens with an
RCA of 2.27 and plastic furniture with an RCA of 2.18.
The first exportable products of the fifteen chapters, in terms of their high RCA
values, are: manganese articles and waste (72.31), tomatoes (60.20), salted bovine
meat (60.20), citrus fruits (53.50), softwood lumber (37.55), manganese oxides
(28.60), plastic tube (25.15), insulating glass (25.06), trucks (16.83), leather gloves
and mittens (16.17), petroleum (13.57), knitted garments of material (12.17), rubber
and plastic headgear (11.14), transporter or bridge cranes (8.50), accessories for
photographic cameras (7.77).
Disregarding the particular chapter grouping, the fifteen products or industries that
are overall most competitive, as revealed by the Revealed Comparative Advantage
(RCA) indices are, in order of merit: manganese articles and scrap manganese metal
(72.31), salted bovine beef meat (60.20), tomatoes (60.20), citrus fruits products
116
(53.50), softwood lumber (37.55), frozen fish (53.43), chewing gum (36.00), soups
and broths (35.05), manganese oxides (28.60), oral and dental heath preparations
(25.76), plastic tubing (25.15), insulating glass (25.06), soybean oil-cake and other
solid residues (24.60), refined sugar (23.98) and washing and cleaning preparations
(23.45).
All the products listed in the tables of the various “chapters” in this study were
matched to the results of the Decision Support Model (DSM) to ascertain whether
those identified as the most competitive according to their RCA indices, also have
realistic international export opportunities. The analysis of the DSM concluded that
approximately all the products with the highest RCA values in their subsequent
industries are seen as valuable export opportunities.
This chapter investigated all the products in the Mpumalanga Province with the
highest revealed comparative advantage value and customs value of the main
sectors of the province and matched them with exportable products identified by the
DSM.
Chapter 6 will provide a summarised conclusion as well as recommendations for this
study, and will be discussed next.
117
CHAPTER 6: SUMMARY, CONCLUSION AND
RECOMMENDATIONS
6.1 INTRODUCTION
The aim of this study was set in Chapter 1 as to analyse the composition of the
Mpumalanga Province’s economic activity to determine where the comparative
advantage lies regarding exports. Mpumalanga’s contribution to South Africa’s
economy over the past fifteen years was small and insignificant. For that reason it
was important to determine the Mpumalanga province’s composition of GDP and its
dominant sectors and also to conduct and in-depth study into Mpumalanga’s export
sectors to determine which products has potential export possibilities. Finally the
export possibilities were matched to the results of the DSM to determine if products
are seen as high export opportunities.
This chapter will provide a summary and recommendations that were derived in this
study based on the findings of this study. This chapter will also provide areas of
further research.
6.2 SUMMARY AND CONCLUSION
Research has shown that South Africa’s regions have been experiencing reasonable
export growth, as well as growth in the gross domestic product (GDP), population
and skills level. South Africa’s provinces have been experiencing difficulties
allocating resources for effective export enhancement and promotion. By effective
targeting of specific sectors and industries within the South African provinces,
provincial government entities might be able to determine which sector or industry
could gain the most by effective targeting.
Chapter 1 provided the background of the study on the Mpumalanga Province as well
as the motivation and problem statement, research objectives, research question and
the research method applicable to this study. The research question of this study
was twofold. First, the potential priority exports sectors or industries were
determined, such as mining, electricity, agriculture and manufacturing. Secondly, the
118
outcomes of this study were matched in perfect cohesion to the opportunities
presented by the Decision Support Model (DSM). The primary objective of this study
was to determine in which sectors or industries the Mpumalanga Province has
comparative advantage. This study identified mining, electricity, agriculture and the
manufacturing industries as most successful exportable opportunities. In relation to
the primary objectives, the secondary objectives further narrowed the scope of this
study and provided an economic profile of the Mpumalanga Province, as well as high
contributing products or sectors towards the province’s GDP and finally provided
priority export sectors compiled by using the Revealed Comparative Advantage
(RCA) and matched with results from the DSM model.
Chapter 2 reviewed the theoretical determinants of economic growth, export
promotion and the decision support model (DSM). Theories from Keynes, the Neo-
Classical Model and the Endogenous Growth Theory explained the theoretical
aspects and concluded that exports are sustainable, that technological innovation,
saving, depreciation and population growth cause economic growth and finally, that
constant levels of capital and labour result in economic growth. The subsequent
determinants of economic growth were discussed: investment, human capital,
openness to trade, foreign direct investment, political issues and export-led growth.
Finally the theoretical aspects of the RCA and DSM were discussed in this chapter
the DSM was developed to prioritise export assistance to potentially successful
exporters from South Africa and to identify products with high export potential.
Chapter 3 provided an overview of the socio-economic outlook and infrastructure of
the Mpumalanga Province. Favourable GDP and GVA growth rates, as well as
positive growth in the trade sector, Mpumalanga’s exports as a percentage of GDP,
total trade as a percentage of GDP, and the regional share of exports and imports
were highlighted. The economic sectors of the province were also discussed in detail
and it was concluded that the largest contributors in 2010 were mining, electricity,
agriculture and manufacturing.
Chapter 4 reviewed the research method utilised in this study. Post office codes,
tariff heading and the customs value data from the South African Revenue Services
(SARS) were used. An explanation on how the harmonised system codes work and
119
how the tariff headings are compiled was also provided. The sectors and industries
(identified in chapter 3) were then divided into the relevant 15 “chapters” of the HS.
After filtering the data compiled by SARS, products were identified to determine the
comparative advantage of products in sectors or industries (which were now divided
into chapters), and the RCA Index was explained.
The RCA determined specific products with RCA values larger than one, which are
the products identified in the sectors or industries that the Mpumalanga Province will
be relatively specialising in, implying that Mpumalanga has a revealed comparative
advantage in that specific product. If the RCA value is smaller than one a
comparative disadvantage will occur. Products with high RCA values were then
matched with realistic export opportunities provided by the DSM that may effectively
enhance the Mpumalanga Province’s export activities. The DSM is based on
planning and assessment of export promotion activities and works through a process
of four filters, where each filter is used for a specific task to finally provide a list of
potential export opportunities that a country can use to enhance their exports.
In chapter 5 the RCA indices were estimated and a list of products was compiled
under each chapter, sorted according to the highest RCA values. Subsequently, the
ten most competitive products in terms of their RCA values, under each chapter,
were discussed. The product with the highest RCA value across all 15 industries,
and therefore providing the Mpumalanga Province with a comparative advantage as
well as endless export opportunities, is manganese articles with an RCA index of
72.31. Manganese articles were matched to the results from the DSM to determine
whether possible export opportunities exist for this product. The DSM provided a list
of countries that could provide export opportunities for the Mpumalanga Province for
this product. Austria, France and Canada (in terms of their high importing values
from South Africa) were the three countries identified that could provide the
Mpumalanga Province with reliable export opportunities.
The analysis of the DSM on all the products concluded that approximately all the
products identified with the highest RCA values in their subsequent industries are
also seen to have valuable export opportunities. Five products could not been
matched with the DSM as the model does not perceive them as valuable export
120
opportunities for the time being. The products, excluded from the DSM even though
they have high RCA values, include: frozen fish, bovine cuts, coal briquettes, light
petroleum distillates and aviation spirits. It might be that these products have a
potential competitive advantage, but that the opportunities have not yet been
recognised. This chapter discussed all the products in the Mpumalanga Province
with high revealed comparative advantage indices and large customs values, divided
into main sectors (“chapters”) of the province and matched with exportable products
identified by the DSM.
This study has made the following important contributions. First, the sector that
provides the Mpumalanga Province with the highest export opportunities is the
metals industry. Secondly, manganese articles from the same industry was identified
as the most realistic export opportunity that will help enhance the Mpumalanga
Provinces’ export activity in South Africa. Finally, five products were identified with
additional export opportunities as they were not listed in the DSM, but also have
potential to enhance the export activity in the province.
Overall the potentially most competitive products internationally are: manganese
articles and waste metal, tomatoes, citrus fruits products, softwood lumber, chewing
gum, soups and broths, manganese oxides, oral and dental heath preparations,
plastic tubing, insulating glass, soybean oil-cake and other solid residues, refined
sugar and washing and cleaning preparations.
6.3 RECOMMENDATIONS
The availability of research on exportable products that exist on provincial level in
South Africa is not sufficient to provide provinces with the needed tools to enhance
their own export activity. This study made some contribution in that regard.
Compiling data and finding relevant research on provincial level also causes
constraints, as data is not updated annually, is difficult to access. The issue of limited
research on the Mpumalanga Province can be resolved by the South African
government granting the province the necessary funds in order to enable provincial
governments to conduct additional research. This might for example be done in co-
operation with a university, either public or private.
121
A recommendation towards the Mpumalanga Province would be for the provincial
government to provide needed attention, specifically to the promotion and added
research to the following five products as they have exportable potential: frozen fish,
bovine cuts, coal briquettes, light petroleum distillates and aviation spirit.
Research regarding the RCA indicators of comparative advantage, matched with the
Decision Support Model (DSM), similar to this current study on Mpumalanga should
also be extended to the other provinces. Even though there is a clear comparison
with the RCA and DSM, it should not be confused with being the same model. There
are still clear differences between the two models. It is important in the light of wealth
creation and the generation of job opportunities in South Africa. The current study
only considered the largest 150 exporters in Mpumalanga Province, but there might
be some industries that do not export yet and do have large competitive potential.
The RCA index can also be extended by not only using the South African data, but
using world data as well.
Expanding this study to include all the thousands of other industries that were not
considered in this study, might be a worthwhile exercise. RCA values can also be
determined relative to world values and then compared to results from this study.
Recommendations regarding the product identified as the highest export potential in
the Mpumalanga Province, namely manganese articles, include:
identifying companies involved in the production of this product and providing
the companies with grants to further promote the product.
expanding further research on the development of this product to add value to
the product.
identifying additional geographical areas or locations to enhance production of
this product.
conducting in-depth research of additional uses and applications of this product.
promoting this product in the countries identified as reliable export opportunities
by means of trade shows and trade magazines.
This study set the task to identify globally competitive economic products, sectors
and industries in the Mpumalanga Province which have export potential to enhance
122
effective export promotion. This was accomplished by estimating the revealed
comparative advantage of products and industries and matching it with the results of
the Decision Support Model. Much information was obtained and the most important
findings were reported in this dissertation. The major contribution of this study is that
it provides potential exporters, and especially export agencies, with a scientific
instrument to identify products and industries that offer the most potential to
effectively enhance export promotion and sustain creation of wealth and employment
opportunities in the region. This should be an ongoing research project, updated
continually and extended to all the regions and provinces of South Africa.
123
LIST OF REFERENCES
ADLAM, G. 2009. Why invest in Mpumalanga. http://www.mputopbusi
s.co.za/site/economic-overview Date of access: 11 May 2010.
ALESINA, A., & RODRIK, D. 1994. Distributive Politics and Economic Growth. The
Quarterly Journal of Economics, 2(109):465-490. May.
ANON. 2007. Export Promotion.
http://www.econ.utah.edu/~vernengo/papers/ExportPromotion.pdf Date of
access: 15 April 2010.
AWOKUSE, T.O. 2008. Trade Openness and Economic Growth: Is Growth Export –
Led or Import-Led. Applied Economics, 40:161-173.
BALASSA, B. 1977. Revealed Comparative Advantage Revisited: An Analysis of
Relative Export Shares of the Industrial Countries, 1953-1971. The Manchester
School of Economic and Social Studies, 45(4): 327-344.
BALASSA, B. 1979. The Changing Pattern of Comparative Advantage in
Manufactured Goods. Review of Economics and Statistics, 61(2) May: 259-266.
BALASSA, B & STOUTJESDIJK, A. 1984. Economic Integration among Developing
Countries. Economic Integration and Third World Development, 1984:33-50.
BARRO, R.J. & SALA-I-MARTIN, X. 2004. Economic Growth. 2nd ed. Cambridge:
MIT Press.
BATRA, A & KHAN, Z. 2005. Revealed Comparative Advantage: An Analysis for
India and China. Working Paper No. 168. Indian Council for Research on
International Economic Relations.
BENDER, S. 2002. The Changing Trade and Revealed Comparative Advantages of
Asian and Latin American Manufacture Exports. Yale University. Discussion
paper No. 843.
124
BENDER, S & LI, K.W. 2002. The Changing Trade and Revealed Comparative
Advantages of Asian and Latin American Manufacture Exports. Discussion paper
No. 843, Yale University: Economic Growth Centre.
BORENSZTEIN, E., DE GREGORIO, J. & LEE, J. 1998. How Does Foreign Direct
Investment Affect Economic Growth? Journal of International Economics,
45:115-135.
BOWEN, H. 1983. On the Theoretical Interpretation of Indices of Trade Intensity and
Revealed Comparative Advantage. Review of World Economics, 119:464-472.
BROWNING, E.K. & ZUPAN, M.A. 2012. Microeconomics: Theory and Application.
Danvers: John Wiley & Sons.
CAMINATI, M. 2003. R&D Models of Economic Growth and the Long-Term Evolution
of productivity and innovation. (In Salvadori, N., ed., The theory of economic
growth: A ‘classical’ perspective. Massachusetts: Edward Elgar Publishing Inc. p.
235-258)
COLANDER, D.C., & GAMBER, E.N. 2002. Macroeconomics. Upper Saddle River,
N.J.: Prentice Hall.
COWDEN, G. 2005. State of the environment in South Africa: Mpumalanga.
Department of Environmental Affairs and Tourism.
http://www.mpu.agric.za/SOER/Mpumalanga%20Publikit%20Web%20Version%2
0SoER%20(2003)/default.htm Date of access: 15 May 2010
CUYVERS, L. 2004. Identifying Export Opportunities: The Case of Thailand.
International Marketing Review, 21(3):255-278.
CUYVERS, L., DE PELSMACKER, P., RAYP, G. & ROOZEN, I.T.M. 1995. A
Decision Support Model for the Planning and Assessment of Export Promotion
Activities by Government Export Promotion Institutions: The Belgian Case.
International Journal of Research Marketing, 12:173-186.
125
CUYVERS, L., PEARSON, J., NAUDÉ, W. & VIVIERS, W. 2010. Identifying Export
Opportunities for South Africa in the Southern Engines: A DSM Approach.
International Businesses Review, 19(4) Aug: 345-359
CYPHER, J. M. & DIETZ. J. L. 2009. The Process of Economic Development. 3rd ed.
Abingdon: Routledge.
CZINKOTA, M. 2002. National export promotion: A statement of issues, changes and
opportunities. (In Kotabe, M. & Aulakh. P., eds. Emerging issues in international
business research. Cheltenham: Edward Elgar.)
DTI. Department of Trade and Industry see SOUTH AFRICA. Department of Trade
and Industry.
DLAMINI, M. 2009. Mpumalanga development indicators. Department of
Environmental Affairs and Tourism. www.mega.gov.za/smme.../20-mpumalanga-
development-indicators Date of access: 5 March 2012.
DORNBUSCH, R., FISCHER, S. & STARTZ, R. 2008. Macroeconomics. 10th ed.
Boston: McGraw-Hill.
EDWARDS, L & ALVES, P. 2006. South Africa’s Export Performance: Determinants
of Export Supply. South African Journal of Economics, 74(3):473-500.
FARMER, R.E.A. 2010. How the Economy Works. Oxford: Oxford University Press.
FAUSTINO, H. 2008. Intra-Industry Trade and Revealed Comparative Advantage: an
Inverted-U Relationship. Technical University of Lisbon School of Economics and
Management Department of Economics Working Papers 3.
FISHER S. 1993. The Role of Macroeconomic Factors in Growth. Journal of
Monetary Economics. 32:485-512.
GENCTURK, E.F. & KOTABE, M. 2001. The Effect of Export Assistance Program
Usage on Export Performance: A Contingency Explanation Journal of
International Marketing, 9(2):51-72.
126
GHORDON, P. 2012. Budget Speech 2012. National Treasury.
http://www.treasury.gov.za/documents/national%20budget/2012/review/FullRevie
w.pdf Date of access: 22 April 2012
GLENDAY, G. & NDII, D. 2000. Export Platforms in Kenya. Discussion paper No.
752, Boston, Mass.: Harvard Institute of International Development.
GREENAWAY, D. & KNELLER, R.A. 2004. New Perspectives on the Benefits of
Exporting. Économie Internationale. 100(2004):99-110.
GRAFF, M. & PLÜMPER, T. 2001. Export Specialization and Economic Growth.
Review of International Political Economy, 8(4):661-688. Winter.
HAUSMANN, R. & KLINGER, B. 2008. South Africa’s Export Predicament.
Economics of Transition, 16(4):609-637.
HAUSMANN, R. & RODRIK. D. 2003. Economic Development as Self-Discovery.
Journal of Development Economics, 72:603–633.
HELPMAN, E. & KRUGMAN, P. 1985. Market Structure and Foreign Trade.
Cambridge: MIT Press.
HERS, J. 1998. Human Capital and Economic growth: A Survey of the Literature.
GBS Report, pp. 36-41
HIDALGO, C., KLINGER, B., BARABASI, A. & HAUSMANN, R. 2007. The Product
Space Conditions the Development of Nations. Science, 317:482–487.
HODGE, D. 2009. Growth, Employment and Unemployment in South Africa. South
African Journal of Economics, 77(4):488-504.
INTERNATIONAL TRADE CENTRE (ITC). 2012. Trade Map – Trade Statistics for
International Business Development. http://www.trademap.org. Date of access:
13 Feb 2012
127
JAFFE, A. 1986. Technological Opportunity and Spill-Overs of R&D: Evidence from
Firm’s Patents, Profits, and Market Value. American Economic Review,
76(5):984–1001.
JOURDAN, P. 1998. Spatial Development Initiatives (SDI’s) – The Effectiveness.
Development Southern Africa, 15(5):717-725.
KHALAFALLA. K.Y. & WEBB. D.A.J. 2001. Export-led Growth and Structural
Change: Evidence from Malaysia. Applied Economics, 33:1703-1715.
KEYNES, J.M. 1937. The General Theory of Employment. The Quaterly Journal of
Economics, Feb 1937
KLEYNHANS, E.P.J. 1998. Komparatiewe Voordeel in die Landbou. South African
Journal of Economic and Management Sciences. SAJEMS NS 1(3):498-512.
KLEYNHANS, E.P.J. 2003. The Competitive Platform for Industrial Development in
South Africa. (Thesis–PhD). Potchefstroom University for Christian Higher
Education, School of Economics, Risk Management and International Trade.
KLEYNHANS, E.P.J. 2004. ’n Geïntegreerde Benadering tot die Armoedevraagstuk
met Inagneming van Ekonomie en Kultuur. Tydskrif vir Geesteswetenskappe,
44(2 & 3):180-192. Jun. / Sep.
KLEYNHANS, E.P.J. & NAUDÉ W.A. 2003. Ekonomiese Ontwikkeling – ’n Suid-
Afrikaanse Perspektief. 7de ed. Potchefstroom: Potchefstroom University for
Christian Higher Education.
KLUGMAN, J. 2010. Human Development Report 2010. The Real Wealth of Nations:
Pathways to Human Development. New York: Palgrave Macmilan.
KOHLI, U. 2003. Real GDP, Real Domestic Income, and Terms-of-Trade Changes.
Journal of International Economics, 62(2004):83-106.
KORMENDI, R. & MEGUIRE, P. 1985. Macroeconomic Determinants of Growth:
Cross-country Evidence. Journal of Monetary Economics, 16(4):141-163.
128
KRUGELL, W.F. & MATTHEE, M. 2008. Measuring the Inward FDI Potential of South
African Regions. Acta Commercii, 8:160-180
KRUGELL, W.F. & MATTHEE, M. 2009. Measuring the Export Capability of South
African Regions. Development Southern Africa, 26(3):459-476. September.
LIESNER, H. H. 1958. The European Common Market and British Industry. The
Economic Journal, 68:302-316.
LOMBAARD, M. 2005. South African Postcode Geography. Statistics South Africa
http://mapserver2.statssa.gov.za/geographywebsite/africaGIS.html. Date of
access: 27 May 2010
LINDHAUER, D.L., PERKINS, D.H., & RADELET, S. 2006. Economics of
Development. New York & London: WW Northam and Company.
LUCAS, K.E. 1988. On the Mechanics of Economic Development. Journal of
Monetary Economics, 22:3-12. June.
MAHLANGU, J. 2010. Mpumalanga economic profile. Department of Economic
Development, Environment and Tourism.
http://www.mpumalanga.gov.za/dedet/economic%20profile/Mpu_Econ_Vol5_01_
Jul_2010.pdf. Date of access: 1 June 2011.
MATTHEE, M & NAUDÉ, W.A. 2008. The Determinants of Regional Manufactured
Exports from a Developing Country. International Regional Science Review,
31(4):343–58.
MILES, D. & SCOTT, A. 2005. Macroeconomics: Understanding the Wealth of
Nations. 2nd ed. John Wiley & Sons.
MPUMALANGA DEPARTMENT OF ECONOMIC DEVELOPMENT AND PLANNING.
2009. Mpumalanga. Economic Development Review, 2004-2009.
129
MPUMALANGA DEPARTMENT OF FINANCE. 2011. Socio-Economic Review and
Outlook of Mpumalanga September 2011.
http://www.mpumalanga.gov.za/dedet/docs_pubs/docs/DEDET%20ANNUAL%20
REPORT%202011.pdf Date accessed: 21 Feb. 2012.
MPUMALANGA TOP BUSINESS PORTFOLIO. 2009. Mpumalanga Economic
Overview. http://www.mputopbusi s.co.za/site/the-mpumalanga-economy Date of
access: 20 May 2010.
MPUMALANGA PROVINCIAL GOVERNMENT FINANCE DEPARTMENT see
SOUTH AFRICA. Mpumalanga Provincial Government Finance Department
ORGANISATION FOR ECONOMIC CO-OPERATION AND DEVELOPMENT
(OECD). 2001. Glossary of statistical terms .
http://stats.oecd.org/glossary/detail.asp?ID=1184. Date of access: 5 March 2012.
PEARSON, J.J.A. 2007. A Decision Support Model to Identify Realistic Export
Opportunities for South Africa. (Thesis–PhD). North-West University,
Potchefstroom Campus. School of Economics.
PEARSON, J.J.A., CUYVERS, L. & VIVIERS, W. 2006. Identifying Export
Opportunities: the Case of South Africa.
http://www.essa.org.za/download/2007conference/Pearson;Viviers&Cuyvers_Ide
ntifying%20export.pdf Date of access: 15 April 2010.
PETRAKOS, G., & ARVANITIDIS, P. 2008. Determinants of Economic Growth.
Economic Alternatives, (1):11-30.
PIERCE, R.J., & SCHOTT, P.K. 2010. Concording U.S. Harmonized System Codes
Over Time. http://faculty.som.yale.edu/peterschott/files/research/papers/readme_
hs_over_time_33.pdf Date of access: 13 Feb 2012.
POGGE, T. 2005. World Poverty and Human Rights. Ethics & International Affairs,
19:1–7.
130
PORTER, M. 1990. The Competitive Advantage of Nations. Harvard Business
Review, March-April: 70-91
PORTER, M.E. 1998. The Competitive Advantage of Nations: With a New
Introduction. Houndmills, Basingstoke: Palgrave.
RICARDO, D. 1817. On the Principles of Political Economic and Taxation. London:
Murray. http://socserv.mcmaster.ca/econ/ugcm/3ll3/ricardo/Principles.pdf Date of
access: 12 Feb 2012
RICHARDS, T.J., VAN ISPELEN, P. & KAGAN, A. 1997. A Two-Stage Analysis of
the Effectiveness of Promotional Programs for U.S. Apples. American Journal of
Agricultural Economics, 79:825-837.
ROMER, P.M. 1986. Increasing Returns and Long-Run Growth. Journal of Political
Economy, 1002-1037. October.
RUSSU, C. 2011. Revealed Competitive Advantage of the European Union and
Romanian Manufacturing Industries. Economic Sciences Series, 63(3):50-58.
SALVATORE. D. 2004. International Economics. 8th ed. Crawfordsville: Wiley.
SAMUELSON, P.A. & NORDHAUS, W.D. 2010. Macroeconomics. 19th ed. Boston:
McGraw-Hill.
SANIDAS, E. & SHIN, Y. 2010. Comparison of Revealed Comparative Advantage
Indices with Application to Trade Tendencies of East Asian Countries.
Department of Economics, Seoul National University
SHANKARMAHESH, M.N., OLSEN, H.W. & HONEYCUTT, E.D. JR. 2005. A
Dominant Product-Dominant Country Framework of Industrial Export
Segmentation. Industrial Marketing Management, 34:203-210.
SMITH, A. 1776. The Wealth of Nations. Books 1-5. 2005-edition: A Penn State
Electronic Classics Series Publication.
131
SMITH, S.C & TODARO, M.P. 2003. Economic Development. Harlow, England:
Pearson Addison Wesley.
SNOWDON, B & VANE, H.R. 2005. Modern Economics. Edward Elgar Publishers.
SOUTH AFRICA. Department of Trade and Industry. 2005. National export strategy.
Pretoria: Department of Trade and Industry. DTI-Campus. June, Number 4.
SOUTH AFRICA. Mpumalanga Provincial Government Finance Department. 2011.
Socio-Economic Review and Outlook of Mpumalanga [email received from
[email protected]] 22 September 2011
SOUTHERN AFRICAN PLACES. 2012. Map of Mpumalanga. (Image online)
http://www.places.co.za/maps/mpumalanga_map.html. Date of access 10 May
2012
STATISITICS SOUTH AFRICA (STATSSA). 2010. Stats in brief: 2010. Pretoria.
www.statssa.gov.za/publications/StatsInBrief/StatsInBrief2010.pdf/. Date of
access: 1 June 2011.
STATISITICS SOUTH AFRICA (STATSSA). 2011. Stats in brief: 2010. Pretoria.
http://www.statssa.gov.za/publications/P0302/P03022011.pdf. Date of access: 15
Aug 2011.
STATE OF THE ENVIROMENT IN SOUTH AFRICA. 2005. Mpumalanga.
http://www.mpu.agric.za/SOER/Mpumalanga%20Publikit%20Web%20Version%2
0SoER%20(2003)/default.htm Date of access: 15 May 2010.
STEENKAMP, E., ROSSOUW, R., VIVIERS, W. & CUYVERS, L. 2009. Export
Market Selection Methods and the Identification of Realistic Export Oppurtunities
for South Africa using a Desicion Support Model. Arcadia: Trade and Industrial
Policy Strategies. Paper no. 3-2009, Nov.
http://www.tips.org.za/files/Export_Market_Selection_Methods.pdf. Date of
access: 15 August 2012.
132
UTKULU, Y. & SEYMEN. D. 2004. Revealed Comparative Advantage and
Competitive s: Evidence for Turkey vis-à-vis the EU/15. Presented at the
European Trade Study Group 6th Annual Conference, ETSG 2004, Nottingham,
September 2004.
VAN AARDE, N & VIVIERS, W. 2007. Export Promotion in South Africa: Evaluation
of the EMIA Scheme of the DTI. Paper presented at the Economic Society of
South Africa Conference 2007.
VOLLRATH, T.L. 1991. A Theoretical Evaluation of Alternative Trade Intensity
Measures of Revealed Comparative Advantage. Weltwirtschaftliches Archiv,
127(2), 265-280.
WACZIARG, R. 2001. Measuring the Dynamic Gains from Trade. World Bank
Economic Review, 15:393-429.
WILLOUGBY, C. 2007. Ways to Ensure Large Impact from Regional Transport
Investment in Africa. Report of the Development for International Development.
London: DFID.
YAMANDA. H. 1998. A Note on the Causality between Export and Productivity: An
Empirical Re-Examination. Economics Letters. 61:111-114.
YANYUN, Z., & MINGQIAN, Z. 2004. R&D and Economic Growth. Paper presented
at the Seoul Conference on Korea and the world economy III, Seoul, Korea, 3-4
July 2004.
YU, D. 2008. The Harmonized System - Amendments and their Impact on WTO
Members Schedules World Trade Organisation.
http://www.wto.org/english/res_e/reser_e/ersd200802_e.pdf/. Date of access: 13
Feb 2012.
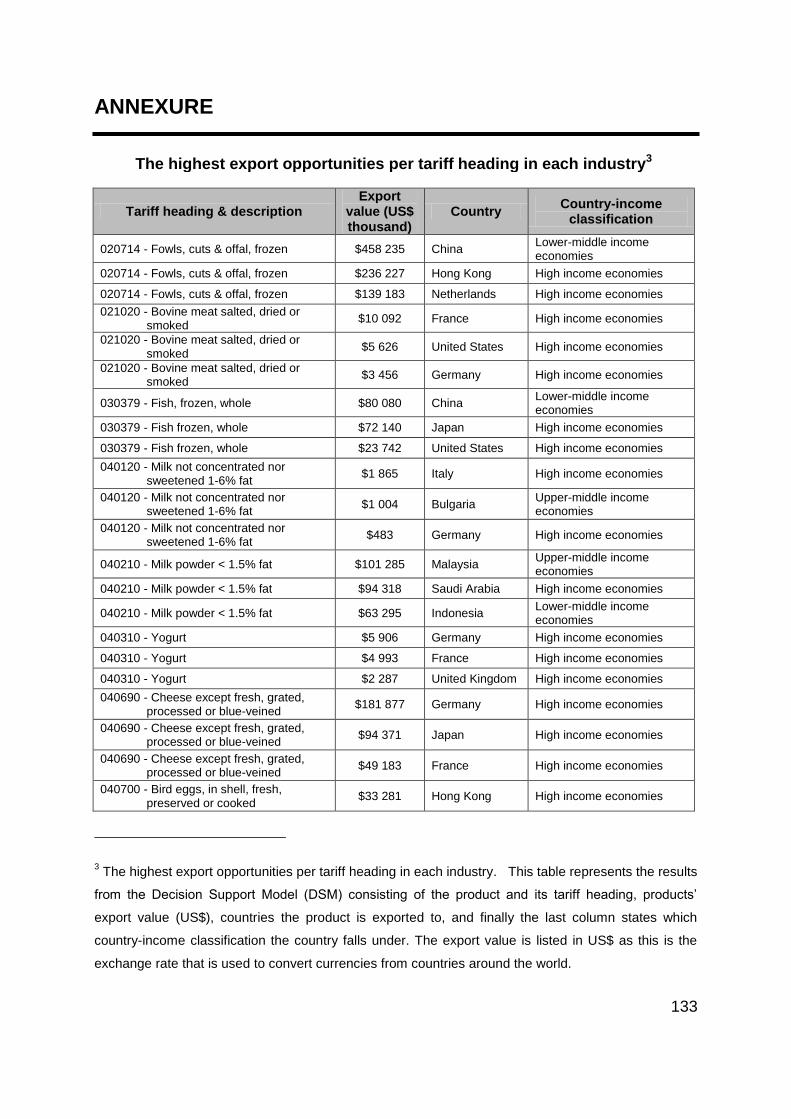
133
ANNEXURE
The highest export opportunities per tariff heading in each industry3
Tariff heading & description
Export value (US$ thousand)
Country Country-income
classification
020714 - Fowls, cuts & offal, frozen $458 235 China Lower-middle income economies
020714 - Fowls, cuts & offal, frozen $236 227 Hong Kong High income economies
020714 - Fowls, cuts & offal, frozen $139 183 Netherlands High income economies
021020 - Bovine meat salted, dried or smoked
$10 092 France High income economies
021020 - Bovine meat salted, dried or smoked
$5 626 United States High income economies
021020 - Bovine meat salted, dried or smoked
$3 456 Germany High income economies
030379 - Fish, frozen, whole $80 080 China Lower-middle income economies
030379 - Fish frozen, whole $72 140 Japan High income economies
030379 - Fish frozen, whole $23 742 United States High income economies
040120 - Milk not concentrated nor sweetened 1-6% fat
$1 865 Italy High income economies
040120 - Milk not concentrated nor sweetened 1-6% fat
$1 004 Bulgaria Upper-middle income economies
040120 - Milk not concentrated nor sweetened 1-6% fat
$483 Germany High income economies
040210 - Milk powder < 1.5% fat $101 285 Malaysia Upper-middle income economies
040210 - Milk powder < 1.5% fat $94 318 Saudi Arabia High income economies
040210 - Milk powder < 1.5% fat $63 295 Indonesia Lower-middle income economies
040310 - Yogurt $5 906 Germany High income economies
040310 - Yogurt $4 993 France High income economies
040310 - Yogurt $2 287 United Kingdom High income economies
040690 - Cheese except fresh, grated, processed or blue-veined
$181 877 Germany High income economies
040690 - Cheese except fresh, grated, processed or blue-veined
$94 371 Japan High income economies
040690 - Cheese except fresh, grated, processed or blue-veined
$49 183 France High income economies
040700 - Bird eggs, in shell, fresh, preserved or cooked
$33 281 Hong Kong High income economies
3 The highest export opportunities per tariff heading in each industry. This table represents the results
from the Decision Support Model (DSM) consisting of the product and its tariff heading, products’
export value (US$), countries the product is exported to, and finally the last column states which
country-income classification the country falls under. The export value is listed in US$ as this is the
exchange rate that is used to convert currencies from countries around the world.
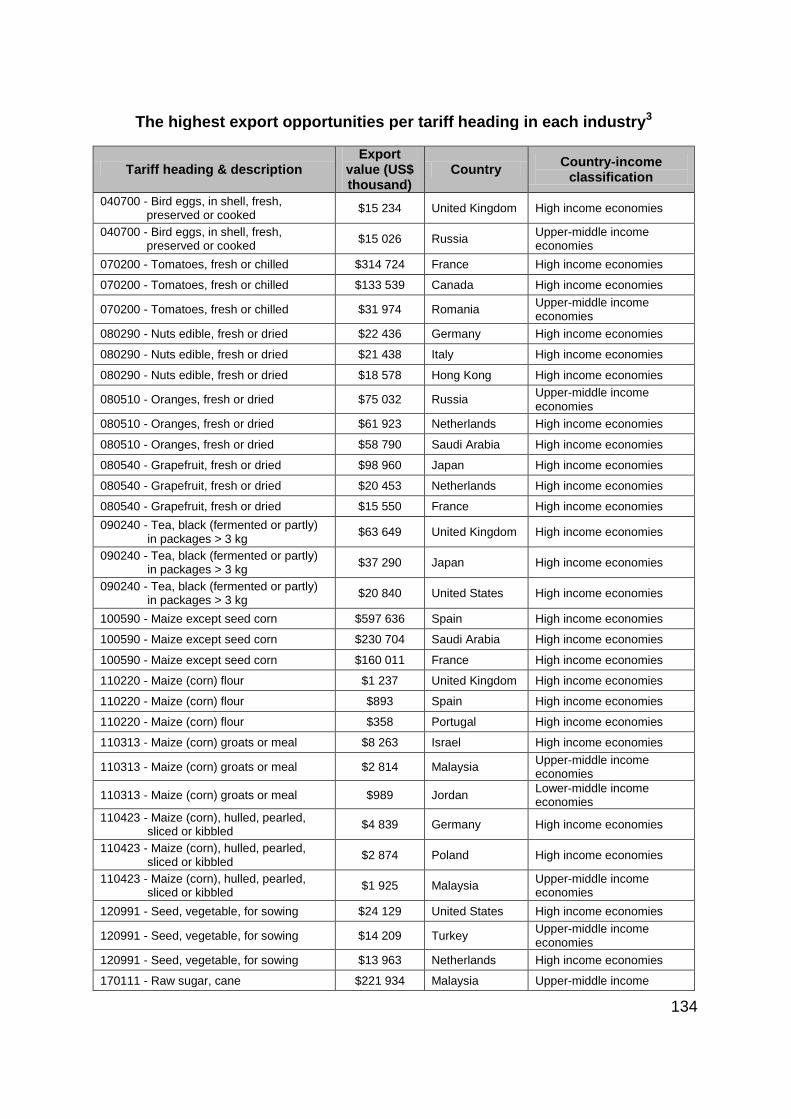
134
The highest export opportunities per tariff heading in each industry3
Tariff heading & description
Export value (US$ thousand)
Country Country-income
classification
040700 - Bird eggs, in shell, fresh, preserved or cooked
$15 234 United Kingdom High income economies
040700 - Bird eggs, in shell, fresh, preserved or cooked
$15 026 Russia Upper-middle income economies
070200 - Tomatoes, fresh or chilled $314 724 France High income economies
070200 - Tomatoes, fresh or chilled $133 539 Canada High income economies
070200 - Tomatoes, fresh or chilled $31 974 Romania Upper-middle income economies
080290 - Nuts edible, fresh or dried $22 436 Germany High income economies
080290 - Nuts edible, fresh or dried $21 438 Italy High income economies
080290 - Nuts edible, fresh or dried $18 578 Hong Kong High income economies
080510 - Oranges, fresh or dried $75 032 Russia Upper-middle income economies
080510 - Oranges, fresh or dried $61 923 Netherlands High income economies
080510 - Oranges, fresh or dried $58 790 Saudi Arabia High income economies
080540 - Grapefruit, fresh or dried $98 960 Japan High income economies
080540 - Grapefruit, fresh or dried $20 453 Netherlands High income economies
080540 - Grapefruit, fresh or dried $15 550 France High income economies
090240 - Tea, black (fermented or partly) in packages > 3 kg
$63 649 United Kingdom High income economies
090240 - Tea, black (fermented or partly) in packages > 3 kg
$37 290 Japan High income economies
090240 - Tea, black (fermented or partly) in packages > 3 kg
$20 840 United States High income economies
100590 - Maize except seed corn $597 636 Spain High income economies
100590 - Maize except seed corn $230 704 Saudi Arabia High income economies
100590 - Maize except seed corn $160 011 France High income economies
110220 - Maize (corn) flour $1 237 United Kingdom High income economies
110220 - Maize (corn) flour $893 Spain High income economies
110220 - Maize (corn) flour $358 Portugal High income economies
110313 - Maize (corn) groats or meal $8 263 Israel High income economies
110313 - Maize (corn) groats or meal $2 814 Malaysia Upper-middle income economies
110313 - Maize (corn) groats or meal $989 Jordan Lower-middle income economies
110423 - Maize (corn), hulled, pearled, sliced or kibbled
$4 839 Germany High income economies
110423 - Maize (corn), hulled, pearled, sliced or kibbled
$2 874 Poland High income economies
110423 - Maize (corn), hulled, pearled, sliced or kibbled
$1 925 Malaysia Upper-middle income economies
120991 - Seed, vegetable, for sowing $24 129 United States High income economies
120991 - Seed, vegetable, for sowing $14 209 Turkey Upper-middle income economies
120991 - Seed, vegetable, for sowing $13 963 Netherlands High income economies
170111 - Raw sugar, cane $221 934 Malaysia Upper-middle income
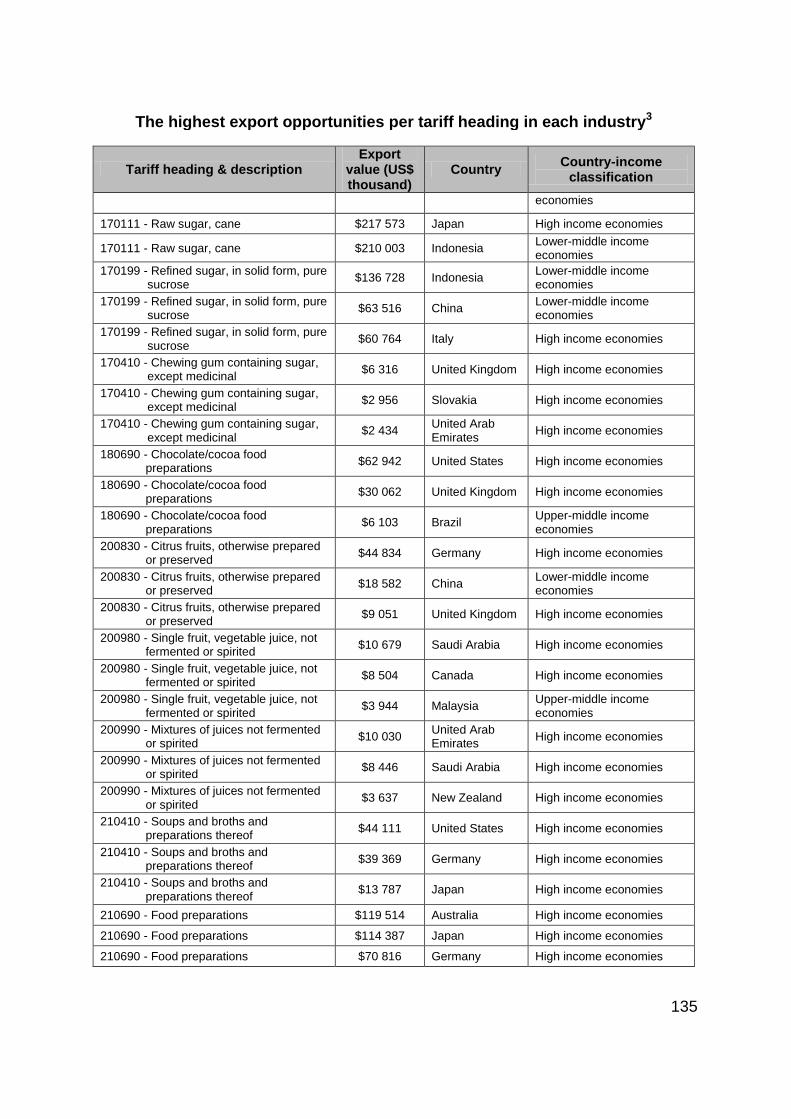
135
The highest export opportunities per tariff heading in each industry3
Tariff heading & description
Export value (US$ thousand)
Country Country-income
classification
economies
170111 - Raw sugar, cane $217 573 Japan High income economies
170111 - Raw sugar, cane $210 003 Indonesia Lower-middle income economies
170199 - Refined sugar, in solid form, pure sucrose
$136 728 Indonesia Lower-middle income economies
170199 - Refined sugar, in solid form, pure sucrose
$63 516 China Lower-middle income economies
170199 - Refined sugar, in solid form, pure sucrose
$60 764 Italy High income economies
170410 - Chewing gum containing sugar, except medicinal
$6 316 United Kingdom High income economies
170410 - Chewing gum containing sugar, except medicinal
$2 956 Slovakia High income economies
170410 - Chewing gum containing sugar, except medicinal
$2 434 United Arab Emirates
High income economies
180690 - Chocolate/cocoa food preparations
$62 942 United States High income economies
180690 - Chocolate/cocoa food preparations
$30 062 United Kingdom High income economies
180690 - Chocolate/cocoa food preparations
$6 103 Brazil Upper-middle income economies
200830 - Citrus fruits, otherwise prepared or preserved
$44 834 Germany High income economies
200830 - Citrus fruits, otherwise prepared or preserved
$18 582 China Lower-middle income economies
200830 - Citrus fruits, otherwise prepared or preserved
$9 051 United Kingdom High income economies
200980 - Single fruit, vegetable juice, not fermented or spirited
$10 679 Saudi Arabia High income economies
200980 - Single fruit, vegetable juice, not fermented or spirited
$8 504 Canada High income economies
200980 - Single fruit, vegetable juice, not fermented or spirited
$3 944 Malaysia Upper-middle income economies
200990 - Mixtures of juices not fermented or spirited
$10 030 United Arab Emirates
High income economies
200990 - Mixtures of juices not fermented or spirited
$8 446 Saudi Arabia High income economies
200990 - Mixtures of juices not fermented or spirited
$3 637 New Zealand High income economies
210410 - Soups and broths and preparations thereof
$44 111 United States High income economies
210410 - Soups and broths and preparations thereof
$39 369 Germany High income economies
210410 - Soups and broths and preparations thereof
$13 787 Japan High income economies
210690 - Food preparations $119 514 Australia High income economies
210690 - Food preparations $114 387 Japan High income economies
210690 - Food preparations $70 816 Germany High income economies
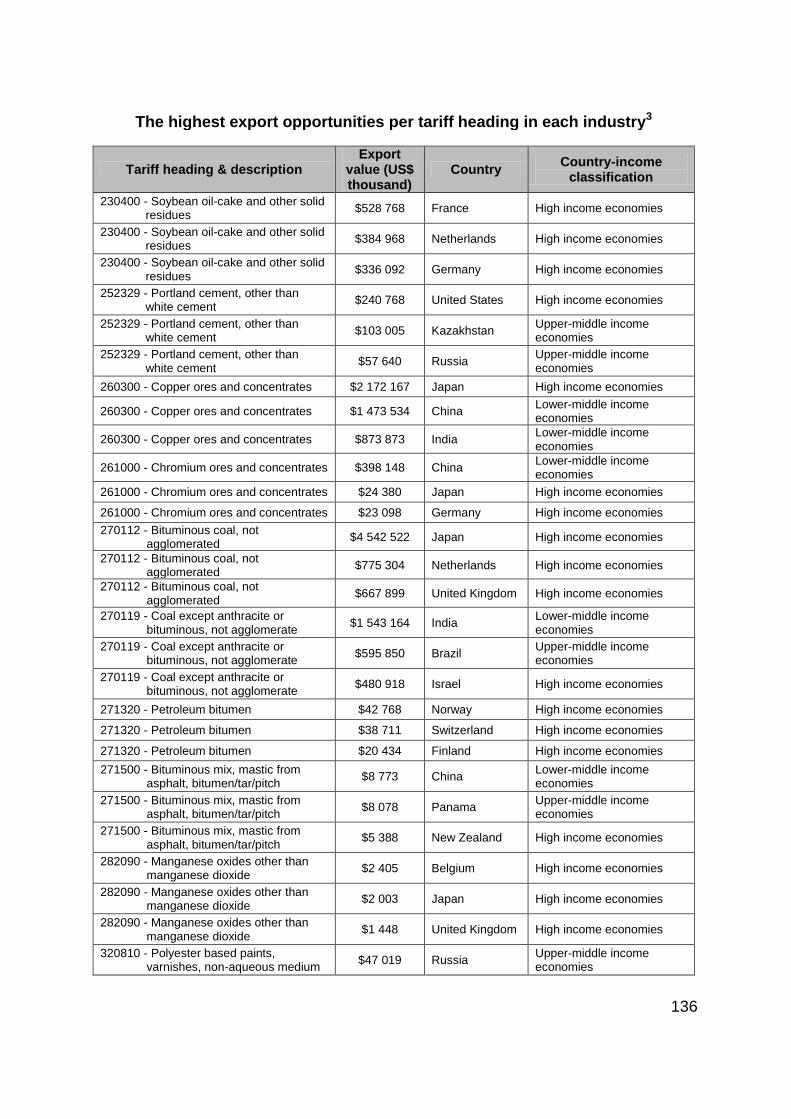
136
The highest export opportunities per tariff heading in each industry3
Tariff heading & description
Export value (US$ thousand)
Country Country-income
classification
230400 - Soybean oil-cake and other solid residues
$528 768 France High income economies
230400 - Soybean oil-cake and other solid residues
$384 968 Netherlands High income economies
230400 - Soybean oil-cake and other solid residues
$336 092 Germany High income economies
252329 - Portland cement, other than white cement
$240 768 United States High income economies
252329 - Portland cement, other than white cement
$103 005 Kazakhstan Upper-middle income economies
252329 - Portland cement, other than white cement
$57 640 Russia Upper-middle income economies
260300 - Copper ores and concentrates $2 172 167 Japan High income economies
260300 - Copper ores and concentrates $1 473 534 China Lower-middle income economies
260300 - Copper ores and concentrates $873 873 India Lower-middle income economies
261000 - Chromium ores and concentrates $398 148 China Lower-middle income economies
261000 - Chromium ores and concentrates $24 380 Japan High income economies
261000 - Chromium ores and concentrates $23 098 Germany High income economies
270112 - Bituminous coal, not agglomerated
$4 542 522 Japan High income economies
270112 - Bituminous coal, not agglomerated
$775 304 Netherlands High income economies
270112 - Bituminous coal, not agglomerated
$667 899 United Kingdom High income economies
270119 - Coal except anthracite or bituminous, not agglomerate
$1 543 164 India Lower-middle income economies
270119 - Coal except anthracite or bituminous, not agglomerate
$595 850 Brazil Upper-middle income economies
270119 - Coal except anthracite or bituminous, not agglomerate
$480 918 Israel High income economies
271320 - Petroleum bitumen $42 768 Norway High income economies
271320 - Petroleum bitumen $38 711 Switzerland High income economies
271320 - Petroleum bitumen $20 434 Finland High income economies
271500 - Bituminous mix, mastic from asphalt, bitumen/tar/pitch
$8 773 China Lower-middle income economies
271500 - Bituminous mix, mastic from asphalt, bitumen/tar/pitch
$8 078 Panama Upper-middle income economies
271500 - Bituminous mix, mastic from asphalt, bitumen/tar/pitch
$5 388 New Zealand High income economies
282090 - Manganese oxides other than manganese dioxide
$2 405 Belgium High income economies
282090 - Manganese oxides other than manganese dioxide
$2 003 Japan High income economies
282090 - Manganese oxides other than manganese dioxide
$1 448 United Kingdom High income economies
320810 - Polyester based paints, varnishes, non-aqueous medium
$47 019 Russia Upper-middle income economies
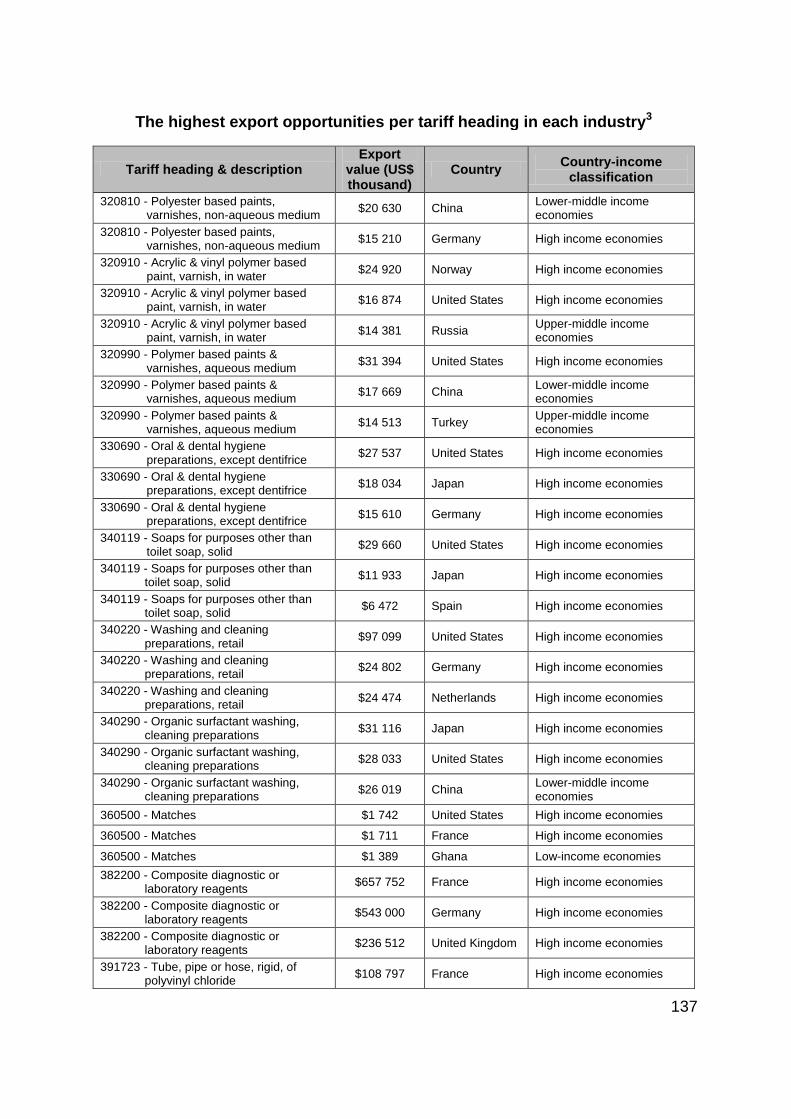
137
The highest export opportunities per tariff heading in each industry3
Tariff heading & description
Export value (US$ thousand)
Country Country-income
classification
320810 - Polyester based paints, varnishes, non-aqueous medium
$20 630 China Lower-middle income economies
320810 - Polyester based paints, varnishes, non-aqueous medium
$15 210 Germany High income economies
320910 - Acrylic & vinyl polymer based paint, varnish, in water
$24 920 Norway High income economies
320910 - Acrylic & vinyl polymer based paint, varnish, in water
$16 874 United States High income economies
320910 - Acrylic & vinyl polymer based paint, varnish, in water
$14 381 Russia Upper-middle income economies
320990 - Polymer based paints & varnishes, aqueous medium
$31 394 United States High income economies
320990 - Polymer based paints & varnishes, aqueous medium
$17 669 China Lower-middle income economies
320990 - Polymer based paints & varnishes, aqueous medium
$14 513 Turkey Upper-middle income economies
330690 - Oral & dental hygiene preparations, except dentifrice
$27 537 United States High income economies
330690 - Oral & dental hygiene preparations, except dentifrice
$18 034 Japan High income economies
330690 - Oral & dental hygiene preparations, except dentifrice
$15 610 Germany High income economies
340119 - Soaps for purposes other than toilet soap, solid
$29 660 United States High income economies
340119 - Soaps for purposes other than toilet soap, solid
$11 933 Japan High income economies
340119 - Soaps for purposes other than toilet soap, solid
$6 472 Spain High income economies
340220 - Washing and cleaning preparations, retail
$97 099 United States High income economies
340220 - Washing and cleaning preparations, retail
$24 802 Germany High income economies
340220 - Washing and cleaning preparations, retail
$24 474 Netherlands High income economies
340290 - Organic surfactant washing, cleaning preparations
$31 116 Japan High income economies
340290 - Organic surfactant washing, cleaning preparations
$28 033 United States High income economies
340290 - Organic surfactant washing, cleaning preparations
$26 019 China Lower-middle income economies
360500 - Matches $1 742 United States High income economies
360500 - Matches $1 711 France High income economies
360500 - Matches $1 389 Ghana Low-income economies
382200 - Composite diagnostic or laboratory reagents
$657 752 France High income economies
382200 - Composite diagnostic or laboratory reagents
$543 000 Germany High income economies
382200 - Composite diagnostic or laboratory reagents
$236 512 United Kingdom High income economies
391723 - Tube, pipe or hose, rigid, of polyvinyl chloride
$108 797 France High income economies
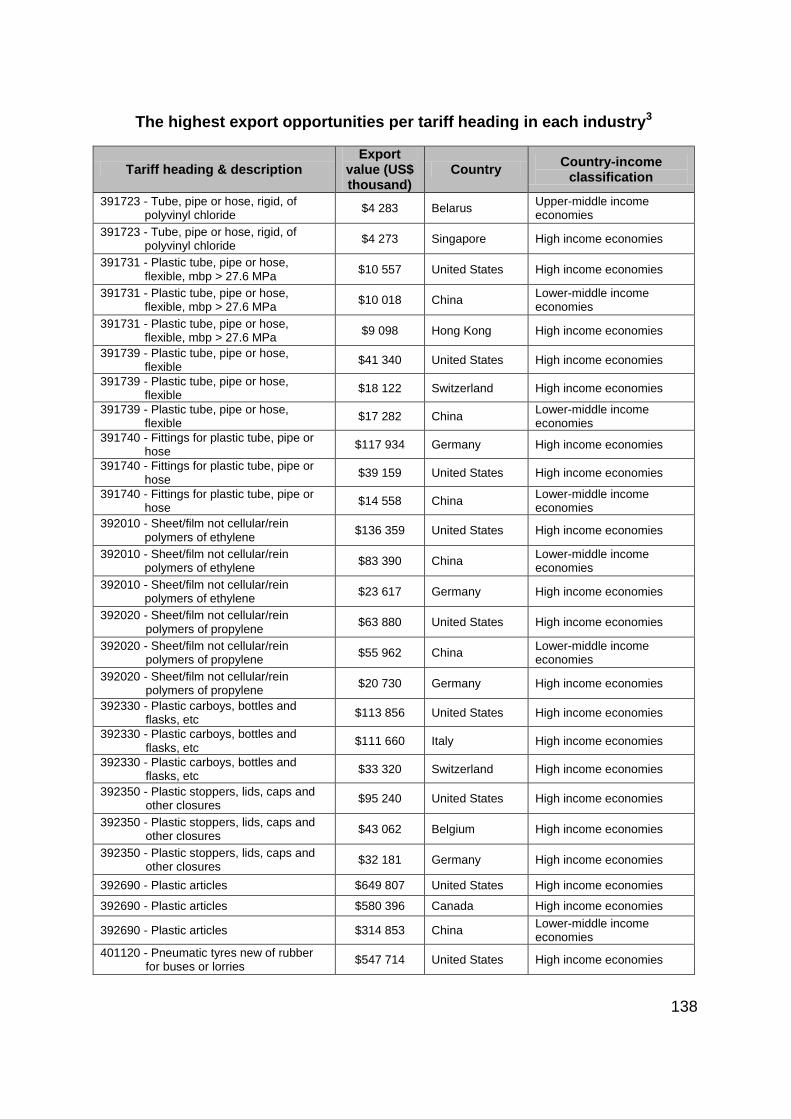
138
The highest export opportunities per tariff heading in each industry3
Tariff heading & description
Export value (US$ thousand)
Country Country-income
classification
391723 - Tube, pipe or hose, rigid, of polyvinyl chloride
$4 283 Belarus Upper-middle income economies
391723 - Tube, pipe or hose, rigid, of polyvinyl chloride
$4 273 Singapore High income economies
391731 - Plastic tube, pipe or hose, flexible, mbp > 27.6 MPa
$10 557 United States High income economies
391731 - Plastic tube, pipe or hose, flexible, mbp > 27.6 MPa
$10 018 China Lower-middle income economies
391731 - Plastic tube, pipe or hose, flexible, mbp > 27.6 MPa
$9 098 Hong Kong High income economies
391739 - Plastic tube, pipe or hose, flexible
$41 340 United States High income economies
391739 - Plastic tube, pipe or hose, flexible
$18 122 Switzerland High income economies
391739 - Plastic tube, pipe or hose, flexible
$17 282 China Lower-middle income economies
391740 - Fittings for plastic tube, pipe or hose
$117 934 Germany High income economies
391740 - Fittings for plastic tube, pipe or hose
$39 159 United States High income economies
391740 - Fittings for plastic tube, pipe or hose
$14 558 China Lower-middle income economies
392010 - Sheet/film not cellular/rein polymers of ethylene
$136 359 United States High income economies
392010 - Sheet/film not cellular/rein polymers of ethylene
$83 390 China Lower-middle income economies
392010 - Sheet/film not cellular/rein polymers of ethylene
$23 617 Germany High income economies
392020 - Sheet/film not cellular/rein polymers of propylene
$63 880 United States High income economies
392020 - Sheet/film not cellular/rein polymers of propylene
$55 962 China Lower-middle income economies
392020 - Sheet/film not cellular/rein polymers of propylene
$20 730 Germany High income economies
392330 - Plastic carboys, bottles and flasks, etc
$113 856 United States High income economies
392330 - Plastic carboys, bottles and flasks, etc
$111 660 Italy High income economies
392330 - Plastic carboys, bottles and flasks, etc
$33 320 Switzerland High income economies
392350 - Plastic stoppers, lids, caps and other closures
$95 240 United States High income economies
392350 - Plastic stoppers, lids, caps and other closures
$43 062 Belgium High income economies
392350 - Plastic stoppers, lids, caps and other closures
$32 181 Germany High income economies
392690 - Plastic articles $649 807 United States High income economies
392690 - Plastic articles $580 396 Canada High income economies
392690 - Plastic articles $314 853 China Lower-middle income economies
401120 - Pneumatic tyres new of rubber for buses or lorries
$547 714 United States High income economies
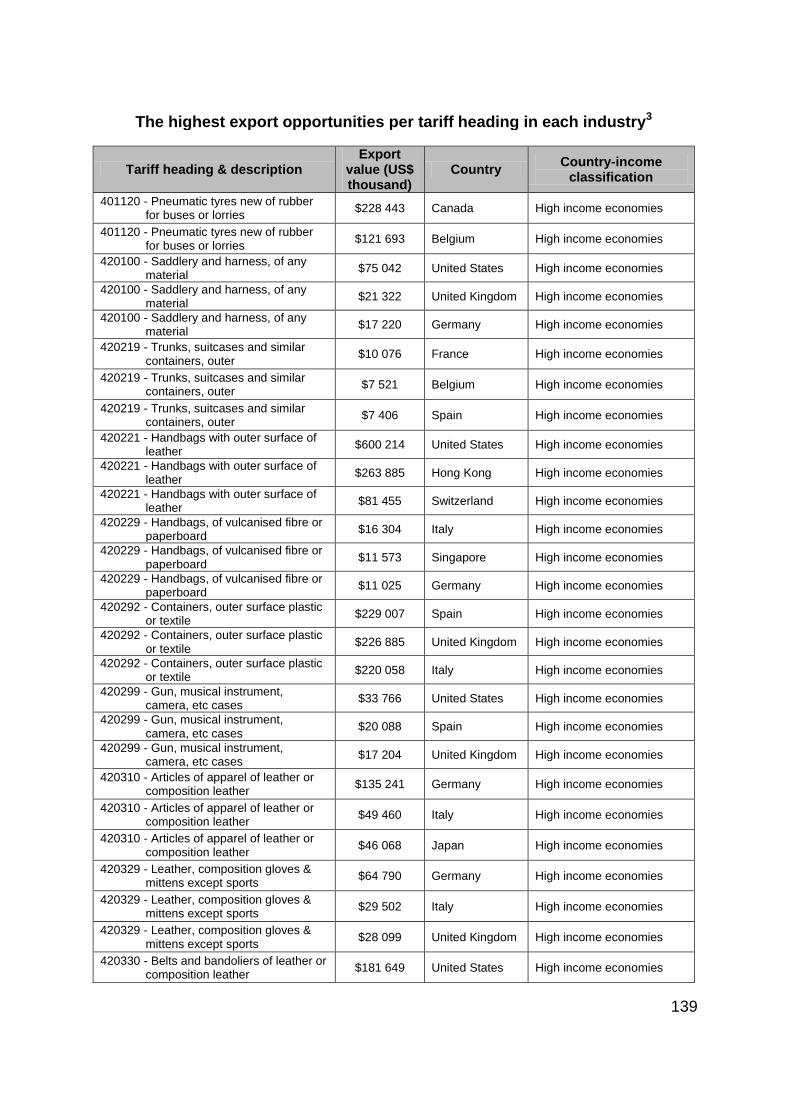
139
The highest export opportunities per tariff heading in each industry3
Tariff heading & description
Export value (US$ thousand)
Country Country-income
classification
401120 - Pneumatic tyres new of rubber for buses or lorries
$228 443 Canada High income economies
401120 - Pneumatic tyres new of rubber for buses or lorries
$121 693 Belgium High income economies
420100 - Saddlery and harness, of any material
$75 042 United States High income economies
420100 - Saddlery and harness, of any material
$21 322 United Kingdom High income economies
420100 - Saddlery and harness, of any material
$17 220 Germany High income economies
420219 - Trunks, suitcases and similar containers, outer
$10 076 France High income economies
420219 - Trunks, suitcases and similar containers, outer
$7 521 Belgium High income economies
420219 - Trunks, suitcases and similar containers, outer
$7 406 Spain High income economies
420221 - Handbags with outer surface of leather
$600 214 United States High income economies
420221 - Handbags with outer surface of leather
$263 885 Hong Kong High income economies
420221 - Handbags with outer surface of leather
$81 455 Switzerland High income economies
420229 - Handbags, of vulcanised fibre or paperboard
$16 304 Italy High income economies
420229 - Handbags, of vulcanised fibre or paperboard
$11 573 Singapore High income economies
420229 - Handbags, of vulcanised fibre or paperboard
$11 025 Germany High income economies
420292 - Containers, outer surface plastic or textile
$229 007 Spain High income economies
420292 - Containers, outer surface plastic or textile
$226 885 United Kingdom High income economies
420292 - Containers, outer surface plastic or textile
$220 058 Italy High income economies
420299 - Gun, musical instrument, camera, etc cases
$33 766 United States High income economies
420299 - Gun, musical instrument, camera, etc cases
$20 088 Spain High income economies
420299 - Gun, musical instrument, camera, etc cases
$17 204 United Kingdom High income economies
420310 - Articles of apparel of leather or composition leather
$135 241 Germany High income economies
420310 - Articles of apparel of leather or composition leather
$49 460 Italy High income economies
420310 - Articles of apparel of leather or composition leather
$46 068 Japan High income economies
420329 - Leather, composition gloves & mittens except sports
$64 790 Germany High income economies
420329 - Leather, composition gloves & mittens except sports
$29 502 Italy High income economies
420329 - Leather, composition gloves & mittens except sports
$28 099 United Kingdom High income economies
420330 - Belts and bandoliers of leather or composition leather
$181 649 United States High income economies
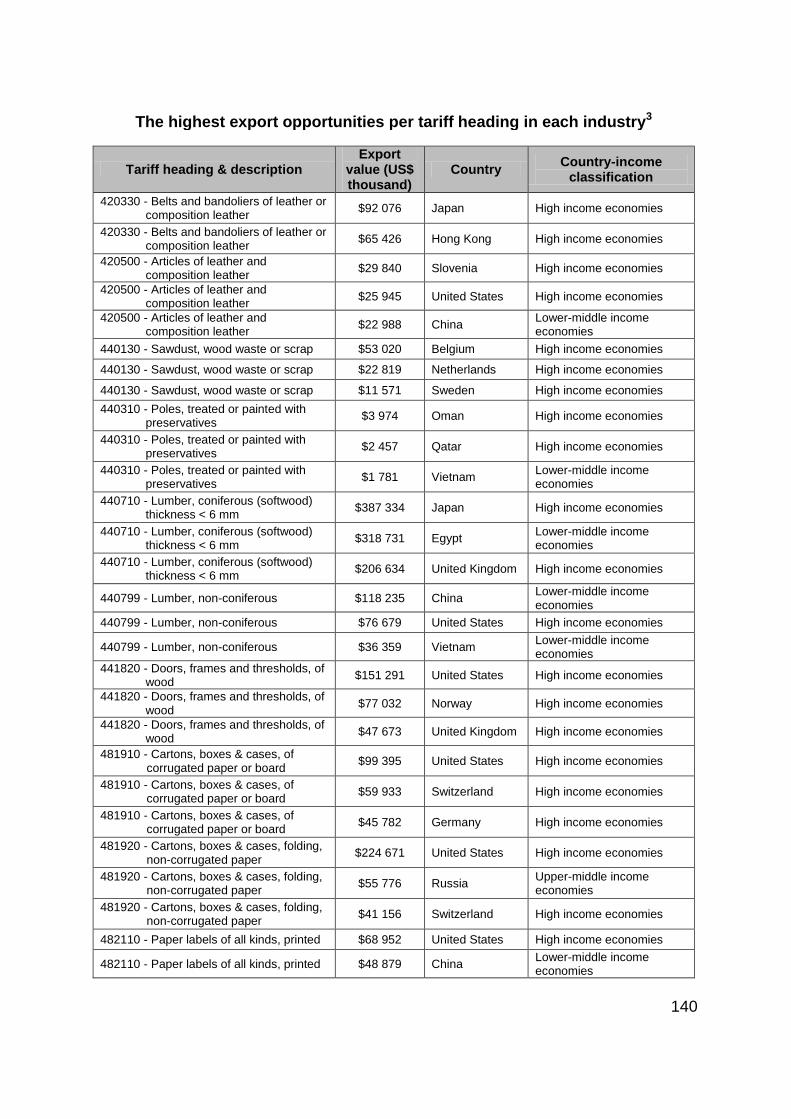
140
The highest export opportunities per tariff heading in each industry3
Tariff heading & description
Export value (US$ thousand)
Country Country-income
classification
420330 - Belts and bandoliers of leather or composition leather
$92 076 Japan High income economies
420330 - Belts and bandoliers of leather or composition leather
$65 426 Hong Kong High income economies
420500 - Articles of leather and composition leather
$29 840 Slovenia High income economies
420500 - Articles of leather and composition leather
$25 945 United States High income economies
420500 - Articles of leather and composition leather
$22 988 China Lower-middle income economies
440130 - Sawdust, wood waste or scrap $53 020 Belgium High income economies
440130 - Sawdust, wood waste or scrap $22 819 Netherlands High income economies
440130 - Sawdust, wood waste or scrap $11 571 Sweden High income economies
440310 - Poles, treated or painted with preservatives
$3 974 Oman High income economies
440310 - Poles, treated or painted with preservatives
$2 457 Qatar High income economies
440310 - Poles, treated or painted with preservatives
$1 781 Vietnam Lower-middle income economies
440710 - Lumber, coniferous (softwood) thickness < 6 mm
$387 334 Japan High income economies
440710 - Lumber, coniferous (softwood) thickness < 6 mm
$318 731 Egypt Lower-middle income economies
440710 - Lumber, coniferous (softwood) thickness < 6 mm
$206 634 United Kingdom High income economies
440799 - Lumber, non-coniferous $118 235 China Lower-middle income economies
440799 - Lumber, non-coniferous $76 679 United States High income economies
440799 - Lumber, non-coniferous $36 359 Vietnam Lower-middle income economies
441820 - Doors, frames and thresholds, of wood
$151 291 United States High income economies
441820 - Doors, frames and thresholds, of wood
$77 032 Norway High income economies
441820 - Doors, frames and thresholds, of wood
$47 673 United Kingdom High income economies
481910 - Cartons, boxes & cases, of corrugated paper or board
$99 395 United States High income economies
481910 - Cartons, boxes & cases, of corrugated paper or board
$59 933 Switzerland High income economies
481910 - Cartons, boxes & cases, of corrugated paper or board
$45 782 Germany High income economies
481920 - Cartons, boxes & cases, folding, non-corrugated paper
$224 671 United States High income economies
481920 - Cartons, boxes & cases, folding, non-corrugated paper
$55 776 Russia Upper-middle income economies
481920 - Cartons, boxes & cases, folding, non-corrugated paper
$41 156 Switzerland High income economies
482110 - Paper labels of all kinds, printed $68 952 United States High income economies
482110 - Paper labels of all kinds, printed $48 879 China Lower-middle income economies
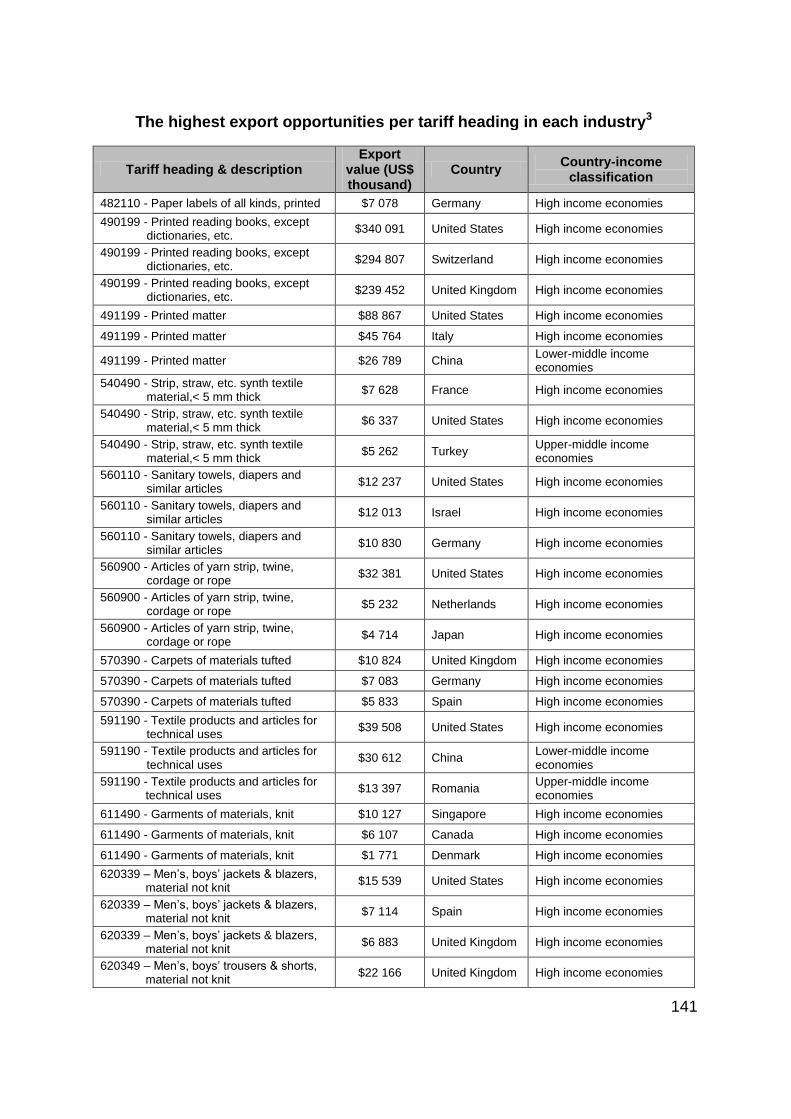
141
The highest export opportunities per tariff heading in each industry3
Tariff heading & description
Export value (US$ thousand)
Country Country-income
classification
482110 - Paper labels of all kinds, printed $7 078 Germany High income economies
490199 - Printed reading books, except dictionaries, etc.
$340 091 United States High income economies
490199 - Printed reading books, except dictionaries, etc.
$294 807 Switzerland High income economies
490199 - Printed reading books, except dictionaries, etc.
$239 452 United Kingdom High income economies
491199 - Printed matter $88 867 United States High income economies
491199 - Printed matter $45 764 Italy High income economies
491199 - Printed matter $26 789 China Lower-middle income economies
540490 - Strip, straw, etc. synth textile material,< 5 mm thick
$7 628 France High income economies
540490 - Strip, straw, etc. synth textile material,< 5 mm thick
$6 337 United States High income economies
540490 - Strip, straw, etc. synth textile material,< 5 mm thick
$5 262 Turkey Upper-middle income economies
560110 - Sanitary towels, diapers and similar articles
$12 237 United States High income economies
560110 - Sanitary towels, diapers and similar articles
$12 013 Israel High income economies
560110 - Sanitary towels, diapers and similar articles
$10 830 Germany High income economies
560900 - Articles of yarn strip, twine, cordage or rope
$32 381 United States High income economies
560900 - Articles of yarn strip, twine, cordage or rope
$5 232 Netherlands High income economies
560900 - Articles of yarn strip, twine, cordage or rope
$4 714 Japan High income economies
570390 - Carpets of materials tufted $10 824 United Kingdom High income economies
570390 - Carpets of materials tufted $7 083 Germany High income economies
570390 - Carpets of materials tufted $5 833 Spain High income economies
591190 - Textile products and articles for technical uses
$39 508 United States High income economies
591190 - Textile products and articles for technical uses
$30 612 China Lower-middle income economies
591190 - Textile products and articles for technical uses
$13 397 Romania Upper-middle income economies
611490 - Garments of materials, knit $10 127 Singapore High income economies
611490 - Garments of materials, knit $6 107 Canada High income economies
611490 - Garments of materials, knit $1 771 Denmark High income economies
620339 – Men’s, boys’ jackets & blazers, material not knit
$15 539 United States High income economies
620339 – Men’s, boys’ jackets & blazers, material not knit
$7 114 Spain High income economies
620339 – Men’s, boys’ jackets & blazers, material not knit
$6 883 United Kingdom High income economies
620349 – Men’s, boys’ trousers & shorts, material not knit
$22 166 United Kingdom High income economies
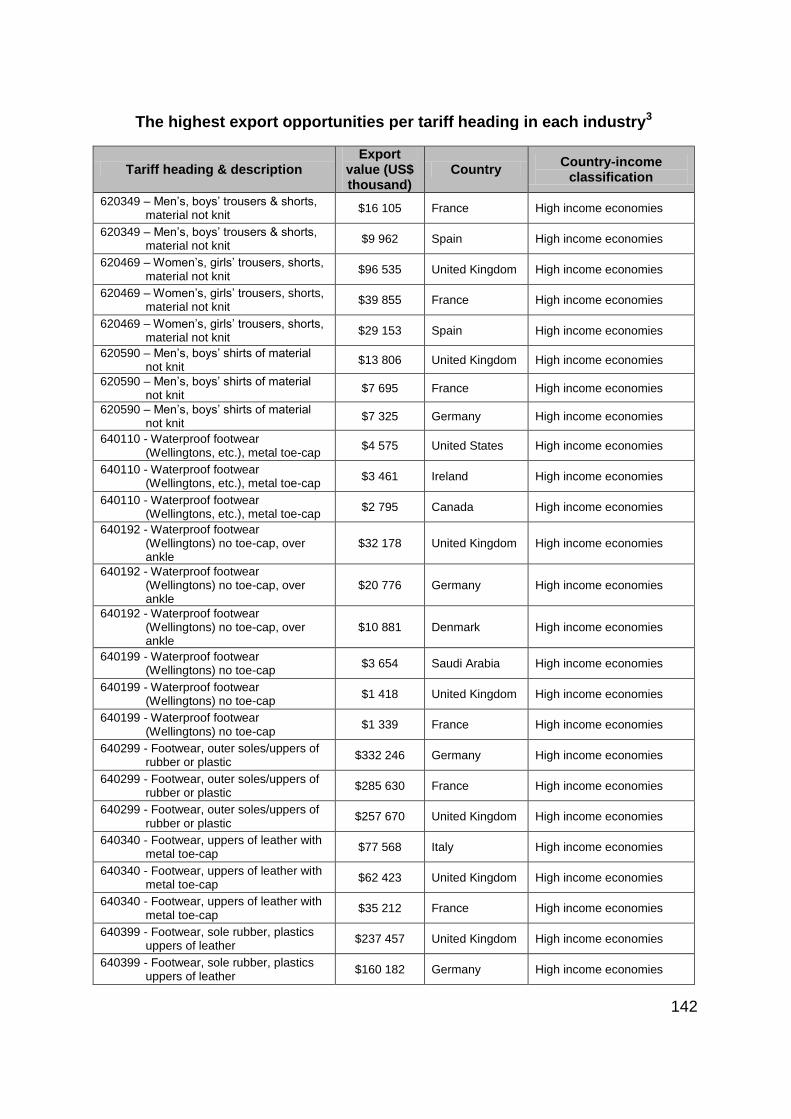
142
The highest export opportunities per tariff heading in each industry3
Tariff heading & description
Export value (US$ thousand)
Country Country-income
classification
620349 – Men’s, boys’ trousers & shorts, material not knit
$16 105 France High income economies
620349 – Men’s, boys’ trousers & shorts, material not knit
$9 962 Spain High income economies
620469 – Women’s, girls’ trousers, shorts, material not knit
$96 535 United Kingdom High income economies
620469 – Women’s, girls’ trousers, shorts, material not knit
$39 855 France High income economies
620469 – Women’s, girls’ trousers, shorts, material not knit
$29 153 Spain High income economies
620590 – Men’s, boys’ shirts of material not knit
$13 806 United Kingdom High income economies
620590 – Men’s, boys’ shirts of material not knit
$7 695 France High income economies
620590 – Men’s, boys’ shirts of material not knit
$7 325 Germany High income economies
640110 - Waterproof footwear (Wellingtons, etc.), metal toe-cap
$4 575 United States High income economies
640110 - Waterproof footwear (Wellingtons, etc.), metal toe-cap
$3 461 Ireland High income economies
640110 - Waterproof footwear (Wellingtons, etc.), metal toe-cap
$2 795 Canada High income economies
640192 - Waterproof footwear (Wellingtons) no toe-cap, over ankle
$32 178 United Kingdom High income economies
640192 - Waterproof footwear (Wellingtons) no toe-cap, over ankle
$20 776 Germany High income economies
640192 - Waterproof footwear (Wellingtons) no toe-cap, over ankle
$10 881 Denmark High income economies
640199 - Waterproof footwear (Wellingtons) no toe-cap
$3 654 Saudi Arabia High income economies
640199 - Waterproof footwear (Wellingtons) no toe-cap
$1 418 United Kingdom High income economies
640199 - Waterproof footwear (Wellingtons) no toe-cap
$1 339 France High income economies
640299 - Footwear, outer soles/uppers of rubber or plastic
$332 246 Germany High income economies
640299 - Footwear, outer soles/uppers of rubber or plastic
$285 630 France High income economies
640299 - Footwear, outer soles/uppers of rubber or plastic
$257 670 United Kingdom High income economies
640340 - Footwear, uppers of leather with metal toe-cap
$77 568 Italy High income economies
640340 - Footwear, uppers of leather with metal toe-cap
$62 423 United Kingdom High income economies
640340 - Footwear, uppers of leather with metal toe-cap
$35 212 France High income economies
640399 - Footwear, sole rubber, plastics uppers of leather
$237 457 United Kingdom High income economies
640399 - Footwear, sole rubber, plastics uppers of leather
$160 182 Germany High income economies
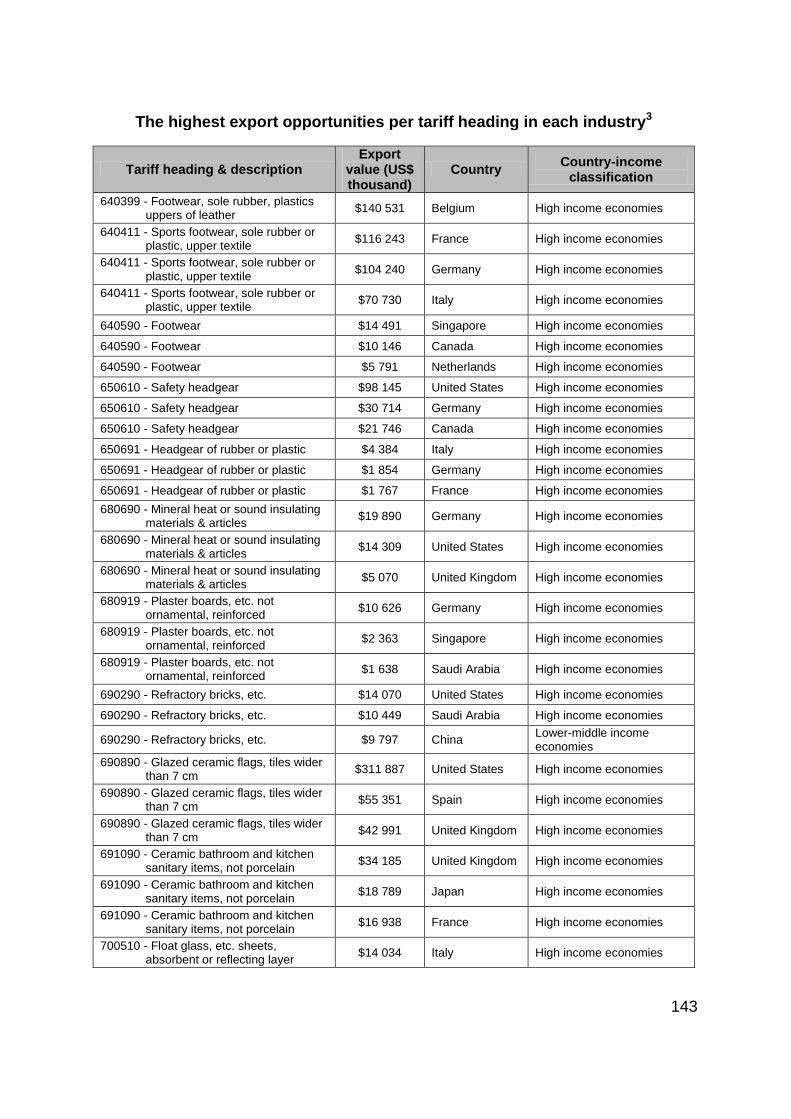
143
The highest export opportunities per tariff heading in each industry3
Tariff heading & description
Export value (US$ thousand)
Country Country-income
classification
640399 - Footwear, sole rubber, plastics uppers of leather
$140 531 Belgium High income economies
640411 - Sports footwear, sole rubber or plastic, upper textile
$116 243 France High income economies
640411 - Sports footwear, sole rubber or plastic, upper textile
$104 240 Germany High income economies
640411 - Sports footwear, sole rubber or plastic, upper textile
$70 730 Italy High income economies
640590 - Footwear $14 491 Singapore High income economies
640590 - Footwear $10 146 Canada High income economies
640590 - Footwear $5 791 Netherlands High income economies
650610 - Safety headgear $98 145 United States High income economies
650610 - Safety headgear $30 714 Germany High income economies
650610 - Safety headgear $21 746 Canada High income economies
650691 - Headgear of rubber or plastic $4 384 Italy High income economies
650691 - Headgear of rubber or plastic $1 854 Germany High income economies
650691 - Headgear of rubber or plastic $1 767 France High income economies
680690 - Mineral heat or sound insulating materials & articles
$19 890 Germany High income economies
680690 - Mineral heat or sound insulating materials & articles
$14 309 United States High income economies
680690 - Mineral heat or sound insulating materials & articles
$5 070 United Kingdom High income economies
680919 - Plaster boards, etc. not ornamental, reinforced
$10 626 Germany High income economies
680919 - Plaster boards, etc. not ornamental, reinforced
$2 363 Singapore High income economies
680919 - Plaster boards, etc. not ornamental, reinforced
$1 638 Saudi Arabia High income economies
690290 - Refractory bricks, etc. $14 070 United States High income economies
690290 - Refractory bricks, etc. $10 449 Saudi Arabia High income economies
690290 - Refractory bricks, etc. $9 797 China Lower-middle income economies
690890 - Glazed ceramic flags, tiles wider than 7 cm
$311 887 United States High income economies
690890 - Glazed ceramic flags, tiles wider than 7 cm
$55 351 Spain High income economies
690890 - Glazed ceramic flags, tiles wider than 7 cm
$42 991 United Kingdom High income economies
691090 - Ceramic bathroom and kitchen sanitary items, not porcelain
$34 185 United Kingdom High income economies
691090 - Ceramic bathroom and kitchen sanitary items, not porcelain
$18 789 Japan High income economies
691090 - Ceramic bathroom and kitchen sanitary items, not porcelain
$16 938 France High income economies
700510 - Float glass, etc. sheets, absorbent or reflecting layer
$14 034 Italy High income economies
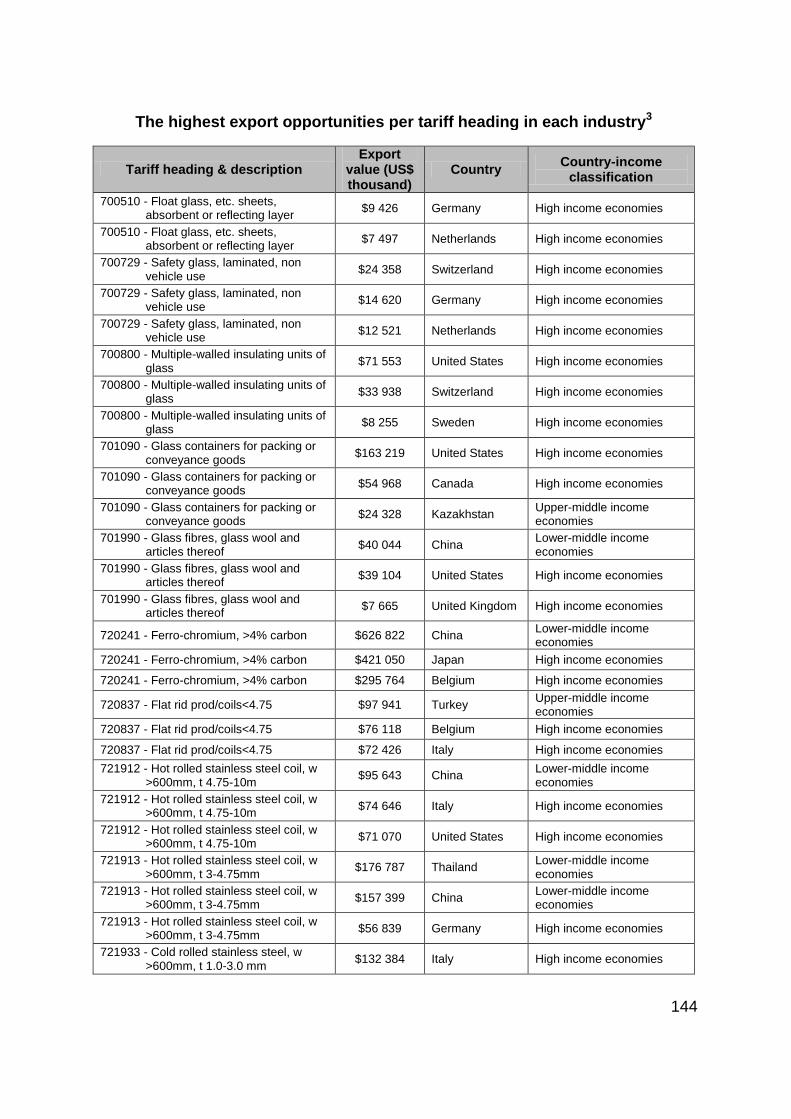
144
The highest export opportunities per tariff heading in each industry3
Tariff heading & description
Export value (US$ thousand)
Country Country-income
classification
700510 - Float glass, etc. sheets, absorbent or reflecting layer
$9 426 Germany High income economies
700510 - Float glass, etc. sheets, absorbent or reflecting layer
$7 497 Netherlands High income economies
700729 - Safety glass, laminated, non vehicle use
$24 358 Switzerland High income economies
700729 - Safety glass, laminated, non vehicle use
$14 620 Germany High income economies
700729 - Safety glass, laminated, non vehicle use
$12 521 Netherlands High income economies
700800 - Multiple-walled insulating units of glass
$71 553 United States High income economies
700800 - Multiple-walled insulating units of glass
$33 938 Switzerland High income economies
700800 - Multiple-walled insulating units of glass
$8 255 Sweden High income economies
701090 - Glass containers for packing or conveyance goods
$163 219 United States High income economies
701090 - Glass containers for packing or conveyance goods
$54 968 Canada High income economies
701090 - Glass containers for packing or conveyance goods
$24 328 Kazakhstan Upper-middle income economies
701990 - Glass fibres, glass wool and articles thereof
$40 044 China Lower-middle income economies
701990 - Glass fibres, glass wool and articles thereof
$39 104 United States High income economies
701990 - Glass fibres, glass wool and articles thereof
$7 665 United Kingdom High income economies
720241 - Ferro-chromium, >4% carbon $626 822 China Lower-middle income economies
720241 - Ferro-chromium, >4% carbon $421 050 Japan High income economies
720241 - Ferro-chromium, >4% carbon $295 764 Belgium High income economies
720837 - Flat rid prod/coils<4.75 $97 941 Turkey Upper-middle income economies
720837 - Flat rid prod/coils<4.75 $76 118 Belgium High income economies
720837 - Flat rid prod/coils<4.75 $72 426 Italy High income economies
721912 - Hot rolled stainless steel coil, w >600mm, t 4.75-10m
$95 643 China Lower-middle income economies
721912 - Hot rolled stainless steel coil, w >600mm, t 4.75-10m
$74 646 Italy High income economies
721912 - Hot rolled stainless steel coil, w >600mm, t 4.75-10m
$71 070 United States High income economies
721913 - Hot rolled stainless steel coil, w >600mm, t 3-4.75mm
$176 787 Thailand Lower-middle income economies
721913 - Hot rolled stainless steel coil, w >600mm, t 3-4.75mm
$157 399 China Lower-middle income economies
721913 - Hot rolled stainless steel coil, w >600mm, t 3-4.75mm
$56 839 Germany High income economies
721933 - Cold rolled stainless steel, w >600mm, t 1.0-3.0 mm
$132 384 Italy High income economies
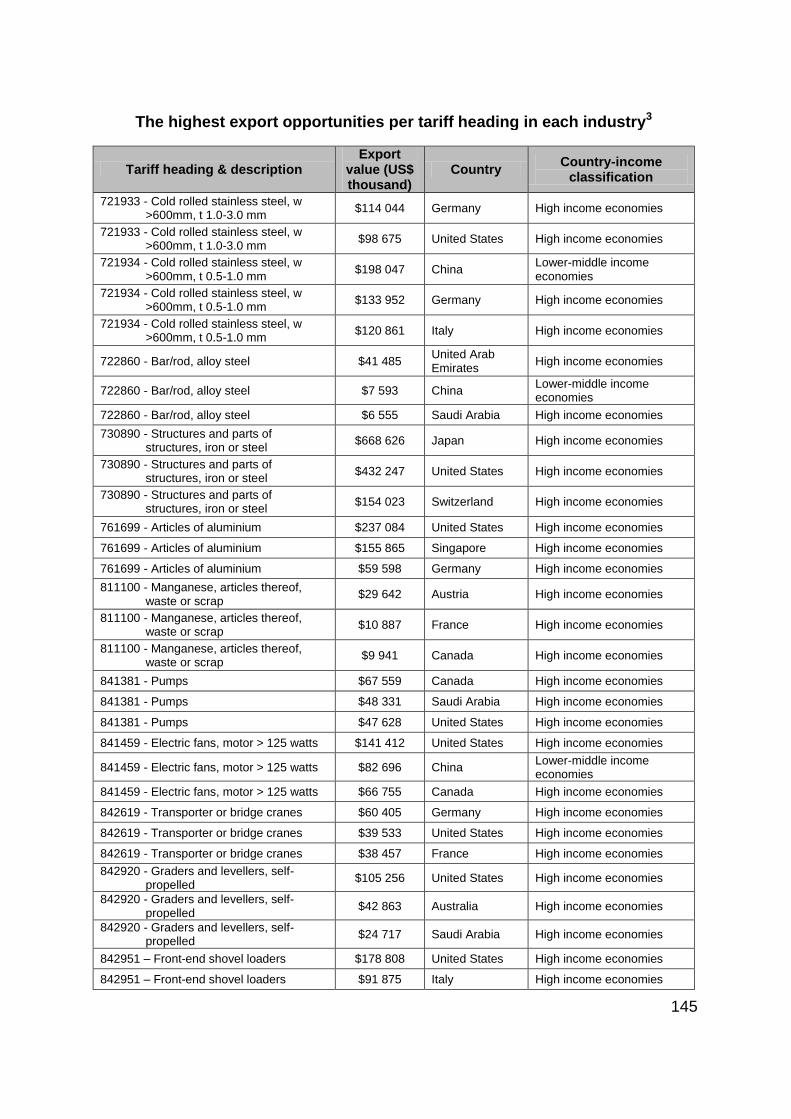
145
The highest export opportunities per tariff heading in each industry3
Tariff heading & description
Export value (US$ thousand)
Country Country-income
classification
721933 - Cold rolled stainless steel, w >600mm, t 1.0-3.0 mm
$114 044 Germany High income economies
721933 - Cold rolled stainless steel, w >600mm, t 1.0-3.0 mm
$98 675 United States High income economies
721934 - Cold rolled stainless steel, w >600mm, t 0.5-1.0 mm
$198 047 China Lower-middle income economies
721934 - Cold rolled stainless steel, w >600mm, t 0.5-1.0 mm
$133 952 Germany High income economies
721934 - Cold rolled stainless steel, w >600mm, t 0.5-1.0 mm
$120 861 Italy High income economies
722860 - Bar/rod, alloy steel $41 485 United Arab Emirates
High income economies
722860 - Bar/rod, alloy steel $7 593 China Lower-middle income economies
722860 - Bar/rod, alloy steel $6 555 Saudi Arabia High income economies
730890 - Structures and parts of structures, iron or steel
$668 626 Japan High income economies
730890 - Structures and parts of structures, iron or steel
$432 247 United States High income economies
730890 - Structures and parts of structures, iron or steel
$154 023 Switzerland High income economies
761699 - Articles of aluminium $237 084 United States High income economies
761699 - Articles of aluminium $155 865 Singapore High income economies
761699 - Articles of aluminium $59 598 Germany High income economies
811100 - Manganese, articles thereof, waste or scrap
$29 642 Austria High income economies
811100 - Manganese, articles thereof, waste or scrap
$10 887 France High income economies
811100 - Manganese, articles thereof, waste or scrap
$9 941 Canada High income economies
841381 - Pumps $67 559 Canada High income economies
841381 - Pumps $48 331 Saudi Arabia High income economies
841381 - Pumps $47 628 United States High income economies
841459 - Electric fans, motor > 125 watts $141 412 United States High income economies
841459 - Electric fans, motor > 125 watts $82 696 China Lower-middle income economies
841459 - Electric fans, motor > 125 watts $66 755 Canada High income economies
842619 - Transporter or bridge cranes $60 405 Germany High income economies
842619 - Transporter or bridge cranes $39 533 United States High income economies
842619 - Transporter or bridge cranes $38 457 France High income economies
842920 - Graders and levellers, self-propelled
$105 256 United States High income economies
842920 - Graders and levellers, self-propelled
$42 863 Australia High income economies
842920 - Graders and levellers, self-propelled
$24 717 Saudi Arabia High income economies
842951 – Front-end shovel loaders $178 808 United States High income economies
842951 – Front-end shovel loaders $91 875 Italy High income economies
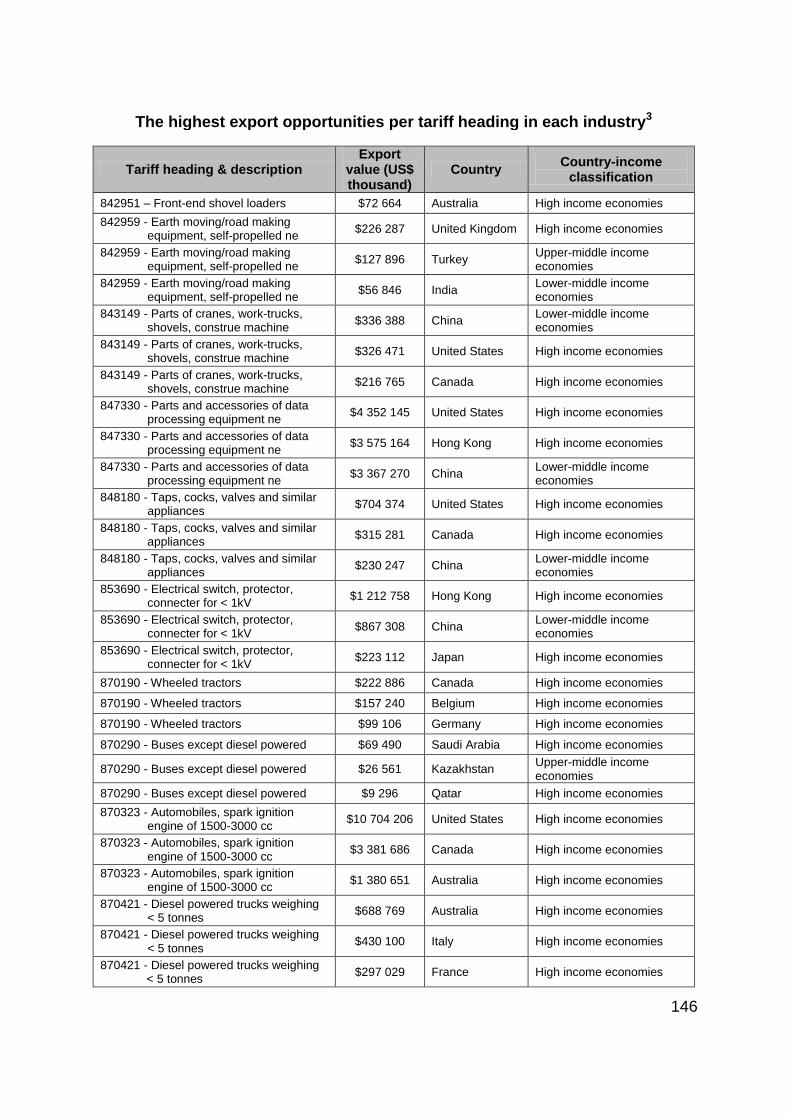
146
The highest export opportunities per tariff heading in each industry3
Tariff heading & description
Export value (US$ thousand)
Country Country-income
classification
842951 – Front-end shovel loaders $72 664 Australia High income economies
842959 - Earth moving/road making equipment, self-propelled ne
$226 287 United Kingdom High income economies
842959 - Earth moving/road making equipment, self-propelled ne
$127 896 Turkey Upper-middle income economies
842959 - Earth moving/road making equipment, self-propelled ne
$56 846 India Lower-middle income economies
843149 - Parts of cranes, work-trucks, shovels, construe machine
$336 388 China Lower-middle income economies
843149 - Parts of cranes, work-trucks, shovels, construe machine
$326 471 United States High income economies
843149 - Parts of cranes, work-trucks, shovels, construe machine
$216 765 Canada High income economies
847330 - Parts and accessories of data processing equipment ne
$4 352 145 United States High income economies
847330 - Parts and accessories of data processing equipment ne
$3 575 164 Hong Kong High income economies
847330 - Parts and accessories of data processing equipment ne
$3 367 270 China Lower-middle income economies
848180 - Taps, cocks, valves and similar appliances
$704 374 United States High income economies
848180 - Taps, cocks, valves and similar appliances
$315 281 Canada High income economies
848180 - Taps, cocks, valves and similar appliances
$230 247 China Lower-middle income economies
853690 - Electrical switch, protector, connecter for < 1kV
$1 212 758 Hong Kong High income economies
853690 - Electrical switch, protector, connecter for < 1kV
$867 308 China Lower-middle income economies
853690 - Electrical switch, protector, connecter for < 1kV
$223 112 Japan High income economies
870190 - Wheeled tractors $222 886 Canada High income economies
870190 - Wheeled tractors $157 240 Belgium High income economies
870190 - Wheeled tractors $99 106 Germany High income economies
870290 - Buses except diesel powered $69 490 Saudi Arabia High income economies
870290 - Buses except diesel powered $26 561 Kazakhstan Upper-middle income economies
870290 - Buses except diesel powered $9 296 Qatar High income economies
870323 - Automobiles, spark ignition engine of 1500-3000 cc
$10 704 206 United States High income economies
870323 - Automobiles, spark ignition engine of 1500-3000 cc
$3 381 686 Canada High income economies
870323 - Automobiles, spark ignition engine of 1500-3000 cc
$1 380 651 Australia High income economies
870421 - Diesel powered trucks weighing < 5 tonnes
$688 769 Australia High income economies
870421 - Diesel powered trucks weighing < 5 tonnes
$430 100 Italy High income economies
870421 - Diesel powered trucks weighing < 5 tonnes
$297 029 France High income economies
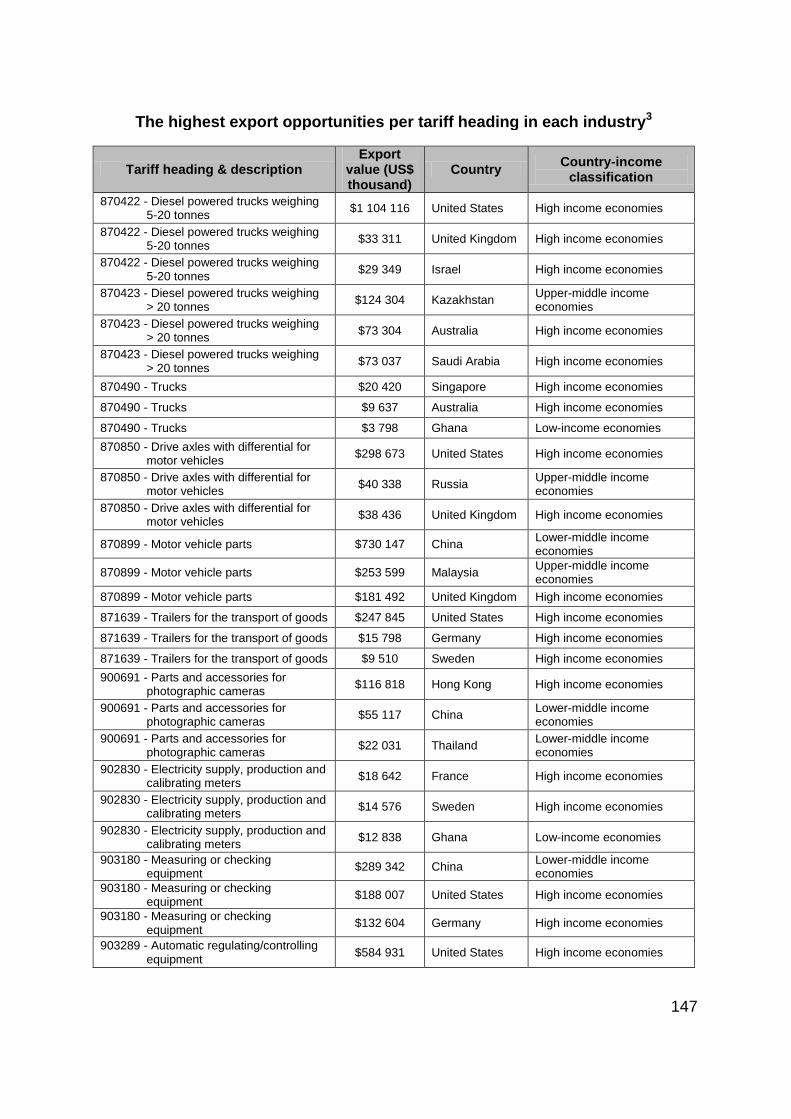
147
The highest export opportunities per tariff heading in each industry3
Tariff heading & description
Export value (US$ thousand)
Country Country-income
classification
870422 - Diesel powered trucks weighing 5-20 tonnes
$1 104 116 United States High income economies
870422 - Diesel powered trucks weighing 5-20 tonnes
$33 311 United Kingdom High income economies
870422 - Diesel powered trucks weighing 5-20 tonnes
$29 349 Israel High income economies
870423 - Diesel powered trucks weighing > 20 tonnes
$124 304 Kazakhstan Upper-middle income economies
870423 - Diesel powered trucks weighing > 20 tonnes
$73 304 Australia High income economies
870423 - Diesel powered trucks weighing > 20 tonnes
$73 037 Saudi Arabia High income economies
870490 - Trucks $20 420 Singapore High income economies
870490 - Trucks $9 637 Australia High income economies
870490 - Trucks $3 798 Ghana Low-income economies
870850 - Drive axles with differential for motor vehicles
$298 673 United States High income economies
870850 - Drive axles with differential for motor vehicles
$40 338 Russia Upper-middle income economies
870850 - Drive axles with differential for motor vehicles
$38 436 United Kingdom High income economies
870899 - Motor vehicle parts $730 147 China Lower-middle income economies
870899 - Motor vehicle parts $253 599 Malaysia Upper-middle income economies
870899 - Motor vehicle parts $181 492 United Kingdom High income economies
871639 - Trailers for the transport of goods $247 845 United States High income economies
871639 - Trailers for the transport of goods $15 798 Germany High income economies
871639 - Trailers for the transport of goods $9 510 Sweden High income economies
900691 - Parts and accessories for photographic cameras
$116 818 Hong Kong High income economies
900691 - Parts and accessories for photographic cameras
$55 117 China Lower-middle income economies
900691 - Parts and accessories for photographic cameras
$22 031 Thailand Lower-middle income economies
902830 - Electricity supply, production and calibrating meters
$18 642 France High income economies
902830 - Electricity supply, production and calibrating meters
$14 576 Sweden High income economies
902830 - Electricity supply, production and calibrating meters
$12 838 Ghana Low-income economies
903180 - Measuring or checking equipment
$289 342 China Lower-middle income economies
903180 - Measuring or checking equipment
$188 007 United States High income economies
903180 - Measuring or checking equipment
$132 604 Germany High income economies
903289 - Automatic regulating/controlling equipment
$584 931 United States High income economies
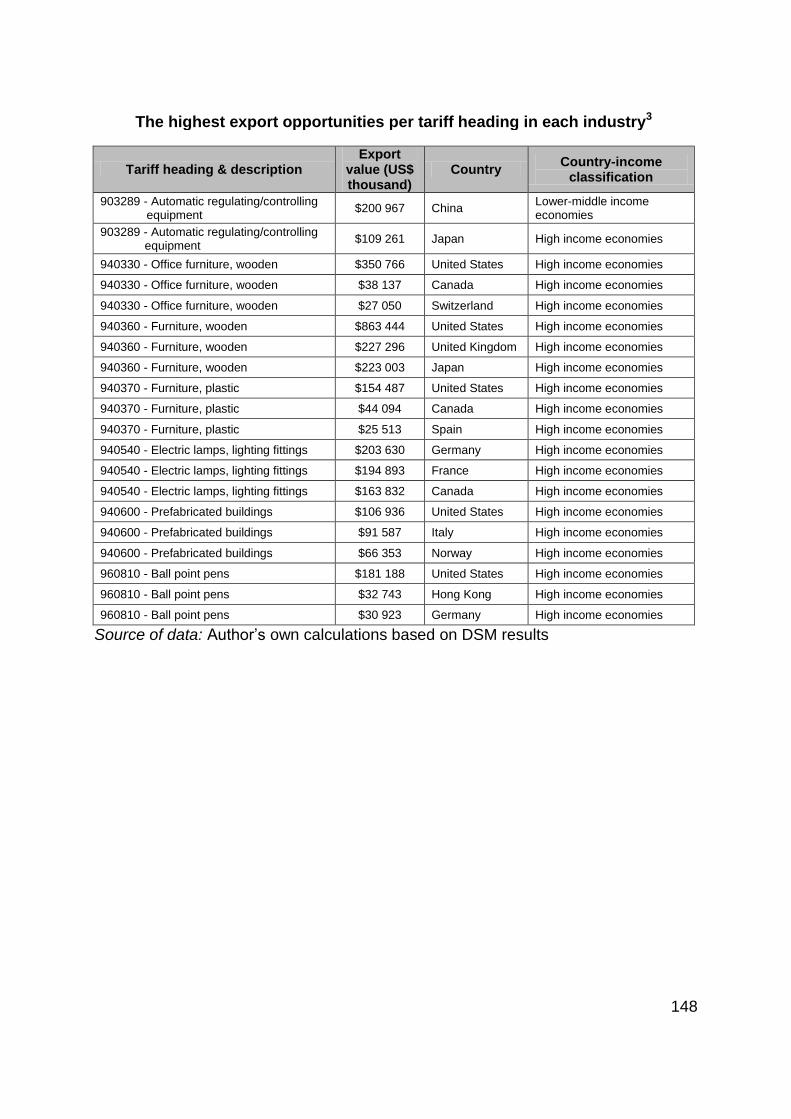
148
The highest export opportunities per tariff heading in each industry3
Tariff heading & description
Export value (US$ thousand)
Country Country-income
classification
903289 - Automatic regulating/controlling equipment
$200 967 China Lower-middle income economies
903289 - Automatic regulating/controlling equipment
$109 261 Japan High income economies
940330 - Office furniture, wooden $350 766 United States High income economies
940330 - Office furniture, wooden $38 137 Canada High income economies
940330 - Office furniture, wooden $27 050 Switzerland High income economies
940360 - Furniture, wooden $863 444 United States High income economies
940360 - Furniture, wooden $227 296 United Kingdom High income economies
940360 - Furniture, wooden $223 003 Japan High income economies
940370 - Furniture, plastic $154 487 United States High income economies
940370 - Furniture, plastic $44 094 Canada High income economies
940370 - Furniture, plastic $25 513 Spain High income economies
940540 - Electric lamps, lighting fittings $203 630 Germany High income economies
940540 - Electric lamps, lighting fittings $194 893 France High income economies
940540 - Electric lamps, lighting fittings $163 832 Canada High income economies
940600 - Prefabricated buildings $106 936 United States High income economies
940600 - Prefabricated buildings $91 587 Italy High income economies
940600 - Prefabricated buildings $66 353 Norway High income economies
960810 - Ball point pens $181 188 United States High income economies
960810 - Ball point pens $32 743 Hong Kong High income economies
960810 - Ball point pens $30 923 Germany High income economies
Source of data: Author’s own calculations based on DSM results