The Design and Sustainability of Renewable Energy Incentives
26
17 The Design and Sustainability of Renewable Energy Incentives • http://dx.doi.org/10.1596/978-1-4648-0314-7 The Economic Rationale for Renewable Energy Analytical Framework The economic rationale for renewable energy (RE) is straightforward: the optimum amount of RE for grid-connected generation is given by the intersection of the RE supply curve with the avoided cost of thermal electricity generation (figure 2.1). Very little RE will be competitive with the avoided thermal cost if that cost is based on financial prices: in almost all Asian countries that have their own fossil-fuel resources, subsidized prices to power utilities are widespread. Only where the marginal thermal resource is imported (unsubsidized) oil is RE competitive (as was the case in Sri Lanka in the early 2000s); where the thermal generation price is based on coal, little if any RE is competitive. If thermal energy is correctly valued at the border price P ECON (which equals = P FIN + a, the subsidy), then the optimal quantity of RE increases, as depicted in figure 2.2. These principles constitute the basis for the original avoided cost tariffs (ACTs) for RE in Sri Lanka, Indonesia, and Vietnam. In Sri Lanka, which has no domestic fossil resources, the marginal thermal production cost was set by imported diesel fuel, so the acceptance of an RE tariff set at this avoided cost was easily achieved in 1998. In Vietnam this was more difficult, since at the time of its introduction in 2009, the avoided financial cost of thermal generation to the state-owned utility (Electricity of Vietnam, EVN) was based on extensive subsi- dies to coal and domestic gas used for power generation. But as additional gas- fired combined-cycle-gas-turbine (CCGT) plants came online, with prices linked to international prices, 1 EVN accepted a tariff based on the cost of the marginal thermal project. This is discussed further in chapter 3. But even if the cost of fossil energy is correctly valued at the border price, this needs to be further adjusted to reflect the local environmental damage costs of fossil energy—that is, the damage caused by local air pollutants (PM 10 , 2 SO X , 3 NO X 4 ), or the environmental damage costs associated with coal mining (to the CHAPTER 2
-
Upload
khangminh22 -
Category
Documents
-
view
5 -
download
0
Transcript of The Design and Sustainability of Renewable Energy Incentives
17 The Design and Sustainability of Renewable Energy Incentives • http://dx.doi.org/10.1596/978-1-4648-0314-7
The Economic Rationale for Renewable Energy
Analytical Framework
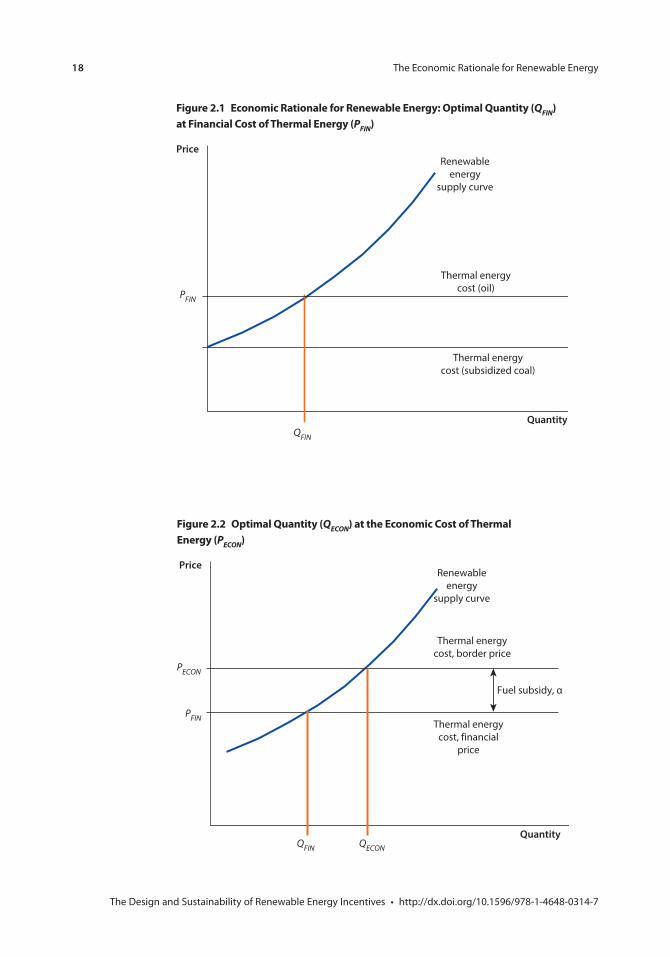
The economic rationale for renewable energy (RE) is straightforward: the optimum amount of RE for grid-connected generation is given by the intersection of the RE supply curve with the avoided cost of thermal electricity generation ( figure 2.1). Very little RE will be competitive with the avoided thermal cost if that cost is based on financial prices: in almost all Asian countries that have their own fossil-fuel resources, subsidized prices to power utilities are widespread. Only where the marginal thermal resource is imported (unsubsidized) oil is RE competitive (as was the case in Sri Lanka in the early 2000s); where the thermal generation price is based on coal, little if any RE is competitive.
If thermal energy is correctly valued at the border price PECON (which equals = PFIN + a, the subsidy), then the optimal quantity of RE increases, as depicted in figure 2.2.
These principles constitute the basis for the original avoided cost tariffs (ACTs) for RE in Sri Lanka, Indonesia, and Vietnam. In Sri Lanka, which has no domestic fossil resources, the marginal thermal production cost was set by imported diesel fuel, so the acceptance of an RE tariff set at this avoided cost was easily achieved in 1998. In Vietnam this was more difficult, since at the time of its introduction in 2009, the avoided financial cost of thermal generation to the state-owned utility (Electricity of Vietnam, EVN) was based on extensive subsi-dies to coal and domestic gas used for power generation. But as additional gas-fired combined-cycle-gas-turbine (CCGT) plants came online, with prices linked to international prices,1 EVN accepted a tariff based on the cost of the marginal thermal project. This is discussed further in chapter 3.
But even if the cost of fossil energy is correctly valued at the border price, this needs to be further adjusted to reflect the local environmental damage costs of fossil energy—that is, the damage caused by local air pollutants (PM10,
2 SOX,3 NOX
4), or the environmental damage costs associated with coal mining (to the
C h A p t e r 2
18 The Economic Rationale for Renewable Energy
The Design and Sustainability of Renewable Energy Incentives • http://dx.doi.org/10.1596/978-1-4648-0314-7
Figure 2.1 economic rationale for renewable energy: Optimal Quantity (QFIN) at Financial Cost of thermal energy (PFIN)
PFIN
Renewableenergy
supply curve
Price
QuantityQFIN
Thermal energycost (oil)
Thermal energycost (subsidized coal)
Figure 2.2 Optimal Quantity (QECON) at the economic Cost of thermal energy (PECON)
PECON
PFIN
Renewableenergy
supply curve
QECON
Price
QuantityQFIN
Thermal energycost, financial
price
Thermal energycost, border price
Fuel subsidy, α

The Economic Rationale for Renewable Energy 19
The Design and Sustainability of Renewable Energy Incentives • http://dx.doi.org/10.1596/978-1-4648-0314-7
extent these are not already reflected in the economic cost of coal supplied to a coal-burning project).
As shown in the example of South Africa, in the case of coal these externality costs may be substantial (table 2.1). Nevertheless, there are also positive externalities to be included, which as shown in this table exceed the negative externalities—these benefits derive mainly from the avoidance of the health effects from indoor air pollution associated with kerosene lighting and diesel self- generation. However, while these net benefits are relevant for evaluation of the no project alternative, when comparing coal with RE alternatives these same benefits also accrue to RE, so it is only the comparison of the negative externali-ties that matter.
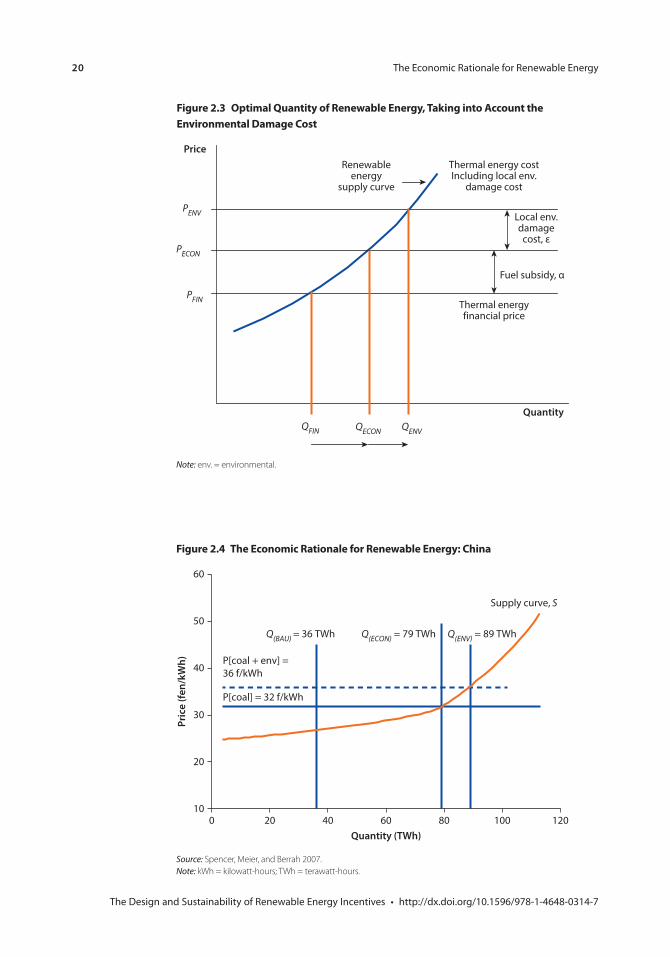
Such environmental damage costs represent real economic costs to the national economy, and their avoidance should be reflected as a benefit in the economic analysis of RE. In effect, the real social cost of thermal generation is its economic price (that is, without subsidy) plus the per kilowatt-hour (kWh) local environmental damage cost. As shown in figure 2.3, at this cost (PENV) = PECON + E, the economic quantity of RE increases further, to QENV.
Just this framework was used to underpin the case for RE in China, as is sum-marized in figure 2.4. The quantity of additional RE increases from 79 terawatt-hours (TWh) to 89 TWh when the environmental damage cost of coal, estimated at 0.4 yuan/kWh (0.48 cents/kWh), is added to the economic cost of coal-fired generation.5 Appendix C shows how such supply curves can be used in practice to illustrate and estimate incremental costs.
Local environmental Damage Costs
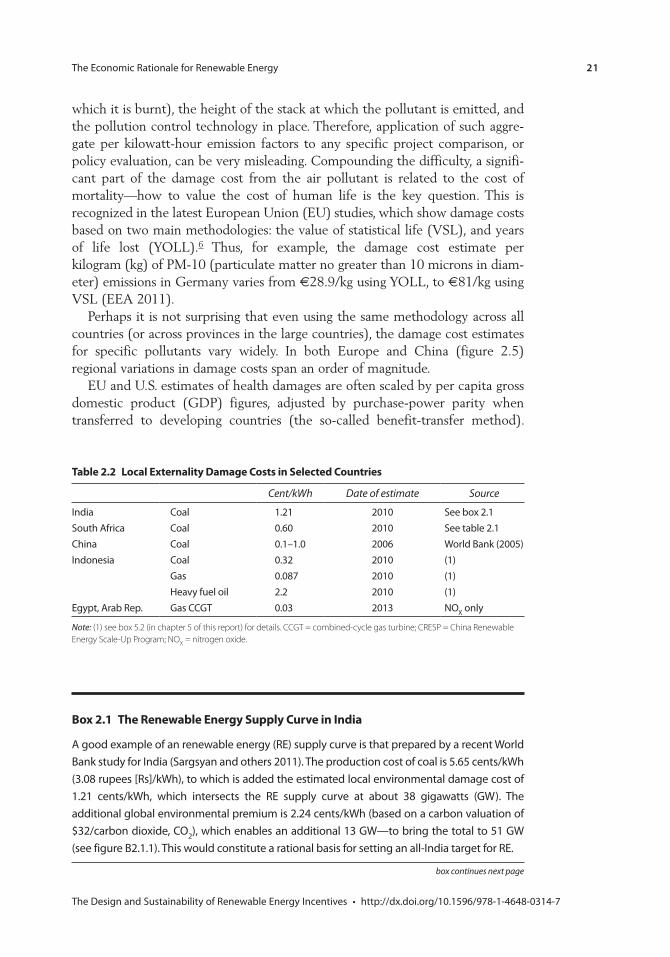
Table 2.2 summarizes estimates of the environmental damage costs of thermal projects in several developing countries.
The difficulty with such aggregate damage cost estimates is that they are not transparent with respect to a whole range of important assumptions: the popula-tion affected, per capita income, the quality of the fuel (and the efficiency with
table 2.1 externality Costs of Coal Generation
Rand cents/kWh US cents/kWh
Positive externalities 18.00 2.40
Negative externalitiesCombustion air pollution −1.35 −0.18Biodiversity loss −0.70 −0.09Acid mine drainage −2.10 −0.28Fuel production health impacts (coal mining) −0.36 −0.05Total negative externalities −4.51 −0.60Net benefit 13.49 1.80
Source: Edkins and others 2010. Note: kWh = kilowatt-hours.
20 The Economic Rationale for Renewable Energy
The Design and Sustainability of Renewable Energy Incentives • http://dx.doi.org/10.1596/978-1-4648-0314-7
Figure 2.4 the economic rationale for renewable energy: China
Source: Spencer, Meier, and Berrah 2007.Note: kWh = kilowatt-hours; TWh = terawatt-hours.
010
20
30
40
50
60
20 40 60 80 100 120Quantity (TWh)
Pric
e (f
en/k
Wh)
Q(ECON) = 79 TWh Q(ENV) = 89 TWh
P[coal] = 32 f/kWh
Supply curve, S
Q(BAU) = 36 TWh
P[coal + env] = 36 f/kWh
Figure 2.3 Optimal Quantity of renewable energy, taking into Account the environmental Damage Cost
PECON
PFIN
Renewableenergy
supply curve
QECON
Price
QuantityQFIN
Thermal energyfinancial price
Thermal energy costIncluding local env.
damage cost
Fuel subsidy, α
QENV
PENV Local env.damagecost, ε
Note: env. = environmental.
The Economic Rationale for Renewable Energy 21
The Design and Sustainability of Renewable Energy Incentives • http://dx.doi.org/10.1596/978-1-4648-0314-7
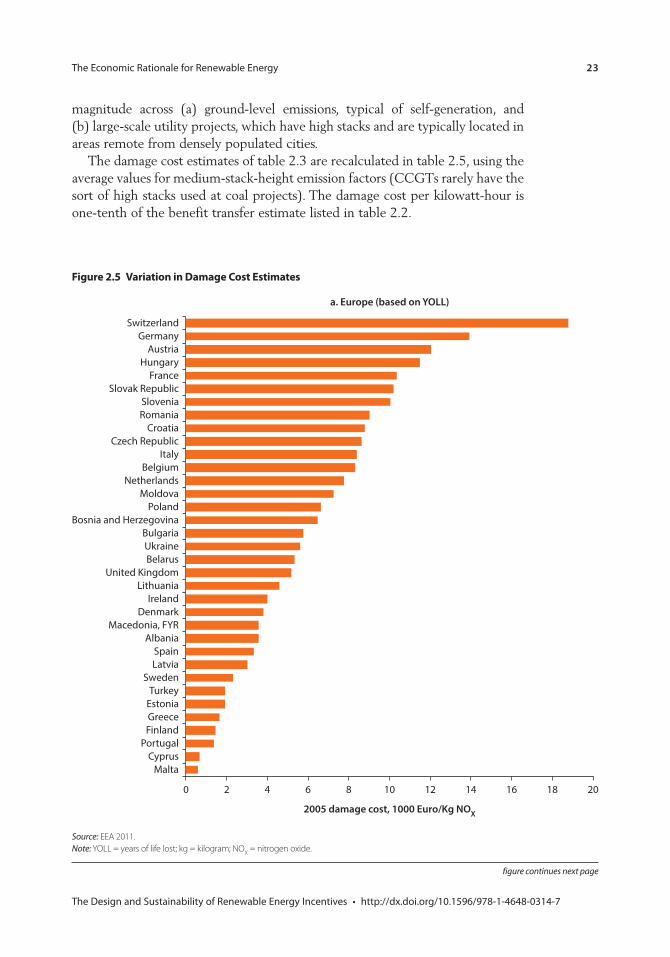
which it is burnt), the height of the stack at which the pollutant is emitted, and the pollution control technology in place. Therefore, application of such aggre-gate per kilowatt-hour emission factors to any specific project comparison, or policy evaluation, can be very misleading. Compounding the difficulty, a signifi-cant part of the damage cost from the air pollutant is related to the cost of mortality—how to value the cost of human life is the key question. This is recognized in the latest European Union (EU) studies, which show damage costs based on two main methodologies: the value of statistical life (VSL), and years of life lost (YOLL).6 Thus, for example, the damage cost estimate per kilogram (kg) of PM-10 (particulate matter no greater than 10 microns in diam-eter) emissions in Germany varies from €28.9/kg using YOLL, to €81/kg using VSL (EEA 2011).
Perhaps it is not surprising that even using the same methodology across all countries (or across provinces in the large countries), the damage cost estimates for specific pollutants vary widely. In both Europe and China (figure 2.5) regional variations in damage costs span an order of magnitude.
EU and U.S. estimates of health damages are often scaled by per capita gross domestic product (GDP) figures, adjusted by purchase-power parity when transferred to developing countries (the so-called benefit-transfer method).
table 2.2 Local externality Damage Costs in Selected Countries
Cent/kWh Date of estimate Source
India Coal 1.21 2010 See box 2.1South Africa Coal 0.60 2010 See table 2.1China Coal 0.1–1.0 2006 World Bank (2005)Indonesia Coal 0.32 2010 (1)
Gas 0.087 2010 (1)Heavy fuel oil 2.2 2010 (1)
Egypt, Arab Rep. Gas CCGT 0.03 2013 NOX only
Note: (1) see box 5.2 (in chapter 5 of this report) for details. CCGT = combined-cycle gas turbine; CRESP = China Renewable Energy Scale-Up Program; NOX = nitrogen oxide.
Box 2.1 the renewable energy Supply Curve in India
A good example of an renewable energy (RE) supply curve is that prepared by a recent World Bank study for India (Sargsyan and others 2011). The production cost of coal is 5.65 cents/kWh (3.08 rupees [Rs]/kWh), to which is added the estimated local environmental damage cost of 1.21 cents/kWh, which intersects the RE supply curve at about 38 gigawatts (GW). The additional global environmental premium is 2.24 cents/kWh (based on a carbon valuation of $32/carbon dioxide, CO2), which enables an additional 13 GW—to bring the total to 51 GW (see figure B2.1.1). This would constitute a rational basis for setting an all-India target for RE.
box continues next page

22 The Economic Rationale for Renewable Energy
The Design and Sustainability of Renewable Energy Incentives • http://dx.doi.org/10.1596/978-1-4648-0314-7
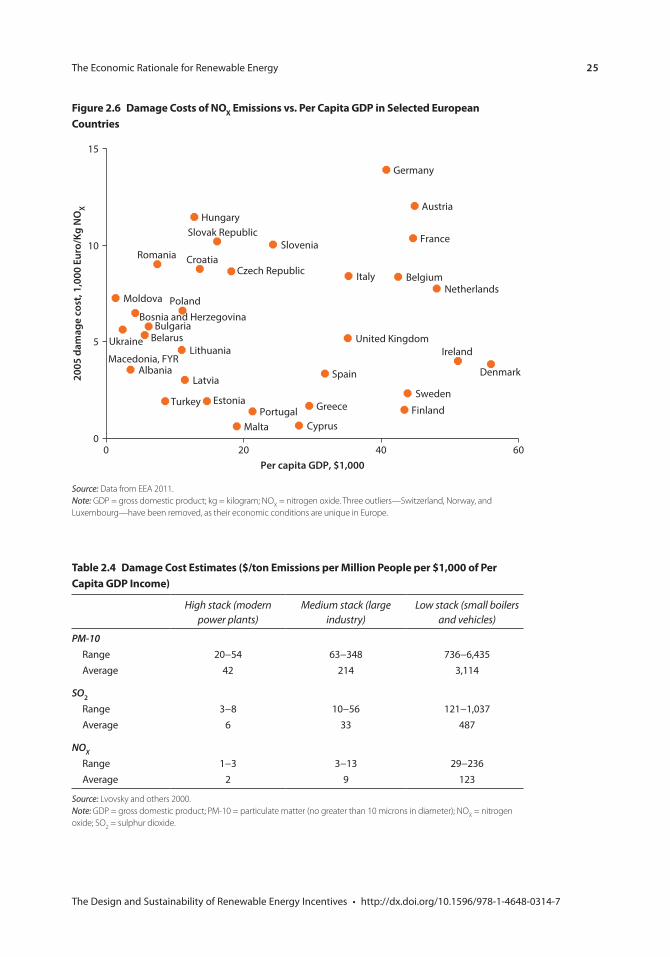
Table 2.3 shows such an exercise for NOX emissions in the Arab Republic of Egypt, estimated at about 0.1 cent/kWh using the U.K. damage costs. Had the calculation been based on German damage costs, the estimate would be three times higher.7
The rationale for such adjustment is therefore doubtful. Figure 2.6 shows the relationship between damage cost estimates for NOX (as a/kg) versus per capita GDP for European countries. There is little evidence of correlation. The practice of scaling by per capita GDP would certainly not work within Europe, so there is little reason to suppose it would work across developing countries.
These problems were recognized in a 2000 World Bank study that estimated health damage costs from air pollution across six major cities in developing countries. As shown in table 2.4, damage cost estimates varied by two orders of
In the case studies presented in this report, some of the issues associated with such supply curves will be discussed in more detail. For example, India in particular suffers from low (and declining) average load factors in its wind projects, so gigawatt-hours rather than megawatts is the preferred unit of comparison. And different RE technologies also have very different capacity values, which require some adjustment to the RE cost if expressed simply as Rs($)/kWh. But whatever the difficulties, such an analysis is always a better basis for setting an RE target than mere political statement of aspirational goals.
Source: Sargsyan and others 2011.
Box 2.1 the renewable energy Supply Curve in India (continued)
Note: SHP = small hydro project; TN = Tamil Nadu; MP = Madhya Pradesh; AP = Andhra Pradesh. $1 = Rs. 54.5.
0
1
2
3
4
5
6
0.11 37.8Cumulative capacity (in GW)
Econ
omic
cos
t of g
ener
atio
n, R
s/kW
h
51.0 67.9
With global environmentalpremium 4.96 Rs/kWh
With local environmentalpremium 3.74 Rs/kWh
Coal avoided cost 3.08 Rs/kWh
SHPAll
states
WindTN and
Karnataka
Biomass A
P and MP
Wind Kerala and M
aharashtra
Biomass Various states*
Wind Rajesthan and W
est Bengal andH
aryana Biomass
WindAP
WindGujarat
andMP
Figure B2.1.1 renewable energy Supply Curve in India, by States and energy Source
The Economic Rationale for Renewable Energy 23
The Design and Sustainability of Renewable Energy Incentives • http://dx.doi.org/10.1596/978-1-4648-0314-7
Figure 2.5 Variation in Damage Cost estimates
Source: EEA 2011.Note: YOLL = years of life lost; kg = kilogram; NOX = nitrogen oxide.
0 2 4 6 8 10 12 14 16 18 20
MaltaCyprus
PortugalFinlandGreeceEstoniaTurkey
SwedenLatviaSpain
Albania
DenmarkMacedonia, FYR
IrelandLithuania
United KingdomBelarusUkraineBulgaria
Bosnia and HerzegovinaPoland
MoldovaNetherlands
BelgiumItaly
Czech RepublicCroatia
RomaniaSlovenia
Slovak RepublicFrance
HungaryAustria
GermanySwitzerland
2005 damage cost, 1000 Euro/Kg NOX
a. Europe (based on YOLL)
figure continues next page
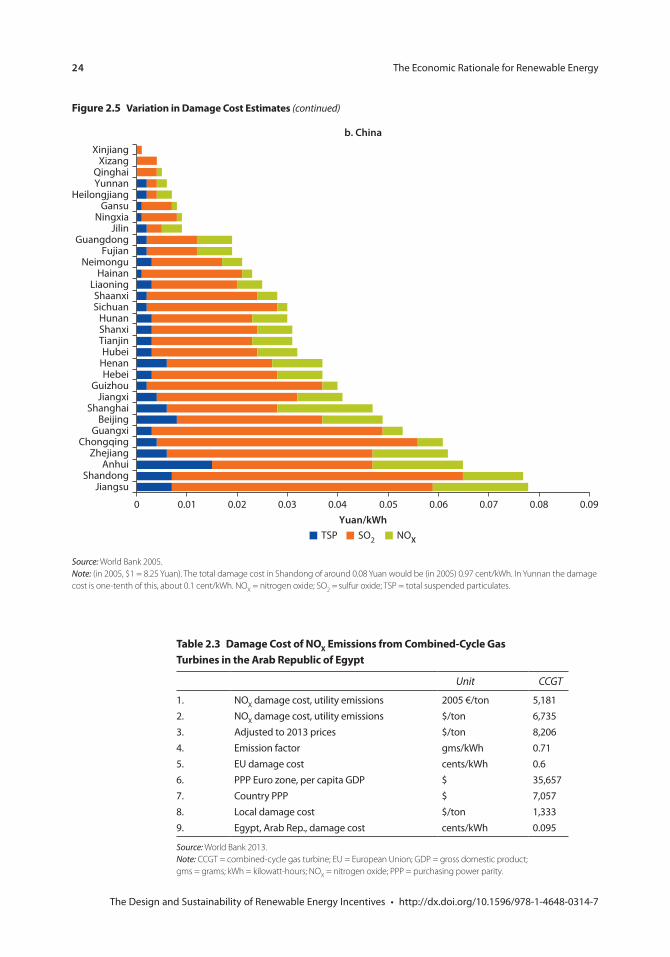
magnitude across (a) ground-level emissions, typical of self-generation, and (b) large-scale utility projects, which have high stacks and are typically located in areas remote from densely populated cities.
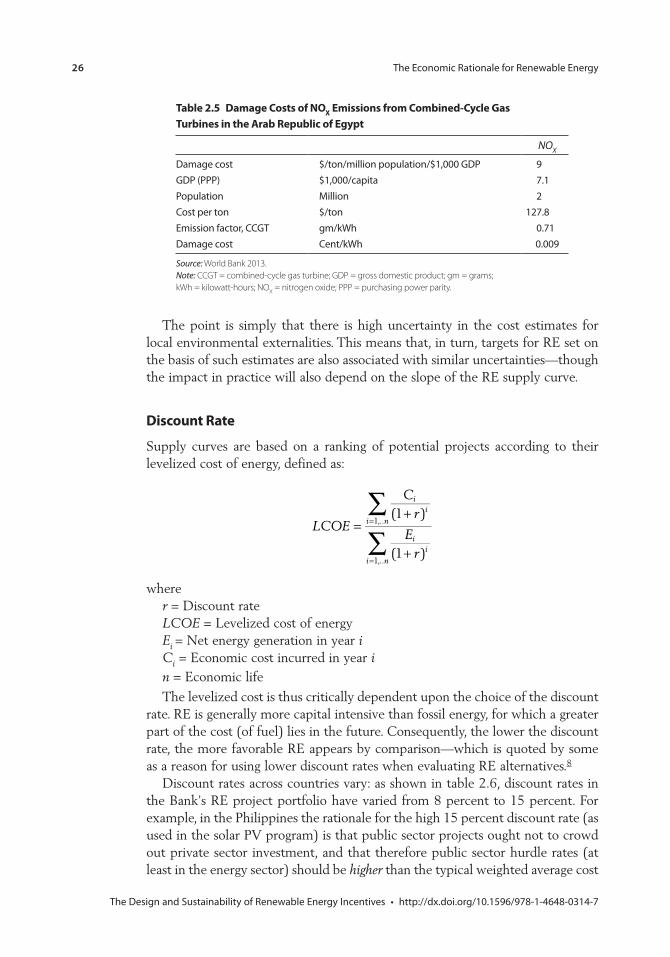
The damage cost estimates of table 2.3 are recalculated in table 2.5, using the average values for medium-stack-height emission factors (CCGTs rarely have the sort of high stacks used at coal projects). The damage cost per kilowatt-hour is one-tenth of the benefit transfer estimate listed in table 2.2.
24 The Economic Rationale for Renewable Energy
The Design and Sustainability of Renewable Energy Incentives • http://dx.doi.org/10.1596/978-1-4648-0314-7
Source: World Bank 2005.Note: (in 2005, $1 = 8.25 Yuan). The total damage cost in Shandong of around 0.08 Yuan would be (in 2005) 0.97 cent/kWh. In Yunnan the damage cost is one-tenth of this, about 0.1 cent/kWh. NOX = nitrogen oxide; SO2 = sulfur oxide; TSP = total suspended particulates.
0 0.01 0.02 0.03 0.04 0.05 0.06 0.07 0.08 0.09
JiangsuShandong
AnhuiZhejiang
ChongqingGuangxi
BeijingShanghai
JiangxiGuizhou
HebeiHenanHubei
TianjinShanxiHunan
SichuanShaanxi
LiaoningHainan
NeimonguFujian
GuangdongJilin
NingxiaGansu
HeilongjiangYunnanQinghai
XizangXinjiang
Yuan/kWhTSP SO2 NOX
b. China
Figure 2.5 Variation in Damage Cost estimates (continued)
table 2.3 Damage Cost of NOX emissions from Combined-Cycle Gas turbines in the Arab republic of egypt
Unit CCGT
1. NOX damage cost, utility emissions 2005 €/ton 5,1812. NOX damage cost, utility emissions $/ton 6,7353. Adjusted to 2013 prices $/ton 8,2064. Emission factor gms/kWh 0.715. EU damage cost cents/kWh 0.66. PPP Euro zone, per capita GDP $ 35,6577. Country PPP $ 7,0578. Local damage cost $/ton 1,3339. Egypt, Arab Rep., damage cost cents/kWh 0.095
Source: World Bank 2013.Note: CCGT = combined-cycle gas turbine; EU = European Union; GDP = gross domestic product; gms = grams; kWh = kilowatt-hours; NOX = nitrogen oxide; PPP = purchasing power parity.
The Economic Rationale for Renewable Energy 25
The Design and Sustainability of Renewable Energy Incentives • http://dx.doi.org/10.1596/978-1-4648-0314-7
Figure 2.6 Damage Costs of NOX emissions vs. per Capita GDp in Selected european Countries
Source: Data from EEA 2011.Note: GDP = gross domestic product; kg = kilogram; NOX = nitrogen oxide. Three outliers—Switzerland, Norway, and Luxembourg—have been removed, as their economic conditions are unique in Europe.
0 20 40 600
5
10
15
Germany
AustriaHungary
FranceSlovak RepublicSlovenia
Romania CroatiaCzech Republic Italy Belgium
NetherlandsMoldova Poland
Bosnia and HerzegovinaBulgaria
Ukraine Belarus United KingdomLithuania Ireland
DenmarkAlbaniaMacedonia, FYR
SpainLatviaSweden
Turkey Estonia Greece FinlandPortugalCyprusMalta
Per capita GDP, $1,000
2005
dam
age
cost
, 1,0
00 E
uro/
Kg N
OX
table 2.4 Damage Cost estimates ($/ton emissions per Million people per $1,000 of per Capita GDp Income)
High stack (modern power plants)
Medium stack (large industry)
Low stack (small boilers and vehicles)
PM-10 Range 20−54 63−348 736−6,435 Average 42 214 3,114
SO2
Range 3−8 10−56 121−1,037 Average 6 33 487
NOX
Range 1−3 3−13 29−236 Average 2 9 123
Source: Lvovsky and others 2000.Note: GDP = gross domestic product; PM-10 = particulate matter (no greater than 10 microns in diameter); NOX = nitrogen oxide; SO2 = sulphur dioxide.
26 The Economic Rationale for Renewable Energy
The Design and Sustainability of Renewable Energy Incentives • http://dx.doi.org/10.1596/978-1-4648-0314-7
The point is simply that there is high uncertainty in the cost estimates for local environmental externalities. This means that, in turn, targets for RE set on the basis of such estimates are also associated with similar uncertainties—though the impact in practice will also depend on the slope of the RE supply curve.
Discount rate
Supply curves are based on a ranking of potential projects according to their levelized cost of energy, defined as:
LCOE
Cr
Er
ii
i n
ii
i n
(1 )
(1 )
1,..
1,..
∑∑
=+
+
=
=
wherer = Discount rateLCOE = Levelized cost of energyEi = Net energy generation in year iCi = Economic cost incurred in year in = Economic life
The levelized cost is thus critically dependent upon the choice of the discount rate. RE is generally more capital intensive than fossil energy, for which a greater part of the cost (of fuel) lies in the future. Consequently, the lower the discount rate, the more favorable RE appears by comparison—which is quoted by some as a reason for using lower discount rates when evaluating RE alternatives.8
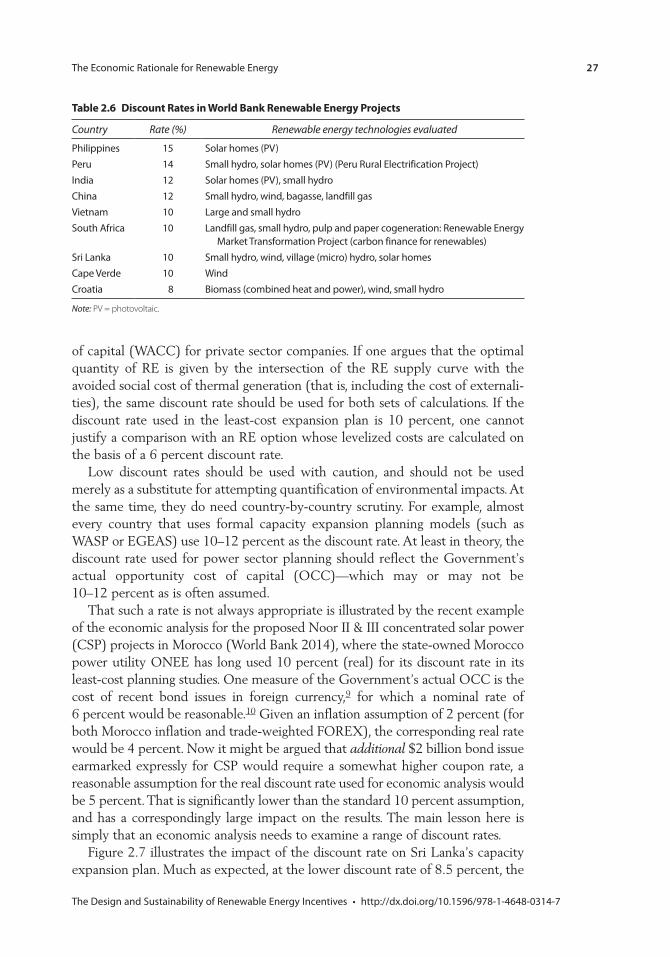
Discount rates across countries vary: as shown in table 2.6, discount rates in the Bank’s RE project portfolio have varied from 8 percent to 15 percent. For example, in the Philippines the rationale for the high 15 percent discount rate (as used in the solar PV program) is that public sector projects ought not to crowd out private sector investment, and that therefore public sector hurdle rates (at least in the energy sector) should be higher than the typical weighted average cost
table 2.5 Damage Costs of NOX emissions from Combined-Cycle Gas turbines in the Arab republic of egypt
NOX
Damage cost $/ton/million population/$1,000 GDP 9GDP (PPP) $1,000/capita 7.1Population Million 2Cost per ton $/ton 127.8Emission factor, CCGT gm/kWh 0.71Damage cost Cent/kWh 0.009
Source: World Bank 2013.Note: CCGT = combined-cycle gas turbine; GDP = gross domestic product; gm = grams; kWh = kilowatt-hours; NOX = nitrogen oxide; PPP = purchasing power parity.
The Economic Rationale for Renewable Energy 27
The Design and Sustainability of Renewable Energy Incentives • http://dx.doi.org/10.1596/978-1-4648-0314-7
of capital (WACC) for private sector companies. If one argues that the optimal quantity of RE is given by the intersection of the RE supply curve with the avoided social cost of thermal generation (that is, including the cost of externali-ties), the same discount rate should be used for both sets of calculations. If the discount rate used in the least-cost expansion plan is 10 percent, one cannot justify a comparison with an RE option whose levelized costs are calculated on the basis of a 6 percent discount rate.
Low discount rates should be used with caution, and should not be used merely as a substitute for attempting quantification of environmental impacts. At the same time, they do need country-by-country scrutiny. For example, almost every country that uses formal capacity expansion planning models (such as WASP or EGEAS) use 10–12 percent as the discount rate. At least in theory, the discount rate used for power sector planning should reflect the Government’s actual opportunity cost of capital (OCC)—which may or may not be 10–12 percent as is often assumed.
That such a rate is not always appropriate is illustrated by the recent example of the economic analysis for the proposed Noor II & III concentrated solar power (CSP) projects in Morocco (World Bank 2014), where the state-owned Morocco power utility ONEE has long used 10 percent (real) for its discount rate in its least-cost planning studies. One measure of the Government’s actual OCC is the cost of recent bond issues in foreign currency,9 for which a nominal rate of 6 percent would be reasonable.10 Given an inflation assumption of 2 percent (for both Morocco inflation and trade-weighted FOREX), the corresponding real rate would be 4 percent. Now it might be argued that additional $2 billion bond issue earmarked expressly for CSP would require a somewhat higher coupon rate, a reasonable assumption for the real discount rate used for economic analysis would be 5 percent. That is significantly lower than the standard 10 percent assumption, and has a correspondingly large impact on the results. The main lesson here is simply that an economic analysis needs to examine a range of discount rates.
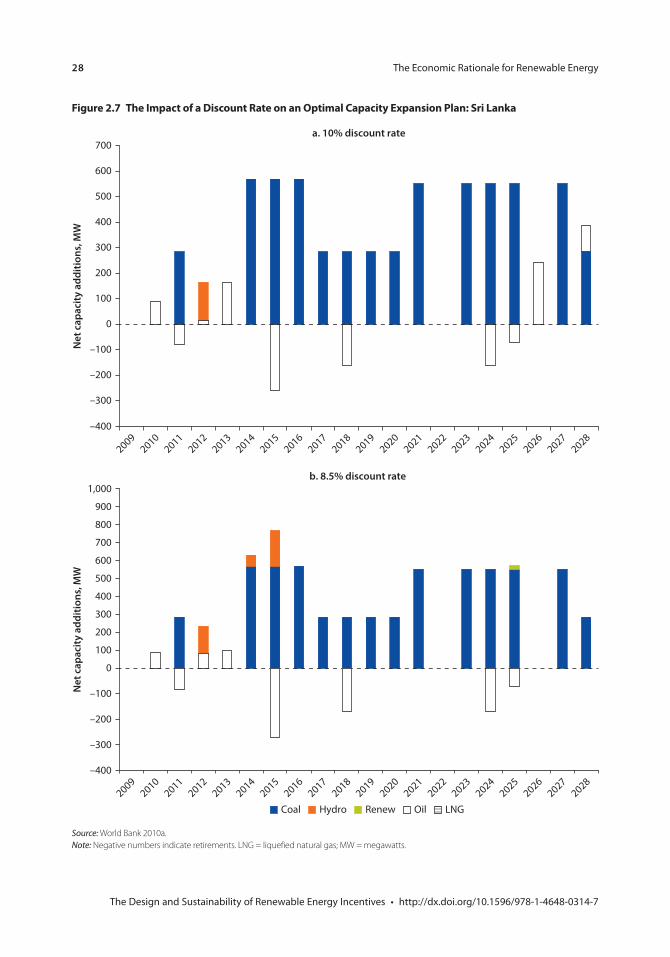
Figure 2.7 illustrates the impact of the discount rate on Sri Lanka’s capacity expansion plan. Much as expected, at the lower discount rate of 8.5 percent, the
table 2.6 Discount rates in World Bank renewable energy projects
Country Rate (%) Renewable energy technologies evaluated
Philippines 15 Solar homes (PV)Peru 14 Small hydro, solar homes (PV) (Peru Rural Electrification Project)India 12 Solar homes (PV), small hydroChina 12 Small hydro, wind, bagasse, landfill gas Vietnam 10 Large and small hydroSouth Africa 10 Landfill gas, small hydro, pulp and paper cogeneration: Renewable Energy
Market Transformation Project (carbon finance for renewables)Sri Lanka 10 Small hydro, wind, village (micro) hydro, solar homesCape Verde 10 WindCroatia 8 Biomass (combined heat and power), wind, small hydro
Note: PV = photovoltaic.
28 The Economic Rationale for Renewable Energy
The Design and Sustainability of Renewable Energy Incentives • http://dx.doi.org/10.1596/978-1-4648-0314-7
Source: World Bank 2010a.Note: Negative numbers indicate retirements. LNG = liquefied natural gas; MW = megawatts.
Figure 2.7 the Impact of a Discount rate on an Optimal Capacity expansion plan: Sri Lanka
–400
–300
–200
–100
0
100
200
300
400
500
600
700a. 10% discount rate
20092010
20112012
20132014
20152016
20172018
20192020
20212022
20232024
20252026
20272028
Net
cap
acity
add
ition
s, M
W
–400
–300
–200
–100
0
100
200
300
400
500
600
900
800
700
1,000b. 8.5% discount rate
20092010
20112012
20132014
20152016
20172018
20192020
20212022
20232024
20252026
20272028
Net
cap
acity
add
ition
s, M
W
Hydro OilCoal Renew LNG
The Economic Rationale for Renewable Energy 29
The Design and Sustainability of Renewable Energy Incentives • http://dx.doi.org/10.1596/978-1-4648-0314-7
planning model chooses to build additional medium-scale hydro projects in 2014 and 2015, reducing the need for additional combustion turbine capacity. In the later years of the planning horizon, the model builds additional coal capacity, rather than the combustion turbines built in the reference case using a 10 percent discount rate.
the Social Cost of Carbon
In economic analysis, the relevant global environmental premium is not the financial revenue that may be obtained from the sale of carbon credit on global carbon markets, but the global social cost of carbon (SCC) that reflects the actual damage costs of increasing atmospheric concentrations of greenhouse gases (GHGs).
The literature on the SCC is growing, with estimates ranging from a small net benefit to costs of several hundred dollars a ton. Thus almost any estimate would find some support. Tol’s (2008) meta-analysis of peer-reviewed literature—which updated an earlier 2005 meta-analysis (Tol 2005)—cites 211 studies, and finds an average estimate of $120/ton carbon ($33/ton CO2) for studies pub-lished in 1996−2001, and $88/ton carbon ($24/ton CO2) for studies published since 2001. Tol concludes in the 2005 study that “it is unlikely that the marginal damage costs of emissions exceeds $50/ton carbon ($14/ ton CO2) and are likely to be substantially lower than that.”
Much of the economics literature on the subject is highly technical, particularly with respect to the choice of discount rate and assumptions about future global economic growth and income inequalities: in general one can say that the lower the discount rate, the higher the SCC (a value that may also change over time). The high valuation given in a report by Stern (2007) (“the current SCC might be around $85/ton CO2”) is largely a consequence of the use of a very low discount rate.11 A 2007 Intergovernmental Panel on Climate Change (IPCC) report highlighted the wide range of SCC estimates, given in the literature as $4−$95/ton CO2. In the United States, regulatory impact analysis requires consideration of the SCC12 using a range of discount rates (from 2.5 percent to 5 percent), with carbon values that increase over time. For example, at a 5 percent discount rate the valuation is $12/ton in 2015, rising to $27/ton by 2050; at a 2.5 percent discount rate the valuation rises from $58/ton to 98$/ton by 2050. In the United Kingdom the Department of Environment recommended, in 2007, a value of £25/ton ($37/ton) CO2
13; this was subsequently updated to a time-dependent system ranging from £23/ton CO2 in 2015 rising to £48/ton by 2025 ($36–$76/ton CO2).
The World Bank—like other international financial institutions (IFIs), such as the Asian Development Bank (ADB) and African Development Bank AfDB)—does not publish an official estimate of the value of the SCC to be used in eco-nomic analysis. In the typical economic analysis of RE projects, recent practice has been to calculate the economic rate of return (ERR) with and without
30 The Economic Rationale for Renewable Energy
The Design and Sustainability of Renewable Energy Incentives • http://dx.doi.org/10.1596/978-1-4648-0314-7
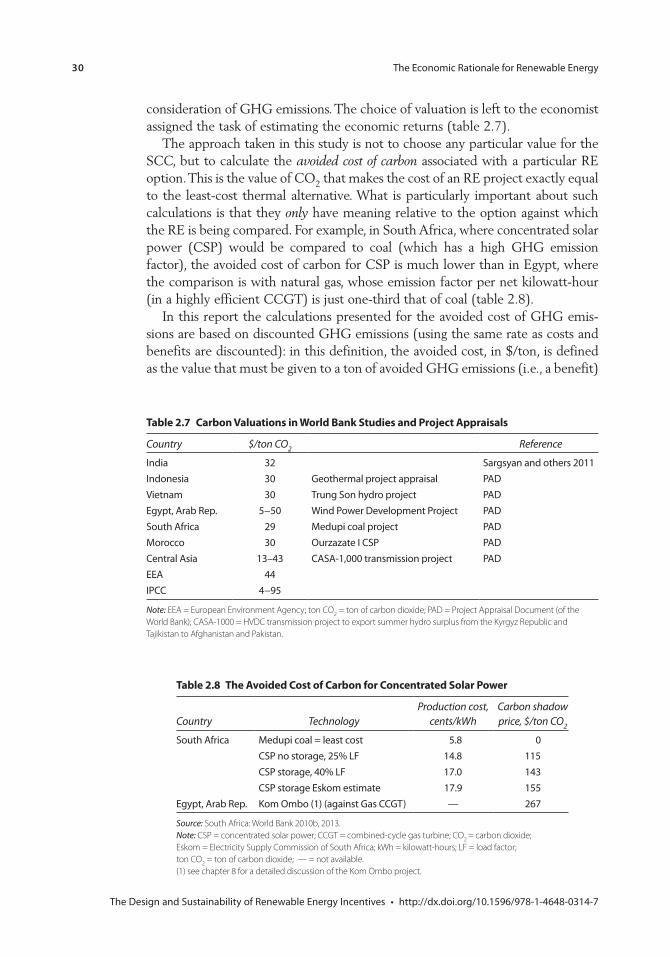
consideration of GHG emissions. The choice of valuation is left to the economist assigned the task of estimating the economic returns (table 2.7).
The approach taken in this study is not to choose any particular value for the SCC, but to calculate the avoided cost of carbon associated with a particular RE option. This is the value of CO2 that makes the cost of an RE project exactly equal to the least-cost thermal alternative. What is particularly important about such calculations is that they only have meaning relative to the option against which the RE is being compared. For example, in South Africa, where concentrated solar power (CSP) would be compared to coal (which has a high GHG emission factor), the avoided cost of carbon for CSP is much lower than in Egypt, where the comparison is with natural gas, whose emission factor per net kilowatt-hour (in a highly efficient CCGT) is just one-third that of coal (table 2.8).
In this report the calculations presented for the avoided cost of GHG emis-sions are based on discounted GHG emissions (using the same rate as costs and benefits are discounted): in this definition, the avoided cost, in $/ton, is defined as the value that must be given to a ton of avoided GHG emissions (i.e., a benefit)
table 2.7 Carbon Valuations in World Bank Studies and project Appraisals
Country $/ton CO2 Reference
India 32 Sargsyan and others 2011Indonesia 30 Geothermal project appraisal PADVietnam 30 Trung Son hydro project PADEgypt, Arab Rep. 5−50 Wind Power Development Project PADSouth Africa 29 Medupi coal project PADMorocco 30 Ourzazate I CSP PADCentral Asia 13–43 CASA-1,000 transmission project PADEEA 44IPCC 4−95
Note: EEA = European Environment Agency; ton CO2 = ton of carbon dioxide; PAD = Project Appraisal Document (of the World Bank); CASA-1000 = HVDC transmission project to export summer hydro surplus from the Kyrgyz Republic and Tajikistan to Afghanistan and Pakistan.
table 2.8 the Avoided Cost of Carbon for Concentrated Solar power
Country TechnologyProduction cost,
cents/kWhCarbon shadow price, $/ton CO2
South Africa Medupi coal = least cost 5.8 0CSP no storage, 25% LF 14.8 115CSP storage, 40% LF 17.0 143CSP storage Eskom estimate 17.9 155
Egypt, Arab Rep. Kom Ombo (1) (against Gas CCGT) — 267
Source: South Africa: World Bank 2010b, 2013.Note: CSP = concentrated solar power; CCGT = combined-cycle gas turbine; CO2 = carbon dioxide; Eskom = Electricity Supply Commission of South Africa; kWh = kilowatt-hours; LF = load factor; ton CO2 = ton of carbon dioxide; — = not available.(1) see chapter 8 for a detailed discussion of the Kom Ombo project.
The Economic Rationale for Renewable Energy 31
The Design and Sustainability of Renewable Energy Incentives • http://dx.doi.org/10.1596/978-1-4648-0314-7
to bring the incremental costs of a RE option to the hurdle rate. It could also be termed the switching value as used in sensitivity analysis and risk assessment. Note that this differs to the term “marginal abatement cost” of GHG as used by the CTF and GEF, in which the net present value of costs and benefits (at the dis-count rate used) is divided by the undiscounted lifetime GHG emissions (i.e., assuming a zero discount rate). In general one should avoid arithmetic operations on quantities based on different discount rates. The calculation based on undiscounted emissions will typically be 50–60 percent lower than in the switching value definition.14
Fossil-Fuel price Subsidies
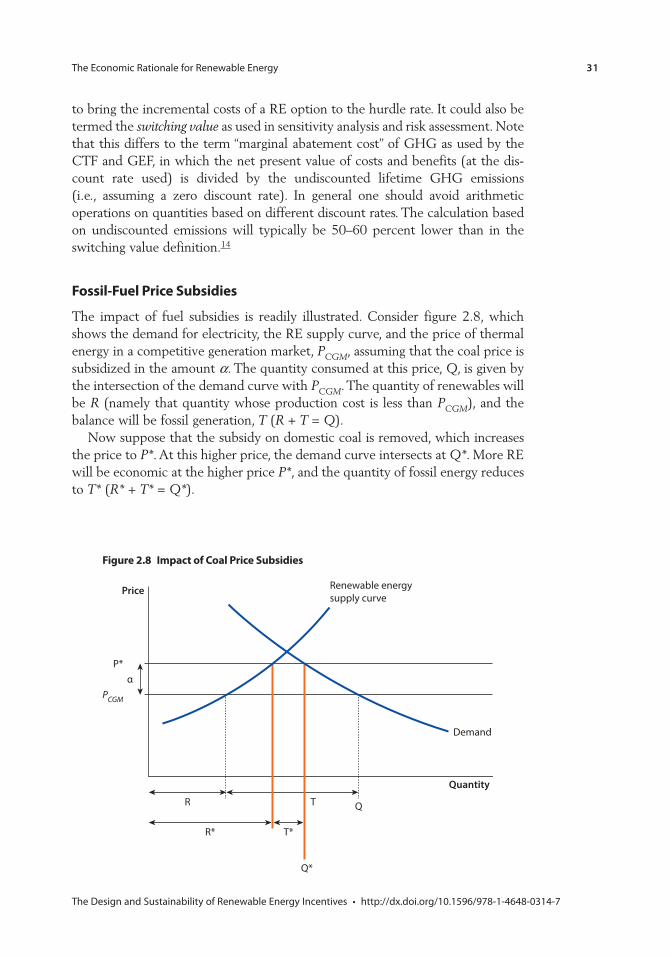
The impact of fuel subsidies is readily illustrated. Consider figure 2.8, which shows the demand for electricity, the RE supply curve, and the price of thermal energy in a competitive generation market, PCGM, assuming that the coal price is subsidized in the amount a. The quantity consumed at this price, Q, is given by the intersection of the demand curve with PCGM. The quantity of renewables will be R (namely that quantity whose production cost is less than PCGM), and the balance will be fossil generation, T (R + T = Q).
Now suppose that the subsidy on domestic coal is removed, which increases the price to P*. At this higher price, the demand curve intersects at Q*. More RE will be economic at the higher price P*, and the quantity of fossil energy reduces to T* (R* + T* = Q*).
Figure 2.8 Impact of Coal price Subsidies
Renewable energysupply curve
Demand
Quantity
Price
P*
T QR
R* T*
Q*
αPCGM
32 The Economic Rationale for Renewable Energy
The Design and Sustainability of Renewable Energy Incentives • http://dx.doi.org/10.1596/978-1-4648-0314-7
Thus there are three important consequences of reducing the subsidy on coal:
• Less electricity is consumed.• The amount of fossil energy, and hence GHG emissions, is reduced.• The amount of RE increases.
It is easily shown (in box 2.2) that both social and global welfare increases as a result of the elimination of the subsidy: the reduction in fossil-fuel subsidies is a win-win.
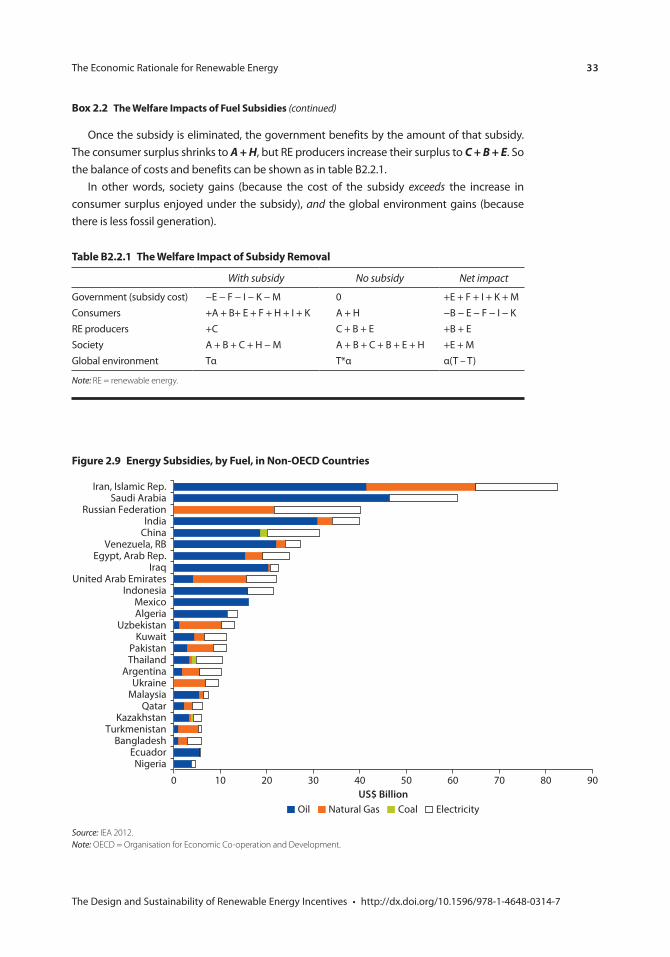
The International Energy Agency (IEA 2012) Energy Outlook15 estimates subsidies on energy consumption in the largest countries outside the Organisation for Economic Co-operation and Development (OECD) at $523 billion in 2011—almost $110 billion higher than in 2010, based on the IEA’s price-gap methodology (figure 2.9). This applies to several of this report’s case study countries (Egypt, Vietnam, Indonesia, South Africa, and Brazil). Most countries
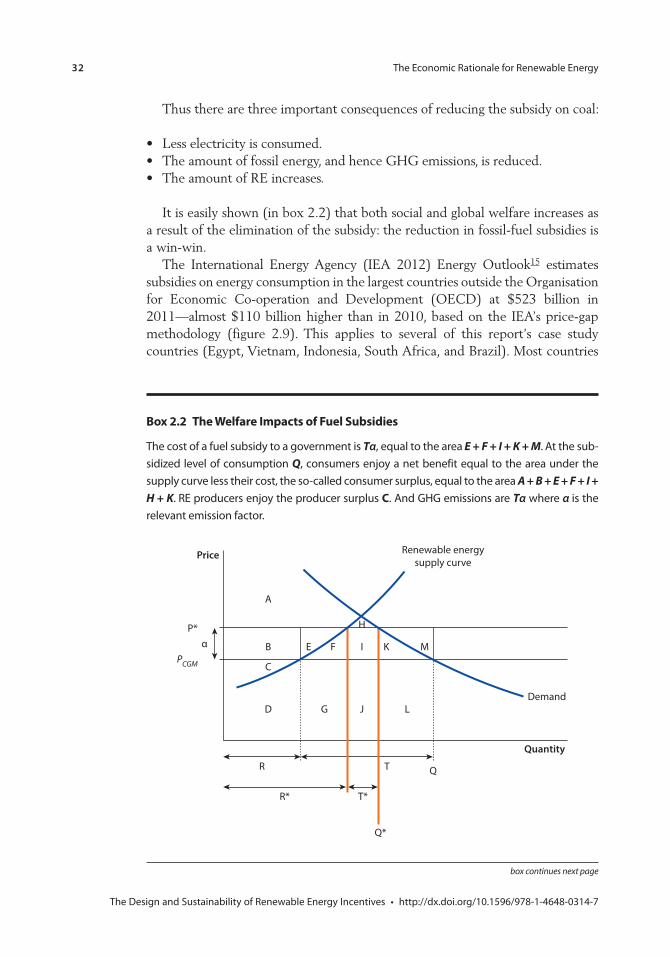
Box 2.2 the Welfare Impacts of Fuel Subsidies
The cost of a fuel subsidy to a government is Tα, equal to the area E + F + I + K + M. At the sub-sidized level of consumption Q, consumers enjoy a net benefit equal to the area under the supply curve less their cost, the so-called consumer surplus, equal to the area A + B + E + F + I +
H + K. RE producers enjoy the producer surplus C. And GHG emissions are Tα where α is the relevant emission factor.
Renewable energysupply curve
Demand
Quantity
Price
P* H
MK
T QR
R* T*
IFEB
A
C
D G J L
αPCGM
Q*
box continues next page
The Economic Rationale for Renewable Energy 33
The Design and Sustainability of Renewable Energy Incentives • http://dx.doi.org/10.1596/978-1-4648-0314-7
Once the subsidy is eliminated, the government benefits by the amount of that subsidy. The consumer surplus shrinks to A + H, but RE producers increase their surplus to C + B + E. So the balance of costs and benefits can be shown as in table B2.2.1.
In other words, society gains (because the cost of the subsidy exceeds the increase in consumer surplus enjoyed under the subsidy), and the global environment gains (because there is less fossil generation).
Box 2.2 the Welfare Impacts of Fuel Subsidies (continued)
Figure 2.9 energy Subsidies, by Fuel, in Non-OeCD Countries
Source: IEA 2012.Note: OECD = Organisation for Economic Co-operation and Development.
0 10 20 30 40 50 60 70 80 90
NigeriaEcuador
BangladeshTurkmenistan
KazakhstanQatar
MalaysiaUkraine
ArgentinaThailandPakistan
KuwaitUzbekistan
AlgeriaMexico
IndonesiaUnited Arab Emirates
IraqEgypt, Arab Rep.
Venezuela, RBChinaIndia
Russian FederationSaudi Arabia
Iran, Islamic Rep.
US$ BillionOil Natural Gas Coal Electricity
table B2.2.1 the Welfare Impact of Subsidy removal
With subsidy No subsidy Net impact
Government (subsidy cost) −E − F − I − K − M 0 +E + F + I + K + MConsumers +A + B+ E + F + H + I + K A + H −B − E − F − I − KRE producers +C C + B + E +B + ESociety A + B + C + H − M A + B + C + B + E + H +E + MGlobal environment Tα T*α α(T – T)
Note: RE = renewable energy.
34 The Economic Rationale for Renewable Energy
The Design and Sustainability of Renewable Energy Incentives • http://dx.doi.org/10.1596/978-1-4648-0314-7
have declared policies to eliminate these subsidies, but implementation is almost always slower than the announced schedule, for sudden removal of subsidies often has significant political repercussions. Vietnam is a case in point: notwith-standing the declared intention of removing subsidies for fuels used in power generation, and the commitment to market principles declared in the Electricity Law, both domestic coal and natural gas prices for power generation remain subsidized.16
renewable energy and employment
A widely cited benefit of RE is employment creation.17 But assessment of the benefits of increased employment requires caution. Economic analysis normally treats the cost of labor as an input, not as an output. A highly labor-intensive biomass technology may create local employment, but if the economic costs of the biomass project are above the avoided social costs, then employment in the economy as a whole may fall (because if households spend more on electricity, they will spend less on other goods and services).
The argument that RE development will create “green jobs” is frequently heard in the United States, European countries, and some developing countries (such as China). Generalizations from limited country experience, mainly in RE equipment manufacturing in the OECD countries, are no substitute for careful country-specific analysis; more research is needed to better understand the issue of green jobs.
The large employment benefits noted in such countries are a consequence of RE technology manufacture, particularly in countries that manufacture and export equipment, such as Spain and Denmark in the case of wind power (see box 2.3). So the question is: what is the extent to which these job gains apply to countries that do not have domestic manufacturing capacity for renewable generating equipment or reasonable prospects for doing so?
Another question that needs to be answered is whether such studies on the job creation benefits of RE also include the loss of jobs in those energy indus-tries that are displaced by the RE. In countries where there are large benefits from RE replacing coal, more RE could mean fewer coal miners, and lower employment in factories that manufacture gas turbines and coal-fired steam generators.
Within this context it is important to build a methodology to (a) contribute to a better understanding of the main effects/mechanisms to depict employ-ment impacts and (b) provide a clear definition of gross impact studies ( sectoral) and net impact studies (economy wide). Even if some comparisons indicate that RE and energy efficiency projects generated more employment than fossil fuels, such comparisons fail to consider both the costs of delivery of equal outputs using different fuel mixes and the cost of public funds. Such simplifying assumptions may lead to misleading estimates. First, the lack of evidence on the cost of using alternative energy sources to generate the same
The Economic Rationale for Renewable Energy 35
The Design and Sustainability of Renewable Energy Incentives • http://dx.doi.org/10.1596/978-1-4648-0314-7
Box 2.3 Lessons Learned from the German Energiewende (energy transition)
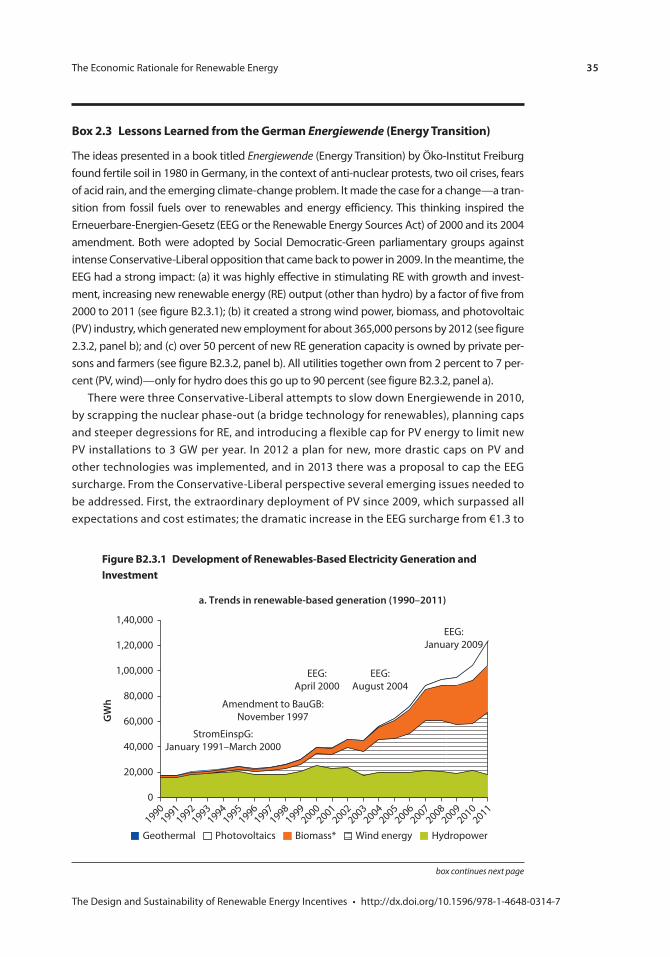
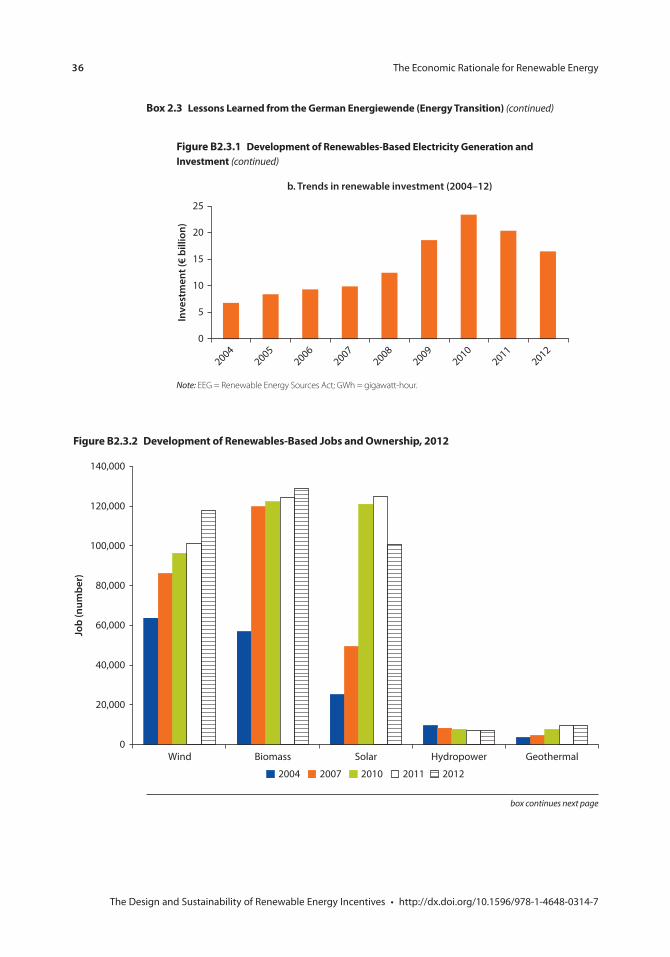
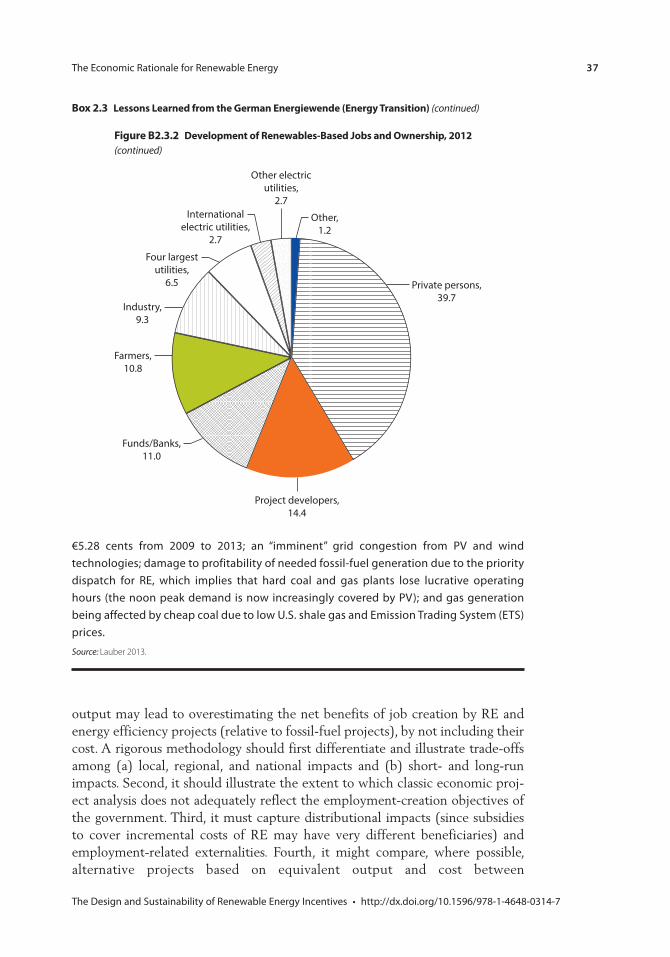
The ideas presented in a book titled Energiewende (Energy Transition) by Öko-Institut Freiburg found fertile soil in 1980 in Germany, in the context of anti-nuclear protests, two oil crises, fears of acid rain, and the emerging climate-change problem. It made the case for a change—a tran-sition from fossil fuels over to renewables and energy efficiency. This thinking inspired the Erneuerbare-Energien-Gesetz (EEG or the Renewable Energy Sources Act) of 2000 and its 2004 amendment. Both were adopted by Social Democratic-Green parliamentary groups against intense Conservative-Liberal opposition that came back to power in 2009. In the meantime, the EEG had a strong impact: (a) it was highly effective in stimulating RE with growth and invest-ment, increasing new renewable energy (RE) output (other than hydro) by a factor of five from 2000 to 2011 (see figure B2.3.1); (b) it created a strong wind power, biomass, and photovoltaic (PV) industry, which generated new employment for about 365,000 persons by 2012 (see figure 2.3.2, panel b); and (c) over 50 percent of new RE generation capacity is owned by private per-sons and farmers (see figure B2.3.2, panel b). All utilities together own from 2 percent to 7 per-cent (PV, wind)—only for hydro does this go up to 90 percent (see figure B2.3.2, panel a).
There were three Conservative-Liberal attempts to slow down Energiewende in 2010, by scrapping the nuclear phase-out (a bridge technology for renewables), planning caps and steeper degressions for RE, and introducing a flexible cap for PV energy to limit new PV installations to 3 GW per year. In 2012 a plan for new, more drastic caps on PV and other technologies was implemented, and in 2013 there was a proposal to cap the EEG surcharge. From the Conservative-Liberal perspective several emerging issues needed to be addressed. First, the extraordinary deployment of PV since 2009, which surpassed all expectations and cost estimates; the dramatic increase in the EEG surcharge from €1.3 to
box continues next page
Figure B2.3.1 Development of renewables-Based electricity Generation and Investment
1,40,000
a. Trends in renewable-based generation (1990–2011)
1,20,000
1,00,000
StromEinspG:January 1991–March 2000
Amendment to BauGB:November 1997
EEG:April 2000
EEG:August 2004
EEG:January 2009
80,000
GW
h
60,000
40,000
20,000
0
19901991
19921993
19941995
19961998
19971999
20002001
20022003
20042005
20062007
20082009
20102011
PhotovoltaicsGeothermal Biomass* Wind energy Hydropower
36 The Economic Rationale for Renewable Energy
The Design and Sustainability of Renewable Energy Incentives • http://dx.doi.org/10.1596/978-1-4648-0314-7
Figure B2.3.2 Development of renewables-Based Jobs and Ownership, 2012
0
20,000
40,000
60,000
80,000
100,000
120,000
140,000
Wind Biomass Solar Hydropower Geothermal
Job
(num
ber)
2004 2007 2010 2011 2012
Box 2.3 Lessons Learned from the German energiewende (energy transition) (continued)
box continues next page
0
5
10
15
20
25
Inve
stm
ent (
€ bi
llion
)
20042005
20062007
20082009
20102011
2012
b. Trends in renewable investment (2004–12)
Note: EEG = Renewable Energy Sources Act; GWh = gigawatt-hour.
Figure B2.3.1 Development of renewables-Based electricity Generation and Investment (continued)
The Economic Rationale for Renewable Energy 37
The Design and Sustainability of Renewable Energy Incentives • http://dx.doi.org/10.1596/978-1-4648-0314-7
output may lead to overestimating the net benefits of job creation by RE and energy efficiency projects (relative to fossil-fuel projects), by not including their cost. A rigorous methodology should first differentiate and illustrate trade-offs among (a) local, regional, and national impacts and (b) short- and long-run impacts. Second, it should illustrate the extent to which classic economic proj-ect analysis does not adequately reflect the employment-creation objectives of the government. Third, it must capture distributional impacts (since subsidies to cover incremental costs of RE may have very different beneficiaries) and employment-related externalities. Fourth, it might compare, where possible, alternative projects based on equivalent output and cost between
Box 2.3 Lessons Learned from the German energiewende (energy transition) (continued)
€5.28 cents from 2009 to 2013; an “imminent” grid congestion from PV and wind technologies; damage to profitability of needed fossil-fuel generation due to the priority dispatch for RE, which implies that hard coal and gas plants lose lucrative operating hours (the noon peak demand is now increasingly covered by PV); and gas generation being affected by cheap coal due to low U.S. shale gas and Emission Trading System (ETS) prices.
Source: Lauber 2013.
Other,1.2
Private persons,39.7
Internationalelectric utilities,
2.7
Four largestutilities,
6.5
Industry,9.3
Farmers,10.8
Funds/Banks,11.0
Project developers,14.4
Other electricutilities,
2.7
Figure B2.3.2 Development of renewables-Based Jobs and Ownership, 2012 (continued)

38 The Economic Rationale for Renewable Energy
The Design and Sustainability of Renewable Energy Incentives • http://dx.doi.org/10.1596/978-1-4648-0314-7
(a) renewable-energy and energy-efficiency projects and (b) fossil-fuel projects. To our best knowledge, no study reviewed to date compares projects costing the same amount (or producing the same output) along both employment and cost metrics.
Of course, it is perfectly valid for governments to stimulate employment in disadvantaged areas of a country, even at the cost of lower employment in richer urban areas, if this is viewed in the context of social equity. But an impor-tant distinction might be noted: promoting employment in specific regions reflects the equity objective of the government, and not the economic- efficiency objective.
The correct approach for economic analysis is to shadow-price labor costs.18 For example, the economic cost (or the opportunity cost) of employing otherwise unemployed rural workers is zero—and different to the actual wage rate that would be used in the financial analysis. But few RE projects will have much need for unskilled labor, whether during construction, or during operation (when unskilled labor, at best, would extend to the security staff at a wind farm or a CSP project).
Specific Questions for the Case Studies
The analytical framework requires that the effectiveness of incentive mecha-nisms be assessed and compared by a set of rational criteria, as follows:
• Economic efficiency. How close is an RE support tariff to the avoided social cost of thermal energy (which for developing countries means economic cost + avoided local externalities)? How close is the target quantity to the economic optimum (intersection of the economic supply curve with the avoided social cost of thermal energy)?
• Market principles. Does the design require the application of market princi-ples? An auction meets this criterion perfectly (provided there are safeguards against collusion and abuses). Access to a subsidy on the basis of first come, first served, or “all come” (as in Germany’s feed-in tariff, FIT) does not meet market principles (and constitutes the worst possible way of providing access to support).
• Transparency. Is the methodology of preferential pricing published? Can devel-opers and their lenders come to their own conclusions about the future evolu-tion of the tariff level? Does the mechanism provide for adjustment to changes in the law?
• Sustainable recovery of incremental costs. Are the incremental costs known? (In a surprising number of cases they are not!) Is the mechanism for recovery of these costs sustainable (that is, is the mechanism for raising the necessary funds, and for disbursing them, seen as credible by developers and their lenders)?
• Adaptability. Is there a predictable mechanism for updating the tariff and adjusting it for external changes (changes in technology costs, changes in tax rates, changes in fossil energy prices in the case of ACTs)?
The Economic Rationale for Renewable Energy 39
The Design and Sustainability of Renewable Energy Incentives • http://dx.doi.org/10.1596/978-1-4648-0314-7
The evaluation of the policy framework should similarly follow a set of ratio-nal criteria:
• Targets. Are the targets set as political statements, or on the basis of a rational economic analysis (supply curve methodology, or affordability)? Are targets reasonably achievable, and are they in harmony with the support measures necessary to achieve them? In the case of renewable portfolio standards (RPSs) and mandatory renewable shares, are the penalties for not meeting them reasonable?
• Energy subsidies. How does the additional quantity of RE—made economic by reducing fossil-fuel subsidies—compare with the quantity of RE to be sup-ported by RE incentives? How does the quantity of thermal energy that would not be required if retail tariff subsidies were eliminated compare with the quantity of RE supported by targeted RE incentives?
Methodology
For each of the case study countries, the following set of calculations will be presented:
• From the current least-cost power sector development plan, the expected gen-eration mix for 2020, the generation shares and gigawatt-hours of each major fuel and technology, and the gigawatt-hours of retail sales.
• Estimate of the consequences if 1 percent of generation were replaced by RE. What would be replaced is the most expensive of the thermal generation, by some RE whose tariff could be calculated to provide the developer with a target financial internal rate of return (FIRR) based on typical commercial lending rates. This allows a calculation of the total financial incremental costs—and the impact on consumers were this amount to be recovered from them.
• An estimate of the tariff (and incremental cost) decrease prompted by the various incentives listed in table 1.1 (taxonomy of incentives): a clean develop-ment mechanism (CDM), carbon finance, subsidized loans from government-owned development banks, tax incentives, and so on.
• A comparison of the impact on the consumer from reducing any fossil-fuel subsidies. Reducing fossil-fuel subsidies would increase the generation cost passed to the consumer, for which there is also a GHG emission reduction benefit. How does this compare with the cost to the consumer if the consumer is charged with a levy to recover RE generation costs?
• Finally, a comparison of the residual incremental cost, as may need to be cov-ered from the direct government budget, with government spending on edu-cation and health (or some other appropriate indicator of spending for poverty alleviation). This question is core, as developing country governments are reluctant to incur the incremental cost of RE in the face of the overriding objectives of poverty alleviation and economic growth.
40 The Economic Rationale for Renewable Energy
The Design and Sustainability of Renewable Energy Incentives • http://dx.doi.org/10.1596/978-1-4648-0314-7
Notes
1. Gas delivered to the Ca Mau CCGT project in Vietnam is indexed to the Singapore fuel oil price.
2. Particulate matter (no greater than 10 microns in diameter).
3. Sulphur oxides.
4. Nitrogen oxides.
5. The additional quantity QBAU is the much lower quantity of renewable energy likely to be implemented in the absence of explicit RE policy, due mainly to institutional and regulatory constraints (such as problems in negotiating PPAs, obtaining permits, and obstacles imposed by utility buyers who have traditionally opposed the emer-gence of IPPs for fear of losing market share).
6. VSL (value of statistical life) is used in most U.S. and European studies as a basis for mortality and is based on contingent valuation methods typical in American accident liability lawsuits. Most development economists argue that valuations based on YOLL (years of life lost) are more appropriate for the premature mortality typically associ-ated with pollution-aggravated respiratory diseases.
7. The damage cost of $1,333/ton NOX is consistent with the $473/ton (at 2002 prices) cited in the Bank’s 2003 Energy/Environmental Review (though the derivation of that estimate is unclear) (World Bank/EEAA 2003).
8. For example, a study on wind energy in Vietnam (Global Green Energy 2004) argues that “OECD uses a discount rate of 6 percent as standard, thereby justifying a 7 percent rate” (rather than the 10 percent actually used by the Government of Vietnam).
9. In the case of an open economy, capital can be considered a tradable good, and the EOCC will be the world supply price of capital (U.S. treasuries, or long term LIBOR plus some country specific risk premium). Many developing countries now have domestic bond markets which can provide further information.
10. Morocco issued $500 million, 30-year 144a/Regulation S bonds in December 2012 at a coupon of 5.5 percent. The issue was reopened in May 2013 to increase the issue to $750 million for a tap of 237.5 basis points over U.S. Treasuries, and is currently trad-ing at a discount. As such, a nominal discount rate of 6 percent for modeling purposes seems reasonable.
11. For a good discussion of these issues, and a review of the assumptions in the Stern Review, see, for example, Hope and Newbery (2007). See also Grubb, Jamasb, and Pollitt (2008).
12. Interagency Working Group, Technical Update of the Social Cost of Carbon (SCC) for Regulatory Impact Analysis under Executive Order 12866, May 2013.
13. DEFRA, The SCC and the Shadow Price of Carbon, December 2007; Department of Energy and Climate Change, Carbon Appraisal in UK Policy Appraisal: A Revised Approach: A Brief Guide to the New Carbon Values and their Use in Economic Appraisal.
14. The rationale for not discounting GHG emissions is that it is the cumulative stock of GHG emissions in the atmosphere that matters, not the time at which it is emitted. However, there is an emerging consensus that the economic benefit of a ton of avoided GHG emissions increases over time as the concentration of atmospheric GHGs reaches the tipping point (recall the discussion of SCC, above, and the valua-tions being used by the U.S. Interagency Working Group on the SCC, and others).
15. The subject first received detailed analysis by the IEA in 1999 (IEA 1999).
The Economic Rationale for Renewable Energy 41
The Design and Sustainability of Renewable Energy Incentives • http://dx.doi.org/10.1596/978-1-4648-0314-7
16. Whether the use of subsidized fuel prices also distorts power sector investment deci-sions is unclear. An assessment of the use of financial prices rather than economic prices in Vietnam’s Sixth Power Development Plan found little impact on the optimal capacity mix as proposed by the plan (Economic Consulting Associates 2006).
17. An argument made, for example, by Kammen, Nozafari, and Prull (2012).
18. A related problem is the extent to which the cost of accidents and deaths to coal min-ers should be separately considered as an additional externality and added to the social cost of coal generation (as are included, for example, in the South African damage cost estimates of table 2.1). In economic theory higher occupational health hazards should be reflected in higher wage rates for miners, compared to other potential occupations that experience lower rates of occupational mortality, and hence do not classify as an externality. But this would be true only in a perfectly competitive and mobile labor market. For example, whether miners in the mining areas of northern Vietnam have real alternative employment opportunities (whether in the mining areas or elsewhere in Vietnam) may be debated.
Bibliography
Economic Consulting Associates. 2006. Economic Chapter of Power Sector Masterplan No.6. Report to the World Bank, Washington, DC, January.
Edkins, M., H. Winkler, A. Marquard, and R. Spalding-Fecher. 2010. External Cost of Electricity Generation, Contribution to the Integrated Resource Plan 2 for Electricity. Report to the Department of Environment and Water Affairs, Energy Research Centre, University of Cape Town, South Africa.
EEA (European Environment Agency). 2011. Revealing the Costs of Air Pollution from Industrial Facilities in Europe. Report EEA Technical Report 12/2011, Copenhagen, Denmark.
Global Green Energy. 2004. Wind Farm Development in Vietnam, Prefeasibility Study: Developing Commercial Wind Energy Projects in Vietnam. New York, USA: Global Green Energy.
Grubb, M., T. Jamasb, and M. G. Pollitt, eds. 2008. Delivering a Low Carbon Electricity System: Technologies, Economics and Policy. Cambridge, U.K.: Cambridge University Press.
Hope, C., and D. Newbery. 2007. Calculating the Social Cost of Carbon. Cambridge University Electricity Policy Research Group, Cambridge, U.K.
IEA (International Energy Agency). 1999. Insights, World Energy Outlook: Looking at Energy Subsidies: Getting the Price Right. Paris: IEA.
———. 2012. World Energy Outlook 2012. Paris: IEA.
Kammen, D., M. Nozafari, and D. Prull. 2012. Sustainable Energy Options for Kosovo. Renewable & Appropriate Energy Laboratory Energy & Resources Group, University of California, Berkeley.
Lauber, V. 2013. “Can Germany’s Energiewende Still Be Slowed Down?” Presentation made at 8th IEWT, Tech. Univ. Vienna, Vienna, Austria, February.
Lvovsky, K., G. Hughes, D. Maddison, B. Ostrop, and D. Pearce. 2000. “Environmental Costs of Fossil Fuels: A Rapid Assessment Method with Application to Six Cities.” Environment Department Paper 78, World Bank, Washington, DC.
42 The Economic Rationale for Renewable Energy
The Design and Sustainability of Renewable Energy Incentives • http://dx.doi.org/10.1596/978-1-4648-0314-7
Sargsyan, G., M. Bhatia, G. Banerjee, K. S. Raghunathan, and R. Soni. 2011. Unleashing the Potential of Renewable Energy in India. Washington, DC: World Bank.
Spencer, R., P. Meier, and N. Berrah. 2007. Scaling Up Renewable Energy in China: Economic Modelling Method and Application. Energy Sector Management Assistance Program (World Bank) (ESMAP) Knowledge Exchange Series #11, June, Washington, DC.
Stern, N. 2007. The Economics of Climate Change: The Stern Review. Cambridge, U.K.: Cambridge University Press.
Tol, R. 2005. “The Marginal Damage Costs of Carbon Dioxide Emissions: An Assessment of the Uncertainties.” Energy Policy 33: 2064–74.
———. 2008. “The Social Cost of Carbon: Trends, Outliers and Catastrophes.” Economics e-Journal 2: 2008–25.
World Bank. 2005. Economic Analysis for the China Renewable Energy Scale-Up Programme (CRESP). Washington, DC: World Bank.
———. 2010a. Sri Lanka, Environmental Issues in the Power Sector. Washington, DC: World Bank.
———. 2010b. Medupi Economic Analysis Background Report. Washington, DC: World Bank.
———. 2013. Kom Ombo CSP: Economic and Financial Analysis. Washington, DC.
———. 2014. Noor II and III Concentrated Solar Power Projects. Project Appraisal Document. Washington, DC.
World Bank/EEAA. 2003. Egypt: Energy/Environmental Review. Report prepared by ERM, April, Washington, DC: World Bank.