THE DENTAL STATUS, NEEDS AND DEMANDS OF ... - CORE
394
THE DENTAL STATUS, NEEDS AND DEMANDS OF THE ELDERLY IN THREE COMMUNITIES JAMES G. STEELE A thesis submitted for the degree of Doctor of Philosophy in the University of Newcastle upon Tyne NEWCASTLE UNIVERSITY LIBRARY 093 52209 7 January 1994
-
Upload
khangminh22 -
Category
Documents
-
view
0 -
download
0
Transcript of THE DENTAL STATUS, NEEDS AND DEMANDS OF ... - CORE
THE DENTAL STATUS, NEEDS AND DEMANDS OF THE
ELDERLY IN THREE COMMUNITIES
JAMES G. STEELE
A thesis submitted for the degree of
Doctor of Philosophy in the
University of Newcastle upon Tyne
NEWCASTLE UNIVERSITY LIBRARY
093 52209 7
January 1994

ABSTRACT
THE DENTAL STATUS, NEEDS ANI) DEMANDS OF THE
ELDERLY IN THREE COMMUNITIES

An age stratified random sample of 2280 adults over the age of 60 years, from three different areas of
England, were interviewed and examined by a dentist in order to assess their dental status needs and
demands. The towns of Salisbury (representing an urban community in the South of England), Darlington
(representing an urban community in the North of England) and Richmondshire in North Yorkshire
(representing a rural community) were the areas used. This allowed Salisbury and Darlington, the two towns
used in one of the original population studies of adult dental health in 1962, to be revisited after 30 years.
Response rates were around 55%, and a postal follow up of refusers allowed the influence of sampling bias
on key dental factors to be established. The final sample was mostly ambulant and severe disability was
rare, except in the oldest subjects (75^). Four dentists conducted the examinations, but one examiner (the
author) undertook half of the examinations in each area.
Geographical location, age and social class were strongly related to edentulousness. The percentage
edentulous ranged from 11% in the younger (age 60-64) Salisbury non-manual workers to 90% in the oldest
(age 75^) Darlington unskilled manual workers. A further 10% of the total sample in all three areas was
edentulous in one arch. Complete dentures were rarely free of faults, but the relationships between denture
faults, as assessed by the dentist, and reported dissatisfaction were weak.
In the dentate sample, partial dentures were worn by 40%. Most of these were made of acrylic and were
of a simple tissue supported design. Around 20% had had a partial denture made in the past which they
were unable or unwilling to wear. Decay, periodontal attachment loss and tooth wear increased with age,
but geographical variations were small. The most important influence on the dental health of the dentate
was dental attendance pattern. Subjects who only attend the dentist when driven by pain had about six fewer
teeth, six fewer filled teeth, and about twice as much decay (taking into account the number of teeth left)
as those who attend for check-ups. 40-50% of the sample had some moderate periodontal attachment loss,
but signs of more severe disease were found in only 10-25%. CPITN was an inappropriate measure of
periodontal disease in an elderly population; loss of attachment and tooth mobility were preferable. Some
moderate tooth wear affected about 40% of the sample, but did not seem to be closely related to functional
111

problems. Most of the teeth with root surface decay, advanced periodontal disease and severe wear were
concentrated in a minority of the sample.
Demands and attitudes in the dentate varied with geography, gender and social class. Dental non-attenders
were more common among men (particularly in the North) and people from manual backgrounds. A
perceived lack of need for treatment was the major reason given for non-attendance. Fear of edentulousness
and a preference to have restorative treatment were more common in the south. Few subjects reported
difficulty with access to dental care.
The risk factors for dissatisfaction and difficulty with eating were analysed using a model of the factors
contributing to oral health and well being. The presence of unfilled anterior spaces and social and
demographic variables were the major risk factors for dissatisfaction with aesthetics. Symptoms and the
number of missing teeth were the most important factors leading to eating difficulties and dissatisfaction
with masticatory function. Partial dentures are much more likely to be worn when there are less than 20
teeth, and where there is an anterior space. Number of posterior contacts and dental attendance pattern were
the other major determinants of partial denture wearing. Partial dentures were a major risk factor for having
root surface decay and fillings.
Oral health goals for the elderly, taking into account the need to retain sufficient teeth to function through
life, are presented. The absence of partial dentures, 20-24 teeth and 2-4 posterior contacts are seen as the
desirable minimum, although these requirements may reduce with age.
This research was supported by the Department of Health, grant number 121/2392.
iv

ACKNOWLEDGEMENTS

A study of this sort, in which over 2000 home visits were undertaken to subjects spread over three areas
of the country, and involving a wide variety of different agencies and institutions, depends on the co-
operation and co-ordination of a large number of people. Consequently I shall begin the acknowledgements
with an apology to anybody who I omit to thank. If anyone has been left out undeservedly it is not through
lack of gratitude, but through lack of adequate memory.
I had two supervisors for this project and I would like to express heartfelt thanks to both. John Murray
provided tremendous encouragement, common sense and advice at all stages. His vision kept the work
going forward when there was a risk of it getting bogged down, and manuscripts were always returned with
alarming rapidity having been read and commented upon. The contribution of Angus Walls provided a
perfect complement to this, particularly with reference to his attention to detail, knowledge of the literature
and sound practical advice. I cannot thank them both enough for their tolerance and support.
This study was funded by the Department of Health, and whilst it would be folly to express my gratitude
to a huge, impersonal, government department, I would personally like to thank Cohn Howard, who not
only provided the link to our funding body, but gave an immense amount of valuable feedback and in many
ways acted as an accessory supervisor for much of the work. I would also like to register my debt to
Professor Ian Barnes and Professor Andrew Rugg-Gunn who were both involved in setting up the study in
the first place, and continued to take an interest in the project and provide practical advice until its
completion.
Pat Ludiman, Denise Mattin and Hilary Smith acted as the other examiners (besides myself) during the
fieldwork. The 350 or so examinations which they undertook must have stretched their boredom tolerance
to the limit, but they all got on with it and completed what was required with good humour and, in view
of my paranoid nagging, surprising patience. Five Dental Surgery Assistants took time out from their normal
duties in the community service and undertook a job which was new, difficult, often tedious, sometimes
awkward or embarrassing and always hard work, and did it superbly and loyally. I enjoyed their company
and I cannot express my gratitude strongly enough to Mattie Andrew, Sandra Gates, Va! Gunson, Elaine
vi

Inness and Brenda Woodehouse.
Statistical analysis and computing played a large part in this work and two people deserve my special
thanks. Dr Taghi Ayatollahi performed an invaluable task in breaking the back of the data description and
early analysis, and in providing advice and practical help in the later stages. The work would have taken
several years longer to complete without his help. David Appleton also provided help with the sampling
and subsequently excellent advice.
At an early stage in the three years or so during which the work was carried out I sought and received
advice from many people. I would particularly like to thank Arnd KAyser and Dick Witter from the Dental
School in Nijmegen, Aubrey Sheiham and Anna Theresa Leao from UCH in London, John Bond and
Graham Farrow from the Centre for Health Services Research in Newcastle, Angus McNay from the
Northern Regional Health Authority, and Jean Todd from OPCSIDPB for their help and, in some cases
practical support. Stella Saunders and John Stewart deserve thanks for their roles in providing the examiners
to undertake the home visits and for dealing sensitively with various local political problems.
The names for the sample came from the computerised lists held by the Family Health Services Authorities
for each of the areas concerned. Drawing a sample from these was not a straightforward matter, and for
those that constructed the lists of names that I required and had to endure my repeated, anxious, telephone
enquiries in the process I would like to express my gratitude.
My colleagues in the Department of Restorative Dentistry have had to put up with my presence, my mess
and my continual occupancy of various computers. Despite this they have given me continued help and
encouragement which I appreciate. They deserve my thanks.
During the course of the fieldwork 2280 people were visited, interviewed and examined, some of them on
two occasions (if they took part in the revisit procedure). Most were pleasant, many were interesting and
some had excellent chocolate biscuits, but above all every one of them gave up their own time and allowed
vii

two total strangers into their house to ask them questions and poke around inside their mouths. At a time
when crime levels are high and the media regularly reports deception and crime against older adults they
deserve great praise and thanks, and I hope that some of them (all of them) enjoyed our visits as much as
we enjoyed visiting them.
Final thanks must go to my wife Katie and the children - Tom and Jenny. They have endured much over
the three years which it took to complete this work, particularly throughout the twelve weeks or so that I
spent in Salisbury, and the many other late returns from Darlington, Richmondshire and the computer. Katie
also provided loyal support and practical help when desperation set in. Tom and Jenny behaved well
(usually) and kept life in perspective.
viii

CONTENTS
lx
CONTENTS
Page No.
1Section 1 INTRODUCTION
Section 2 REVIEW OF THE LITERATURE
2.1. The dental health of older adults and it's relationship to
geography and social factors.
2.1.1. The relationship of oral health with geography and social factors
- an historical perspective
2.1.2. Edentulousness or total tooth loss
2.1.3. The number of standing teeth and the replacement of missing
teeth in the UK adult population and the relationship with age,
gender, geography and social factors.
2.1.4. The state of the crowns of the teeth in older adults.
2.1.5. Root caries in older adults.
2.1.6. Periodontal disease in older adults.
2.1.7. Tooth wear in older adults.
2.1.8. Temporo-mandibular dysfunction in older adults
2.1.9. Soft tissue pathology in older adults
2.1.10. Dental health of older adults - an international perspective
2.1.11. Summary - The dental health of older adults and its relationship to
geography and social factors
2.2. Attitudes to oral health, oral behaviours and barriers to
dental care in older adults.
2.2.1. Attitudes to oral health and oral health behaviours in older adults
2.2.2. Barriers to dental care in older adults.
2.2.3. Summary - Attitudes to oral health, oral health behaviours and
barriers to dental care in older adults.
7
8
8
11
18
21
28
33
39
42
43
48
55
60
60
66
70
x

Section 3
3 .1.
3.1.1.
3.1.2.
3.1.3.
3.1.4.
3.1.5.
3.1.6.
3.2.
3.3.
3.3.1.
3.3.2.
3.3.3.
2.3. The concept of a functional dentition 72
2.3.1. The partial dentition and masticatory function
72
2.3.2. The partial dentition, digestion and nutrition
75
2.3.3. The partial dentition and other aspects of function and health
77
2.3.4. The replacement of missing teeth and the restoration of function
79
and aesthetics
2.3.5. Tooth replacement as a factor in dental disease
83
2.3.6. The shortened dental arch
84
2.3.7. Summary - the concept of a functional dentition
86
2.4. Identifying goals for oral health
89
2.4.1. Defining oral health
89
2.4.2. Disease and clinical variables a measures of oral health
91
2.4.3. Sociological measures of oral health
92
2.4.4. Summary - identifying goals for oral health
95
97
98
98
99
100
102
103
103
103
104
104
105
105
MATERIALS AND METHODS
Sampling
Selection of areas
Age groups
Sample size
Sampling frame and procedure
Localisation of the sample
Randomization
Ethical approval and contacting local bodies
Pilot work
Pilot work: sampling
Pilot work: clinical examination and diagnostic criteria
Pilot work: questionnaire
xi
3.4. Personnel and training 106
3.4.1. Personnel
106
3.4.2. Training the examiners
106
3.4.3. Training the Dental Surgery Assistants
108
3.5. Arranging the dental visit and follow-up of refusers 108
3.5.1. Contact
108
3.5.2. Information on refusers
109
3.6. The procedure for the dental visit
110
3.7. The diagnostic criteria for the examination
112
3.7.1. Coronal decay and restoration
112
3.7.2. Root surface decay
115
3.7.3. Tooth wear
117
3.7.4. Periodontal disease
118
3.7.5. Posterior tooth contacts
120
3.7.6. Spacing
120
3.7.7. 1'MJ examination and soft tissues
120
3.7.8. Partial dentures 122
3.7.9. Complete dentures
123
3.8. The Questionnaire 125
3.9. Inter-examiner variability 127
3.10. Data entry, verification, cleaning and consistency checking
128
3.11. Data analysis and presentation 129
3.11.1. Sampling bias and examiner bias
129
3.11.2. Reweighing of data
130
3.11.3. Presentation of data in tables
131
3.11.4. Confidence limits and reweighted confidence limits
131
3.11.5. Manipulation of clinical data
136
3.11.6. Logistic regression analysis
138
xii

Section 4
4.1.
4.1.1.
4.1.2.
4.1.3.
4.2.
4.2.1.
4.2.2.
4.2.3.
4.2.4.
4.2.5.
4.2.6.
4.2.7.
4.3.
4.3.1.
4.3.2.
4.3.3.
4.3.4.
4.3.5
4.4.
4.4.1.
4.4.2.
4.5.
RESULTS 143
The sample 144
Response rates 144
Sampling bias 146
Examiner bias 154
Data from the clinical examination 158
Edentulousness 158
Dentate subjects: The number of teeth and tooth replacement 161
Dentate subjects: Data on the condition of the crowns of the teeth 166
Dentate subjects: Data on decay and fillings of the roots 174
Dentate subjects: Periodontal disease 180
Dentate subjects: tooth wear S 189
All subjects: Other oral disorders 191
Data from the questionnaire 197
Edentulous subjects 197
Dentate subjects: Demands 204
Dentate subjects: Attitudes 208
Dentate subjects: Barriers and reasons for dental non-attendance 215
(non-attenders only)
All subjects: Access to care and knowledge of services 221
The partially dentate: Masticatory function, the number 223
of teeth and the role of partial dentures
Number of teeth and function 223
Partial denture wearing and the role of partial dentures in dental disease 227
The factors which influence oral health in the elderly 233
xlii

Section 5
5.1.
5.1.1.
5.1.2.
5.1.3.
5 .2.
5.2.1.
5.2.2.
5.2.3.
5.2.4.
5.2.5.
5.2.6.
5.2.7.
5 .3.
5.3.1.
5.3.2.
5.3.3.
5.3.4.
5.3.5.
5 .4.
5.4.1.
5.4.2.
5.4.5.
5.5.
DISCUSSION 239
The sample and methodological issues 240
Response rates 240
Sampling bias 242
Examiner bias 244
Data from the clinical examination 247
Edentulousness 247
Dentate subjects: The number of teeth and tooth replacement 249
Dentate subjects: Data on the condition of the crowns of the teeth 251
Dentate subjects: Data on decay and fillings of the roots 253
Dentate subjects: Periodontal disease 255
Dentate subjects: tooth wear 258
All subjects: Other oral disorders 260
Data from the questionnaire 261
Edentulous subjects 261
Dentate subjects: Demands 264
Dentate subjects: Attitudes 265
Dentate subjects: Barriers and reasons for dental non-attendance 268
(non-attenders only).
All subjects: Access to care and knowledge of services 269
The partially dentate: Masticatory function, the number of 270
teeth and the role of partial dentures
Number of teeth and function 270
Partial denture wearing and the role of partial dentures in dental disease 272
The minimum requirements for the partial dentition 276
The factors which influence oral health in the elderly 277
xiv

Section 6 CONCLUSIONS 289
Section 7 REFERENCES 300
Section 8 APPENDICES 316
xv

LIST OF TABLES
Table no. Page no.
2.1.1. Percentage edentulous by social class in Salisbury in 1962 and equivalent 10
areas in Adult Dental Health Surveys, 1968 - 88
2.1.2. Percentage edentulous by social class in Darlington in 1962 and the North 10
of England in Adult Dental Health Surveys 1968 - 88.
2.1.3. Percentage edentulous in England and Wales in 1968 and 1988 for three age 13
cohorts and their ages in 1948.
2.1.4. Prevalence of edentulousness in 1968 and 1988 in the North and South of 15
England and incidence of edentulousness over the same period.
2.1.5. Percentage point reduction in edentulousness for different social class groups 16
in three English regions between 1978 and 1988.
2.1.6. Geographical variations in the number of sound and untreated teeth in U.K. 23
adults in 1988.
2.1.7. Mean number of filled teeth and the percentage of teeth which were filled 26
in different gender, geographical, social and attendance groups in U.K. adults in 1988
2.1.8. Mean number of decayed teeth per person and the proportion of standing 27
teeth which this represents, broken down by age group.
2.1.9. Mean number of decayed and filled root surfaces in U.K. in 1988, with and 31
without taking into account the number of vulnerable teeth.
2.1.10. Percentage of the population over the age of 65 who are edentulous in different 49
countries.
2.1.11. Mean number of decayed, filled and sound teeth in the U.K. and the U.S. for older 51
adults.
2.1.12. DMFT for over 65s in various European countries 52
2.1.13. Periodontal conditions around the world in the 35-44 year old age groups, measured 54
by CPITN.
2.2.1. Proportions of the total population who attend the dentist for regular dental check- 61
xvi

ups and only with trouble according to gender, social class and area of residence.
2.2.2. Change in attendance pattern for different groups of the dentate in England 62
and Wales between 1968 and 1988.
2.2.3. Oral Hygiene behaviours according to gender, social class and area of residence. 63
2.2.4. Treatment preferences according to age, gender, social class and area. 63
2.2.5. Proportion of the dentate sample who said that they would be very upset at
needing partial and complete dentures, by age, gender, social class and area of 65
residence.
2.2.6. Proportion of the population reporting different types of barriers as the single most 67
important barrier by age, gender and social class.
3.1.1. Required Sample size for each area, taking into account response rates, 101
deaths and absences from address.
3.11.1. Correction factor matrix for reweighing to correct for population age structure. 132
3.11.2. 95% Confidence intervals for different sample sizes and percentages of the sample 132
affected.
3.11.3. Reweighted and non-reweighted 95% confidence intervals and the data 135
used to calculate them for three different examples.
4.1.1. Response rates for different sections of the sample. 145
4.1.2. Base numbers in the total sample by area, age, gender, social class and attendance 147
pattern
4.1.3. Response rate with and without data from the postal questionnaire. 149
4.1.4. Percentage edentulous with and without including the data from the postal 149
questionnaire.
4.1.5. Percentage of dentate who attend only with trouble, with and without data 149
from the postal questionnaire.
4.1.6. Income and education of the total sample, by area and age. 151
4.1.7. Percentage of all subjects with various relevant medical conditions by age and area. 152
4.1.8. Percentage of the sample with long term illness or disability by area and age. 153
xvii

4.1.9. Reweighted (60+) totals by observer and area for key variables (clinical data). 155
4.1.10. Total area scores for clinical dental data calculated from the data collected by 156
one examiner, by age.
4.1.11. Kappa scores for major clinical variables 157
4.2.1. Percentage of the sample edentulous by age, area, gender and social class. 159
4.2.2. Percentage of the sample edentulous in one arch by area, age, gender and social 160
class.
4.2.3. Base numbers for the dentate sample 162
4.2.4. Percentage of the dentate sample with 21 or more teeth, by area, age, gender, 164
social class and attendance pattern.
4.2.5. Partial dentures by area, age, gender, social class and attendance pattern. 165
4.2.6. Distribution of partial dentures by area and age. 167
4.2.7. Mean number of decayed, missing and filled teeth (coronal surfaces), CCI 168
and CCI(d) for the dentate sample, by area, age, gender, social class
and attendance pattern. (includes overlay for confidence limits)
4.2.8. Mean number of decayed, missing and filled teeth (coronal surfaces), 169
CCI and CCI(d) for the reweighted (60+) sample, by area, age,
gender, social class and attendance pattern. (includes overlay for confidence limits)
4.2.9. Percentage of the coronal decay component in different categories by area and age. 171
4.2.10. Percentage of the dentate sample with one or more crowned teeth, by area, age, 172
social class and attendance pattern.
4.2.11. Percentage of dentate sample with multiple crowns and bridges, and the mean 173
number of crowns in those with crowns, by area and age.
4.2.12. Mean number of teeth affected by root caries, sample RCI and sample RCI(d), 175
by area, age, social class and attendance pattern. (includes overlay for confidence limits).
4.2.13. Mean number of teeth affected by root caries, sample RCI and sample RCI(d), 176
for the reweighted dentate (60+) sample by area, age, social class and
attendance pattern. (includes overlay for confidence limits).
xviii

4.2.14. Percentage of the root decay component in different categories by area and age. 177
4.2.15. The mean number of decayed, missing and filled teeth (crown and root) 179
for reweighted (60+) dentate sample, by area, age, gender, social class and attendance pattern.
4.2.16. Base numbers of sample for periodontal data. 181
4.2.17. Percentage of dentate subjects not periodontally examined due to medical 181
history, by area and age.
4.2.18. CPITN - Richmondshire, by age, gender, social class and attendance. 182
4.2.19. CPITN - Darlington, by age, gender, social class and attendance. 183
4.2.20. CPITN - Salisbury, by age, gender, social class and attendance. 184
4.2.21. Percentage of the dentate sample with different thresholds of attachment loss, 185
by area, age, gender, social class, and attendance pattern.
4.2.22. Percentage of the reweighted (60+) sample with different thresholds of 186
periodontal attachment loss by area, age, gender, social class and attendance pattern.
4.2.23. Percentage of the dentate sample with mobile teeth by area and age. 187
4.2.24. Percentage of the dentate sample with molar furcation involvement by area and age. 187
4.2.25. Percentage of the dentate sample with grade 3 or 4 cervical wear, by area and age. 190
4.2.26. Mean number of grade 3 or 4 cervical wear lesions, by age and area in those
with lesions. (with overlay for confidence limits). 190
4.2.27. Percentage of the dentate sample with coronal tooth wear of grade 3 or 192
worse by area, age, gender, social class and attendance pattern.
4.2.28. Mean number of grade 3 or worse teeth in those who have some grade 3 wear, 193
by area, age, gender, social class and attendance pattern. (with overlay for confidence limits)
4.2.29. The relationship between wear and dissatisfaction/function problems (combined data) 193
4.2.30. Frequency of reported dry mouth in dentate and edentulous groups and frequency 195
of related factors in all subjects by area and age.
4.2.3 1. Frequency of denture related soft tissue pathology and other pathology, by area 196
and age.
4.2.32. TMJ clicks, crepitus and joint tenderness by area and age. 196
xix

4.3.1. Mean period and age edentulous, age of dentures worn and percentage of the 199
edentulous sample rendered edentulous at a young age, by area and age.
4.3.2. Type of payment among the edentulous sample by age and area. 200
4.3.3. Percentage of the edentulous sample who say they fmd dentistry expensive or 200
very expensive by area and age.
4.3.4. Percentage of the edentulous sample who were dissatisfied with different aspects 201
of function or who reported functional difficulties or discomfort by area and age.
4.3.5. Denture faults and their correlation with dissatisfaction (data combined for 202
all areas and age groups).
4.3.6. Demands: percentage of the dentate sample who think that they do not need 205
treatment, by age, area, the presence of decayed teeth and non-attendance.
4.3.7. Demands: Treatment preferences among the dentate sample by area, age, gender, 206
social class and attendance pattern.
4.3.8. Demands: Treatment preferences among the dentate sample aged 60+ (reweighted 207
data) by area, age, gender, social class and attendance pattern.
4.3.9. Demands: Symptoms reported by the dentate sample by area and age. 209
4.3.10. Attitudes: Percentage of the dentate sample who attend only when they are 210
having trouble with their teeth, by area, age, gender, social class and attendance pattern.
4.3.11. Attitudes: Reported frequency of tooth brushing by the dentate sample by area 212
and age.
4.3.12. Attitudes: Percentage of the dentate sample who would be not at all upset 213
at loosing all of their teeth by area, age, gender, social class and attendance pattern.
4.3.13. Attitudes: Percentage of the dentate sample who expect to need full dentures in 214
future, by area, age, social class and attendance pattern.
4.3.14. Attitudes: Percentage of the dentate sample who say they find dentistry 216
expensive or very expensive by age, gender, social class and recent experience.
4.3.15. Attitudes: Type of payment for dental care among the dentate sample by area 217
and age.
xx

4.3.16. Attitudes: Percentage of the dentate sample who were dissatisfied with different 218
aspects of function by area and age.
4.3.17. Barriers: Most frequently quoted barriers amongst dentate non-attenders, by area 219
and age.
4.3.18. Barriers: Single most important barrier among non-attenders, by area and age. 220
4.3.19. Percentage of sample reporting problems of access to care and knowledge of 222
domiciliary care by area and age (all subjects).
4.4.1. Factors involved in wearing a partial denture. 229
4.4.2. Percentage of the dentate sample who have had a partial denture made which 231
could not be worn.
4.4.3. Percentage of partial denture wearers expressing different reasons for wearing 231
partial dentures by area and age.
4.4.4. Partial dentures as a risk factor for dental disease. 229
4.5.1. Risk factors for difficulty eating. 234
4.5.2. Risk factors for dissatisfaction. 235
xxi

LIST OF FIGURES
FIGURE Page no.
2.1.1. Changes in edentulousness 1978-1988 14
2.1.2. Changes in 21 standing teeth 1978-1988 19
2.1.3. Mean number of filled teeth by age 25
2.1.4. Filled teeth per 100 people 25
2.1.5. The percentage edentulous in the UK and the USA 50
3.11.1. Standard error of the percentage plotted against percentage affected for four different 133
sample sizes (n).
3.11.2. Theoretical model for oral health in the elderly 142
4.1.1. Sample and Census data. Percentage males and females aged 75+ 148
4.2.1. Percentage of sample accounting for percentage of all root caries lesions or 178
unsound restorations (data for all areas pooled).
4.2.2. Percentage of sample accounting for percentage of all root caries lesions 178
and all root surface restorations (data for all areas pooled).
4.3.1. Complete dentures: any dissatisfaction by denture faults. 203
4.4.1. Number of teeth by % dissatisfied with function 225
4.4.2. Number of teeth by % with functional problems 225
4.4.3. Contacts by % dissatisfied with function 226
4.4.4. Contacts by % with functional problems 226
4.4.5. Number of teeth by % with partial denture 228
4.4.6. Contacts by % with partial denture 228
4.5.1. Factors affecting ability to eat and satisfaction with function 237
4.5.2. Factors affecting satisfaction with aesthetics 237
4.5.3. Final schematic model of the factors affecting oral health in the elderly 238
5.5.1. Clinical photographs - case 1 284
5.5.2. Clinical photographs - case 2 285
xxii

5.5.3. Clinical photographs - case 3 286
5.5.4. Clinical photographs - case 4 287
5.5.5. Clinical photographs - case 5 288
xdii

INTRODUCTION AND AIMS OF THE STUDY

Section 1
INTRODUCTION AND AIMS OF THE STUDY
The age structure of the population of the United Kingdom is changing. Life expectancy at birth had
increased from 68 years for men and 74 years for women in 1961, to 72 years for men and 78 years for
women 25 years later (OPCS, 1991a) and is expected to continue to increase (Thompson, J., 1987).
Although birth rates tend to fluctuate considerably, there has been a marked reduction since the "baby
boom" of the 1960s (OPCS, 1991a; OPCS, 1991b). The net effect of a steady or reducing birth rate and
a reduction in mortality is a general ageing of the population. This is illustrated by an increase in the
median age of the British population from 34 years in the late 1970s to 35.5 years in 1987, predicted to
increase to as much as 40 years by 2010 (Thompson, J., 1987). The population of pensionable age (at
present, 60+ years for women, 65+ for men) is only expected to increase slightly to the end of the century,
but this masks a considerable increase in the proportion of the very old" (85+ years). The actual size of
this group is projected to rise from the 1991 figure of 0.8 million to 1.1 million by the end of the century
and 1.5 million by 2010 (OPCS, 1993; Thompson, J., 1987). The ratio of dependent elderly to working age
adults wifi change from 30 dependents for every 100 working age adults in 1991 to 47 dependents for every
100 working age adults within 40 years - with considerable economic implications (OPCS, 1993).
The demographic changes which have been described would be of significance to the dental profession
irrespective of any future changes in the dental status of the nation. However, evidence from the last three
decennial Surveys of Adult Dental Health in the United Kingdom indicates profound changes, most
obviously a drop in the rate of edentulousness, but also an increase in the number of sound and untreated
teeth in children and young adults (Todd, J.E. & Lader, D., 1991; Todd, J.E. et al., 1982). These changes
in prevalence are most evident in the younger age groups, but there is also evidence of a reduced incidence
of edentulousness in all age groups (including older adults) compared with the previous surveys . Basing
their projections on a continuation of these trends, Todd and Lader have predicted that by the year 2018
only 16% of the population will be edentulous, and if no more tooth loss were to occur between now and
2

then (which seems very unlikely) the figure would be as low as 4%. Even if one considers the older age
groups alone the edentulous would comprise only 16% (at 'worst') of the 65-74 age group and 34% of the
over 75 year olds compared to the 1988 figures of 57% and 80% respectively (Todd, J.E. & Lader, D.,
1991). By this time the total population of over 60 year olds will have increased to nearly 12 million from
the current figure of just over 10 million. The combination of falling levels of edentulousness, an increase
in the elderly population and lower disease levels in the younger age groups will lead to changes in the way
dentistry is practised in the United Kingdom over the next fifty years.
The requirement for complete dentures will reduce, and the age of those who require full dentures for the
first time will increase. However it is not the reduction in the requirement for complete dentures which is
likely to be of greatest significance, but the need for restorative dental care for a large and increasing
number of dentate elderly. The need for repair and replacement of existing large and complex coronal
restorations (the legacy of high caries levels in the past), the management of partial dentitions and of
dentitions extensively and irreversibly damaged by periodontal disease are likely to become of considerable
significance. As more teeth are retained, more root surfaces will become exposed due to gingival recession
and therefore vulnerable to attack by root surface caries. Other problems which are a feature of the elderly,
such as altered salivary function and a reduced capacity to perform adequate oral hygiene, are likely to
increase the incidence of root caries in the elderly population further. It has been widely predicted that root
surface caries will become an increasing dental problem in the future (Heinrich, R. et al., 1990; Katz, R.V.
et al., 1982; Kitamura, M. et al., 1986; Ripa, L.W. & Leske, G.S., 1986), although the significance of such
a change has been questioned (Sheiham, A., 1990).
The strategies employed to treat these problems may be complex and expensive, so concepts of priority are
likely to become increasingly important, particularly where finances are in any way restricted. Alternative
treatment ideologies, such as the "shortened dental arch (Kayser, A.D. & Witter, D.J., 1985) may provide
useful solutions. The patient's own subjective assessment of what constitutes a good or comfortable
dentition may differ from that of the professional treating them. However, where resources are limited and
life expectancy is short, patient satisfaction may be a more important goal than a clinical result which is
3

technically "ideal'.
The edentulous are generally not an expensive group to treat in terms of frequency and duration of
maintenance. In the 1988 Adult Dental Health Survey 65% of the edentulous reported last attending the
dentist more than 5 years previously, and the figure was higher for the very old. However, when the dentate
were asked the same question, overall only 10% reported that it was over 5 years since their last visit
(although the figure was 25% for the over 65s). The proportion of dentate older adults (>55 years) in
England and Wales who attend for regular checkups has also increased, from 27% in 1968 to 45% in 1988,
and was as high as 55% in the 45-54 year old age group (Todd, J.E. & Lader, D., 1991). It would appear
that not only will the numbers of elderly people with teeth increase, but the tendency for older people to
demand regular treatment also seems set to increase as the middle aged cohorts of today get older. One may
expect an increasing proportion of dentists' time to be devoted to the treatment of the elderly, with a
corresponding increase in the cost for this sector of the population. The attitudes of older people to dental
health and the effect that this has on demand for dental care will be an important factor when planning
resources to deal with the projected increase in need for dental care in this age group.
The complex combination of demographic and dental changes which have been described will not be
uniform throughout the United Kingdom; geographical and social factors are also important influences.
Geographic differences in dental health exist within the UK, well illustrated by higher levels of
edentulousness and dental disease in Scotland and the North of England compared to the South of England.
Such regional effects were first demonstrated in this country by Bulman (Bulman, J.S. et al., 1968) in a
study entitled Demand and Need for Dental Care which compared the dental health of adults in two
communities "typical" of their area, Darlington in the north of England and Salisbury in the south. Demand
and Need for Dental Care was distinguished from previous oral health surveys by its inclusion of
sociological and socio-dental aspects of oral health and the impact of geography on these, in addition to
clinical dental data. This study was described as "in all ways a pilot" by the authors, and many of the
methods used were later applied to the first and subsequent British national surveys of adult dental health
(Gray, P.O. et al., 1970; Todd, J.E. & Lader, D., 1991; Todd, J.E. et al., 1982).
4
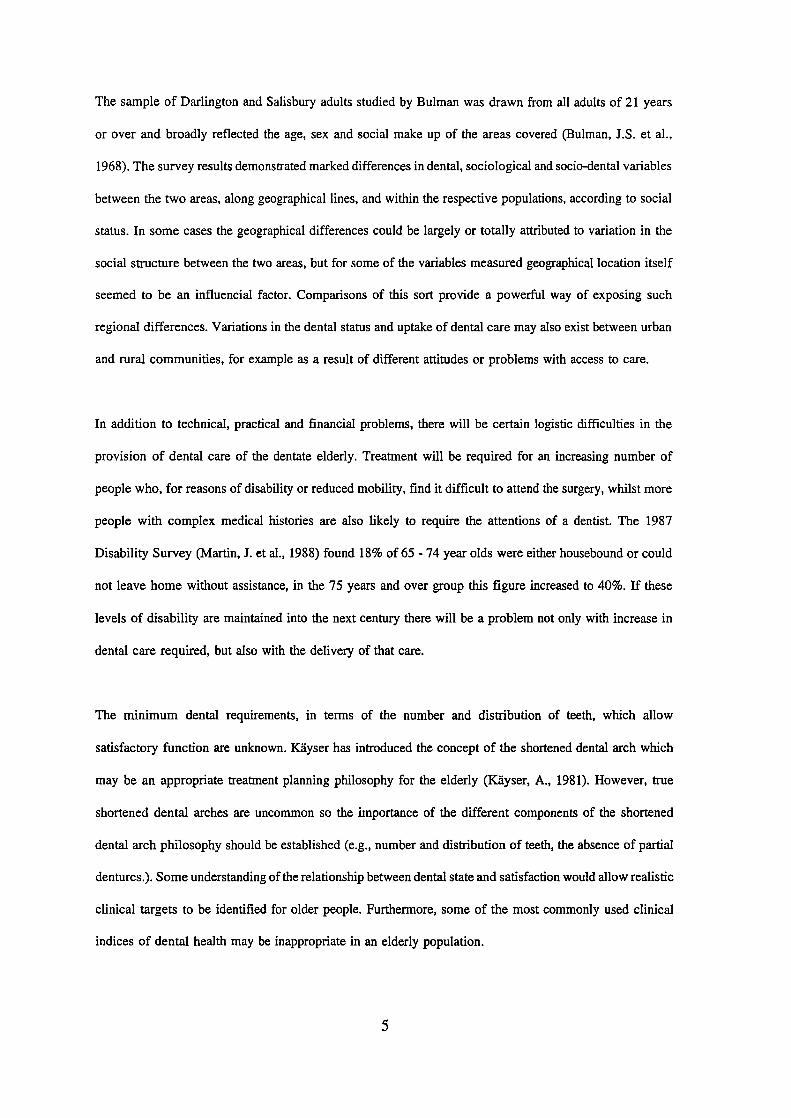
The sample of Darlington and Salisbury adults studied by Bulman was drawn from all adults of 21 years
or over and broadly reflected the age, sex and social make up of the areas covered (Bulman, J.S. et al.,
1968). The survey results demonstrated marked differences in dental, sociological and socio-dental variables
between the two areas, along geographical lines, and within the respective populations, according to social
status. In some cases the geographical differences could be largely or totally attributed to variation in the
social structure between the two areas, but for some of the variables measured geographical location itself
seemed to be an influencial factor. Comparisons of this sort provide a powerful way of exposing such
regional differences. Variations in the dental status and uptake of dental care may also exist between urban
and rural communities, for example as a result of different attitudes or problems with access to care.
In addition to technical, practical and financial problems, there will be certain logistic difficulties in the
provision of dental care of the dentate elderly. Treatment will be required for an increasing number of
people who, for reasons of disability or reduced mobility, find it difficult to attend the surgery, whilst more
people with complex medical histories are also likely to require the attentions of a dentist. The 1987
Disability Survey (Martin, J. et al., 1988) found 18% of 65 - 74 year olds were either housebound or could
not leave home without assistance, in the 75 years and over group this figure increased to 40%. if these
levels of disability are maintained into the next century there will be a problem not only with increase in
dental care required, but also with the delivery of that care.
The minimum dental requirements, in terms of the number and distribution of teeth, which allow
satisfactory function are unknown. Käyser has introduced the concept of the shortened dental arch which
may be an appropriate treatment planning philosophy for the elderly (Kayser, A., 1981). However, true
shortened dental arches are uncommon so the importance of the different components of the shortened
dental arch philosophy should be established (e.g., number and distribution of teeth, the absence of partial
dentures.). Some understanding of the relationship between dental state and satisfaction would allow realistic
clinical targets to be identified for older people. Furthermore, some of the most commonly used clinical
indices of dental health may be inappropriate in an elderly population.
5

This study revisits Darlington and Salisbury 30 years after Bulman. A third area, the rural district of
Richmondshire in North Yorkshire, has been included to provide a rural contrast to Darlington in the north
of England. This time, however, the research is concentrating on the elderly population. Although the term
elderly means different things to different people, this study concentrated on adults over 60 years of age.
There is no agreed point at which somebody starts becoming elderly, and few 60 year olds would regard
themselves as elderly, nevertheless the inclusion of all adults over the age of 60 years does allow some
indication of important trends which will affect older adults in the medium and long term.
The objectives of this study are therefore:
1. To collect information about the oral health of subjects over the age of 60 years living in three areas
of England, and to review the effect of social and geographic factors on oral health.
2. To collect data on the attitudes, demands and barriers to dental care among older adults, and to
review the effect of social and geographic factors on these.
3. To investigate the relationship between the presence, number and distribution of teeth and partial
dentures, and levels of function and satisfaction.
4. To identify goals for oral health in the elderly and to identify the factors, clinical and sociological,
which may need to be addressed in order to achieve these goals.
6

REVIEW OF THE LITERATURE

Section 2.
REVIEW OF THE LITERATURE
The review of the literature is divided into four major sub-sections. Section 2.1 covers data on different
aspects of dental health in the population of the United Kingdom. It reports the prevalence and extent of
edentulousness, caries, root surface caries, periodontal disease, tooth wear, dentures and disease of the soft
tissues, as well as describing the social and geographic factors which affect these. This is followed by a
synopsis of the dental health of the elderly put in an international context. Section 2.2. describes the
attitudes and demands of the UK public in terms of dental care, as well as access and barriers to care.
Section 2.3. addresses the specific problem of the partial dentition and the effect of tooth loss on function
and satisfaction, as well as the role of prosthetic replacement in the restoration of function. Finally, in
section 2.4. the existing indices for the measurement of oral health are described and their advantages and
disadvantages in terms of an older population are discussed. In this review the terms elderly, older adults
and older population generally refers to those over the age of 65 years, as this is usually the way in which
data are presented, although in some cases the over 55 year olds and over 75 year olds may be referred to
separately.
2.1. THE DENTAL HEALTH OF OLDER ADULTS AND ITS RELATIONSHIP TO GEOGRAPHY
AND SOCIAL FACTORS.
2.1.1. The relationship of oral health with geography and social factors - an historical perspective
The dental data published by Bulman (Bulman, J.S. et al., 1968) revealed higher levels of edentulousness
and untreated decay (particularly among manual workers), and fewer standing and restored teeth in
Darlington, even when comparing equivalent social groups. This may have been a reflection of the more
favourable patient to dentist ratio in Salisbury, as the authors suggested, or, at least in part, of cultural and
behavioural differences between the two populations. However, while dental health was generally better in
8

the Salisbury population, the professionally assessed quality of complete dentures was deemed to be much
higher in Darlington. Geographical differences were not restricted to clinical dental data, but also to
sociological and socio-dental findings. Although attendance patterns for social classes I and H were similar
for the two areas, Salisbury had considerably more regular attenders in social classes III, IV and V. Perhaps
the most striking geographical difference found was in the expectation of and attitude to complete denture
wearing. A far higher proportion of dentate subjects in Salisbury, in all social classes, expected that they
would need complete dentures at some time in the future (55% to 3 1%), while a higher proportion of the
dentate subjects in Darlington (54% to 23%) hoped not to need them. In the context of the generally better
dental health in Salisbury, this is perhaps a surprising finding.
It would be incorrect to try to extrapolate these results to give a national picture, indeed the authors
emphasised that their findings were only applicable to the two areas investigated. However, it would seem
reasonable to investigate the possibility of extending the results, in a limited way, to apply some of the
findings at a regional level at least, and to investigate how representative the chosen areas were. Direct
comparison of much of the data with the national survey, conducted 6 years after the work of Bulman, is
difficult due to different presentation of the statistics. Levels of edentulousness for Darlington and Salisbury
can be compared though, and although they. were a great deal higher than the national average in both areas,
they were broadly in line with their regional levels from the national survey (see tables 2.1.1. and 2.1.2).
In the case of all manual workers in Salisbury and Darlington, the 1962 study gave levels of edentulousness
between 1% and 10% higher than the respective regional findings in the 1968 national survey. Given the
reductions in levels of edentulousness over the following 20 years (Todd, J.E. & Lader, D., 1991), this
difference may have been as much a reflection in actual changes in the 6 year period between the two
surveys, as it was of Salisbury and Darlington being poorly representative of the national picture (as was
suggested in the report of the 1968 national survey). Many of the geographical trends demonstrated by
Bulman were reflected in the subsequent national surveys.
9

Table 2.1.1. Percentage edentulous by social class in Salisbury in 1962 and equivalent areas in Adult DentalHealth Surveys 1968 - 88.* Salisbury was included in the south-west area in 1968, but due to changes in area boundaries wasincluded under "south' in 1978 and 1988.
Salisbury 1962 South-West 1968 South 1978 South 1988
Non-manual 31 36 17 11
III manual 46 41 19 17
IV/V 57 50 36 28
All 42 43 23 16
Table 2.1.2. Percentage edentulous by social class in Darlington in 1962 and the North of England in AdultDental Health Surveys 1968-88.
Darlington 1962 North 1968 North 1978 North 1988
Non-manual 36 30 24 17
III manual 53 43 35 32
IV/V 62 57 38 38
All 51 46 34 27
In Demand and Need for Dental Care the geographical differences in dental health between the two areas
were far less evident than the enormous impact of social factors within the two populations. In general, a
person's social class (according to the occupation of the head of the household) was found to be a much
more potent determinant of their dental health and attitudes to dental health, than whether they lived in
Salisbury or Darlington. In general, non-manual and skilled manual workers were more likely to be dentate,
had more teeth, more restorations, less decay and visited the dentist more regularly than semi- or unskilled
manual workers. The existence of these differences has subsequently been borne out by the findings of
national and regional surveys both in the U.K. and abroad. "Demand and need for dental care" played a
pioneering role in dental epidemiology, but reflected the dental priorities of the period. It was published
when dental caries rates were high in children and young adults, and when being elderly usually meant
being edentulous. To quote directly from the publication "hardly anyone over the age of 65 can be expected
10
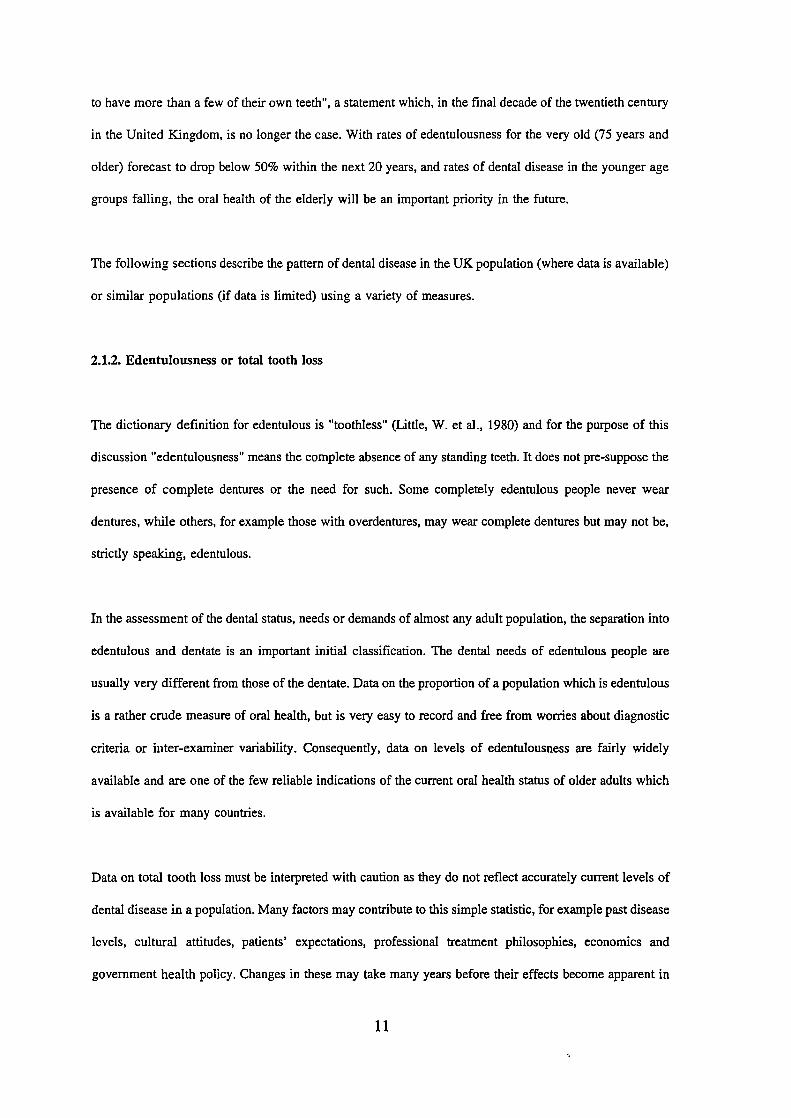
to have more than a few of their own teeth', a statement which, in the final decade of the twentieth century
in the United Kingdom, is no longer the case. With rates of edentulousness for the very old (75 years and
older) forecast to drop below 50% within the next 20 years, and rates of dental disease in the younger age
groups falling, the oral health of the elderly will be an important priority in the future.
The following sections describe the pattern of dental disease in the UK population (where data is available)
or similar populations (if data is limited) using a variety of measures.
2.1.2. Edentulousness or total tooth loss
The dictionary definition for edentulous is "toothless' (Little, W. et al., 1980) and for the purpose of this
discussion "edentulousness" means the complete absence of any standing teeth. It does not pre-suppose the
presence of complete dentures or the need for such. Some completely edentulous people never wear
dentures, while others, for example those with overdentures, may wear complete dentures but may not be,
strictly speaking, edentulous.
In the assessment of the dental status, needs or demands of almost any adult population, the separation into
edentulous and dentate is an important initial classification. The dental needs of edentulous people are
usually very different from those of the dentate. Data on the proportion of a population which is edentulous
is a rather crude measure of oral health, but is very easy to record and free from worries about diagnostic
criteria or inter-examiner variability. Consequently, data on levels of edentulousness are fairly widely
available and are one of the few reliable indications of the current oral health status of older adults which
is available for many countries.
Data on total tooth loss must be interpreted with caution as they do not reflect accurately current levels of
dental disease in a population. Many factors may contribute to this simple statistic, for example past disease
levels, cultural attitudes, patients' expectations, professional treatment philosophies, economics and
government health policy. Changes in these may take many years before their effects become apparent in
11

the edentulous statistic, particularly when considering older adults. It is therefore appropriate to look at all
age groups in order to identify trends and anticipate future changes.
Edentulousness and its relationship to age, gender geography and social factors.
The 1988 Adult Dental Health Survey (Todd, J.E. & Lader, D., 1991), as the third decennial assessment
of adult dental health in England and Wales (and the second covering all of the U.K.), was able to detect
changes in the prevalence of edentulousness over a 20 year period. This section refers only to data from
this and previous national surveys. The overall proportion of the adult population who were edentulous in
England and Wales has dropped from 37% in 1968, to 20% in the most recent survey. A national reduction
of 17 percentage points is impressive, but treating the figures in such a simplistic way conceals important
differences according to age, gender, geography, social factors and combinations of these.
The reductions in levels of edentulousness have affected all age groups. In general these have been most
marked in the middle aged and younger elderly (45-74 years) who have shown decreases of between 23
and 28 percentage points over this period. In the under 35s the proportion edentulous was low to start with
(in 1968), but the figure has now dropped to almost zero. The least impressive change is among the very
old, among whom the last 20 years have only seen an overall reduction of 8 percentage points. However
this is better than it looks: if the incidence of edentulousness is calculated by following the middle aged
groups of 1968 (the three age bands from 35 to 64) through to 1988 (the three age bands over 55 years),
it is similar for all three groups. As the younger cohorts work through over the next 20 years or so similar
reductions in prevalence may become apparent in the very old as well. This was an interesting finding in
the 1988 survey as it became clear that the high levels of total tooth loss seen in the older age groups in
the past was not inevitably going to continue. The differences in prevalence that are apparent between the
age bands are undoubtedly multifactorial but are probably less to do with a falling incidence in either of
the major dental diseases than they are to do with changing social attitudes towards dental health combined
with (and perhaps related to) the benefits of a lifetime of National Health Service dentistry. The 55 to 64
year olds of 1988 were the 15 to 24 year olds of 1948 and have therefore experienced almost a full life of
free or subsidised dentistry. The prevalence of edentulousness in this group was 28 percentage points lower
12
than that of their predecessors at the same age 20 years previously (the 55-64 year olds of 1968), who were
already aged 35-44 at the inception of the NHS in 1948.
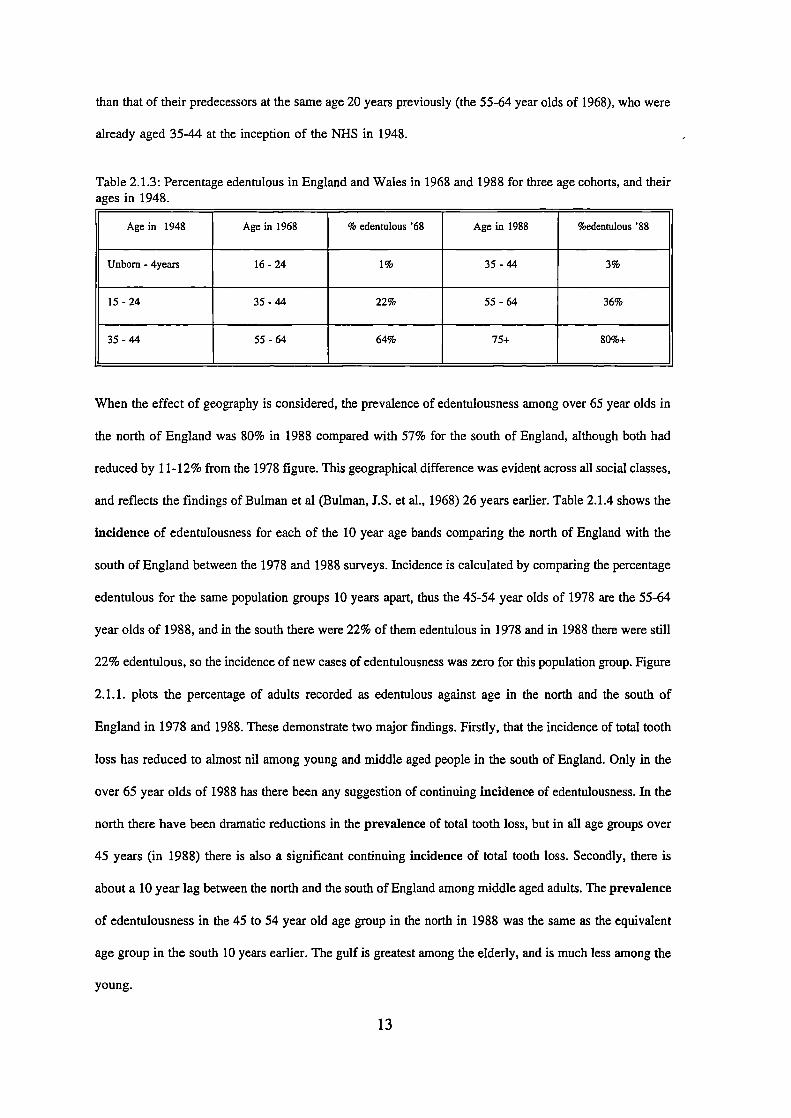
Table 2.1.3: Percentage edentulous in England and Wales in 1968 and 1988 for three age cohorts, and theirages in 1948.
When the effect of geography is considered, the prevalence of edentulousness among over 65 year olds in
the north of England was 80% in 1988 compared with 57% for the south of England, although both had
reduced by 11-12% from the 1978 figure. This geographical difference was evident across all social classes,
and reflects the findings of Bulman et al (Bulman, J.S. et al., 1968) 26 years earlier. Table 2.1.4 shows the
incidence of edentulousness for each of the 10 year age bands comparing the north of England with the
south of England between the 1978 and 1988 surveys. Incidence is calculated by comparing the percentage
edentulous for the same population groups 10 years apart, thus the 45-54 year olds of 1978 are the 55-64
year olds of 1988, and in the south there were 22% of them edentulous in 1978 and in 1988 there were still
22% edentulous, so the incidence of new cases of edentulousness was zero for this population group. Figure
2.1.1. plots the percentage of adults recorded as edentulous against age in the north and the south of
England in 1978 and 1988. These demonstrate two major findings. Firstly, that the incidence of total tooth
loss has reduced to almost nil among young and middle aged people in the south of England. Only in the
over 65 year olds of 1988 has there been any suggestion of continuing incidence of edentulousness. In the
north there have been dramatic reductions in the prevalence of total tooth loss, but in all age groups over
45 years (in 1988) there is also a significant continuing incidence of total tooth loss. Secondly, there is
about a 10 year lag between the north and the south of England among middle aged adults. The prevalence
of edentulousness in the 45 to 54 year old age group in the north in 1988 was the same as the equivalent
age group in the south 10 years earlier. The gulf is greatest among the elderly, and is much less among the
young.
13

1U)C')
0C)C)C)ci:
CoCO0)1
CO
0)
Cl)Cl)C)
Cl)
2U-
C)
C)
Cl)C)0)
.0
U
C)
C)iz
Lt)
L
U,L()
+Lt)CD
co0)0)11
•0U
cc0)0)ww'4- 'I-00
.
00zz
th
0)0)
cc0)0)
wwII-00
— —
00U)C1)
I I
.,
CU,
cJCD1
o 0 0 0 0 0 0 0 0 0o 0) CD CD U) C') C4
snonuope %
C
14
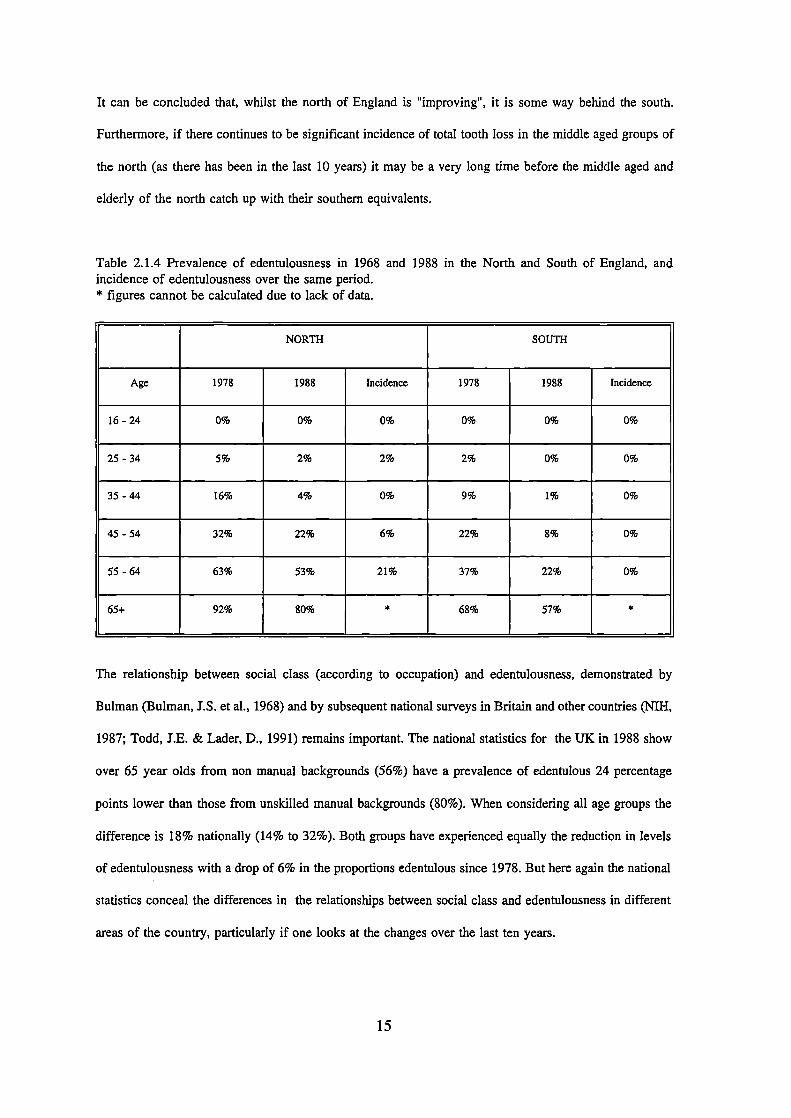
It can be concluded that, whilst the north of England is "improving, it is some way behind the south.
Furthermore, if there continues to be significant incidence of total tooth Toss in the middle aged groups of
the north (as there has been in the last 10 years) it may be a very long dine before the middle aged and
elderly of the north catch up with their southern equivalents.
Table 2.1.4 Prevalence of edentulousness in 1968 and 1988 in the North and South of England, andincidence of edentulousness over the same period.* figures cannot be calculated due to lack of data.
NORTH SOUTH
Age 1978 1988 Incidence 1978 1988 Incidence
16-24 0% 0% 0% 0% 0% 0%
25 - 34 5% 2% 2% 2% 0% 0%
35-44 16% 4% 0% 9% 1% 0%
45 - 54 32% 22% 6% 22% 8% 0%
55 - 64 63% 53% 21% 37% 22% 0%
65+ 92% 80% * 68% 57% *
The relationship between social class (according to occupation) and edentulousness, demonstrated by
Bulman (Bulman, J.S. et al., 1968) and by subsequent national surveys in Britain and other countries (NIH,
1987; Todd, J.E. & Lader, D., 1991) remains important. The national statistics for the UK in 1988 show
over 65 year olds from non manual backgrounds (56%) have a prevalence of edentulous 24 percentage
points lower than those from unskilled manual backgrounds (80%). When considering all age groups the
difference is 18% nationally (14% to 32%). Both groups have experienced equally the reduction in levels
of edentulousness with a drop of 6% in the proportions edentulous since 1978. But here again the national
statistics conceal the differences in the relationships between social class and edentulousness in different
areas of the country, particularly if one looks at the changes over the last ten years.
15

All areas and social groups have shown a reduction in the prevalence of edentulousness in the 10 years to
1988. This ranged from 2% to 10% and was generally similar in the North and the South of England.
However, one sub-group stands out as the exception; over the same period there was no reduction at all in
the prevalence of edentulousness in people from unskilled manual backgrounds in the north of England. In
other words, while there have been national falls in the prevalence of edentulousness which seem impressive
and have been noted in almost all areas and all social classes, there remains one large section of the popula-
tiori (the families of unskilled manual workers in the north of England) who have apparently not
experienced these changes and who are being left behind the rest of the country according to this most
simple measure of oral health (see table 2.1.5.).
Table 2.1.5.. Percentage point reduction in edentulousness for different social class groups in the threeEnglish regions between 1978 and 1988 (Todd and Lader 1991).
North of England Midlands South of England
Non-manual 7% 6% 6%
III manual 3% 2% 5%
IV/V (unskilled) 0% 8% 10%
In all areas fewer males are edentulous than females; the overall national difference is 9% between the
sexes. The reductions in prevalence over the past 20 years have been experienced more or less equally by
men and women, but with the exception, once again, of the north of England where the gulf between the
sexes seems to have widened. The total prevalence has fallen markedly among both sexes in the north over
the last 10 years, but by only 5% for women (2% below the national average for women) compared with
9% for men. Women in the north of England have taken over from Scottish women as the group (according
to geography and gender) with the highest percentage without any teeth (33%), 8% above the national
average for females.
The state of complete dentures in the edentulous elderly
There is likely to be a large discrepancy between the large normative need, reported by most research in
this field, and the perceived need of those who are wearing dentures. Clinical experience seems to show
16

that the two are often poorly matched. Studies on older populations have consistently shown a high
normative need among older adults as a result of denture faults found on examination by a dentist -
(Floystrand, F. et al., 1982; MacEntee, M.I. & Scully, C., 1988; Merelie, D.L. & Heyman, B., 1992;
Srisilapan, P. et a]., 1985), and some studies have reported as few as a tenth to a third of dentures as
satisfactory (Manderson, R.D. & Ettinger, R.L., 1975; Martinello, B.P., 1976; Smith, J.M. & Sheiham, A.,
1980b). However, although the proportion of denture wearers who are disabled or handicapped as a result
of problems with their dentures is high (although the handicap is usually minor), the proportion of those
who seek professional help, the demand, is low (MacEntee, M.I. et al., 1988; Smith, J.M., 1979). The
difference is particularly apparent in institutionalised compared to non-institutionalised populations
(Hoad-Reddick, 0. et aL, 1987). Furthermore, the relationship between complaints about dentures,
satisfaction with dentures and professionally assessed denture quality is not always straightforward.
Although Heyinck and Schaub (1986) found significant correlations between these factors in a small group
of selected denture wearers, the correlations were fairly weak, and the subjects used may not have been
representative of older people generally. In an elderly population the primary objective would seem to be
to address the wearers' satisfaction and problems; normative need may be of limited relevance.
The 1988 Adult Dental Health Survey (Todd, J.E. & Lader, D., 1991) did not include a clinical examination
of complete dentures, but the subjects were asked about denture problems and levels of satisfaction in the
questionnaire. Ninety nine percent of the edentulous reported having complete dentures constructed, but 3%
reported not wearing an upper denture and 6% not wearing a lower denture in the previous four weeks. It
is likely that in most of these cases the denture was rarely or never worn. Among the denture wearers,
reports of problems were commonplace, 10% complaining about aesthetics, 7% about speech problems and
21% reported discomfort on eating. In all 41% had a complaint of some description, although only 11%
had any plans to have something done about it. There were markedly fewer people with problems in the
75+ age group (29%) and fewer of them were dissatisfied with their dentures (6% compared to an overall
population mean of 10%).
17
Fewer females reported problems than males, but different social groups showed no consistent patterns. In
general though, dentures made under the National Health Service were associated with more problems than
private dentures. One important finding was that those who had been edentulous for longest tended to report
the fewest problems.
The implications of this relationship between denture problems and wearing experience are important in the
context of an increasing proportion of the population retaining natural teeth into old age. This trend has
been seen by many to be desirable, but if all that is happening is the delaying of the need for complete
dentures into old age, the preservation of a natural dentition may be counter productive. Research into the
age related changes of the oral musculature suggest that the muscle bulk and precision of muscle
contraction, and hence perhaps the ability to control dentures and to adapt may diminish with age (Newton,
J.P. et al., 1987; Yemm, R. et al., 1985). Whilst the current oldest group (the 75+ group in 1988) report
fewer problems than their younger counterparts, this may be a reflection of the denture wearing experience
of this group. The next generation may be less fortunate. If late onset tooth loss becomes a significant
problem the potential for increased morbidity and reduced quality of life will increase in parallel.
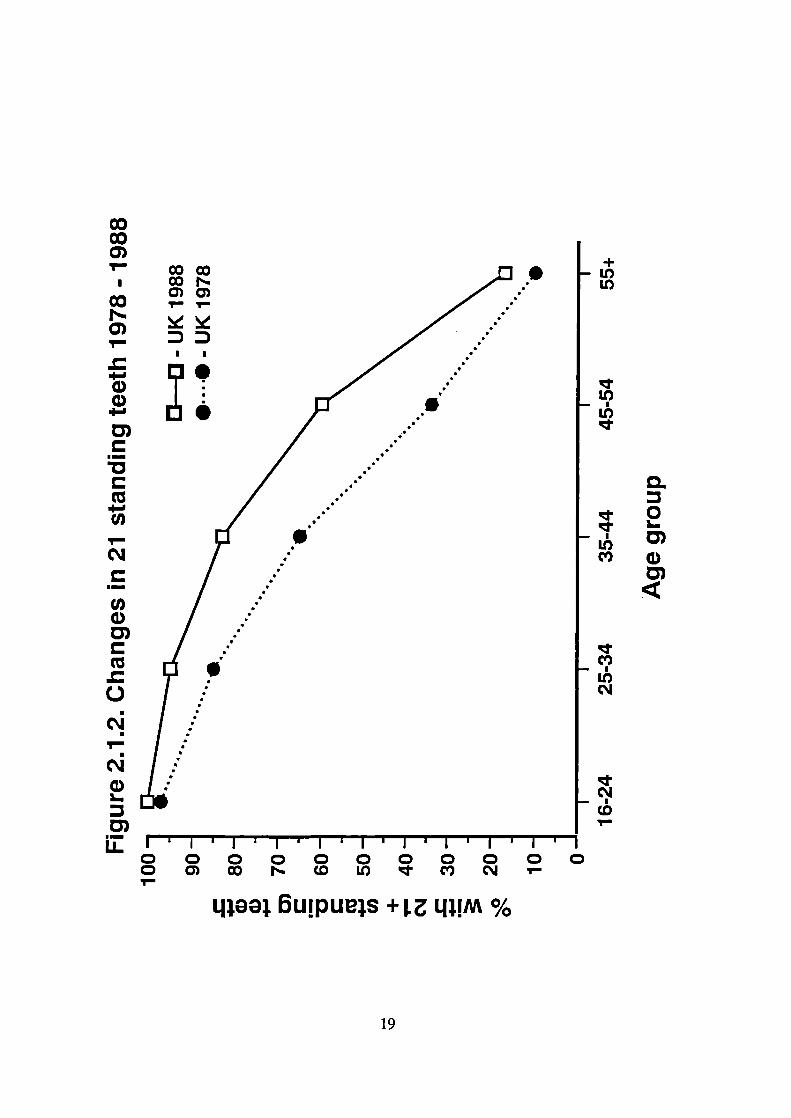
2.1.3. The number of standing teeth and the replacement of missing teeth in the UK adult population
and the relationship with age, gender, geography and social factors.
Section 2.1.2. showed that age, geography, social class, and to a lesser extent gender are important
influences on the prevalence of edentulousness in the UK population. These may also influence the
proportion of the population with a "functional" dentition. For the purposes of analysis the figure used to
represent a "functional dentition" in the 1978 and 1988 adult dental health surveys was 21 or more standing
teeth. This cut off point is rather arbitrary but, if the number of teeth alone is to be used as the means of
analysis, 21 teeth is probably reasonable (see section 2.3). As in the last section all data presented here are
derived from the 1988 Adult Dental Health Survey (Todd, J.E. & Lader, D., 1991) and previous British
national surveys conducted in 1968 and 1978 (Gray, P.G. et al., 1970; Todd, J.E. et al., 1982).
18
CoCoC)
CoN.C)1
.
C)C)
D)
..
Cl)
c'1
Cl)C)D)
0
C)
D).Iz
+
LI)
Ic)LI,
0.
0
It) D)
CV)
C)C)
C
LI,CJ
CD1
001
..
o 0 0 0 0 0 0 0 00) F CD LO CV) CJ
LflOOj 6upuejs + LflM %
0
19

The influence of age is important. In 1988 the proportion of UK adults with 21 or more standing teeth
drops from 100% in the youngest adults (16-24) down to 3% of all those in the 75+ age group. The change
is most rapid in those aged 45 years or over. When looked at in isolation it would seem that the period of
life when most people are likely to become reliant on some sort of prosthetic replacement is in late middle
and old age. However, with the benefit of figures from the previous (1978) survey (Todd, J.E. et al., 1982)
it has been possible to examine the trends in each individual cohort. This shows that the rate of loss of
subjects from the 21+ standing teeth group in any of the ten year age bands who were 25-64 in 1988 had
been between 2% and 5% over the previous ten years (see figure 2.1.2.). As is the case for edentulousness,
the apparent effect of age is not only a reflection of progressive loss of teeth with increasing age, but is in
large part historical, and the number of people who are currently losing teeth to take them below the 21
tooth threshold is small. It is possible to attempt to predict the changes over the next 30 years or so by
extrapolating recent trends. For the 55-64 year old age group this would be predicted to result in 84% of
adults having 21 or more teeth in 2018, compared to the 1988 statistic of 30%. For the older age groups
(65+) there will probably be similar increases, but projections for the over 65 year olds based on figures
for the younger groups may be unsafe in view of additional dental considerations of relevance to older
adults (e.g. an increased risk of root caries, perhaps changed treatment preferences or a reduced ability to
pay for restorative dental work).
When the number of missing teeth is used as a measure, similar age related trends are illustrated. The oldest
cohorts are losing teeth more rapidly than those in the younger groups. Those between 55 and 64 years in
1988 had lost on average 2.9 teeth in the last 20 years, compared with figures of 2.0 and 1.4 for the 45-54
and 35-44 age groups respectively. While tooth loss may be more frequent in older adults, the changes
described above are not just age related. There is strong evidence that the tooth loss experienced by any
age cohort between 1978 and 1988 was considerably less than that experienced by people of the same age
10 years previously.
The effect of gender on the proportion of the population with 21+ standing teeth is negligible, but
geography, social class and dental attendance pattern are more important. Concentrating solely on the
20

current generation of older adults (55+) the North of England was well behind the South in 1988, with 42%
of dentate adults having 21+ standing teeth compared to 51% in the south. Looking at the younger age
groups there are signs of this difference being diminished. Social class according to occupation of the head
of the household demonstrates a surprisingly minor influence among older dentate adults. There are no real
differences between the proportions of those from non-manual backgrounds and those from unskilled
manual backgrounds who have 21 or more standing teeth, nor are there any large differences in the mean
number of missing teeth. In the current generation of older adults, social class seems to be related to the
prevalence of edentulousness, but not to the number of teeth that are present.
Dental attendance patterns are closely correlated with the proportion of adults with 21 or more standing
teeth, and this is true for all age groups, including the elderly. Even in the 75+ age group 18% more regular
attenders have 21 or more standing teeth compared with those who attend only with trouble. It is interesting
though that 11% of the dentate adults aged over 75 years have managed to keep more than 21 standing
teeth for most, if not all of their life without regular dental visits.
The figure of 21 standing teeth is a rather arbitrary one and its relevance in terms of dental function will
be discussed in section 2.3., but for the UK population it does seem to be an important watershed for the
reliance on a combination of natural teeth and dentures. Only 5% of those with 21 or more standing teeth
in 1988 wore a partial denture. Of those dentate adults with less than 21 standing teeth, 78% wore some
sort of a denture, and while the prostheses concerned may in some cases have been a single complete
denture (e.g. a complete upper denture opposing natural lower teeth), a high proportion will have been
partial dentures.
2.1.4. The state of the crowns of the teeth in older adults
Decay of the crown of the tooth is a common disease. In 1988 the UK Adult Dental Health Survey showed
that only 8% of the adult population had no fillings, and it is almost certain that at least some of those
without fillings had some carious teeth or teeth lost because of caries. Primary caries affecting the crown
21

of a tooth for the first time appears to be less common in older adults than in children and young adults,
but this may be because in the current generation of middle aged and elderly people the most vulnerable
sites have been restored early in life. Such restorations may have to be replaced many times during a
lifetime. With every replacement comes further destruction of sound tooth tissue and with it the possible
threat to pulp vitality, tooth strength and possibly aesthetics. Consequently, while new coronal caries may
not be a major problem in the elderly, the potential for restorative treatment among older adults with a past
history of caries is large as teeth and restorations crumble and need to be restored. Once again, all of the
data in this section are derived from the 1988 Adult Dental Health Survey (Todd, J.E. & Lader, D., 1991).
Teeth with sound and unfilled coronal surfaces in older adults in the UK in 1988
The number of sound teeth unaffected by dental caries gives some impression of the impact of dental caries
in a population. In 1988 the mean number of sound teeth in the 55+ age band was 9.4, compared with 21.2
for the 16 - 24 year old age groups. With improving oral health, this statistic is of limited value as it tells
us little of the trends taking place in dental health. The number of sound untreated teeth in any given age
band has actually increased between 1978 and 1988 (i.e. fewer are being filled or extracted in each
successive age group), so the 45-54 year olds of 1988 had more sound teeth than the 45-54 year olds of
1978. However, if one follows through the young and middle aged groups of 1978 to 1988 (for example
comparing the 45-54 year olds of 1988 with the 35-44 year olds of 1978), the loss of sound teeth for any
given age group was between 0.6 and 0.9 teeth per person over the ten years. There has been a sharp
increase in the proportion of the total population with 18 or more sound teeth between 1978 and 1988 from
25% to 35%. This increase is only occurring in the young and to a lesser extent, middle aged group: the
over 55's showed no change in this statistic at all (fixed at around 8%), although the mean number of sound
teeth increased slightly.
Overall, males (38%) are more likely than females (32%) to have retained 18 or more sound and untreated
teeth, and men have on average about one more sound tooth than women. These differences are not
applicable to the 65+ age band where the women are slightly better off than the men.
22

The relationship between the number of sound and untreated teeth and social class is interesting. The pattern
of dental health (as measured by edentulousness or the number of teeth), which generally shows more teeth
in the non-manual groups than in the unskilled manual groups, is reversed. Dentate people from unskilled
manual backgrounds have, on average, more sound teeth than those from non-manual backgrounds and 8%
more of the population from unskilled manual backgrounds have 18+ sound teeth. These differences are
particularly evident for the 65+ age group where 13% of unskilled manual workers had 18+ sound,
untreated teeth compared to just 1% of their non-manual counterparts. The reasons for such variation are
no doubt complex, but may in large part reflect attendance and treatment patterns in these two groups. The
figures for the number of sound teeth according to dental attendance pattern give some support to this, with
38% of irregular attenders having 18+ sound teeth compared with only 29% of regular attenders.
Geographical variations in pattern also occur; Scotland and Northern Ireland stand out as areas where the
mean number of sound teeth and the proportion of the population with over 18 standing teeth is much lower
than the national average (see table 2.1.6.). The north and the south of England also demonstrate unexpected
differences. The 65+ year old age groups are different from the population as a whole, and no-one in the
65+ age category in the north of England had 18+ sound teeth. The statistics for these sub-groups must be
treated with caution as the total number of cases involved are rather small.
Table 2.1.6.. Geographical variations in the number of sound and untreated teeth in U.K. adults in 1988(Todd and Lader 1991).
UK Scotland N.Ireland N.England S.England
% with 18^ sound teeth 35 26 25 41 33
% (65+) with 18+ sound teeth 5 0 7 0 6
Mean no. standing teeth 14.8 13.0 12.6 15.3 14.5
Mean no. standing teeth (65+) 8.2 8.0 7.5 6.9 8.4
23

Teeth with filled but otherwise sound coronal surfaces among older UK adults in 1988.
The number of filled teeth is not without problems as a measure of caries experience. The filled statistic
is a reflection of dental attendance, treatment patterns and of cultural attitudes (both patients' and dentists')
as well as of caries experience and differences in diagnosis of the disease.
The 1988 adult dental health survey shows that 31% of all adults had 12 or more filled teeth and the mean
number of filled teeth for the population was 8.4 teeth per person. The pattern with age shows a broad peak
in the 25-54 age bands with a sharp drop off in the under 25's and the over 55's. Figure 2.1.3. shows that
this peak, with the current middle aged groups, is getting gradually larger. At present the older adults have
a rather low proportion of the total number of filled teeth. However, if the trends towards a gradual
accumulation of filled teeth, currently affecting the 25-54 year olds, continue for the next 20 or 30 years
we are likely to see a large increase in the number of filled teeth in older adults. In the younger group there
is a dramatic reduction in the number of filled teeth in those born in 1965 or after and this presumably
reflects a genuine reduction in (or perhaps a delay in manifestation of) dental caries. The plateau shown
in figure 2.1.3. will not reduce until the heavily filled middle-aged generation of today die off and are
replaced by the relatively dentally healthy population, currently under 30 years.
The quoted statistics seriously underestimate the scale of the change because they are calculated as a
proportion of the dentate sample, but the proportion of those who have some standing teeth is rapidly
increasing among the middle aged and is starting to increase in the elderly. Figure 2.1.4. calculates the mean
number of filled teeth per 100 of the total sample, taking into account the differences in the size of the
dentate population at any age (mean number of filled teeth x percentage dentate) to give a more meaningful
indication of the impact which these trends are likely to have on the provision of dental care to the elderly.
At present there are over three times as many filled teeth in the 35-44 age band as there are in the over
55's. If current trends continue in the way they did between 1978 and 1988, which is likely but by no
means certain, the increase could be four-fold by the time the current middle aged become elderly.
Restorations generally have a limited life expectancy, so the future need and demand in the older age
groups, just for maintenance of existing restorations, has the potential for a substantial increase. Of course
24

1100
1000C)a 9000
800
00
. 600
500
400
D 300C)
200
100
0
Cu
0100
Figure 2.1.3. Mean number of filled teeth by age
D-D-1988
S.....S-1978
16-24 25-34 35-44 45-54
55+
Age group
Figure 2.1.4. Filled teeth per 100 people
D-D-1988
OQ-1978
0' i I I I I
16-24 25-34 35-44 45-55 55+
Age group
25

this calculation does not take into account demographic trends towards an ageing population, nor the
additional dental problems arising from the age of the dentition or complicating medical or dental
influences, all of which will tend to increase the treatment need further.
In addition to age related and cohort differences, the number of filled teeth also demonstrate gender, social
and geographic variations. In the population as a whole, women are more likely to have more than 12 filled
teeth than men (34% to 28%) and women have on average one more filled tooth than men. Unskilled
manual workers have, on average, three fewer filled teeth than non-manual workers. As with the number
of sound teeth, this is probably in part related to dental attendance pattern; regular attenders have nearly
twice as many filled teeth as irregular attenders. Geographical variations are again evident, with the lowest
number of filled teeth in Wales, the Midlands and the North of England, and highest numbers in the South
of England. This is likely to be a reflection of a combination of socio-dental, cultural and local treatment
factors rather than an actual difference in caries experience. All of these trends are evident in all age groups,
including older adults (see table 2.1.7.).
Table 2.1.7.. Mean number of filled teeth and the percentage of teeth which were filled in different gender,geographical, social and attendance groups in UK adults in 1988 (Todd and Lader 1991).
Males Females North of South of Non- Unskiffled Regular Irregular
England England manual Manual Attender Attender
Mn. no. of ifiled teeth 7.9 8.9 7.8 9.1 9.5 6.5 10.4 5.8
Mean number of teeth 24.4 24.1 24.4 24.5 24.8 23.4 24.9 22.4
% of teeth filled 32% 37% 32% 37% 38% 28% 42% 26%
Teeth with decayed or unsound coronal surfaces in older adults in the U.K. in 1988
Studies of relatively untreated populations show that dental caries is active throughout life, on crowns as
well as roots (Manji, F. et aL, 1989). In the three Adult Dental Health Surveys conducted from 1968 to
1988 the mean number of decayed or unsound teeth has reduced from 2.2 per dentate person down to 1.0,
with this trend present in all age groups (Gray, P.O. et al., 1970; Todd, J.E. & Lader, D., 1991; Todd, J.E.
& Walker, A.M., 1980; Todd, J.E. et al., 1982). There is almost no difference in the mean number of
26
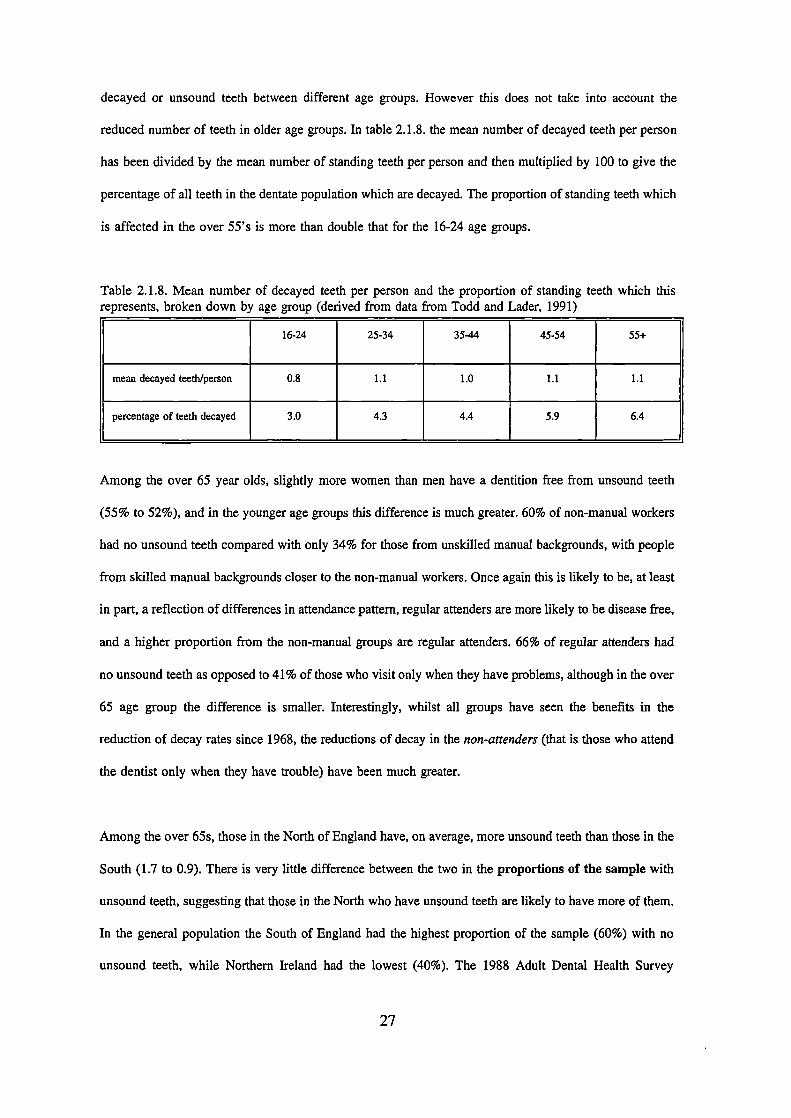
decayed or unsound teeth between different age groups. However this does not take into account the
reduced number of teeth in older age groups. In table 2.1.8. the mean number of decayed teeth per person
has been divided by the mean number of standing teeth per person and then multiplied by 100 to give the
percentage of all teeth in the dentate population which are decayed. The proportion of standing teeth which
is affected in the over 55's is more than double that for the 16-24 age groups.
Table 2.1.8. Mean number of decayed teeth per person and the proportion of standing teeth which thisrepresents, broken down by age group (derived from data from Todd and Lader, 1991)
16-24 25-34 35-44 45-54 55-i-
mean decayed teeth/person 0.8 1.1 1.0 1.1 1.1
percentage of teeth decayed 3.0 4.3 4.4 5.9 6.4
Among the over 65 year olds, slightly more women than men have a dentition free from unsound teeth
(55% to 52%), and in the younger age groups this difference is much greater. 60% of non-manual workers
had no unsound teeth compared with only 34% for those from unskilled manual backgrounds, with people
from skilled manual backgrounds closer to the non-manual workers. Once again this is likely to be, at least
in part, a reflection of differences in attendance pattern, regular attenders are more likely to be disease free,
and a higher proportion from the non-manual groups are regular attenders. 66% of regular attenders had
no unsound teeth as opposed to 41% of those who visit only when they have problems, although in the over
65 age group the difference is smaller. Interestingly, whilst all groups have seen the benefits in the
reduction of decay rates since 1968, the reductions of decay in the non-attenders (that is those who attend
the dentist only when they have trouble) have been much greater.
Among the over 65s, those in the North of England have, on average, more unsound teeth than those in the
South (1.7 to 0.9). There is very little difference between the two in the proportions of the sample with
unsound teeth, suggesting that those in the North who have unsound teeth are likely to have more of them.
In the general population the South of England had the highest proportion of the sample (60%) with no
unsound teeth, while Northern Ireland had the lowest (40%). The 1988 Adult Dental Health Survey
27

separated out the different categories of 'unsound" teeth in the various age bands. The one striking
difference between the over 65s and the rest is the much higher proportion of decayed teeth which were
coded as 'unrestorable, accounting for 15% of all unsound teeth in the 65+ age group, three times the
figure for the total population.
2.1.5. Root caries in older adults
Root surface caries is a decay process which begins on root cementum or dentine exposed to the oral
environment. Many aspects of its pathology are poorly understood, but it seems that, although the basic
processes are similar to those for coronal caries, the location and mineral composition of the tissues
involved may lead to differences in chemical behaviour (Mellberg, J.R., 1986) and the vulnerability to
microorganisms (Jordan, H.V., 1986).
Inherent in any definition of root surface caries is the availability of vulnerable sites. The exposure of the
vulnerable root surface is as a result, one way or the other, of periodontal disease. Root caries is therefore
unusual among dental or oral disease in that its development is dependent on another, separate, disease
process. Periodontal attachment loss is largely irreversible, and so the tendency is for this to increase with
the age of the tooth. Consequently, root surface caries is also likely to be age related. A number of other
factors of specific relevance to the elderly, for example altered salivary flow or composition, may also
contribute to the problem. It has been suggested (Katz, R.V., 1984) that root surface caries is the
commonest type of dental caries in the elderly, and recent work in a population of U.S. men has shown
dental caries to be the commonest cause of tooth loss in older age groups (Chauncey, H.H. et al., 1989;
Niessen, L.C. & Weyant, R.J., 1989). Therefore root caries is likely to be a significant cause of tooth loss
in the older patient.
Root surface caries is microbiological in origin and involves demineralisation of the cementum or dentine
by acids produced from fermentable carbohydrate by acidogenic plaque bacteria. Dentine and cementum
have a much lower mineral content than enamel, and the decay process is likely to be one of
28

be one of dernineralisation, rather than proteolysis although this issue is not resolved (Hoppenbrouwers,
P.M.M. et al., 1987). Although root surface caries has a microbiological basis, the organisms responsible
are uncertain. Jordan (Jordan, H.V., 1986) considered that, because there is no need to break down a
resistant enamel barrier, the range of organisms which are capable of an active role in root surface caries
is likely to be wider than for coronal caries. Actinomycosis viscosus, Streptococcus mutans, Lactobacilli
and yeasts have all been associated with root caries, but which, if any, plays a causative role is still
unknown. Fermentable carbohydrates also appear to play an important part in the development of root
surface caries. Animal experiments and human studies have generally shown strong associations between
the presence and number of root caries lesions and high sugar diets (Gustafsson, B.E. et al., 1954; Hix, J.O.
& O'Leary, T.J., 1976; Jordan, H.V., 1986).
Root caries in U.K. and abroad - relationship with age, gender and social factors
Root surface caries was recorded for the first time in a UK national dental survey in 1988. Although it is
not clear what proportion of the population are affected by root surface caries, only 2% of the over 55 year
olds had no exposed roots, in other words almost all older adults are vulnerable to root decay. Both of the
oldest age groups (55-64 and 65+) had on average 1.9 teeth with decayed or filled root surfaces, compared
to less than 1.0 for all age groups under the age of 45. This does not take into account the age related
variation in the number of vulnerable teeth, which magnifies the difference (see table 2.1.9.).
Although there are many published reports of epidemiological surveys of root caries, comparison between
them is almost impossible due to differences in the populations used (very few report a random adult
population), different means of reporting the statistics and variation in diagnostic criteria. This final point
can have a profound effect on the results (Dc Paola et al., 1989). The review which follows attempts to
identify consistent trends rather than compare populations.
Almost all epidemiological surveys to date have shown an age related increase in root caries activity, at
least through the middle aged population. Root caries appears to be rare in the young, but as more root
surfaces are exposed more sites become vulnerable. Banting (Banting, D.W., 1986) observed a relationship
29

with ageing which was more or less linear. This is in contrast to the bimodal age distribution of coronal
caries in the primary and permanent dentitions, where there is a peak of new lesions soon after eruption.
With an increasing proportion of the population retaining some natural teeth in the future it is likely that
the number of root caries lesions will increase markedly. Over sixty percent of the over 65 population of
the U.S. in 1985/86 (NIH, 1987) had one or more decayed or filled root surface.
The increase in root caries with age is not solely related to the increased exposure of surfaces. If the root
caries index (RCI), which takes into account the number of exposed surfaces, is calculated, there is still an
age related increase (Katz, R.V., 1980; Katz, R.V. et al., 1982). This suggests that there are additional
factors at work as people age. Table 2.1.9. shows the national root caries data from the 1988 U.K. Adult
Dental Health Survey with the gross mean figures and the mean number of lesions divided by the number
of vulnerable teeth (Todd, J.E. & Lader, D., 1991). The second statistic corrects for the distorting effect
that tooth loss (which is age related) will have on the mean figures. Both show age related increases, but
both also show a slowing off of the increase in the oldest age bands. This sort of "plateau" effect was also
present in the U.S. national survey, and in a study of a group of over 65 year old people, Beck (Beck, J.D.
et al., 1987) found that only a small part of the variance (2%) was due to age, reinforcing the suggestion
of a slowing down of activity in old age. He proposed a number of possible reasons for this, including
increased mineralisation of older teeth, a reduction in the carious challenge or a reduction of the number
of unrestored sites (due to restoration or extraction). Thompson (1990) in a review of the literature proposed
that it may just be a cohort effect and as different cohorts age, the pattern will change.
Males have consistently been shown to have more untreated root surface decay than women, and in some
studies also a higher RCI, (Beck, J.D. et al., 1987; Fure, S. & Zickert, I., 1990; Heinrich, R. et al., 1990;
Katz, R.V., 1980; Locker, D. et al., 1989; Vehkalhati, M.M. & Paunio, I.K., 1988; Wallace, M.C. et al.,
1988) and this was the case in both the US in 1985/6 (NIH, 1987) and the UK in 1988 (Todd, J.E. &
Lader, D., 1991) national surveys, although the differences were not large. Other authors (Vehkalhati, M.M.
& Paunio, I.K., 1988) attributed this to differences in dental health behaviour, such as toothbrushing.
30

Table 2.1.9. Mean number of decayed and filled root surfaces in U.K. in 1988, with and without taking intoaccount the number of vulnerable teeth.
16 - 24 25 - 34 35 - 44 45 - 55 55 - 64 65+ All
Exposed 0.8 3.2 6.2 8.9 10.2 9.8 5.3
Filled (F) 0.0 0.2 0.6 0.8 1.2 1.2 0.5
Decayed CD) 0.0 0.1 0.2 0.4 0.7 0.7 0.2
D + F 0.0 0.3 0.8 1.2 1.9 1.9 0.7
% exposed teeth decayed 0.0 3.1 3.2 4.5 6.8 7.1 3.7
% exposed teeth decayed 0.0 9.4 12.9 13.4 18.6 19.4 13.2
or filled
The relationship of socio-demographic factors to root caries was examined by Beck (Beck, J.D. et al.,
1987), as part of a multiple regression model of the factors affecting root caries prevalence, but they were
found to make no significant contribution to the model. The 1988 Adult Dental Health Survey (Todd, J.E.
& Lader, D., 1991) did show minor increases in the manual groups compared with the non-manual groups,
but the increased number of decayed roots was offset by an increase in the number of filled roots in the
non-manual workers. This trend is almost certainly a reflection of attendance patterns; regular attenders had
five times as many teeth with filled roots as irregular attenders. Socio-demographic factors appear to be,
at most, only a minor contributor to root caries activity. The mean number of decayed or filled root surfaces
for the over 65s in the US national survey was 3.2, while in the UK the mean number of teeth with decayed
or filled root surfaces was 1.9 (NIH, 1987; Todd, J.E. & Lader, D., 1991).
Despite the growing number of epidemiological studies which are being reported and the development of
a meaningful index, most of the data is presented in terms of mean number of decayed teeth or mean RCI
for various groups. There is little that describes accurately how the disease is distributed in the population.
A total prevalence figure is often given for the population, usually in the order of 60% - 90% in the older
age groups, but this gives no indication whether root caries is evenly distributed throughout the older
population, or whether the majority of the problems are concentrated in a minority of mouths. One
31
exception to this is the study by Fure (Fure, S. & Zickert, I., 1990) which studied three cohorts of older
adults, and found that in the older two groups 20% of the population had 5 or more root caries lesions. This
figure suggests that much of the disease may be concentrated in a subgroup of the population, and if this
proves to be the case universally then this may have important public health implications for the
management of the disease. Identification of at risk individuals and targeting of care and preventive
measures may provide the most cost effective approach to management.
Other factors affecting root surface caries.
A multitude of factors have been reported as having a relationship with root caries prevalence. These
include microbiological, salivary, psychosocial, medical and dental variables in addition to age, gender and
the socio-demographic variables noted above. In discussing the influence, or relationship, of other factors
with root caries it is important to distinguish those which are causal, or which have intervening roles, from
those which are moderators or antecedents but which have no direct role in the aetiology. Banting (Banting,
D.W., 1986) identified specific micro-organisms as causal, while dietary and salivary factors have an
intervening role. Antecedents associated with the disease included root caries and periodontal disease
experience while age and gender were considered as moderators. Of the factors which have been recorded,
several may be of particular relevance to the elderly. Kitamura (Kitamura, M. et al., 1986) found a strong
relationship with the use of drugs causing xerostomia in a group of elderly people. Beck (Beck, J.D. et al.,
1987) found relationships with a spectrum of debilitating diseases, and associated the increase in root caries
prevalence with a general breakdown of health. There are a number of other explanations for this finding,
including greater drug use in the medically compromised population. However, a more recent study of a
group of adults over the age of 55 actually found a reduction in root caries activity in those subjects who
were taking medicines which are known to cause xerostomia, but those who took medications containing
sucrose had significantly raised concentrations of all the implicated microorganisms (Beighton, D. et aL,
1991).
Fluorides have been shown to have a protective effect. Hunt (Hunt, R.J. et al., 1989) observed a
significantly lower incidence of new root caries lesions in long term residents of a fluoridated area,
32

compared to lifelong residents of a non-fluoridated community. This appeared to demonstrate a beneficial
effect of fluoride, even when the exposure started late in life. Other authors have demonstrated significantly
fewer root caries lesions in almost all age- and gender- specific groups (Stamm, J.W. et a!., 1990). In this
case, over 15% fewer of the population of the fluoridated area had root caries experience, and in those with
root caries experience the RCI was 4.71 for the non-fluoridated community compared to 2.31 for the
fluoridated. In vitro work has supported the potency of fluoride in preventing demineralisation of dental
roots (Hoppenbrouwers, P.M.M. et al., 1987).
2.1.6. Periodontal disease in older adults
Periodontal diseases consist of a group of disorders of the periodontium, including gingivitis and various
forms of periodontitis. Although very common, chronic gingivitis is generally non destructive. Prevalence
figures for periodontal disease which includes all inflammation of the periodontal tissues (no matter how
mild) approach 100% (Johnson, N.W. et al., 1988), but the morbidity of the milder forms is negligible.
There is no firm evidence that gingivitis is a necessary pre-requisite for periodontitis, while there is
certainly evidence that in some cases there can be long term gingivitis without progression to periodontitis
(Listgarten, M.A. et al., 1985; Lovdal, A. et al., 1961). Chronic periodontitis on the other hand, is a
destructive and largely irreversible disorder characterised by loss of the tooth's fibrous attachment and
potentially loss of the tooth. It has been fairly widely attributed as the principal reason for tooth loss in
the over 35 year old population in western countries (Douglass, C.W. et al., 1983; Kay, E.J. & Blinkhorn,
A.S., 1986; Reich, E. & Hiller, K.A., 1993). Some authors have cast doubt on this, at least as far as older
adults in some populations are concerned (Chauncey, H.H. et a!., 1989; Niessen, L.C. & Weyant, RJ.,
1989). Whether or not it is the most important cause of tooth loss in older adults, it is clearly a major
reason for loss of teeth in these subjects.
Severe periodontal disease leading to extensive attachment loss is not uniformly distributed through the
population; only a relatively small proportion of people appear to be vulnerable to, and affected by, severe
disease (reviewed in Johnston, N.W., et al, 1988). Furthermore, within these individuals severe disease may
33

only be localised to a few Sites in the mouth (Goodson, J.M. et al., 1982; Socransky, S. et al., 1984). Much
periodontal research has tried to characterise these individuals and sites so that treatment can be targeted
appropriately. Moderate, slowly progressing disease is more widespread, but could in time lead to tooth loss,
particularly in older adults in whom there has been more time for attachment loss to occur. Periodontal
treatment is relatively time consuming, potentially expensive, and successful outcomes cannot be guaranteed.
Consequently accurate and appropriate targeting of resources to the individuals and sites most likely to
benefit (not necessarily the most severely affected) is an important principal.
When considering periodontal disease and the resulting treatment needs of older adults there are some
specific considerations which should be addressed. As the destruction resulting from the disease is largely
irreversible, the overall loss of attachment will be greater than for an equivalent younger population. On
the other hand the potential life of the teeth in older adults is less (it is limited by the years of life
remaining), so even if relatively advanced loss of attachment has occurred, it is the age and rate of
progression which will be the major determinants of treatment need, as well as the loss of attachment to
date. Finally, both the functional requirements of the dentition, and the desire or ability to undergo
prolonged treatment may be reduced and will further influence management.
In this review the distribution of periodontal diseases in the population are described in terms of the effect
of age, gender and social factors. The role of age as a specific risk factor for continuing disease will also
be discussed.
Periodontal Disease in older adults - the influence of age, gender and socio-demographic factors.
Prevalence studies to date make clear that severe destructive periodontal disease is restricted to a relatively
small subsection of the population and within that subsection to a relatively limited proportion of sites
(Johnson, N.W. et al., 1988). This is an important point when considering the results of epidemiological
surveys and their impact on the population. Many studies report mean values for pocket depth or attachment
loss, and this has a tendency to obscure the nature of the problem. As attachment loss is an irreversible
process it would be expected that mean values for attachment loss will tend to increase with age. The size
34
of the proportion of the population who are affected by more severe disease may give a better indication
of the impact of age on periodontal disease, but even this could be a misleading measure as it gives no
indication of the average extent of the disease in individual subjects.
The 1988 U.K. Adult Dental Health Survey (Todd, J.E. & Lader, D., 1991) found that the older age groups
had on average fewer periodontally healthy teeth (without pocketing over 4mm, calculus or bleeding on
probing), even taking into account the number of missing teeth, than younger groups; over half of the over
75 year old age groups had no healthy sextants. The proportion of the over 65 year old population with
some deep pockets (>6mm) stood at 16%, slightly less than the 45-54 year olds (17%) but the significance
of this is difficult to assess as in the older groups there may have been some "natural selection", in other
words some of the most severely affected teeth will have been extracted. Only 12% of the over 75 year
old age groups had some deep pocketing.
The US national survey showed an age related increase in mean attachment loss (NIH, 1987). Forty six
percent of the 'seniors" (over 65 year olds who were drawn from those attending senior citizens' centres)
had some sites with attachment loss of 6mm or more, compared with only 9.5% of the under 65s. The
proportion with deeper pockets (>4mm) dropped off slightly in the oldest age groups from 24% in the 65-69
down to 21% for the 80+ age groups. A number of other prevalence studies have demonstrated similar age
related increases in attachment loss or pocket depth (000dson, J.M. et aL, 1982; Lindhe, J. et al., 1983,
Albander, J.M. et al., 1986; Beck, J.D. et al., 1984; Hugosen, A. & Jordan, T., 1982; Hugosen, A. et al.,
1992). The results were presented differently by Papapanou (Papapanou, P.N. et al., 1988) to give a better
indication of the concentration of disease, indicating more widespread severe loss of attachment in the older
age groups. Forty five percent of subjects over 75 years of age accounted for three quarters of the sites
where attachment loss exceeded 6mm; for the 40 year old age group only 22% of the population accounted
for the same proportion of deep pockets. Okamoto (Okamnoto, H. et al., 1988) found that advanced
attachment loss was experienced more generally by the older population, 25% of their 70-79 year olds had
one or more teeth with >8mm of attachment loss, the figure for 50-59 year olds was only 8%.
35

There is some evidence for changing trends in the distribution of health and disease, at least in some
western populations. Douglass (Douglass, C.W. et al., 1983) noted a marked increase in the levels of
periodontal health (as evidenced by lack of gingival bleeding and calculus) in the US population through
the 1960s and early 1970s, and also a small rise in severe disease. A similar trend has also been noted in
Swedish adults (Hugosen, A. et aL, 1992). This implies that what may appear to be the influence of age
may be confounded by a component of cohort effect; different generations may have levels of disease lower
or higher than their predecessors did at the same age.
Prevalence findings are indications of disease experience, not of current risk. In assessing the potential
periodontal needs of an enlarging dentate population, an individual's dental history is not particularly
helpful. More important is whether there is an increased risk of disease progression or acceleration with age,
and also whether simple clinical variables, of the type collected in epidemiological surveys, can be useful
in identifying the groups at highest risk. Griffiths claimed that clinical variables were of no use in
determining risk (Griffiths, G.S. et al., 1988). Nevertheless, a number of studies have noted age as a risk
factor for disease progression (Buckley, R.A. & Crowley, M.J., 1984; Halazonetis, T.D. et al., 1989; Locker,
D. & Leake, J.L., 1993; Papapanou, P.N. et al., 1989). Locker used a ten year radiographic follow up of
a cohort of patients and found that those patients who were over 70 at the beginning of the study underwent
the greatest longitudinal bone loss (Locker, D. & Leake, J.L., 1993). Albander (Albander, J.M. et al., 1986)
found that the rate of destruction increased with age but levelled off in the oldest adults (56+). The sample
used in that study was less selective in terms of dental history than those used by some later workers
(Grbic, J.T. & Lamster, I.B., 1992; Grbic, J.T. et al., 1991; Papapanou, P.N. et al., 1989) and it is likely
that loss of affected teeth was an important confounding factor.
More recent work took a sophisticated statistical approach to assess the problem of risk. Over a six month
period change in attachment levels were recorded and related to various patient and site variables (Grbic,
J.T. & Lamster, I.B., 1992; Grbic, J.T. et al., 1991). Eighty nine percent of 60-69 year olds showed some
clinical loss of attachment, compared to only 30% of 30-39 year olds. After the patient's mean attachment
loss, age was the most important risk factor for continued attachment lpss. In addition some types of sites
36

in some types of mouths were at greater risk than others. The implications of the results were that shallow
sites in cases of severe disease in younger adults were at high risk, but in the older groups, moderate to
deep sites were generally at greater risk of progression than in their younger counterparts. Using this type
of information (age, previous attachment loss, site) to predict the likely progression of disease could be a
useful approach for the elderly, both at an epidemiological and at an individual level, although it is
insufficiently developed at the moment.
All of the evidence to date indicates that attachment loss correlates with age, but does not indicate whether
any of this relationship is a direct result of the ageing process. Research on animal models suggests that
there are ageing changes which affect all of the tissues of the periodontium (van der Velden, U., 1984).
However separating out true age changes from changes due to long term exposure to plaque is extremely
difficult in a human population. Abdellatif (Abdellatif, H.M. & Burt, B.A., 1987) and Papapanou
(Papapanou, P.N. et al., 1991) investigated this question differently, but both came to the same conclusion,
that the relationship between age and attachment loss is plaque related and not an age change in itself.
Findings, such as those by Löe (Löe, H. et al., 1978) and Lindhe (Lindhe, J. & Nyman, S., 1984), where
little or no long term attachment loss occurred where plaque control was excellent, tend to support this
conclusion. Changes in plaque composition or the response of the periodontium to plaque may well account
for some of the age related changes which have been reported in the epidemiological studies described
above (van der Velden, U., 1984). It has also been proposed recently that passive eruption, rather than
plaque related factors, may be responsible for some of the loss of attachment seen with age (Hirsch, R.S.
& Clarke, N.G., 1993).
Compared with age, gender differences in periodontal disease are relatively small. In the 1988 Adult Dental
Health Survey (Todd, J.E. & Lader, D., 1991) more males had deep pockets (12% to 9%) and also more
males had calculus and shallow pockets, and more sites with each of these conditions; this could be related
to the fact that males also tend to have more teeth. Women had slightly more healthy teeth (12.9 - 12.2).
In the seniors group in the US national survey (NIH, 1987) there were similar differences between genders
with males having more bleeding sites, sites with calculus and sites with attachment loss and over 0.4mm
37

more attachment loss on average than females. There was almost no difference in the mean pocket depth
between the two. Grbic (Grbic, J.T. et aL, 1991) did not find gender to be a significant risk factor in his
selected population of periodontal disease sufferers, and Locker (Locker, D. & Leake, J.L., 1993) did not
list gender as a consistent independent risk. It may be that the differences observed are as the result of
behavioural variation between the two sexes.
In the 1988 UK Adult Dental Health Survey socio-demographic variables were cross tabulated with
measures of periodontal disease. While the families of more non-manual workers generally had healthier
periodontal tissues, less calculus and fewer shallow pockets than unskilled manual workers, the proportion
with deep pockets (>6mm) hardly varied between the groups (at 10 - 11%). The factor which appeared to
have the strongest relationship with the proportion of the population with deep pockets (other than age) was
attendance pattern. Thirteen percent of those who attended only with trouble had deep pockets. Regular and
occasional attenders had lower proportions (9% and 8%) with deep pockets, as well as more completely
healthy mouths (full mouth CPITN scores of 0) (Todd, J.E. & Lader, D., 1991). Locker (Locker, D. &
Leake, J.L., 1993) did not rate socio-economic group as a risk factor, but educational background was
found to be a consistent factor.
CPITN as a measure of periodontal disease in the elderly
The community periodontal index of treatment need (CP1TN) is used widely for the measurement of
periodontal disease in populations, although it is not the only means of measurement (Carlos, J.P. et al.,
1986; NIH, 1987). It is based on a hierarchical system of recording where bleeding sites, calculus, moderate
(4-5mm) and severe pocketing (6mm or greater) are scored and represent different levels of disease or
(correctly), treatment need (Ainamo, J. et al., 1982). The whole mouth or specific index teeth can be used
to calculate the CPITN scores. The validity of the partial recording system for CPITN has been questioned
(Baelum, V. et al., 1993a). There are also concerns about the validity of the assumptions which underpin
the hierarchical system, which have been shown to be frequently untrue (Baelum, V. et al., 1993b). There
are additional, theoretical, problems about the use of the index in populations of older adults. These are
specifically associated with the index's use only of pocket depth, and not of attachment loss, as a measure
38

of periodontal disease. Many older adults may have extensive loss of attachment in association with gingival
recession but, without pocketing, this would not be detected using CPITN. Furthermore, tooth loss may well
lead to difficulty interpreting the results of CPITN as these are often reported as the number sextants
affected by a given condition. Where several sextants are missing (as will be frequently the case in elderly
subjects) the interpretation may be less straightforward. Other questions about the appropriateness of CPITN
are associated with its relevance to the real needs of older adults, given their greater age and generally
larger disease experience. The most appropriate periodontal index for older adults is an area which requires
further investigation.
2.1.7. Tooth wear in older adults
Tooth wear is a general term which can be used to describe any non-carious wear of the teeth, regardless
of aetiology, and it encompasses three processes (Robb, N.D., 1992):
Attrition - tooth wear as a result of tooth to tooth contact
Abrasion - physical wear of the teeth by an object other than the teeth.
Erosion - The loss of tooth substance by a chemical substance, not involving bacterial action.
Much of the dental literature on tooth wear is made difficult to interpret by poor definitions and variation
in terrriinology. Furthermore work by Eccles (Eccles, J.D., 1982) and Smith (Smith, B.G.N. & Knight, J.K.,
1984a) has led to a greater appreciation of the interaction of these three different processes. Attrition,
abrasion and erosion frequently co-exist and may all contribute to tooth wear in any given case. The
importance of tooth wear to the growing population of older adults is, as yet, uncertain. As the wear of
teeth is an irreversible process, and a certain amount of wear can be considered as functionally normal, it
follows that the older the teeth, the more worn they are likely to be. However, the treatment of severely
worn teeth has the potential to become complex and consequently expensive (Watson, I.B. & Tulloch, E.N.,
1985). The question which needs to be addressed would then seem to be related to what proportion of older
adults are disadvantaged by tooth wear. In many cases where there is an underlying problem likely to lead
39

to severe wear, the required dental treatment will have been carried out before the person gets "old'. The
treatment need for these people as they become old is not going to be the management of a primary wear
problem, but the maintenance of existing restorations.
Tooth wear in older adults. The influence of age, gender and social factors.
Studies of the prevalence of tooth wear in the population are rare. Many of those which have been
conducted relate to either attrition or abrasion or erosion, but not to tooth wear as a composite problem.
Hugosen (Hugosen, A. et al., 1988), studying a population of 20 to 80 year olds, found attrition to be more
frequent in the older age group, with 77% of 80 year olds affected compared with 65% of 20 year olds.
Abrasive lesions, resembling toothbrush abrasion, have also been found to be more common among older
adults (76% affected) compared to younger ones (42%) (Kitchen, P.C., 1941). These prevalence figures fit
well with the statistics published by Ervin (Ervin, J.L. & Bucher, E.M., 1944) and Hand (Hand, J.S. et aL,
1986) showing 56% to 66% of the total population affected by the same types of lesion. Donachie
(Donachie, M.D., 1992) and Robb (Robb, N.D., 1992) considered all forms of tooth wear as a composite
entity in their samples of English adults, and found an increase with age, although in the former study this
was only evident on functional surfaces.
The 1988 Adult Dental Health Survey (Todd, J.E. & Lader, D., 1991) investigated wear of the root surfaces
(but not the coronal surfaces) along with the examination for root surface caries and restorations. A
population mean of 0.8 worn teeth per person was found, but the age differences were substantial, with the
65+ group having on average 2.4 worn teeth compared with only 0.1 for the youngest group. The statistics
presented here probably slightly underestimate the true prevalence of wear of the cervical surfaces as filled
surfaces were not included, in some cases these will have been restored as a result of wear. Gender and
social class appeared to have no strong relationship with root surface wear. However, attrition of functional
tooth surfaces has been found to be greater in men in a number of studies (Hand, J.S. et al., 1987; Hugosen,
A. et al., 1988; Poliman, L. et al., 1987; Donachie, M.D., 1992). Robb (Robb, N.D., 1992) found that the
pattern of wear was also gender dependent.
40

Tooth wear - Other aetiological factors
Many factors have been implicated in the causation of tooth wear, including diet, specific medical problems,
bruxism and other parafunctional habits, toothbrushing and tooth loss (Pu, D.R., 1940; Holloway, P.J. et
al., 1958; Pavone, B.W., 1985; Robb, N.D., 1992; Robb, N.D. & Smith, B.G.N., 1992). The cumulative
effect of age has already been discussed, but few other factors are of relevance specifically to an elderly
population. The possible exceptions to this are relationships between wear and a reduced number of teeth,
and to certain medical conditions which may be more common in the elderly than in certain other groups.
A number of studies have investigated the relationship of tooth loss to tooth wear. It is frequently assumed
by clinicians that loss of teeth will result in a greater occiusal load on the remaining teeth and hence more
rapid wear of those remaining. The evidence from studies on this subject is contradictory. At least one study
finds in favour of the assertion (Ekfeldt, A. et aL, 1990), whilst several others could find no evidence for
such an association (Hand, J.S. et aL, 1987; Poynter, M.E. & Wright, P.S., 1990; Robb, N.D. & Smith,
B.G.N., 1992).
Specific medical conditions which may predispose to wear include eating disorders, gastric regurgitation
associated with various gastro-intestinal complaints, chronic alcoholism and possibly diabetes (Jarvinen, V.
et aL, 1988; Robb, N.D., 1992; Robb, N.D. & Smith, B.G.N., 1990; Smith, B.G.N. & Robb, N.D., 1989).
Of these, eating disorders are more or less non-existent in elderly populations (Crisp, A.H. et aL, 1976) and
the role of gastric regurgitation, which may be common in older adults due to pathology such as hiatus
hernia, has not been extensively investigated, although there is some evidence to support its relevance
(Howden, G.F., 1971; Myllarniemi, M. & Saari, I., 1985). Chronic alcoholism has been shown to increase
tooth wear although the mechanism is uncertain (Robb, N.D. & Smith, B.G.N., 1990; Smith, B.G.N. &
Robb, N.D., 1989), but this is a problem which affects all age groups in the population including the elderly
(Christen, A.G., 1983). Diabetes mellitis type 1 (insulin dependent diabetes) has also been linked with tooth
wear, but the relationship is not strong (Robb, N.D., 1992).
41

2.1.8. Temporo-mandibular dysfunction in older adults
Dysfunction of the temporo-mandibular joint and its associated structures can manifest in a number of ways,
from severe chronic pain around the joint, with associated headaches, trismus or locking of the joint, to the
mildest muscle tenderness or the most gentle click. Theoretically all of these would register as dysfunction
at least using the most commonly applied epidemiological indices. In an elderly population it is important
to try and keep these problems in perspective. Against a background of more serious illness or disability,
slight tenderness of the lateral pterygoid muscle, or a minor click are of minimal relevance. Joint symptoms
are only likely to be of importance if they cause pain or discomfort or interfere with normal function in a
large proportion of the population. A multitude of prevalence studies of temporo-mandibular dysfunction
have been reported. These have been reviewed by Carlsson (Carlsson, G.E., 1984) and De Kanter (De
Kanter, R.J.A.M., 1990). The prevalence of dysfunction depends on what is actually measured. In general,
objective clinical findings such as muscle tenderness to palpation, deviation and limited opening occur more
frequently (20 -88%) than anamnestic or reported symptoms (11 - 58%) (De Kanter, RJ.A.M., 1990).
Temporo-mandibular dysfunction is generally perceived to be a problem of younger adults, and some
studies have shown a reduction with increasing age. However the relationship with age also depends on
what has been measured. Clinical measures have been found to be fairly stable with age while reported
severe symptoms showed a general slight decrease with advancing age from a peak in the 20s and 30s (Dc
Kanter, R.J.A.M., 1990).
Only a small number of studies have looked exclusively at older adults. Heloe (Heloe, B. & Heloe, L.A.,
1978) investigated a random sample of 65-79 year olds. Eight percent reported recent pain, but the actual
question used in the study referred only to pain in recent years, so the scope for misunderstanding was high.
Clicks and crepitus were reported by 14% of the group and overall there were twice as many females who
reported symptoms as males. Osterberg (Osterberg, T. & Carlsson, G.E., 1979) reported on a cohort of 70
year olds. According to Helkimo's Index (Helkimo, M., 1974) 46% of the subjects reported severe
symptoms of dysfunction, while 37% showed clinical signs of moderate or severe dysfunction. However
there must be some question of the validity of these data. The questions used in this survey asked about
42

pain in the teeth or jaws when chewing, and ability to open wide to take a large bite. There are multiple
reasons why a positive response may be obtained in answer to these questions, quite separate from
dysfunction of the temporo-mandibular joint. Well under 10% demonstrated clinical signs of severe
dysfunction. In another study on a convenience sample of dental hospital patients over the age of 65, only
2% reported actual joint pain, although over 20% reported pain on chewing (Budtz-Jorgensen, E. et al.,
1985). Once again this latter finding is probably more to do with denture or dental problems than temporo-
mandibular dysfunction.
The 1988 UK Adult Dental Health Survey recorded symptoms of pain, clicking or locking of the temporo-
mandibular joint. All were slightly more common in the younger age groups. Both pain and locking only
affected 3% of the over 56 year old population, while clicking was reported by only 9%. As with other
studies, women were affected slightly more often than men (5% compared to 3% with pain) (Todd, J.E.
& Lader, D., 1991).
2.1.9. Soft tissue pathology and dry mouth in older adults
Pathological lesions of the oral soft tissues constitute a very varied group, from the common to the
extremely rare and from those which are almost inevitably fatal to others which are so mild as to be
fringing on the limits of normality. Only those which are serious (i.e. associated with high mortality or
morbidity) and those which are both common and uncomfortable, and present a therapeutic difficulty,
constitute a public health problem. Oral cancers and precancers are potentially fatal and occur more
commonly in the older age groups, although they are generally rare. Dry mouth is fairly common in the
elderly, and can cause considerable problems, particularly in people who retain some natural teeth, so is
likely to be an escalating concern as an increasing proportion of the elderly retain their teeth. Denture
related pathology is rather common in denture wearers and is consequently a problem in the current elderly,
although its impact is relatively minor. A wide variety of other soft tissue lesions may occur in the elderly,
but are generally uncommon and do not constitute a major public health problem. These include oral
manifestations of a variety of systemic disorders, particularly dermatological diseases such as lichen planus
43

and bullous lesions, as well as a few specific oral lesions which are uncommon (e.g. salivary tumours) or
benign and generally symptomless (e.g. geographic tongue).
Oral cancers and precancers
Cancer of the mouth and pharynx is thought to be globally the fourth most common cancer in men and the
eighth most common in women. The geographical variation in prevalence is enormous and the pattern of
site involvement is complex, with certain sites being much more commonly affected in some populations
(Smith, C.J., 1989). Generally males are more frequently affected than females.
In England and Wales the tongue and lip are the most commonly affected sites (excluding major salivary
glands). The age standardised incidence per 100,000 of the population is in the region of 4.5 for men and
2 for women (Binnie, W.J. et al., 1972; Waterhouse, J. et al., 1982). Oral malignancies constitute 1.9% of
all malignancies. The incidence has shown signs of an increase in recent years (Cowan, C.G. et al., 1992;
Hindle, J. & Nally, F., 1991), particularly among females, and there has also been a shift towards the
younger age groups. Nevertheless, nearly three quarters of the new cases of oral cancer which arise in males
each year are in the 60+ age group and the incidence in this group was found to be around 10 per 100,000
in a recent study in Northern Ireland (Cowan, C.G. et al., 1992). Thus the elderly appear to be an important
group in which to monitor oral cancer, but it must be remembered that the total number of new lesions in
any one year is relatively small. The average number of new oral malignancies in the UK through the 1970s
and early 1980s was 1704 per year, excluding those in the oropharynx and those arising in the major
salivary glands (Johnson, N.W. & Warnakulasuriya, K.A.A.S., 1991).
Most oral cancers arise in normal tissue, but a small proportion result from malignant transformation
occurring in an existing non-malignant lesion, usually a red or white mucosal patch
(leucoplakialerythroplakia). Data on the prevalence of these lesions is much less widely available than that
for oral cancer, and interpreting the information which is available is difficult due to the low proportion of
patches which transform. The rate of transformation is reported as 3-6% over ten years (WHO, 1993), so
the prevalence of truly premalignant lesions is undoubtedly low (Axell, T., 1987; Pindborg, J.J., 1977).
44

There is also a suggestion that the rate of transformation may be reducing relative to the apparent increasing
incidence of oral cancer (Gregg, T.A. et al., 1992). The reduction in the mortality or the morbidity of oral
cancers hinges around early detection. The role of the dental profession in this is obviously important,
although by no means exclusive. In a study by Scully (Scully, C. et al., 1986) only about half of the cases
referred to his department were referred by dental practitioners, and the major delay in instituting treatment
was as a result of patients delaying seeking professional advice. It is towards more rapid presentation and
identification of lesions, rather than at population wide screening programmes, that any strategy to reduce
the mortality or morbidity of the disease would best seem to be directed.
Dry mouth
Saliva has a protective function, both physical and chemical. Reductions in flow will diminish that
protective function. Profound reductions in flow can be extremely uncomfortable, difficult to treat, and may
diminish the quality of life. Dentate individuals with decreased salivary flow are likely to be at greatly
increased risk of dental caries (Papas, A.S. et al., 1993; Stelling, E. & Gustafsson, G., 1952), particularly
where root surfaces are exposed to risk of carious attack. As the population of dentate elderly grows, the
problem of dry mouth is likely to increase in practical significance. The reasons for a reduction in the
salivary flow are varied and include specific disorders of the salivary glands (e.g. Sjogrens Syndrome), the
use of a variety of medications, psychiatric conditions, radiation and many others (Fox, P.C. et al., 1985).
A reduction in salivary flow has also been considered as an age change by some authors, but the role of
age in salivary flow is still a vexed issue. There are clear histological changes in the salivary glands with
age, characterised by a reduction in the volume of functional tissue (Andrew, W., 1952; Scott, J., 1977a;
Scott, J., 1977b; Scott, 1., 1980), but whether this translates into a reduction in the production of saliva is
less clear. Some early studies suggested a reduction in flow was a part of the normal ageing process
(Bricson, S., 1968; Gutman, D. & Ben Aryeh, M., 1974). However salivary flow studies on healthy, non-
medicated subjects seem to suggest that flow reduction is not a function of age per Se, the changes recorded
in many studies may have been as a result of the use of drug medication (Baum, B.J., 1981; Chauncey,
H.H. et al., 1981; Heft, M.W. & Baum, B.J., 1984; Parvinen, T. & Larmas, M., 1982). Other recent studies
45

have shown an apparent reduction in resting whole saliva flow (Ben-Aryeh, H. Ct aL, 1984; Navazesh, M.
et aL, 1992) and resting and post-stimulated submandibular salivary flow as a result of agemg (Pedersen,
W. et aL, 1985). The situation with slimulated salivary flow (as opposed to resting flow) is a little more
confused. Osterberg (Osterberg, T. et al., 1992) could find no longitudinal change over up to 12 years in
a cohort of randomly selected elderly individuals, whilst Navasesh (Navazesh, M. ci aL, 1992) observed
that although resting flow was lower in their older than in their matched younger subjects, stimulated flow
was actually higher.
Studies of the prevalence of dry mouth are few. This may be as a result of difficulty in measurement. Dry
mouth is not a single entity. Saliva flow may be subjectively assessed by the patient, or objectively
measured after collection. Collected saliva may be stimulated or unstimulated, whole saliva or the product
of just one of the major glands. It is difficult to know which holds the greatest significance. Furthermore,
subjectively assessed dry mouth may give a good indication of the subject's level of discomfort, but it is
not clear how, or even whether, this is related to actual saliva production (Thorseius, L et al., 1988). Two
studies have investigated the prevalence of dry mouth in populations of elderly people. Osterberg
(Osterberg, T. et al., 1984) studied a random group of 70 year old subjects. 16% of men and 25% of
women reported subjective dry mouth. Thorseius (Thorseius, L et a!., 1988) investigated a group of
institutionalised elderly (mean age of 85 years), and 37% of the males and 60% of the females subjectively
reported thy mouth. The higher level in the latter study are probably a reflection of greater age, illness and
medication usage. Osterberg (Osterberg, T. ci a]., 1984) found that over a quarter of his subjects had
resting flow rates of less than 0.Olinl per minute, the lower border of normality (Bertram, U., 1967).
Thorselius (Thorseius, I. et a]., 1988) found that one third of their institutionalised population had
stimulated whole saliva flow rates less than 0.7mllmin, which is lower than the generally acknowledged cut
off for normality, whilst 11% had stimulated flow rates less than 0.3mllmin, consistent with a very dry
mouth. If this figure was reflected generally in the population of the very old it would represent a large
number of individuals. For the current generation of old elderly (over 75 year olds), the vast majority of
whom are edentulous, it may mean considerable discomfort, a decrease in the quality of life, and possibly
poorer mucosal health (Kreher, J.M. et at., 1991), although the relationship between salivary flow and
46
reported dry mouth is not clear. Widespread reduced saliva flow does not translate into a large treatment
need in these subjects, because there is only limited treatment available. However in future generations, who
are more likely to have retained some natural teeth, the management of the resultant dental disease could
be a significant problem.
Flow rate studies have consistently shown a gender difference with females displaying lower flow rates than
males, and a higher proportion of females reporting a dry mouth (Johnson, 0. et a!., 1984; Narhi, T.O. et
al., 1992; Osterberg, T. et al., 1984; Parvinen, T. & Larmas, M., 1982; Thorselius, I. et al., 1988). Other
correlates which have been reported include medication usage and, interestingly, dental state as measured
by the Eichner index (Narhi, T.O. et al., 1992; Osterberg, T. et al., 1984; Thorselius, I. et al., 1988).
Denture related pathology
Pathological lesions of the oral soft tissues, which are caused by the patient's dentures, or in the formation
of which the dentures play a key role, appear to be fairly common, but are generally not serious and involve
moderate discomfort at worst. The lesions include those which are caused by direct denture trauma (e.g.
ulcers and denture hyperplasia) and infections (denture induced stomatitis and some cases of angular
cheilitis) where the denture plays a key role in the pathogenesis (Budtz-Jorgensen, E. & Bertram, U., 1970).
A number of small scale studies have reported the prevalence of these in a variety of populations and
differences in prevalence are frequent. In a review of the literature, Budtz-Jorgensen (Budtz-Jorgensen, E.,
1981) found the prevalence of denture related pathology to be generally high although there were wide
variations. Angular cheilitis occurred in about 15%, traumatic ulcers in about 5% and denture hyperplasia
in around 12% of his denture wearing subjects. In the over 65 year old age group denture stomatitis was
recorded at anywhere between 17% and 65%. In a study of a population of institutionalised elderly in
Denmark very similar figures were reported. Denture stomatitis was much more common where denture
hygiene was poor, or the prosthesis was old or worn at night. Rather surprisingly, the prevalence of
problems reduced with age. However it was unaffected by a range of social and geographic factors (Vigild,
M., 1987).
47

2.1.10. Dental health of older adults - an international perspective
In 1982 the World Health Organization and the Federation Dentaire Internationale collaborated to define
and adopt 6 global goals for oral health for the year 2000 (FDI, 1982; WHO, 1986). These cover oral
conditions which are straightforward to measure and to monitor, and which, when measured, will give a
reasonable indication of a country's dental state in an international context. When these conditions are
monitored over time they also give a useful indication of change. One of the "goals" relates to the
prevalence of edentulousness specifically in older adults. This is
A 25% reduction in the present levels of edentulousness at age 65 years and over will be achieved
by the year 2000.
The European regional office of the WHO subsequently published figures for all the nations of Europe for
which data was available (WHO, 1986), as a baseline against which progress could be measured. Based on
the 1978 (which were used in the document) and the 1988 Adult Dental Health Survey, the United Kingdom
has already comfortably achieved both goals (Todd, J.E. & Lader, D., 1991). The WHO European data
allows comparison of the United Kingdom with many of our neighbours in Europe, while the National
Survey of United States Employed Adults and Seniors: 1985-86 (NIH, 1987) permits a transatlantic
comparison. Table 1.5 shows the proportion of 65+ year olds who are edentulous in a selection of European
nations and in the United States. The figures given are for the year 1985 or the most recently available
figures up to that year as well as projected figures for the year 2000 where these are available. In terms of
the prevalence of total tooth loss, the U.K. as a whole compares rather unfavourably with much of Europe.
The figures for Switzerland, Sweden and Hungary are particularly impressive with only 20% or so of their
older populations edentulous. However, in terms of the projected figure for the year 2000 the expected
reductions in the U.K. are at least in line with other comparable European countries.
More detailed figures are available for the United States of America. Their overall figure for edentulousness
in the over 65 year olds lies somewhere in the middle of the European group, not as good as the best, but
48

a great deal better than the United Kingdom. If the younger cohorts (up to age 54) are considered, the US
national figures are very similar to those for the south of England, though much lower than the U.K.
national average. It is only in the population 55 years and over that the U.S. can demonstrate a much lower
level, but as the younger British subjects get older this difference may also be eliminated. It is of interest
that, at present, the South of England shows an age related pattern of edentulousness which appears to be
closer to that of the United States of America than to that of the North of England (see fig 2.1.5.)
Table 2.1.10. Percentage of the population over the age of 65 who are edentulous in different countries(NOTE: the year for which the data has been recorded is not the same for all countries, so where there aretrends towards reduction in the prevalence of edentulousness this may lead to distortion of the relationshipsbetween countries) (WHO, 1986).
COUNTRY % edentulous 1985 or latest Prediction for year 2000
UK (1978) 79% -
Ireland 72% 54%
Netherlands 70% -
UK (1988) 67% 51%
Finland 65% 30%
Denmark 60% 45%
GDR (former East Germany) 58% 20%
Malta 50% 35%
USA 41% -
Austria 30% -
Switzerland 25% -
Sweden 20% -
Hungary 18% -
49

Cl)
C).c
V
C)
(1)
0
CC)
C)
C)a)CD
CC)CI)I-C)0.
C)
I-Lr1(b%j
C)
0)
U-
+LI)(0
o o o o o o o o 0 0 0o 0) (0 U) C') C.1I-
snoinwopo %
(9LI)LI)
(9Lf)
0
0
0)
C)0)
LI)C')
C
U,C'1
cJ
(01
50

National data on the proportion of the population of other countries with 21 or more standing teeth are not
easy to come by. Recent statistics for over 65 year olds in Ireland (O'Mullane, D. & Whelton, H., 1992)
showed 10.7% of the total population and 20% of the dentate population to have 21 or more standing teeth,
very similar to the United Kingdom. In the 19 85/86 US National Survey 24% of the total over 65 year old
sample and 40% of the dentate seniors had 21 or more standing teeth (NIH, 1987), roughly double the UK
figures. If the percentage edentulous in any way reflects the proportion of a population with a functional
dentition, then based on the statistics in the previous section, the UK could be expected to be well behind
the rest of Europe.
A higher proportion of older adults in the U.S. are dentate - 45% of over 75 year olds compared with 20%
of the equivalent U.K. population. The older adults are not only more likely to have teeth, but to have more
of them (mean 17.2 for the U.S. compared with 14.5 for the U.K.). The 1988 U.K. figure was actually very
close to the statistic for black Americans. There is a significant "heavily filled" cohort similar to that in the
U.K., although not as large, the peak of which is around 10 years ahead of the United Kingdom (see figure
2.1.5.). Table 2.1.11. shows the US in 1985/86 compared to the UK in 1988. There are fewer decayed and
more filled teeth in older US adults (NIH, 1987; Todd, J.E. & Lader, D., 1991).
Table 2.1.11. Mean number of decayed, filled and sound teeth in the U.K. and the U.S. for older adults(Todd and Lader 1991, NIH 1987).
Mean Decayed (D) Teeth Mean Filled (F) Teeth Mean Standing Teeth
U.K. (55^, dentate) 1.1 6.3 14.5
U.S. (65^,dentate) 0.7 6.9 17.2
Data for some other countries are available, either directly from national surveys or from the WHO national
data bank (table 2.1.12.). There are problems with the comparability of these statistics, and in many cases
details of sampling procedure, diagnostic criteria and, most importantly, how the statistics deal with the
edentulous, are uncertain. The score given in each case is the DMFT, however much of this data is of
limited value as it is frequently not clear whether it refers to the dentate alone or the whole population,
51

dentate and edentulous (the latter will have a DMFT of 28 or 32, depending on whether third molars are
counted or not).
Table 2.1.12. DMFI' for over 65s in various European countries (WHO, 1986)
Country DMFT
U.K. (dentate only) 23.8
U.K (total population) 29.3
Czeckoslovakia 28.0
Denmark 27.0
Finland 25.0
Gemian Democratic Republic 24.0
Netherlands 22.8
Malta 20.0
Bosnia Herzogovina 14.7
There is only a very limited amount of data on the periodontal health of randomly selected older
populations, which is widely available and directly comparable. In the WHO document "Country profiles
on Oral Health in Europe" only 3 out of 34 countries provide any figure for the periodontal health of the
over 65 year old age group (WHO, 1986). Some comparison may be made between seniors in the USA and
the over 65s in the 1988 UK national survey, but differences in the recording and reporting methods mean
that only data for pockets 4mm or greater are directly comparable. Even with this single variable there is
an enormous difference between the two countries, which is difficult to explain. In the American population
22% of seniors had pockets of 4mm or deeper, while in the U.K. the figure was 77% of over 65 year olds
(NIH, 1987; Todd, J.E. & Lader, D., 1991).
The international distribution of periodontal diseases has been reviewed by Johnson (Johnson, N.W. et al.,
52
1988) and Miyazaki (Miyazaki, H. et aL, 1991). The restriction of severe disease to a subset of the
population appears to be consistent in many countries, including those in Europe, the USA and various
developing countries for which data are available. However information is generally limited to the young
and young middle aged groups. In a small number of the developing countries the proportion of the
population with severe disease is much higher but the reasons are uncertain (see table 2.1.13.). More
profound racial and geographical differences are evident for some of the less common periodontal disorders
(e.g. acute ulcerative gingivitis and juvenile periodontitis). Other studies comparing various different
populations using identical criteria may point to potential genetic or nutritional differences to explain some
of the variations (Löe, H. et al., 1978; Cutress, T.W. et al., 1982; Löe, H. et al., 1986).
Pilot (Pilot, T. & Miyazaki, H., 1991; Pilot, T. et al., 1992) has reviewed the periodontal conditions
throughout Europe, using data from the WHO data bank, mostly collected in the mid 1980s and all using
the Community Periodontal Index of Treatment Needs. What is immediately striking is the wide variation
between different countries (see table 2.1.13.), but the differences between different studies in the same
country are even more telling. One of the French studies reports only 6% of 35 - 44 year olds as having
pockets of 4mm or worse, while in another the figure is 65%. Although this is an extreme example it
graphically illustrates the problems of trying to compare different studies, even where the means of
measurement used are standardised (theoretically). Data from the rest of the world shows similar variation
(Miyazaki, H. et a!., 1991). Table 2.1.13. is a selection of this data (see next page).
53

Table 2.1.13. Periodontal conditions around the world in the 35-44 year old age groups, measured by
CPITN (from Miyazaki et a! 1991).
Worst score
Country Health Pockets of 4mm+ Pockets of 6mm+
United Kingdom (1988) 4% 62% 13%
USA (1985) 2% 48%* 14%
Netherlands (1986) 4% 56% 8%
Norway (1983) 0% 65% 9%
Spain (1985) 7% 50% 18%
Italy (1985) 3% 48% 12%
Sri Lanka (1984) 5% 38% 10%
Bangladesh (1982) 2% 98% 64%
Japan (1986/87) 6% 50% 8%
Niger (1988) 1% 79% 28%
Zaire (1987) 0% 61% 16%
Burkina Faso (1986) 0% 99% 74%
Tanzania (1982) 1% 71% 7%
This is NOT the US Nationar Survey data (the equivalent figure for the national survey was only 15%)
54
2.1.11. Summary -The dental health of older adults and its relationship to geography and social
factors.
- The proportion of the adult population of the U.K. who are edentulous has reduced in the last 20
years and is projected to continue falling (the projected national figure for 2038 is 0 - 6%).
Most of the reduction to date has been in the young and middle aged groups, but in future it will be
evident particularly among the old and the very old.
- The national figures conceal combined social and geographical subgroups who appear to be lagging
well behind the rest of the population. Women from the families of unskilled manual workers in the
North of England appear to be doing least well in comparison with the rest of the country.
- The normative treatment need of older adults who wear complete dentures is high, the level of
complaints articulated by the denture wearers is also high, but the proportion who actually seek
professional help is low. Complaints occur less frequently in those who have worn dentures for the
longest.
In future denture wearers are likely to be older when they are rendered edentulous and may find it
more difficult to adapt to their dentures at that stage.
- The proportion of the population with 21 or more standing teeth is increasing rapidly, and in the
30 yeais from 1988 to 2018 it is predicted to increase from 30% to 84% of the total UK population.
It is difficult to predict confidently the likely changes in older adults, although there will certainly
be an increase.
Older cohorts have lost teeth rather more quickly than their younger counterparts: 55-64 year olds
lost on average 2.9 teeth in the 20 years up to 1988, but this figure was 2.0 and 1.4 in the next two
55

younger cohorts.
Adults in the North of England have a lower proportion of their population with more than 21
standing teeth than the South. The influence of gender and social class appears to be rather minor.
In the oldest age groups (75+) the influence of attendance pattern is particularly important with 18%
more dental attenders than non-attenders retaining over 21 standing teeth. It is worth noting though,
that 11% of the population over the age of 75 have been able to retain 21 or more standing teeth in
spite of irregular attendance.
The 21+ standing teeth statistic is an important watershed for denture wearing. 78% of those with
less than 21 teeth in 1988 wore a denture compared with only 5% of those with 21 or more.
An increasing proportion of the population is dentate. Among this dentate population the trend in
successive cohorts is for the retention of more teeth, and an increasing number of these are sound
and untreated.
The mean number of decayed teeth has fallen across the entire population. The reason for this is an
actual reduction in decay, but perhaps also more teeth are being treated earlier.
The pattern of decay and restoration at different ages in the population indicates three broad bands.
Those aged under 30 are almost all dentate, have a lot of teeth and relatively few restorations. Those
between 30 and 65 are mostly dentate and have a lot of teeth, but these are very heavily filled, with
a mean of around 10 filled teeth per member of the population aged between 25 and 44 in 1988. The
treatment need for these people as they become old could become a drain on resources and a serious
problem for health care providers. The final group are those aged over 65. At present, levels of
edentulousness are high in this group, particularly in the older age bands (75+). Those who are
dentate have relatively few teeth, a high proportion of which are unsound. The people at the younger
56

end of this age group represent the first wave of the predominantly dentate and heavily restored
population.
- Males, those from the North of England, people from unskilled manual backgrounds and irregular
attenders are likely to have fewer teeth, more decay and fewer restorations than females, those from
the South of England and non-manual workers. When considering the average number of sound and
untreated teeth, those from the North of England, from unskilled manual backgrounds and irregular
auenders generally have more sound teeth.
- Nearly all of the older population are vulnerable to root surface caries by virtue of gingival recession.
60% - 90% of the elderly are affected by root caries, or have a history of the disease. In the United
Kingdom 7% of all vulnerable teeth in older adults have decayed or unsound root surfaces, and
nearly 20% of teeth have decayed or filled root surfaces.
- Many factors, including age and gender are strongly related to root decay, although the relative
significance of many of these to the pathogenesis of root caries lesions requires further investigation.
- There is, as yet, relatively little data which describes how root caries lesions are distributed in the
population. Mean figures are frequently quoted, but it may be that a majority of lesions are
concentrated in a minority of mouths.
- Periodontal disease is a common disorder and an important reason for tooth loss in older adults. Its
distribution in the population is not uniform; severe disease is restricted to a proportion of the
population. Interpretation of its importance in the older population is hampered by inappropriate
presentation of the data.
- There are signs of changes in the pattern of disease. More people have healthy mouths, but there is
also more severe disease than in the past.
57

- Attachment loss appears to increase with age, which is not surprising considering that periodontal
disease is an irreversible process. Advanced attachment loss is much more widespread in older adults
than in the young. There is recent evidence that the rate of progression may also be greater among
older adults.
Females generally have more healthy sites than males, and males tend to have more severe disease,
but there could be a distortion brought about by a reduction in the number of teeth.
- Social factors do not influence the prevalence of severe disease, but the prevalence of mild disease
and sites with calculus is increased in unskilled manual groups.
Some increase in wear is to be expected as a result of normal function. There are relatively few
additional factors in an elderly population which make acceleration of wear more likely with age.
The most widely relevant factor is loss of occlusal support due to loss of teeth, but the role of loss
of support in exacerbating wear is uncertain.
- It is important to relate the patient's satisfaction and ability to function with the level of wear, and
to use these non-clinical variables as determinants of treatment need, rather than to regard the
presence of wear, even of advanced wear, as an automatic indicator of the necessity for treatment.
- The prevalence of temporo-mandibular dysfunction in older adults is very difficult to evaluate and
depends on the measures used. It appears that severe problems are rare, although clinical signs are
commonly detected. Put in perspective with the other medical problems of the elderly temporo-
mandibular dysfunction would appear to be a rather minor disorder.
- Oral cancers involve a high mortality and morbidity, and although they are most common in older
adults, they are still rare in the U.K.
58

Up to a quarter of the total population have reported subjective dry mouth whilst up to 11% of
institutionalised elderly have been found to have profoundly dry mouth based on measured flow
rates. The effect of dry mouth on the teeth in future elderly populations (as a result of dental disease)
could be damaging and expensive.
Denture related pathology is generally associated with relatively low (although possibly significant)
morbidity, but appears to be common.
Directly comparable international data is uncommon as means of presenting and analysing data are
not uniform. The UK lags some way behind the USA and most European countries for the variables
where comparison is possible (edentulousness, number of teeth, DMFT).
59

2.2. ATTITUDES TO ORAL HEALTH, ORAL HEALTH BEHAVIOUR AND BARRIERS TO
DENTAL CARE IN OLDER ADULTS.
2.2.1. Attitudes to oral health and oral health behaviours in older adults.
Attitudes, behaviour and oral health are inter-related variables. This has been well illustrated by developing
and testing an interactional model which includes the motivational and vulnerability factors which influence
dental health, dental health behaviour and each other (Maizels, J. et al., 1991). The interactions between
these variables are complex. The relationships which were described using the model accounted for only
35% of the variance in the number of filled teeth, whilst other important influences, for example sugar
consumption, were not included. Nevertheless, the model illustrated the complicated inter-relationships of
psychological, behavioural and biological factors which contribute to "oral health". The factors which may
combine to influence social attitudes towards oral health include experience of treatment and disease, social
circumstances and cultural background. These will in turn be determined by age, gender, socio-economic
status and probably geography (through cultural heterogeneity). Not only will different age cohorts have
different attitudes to oral health, but within any given age cohort the attitudes may also be dynamic and
change with time according to the dental, social, political and economic environment. As a result,
assumptions relating to future changes in oral health or the demand for dental health care as a result of
current attitudes must be made with caution. Furthermore, the cultural element makes it inappropriate to
place assumptions drawn from studies conducted overseas in the context of the United Kingdom.
This section will cover some of the differences in attitude to oral health according to age cohorts, gender,
social class, and geography as they were described by a sample of the population of the United Kingdom
in the 1988 Adult Dental Health Survey (Todd, J.E. & Lader, D., 1991). All of the statistics quoted in
section 2.2.1. are derived from the 1988 Adult Dental Health Survey, or in a few cases, previous UK
surveys of adult dental health. The figures given for different genders, social classes and geographical areas
refer to the total population. Statistics for these parameters broken down by age are not available. Important
variation affecting subsets of the elderly may lie undetected.
60

Dental Attendance
Overall figures for dental attendance patterns demonstrate large age and geographical differences, but the
figures are distorted in the older age groups by the high proportion of edentulous people, who have quite
different treatment needs. When trying to establish differences between groups it is probably prudent to
consider only the dentate. A slightly lower proportion of dentate older adults are regular attenders (42% of
over 65 year olds) compared with younger age groups, about half of whom attend for regular checkups. A
high proportion of the dentate very old (75+) only attend with trouble (57%). This is almost double the
figure for those aged 35-44.
Table 2.2.1. sums up the gender, social and geographic variations in attendance pattern. Males, those from
unskilled manual backgrounds and people living in the North of England appear to be the groups likely to
have the lowest number of regular attenders, and the highest proportion who wait for pain or dental
problems to drive them to seek care.
Table 2.2.1. Proportions of total population who attend the dentist for regular checkups and only withtrouble according to gender, social class and area of residence (Data from Todd and Lader 1991).
Males Females Non- Unskilled North of South of All adults
manual manual England England
Regular attenders 42% 58% 59% 34% 49% 52% 50%
Only with trouble 42% 29% 26% 52% 38% 32% 34%
Following through the attendance behaviour of single cohorts in England and Wales between 1968 and 1988
may give some indication of trends towards demand for dental care. The proportion of the dentate
population who say that they attend for regular checkups has increased during this period for all age groups.
As the group ages, the proportion of regular attenders increases (see table 2.2.2.). However a note of caution
should be sounded before interpreting all of this rise as a sign of demand increasing with age. The figures
refer only to the dentate members of the population, and there will have been some "selecting out of
irregular attenders who have been rendered edentulous. This will tend to exaggerate the rise in demand for
regular checkups as only a very small proportion of the edentulous attend for regular checkups. However,
61

even when this is corrected for, the proportion of the total population does show the middle aged cohorts
of 1988 attending more regularly than they did when they were younger.
Table 2.2.2. Change in attendance pattern for different groups of the dentate in England and Wales between1968 and 1988 (Data from Todd and Lader 1991).* - figure will be artificially low as it applies to all over 55 year olds, not just the age group in question.
Age in 1968 % regular attenders Age in 1988 % regular attenders % increase in regular
attenders 1968 -1988
16-24 46% 35-44 59% 13%
25 - 34 45% 45 - 54 55% 10%
35 - 44 42% 55^ 45%* 3% *
Table 2.2.2. shows only the data for the dentate population. It can be stated with reasonable confidence that
as the proportion of the elderly who are dentate increases, the demand for dental checkups alone
(irrespective of the new treatment need) will rise markedly in the first quarter of the next century.
Oral Hygiene
The frequency of tooth brushing and the use of additional oral hygiene aids may give some indications of
the variation in social attitudes to oral health throughout the U.K.. The current generation of elderly clean
their teeth slightly less frequently overall than the younger age groups. Comparing only dentate elderly with
younger groups shows that 11% of the over 75 year olds clean their teeth less than once a day, and 6% said
that they never cleaned their teeth. Nobody in the under 44 year old age groups fell into this latter category.
Around three quarters of the over 65 year olds used no oral hygiene aids over and above normal toothbrush
and toothpaste and less than 8% said that they used dental floss. In some of the younger age groups up to
30% reported using dental floss. Table 2.2.3. shows the variation in oral hygiene practices between the
North and the South of England, males and females and people from non-manual and unskilled manual
backgrounds. Unskilled manual workers and individuals from the North of England, particularly males,
demonstrated the least enthusiasm for oral hygiene practices, whilst those from the South, people from non-
manual backgrounds and women showed the most.
62

Table 2.2.3. Oral Hygiene behaviour according to gender, social class and area of residence (Data fromTodd and Lader,1991).
Males Females Non- Unskilled North of South of All
manual manual England England adults
Brushing 2x daily or more 58% 76% 73% 62% 65% 70% 67%
Brushing <lx daily 9% 2% 4% 11% 8% 4% 6%
Use of floss or sticks 19% 31% 34% 10% 21% 32% 25%
Treatment preferences
The sort of treatment which individuals would prefer if they had a choice may give a useful indication of
the attitude of a population towards dental treatment. The Adult Dental Health Survey reported the
responses of subjects to a number of hypothetical questions. The treatments preferred varied substantially
with age. Table 2.2.4. sums up the trends for different age groups, as well as area of residence, social class
and gender according to the answers to three such questions
Table 2.2.4.Treatment preferences according to age, gender, social class and area (Data from Todd andLader, 1991).
65+ <44 Males Females Non- Un- North South
manual skilled
Back tooth extracted 44% 20% 25% 23% 15% 40% 28% 19%
rather than filled
Front tooth extracted 31% 6% 12% 9% 8% 18% 12% 10%
rather than crowned
Back tooth extracted 57% 31% 35% 36% 26% 48% 38% 31%
rather than crowned
Older males, those living in the North of England, and people from an unskilled manual background were
much less likely to demand restorative care than young females, those from non-manual backgrounds and
people living in the South. The Midlands and Scotland shared a similar lack of enthusiasm with the North
63

of England. Generally those with most teeth were more likely to want a tooth restored. Adults with partial
dentures were much less likely than those without to want another tooth extracted. In the case of crowning
or extracting an anterior tooth only 5% of all partial denture wearers would want it extracted, compared to
28% of those without dentures. The reasons for this are undoubtedly complex, but it may be that the denture
wearers realise that the loss of another tooth would imply treatment beyond the extraction (modification of
the denture) or that loss of a tooth may (further) reduce the ability of a denture to do its job.
Attitudes to dentures
The 1988 Adult Dental Health Survey included data on the expectation of the need for dentures and the
degree of upset that being rendered edentulous and becoming reliant on dentures would cause. The
proportion of dentate adults who felt that they would need a partial denture within 5 years was generally
low, but increased with age, and accounted for 17-18% of the over 55s. Gender and geographical
differences were small, although 4% more manual workers felt that they would need partial dentures than
non-manual workers. When the same dentate adults (with no partial dentures) were asked about the
prospects for complete dentures, between 13% and 19% felt that they would need them at some time, with
the proportion anticipating a short term need (less than 5 years) increasing with age, and those anticipating
a need in the long term decreasing. The variation with other factors was much greater, but the North of
England stood out as the area with the highest proportion of the population with overall expectation of
complete denture need (one fifth), 8% higher than the South of England. A similar number of males and
females anticipated edentulousness, but more than twice as many manual workers as non-manual workers
(20% to 8%) thought that they would need dentures at some time. Dentate adults who wore partial dentures
were much more likely to identify a long term need for complete prostheses (37% overall) than those who
did not (15% overall).
The proportion of partial denture wearers who would be very upset at the prospect of complete dentures
was between a third and a half and showed a decrease with age (37% of over 55s) after a peak in middle
age (44%). Generally, females, those from non-manual backgrounds and residents of the South of England
were more likely to be very upset at the prospect of total tooth loss than males, unskilled manual workers
64

and residents of the North of England.
Dentate adults who did not wear dentures were more likely to be very upset at the prospect of partial
dentures the older they were. 27% of over 65s in this category said that they would be very upset, compared
to only 16% for the youngest group. When the same questions were asked about complete dentures the
proportion who would be "very upset' was much higher, although the same trends were apparent (see table
2.2.5.).
Table 2.2.5. Proportion of the dentate sample who said they would be very upset at needing partial andcomplete dentures, by age, gender, social class and area of residence (data from Todd and Lader, 1991).
65+ Males Females NM* * North South All
Very upsetting - partial 27% 14% 29% 23% 21% 18% 22% 22%
dentures
Very upsetting - 69% 55% 71% 67% 58% 58% 65% 63%
complete dentures
= Non-manual, UM = Unskilled manual.
If any individual age group of non-denture wearing dentate adults is followed through from 1978 to 1988
the proportion of people who say they would be very upset if they required partial dentures is almost
unchanged (Todd, J.E. & Walker, A.M., 1980; Todd, J.E. et al., 1982). There is no sign of a ground swell
change in social attitudes here. However, the proportion who would be very upset by total tooth loss has
leapt by between 8% and over 20%, with the biggest increase occurring in the older groups. There should
be a degree of caution exercised when interpreting the figures for the older age groups as the incidence of
edentulousness may have selected out those who would have been least upset, but this can only partly
account for the altered attitudes. Similar changes are evident among those who already wear partial
dentures. Reference to figures for all dentate adults in 1968 shows that this trend in public opinion has
probably been going on for at least 20 years (Gray, P.G. et al., 1970). During that twenty year period it
appears that hundreds of thousands of people must have changed their attitude to complete dentures and
become less prepared to accept the inevitability of complete dentures.
65

2.2.2. Barriers to dental care in older adults
Barriers to dental care could be defined as factors which prevent or discourage individuals from seeking
care. Barriers may be psychological, financial or physical. The former will be tied up closely with attitudes
and resultant behaviour, and as such will be influenced heavily by cultural variables, age, gender and social
circumstances. Financial barriers will be related to these, as well as to the political and economic climate
current at the time and consequently may, be fairly volatile. Physical barriers will be of little consequence
to most of the young and middle aged population, but are likely to parallel the increasing disability
associated with old age.
When considering barriers to the provision of dental care in the elderly as a whole, it is worth considering
the heterogeneity of the group. The edentulous and the dentate not only have different needs, but also a
different perception of their needs, so what they perceive as barriers will also be different. Similarly the
definition of what constitutes elderly is crucial. Many people in their sixties and early seventies are very
fit and able, but with increasing age the likelihood of being disabled or institutionalised increases. The
physical barriers to the fit and able will be minimal, but to the housebound, ill or institutionalised may be
considerable. There is also some evidence of differences in attitude between institutionalised and non-
institutionalised elderly which are likely to influence psychological barriers as well (Kandelman, D. &
Lepage, Y., 1982). Many of the recent studies of barriers relate to institutionalised elderly who constitute
a relatively small but potentially important subgroup. Care must be taken not to interpret the findings of
such studies in the context of the elderly in general.
In the 1988 Adult Dental Health Survey all dentate subjects were asked whether and how strongly they
agreed with a series of 15 statements depicting barriers to dental care. The statements were clumped into
three groups of five depending on whether they related to fear, image of the dentist/surgery or cost. These
were the three major categories of barrier to care described by Finch (Finch, H. et al., 1988). Other workers
have reported on various subgroups of the elderly population and have generally identified similar barriers,
but direct comparison is difficult due to differences in sampling and general methodology.
66
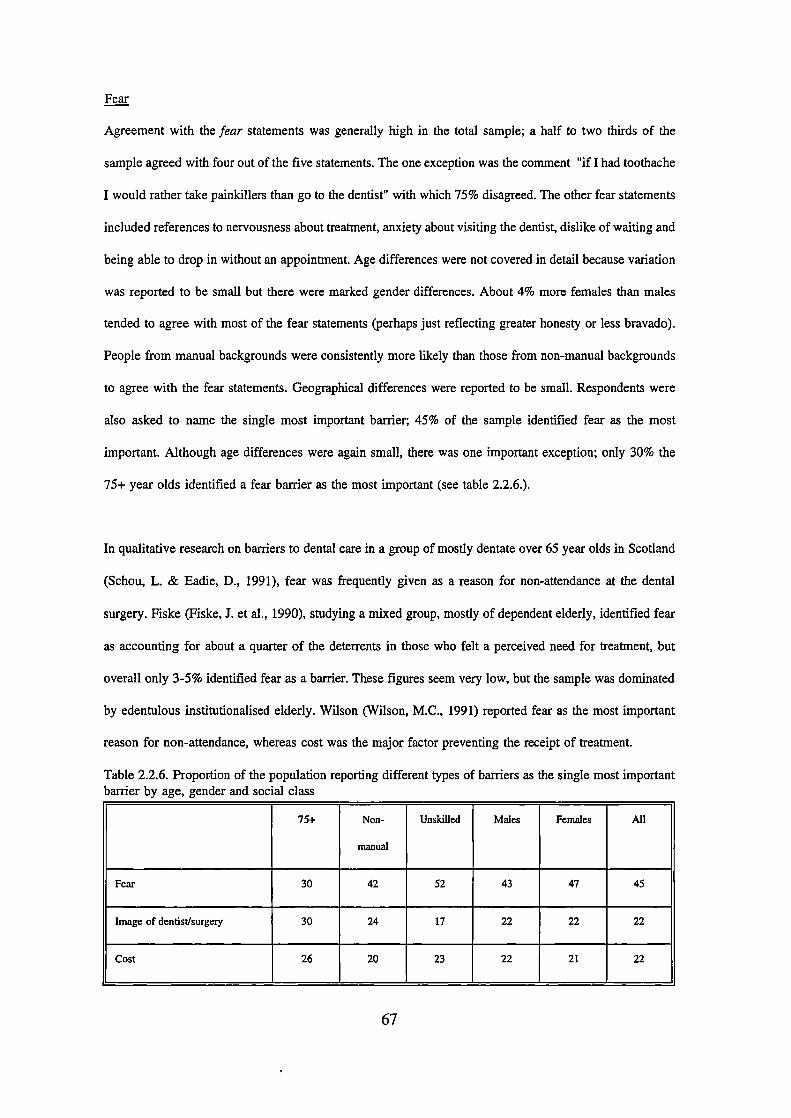
Fear
Agreement with the fear statements was generally high in the total sample; a half to two thirds of the
sample agreed with four out of the five statements. The one exception was the comment "if I had toothache
I would rather take painkillers than go to the dentist" with which 75% disagreed. The other fear statements
included references to nervousness about treatment, anxiety about visiting the dentist, dislike of waiting and
being able to drop in without an appointment. Age differences were not covered in detail because variation
was reported to be small but there were marked gender differences. About 4% more females than males
tended to agree with most of the fear statements (perhaps just reflecting greater honesty or less bravado).
People from manual backgrounds were consistently more likely than those from non-manual backgrounds
to agree with the fear statements. Geographical differences were reported to be small. Respondents were
also asked to name the single most important barrier; 45% of the sample identified fear as the most
important. Although age differences were again small, there was one important exception; only 30% the
75+ year olds identified a fear barrier as the most important (see table 2.2.6.).
In qualitative research on barriers to dental care in a group of mostly dentate over 65 year olds in Scotland
(Schou, L. & Eadie, D., 1991), fear was frequently given as a reason for non-attendance at the dental
surgery. Fiske (Fiske, J. et al., 1990), studying a mixed group, mostly of dependent elderly, identified fear
as accounting for about a quarter of the deterrents in those who felt a perceived need for treatment, but
overall only 3-5% identified fear as a barrier. These figures seem very low, but the sample was dominated
by edentulous institutionalised elderly. Wilson (Wilson, M.C., 1991) reported fear as the most important
reason for non-attendance, whereas cost was the major factor preventing the receipt of treatment.
Table 2.2.6. Proportion of the population reporting different types of barriers as the single most importantbarrier by age, gender and social class
75+ Non- Unskilled Males Females All
manual
Fear 30 42 52 43 47 45
Image of dentist/surgery 30 24 17 22 22 22
Cost 26 20 23 22 21 22
67

Image of the dentist/surgery
In the UK Adult Dental Health Survey most of the image statements were agreed with by less than half of
the sample (Todd, J.E. & Lader, D., 1991). The exception was the statement "I would like to know more
about what the dentist is going to do and why" with which two thirds of the sample agreed. Gender
differences were small, although twice as many females (20%) as males (10%) strongly agreed that they
'do not like lying flat in the dentist's chair'. Social class differences were small and geographical
differences were not mentioned. When the 'most important" statements were analyzed, the 75^ group again
showed marked differences from the rest of the sample. Overall 8% more rated an 'image" statement as
the most important (30% to 22%). The two which stood out were '1 don't fancy intricate treatment' (13%)
and "I do not like lying flat in the dentist's chair' (8%). Although 13% may seem a rather low proportion
it must be seen against the background of 14 other possible choices, and in fact the statement about intricate
treatment was rated as the second most important overall.
Cost
Two of the cost statements were agreed with by over half of the population. These were "I would like to
be given an estimate without commitment" and "I find NHS treatment expensive". Others related to cost
were agreed with by less than half. Gender differences were small, but far more manual workers (about
half) than non-manual workers (about 30%) agreed with the statement "it will cost me less in the long
term if I only go to the dentist when I have trouble". Whether this represents genuine reasoning or whether
there is an element of excuse is difficult to know. When the most important reasons were investigated it
was the over 75 year olds who once again stood out. From this group, the statement "I find NHS dental
treatment expensive" was rated the most important barrier overall; 16% rated it the most important reason,
a much higher proportion than the rest of the population. Again, it is important to note that the 16% figure
is seen in the context of 14 other possibilities. This is perhaps a reflection of a general perception of
expense among the elderly.
A number of authors (Fiske, I. et al., 1990; Kandelman, D. & Lepage, Y., 1982; Schou, L. & Eadie, D.,
1991; Wilson, M.C., 1991) have identified cost as an important barrier to dental care. Quantifying the size
68

of the barrier is difficult as it may change rapidly according to the political and economic situation. Schou
(Schou, L. & Eadie, D., 1991) identified widespread confusion about NHS charges and entitlement. This
will not have been helped by recent, well publicised, changes to the NHS fee structure and consequent
alterations in individual practices' policy regarding patient registrations.
Other barriers to dental care in the elderly
The 1988 Adult Dental Health Survey covered the general population and information relating specifically
to the elderly is difficult to glean (Todd, J.E. & Lader, D., 1991). However, the differences exhibited by
the over 75 year olds were quite marked and stood out against a rather homogenous background. The
elderly are an important subgroup of the population with specific needs and there are likely to be barriers
which are unique to this population. Schou (Schou, L. & Eadie, D., 1991) identified two other major
reasons for irregular attendance. The lack of any perceived need was one that was stated by many elderly
people, but it is difficult to evaluate in a mixed sample (as this was) of dentate and edentulous, as there is
good evidence that the latter almost universally only attend when problems force them. The other important
barrier was 'lack of interest'. This may go hand in hand with "don't need to go" but the statements gathered
from the group discussions indicated a reduced concern about appearance and a reluctance to get involved
with dental care. Wilson (Wilson, M.C., 1991) reported the factors, including barriers, which influenced the
receipt of dental treatment of a group of dentate elderly people in Northern England. The main stimulus
for dentate individuals was a desire to remain dentate, with peace of mind, a perceived need for scaling and
polishing and force of habit being the other determinants. Irregular attenders' reasons for attendance were
dominated by the relief of symptoms. The main barriers to care were fear and cost, but various others were
noted, the most important of these being "negative attitudes'. This study also reported on the barriers that
the dentists perceived that their patients felt. These generally accorded reasonably well (qualitatively) with
the patients' reports, but the dentists tended to consistently overestimate the scale of the barriers.
Physical barriers may be important to some elderly people. In a random population of those over the age
of 65 in Quebec the rural subjects in the sample demonstrated the lowest utilisation of services, suggesting
that distance itself may be a very important barrier in certain communities (Kandelman, D. & Lepage, Y.,
69

1982). In a study of a mixed, but mostly dependent, group of elderly subjects in the UK access to the
surgery accounted for 44% of the deterrents in those subjects who perceived a need (Fiske, J. et al., 1990).
About 50-60% of over 75 year olds can be classified as disabled and 18% of this disabled population are
housebound or can only leave the house with assistance (Martin, J. et al., 1988). Domiciliary dental care
is fairly widely available for housebound elderly in the UK, but uptake of such services appears to be low,
and Fiske (Fiske, J. et al., 1990) identified a number of reasons for this. One was that dental practitioners
waited to be asked, rather than offering their services, and the others included a lack of knowledge of the
services available, and possibly insufficient training of dentists and a lack of availability of equipment. The
need and demand for domiciliary care is also likely to be higher among the dentate, so is likely to increase
over the next few decades.
2.2.3. Summary - Attitudes to oral health, oral health behaviours and barriers to dental care in older
adults
- Attitudes to oral health show large variations between population groups. Generally, the attitudes of
dentate older adults do not differ greatly from their younger counterparts. There are exceptions to
this, the most notable being that more of the very old (75+) attend only with trouble than their
younger counterparts, and older adults are much more willing to have troublesome teeth removed
rather than restored.
Despite this, it is the older dental adults who are more likely to be very upset at the prospect of any
kind of dentures. Nearly 70% of dentate individuals over 65 year old would be very upset at being
rendered edentulous. Comparison between 1988 and 1978 appears to show a substantial (in numerical
terms) shift in attitudes to edentulousness with 10% more people saying that they would be very
upset at total tooth loss.
It is consistently males and those from unskilled manual backgrounds who appear to be the most
70

likely to have "negative' attitudes to oral health, hygiene and treatment. Southern England stands out
as the area with the highest proportion of the population who will keep their mouths clean (70%),
visit the dentist (52%) and have restorative treatment.
There are no data to compare, for example, older people from manual backgrounds in the North of
England with the national picture, and it may be that these types of sub-group display important
differences in attitude.
The elderly may have different and special needs and there is some evidence that the sort of barriers
which prevent them attending are different. Fear appears to be less important, while cost and an
aversion to complex treatment (and "getting involved") are more important in the elderly than is the
case in younger groups. In the population as a whole, gender and social class have a variable
influence. Certain sub-groups of the elderly may experience important and specific barriers which
require targeted sampling to draw out.
71

2.3. THE CONCEPT OF A FUNCTIONAL DENTITION
The presence of one or more standing teeth excludes a person from being edentulous, but the mere presence
of teeth does not necessarily infer a better state of oral health or a superior ability to function than an
edentulous person. When assessing oral health, it is necessary to estimate the potential contribution that a
dentate individual's dentition makes to their level of function. Although 32 teeth is the usual maximum
dentition, it is certainly possible, and often desirable, to function with fewer than this. Furthermore, if it
were felt desirable, from a public health perspective, to aim for a goal of 32 standing teeth across the
population in order to bring about an improvement in oral health, this would be both unattainable and
clinically undesirable (Kayser, A.F., 1990; Todd, J.E. & Lader, D., 1991). The cost of maintaining a full
arch of teeth against the ravages of the two major dental diseases into old age would be prohibitive. It
seems clear that the objective for older adults, at both an individual and a public health level, should be to
preserve the number of natural teeth that allow a person to function comfortably and without embarrassment
for the rest of their life, in line with the definition of oral health given in section 2.4..
In attempting to define what is acceptable, it is necessary to understand what the limitations brought about
by tooth loss are likely to be. As the proportion of dentate adults increase, the actual number of those who
are partially dentate will increase. Loss of some teeth may be acceptable, but if this occurs in a rather
random and uncontrolled way, it may cause more problems and be even less desirable than edentulousness.
This section specifically reviews the problems of tooth loss and the partially dentate.
2.3.1. The partial dentition and masticatory function
It would seem obvious that loss of teeth will in turn lead to a diminution of the ability to masticate. Studies
of masticatory performance (objectively measured mastication using specific tests) in relation to number
of natural teeth, food platform area or the comparison between natural teeth and dentures have shown this
statement to be broadly true (Chauncey, H.H. et al., 1984; Helkimo, E. et al., 1978; Jiffrey, M.T.M., 1983;
Kayser, A., 1981; Luke, D.A. & Lucas, P.W., 1985; Manly, R.S. & Braley, L.C., 1950; Wayler, A.H. et
72

al., 1984; Oosterhaven, S.P. et al., 1988). All of these studies used test foods of various descriptions and
measured pulverization or swallowing threshold in standardised tests. In other words the assessments were
completely objective, and the conclusions were that chewing is more efficient the more teeth, or pairs of
teeth, which are present. Just because objectively recorded masticatory performance is inferior where a
number of teeth are missing it does not necessarily follow that it is insufficient. Although masticatory
performance is slightly poorer it may be perfectly adequate when subjectively assessed by the patient, and
provide sufficient food pulverisation to be physiologically acceptable.
There are many studies which assess the performance of reduced dentitions by questionnaire or subjectively
assessed performance. Whilst objective studies allow the use of standardised experimental techniques
amenable to scientific measurement, subjective assessments may be less precise, but are of greater relevance
to dental practice. Masticatory ability, as this form of measurement is known, reflects a person's ability to
function to a level which is acceptable to them. In spite of the consistent finding that complete dentures are
much less efficient than a full set of natural teeth (Gunne, H.J., 1985a; Helkinio, E. et al., 1978; Mahmood,
W.A. et aL, 1992; Wayler, A.H. et al., 1984), a study by Bergman found that most complete denture
wearers were satisfied with their chewing ability (Bergman, B. & Carlsson, G., 1972). In studies of
masticatory performance (objectively measured), complete dentures are generally found to give a poorer
performance than any other dental state, with the possible exception of a single complete denture opposed
by natural teeth. Given the satisfaction of complete denture wearers, one may expect most partially dentate
individuals to be satisfied with their chewing ability. Findings from studies on people with partial dentitions
generally support this although the results are variable depending on experimental differences (Lappalainen,
R. & Nyyssonen, V., 1987; Wayler, A.H. et al., 1984). Wayler (Wayler, A.H. et al., 1984) found that
subjective ease of chewing hard foods was correlated to dental status, with complete dentitions giving the
best performance and complete dentures the poorest. Lappalainen (Lappalainen, R. & Nyyssonen, V., 1987)
found that masticatory ability correlated with the number of teeth and age. The worst option in all
age/gender groups was a complete denture opposed by natural teeth alone. This scored lower even than
complete dentures.
73

Whilst the previous studies showed a trend related to numbers of teeth, a number of studies have
investigated the minimum number of natural teeth required for satisfactory subjective masticatory ability.
Haraidson (Haraidson, T. & Carisson, G.E., 1979), in a small study of 24 subjects with osseointegrated
implants concluded that 9 pairs of occluding units (in this case in the form of bridges) seem to provide
sufficient masticatory efficiency. A large epidemiological survey of 1100 subjects (Agerberg, G. & Carisson,
G.E., 1981) concluded that 20 well distributed teeth were needed to provide satisfactory chewing ability,
and that loss of up to 7 teeth (from a complete' dentition of 28) did not seem to entail impairment, as
assessed by the subject. Even among subjects with only 8-20 teeth as few as 1% rated their chewing ability
as poor. Käyser (Kayser, A., 1981) looked not at ability to masticate food, but at the point at which
discomfort occurred during chewing and concluded that discomfort begins with less than 4 occluding units,
equivalent to 20 standing teeth assuming a complete anterior dentition. This then defines the cut off point
for what is acceptable masticatory ability, and also puts some emphasis on the distribution of the teeth, as
well as just the number. The importance of the distribution of the teeth for satisfactory function was
supported in a study by Battistuzzi (Battistuzzi, P.G.F.C.M. et al., 1987). In a study of 750 adults he
showed only a weak correlation between subjectively assessed masticatory ability and the number of teeth
or contacting pairs, but, using his own classification system for distribution of teeth, concluded that the
distribution of teeth or contacting pairs is of greater significance. Aukes investigated subjectively assessed
masticatory ability in the shortened dental arch, that is where there is an un-interrupted, but reduced
functional arch, usually, but not necessarily, from premolar to premolar (Aukes, J.N.S.C. et al., 1988). From
a study of 97 such subjects his conclusion was that the differences between this group and a control group
with complete (second molar to second molar) dental arches were small. Witter took this concept a little
further and showed that only 10% of his subjects with shortened dental arches raised any complaints about
masticatory ability (Witter, D.J. et al., 1989). Oosterhaven found that subjects with complete arches had
more positive feelings and fewer negative feelings about their ability to chew than those with missing
molars but no partial dentures, whilst they in turn had more positive and fewer negative feelings than
subjects with missing molars and a similar number of teeth, but who wore partial dentures (Oosterhaven,
S.P. et al., 1988).
74
In a short review of this subject, Witter concluded that masticatozy ability is generally sufficient as long
as 20 or more teeth are present, such as in cases of shortened dental arch (Witter, D.J. et a!., 1990). He also
schematically illustrated the apparent relationship between masticatory performance (assessed objectively)
and masticatory ability (assessed subjectively). While performance decreases in direct proportion to the
number of teeth, from an optimum of 12 occlusal units (pairs of teeth, or half teeth in the case of molars),
masticatory ability decreases much more slowly, and only when 4 occiusal units remain (equivalent to all
8 premolars, or 20 teeth in shortened dental arches) does masticatory ability start to fall off more rapidly.
However plausible this model may be, it is still speculative. Above all it appears that, whilst the average
number of teeth required for mastication may be as described, there is considerable individual variation
(Kalk, W. et al., 1993).
2.3.2. The partial dentition, digestion and nutrition
If nutrition is impaired by tooth loss, due to inadequate chewing of food, or by altering the person's choice
of food as a result of discomfort during mastication, then tooth loss could have serious long term
implications. In older people, where diet may be limited by income, illness or disability, this could
potentially be of some importance. Farrell (Farrell, J., 1957; Farrell, J., 1956) investigated the effect of
mastication on the digestion of food in a series of experiments using chewed and unchewed food wrapped
in cotton mesh bags and swallowed. The results illustrated that the amount of digestion which took place
inside the bags was highly food dependent, but for at least some foodstuffs some mastication is important
for digestion. To investigate the importance of "incomplete" mastication a further analysis was undertaken
of a patient with full dentures, a patient with a partial dentition (with and without partial dentures in place)
and in a patient with a full dentition who was asked to chew a test food only with the incisors. In all of
these patients with reduced masticatory performance, digestion was shown to be no poorer than in those
with "complete" mastication. So for even the most difficult foods, incomplete mastication is sufficient for
digestion to occur to an acceptable level.
Impaired chewing may not seriously affect digestion, but it may influence food selection, and therefore
75

nutritional status. Perhaps the most obvious group for research into this subject are the edentulous who are
known to have among the poorest masticatory performance and efficiency. Dietary interviews or
questionnaires have been used on various groups of elderly edentulous subjects (Ettinger, R.L., 1973;
Hartsook, E.I., 1974; Heath, M.R., 1972; Neil!, DJ. & Phillips, HJ.B., 1970). Whilst all groups described
chewing difficulties or some dietary restriction, none displayed any serious dietary inadequacies as a result.
A number of other studies have interviewed or used questionnaires on groups of subjects with more varied
dental conditions, including dentate and partially dentate mouths, to investigate any dietary or nutritional
limitations as a result of a partial dentition. The frequency of ingestion of a number of listed foods, as well
as perceptual assessments of taste and texture, was investigated in a group of over 1200 males by Chauncey
(Chauncey, H.H. et al., 1984). The frequency of ingestion of the selected list of test foods was highest in
fully dentate subjects and lowest in edentulous subjects, with those with a compromised or partial natural
dentition lying somewhere in between. Baxter looked at intake of specific nutrients in 4 groups of 20
selected elderly subjects (Baxter, J.C., 1984). Each group had a different dental state ranging from
completely edentulous through to fully dentate. Minor nutritional imbalances were common, but were not
restricted to any one dental state, and there were no important differences between the groups. HaIling
(HaIling, A. et al., 1988) found slight differences between dentate and edentulous middle aged women when
the intake of a wide variety of nutrients was investigated. However none were considered important (except
possibly vitamin C), and when groups with different numbers of natural teeth were compared there were
no deficiencies identified. Gunne (Gunne, H.J., 1985a) investigated a group of dentate persons before and
after placement of a lower removable partial denture and found that intake of a number of key dietary
components were unaffected by the change in dental state, in spite of the fact that masticatory efficiency
more than doubled with denture provision. Bates (Bates, J.F. et a!., 1971) used a variety of physical and
haematological indicators, rather than a questionnaire, to indicate nutritional status in a group of 700 elderly
people. They compared those who wore dentures for eating or who had natural teeth with those who did
not. Only for two of the variables measured were there any significant differences at a 5% level of
probability. The variables involved (haemoglobin and haematocrit) are closely related (if one is reduced the
other is likely to be), the actual differences were small, and with 30 different comparisons made between
the two groups this finding may well have arisen by chance.
76

The previous studies have investigated a wide variety of different groups, rarely randomly selected or fully
representative. Probably the most detailed study was reported by Osterberg (Osterberg, T. & Steen, B.,
1982). They investigated the relationship between dietary intake, assessed by a validated interview
technique, and dental state according to the Eichner Index (Eichner, K., 1955) in a representative sample
of 368 Swedish 70 year olds. As this index correlated very strongly with both number of teeth and tooth
contacts it was felt that it would accurately reflect masticatory performance and "dental invalidity'.
Insufficient intake of some nutrients was significantly higher in edentulous compared to dentate persons.
The intake of some nutrients was related to the degree of dental invalidity but the relationship was weak
and confounded by socio-economic factors. This appears to reinforce the findings of previous studies that
partial loss of the dentition is unlikely to affect the nutritional status of older people at a population level.
However there is the possibility, which the authors identify, that in a few individuals or vulnerable
subgroups of the population, particularly those who are edentulous in one or both arches and in whom the
medical or financial status may be unfavourable, that the dental state could have an important contributory
role in nutritional deficiency.
Taken together, the results of these studies imply that, although choice of foods may be affected by a
reduced dentition and the resultant reduced masticatory efficiency, this may not necessarily alter the
nutritional balance of the diet. However, there remains a possibility that reduced masticatory efficiency may
predispose to certain gastrointestinal disorders. Increased frequency of gastric symptoms was reported
among patients with impaired masticatory efficiency (Rodrigues-011eros, A., 1947). The same problem has
subsequently been investigated in a more controlled manner and no increased frequency of such symptoms
was found (Mumrna, R.D.jr. & Quinton, K., 1970; Sirus, W. & Prescott, R.J., 1985).
2.3.3. The partial dentition and other aspects of function and health
Agerberg (Agerberg, G. & Carlsson, G.E., 1981) noticed that reduced chewing ability was reported more
frequently by people who considered their state of general health to be impaired than by healthy subjects.
Osterberg (Osterberg, T. et aL, 1990) used the Eichner index to compare the number and distribution of
77

contacting teeth with a number of physical measurements of general health in 1380 seventy year old
subjects. Dental functional impairment was found to be significantly associated with cognition, visual and
hearing ability, lung and heart volume, muscle strength and bone mineral content, as well as self assessed
health. Even with possible confounding factors, such as socio-economic group and tobacco smoking, it was
found that the most predictive factor for dental state was an index of seven functional capacities (including
measurements such as lung and heart volume). These findings do not imply a causative role to the loss of
teeth in the degeneration of general health, or vice versa, but probably reflect a common functional ageing
which affects the oral cavity as well as other systems.
It is self evident that an anterior space, particularly one in the upper arch will usually have a detrimental
impact on aesthetics, and that any clinician or patient would regard filling the space with a bridge or denture
as a reasonable course of treatment. Statistics to support this assumption are difficult to come by, but it may
be of significance that of the dentate population in the UK in 1988 who rely on a combination of natural
teeth and dentures, 93% wore an upper denture of some description as opposed to 32% who wore a lower.
Furthermore, only 57% of those supplied with a lower denture actually wore it, compared with 80% of
those supplied with an upper (Todd, J.E. & Lader, D., 1991). While these statistics are, no doubt, related
in part to different patterns of tooth loss and specific difficulties with the wearing of lower dentures, they
almost certainly also reflect the greater aesthetic importance of the upper arch.
The 1988 Adult Dental Health Survey also investigated the reasons for dissatisfaction with aesthetics among
adults in the United Kingdom. Gaps and spaces were overall the third most frequently quoted reason for
dissatisfaction (13%) after colour and irregularity. However, amongst the over 65 year old group, gaps and
spaces were the second most frequently listed source of dissatisfaction and were considered a problem by
far more people than irregularities were (21% to 16%). Colour was still rated the most important source
of dissatisfaction (29%). Missing teeth are a potentially important source of dissatisfaction in the elderly,
although the over 75 year olds were the group most likely to be satisfied with the appearance of their
dentitiori overail.
78
Beside mastication and the social function of aesthetics, the other major function of the dentition is speech.
Missing anterior teeth may seriously impair a persons ability to pronounce certain sounds, specifically 'f,
"th' and "v' (Chierici, G. & Lawson, L., 1973; Grant, A.A. & Johnson, W., 1983). Loss of posterior teeth
seems to be of less importance in terms of speech.
Temporo-mandibular dysfunction (TMD) is often not perceived to be a problem of the elderly and has been
reviewed in section 2.2.. However, loss of posterior teeth has been implicated as an important aetiological
factor in temporo-mandibular dysfunction by a number of authors, but the whole area of temporo-
mandibular function and occlusion is controversial. Many studies have investigated the relationship between
the number and distribution of teeth and symptoms, clinical and anamnestic findings of temporo-mandibular
dysfunction. For every study which reports a correlation between number of teeth lost or extensive tooth
loss in certain areas and temporo-mandibular dysfunction, there are at least three which find no such
relationship (De Kanter, R.J.A.M., 1990). Only one study to date has specifically looked at temporo-
mandibular dysfunction and tooth loss in an elderly population (Osterberg, T. & Carlsson, G.E., 1979). This
research was conducted on a group of 384 70 year olds and used indices described by Eichner (Eichner,
K., 1955) and Helkimo (Helkimo, M., 1974) for measurement of dental invalidity and TIvID respectively.
Only a very weak correlation (if any) was found between the two measures. Given that only 3% of the
sample reported any painful symptoms attributable with certainty to the temporo-mandibular joint, it seems
unlikely that temporo-mandibular discomfort is a significant problem following loss of teeth in older adults.
2.3.4. The replacement of missing teeth and the restoration of function and aesthetics.
Having discussed the effect of tooth loss leading to a partial dentition, the success and side effects of their
artificial replacements will be discussed. Studies of masticatory performance in relation to wearing partial
dentures or bridges are not clear cut. Masticatory performance is diminished when teeth are lost, but this
appears not to influence subjective ability to chew or oral comfort until a large number of the posterior teeth
have been lost (Kayser, A., 1981). The value of artificially replacing these posterior teeth will depend
largely on the success of prosthetic replacement in restoring lost masticatory function (if enough teeth have
79
been lost to make a difference), comfort and pleasure. One of the problems of research to investigate the
role of partial dentures in restoring masticatory function and ability, particularly in population studies, is
that of matching groups according to the number and distribution of teeth. The enormous heterogeneity in
the dental state of any partially dentate population makes it difficult to draw any proper conclusions from
most research in this field. Nevertheless a number of studies have attempted to tackle the issue.
A study by Jemt (Jemt, T. et al., 1983) investigated the form and number of chewing cycles of a test food
before and after placement of a lower removable partial denture opposing a complete upper denture. Their
conclusion was that, although the number of chewing cycles were reduced and there were minor changes
in mandibular movements after partial denture placement, the overall masticatoiy function was little
changed. Improvements in function in partial denture wearers compared to non-wearers with similar levels
of tooth loss, or with the same patients before tooth replacement, have been described by several authors
(Battistuzzi, P.G.F.C.M. et aL, 1987; Gunne, H.J., 1985b; Ranta, K. et al., 1987). In two of these studies
the subjects wore a complete upper denture and had extremely shortened arches in the lower. Lappalainen
and Nyyssonen also looked at those with a limited number of teeth in only one arch and found that those
with partial dentures were more likely to rate their masticatory ability as good (Lappalainen, R. &
Nyyssonen, V., 1987). In a study of over 1200 healthy males Chauncey (Chauncey, H.H. et al., 1984) split
the subjects into groups according to dental status and then into one of two groups according to their
masticatory performance. This design allowed different dental states to be compared for subjective
assessments of taste and texture acceptability, frequency of ingestion of certain foods and ease of chewing,
while controlling for masticatory performance. They found that inefficient partial dentures were poorer than
compromised dentitions unrestored by dentures for certain subjective assessments of eating. The likelihood
of a denture being efficient is probably influenced in turn by number of natural teeth; the more teeth that
are missing the less likely it is that a partial denture will be efficient, as there is less support and retention
available. However, the inference from this paper was that an efficient combination of natural teeth and
partial dentures giving good masticatory performance may increase the enjoyment of eating and thus
perhaps the quality of life.
80
Witter (Witter, D.J. et al., 1989) compared 99 patients with shortened dental arches, that is 3 - 5 occlusal
units (pairs of opposing premolars or half molars), split into three groups according to whether they were
partial denture wearers, previous partial denture wearers or had no history of wearing partial dentures. The
group with partial dentures and those without partial dentures and with no history of them demonstrated
no significant differences when the frequency of impaired chewing or anterior chewing were assessed
subjectively. The group who had previously worn partial dentures stood out as having a much higher
frequency of impaired chewing capacity, anterior chewing and, interestingly, aesthetic dissatisfaction, than
the other two groups. It should be noted however that the total numbers in each of the groups were
relatively small (only 25 in the current denture group and 19 in the previous wearers category).
Although there is considerable variation between these studies, there does seem to be a general suggestion
that masticatory efficiency and ability are improved by partial dentures where mastication is already likely
to be seriously hampered by tooth loss, but where a few functional posterior units remain, the benefits are
less easy to demonstrate. The improved acceptability of taste and food texture by the wearers of efficient
partial dentures found by Chauncey (Chauncey, H.H. et al., 1984) may add an extra and unexpected
dimension.
It seems self evident that if teeth are lost from an area of the mouth which has aesthetic importance, then
artificial replacement must go some way to restoring the aesthetics. Although artificial teeth may not be a
perfect representation of their natural predecessors, if the appearance of the natural teeth was poor, there
is even the possibility that they could improve the aesthetics. The 1988 United Kingdom Adult Dental
Health Survey investigated some of the factors which affected people's perceptions of the aesthetics of their
own teeth, including the provision of artificial replacements. In general older adults (55+) were more likely
to be satisfied than younger adults, and men were more likely to be satisfied than women. These differences
probably demonstrate the importance of people's expectations in the assessment of aesthetics. When
respondents who relied upon a combination of natural teeth and upper and lower partial dentures were
compared with those relying only on natural teeth, the denture wearers reported satisfaction with their
appearance more frequently than those with natural teeth (75% compared to 70%). This suggests that
81

dentures play an important role, not just in maintaining aesthetic satisfaction, but in improving it. The
number of natural anterior teeth replaced by a partial denture also seemed to have an important bearing on
overall aesthetic satisfaction. In general subjects with a partial denture were more likely to be satisfied with
their appearance if they had fewer natural teeth, while the reverse was true for non-denture wearers. In
cases where all 6 anterior teeth were replaced by a partial denture 84% of respondents said that they were
satisfied with their appearance, but where no anterior teeth were replaced resumably implying 6 natural
teeth in most cases) only 70% reported being satisfied, while only 66% of people with two artificial anterior
teeth were satisfied. These findings suggest that a combination of natural and artificial anterior teeth is less
satisfactory than either alone, a hypothesis borne out by very similar results for crowned teeth (Todd, J.E.
& Lader, D., 1991).
It is of interest that the reasons given for dissatisfaction are different depending on whether the respondents
rely on dentures and natural teeth or natural teeth alone. For both groups the most important reasons were
colour and irregularities of the teeth, although fewer of the denture wearers were concerned about the latter
(22% of denture wearers compared with 39% of those without). Gaps and spaces were more often a cause
of dissatisfaction with denture wearers than with dentate subjects (18% to 12%). However 20% of all the
denture wearers gave the reasons for dissatisfaction as "other", compared to only 8% of the dentate group
suggesting that those who were unhappy about their prostheses often had problems relating to their dentures.
Taken together, these findings imply that, in the opinion of the wearer, artificial teeth are often very
successful replacements for the real thing, that a high proportion of the population who wear partial dentures
are satisfied with the aesthetics, but that the size and distribution of restored spaces may be very important.
There are other reasons for the replacement of missing teeth in addition to the restoration of function and
aesthetics. These include the prevention of tilting, drifting and overeruption of the remaining teeth, and to
provide a transitional prosthesis prior to edentulousness. This subject has recently been discussed by Devlin
(Devlin H., 1994), but there is no indication of how successful partial dentures are in these cases,
particularly in the latter role.
82

2.3.5. Tooth replacement as a factor in dental disease
Both wearing a partial denture and preparing teeth for a bridge to replace missing teeth carry potential risks.
These may be of particular relevance to the older patient where oral hygiene may be imperfect, and there
is a greater risk from, for example, root surface caries. Increased plaque accumulation, gingival and
periodontal breakdown have been observed in patients with removable partial dentures by a number of
authors (Carlsson, G.E. et al., 1962; Chandler, J.A. & Brudvik, J.S., 1984; Derry, A. & Bertram, U., 1970;
El Ghainrawy, E., 1976; Lappalainen, R. et al., 1987). Well controlled longitudinal research by Bergman
(Bergman, B. et al., 1982; Rissin, L. et al., 1979) studied periodontal damage in the presence of partial
dentures where plaque control was kept at a very high level by patient oral hygiene and intensive
professional support over a 10 year period. The result was no progression of periodontal destruction no
matter what measure was used to assess it, although more recently, degeneration in the gingival condition
has been shown, even where plaque control is good, although this change appeared to be transient (Orr, S.
et al., 1992).
Damage to the periodontium by the unnatural physical forces exerted on remaining teeth by partial dentures,
either independent of or potentiating the effects of existing plaque is also a possibility. This subject was
reviewed by Berg (Berg, E., 1985) and his conclusion was that many of the assumptions related to the role
of denture design (specifically distal extension prostheses) in direct periodontal damage did not stand up
to critical analysis, and where it occurred, damage was more likely to be plaque related.
Data on plaque accumulation and periodontal disease as a result of the placement of fixed prostheses is very
sparse. A longitudinal study of two fairly well matched groups with a complete upper denture opposed by
a few lower natural teeth and either a distal extension cantilever bridge or a lower partial denture has been
reported (Isidor, F. & Budz-Jorgensen, E., 1987). Although higher plaque scores were recorded in the
former group, neither showed any significant progression of the existing periodontal disease over a two year
period.
83

As plaque also has a major role in dental caries, the increased plaque accumulation and stagnation areas
found associated with partial dentures and fixed bridges could contribute to the development dental caries.
In a large cross sectional survey of Finnish adults, Tuominen (Tuominen, R. et al., 1988) found that the
proportion having one or more carious teeth was slightly greater among those wearing a partial denture,
compared to those without. However, where carious teeth were present the presence of a removable partial
denture did not appear to lead to an increase in the number of teeth involved. Some progression of carious
activity over a 10 year period in his denture wearing group was reported by Bergman (Bergman, B. et al.,
1982), but with no control group for comparison the role of the denture in this is uncertain. Chandler
(Chandler, J.A. & Brudvik, J.S., 1984) also showed caries progressing over a nine year period, but there
was no difference between those who had worn a partial denture over this period and those for whom a
partial denture had been made but not worn. Two recent studies have shown an association between partial
denture wearing and root caries (Wright, P.S., et al., 1992; Drake, C.W. & Beck, J.D., 1993). Although the
sample groups in the studies were different, abutment teeth were found to be particularly prone to disease
in both.
In summary, partial dentures do lead to an increase in plaque accumulation where oral hygiene is not
optimal, and this may accelerate periodontal destruction in some individuals. The role of partial dentures
in dental caries is less clear, but again could be significant in some individuals. Caries specifically affecting
the root surfaces in relation to partial denture wearing has only been investigated recently, but there is
mounting evidence that it may play a role. In terms of plaque accumulation, and hence both diseases,
avoiding a removable partial denture and restoring anterior spaces with a fixed bridge would seem to be
a preferable option where possible.
2.3.6. The shortened dental arch
The expected increases in the number of older dentate adults and the number of teeth these people will have
has already been discussed in some detail. Despite the advantages regarding function, the cost of
maintaining a full arch of teeth into old age may be high as the cumulative effect of a lifetime of dental
84

disease has to be managed. Extraction of teeth which require extensive and expensive care may be an
attractive option to both patient and dentist. However, tooth loss will lead to a diminution of function,
possibly impaired aesthetics and in the long term perhaps even the breakdown of the dental arch, although
these changes are unlikely to have any seriously detrimental effect on health or nutrition. In many cases
the artificial replacement of extracted teeth with partial dentures is likely only to improve masticatory
function marginally (unless only very few teeth remain). These prostheses could have a role in the
acceleration of periodontal disease and dental caries, and they may be rather costly both for an individual
and for a health care system.
Kayser has described a problem based treatment planning philosophy, aimed at the targeting of resources
to key areas of the dental arch to prevent haphazard tooth loss and preserve a continuous, but shortened
dental arch (Kayser, A., 1981; Kayser, A.D. & Witter, D.J., 1985; Kayser, A.F. et al., 1990). The strength
of this concept lies in its pragmatic approach to dental health care in older adults. Shortened dental arch
(SDA) philosophy acknowledges that a complete dental arch of 28 teeth (third molars are disregarded) is
the most desirable dentition, but where teeth are lost due to disease, or where the burden of managing the
disease becomes excessive and resources are limited, then priority should be given to anteriors and pairs
of occluding premolar teeth. These are the most aesthetically important teeth, they have been shown to
provide sufficient function for comfortable and efficient mastication without the need for dentures (Aukes,
J.N.S.C. et al., 1988; Witter, D.J. et al., 1990), and above all are more straightforward to maintain than
large, inaccessible and multi-rooted molars. If molar teeth are expendable, as some of this research suggests,
it seems inappropriate to spend time and money and cause patient discomfort attempting to maintain them
where the long term benefit is in doubt. Shortened dental arch theory involves maintaining a continuous but
reduced dental arch, generally from premolar to premolar, without removable partial dentures, but possibly
with fixed bridges to maintain the integrity of the shortened arch where necessary.
The actual number of teeth in the shortened arch is not absolute, but Kayser has proposed that the
requirement reduces with age, and for those aged 70 and over it may be as few as 2 occluding pairs,
effectively first premolar to first premolar. This figure is, in fact, hypothetical and based on clinical
85

experience and extrapolation of some research data (Kayser, A., 1981; Witter, D.J. et al., 1990).
All the studies to date into the effect of shortened dental arches on the function and potential for long term
breakdown of the dentition have been cross-sectional and based on a small and highly selected group of
about 70 patients (regular attenders to a dental hospital) who have been restored to a classical shortened
dental arch. This group has generally been compared to an age and sex matched control group for a number
of factors. Studies of shortened dental arch in relation to mastication, food selection and oral comfort reflect
the findings of the many studies already described relating tooth loss to oral function, that is that tooth loss
causes some mild impairment of chewing function, food perception and selection (Aukes, J.N.S.C. et aL,
1988; WilIer, D.J. et al., 1990; Witter, D.J. et al., 1990). These problems were mild however, and only 8%
of the SDA patients reported impaired chewing ability, and only 11% aesthetic complaints. Interestingly
among the partial denture wearers who also had a shortened dental arch 20% had some complaint about
their prosthesis, whilst another 20% did not wear theirs.
Loss of posterior teeth may be expected to result in drifting of the premolars with a consequent reduction
of posterior support and an increase in anterior loading and anterior interdental spacing. Cross sectional data
from Wilier's group of patients demonstrated that there was more spacing anteriorly and between premolars
in the SDA group compared to those with a full dental arch, but the differences were small (Witter, D.J.
et al., 1987). Additional studies into periodontal support and mandibular dysfunction have shown little
difference between those with shortened dental arches and those with a full arch of teeth, but firm
conclusions are difficult to draw due to difficulty matching controls (Wilier, D.J. et al., 1992; Witter, D.J.
et al., 1988).
2.3.7. Summary - the concept of a functional dentition.
- One of the major problems likely to be faced by the dental profession in the UK over the next thirty
years is the emergence of a dentate population of elderly people with a high treatment need and loss,
or impending loss of part of the dentition. In many cases resources will be limited and the resultant
86

upkeep and management of the partially dentate mouth are likely to prove difficult.
- Such evidence as exists suggests that 20 or 21 standing teeth is the threshold at which impairment
of masticatory function becomes apparent. If further teeth are lost beyond this level, masticatory
function and ability, and the capacity to chew comfortably, are reduced. The distribution of teeth and
the presence of posterior occlusal contacts may be an important factor as well as the number of teeth.
- Although masticatory function is impaired with tooth loss, and food choice may be restricted, even
very limited mastication (where there are very few remaining teeth) is quite sufficient for acceptable
digestion and nutrition given a modern diet.
- It is reasonable to assume that some aesthetic impairment will result from tooth loss, and spaces in
the anterior region are an important source of dissatisfaction in the elderly. Evidence for a
relationship between temporo-mandibular dysfunction and tooth loss is still inconclusive.
- The greatest benefit in masticatory performance and ability to accrue from partial dentures seem to
occur in extremely limited dentitions. Where there are fewer missing teeth, particularly where the
patient has a shortened but unbroken arch from premolar to premolar in both jaws, the masticatory
benefit of partial dentures is more difficult to demonstrate.
- Efficient and comfortable partial dentures appear to increase the enjoyment of eating, but no partial
dentures may often be preferable to inefficient ones.
- Partial dentures do appear to be successful in restoring aesthetics, and levels of satisfaction are
generally higher the more teeth that are replaced.
- Where oral hygiene is not optimal, the plaque accumulation resulting from the stagnation areas
associated with partial dentures can lead to an increase in periodontal disease and possibly dental
87

caries. The increased risk appears to be generally small, and the problem is preventable if oral
hygiene is excellent. However in older adults the combination of exposed root surfaces and increased
plaque retention and stagnation associated with a partial denture could cause problems with root
surface caries. This problem has not been fully investigated.
Shortened dental arch theory is based on the preservation of unbroken, but reduced dental arches,
without the reliance on partial dentures. It is a treatment planning philosophy which is based on the
finding that significant impairment of function does not result from the loss of the molars, provided
sufficient other teeth remain. The evidence to date suggests that shortened dental arches are viable,
and may prove a useful approach in the management of the heavily restored and difficult to manage
natural dentition in the older population.
Despite the apparent potential of the shortened dental arch as a treatment philosophy and as a public
health measure its ultimate usefulness will depend on its long term success and it's adoption by the
dental profession.
88

2.4. IDENTIFYING GOALS FOR ORAL HEALTH
Any index which is used to measure the oral health of a population will be imperfect to a greater or lesser
degree. When such indices, many of which were developed for use in younger subjects, are applied to an
elderly population the imperfections can be magnified by some of the specific considerations relating to oral
health in the elderly. In addition, the pattern of disease, functional requirements and ability to pay may be
altered, and may have a bearing on what is a meaningful measure of oral health and what is a realistic goal.
2.4.1. Defining oral health
A number of bodies have attempted to define oral health, or at least to provide a goal for oral health
towards which the population should be moving. A selection of the available definitions and goals are given
below.
"To provide the opportunity for everyone to retain a healthy functional dentition for life by
preventing what is preventable and containing the remaining disease (or deformity) by the efficient
use of treatment resources" (Dental Strategy Review Group, 1981).
"The optimal function of the teeth and jaws and supporting structures" (FDI, 1982).
"The retention throughout life of a functional aesthetic natural dentition of not less than 20
teeth and not requiring a prosthesis" (WHO, 1982).
"Such a standard of health of the teeth, their supporting structures and other tissues of the
mouth, and of dental efficiency, as in the case of any patient is reasonable having regard to
the need to safeguard his general health" (National Health Service, England and Wales, 1992,
in the National Health Service, General Dental Services, regulations).
"Oral health consists of having no active oral disease and sufficient natural teeth to enable an
89

individual to eat, speak and socialise without discomfort or embarrassment and thereby to
contribute to general well being. It is desirable that this be achieved by a lifetime reliance on
the natural teeth with minimal disease experience." (proposed definition of oral health from
the working group on the oral health of the nation, J.J.Murray, pers comm.).
Some of these are definitions, some may be better described as goals. Some of them may also be more
appropriate than others, but the reason for listing them is not to offer a considered critique of each, but to
try to identify a consensus as to the most important elements of 'oral health". Only when these components
have been defined can an attempt be made to measure this in a population.
The following basic elements appear in all or some of the definitions:
1. Clinical - An absence of disease.
- The presence of natural teeth
2. Functional (mastication) - The ability to function mechanically
3. General/social function - The absence of discomfort and embarrassment and a
contribution to well being.
The inclusion of functional and social aspects are not universal, but are an important element if we are to
meet the needs of the population. In terms of the elderly, these general themes are still appropriate, and it
could be argued that those relating to social function may take on a relatively increased importance.
Some definitions include the necessity for a natural dentition, or in the case of the 1982 WHO definition,
a minimum number of natural teeth. Whilst this may be useful and appropriate as a goal (provided that the
requirement is justified), as a means of measuring the proportion of the population who currently enjoy oral
health the stipulation of a minimum number of teeth has drawbacks. These are primarily that it may exclude
some people who would otherwise fulfil the criteria for oral health and, if no mention is made of social
functioning or satisfaction, that it may include many who would not.
90

The ability of the dental profession to increase the proportion of the population who could be defined as
enjoying satisfactory oral health may depend as much on being able to keep in touch with changed attitudes
and expectations as being able to control disease. Goals for oral health should not just cover clinical disease,
but should try to take into account functional and social roles, and satisfaction with these, if they are to
record meaningfully the health of the population.
2.4.2. Disease and clinical variables as measures of oral health
Measurement of the extent and severity of dental disease is the traditional way of recording oral health in
the population, and goals or targets for oral health are usually set in these terms. Dental disease and its
sequelae (tooth loss and discomfort) lead to alterations in the impacts on social function and satisfaction
which are discussed in the next section. However, most of the clinical indices which are used to measure
dental health are really measures of dental disease and are disease specific, that is they measure only one
condition, and do not relate it to any other. Furthermore the available indices all have serious shortcomings,
even within the limited context of the disease that they are intended to measure. Some are particularly
inappropriate for the measurement of dental health (or disease) in the elderly. Setting oral health targets for
the elderly purely in the terms of these indices would be short sighted, but some indication of disease is
important. The shortcomings of individual measures are described briefly below.
DMF, the conventional measure of caries, becomes less relevant with age as teeth are lost for reasons other
than caries (Murray, JJ., 1971). It also gives no positive value for the restoration of normal function which
results from satisfactory restoration. The latter issue has been addressed with the development of the Tooth
Health and the Functioning Teeth indices (Jakobsen, J.R. & Hunt, R.J., 1990; Marcenes, W.S. & Sheiham,
A., 1993; Sheiham, A. et al., 1987) which may be a more appropriate way of presenting this sort of data
for older adults as they take into account the value of restored or restorable teeth compared with missing
teeth. The Root Caries Index (RCI) is appropriate for older adults, but suffers from problems with
diagnostic criteria (which have not been standardised) and the components combined in its construction. De
Paola (De Paola et al., 1989; Dc Paola, P.F., 1990) described in detail the variation in the index according
91

to what criteria were used to determine the presence of fillings and caries of the root surfaces. The
problems with CPITN are covered elsewhere, but it is another measure which is not entirely appropriate
for application to the elderly. The tooth wear index does not suffer from being inappropriate for the elderly,
but it does tend, in its original form, to be over-complex, and there is as yet no indication of what role tooth
wear plays in terms of the subjects well being.
2.4.3. Sociological measures of oral health.
In most research into the oral health of the population the measures used are purely clinical, and usually
record disease, as opposed to health. They have been designed by dentists to measure the prevalence or
severity of the diseases which are felt by the dentists to be of importance in terms of dental health. Many
of them measure disease history rather than the need for preventive care, and none of them record the
subject's perceived need. The dental problems which individual subjects identify as important may often
differ from those recognised using the conventional clinical indices alone, although the two may be related.
An analytical approach which takes into account the subject's social and psychological needs and handicaps
as a result of oral disease could be of particular value for the elderly, not only because the clinical indices
may be inappropriate, but also because the health care priorities are altered. In older adults life expectancy
is less and the financial situation, the ability to tolerate treatment, the reasons for seeking treatment and the
attitudes to oral health may all be substantially different from those of younger groups. For these reasons,
an oral health measure based on the patient's ability to eat, speak and function socially without discomfort
or embarrassment would be a useful adjunct to the conventional clinical measures.
Indicators of the social impact of ill health have been developed over many years (Andrews, F.M., 1981).
White (White, K.L., 1974) has reported on the use of such indicators in epidemiological studies but interest
in their development for dental research has been relatively limited. The early work by Bulman (Bulman,
J.S. et al., 1968) was unique at the time in its enlistment of sociological support in a survey of dental
health. Their findings included a clear indication of the gulf between professionally assessed need and the
92
patient's perceived need. They also indicated a widespread ignorance about oral health among the general
population. Subsequent national surveys have continued the sociological input, but the amount of
information on the impact of dental disease on normal life and on levels of satisfaction with various aspects
of the dental state has been limited. Reisine (Reisine, S., 1981; Reisine, 5., 1985) reviewed the status of
socio-dental indicators and the social impacts of dentistry, and found that most measures related to the
effect of acute dental problems, with most of the remainder concentrating on malocclusion and dento-facial
abnormalities (Baldwin, D., 1980; Rutzen, S., 1973; Schroeder, C., 1972).
That dental and oral disease has a social and psychological dimension has been shown by a number of
authors. Smith (Smith, J. & Sheiham, A., 1979) looked at a random sample of 254 adults of 65 years of
age or older. One third had experienced recent pain and 30% had difficulty chewing. A high proportion
reported some sort of social handicap as a result of these difficulties; 9% felt uncomfortable eating with
others and 13% felt embarrassed during social contact. Cushing (Cushing, A.M. et al., 1986) investigated
the social impact arising from various dental conditions in a group of 414 factory workers in England aged
between 16 and 60. Five categories of impact were measured according to what aspect of life was affected,
these included eating, communication, pain, discomfort and aesthetics. Overall 71% recorded one or more
'impacts', with the commonest being discomfort (due to food packing) or cold sensitivity. 20% reported
some difficulty eating. When the social and functional dimensions of oral health were compared with
clinical data it became clear that the two were not always well matched. In many cases oral health and
satisfaction with oral health were rated as high by the subject, who at the same time acknowledged that
there was a treatment need. There is a gulf between patient's and dentist's perceptions. Burgersdijk
(Burgersdijk, R. et al., 1991) has noted this trait in a study of aesthetics. In many cases the clinician
identified problems where none was perceived by the patient and vice versa.
Heyinck (Heyinck, J.W. & Schaub, R.M.H., 1986) reported the impacts of dental problems in a group of
complete denture wearers and found them to be minimal. The effect of TMJ disorders, periodontal disease
and denture problems on various scales covering social functioning, well being and symptoms have also
been investigated (Reisine, S.T. et al., 1989; Reisine, S.T. & Weber, J., 1989). These studies found that all
93
of the sociological measures were able to detect impacts as a result of the temporo-mandibular dysfunction,
but denture problems only affected social functioning while periodontal disease had no impact on any of
the three measures used.
Davis has argued that the impact of dental and oral disease on daily life is small (Davis, P., 1976).
Nevertheless, if the WHO goals (which include a reference to social functioning) are to be addressed, this
is an area which requires consideration. Despite the lip service paid to the concept of socio-dental measures
(Miller, W.A., 1987; Thines, T. et al., 1987) there are relatively few signs of their development and
widespread adoption. Recently a "dental activities of daily living' index has been described (Sheiham, A.
& Rosenouer, L.M., 1992). This has been reported to measure dental satisfaction quantitatively in a
reproducible manner and may prove a useful starting point for addressing the dental problems of the elderly.
Very recently a measure of the 'propensity" of adults to adopt oral self care behaviours has been tested with
a view to the detection of different treatment need groups (Maizels, J. et al., 1993). Locker (Locker, D.,
1988) has laid out a conceptual framework for the development of socio-dental indicators, but at present
no single all encompassing instrument exists. Development of such a comprehensive measure of oral health
will require a substantial input of time and resources and may be unattainable. Until such a tool is available
it would be prudent to collect information on a range of indicators which broadly cover all of the categories
and concepts of ill health, including both biophysical and sociomedical dimensions.
From the preceding review, problems with eating, dissatisfaction with aesthetics and aspects of oral
discomfort are the most often quoted impacts of dental disease on normal life and social function. At a
population level, it would seem appropriate to attempt to identify the factors which influence these and their
relationship to each other, including measures of disease, social and demographic variables. In this way
targets for oral health may be better directed: it would be all very well having a population in which nobody
was edentulous, but if they were unable to eat or loathed the appearance of their teeth, then the system for
providing the means to achieve oral health would be a failure. However, one of the problems of identifying
risk factors for dissatisfaction and difficulty eating is separating out a mass of inter-related variables. For
example, the number of teeth a person has, the subject's age and the presence of loose teeth may all
94

correlate with eating problems, but they almost certainly also correlate with each other. Such problems
require complex multivariate statistical techniques, such as multiple linear or logistic regression. The nature
of the dependent variables one may wish to examine (often categorical in nature rather than continuous
measurements) and the independent variables one may wish to enter into the model (which may vary from
risk factor to risk factor) rather limits the possibilities. Logistic regression provides an attractive option for
data of this type (Altman, D.G., 1991). Such analysis is widely used in epidemiology and has been applied
to dental data, for example to identify the risk factors for root caries and other dental disease (Locker, D.
et al., 1989; Pullinger, A.G. et al., 1993; Vehkalhati, M.M. & Paunio, I.K., 1988).
2.4.4. Summary - Identifying goals for oral health
The measurement of a population's progress towards a goal for oral health should cover all of the
important elements given in any definition of oral health. These comprise of the presence of natural
teeth, the extent and severity of dental disease and the ability to function mechanically and socially
without discomfort.
- In a population of the elderly the dental conditions required to fulfil these criteria, and the balance
between them may be different from the rest of the population.
- To date most assessments of oral health have been concerned with the presence of clinical disease.
- There is no single measure which gives an assessment of the level of health of a dentition, or its
potential to contribute to oral health.
- An essential element common to most definitions of oral health, but often overlooked due to the
distraction of clinical disease, is the contribution of oral health to social well being. Although there
is some research to indicate the presence and magnitude of the social impact of oral health and
disease, there are relatively few attempts to measure this element consistently.
95

There may be merit in the measurement of oral health being, in part, determined by the subject. An
assessment of the interaction of clinical with sociological and socio-dental factors should be a
reasonable starting point for setting realistic targets for the oral health of the elderly.
96

MATERIALS AND METHODS
97
Section 3
MATERIALS AND METHODS
3.1. SAMPLII'4G
3.1.1. Selection of areas
In order to satisfy the objectives of this study (listed in section 1.1.) three separate areas were chosen for
sampling. The requirements of these were:
- one discrete urban area in the North of England.
- one discrete urban area in the South of England, preferably outside the influence of London
commuting.
- one discrete rural area, without any major conurbations, lying close to one or other of the urban sites.
The use of such a sampling design allows comparison between the dental health and attitudes of the North
and the South of England, and between rural and urban communities. After consultation with an expert in
the social geography in the University of Newcastle upon Tyne, three areas were chosen:
- Darlington, County Durham. Darlington is a large town @opulation around ninety thousand) lying
just north of the River Tees in the south of County Durham. It is primarily an industrial town but
also has an important role as a market and service centre for the surrounding area. The industry has
been built largely around the railways, and associated heavy engineering works.
- Salisbury, Wiltshire. Salisbury is a substantial town of eighty thousand people. It is primarily a
market town and a provider of services to the local area, although it has some light industry. The
town is dominated by its ancient cathedral and consequently has an important tourist industry. As
an attractive and accessible centre of population, there is probably a marked inward influx of older
people after retirement.
Richmondshire, North Yorkshire. Richmondshire is a very large rural area in North Yorkshire with
a population of around forty five thousand. It lies between the main east coast road and rail routes
and the North Sea watershed of the central Pennines. It includes the two large dales of Swaledale
and Wensleydale. The area is largely agricultural with a number of scattered small market towns,
98

the largest of which is Richmond itself. Whilst, traditionally, the local economy has been centred
around farming, it also has an important tourist industry, and a large part of the upland area is a
National Park.
Salisbury and Darlington were the two areas studied by Bulman et al in the early 1960s (Bulman, J.S. et
al., 1968), when they were selected for similar reasons. The inclusion of Salisbury and Darlington has the
advantage of allowing some limited comparison between the two studies, separated by 30 years.
3.1.2. Age groups
A sample was drawn to represent all adults over the age of 60 in each area, but stratified into 3 groups
depending on age. The date which was used for calculating ages was 1st January 1992. This had the
advantage of falling in the middle of the study period, and of making calculation of ages very
straightforward (they could be calculated by year of birth).
The age groups were as follows:
60-64 - as a representative group of the old middle aged population, who are at the oldest end of
the dentate but heavily restored generation.
Year of Birth 1927-3 1.
65-74 - this group represents a transitional cohort between the heavily filled older middle aged and
the still largely edentulous elderly.
Year of Birth 19 17-26.
75+ - this group represents the predominantly edentulous elderly. The dentate in this group
should give some qualitative indication of the dental problems of the future.
Year of Birth 1916 or earlier.
When the data from all 3 age groups in each area has been reweighted to correct for the natural age
distribution of the population of 60+ year olds (see section 3.11.2.), it can be directly compared with that
99

from the 55+ group from the 1988 Adult Dental Health Survey (which represents the same age cohort 4
years earlier).
3.1.3. Sample size
The size of the sample in each group was decided on the basis of advice from the Department of Medical
Statistics at the University of Newcastle upon Tyne, and Miss Jean Todd from the Dental Practice Board
(Eastbourne). The final estimate took into account the likely proportions of edentulous, gender variations
and the combined prevalence of the major dental diseases as well as mortality rates and the expected
response rate among those contacted.
The response rate was very difficult to predict in advance. A large study undertaken in Newcastle
(Donachie, M.A., 1992) acted as a pilot for many of the techniques used in this research, including some
aspects of sampling. This work had reported a response rate of around 50% and it was considered that this
was the minimum that would be acceptable. A further important consideration was the number of deaths
and likely absences from home over the period of the survey. These were taken into account in advance
by using available mortality and census statistics and were added to the total. Table 3.1.1. shows the
required sample size based on a final sample of 800 for each area. Due to the diminishing population size
in the over 60 age group (as a result of the increase in mortality rate with age), it was necessary to stratify
the sample into the three bands described above with similar numbers in each to ensure adequate
representation of the oldest age group. The required sample was drawn on the basis of a target acceptance
rate of 70%, with a reserve sample to be used if the acceptance rate was as low as 50% or if the sampling
frame used contained inaccuracies leading to non-contacts. The latter was an unknown quantity and would
remain unknown until a large number of subjects in all areas had been contacted.
100

369
518
149
518
- if response rate 70%(=initial working sample)
- if response rate 50%
Difference (=finalcontingency sample
Total number of names
382 519 1270
535 726 1779
153 207 509
535 726 1779
Table 3.1.1. Required sample size for each areataking into account response rates, deaths andabsences from address.
60-64 65-74 75+ Total
Aim (intended final sample) 250 250 300 800
Required Sample
- if response rate 70%
357
357
429
1143
- if response rate 50%
500
500
600
1600
Difference (=contingency)
143
143
171
457
Additional weighting to account for deaths and absences from home occurringafter sampling
-if response rate 70% 12 25 90 127
-if response rate 50% 18 35 126 179
Difference (= weighting for 6 10 36 52contingency sample)
Required sample (including weightings for deaths and absences)
The total sample list of names was drawn (i.e. assuming a 50% response), and then thecontingency sample was removed, to be used if the response rate was below 70%.In all cases the contingency sample was used in full
The numbers for the base sample were increased in advance to take account of deaths andabsences from the address given. Deaths were estimated using mortality statistics. Absencesfrom home (e.g. due to illness or institutionalisation) were estimated from census data.
Error due to list accuracy was an unknown factor and could not be estimated in advance.
101

3.1.4. Sampling frame and procedure
The sampling frame used was the register of the Family Health Service Authority (FHSA) for each of the
three FHSA areas involved (Durham, Wiltshire and North Yorkshire). These contained all of the
information required to make initial contact. The registers depend on the individuals concerned being
registered with a local General Medical Practitioner. In the case of the over 60s this was felt not to present
a problem as it was likely that almost everyone over the age of 60 would be registered locally, so the lists
would represent an almost complete list of the over 60 year old population. The proportion of names on
the register belonging to those who had died or moved in the recent, or even distant, past or whose details
had been wrongly entered, was perceived to be more of a concern, but there was little that could be done
to establish the scale of this in advance.
3.1.5. Localisation of the Sample
Boundary limits for all three areas were determined by using postcode areas. This was necessary as the
FHSA boundaries for both the urban areas included substantial rural fringes which would be likely to alter
the profile of the samples. For Salisbury and Darlington the lists of all medical practitioners whose practice
addresses were in either of the towns were used. For Darlington this resulted in a sample almost totally
limited to the town itself. In the Salisbury sample, a number of names with rural addresses (SP3, 4 and 5)
also appeared on the lists. Further cleaning of the samples was undertaken by removing names with rural
postcodes and replacing them with randomly sampled urban ones. These names were removed before the
final sample was drawn so that the final list consisted solely of those whose addresses were in Salisbury
town.
Richmondshire, being a large rural area, presented different problems. There was a possibility of missing
a significant proportion of the population to be sampled in peripheral areas as a result of people being
registered with medical practices lying outside its geographical boundaries. Consequently, rather than using
the GMP's practice address as the basis of the sample, this sample was drawn using the postcode prefixes
102

DL8, DL1O and DL1 1. This ensured that the whole population was included in the sampling frame without
compromising the principal of random selection. These areas cover almost the whole of Richmondshire with
a small part of the adjacent rural Hambleton District. The one area not included was Catterick Garrison,
which is a discrete district dominated by, and providing housing for, military personnel attached to the
Catterick military base. Catterick Garrison is covered by postcode DL9, and because it was felt to be very
atypical, it was excluded from the sampling procedure.
3.1.6. Randomization
The two urban FHSAs presented three complete lists, one. for each age group. These were in the form of
computer ASCII files and the details were transferred to protected files on the University's central
computing facility. With the help of the Department of Medical Statistics, the lists were randomized by
assigning a random number set equal to the total number of names, and then sorting the names in numerical
sequence. Names and details could then be removed from the list in sequential batches as required. North
Yorkshire FHSA were able to perform a similar randomization procedure (by assigning random numbers)
to their register themselves. They then presented three finite samples (one for each age band) of the
dimensions indicated in Table 3.1.1..
The names required for the samples were converted into a Database format. This was then mail merged
using a word processing package in order to print out the initial introduction letter to the sample subjects.
3.2. ETHICAL APPROVAL AND CONTACTING LOCAL BODIES
After the full study protocol had been prepared, a number of local bodies were contacted both to inform
them about and request their support for the study. Ethical approval was sought initially from the joint
University and District Health Authority Ethics Committee in Newcastle upon Tyne. Once this had been
obtained the three relevant District Health Authority ethics committees were approached, and their approval
obtained. All of the appropriate Local Dental Committees and Local Medical Committees were informed
103

of the survey. The General Medical Practitioners whose lists were to be used as a sampling frame were
informed by individual letters and their support was canvassed. Local police, social services and branches
of the charity "Help the Aged" were also informed about the study at the beginning of fieldwork. It had
been intended, in the preparation stage, that the survey should be publicised widely (using the local press
for example) so that some potential subjects could be familiarised with the concept of the study before they
were contacted by the survey team. However, in view of advice from the police in one area where there
had been a spate of "bogus callers", it was felt that although the risk of the survey being abused in such
a way was small, the result (in terms of public trust and response rates) could be catastrophic. Copies of
the letters sent to General Medical Practitioners and the Local Medical and Dental Committees are included
as appendices 1 to 3, and a copy of the information sheet sent to all other bodies is enclosed as appendix
4.
3.3. PILOT WORK
Pilot work consisted of several parts. A previous study of a substantial sample of older adults living in
Newcastle upon Tyne was conducted by Donachie in 1989 (Donachie, M.A., 1992). This acted as a path
finder for much of the examination procedure and some aspects of sampling. The questionnaire was piloted
separately.
3.3.1.Piot work: sampling
The Newcastle study had used general medical practitioners' lists as a sampling frame and found that they
provided a workable sample, containing all of the information required for a study of the elderly,
specifically age and gender as well as names and addresses. Similarly the response rate obtained was found
to be as good as could be expected for such a group (and it provided a reasonable guide to the final
response rate in this study). One potential problem which was identified was that the use of only a limited
number of practice lists (as was the case in the Newcastle study) could not be guaranteed to give a
representative social mix of an area, particularly one as large as Richmondshire. This issue was addressed
104

prior to the sampling procedure already described and led to the use of the regional FHSA lists.
3.3.2. Pilot work: clinical examination and diagnostic criteria
The study of Newcastle subjects (Donachie, M.D., 1992) used many of the diagnostic criteria used in this
study. A number of specific problems were raised in the light of the Newcastle work and these were
subsequently remedied. These concerned difficulty in distinguishing between low tooth wear scores,
problems with the measurement of loss of attachment and recession, and over complexity in the scoring of
complete dentures. A general tightening of the criteria was also required to ensure that there was less room
for misinterpretation when they were used by more than one dentist. New criteria were developed and
piloted for areas which the Newcastle study had not covered, these included some aspects of the periodontal
examination, tooth contacts and soft tissue pathology. When changes were made in the light of previous
experience, they were then piloted on a selection of older patients drawn from the treatment clinics of the
dental hospital, to ensure that the alterations were appropriate and workable.
33.3. Pilot work: questionnaire
A number of questions were specifically designed for the survey but many of those used had been validated
and used in previous studies. Minor modifications to some of these questions were required in order to
make them more appropriate for the present study, but this was kept to a minimum. Details of the sources
of questions are given in section 3.8.. The full questionnaire was piloted on a selection of older individuals.
Initially these were patients in the Newcastle Dental Hospital, but subsequently a number of elderly people
who attended clubs for the over 60s were interviewed in the field. This process allowed all questions
(particularly the new ones), to be assessed, and a number of questions were deleted, reworded or moved
following this procedure.
105

3.4. PERSONNEL AND TRAINING
3.4.1. Personnel
A study of this magnitude required personnel to undertake much of the clerical work, to act as Dental
Surgery Assistants (DSAs) during visits, and to conduct the questionnaire. In addition, with around 2,400
detailed examinations to be undertaken within an acceptable time scale, two dentists were required in each
area. In all cases the author undertook around half of the examinations. The other half were performed
by a dentist from the local community dental service (a senior dental officer in each case). They were as
follows:
Darlington - Hilary Smith
Richmondshire - Pat Ludiman
Salisbury - Denise Mattin
Two DSAs for each of Richmondshire and Salisbury worked part time to share the workload of clerical and
visiting duties. In Darlington, one DSA (working 4 days a week) undertook almost all of this work herself
with some clerical assistance provided in the second half of the survey period.
3.4.2. Training the examiners
All four examiners attended a four-day intensive training block in Newcastle Dental School in late May
1991. For the last two days of this period they were joined by the dental surgery assistants who were to
work on the project.
Training for the clinical examination was split into four main sections, and one full session was devoted
to each. These were:
1) Coronal and root surface caries
2) Tooth wear, tooth contacts and spacing
3) Periodontal disease
106

4) Complete denture assessment
The subject of soft tissue disease was considered to be too wide to cover in sufficient detail, but where
cases of denture related pathology were found, these were included as part of the training. For each
assessment the training was co-ordinated to coincide with an appropriate consultant referral clinic to attempt
to ensure sufficient throughput of patients. Additional dentate elderly subjects were recruited from a number
of local over 60s clubs and centres. Nevertheless, finding sufficient elderly patients with teeth and dental
disease who were willing to be examined by four different dentists was a problem.
After preliminary discussions and training using dental models and suitable photographic material, clinical
cases were examined. Each examiner rotated around three or four patients and completed an examination
form. The forms were examined and levels of agreement were compared. Patients remained in the chairs
so that the group could return together to discuss and re-examine areas of disagreement. This process was
then repeated on at least two further groups of three or four patients, with the diagnostic process being
repeated each time. After each of the four specified sessions, two further sessions were used to tighten up
the diagnostic procedure in areas where disagreement had been highest (root caries, periodontal disease and
tooth wear were covered again).
One final "field" session was undertaken at a work centre for the elderly in Elswick, Newcastle. Further
denture examinations were undertaken in addition to examination of dentate individuals in field conditions.
Seventeen denture wearers were examined by all clinicians on this occasion. A final meeting was held to
clarify various problem areas in both the examination and questionnaire procedure with both dentists and
assistants present.
Examiners were encouraged to regularly practice examinations with their DSAs until the survey began. This
was important as there were last minute delays to the start of the fieldwork in all areas due to sampling
difficulties.
107

3.4.3. Training of the Dental Surgery Assistants
The assistants scheduled to work on the project attended for the second two days of the training period.
Training was given in interview technique and the questionnaire was examined and explained in detail. All
DSAs then had the opportunity to run through the questionnaire in pairs with the elderly individuals who
took part in the clinical training exercise. The DSAs could then offer a critique of each others performance.
Further experience in interviewing was gained during the field exercise.
Further tightening of questionnaire technique was undertaken during the first few days of the survey when
the author sat in on some of the early interviews and was able to sort out any remaining misunderstandings
or problems of technique. This monitoring process was maintained on an occasional basis throughout the
survey period to ensure that standards and standardisation were maintained.
3.5. ARRANGING THE DENTAL VISIT AND FOLLOW UP OF REFUSERS.
The data collection period ran as follows:
Darlington:
September 1991 to August 1992
Salisbury:
July 1991 to May 1992
Richmondshire: July 1991 to August 1992
3.5.1. Contact
Each subject in the sample was sent an initial letter inviting them to take part in the survey and explaining
it's purpose briefly. A copy of this letter is included as appendix 5. Letters were sent out in batches in order
to allow reasonable control of the appointment system. All of the local general medical practitioners, from
whose lists the names were drawn, were contacted and asked for a letter of support which could be copied
and sent out with the introductory correspondence to the patient. The primary reason for this letter was to
reassure the patient that the study was bona fide. In most cases this letter was supplied and the beneficial
108

effects were often apparent at the time of the visits. One practice in Richmondshire (two doctors), one in
Darlington (two to three doctors), and two in Salisbury (three doctors) did not supply letters despite follow
up. In addition, due to an early administrative problem, only a small proportion of the first batch of letters
sent out in Salisbury included a doctor's letter. This batch was exclusively sent to over 75 year olds and
may have affected the response rate in this sample significantly. About two to three weeks after the letters
were sent out, subjects for whom a telephone number could be found (using the local telephone directory)
were called and asked if they would be willing to take part. Those who accepted were given an
appointment time, and refusers were noted.
In the event of being unable to contact the subject, the telephone call was repeated on a minimum of two
further occasions, at different times of the day. If no contact could be made after three telephone calls,
at least one personal call was made by the dental surgery assistant. If the subject still could not be
contacted no further attempt was made and the subject listed as a 'non-contact". In cases where no
telephone number was available (either because the individual did not have a telephone or because they
were ex-directory) a further letter was sent to name a date and time (usually just given as am or pm) when
one of the assistants would call to arrange a full dental visit. In the high proportion of cases this elicited
a response before the call was made (the subject contacted us) which streamlined the procedure. If no
contact was received the visit was made. If the person was still not contactable after one visit, at least one
more house call was made, usually without prior warning. If there was still no contact the person was listed
as a "non-contact". In some cases, additional enquiries could be made with neighbours or the local post
office (the latter was particularly useful in remote Richmondshire villages) to establish the person's
whereabouts. Where such information was forthcoming it was followed up in the same way as before,
providing it was appropriate to do so.
3.5.2. Information on refusers
A fairly high proportion of the sample were expected to refuse to take part in the survey, and this raised
the possibility of substantial sampling bias. In order to assess the scale of this, a simple, anonymous, two
109

question questionnaire with a covering letter was sent to the refusers at the end of the study. These are
included as appendices 6 and 7. Initially this was only sent to the one group with a very poor response rate
(75+ in Salisbury), but the high response rate to this questionnaire and the results from this group suggested
that more widespread circulation would be valuable. This was a relatively expensive and time consuming
procedure so this exercise was limited to six of the nine age/area sub-groups. This accounted for all refusers
aged 65 or over in all areas. The refuser profile of those in the 60-64 age group was expected to be similar
to that for the 65-74 year olds (who had a very similar response rate). It also ensured that all of the groups
with the lowest response rates were included.
In order to maximise the response rate to this postal enquiry, the questionnaire was limited to two key
questions: one to establish whether or not the subject was dentate, and the second to detennine the normal
dental attendance behaviour of the refusers. The wording of the latter question was identical to that used
on the main study questionnaire. Data on the gender, age and postcodes of the refusers was already
available. Although information on social class would have been desirable, obtaining sufficient information
to determine this accurately from the questionnaire would have complicated the document considerably and
ran the risk of reducing the response rate.
3.6. THE PROCEDURE FOR THE DENTAL VISIT
Once an appointment for a dentist to visit had been made, the procedure followed was standardised. Each
visit lasted around half an hour (if the patient was edentulous) and three quarters of an hour if they were
dentate, but times varied enormously, between 20 minutes (for the busy or curt) and well over an hour (for
the lonely, deaf or conversational). On arriving at the home, the dentist would give a brief description of
the nature of the study and explain the background to it. Written consent was then obtained using a consent
form separate from the main questionnaire (see appendix 8). This was followed by Section 1 of the
questionnaire conducted by the dentist, an examination of the mouth and denture (where present), and then
a final questionnaire conducted by the assistant. At this point it was normal for the examiner to leave the
house in order to avoid the possibility of biased responses as a result of the dentist's presence.
110

The full examination was undertaken in every case, unless the patient was in one or more of the following
categories:
- any history of rheumatic fever
- any history suggesting valvular heart disease
- any history of a joint replacement
If the subject fell into any of these groups the periodontal examination was not carried out in view of the
risk of inducing a bacteraemia. Although this may seem unnecessarily restrictive, it was felt that where the
patient was not going to benefit directly from the examination, no risk was ethically acceptable if it was
avoidable, even if it is barely significant.
Each examination covered the following areas, usually in the order given, although different examiners may
have varied the sequence slightly to suit individual preferences.
1) Coronal surfaces of all natural teeth for caries and restorations
2) Root surfaces of all natural teeth for caries and restorations
3) Wear of cervical and coronal surfaces of all teeth
4) Pocket depth, loss of attachment, the presence of calculus and bleeding on probing were recorded
for two sites on each tooth. The presence of furcation involvement and mobility were also recorded
for each natural tooth.
5) Contacts between natural lower posterior and natural upper posterior teeth.
6) Presence of spacing in the anterior region
7) Clicking, crepitus or tenderness of the temporo-mandibular joint
8) Soft tissues of the oral cavity
9) Partial dentures
10) Complete dentures
A list of instruments and equipment is given in appendix 9. Clean instruments were required for each
examination and sufficient kits were carried to allow this. All instruments were then cleaned, autoclaved
and bagged at the end of the day, ready for the next days examinations. Only a limited number of Willis
111

and Alma Gauges were available and as these were for extra-oral use only, these were wiped down with
alcohol wipes after each use.
3.7. THE DIAGNOSTIC CRITERIA FOR THE EXAMINATION
Where possible and appropriate, existing diagnostic criteria were used as a basis for the criteria in this
study. However, whilst those available are appropriate for the groups for which they have been designed,
usually children or younger adults, they often required modification for use in an elderly population. The
examination form is included at the end of the questionnaire as appendix 10.
3.7.1.Coronal decay and restoration
Diagnostic criteria for coronal surfaces were based on those given in the WHO document Oral Health
Survey; Basic Methods (WHO, 1987), those used in the Adult Dental Health Survey (Todd, J.E. & Lader,
D., 1991) arid those described in the British Association for Community Dentistiy (BASCD) document
Information needs for monitoring dental health and for planning local dental services (BASCD, 1991). The
criteria for identifying decayed teeth and unsound restorations are very similar in all three documents.
Some categories used in the publications above were not required, specifically a code for sealant
restorations and a group of codes used to identify materials used for various restorations was felt
unnecessary. As surface data was being recorded, no code for "decayed plus filled" was included, for
simplicity only one code was used for all cases where caries and restorations occurred together. Similarly,
no code for "arrested dentinal decay" was used, any such surfaces were coded as sound. However, it was
felt necessary to introduce one code, to distinguish between satisfactory and unsatisfactory crowns. This part
of the examination was conducted with a sickle probe blunted to 0.2-0.3mm.
For this part of the examination the coronal and root surfaces were examined separately. Each surface was
coded according to the criteria given below. The examination was primarily visual with the blunted sickle
probe used solely for the removal of plaque and debris and for gentle probing of certain lesions. The probe
112

was not routinely inserted into the pit and fissure systems of the teeth and was intended for the removal
of plaque and debris and to detect the surface texture of certain lesions.
Coronal surfaces were scored as follows (the number or symbol indicates the code inserted on the form).
Missing: - (dash or minus sign)
Indicated that the tooth was missing, for whatever reason.
Sound:(0)
Surface was present, but was not carious or restored as defined by codes below.
Carious - restorable: (2)
A carious cavity was present which, taking into account the patients oral status, was deemed to be
restorable. The criteria for diagnosis of a carious cavity were:
Pits and fissures - Breakdown of the walls of a pit or fissure or shadowing beneath the enamel surface,
detected visually after cleaning with a probe. Stained fissures were not necessarily designated as carious.
Approximal surfaces - A cavity with a soft floor detected by gentle probing, or brown/grey shadowing
detected visually from the buccal or lingual, or occlusal aspects.
Smooth surfaces - A cavity with a soft floor detected by gentle probing.
Arrested caries, appearing dark brown/black and having a hard floor was not designated carious, neither
were hard floored hypoplastic pits.
Carious - exposed/unrestorable: (3)
A carious cavity, as defined above, which was considered to be so extensive that (a) there is pulp
involvement or (b) restoration is not possible, bearing in mind the present dental health status of the subject.
This may include frank pulpal exposure or deep decay without visible exposure or obvious pulpal
involvement. This should include teeth which are so carious or broken down that they are deemed to be
unrestorable, even where little or no coronal tissue remains. All surfaces involved were coded in these
cases.
Restored - needs replacement: (4)
Presence of one or more restorations which require further treatment. This may have been due to:
a) Caries, whether or not it was associated with the restoration.
113

b) The presence of a temporary filling
c) Grossly defective permanent restoration, with deficient or overhanging margins that could not be
satisfactorily improved by adjustment, or the presence of a fracture, whether or not the restoration was
mobile.
Restored - satisfactorily: (5)
One or more restorations whose margins were intact and not associated with caries, and which did not
require further treatment as defined by the code above. A permanent restoration may have been amalgam,
composite, glass polyalkenoate, gold or porcelain.
Crown - satisfactory: (6)
Presence of a satisfactory full or partial veneer crown which did not fulfil any of the criteria listed below.
Crown - unsatisfactory: (7)
A full or partial veneer crown is present which was considered to be unsatisfactory. This could be due to:
a) Caries at the margin
b) A positive margin which could not be satisfactorily reduced with a bur (in the opinion of the examiner).
c) A grossly overcontoured crown.
d) A crown preparation was present and satisfactory, or could be made to be satisfactory, but the crown
had been lost.
e) A deficient margin into which a probe could be inserted.
Bridge pontic:(8)
The presence of a bridge pontic replacing a single tooth.
Root retained but surface missin/unscorable: (*)
This included overdenture abutments or (for example) severe wear where the surface has been completely
lost. This should not include cases where there has been extensive carious destruction leading to complete
surface loss (e.g. gross caries or large filling missing). In these cases the appropriate caries/restoration code
should be applied.
In cases where the tooth was rotated, the anatomical surfaces were scored, not the position that the surfaces
had assumed. If a permanent restoration extended onto more than one surface, it was scored as present on
114
all surfaces on which it appeared.
3.7.2. Root surface decay
Coding for root surface caries and restorations was rather more of a problem. A number of specific
problem areas exist for which there were no standard guidelines when the study was in preparation. These
problems were:
1) Root surfaces which are exposed but completely or partially covered by calculus.
2) Root surfaces which are restored, but where the restoration extends onto the crown. In these cases
it may often be unclear where the disease (for which the restoration was placed) originated.
3) Root surfaces which have been restored as a result of cervical wear rather than root surface caries.
These problems required specific criteria to be formulated using existing literature and considering the needs
of the survey. The diagnostic criteria used to distinguish non-carious, from carious, and sound restorations
from unsound ones were based on those used by Katz (Katz, R.V., 1986) and the UK Adult Dental Health
Survey (Todd, J.E & Lader, D., 1991).
This part of the examination was conducted using the same sickle probe as was used for coronal surfaces.
The 0.2-0.3mm tip was found to give sufficient tactile information to judge the texture of root surfaces
during pilot work on extracted teeth. The criteria used were as follows:
Missing:(0)
As for crowns
Gingival recession/exposed root - sound: (1)
The gingival margin was below the CEJ exposing some root surface. The exposed root surface was sound,
with no evidence of restoration or caries.
Gingival recession/exposed root - caries: (2)
Exposed root surface was carious as detected visually by yellow/brown discolouration and a softened floor
on gentle probing. In the case of a large lesion which crossed the CEJ, the observer was asked to make a
115
judgement about its origins and code it appropriately.
Gingival recession - root surface caries with exposure:(3)
Root surface caries was present which clearly involved, or was strongly suspected of directly involving the
pulp.
Gingival recession - surface restored - requires replacement: (4)
Exposed root surface contained one or more permanent restorations which required complete replacement.
This may have included:
a) Caries associated or not associated with the restoration(s).
b) Temporary restoration (e.g. Zinc Oxide and Eugenol, polycarboxylate).
c) Grossly defective or overhanging restoration which would need to be replaced to make them satisfactory.
Further details of what restorations were classed as being root surface are given below under code 5.
Gingival recession - satisfactorily restored: (5)
Exposed root surface containing one or more permanent restorations whose margins were intact and were
not associated with caries. A permanent restoration was defined (regarding material) as for crowns above.
Coronal restorations (with the important exception of full veneer crowns) which extend onto the root surface
for 3mm or more were coded as a filled root surface, coronal restorations extending onto the root surface
for less than 3mm were coded as purely coronal, and the root surface dealt with separately.
Where a restoration, which is primarily a root surface restoration, encroached onto the coronal tissue (above
the CEJ), it was coded as a root surface restoration but not as a coronal one. In some cases where a
restoration straddled the cement-enamel junction a subjective decision had to be made as to whether it is
primarily a crown or a root restoration.
Gingival recession - arrested caries:(6)
Exposed root surface contains an area of decay which was considered to be arrested, as indicated by the
presence of a hard dark brown/black floor, resistant to gentle probing.
Present - unscorable: (*)
The tooth was present, but the presence of recession could not be judged. If any root surface was visible
it was scored appropriately, even where there is extensive calculus, as caries is considered rare under
calculus. Only if it was unclear whether any recession had taken place was the unscorable code used. This
116
may have been because there was a crown or total coverage of calculus making it impossible to assess the
status of the root. If some exposed root surface is present, clearly recession has taken place.
In some cases there was more than one possible code per surface. As it was impossible to multicode, a
convention for priority was worked out. This was as follows:
Primary caries > Secondary caries/restoration requiring replacement> Sound restoration > Exposed root
> no recession > unscorable.
3.7.3. Tooth wear
The index and diagnostic criteria used for the measurement of tooth wear were a modified version of those
devised by Smith and Knight (Smith, B.G.N. & Knight. J.K., 1984b). Cervical, buccal, occiusal and lingual
surfaces were scored, although in the analysis cervical data is presented separately. The original index has
five grades (0-4) to indicate the amount of tooth substance lost due to wear. It is intended to compare the
score for each surface of each tooth with a matrix of normal scores for each age band, to detect
'pathological" wear. The existing index was simplified considerably after discussions with Dr Nigel Robb
and Mr Martin Donnachie who had recently used it in two large population studies including studies of
tooth wear. The 3 lowest scores were combined to make just two. The criteria used are presented below.
The teeth are gently dried with a piece of gauze, and then examined visually, a probe may be used to
remove loose deposits and to aid diagnosis, particularly where there may be difficulty scoring in the cervical
region. Teeth are examined surface by surface, in the order: cervical, buccal, occlusal, lingual. The teeth
were scored as follows:
Score Surface Criteria
- All Tooth missing
0 All Wear not into dentine or no distinct cervical cavity.
2 B/L/Occ Loss of enamel just exposing dentine
C A definite defect present but less than 1mm in depth.
117

3 B/L/Occ Loss of enamel exposing dentine for more than one third of the surface.
I Loss of enamel and extensive loss of dentine, but not exposing secondary dentine
or pulp.
C A defect 1-2mm deep
4 BIL/Occ Complete loss of enamel, or pulp exposure, or exposure of secondary dentine.
I Pulp exposure or exposure of secondary dentine
C A defect more than 2mm deep, or pulp exposure or exposure of secondary dentine.
* B/Lu >75% of the surface obscured by decay, calculus, fracture or restoration.
0cc >75% obscured and no remaining functional cusp.
C If any restoration, decay or calculus is present at the depth of a cervical abrasion,
then this is scored * if the depth of any abrasion lesion does not coincide with an
existing restoration or lesion this may be scored 0-4 as above.
Where doubt existed the lower score was given. Where tooth wear was present on two or more contiguous
surfaces, all the surfaces were scored separately.
3.7.4. Periodontal Disease
Pocket depth, loss of attachment, the presence of calculus and bleeding after probing were measured at two
sites on each tooth. In the upper arch mesio-buccal and mid-buccal sites were probed, in the lower mesio-
lingual and mid-lingual sites were examined, the choice of sites was made after careful consideration of the
sites used in the Adult Dental Health survey and the work of a number of other authors (Ainamo, J. et al.,
1982; Carlos, J.P. et aL, 1986; Pritchard, J.R. & Laws, A.J., 1984; Todd, J.E. & Lader, D., 1991). Probing
and measurement were carried out using a CPITN type C probe. These have markings at 0.5, 3.5, 5.5, 8.5
and 11.5mm. Where pocket or loss of attachment measurements lay between the probe gradings, the
recordings were estimated, but in the final data analysis the probe gradings were used as the thresholds for
analysis, so there should have been no loss of accuracy. In addition to the measures noted above, mobility
and furcation involvement were also recorded. The diagnostic criteria are described below:
118
Pocket depth and loss of attachment: (in mm)
Probing was very gentle (25g force). When necessary, loose debris was cleared from the gingival margin
using the probe. For pocket depth measurements the unscorable code was used only where the pocket could
not be probed due to discomfort or difficulty with access. In the case of loss of attachment, the surface was
recorded as unscorable if the CEJ could not be located accurately due to gross decay, wear or the presence
of a restoration. If the position of the CEJ could be reasonably assessed, the total loss of attachment was
measured. For surfaces where either of these measurements were 10, 11 or 12mm the codes W, X, or Y
should be recorded. If any measurement was 13mm or greater it was coded Y.
Calculus: (present - 1, absent - 0, unscorable -
Calculus was detected using the ball on the tip of the CPI probe at each examination Site, and by direct
vision. Sometimes it was difficult to differentiate between sub-gingival calculus and a restoration with a
poor margin, if this was the case it was scored as "present", as both can predispose to plaque retention.
Bleeding: (present - 1, absent - 0, unscorable -
The presence of bleeding was looked for after probing a quadrant as it may take several seconds for blood
to appear at the gingival margin. The patient was discouraged from swallowing before the scoring of
bleeding had been completed.
Furcation involvement: (Absent - 0, Present but not through and through - 1, Through and through lesion
- 2 , Unscorable -
Clearly furcation involvement could usually only be recorded easily for molar teeth, however if a furcation
was present on any other tooth the space was available to record it on the form. One furcation score was
recorded for each tooth.
Mobility: (Less than 1mm movement horizontally - 1, Greater than 1mm, horizontal only - 2, Horizontal
and vertical movement - 3, Unscorable -
This was measured using a finger at one side of the tooth to detect movement while a rigid instrument (e.g.
a mirror handle) was applied to the other, the tooth was then very gently wiggled.
119

3.7.5. Posterior tooth contacts (present - 1, absent - 0)
A visual examination of the teeth in contact was made with the help of the mouth mirror and the teeth in
the lower arch which had an opposing contact were noted on the chart. The presence and position of any
contacts between upper and lower teeth were recorded. This was restricted to premolar and molar teeth only.
The lower arch was used as the index' arch. Lower teeth with an opposing contact were coded as 1, those
with no contact, or where the tooth was missing, were coded as zero. A contact was defined as "a contact
between the lower tooth and an opposing upper tooth in intercuspal position, except on rare occasions where
there is a scissors like occlusion and the point of contact would not provide any occlusal stop".
3.7.6.Spacing (none - 0, unrestored - 1, restored - 2)
All anterior spacing was recorded. An anterior space was defined as any space of greater than a half the
width of the tooth expected in that position, in the upper and lower anterior regions (between upper and
lower second premolars). Spaces were recorded in relation to their position, not according to the missing
tooth (assuming there was a missing tooth). In other words, a space at upper left canine position does not
necessarily mean that the upper left canine is missing. Spaces were recorded as restored if the space was
nonnally filled by a partial denture or bridge, or unrestored if it was not.
3.7.7. TMJ examination and soft tissues (scoring system given below)
The temporo-mandibular joints were palpated to detect tenderness and then the jaw opened and closed two
or three time with the observer's index or middle fingers touching the skin over the joint to feel for clicks
or crepitus. In all cases code 0 represents a negative finding, 1 represents left side only, 2 the right side
only, and 3 bilateral.
A brief visual examination of the lips and perioral tissues preceded intra-oral examination. Most intra-oral
areas can be visualised easily during the dental examination, however several areas were visualised
120

specifically. These were: -
I. Floor of mouth. A piece of gauze is used to hold the tongue and it is gently lifted and deflected to right
and left.
2. Mucosal surface of lips. The upper and lower lips are gently inverted to visualise.
3. Buccal sulci. The mouth is half closed and the cheeks gently retracted.
4. Soft palate - visualise directly.
The examination procedure was based on that recommended by WHO (WHO, 1980), although one mouth
mirror and a gloved finger were used in preference to two mirrors.
Only a small number of conditions were listed specifically, and these were all denture related lesions. The
coding was Yes (present) - 1, No (absent) - 0.
The three types of denture stomatitis were based on a classification first described by Newton and modified
by Budtz-Jorgensen (Budtz-Jorgensen, E. & Bertram, U., 1970; Newton, A.V., 1962). Denture stomatitis
was classified as patchy (simple localised inflammation - type I), generalised (simple diffuse inflammation -
type II), or granular (papillary hyperplasia - type ifi).
Angular cheilitis was defined as inflammation with or without cracking localised to one or both
commissures.
Denture hyperplasia was defined as a firm enlargement of the vestibular mucosa, clearly related to the
flange of a denture.
'Ulcer associated with denture trauma' applied to any ulcerated lesion which was believed to be due to
trauma alone and not any other pathological process (e.g. malignancy).
Other soft tissue disease was noted and where possible a provisional diagnosis was made, but it was
impractical to train the examiners in diagnosis for this part of the examination due to the diversity of
121

possible lesions, and the rarity of many of them. Furthermore, the previous experience of the examiners
varied enormously, so the ability to make a diagnosis based on clinical experience was obviously
inconsistent. However, examiners were asked to note and describe anything, even if they did not feel
confident to give a provisional diagnosis.
3.7.8. Partial Dentures
Diagnostic criteria for these partial denture data where criteria were required, is given below:
Do the dentures replace all missing teeth? (no - 0, yes - 1)
If extractions had been undertaken since the denture was constructed, without alteration to the denture, this
was scored "no". This question did not mean that the denture had to replace third molars, or even second
molars for that matter, but referred to gaps that were unfilled for the reason given above.
Are the soft tissues affected? (no - 0, yes - 1)
The denture bearing area was examined, and any destructive effect that the denture was having on these
tissues was noted. Only conditions related to the wearing of partial dentures were assessed (e.g. marked
periodontal destruction, tilting, caries on abutment surfaces), not those conditions common to both complete
and partial dentures (e.g.denture stomatitis). The findings were recorded separately for each jaw.
KennedyClass (I- 1,ll-2,ffl-3,IV-4)
Kennedy classification (Kennedy, E., 1942) was recorded but, in order to keep it simple, only the basic
divisions (I to IV) were used. The codes recorded did not include provision for modifications.
- I (two free end saddles)
- II (one free end saddle)
- Ill (no free end saddles, one or more posterior teeth replaced)
- IV (Anterior teeth only replaced)
The other partial denture variables recorded were material, support, retention, and the presence of missing
anterior teeth (canine to canine). These are self explanatory (see examination form; appendix 10).
122

3.7.9. Complete Dentures
Diagnostic criteria for the complete denture (data where criteria were required), are given below:
Ridge form (adequate - 1, poor - 2)
Adequate ridges were recorded where there was a definite bony ridge which could resist lateral and anter-
posterior movement of the dentures, even if the ridge was relatively low or irregular. Poor ridges were those
which were atrophic, flabby or inverted.
Matching set (no - 0, yes - 1)
This referred to whether the dentures which were normally worn were made to match each other (i.e. they
were made as a pair, or one denture was made against an existing opposing denture). A non-matching pair
was where a lower from one set was worn against an upper from a different set. Where there was any doubt
this question was scored as yes.
Occiusal wear (satisfactory - 1, excessive -2)
Upper and lower were scored separately. Excessive wear of the denture teeth was where all occlusal
morphology was lost on the posterior teeth, or only the remnants of the fissure pattern remained.
Alternatively, wear of the anterior teeth, such that over one third of the crown height was lost was also
considered excessive.
Defects (none - 1, missing anterior teeth - 2, rectifiable by repair or rebase - 3, requires remake - 4)
This refers to actual physical defects of the substance of the denture, i.e. fractures, missing teeth, rather than
to any fault which had already been scored. Missing anterior teeth referred to where there were artificial
teeth missing from the denture between first premolar and first premolar. Rectifiable by repair or rebase
was where missing teeth occurred (up to 3) or there was a simple fracture or minor defect in the denture
base. Requires remake implies an irretrievable situation where the denture defect cannot be satisfactorily
repaired.
Upper anterior tooth position (adequate - 1, too anterior - 2, too posterior - 3)
The tips of the central incisors should be 5 -10mm anterior to the centre of the incisive papilla. Greater than
this was scored as too anterior, less as too posterior. This was measured using an Alma Gauge.
123

Lower posterior tooth position (adequate - 1, lingual - 2)
The lower posterior teeth should be aligned over the ridge without any lingual undercut. Although buccal
placement is technically incorrect, the clinical implications are limited. For this reason the tooth position
was recorded as adequate (which included buccally placed teeth) or lingual. Lingual was scored where the
tooth position was lingual uni- or bilaterally. In the cases of lingual tooth position, the presence or absence
of any cross bite was noted.
Adaptation (adequate - 1, inadequate - 2)
The scoring in this case was highly subjective. The dividing line between what was acceptable and what
was not was not clearly defined, and account was taken of the quality and mobility of the ridges and the
denture bearing areas. Index fingers and thumbs were placed either side of the premolars and rotatory, and
lateral forces applied. Where movement over the tissues was greater than considered acceptable, taking into
account the denture bearing area, then the adaptation was considered inadequate. Clearly the denture bearing
areas were examined prior to this assessment.
Retention (Adequate, Inadequate, Unrecordable)
In the upper, index fingers were carefully placed in the premolar areas, taking care not to stretch the cheek
excessively and break the peripheral seal, and gentle vertical downward pressure exerted. Retention was
coded as adequate when resistance to removal was felt and when there was audible or tactile evidence of
the peripheral seal being broken. In the lower the index finger and thumb of one hand were used to grip
either side of the central incisors and gentle upward force exerted. Retention was coded as adequate when
some resistance to removal was felt. No evidence of the seal breaking was required.
Extension (adequate / underextended - 1, overextended - 2)
The denture was examined in-situ by gentle manipulation of the cheeks and direct visual examination of
the distal extension. The patient was also asked to protrude the tongue. The denture was scored as
overextended where overextension leading to displacement of the denture on examination, or soft tissue
damage was present. Criteria were identical for upper and lower denture.
Occlusal relationship (adequate - 1 , inadequate - 2)
The occlusal relationship was recorded by establishing the rest position of the mandible and then supporting
the lower denture with the index fingers and asking the patient to close together, where necessary with
124

gentle guidance to ensure that closure was along the retruded arc. The relationship was recorded as
inadequate if there was a slide of greater than one quarter cusp length (1 - 1.5mm approx.) into intercuspal
position from first contact OR if first contact was uneven, leading to displacement of the dentures on further
closure.
Free way space (satisfactory - 1, excessive - 2, too little - 3)
Free way space was measured with a Willis Gauge. A measurement was taken with both dentures in place
and in intercuspal position, and then a measurement was recorded with the lower denture out, and the
patient in the rest position. 2-6mm was considered as normal range, <2mm as too little, and >6mm as
excessive.
3.8. THE QUESTIONNAIRE
The questionnaire recorded information on some one hundred and twenty variables, although no subjects
were asked every question. Some sections only applied to the dentate, others to the edentulous and many
to both. A copy of the questionnaire is included as appendix 10. It comes in 9 sections which are briefly
described below
Section 1 includes the subject's basic details (age, gender, postcode, identification number and record
number for computing purposes). The identification numbers were designed so that the first digit was
constant for each area and examiner, and the remaining three digits are the subject's personal identification.
The remaining questions covered various medical conditions, drug usage, the presence of specific
symptoms, self assessments of health and an index of disability. The questions on medical health and drug
usage were formulated specifically for this survey. Those on disability were derived from Isaacs (Isaacs,
B. & Neville, Y., 1976) and Bond (Bond, J. & Carsairs, V., 1982) after advice from Dr John Bond and Mr
Graham Farrow in the Centre for Health Services Research at Newcastle University. The question on
medication usage asked the examiner to enter a code specifically to indicate whether any of the drugs used
had a known, potent, xerostomic effect. The criteria used to determine this are given in appendix 11.
125
Section 2 was split into two parts, the first asking about complete dentures, the second about various aspects
of edentulousness. Most of the denture questions refer either to specific aspects of history, or to levels of
discomfort and satisfaction. This was completed by anyone who wore a complete denture, even if it is only
in one arch. The second part referred only to those with no teeth. Inevitable problems of interpretation
arose with individuals who had dentures but never wore them. In these cases, if the patient literally never
wore the dentures, any dentures the patient owned were not examined, but the questions were asked (there
is provision to note their non-wearing in the questionnaire). Upper and lower dentures were considered
separately for most aspects of history. Questions in this section were designed specifically for this survey
or were previously used in the Adult Dental Health Survey.
Section 3 and 5 only applied to dentate individuals and covered various aspects of history and behaviour
of relevance only to the dentate, including history of dental pain, hygiene behaviour and partial denture
wearing. Some questions were designed specifically for this survey others came from the 1988 Adult Dental
Health Survey.
Sections 4, 6, 7 and 8 applied to all subjects and came from three sources. Some were designed specifically
for the survey and, as above, some came from the 1988 Adult Dental Health Survey. Questions on
satisfaction and function were derived from a questionnaire on the dental impacts of daily living, kindly
given by Anna-Theresa Leao, from the Department of Epidemiology and Public Health, University College
London.
Section 9 concerns various aspects of the subjects social position, specifically relating to age, income,
marital status and employment. Problems arise when attempting to socially classify elderly people. The
1981 Registrar General's classification (OPCS, 1980) was used as it was straightforward, appropriate and
directly compatible to the 1988 Adult Dental Health Survey. Advice on exactly how this classification
should be applied was given by sociologists at the Centre for Health Services Research of Newcastle.
Normally, it is applied to the head of the household, but many individuals, particularly elderly women,
would live alone and their own occupation (or previous occupation), if any, may not be an accurate
126

reflection of their social status through most of their lives. Consequently, the classification was made
according to last full-time occupation (if male or had been a single woman living independently throughout
life), or husband's last full time occupation in the case of married women or widows. Only long term
widows and divorcees presented any problem and in these cases, if the husband's last full time job was felt
inappropriate, then the classification was based on their own occupation. Single women who had been
dependent through life were classified according to the head of the household through life.
These criteria worked satisfactorily, both in pilot work and in the field. The occupation was entered on the
form by the interviewer and was then classified by the examiner after the visit. It was then double checked
by the author prior to entry onto computer.
3.9. INTER-EXAMINER VARIABiLITY
A proportion of the subjects in each area were re-examined by the other examiner. A minimum of twenty
dentate and 10 edentulous subjects were examined by both dentists in each area to measure inter-examiner
variability.
A proportion of the subjects were asked at the time of the first visit whether they would mind a revisit.
If they agreed they were subsequently contacted to arrange a visit and were at that time instructed about
the procedure. The revisits were conducted "blind" to try to minimise any bias introduced because it was
a revisit. Almost all revisits were conducted within a month of the original visit and if dental treatment
had been carried out in the interim, the examination was not undertaken (unless the subject had only
received a check-up or very minor treatment). The revisit could either be conducted by the author or the
"regional" examiner.
The procedure followed was identical to that for the original visit, but was terminated by the dental surgery
assistant at the end of the clinical examination. All relevant clinical data were collected. Statistical analysis
of these data is covered in section 3.11.1..
127

3.10. DATA ENTRY, VERIFICATION, CLEANING AND CONSISTENCY CHECKING
Data from the survey was entered onto the University's central computing facility as it arrived between
August 1991 and August 1992 by the data preparation service at Newcastle University.
The data files completed by the data preparation service were in the form of straightforward ASCII text
files. In order to facilitate analysis these were converted in to system files which could be analysed by the
statistical programme SPSSx (SPSS inc., Chicago illinois, 60611, USA). A series of such files were
produced to ensure flexibility of working and file security.
Data cleaning and verification took place at four separate stages.
1. All forms were checked by the examiner after the examination. This was to ensure that every box
which required to be completed was completed, and that all the key variables had been entered
correctly (e.g. age, social class, gender and dental status). This procedure normally took place in the
car after the visit.
2. At the data entry stage all forms were entered and then verified (i.e. re-entered) and any
inconsistencies between entries were corrected. This procedure is intended to minimise keystroke
errors and was undertaken by the data preparation service.
3. Data files were then checked visually. This was done by checking pages on screen to ensure there
were no missing lines, searching for incorrect symbols using a text editor and checking printouts of
key variables to ensure that all of these were present.
4. A series checking programmes were run. These included consistency checks on key variables (to
check for non-logical code combinations), and programmes to check ranges to detect any out of
range codes.
128

3.11. DATA ANALYSIS AND PRESENTATION
Once the data files were cleaned and ready for use, most of the analysis was done using SPSSx on the
central computing facility at Newcastle University. The only analysis conducted without using this facility
was the reweighting of data which, for reasons of convenience, were conducted using the arithmetic
function of a spreadsheet programme. The different aspects of data analysis are covered below in the order
in which they are encountered in the results section
3.11.1. Sampling bias and examiner bias
Sampling bias was likely to be dependent on response rates - bias will increase with the number of people
in the sample who refuse to take part. When data collection was finished, refusers (classed as those who
had been contacted but had refused a dental visit) in six of the nine age/area sub-groups were circulated
with a brief questionnaire. The details of this process are given in section 3.7.2.. Data from this
questionnaire, which covered edentulousness and attendance, were combined with data from the main survey
to give an estimate of the size and direction of the bias for these two key variables. The results tables
presenting these data are the only ones which present clinical or questionnaire information which does not
come from the visited sample.
Data on examiner bias was generated from two sources: Data recorded during the revisits and data analysed
on the basis of different examiners in each area. Cohen's Kappa analysis (Hunt, RJ., 1986; Landis, J.R.
& Koch, G.C., 1977) was performed on revisit data for decayed, missing and filled coronal surfaces,
decayed, missing, filled and vulnerable root surfaces, coronal tooth wear, cervical tooth wear, pocket depth
and loss of attachment. The computer programme was one written by Dr P.H. Gordon from the Department
of Child Dental Health in Newcastle for this purpose. The analyses were made in such a way as to reflect
the final analysis of the main body of the data, so, for example, tooth scores were used for coronal and root
caries data and loss of attachment scores were graded as, mild (<4mm), moderate (4-5mm), severe (6-9mm)
and very severe (9mm+). Where data was graded along a scale of severity (wear and periodontal disease)
129

a weighted Kappa was used. The weighting matrix is shown with the results of the Kappa analysis in the
results section.
The survey design ensured that one examiner (the author) examined around half of the subjects in all areas,
and there was no conscious selection of subjects for each examiner, so that the profile of the sample for
both examiners should have been similar. The information collected on the subject forms allowed all data
to be separated out by examiner so that the final data could be analysed separately for each of the
examiner/area combinations. Where there was a risk of inter-examiner variation leading to artificial
differences between the three areas, data for the author was considered alone in order to assess the presence
of these. Use of this form of survey design allowed some steps to be taken to address the problems of inter-
examiner variability, rather than just measuring it.
3.11.2. Reweighting of data
The sample was designed to give roughly equal numbers in each of the three age groups ie 60-64, 65-74,
75+ so the sample does not reflect the structure of the population as a whole where there would be a
reducing number of individuals within the age groups with age. Consequently, it would be inappropriate
just to combine the three age groups to give an "over 60' total, without first correcting for the differences
between the age structure of the sample and that of the population at large. Generally the 60-64s were over-
represented while the 65-74s were under-represented, and the 75+ group varied between under- and over-
representation depending on the area. The correction is made by reweighting the base figures (multiplying
them by a mathematical correction factor based upon the actual profile of the population studied) in each
of the age groups before combining them to get an over 60's total. The reweighting factors are given in
table 3.1.1.. These factors only give a correct result when the full samples are considered. Where sub-
samples which have different age structures (for example the edentulous) are reweighted the resultant
percentages become inaccurate. In these cases the reweighting factors are corrected by multiplying them
by a constant which maintains the ratios of the reweighting factors to each other but corrects the shortfall
(which arises as a result of a different age structure in the sub-group). Maintenance of the arithmetic
130

relationships of the reweighting factors with each other is the critical factor in these cases. Reweighting of
data was carried out using the arithmetic capability of a spreadsheet programme during the preparation of
the results tables.
The figures given in the tables for individual age groups are not reweighted (there is no need to correct
these as they stand), but where tables give a figure for the over 60's the data has been reweighted to
represent the general population. This is the data which appears in the Rwt 60+ column.
3.11.3. Presentation of data in tables
Much of the data presented in this thesis are in the form of straightforward percentages. These are usually
given for each age group broken down by gender social class and attendance pattern, as well as an all total
for each age group. In some cases the demographic breakdown was felt to be unnecessarily complex and
is not included. For all of the data relating to the dentate sample the total sample size for social class IV/V
was too small to be meaningful and data has been combined with those in social class ifi manual to give
a single manual group. The three non-manual classes have also been combined to give a single non-manual
group, so in most of the tables data is split by social class simply into manual and non-manual. The base
numbers for the all total are also given. In almost every case an overall reweighted total for all age groups
considered together (labelled as "Rwt 60^" in the tables) is also presented.
3.11.4. Confidence limits and reweighted confidence limits
Confidence limits for the proportion (presented here as a percentage) have been calculated and give a very
useful indication of the margin of error of the percentages given. Because confidence limits for the
proportion (or percentage) vary according to the proportion (or percentage) of the sample affected and the
sample size in a consistent way (see figure 3.11.1.), calculation of confidence limits for every percentage
presented subsequently would result in tables which are unnecessarily complex. For this reason a selection
of confidence limits were calculated and are presented separately in table 3.11.2..
131

255075
100150200300400800
10%11.8%8.3%6.8%5.9%4.8%4.2%3.4%2.9%2.1%
SampleSize (n)
Table 3.11.1. Correction factor matrix for reweightingto correct for population age structure.
60-64
65-74 75+
Richmondshire 0.827
1.297 0.878Darlington 0.83
1.227 0.917Salisbury 0.711
1.191 1.095
Formula for the calculation of the reweighting factors= Expected sample size/Actual sample size
where "expected sample size" is calculated from population data.
The figures given here are the basic reweighting factors, and the reweighting procedure wasalways according to these relative proportions. In some cases, where sub-sampleswere being used (for example the dentate), reweighting factors had to be multiplied by aconstant to maintain accurate statistics, but the relationship between the reweightingfactors was always the same.
Table 3.11.2. 95% Confidence intervals for differentsample sizes and percentages of the sample affected
Percentage of sample affected25% 50% 75%17.0% 19.6% 17.0%12.0% 13.9% 12.0%9.8% 11.3% 9.8%8.5% 9.8% 8.5%6.9% 8.0% 6.9%6.0% 6.9% 6.0%4.9% 5.7% 4.9%4.2% 4.9% 4.2%3.0% 3.5% 3.0%
100%11.8%8.3%6.8%5.9%4.8%4.2%3.4%2.9%2.1%
132
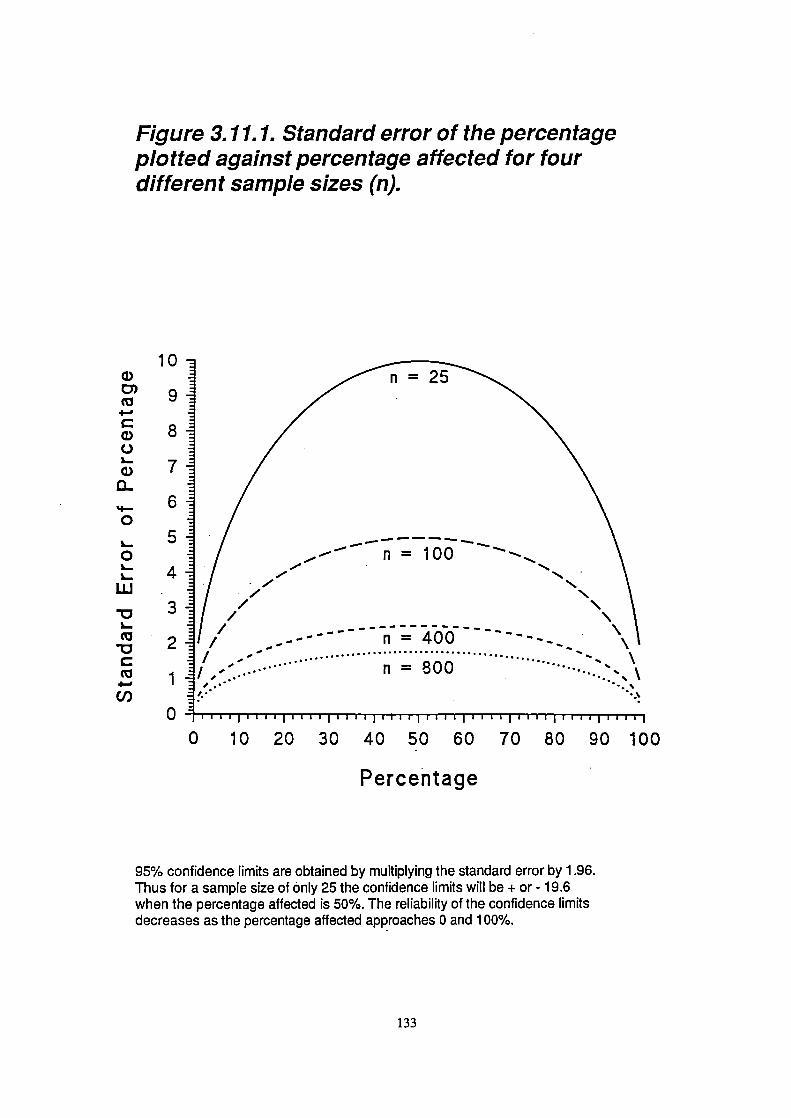
0D)
C0C-)I-0
'I-0
0L.
LU
(0
C(0
C,)
Figure 3.11.1. Standard error of the percentageplotted against percentage affected for fourdifferent sample sizes (n).
10
9
8
7
6
5
4.
3
2
1' '1 -...•• .....
0 111111111111111 Iii I III 11111111111111111111111111
0 10 20 30 40 50 60 70 80 90 100
Percentage
95% confidence limits are obtained by multiplying the standard error by 1.96.Thus for a sample size of only 25 the confidence limits will be + or - 19.6when the percentage affected is 50%. The reliability of the confidence limitsdecreases as the percentage aftected approaches 0 and 100%.
133

The standard error of sample means does not vary in such a predictable way and instead is dependent on
the distribution and variance of the values used to calculate the mean. For this reason, standard errors or
confidence limits have to be presented for each mean value given. In the tables where mean values are
given, an overlay has been provided which gives the figure from which the confidence interval (95%) can
be calculated. The mean plus or minus the value given on the overlay represents the 95% confidence limits.
Where reweighted totals are given, the confidence intervals should also, theoretically, be reweighted. This
is done using the formula:
1 .96x 1 xSEp1)2 ^(w2xSEp2)2+(w3 xSEp3)2
where w 1 , w2 and w3 represent the weights for each of the three age groups, and SEp 1 , SEp2 and SEp3 the
standard error of the percentage for each of the three age groups (Sneder, G.W. & Cochran, W.G., 1967).
Reweighted confidence limits not only vary according to the total sample size and final reweighted
proportion, but also to the combination of sample size, weight and proportion for each component part. For
this reason it is impractical to present confidence limits for a selection of proportions and sample sizes. The
effect of reweighting the confidence limit was tested using a number of examples, and comparing these with
the confidence limits obtained using the reweighted data but not reweighting the confidence interval. The
findings are presented in table 3.11.3. and, in view of the very small difference between reweighted and
unreweighted confidence intervals, it is recommended that the confidence intervals presented in table 3.11.2.
are also appropriate for reweighted data.
Standard errors for mean values have also been reweighted using the same basic procedure, and the figures
from which the 95% confidence limits can be calculated (the mean +1- the figure given) are presented on
the overlays in the Rwt 60+ column.
134

(0 LI)+ U) c'.i ,-
a, 0000.
+ - (NU) a, 00Q)
C.) ('5
0Cm)
to03
.)
'U
0 E
Cm)
wo"U..-
Cf5
w
a,C) =a, a,.E.5 a,.a, C)
a, a,a,C.o D C
Na
a,a, .- C)CC —C) a, a, 0C5 a, CC- -—C. C 0C) — a,C U) a) -
>,5a,
a,oa,
2:' C •a,a,a,>-a,a)
:: a, a,DU)
.0 C_'m i- E'.a,C)
Na,-.0— a, a —C C
Eoa,a, U) >
C - .0 a,g 2
0-U) - •)
a, - E ':2 — a, a,
a, = a, (I)
>^0 U) -o-.a, 0. C C.> a)—o2— C) a,a, .-1
a, .0 a,, 2: a,E a, a, C= a, . —
a,0__ a,a,
C) C CC a, a,' C a,
a, U) ) =a)
— a, a, a, 0CC —
a,C C a, U)
.2' a, C Sa, 0.220UI- 0 LI)
C) C 0 0)
Ca,(I,
C .0(I, .
oa,-(/). .IDa,
a,0
C_Ca,
a,
U) =
I-
cU
0a,Eo.= C2
CC
a,
—
-- Ca,)
a,
IDa)-C)C
E .NU) - U)
C_a, a,a,a,
Ea,
C =— = a,a) .-.c
a,C.)
&_ ,- 1
CC
+ 0 C') LI) Cocc-)
+c'J.C.o 0 C') LI) Co
=+ C\J C'J co
LI) LI)
+ CD 0o a, (N C') COCo C,,
NNNa,Cn
0.0.0.EEEa,a,a,— U) —
C) a,
. (0 0) CI—r--coLc)
+ .0 ,- c' -U, 0)0)00)
-,--'--.1.:C',c')c')000
co
000
.00C)
r- a, o -
CD a, 000
C r-. c'.i
0. LI) LI) (N
0 Frn;.
U)
U)
. C\ILI)CJCl) 0)O0)
• C)LOU)
CDUC\CJC'JC) 000C
C) ..0 ,_.
C)
CO LI) N-C cpa, 00C) C.VII-C0 U)C)
a,WU)C) NNNa,a,a,a,Qa,
C) 0.0.0.EEE0 a,a,u— U) —V a, a,
U) a,C)C) =U)
1
C,a,-Qa,C
C0a,.0Ca,0C,)00a,C0C.)a,10
C)
135

3.11.5. Manipulation of clinical data
For some of the clinical dental data specific manipulation had to be undertaken to make them concise and
meaningful. The methods used are covered below.
Decayed missing and filled teeth (coronal and root surfaces).
Data on the condition of the crowns of the teeth were collected on a surface by surface basis, but for
presentation, were converted to tooth scores. An hierarchical recoding system was used so that the worst
surface score dictated the category into which the tooth was put. Teeth were classed as decayed if any
surface was decayed or had an unsound filling, as filled if there was no decay or unsound restoration but
there was a sound filling, and as sound if there was no decay or filling but at least one surface was recorded
as sound. Teeth were classed as unscorable only if all surfaces were unscorable, otherwise they were classed
according to the scorable surfaces. A tooth was missing if no scorable or unscorable surface was recorded,
in all such cases all of the surface codes will have indicated a missing tooth.
The decayed category includes teeth with caries, teeth with unsound restorations (including unsound
artificial crowns) and teeth with temporary restorations. Consequently the decayed component of the coronal
data gives an indication of treatment need. Data on the different constituents of the decayed component
were calculated and presented separately. The filled component includes teeth which are otherwise sound
but have any restorations, including full coverage artificial crowns.
A coronal caries index (CCI) has also been calculated and is given in tables 4.2.7. and 4.2.8.. This is a
straightforward calculation based on the sample means according to the following formula:
CCI(%)= decayed ^fihled teethxlOO
Standing teeth
The CCI is presented as a percentage and so represents the percentage of all teeth which are decayed or
filled. A Coronal Caries Index for decayed teeth alone is also given and marked as CCI(d) on the tables,
this is calculated in the same way as the CCI but considers only decayed (not decayed and filled) teeth.
136

These indices are included simply to allow the reader quickly to take into account the effect of variation
in the number of missing teeth found in different subgroups.
Root caries data are treated in a similar way to the coronal data and tables 4.2.12. and 4.2.13. relate to root
surface data. As not all teeth are vulnerable to root surface decay (not all teeth have gingival recession),
it is appropriate to give some indication of the proportion of at risk surfaces which are affected. Although
treatment need may be indicated by giving the sample mean for decayed or filled teeth alone, there will be
no indication of the differences in relative risk of root caries in different sub-samples if the number of
vulnerable surfaces are not accounted for. In order to correct for variations in the number of at risk teeth
the Root Caries Index (RCI) is calculated. The formula used is:
RCI(%)=decayed^fihled roots
x 100decayed -i-fihled^exposed(but sound)roots
Once again the sample means are used in this calculation and the index is expressed as a percentage. The
decayed component in these cases does not include arrested decay. An RCI(d) has been calculated for
decayed roots alone, using the same formula but excluding filled roots from the top line.
Crown and root data have also been combined in order to give a total tooth score. Once again an
hierarchical recoding system was used so that if either crown or root were decayed the tooth was recoded
as decayed, if neither were decayed but either was filled (but otherwise sound) it was recoded as filled and
if neither crown nor root were decayed or filled the tooth was recoded as sound.
Manipulationofdatafortoothwear
Tooth wear data were collected for four tooth surfaces; cervical, buccal, incisal/occiusal and palatal/lingual.
In view of the different pathogenesis and treatment implications of cervical wear, data on cervical and
coronal wear were separated for the purpose of analysis and presentation. Data on coronal wear were
collected on a surface by surface basis for buccal, incisal/occlusal and palatal/lingual surfaces. However
137

where severe wear was present, all surfaces were often affected and it can be difficult to score individual
surfaces separately. For this reason, and for simplicity of reporting, the worst score of the three is used to
give an overall tooth score.
For both cervical and coronal wear a threshold score of three on the tooth wear index was used, so the data
was analysed on the basis of the percentage of the population with wear of grade three or worse. In the case
of cervical surfaces this is the minimum amount of wear consistent with a possible treatment need. In the
case of coronal surfaces, grade three wear represents a substantial loss of tooth substance, but not enough
to expose secondary dentine.
Manipulation of data for periodontal disease
A variety of periodontal data were collected in the field, including pocket depths, bleeding and calculus
scores, a measurement of loss of attachment (L0A) and data on mobility and furcation involvement. With
the exception of the last two, these data were collected at two points on the tooth (mesio-buccal and mid-
buccal on the uppers and mesio-lingual and mid-lingual on the lowers). In order to make the presentation
of these data more straightforward, a tooth score was recoded by taking the worst of the two measurements.
Standard WHO recommended tables of CPITN were calculated for this data (WHO, 1987), but additional
tables were generated relating to loss of attachment and mobility. This is presented as frequency tables for
those with certain thresholds of disease. For loss of attachment (LoA) the thresholds used were at 6mm or
greater and 9mm or greater as these correspond to the marks on a CPITN type C probe.
3.11.7. Logistic Regression Analysis
Logistic regression analysis is a multivariate statistical technique which can be used for estimating the
probability of an event occurring, or the probability of an individual falling into any given category, on the
basis of a set of independent variables. It allows the effect of each independent variable to be assessed in
the context of a model including a range of other potentially contributory factors. Logistic regression
analysis was carried out in this study to identify the independent variables which play a role in
138

dissatisfaction and problems with function, denture wearing and certain dental diseases (with particular
reference to the role of partial denture wearing).
The LOGISTIC REGRESSION command of the statistics programme SPSSx was used to conduct the
analysis for this study (Norusis, M.J., 1990). All variables to be used in the analysis were selected,
converted into a separate data file and recoded for the purpose. A forward stepwise procedure was used in
all cases. This involves the individual logistic regressions for the full range of independent variables being
tested separately. Then the most significant factor is entered into the statistical model created by the
computer and the logistic regressions are recalculated taking its contributory effect to the model into
account. The most significant of the remaining independent variables is then included and once again the
contribution of each factor is recalculated. This procedure is repeated with variables being added to the
model if they are significant, and removed from the model if they become non-significant until no more
significant factors can be included or non-significant ones removed, when the model is deemed to be
complete. In some cases interactions of a combination of different independent variables were included in
the list of independent variables.
The results of this procedure are presented in a series of tables. The data given in each table includes the
following:
1. The dependent variable. This is given in terms of the presence of a problem, a disease or a condition.
The data given for each independent variable indicate the change in the likelihood of this problem,
disease or condition being present.
2. The number of cases (subjects) used in the analysis (n). Where periodontal data was included as a
variable only those subjects who underwent a periodontal examination could be included.
3. A constant is sometimes included (by the computer programme) in the model. The values for this
constant have been given where one was used.
4. The significant independent variables. These are expressed in terms of risk factors, so that where
gender (for example) is significant it is expressed in terms of "being female", and where dental
attendance is significant it is "being a dental non-attender".
139

5. A description of the type of independent variable being reported in each case, for example
dichotomous (e.g. male/female, partial denture presentino partial denture present), discrete
quantitative (e.g. age in years, number of missing teeth) or categorical variables (e.g number of
missing teeth divided into 3 categories, 0-7, 8-15, 16+). Most of the variables present are
dichotomous and in these cases the odds ratio which is subsequently reported, is the relative odds
of that risk factor (e.g. being female). For discrete quantitative variables (e.g. age, number of teeth)
the odds ratio reports the odds change when the variable increases by an increment of one (e.g. one
more tooth or one more year of age). This is an important distinction and should be borne in mind
when interpreting the tables. In one case (denture wearing) categorical variables with more than two
categories are included. These were used for tooth number and the number of posterior contacts
because the data clumped neatly into three or four categories. The odds ratios here indicate the odds
change for that group compared to a reference category. In these cases the nature of the group and
the reference category are both given.
6. The value of 'B', which is the logistic coefficient and represents the change in the log odds for a
one unit change in the independent variable.
8. The standard error of "B'.
9. The significance (p) of the correlation for each independent variable in the list with the dependent
variable. Independent variables are included in the list and in the model if they are significant at the
0.05 level.
10. The partial correlation of each independent variable with the independent variable is given in the
column marked "R". This can vary between -1 and 1, a negative score indicating a negative
correlation with the risk factor. It should be noted that this is the correlation, taldng into account the
effect of other independent variables in the model.
11. The odds ratio is given in the column marked exp (B). This represents the predicted change in the
odds comparing the odds where the risk factor is present with the odds where it is not. This figure
then represents the predicted change in the odds in the presence of the risk factor (independent
variable). This is the key indicator of the effect of any of the independent variables.
12. A list of non-significant variables which were tested but not included in the final model.
140

In order to provide a structure to look for likely contributory factors for dissatisfaction and eating problems
a model was designed illustrating possible theoretical relationships between groups of factors to be tested.
The design of the model was based on the findings of previous analysis of the data (for example differences
in frequencies in different sample groups), research findings published elsewhere and logical, but untested,
relationships. This is illustrated in figure 3.11.2.. The factors included as independent variables in each
procedure varied according to possible predicted relationships.
Several statistics relating to how well the model fits the data were also calculated during the procedure.
These include the % correct c1assfications, the -2 Log Likelihood and the Goodness of Fit. Their inclusion
in the tables would have made them unnecessarily complex, but they have been referred to in the text where
appropriate.
The logistic regression procedure examining the factors contributing to partial denture wearing included
variables covering socio-demographic factors as well as clinical factors. The procedures conducted to
identify the role of partial dentures in coronal and root caries and periodontal disease included a set of
factors indicating disease history, as well as partial denture wearing and various socio-demographic
variables.
141

V
VU
-C,, V
VV o
V
= c .— 0
VoE'-
L
a.
—
a.
—
E
.-
a.
a.
••
•.. C.
• 'o.
- V —
Cl
0
0
V- =
EV
;
•
- 0 o 0.)0 0)
I- C/) , Cl)
E0
ECl)
o.
0
0
1 0
c L.. C
0
0.)
4-
. 0.)U-
C4
0
0cO)— I-
+
. V
•. -•! .V
0_Vd)
.0 C4...C.)
•0 4-4
•
0)0
0C.)
0 u
=— 41)
0.)
- V 0
.-. 0.).0
-2E
0)041)
142

RESULTS
143

Section 4.
RESULTS
4.1. THE SAMPLE
This section is divided into 5 parts. The first presents response rates and the final sample size and profile,
as well as data on sampling bias and inter-examiner variations. The remaining four parts reflect the subject
matter covered in the four sub-sections of the literature review. These are clinical data (4.2.), and
questionnaire data, including data on demands, attitudes, barriers and access to dental care (4.3.). Section
4.4. covers the relationships between dental condition and the ability to function in the partially dentate,
including the results of investigations into the role of partial dentures. Section 4.5. presents the results of
analysis of the interaction of a variety of influences on the oral health of the elderly within an overall
model.
4.1.1. Response rates
Response rates are shown in table 4.1.1.. These were calculated from those subjects with whom contact was
made at some stage. Individuals who had died or moved home, whose names were on the sample list due
to a list error in the sampling frame, or who were completely non-contactable were assumed to be randomly
distributed, in terms of their dental health, and were excluded from the figures for acceptance rate.
Response rates were between 53% and 62% for individual age/area groups, with one exception, Salisbury
75+, which achieved only 39.4%. The highest rate obtained was from the Darlington 65-74 year olds
(6 1.6%) and the overall response rate (for all areas and all age groups combined) was 54.4%. Those
subjects with whom contact was made, but who refused to be visited, are reported as refusers in the
subsequent results. This does not include subjects who had died, moved or with whom no contact could be
made for some other reason.
144

RichmondshireNames drawn
Letters sentDied
Moved/not knownNot able to contact
Contact madeRefused
Seen
% accepted (of contacts)
DarlingtonNames drawn
Letters sentDied
Moved/not knownNot able to contact
Contact madeRefused
Seen
% accepted (of contacts)
SalisburyNames drawn
Letters sentDied
Moved/not knownNot able to contact
Contact madeRefused
Seen
% accepted (of contacts)
All areasNames drawn
Letters sentDied
Moved/not knownNot able to contact
Contact madeRefused
Seen
% accepted (of contacts)
Table 4.1.1. Response rates for different sections of the sample
60-64 yr518505
53440
426171255
59.9%
60-64 yr518510
95375
373153220
59.0%
60 - 64 yr513506
22729
448204244
54.5%
60-64 yr15491521
16114144
1247528719
57.7%
65 - 74 yr533521113826
446174272
61 .0%
65 - 74 yr534525124359
411158253
61.6%
65-74 yr535531
52516
485227258
53.2%
65 - 74 yr1602157728106101
1342559783
58.3%
75+ yr723703378928
549248301
54.8%
75+ yr72671846110105
457215242
53.0%
75+ yr720708234450
597362235
39.4%
75+ yr21692129106243183
1603825778
48.5%
Total177417295316194
1421593828
58.3%
Total1778175367
206239
1241526715
57.6%
Total17681745
309695
1530793737
48.2%
Total53205227150463428
419219122280
54.4%
145
Table 4.1.2. shows the numbers in various demographic groups in order to indicate the sample size (or base)
from which percentages were calculated. Where the sum of the base totals for subgroups does not match
the overall total exactly, it indicates that there have been a small number of cases where the data was not
recorded or was unscorable (e.g. some occupations were not classifiable on the information given). To keep
the base number of sufficient size, the social class ifi Manual and social class N/V groups were aggregated
for most of the analyses of the dentate population, the only exception being for data on attendance pattern
which were used as a major variable to split the data in all other tables, so it was felt that the more detailed
breakdown may be appropriate.
4.1.2. Sampling Bias
Initial checks on selection bias were possible by comparing this sample with 1991 census data. Male to
female proportions were compared with 1991 census data and were generally very similar with a slight
tendency to under-sampling of women for this survey (generally 0% - 4% fewer than predicted by census
data). This tendency was greater in the oldest age groups living in the urban areas. The trend is shown
graphically in figure 4.1.1..
The results of the follow-up postal investigation to establish the impact of refusers on the make-up of the
final sample, are presented in tables 4.1.3. to 4.1.5.. By including these data from the postal questionnaire,
the proportion of the sample for whom information on edentulousness and attendance is available, increases
to around 87% for the 65-74 year old groups and 80% for the 75+ groups. These figures would have been
a little higher still but for deaths and house moves between the first letter and the postal questionnaire
which accounted for at least 3% of those who were sent a refuser's questionnaire.
The edentulous were consistently under-represented, but only in Salisbury is the difference large (6% and
10% for the two groups), otherwise it is between 1.4% and 4.2% (for the two Northern areas).
146

60-641191361645233147106255
65-741331391625355104160272
75+
Total114
366187
462182
50862
16746
13449
300231
497301
828
60-64114106104823496124220
65-741201331171023487165253
75+
Total102
336140
379115
33681
26541
10944
227195
484242
715
60-64117127159622317767
244
65-741151431547133146111258
75+
Total99
331136
406150
46359
19224
8097
420136
314235
737
Table 4.1.2. 8ase numbers in the total sampleby area, age, gender, social class andattendance pattern
Richmondshire
MaleFemale
Non-ManualIll Manual
IVNAttenders
Non-AttendersAll
Darlington
MaleFemale
Non-ManualIll Manual
IVNAttenders
Non-AttendersAll
Salisbury
MaleFemale
Non-ManualIll Manual
IVNAttenders
Non-AttendersAll
147

.I—J
-o(I)
C')
a)0-o
0
E
C')
0)U-
+L()N--oci)C)
C')ci)
EU)
-C
C,)ci)
Ea)C)
U)C)
U)0
a)
a)
a)LI.. C
00)CI.-
a)
a)
Ea)
U-
a)c'j
+U,
U)
U)
a)0
0)0)
IU,N-a)a-E
I
0 0 0 0 0 0 0 0N- (0 U) C) C'4
U0! I fld0d eq, 10 e6ueued
148

75++ques difference
70.6% 3.1%
78.1% 2.7%
75.4% 3.0%
71.8% 0.2%
81.0% 1.7%
77.4% 1.4%
55.8% 6.3%57.6% 12.7%
57.0% 10.2°fo
visited67.5%75.4%72.4%
71.6%79.3%76.0%
49.5%44.9%46.8%
Table 4.1.3. Response rate with and without datafrom the postal questionnaire
65-74 75+visited v or q visited v or q
Richmondshire 61.0% 88.6% 58.4% 80.7%
Darlington 61.6% 86.4% 53Q% 80.5%
Salisbury 53.2% 87.6% 39.4% 79.9%
"v or q" stands for visited OR responded to questionnaire
Note: postal questionnaires were not sent to those in the 60-64 age group - see text
Table 4.1.4. Percentage eden tulous with and withoutincluding the data from the postal questionnaire.
65 - 74
visited + ques difference
Richmondshire males 44.4% 51.1% 6.7%
females 56.8% 58.3% 1.5%
all 50.7% 54.9% 4.2%
Darlington males 51.7% 53.5% 1.8%
females 57.9% 61.6% 3.7%
all 54.9% 58.0% 3.1%
Salisbury males 30.4% 34.7% 4.3%
females 33.6% 41.7% 8.1%
all 32.2% 38.8% 6.6%
"+ques" means that questionnaire data is included
Table 4.1.5. Percentage of dentate who attend onlywith trouble, with and without data from the postalquestionnaire.
Richmondshire
Darlington
Salisbury
65 - 74visited + ques difference26.1% 29.0% 2.9%
24.8% 32.8% 8.0%
16.6% 20.8% 4.2°fo
75+visited + ques difference43.9% 45.9% 2.0%
29.3% 42.2% 12.9%
25.8% 34.5% 8.7%
149

In almost all of the tables in this report the attendance pattern has been used to split the data into dental
attenders (those who attend for check ups) and non-attenders (those who say that they only go to the dentist
when in pain). It was therefore important to establish whether the attendance pattern of the sample who
were examined, reflected accurately that of the random sample which was drawn originally. Whilst the term
non-attender may not be strictly accurate (these subjects may attend if they are in pain) it is probably the
best of a number of alternative terms and is the one used in the tables.
The study of refusers showed that the dentate non-attenders had been consistently under-represented in the
sample who were visited. In Richmondshire this tendency was small - the discrepancy was only about 2-3%,
in Salisbury it was higher (4-9%) and in Darlington it was higher still (8-13%). As non-attenders have been
shown in this study to have very different oral health to attenders, it is likely that the oral health of the
population as a whole is a little poorer than is presented here (because there are fewer non-attenders than
there should be), although for Richmondshire the difference is probably marginal. However, most of the
tables present data for attenders and non-attenders separately to allow the effect of this bias to be taken into
account by the reader.
Table 4.1.6. gives some additional data on the educational and economic status of the sample. Salisbury had
the highest percentage of the sample who had undertaken some sort of higher education (21% compared
to only 10% in Darlington), and the youngest age groups were generally more likely to have had some
higher education. The majority of the subjects in all age groups had retired, although, for obvious reasons,
there were fewer retired people in the 60-64 year olds than in the other groups. In Richmondshire there was
a small but significant proportion still working in the older age groups (4-11%): this was a little higher than
both of the other areas. In Darlington, 30% of the sample relied entirely on state benefits, compared with
24% in Richmondshire and 18% in Salisbury. Far more of the over 75 year old subjects (28-41% for the
reweighted samples) relied on state benefits than the under 75 year olds (9-29%) in all areas.
Tables 4.1.7. and 4.1.8. give an indication of the general health and levels of disability of the sample. In
all three areas the sample were generally healthy and reasonably mobile, although the proportion who had
150

Table 4.1.6. Income and education of thetotal sample, by area and age.
Richmondshire60-64 65-74 75+ Rwt 60+
base 255 272 301 828
% having had higher education 29.0% 12.1% 16.8% 17.9%
% retired 68.2% 88.9% 95.6% 85.8%
% with no private income 17.3% 21.7% 32.0% 23.9%
Darlington60-64 65-74 75+ Rwt 60+
base 220 252 243 715
% having had higher education 15.9% 10.7% 5.4% 10.4%
% retired 76.8% 96.0% 97.9% 91.7%
% with no private income 28.6% 23.7% 41.4% 30.4%
Salisbury60-64 65-74 75+ Rwt 60+
base 244 258 235 737
% having had higher education 28.3% 15.9% 22.6% 21.2%
% retired 57.8% 91.9% 99.1% 86.5%
% with no private income 9.1% 14.0% 27.5% 17.6%
These data are based on questions 1, 2 and 4 in section 9 of the questionnaire
151
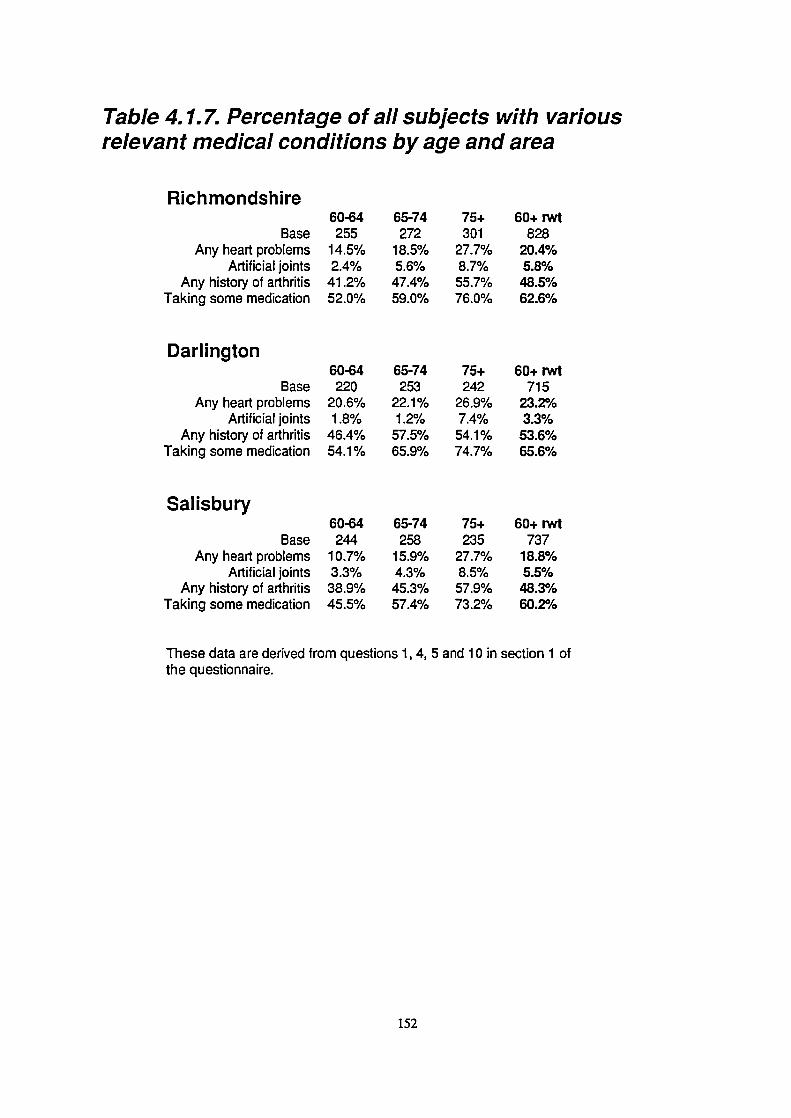
Darlington
BaseAny heart problems
Artificial jointsAny history of arthritis
Taking some medication
Salisbury
BaseAny heart problems
Artificial jointsAny history of arthritis
Taking some medication
Table 4.1.7. Percentage of all subjects with variousrelevant medical conditions by age and area
Richmondshire
BaseAny heart problems
Artificial jointsAny history of arthritis
Taking some medication
60-64255
14.5%2.4%
41.2%52.0%
60-64220
20.6%.4 00/I .) /0
46.4%54.1%
60-64244
10.7%3.3%38.9%45.5%
65-74272
18.5%5.6%
47.4%59.0%
65-74253
22.1%1.2%
57.5%65.9%
65-74258
15.9%4.3%45.3%57.4%
75+301
27.7%8.7%55.7%76.0%
75+242
26.9%7.4%54.1%74.7%
75+235
27.7%8.5%57.9%73.2%
60+ rwt828
20.4%5.8%48.5%62.6%
60+ rwt715
23.2%3.3%
53.6%65.6%
60+ rwt737
18.8%5.5%48.3%60.2%
These data are derived from questions 1, 4, 5 and 10 in section 1 ofthe questionnaire.
152

60-6437.9%22.7%0.8%0.0%0.8%
65-7442.7%25.0%.4 10/I. I /0
1 10/I . I /0
1.9%
75+45.7%36.5%18.9%4.3%12.3%
60+ rwt42.4%28.1%6.7%1.8%4.9%
60-6453.4%33.6%5.0%0.0%4.1%
65-7460.6%29.6%4.4%0.8%4.7%
75+64.6%40.1%20.3%2.5%16.9%
60+ rwt60.0%33.9%9.5%1.1%8.3%
60-6437.0%20.5%2.0%0.4%.4 0/I .J /0
65-7439.5%22.1%2.7%0.4%1.6%
75+47.0%31.9%18.3%3.8%13.7%
60+ rwt41.6%25.2%8.0%I 0/I .0 /0
5.8%
Table 4.1.8. Percentage of the sample with long termillness or disability by area and age.
Richmondshire
Long term illnessLong term illness which limits daily activity
Housebound or requires assistance to leave homeCompletely housebound
Frail (disability score of 6 or less)
Darlington
Long term illnessLong term illness which limits daily activity
Housebound or requires assistance to leave homeCompletely housebound
Frail (disability score of 6 or less)
Salisbury
Long term illnessLong term illness which limits daily activity
Housebound or requires assistance to leave homeCompletely housebound
Frail (disability score of 6 or less)
This table is based on data from questions 12 to 15 in section 1 of the questionnaire.
The disability score is calculated from an eight item index (questionl 4), the overall score foreach person could range from 0 to 16, where 0 represents the most severe disability and ascore of 16 indicates no disability. A score of 6 or less is considered as frail.
153
problems with mobility increased with age. Heart complaints were reported by 19-23% of the reweighted
samples and arthritis affected around half of all subjects. Both tended to increase with age. Between 60%
and 66% of the sample used some form of regular prescribed medication, again increasing with age.
Although long term illnesses were reported by a rather high proportion of the samples (60% in Darlington
and 42% in the other two areas) the housebound, partially housebound and frail constituted a rather small
part of the sample, although the number affected was much higher in the over 75 year old groups (see table
4.1.8.). The sample from Darlington appeared to be consistently less well than those from the other two
areas, with heart problems, arthritis, medication usage, long term illness with and without associated
disability were all found to be more common. Reduced mobility and frailty were also more common in
Darlington, sometimes much more common. In summary, although the samples were not in perfect health,
they were generally fit, mobile and independent.
4.1.3. Examiner bias
Inter-examiner variation is inevitable in this sort of research. Because of the design of this study, where
different examiners covered different areas, consistent over or under scoring by one examiner, relative to
the rest, could suggest differences between areas which are simply due to the examiner bias. Table 4.1.9.
shows the variation in scores recorded by separate examiners in the parts of the sample that they examined.
However, to ensure that inter-area comparisons of clinical data could be made, one examiner (the author)
carried out around half the examinations in each area. There was no conscious selection of subjects seen
by each of the examiners.
Kappa scores, based on repeat examinations, were also calculated for a variety of clinical dental variables.
Table 4.1.10. presents data for variables which had low kappa scores and gives data recorded for examiner
JGS alone, as he examined similar numbers of subjects in all areas. The variables presented in this table
cover root surface caries, tooth wear and periodontal disease. The kappa scores themselves and the
weighting matrix used in the calculation of some of these are presented as table 4.1.11. It is evident that
154

base270237
270237
270237
270237
270237
270237
base142164
142164
142164
142164
142164
142164
Richmondshirebase205 17.03193 16.26
205 0.87193 0.43
205 2.19193 1.59
205 10.23193 8.56
205 32.0%193 40.9%
205 21.4%193 18.4%
Salisbury
17.9017.40
0.820.57
2.152.27
11.019.61
27.8%29.1%
19.6%23.6%
Darlington
17.3116.24
0.791.24
2.283.09
10.4311.95
31.7%19.3%
21.8%25.6%
270237
270237
270237
270237
142164
142164
142164
142164
205 44.2%193 14.6%
205 2.29193 1.91
205 41.9%193 21.5%
205 3.11193 2.92
46.1%42.9%
2.653.60
45.1%63.2%
3.063.97
41.7%31.1%
2.522.86
3 9.7%51.6%
3.713.49
132140
132140
132140
132140
243199
243199
243199
243199
22.6%1.1%
47.8%21.5%
12.9%3.7%
25.0%15.1%
24.9%22.5%
44.3%57.9%
11.0%15.3%
22.9%39.4%
Table 4.1.9 Reweighted (60+) totals by observer and areafor key variables (clinical data).
Variable
Root cariesMean no. of teeth JGS
Other
Mean no of decayed roots JGSOther
Mean no of d or f roots JGSOther
Mean no of teeth JGSvu!nerable to root caries Other
% with no root decay JGSOther
RCI JGSOther
Wear% with cervical wear JGS
Other
Mean no of teeth with JGScervical wear lesions Other
% with coronal wear JGSOther
Mean number of teeth JGSwith coronal wear Other
Periodontal% with deep pockets JGS
Other
% with LOA >6mm JGSOther
% with LOA> 9mm JGSOther
% with any mobile teeth JGSOther
174 22.6%163 23.0%
174 41.8%163 49.5%
174 11.4%163 12.1%
174 17.8%163 16.5%
155

205142270
205142270
205142270
205142270
205142270
0.580.550.64
2.191.851.79
10.5010.2311.19
2 8.7%36.3%32.7%
20.8%18.1%16.0%
1.150.880.72
2.052.392.17
10.0310.6110.86
40.7%33.3%29.4%
20.4%22.6%19.9%
0.801.161.20
2.543.002.53
10.1110.4211.06
17.1%15.8%19.6%
25.1%28.8%22.9%
0.870.790.82
2.192.282.15
10.2310.4311.01
32.0%31.7%27.8%
21.4%21.8%19.6%
205142270
205142270
205142270
205142270
41.2%43.7%45.8%
2.182.522.71
36.3%37.5%35.6%
2.243.702.78
442%41.7%46.1%
2.292.522.65
41.9%39.7%45.1%
3.113.713.06
60.0%26.3%52.9%
2.443.402.74
40.0%63.2%66.7%
3.503.913.20
40.7%45.5%42.4%
2.332.202.55
47.5%33.3%38.8%
3.713.643.15
205142270
205142270
205142270
205142270
20.0%10.5%13.7%
40.0%52.6%62.7%
8.6%10.5%17.6%
20.0%21.1%29.4%
22.6%24.9%22.6%
41.8%44.3%47.8%
11.4%11.0%12.9%
17.8%22.9%25.0%
23.7%33.3%27.1%
44.1%48.5%47.1%
13.6%12.1%11.8%
23.7%27.3%27.1%
22.5%21.2%23.4%
40.0%36.3%35.6%
10.0%10.0%10.3%
10.0%18.7%17.8%
Table 4.1.10. Total area scores for clinical dental datacalculated from the data collected by one examiner, by age.
Variable Area 60-64 65-74 75+ base (60+) Rwt 60+
Mean no. of teeth Richmondshire 19.45 15.48 15.63 205 17.03Darlington 18.53 17.09 14.90 142 17.31Salisbury 19.92 17.61 16.14 270 17.90
Root cariesMean no of decayed rootRichmondshire
DarlingtonSalisbury
Mean no of d or f roots Rich mondshireDarlingtonSalisbury
Mean no of teeth Rich mondshirevulnerable to root caries Darlington
Salisbury
% with no root decay RichmondshireDarlingtonSalisbury
RCI RichmondshireDarlingtonSalisbury
Wear% with cervical wear Richmondshire
DarlingtonSalisbury
Mean no of teeth with Richmondshirecervical wear lesions Darlington
Salisbury
% with coronal wear RichmondshireDarlingtonSalisbury
Mean number of teeth Richmondshirewith coronal wear Darlington
Salisbury
Periodontal% with deep pockets Richmondshire
DarlingtonSalisbury
% with LOA >6mm RichmondshireDarlingtonSalisbury
% with LOA> 9mm Rich mondshireDarlingtonSalisbury
% with any mobile teeth RichmondshireDarlingtonSalisbury

Table 4.1.11. Kappa scores for major clinical variable
Variables
Decayed and filled teeth (crowns)
Root caries (decayed and filled teeth)
Pockets (<4mm, 4-5mm, 6mm+)t
LoA (<4mm, 4-5mm, 6-8mm, 9mm^)*
Cervical wear (<grade 3, grade 3, grade 4)*
Coronal wear (<grade 3, grade 3, grade 4)*
Darlington Richmondshire Salisbury(JGS/HS) (JGS/PL) (JGS/DM)
0.94 0.89 0.94
0.66 0.50 0.63
0.49 0.57 0.10
0.63 0.67 0.58
0.66 0.38 0.70
0.88 0.55 0.84
* Indicates where a weighted Kappa was used. The weighting matrices are shown below, the size.of the matrix (i.e. 3 x 3 or 4 x 4) depends on the number of categories used for each variable (3 or 4).
Weighting matrices for calculation of Kappa
a) 3 x 3 (pockets, cervical and coronal wear
b) 4 x 4 (loss of attachment)
1.0 0.3 0.0
0.3 1.0 0.7
0.0 0.7 1.0
1.0 0.6 0.2 0.0
0.6 1.0 0.8 0.4
0.2 0.8 1.0 0.8
0.0 0.4 0.8 1.0
157

for a number of clinical variables the comparison between areas using combined data (i.e. that from both
examiners in each area) may be unsafe due to differences between the second examiners. This has been
indicated in the text and inter-area comparisons have generally been made using the data for the author
alone.
4.2. DATA FROM THE CLINICAL EXAMINATION
4.2.1. Edentulousness
Tables 4.2.1. and 4.2.2. give the patterns of edentulousness as recorded in the sample who were examined.
Edentulousness was an area where there was a substantial known sampling bias ascertained from the follow
up questionnaire. The edentulous appeared to be more likely to refuse to take part than the dentate leading
to an underestimation of the proportion edentulous in the results. Table 4.1.4. gives the proportions
edentulous for the age and gender groups including data from the postal questionnaires. This should give
a more accurate reflection of the proportions edentulous in the three populations sampled.
For the purposes of analysis of the proportion edentulous, the sample was divided into non-manual workers,
skilled manual workers and unskilled manual workers. This data does not take into account the results of
the postal questionnaire of refusers. The proportion edentulous ranged from 15.2% for 60-64 year olds in
Salisbury to 76% for the over 75 year olds in Darlington. There was greater variation in some of the sub-
groups with totals ranging from 11.3% (non-manual, 60-64, Salisbury) to 90.2% (unskilled manual, 75^,
Darlington), however, given the small sample sizes, the confidence limits for these data will be very wide.
Salisbury generally had a far smaller proportion of the population who were edentulous than either of the
two areas in the north. It was consistently around 20 percentage points lower than Darlington, even taking
into account data from the postal questionnaire. The proportion edentulous increased steadily with age in
all areas, with about 20% more edentulous in the 75^ group than in the 65-74 year olds, and about a 15-
20% difference between the latter and the 60-64 year olds. Women and subjects from the families of
manual workers were more likely to be edentulous than men and non-manual workers. Subjects from the
158

MaleFemale
Non-ManualIll Manual
IVNBase for "All"
All
Darlington
MaleFemale
Non-ManualIll Manual
IVNBase for "All"
All
Salisbury
MaleFemale
Non-ManualIll Manual
IVNBase for "All"
All
Table 4.2.1. Percentage of the sample eden tulousby age, area, gender and social class
Richmondshire60-6425.2%32.4%18.9%40.4%54.5%
25529.0%
60-6435.1%43.4%26.0%50.0%52.9%
22039.1%
60-6417.1%13.4%11.3%22.6%21.7%
24415.2%
65-7444.4%56.8%42.0%54.7%72.7%
27250.7%
65-7451.7%57.9%41.9%64.7%70.6%
25354.9%
65-7430.4%33.6%23.4%46.5%42.4%
25832.2%
75+67.5%75.4%67.0%79.0%84.8%
30172.4%
75+71.6%79.3%67.0%80.2%90.2%
24276.0%
75+49.5%44.9%36.7%55.9%87.5%
23546.8%
Rwt 60+46.2%56.8%43.5%58.7%75.4%
82852.1%
Rwt 60+52.5%61.9%45.6%65.9%71.8%
71557.4%
Rwt 60+33.1%33.5%25.0%44.5%54.0%
73733.3%
Base figures for other sub-groups may be found in Table 4.1.2.
159
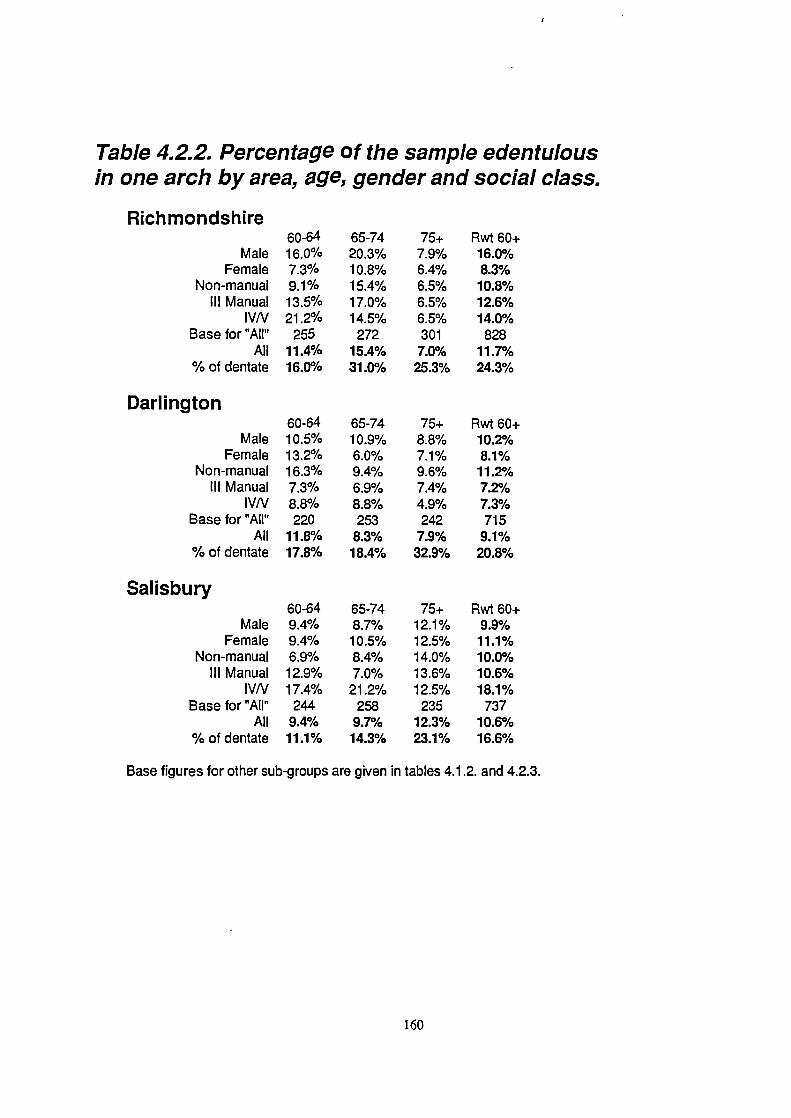
MaleFemale
Non-manualIll Manual
IVNBase for "All'
All% of dentate
Darlington
MaleFemale
Non-manualIll Manual
IVNBase for "All"
All% of dentate
Salisbury
MaleFemale
Non-manualIll Manual
IVNBase for "All"
All% of dentate
Table 4.2.2. Percentage of the sample edentulousin one arch by area, age, gender and social class.
Richmondshire60-6416.0%7.3%9.1%13.5%21.2%
25511.4%16.0%
60-6410.5%13.2%16.3%7.3%8.8%220
11.8%17.8%
60-649.4%9.4%6.9%12.9%17.4%
2449.4%11.1%
65-7420.3%10.8%15.4%17.0%14.5%
27215.4%31.0%
65-7410.9%6.0%9.4%6.9%8.8%253
8.3%18.4%
65-748.7%10.5%8.4%7.0%
21.2%258
9.7%14.3%
75+7.9%6.4%6.5%6.5%6.5%301
7.0%25.3%
75+8.8%7.1%9.6%7.4%4.9%242
7.9%32.9%
75+12.1%12.5%14.0%13.6%12.5%
23512.3%23.1%
Rwt 60+16.0%8.3%10.8%12.6%14.0%
82811.7%24.3%
Rwt 60+10.2%
8.1%11.2%7.2%7.3%715
9.1%20.8%
Rwt 60^9.9%11.1%10.0%10.6%18.1%
73710.6%16.6%
Base figures for other sub-groups are given in tables 4.1.2. and 4.2.3.
160

families of unskilled manual workers were by far the most likely subgroup to be edentulous.
A proportion of dentate subjects were edentulous in one arch, almost always the upper, these results are
presented in table 4.2.2.. This group represented between 9% and 12% of the total sample for each of the
three areas. There was no consistent age trend, although as a proportion of the dentate sample (as opposed
to the total sample which is presented in table 4.2.2.) those who were edentulous in one arch increased with
age. Gender and social class trends were also complex. Far more men than women in Richmondshire were
edentulous in one arch, while in Salisbury there was a slightly higher proportion of women in this condition.
In Richmondshire and Salisbury there was a tendency for manual workers to be more likely to be
edentulous, particularly those in social class IV/V, whilst in Darlington it appeared to be non-manual
workers who were most likely to be edentulous in one arch.
Of the edentulous subjects, 1% never wore complete upper dentures and between 2% and 4% never wore
a complete lower denture. A further 1-2% of the edentulous only wore their dentures socially.
All dentures which were regularly worn were assessed for faults. On average each set of complete dentures
had about 3 faults recorded (from a possible maximum of 15), and this was consistent between areas and
showed a tendency to increase slightly with age. Only between 3.8% and 13.8% (depending on the area and
age group) of complete dentures were assessed by the examiners as having no faults, whilst overall 29%
of sets had 5 or more faults and 10% had 7 or more. The most commonly recorded faults were incorrect
occlusal relationships, excessive free way space, poor lower retention, poor adaptation (upper and lower)
and excessive occlusal wear. The relative abundance of these faults depended on the area and age group
concerned with the most common faults present in about 35% to 50% of cases. The relationships between
the type and number of faults and satisfaction are covered in section 4.3.1..
4.2.2. Dentate subjects: The number of teeth and tooth replacement
Table 4.2.3. gives the base numbers from which the percentages and means in subsequent tables for the
161

Table 4.2.3. Base Numbers for the Dentate Sample
Richmond
MaleFemale
Non-ManualManual
AttendersNon-attenders
All
75+37466018463683
60-6489921334614535181
65-74746094399835134
Total200198287103289106398
75+29293820362158
Darlington
MaleFemale
Non-ManualManual
AttendersNon-attenders
All
60-64746077579242134
65-74585668468528114
Total16114518312321391306
75+507595299232125
Salisbury
MaleFemale
Non-ManualManual
AttendersNon-attenders
All
60-64971101416617433
207
65-7480951185714629175
Total22728035415241294507
162

dentate sample are calculated. Periodontal data is drawn from a slightly smaller base due to exclusion of
some patients from the periodontal examination as a result of specific problems in their medical history.
The periodontal base figures are given in table 4.2.16., just before the tables of periodontal data.
Data are presented in this section for the percentage of the sample with 21 or more standing teeth, the mean
number of teeth and data on the types and frequency of prostheses used to replace missing teeth. The 21
or more standing teeth statistic is one that has been used as a measure of oral health in previous national
surveys and which appears to be a reasonable measure of what constitutes a functional natural dentition.
This is discussed in more detail in sections 2.3., 4.4 and 5.4..
Statistics for the percentage with 21+ standing teeth in each part of the dentate sample are given in table
4.2.4.. The proportion of the dentate sample with 21 or more standing teeth varies between 64.5% for the
youngest non-manual workers in Salisbury, and 5.9% in the oldest non-attenders in Darlington. The
proportion is generally highest for those in Salisbury, males, non-manual workers and regular attenders. At
the time of the study, only the dentate attenders in the youngest age groups (60-64, in all three areas) had
more than 50% in the 21+ standing teeth group. If the edentulous subjects are taken into account, only 22%
of the 2280 subjects examined had 21 or more standing teeth.
The reweighted mean number of teeth (see table 4.2.8.) for the over 60 year olds was around 17, although
the mean number of teeth was very age dependent, from 19 in the youngest group down to only 14 in the
oldest. Inter-area differences were rather small, as were gender differences, except in Richmondshire where
women had on average, nearly two more teeth than men. Non-manual workers had more teeth than manual
workers, and attenders had on average between 4 and 7 more teeth than non-attenders.
Tooth replacement and the prevalence of partial dentures
Table 4.2.5. shows the distribution of partial dentures in the three areas by demographic variables. Partial
dentures were worn by around 40% of dentate over 60 year olds. The percentage increases with age (from
around 35% to about 50%). In the northern samples, females were more likely to wear partial dentures than
163

Table 4.2.4. Percentage of the dentate sample with 21or more teeth, by area, age, gender social class andattendance pattern.
Rich mondshire
MaleFemale
Non-ManualManual
AttendersNon-attendersBase for "All"
All
60-6453.9%53.3%59.4%37.0%59.3%28.6%
18153.6%
65-7424.3%35.0%33.0%20.5%35.7%11.4%
13429.1%
75+24.3%30.4%30.0%25.0%41.3%11.1%
8327.7%
Rwt 60+35.4%40.4%42.3%27.6%46.1%16.0%
39837.9%
Darlingtori
MaleFemale
Non-ManualManual
AttendersNon-attendersBase for "All"
All
60-6448.6%33.3%42.9%40.4%52.2%19.0%
13441.8%
65-7436.2%41.1%45.6%28.3%43.5%25.0%
11438.6%
75+13.8%13.8%15.8%10.0%15.0%5.9%
5813.8%
Rwt 60+36.8%33.4%38.8%30.0%42.3%18.0%
30635.2%
Salisbury
MaleFemale
Non-ManualManual
AttendersNon-attendersBase for "All"
All
60-6455.7%56.4%64.5%37.9%63.2%18.2%207
56.0%
65-7440.0%41.1%44.9%31.6%45.2%17.2%
17540.6%
75+34.0%33.3%38.9%17.2%39.1%18.8%
12533.6%
Rwt 60+41.9%42.1%47.5%29.4%47.6%17.9%
50742.0%
Base figures for other sub-groups are given in table 4.2.3.
164

65-7444.6%50.0%52.1%35.9%49.0%42.9%
13447.0%
75+48.6%47.8%51.7%35.0%56.5%38.9%
8348.2%
60+ rwt38.4%45.3%45.3%32.2%42.5%40.9%
39841.8%
Table 4.2.5. Partial dentures by area, age,gender, social class and attendance pattern
Richmondshire60-64
Male 25.8%Female 39.1%
Non-manual 34.6%Manual 26.1%
Attender 31.0%Non-attender 40.0%Base for 'All' 181
All 32.6%
Darlington
MaleFemale
Non-manualManual
AttenderNon-attenderBase for 'AU'
All
60-6431.1%41.7%37.7%33.3%34.8%38.1%
13435.8%
65-7432.8%42.9%42.6%30.4%3 8.8%35.7%
11437.7%
75+44.8%58.6%57.9%40.0%50.0%52.9%
5851.7%
60+ rwt34.1%45.4%43.8%33.0%39.3%39.8%
30639.5%
Salisbury
MaleFemale
Non-manualManual
AttenderNon-attenderBase for 'All'
All
60-6435.1%35.5%34.0%37.9%33.3%45.5%
20735.3%
65-7451.2%43.2%45.8%49.1%48.6%37.9%
17546.9%
75+52.0%52.1%51.6%44.8%52.2%46.9%
12550.4%
60+ rwt46.3%43.7%44.1%44.6%44.8%43.2%
50744.4%
Base number for sub-groups can be found in table 4.2.3.
165

males (for example 45% to 34% in Darlington), but in Salisbury the trend was reversed. In the north, non-
manual workers were more likely to wear partial dentures than manual workers, but in the south there was
no real difference while there was also little difference between attenders and non-attenders in any area.
Table 4.2.6. shows the distribution of partial dentures between upper and lower jaws. Most partial dentures
are uppers alone, although in the over 65 year olds in Salisbury partial upper and lower dentures together
were the most common finding. However the distribution of denture provision (according to arch restored)
does not conform to any consistent pattern. Partial dentures in combination with complete dentures were
worn by 8-10% of the reweighted dentate samples, equivalent to just under half of the 17-24% who were
edentulous in one arch.
The majority of partial dentures were made of acrylic resin (62% to 73% of uppers, 45% to 61% of lowers),
had no clasps (65% to 71% of uppers, 56% to 70% of lowers) and were tissue supported (74% to 81% of
uppers, 68% to 76% of lowers). In most cases (about 55%) the dentures were acrylic and had no clasps
and had no tooth support. Many of those which were classed as metal based were lower dentures where
the connector was a wrought metal bar, rather than a cast metal framework.
Fixed bridges were reported for only 3-6% of the samples, and in all three areas the percentage with bridges
was highest in the youngest age group (as high as 9.2% of the 60-64 year olds in Salisbury). More detailed
breakdown on bridges is given with data on multiple crowns in table 4.2.11..
4.2.3. Dentate subjects: Data on the condition of the crowns of the teeth
The state of the crowns of the teeth varied widely between groups (tables 4.2.7. and 4.2.8.). The mean
number of filled teeth (including crowned teeth) ranged from as low as 1.39 (the oldest non-attunders in
Richmondshire) up to over 11 (for the youngest females in the same area). There was a slight decrease with
age and it is consistently women, non-manual workers and regular attenders who have the most fillings. The
number of decayed teeth was between 0.76 and 0.97 for the major age/area groups with little variation
166
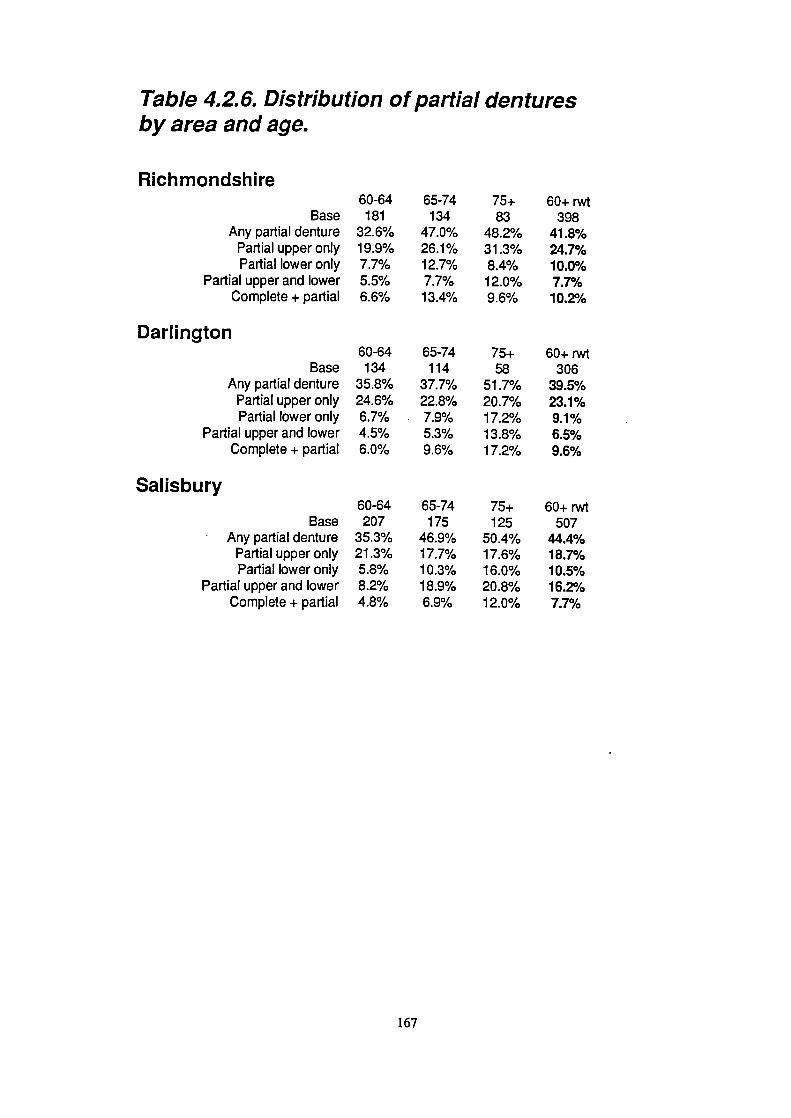
65-74134
47.0%26.1%12.7%7.7%13.4%
75+83
48.2%31.3%8.4%12.0%9.6%
65-74114
37.7%22.8%7.9%5.3%9.6%
75+58
51.7%20.7%17.2%13.8%17.2%
65-74175
46.9%17.7%10.3%18.9%6.9%
75+125
50.4%17.6%16.0%20.8%12.0%
Table 4.2.6. Distribution of partial denturesby area and age.
Richmondshire60-64
Base 181Any partial denture 32.6%
Partial upper only 19.9%Partial lower only 7.7%
Partial upper and lower 5.5%Complete + partial 6.6%
Darlington60-64
Base 134Any partial denture 35.8%
Partial upper only 24.6%Partial lower only 6.7%
Partial upper and lower 4.5%Complete + partial 6.0%
Salisbury60-64
Base 207• Any partial denture 35.3%
Partial upper only 21.3%Partial lower only 5.8%
Partial upper and lower 8.2%Complete + partial 4.8%
60+ rwt398
41.8%24.7%10.0%7.7%
1 0.2°h
60+ rwt306
39.5%23.1%9.1%6.5%9.6%
60+ rwt507
44.4%18.7%10.5%16.2%7.7%
167

v , ii000000e 0000óOO 000eeoe
0.
0000000 O0000d
v,Cd 0
-.-000d
0O00 00
• U, COtrci 0 v
C.)
dOá0000 OooOoeO
.ca)
C. ju 0
2.0 =.2 z z
àóo0000
z z

! !!r.. a a a a
a W a N C) çJ F.
+ a N (•) a a a aN N a
a i' pa a a o Co 0.- a a ma.-
0.
a
-
U
C.)
oo.-o0
20 —
0.
.2.
•0
E
a a P.. Ps Ps. 0 •D0000.-ó
0
)
C 0 0 C
-0m
z
.Cl Cl Cl
r- a a c'a a
! 55
NaNww4d
C ae 0
a.
8
a l) l a I.) N
e l. N OP..10 NC
naP-CCOIDPs
a.
_eC) Pa NC Cl 'J P..
. Pa , I') l.) Cl
.aapja0 a
,..P,oJnr-0 CC O0 N C0_00_0.5o
a.
o
Uffll l50z 0
z
.I l- PC Cl 01 9 l
IOW P. 11 PS 01 lb
000.-0
C1Np.:
Pi a c.a N OW aa In N C 010 N
a.
II, lb
_ee
OP ON C
000000 0
UP 0) Cl Cl a
a a a ,a a
NP-Cl a 01 04a.
a 'C a op Cl
CII N — 'C — PC N
N N N N OP —aol
PPCII
iuP Iu a
Cl)

Table 4.2.8. 95% Confidence limits
Richmondshire
Filled1.071.151.011.190.951.050.90
MaleFemale
Non-ManualManual
AttendersNon-attenders
All
Present1.391.411.241.711.121.761.11
Sound Decayed
1.05 0.49
1.07 0.52
0.87 0.41
1.46 0.69
0.90 0.42
1.37 0.67
0.85 0.41
Missing1.391.411.241.701.121.751.11
Darlington
Male
0.91
0.74
0.46
0.73
0.91
Female
0.90
0.73
0.33
0.75
0.90
Non-Manual
0.86
0.68
0.35
0.70
0.86
Manual
0.97
0.81
0.50
0.81
0.97
Attenders
0.78
0.65
0.36
0.64
0.78
Non-attenders
1 .11
0.90
0.49
0.82
1.11
All
0.74
0.60
0.34
0.61
0.74
Salisbury
Male
0.92
0.74
0.34
0.70
0.88
Female
0.78
0.65
0.36
0.68
0.75
Non-Manual
0.77
0.63
0.31
0.64
0.74
Manual
0.94
0.80
0.43
0.68
0.90
Attenders
0.72
0.59
0.28
0.59
0.69
Non-attenders
1.14
1.00
0.53
0.64
1.11
All
0.69
0.57
0.30
0.57
0.66

Missing14.6014.4213.9015.8412.8519.8014.50
CCI48.8%50.3%52.7%41.8%51.0%33.5%49.6%
CCI(d)4.8%4.7%4.8%4.8%3.7%10.6%4.8%
Table 4.2.8. Mean number of decayed missing andfilled teeth, CCI and CC!(d) for the reweigh ted (60^)sample, by area, age, gender, social class andattendance pattern.
Richmondshire
MaleFemale
Non-ManualManual
AttendersNon-attenders
All
Filled6.078.428.204.659.082.307.22
Present15.9417.6017.5014.8318.7211.7116.75
Sound9.018.328.469.298.908.158.68
Decayed0.860.850.830.890.741.260.85
Missing16.0614.4014.5017.1713.2820.2915.25
CCI43.5%52.7%51.6%37.4%52.5%3 0.4%48.2%
CCI(d)5.4%4.8%4.8%6.0%3.9%10.8%5.1%
Dar!ington
MaleFemale
Non-ManualManual
AttendersNon-attenders
All
Filled6.547.727.736.168.133.417.10
Present17.2117.0817.3616.8318.0313.8717.16
Sound9.518.658.839.529.169.089.10
Decayed1.170.700.811.150.741.380.95
Missing14.7914.9214.6415.1713.9718.1314.84
CCI44.7%49.3%49.2%43.5%49.2%34.5%46.9%
CCI(d)6.8%4.1%4.6%6.8%4.1%10.0%5.5%
Salisbury
Filled7.658.028.675.999.052.807.86
Present Sound Decayed
Male 17.40 8.92 0.84
Female 17.58 8.73 0.83
Non-Manual 18.10 8.57 0.86
Manual 16.16 9.41 0.77
Attenders 19.15 9.39 0.71
Non-attenders 12.20 8.12 1.29
All 17.50 8.81 0.83
Base numbers can be found in Table 4.2.3.
169

between areas and a slight age related increase (despite a reduction in the total number of teeth present).
It is the non-attenders who have by far the highest number of decayed crowns (around 1.3 in all areas). As
this is the group with the fewest fillings, they stand out as having a rather low Coronal Caries Index (CCI),
but a high Coronal Caries Index for decay (CCI(d)). The calculation of these indices is presented in section
3.11.5.. Overlays, giving the figure from which the 95% confidence intervals for each mean value can be
calculated, are presented.
The decayed component constituted teeth with new decay, teeth with unsound restorations (this may be
decay around restorations or fractured fillings), teeth which are sufficiently broken down by dental decay
to expose the pulp or make them unrestorable, and unsound artificial crowns. Table 4.2.9. shows the relative
abundance of these different categories in different areas and age groups. Using the reweighted data for the
three samples 33-39% of all teeth categorised as decayed were unsound fillings, and 42-56% were unsound
restorations (either fillings or crowns). New or untreated decay (not including grossly decayed or broken
down teeth) constituted only 24 .37% of all decayed teeth. Heavily broken down teeth accounted for an
additional 21% of the decayed component in all areas. The proportion of the decayed component accounted
for by unsound fillings showed a tendency to decrease with age, whilst the proportion which was accounted
for by gross decay or breakdown increased consistently with age.
Artificial full coverage crowns were present in around a third (32-36%) of the reweighted 60+ sample in
all three areas, but it was women, non-manual workers and attenders who were most likely to have crowns,
with a 60+ maximum of 43.9% (for attenders in Richmondshire), and a minimum of 6.8% (non-attenders
in the same area). Manual workers in Darlington were much more likely to have crowns than their fellows
in either of the other areas (29% compared with 16 - 18% ). These data are presented in tables 4.2.10. and
4.2.11. (with an overlay for the latter table, to allow the calculation of the confidence limits for the mean
values). Between 9% and 15% of all artificial crowns were recorded as unsound.
170

Table 4.2.9. Percentage of the coronal decaycomponent in different categories,by area and age.
Richmondshire
Mean number of "decayed" teeth% new decay
% unrestorable% unsound fillings% unsound crowns
60-640.79
23.6%10.4%44.5%21.5%
65-740.96
21.7%23.3%40.8%14.2%
75+0.84
36.8%32.9%22.4%7.9%
Rwt 60^0.85
25.3%20.7%38.5%15.5%
Darlington
Mean number of SIdecayedI teeth% new decay
% unrestorable% unsound fillings% unsound crowns
60-640.95
26.6%21.0%39.9%12.5%
65-740.95
47.7%19.2%27.5%5.5%
75^0.97
31.0%24.1%31.0%13.8%
Rwt 60^0.95
37.0%20.8%32.6%9.6%
Salisbury
Mean number of "decayed" teeth% new decay
% unrestorable% unsound fillings% unsound crowns
60-640.76
29.1%10.1%44.3%16.5%
65-740.81
20.4%22.5%40.1%16.9%
75+0.95
22.3%27.3%29.8%20.7%
Rwt 60+0.83
23.4%20.7%37.9%18.0%
171
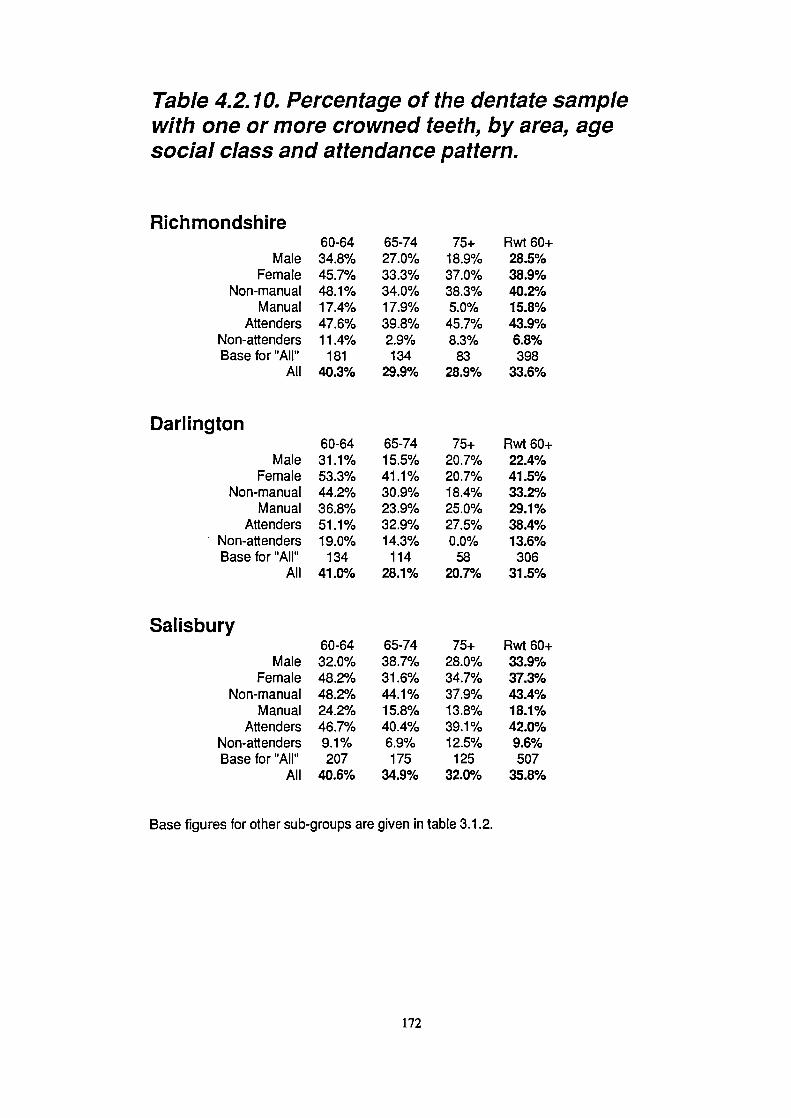
Darlington
MaleFemale
Non-manualManual
AttendersNon-attendersBase for "All"
All
Salisbury
MaleFemale
Non-manualManual
AttendersNon-attendersBase for "All"
All
Table 4.2.10. Percentage of the dentate samplewith one or more crowned teeth, by area, agesocial class and attendance pattern.
Richmondshire
MaleFemale
Non-manualManual
AttendersNon-attendersBase for "AlP'
All
60-6434.8%45.7%48.1%17.4%47.6%11.4%
18140.3%
60-6431.1%53.3%44.2%36.8%51.1%19.0%
13441.0%
60-6432.0%48.2%48.2%24.2%46.7%9.1%207
40.6%
65-7427.0%33.3%34.0%17.9%39.8%2.9%134
29.9%
65-7415.5%41.1%30.9%23.9%32.9%14.3%
11428.1%
65-7438.7%31.6%44.1%15.8%40.4%6.9%175
34.9%
75+18.9%37.0%38.3%5.0%
45.7%8.3%
8328.9%
75+20.7%20.7%18.4%25.0%27.5%0.0%
5820.7%
75+28.0%34.7%37.9%13.8%39.1%12.5%
12532.0%
Rwt 60^28.5%38.9%40.2%15.8%43.9%6.8%398
33.6%
Rwt 60+22.4%41.5%33.2%29.1%38.4%13.6%
30631.5%
Rwt 60^33.9%37.3%43.4%18.1%42.0%9.6%507
35.8%
Base figures for other sub-groups are given in table 3.1.2.
172

Table 4.2.11.95% Confidence limits
Richmondshire60-64 65-74 75+ Rwt 60+
Mean number of crowns 0.49 0.54 0.84 0.38
Darlington60-64 65-74 75+ Rwt 60^
Mean number of crowns 0.56 0.47 0.66 0.32
Salisbury60-64 65-74 75+ Rwt 60+
Mean number of crowns 0.53 0.64 0.86 0.42

Table 4.2.11. Percentage of dentate sample withmultiple crowns and bridges, and the mean numberof crowns in those with crowns, by area and age.
Richmondshire60-64 65-74 75+ Rwt 60+
Base 181 134 83 398
% with bridges 4.4% 3.0% 2.4% 3.4%
% with multiple crowns 26.0% 20.9% 19.3% 22.5%
*mean number of crowns 2.86 2.68 2.83 2.78
Darlington
Base% with bridges
% with multiple crowns*mean number of crowns
Salisbury
Base% with bridges
% with multiple crowns*mean number of crowns
60-64134
6.0%27.6%2.71
60-64207
9.2%28.0%3.02
65-74114
0.9%13.2%
1.9
65-74175
5.7%23.4%2.72
75+58
0.0%12.1%2.08
75+125
3.2%16.0%2.78
Rwt 60+3062.6%18.3%2.23
Rwt 60+507
6.1%22.7%2.83
* the mean number of crowns are calculated only in those with crowns.The base numbers for this group are given below:
60-64 65-74
75+ Rwt6O+Richmondshire
73 40
24 137Darlington
55 32
12 99Salisbury
84 61
40 185
173

4.2.4. Dentate subjects: Data on decay and fillings on the roots.
On average most sample sub-groups had between 8 and 12 teeth vulnerable to root surface caries, and the
proportion of these affected (RCI) increased with age (tables 4.2.12. and 4.2.13, plus overlays). Overall the
RCI was around 20-24%. Much of the apparent inter-area differences can probably be accounted for by
inter-examiner differences (see table 4.1.10.) and it is recommended that this table should be used for
comparisons between areas. Non-attenders stand out as the group with the lowest RCI, but by far the
highest number of decayed roots (and RCI(d)), mirroring the situation on the coronal surfaces. A significant
proportion of the sample in all areas were unaffected by root caries or root surface fillings, around 30% or
more and highest in Richmondshire (see also table 4.1.10.).
Most of the roots classed as decayed were new decay, accounting for 76-80% of the decayed root
component of the reweighted samples. Between 11% and 21% were unsound restorations and 3-11% were
sufficiently broken down to have indicated frank pulpal involvement. There were no clear or consistent age
related trends. These data are presented in table 4.2.14..
Figures 4.2.1. and 4.2.2. demonstrate the concentration of the disease in a small proportion of the
population. These plot the percentage of the dentate sample, starting with the most severely affected at the
left hand end of the x-axis, against the percentage of all lesions, and the percentage of all lesions and
fillings combined, in the dentate sample. These graphs illustrate that the most severely affected 10% of the
sample account for over 50% of all of the teeth with root surface lesions or unsound restorations and over
35% of all of the decayed or filled roots. The worst 20% account for over 70% of all of the lesions, and
nearly 60% of all of the decayed or filled roots.
Root and crown data have been combined in table 4.2.15. to give a whole tooth score. These figures mirror
the ones for roots and coronal surfaces, and once again it is the non-attenders who stand out as having more
decay, fewer fillings and fewer teeth. The reweighted mean numbers of teeth with decay or fillings of the
coronal and root surfaces are given in the same table as the combined root and crown data. This allows the
174

.;p_ 0O00oe0
0000000
Ce eeoc e
00e000
----.-0
0000000
0000000
ci
.0
C2
2U)
.h !oo00000•0
0000000
0000000
eeoc ó cc
---0--c
6600000
060 000 0
0
0Oe0000 000oeoe .060 00e
i00o0o00 000.000 0000000
0

9ro9oo
O-U)OU)
Iir- ---°°- r. - 04
wwIt 9 N 9w coo
04-04-c"
2 04 01404' 0)0)
ID 0 N ID ID In 1%. ID II. (DID(s) U) ID N 0000 P. a
09.0 N 0 oo99Na
III0
'•0
•0
00
O . 'q ID0) .Iq= N N N In ID N
00 e cc ó 0
N N N NO ID I).
ID N S in
0000000
1SNNNNNN
_9.000 00
I
Ou0.0.0
1010
It) (14 - (14-. (110W0
; ._c0_ 00
00 0 0 0 a
0)004
C004 .-0) .N
-0d.--
0 CD - -
-in
C z2 2
COIDU)= NM) U) NIl) ID
-"olD.--),.
U,
00000-c
ON ON 000
It0 0 0 . 0 •o
Quit) 00(010
It-
(0owI
00000 NO
2
30
U)
ItU
B$
2
2
qn IID
175

Table 4.2.13.95% Confidence limits
Rich mondsh ireAt Risk
Male 0.86Female 0.79
Non-Manual 0.73Manual 1.05
Attenders 0.72Non-attenders 0.91
AU 0.58
Sound Decayed Filled
0.82
0.19
0.33
1.00
0.19
0.30
0.86
0.21
0.36
0.98
0.22
0.30
0.81
0.15
0.29
1.08
0.27
0.23
0.65
0.13
0.22
Darlington
Male 0.88 0.76 0.34 0.4.3
Female 0.93 0.85 0.17 0.33
Non-Manual 0.84 0.81 0.21 0.32
Manual 0.97 0.74 0.36 0.46
Attenders 0.76 0.70 0.23 0.34
Non-attenders 1.06 0.99 0.39 0.28
All 0.64 0.58 0.20 0.27
Salisbury
Male 1.65 1.76 0.42 0.69
Female 1.31 1.47 0.28 0.45
Non-Manual 1.29 1.33 0.29 0.48
Manual 1.65 2.16 0.37 0.62
Attenders 1.16 1.28 0.28 0.47
Non-attenders 2.33 1.95 0.56 0.39
All 1.04 1.12 0.24 0.39

Filled1.281.271.490.771.620.351.28
Filled1.791.721.851.602.210.611.75
Table 4.2.13. Mean number of teeth affected byroot caries, sample RCI and RCI(d) for thereweighted dentate (60+) sample by area, age,social class and attendance pattern.
Sound7.707.547.617.848.126.337.62
Richmondsh ireAt Risk
Male 9.72Female 9.42
Non-Manual 9.74Manual 9.28
Attenders 10.33
Non-attenders 7.57
AJl 9.57
Decayed0.740.610.640.670.580.890.68
No D/F33.3%39.6%32.5%45.7%32.6%46.5%36.3%
RCI20.78%20.00%21 .89%15.49%21 .39%16.44%20.40%
RCI(d)7.63%6.51%6.60%7.25%5.66%11.78%7.09%
Sound9.168.128.079.558.908.118.67
DarlingtonAt Risk
Male 12.26Female 10.53
Non-Manual 10.80Manual 12.36
Attenders 11.99Non-attenders 10.01
AU 11.43
Decayed1.310.690.881.210.881.301.01
No D/F21.0%30.6%26.2%21 .3%21.6%35.7%28.2%
RCI25.25%22.87%25.25%22.72%25.78%19.03%24.21%
RCI(d)10.68%6.55%8.15%9.81%7.37%12.98%8.87%
SalisburyAt Risk Sound Decayed Filled No D/F RCI RCI(d)
Male 10.65 8.12 0.85 1.67 27.1% 23.72% 8.02%
Female 10.39 8.30 0.59 1.51 28.9% 20.12% 5.63%
Non-Manual 10.72 8.39 0.74 1.59 28.1% 21.72% 6.87%
Manual 10.01 7.82 0.63 1.55 28.0% 21.87% 6.34%
Attenders 10.81 8.34 0.64 1.82 26.9% 22.78% 5.95%
Non-attenders 9.34 7.80 0.96 0.58 32.4% 16.50% 10.32%
All 10.51 8.22 0.70 1.58 28.1% 21 .75% 6.71%
"sound' means vulnerable (i.e. root exposed) but sound"No 0/F' gives the percentage of the population with no decayed or filled root surfaces'RCI" indicates Root Caries Index calculated using decayed and filled teeth as componentsRCI(d)' indicates Root Caries Index calculated using only decayed teeth as components
Base numbers can be found in Table 32.3.
176

60-640.85
80.5%9.7%9.7%
65-740.90
80.5%8.0%11.5%
75+1.41
68.6%18.1%13.3%
Rwt 60^1.01
77.6%11.0%11.4%
60-640.46
72.7%') 10/J. I 10
24.2%
65-740.66
73.5%6.0%
20.5%
75+1.03
79.1%1.6%19.4%
Rwt 60^0.7
75.6%3.6%20.8%
Table 4.2.14. Percentage of the root decaycomponent in different categories,by area and age
Richmondshire
Mean number of "decayed" teeth% new root surface decay
% unrestorable% unsound root surface fillings
60-640.52
72.0%4.3%23.7%
65-740.72
89.3%1.0%9.7%
75+0.92
73.7%6.6%19.8%
Rwt 60+0.68
80.3%3.4%16.3%
Darlington
Mean number of "decayed" teeth% new root surface decay
% unrestorable% unsound root surface fillings
Salisbury
Mean number of "decayed" teeth% new root surface decay
% unrestorable% unsound root surface fillings
177

Figure 4.2.1. Percentage of sample accounting forpercentage of all root caries lesions or unsoundrestorations (data for all areas pooled).
10 20 30 40 50 60 70 80 90 100
Cumulative % of Sample
Figure 4.2.2. Percentage of sample accounting forpercentage of all root caries lesions and all rootsurface restorations (data for all areas pooled).
C0
a,-J
a'C.,
I-
-S
00
0
100
90
80
70
60
50
40
30
20
10
00
C
ii: 100
C
80C.2 70U,a,-j 60a,C.,
'I-.
10 20 30 40 50 60 70 80 90 100
Cumulative % of Sample
178

1.491.211.201.501.131.80
1.07
1.191.000.951.330.921.61
0.88
1.131.050.991.060.930.96
0.88
0.770.610.630.720.610.84
0.57
Table 4.2.15. Confidence limits
Richmondshire
MaleFemale
Non-manualManual
AttenderNon-attender
All
Present1.501.441.301.811.161.75
1.17
Sound Decayed
0.62 1.17
0.59 1.23
0.50 1.10
0.83 1.30
0.53 1.01
0.72 1.05
0.50 0.98
Filled1.151.080.911.570.911.43
0.90
1.481.441.361.601.241.79
1.16
Dan i ngton
MaleFemale
Non-manualManual
AttenderNon-attender
All
Salisbury
MaleFemale
Non-manualManual
AttenderNon-attender
All
0.81 1.25 1.17
0.63 1.16 1.13
0.65 1.11 1.05
0.88 1.36 1.32
0.69 1.04 1.01
0.78 1.28 1.49
0.61 0.97 0.92
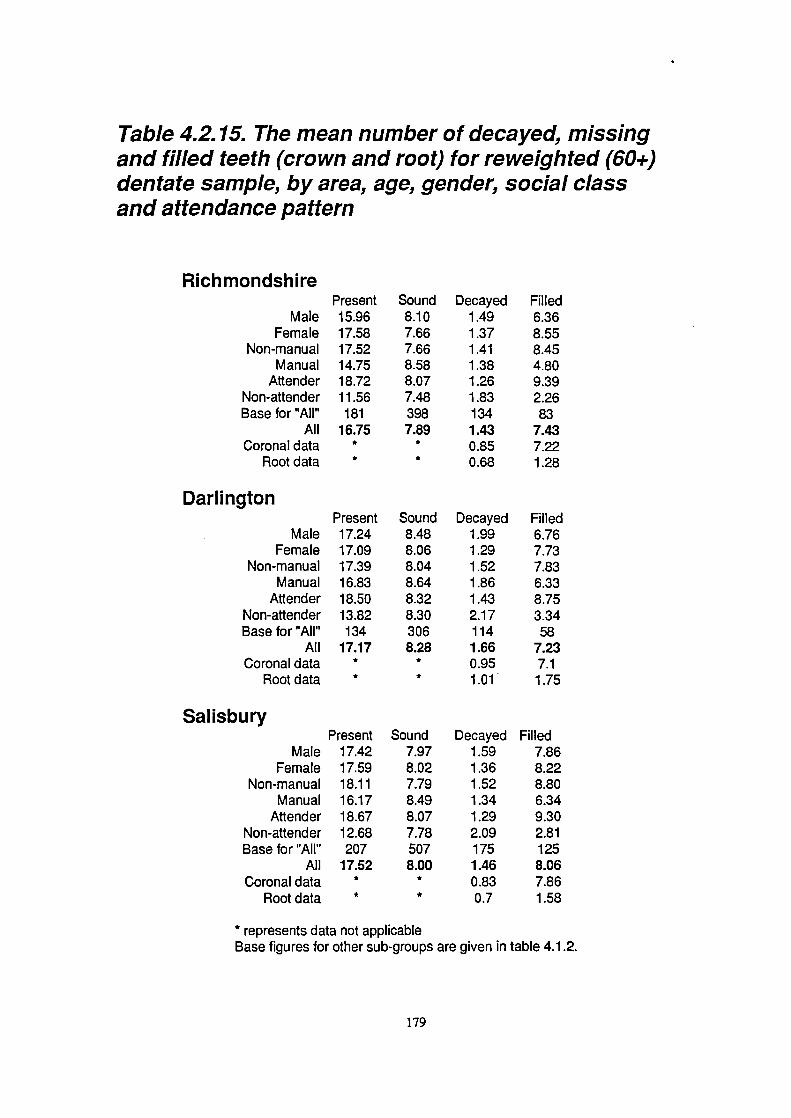
MaleFemale
Non-manualManual
AttenderNon-attenderBase for "All"
AllCoronal data
Root data
Darlington
MaleFemale
Non-manualManual
AttenderNon-attenderBase for "All"
AllCoronal data
Root data
Table 4.2.15. The mean number of decayed, missingand filled teeth (crown and root) for reweighted (60+)dentate sample, by area, age, gender, social classand attendance pattern
RichmondshirePresent15.9617.5817.5214.7518.7211.56181
16.75**
Present17.2417.0917.3916.8318.5013.82134
17.17**
Sound8.107.667.668.588.077.483987.89
**
Sound8.488.068.048.648.328.303068.28
**
Decayed1.491.371.411.381.261.831341.43
0.850.68
Decayed1.991.291.521.861.432.171141.660.951.01
Filled6.368.558.454.809.392.2683
7.437.221.28
Filled6.767.737.836.338.753.3458
7.237.11.75
Salisbury
MaleFemale
Non-manualManual
AttenderNon-attenderBase for "All"
AllCoronal data
Root data
Present17.4217.5918.1116.1718.6712.68207
17.52**
Sound7.978.027.798.498.077.785078.00
**
Decayed1.591.361.521.341.292.091751.460.830.7
Filled7.868.228.806.349.302.811258.067.861.58
* represents data not applicableBase figures for other sub-groups are given in table 4.1.2.
179

amount of overlap of root and crown decay and fillings to be estimated. A mean of 0.1 to 0.3 teeth had
decay on both crown and roots, whilst a mean of 1.1 to 1.6 teeth had fillings in both crown and root
surfaces, accounting for the majority of teeth with root surface fillings.
4.2.5. Dentate subjects: Periodontal disease
The subject base for the measurement of periodontal disease was smaller than that for other aspects of
clinical disease, and is given in table 4.2.16., while the percentage of the total dentate sample who were
excluded from the periodontal examination is given in table 4.2.17..
Periodontal data was affected by the problems of inter-examiner variability, specifically in terms of the
measurements of pocket depths. In view of these problems data recorded for deep pocketing (the most
severe CPITN code) and loss of attachment by the author alone are given in table 4.1.10.. Where
comparisons have been made between areas, it is referring to these data. The problems with trying to
compare areas using data from all examiners are illustrated in table 4.1.9., which shows that the variations
between the second examiners and the author were sometimes large, and the direction of the discrepancy
was different according to the area. Despite concerns about its value (see the results presented later in this
section) tables of CPITN data of the type recommended by the WHO are given for each area separately
(tables 4.2.18. to 4.2.20.). The reason that these have been included is to allow some comparison with any
previous studies which used this index. Additional tables presenting data for loss of attachment, furcation
involvement and mobility are also presented (tables 4.2.21. to 4.2.24.).
When considering differences between areas it is probably most appropriate to consider the statistics for
the author alone (table 4.1.10.). The proportion of the population with one or more deep pockets (6mm or
greater) was consistent between areas at around 23% overall, those with any loss of attachment of 6mm or
greater accounted for 42-48% and those with any severe loss of attachment (9mm or more) accounted for
11-13% (see table 4.1.10.). 18-25% of the sample had 3 or more teeth with loss of attachment of 6mm or
greater. The low figures for periodontal variables found in Salisbury in tables 4.2.20., 4.2.21 and 4.2.22.
180

65-74
75+
Total71
39
19986
62
245107
76
31550
25
129131
73
36226
27
81157
101
444
Table 4.2.16. Base numbers of samplefor periodontal data.
Richmondshire60-64
65-74
75+
Total
Male 80
59
29
168
Female 82
49
38
169Non-manual 120
72
48
240
Manual 40
35
16
91Attenders 132
76
38
246
Non-attenders 30
31
28
89All 162
108
67
337
Darlington65-74
75+
Total52
26
14849
22
12461
31
16140
17
11175
34
19325
14
78101
48
272
MaleFemale
Non-manualManual
AttendersNon-attenders
All
Salisbury
MaleFemale
Non-manualManual
AttendersNon-attenders
All
60-64705369548439123
60-6489971325415828186
Table 4.2.17. Percentage of dentate subjectsnot periodontally examined due to medicalhistory, by area and age.
60-64 65-74 75^
Total
Richmondshire 10.5% 19.4% 23.9%
15.3%Darlington 8.2% 11.4% 17.2%
11.1%
Salisbury 10.1% 10.3% 19.2%
12.4%
181


CD
C) — C) C'J C) C) CDCD 0 CD C'.J C) tO C) CD
0000 000
— ( C)CDN-CDCDC)CDCD o CJ CD .- 0) ('4 0DO L..
.o
U) 0).2 CD C) N- CD .- ('4 C)
U) OCD0U)-CDC)U• - CD CD CD C) CD ('4 CD
x
..- - N- 0) CD CD N-O OCCO)
C)'1C)C)-CDcoECD C)C)._C)-C)CDCD C)U)CD
C)
CD CD 0 — N- 0 CD CD00cvCD
o CD i- ('4 ('4 .- CD C40..
CDU)•C')C'— N- CD CD U) C) CD 'U) 0 0 U) CD CD CD C') U)
Co
.CDt 0N-CD0CDCD
0CD.-C)0ClCD 0C'-CDC"
E ,
' 0)0)0C)00CDo .2cidcidc'id-
c)
U)(I)
C.)
C.)0C,)
3)
0 o 0 0) 0 CD CD
0 0) •N.. U) CD U) CD C')
N-C')CDON-CDLD CDLOC)—C\JCDCD C)N-N-.-U)N-CDC')CDCY)C\IC) _CD C')C')C') CDC')C')
ociddoo ddd0000 0000000
CD.-CDC')CDCDO C)CDN-.-- D0OC')C')CDCD CD.U)N-U) ('J03iCDc')CiC' ('JCJC'1 cc'Jc'
U) U) C') C') CD CD N- CD C') 0 CD C') C) C').- C) N- ClCD CD N- N- 00) N- 0 CD CD CD 0 U) CD CO C') U) U) N- CD LCD
cic' C' CDC'JC'I ccc'c')
14) CD C') U) U) CD CD U) N- 0 U) N- CD C') U) C') CD 0 N- 0CD 00 CD C'4 .- C) .- N- 0 C) .- U) 0) 0) CD CD N- — 0 CD
'C 'C CD C') ('4 C') ('4 C') ('1 CJ C') C') C') CD C') CD
CDN-C)CDCD.-r- .-COCD.-0N-CD C)CDCf)00CD.-C').--C')CDC') C')CDLO0C') -tC')C')ddddddo ddddddo cddodoe
.- U) 0 U) C') 0 CD N- C) U) — CD CD CD C) N- U).-.- C)
rLroc 'ddoCrNC\lC'4 ('4,- ('4 ('4 ('4 .- ('4 .- ('1 ('4'- C\IC'4 ('4 — ('4 ('4 Cl
U)C).-OCDOICD C')U)CD-0O) CDCD0CDCDC'1(DU)N-0 C'4C)N-0r- CJ.-CDCDCDC'4
CDU)tflU) )CDC'JLO CDU)U)C')CDC')U)
LflC')CD00CD C')C'J0U)c')C') CD.-CDCJC'JC')C')
I4)CO.-N-CDCDO ('JCDC)C')tfl.- C'N-0.-C')
-C')C'1 C'4CDCJCD C'J.—C\ICDC'1
OOCDOCDOO 0000000 CJ0CDOU)Oi-dci.-o—oa-- 0000000 ,-,-.-0,-0i-
0000000 0CDc\l0C)O 0-cDCDLfl-cDdddddoo odcjo o.-ddd.--o
C'4C),-0U)Lfl' (DC'J.-N-CDU) CD N- C'4 C'JC'4 CD .- C') CD.—
N- N-
1- r ,- r r 04
! •H1 c0
—c
0 0 C 0 C 0Z 0 z Z 0 Z 02 Z Z Z
c'j
CD
.0
CCCD>
C)
CD
CO0..0I-0)0Cl)I.-CD
-C0I-0Cl)CD1
0)
CDCoCUa)
+0
COCD
0 I +U•) U)CD CO N-
-
183
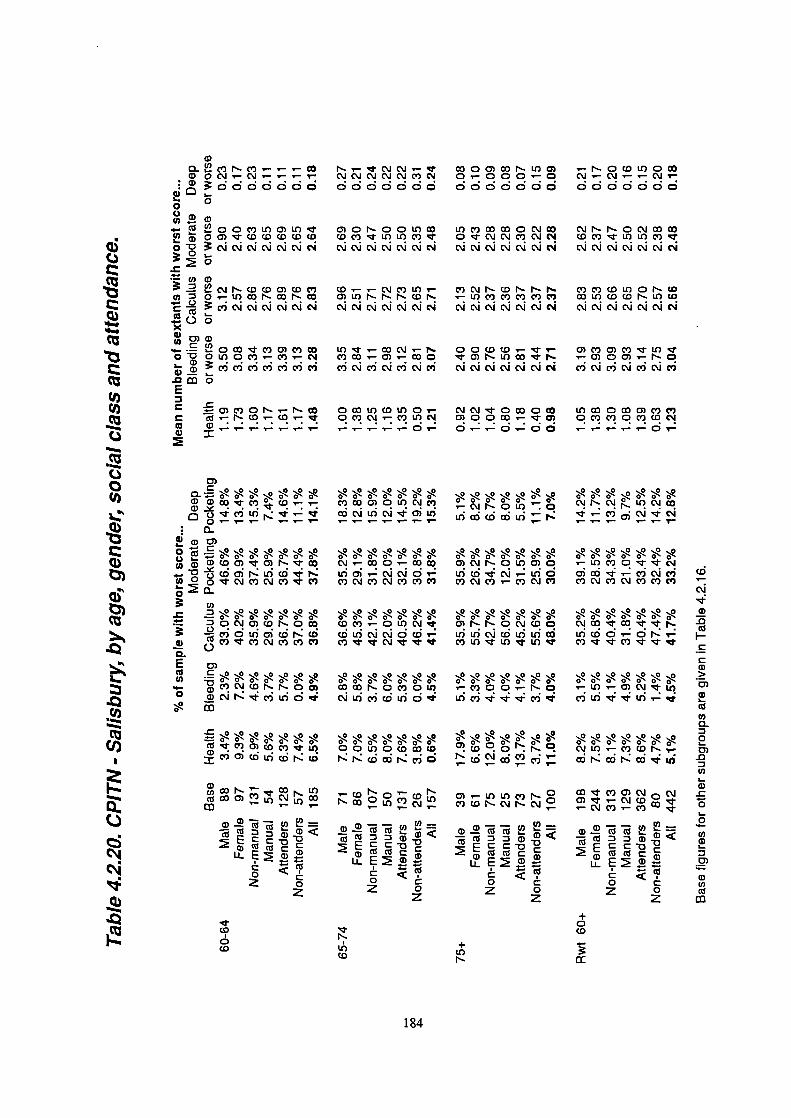
0014) 0 CD CD CD
N-ccj0
' CD N- o' CDN- CO 0L() C')
- CU -o
Li..C0 C
.cooh°.
C).- U) U) C') N- 0C')CDN-CMN-CJ
--CD. CU CU
- CU a) -E
Co C
z
CM U) .- c' CD N-
CDc')0)('J0cJC) .-CM CD
- CU
EL?E
<(U0 Cz 0
z
+0CD
(0+
U)N-
C.)
U)U)
C.)
C-)0U)
ci)
cii'
U)
c\i
a)
C) N-C)- .- -o a ci .- CM .- .- .-CD
•1 CU 00C)LflC)U)'tCD O0)'UCDCDCDCDCD
0D CJCMC'1
U) a)
.2 N- (0(00) CD C)U)
c'Jcic
-- 0(0'rC,0)C)cOo - 0 U) 0 C').- C').- CM
C))
E
C
C N--1- r r .- . . —
0)
0 o . •- r. .0
Eo0)) U) (00) 0) N- "t CD
U) 0 0 CM C') CM C') C')
CO-C: 0C'JC)(0N-0CD
C) CC)C')C\JC')C')C')a.E o,
o
0iCDCU)
(U CD 0)
CO_(U
C
0
(0
(0
CJC'J— CD00)CDN-U)0 .-N-0C0U)0CD
CMC'JC 0.-000.0 CMCM.—C\J0000000 0000000 0000000
C)ON-OotflCD U)c')CDaD0CJCD CJN-N-0CJCDCDU)U)C') Oc')C'JCM CDc')flU)C'
CMCMCMcM cjcic'4CMCM CMCJC'JCM
(0—C')U)- C')CMN-CDN-N-N C')c')(DPMON-W0) U) N- N- N- CD N '-U) C') C') C') C') C') CD U) CD CD N- U) CD
ccic c cicsjc'a ccicjCM
U) .- CD CM .- N- 00 CD CD .- '- ,- 0) C') 0) C') 1- U)C') (0 .- 0)'.- (00 0) N- U) (0 F-. .-0)0O).- N- 0C') CM C' CM C') CM C') CM C CM C C' CM CM C') C C CM C') ('4 C')
0 CD U) CD tOOi- CM CM 0 (00 CD U) (00 (00) C') C')0 C') CM .- C') U) 0) 00 U) .- - 0) 0 C') C') 0 C') CD C'J.- .- .- ..- 01- 0.-'.- c .- .- .- .- - .-
C')CD0)0U)CJC') .-C'JN-0U) .o C'JN-1U)C'
, , , _ .-. _ 14) d cri ui N- , ,_ , ' ,
C'J.-CD0.-(0 0)CMN-01t)0)0 .—U)C')Oc1C'JCM01- CM'.-U)O 0)CD.-C')C'JC')CMC')C')C') C')CMC')'-C')C'JC') C')CMC')C')C')
CDC').-0U)C 0)N-N-OCMC00 •U'NCDU)CiJCM0CD U)U)CMC0LOLnCD U)CD0-0N-i-C')CM C')U)U)c1-U) C')C')U(U
CDN-0c')0U) -c')00.-N-Q .-L(-0)CJ'-,CMLflc'óUid U)'Uc'i C')U)U)'-
CM
'U-a)
-cCU
I-
CCCD>
0)CD
(UCOa-00).0
U)I-a)
0C-09-Cl)CDC--
0)
CD(I)
CU
184

0)U)cOQQ(
,- - 11- CJ ia
— a)rcoacor-r-fl ,- i- 1 1- i
oNoC')NCJ,-OLt)Lflcc'JC.)c'1
N C') N- L() (0 (0 CO
C\IO)N(ON COON C') (0 N (0 N F-
LOOC') (0 CO C'J (0 CO
NC0)N- to to N It)
N-N 0) OOQ U)0U)O'(OF'-
.1
U)0)C')C')LOC')LOCO
U) Cl) - - U) =I-.
-- a)a) a) C C D
Co z 0— z
C
.0)
(0 C') NQ (0 C') C
C\!coC') QC\IO F-1- C'J - C')
-0)
NN(0QC')C
c')t')UC')
a) a) C C D CE a) a)
U a)0Z z
U)
Cl)
.C%JcOtO.0to
1 C'J 1
0
'.,-a3'1-C' .0N..(0N
oc')0J0)C'ccicJU)
crc'J
-
(0
('a
a)
a)I-
C
Ca)>
C)
a)1a)
C/)0
2C).0
U)
a)-C
0I-0
U)a)
C)
a)U)a)
muOQU'
QC
'Cl)
ww
4..
0S..
wc
S..
Cl)
S
".4.5
.
L().2
N >. E o L() N It) C)C)' C') C'Ji
a) A
.
EN1C'N>.. (0CJCiC')LflCO
a)
a) ENCJCoF-O)Iq— ,-o,cjco
.='F 0,•O,•qU) >..C)(o C'J OCJC1CO c A '- i- i- - -
a)-
o EC).>.. COc')Cot()
a)
.
a) EN•o•-c)•q—
A,-C'JC1
-csi••3
Eoco.">.. A'- '- '- '- ?-a)
6o EJLS)0CoNO)DC
c A(DC'JC')LOC')Wa)
Cl Cl) - - Cl) =G)a. a) a) -
E a) a) C.U) LL
0C Z0
EC)
185

Table 4.2.22. Percentage of the reweighted(60+) sample with different thresholdsof periodontal attachment loss by area,age, gender, social class and attendancepattern.
Richmondshire baseMales 168
Females 169Non-manual 240
Manual 91Attenders 246
Non-attenders 89All 337
DarlingtonMales 148
Females 124Non-manual 161
Manual 111Attenders 193
Non-attenders 78All 272
SalisburyMales 199
Females 245Non-manual 315
Manual 129Attenders 362
Non-attenders 81All 444
any tooth
>6mm54.3%36.4%42.6%53.0%41.4%56.0%45.5%
57.6%31.3%45.8%56.1%46.1%58.9%57.5%
41.7%31.0%34.2%39.5%31.9%53.0%35.7%
60+any tooth
>9mm15.2%8.1%10.0%15.3%9.8%15.4%11.6%
12.9%11.1%12.1%11.9%8.4%
21.3%12.0%
13.0%4.6%6.2%
13.4%5.7%19.7%8.3%
3+ teeth
>6mm25.7%13.0%18.7%20.9%15.2%17.2%19.4%
25.6%20.5%20.4%29.6%19.4%35.1%24.2%
18.7%10.6%12.8%17.5%10.9%28.9%10.8%
Base numbers can be found in table 4.2.16.
186
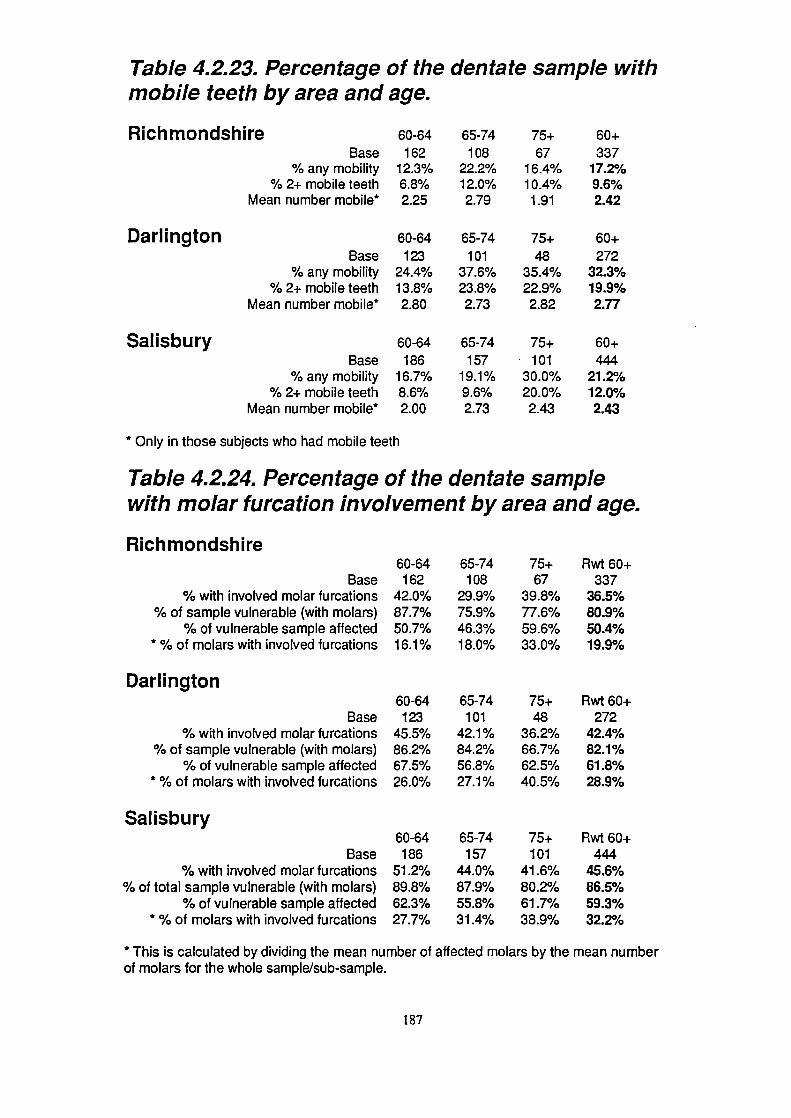
DarlingtonBase
% any mobility% 2+ mobile teeth
Mean number mobile*
60-64162
42.0%87.7%50.7%16.1%
65-74108
29.9%75.9%46.3%18.0%
75+67
39.8%77.6%59.6%33.0%
60-64123
45.5%86.2%67.5%26.0%
65-74101
42.1%84.2%56.8%27.1%
75^48
3 6.2%66.7%62.5%40.5%
60-64186
51.2%89.8%62.3%27.7%
65-74157
44.0%87.9%55.8%31.4%
75+101
41.6%80.2%61.7%38.9%
Table 4.2.23. Percentage of the dentate sample withmobile teeth by area and age.
RichmondshireBase
% any mobility% 2+ mobile teeth
Mean number mobile*
60-64162
12.3%6.8%2.25
65-74108
22.2%12.0%2.79
75+67
16.4%10.4%1.91
60+337
1 7.2%9.6%2.42
60-64123
24.4%13.8%2.80
65-74101
37.6%23.8%2.73
65-74157
19.1%9.6%2.73
75+48
35.4%22.9%2.82
75+101
30.0%20.0%2.43
60+272
32.3%19.9%2.77
60^444
21.2%12.0%2.43
Salisbury 60-64Base 186
% any mobility 16.7%% 2+ mobile teeth 8.6%
Mean number mobile* 2.00
* Only in those subjects who had mobile teeth
Table 4.2.24. Percentage of the dentate samplewith molar furcation involvement by area and age.
Richmondshire
Base% with involved molar furcations
% of sample vulnerable (with molars)% of vulnerable sample affected
* % of molars with involved furcations
Darlington
Base% with involved molar furcations
% of sample vulnerable (with molars)% of vulnerable sample affected
* % of molars with involved furcations
Salisbury
Base% with involved molar furcations
% of total sample vulnerable (with molars)% of vulnerable sample affected
* % of molars with involved furcations
Rwt 60+337
36.5%80.9%50.4%19.9%
Rwt 60+272
42.4%82.1%61.8%28.9%
Rwt 60+444
45.6%86.5%59.3%32.2%
* This is calculated by dividing the mean number of affected molars by the mean numberof molars for the whole sample/sub-sample.
187
may be due to examiner bias (see tables 4.1.9. and 4.1.10.).
Although the data may be subject to examiner related differences between the areas, they are able to
indicate trends according to demographic variables within each area, and the statistics here relate to the
pooled data for both examiners in each area. All areas show a reduction in the proportion with deep pockets
with age. Conversely the proportion with 6mm or more loss of attachment (L0A) appears to increase with
age, and this also applies to the two other thresholds given (i.e. 9mm LoA and 3 or more teeth with 6nmi
LoA). Males are more likely to have deep pockets than females in the younger age groups although the
position is reversed in the oldest group. The trends for social class are inconsistent as they are for
attendance pattern. The picture is clearer when the proportion with loss of attachment is considered. Men,
manual workers and non-attenders are all much more likely to have moderate attachment loss, multiple teeth
affected by moderate attachment loss and severe attachment loss.
Around 18-25% of the sample had some mobile teeth (JGS data only). There was no consistent age related
trend regarding mobility. Those with mobile teeth generally had more than two (table 4.2.23.). Considering
the reweighted data, 50-62% of all subjects with molars had some furcation involvement, and 20-32% of
all molars were involved. The percentage of subjects with furcation involvement (see table 4.2.24.) showed
signs of a reduction in the older age groups, at least in the two urban areas, but the proportion of teeth
which were vulnerable (i.e. the number of molars) decreased with age. In all but a very small number of
cases the furcation involvement was grade 1 (i.e. not through and through).
The measurement of periodontal disease using CPITN
A variety of indices have been for the measurement of oral health, most of these have been designed with
the younger population in mind, and some may not be appropriate for older populations. One commonly
used index for the measurement of periodontal disease (CPITN), seems to be particularly inappropriate as
it relies on the measurement of pocket depth alone, not loss of attachment, to detect the most severe cases.
The design of the data collection in this survey allowed alternative means of collecting measurements of
periodontal disease, so that CPITN could be directly compared with other measures.
188
Two sites on each tooth were probed, the mesio-buccal and mid-buccal on the upper teeth, and the mesio-
lingual and mid-lingual on the lowers. Pocket depth and estimated loss of attachment were recorded at each
Site. When the worst CPITN score (grade 4, pocketing of 6mm or more) was used as the threshold for
severe disease, it was found that:
65% of 441 subjects who had one or more teeth with 6mm or more loss of attachment did not
have deep periodontal pockets (i.e. one or more teeth with pockets of 6nmi or more).
49% of the 194 subjects with 3 or more teeth with 6nini or more attachment loss did not have any
deep periodontal pockets.
44% of the 73 subjects with one or more teeth with very advanced loss of attachment (9mm or
greater) did not have any deep periodontal pockets.
5 of the 13 subjects who had 3 or more teeth affected by loss of attachment of 9mm or more did
not have any deep periodontal pockets.
59% of 231 subjects with mobile teeth and 57% of 134 subjects with 2 or more mobile teeth did
not have any deep periodontal pockets.
It is apparent from these results that when used on its own, CPITN, an index based on pocket depth, failed
to detect a large proportion of cases where there had been moderate periodontal attachment loss robably
a more accurate measure of periodontal disease history). When the analysis was repeated using loss of
attachment of 6mm or more as the primary measure, 21% of 196 subjects with deep pockets (6mm+) and
23% of the 231 subjects with mobile teeth were not detected when using this measure alone. The reasons
for this are covered in the discussion.
4.2.5. Dentate subjects: Tooth wear
Cervical wear
Cervical wear statistics are given in table 4.2.25. and 4.2.26., and an overlay is presented to allow the
calculation of confidence limits for the mean values in the latter table. The data collected by JOS alone is
given in table 4.1.10.. Inter-examiner variation was relatively high and probably accounts for much of the
189
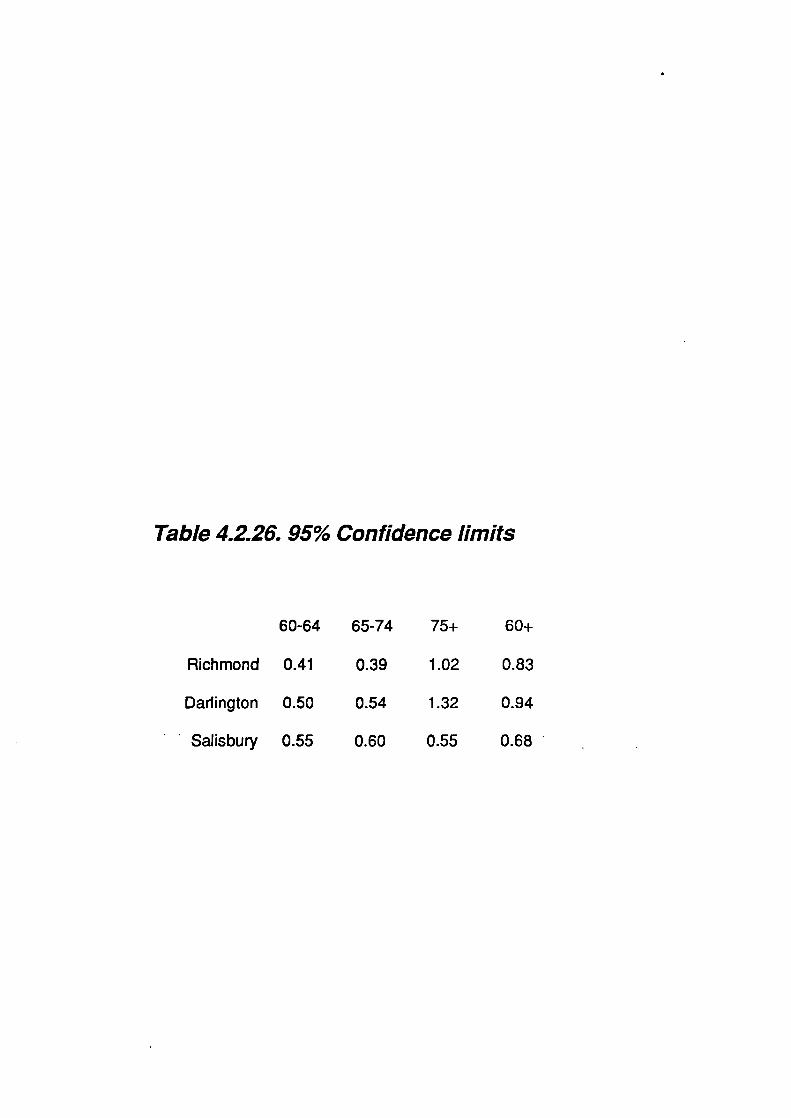
Table 4.2.26.95% Confidence limits
6 0-64 65-74
75+ 60+
Richmond 0.41 0.39
1.02 0.83
Dartington 0.50 0.54
1.32 0.94
Salisbury 0.55 0.60
0.55 0.68

Table 4.2.25. Percentage of the dentate samplewith grade 3 or 4 cervical wear, by area andage.
Base (R)Richmond
Base (D)Darlington
Base (S)Salisbury
60-64181
24.3%134
34.3%207
43.5%
65-74134
27.6%114
38.6%175
40.0%
75+83
30.1%58
25.9%125
51.2%
Rwt 60+398
26.7%306
34.6%507
42.9%
Table 4.2.26. Mean number of grade 3 or4 cervical wear lesions, by age and areain those with lesions
Base (R)RichmondBase (D)
DarlingtonBase (S)
Salisbury
60-6444
2.2246
2.3690
3.31
65-7437
1.9644
2.3670
2.90
75+
60+25
1062.96
2.2415
1053.59
2.5764
2242.99
3.05
See table 4.1.10 for results for one examiner in all areas
190

inter-area differences seen. When the figures for JGS alone are examined the inter-area differences were
fairly small. Overall about 40% of the sample in all three areas had grade 3 wear (as assessed by JGS),
whilst on average about 2.5 to 3 teeth were affected in those who had some wear.
Coronal Wear
Statistics relating to coronal wear are given in Tables 4.2.27. to 4.2.28., with an overlay to allow the
calculation of confidence limits for the mean values in the latter table. A much higher proportion of men
than women showed marked coronal wear and, when wear was present, men had more worn teeth than
women, whilst the trends for social class are not consistent. Non-attenders appear more likely to have wear
than regular attenders. About a third to a half of the dentate sample exhibited wear of grade 3 or worse,
and there was a slight increase with age. Those who are affected generally have multiple worn teeth,
averaging at about 3, but varying between 2.4 for the youngest non-manual workers in Richmond to 5.9
for 65-74 year old non-attenders in Darlington. A minority of the sample demonstrated wear of grade 3 or
worse.
A straightforward chi-squared analysis was undertaken to assess whether more subjects with wear reported
being dissatisfied or having difficulty eating than those without (see table 4.2.29.). No significant differences
were found when subjects with some wear of grade 3 or worse were compared to those with no such wear.
When subjects with some wear of grade 4 were tested in the same way, significantly more reported being
dissatisfied generally, and with their ability to eat, than those without such wear (p<0.05 in both cases).
There was no significant difference when difficulties with eating and dissatisfaction with appearance were
tested in the same way.
4.2.6. All subjects: Other oral disorders
Inter-examiner variability was not measured for soft tissue pathology, so the records of these lesions will
be subject to some unknown examiner variation. However the results show relatively small inter-area
differences, suggesting that these problems are unlikely to be severe. There did not appear to be any really
191

MaleFemale
Non-ManualManual
AttendersNon-attendersBase for "All"
All
Darlington
MaleFemale
Non-ManualManual
AttendersNon-attendersBase for "All"
All
Salisbury
MaleFemale
Non-ManualManual
AttendersNon-attendersBase for "All"
All
Table 4.2.27. Percentage of the dentate samplewith coronal tooth wear of grade 3 or worse byarea, age, gender, social class and attendance.pattern.
Richmondshire60-6433.7%13.0%22.6%25.8%21.2%33.3%
18123.2%
60-6440.5%40.0%36.4%45.6%41.7%43.6%
13440.3%
60-6441.2%43.6%44.0%39.4%42.4%48.1%
20742.5%
65-7443.2%30.0%39.4%37.5%36.8%35.5%
13437.3%
65-7458.6%32.1%35.3%60.9%44.0%52.0%
11445.6%
65-7453.7%49.5%50.0%56.1%50.4%50.0%
17551.4%
75+46.9%43.5%46.7%31.8%44.7%36.7%
8344.6%
75+65.5%51.7%60.5%55.0%52.9%68.6%
5858.6%
75+82.0%60.0%63.2%82.8%68.5%70.4%
12568.8%
Rwt6O+40.8%25.7%34.0%32.8%31.2%35.2%
39833.2%
Rwt6O+52.2%38.4%40.3%53.7%44.7%50.9%
30645.7%
Rwt 60-i-54.8%49.8%50.9%54.5%50.8%56.6%507
52.0%
Base figures for other sub-groups are given in table 4.1.2.
192

1.06
1.23 ' 1.28
0.86
0.95 1.01
1.14
1.16 1.28
1.04
1.22 1.26
0.87
0.93 1 .02
1.66
1.80 1.90
0.77
0.87 0.91
0.73
1.01
1.01
0.58
0.69
0.79
0.56
0.79
0.81
0.84
0.69
0.89
0.52
0.73
0.73
1.13
1.00
1.41
0.47
0.60
0.63
Table 4.2.28. 95% Confidence limits
Richmondshire 60-64
Male 0.74
Female 0.78
Non-Manual 0.54
Manual 1.46
Attenders 0.72
Non-attenders 0.67
All 0.57
DarlingtonMale 1.06
Female 0.80
Non-Manual 0.91
Manual 1.01
Attenders 0.82
Non-attenders 1.28
All 0.68
SalisburyMale 0.92
Female 0.89
Non-Manual 0.86
Manual 0.67
Attenders 0.69
Non-attenders 1.76
All 0.64
65-74
75+
Rwt 60+
0.88
1.29
1.15
0.62
0.62
0.75
0.80
0.76
0.86
0.88
1.41
1.36
0.72
1.03
0.95
1.31
0.72
1.23
0.64
0.67
0.74

Table 4.2.28. Mean number of grade 3 or worse teethin those who have some grade 3 wear, by area, agegender, social class and attendance pattern.
RichmondshireMale
FemaleNon-Manual
ManualAttenders
Non-attendersBase for "All"
All
DarlingtonMale
FemaleNon-Manual
ManualAttenders
Non-attendersBase for "All"
All
SalisburyMale
FemaleNon-Manual
ManualAttenders
Non-attendersBase for "All"
All
60-64 65-74 75+
2.64 4.07 3.23
2.42 2.39 2.75
2.36 3.67 2.75
3.10 2.53 5.19
2.73 3.08 3.16
2.07 4.99 3.4142 50 37
2.57 3.46 3.00
60-64 65-74 75+
3.70 4.15 4.90
3.35 2.95 2.74
2.93 3.46 3.74
3.93 3.96 4.36
3.10 3.80 3.40
3.55 3.57 4.9754 52 34
3.41 3.73 3.94
60-64 65-74 75+
4.05 3.86 3.76
3.25 3.17 3.58
3.85 3.42 4.03
3.05 3.53 2.91
3.66 3.57 3.76
3.00 3.59 3.4688 90 86
3.61 3.50 3.66
Rwt6O+3.412.483.003.142.953.721323.02
Rwt 60+4.103.053.334.013.493.821403.65
Rwt6O+3.903.323.733.243.653.392643.58
Base figures for other subgroups can be calculated from Tables 4.1.2.and 4.2.27.
Table 4.2.29. The relationship between wear anddissatisfaction/function problems (combined data).
% dissatisfied - grade 3+no wear some wear p
Dissatisfied - generally
5.6% 5.6% NS
- with appearance 12.7% 11.0% NS
- with ability to chew
3.8% 4.7% NS
Difficulty - hard foods 29.0% 29.4% NS
Dietary restriction
15.7% 13.4% NS
% dissatisfied - grade 4no wear some wear p
Dissatisfied - generally
5.1% 9.6% 0.02
- with appearance 11.9% 12.2% NS
- with ability to chew
3.7% 7.6% 0.02
Difficulty - hard foods 28.3% 35.0% NS
Dietary restriction
14.6% 15.3% NS
"p" represents the probability value (chi-squared test).

convincing age group or area trends. All 2280 subjects underwent an examination of all visible oral soft
tissues. None had suspected malignancies, and none had lesions which the examiners felt merited further
investigation.
Dry mouth was reported by a substantial proportion of subjects. Flow rates were not measured so the data
presented in table 4.2.30. are based on reported dry mouth and associated factors. Considering the
reweighted 60+ group as a whole, 16-24% reported dry mouth, and the percentage affected in all age groups
was higher in the edentulous than in the dentate (12-20% of the dentate, 22-27% of the edentulous). Only
a relatively small percentage of the sample were taking a medication which has been strongly implicated
in causing xerostomia (the criteria used are presented in appendix 11) however the percentage was higher
in those who suffered from dry mouth, 18-30% in dry mouth sufferers compared to 7-16% of those who
did not have a dry mouth. It should be noted that such drugs could only be held responsible for dry mouth
in less than a third of cases. The remainder must have had some other reason for their dry mouth (for
example disease of the glands, or inhibition of salivary function by drugs or combinations of drugs not
included as high risk for xerostomia). Between 4% and 8% of the reweighted samples reported both dry
mouth and dry eyes, a combination suggesting Sjögrens syndrome, although clearly not indicating it in
every case.
Between 16% and 20% of all complete denture wearers over the age of 60 had pathological lesions
associated with their dentures, whilst 1.6% to 1.8% had more than one type of lesion (table 4.2.31.). The
majority of denture related lesions were denture stomatitis (grade I, U or ifi) which occurred in 11-13%
of all denture wearers. Ulceration associated with dentures (i.e. occurring in obvious areas of denture
trauma) was the next most common occurring in about 3-5% of all complete denture wearers, whilst denture
hyperplasia and angular cheilitis were found in less than 3% overall.
Soft tissue lesions which were not obviously denture related were found in between 10.7% and 14.6% of
mouths. All were thought to be benign, and few were the source of any discomfort to the subject or concern
to the visiting dentist. Small epulides and papillomatous lesions, geographic and black hairy tongue were
194

60-6415.7%13.3%21.6%3.1%
52.0%8.2%75.0%28.1%
65-7416.7%13.4%20.0%4.0%59.0%7.0%
73.3%17.8%
75+20.9%7.3%26.0%5.3%
76.0%10.6%95.2%35.5%
60+ rwt17.8%12.2%22.9%4.2%
62.6%8.5%
80.7%26.1%
60-6416.4%14.2%19.8%4.1%54.1%10.5%77.8%27.8%
65-7423.7%22.8%24.5%9.9%65.9%14.6%88.3%28.3%
75+30.6%24.1%32.6%9.1%
74.7%22.7%85.1%33.8%
60+ rwt24.0%19.9%27.0%8.2%
65.6%16.1%84.6%29.9%
60-6412.8%12.6%13.5%3.7%
45.5%4.5%71.0%12.9%
65-7411.6%10.9%13.3%5.0%
57.4%5.8%
86.7%16.7%
75+23.8%18.4%30.0%6.0%
73.2%
85.7%23.2%
60+ rwt16.2%13.5%21.5%5.1%60.2%7.0%82.8%18.1%
Table 4.2.30. Frequency of reported dry mouth in dentateand eden tulous groups and frequency of relatedfactors in all subjects by area and age.
Richmondshire
Dry mouth - all subjectsDry mouth - dentate
Dry mouth - edentulousDry mouth and eyes
Any medicationXerostomic medication
% of dry mouth subjects on medication% of dry mouth subjects on xerostomic medication
Darlington
Dry mouth - all subjectsDry mouth - dentate
Dry mouth - edentulousDry mouth and eyes
Any medicationXerostomic medication
% of dry mouth subjects on medication% of dry mouth subjects on xerostomic medication
Salisbury
Dry mouth - all subjectsDry mouth - dentate
Dry mouth - edentulousDry mouth and eyes
Any medicationXerostomic medication
% of dry mouth subjects on medication% of dry mouth subjects on xerostomic medication
Dry mouth and medication usage were based on whether these were reported by the patient
Subjects were recorded as medication users if they had been taking a prescribed medication forover a month. Medications were classed as xerostomic if they fulfilled the criteria given in appendix 11.
195

BaseAngular Cheilitis
Denture StomatitisDenture Hyperplasia
Ulcer (denture induced)Any lesion
More than 1 lesionOther pathology (base=all)
Darlington
BaseAngular Cheilitis
Denture StomatitisDenture Hyperplasia
Ulcer (denture induced)Any lesion
More than 1 lesionOther pathology (base=all)
Salisbury
BaseAngular Cheilitis
Denture StomatitisDenture Hyperplasia
Ulcer (denture induced)Any lesion
More than 1 lesionOther pathology (base=all)
Table 4.2.31. Frequency of denture related soft tissuepathology and other pathology, by age and area.
Richmondshire60-64102
1.0%11.8%2.9%4.9%18.7%2.0%7.1%
60-64112
1.8%20.5%1.8%3.6%24.1%2.7%20.0%
60-6461
3.3%21.3%1.7%1.6%
21.3%4.9%13.9%
65-74176
1.7%10.8%1.2%2.9%14.8%1.7%12.9%
65-74157
3.2%9.6%1.3%5.1%17.2%1.2%9.1%
65-74108
2.8%15.7%3.8%5.7%
24.9%1.9%
11.6%
75+237
0.4%11.0%3.8%2.1%16.1%1.3%
10.6%
75+199
2.5%12.6%2.0%5.5%
20.6%2.0%17.8%
75+134
1.6%7.5%0.0%5.5%13.4%0.7%11.5%
60+rwt5151.1%
11.0%2.5%2.9%16.0%1.6%10.7%
60i-rwt4682.7%12.7%1.7%5.0%19.8%1.8%14.6%
60+rwt3032.3%12.5%1.8%5.1%19.1%1.7%12.1%
Table 4.2.32. TMJ clicks, crepitus and jointtenderness by area and age.
R Ic hm onds hirebase
ClicksCrepitus
Tenderness on palpation
Darlingtonbase
ClicksCrepitus
Tenderness on palpation
Salisburybase
ClicksCrepitus
Tenderness on palpation
60-64255
17.6%9.0%1.2%
60-64220
14.5%10.0%9.0%
60-64244
17.2%4.9%1.2%
65-74272
14.0%6.2%1.5%
65-74253
24.1%15.4%1.6%
65-74258
15.5%9.3%0.4%
75+301
10.6%13.3%0.7%
75+242
21.5%22.7%0.8%
75+235
16.6%10.6%1.3%
60+rwt82813.8%9.2%1.2%
60i-rwt71520.8%16.3%3.2%
60+rwt73716.3%8.7%0.9%

relatively common and a few cases of lichen planus or lichenoid lesions were also recorded, all of which
were non-ulcerated and symptom free.
Table 4.2.32. presents data on temporo-mandibular joint signs and symptoms. Clicks were found in 14-21%
of the total reweighted sample, with no strong suggestion of age related differences. Crepitus was found
in 9-16% of the total reweighted sample, and here there was an age related increase. Tenderness of the joint
area to palpation was found in only 1-3% of subjects, and this is in line with the infrequent reports of
discomfort (see table 4.3.9.).
4.3. DATA FROM THE QUESTIONNAIRE
Normative treatment need is covered by the previous data derived from the clinical examination, but what
a dentist considers a patient needs, and what the patient really wants are not necessarily the same thing.
Furthermore, many individuals' behaviour will be determined by their own perceptions of their needs rather
than their dentist's. This section covers the the dental needs and demands of the sample, their attitudes and
the barriers to dental care which they experienced.
The treatment needs and demands of the edentulous are likely to differ from those of the dentate, and
attitudes, levels of satisfaction and expectation may also differ. Consequently data for the edentulous part
of the sample is considered first in tables 4.3.1. to table 4.3.5..
4.3.1. Edentulous subjects
Only a tiny proportion of the edentulous attend the dentist for regular checkups. Of over 1000 edentulous
subjects in this study only 33 said that they attended for regular, or even just occasional, checkups. Given
that non-attendance or irregular attendance is almost universal, comparison of attendance pattern between
areas and groups is meaningless for the edentulous sample, and is not presented.
197

Table 4.3.1. presents data on the length of time edentulous and the age of dentures, with an overlay giving
the figure from which the 95% confidence limits can be calculated. The reweighted edentulous sample had
been edentulous for 30-35 years on average. This was highest in Richmondshire and, not surprisingly,
increased with age from 23-28 years in the 60-64 year olds up to 32-40 years in the over 75 year olds. The
average age of the dentures was 13-14 years in all areas, but once again there was an age related increase
(9-13 years for the youngest groups, 16-18 years for the oldest). The percentage of the sample who had
been rendered edentulous before the age of 40 was much lower in Salisbury (14% of the reweighted
sample) compared to the two northern areas (29-32%) and showed an age related increase, particularly in
the north. However, even in the youngest group in Darlington, 26% of the edentulous reported being
rendered edentulous before the age of 40, about 3 times the equivalent figure in Salisbury (9%).
Edentulous subjects were asked how they normally paid for their dentures and what they thought of dental
charges, this data is presented in tables 4.3.2 and 4.3.3.. Of those who could remember, the majority paid
an NHS contribution (about 70% of respondents) but there were variable but substantial numbers of private
patients and NHS patients who were exempt from charges. The proportion who said that they thought
dentistry was expensive or very expensive decreased with age from about 45% in all areas for the 60-64
year olds down to 22-35% for the 75+ year olds.
Edentulous subjects were asked how satisfied they were with different aspects of function; the figures are
given in table 4.3.4.. Around 90% of the edentulous population were satisfied overall with little regional
difference. Dissatisfaction was more likely to be due to problems with mastication than aesthetics. Subjects
in Salisbury were more likely to be dissatisfied than those in the other areas. No consistent age trend was
apparent. Although 90% were satisfied, about 30% reported some dietary restriction (that there were foods
they would like to eat but could not). This figure was highest in Darlington (37.3%) and Salisbury (30.1%)
and much lower in Richmondshire (21.6%). Despite the high levels of satisfaction, 27-31% of the
reweighted edentulous sample reported discomfort eating, 50-58% reported ulcers under their dentures
occasionally or often, although less than 5% reported constant ulceration. In total 63-72% reported some
oral discomfort, this included discomfort eating, ulceration or other oral discomfort (for example that arising
198

Table 4.3.1. 95% Confidence limits
Rich mondshire
Cont. limits - time edentulousCont. limits - age edentulous
Cont. limits - age of upperConf. limits - age of lower
60-64 65-74 75+ Rwt 60+
1.4 1.2 1.3 1.5
1.3 1.2 1.3 1.4
1.2 1.1 1.2 1.3
1.2 1.0 1.1 1.3
Dan i ngton
Conf. limits - time edentulous
1.3
1.2
1.2
1.4
Cont. limits - age edentulous
1.3
1.2
1.1
1.3
Cant. limits - age of upper
1.3
0.9
1.1
1.2
Conf. limits - age of lower
1.3
0.9
1.2
1.2
Salisbury
Conf. limits - time edentulous 1.7 1.4
1.7
1.8
Conf. limits - age edentulous 1.8 1.4
1.7
1.8
Conf. limits - age of upper 1.6 1.3
1.6
1.7
Cont. limits - age of lower 1.5 1.4
1.6
1.7

65-7480
29.140.711.011.0
15.5%
75+98
31.547.917.917.6
14.8%
Rwt 60+21529.544.014.113.8
13.6%
60-6437
23.140.110.09.0
8.6%
Table 4.3.1. Mean period and age eden tulous,age of dentures worn and percentage of theeden tulous sample rendered edentulous at ayoung age, by area and age.
Richmondshire
BaseMean time edentulous (years)
Mean age rendered edentulousMean age of upper denturesMean age of lower dentures
% edentulous at age 40 or less *
Darlington
BaseMean time edentulous (years)
Mean age rendered edentulousMean age of upper denturesMean age of lower dentures
% edentulous at age 40 or less *
60-6476
27.834.710.211.0
20.4%
60-6486
24.837.012.712.9
25.9%
65-7412932.437.212.411.7
31.3%
65-7413729.940.210.210.0
30.0%
75+17739.841.617.316.1
31.2%
75+17332.041.216.116.6
39.7%
Rwt 60+38234.638.614.013.4
28.5%
Rwt 60^39629.840.013.013.1
32.0%
Salisbury
BaseMean time edentulous (years)
Mean age rendered edentulousMean age of upper denturesMean age of lower dentures
% edentulous at age 40 or less *
* Represents the percentage of the whole population (dentate and edentulous)
These data are based on questions 2 and 10 in Section 2 of the questionnaire
199
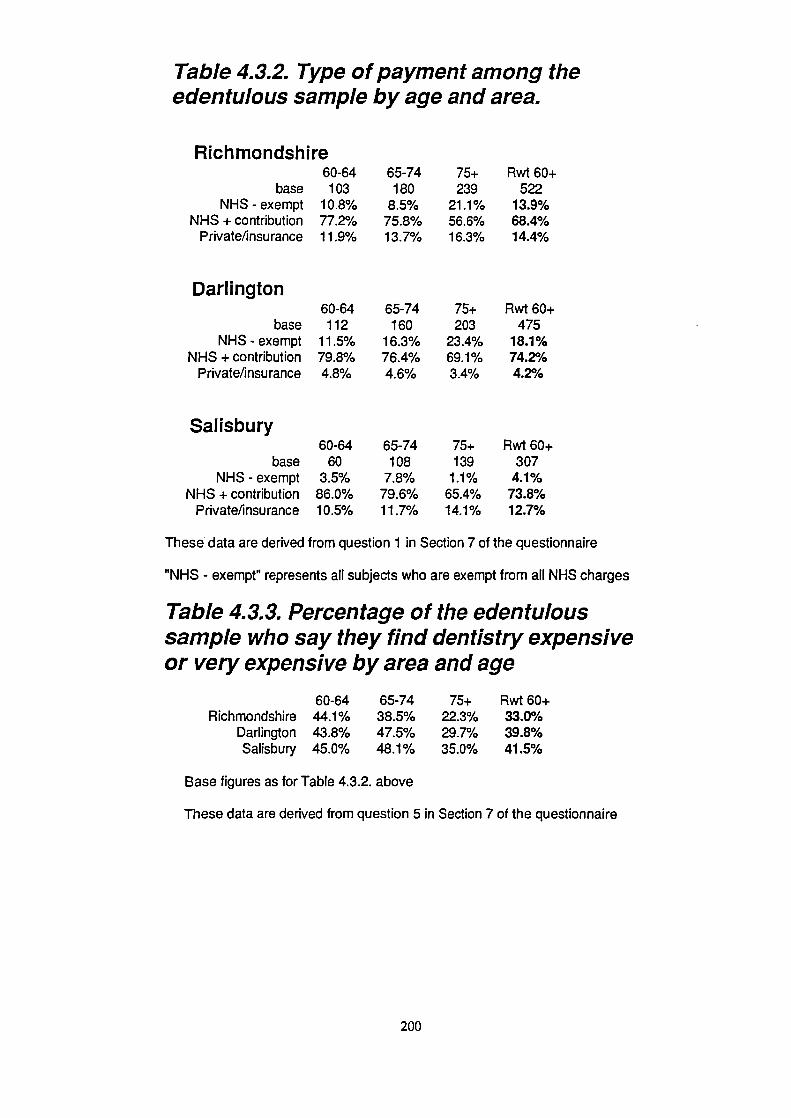
65-74180
8.5%75.8%13.7%
75+239
21.1%56.6%16.3%
Rwt 60^522
13.9%68.4%14.4%
Table 4.3.2. Type of payment among theeden tulous sample by age and area.
Richmondshire60-64
base 103NHS - exempt 10.8%
NHS + contribution 77.2%Private/insurance 11.9%
Darlington
baseNHS - exempt
NHS + contributionPrivate/insurance
Salisbury
baseNHS - exempt
NHS + contributionPrivate/insurance
60-64112
11.5%79.8%4.8%
60-6460
3.5%86.0%10.5%
65-74160
16.3%76.4%4.6%
65-74108
7.8%79.6%11.7%
75^203
23.4%69.1%3.4%
75+139
1.1%65.4%14.1%
Rwt 60+475
18.1%74.2%4.2%
Rwt 60^307
4.1%73.8%12.7%
These data are derived from question 1 in Section 7 of the questionnaire
"NHS - exempt" represents all subjects who are exempt from all NHS charges
Table 4.3.3. Percentage of the edentuloussample who say they find dentistry expensiveor very expensive by area and age
60-64
65-74 75^ Rwt 60+
Richmondshire 44.1%
38.5% 22.3% 33.0%
Darlington 43.8%
47.5% 29.7% 39.8%
Salisbury 45.0%
481% 35.0% 41.5%
Base figures as for Table 4.3.2. above
These data are derived from question 5 in Section 7 of the questionnaire
200

baseDissatisfied - aesthetics
Dissatisfied - functionDissatisfied - overall
Diet RestrictionDiscomfort when eating
Ulcers under dentures*Any discomfort
Darlington
baseDissatisfied - aesthetics
Dissatisfied - functionDissatisfied - overall
Diet RestrictionDiscomfort when eating
Ulcers under dentures*Any discomfort
Salisbury
baseDissatisfied - aesthetics
Dissatisfied - functionDissatisfied - overall
Diet RestrictionDiscomfort when eating
Ulcers under dentures*Any discomfort
Table 4.3.4. Percentage of the edentuloussample who were dissatisfied with differentaspects of function or who reported functionaldifficulties or discomfort, by area and age.
Richmondshire60-64
742.7%5.5%9.5%20.3%28.8%54.8%62.2%
60-6486
5.9%10.5%12.9%34.9%25.9%60.0%73.3%
60-6437
5.4%18.9%18.9%37.8%24.3%56.8%62.2%
65-74138
10.9%10.9%15.6%22.6%26.9%56.7%67.4%
65-74139
8.1%15.8%12.5%39.1%36.0%64.7%78.4%
65-7483
7.2%14.4%8.4%
31.3%33.7%57.8%73.5%
75^2181.9%
5.60%4.70%
21 .1 0%26.70%43.00%59.60%
75+184
3.9%11.40%7.70%
36.40%23.50%50.00%64.10%
75+110
6.5%17.50%13.90%27.50%30.8%53.3%67.3%
Rwt 60+430
5.7%7.8%9.9%21.6%27.1%50.4%63.2%
Rwt 60^4096.0%13.1%10.6%37.3%29.1%57.8%71.6%
Rwt 60+230
6.7%16.4%12.2%30.1%31.3%55.5%69.2%
These data are derived from questions 1 to 4 and question 8 in section 4,and questions 5 and 6 in section 2 of the questionnaire.
Percentages for discomfort and ulceration data are based on these occurringsometimes or always. The frequency of constant discomfort on eating andconstant ulceration are much lower (3-11% and 0-13% respectively).
* "Any discomfort" is a composite variable derived from questions 5 and 6 insection 2 and question 8 in section 4 of the questionnaire.
201

COa).0CO
c'Jx
c'J
0CO
CO
CCO
a)CO
0CO
C.)
>.0•0a,CU
C.)
CUC)
(0a)
CO
0.
C0
CU
8U)(I)CO
0C
0
Ca,a)
a,.0
CU>
>
E
0. •C
CU0>
a,0
CO
>C
.0
Usa,
0.
2E
.0 U)
CU 0
C
§2
COCO
0;= 0
E (.)(I)
• 5 a,>'
o .20)a,.I-
COO
.2 2CUC
COa,0
C
fl.CU
COC.)
C
C.)
COCU
a,
CO
CU
a,I-CO
CC
0
U)
C.
a'
0LI)C0C.)a,Cl)
c)0
U)C0U)a,
C.
CCO
c'J
C
0
C)a,Cl)C
C0U)a,
C.E0'—U)a,
a,-
fi.0 CO
I—•D
0). 0
0 0
E0C)
0
(1)
(I)
0
0C.)
l)
.CI)
C0C) 1 U)
O CO CO 0 CO CO CO CO CO COOC C C C d C C C C C C
V V
.
01 0
0. d
C)C
CO
a CO CO 0 CO CO CO CO U) CO CO CO00. C C C C C C C C C CCO V V.0
C) CC.0 0 0 0 0
d d d
.t0E — ,— u U)o CO CO CO 0 CO C CO CO U) CO 0o C 0 C C d C 0 C C C C 0.0 V V V V=
r- r-o 0)CC.0 0 0-t-0 000. d dddd cd
C0
CO It) U) — i— — ,— —Cl) 0 CO 000 0 CO 00 CO CO
C 0 C 0000 C 00 C Co V VVVV VV
(01
CO
a, - CO C C C C .0 a a,
.2.2.2 Cl)
— 5 .2 O)" 0. 0.
a) a, o '- Cl) CO
CO - 0. Q) .0 Cl) >s>.C) CO CO
C CO '-Oa,'Oa,
8a) '—Ofl
COt 0.0. .2oCOCO >s E-a,'->( a, 0w -J
OC
202

IC) Q IC) 0 IC) 0C\J C\1
pe!siEssip 8U83JOd
Cl)
w -
ct5—
a)
0
E.ot;O
C')•
IC,)C
>D)c•IEc
+N-
(0
U).I-J
C5-Q
E
z
2
a)0z
00
U)I-
U)U)-o>'
I

from dry or burning mouth).
The interaction between dissatisfaction and various aspects of dentures, including the number of faults and
specific faults, was investigated using a simple chi-squared analysis. Pooled data for all three areas were
used for these analyses The findings are presented in table 4.3.5. and figure 4.3.1.. Certain denture faults
were significantly associated with specific aspects of dissatisfaction (excessive wear, poor adaptation or
retention, overextension, incorrect upper teeth placement, occiusal faults, non-matching set and insufficient
free way space) although in all cases the strength of the relationship (indicated by the phi statistic) was
weak. Some denture related faults or findings which might be expected to be related to satisfaction were
not related, specifically the lower ridge form and the position of the lower teeth.
4.3.2. Dentate subjects: Demands
Subjects were asked in the questionnaire whether or not they felt they needed treatment; the findings are
presented in table 4.3.6.. Overall a majority did not feel that they needed treatment (54-62% of the
reweighted dentate sample), but the proportion was about 5% lower in Darlington than it was in the other
two areas. When only those who had some decay were selected the percentage who felt that they did not
need treatment dropped a little, but even so around half of the population with some decay felt they did not
need treatment. Non-attenders were much less likely to think that they did not need treatment, and only a
fifth to a third of non-attenders with decay felt that they were not in need of treatment.
Subjects were also asked to choose the sort of treatment that they would prefer in each of three cases
(filling or extraction in an aching back tooth, crown or extraction in an aching front tooth and crown or
extraction in an aching back tooth). The findings from this are presented in tables 4.3.7. and 4.3.8.. For the
purposes of analysis the dentate population has been divided into those who would always choose
restoration, those who would always choose an extraction and those who would pick and choose according
to tooth and proposed restoration. Quite large regional differences are apparent. More than 70% of the
reweighted sample in Salisbury said they would always choose a restoration (80% in non-manual groups),
204

Darlington
AllBase
With some decayNon-attenders
Non-atts with decay
Salisbury
AllBase
With some decayNon-attenders
Non-atts with decay
Table 4.3.6. Demands: Percentage of thedentate sample who think that they do notneed treatment, by age, area, the presenceof decayed teeth and non-attendance
Rich mondshire
AllBase
With some decayNon-attenders
Non-atts with decay
60-6462.1%
18152.7%33.3%31.8%
60-6448.8%
13444.2%20.5%16.0%
60-6459.8%
20754.3%22.2%20.0%
65-7455.2%
13448.4%35.7%29.4%
65-7456.4%
11446.2%28.0%19.0%
65-7463.1%
17555.4%34.6%29.4%
75+70.3%
8372.5%50.0%53.3%
75+59.6%
5861.3%42.9%50.0%
75+62.0%
12554.5%44.4%38.1%
Rwt 60^60.6%
39854.7%39.0%36.3%
Rwt 60+54.2%
30647.9%27.2%21.8%
Rwt 60+61.8%
50754.8%35.2%30.6%
"With some decay" includes all those subjects who had any decayedor unsound teeth.
Sample bases for some of the subgroups are small, the reader isadvised to refer to reweighted (60+) and "all" totals shown in bold.Figures in italics represent those from a sample base .c20
These data are based on question 1 in Section 5 and question 3 inSection 6 of the questionnaire.
205

C,)
C,)Cl)
C,)
.C,)
0C)
w
a,Cl)0C-0
0.
C0
ca
0
U)a,
a,
-a,Cdl)
00
a,-c
0a,
'I,a,-C
0
0)C
0
8Ca
C0
Cl)
0(I)a,
0C0
C.)'a
a,-DWa,
EWE
a, U)
(o0
wa, 0.0
C t -.2 dl)
— — CU) dl)
C C,
Wa,0EE
C')C'J
a,.0Cl)I-C
0C
0
a,-aCCa00)a,
0)
a,U)dl)
U, O)NO U)N.L0C')LC) NC')DN. CJC)
Wcii-'--C') '— Wci'-cI.-- u-
+U) .C')CD .CD .
C0
. C')• C%J 00) N. NCDCJCDOC)
0
0 .— CD — .— •cc CJ CD .-
C0
CD C') 0) CD CD CD
c:jc.JC'i
C)
.-C')CDU).-N. CD 0 CD 0 C'.1
cc U) CD C') CO C') ID
C0
CD CD C') U) C') (.1drc'i0
C)
w
:s: cc U) U) CD C') CD (.4 I)0V0E.cC.) 0z
z
C0
£o CD N. C'J C') . 0C1 .-CD .- N. N.C') C') C'J C'J U) C'
0
.-oCDC')OC') — C') CD
C0
U) CD C'J 0 U) 0 C')
C') C'.J C') C') C') CD C')0
-N.00O•0•Ifla, CD .— U) C') ('1cc CD (DC') ID
C0
.E C') C') U) N .- N 0
Eiwrc')0C)
2 0 0) (0 C C') • 00 .- C') N. ('4 C') CDCO U) CD N C.4U)
o CaCaE•1
C)
.
0"I 0
z
C0
° 0 C) CD C') 0 CD.0E CD c,a .— c'.i -. (.4
0
(DN.CDC')O0 .- 0 CD C') (.4 IDCD N CD U) CD U) N
C0
. U) C') CD N a cq
.0 N. N- 0.- 0'-. (.4.- C') (.4 (.4 (.1
0
_DU)OCD•Lqo..- U) CD C) C') N CDN. CD N N C') CD
C0
. ('4 U) CD .— C') 0) CD
.DNLUIE.-00
CD C') U) 0)0)0) CD
ajN.N.-.-OU)("lcc CDNCDU) CD (.4 N
.=
00V., z
F- E-'U)C')CDC')OU)0U)N.-cóCOW .-C.4.--C')C'.l CDW-
CDCD.C').• CD0c'i IC')1_
206
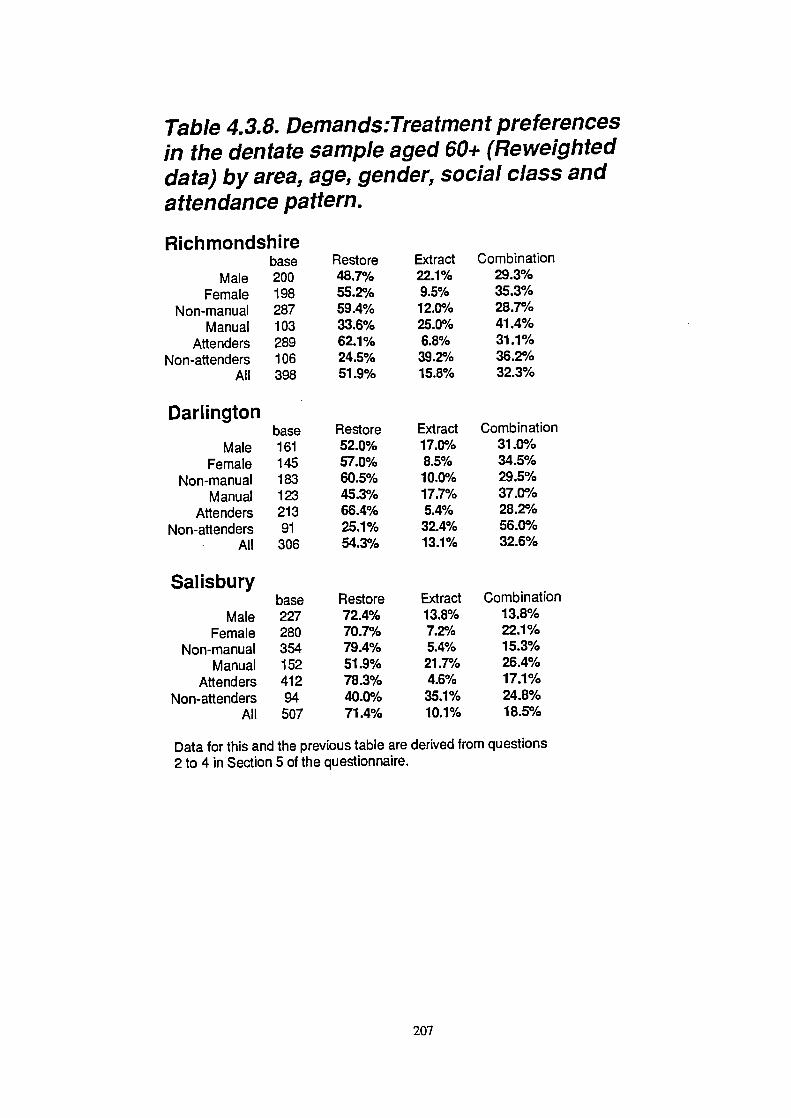
Restore48.7%55.2%59.4%33.6%62.1%24.5%51.9%
Extract22.1%9.5%12.0%25.0%6.8%39.2%15.8%
Combination29.3%35.3%28.7%41.4%31.1%36.2%32.3%
Restore52.0%57.0%60.5%45.3%66.4%25.1%54.3%
Extract17.0%8.5%1 0.0%17.7%5.4%32.4%13.1%
Combination31.0%34.5%29.5%37.0%28.2%56.0%32.6%
Restore72.4%70.7%79.4%51.9%78.3%40.0%71.4%
Extract13.8%7.2%5.4%21.7%4.6%35.1%10.1%
Combination13.8%22.1%15.3%26.4%17.1%24.8%18.5%
Table 4.3.8. Deman ds:Trea tmen t preferencesin the dentate sample aged 60+ (Reweighteddata) by area, age, gender, social class andattendance pattern.
Richmondshirebase
Male 200
Female 198
Non-manual 287
Manual 103
Attenders 289
Non-attenders 106
All 398
Darlingtonbase
Male
161
Female
145
Non-manual
183
Manual
123Attenders 213
Non-attenders
91
All
306
Salisburybase
Male 227Female 280
Non-manual 354
Manual
152Attenders 412
Non-attenders
94
All
507
Data for this and the previous table are derived from questions2 to 4 in Section 5 of the questionnaire.
207

whilst the figure is 50-55% in both northern areas and there is an age related reduction in the north. Overall
10-15% of the sample in all areas would always choose extraction, but in the sub-groups this ranges from
none in the oldest Richmondshire attenders and 4% in the youngest Salisbury attenders up to 48% of the
non-attenders in the same sample (60-64 year olds in Salisbury). Generally men, manual workers and non-
attenders are more likely to opt for extraction.
Table 4.3.9. reports on the frequency of various dental or oral symptoms in the dentate samples. Of the
reweighted sample 21-25% reported sensitivity of their teeth to hot or cold, and 7-10% reported toothache
in the previous four weeks. Sensitivity showed signs of an age related decrease in all areas. Data for
temporo-mandibular joint pain and tooth mobility were generally in line with the findings of the clinical
examination. Gums which frequently bled on tooth brushing were reported by 5-7% of the reweighted
sample. The "other oral discomfort' category was generally accounted for by those with uncomfortable oral
dryness (at least 80% of these cases). Reports of burning mouth arid oral pain other than toothache were
restricted to a very few individuals.
43.3. Dentate subjects: Attitudes
Results are presented in this section for a variety of variables related to peoples' attitudes to dental health.
These include dental attendance, oral hygiene practices, attitudes to becoming edentulous, attitudes to partial
dentures, attitude to cost and payment and levels of satisfaction or dissatisfaction with various aspects of
oral function.
Non-attendance at the dentist may be an important indicator of attitudes to oral health and table 4.3.10.
gives the demographic breakdown of the non-attenders. Non-attenders were found to be under represented
in the final (visited) sample; the proportion of the sample who were non/irregular attenders, including those
responding to the postal questionnaire of refusers, is given elsewhere (see table 4.1.5.). There are strong
social, gender and regional trends among the non-attenders. Men, the families of manual workers
(particularly those from unskilled manual backgrounds) and subjects in both of the northern samples were
208

baseBleeding gums
Loose teethSensitivityToothache
TMJ painOther oral discomforl
Darlington
baseBleeding gums
Loose teethSensitivityToothache
TMJ painOther oral discomforl
Salisbury
baseBleeding gums
Loose teethSensitivityToothache
TMJ painOther oral discomf oil
Table 4.3.9. Demands: Symptoms reportedby the dentate sample, by area and age
Richmondshire60-64
1818.3%13.9%27.2%5.0%2.8%8.3%
60-64134
6.0%15.7%21.6%6.7%7.5%13.4%
60-64207
5.3%12.6%30.6%10.7%9.2%12.6%
65-74134
4.5%21.2%22.8%9.8%4.5%12.0%
65-74114
6.1%15.8%21.0%6.1%7.9%19.3%
65-74175
4.0%13.1%23.9%7.4%5.2%8.0%
75+83
0.0%13.6%13.6%3.7%4.9%7.3%
75+58
10.3%16.7%18.5%9.3%0.0%12.1%
75+125
4.8%11.3%21.2%12.1%1.6%19.2%
Rwt 60+398
5.1%17.0%22.8%6.9%3.9%9.7%
Rwt 60+306
6.8%15.9%20.8%6.9%6.4%15.9%
Rwt 60^507
4.6%12.5%25.2%9.7%5.4%12.5%
Data for this table are derived from questions 2 to 5 in Section3 and questions 8 and 9 in Section 4 of the questionnaire.
Bleeding gums data refers to responses of "always" or "often".Sensitivity data refers to responses of "often" or "sometimes".
209

MaleFemale
Non-ManualIll Manual
IVNBase for "All"
All
Darlington
MaleFemale
Non-ManualIll Manual
IVNBase for "All"
All
Salisbury
MaleFemale
Non-ManualIll Manual
IVNBase for "All"
All
Table 4.3.10. Attitudes: Percentage of the dentate samplewho attend only when they are having trouble with theirteeth, by area, age, gender, social class and attendancepattern.
Richmondshire60-6430.3%8.8%
18.0%20.0%33.3%
18119.4%
60-6433.8%28.3%23.4%39.0%50.0%
13431.3%
60-6420.6%11.8%7.8%
33.3%33.3%
20715.9%
65-7431.1%20.0%20.2%33.3%53.3%
13426.1%
65-7431.6%17.9%19.1%27.8%50.0%
11424.8%
65-7416.3%16.8%13.6%13.2%42.1%
17516.6%
75+50.0%39.1%33.3%69.2%14.3%
8343.9%
75+37.9%20.7%28.9%31.3%75.0%
5829.3%
75+28.0%24.3%19.1%53.8%66.7%
12525.8%
Rwt 60+33.8%19.6%21.8%34.3%40.5%
39826.8%
Rwt 60+33.5%22.0%22.5%32.5%54.0%
30628.0%
Rwt6O+20.6%17.6%13.6%30.3%41.3%507
18.9%
Base numbers for subgroups can be found in Table 4.2.3.
Data for this table are based on question 3 in Section 6 of the questionnaire.
210
substantially more likely to be non-attenders. There was a general increase in the proportion of non-
attenders with age, and this was particularly evident in Richmondshire where 44% of the over 75 year old
sample attended never or only when they had trouble.
Dentate subjects were asked about their toothbrushing frequency; the results are presented in table 4.3.11..
Salisbury had a higher proportion of regular brushers (70% brushing 2x a day or more) than Darlington
(61%) and particularly Richmondshire (42%). Both urban areas had a hard core of 5-6% of the sample who
only occasionally, or never, brushed their teeth, this was doubled (12%) in rural Richmondshire.
The dentate subjects were asked how upsetting they found the prospects of total tooth loss; the percentage
who said that they would be nor at all upset is given in table 4.3.12. In Richmondshire and Salisbury there
was a small increase with age in the proportion who would be untroubled by the prospect of edentulousness,
with around a quarter of the population over 60 years falling into this category. The age related trend in
Darlington seems less clear. Regional differences were small, although Salisbury had fewer who would not
be upset than the other two areas (about 3-4% fewer). Males and manual workers were much less likely
to be upset than females and non-manual workers, particularly in the urban areas (the size of the differences
were much smaller in Richmondshire). It was, once again, between attenders and non-attenders that the
largest differences lay, 47-52% of non-attenders said that they would not be upset by loss of all of their
teeth, compared to only about 18-20% of attenders.
Table 4.3.13. reports on the expectation of the need for full dentures in the future by the dentate sample.
Expectation was highest in Darlington (19% of the reweighted sample), and lowest in Richmondshire (11%).
Richmond and Salisbury showed a decrease in this expectation with increasing age, in Darlington there were
signs of the opposite, but in none of these cases were the trends convincing. Gender and social class
differences were generally minor, but it was non-attenders who were by far the most likely sub-group to
expect to become edentulous, 27-28% in the two urban areas, although much less in Richmondshire (14%).
Dentate subjects were asked the same questions about payment as the edentulous, these data are presented
211

base for "All"2x or more daily
lx daily<lx daily/never
never
Darlington
base for "All"2x or more daily
lx daily<lx daily/never
never
Salisbury
base for "All"2x or more daily
lx daily<lx daily/never
never
Table 4.3.11. Attitudes: Reported frequency oftoothbrushing by the dentate sample by areaand age.
Richmondshire60-64
18146.7%41.1%11.1%1.1%
60-64134
56.0%39.6%3.7%0.7%
60-64207
70.9%25.7%2.4%1.0%
65-74134
40.5%45.1%11.4%3.0%
65-74114
67.5%25.4%5.3%1.8%
65-74175
70.9%23.5%4.5%1.1%
75+83
35.8%47.0%12.3%4.9%
75+58
53.7%33.3%11.1%1.9%
75+125
65.9%22.8%9.7%1.6%
Rwt 60+398
42.0%43.9%11.5%2.6%
Rwt 60+306
60.9%32.0%5.7%1.4%
Rwt 60+507
69.5%24.0%5.3%1 .2%
Data for this table were derived from question 8 in section 3 of the questionnaire
212

Table 4.3.12. Attitudes: Percentage of the dentatesample who would be not at all upset at losingall of their teeth by area, age, gender, socialclass and attendance pattern.
Richmondshire
MaleFemale
Non-manualManual
AttendersNon-attendersBase for "All"
All
Darlington
MaleFemale
Non-manualManual
AttendersNon-attendersBase for "All"
All
Salisbury
MaleFemale
Non-manualManual
AttendersNon-attendersBase for "All"
All
60-6422.5%14.8%18.5%17.5%13.0%43.3%
18118.6%
60-6434.3%26.4%29.0%33.3%21.4%51.3%
13430.9%
60-6423.0%11.3%11.5%29.6%11.5%48.1%
20716.8%
65-7433.3%29.2%31.0%31.4%26.3%46.4%
13431.4%
65-7430.8%12.5%16.7%30.0%14.9%40.0%
11422.0%
65-7435.7%15.1%19.8%34.0%20.0%46.2%
17521.6%
75+37.0%28.9%31.3%33.3%18.4%51.9%
8332.3%
75+56.0%13.6%33.3%41.2%27.3%57.1%
5836.2%
75+35.9%29.5%30.7%36.0%21.9%59.3%
12532.0%
Rwt 60+30.0%23.5%26.2%26.6%19.6%47.2%
39826.7%
Rwt 60+36.4%17.5%24.2%33.0%19.3%47.8%
30627.7%
Rwt 60^31.8%18.3%20.7%33.0%17.8%51.6%
50723.1%
Base figures for other sub-groups can be found in Table 4.2.3.
These data are derived from question 6, Section 5 of the questionnaire
213

Table 4.3.13. Attitudes: Percentage of thedentate sample who expect to need fulldentures in future, by area, age, socialclass and attendance pattern.
Richmondshire
MaleFemale
Non-manualManual
AttendersNon-attendersBase for "All"
All
75+8.6%4.3%5.0%7.7%4.3%8.6%
836.2%
60-6422.5%11.0%11.4%25.8%11.1%37.1%
18116.7%
65-745.6%10.2%7.5%4.3%9.2%3.1%134
7.6%
Rwt 60+12.2%9.3%8.5%12.6%9.3%1 4.0%398
10.8%
Darlington
MaleFemale
Non-manualManual
AttendersNon-attendersBase for "All"
All
60-6416.2%20.3%14.5%19.5%8.8%
38.1%134
18.0%
65-7420.7%14.5%14.9%16.7%15.5%21.4%
11417.7%
75+14.3%34.5%24.3%25.0%25.6%17.6%
5824.6%
Rwt 60+17.9%20.2%16.6%19.0%14.9%27.6%306
19.0%
Salisbury
MaleFemale
Non-manualManual
AttendersNon-attendersBase for "Allt'
All
60-6421.9%13.9%17.3%14.6%12.2%46.9%
13417.6%
65-7416.3%13.7%11.9%18.4%12.3%27.6%
11414.9%
75+20.0%6.8%12.9%11.5%12.0%12.9%
5812.2%
Rwt 60+19.0%11.7%13.8%15.7%12.2%26.9%
30615.0%
Base figures for other sub-groups can be found in Table 4.2.3.
These data are derived from question 7 in Section 5 of the questionnaire
214

in tables 4.3.14. and 4.3.15.. A substantial proportion of all groups felt that dentistry was expensive or very
expensive, the lowest overall figure being in Salisbury (4 1%) and the highest in Darlington (5 1%). In both
urban areas non-attenders were much more likely to think it was expensive than attenders (with a 30%
difference between the groups), but in Richmondshire the non-attenders felt quite differently and only 30%
said that they thought dentistry was expensive or very expensive. In all areas manual workers were much
more likely to feel that dentistry was expensive than non-manual workers. Those who had had a dental visit
in the last year were less likely to feel that dentistry was expensive than those who had not, but this only
applied to the urban areas, once again the situation was reversed in Richmondshire. Those in the 65-74 year
old group in both Northern areas were much more likely to feel dentistry was expensive than those in either
the younger or the older age groups, whilst in Salisbury there was a general reduction with age in the
percentage who felt this way. Over 85% in all areas (for the reweighted 60+ totals) were NHS patients who
paid a contribution, only 2% to 7% received NHS dentistry exempt from all charges, while the proportion
having private dentistry was about 7% in Richmondshire and Salisbury, but only 3% in Darlington.
Dentate subjects were asked the same satisfaction questions as the edentulous; the results are presented in
table 4.3.16.. Fewer dentate people were dissatisfied with their overall oral condition (a consistent 5-6%)
than was the case with the edentulous, but dissatisfaction with aesthetics was more common in the dentate
(11-14%) than it was in the edentulous (6-7%). In the dentate it decreased with age in the Northern areas,
but not in Salisbury. On the other hand dietary restriction and dissatisfaction with function were much less
frequently reported (around 15% and 4% respectively) in the dentate. In both urban areas dietary restriction
increased markedly with age, this was not the case in Richinondshire. Further analysis of the factors which
contribute to dissatisfaction are covered in sections 4.4. and 4.5.
4.3.4. Dentate subjects: Barriers and reasons for dental non-attendance (non-attenders only)
Dentate subjects who did not attend the dentist for check-ups were asked about the reasons for non-
attendance. The results are shown in Tables 4.3.17 and 4.3.18.. Six potential barriers were listed and the
subjects asked if they were, or were not, reasons for non-attendance at the dentist. They were then asked
215

MalesFemales
Non-manualManual
AttendersNon-attenders
Dental visit in last yearNo dental visit in last yearNHS contribution and visit
base for "All"All
Darlington
MalesFemales
Non-manualManual
AttendersNon-attenders
Dental visit in last yearNo dental visit in last yearNHS contribution and visits
base for "All"All
Salisbury
MalesFemales
Non-manualManual
AttendersNon-attenders
Dental visit in last yearNo dental visit in last yearNHS contribution and visiV
base for "All"All
Table 4.3.14. Attitudes: Percentage of the dentatesample who say they find dentistry expensive orvery expensive by age, gender, social class andrecent experience.
Richmondshire60-6440.0%46.3%35.6%71.9%43.9%3 6.8%42.4%47.8%41.2%
18143.4%
60-6446.8%52.2%40.0%60.4%42.7%69.2%45.1%61.5%46.7%
13449.1%
60-6444.2%42.9%36.2%61.1%41.1%61.9%42.0%54.9%43.4%
20743.5%
65-7453.2%55.6%50.7%63.6%59.0%36.8%58.6%40.9%60.0%
13454.3%
65-7462.2%56.3%52.6%69.4%54.1%77.8%54.9%72.7%54.7%
11459.1%
65-7438.6%43.8%28.6%71.1%39.4%55.6%40.9%43.5%39.8%
17541.3%
75+25.0%23.5%22.9%30.8%24.4%23.5%22.7%29.4%22.2%
8324.2%
75+30.0%42.1%37.0%33.3%23.3%75.0%28.1%71.4%28.1%
5835.9%
75+39.5%38.6%30.1%71.4%32.5%66.7%35.0%60.0%29.9%
12538.9%
Rwt6O+43.9%45.3%39.7%61.7%47.8%32.8%45.4%40.3%45.8%
39844.6%
Rwt6O+50.9%52.3%45.2%60.5%44.9%73.8%47.0%68.2%47.2%
30651.4%
Rwt6O+40.6%42.0%31.3%68.0%38.2%61.4%39.8%51.1%38.6%
50741.3%
These data are derived from questions 1,2 and 5 in Section 7 of the questionnaire
216

65-74134
0.0%90.1%6.6%
75+83
4.8%75.6%12.9%
Rwt 60+3981.6%
88.2%6.8%
Table 4.3.15. Attitudes: Type of payment for dentalcare among the dentate sample by area and age.
Rich mon ds hire60-64
base 181NHS-exempt 2.0%
NHS-contribution 92.1%Private/insurance 4.0%
Darlington
baseNH S-exempt
NHS-contributionPrivate/insurance
Salisbury
baseNHS- exempt
NHS-contributionPrivate/insurance
60-64134
9.3%85.2%1.9%
60-64207
2.7%88.6%7.1%
65-74114
8.6%87.1%3.2%
65-74175
2.0%84.7%10.7%
75+58
0.0%94.9%2.6%
75+125
10.5%81.1%2.1%
Rwt 60+306
7.4%87.8%2.6%
Rwt 60+507
4.6%84.9%7.2%
'NHS-exempt" represents those who are exempt from all dental charges"NHS -contribution' represents all those who pay a contribution of the cost.
These data are derived from question 1 in Section 7 of the questionnaire
217

Table 4.3.16. Attitudes: Percentage of thedentate sample who were dissatisfied withdifferent aspects of function, by area and age.
Richmond
baseDissatisfied - aesthetics
Dissatisfied - functionDissatisfied - overall
Difficulty eating - diet restrictedDifficulty eating - hard foods
Altered food preparation
Darlington
baseDissatisfied - aesthetics
Dissatisfied - functionDissatisfied - overall
Difficulty eating - diet restrictedDifficulty eating - hard foods
Altered food preparation
Salisbury
baseDissatisfied - aesthetics
Dissatisfied - functionDissatisfied - overall
Difficulty eating - diet restrictedDifficulty eating - hard foods
Altered food preparation
60-64181
13.8%4.4%5.5%12.8%18.4%3.3%
60-64134
16.4%3.0%5.2%10.4%20.8%2.2%
60-64207
11.6%5.4%7.8%14.5%28.5%1.0%
65-74134
9.0%2.2%4.5%14.4%28.3%0.7%
65-74114
14.0%6.2%5.3%12.3%28.9%3.5%
65-74175
10.3%5.1%62%15.4%29.1%4.0%
75+83
8.5%3.7%6.10%12.3%32.9%2.4%
75+58
8.6%8.6%6.9%19.0%43.4%5.2%
75^125
12.0%2.4%2.4%
23.2%41.1%4.8%
Rwt 60+398
10.7%3.3%5.2%13.4%25.4%2.0%
Rwt 60+306
13.9%5.4%5.5%12.8%28.5%3.3%
Rwt 60+507
11.2%4.4%5.6%17.3%32.3%3.3%
These data are based on questions 1 to 4 in Section 4 of the questionnaire.
218
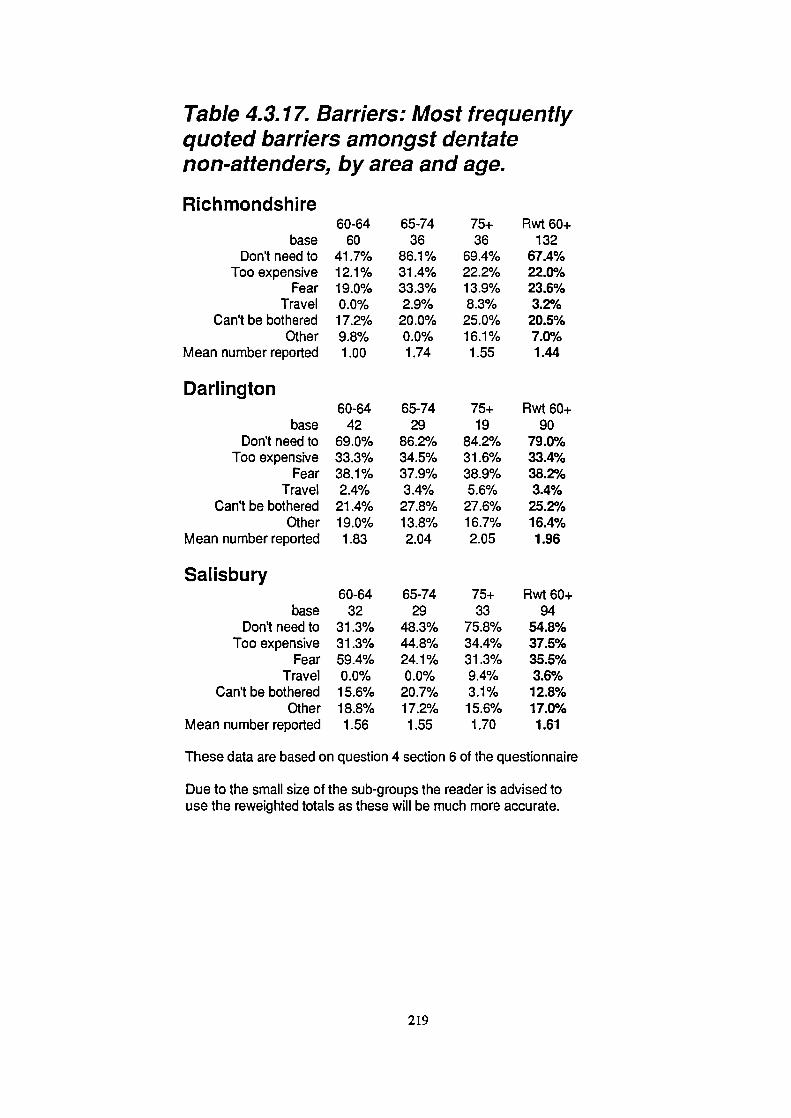
baseDon't need to
Too expensiveFear
TravelCan't be bothered
OtherMean number reported
Darlington
baseDon't need to
Too expensiveFear
TravelCan't be bothered
OtherMean number reported
Salisbury
baseDon't need to
Too expensiveFear
TravelCan't be bothered
OtherMean number reported
Table 4.3.17. Barriers: Most frequentlyquoted barriers amongst dentatenon-attenders, by area and age.
Richmondshire60-64
6041.7%12.1%19.0%0.0%17.2%9.8%1.00
60-6442
69.0%33.3%38.1%2.4%21.4%19.0%1.83
60-6432
31.3%31.3%59.4%0.0%15.6%18.8%1.56
65-7436
86.1%31.4%33.3%2.9%
20.0%0.0%1.74
65-7429
86.2%34.5%37.9%3.4%
27.8%13.8%2.04
65-7429
48.3%44.8%24.1%0.0%20.7%17.2%1.55
75+36
69.4%22.2%13.9%8.3%25.0%16.1%1.55
75+19
84.2%31.6%38.9%5.6%
27.6%16.7%2.05
75+33
75.8%34.4%31.3%9.4%3.1%15.6%1.70
Rwt 60+132
67.4%22.0%23.6%3.2%
20.5%7.0%1.44
Rwt 60+90
79.0%33.4%38.2%3.4%25.2%16.4%1.96
Rwt 60+94
54.8%37.5%35.5%3.6%12.8%17.0%1.61
These data are based on question 4 section 6 of the questionnaire
Due to the small size of the sub-groups the reader is advised touse the reweighted totals as these will be much more accurate.
219

baseDon't need to
Too expensiveFear
TravelCan't be bothered
Other
Darlington
baseDon't need to
Too expensiveFear
TravelCan't be bothered
Other
Salisbury
baseDon't need to
Too expensiveFear
TravelCan't be bothered
Other
Table 4.3.18. Barriers: Single mostimportant barrier among non-attenders,by area and age.
Rich mondshire
60-6455
70.9%7.3%10.9%0.0%5.5%5.5%
60-6441
48.8%17.1%19.5%0.0%2.4%12.2%
60-6432
51.6%9.7%2.9%0.0%3.2%6.5%
65-7436
72.2%13.9%11.1%0.0%2.8%0.0%
65-7428
57.1%10.7%17.9%0.0%3.6%10.7%
65-7428
60.7%17.9%7.1%0.0%10.7%0.0%
75+35
60.0%11.4%5.7%5.7%8.6%8.6%
75+18
57.2%11.1%5.6%0.0%0.0%11.1%
75+33
60.6%21.2%12.1%0.0%0.0%0.0%
Rwt 60+126
68.7%10.8%9.7%1.4%5.2%4.2%
Rwt 60+87
53.8%13.3%16.1%0.0%2.4%11.4%
Rwt 60+93
58.4%17.1%8.0%0.0%4.7%1.6%
These data are based on question 4 section 6 of the questionnaire
Due to the small size of the sub-groups the reader is advised touse the reweighted totals as these will be much more accurate.
220

to name the barrier which was the most important reason for non-attendance.
In all areas it was a feeling that they did not need to go which was the most widely quoted reason for non
attendance (55-79% for the 60+ groups as a whole), followed by fear (24-38%), expense (22-38%) and
"can't be bothered" (13-25%). When looking at these figures it is important to consider the relatively small
base numbers, even the reweighted totals will have 95% confidence limits of between 6% and 10%, so
interpretation of minor percentage differences, particularly between the age/area sub-groups, should be made
with caution. Nevertheless there is a strong suggestion that the proportion who said they did not attend
because they did not need to attend was much lower in the 60-64 year olds than in the older age groups.
Patterns for the other variables are much less clear. The mean number of barriers reported lay between 1.4
in Richmondshire and 2.0 in Darlington.
When the single most important barriers were examined the findings were similar with 50-60% choosing
"don't need to" as the most important reason for non-attendance in the urban areas, increasing to nearly
70% in Richmondshire. Expense and fear were the only other barriers which were reasonably frequently
quoted, but at 11-17% and 8-16% respectively they lagged well behind "don't need to" as most important
reasons. Too far to travel did not feature at all except for a couple of individuals in the oldest group in rural
Richmondshire.
4.3.5. All subjects: Access to care and knowledge of services
Table 4.3.19. presents data on access to care and knowledge of services for all subjects (dentate and
edentulous). Only 1-3% of the total sample (reweighted data) reported any problem getting treatment, and
only 3-4% reported any difficulty getting to the surgery, although this was age dependent with up to 7%
of the 75+ groups reporting difficulty. In the two urban areas only 6-9% of the reweighted samples travelled
any more than 5 miles to the dentist, so the problems of getting to the surgery were, in theory, less than
those experienced in Richmondshire where 44% travelled more than 5 miles. However in terms of reported
difficulty getting to the surgery it appeared to make no difference.
221

60-642.0%1.6%
40.2%0.4%2.4%
47.6%9.5%
65-741.5%3.7%40.6%1 .2%3.7%59.7%14.6%
60-644.1%0.9%7.0%1.3%2.7%61.8%20.6%
65-744.3%2.4%4.2%0.8%3.2%65.2%20.3%
60-644.1%1.6%6.5%2.4%2.5%49.6%8.6%
65-741.6%3.5%9.5%2.1%1.9%
51.9%12.4%
Table 4.3.19. Percentage of sample reporting problemsof access to care and knowledge of domiciliary careby area and age (all subjects).
Richmondshire
Problems getting treatmentDifficulty getting to surgery
Travel more than 5 milesDifficulty getting an appointment
Personal experience of domiciliary careThink domiciliary care is possible
Think domiciliary care would be helpful
Darlington
Problems getting treatmentDifficulty getting to surgery
Travel more than 5 milesDifficulty getting an appointment
Personal experience of domiciliary careThink domiciliary care is possible
Think domiciliary care would be helpful
Sa'isbury
Problems getting treatmentDifficulty getting to surgery
Travel more than 5 milesDifficulty getting an appointment
Personal experience of domiciliary careThink domiciliary care is possible
Think domiciliary care would be helpful
75+0.7%6.3%
51.9%0.0%6.5%
48.1%24.3%
75+1.2%5.0%8.5%0.8%8.3%60.7%23.2%
75+2.6%6.8%10.3%1.4%5.6%51.3%49.8%
60+ rwt1.4%4.0%44.1%0.6%4.3%52.9%16.4%
60+ rwt3.3%2.8%6.2%0.9%4.7%62.9%21.3%
60+ rwt2.5%4.2%9.1%1.9%3.3%51.2%24.6%
These data are based on questions 1, 2 and 3 in Section 8 and question 1 in Section6 of the questionnaire.
222

Only 3-5% had any experience of domiciliary care, and this was age dependent, with up to 8% of the 75+
year olds having previous experience of domiciliary care. Despite low levels of personal experience, more
than half of the reweighted samples (51-63%) was aware of the possibility of domiciliary care, with
awareness fairly constant between age groups. Between 16% and 25% of the reweighted samples felt it
would be helpful to receive domiciliary care. In Salisbury there was the expected age related increase, from
7% in the 60-64 age band up to 50% in the 75+ group. A similar, though less marked increase was apparent
in Richmondshire, whilst in Darlington there was only a small age related increase where 21% of 60-64
year olds felt it would be helpful to have domiciliary care, compared with 23% of 75+ year olds.
4.4. THE PARTIALLY DENTATE: MASTICATORY FUNCTION, THE NUMBER OF TEETH AND
THE ROLE OF PARTIAL DENTURES
This section reports on the relationship between number and distribution of teeth and various functional
problems. The factors which determine whether a subject wears partial dentures to try to restore aesthetics
or function is also covered followed by an investigation of the possible detrimental role of partial dentures
in various dental conditions. The underlying theme of these analyses is an attempt to identify an
appropriate goal or goals for the minimum number of natural teeth in the elderly, and the desirability or
otherwise of prosthetic replacements for those that are missing.
4.4.1. Number of teeth and function
A series of logistic regression analyses which tested the relationship between problems with masticatory
function and various clinical, socio-demographic and other variables was undertaken. The full results are
presented in the Section 4.5.: however, the number of teeth (or specifically the number of missing teeth)
were found to have a highly significant relationship with eating problems in all cases, such that more
missing teeth increased the odds of problems. These logistic regression models are able to control for the
effect of a large number of important variables in assessing the importance of the number of teeth. For each
missing tooth the odds of reporting a problem eating increased by a factor of about 1.15 overall. The
223

cumulative effect of this where there were many missing teeth would be large. An alternative measure to
the number of teeth was to use the number of posterior contacts. This variable was also provided for
inclusion into the model, and when considered on its own outside the statistical model it was highly
significantly correlated to problems with function, such that the more contacts that are present, the less
likely it is that there will be any problems with the ability to eat. However, number of missing teeth was
marginally the more significant of the two, and because this and the number ofposterior contacts are highly
correlated with each other, the significance of the latter variable was eliminated when number of missing
teeth was included in the model. The only exception to this was in the case of the variable indicating altered
preparation of food due to problems with eating, where number of posterior contacts was the more
significant and was included in the model. The four eating variables which were tested are listed below and
the odds ratio for the effect of number of teeth/posterior contacts given:
Diet limited by difficulty eating odds ratio 1.09 per missing tooth
Difficulty eating hard foods odds ratio 1.15 per missing tooth
Altered food preparation (eating problems)
odds ratio 0.65 per contact present
Any difficulty eating (any of the above)
odds ratio 1.14 per missing tooth
Full results of these dependent variables including all other contributory variables are given in table 4.5.1.
and are described in section 4.5.
In order to try to illustrate the nature of the relationship in a little more detail, number of teeth has been
plotted against percent of the sample who were dissatisfied with function and the percentage of the sample
who reported problems eating (figures 4.4.1. and 4.4.2.). The number of tooth contacts has been plotted
against the same variables (figures 4.4.3. and 4.4.4.). In both cases only subjects with teeth in both arches
have been included. The relationship appears to be basically linear such that the percentage dissatisfied and
the percentage with eating problems decrease at an even rate with an increasing number of teeth, at least
when the number of teeth lies between 13 and 27 (unfortunately, where the number of teeth lay outside this
range, number of subjects were too few to allow plotting of tooth number in the same way). There is no
part of the curve which is obviously steeper than the rest, apparenfly indicating that there is no critical
number of teeth for satisfactory function. Similarly, although the plot tends towards zero with the more teeth
224

0
C.)
I-
D 5C)
II-U)
U)U)
0'
0
Figure 4.4.1. Number of teeth by % dissatisfied with function10-1
<13 13-14 15-16 17-18 19-20 21-22 23-24 25-26 27+
Number of teeth
Figure 4.4.2. Number of teeth by % with functional problems
50-i
45U)
C)
30
025
C.)20
I.-. 15
0<13 13-14 15-16 17-18 19-20 21-22 23-24 25-26 27+
Number of teeth
225
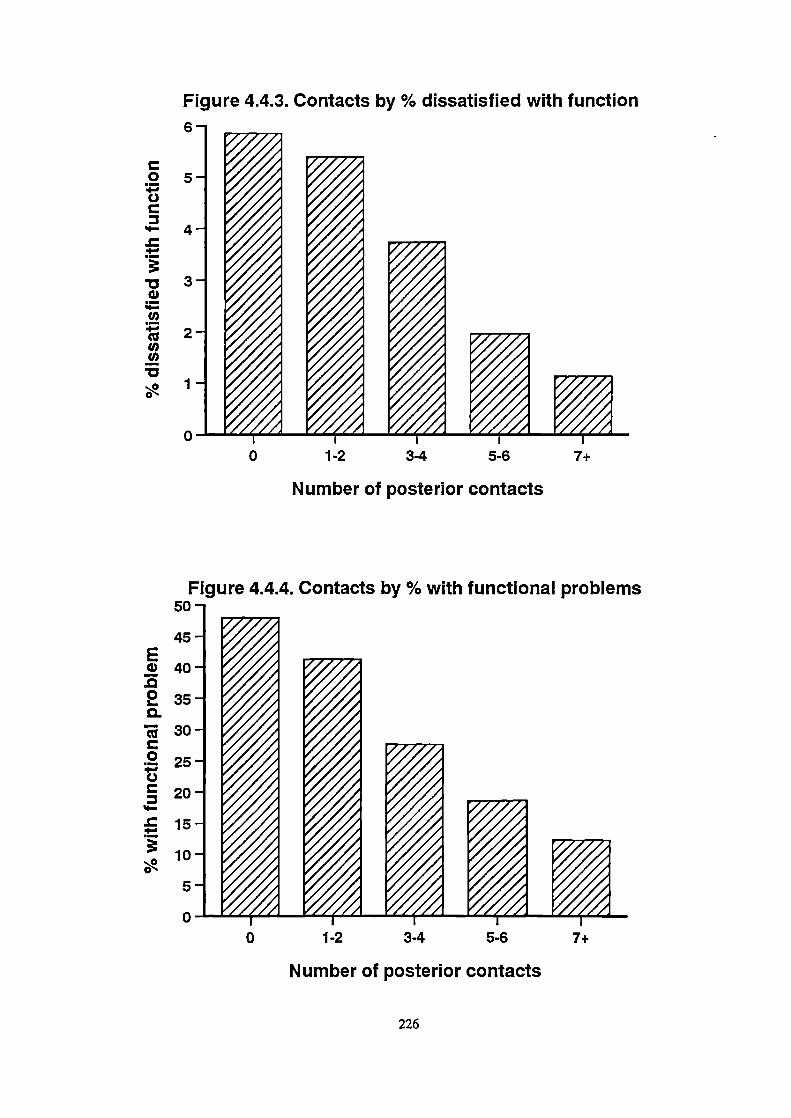
o 5C.)
'-4.
. 30
'I-Cl)
U)U)
0
Figure 4.4.3. Contacts by % dissatisfied with function6 -i ______
0 1-2 3-4 5-6 7+
Number of posterior contacts
Figure 4.4.4. Contacts by % with functional problems50-
:: V235-
3O- __
F __
0 1-2 3-4 5-6 7+
Number of posterior contacts
226
that are present, it does not appear to reach zero when there is an almost full arch of teeth. Among the
dentate subjects with most teeth there appear still to be some with functional problems or who are
dissatisfied with function, and many with very few teeth who do not report problems or dissatisfaction. Only
7% of those with 13 teeth or fewer were dissatisfied with their ability to bite and chew.
4.4.2. Partial denture wearing, and the role of partial dentures in dental disease.
Figure 4.4.5. illustrates the pattern of partial denture wearing according to number of teeth in those who
are dentate in both arches. It shows a steep reduction from over 75% of the sample wearing partial dentures
where there are less than 17 teeth down to below 5% where there are more than 24. Figure 4.4.6. illustrates
the relationship between denture wearing and the number of natural posterior contacts. When there are 2
contacts or less, nearly two thirds of the sample wore a partial denture, when the number of contacts
increases beyond this threshold the percentage with a partial denture diminishes sharply to well under 10%
where there are 7 or more contacts. There does appear to be a critical size for the dentition (20 teeth + or -
4 teeth or 2-4 contacts) which marks the watershed for denture wearing. Clearly there are other factors
which may determine whether or not a denture is worn, specifically the need to restore anterior spaces as
well as a number of socio-demographic and clinical factors. In an attempt to untangle some of these a
multiple logistic regression was undertaken, with partial denture wearing as a dependent variable and tooth
number, filled and unfilled anterior spaces and a number of socio-demographic and clinical variables as the
risk factors. This analysis was restricted to those who are dentate in both arches. The results of this analysis
are shown in table 4.4.1. The -2 log likelihood indicated that the final statistical model created by the
computer fitted the data well.
The single most important factor which determines whether or not a partial denture is worn is the presence
of an anterior space. The odds of wearing a partial denture increase by a factor of 12.7 in those who have
an anterior space. The other major factors were the number of missing teeth and the number of posterior
contacts. Because the relationship between number of teeth (and number of contacts) and denture wearing
is clearly non-linear, the number of missing teeth was split into three categories (<8, 8-15, 16 or more).
227

Figure 4.4.5. Number of teeth by % with partial denture80 -i _____
700)
60
50Cu
tCu0.Cu30
.
:20
0<13 13-14 15-16 17-18 19-20 21-22 23-24 25-26 27+
Number of teeth
Figure 4.4.6. Contacts by % with partial denture70
60I-
5Oa)
Cu40
Cu0. 30Cu
:20
00 1-2 3-4 5-6 7+
Number of posterior contacts
228

B-32142.538-1.1632.3281.5400.5010204-0.5670.497
S.E.0.454021002430.4650.4040.18302040.2540.225
sig0.0000.0000.0000.0000.000
0.0060.0140.0260.027
0.33-0.130.130.090.070.060.050.05
12.650.3110.264.671.650.610.571.64
R Odds ratio
Table 4.4.1. Factors involved in wearing a partial denture
Dependent variable: Wears a partial denturen=964 (only those dentate in both arches were included)
Independent variableconstant1 + anterior spaces (filled or unfilleBeing a dental non-attender16+ missing teeth (compared to <8)8 - 15 missing teeth (compared to <8)Being femaleSocial class (manual)5^ posterior contacts (compared to 0)1-2 posterior contacts (compared toO)
Type
dichotomousdichotomouscategoricalcategorical
dichotomousdichotomouscategoricalcategorical
Non-significant variables, not Included the model aboveHaving had a higher education AgeHaving 3-4 posterior contacts Being from the North of England
Table 4.4.4. Partial dentures as a risk factor for dental disease
n=1 030
Statistics Indicating relative risk of partial dentures
Disease variable (dependent)Presence of root cariesPresence of root caries/fillingsPresence of coronal cariesPresence of tooth wearPresence of any L0A >6mm
B S.E. sig R Odds ratio
0.620 0.154 0.000 0.10 1.86
2.857 0.177 0.000 0.43 17.42Partial dentures not significantPartial dentures not significant
0.539 0.139 0.000 0.10 1.71
Other Independent variables tested for InclusionAge Number of teeth with coronal fillingsBeing female Number of teeth with coronal decay/fillingsBeing a dental non-attender Number of root surface fillings ("Presence of root decay" only)Social class (manual) Number of missing teethEducation Number of teeth with LoA of 6mm+Toothbrushing <once daily Number of posterior contactsCPresence of tooth wear "only)
Number of premolar contacts("Presence of tooth wear "only)Number of molar contacts(°Presence of tooth wear "only)
For tables 4.4.2. and 4.4.3. see page 231
229

Posterior contacts were split into 4 categories (0, 1-2, 3-4 and 5^). The number of missing teeth and the
number of contacts are compared back to a reference category in order to calculate an odds ratio. For the
former it was 0 to 8 missing teeth and for the latter it was 0 posterior contacts. The odds ratios in table
4.4.1. are the predicted change in the odds compared with these reference categories. So, where there are
between 8 and 15 missing teeth the odds of wearing a partial denture increase by a factor of 4.7 compared
to where there are 0-8 missing. Where there are 16 or more missing teeth the odds increase by 10.3.
Number of posterior contacts also have an independent effect, over and above that of the number of teeth.
Some socio-demographic and socio-dental factors had an influence on partial denture wearing. Being a
manual worker and being a dental non-attender significantly reduced the odds of wearing a denture, whilst
being female increased them.
The importance of anterior aesthetics as a factor are further emphasised by data on the pattern of denture
wearing according to anterior spaces. Considering current denture wearers, in 83% of those with upper
dentures their denture fills an anterior space, whilst this is the case in 50% of lower dentures. In the sample
who do not wear a denture only 10% have upper spaces and 8% have lower spaces in the anterior region.
All dentate individuals were asked whether they had ever had a partial denture made which they could not
or did not wear. Overall about a fifth to a quarter (19-25%) of the entire reweighted dentate sample said
that they had. Non-wearers were divided fairly evenly between current partial denture wearers and current
non-wearers. Salisbury had fewer (19%) who had a history of previously unsuccessful dentures than either
of the Northern areas (25% and 23% respectively). These results are presented in table 4.4.2.. Further
analysis of the pooled data for these subjects showed that 47% of them now wore a partial denture on a
regular basis, whilst 53% wore no partial denture, or in some cases, had had an alternative type of
prosthesis placed (i.e. a fixed bridge). Of those who had had a denture made which they could not wear
in the past, but who now had an upper denture, (n=75), that denture filled an anterior space in 83% of
cases, whilst of those who did not wear an upper denture (n=1 13), only 20% had an unfilled upper space.
The equivalent figures in the lower jaw were 34.9% (n=43) and 17.2% (n=145).
230

Table 4.4.2. Percentage of the dentate samplewho have had a partial denture made which couldnot be worn.
All dentate subjects were asked whether or not they had ever had a partial denturewhich they did not or could not wear.
60-64
65-74 75+ 60+ rwt
Richmondshire 30.8%
27.9% 21.4% 25.3%
Darlington 24.1%
23.2% 30.4% 23.2%Salisbury 20.8%
25.2% 13.5% 18.9%
Table 4.4.3. Percentage of partial denture wearersexpressing different reasons for wearing partialdentures by age and area.
All partial denture wearers were asked to choose the main reason for wearing theirpartial denture. The commonest two reasons are given here.
Richmondshire
Wearers: main reason eatingWearers: main reason aesthetics
Darlington
Wearers: main reason eatingWearers: main reason aesthetics
Salisbury
Wearers: main reason eatingWearers: main reason aesthetics
60-6436.5%38.1%
60-6429.8%48.9%
60-6443.2%36.5%
65-7447.7%30.8%
65-7441.9%39.5%
65-7456.6%31.3%
75+50.0%30.0%
75+55.9%23.5%
75+52.9%32.4%
60+ rwt44.3%33.0%
60+ rwt40.9%38.8%
60^ rwt51.1%32.7%
The data for both tables on this page are based on questionsi 0 and 11 inSection 3 of the questionnaire.
231

Partial denture wearers were also asked to choose the most important reason that they wear a denture, from
a list of four possibilities (to help eating, to improve appearance, because their dentist advised it and other).
Eating and aesthetics accounted for about 80% or more of the reasons given, but the relative importance
of the two reasons varied with age - aesthetics decreased and functional considerations increased with
increasing age. In general, more people in Salisbury than in the Northern areas listed help with eating as
the most important reason for denture wearing . All of these results are presented in table 4.4.3..
Multiple stepwise logistic regression was conducted for a number of dental disease variables to try to
establish the relationship between the presence or absence of certain conditions and a variety of potential
contributory factors, including partial denture wearing. The relationship between partial denture wearing and
dental disease is not easy to test. Partial denture wearers may be more prone to disease, such as root caries,
because of stagnation associated with the denture. However the people who wear partial dentures may be
more prone to dental disease anyway (quite independent of the presence of dentures) and it may be this
underlying predisposition which has caused them to lose teeth and need partial dentures. Logistic regression
allows the past history of disease (as number of missing teeth and number of teeth with coronal restorations)
to be taken into account as a risk factor, as well as the presence of a partial denture and a variety of
confounding variables. Goodness of fit indicators suggested a well fitting statistical model had been created.
The results from this section are given in table 4.4.4. which only presents data for the effect of partial
dentures. The other significant variables are not presented in order to keep the table relevant and simple.
However, all potential confounding variables which reflect past disease (e.g. number of missing teeth,
number of filled teeth, number of teeth with moderate or severe loss of attachment) were included where
appropriate in the statistical models used in the analysis. Measures of caries (crown and root), tooth wear
and periodontal disease were the dependent variables used. In the case of the presence of root surface caries
and the presence of root surface caries or fillings, partial dentures were a significant and important factor.
The odds of having root surface decay or unsound restorations were increased 1.9 times in those who wore
partial dentures compared to non-wearers and the figure for root decay or fillings was 17.4.. This was after
taking into account past vulnerability to dental disease (number of teeth, number of periodontally involved
232

teeth and number of missing teeth). The presence of coronal decay was not influenced by partial denture
wearing, however some loss of attachment was significantly more likely in the presence of dentures (odds
ratio of 1.7).
4.5. THE FACTORS WHICH INFLUENCE ORAL HEALTH IN THE ELDERLY
Dental health has traditionally been measured by measuring the prevalence and severity of dental disease.
In young age groups, where the priorities of dental care may be different from the elderly, this is a
reasonable approach, however in the elderly there may be different considerations and this narrow approach
is inappropriate.
The schematic model of oral health introduced in section 3.11. was used as the basis for testing a batch of
potential contributory variables in a structured way, such that social, demographic, clinical dental and socio-
dental variables (e.g. satisfaction, symptoms etc.) could be compared together. The results are presented in
several forms. Table 4.5.1. shows the results of the logistic regressions where eating difficulties were used
as the dependent variables. Table 4.5.2. give the results of the analysis where satisfaction variables were
analysed. The calculations which test the goodness of fit of the statistical model created by the computer
(the -2 Log likelihood, goodness of fit and % correct classifications) pointed to well fitting final (statistical)
models for all of the dependent variables tested. These indicate that the final models did not differ
significantly from a "perfect" model.
A considerable amount of data is presented in each table and the meaning of each statistic is described in
section 3.11.7. However, for the purpose of straightforward interpretation the odds ratio (representing the
change in the odds in the presence of that independent variable) is the most important. Where the odds ratio
is greater than one it indicates a positive risk and where it is smaller than one it indicates a reduced risk
in the presence of that independent variable. In the cases of discrete variables (e.g. age, number of missing
teeth), the odds ratio is the change in the odds per one unit increase in the value of the independent
variable, so even if the odds ratio seems small, its multiplicative effect could be large. Figures 4.5.1. and
233

Odds ratio
1.151.161.560.67
Odds ratio
5.920.653.24
Table 4.5.1. Risk factors for difficulty eatingDependent variable: Diet limited by difficulty eating
n=1 028
Independent variableConstantNumber of missing teethNumber of mobile teeth (dentist report)Having had higher educationPresence of sensitive teethPresence of mobile teeth (patient report)
Type
discretediscrete
dichotomousdichotomousdichotomous
B S.E. sig-3.669 0.2928 0.000.086 0.0135 0.000
0.173 0.053 0.0010.661 0.209 0.0020.468 0.21 62 0.0310.456 0.21 78 0.036
R Odds ratio
0.21 1.09
0.10 1.19
0.10 1.94
0.06 1.60
0.05 1.58
Dependent variable: Difficulty eating hard foodsn=1 028
Independent variable Type B S.E. sig Rconstant -3.405 0.262 0.000Number of missing teeth discrete 0.142 0.012 0.000 0.35Number of decayed teeth discrete 0.150 0.039 0.000 0.10
Being female dichotomous 0.443 0.157 0.005 0.07
Living in the north dichotomous -0.401 0.156 0.010 -0.06
Dependent variable: Altered food preparation (eating problems)n=1 028
Independent variable Type B S.E. sig Rconstant -4.121 0.490 0.000
Presence of sensitive teeth dichotomous 1.778 0.438 0.000 0.25Number of posterior contacts discrete -0.432 0.174 0.013 -0.13Being edentious in one arch dichotomous 1.175 0.514 0.022 0.12
Dependent variable: Any difficulty eatingn=1 028
Independent variableconstantNumber of missing teethNumber of decayed teethPresence of sensitive teethBeing femaleLiving in the northNumber of teeth with 6mm+ LoA
Type
discretediscrete
dichotomousdichotomousdichotomous
discrete
B S.E. sig-3.044 0.246 0.0000.134 0.011 0.0000.127 0.038 0.001
0.481 0.171 0.007
0.392 0.151 0.009-0.377 0.149 0.011
0.074 0.032 0.020
R Odds ratio
0.33 1.14
0.08 1.14
0.06 1.62
0.06 1.48
-0.06 0.69
0.05 1.08
Non-significant variables, not included in any of the four models aboveAge Number of posterior contactsSOCIal class (manual) Recent toothacheBeing a dental non-attender TMJ painNumber of worn teeth Difficulties with speechWearing partial dentures
234

B-0.0801.2730.121-0.0460.6110.5820.1120.408
S .E.1.0340.25 10.0380.0160.2300.2280.0490.207
sig0.9400.0000.0020.0040.0080.0110.0210.049
Table 4.5.2. Risk factors for dissatisfaction
Dependent variable: Dissatisfaction with ability to bite and chewn=1 028
S .E. sig
R Odds ratio1.929
0.7680.446
0.000
0.28 11.020.630
0.000
0.19 11.010.270
0.012
0.11 1.980.422
0.016
0.11 2.770.029
0.023 -0.10 0.94
Independent variable Type Bconstant -0.568Difficulty eating hard foods dichotomous 2.400lnteraction dichotomous 2.398Diet limited by difficulty eating dichotomous 0.682Recent toothache dichotomous 1.020Age discrete -0.066* represents interaction between all three difficulty eating variables
Non-significant variables, not included in the model aboveAltered food preparation (eating) Difficulty with speechAny eating problems TMJ painBeing a dental non-attender Number of missing teethBeing female Number of worn teethLiving in the North of England Number of decayed teethSocial class (manual) Number of teeth with LoA of 6mm+Having had a higher education Number of mobile teethPresence of sensitive teeth Being edentulous in one archPresence of mobile teeth Having a partial denture
Dependent variable: Dissatisfaction with appearance of the teethn=1028
Independent variableconstantAny unfilled anterior spaceNumber of teeth with 6mm+ LoAAgeHaving had higher educationBeing a dental non-attenderNumber of decayed teethBeing female
Type
dichotomousdiscretediscrete
dichotomousdichotomous
discretedichotomous
R Odds ratio
0.18 3.57
0.10 1.13
-0.09 0.96
0.08 1.84
0.08 1.79
0.07 1.12
0.05 1.50
Non-significant variables, not included the model aboveLiving in the North of England Any filled anterior space
Social Class (manual) Number of missing teethDifficulty with speech Number of worn teeth
Dependent variable: Dissatisfaction with mouth generallyn=1 030
Independent variableconstantDissatisfied with ability to bite/chewDissatisfied with appearanceAny problems eatingRecent toothacheDifficulty with speaking due to teethWearing partial denture
Type B S.E. sig-4.534 0.347 0.000
dichotomous 2.996 0.407 0.000dichotomous 1.449 0.344 0.000dichotomous 0.917 0.344 0.008dichotomous 0.923 0.357 0.010dichotomous 0.498 0.208 0.017dichotomous 0.716 0.326 0.028
R Odds ratio
0.34 20.00
0.19 4.26
0.11 2.50
0.10 2.52
0.09 1.65
0.08 2.05
Non-significant variables, not included the model aboveAge TMJ painBeing female Being edentulous in one archSocial class (manual) Number of posterior contactsHaving had a higher education Number of decayed teethBeing a dental non-attender Number of worn teeethPresence of mobile teeth (patient) Number of teeth with LoA of 6mm+Presence of sensitive teeth Number of mobile teeth
235

4.5.2. illustrate schematically two different parts of the final model and include all of the contributory
variables where the relationships were found to be significant. Figure 4.5.3.. illustrates a simplified final
model with known relationships indicated by solid black arrows.
All of the difficulty eating variables were affected by number of teeth or number of contacts, and when the
three variables were combined into one (indicating any difficulty eating) the number of missing teeth
increased the odds of problems by 1.14 per tooth. Decayed, periodontally involved and sensitive teeth all
increased the odds of problems with eating, as did being female. Living in the North of England reduced
them. Difficulties with eating were the major contributory factor towards dissatisfaction with the ability to
eat, the only additional contributory factors were age, which reduced the odds of dissatisfaction, and recent
toothache which increased them considerably (odds ratio of 2.8).
Risk of dissatisfaction with appearance was increased by the presence and number of unfilled anterior
spaces, the number of teeth with 6mm or more loss of attachment, the number of decayed teeth, being
female, having had a higher education, whilst they reduced with age.
The risk of overall dissatisfaction was increased considerably in the presence of either of the other aspects
of dissatisfaction (with eating or appearance), as well as problems eating (a direct relationship over and
above that for dissatisfaction eating), toothache, speech problems and wearing a partial denture.
Measurement of dental health has concentrated generally around the identification and measurement of
disease. This model illustrates factors, including those related to disease, which impinge on a patient's
ability to function and their satisfaction. Symptoms and functional impairment clearly play an important role
in satisfaction in a much more direct way than clinical disease. This topic will be covered in more detail
in the discussion.
236
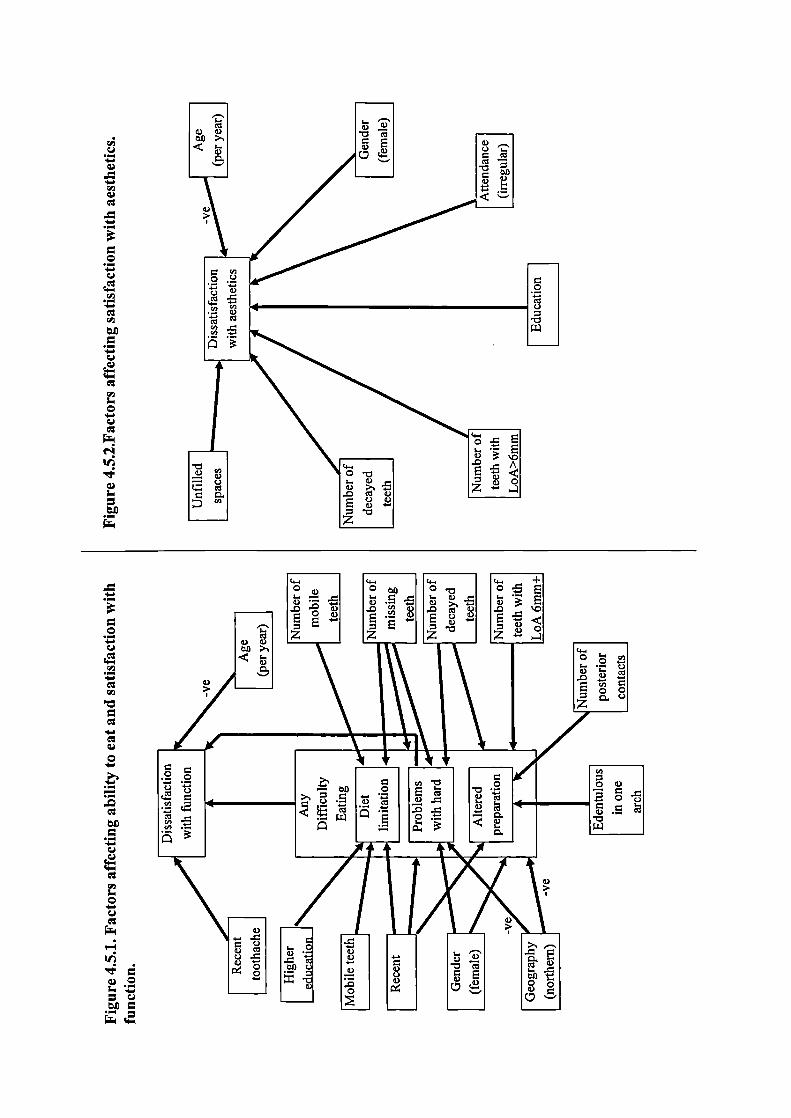
-
.-
I 'I ____cI
< s_I
Ic
I
C,, I I
o.2 La- I
1.2I
I I-
io. EI ')A
o-
I_ c ______
IE
I

4-.U
Cl)
Cl)Cl)
U -
E
0
U
0
0U
Cl)
CI)
CI)
0-
-
Cl)
0U -U
C-CI)
C-
Cl)0,—
OQ
Cl)- C)
_0 I00
C-0 -
z
o-
,
Z-C-:
C-o
CI). ).E
Cl) -
. -
U I
:E ja_I I>,—II I II I L I)
IiI) I io o I IcI
''' r rHcI
© EIbI II(ID 1< ' '' I _____ ____ _____I I __ __ __ __
•; I
0 ICOt1 I
IIi 0 IIc I
•
II0._II_0I
— ii i2 I
II II I
CI) 'I )II •SIIIiiiIi
0 II ilE IoI
I ii HLW I
238

DISCUSSION
239
Section 5
DISCUSSION
The discussion comprises 5 sub-sections which follow the same structure as the 5 sub-sections in Results
(section 4). These are the sample and methodological issues (5.1.), data from the clinical examination (5.2.),
questionnaire data (5.3.), the partially dentate and the role of the number of teeth and partial dentures (5.4.)
and the factors which influence oral health in the elderly.
5.1. THE SAMPLE AND METHODOLOGICAL ISSUES
5.1.1. Response rates
The acceptance rate for those contacted was fairly good for eight out of the nine area/age subgroups, but
was poor for one. Given the nature of the study the 50% to 60% acceptance rate achieved for these eight
groups would probably have been difficult to better, although small improvements could have been made
by ensuring doctors letters for every subject (if this is possible) and perhaps by having the accompanying
letter printed on Department of Health headed paper. The acceptance rate in Salisbury was generally a little
lower than the two northern areas and this is probably a reflection of two things, firstly the large
geographical distance involved, and secondly that there had been a recent, well publicised, spate of bogus
callers in the Salisbury area. The one group where the response rate was poor was the Salisbury 75+. A
number of factors conspired to keep the response rate for this group low. Due to early administrative and
sampling problems there were no doctors letters available for a substantial proportion of these subjects.
This, combined with the subject's age and perceived vulnerability and the factors noted above resulted in
the response rate below 40%.
Comparison of the response rate between this and other large surveys is hampered by differences in
sampling strategies and by an absence of other large studies specifically of the elderly. The response rates
in this study were lowest in the oldest groups in all areas, but there is no indication from other large dental
240

health surveys whether this trend is consistent. In the Finnish National Survey (Vehkalhati, M. et al., 1991),
covering adults of all ages, 90.1% 'participated", but there is no indication whether or not they all took a
full part (i.e. had the examination and the full interview). In the Dutch national survey 68% were
interviewed but only 53% of those contacted were actually examined, and all those taking part were given
a small gift as an incentive to participate (Hof, M.A.van't. et al., 1991). In Ireland only 38% of the
households sampled agreed to take part (O'Mullane, D. & Whelton, H., 1992). The United States National
survey (NIH, 1987) only reported the number taking part, not the percentage of the total sample this
represented. The 1988 UK National Survey (Todd, J.E. & Lader, D., 1991) obtained interviews from an
estimated 84% of the adults in the sample (the figure could be no more than an estimate as it was
households, not named adults which were sampled). In total around 68% both gave an interview and were
examined. In the context of these surveys, the present study compares favourably, particularly with Ireland
and the Netherlands. The luxury of a double visit (interview followed by examination at a second visit),
a strategy employed by most of the other surveys, was one we could not afford, but this would probably
have increased the number of interviews obtained, although it may not have affected the number of
examinations.
In total 2280 subjects were examined, with a minimum of 715 in any of the three areas. This gave sufficient
data to keep the margin of error within reasonable limits. The reweighted totals in each of the subgroups
did not generally drop much below 100, even for the dentate sample, and this allowed comparisons between
subgroups to be reasonably safe (95% confidence limits within 10 percentage points of the percentage
given). Some of the minor subgroups (e.g. broken down by age and area and gender or social class or
attendance) are much too small to draw firm conclusions, but to have ensured a sufficient number in each
of these would have meant at least a four fold increase in the size of the total sample drawn.
In order to interpret the data to its maximum potential, reweighted 60+ totals (usually the column at the
extreme right of the tables) were presented for comparing the effect of gender, social class and (where
appropriate) attendance pattern, whilst the all totals for each age group (the bottom row of the table for each
area) could be used to estimate the influence of age. The reweighted all figure given at the bottom right
241

hand corner of most of the area tables allowed overall comparisons between areas to be made. In order to
address some of the problems of inter-examiner variability which affected the clinical examination, data
collected by the author alone were presented separately.
The method of sampling, utilising the FHSA lists, was unique for a dental survey, and reflected the
difficulty in sampling any age specific adult group. Even with this methodology, there were some problems
with follow-up of the selected subjects due to errors within the FHSA lists. It appeared to be the case that
many of these errors had occurred during the initial setting-up of the lists rather than as a problem resulting
from poor maintenance of the database, as many of the known errors related to individuals who had died
or moved before the computer databases were established. Alternatives to this sampling frame are very
limited due to the necessity of having some record of the age of the subjects. Post code address files and
the electoral register, sampling frames which have been used in previous dental surveys were inappropriate
because of the lack of any age information. The only realistic alternatives would have been to use the social
security database, which would not have given the option of sending an accompanying doctor's letter, or
the patient lists held in doctors' surgeries, which would have been much more cumbersome and less random
than using the centralised FHSA database.
5.1.2. Sampling Bias
The gender ratio was roughly what would be expected for this age group. However there was under-
sampling of women, particularly in the oldest age band in the two urban areas (see figure 4.1.1.). This
probably reflects the personal vulnerability that these subjects perceive (for example to criminal offenses).
Only 9% - 20% of the samples were unskilled manual workers (social class IV/V), perhaps a little lower
than may be predicted (although census data does not give a social class breakdown of retired adults). The
reason for the apparent under-representation of these groups may be partly as a result of sampling bias (the
proportion of non-attenders is generally highest in social class IV/V), but may also reflect the specific
characteristics of the areas sampled.
242

The ascertainment of sampling bias using a postal questionnaire of the refusers in both of the older age
groups in all areas proved a worthwhile exercise and gave an invaluable insight into the make-up of the
final sample. Although only data on attendance and edentulousness were collected, this key information was
obtained from 60-70% of the refusers, so that when the information from those visited and those refusers
who responded to the questionnaire were combined, data were available for 80-90% of the total number
of individuals originally contacted and asked to take part in the study.
The postal survey revealed that edentulous subjects and dentate non-attenders were relatively under-
represented in the sample who participated in the study. In the case of the edentulous, one major reason for
this was probably a perception by many that the dental survey team would not be interested in someone
with no teeth. However, under-representation of edentulous subjects was relatively small. Under-
representation of non-attenders was variable, from only 2-3% in Richmondshire up to nearly 13% in
Darlington. As attendance pattern appears to be a major influence on dental health, the detection of this bias
was an important finding. Fortunately the sample sizes were large enough to separate out the statistics for
attenders and non-attenders.
The Salisbury sample was generally more educated and financially better off than those in Darlington, with
Richmondshire lying somewhere in between, at least when simple measures such as the proportions who
have had higher education and who have no private income were used. These data are presented to further
define the socio-economic make-up of the three samples, rather than to look for direct correlations with
dental health. The impact of these on dental health and attitudes could be considerable, but trying to
untangle all of the social, economic and demographic influences on dental health is an extremely difficult
task.
The data on general health and mobility serve to illustrate two major points. First, that pathology, illness
or disability of some sort is very common in older populations and may have a bearing on dental treatment.
Second, that despite the abundance of illness and disability, the great majority of the elderly are ambulant,
active, and largely self sufficient to a very advanced age. Many of the potentially debilitating conditions
243

(e.g. heart problems, arthritis) from which they suffer are sufficiently well controlled to allow reasonable
levels of activity. Looking to the future, there will be an increase in the potential medical complications of
dental treatment as the need for more complex dental treatment itself increases, and a higher proportion of
those in institutions will require maintenance of natural teeth. On the other hand most of the treatment need
and demand will come from the ambulant and generally healthy elderly.
The finding that general health was poorer in Darlington than elsewhere was consistent for just about every
measure used (mobility, frequency of disabling long term disease, medication usage etc.) and is unlikely
to be a statistical artefact. It may be a reflection of the different socio-economic composition of the
population, geographic inequalities in health or the relatively high number of institutionalised or dependent
elderly in the town.
5.1.3. Examiner bias
Examiner variability is a complicating factor which can never be eliminated in any study of this sort, but
it is possible to over-estimate its importance. In this survey it is a relevant factor in two situations:
1. When comparisons are being made between areas (as the second examiner was different in each area).
2. When considering the accuracy of individual statistics.
All examiners took part in a four day intensive training programme at the beginning of the survey to try
to standardise scoring. As a part of this programme the examiners all examined the same patients and areas
of disagreement were targeted and re-examined. The inter-examiner variability in the survey, as measured
by both revisit data and by survey data calculated for separate examiners, was small for the condition of
the crowns of the teeth, was moderate for root caries and wear and was rather high for periodontal disease.
It is possible that if the training had been extended, levels of agreement would have improved, however it
is doubtful whether this would have been maintained for the duration of the survey. In addition there would
have been very serious logistic problems in increasing the training period and in finding willing and suitable
training subjects. Problems of calibration, particularly of periodontal data, are well documented. The 1988
244
UK Adult Dental Health Survey did not produce periodontal data broken down by area because of the scale
of inter-examiner variation. Examination of the periodontal data on the WHO global data bank (Miyazaki,
H. et al., 1991; Pilot, T. & Miyazaki, H., 1991; Pilot, T. et aL, 1992) demonstrates such variations in the
prevalence of various conditions, between apparently similar populations, that inter-examiner variation must
be an important factor. To complicate the issue further, some periodontal conditions are capable of rapidly
changing between one examination and the next, for example improved hygiene in one area of the mouth
could rapidly eliminate several bleeding sites and result in apparent disagreement between examiners.
Inter-examiner variability will have affected all areas of the clinical examination to a greater or lesser
degree. Kappa scores are presented in table 4.1.11., however, kappa statistics do not tell the whole story.
A high kappa means good agreement and there is no need for further discussion. A low kappa may reflect
either of two situations, depending on the direction of the disagreement. If two examiners disagree, but the
overall frequency of the variables recorded is much the same, then in a study of this sort it will make little
difference to the overall statistics produced. If, however, one examiner is more sensitive and records, for
example, more decay than the other then this will start to affect the final statistic substantially. For example
two dentists may totally disagree about which roots are carus in nearly every subject examined, but if they
both record 1.6 carious roots on average, the effect of their disagreements on the final statistics will be
minimal, despite a very low kappa score. However, even if the two examiners agree frequently, but one
records 1.6 carious roots and the other one records 3.0 on average, this can radically alter the final result.
When looking for differences between areas even a difference in sensitivity between two examiners in one
area may make little difference, it is only if the combination of examiners in one area is more sensitive
than the combination of examiners in another that the difference between areas becomes difficult to
interpret. In this study care was taken to ensure that the distribution of subjects to each examiner was as
random as possible so that, if differences were apparent between the examiners, data for the one standard
examiner (JGS) who covered half the subjects in each area could be used alone to compare between areas.
As examination days in different areas were mixed together over the same time period there is no reason
why the author should have been any more sensitive in one area than another.
245
Table 3.1.7. separates some of the key data by examiners, and shows that there were apparent differences
in sensitivity between the second examiners in different areas. For example, when decayed or unsound roots
were considered, the second examiner in Darlington recorded 50% more decayed or unsound roots in her
sample than the standard (JGS), whilst in Richmondshire the second examiner recorded about 50% less.
The pattern between examiners varied between the variables being recorded. Such variation will not affect
the trends between social groups, genders and attenders/non-attenders within an area, these should be
virtually unaffected, but they do make comparisons between areas more difficult. Table 3.1.7. presents the
data for JGS alone. These data are consistent between areas, and the 95% confidence limits for the
reweighted data are about 6-8% at most. It is recommended that for checks of differences between areas
regarding root caries, wear and periodontal disease, that these data are used.
Intra-exa.miner variability was not measured in this study. The logistics of checking inter-examiner
variability were difficult and it was felt that intra-examiner variation was a lower priority. Samples
examined by all examiners were essentially the same throughout the period. Subject's names were drawn
off the random list in unsorted batches, so those visited towards the end of the survey should have been
no different, in terms of area of residence, gender, or social class than those visited at the beginning.
Batches from the three age groups were drawn simultaneously.
Finally, consistency of questionnaire data, and some of the clinical data (where kappa scores were good or
major errors were impossible) was not a problem. The questions in the questionnaire were identical for
everybody and every effort was made to ensure a standard technique was used. The interviewers' techniques
were kept under intermittent supervision by the author throughout the survey to ensure that standards of
interviewing were maintained.
246

5.2. DATA FROM THE CLINICAL EXAMINATION
5.2.1. Edentulousness
Overall 33% of those examined in Salisbury and 57% of those examined in Darlington were edentulous.
There is the suggestion of a ten year difference between the two areas: the Darlington 65-74 year olds have
a similar level of edentulousness to the Salisbury 75+ group. This relationship holds true after taking into
account the data obtained from the postal questionnaire from the refusers. Rural Richmondshire was broadly
similar to nearby Darlington for the proportion edentulous, the small difference between the two could be
explained by differences in the social class structure. This similarity probably reflects its position in the
North of England, rather than the fact that it is rural.
Females were much more likely to be edentulous than males in all age groups, although in Salisbury the
difference appeared to be smaller, even when the refusers were taken into account. This may reflect cultural
attitudes to edentulousness. It is also interesting that more women than men were edentulous only in one
arch in Salisbury, in contrast to the picture in the two northern areas where the situation was reversed. It
may be that women in the South of England are more likely to hang on to their teeth come what may,
whilst in the north the decision to have the remaining teeth extracted tends to come a little more easily.
The figures for edentulousness are substantially lower than the regional averages for the areas concerned
which were published in the 1988 Adult Dental Health Survey (57% in the south of England and 68% in
the North of England for the equivalent cohort). This is the case even taking into account the postal
questionnaire although the discrepancy is reduced (Todd, J.E. & Lader, D., 1991). This difference probably
reflects a number of factors. Firstly this data was recorded four years later, so cohorts of progressively more
dentate individuals will have entered the over 60 population in this period. Secondly, the areas were chosen
to be representative of their types, rather than as a microcosm of the North or South of England, so
differences between the sample and the population of a region will occur. For example there were no sites
of inner city deprivation in any of the three areas used. If it is the case that these areas are not the perfect
247

representatives of their region, this does not necessarily present a problem as, with changing attitudes and
a progressively more dentate population, the areas chosen are more likely to give a window into the future
than would more representative but less dentate samples.
Only 15.2% of the Salisbury 60 - 64 year olds were edentulous, compared with 83% in 1962 (Bulman et
al 1968). This is actually less than the same age group in the USA in 1985 (16.1%) and similar to the
figures of 16% for the 55-64 year-olds in the South of England in the 1988 Adult Dental Health study in
the UK. The figure for Salisbury in this study may be a little low due to sampling bias. However the scale
of the reduction in edentulousness over the last 30 years has been enormous. The North of England has seen
a smaller change. Edentulousness in the 60-64 year olds in Darlington was reduced from 75% in 1962 to
39% in this study, but even here the scale of the reduction has been considerable. In 1982 the FDI and the
WHO called for a 25% reduction in the levels of edentulousness at age 65 by the year 2000 (FDI, 1982;
WHO, 1986). The difference between the three age bands in this study suggest that the 25% reduction
demanded will be, indeed probably already has been, comfortably achieved.
An additional 10% or so of the sample were edentulous in one arch and the figure was similar for all areas.
Gender and social class differences follow no consistent pattern from one area to the next. In the north it
is men who are more likely to be edentulous in one arch while in Salisbury it is women. In Salisbury and
Richmondshire people from unskilled manual backgrounds have a far higher proportion edentulous in one
arch (in Salisbury it is 18%), but in Darlington it is non-manual workers who have the highest proportion.
In some of the sub-groups, particularly unskilled manual workers, the proportion with teeth in only one arch
constitutes up to, and in one case exceeds, 50% of all dentate individuals.
The sum of the percentage edentulous and the percentage edentulous in one arch gives an indication of the
proportion of the population who wear a full denture and hence have a need for maintenance of their
complete prostheses. This could be an important measure of adult dental health in the future. At present
25% of the potential complete denture need in Salisbury would be ignored if those who are edentulous in
only one arch were not considered.
248

A small but significant proportion of the edentulous sample were unable to wear their complete dentures
either at all or for anything except appearance (up to 4% in the case of lower dentures). Those who did not
wear the dentures provided were much more likely not to be able to wear the lower rather than the upper.
Data on denture faults has been kept to a minimum. The most important findings with respect to complete
dentures were that fault free dentures (as assessed by a dentist) were a rarity, and the mean number of faults
was around 3. Whilst some faults were apparently more common than others, the relative abundance of
these will only be of significance if their impact on comfort, function and satisfaction are known. Many
studies of the elderly report a high prosthetic treatment need (Floystrand, F. et aL, 1982; MacEntee, M.I.
& Scully, C., 1988; Merelie, D.L. & Heyman, B., 1992; Smith, J.M. & Sheiham, A., 1980a; Srisilapan, P.
et al., 1985) but this need is invariably determined by the dentist, not by the patient. The relationship
between professionally assessed need and satisfaction is covered in more detail in section 5.3.1..
5.2.2. Dentate subjects: The number of teeth and tooth replacement
In total 1211 dentate adults over the age of 60 were examined, with 300 to 500 in each area. This gave a
sufficiently large sample size in all of the reweighted sub-groups and in each of the age groups to ensure
statistics which are accurate and allow comparison. The rest of this section will discuss the percentage of
the sample with 21 or more standing teeth, the mean number of teeth and partial denture data.
The proportion of the dentate population with 21 or more standing teeth was similar for the three areas
(between 35% in Darlington and 42% in Salisbury), figures that are close to the statistics for the 55+ age
group in the 1988 Adult Dental Health Survey (30% in the North and 40% in the South of Fngland)(Todd,
I.E. & Lader, D., 1991). This is a little lower than the figure for the US in 1985/6 (46%)(NTH, 1987).
Attendance pattern was the most important correlate of whether or not someone has 21 or more standing
teeth. Overall, two to three times as many attenders as non-attenders had 21 or more standing teeth
(reweighted totals, all ages). Age and social class are also very important correlates with the proportion with
21 or more standing teeth. In two of the areas (Salisbury and Richmondshire) more than half of the
249
youngest groups were at or above the 21 tooth threshold, whilst Darlington, which has only 14% of its
oldest group in this category, shows signs of improvement in the youngest group. These statistics can be
misleading as they refer only to the dentate part of the sample. Only 20.7% of the total sample, dentate and
edentulous, had a natural dentition of 21 or more standing teeth. The mean number of teeth ranged between
about 19 in all of the 60 - 64 year old groups, down to 12-15 in those aged 75 or older. The number of
teeth and socio-demographic trends reflect those reported for 21 or more teeth.
Around 40% of all of the dentate sample wore partial dentures. In the population this will account for
several miffion individuals and dentures. This is consistent with the findings from the 1988 UK Adult
Dental Health Survey which found 41% of over 55 year olds with partial dentures. In the North of England
samples, far more women than men wore partial dentures, but in Salisbury the position was reversed. This
difference between the north and the south in terms of gender variation was unexpected and quite marked.
It may well illustrate an important difference in attitude to dental health between northern and southern men
(or women), and it reflects the findings for edentulousness, coronal restorations and crowned teeth, where
the gender difference was pronounced in the north and minimal (or even reversed) in the south. There is
an age related increase in partial denture wearing and this may be related to number of teeth and it could
also account for the unexpectedly high prevalence of partial dentures found among non-attenders compared
to attenders. There appears to be a preponderance of upper dentures. This is probably mostly a reflection
of aesthetic concerns, and possibly the difficulty of wearing lower partial dentures.
The quality of design of partial dentures was poor by the standards taught in British dental schools.
Nevertheless, the subjects were able to wear their dentures. Although the 1988 Adult Dental Health Survey
provides data on the material and design of partial dentures, this is a little difficult to interpret as partial
dentures and complete dentures for dentate adults are lumped together (Todd, J.E. & Lader, D., 1991).
Nevertheless the data shows a similarly small proportion of cases where dentures are tooth supported and
made of anything other than acrylic. Further data on partial dentures and the factors which influence their
provision and acceptance, their influence on comfort and satisfaction and the relationship between wearing
partial dentures and current dental disease are discussed in section 5.4..
250

5.2.3. Dentate subjects: Data on the condition of the crowns of the teeth
The number of teeth decreases with age and various social and socio-dental factors. The fact that there is
an age related decrease is no surprise, but in interpreting the rest of the mean figures it is important to take
this into account. if there are fewer decayed teeth in any particular group it does not necessarily mean that
that group is less prone to decay, it may just be that there are fewer teeth to get decayed. In order to
interpret the data properly the CCI and CCI(d) are given, these should give some idea of the rate of attack
and the risk of treatment need in different groups (see section 3.11.5. for details on the calculation of these
indices). The CCI is an index of the percentage of all teeth which are decayed or filled. For the reweighted
data the CCI is just under 50% for all areas, and shows a slight tendency to reduce with age. The
percentage which are decayed or have unsound fillings is generally around 5% for the group as a whole,
but is doubled in the case of the non-attenders.
Of all of the factors presented in the tables, attendance pattern is the single most important correlate with
the condition of the crowns of the teeth. Attenders and non-attenders have similar numbers of sound teeth,
but non-attenders have far fewer filled teeth and more decayed ones. As a general rule the number of teeth
present in the non-attenders is 4-7 fewer than those in attenders. However the attenders have about 4-7
more filled teeth. The suggestion from these data is that the rate of decay may not be very different, but
the attenders retain their teeth by having them filled, whilst the non-attenders have them removed.
Attendance pattern appears to be a very important factor in terms of current, and probably also future,
normative treatment need as well as demand. Much of the variation according to age and social class may
be associated with attendance patterns, but this will require further analysis to clarify. Gender differences
were evident in the north with women having a higher proportion of restored teeth and a lower proportion
of decayed ones. This trend was not evident in Salisbury.
If the decayed component is used as an indication of treatment need, a relatively small proportion of the
treatment need of the crowns of the teeth is as a result of new decay, whilst around half (42-56%) is
concerned with the failure of existing restorations. Furthermore, a consistent 21% of the decay in the
251

reweighted 60+ samples is accounted for by gross caries with obvious pulp involvement or little chance of
successful restoration. The relative size of this category shows a steep rise with age in both of the urban
areas. This may reflect an increasing tendency to self-neglect with age, in which case the need for
extractions in the very old is liable to increase markedly as more of them retain some teeth. Alternatively,
it could be a cohort effect, and successive cohorts who are more dentally aware and demanding may have
fewer such teeth. At this stage it is impossible to establish which is the case but it is clearly a statistic to
keep under observation. These findings reflect those of the 1988 Adult Dental Health Survey (Todd, J.E.
& Lader, D., 1991), which reported on the percentage of subjects with various types of decay. In the over
65 year olds, 15% of their sample had grossly decayed teeth: this was considerably more than was the case
for younger subjects.
Approximately one third of the dentate sample had one or more crowned teeth, with greater proportions in
females and attenders. The gender difference was much more pronounced in the northern areas than in
Salisbury as the difference between the reweighted totals for females and males in Darlington was 19
percentage points, compared to 3 percentage points in Salisbury. This is evidence once again (see also data
above on filled/decayed teeth and edentulousness) of a polarisation of attitude according to gender in the
northern areas, with women being much more likely to have crowns than men. Todd and Lader (Todd, J.E.
& Lader, D., 1991) also found a considerable gender difference (6%), but the data was broken down by
area or gender, not by both simultaneously. Those who had crowns tend to have more than one, the mean
being between 2 and 3 for the reweighted totals. An exception to the general trend for dental decay and
restoration was that far more manual workers, and fewer non-manual workers in Darlington had crowns
than in the other areas. This may reflect differences in treatment patterns, which may in turn be influenced
by the social make up of the samples, the ability to pay and the availability of treatment free of charge to
some patients (for example those on very low income) on the National Health Service. The incoming
dentate generation (represented by the 60-64 year olds) are much more likely to have crowns than their
dentate predecessors, this is particularly evident in the north of England and among manual workers. The
Salisbury elderly appear to have a longer history of advanced restorative work with a significant proportion
of multiple crowns and bridges at all ages. The wave of advanced restorations presently found in the 60-64
252

year olds has considerable treatment implications. There are about a third more people with crowns in this
generation than there are in the cohort just ahead of them. Around 9-15% of the crowns examined in this
survey were deemed to be unsound.
Fixed bridges are relatively uncommon, being worn by 3-6% of all subjects (reweighted totals), with most
in Salisbury, 30% of the 50 or so bridge wearers seen in the survey were in Salisbury.
5.2.4. Dentate subjects: Data on decay and fillings of the roots
Between 28% and 36% of the reweighted sample showed no history of root surface decay and only a
minority of the sample had any active treatment need for their exposed root surfaces. However, even
including those who had no history of root surface caries, between 20% and 24% of all vulnerable teeth
had been affected, whilst 7-9% of vulnerable teeth actually had a current treatment need (decay or an
unsound restoration), and about 65% of teeth were vulnerable. The treatment need increased markedly with
age.
The pattern of disease according to demographic factors was similar to that for coronal decay and
restoration, with men and non-attenders having more decayed roots and generally higher RCI and RCI(d).
Unlike coronal disease however, women generally had no more fillings than men, and they tended to have
a similar or smaller number of at risk teeth. The differences between areas appear to be substantial,
however, when data from JGS is considered alone these disappear, suggesting that much of the observed
geographical difference was due to inter-examiner variability.
The RCI(d) for non-attenders was nearly double the score for attenders, however the RU was substantially
higher in the attenders. There are a number of possibilities why this should be so. The attenders may have
had restorations placed in their root surfaces which are not strictly necessary, as root caries lesions can
remineralise if the conditions are correct. Non-attenders may have had affected teeth extracted, which would
increase the proportion of healthy teeth in their mouths. Alternatively some of the attenders may have had
253

some restorations placed for reasons other than root surface caries, typically for cervical wear. This last
explanation probably accounts for a proportion of the discrepancy, but its relative importance is unknown.
The RCI and pattern of root caries found in this survey are rather similar to that reported elsewhere. The
mean number of decayed and filled teeth is generally a little higher than was reported in the 1988 Adult
Dental Health Survey (Todd, J.E. & Lader, D., 1991). The RCI in the present study is also similar to, or
a fraction higher than, that which can be calculated for data from the 1988 UK national survey, although
RCI as such was not presented in the survey report. The prevalence, RCI and mean number of teeth
affected in the present study are very similar to samples of older Canadians (Locker, D. et al., 1989) and
a sample of older adults in Sweden (Fure, S. & Zickert, I., 1990)
A number of the factors reported here are significant when the prospects for root surface decay in the future
are considered. Both the actual number of decayed teeth and the proportion of vulnerable teeth which are
decayed or have an unsound filling increase markedly with age and in the case of the latter the proportion
nearly doubles in all areas between the youngest and the oldest group. In other words, even when the
number of vulnerable teeth is controlled for, the risk of having decayed roots is an age related phenomenon,
as is the treatment need itself. At present, the number of teeth in the over 75 year old population is
relatively small: a high proportion are edentulous whilst the dentate have relatively few teeth. The
proportion of this population with teeth will rise sharply in the next few years, and the number of teeth per
person may also rise. In terms of gross treatment need there could be a several fold rise in the treatment
need for root surfaces. There is the possibility of limiting the increase if the disease is amenable to
prevention.
Decayed roots, or roots with an unsound filling, were about as common as teeth with decayed or unsound
crowns in the sample studied. However the constitution of the decayed component was substantially
different in the case of root surfaces, 76-80% of all decayed roots were accounted for by new decay. This
difference in the relative proportions of different categories of decay between crown and root is important
as it highlights root decay as a disease process of specific relevance to the elderly. Furthermore, new decay
254

should be easier to prevent than the failure of an existing restoration as, in the case of the latter, the quality
of the restoration is a complicating factor. Root caries may be more amenable than coronal caries (most of
which occurs around existing restorations) to prevention in the elderly population.
A further factor which may have implications for the control of this disease in the future is its distribution
in the population. Figures 4.2.3 and 4.2.4. illustrate the concentration of most of the teeth with lesions
needing treatment (those scored as active caries or restorations in need of replacement) and most of the
teeth with lesions and sound fillings in a minority of the population. This concentration of the disease, such
that the most severely affected 20% of the sample accounted for well over 70% of all treatment need
suggests that any preventive programme would be best targeted at these individuals, if they could be
identified.
In summary, root surface caries will increase sharply as a specific problem of the elderly. Furthermore,
most root surface decay is new decay, rather than unsound existing restorations, and most of the decayed
lesions are concentrated in a minority of the population. If that minority can be targeted for preventive
action the impact and cost of the disease could be reduced.
5.2.5. Dentate subjects: Periodontal disease
Periodontal data, particularly that on pocket depth was prone to inter-examiner variability. For inter-area
differences the reader is referred to the data for JGS alone.
Around 10% of the reweighted samples suffered from periodontal disease which had resulted in advanced
attacluiient loss (6mm or greater) in three or more teeth, and mobility of at least one tooth (two or more
on average). This probably represents the most severely affected 10% of the population. A further 10% had
signs of widespread disease (3 or more teeth affected by attachment loss of 6mm or greater), whilst another
10% had at least one mobile tooth. These two groups represent those with some signs of threatening
disease. In total nearly half of the subjects examined had some loss of attachment, but in around half of
255

them it only affected one or two teeth. So moderate or severe periodontal destruction (or strictly speaking,
evidence of past periodontal destruction) was really rather common, whilst severe and/or widespread disease
affected up to 30% of the sample. The US national survey is the only one to report loss of attachment data
on a large sample of elderly people, and the statistics found in the present study seem to indicate rather
more severe disease than was reported in a similar age group in the US. 34% of older Americans had some
loss of attachment of 6mm or greater, compared to around 40-50% in this study (NIH, 1987).
The distribution of loss of attachment according to socio-demographic variables reflects the findings for
coronal and root caries. Males, manual workers and non-attenders tend to be more severely affected by loss
of attachment. The proportion with deep pocketing reduces with age, whilst the proportion with advanced
attachment loss, if anything, tends to increase. This may be a reflection of recession catching up with
pocketing in the oldest age group, altered treatment patterns in old age or a genuine reduction of risk.
Involvement of molar furcations can seriously complicate periodontal treatment. In this study it was found
that a majority of those with molars and, in some areas, nearly a third of all molar teeth, had furcations
involved by loss of periodontal attachment, albeit not severely in most cases.
The temptation, when examining this data, is to identify a huge unmet treatment need, millions of people
with moderate or advanced attachment loss and up to a third of all remaining molars with some furcation
involvement. However these findings must be placed in the context of the age of the subjects, their
expectations of their teeth, and the likely impact of any treatment on the longevity of the dentition and the
quality of life of the individual. In order to translate data of this sort into a real assessment of treatment
need, much more needs to be understood about the factors which govern risk of disease progression (for
example age, tooth and site, see Grbic, J.T., et al 1991), the natural history of the disease in the elderly,
and the impact of periodontal disease and tooth loss on oral comfort and the quality of life. As more British
adults retain natural teeth into old age these issues will become increasingly important.
256

Indices of clinical disease - CPITN
The best index for the measurement of periodontal disease is a vexed question. The Community Periodontal
Index of Treatment Need (CPITN) is probably the most widely used, but its validity has been questioned
(Baelum, V. et al., 1993b) and it may be particularly inappropriate for use in an elderly population for
several reasons. These include:
1. It has no component of loss of attachment measurement. In any group, but in particular in the elderly,
a tooth can have extensive loss of attachment which threatens its integrity and longevity without
necessarily having a deep pocket (the worst level of disease recorded by CP1TN). In other words the
index may not actually detect the most advanced disease.
2. CPITN relies on a sextant scoring method. As sextants are rendered toothless the count of the number
of sextants affected by disease (one of the standard WHO analyses) becomes increasingly difficult to
interpret and compare, as the number of affected sextants will be limited by the number of dentate
sextants left.
3. Components of the CPITN are subject to severe problems of inter-examiner variability. This has
already been discussed elsewhere (see section 4.1.3.).
4. The priorities and needs of the elderly are likely to be different from those of younger generations. The
maintenance of a full arch of perfect teeth may well cease to become a realistic goal, the maintenance
of a functional comfortable dentition, even if there are a couple of deep pockets, may be a sufficient
goal in itself for some. Against this background, the treatment need (TN) component of CPITN may
well be irrelevant, and may not reflect the true concerns of an individual, their satisfaction and ability
to function
When CPITN was applied to the data from this sample, the worst score (pockets of 6mm or greater) failed
to detect a disturbingly large number of people who undoubtedly had severe periodontal disease, or who
had at least had experienced substantial periodontal damage, when other straightforward measures were
used. The sites used in this study were a mid-buccal/lingual and an interproximal site. This may have
favoured the detection of loss of attachment over pocketing (there is often extensive buccal recession in the
absence of a pocket). Nevertheless, the failure to detect affected subjects was large and consistent for
257

several different measures. When the position was reversed, and those with 6mm loss of attachments were
cross-tabulated against those with pockets and those with mobile teeth, a much smaller proportion of those
with the second measure (i.e. deep pockets or mobile teeth) were missed. Part of the discrepancy in these
cases will have arisen from unscorable codes being recorded for teeth where the amelocemental junction
was not present or not detectable (e.g., deep fillings, crowns and gross calculus), and most of the rest will
have been cases where the gingival margin lay above the amelocemental junction. The former could be
addressed in the design of diagnostic criteria as it should not be necessary to record as unscorable all sites
where there are crowns or gross calculus.
The detection rates of severe disease which are reported here are based around individual subjects, not sites.
In other words they are reporting differences in the prevalence, not the extent, of periodontal disease using
alternative measures. However, in terms of studies of the population the first priority must be to identify
the subjects who have some severe disease. In this respect CPITN fails.
5.2.6. Dentate subjects: Tooth Wear
Cervical wear
The threshold used for describing the pattern of cervical wear was a score of three which represents a
cervical defect 1-2nmi in depth and is consistent with the possibility of early treatment need. However the
treatment implications for cervical wear are not major. if these lesions are deemed to need operative
treatment at all, the treatment required is quick and inexpensive (usually placement of a glass ionomer
cement filling). In many cases, even with quite deep lesions, treatment may not be necessary. Cervical wear
was one of the areas with a significant inter-examiner variability problem, but using data for the author
alone there appears to be no difference between areas; 42-46% of the population were affected. Cervical
wear is therefore rather widespread. Not surprisingly, in cases where wear was present, a number of teeth
were affected, with the mean number affected lying between 2.3 and 2.7. Filled cervical root surfaces were
coded as unscorable so there is no wear data from these, in some cases the fillings may have been placed
because of wear. Consequently, the prevalence of cervical wear is almost certainly underestimated.
258

Coronal Wear
Grade 3 (or worse) was also the threshold used to analyse coronal wear data. This represents considerable
exposure of dentine (or worse) but unlike cervical wear there is no direct relationship between the wear
score for an individual tooth and its treatment need. Wear of grade 3 or worse occurred in a substantial
minority (around 40%) of mouths (see data for JGS alone in table 4.1.10.), but where wear was found an
average of over three teeth were affected. The finding that men are more likely to have wear, and have
more worn teeth when wear is present, is consistent with previously published research in this area (Robb,
N.D., 1992). That wear is slightly more common in non-attenders and manual workers may be related to
a smaller number of teeth in these individuals and consequently a reduced occiusal support. Such a
relationship between number of teeth and occlusal wear has been reported by some authors and refuted by
others (Robb, N.D. & Smith, B.G.N., 1992). There was a clear age related increase in prevalence of wear.
As wear of the teeth is an irreversible process this is only to be expected, however tooth number could also
be a factor in these cases.
Wear of the crowns of the teeth is frequently quoted as a particular problem of the elderly, but the scale
of the problem will depend on a number of factors. Unless the rate of wear has shown signs of a rapid
increase, coronal wear will only be of concern in the elderly if:
1. It threatens the long term integrity of the dentition
2. It causes aesthetic or functional problems which are of concern to the patient.
Analysis of data from this study, using a simple chi-squared test of the presence of wear against the
presence of dissatisfaction, showed that the presence of grade three wear was not correlated with any
aspects of dissatisfaction or functional impairment. Grade 4 wear (only 13% of the sample had any grade
4 teeth) is only correlated to general dissatisfaction and dissatisfaction with chewing, and even here the
association was only marginally significant and a reflection of the large sample size. Over 90% of those
with grade four wear were still satisfied. There is no evidence, even from this rather simplistic statistical
analysis, that tooth wear, even severe wear, causes a particular problem to the elderly at the population level
at the moment.
259

5.2.7. All subjects: Other oral disorders.
The prevalence of uncommon oral mucosal lesions is not a statistic which is readily estimated in a study
of this sort, a much larger sample and a completely different survey design would be required. Although
pathology was recorded where it was found, the reporting in this survey is confined to dry mouth, denture
related pathology and temporo-mandibular symptoms, all of which are reasonably common and were
familiar to all of the examiners.
Dry mouth was reported commonly, but the relationship between reported dry mouth and the rate of
salivary flow is not perfect and neither is the relationship between the rate of flow and the condition of the
gland. Reported dry mouth is as valid as any of the other measurements of dry mouth - indeed it may be
more relevant as it is directly tied to the subjects perception of the problem. The prevalence of reported dry
mouth, at around a fifth of the sample, was in line with the findings of Osterberg (Osterberg, T. et al.,
1984) in a study of older adults in Sweden. The Swedish study also reported a correlation between dental
status, as recorded by the Eichner index, and reported dry mouth, a finding which is interesting in the
context of the higher prevalence of reported dry mouth which was found in the edentulous in this study.
There was an age related increase in the prevalence of reported dry mouth, but the relationship between
edentulousness and dry mouth appeared to be maintained, even within individual age bands, and in the
Swedish study all of the patients were the same age. It may be that the presence of dentures alters the oral
environment sufficiently to increase the awareness of dryness, or that dentures actually reduce salivary flow,
or that other denture related problems, such as candidal infections, manifest as a feeling of oral dryness.
The causes of the reported dry mouth are not clear cut. Around a quarter of the subjects who reported dry
mouth also reported dry eyes, a combination suggesting (although obviously not always confirming)
Sjogren's syndrome. Between 18% and 30% of those with dry mouth were on a medication strongly
implicated in causing dry mouth whilst nearly half (47%) of individuals who took such a medication
reported a dry mouth. These figures are similar to those reported recently for older Floridans (Gilbert, G.H.
et al., 1993). The sum of subjects with suspected Sjogrens syndrome or known potent xerostomic drugs can
260

only account for, at most, about a half of all cases of reported dry mouth. Over 80% of all dry mouth
sufferers took some form of medication. Many of the cases of reported dry mouth where there was no
obvious cause (e.g. a drug known to cause xerostomia or a history suggesting Sjogrens syndrome) may be
accounted for by drugs which are less potent xerostomic agents but may nevertheless be capable of causing
a problem where the functional capacity of the gland may be reduced already, or where the interaction with
another medication potentiates the effect of a drug which normally only causes a minor reduction in salivary
flow.
Denture related lesions were fairly common, affecting 16-20% of all denture wearers. However the denture
related pathology which was found was generally minor and of little significance. The majority was
accounted for by cases of denture stomatitis.
Pathological lesions unrelated to the presence of dentures were also quite common, occurring in between
10% and 15% of subjects, but were thought to be benign in all cases and were rarely a source of any
discomfort. The sorts of lesions encountered most frequently included small epulides and papillomatous
lesions, geographic tongue, black hairy tongue and lichen planusllichenoid reactions. No cases of suspected
malignancy were found and, bearing in mind the incidence of oral carcinoma in this age group (around 1
per 10,000 per year in over 60 year olds), in a sample of this size this is not surprising.
Signs of TMJ dysfunction (clicks and crepitus) were relatively common, but tenderness and pain were rather
rare, occurring in less than 5% of the population. TM.! problems appear not to be a severe problem at a
population level in the elderly.
5.3. QUESTIONNAIRE DATA
5.3.1. Edentulous subjects.
Only a tiny minority of the edentulous sample attend regularly (or even occasionally) for check-ups. The
261

mean age of dentures for any given area/age group combination was between 9 and 18 years, and for the
over 75 year olds it was 16-18 years, as there was a general increase in the age of the dentures according
to the age of the individual. It is fair to assume that a large proportion of these edentulous older adults have
not visited a dentist since they had their dentures made, and although the mean age of the dentures varied
between 9 and 18 years (depending on the area and age group), in some individuals the dentures were over
fifty years old. The high prevalence of soft tissue disorders, particularly denture stomatitis, may be related
to this, but it should be noted that, in spite of the age of the dentures and the lack of regular dental care,
levels of subjective satisfaction were high.
Many of the current generation of elderly people were rendered edentulous at a young age (40 or less). Up
to 40% of the Darlington 75+ group fell into this category, although Salisbury stood out as having fewer
(14% in the over 75 year olds). The statistics clearly show a changing pattern, a much smaller proportion
of the younger groups in all areas were rendered edentulous at a young age, but Salisbury still stands out
from the northern areas in having fewer who were rendered edentulous under the age of 40.
The vast majority of the dentures worn by the edentulous were manufactured under the National Health
Service, a maximum of 14% (reweighted totals) were private, and in Darlington the figure was only 4%.
Although only a minority said they found dentistry expensive, the infrequent exposure to dental services
of most of these individuals must limit the significance of this finding. Younger edentulous subjects were
more likely to find dentistry expensive than older subjects. This is mirrored by the findings for the dentate
and may be a result of more widespread recent contact with the dentist among the younger group.
A fairly low percentage of the edentulous sample said they were dissatisfied with their overall oral
condition. Inadequate function was a more important source of dissatisfaction than aesthetic concerns. The
edentulous in Salisbury were more dissatisfied (with all aspects of their oral health) than those in Darlington
and Richmondshire. In Richmondshire, the proportion who were dissatisfied with function was half that
in Salisbury. The reasons for this regional difference are no doubt complex, but it may be that there are
higher expectations in Salisbury, or that they have been edentulous for less time, or that they are dissatisfied
262

with being edentulous in the first place. However it is important to keep this in perspective, as only 8-16%
of the edentulous reported being dissatisfied with function and 10-12% overall.
Restriction of diet (when there are some things which people would like to eat but cannot due to problems
biting or chewing) was reported by between 22% and 37% of the reweighted sample. Ulceration and
discomfort from dentures during eating were reported with similar, or greater, frequency. This is
considerably more than the percentage who reported being dissatisfied with any aspect of their dentures.
This may be a reflection of lowered expectations among many of the denture wearers; discomfort and eating
difficulties appear not necessarily to result in dissatisfaction in many cases, and may be regarded as
inevitable hazards by many. Restriction of diet due to dental problems in the elderly has been reported
before and the findings of previous work are described in detail in section 2.3.. This suggests that there is
no evidence that dietary restriction leads to any significant nutritional impairment.
Although there are many possible reasons for dissatisfaction among the edentulous, there is only really one
which can easily be treated by the dental profession - poor quality dentures and problems related to these.
The analysis of dissatisfaction according to the number of denture faults was intended to try to identify the
relative impact of these factors on dissatisfaction. The percentage dissatisfied increased with the number
of denture faults. There was greater dissatisfaction where there were more faults. However only 10% more
of those with the worst dentures were dissatisfied compared with those with the best. Even where no faults
could be found with the dentures 13% of their wearers were dissatisfied with some aspect of oral function.
Various specific faults were cross-tabulated with satisfaction/dissatisfaction and tested using a simple chi-
squared test. Although a number of significant relationships were found, the relationships were generally
weak and the fact that they were significant was probably related to the large sample size being used. The
implications of this are that much patient dissatisfaction appears to be connected with factors over which
the dentist has little control (for example age, length of time edentulous, expectations), at least once the
patient has been rendered edentulous. Considerable further analysis would be necessary to quantify the
relative importance of these factors. It should also be noted that even the wearers of what were judged to
be poor dentures were satisfied with what they were wearing in a majority of cases.
263

4.3.2. Dentate subjects: Demands
Overall, 54-62% of the reweighted sample felt that they needed no dental treatment. Those who had decay
or unsound restorations were not much more likely to think they needed treatment compared with the
sample as a whole. The conclusion from this is that patients are not very good at knowing whether they
have a treatment need or not. Further analysis according to ttendance pattern and treatment need showed
that those who attend the dentist only when they have pain were more likely to think that they were in need
of treatment than those who had a genuine treatment need (according to the findings of the examination).
The design of the diagnostic criteria were such that, where decay or unsound restorations were detected,
this probably translates fairly well into treatment need. This seems to indicate that non-attenders feel less
secure about their dental state (and this is probably justified), whilst regular attenders may feel a potentially
unjustified sense of security that there is no treatment required.
The data on choice of treatment options exposed large regional differences in attitudes and demands
between Salisbury and the two northern samples. On the whole, the Salisbury sample had a more restorative
ethos, not only choosing restoration as an option more frequently, but also were less likely to pick and
choose between restoration and extraction depending on the circumstances. The two northern samples
showed evidence for a swing away from extractions in the younger age groups with only 9-12% opting for
extraction in all cases. In the over 75 year olds the percentage opting for extractions in the North of
England increased to 19%, but in Salisbury there were only 10%, and 75% of over 75 year olds in Salisbury
opted for restoration in all cases compared to only 41-49% in the two northern samples. Differences in
gender attitudes between north and south have already been discussed, but such differences are once again
apparent here. Men in all areas were more likely to opt for extraction than women. Women in
Richmondshire and Darlington were more likely to choose restoration in all circumstances than men, but
in Salisbury the position was reversed such that more men would choose restoration in all circumstances.
Seen in the context of the figures for edentulousness (more women are edentulous than men) this may seem
surprising, but it may be that women tend to be more interventionist than men in terms of treatment and
are more likely to seek active treatment, even the provision of full dentures, if that is what is required.
264

Manual workers and non-attenders were more likely to opt for extraction or to pick and choose according
to circumstance. Although the results were presented differently, the 1988 Adult Dental Health Survey
similar age related trends were seen (Todd, J.E. & Lader, D., 1991). The data were not broken down by
area so there was no indication of these geographical trends.
Symptoms experienced will be an important determinant of demand across the whole population, including
non-attenders. Up to a quarter of the dentate samples reported sensitivity of their teeth to hot or cold in the
last four weeks, whilst up to 10% reported toothache over the same period and 10-16% reported other oral
discomfort (dominated by that related to dry mouth). This adds up to a considerable amount of discomfort
among the elderly, even if it was not enough to make the sufferers seek professional advice in many cases.
Toothache showed no age related increase or reduction. However, sensitivity reduced in the older age
groups, despite the similar number of teeth with gingival recession seen in all age groups. Mobile teeth were
also reported frequently by 13-16% of subjects although patients reported mobile teeth rather less frequently
than they were detected during the periodontal examination: 17-30% of subjects were found to have mobile
teeth in the examination, perhaps suggesting that dentists can detect problems of this nature before their
patients. The frequency of all of these dental symptoms is rather high. Other authors have reported high
levels of symptoms in the elderly (Smith, J.M. & Sheiham, A., 1980a) although there is little data on the
dentate elderly. The results from this study indicate the potential for discomfort in an elderly population
who increasingly will be dentate.
4.3.3. Dentate subjects: Attitudes
Attendance pattern has been found throughout this survey to be an important indicator of dental health and
attitudes to dental health in the dentate sample. The needs and demands of the edentulous are different and
regular dental attendance was a rarity in this group. However, amongst the dentate, irregular attendance was
much more common in manual workers, particularly unskilled manual workers, than in the non-manual part
of the sample, and was also more common in men than in women. This may account for much of the
difference in clinical dental disease between men and women and between manual and non-manual workers.
265
workers. A higher proportion of the Salisbury sample were regular attenders than those in either of the
northern areas. This may also be linked to some of the (usually minor) regional differences in disease levels
and treatment patterns. Similar geographical and social differences were noted in the Adult Dental Health
Survey (Todd, J.E. & Lader, D., 1991), but the percentage of non attenders which they reported for their
older subjects (around 45-50%) was higher than in this survey (19-28%). There are three reasons for this
discrepancy. First, the three samples used in this survey may not be a true representation of the national
picture (for example no large areas of urban deprivation were included). Second, there was a known
selection bias away from non-attenders in this study which has already been discussed in some detail.
Finally, the sample size for this age group in the national survey was smaller, so the confidence limits will
be wider.
Toothbrushing frequency is a behavioural manifestation of peoples attitude to dental health. The
geographical differences in toothbrushing frequency were not between north and south (although there was
an element of difference here), but between rural and urban. In both of the urban areas brushing twice a
day was the norm (6 1-70%), and only 5-6% brushed less than once a day. In rural Richmondshire only 42%
brushed twice daily and 11% brushed less than once a day. This is one of the few variables for which
Richmondshire stood out as quite different from the other two areas. There was no suggestion though that
the periodontal health of the Richmondshire sample had suffered adversely, but there are so many
confounding variables that this is difficult to say with certainty. Todd and Lader found a similar age related
increase in non-brushers, and the percentages of the samples who brushed their teeth less than once a day
was similar (7-11% , increasing with age) (Todd, J.E. & Lader, D., 1991).
The amount of upset at the prospect of edentulousness may give a good indication of differences in cultural
attitudes between the north and the south. The proportion of the dentate sample who would be 'not at all
upset" about losing their teeth was highest in Darlington (27.7%) and lowest in Salisbury (23.1%) but the
difference between them is surprisingly small and this is also the case for data from the 75+ group alone.
However the 60-64 age band in Darlington stood out as having a much larger proportion who would not
be concerned at losing their teeth than either of the other areas (31% compared to 17-19%). Darlington was
266

also the area where the highest percentage of the reweighted dentate sample expected to be edentulous at
some stage. There is a discrepancy, greatest in the oldest age groups but also substantial in the youngest
group in Darlington, between those who would not be upset at the prospect of edentulousness and those
who do not expect to become edentulous. There are substantial numbers of people who, although they do
not expect to lose all of their teeth, would not be upset if they did. It appears that there may still be a
cultural acceptance of edentulousness, not only in the oldest adults (75^), but also perhaps in the late middle
aged groups (60-74 year olds) in the north of England. The same question about how upset people would
be with the prospect of total tooth loss was asked in the Adult Dental Health Survey, and a higher
proportion said that they would not be upset than was the case in this survey, but once again the difference
is likely to be related to the selection bias against non-attenders. Non-attenders in all areas were the least
likely sub-group to be upset about tooth loss, and had the highest percentage who expected to lose all of
their teeth at some stage. Although they are an obstacle to universal good dental health in the population,
the people in this category do not present as large a problem as it may seem. Their demands are low (they
do not seek care unless they have to), their expectations are low (fewer are likely to be upset about tooth
loss), and consequently when (if) they do lose their teeth they are less likely to be upset and are probably
less likely to make unrealistic demands of their prostheses than regular attenders who visited the dentist
with the aim of preserving oral health.
As with the edentulous, the vast majority of the dentate in all areas usually received dental care under the
NHS. The pattern of private care usage was also similar to that for the edentulous, with a far smaller
percentage in Darlington using private dentistry, although the uptake of private care was small in all areas
(3-7%). These findings are in line with those for the Adult Dental Health Survey (Todd, J.E. & Lader, D.,
1991). Nearly half of the total dentate sample (41-51%) said that they thought dentistry was expensive or
very expensive. Fewer attenders thought that it was expensive than non-attenders in Darlington and
Salisbury, although this was not the case in Richmondshire. The oldest group (75^) were the subjects who
were least likely to say that they found dentistry expensive in all areas, but the difference between young
and old was much less in Salisbury than in the northern areas. This finding could be a reflection of
variation in dental attendance pattern with those who had attended most recently having had a clearer
267
memory of cost. The fieldwork for this study was just finishing as proposed cuts in the fees paid to dental
practitioners for NHS work were leading to threats to the availability of NHS dentistry in some areas.
Consequently this data may be out of date already, but it gives an insight into the experience and possible
expectations of older adults.
Only around 5% of the total dentate sample were dissatisfied with their overall oral condition. A larger
proportion were dissatisfied with various aspects of their mouth, particularly aesthetics (11-14%). More of
the dentate were dissatisfied with the appearance of their teeth than the edentulous. However, only 3-5%
of the dentate sample were dissatisfied with their ability to bite and chew their food (much less than the
edentulous). Despite the nearly universal satisfaction with being able to bite and chew, a much higher
percentage of the reweighted dentate samples (13-17%) said that there were some foods which they would
like to eat but could not due to difficulties biting and chewing (for example tough meat and apples were
often quoted), so that they had some restriction of their diet due to their teeth (or the combination of food
and dentures). The relationship between dissatisfaction with eating and actual dietary restriction is similar
for dentate and edentulous people and suggests that, in the present generation of elderly at least, many
people modify their expectations and are not dissatisfied as a result. In both the urban areas there was the
suggestion of a strong age related increase in dietary restriction. A fuller discussion of the factors which
contribute to satisfaction is given in section 5.5..
5.3.5. Dentate subjects: Barriers and reasons for non-attendance (non-attenders only)
Data on barriers was collected only for those who attended the dentist when they have pain or not at all,
as this is clearly the group in which the presence of barriers is most important. However, as a consequence
the sample sizes are fairly small and it is the reweighted totals which will give the most reliable data. Of
all of the barriers covered in the survey it was "don't need to go" which was the one chosen most often in
all areas; it was also the one most frequently given as the single most important barrier in any individual
case. It is difficult to know whether the widespread feeling that a dental visit is unnecessary is the result
of a genuine belief that there is no treatment requirement or a convenient cover for another reason for non-
268

attendance. This was also frequently reported as a barrier by the predominantly dentate over sixty five year
olds interviewed in one study (Schou, L. & Eadie, D., 1991). In many cases more than one reason was
given for not attending. The subjects in Darlington tended to find the most reasons, and those in
Richmondshire the fewest. Expense (22-33%) and fear (24-39%) were the other two barriers most often
listed and between them accounted for nearly a quarter of the single most important barriers. Quite a
substantial percentage (13-25%) listed 'cannot be bothered" as a reason for non-attendance although few
(2-5%) listed it as a most important reason. Difficulty with travel was rarely given as a reason for non-
attendance. Even in rural Richmondshire where the distance to the nearest dentist can be large, and public
transport may be limited, only a few of individuals reported it as a problem. It is difficult to compare
directly from one study on this subject to another as the questions, samples and techniques used are so
variable, but the general scope and direction of the findings are in line with other published findings
(Kandelman, D. & Lepage, Y., 1982; Schou, L. & Eadie, D., 1991; Todd, J.E. & Lader, D., 1991; Wilson,
M.C., 1991).
4.3.5. Access to care and knowledge of services
Only a tiny proportion of the sample in any area reported any problems obtaining dental treatment, getting
an appointment or travelling to the surgery. Despite the fact that a much higher proportion in Richmondshire
had to travel a substantial distance to the surgery, they were no more likely to report a problem. Domiciliary
care was felt to be a possibility by 51-63% of the reweighted samples. Those in Darlington were more
aware of this possibility than either of the other areas. There appears to be a different perception of the
value of domiciliary care between the north and the south. Half of the Salisbury 75^ groups thought that
it would be helpful for them if domiciliary care was available, this is twice the proportion in either of the
other areas. Few people had had any direct experience of domiciliary care; 3-5% for reweighted data, but
increasing with age to a maximum of 8% in the Darlington 75+ group.
269
5.4. THE PARTIALLY DENTATE: MASTICATORY FUNCTION, THE NUMBER OF TEETH AND
THE ROLE OF PARTIAL DENTURES.
Even as more and more people retain natural teeth it will be impractical, at least in the medium term, to
aim for a complete and healthy dentition of 32 (or even 28) natural teeth. Few of the current middle aged
have a complete set of teeth in both arches, and some tooth loss is likely to continue. The results which are
discussed in this section were the outcome of investigations which aimed to identify the factors which
contribute to function so that realistic targets for oral health in the elderly can be set. The positive and
negative roles of partial dentures, still the most commonly used means of restoring function and aesthetics,
are also discussed.
5.4.1.Number of teeth and function
It is clear from the results of the logistic regression that the number of teeth, or the number of missing
teeth, is an important factor in determining the presence of problems with eating. Although the odds ratios
are fairly small (mostly around 1.1 to 1.2) these are the change in odds for every missing tooth, where there
are a lot of missing teeth the overall effect will be large. It does not indicate the nature of the relationship,
whether there is a steady decline with every missing tooth, or whether there is a critical number of teeth,
below which masticatory function is greatly impaired, and above which it is generally satisfactory. A
number of authors have suggested a minimum number of teeth for satisfactory function, and these have
been in the region of 20 teeth (Agerberg, G. & Carisson, G.E., 1981). Some authors (Kayser, A., 1981;
Witter, DJ. et al., 1990) suggested that the number of teeth required may diminish with age, whilst they
and others have put requirements on the distribution of teeth a well as the number (Aukes, J.N.S.C. et al.,
1988; Battistuzzi, P.G.F.C.M. et al., 1987; Kayser, A., 1981).
The purpose of the plots of number of teeth against eating problems, and against dissatisfaction with the
ability to eat (figs.4.4.1. to 4.4.4.), are not to try to fit an exact formula to the line, but to give a visual
representation of the nature of the relationship. These graphs exclude subjects who are edentulous in one
270
arch. Such individuals can, in many ways, be regarded as a separate sub-group of the dentate and it was
felt reasonable to exclude them from this analysis. The plots indicate a linear relationship with both the
percentage of the sample reporting functional problems and the percentage of the sample who are
dissatisfied. Data for subjects with fewer than 13 teeth and more than 27 teeth were pooled due to relatively
small sample sizes in these areas. This could have concealed flattening off of the graphs at either end, but
the data is fairly normally distributed, with respect to the number of teeth and contacts, and for the large
majority of the sample (those with 14-26 teeth), the relationship is linear. Posterior contacts show a similar
linear relationship.
Two important points arise from this. First, there appears to be no critical number of natural teeth at which
problems or dissatisfaction become suddenly more common. Second, the relationship between tooth number
and eating problems is not perfect. There are significant proportions of the sample who have few teeth and
report no problems eating and are satisfied (over 90% of subjects with less than 13 teeth are still satisfied)
and some who have almost a full dentition and still report eating problems or are not satisfied. Even
amongst those with only a few teeth the majority are quite satisfied, despite reporting some problems with
eating.
In identifying no critical number, one further factor must be taken into account. The data here is not split
into partial denture wearers and those without partial dentures. Partial dentures will be a major confounding
variable. There is evidence that well fitting partial dentures replacing relatively few teeth make a significant
contribution to masticatory ability (Chauncey, H.H. et al., 1984), and if this is the case there may be
evidence of a critical number of teeth, but it may have been masked by the presence of dentures.
Unfortunately, even with a multivariate model it is impossible to resolve this problem satisfactorily, as the
dependent variables being tested (eating problems) may actually be made less likely by wearing a denture,
and those who do not have a problem are less likely to wear a partial denture. However, the relationship
between number of teeth and partial denture wearing may give an indication of the minimum desirable
number of teeth.
271
5.4.2. Partial denture wearing and the role of partial dentures in dental disease
It is very difficult to asses how successful partial dentures are at their job; those for whom partial dentures
are not successful will probably not wear them or wear them selectively. In addition, some factors may
provide a greater incentive to persist with an otherwise unsatisfactory denture than others, for example a
denture which replaces unsightly missing central incisors may be more likely to be worn than an otherwise
similar denture which replaces only posterior teeth. The data on partial denture wearing which is discussed
here attempts to untangle some of the major stimuli for denture wearing. The graphs of number of teeth
and number of posterior contacts against partial denture wearing (shown in figures 4.4.5. and 4.4.6.) do not
show the same sort of linear relationship described above for functional problems and satisfaction. Instead
the plot shows a steeper portion where there are between 17 and 24 teeth after which it flattens out again.
Where there are 16 teeth or less a fairly constant 75% or so wear a partial denture, over 24 teeth and there
are less than 5%, and many of these will be replacing only one or two anterior teeth. The same sort of
relationship is evident according to the number of posterior contacts with 2-4 contacts being the critical
number.
The results of the multiple logistic regression (Table 4.4.1.) which tested the factors contributing to partial
denture wearing indicated the importance of the presence of anterior spaces in determining whether or not
a person wore a partial denture. This was the single most significant factor and increased the odds of
wearing a partial denture by 12.7 in subjects who were dentate in both arches. Furthermore, the importance
of this factor is, probably, underestimated as it was impossible to separate out those who had an anterior
space restored with a bridge from those where it was restored with a denture. With bridge wearers removed
from the equation the importance of anterior spaces in determining partial denture wearing would have
probably been increased. The other major explanatory variables were the number of missing teeth (an odds
ratio of 10.3 where there are 16 or more teeth missing compared to a reference of less than 8 missing
teeth), and the number of posterior contacts. The latter showed a significant contribution to the model which
already included the number of teeth and the presence of anterior space(s), in other words the number of
contacts mattered even when number of missing teeth and anterior spacing are taken into account. However
272

the effect of the number of contacts did not indicate the straightforward increase in the odds of partial
denture wearing with fewer contacts that one might expect. Subjects with one or two posterior contacts were
more likely to wear a denture than those with none (odds ratio of 1.6), and those with more than 5 contacts
were much less likely (odds ratio of 0.57). This relationship is also suggested by the graph (in figure 4.4.6.).
Those with 3 or 4 contacts were no more or less likely to wear a partial denture than those with none. This
slightly unusual pattern may illustrate the problems of wearing a denture where there is relatively little to
aid support and retention. Where everything else is equal, a partial denture with just one or two posterior
teeth to support it may be easier to tolerate than one where there are none. This is interesting in the context
of other findings (Chauncey, H.H. et al., 1984) which showed that food appreciation and mastication
improved where there was a partial denture replacing just a few teeth (compared to no partial denture), but
showed no improvement where there was a more extensive prosthesis. The other factors which influenced
whether a denture was worn or not included being female (which increased the odds) and being a dental
non-attender or being from a manual background, both of which decreased the odds.
Other data served to underline the importance of anterior spaces in continued denture wearing. Subjects who
had had a partial denture made in the past which they could not or did not wear regularly are a particularly
interesting group. Those who now wore a denture were much more likely to be the ones who had a space
to fill, the ones who wore no denture were less likely to have an anterior space. In many cases those in the
latter group presumably felt that, in the absence of an important aesthetic role, the masticatory benefit (if
any) of wearing a denture did not outweigh any discomfort or inconvenience.
Between 19% and 25% of all dentate individuals had had a partial denture made which they did not or
could not wear. This represents hundreds of thousands of unworn dentures and a large waste of effort and
money. This may be a reflection of the quality of partial denture design and manufacture, discomfort and
difficulty wearing any partial dentures or the provision of partial dentures which the patients feel are
unnecessary. It is probably a combination of these, but one way or another it probably says quite a lot about
the success of partial dentures as prostheses. It is worth considering briefly the reasons given for denture
wearing by those who persist with them. Although eating and aesthetics were the most important reasons
273

given there was a small minority (about 10%) who chose as the most important reason "because my dentist
advised it'. The percentage who quoted help with eating as the most important reason for denture wearing
increased with age to over half (50-56%) of the 75^ samples. This may have some implications in terms
of prosthesis design for older adults as it may be reasonable to aim to improve function even at the cost
of some impairment to aesthetics in the oldest subjects.
The role of partial dentures in causing dental disease has not been fully established. In the presence of
perfect oral hygiene and intensive maintenance, Bergman (Bergman, B. et al., 1982) found no increased risk
of periodontal disease or dental caries amongst partial denture wearers. However, in the UK at present, near
perfect oral hygiene is an unrealistic aim. Other authors have shown increased disease in partial denture
wearers in large population samples, but the differences have not been great (Carlsson, G.E. et al., 1962;
Chandler, l.A. & Brudvik, J.S., 1984; Deny, A. & Bertram, U., 1970; El Ghainrawy, E., 1976; Lappalainen,
R. et al., 1987; Rissin, L. et al., 1979; Tuoniinen, R. et al., 1988; Drake, C.W. & Beck, J.D., 1993). One
major difficulty with the relationship, at least when it is to be tested on a cross-sectional basis, is in trying
to control for the factors which may have led to the wearing of partial dentures in the first place. A higher
rate of disease may be expected in those with partial dentures as they are likely to have had greater disease
experience, in some cases as a result of greater disease vulnerability, which has resulted in tooth loss. One
possibility is to include measures of past disease history in a multivariate model. In a case of this sort a
logistic regression model is appropriate, but only the presence or absence of disease, not its extent, can be
tested using this procedure. However, in the case of active caries and advanced periodontal disease, where
less than half of the sample are affected, this is a reasonable approach.
In this study root caries and coronal caries were considered separately, as well as loss of attachment. In the
model to test the relationship between the presence of root caries lesions and partial dentures, the presence
of a partial denture was the most significant independent risk factor and the first to be included in the
model. Whilst the significance and the odds increase were reduced as variables reflecting previous disease
(number of teeth, number of fillings) were included in the model, there was still a significant relationship
between the presence of partial dentures and the presence of active root surface caries when the model was
274

complete with an odds ratio of 1.9. In other words the odds of having a root caries lesion were doubled
where there was a partial denture, even taking into account the other contributory variables reflecting
susceptibility to disease. The odds of having some root caries lesions or fillings were increased 17-fold
where a denture was present. Interpretation of this is a little less easy as the root restorations were not
necessarily placed after the denture, and root surface fillings and partial dentures may be associated for
many reasons, other than just a cause and effect relationship. Most of these were included in the statistical
model and an increase in the odds of this scale cannot be disregarded.
Coronal caries was not affected by the presence of a partial denture, but the presence of loss of attachment
was. The interpretation of this is a little more difficult as much loss of attachment may have already
occurred prior to denture placement, and unlike caries history where the number of fillings can be included
in the model as a reflection of past disease susceptibility, there is no easy way of differentiating between
active and past periodontal disease.
Most previous studies relating partial denture wearing to disease have not separated root caries from coronal
caries. In the elderly there are a number of important reasons why this is desirable. Teeth with unsound
roots axe at least as conurion as teeth with unsound coronal surfaces in older adults (as has been shown in
this study), but unsound roots conform to a different pattern with more new decay compared to the failed
restorations which account for much of the unsound component in tooth crowns. Furthermore, the exposed
roots would appear to particularly vulnerable to the sort of stagnation areas and plaque accumulation often
found in association with partial dentures. From the results of this study, and some other recent work
(Wright, P.S. et al., 1992; Drake, C.W. & Beck, J.D., 1993), concern about an increased prevalence of root
caries in partial denture wearers appears to be well placed. It seems paradoxical that a prosthesis constructed
and worn for the purpose of improving oral function, may increase the risk of further oral breakdown
significantly.
275

5.4.5. The minimum requirements for the partial dentition
In this sub-section the data discussed in the previous four sub-sections (5.4.1. to 5.4.4.) has been drawn
together to try to establish what the minimum goal should be for the partial dentition. Given the potential
for damaging effects of partial dentures it would seem preferable to avoid them where possible. In order
to do this at a population level, two conditions need to be met. The first is that enough teeth are retained
to ensure that partial dentures are not required for the provision of adequate function. The second is to
ensure that any anterior spaces are restored by something other than partial dentures. In practical terms this
means either conventional or adhesive fixed bridges. The latter is an attractive option in terms of the
preservation of natural tooth tissue, and possibly also on economic grounds.
The relationship between tooth number and partial dentures may not be as clear as the graph (figure 4.4.8)
suggests. The rapid reduction in the need for partial dentures where there are 17 teeth or more may be, in
large part, a reflection of the reduction in the odds of there being an anterior space where there are more
teeth. Data from the stepwise logistic regression, with partial denture wearing as the dependent variable,
indicate that this may well be the case. The effect of tooth number is relatively small when it is included
in a model with anterior spaces. A measure of the number of posterior contacts is relatively free from this
complication and number of contacts is a significant influence on denture wearing.
Tooth loss is likely to continue through life, so in order for a sustainable, denture free, condition to be
achieved, more than the minimum number of teeth or contacts (which are required for satisfactory function)
will be required, at least for the under 70 year olds. The rate of tooth loss in the elderly is unknown, so an
accurate assessment of the minimum is impossible. In this context 20 teeth would seem too low, unless the
number of natural posterior contacts can be maximised. Somewhere around 24 teeth or 4 posterior contacts
may be appropriate at age 60. In this study, only 472 of 2280 (20.7%) over 60 year olds had 20 or more
standing teeth. Kayser has suggested that the number of teeth required for comfortable function reduces with
age (Kayser, A.F. et al., 1990), however there is no hard evidence to support this assertion. If this was the
case reserve teeth may not be necessary, and 20 teeth at age 60 may be appropriate.
276

Much of this accords with the principles of the shortened dental arch proposed by Kayser (Käyser, A.,
1981; Kayser, A.D. & Witter, D.J., 1985). The shortened dental arch would seem to be a worthwhile goal
as it embraces the concept of posterior tooth contacts, the need to restore anterior teeth and the
undesirability of partial dentures. However the shortened dental arch, in its pure form of two dental arches
unbroken by spaces from premolar or first molar to premolar or first molar, is uncommon in the UK: only
10% of the people aged over 55 years and 2% of those aged over 65 years examined in the 1988 Adult
Dental Health Survey had the potential for a classic shortened arches from second premolar to second
premolar in upper and lower. It is not achievable widely as a public health goal in the short term, although
with sufficient planning and education it may be a possibility in the longer term. For individual older
patients it remains an appropriate and useful treatment strategy, particularly where resources are limited or
the capacity to undergo advanced treatment is impaired as a result of chronic illness, and where a natural
dentition for the rest of the subjects life is a realistic prospect.
5.5. THE FACTORS WHICH INFLUENCE ORAL HEALTH iN THE ELDERLY
The theoretical model (figure 3.11.2.), which was used as the basis for testing the relationships between
aspects of function and satisfaction and various explanatory variables, is based on four assumptions.
Working down from the top of the model the first assumption is that, in the elderly, it is inappropriate to
measure oral health solely by measuring disease. In order to achieve oral health the subject has to be
satisfied with their oral condition and with their ability to perform normal oral functions (e.g. eating,
looking good) as well as being free of disease. A disease free population would be a failure in terms of
public health if widespread dissatisfaction with appearance or inability to eat remained. The second
assumption is that a good natural dentition is always preferable to a completely artificial one. The evidence
from studies of masticatory performance support this view (Gunne, H.J., 1985a; Helkimo, E. et al., 1978;
Mahmood, W.A. et al., 1992; Wayler, A.H. et al., 1984). More dentate than edentulous subjects in this
study were satisfied with their ability to bite and chew their food, in line with the findings of Bergman and
Caisson (Bergman, B. & Caisson, 0., 1972). The superiority of a natural dentition is not necessarily
supported in terms of aesthetic satisfaction, which in this study was higher among complete denture wearers.
277

However, for the purposes of the analysis this assumption regarding the superiority of a natural dentition
will be upheld. The third assumption is that a healthy set of natural teeth is only of value if it is sustainable
in a reasonable condition for the rest of a persons life. In other words, oral health is of little value if it is
a transient state. The final assumption is that overall satisfaction is likely to depend in large part on
satisfaction with two of the major roles of the dentition; to enable eating and to provide sufficient aesthetics
to be socially acceptable.
An analysis of the factors contributing to problems with eating was the first to be undertaken (table 4.4.1).
The importance of the number of teeth in relation to problems with eating was only to be expected and has
already been discussed. Whilst the impact looks relatively small (odds ratio of 1.12) this is the effect for
each missing tooth, so the multiplicative effect for a large number of missing teeth would be considerable.
The other factors which were contributory to the four variables indicating difficulty with eating, included
a variety of social, demographic, symptom related and clinical variables. Being female appeared to make
problems with eating hard foods more likely, as did living in the South of England, this is over and above
the differences in the number of teeth and dental state related to these variables. It may be that women and
people living in the South of England expected more from their teeth. Although dental health in both cases
was a little better, the expectations may be higher in these groups and, in the case of the geographical
variation, it could also be that southern diets are more demanding. Those who had been through some form
of higher education were also more likely to report dietary limitations than those who had not. Once again
it is difficult to be sure what underlies this finding, whether it is a result of higher expectation, a more
demanding diet, or both.
The other variables which contributed to the model related to symptoms and disease. Tooth mobility (both
when reported by the subject and when found by the dentist) was a factor in dietary limitation due to
problems eating. Although the ability to bite and chew without difficulty was greater where there were more
teeth, if teeth are preserved without consideration of the potential for symptoms, the overall effect may be
to reduce the ability to function, not increase it. It is interesting that subject-detected mobility and dentist
detected mobility were both included in the model separately, suggesting that even where the subject did
278

not notice any mobile teeth, they may still have been the source of problems with eating. The other
symptom which seemed to play a role was sensitivity. The questionnaire asked specifically about
temperature sensitivity, but it is possible that some subjects who had discomfort on biting may have
reported this as sensitivity, so care over the interpretation of this point is advisable. The number of decayed
teeth and the number of teeth with loss of attachment over 6mm were found to contribute to the odds of
suffering from any of the three eating problems, but mobile teeth were not included in the final model in
this case, and loss of attachment may just be another indication of the same sort of thing (advanced
periodontal disease causing problems).
Dissatisfaction with the ability to bite and chew food was heavily influenced by all of the three variables
indicating problems with masticatory function (diet limitation, difficulty with hard foods and altered food
preparation), including an interaction between the three of them. The only other contributory factors were
age, which decreased the odds of dissatisfaction as it increased, and recent toothache, which increased the
likelihood of problems by a factor of 2.8. The former may be a reflection of diminished expectations with
increasing age Alternatively, it may indicate that future generations of the elderly may be more demanding
and that the present age related reduction in the percentage dissatisfied may not be sustained. None of the
other potential contributory variables had a significant effect on the model in their own right, and were not
significant once the three eating problem variables (diet limitation, difficulty with hard foods and altered
food preparation), age and recent toothache were included.
Dissatisfaction with appearance is apparently much more open to influence from social, socio-dental and
demographic variables than dissatisfaction with masticatory function. Age reduced the odds of being
dissatisfied, whilst being female, having had a higher education and being a dental non-attender all
increased the odds of being dissatisfied. The single most potent factor was the number of unfilled spaces
which saw a 3.6 fold increase in the odds of being dissatisfied for every anterior space, although the number
of decayed teeth and the number of teeth with loss of attachment of over 6mm were also significant factors.
The implications of this are that improved dental health will only go some of the way to improving the
levels of satisfaction with aesthetics. Much of the variation is due to socio-demographic factors, and in years
279

to come these may act in favour of increased dissatisfaction as more demanding, educated and dentally
aware generations grow old.
Figure 4.5.1. shows the final tested model of the factors contributing to oral health, function and
satisfaction, given that the assumptions made above are accepted. Significant factors are marked with bold
arrows. The final dependent variable in the model was overall dissatisfaction (reporting being not very
satisfied or completely unsatisfied to the question "overall, how satisfied are you with your mouth and
teeth'). The original model of oral health was upheld, in that the two major satisfaction variables
(appearance and ability to eat) were both major determinants of overall satisfaction. However, two further
factors played a significant role, both of them included under the general heading of symptoms. These were
a recent history of toothache, and difficulties with speech. Neither affected peoples' ability to eat or
impaired their appearance, but both increased significantly the odds of being dissatisfied. The model is by
no means complete, and is only a part of a wider and more complex interaction. A variety of motivational
and vulnerability factors, including aspects of dental health behaviour, diet and predisposing factors related
to systemic or local disease will contribute to the model at various points, but these have not been
quantified and lie outside the scope of this study.
The variables which had an impact on satisfaction were in line with those described by Cushing (Cushing,
A.M. et al., 1986) for younger subjects, particularly the importance of discomfort. Davis (Davis, P., 1976)
argued that dental disease has little impact on daily life, and other authors (Heyinck, J.W. & Schaub,
R.M.H., 1986; Reisine, S.T. et al., 1989) have indicated that the impact of dental problems on social
functioning is small. This may be so, but the factors which contribute to the oral dissatisfaction which is
reported by a significant proportion of subjects must be of relevance to the dental profession. Dissatisfaction
with aesthetics or function is in large part a failure of the profession. The service which is provided cannot
be improved if the factors which contributed to the dissatisfaction are unknown.
With the final tested model of oral health and data from other parts of the survey it is possible to make
some comments about the factors which should be included when measuring the oral health in the elderly.
280

This is done by defining a series of criteria or goals for oral health in elderly subjects. The criteria for oral
health are in accord with the definitions of oral health which are presented in section 2.4., but present more
detailed goals with a specific population, older adults, in mind. These goals are applicable both at an
individual level and in terms of the public health, and incorporate the principles of shortened dental arch
philosophy (Kayser, A., 1981; Kayser, A.D. & Witter, D.J., 1985). Although relatively few of the elderly
subjects interviewed as part of this survey were dissatisfied or reported difficulties with oral function, the
criteria described below are based on the factors which have been identified as responsible for the
dissatisfaction or problems which were reported. They have also been constructed with a long term view
in mind, so that being dentate continues to be an advantage and does not become a burden with advancing
age.
The goals are:
1. A dentate population, with the prospect of remaining dentate for life.
2. A minimum number of teeth, with the prospect of maintaining that minimum number for life. This was
discussed at length in section 5.4.4.. 20-24 teeth would be an appropriate minimum to aim for. Below
this level the odds of requiring a partial denture are increased considerably. Furthermore, any loss of
teeth implies a further increase in the probability of eating difficulties and dissatisfaction.
3. A minimum number of posterior contacts, and the prospect of maintaining these for life. This is
desirable in addition to the data on the number of teeth as it sets a requirement for the distribution of
the teeth. Number of posterior contacts are a factor in determining whether or not partial dentures are
worn.
4. No unrestored anterior spaces; where spaces are restored this should be by fixed prostheses, not
dentures if possible.
5. An absence of partial dentures. This should be implicit if goals 2 to 4 are fulfilled.
6. Clinical disease should be under control and there should be a reasonable expectation of retaining a
natural dentition for life.
7. An absence of recent symptoms including toothache and speech problems (which impair overall
281

satisfaction directly) and mobility and sensitivity (which impair the ability to function).
Subjects should be satisfied with their appearance and ability to eat. This will be much more likely if
all of the above criteria are met.
The three samples reported here fall well short when measured against these criteria. The 60-64 year old
samples are the groups with the best oral health, and the best chance of achieving a functioning natural
dentition for life. However, even amongst this group only 61-85% were dentate and a further 11-18% of
them were dentate only in one arch. Only just over half (at most) of these dentate subjects have 21 or more
teeth and a third wear partial dentures. So, whilst a majority may be dentate and have the prospect of
remaining dentate for life, relatively few of them can be expected to have the potential to approach the
minimum criteria set out above (in terms of tooth number and distribution, and lack of partial dentures.).
Furthermore, there is a risk that many of those who are partially dentate will continue to lose teeth in an
unplanned manner, leading to a need for partial dentures, further dental disease and yet further unplanned
tooth loss. The result of this, in individual cases, could be the combination of factors most likely to lead
to dissatisfaction, such as eating difficulties, discomfort, anterior spaces and so on. There is little that can
be done to improve this situation in the current over 60 year olds, except aiming for the criteria above
(where they are achievable), controlling tooth loss and disease by prevention and treatment (where they are
not), and restoring function as effectively as possible.
The findings of this survey should also be looked at in the context of the study conducted by Bulman in
Salisbury and Darlington 30 years earlier. At that time 80% or more of the subjects aged 60 or over were
edentulous and the author wrote that "hardly anyone over the age of 65 can be expected to have more than
a few of their own teeth". This should be compared to 50% or less who are dentate and 20% of all subjects
aged over 60 who have 21 or more standing teeth. Considerable progress has been made, but the oral health
goals which are set out above will take a longer time to achieve, and are more appropriate for the present
30-60 year olds, rather than the current population of older adults. The 30-60 year olds are a generation
with a large number of teeth, a high proportion of which are restored, and for whom the goals above are
still achievable for many. However, in order to accomplish these goals, long term treatment strategies will
282

to be employed by dental practitioners to ensure that retaining a natural dentition into old age is an
advantage and not a burden.
283

Clinical Photographs
There follow a series of clinical photographs of five subjects who took part in this project. The photographswere taken during the fieldwork, often in less than ideal conditions. They have been selected to illustratevarious points raised in section 5.5.
Figure 5.5.1. Case 1
These show the teeth of an 80 year old male who is dentate in both arches, but has only 8 teeth, and nocontacts at all between upper and lower teeth (anterior and posterior). He relies entirely on partial denturesto provide function. However, function is poor, the dentures are inadequate and there is widespread disease(canes, root caries and periodontal disease), in the development of which the dentures may have played acontributory role. On the anterior teeth there is advanced attachment loss and mobility, but with onlymoderate pocketing. CP1TN used alone may not have detected this as a severe case of periodontal disease,despite these findings. The subject has experienced slow and uncontrolled tooth loss, and the final resultis a person who is dentate, but where the dentition has become a burden rather than an asset. The oralhealth in this case falls well short of almost all of the goals set out in this section. It illustrates well thatbeing dentate is in itself not necessarily desirable if function is poor, disease is uncontrolled and the subjectcannot eat comfortably.
284

/4

Figure 5.5.2. Case 2
These photographs show the teeth of a sixty five year old woman where the only contacting teeth are inthe anterior region. Partial dentures had been supplied, but with further tooth loss these had becomeincreasingly difficult to tolerate and were no longer worn by the subject. There is no upper anterior spaceat present and both function and aesthetics were felt to be satisfactory. Whilst the situation described isreasonable, any further tooth loss could lead to considerable problems. This illustrates a state of oral healthin a person at the younger end of the elderly spectrum where there may not be enough teeth in reserve toaccommodate further loss without a considerable reduction in function or aesthetics.
285

V
••;.'I 1• ... :.
I P itt)
fry? ' f 'I
i:;L I
:•'
jtr aPdP*I4i
I.

Figure 5.5.3. Case 3
A sixty five year old male with some tooth loss (first molars), a fairly heavily filled dentition and severewear of the functional surfaces of the anterior teeth (grade 4 on the incisors). Despite the wear, there is noreason why he should not keep a useful natural dentition for the rest of his life, even if he lives to anadvanced age. He was satisfied with all aspects of his teeth. This subject would fulfil all of the oral healthgoals set out in section 5.4..
286

)
•r
•, (ji4(.
-F ':
-'5,
'-'*.;c%
4.:
.4 #

Figure 5.5.4. Case 4
A 71 year old former actress with 28 well aligned teeth. There are some restorations, which are in goodcondition, and the periodontal tissues are generally healthy. This subject has every prospect of retaining ahealthy, functional dentition for life. She met all of the oral health goals except one, and that was that shewas not very satisfied with her appearance due to the slight rotation of one upper central incisor. misillustrates that clinical problems which are obvious and easily soluble do not account for all dissatisfaction,particularly with aesthetics.
287

•• 1•-1,
II
I - -A •:

Figure 5.5.5. Case 5
A 61 year old male with 31 standing teeth (the lower left canine is unerupted but palpable in the mandible),no restorations, 10 good posterior contacts and no anterior spaces. There was no caries, and although therewas some marginal gingivitis, widespread staining and localised mild attachment loss, these posed no threatto the longevity of any of the teeth in the short term. This subject had not visited a dentist for 40 years andfuture treatment need should be low unless there is some change in the oral environment (e.g. developmentof dry mouth). Even if disease leading to loss of several teeth were to occur there are sufficient teeth inreserve to provide adequate function, and support for fixed prosthodontics (if necessary) without recourseto partial dentures. This illustrates that a complete, sound and unrestored dentition can be consistent withadvanced age.
288

p r (
A

CONCLUSIONS
289

Section 5.
CONCLUSIONS
Four objectives were set for this research (see Section 1). In this concluding section each of these will be
examined in turn and a synopsis of the findings most relevant to each is given.
Objectivel.
To collect information about the oral health of subjects over the age of 60 years living in three areas
of England, and to review the effect of geographic and social factors on oral health
- A random sample of the population aged 60 years and over was drawn in each of three areas
of England. 2280 subjects from Richmondshire, Darlington and Salisbury were examined and
interviewed in their own homes. Four dentists were involved. The author examined
approximately half the sample in each area; three other dentists examined in their home
location.
- The sampling process was successful, despite the fact that the sampling frame (FHSA lists)
had not been used before in a study of this type. The resultant sample was fairly representative
of the areas studied although, as a result of differences between the refusers and those who
agreed to take part, there was some bias away from the edentulous and non-attenders in the
samples. The scale of this bias varied between areas. Response rates were generally around
55%.
- 48% of the reweighted 60+ age group was edentulous and there were large geographical
differences. There were far fewer edentulous people in the younger age groups than in the
older ones. The lowest rates of edentulousness were found in the 60-64 year olds in Salisbury.
- Around 10% of the sample in all areas were edentulous in one arch only. These people were
accounted for in the dentate sample but may represent an increasingly important component
of the need for complete dentures.
- Complete dentures had on average 3 faults when assessed by a dentist. Less than 15% were
290

fault free.
- In the dentate sample the mean number of standing teeth declined from about 19 in the 60-64
year age group to 14 in the 75+ year age group.
- About 40% of the sample wore partial dentures. 55% of these were made entirely from acrylic
and were completely tissue supported (gum strippers).
- Overall, the 60^ sample had around 17 standing teeth, of which 9 were sound, 7 were filled
and 1 was decayed.
- Around half of the coronal decay was accounted for by unsound restorations, and a ftirther
21% was accounted for by grossly decayed or broken down teeth.
- One third of the population had one or more crowned teeth and 18-22% had multiple crowns.
The youngest age group (60-64 year olds) were much more likely to have crowns than the 75+
age group.
- Almost the whole of the dentate sample in all 3 areas had at least one root surface vulnerable
to decay.
- 30-40% of the dentate samples have no root caries experience. A mean of 2-3 root surfaces
were decayed or filled. The mean number of decayed, and the mean number of decayed and
filled roots increased with age. 20-24% of all vulnerable teeth had roots which were decayed
or filled, 7-9% of vulnerable teeth had roots which were decayed/unsound.
- The treatment need for root caries is concentrated, such that a small proportion of the
population account for a large proportion of the lesions which may need treatment. Most of
the decayed component is accounted for by new decay rather than unsound restorations.
- 40-45% of the samples exhibit marked cervical wear. Those who have cervical wear have, on
average, about 2-3 teeth affected.
- The proportion with significant coronal wear increased with age.
- Most worn teeth are concentrated in a minority of mouths; about 40% of the dentate samples
exhibit marked coronal wear (grade three or worse) and those with this marked wear have on
average 3-4 affected teeth.
- Tooth wear was not associated significantly with dissatisfaction with oral function. Cases of
291
very severe wear show a weak association with functional problems and dissatisfaction with
aesthetics.
- Deep pocketing (>6mm) affected around 20-25% of the samples.
- About 45% of the sample had one or more teeth with loss of attachment of 6mm or greater
and severe loss of attachment (9mm or greater) affected around 12%. About 20% of the
sample had one or more mobile teeth. Up to a third of all molars had furcations which were
exposed by loss of periodontal attachment.
- Dry mouth was reported by around 20% of the sample
- Denture related soft tissue lesions were found in 16-20% of the sample, with denture
stomatitis by far the most common finding.
The effect of geography
- The biggest difference found between the south and the north of England was in the percentage
edentulous. 33% of those in Salisbury were edentulous compared to 57% of those in
Darlington, with rural Richmondshire broadly similar to Darlington, its northern neighbour.
Only 15% of the 60-64 year olds in Salisbury were edentulous, in contrast to 39% in
Darlington.
- There is a suggestion of a ten year difference between north and south in terms of the
proportion edentulous.
- The geographical differences among the dentate are less clear. However Salisbury generally
had a higher percentage with 21 or more teeth, a slightly higher mean number of teeth (17.5
compared to 17.2 in Darlington and 16.8 in Richmondshire). Numbers of sound, decayed and
filled teeth are similar though with a tendency to more filled and fewer decayed in Salisbury.
The sample from Salisbury also had more crowns and more bridges than those in the northern
areas, although the numbers of bridges overall were small.
- Geographical variation in much of the rest of the dental data must be interpreted with caution,
but when the findings from the author (who examined in all areas) are considered alone, the
geographical differences are small. Salisbury had slightly more individuals with some root
292

decay or fillings, but fewer decayed or filled roots on average. The Salisbury sample also had
slightly more cervical wear and mobile teeth, a higher proportion with some advanced loss of
periodontal attachment and a higher proportion who wear partial dentures. However the
differences were subtle.
- In terms of dental health, the difference between rural and urban was small. Rural
Richmondshire tended to be similar to Darlington which is geographically very close. Levels
of edentulousness were a little lower in Richmondshire than in Darlington, particularly in the
youngest age group, while decay and restorations of both crowns and roots occurred at a
similar frequency. For many variables Richmondshire lay somewhere between Darlington and
Salisbuiy.
- The study by Bulman et al (1968), which was conducted in 1962, reported that 83% of the
Salisbury 60-64 year olds and 80% of the Darlington 60-64 year olds were edentulous. What
appears to have happened since then is that the proportion edentulous has reduced enormously
in both areas, although the reduction has been less in Darlington (now 39%) than in Salisbury
(now 15%). The differences between the areas in the state of teeth of the dentate population
may have been diminished.
The effect of gender on dental health
- The effect of gender on dental health differed between north and south. In both of the northern
samples men tended to have fewer teeth, fewer fillings, fewer crowns, more coronal wear, a
little more periodontal disease and fewer partial dentures, but more of them were dentate. All
this suggests that they have less professional intervention in their oral health. In Salisbury
almost all of these differences were much reduced, and in some cases eliminated or reversed.
It is probably not a co-incidence that far more women than men are regular or occasional
attenders in the northern areas, whilst in Salisbury there is little difference.
The effect of social class on dental health
- Generally the oral health of manual workers and their families was poorer than that of non-
293

manual workers.
- Far more manual workers than non-manual workers were edentulous in all areas, and unskilled
manual workers (social classes IV and V) had a far higher proportion edentulous than skilled
manual workers (social class ifim).
- Among the dentate samples, manual workers tended to have more decayed and fewer filled
teeth, and fewer crowns although often more sound teeth as well. There was also a slight
tendency to more coronal wear in this group, slightly more advanced periodontal attachment
loss and (except in Salisbury) fewer partial dentures. The finding that there were fewer fillings
and more sound teeth in spite of higher levels of decay indicate that some of the difference
may be related to dental attitudes and behaviour, specifically dental attendance patterns.
The effect of dental attendance pattern on dental health
- Only a few of the edentulous attend the dentist for check-ups.
- Where there are social class differences in the dental health of the dentate, these are amplified
when the sample is split into those who attend the dentist for check-ups and those who attend
only when they have trouble. In all areas far more manual than non-manual workers and more
men than women attend the dentist only when they have trouble. In addition more of the
Darlington and Richmondshire samples attended only when they have trouble than those in
Salisbury. It is attendance pattern and related attitudes and behaviours, which probably
underpin many of the gender, social class and even geographical differences seen in the
dentate.
Objective 2.
To collect data on the attitudes, demands and barriers to dental care among older adults and to
review the effect of geographic and social factors on these.
- The edentulous in this study had, on average, been in this state for about 30 years. The mean
age of their present dentures was about 14 years, which suggests a high degree of acceptance
294

of their dentures. The mean age of dentures increased markedly in the oldest age-band.
- Discomfort and functional problems were common in the edentulous. 63-72% of the
reweighted samples had some oral discomfort or ulceration.
- Despite the discomfort and functional problems only about 10% of the edentulous were
dissatisfied with their dentures. The main problems were diet restriction and difficulty with
hard foods. Very few subjects complained about aesthetics. There were no marked inter-area
differences.
- The proportion of the edentulous who were dissatisfied varied with number of denture faults,
but the relationship was weak. The difference in the proportion of those dissatisfied between
the subjects with the best dentures and the worst dentures (as assessed by a dentist) was small.
The majority of those with the poorest dentures were satisfied.
- 33-40% of the edentulous samples said they found dentistry expensive or very expensive. This
proportion fell in the oldest age-band, but this may simply reflect their infrequent attendance
and hence a lack of knowledge of fees.
- The dentate were generally poor at assessing whether or not they needed treatment.
- The proportion of the dentate who had suffered toothache or sensitivity of their teeth in the
previous four weeks was as high as 10% for toothache and nearly 25% for sensitivity.
- There were few changes in frequency of tooth brushing with increasing age, suggesting that
the habit of tooth brushing does not alter much with age.
- The proportion of the dentate population who would not be upset at losing all of their teeth
was similar in all three areas, particularly for the older age groups, and there was an indication
of an increase in this proportion with age. Only 11-19% of the dentate samples expected to
become edentulous.
- Almost 9 out of 10 dentate people obtained their treatment on the NHS with a patient's
contribution.
- 40-50% of the dentate samples said that they found dental treatment expensive or very
expensive.
- A fifth to a quarter of the total dentate sample had experience of a partial denture which could
295

not be or was not worn, representing a considerable waste of dentists' effort.
- Only 5% of the dentate sample were dissatisfied with the function of their teeth - there were
no large differences among age groups or areas.
- For those dentate people who were dissatisfied the two major problems were diet restriction
and aesthetics; very few expressed dissatisfaction with masticatory function. The edentulous
on the other hand were more likely than the dentate to be satisfied with aesthetics, but less
likely to be satisfied with masticatory function.
- The most frequent barrier amongst non-attenders was that they "didn't need to" attend. This
attitude increased markedly with age in all 3 areas. The other frequently reported barriers were
"fear", "too expensive' and "can't be bothered'.
- The single most important reason for non-attendance - accounting for about 60% of the non-
attenders - was that they considered they didn't need to go to the dentist.
The effect of geography
- Around a third of the edentulous subjects in Darlington and Richmondshire became edentulous
under the age of 40 years. In Salisbury the figure was only 14% overall.
- There were regional differences in treatment preferences, such that even non-attenders in
Salisbury were more likely to choose restoration than their northern counterparts.
- There was little geographic variation in the frequency of various symptoms. However, the
proportion reporting loose teeth was highest in Richmondshire, lowest in Salisbury, reflecting
the examination findings.
- The proportion of the dentate sample who attend only when having trouble increased with age
in both Richmond and Salisbury, but not in Darlington. Overall there were more non-attenders
in the northern areas than in Salisbury, this was mostly accounted for by differences in the
proportions of non-manual workers who were non-attenders.
- There were inter-area differences in the reported frequency of tooth brushing. 12% said they
brushed less than once and 42% said they brushed twice (or more) daily in Richmondshire,
compared with 5-6% for less than once and 60-70% for twice or more in Salisbury and
296

Darlington.
There was little geographical variation in the percentage who said that they would be upset at
the thought of becoming edentulous, although the figure for 60-64 year olds in Darlington
(31%) stood out as being unexpectedly high. More subjects in Darlington expect to become
edentulous than in the other areas (fewest in Richmondshire). There may still be a cultural
acceptance of edentulousness amongst some groups in the north of England.
- 7% in Salisbury and Richmondshire paid for dental treatment privately or by means of
insurance, compared with 3% in Darlington.
- The non-attenders in Darlington reported the most barriers to care and reasons for non-
attendance, Richmondshire the least. Even in rural Richmondshire where travel can be difficult,
only a tiny percentage reported difficulty with travel as a major barrier.
The effect of gender, social class and dental attendance pattern
- The variation in attitudes, demands and barriers according to gender and social class were
probably closely linked to attendance pattern. More males and manual workers were dental
non-attenders than females and non-manual workers. Males, manual workers and non-attenders
were all more likely to opt for extraction rather than restoration, not be upset at the prospect
of edentulousness and to expect to become edentulous. The gender differences were generally
smaller in Salisbury
Objective 3.
To investigate the relationship between the presence, number and distribution of teeth and partial
dentures, and levels of satisfaction and function.
- All of the variables relating to problems with eating were significantly associated with number
of missing teeth or posterior tooth contacts.
- The relationships between number of teeth or posterior contacts and variables measuring ability
to eat and dissatisfaction with the ability to eat appear to be linear. However the presence of
297

partial dentures confounds the relationship.
- The relationship between the number of teeth and the presence of partial dentures is non-linear.
Where there are less than 17 teeth nearly 80% of subjects wear dentures, where there are over
24 teeth there are only 5%.
- Anterior spaces, the number of teeth and the number of posterior contacts were the key
correlates with partial denture wearing when tested using a logistic regression model.
- 19-25% of all dentate subjects had had a partial denture made at one time which they could
not, or did not, wear. Those with anterior spaces were much more likely to be the ones who
now wore a denture, those with no anterior space generally did not.
- Partial dentures appear to increase the risk of dental disease, specifically root surface caries.
The odds of having root surface caries are nearly doubled where partial dentures are worn,
even when measures of disease history are taken into account.
- If partial dentures are to be avoided and a functional and aesthetic dentition are to be
maintained for life, a minimum of 20-24 teeth and 4 posterior contacts would seem a
reasonable goal.
Objective 4.
To identify goals for oral health in the elderly and to identify the factors, clinical and sociological,
which may need to be addressed in order to achieve these goals.
- Oral health can only be achieved if the population are generally satisfied with their oral
condition.
- A long tenn view of oral health is required such that a satisfactory natural dentition must be
sustainable throughout life.
- Using a logistic regression model, satisfaction with the ability to eat and with the appearance
of the teeth were found to be the principal influences on overall satisfaction with the oral
condition. Satisfaction with the ability to eat and the presence of difficulties eating are, in turn,
influenced by the number of teeth or contacts, various symptoms (mobile teeth, sensitivity),
periodontal disease and untreated dental caries as well as a number of socio-demographic
298

variables. The risk factors for dissatisfaction with aesthetics include the presence of anterior
spaces, a variety of socio-demographic variables and the presence of decayed or periodontally
involved teeth.
A population which is completely satisfied with its oral condition is probably an impossible
objective, but by identifying the factors which contribute to dissatisfaction, appropriate goals
and criteria for oral health can be identified.
The list of oral health goals for the elderly which are given include requirements for number
of teeth, contacts, anterior spaces, clinical disease, symptoms and satisfaction.
The goals identified are already out of reach for the majority of the current over 60 year olds,
even those in the 60-64 year old group, but would be an appropriate target for the present 30-
60 year olds in the UK as they age.
299

REFERENCES
300

Abdellatif, H.M. & Burt, B.A. (1987). An epidemiological investigation into the relative importance of ageand oral hygiene status as determinants of periodontitis. Journal of Dental Research; 66: 13-18.
Agerberg, G. & Carlsson, G.E. (1981). Chewing ability in relation to dental and general health. ActaOdontologica Scandinavica; 39: 147-153.
Ainamo, J., Barmes, D., Beagrie, G., Cutress, T., Martin, J. & Sardo-Infirri, J. (1982). Development of theWorld Health Organisation (WHO) community periodontal index of treatment needs (CPITN). InternationalDental Journal; 32: 281-291.
Albander, J.M., Rise, I., Gjermo, P. & Johansen, J.R. (1986). Radiographic quantification of alveolar bonelevel changes. A 2-year longitudinal study in man. Journal of Clinical Periodontology; 13: 195-200.
Altman, D.G. (1991). Practical Statistics for Medical Research. London: Chapman Hall.
Andrew, W. (1952). A comparison of age changes in man and in the rat. Journal of Gerontology; 7:178-190.
Andrews, F.M. (1981). Social indicators and health for all. Social Science and Medicine; 15C: 219-223.
Aukes, J.N.S.C., Käyser, A.F. & Felling, A.J.A. (1988). The subjective experience of mastication in subjectswith shortened dental arches. Journal of Oral Rehabilitation; 15: 321-324.
Axëll, T. (1987). Occurrence of leukoplakia and some other oral white lesions among 20333 adult Swedishpeople. Community Dentistry and Oral Epidemiology; 15: 46-5 1.
Baelum, V., Fejerskov, 0., Manji, F. & Wanzala, P. (1993a). Influence of CPITN partial recordings onestimates of prevalence and severity of various periodontal conditions in adults. Community Dentistry andOral Epidemiology; 21: 354-359.
Baelum, V., Manji, F., Fejerskov, 0. & Wanzala, P. (1993b). Validity of CPITN's assumptions ofhierarchical occurrence of periodontal conditions in a Kenyan population aged 15-65 years. CommunityDentistry and Oral Epidemiology; 21: 347-353..
Baldwin, D. (1980). Appearance and aesthetics in oral health. Community Dentistry and Oral Epidemiology;8: 244-256.
Banting, D.W. (1986). Epidemiology of root caries. Gerodontology; 5: 5-11.
BASCD (1991). Information needs for monitoring dental health and for planning local dental services.British Association for the study of Community Dentistry.
Bates, J.F., Elwood, P.C. & Foster, W. (1971). Studies relating mastication and nutrition in the elderly.Gerontologia Clinica; 13: 227-232.
Battistuzzi, P.G.F.C.M., Kayser, A.F. & Kanters, N. (1987). Partial edentulism, prosthetic treatment and oralfunction in a Dutch population. Journal of Oral Rehabilitation; 14: 549-555.
Baum, B.J. (1981). Evaluation of stimulated parotid saliva flow rate in different age groups. Journal ofDental Research; 60: 1292-1296.
Baxter, J.C. (1984). The nutritional intake of geriatric patients with varied dentitions. Journal of ProstheticDentistry; 51: 164-168.
Beck, J.D., Lainson, P.A., Field, H.M. & Hawkins, B.F. (1984). Risk factors for various levels of
301

periodontal disease and treatment needs in Iowa. Community Dentistry and Oral Epidemiology; 12: 17-22.
Beck, J.D., Kohout, F.J., Hunt, R.J. & Heckert, D.A. (1987). Root caries: physical, medical andpsychological correlates in an elderly population. Gerodontics; 3: 242-247.
Beighton, D., Hellyer, P.H., Lynch, E.J.R. & Heath, M.R. (1991). Salivary levels of mutans streptococci,lactobacilli, yeasts and root caries prevalence in non-institutionalised elderly dental patients. CommunityDentistry and Oral Epidemiology; 19: 302-307.
Ben-Aryeh, H., Miron, D., Szargel, R. & Gutman, D. (1984). Whole saliva secretion rates in old and younghealthy subjects. Journal of Dental Research; 63: 1147-1 149.
Berg, E. (1985). Periodontal problems associated with use of distal extension partial dentures - a matter ofconstruction? Journal of Oral Rehabilitation; 12: 369-379.
Bergman, B. & Carlsson, 0. (1972). Review of 54 complete denture wearers. Patients opinions after 1 yearof treatment. Acta Odontologica Scandinavica; 30: 399-414.
Bergman, B., Hugoson, A. & Olsson, C. (1982). Caries, periodontal and prosthetic findings in patients withremovable partial dentures: a ten year longitudinal study. Journal of Prosthetic Dentistry; 48: 506-514.
Bertram, U. (1967). Xerostomia: studies on salivary secretion. Acta Odontologica Scandinavica;25(Suppl.49).
Binnie, W.J., Cawson, R.A., Hill, G.B. & Soaper, A.E. (1972). Oral Cancer in England and Wales. Anational study of morbidity, mortality, curability and related factors. London: HMSO.
Bond, J. & Carsairs, V. (1982). Services for the elderly: a survey of the characteristics and needs of apopulation of 5000 old people. Scottish Health Service.
Buckley, R.A. & Crowley, M.J. (1984). A longitudinal study of untreated periodontal disease. Journal ofClinical Periodontology; 11: 523-530.
Budtz-Jorgensen, E. (1981). Oral mucosal lesions associated with the wearing of removable dentures.Journal of Oral Pathology; 10: 65-80.
Budtz-Jorgensen, E. & Bertram, U. (1970). Denture stomatitis I. The aetiology in relation to trauma andinfection. Acta Odontologica Scandinavica; 28: 7 1-92.
Budtz-Jorgensen, E., Luan, W.M., Holm-Pedesen, P. & Fejerskov, 0. (1985). Mandibular dysfunctionrelated to dental, occiusal and prosthetic conditions in a selected elderly population. Gerodontics; 1: 28-3 3.
Bulman, J.S., Richards, N.D., Slack, G.L. & Willcocks, A.J. (1968). Demand and need for dental care: Asocio-dental study. Oxford: Oxford University press.
Burgersdijk, R., Truim, G.J., Kalsbeck, H., Hof, M.A.v. & Mulder, J. (1991). Objective and subjective needfor cosmetic dentistry in the Dutch adult population. Community Dentistry and Oral Epidemiology; 19:6 1-63.
Carlos, J.P., Wolfe, M.D. & Kingman, A. (1986). The extent and severity index: a simple method for usein epidemiologic studies of periodontal disease. Journal of Clinical Periodontology; 13(5): 500-505.
Carlsson, G.E. (1984). The effect of age, the loss of teeth and prosthetic rehabilitation. International DentalJournal; 34: 93-97.
302

Carlsson, G.E., Hedegard, B. & Koivumaa, K.K. (1962). Studies in partial denture prosthesis.ffl. Alongitudinal study of mandibular partial dentures with double extension saddles. Acta OdontologicaScandinavica; 20: 95-119.
Chandler, J.A. & Brudvik, J.S. (1984). Clinical evaluation of patients eight to nine years after placementof removable partial dentures. Journal of Prosthetic Dentisitry; 51: 736-743.
Chauncey, H.H., Borken, U., Wayler, A., Feller, R.P. & Kapur, K.K. (1981). Parotid fluid composition inhealthy ageing males. Advances in Physiological Science; 28: 323-328.
Chauncey, H.H., Glass, R.L. & Alman, J.E. (1989). Dental caries. Principal cause of tooth extraction in aveteran population. Caries Research; 23: 200-205.
Chauncey, H.H., Muench, M.E., Kapur, K.K. & Wayler, A.H. (1984). The effect of the loss of teeth on dietand nutrition. International Dental Journal; 34: 98-104.
Chierici, G. & Lawson, L. (1973). Clinical speech considerations in prosthodontics: perspectives of theprosthodontist and speech pathologist. Journal of Prosthetic Dentistry; 29: 29.
Christen, A.G. (1983). Dentistry and the alcoholic patient. Dental Clinics of North America; 27 (2):341-361.
Cowan, C.G., Gregg, T.A. & Kee, F. (1992). Trends in the incidence of histologically diagnosed intra-oralsquamous cell carcinoma in Northern Ireland, 1975-89. British Dental Journal; 173: 23 1-233.
Crisp, A.H., Palmer, R.L. & Kalucy, R.S. (1976). How common is anorexia nervosa? A prevalence study.British Journal of Psychiatry; 128: 549-554.
Cushing, A.M., Sheiham, A. & Maizels, J. (1986). Developing socio-dental indicators - the social impactof dentaldisease. Community Dental Health; 3: 3-17.
Cutress, T.W., Powell, R.N. & Ball, M.E. (1982). Differing profiles of periodontal disease in two similarSouth Pacific Island populations. Community Dentistry and Oral Epidemiology; 10: 193-203.
Davis, P. (1976). Compliance structures and the delivery of health care: the case of dentistry. Social Scienceand Medicine; 10: 329-335.
Dc Kanter, RJ.A.M. (1990) Prevalence and etiology of craniomandibular dysfunction. An epidemiologicalstudy of the Dutch adult population. PhD, University of Nijmegen.
Dc Paola, Hyg, M.S., Soparkar, P.M. & Kent, R.L. (1989). Methodological issues relative to thequantification of root surface caries. Gerodontology; 8: 3-8.
Dc Paola, P.F. (1990). Measurement issue in the epidemiology of dental caries. In J. Bader (Eds.), Riskassessment in dentistry. Dental Ecology (pp. 19-26). Chapel Hill: University of North Carolina.
Dental Strategy Review Group (1981). Towards better dental health - guidelines for the future. DHSS.
Derry, A. & Bertram, U. (1970). A clinical survey of removable paprtial dentures after 2 years usage. ActaOdontologica Scandinavica; 28: 581.
Devlin, H. (1994). Replacement of mising molar teeth - a prosthodontic dilemma. British Dental Journal;176: 31-32.
303

Donachie, M.A. (1992). The dental health of the ageing population of Newcastle upon Tyne. MDS Thesis.Newcastle upon Tyne.
Douglass, C.W., Gillings, D., Sollecito, W. & Gammon, M. (1983). National trends in the prevalence andseverity of the periodontal diseases. Journal of the American Dental Association; 107: 403-412.
Drake, C.W. & Beck, J.D. (1993). The oral status of elderly removable partial denture wearers .Journal ofOral Rehabilitation: 20; 53-60
Eccies, J.D. (1982). Tooth surface loss from attrition, abrasion and erosion. Dental Update; 9: 373-381.
Eichner, K. (1955). Veber eine Gruppeneinteilung des Luchengebisses fur die Prothetik. Zahnarztlichezeitung; 10: 1831-1834.
Ekfeldt, A., Hugosen, A., Bergendal, T. & Helkimo, M. (1990). An individual tooth wear index and ananalysis of factors correlated to incisal and occiusal wear in an adult Swedish population. Acta OdontologicaScandinavica; 48: 343-349.
El Ghamrawy, E. (1976). Quantitative changes in dental plaque formation related to removable partialdentures. Journal of Oral Rehabilitation; 3: 115-120.
Ericson, S. (1968). The parotid gland in subjects with and without rheumatoid arthritis. Acta Radiologica;275 (Suppl).
Ervin, J.L. & Bucher, E.M. (1944). Prevalence of root exposure and abrasion among dental patients. DentalItems of Interesr, 66: 760.
Ettinger, R.L. (1973). Diet, nutrition and masticatory ability in a group of elderly edentulous subjects.Australian Dental Journal; 18: 12-19.
Farrell, J. (1957). Partial dentures in the restoration of masticatory efficiency. Dental Practitioner and theDental Record; 7: 375-379.
Farrell, J.H. (1956). The effect of mastication on the digestion of food. British Dental Journal; 100:149-155.
ED! (1982). FDI-WHO global goals for oral health by the year 2000. International Dental Journal; 32:74-77.
Finch, H., Keegan, J., Ward, K. & Sanyal Sen, B. (1988). Barriers to the receipt of dental care. BritishDental Association.
Fiske, J., Gelbier, S. & Watson, R.M. (1990). Barriers to dental care in an elderly population resident inan inner city area. Journal of Dentistry; 18: 236-242.
Floystrand, F., Ambjomsen, E., Valderhaug, J. & Norheim, P.W. (1982). Oral status and acceptance ofdental services among some elderly persons in Oslo. Acta Odontologica Scandinavica; 40: 1-8.
Fox, P.C., Van der Yen, P.F., Sonies , B.C., Weiffenbach, J.M. & Baum, B.J. (1985). Xerostoniia:evaluation of a symptom with increasing significance. Journal of the American Dental Association; 110:5 19-525.
Eu, D.R. (1940). Habitual abrasion of the central incisors. Journal of the Canadian Dental Association; 6:236-237.
304

Fure, S. & Zickert, I. (1990). Prevalence of root surface caries in 55, 65 and 75 year old Swedishindividuals. Community Dentistry and Oral Epidemiology; 18: 100-105.
Gilbert, G.H., Heft, M.W. & Duncan, R.P. (1993). Mouth Dryness as reported by older Floridans.Community Dentistry and Oral Epidemiology; 21: 390-397.
Goodson, J.M., Tanner, A.C.R., Haffajee, A.D., Sornberger, G.C. & Socransky, S.S. (1982). Patterns ofprogression and regression of advanced destructive periodontal disease. Journal of Clinical Periodontology;9: 472-481.
Grant, A.A. & Johnson, W. (1983). An introduction to Removable Denture Prosthetics. Edinburgh: ChurchillLivingstone.
Gray, P.G., Todd, J.E., Slack, G.L. & Bulman, J.S. (1970). Adult dental health in England and Wales in1968. London: HMSO.
Grbic, J.T. & Lamster, I.B. (1992). Risk indicators for future clinical attachment loss in adult periodontitis.Tooth and site variables. Journal of Periodontology; 63: 262-269.
Grbic, J.T., Lamster, I.B., Celenti, R.S. & Fine, J.B. (1991). Risk indicators for future clinical attachmentloss in adult periodontitis. Patient variables. Journal of Periodontology; 62: 322-329.
Gregg, T.A., Cowan, C.G. & Kee, F. (1992). Trends in the relative frequency of histologically diagnosedepithelial dysplasia and intra-oral carcinoma in Northern Ireland 1975-1989. British Dental Journal; 173:234-236.
Griffiths, G.S., Wilton, J.M.A., Curtis, M.A., Maiden, M.FJ., Gullet, I.R., Wilson, D.T., Sterne, J.A.C. &Johnson, N.W. (1988). Detection of high risk groups and individuals for periodontal diseases. Clinicalassessment of the periodontium. Journal of Clinical Periodontology; 15: 403-410.
Gunne, H.J. (1985a). Masticatory efficiency and dental state. A comparison between two methods. ActaOdontologica Scandinavica; 43: 139-146.
Gunne, H.J. (1985b). The effect of removable partial dentures on mastication and dietary intake. ActaOdontologica Scandinavica; 43: 269-278.
Gustafsson, B.E., Quensel, C.E., Lanke, L.S., Lundquist, C., Grabinen, H., Bonow, B.E. & Krasse, B.(1954). The Vipeholm dental caries study: the effect of different levels of CHO intake on caries activityin 436 individuals for 5 years. Acta Odontologica Scandinavica; 11: 232-264.
Gutman, D. & Ben Aryeh, M. (1974). The influence of age on saliviary content and rate of flow.International Journal of Oral Surgery; 3: 314-317.
Halazonetis, T.D., Haffajee, A.D. & Socransky, S.S. (1989). Relationship of clinical parameters toattachment loss in subsets of subjects with destructive periodontal diseases. Journal of ClinicalPeriodontology; 16: 563-568.
HaIling, A., Bengtsson, C. & Lenner, R.A. (1988). Diet in relation to number of remaining teeth in apopulation of middle-aged women in Gothenburg, Sweden. Swedish Dental Journal; 12: 39-45.
Hand, J.S., Beck, J.D. & Turner, K.A. (1987). The prevalence of occiusal attrition and considerations fortreatment in a non-institutionalised elderly population. Special Care Dentistry; Sept-Oct: 202-206.
Hand, J.S., Hunt, R.J. & Reinhardt, J.W. (1986). The prevalence and treatment implications of cervicalabrasion in the elderly. Gerodontics; 2: 167-170.
305

Haraidson, T. & Carlsson, G.E. (1979). Chewing efficiency in patients with osseointegrated implant bridges.Swedish Dental Journal; 3: 183-191.
Hartsook, E.I. (1974). Food selection, dieitary adequacy and related dental problems of patients with dentalprostheses. Journal of Prosthetic Dentistry; 32: 32-40.
Heath, M.R. (1972). Dietary selection of elderly persons related to dental state. British Dental Journal; 132:145-148.
Heft, M.W. & Baum, B.J. (1984). Unstimulated and stimulated parotid flow rates in individuals of differentages. Journal of Dental Research; 63: 1182-1185.
Heinrich, R., Heinrich, J. & Kunzel, W. (1990). Wird die Wurzelkaries zu einen betreuungsproblem derzukunft? Zahn-mund-Kieferheilkd; 78: 253-257.
Helkimo, E., Carisson, G.E. & Helkimo, M. (1978). Chewing efficiency and state of dentition. Amethodologic study. Acta Odontologica Scandinavica; 36: 33-41.
Helkimo, M. (1974). Studies on function and dysfunction of the masticatory system.11. Index for anamnesticand clinical dysfunction and occlusal state. Svensk Tandlakare Tidskrift; 67: 101-119.
Heloe, B. & Heloe, L.A. (1978). The occurrence of TMJ disorders in an elderly population as evaluatedby recording of "subjective' and 'objective" symptoms. Acta Odontologica Scandinavica; 36: 3-9.
Heyinck, J.W. & Schaub, R.M.H. (1986). Denture problems and the quality of life in a Dutch elderlypopulation. Community Dentistry and Oral Epidemiology; 14: 193-194.
Hindle, J. & Nally, F. (1991). Oral cancer: A comparative study between 1962-67 and 1980-84 in Englandand Wales. British Dental Journal; 170: 15-20.
Hirsch, R.S. & Clarke, N.G. (1993). Pulpal disease and bursts of periodontal attachment loss. InternationalEndodontic Journal; 26: 362-368.
Hix, J.O. & O'Leary, T.J. (1976). The relationship between cemental caries, oral hygiene status andfermenable carbohydrate intake. Journal of Periodontology; 47: 398-404.
Hoad-Reddick, G., Grant, A.A. & Griffiths, C.S. (1987). The dental health of an elderly population in NorthWest England: results of a survey undertaken in the Halton Health Authority. Journal of Dentistry; 15:139-146.
Hof, M.A.v., Truim, G.J., Kalsbeck, H., Burgersdijk, R.C.W., Visser, R.S.H. & Heling, G. (1991). Theproblem of participation in the Dutch National Survey. Community Dentistry and Oral Epidemiology; 19:57-60.
Holloway, PJ., Mellanby, M. & Stewart, R.J.C. (1958). Fruit drinks and tooth erosion. British DentalJournal; 104: 305-309.
Hoppenbrouwers, P.M.M., Driessens, F.L.M. & Borggeven, J.M.P.M. (1987). The demineralisation ofhuman dental roots in the presence of fluoride. Journal of Dental Research; 66: 1370-1374.
Howden, G.F. (1971). Erosion as the presenting symptom in hiatus hernia. British Dental Journal; 131:455-456.
Hugosen, A. & Jordan, T. (1982). Frequency distribution of individuals aged 20-70 years according toseverity of periodontal disease. Community Dentistry and Oral Epidemiology; 10: 187-192.
306
Hugosen, A., Bergendal, T., Ekfeldt, A. & Helkimo, M. (1988). Prevalence and severity of incisal andocciusal tooth wear in an adult Swedish population. Acra Odontologica Scandinavica; 46: 255-265.
Hugosen, A., Laurell, L. & Lundgren, D. (1992). Frequency distribution of individuals aged 20-70 yearsaccording to severity of periodontal disease experience in 1973 and 1983. Journal of ClinicalPeriodontology; 19: 227-232.
Hunt, R.J. (1986). Percent agreement, Pearson's correlation, and Kappa as measures of Inter-examinerReliability. Journal of Dental Reaearch; 65: 128-130.
Hunt, R.J., Eldredge, J.B. & Beck, J.D. (1989). Effect of residence in a fluoridated community on theincidence of coronal and root caries in an older adult population. Journal of Public Health Dentistry; 49;3: 138-141.
Isaacs, B. & Neville, Y. (1976). The needs of old people: 'interval' as a method of measurement. BritishJournal of Preventive and Social Medicine; 30: 79-85.
Isidor, F. & Budz-Jorgensen, E. (1987). Periodontal conditions following treatment with cantilever bridgesor removable partial dentures in geriatric patients. A 2-year study. Gerodontics; 3: 117-121.
Jakobsen, J.R. & Hunt, R.J. (1990). Validation of oral status indicators. Community Dental Health; 7:279-284.
Jarvinen, V., Meurman, J.H., Hyvarinen, H., Rytomaa, I. & Muriomaa, H. (1988). Dental erosion and uppergastrointestinal disorders. Oral Surgery, Oral Medicine and Oral Pathology; 65: 298-303.
Jemt, T., Hedegard, B. & Wickberg, K. (1983). Chewing patterns before and after treatment with completemaxillary and bilateral distal extension mandibular removable partial dentures. Journal of ProstheticDentistry; 50: 566-570.
Jiffrey, M.T.M. (1983). Variations in the particles produced at the end of mastication in subjects withdifferent types of dentition. Journal of Oral Rehabilitation; 10: 357-362.
Johnson, G., Barenthin, L. & Westphal, P. (1984). Mouth dryness among patients in long-term hospitals.Gerodontology; 3: 197-203.
Johnson, N.W., Griffiths, G.S., Wilton, J.M.A., Maiden, M.F.J., Curtis, M.A., Gillet, I.R., Wilson, D.T. &Siene, J.A.C. (1988). Detection of high-risk groups and individuals for periodontal diseases. Journal ofClinical Periodontology; 15: 276-282.
Johnson, N.W. & Warnakulasuriya, K.A.A.S. (1991). Oral cancer: is it more common than cervical. BritishDental Journal; 170: 170-17 1.
Jordan, H.V. (1986). Microbial etiology of root surface caries. Gerodontology; 5: 13-20.
Kalk, W., Kayser, A.F. & Witter, DJ. (1993). Needs for tooth replacement. International Dental Journal;43: 41-49.
Kandelman, D. & Lepage, Y. (1982). Demographic, social and cultural factors influencing the elderly toseek dental treatment. International Dental Journal; 32: 360-370.
Katz, R.V. (1980). Assessing root caries in populations. The evolution of the root caries index. Journal ofPublic Health Dentistry; 40: 7-16.
Katz, R.V. (1984). Development of an index for the prevalence of root caries. Journal of Dental Research;
307

63: 814-818.
Katz, R.V. (1986). The clinical identification of root caries. Gerodontology; 5: 21-24.
Katz, R.V., Hagen, S.P., Chilton, N.W. & Mumma, R.D. (1982). Prevalence and intra-oral distribution ofroot caries in an adult population. Caries Research; 16: 265-271.
Kay, E.J. & Blinkhorn, A.S. (1986). The reasons underlying the extraction of teeth in Scotland. BritishDental Journal; 160: 287-290.
Kayser, A. (1981). Shortened dental arches and oral function. Journal of Oral Rehabilitation.; 8: 457-462.
Kayser, A.D. & Witter, D.J. (1985). Oral functional needs and its consequences for dentulous older people.Community Dental Health; 2: 285-291.
Kayser, A.F. (1990). How much reduction of the dental arch is functionally acceptable for the ageingpatient. International Dental Journal; 40: 183-188.
Kayser, A.F., Meeuwissen, R. & Meeuwissen, J.H. (1990). An occiusal concept for dentate geriatricpatients. Community Dentistry and Oral Epidemiology; 18: 319.
Kennedy, E. (1942). Partial Denture Construction. New York: Dental Items of Interest Publishing Companyinc.Kitamura, M., Kiyak, H.A. & Mulligan, K. (1986). Predictors of root caries in the elderly. CommunityDentistry and Oral Epidemiology; 14: 34-38.
Kitchen, P.C. (1941). Prevalence of tooth root exposure and the relation of the extent of such exposure tothe degree of abrasion in different age classes. Journal of Dental Research; 20: 565-581.
Kreher, J.M., Graser, G.N., Handelman, S.L. & Eisenberg, A.D. (1991). Oral yeasts, mucosal health, anddrug use in an elderly denture-wearing population. Special Care Dentistry; 11: 222-226.
Landis, J.R. & Koch, G.C. (1977). The measurement of observer agreement for categorical data. Biometrics;33: 159-174.
Lappalainen, R., Koskenranta-Wuorinen, P. & Markkanen, H. (1987). Periodontal and cariological statusin relation to different combinations of removable dentures in elderly men. Gerodontics; 3: 122-124.
Lappalainen, R. & Nyyssonen, V. (1987). Self-assessed chewing ability of Finnish adults with removabledentures. Gerodontics; 3: 238-241.
Lindhe, J., Haffajee, A.D. & Socransky, S.S. (1983). Progression of periodontal disease in adult subjectsin the absence of periodontal therapy. Journal of Clinical Periodontology; 10: 433-442.
Lindhe, J. & Nyman, S. (1984). Long-term maintenance of patients treated for advanced periodontal disease.Journal of Clinical Periodontology; 11: 504-514.
Listgarten, M.A., Schifter, C.C. & Layer, L. (1985). 3-year longitudinal study of the periodontal status ofan adult population with gingivitis. Journal of Clinical Periodontology; 12: 225-238.
Little, W., Fowler, H.W. & Coulson, J. (1980). The Shorter Oxford English Dictionary (Third ed.). Oxford:Clarendon Press.
Locker, D. (1988). Measuring oral health: A conceptual framework. Community Dental Health; 5: 3-18.
308

Locker, D. & Leake, J.L. (1993). Risk indicators and risk markers for periodontal disease experience inolder adults living independently in Ontario, Canada. Journal of Dental Research; 72: 9-17.
Locker, D., Slade, G.D. & Leake, J.L. (1989). Prevalence of the factors associated with root decay in olderadults in Canada. Journal of Dental Research; 68 (5): 768-772.
Löe, H., Anerud, A., Boysen, H. & Morrison, E. (1986). Natural history of periodontal disease in man.Rapid, moderate and no loss of attachment in Sri Lankan laborers 14-46 years of age. Journal of ClinicalPeriodontology; 13: 431-440.
Löe, H., Anerud, A., Boysen, H. & Smith, M. (1978). The natural history of periodontal disease in man.Journal of Periodontology; 49: 607-620.
Lovdal, A., Arno, A., Schei, 0. & Waerbaug, J. (1961). Combined effect of subgingival scaling andcontrolled oral hygiene on the incidence of gingivitis. Acta Odontologica Scandinavica; 19: 537-555.
Luke, D.A. & Lucas, P.W. (1985). Chewing efficiency in relation to occlusal wear and other variations inthe natural human dentition. British Dental Journal; 159: 401-403.
MacEntee, M.I., Dowell, J.B. & Scully, C. (1988). Oral health concerns of an elderly population in England.Community Dentistry and Oral Epidemiology; 16: 72-74.
MacEntee, M.I. & Scully, C. (1988). Oral disorders and treatment implications in people over 75 years.Community Dentistry and Oral Epidemiology; 16: 271-273.
Mahmood, W.A., Watson, CJ., Ogden, A.R. & Hawkins, R.V. (1992). Use of image analysis in determiningmasticatory efficiency in patients presenting for irrunediate dentures. International Journal of
Prosthodontics; 5 (4): 359-366.
Maizels, J., Maizels, A. & Sheiham, A. (1991). Dental disease and health behaviour: the development ofan interaction model. Community Dental Health; 8: 311-321.
Maizels, J., Maizels, A. & Sheiham, A. (1993). Sociodental Approach to the identification of dentaltreatment-need groups. Community Dentistry and Oral Epidemiology; 21: 340-346.
Manderson, R.D. & Ettinger, R.L. (1975). Dental status of the institutionalised elderly population ofEdinburgh. Community Dentistry and Oral Epidemiology; 3: 100-107.
Manji, F., Fejerskov, 0. & Baelum, V., (1989). Pattern of dental caries in an adult rural population. CariesResearch; 23(i): 55-62.
Manly, R.S. & Braley, L.C. (1950). Masticatory performance and efficiency. Journal of Dental Research;29: 448-462.
Marcenes, W.S. & Sheiham, A. (1993). Composite indicators of dental health: functioning teeth and thenumber of sound-equivalent teeth (T-Health). Community Dentistry and Oral Epidemiology; 21: 374-378.
Martin, J., Meltzer, H. & Elliot, D. (1988). Disabled adults: Services, transport and employment. London:HMSO.
Martinello, B.P. (1976). Oral health assessment of residency of a Chatham, Ontario home for the aged.Journal of the Canadian Dental Association; 42: 405-408.
Mellberg, J.R. (1986). Demineralisation and Remineralisation of root surface caries. Gerodontology; 5:25-31.
309
Merelie, DL. & Heyman, B. (1992). Dental needs of the elderly in residental care in Newcastle upon Tyneand the role of former carers. Community Dentistry and Oral Epidemiology; 20: 106-111.
Miller, W.A. (1987). Does oral health influence quality of life? Gerodontics; 3: 99.
Miyazaki, H., Pilot, T., Leclercq, M.H. & Barnes, D.E. (1991). Profiles of periodontal conditions in adultsmeasured by CPITN. International Dental Journal; 41: 74-80.
Mumma jr, R.D. & Quinton, K. (1970). Effect of masticatory efficiency on the occurrence of gastricdistress. Journal of Dental Research; 49: 69.
Murray, J.J. (1971). Adult dental health in fluoride and non-fluoride areas - mean DMF values by age.British Dental Journal; 131: 392-395.
Myllarniemi, M. & Saari, I. (1985). A new type of sliding hiatus hernia. Annals of Surgery; 202: 159-161.
Narhi, T.O., Meerman, J.H., Anaimo, A. & Nevalainen, J.M. (1992). Association between salivary flow rateand the use of systemic medication among 76-81 and 86 year old inhabitants of Helsinki, Finland. Journalof Dental Research; 71: 1875-1880.
National Health Service, England and Wales. (1992). The National Health Service (General Dental Services)Regulations 1992. (Statutory instruments, no.66 1). London: HMSO.
Navazesh, M., Mulligan, R.A., Kipriis, V., Denny, P.A. & Denny, P.C. (1992). Comparison of whole salivaflow rates and mucin concentrations in healthy caucasians young and aged adults. Journal of DentalResearch; 71: 1275-1278.
Neill, DJ. & Phillips, H.J.B. (1970). The masticatory performance, dental state and dietary intake of agroup of elderly army pensioners. British Dental Journal; 128: 581-585.
Newton, A.V. (1962). Denture sore mouth. British Dental Journal; 112: 357-360.
Newton, J.P., Abel, R., Robertson, E.M. & Yemm, R. (1987). Changes in human masseter and medialpterygoid muscles with age: a study by computed tomography. Gerodontics; 3: 151-154.
Niessen, L.C. & Weyant, R.J. (1989). Causes of tooth loss in a veteran population. Journal of Public HealthDentistry; 49: 19-23.
NIH (1987). Oral health of United States adults. National findings. Betheseda: NIH publication number87-2868.Norusis, M.J. (1990). Spss Advanced Statistics; Users Guide. Chicago: SPSS inc.
O'Mullane, D. & Whelton, H. (1992). Oral health of Irish adults 1989-1990. The Stationery Office, Dublin.
Okamoto, H., Yoneyama, T., Lindhe, J., Haffajee, A. & Socransky, S. (1988). Methods of evaluatingperiodontal disease data in epidemiological research. Journal of Clinical Periodontology; 15: 430-439.
Oosterhaven, S.P., Westert, G.P., Schaub, R.M.H. & But, A.van der (1988). Social and Psychologicimplications of missing teeth for chewing ability. Community Dentistry and Oral Epidemiology: 16; 79-82.
OPCS (1980). Classification of occupations and coding index. London: HMSO.
OPCS (1991a). Tables of vital statistics. Population Trends; 63: 45-72.
OPCS (1991b). World Population Trends and Projections. Population Trends; 63: 36-39.
310

OPCS (1993). National popu;ation projections: 1991 based. OPCS Monitor, PP2 93/1: 1-12.
Orr, S., Linden, G.J. & Newman, H.N. (1992). The effect of partial denture connectors on gingival health.Journal of Clinical Periodontology; 19 (8): 589-594.
Osterberg, T., Birkhed, D., Johansson, C. & Svanborg, A. (1992). Longitudinal study of stimulated wholesaliva in an elderly population. Scandinavian Journal of Dental Research; 100: 340-345.
Osterberg, T. & Carisson, G.E. (1979). Symptoms and signs of mandibular dysfunction in 70-year old menand women in Gothenberg, Sweden. Community Dentistry and Oral Epidemiology; 7: 315-331.
Osterberg, T., Landahl, S. & Hedegard, B. (1984). Salivary flow saliva, pH and buffering capacity in 70year old men and women. Journal of Oral Rehabilitation; 11: 157-170.
Osterberg, T., Mellstrom, D. & Sundh, V. (1990). Dental health and functional ageing. Community Dentistryand Oral Epidemiology; 18: 313-318.
Osterberg, T. & Steen, B. (1982). Relationship between dental state and dieitary intake in 70-year old malesand females in Gothenburg, Sweden: A population study. Journal of Oral Rehabilitation; 9: 509-521.
Papapanou, P.N., Lindhe, J., Steret, J.D. & Eneroth, L. (1991). Considerations on the contribution of ageingto loss of periodontal tissue support. Journal of Clinical Periodontology; 18: 611-615.
Papapanou, P.N., Wennstrom, J.L. & Grondahi, K. (1988). Periodontal status in relation to age and toothtype. A cross sectional study. Journal of Clinical Periodontology; 15: 469-478.
Papapanou, P.N., Wennstrom, J.L. & Grondahi, K. (1989). A 10 year retrospective study of periodontaldisease progression. Journal of Clinical Periodontology.; 16: 403-411.
Papas, A.S., Joshi, A. & MacDonald, S.L. (1993). Caries prevalence in xerostomic individuals. Journal ofthe Canadian Dental Association; 59: 171-179.
Parvinen, T. & Larmas, M. (1982). Age dependency of stimulated salivary flow rate pH and Lactobacillusand yeast concentrations. Journal of Dental Research; 61: 1052-1055.
Pavone, B.W. (1985). Bruxism and its effect on natural teeth. Journal of Prosthetic Dentistry; 53: 692-696.
Pedersen, W., Schubert, M., Izutsu, K., Mersai, T. & Truelove, E. (1985). Age dependent decreases inhuman submandibular gland flow rates ad measured under resting and post-stimulation conditions. Journalof Dental Research; 64: 822-825.
Pilot, T. & Miyazald, H. (1991). Periodontal conditions in Europe. Journal of Clinical Periodontology.; 18:353-357.
Pilot, T., Miyazaki, H., Leclercq, M-H. & Barmes, D.E. (1992). Profiles of periodontal conditions in olderage cohorts measured by CP1TN. International Dental Journal; 42: 23-30.
Pindborg, J.J. (1977). Epidemiology and public health aspects of diseases of the oral mucosa. Journal ofDental Research; 56: C14-C19.
Poliman, L., Berger, F. & Poliman, B. (1987). Age and dental abrasion. Gerodontics; 3: 94-96.
Poynter, M.E. & Wright, P.S. (1990). Tooth wear and some factors influencing its severity. RestorativeDentistry; 6: 8-11.
311
Pritchard, J.R. & Laws, A.J. (1984). Gingival crevice depth. I Predictability of probing deepest points.Australian Dental Journal; 29: 404-410.
Pullinger, A.G., Seligman, D.A. & Gornbein, J.A. (1993). A multiple logistic regression analysis of the riskand relative odds of temporomandibular disorders as a function of common occlusal features. Journal of
Dental Research; 72: 968-979.
Ranta, K., Tuominen, R. & Paunio, I. (1987). Perceived oral health status and abiliity to chew among anadult Finnish population. Gerodontics; 3: 136-139.
Reich, E. & Hiller, K.A. (1993). Reasons for tooth extraction in the western states of Germany. CommunityDentistry and Oral Epidemiology; 21: 379-383.
Reisine, S. (1981). Theoretical considerations in formulating sociodental indicators. Social Science andMedicine; 15A: 745-750.
Reisine, S. (1985). Dental health and public policy: The social impact of dental disease. American Journalof Public Health; 75: 27-31.
Reisine, S.T., Fertig, J., Weber, J. & Leder, S. (1989). Impact of dental conditions on patients quality oflife. Community Dentistry and Oral Epidemiology; 17: 7-10.
Reisine, S.T. & Weber, J. (1989). The effects of TMJ disorders on patients quality of life. CommunityDental Health; 6: 257-270.
Ripa, L.W. & Leske, G.S. (1986). Introduction: Root surface caries symposium. Gerodontology; 5: 3-4.
Rissin, L., House, J.E., Conway, C., Loftus, E.R. & Chauncey, H.H. (1979). Effect of age and removablepartial dentures on gingivitis and periodontal disease. Journal of Prosthetic Dentistry; 42: 2 17-223.
Robb, N.D. (1992) Epidemiological studies of tooth wear. PhD, London.
Robb, N.D. & Smith, B.G.N. (1990). Prevalence of pathological tooth wear in patients with chronicalcoholism. British Dental Journal; 169: 367-369.
Robb, N.D. & Smith, B.G.N. (1992). The influence of missing posterior teeth on anterior tooth wear indental attenders. Journal of Dental Research; 71 (special issue): 625 (abstract 881).
Rodrigues-011eros, A. (1947). Gastritis in the toothless. Review of Gastroenterology; 14: 180.
Rutzen, S. (1973). The social importance of orthodontic rehabilitation. Journal of Health and SocialBehaviour, 14: 233-238.
Schou, L. & Eadie, D. (1991). Qualitative study of oral health norms and behaviour among elderly peoplein Scotland. Community Dental Health; 8: 53-58.
Schroeder, C. (1972). An evaluation of the long term benefits of dental treatment for dento-facialhandicapped children in Colorado. Journal of the Colorado Dental Association; 50: 17-20.
Scott, J. (1977a). Quantitative age changes in the histological structure of human sub-mandibular salivaryglands. Archives of Oral Biology; 22: 221-227.
Scott, J. (1977b). A morphometric study of age changes in the histology of the ducts of human salivaryglands.Archives of Oral Biology; 22: 243-249.
312

Scott, J. (1980). Qualitative and quantitative observations on the histology of human labial salivary glandsobtained post-mortem. Journal Biologie Buccale; 8: 187-200.
Scully, C., Malaimos, D., Levers, B.G.H., Porter, S.R. & Prime, S.S. (1986). Sources and patterns ofreferrals of oral cancer: role of the general practitioner. British Medical Journal; 293: 599-601.
Sheiham, A. (1990). Dentistry for an ageing population: responsibilities and future trends. Dental Update;17: 70-76.
Sheiham, A., Maizels, J. & Maizels, A. (1987). New composite indicators of dental health. CommunityDental Health; 4: 407-414.
Sheiham, A. & Rosenouer, L.M. (1992). Dental impacts and dental satisfaction. Journal of Dental Research;71 (Special issue): 668.
Sirus, W. & Prescott, RJ. (1985). Relation between dentition and dyspetic disorders. British MedicalJournal; 290: 115.
Smith, B.G.N. & Knight, J.K. (1984a). A comparison of patterns of tooth wear with aetiological factors.British Dental Journal; 157: 16-19.
Smith, B.G.N. & Knight, J.K. (1984b). An index for measuring the wear of teeth. British Dental Journal;156: 435-438.
Smith, B.G.N. & Robb, N.D. (1989). Dental erosion in patients with chronic alcoholism. Journal ofDentistry; 17: 219-221.
Smith, C.J. (1989). Oral cancer and precancer; background epidemiology and aetiology. British DentalJournal; 167: 377-383.
Smith, J. & Sheiham, A. (1979). How dental conditions handicap the elderly. Community Dentistry andOral Epidemiology; 7: 305-3 10.
Smith, J.M. (1979). Oral and dental discomfort - a necessary feature of old age. Age and Ageing; 8: 25-31.
Smith, J.M. & Sheiham, A. (1980a). Dental treatment needs and demands of an elderly population inEngland. Community Dentistry and Oral Epidemiology; 8: 360-364.
Smith, J.M. & Sheiham, A. (1980b). Dental treatment needs and demands of an elderly population inEngland. Community Dentistry and Oral Epidemiology; 8: 360-364.
Sneder, G.W. & Cochran, W.G. (1967). Statistical methods (sixth ed.). Ames, Iowa: Iowa State UniversityPress.Socransky, S., Haffajee, A.D., Goodson, J.M. & Lindhe, 3. (1984). New concepts of destructive periodontaldisease. Journal of Clinical Periodontology; 11: 21-32.
Srisilapan, P., Hunt, R.J. & Whitehill, J.M. (1985). Denture problems and prosthetic needs in anon-institutionalised elderly population. Journal of Dental Research; 6: 1312.
Stamm, J.W., Banting, D.W. & Imrey, P.B. (1990). Adult root caries survey of two similar communitieswith contrasting natural water fluoride levels. Journal of the American Dental Association; 120: 143-149.
Stelling, E. & Gustafsson, G. (1952). Experimental dental caries in animals. Odontologisk Revy.; 60: 27.
Thines, T., Karuza, J. & Miller, W.A. (1987). Oral health impact on quality of life: methodological and
313

conceptual concerns. Gerodontics; 3:3: 100-102.
Thompson, J. (1987). Ageing of the population: contemporary trends and issues. Population Trends; 50:18-22.
Thompson, W.M. (1990). Root surface caries - an overview of aetiology, pathology, prevention andmanagement. New Zealand Dental Journal; 86: 4 - 9.
Thorselius, I., Emilson, C.G. & Osterberg, T. (1988). Salivary conditions and drug consumption in olderage groups of elderly Swedish individuals. Gerodontics; 4: 66-70.
Todd, J.E. & Lader, D. (1991). Adult dental health 1988 United Kingdom. London: HMSO.
Todd, J.E. & Walker, A.M. (1980). Adult dental health. Volume 1, England and Wales 1968-1978. London:HMSO.
Todd, J.E., Walker, A.M. & Dodd, P. (1982). Adult dental health. Volume 2, UK 1978. London: HMSO.
Tuominen, R., Ranta, K. & Paunio, I. (1988). Wearing of removable partial dentures in relation to dentalcaries. Journal of Oral Rehabilitation; 15: 515-520.
Van der Velden, U. (1984). Effect of age on the periodontium. Journal of Clinical Periodontology; 11:281-294.
Vehkalhati, M., Paunio, I.K., Nyyssonen, V. & Aromaa, J.A. (1991). Suomalaisten aikuisten suunterveysja siihenvaikuttavat tekijat. (Oral Health in the adult Finnish population and associated factors.). Helsinkiand Turku: Kansanelakelaitoksen Jjulkaisuja AL:34.
Vehkalhati, M.M. & Paunio, 1K. (1988). Occurrence of root caries in relation to dental health behavior.Journal of Dental Research; 67: 911-914.
Vigild, M. (1987). Oral mucosal lesions among institutionalised elderly in Denmark. Community Dentistryand Oral Epidemiology; 15: 309-3 13.
Wallace, M.C., Retief, D.H. & Bradley, E.L. (1988). Prevalence of root caries in a population of olderadults. Gerodontics; 4: 84-89.
Waterhouse, J., Muir, C.S., Shanmugaratnam, K. & Powell, J. (1982). Cancer incidence in five continents.Lyon: IARC.
Watson, I.B. & Tulloch, E.N. (1985). Clinical assessment of cases of tooth surface loss. British DentalJournal; 159: 144-148.
Wayler, A.H., Muench, M.E., Kapur, K.K. & Chauncey, M.H. (1984). Masticator)' performance and foodacceptability in persons with removable partial dentures, full dentures and intact natural dentition. Journalof Gerontology; 39;3: 284-289.
White, K.L. (1974). Comtemporary epidemiology. International Journal of Epidemiology; 3: 295-303.
WHO (1980). Guide to epidemiology and diagnosis of oral mucosal diseases and conditions. CommunityDentistry and Oral Epidemiology; 8: 1-26.
WHO (1982). A review of current recommendations for the organisation and administration of communityoral health services in Northern and Western Europe. WHO regional office for Europe, Copenhagen.
314

WHO (1986). Country profiles on oral health in europe 1986. WHO Regional Office for EuropeCopenhagen.
WHO (1987). Oral health surveys, basic methods (3rd edition). Geneva: WHO.
WHO (1993). Recent advances in Oral Health. WHO, Geneva.
Wilson, M.C. (1991) An investigation of factors affecting dental care for dentate older people. PhD,Manchester.
Witter, D.J., Cramwinckel, A.B., van Rossum, G.M.J.M. & Kayser, A.F. (1990). Shortened dental archesand masticatory ability. Journal of Dentistry; 18: 185-189.
Witter, D.J., de Haan, A.FJ., Kayser, A.F. & van Rossum, G.MJ.M. (1992). Shortened dental arches andperiodontal support. Journal of Oral Rehabilitation; 19: 203-212.
Witter, D.J., van Eleren, P. & Kayser, A.F. (1987). Migration of teeth in shortened dental arches. Journalor Oral Rehabilitation; 14: 321-329.
Witter, DJ., van Elteren, P. & Käyser, A.F. (1988). Signs and symptoms of mandibular dysfunction inshortened dental arches. Journal of Oral Rehabilitation; 15: 413-420.
Witter, D.J., van Elteren, P., Kayser, A.F. & van Rossum, G.M.J.M. (1990). Oral comfort in shorteneddental arches. Journal of Oral Rehabilitation; 17: 137-143.
Witter, D.J., van Elteren, P., Kayser, A.F. & van Rossum, M.J.M. (1989). The effect of removable partialdentures on oral function in shortened dental arches. Journal of Oral Rehabilitation; 16: 27-33.
Wright, P.S., Hellyer, P.M., Beighton, D., Heath, M.R., Lynch, E. (1992). Relationship of removable partialdenture use to root caries in an older population. International Journal of Prosthodontics; 5: 39-46.
Yemm, R., Newton, J.P. & Lewis, G.R. (1985). Age changes in human muscle performance. In S. J. W.Lisney & B. Matthews (Eds.), Current Topics in oral Biology (pp. 17-25).
315
APPENDICES
316

Appendix 1
Letter sent to all General Medical Practitioners from whose lists the sample wasdrawn
317
UNIVERSITY OFNEWCASTLE UPON TYNE
Appendix 1
The Dental School
Framlington PlaceThe University
Newcastle upon Tyne NE2 4BW
Dean of DentistryProfessor Roy Storer
G.P. nameAddress
Dear (name)
The Dental Status, Needs and Demands of the Elderly inThree Different Communities
I am writing to you as a medical practitioner in Salisbury to inform you of thisimportant study. The study has been funded by the Department of Health as part of itsPrimary Health Care Initiative. It is being conducted by a team of investigators from theUniversity of Newcastle upon Tyne assisted by dental officers from the community dentalservice in each area. Salisbury has been chosen as one of the areas to be studied. It islikely that up to 20% of the patients aged 60 years and over on your list will be selectedduring the sampling procedure.The study has received ethical approval from the ethicalcommittees of the University and each of the districts concerned, and the LMC and LDChave been informed.
With the consent of the individual concerned, each subject will be visited at homewhere a straightforward interview and dental examination will be conducted. The datacollected will be used to identify areas of dental need so that resources can be plannedappropriately for the future.
Our reasons for contacting you are two-fold:
1. To ensure that all general practitioners whose patients are likely to be involvedin the study are fully informed about the study and the reasons for it. To this enda short summary is enclosed
2. A high response rate is critical in an epidemiological study of this kind, and thesupport of the subjects' general practitioners can increase the response rate by upto 10%. The study organisers would greatly appreciate your co-operation in theform of a standard letter of support which we could copy and enclose with ourintroductory letter to those individuals who are your patients.
318
TelephoneS 091 222 6000 Ext 8347Fax 091 2226137
Telex • 53654 (UNINEW G)

One of the study team will be in contact in the near future to discuss the matterfurther and to answer any questions that you may have.
Yours sincerely,
A.W.G.Walls PhD BDS FDSRCS(Eng)Senior Lecturer and Honorary Consultant
319

Appendix 2
Letter sent to secretaries of Local Medical Committees
320

UNIVERSITY OFNEWCASTLE UPON TYNE
Appendix 2
The Dental School
Framlington PlaceThe University
Newcastle upon Tyne NE2 43W
Dean of DentistrySecretary, L.M.C. Prof essor Roy Storer
Address
Date
Dear Dr (name)
I am writing to you regarding a proposed epidemiological study of the dentalstatus, needs and demands of the elderly in three areas of England. The research has beenfunded by the Department of Health as part of their Primary Health Care Initiative, andthe work will be carried out by a team from Newcastle University with help fromappropriately qualified community dental officers from the regions involved.
The study will look at around 800 subjects over the age of 60 years in each ofthree areas, one of these areas will be Richmondshire, North Yorkshire. The sample willbe drawn from the computerised patient register of the local FHSAS.
I enclose a brief description of the study and would be most grateful if you woulddraw the attention of the LMC to this research. We would be very happy to answer anyquestions that the committee may have.
I look forward to hearing from you.
Yours sincerely
J.G.SteeleLecturer in Operative Dentistry.
321
Telephone . 091 222 6000 Ext 8347FaxO91 2226137
Telex 53654 (UNINEW G)

Appendix 3
Letter sent to secretaries of Local Dental Committees
322

UNIVERSITY OFNEWCASTLE UPON TYNE
Appendix 3
The Dental School
Framlington PlaceThe University
Newcastle upon Tyne NE2 4BW
Dean of DentistryProfessor Roy Storer
Secretary, L.D.C. DateAddress
Dear (name)
As you may already know, a team from the dental school at Newcastle upon Tyneis planning to undertake a large epidemiological study of the dental status of the elderlyin three areas of England. One of the areas in which we will be collecting data is (nameas appropriate).
Clearly, the co-operation of the L.D.C. would be most helpful. and I enclose abrief description of the study. A full protocol could be sent if you wish , but it isbecoming an increasingly bulky document.
I would be most grateful if you could draw the attention of the L.D.C. to thisstudy. We would be very happy to answer any questions the committee may have. I lookforward to hearing from you.
Best wishes,
Yours sincerely,
J.G.SteeleLecturer in Operative Dentistry.
323
TelephoneS 091 222 6000 Ext 8347Fax091 2226137
Telex53654(UNlNEWG)

Appendix 4
Information sheet sent with letters (Appendices 1 to 3)
324

Appendix 4
THE DENTAL STATUS, NEEDS AND DEMANDSOF THE ELDERLY IN THREE DIFFERENT COMMUNITIES
OUTLINE
The Dental School at the University of Newcastle upon Tyne has been awarded aresearch grant by the Department of Health to look at the dental status, needs anddemands of the elderly in three different communities, Darlington (to represent an urbanarea in the north of England), Richmondshire (to represent a rural area), and Salisbury(to represent an urban area in the south of England).
The objectives of this study are to provide data to help to plan for the dental needs of anageing population, and to investigate the influence of social, geographic and demographicfactors on dental health. In addition we will investigate a number of specific concepts ofclinical significance, particularly the concept of the "shortened dental arch" as it appliesto the elderly.
The study will collect data from 800 randomly selected subjects in each area who willbe visited in their homes for the purpose. The visit will comprise a clinical examinationand a questionnaire led interview. The clinical data will cover coronal- and root-surfacecaries, periodontal disease, tooth wear, dentures and soft tissue pathology. Thequestionnaire will attempt to establish the subjects own assessment of their dentition, theirdental attendance pattern and the sort of things that influence this, as well as somerelevant aspects of general health, mobility and disability which may influence dentalhealth. The examinations will be carried out either by a dentist from the Newcastle DentalSchool (Mr J.G.Steele), or a Senior Community Dental Officer calibrated for the purpose.
A report of the study will be prepared for the DoH. The study is purely epidemiologicaland involved with data collection, no advice or treatment will be offered by theexaminers. Subject confidentiality will be maintained at all times, and for the purposesof computer analysis and storage, each subject will be represented by a code number.
Copies of a full protocol may be obtained from:
Mr J.G.SteeleDepartment of Operative Dentistry,Dental School,Framlington Place,Newcastle upon Tyne,NE2 4BW.
Principal Investigators: Mr J.G.SteeleDr A.W.G.WallsProfessor J.J.MurrayProfessor A. Rugg-GunnProfessor I.E.Barnes
325

Appendix 5
Letter sent to subjects whose names were drawn in the original sample
326

Appendix S
UNIVERSITY OFNEWCASTLE UPON TYNE
2II.
The Dental School
Framlington PlaceThe University
Newcastle upon Tyne NE2 4BW
Dean of DentistryProf essor Roy Storer
Subject's nameAddress
Date as pcaik
Dear (subject's name),
I am writing to you to ask for your help. The Department of Health has asked theDental School of the University of Newcastle upon Tyne to look at the dental health ofpeople over 60 years of age in several areas of the country. This will provide very usefulinformation which will help to plan dentistry over the next few years.
As part of this survey we would like a dentist and dental nurse to visit you athome. They will carry out a simple examination of your mouth and then ask you somequestions relevant to your teeth or dentures. There is no treatment involved at all.
A member of the research team will contact you in the next few weeks to ask youif you are willing to take part in this study and to try to arrange a mutually acceptabletime for this visit. There is, of course, no obligation for you to help in this way, but wereally would be most grateful for your assistance.
Yours sincerely,
Dr AWG WallsProfessor JJ Murray
327
TelephoneS 091 222 6000 Ext 8347Fax091 2226137
Telex • 53654 (UNINEW G)

Appendix 6
Questionnaire sent to subjects who refused to be visited.
328


Appendix 7
Covering letter to go with questionnnaire to refusers.
330

Appendix 7
Name of refuser,Address
UNIVERSITY OFNEWCASTLE UPON TYNE
The Dental School
Framlington PlaceThe University
Newcastle upon Tyne NE2 4BW
Dean of DentistryProfessor Roy Storer
Date pcstmark
Dear (name),
Some months ago we wrote to you to ask for your help with a Government surveyof dental health. You felt unable to take part, and we appreciate your reasons for this.
As this is a study of the population, it is important that we know two simple factsabout the people who did not agree to be seen, specifically whether you have any teethor not and whether or not you are a regular dental attender. Without this information theresults from the rest of the survey will be much less useful to the community and thehealth care services.
The sheet enclosed is completely anonymous, we do not need to know who youare at all. The 4 digits at the top of your sheet are the first four digits of your postcodeto identify roughly which area you are from. We would urge you to please answer thetwo simple questions on the form and return it to us in the stamped envelope provided.Please feel free to add any further comments you wish in the space provided. No furthercontact will be made.
Many thanks for your help.
Yours sincerely
Dr A.W.G.Walls
331
Telephone . 091 222 6000 Ext 8347FaxO91 2226137
Telex 53654 (UNINEW G)

Appendix 8
Consent form for the examination and interview (completed by all subjects)
332

Appendix 8
THE DENTAL STATUS NEEDS AND DEMANDS OFTHE ELDERLY IN THREE COMMUNITIES
, ••••••••••••••••••••••••••••••••••••••••••••••••••s•...............................,
.....................................................................................
.........................................................................................
.........................................................................................
consent to have my mouth examined by a dentist and beinterviewed as part of the above study which has beenexplained to me by I11r/1\'Irs/II\1Iiss
I understand that I am free to withdraw from thesurvey at any stage, should I so wish. I also understandthat the examiner cannot reveal the findings of theexamination to me, or anybody not involved in thestudy except in exceptional circumstances.
Date I I
signed........................................subject
Date / I
signed............................................dentist
333

Appendix 9
Instruments and equipment used for the examination
334

Appendix 9
List of equipment used in the survey.
For each examination:
Sickle probe with size 54 removable tip*Size 4 plane mouth mirrorCPITN Type CAlma GaugeWillis GaugePetzel Head Torch plus batteriesRubber glovesPaper towelsTissuesAlcohol wipes
* The removable tips had their points standardised to 0.2 mm diameter.
335
Appendix 10
Form used for all visits.Note that this includes questionnaire followed by examination form
336

Appendix 10
This is a confidential document concerning the dental statusand attitudes of individuals taking part in a study of a sampleof people in three areas of England.
PERSONAL DETAILS
(To be answered by all patients)
Name:
Date of Birth: / /
Address:
Postcode (MUST COMPLETE) I I I I I I I I
Area: Darlington / Richmondshire / Salisbury
I.D.No.
Date of Examination:
This top sheet should be removed and stored in a locked cupboard.
337

17El
LII
El
ElElElElEl
18
19
20
21
22
23
24
Section 1: General Details and Medical Health
(This section should be answered by all patients, dentist to interview)
I.D.NumberRecord Number
Age * ON 1/1/92 *Sex
PostcodeThis section concerns your general medical health. I am asking you thesequestions because some medical conditions influence your mouth and teeth.
1. Do you have anything wrong with your heart that you know of?Yes - 1No - 0
If YES, what is the problem (keep brief)?
2. Have you ever had rheumatic fever or St Vitus dance that youknow of
Yes - 1No - 0
3. Have you ever had Hepatitis that you know of?Yes - 1No - 0
(If YES, probe to establish type if possible)
4. Have you ever had arthritis or rheumatism that you know of?Yes - 1No - 0
5. Do you have a replacement hip or knee joint?Yes - 1No - 0
6. Have you ever had swelling of any joint that you know of?Yes - 1No - 0
7. Do you wake up with stiffnes or aching in your joints or muscles?Yes - 1No - 0
8. Are you troubled by a dry mouth at all?Yes - 1No - 0
4
6
8
9
16
If Yes, what do you do to relieve it? 338

25
27
28
29
30
9. Are you troubled by dry or gritty eyes at all?Yes - 1No - 0
10. Do you take any tablets or medicines which you have been on formore than a month?
Yes - 1No - 0
If YES, What are they (list and mark box)?
no drugs with known xerostomic effect - 0one or more drugs with a known xerostomic effect - 1
I would now like to ask you some questions about your overall health andhow well you manage.
11. Would you say that your general health is excellent for your age,good for your age, fair for your age or poor for your age?
Excellent - 1Good -2
Fair -3Poor -4
12. Do you have any long standing illness, disability or infirmity. Bylong standing I mean anything that has troubled you over a periodof time.
Yes - 1No - 0
Other (specify) - 9
If YES, What is the matter with you? (record verbatim)
Does this illness or disability limit your activities in any way?Yes - 1No - 0
Other (specify) - 9
26
339

31
32
33
34
35
36
37
38
39
14. Here are a few things that some people have difficulty with. Doyou have any difficulty with.........(if no difficulty - code 1)
If YES, can you do it on your own (code 2)or are you not able to doit at all alone (code 3)?
ITying a good knot in a piece of string
Getting on a busReaching an overhead shelf
Doing heavy houseworkGoing shopping and carrying heavy bags
Preparing and cooking a hot mealCutting own toenails
Washing all over
15. Are you able to leave the house unassisted, only with assistance, ordo you never leave the house?
Unassisted - 1Only with assistance -2
Never leave home - 3
I would now like to have a look in your mouth. The examination shouldbe comfortable for you, please let me know if you are in any discomfort.
Before I look in your mouth with rubber gloves on, can I just check thatyou are not allergic to rubber?
EXAMINATION (see sheets at end)
Thank you very much for letting me examine your mouth. I am nowgoing to hand over to ... who will ask you some questions about yourteeth. I have some paperwork to sort out now so I shall go back to thecar. Thank you again.
340

40
41
2.
3.
4.
50
INTERVIEWER CHECK WITH EXAMINER
Does the patient have any natural teeth?Both jaws - 1
upper jaw only -2lower jaw only - 3
neither jaw (completely edentulous) - 4
Does the patient have a full denture (plate) to replace all the teethin one or both jaws (even if not regularly worn)?
both jaws (complete set) - 1upper only -2lower only - 3
neither jaw (no dentures) - 4
Section 2. (For subjects who are edentulous in at least onearch)
For subjects who have complete dentures:
I would now like to ask you some questions about your (complete) dentures(teeth).
1. How old were you when you first had some false teeth?age m years
How long ago did you get your present top/bottom plate?
Insert age in years uing two digitscan't remember, don't know - 99
How many top/bottom dentures have you ever had?identure - 1
2-3 dentures -24-5 dentures - 36+ dentures -4
About your present dentures:
Overall, how satisfied have you been with the comfort of yourdentures over the last three months?
Very satisfied - 1Reasonably satisfied - 2
Not very satisfied - 3Completely unsatisfied - 4
_______ 43
Upper Lower
__ __ 47
Upper Lower
LI1
341

Upper
Upper
LI
Lower
Lower
LI
5. Do you have any discomfort or trouble with your dentures whenyou are eating?
Always - 1
Sometimes - 2
51
Never - 3
6. Do you ever get ulcers or painful spots under your dentures?Always - 1
Sometimes - 2
52
Never - 3
7. How satisfied are you with your ability to speak with yourdentures in?
Very satisfied - 1
Reasonably satisfied -2 53Not very satisfied - 3
Completely unsatisfied - 4
8. Do you use denture fixative?Always - 1
Sometimes - 2
54
Never - 3
If sometimesfor eating only - 1
socially - 2
55
both - 3
9. When do you wear your upper/lower denture?For eating only - 1
Socially only -2Both of the above - 3
All day -4All night -5
All day and all night - 6Never -7Other-8
If NEVER, Have you ever had a denture which you could wear in the upperjaw9 ........the lowerjaw?
Yes - 1No - 0
342

63
64
65LI
66LI
67LI
68LI
Only for subjects who have NO remaining natural teeth
10. How many years ago did you lose the last of your natural teeth?
Insert number of years in double digitsDon't know / Can't remember - 99
61
How old were you then?age m years
11. Did you expect to lose them around then or were you surprised tolose them at that age?
expected - 1surprised -2
don't know - 9
12. Did you find losing the last of your natural teeth and having fulldentures
very upsetting? - 1a little upsetting? -2
not at all upsetting? - 3or did you never have full dentures? -4
Section 3.(Dentate subjects)
(To be answered by subjects with some natural teeth, interview afler clinicalexamination)
1. How well do you manage with the teeth that you have got?Verywell- 1
Satisfactory - 2Not very well -3
2. Have your gums bled at all in the last 4 weeks, for example whenyou brush them?
Always - 1Ofien-2
Sometimes - 3Never -4
3. Are any of your teeth loose at all, or not?Loose - 1
Not - 0
343

69
LI 70
LI 71
LI 72
73LI
LI 74
LI75
76
Yes - 1No - 0
Upper - 1Lower -2
Both-3
If YES, is it
4. Have you had any sensitivity to hot or cold things from your teethin the last four weeks, or not?
A lot - 1Some -2None -3
5. Have you had any other pain or toothache from your teeth orgums in the last four weeks, or not?
Yes - 1No - 0
6. Do you put sugar in tea?Yes - 1No - 0
7. Do you put sugar in coffee?Yes - 1No - 0
I would like to ask you some questions about the way that you clean yourteeth:
8. How often do you clean your teeth nowadays?Never - 1
less thanxl daily-2xl daily-3x2 daily -4
more than x2 daily - 5Other (specify) - 6
9. Nowadays there are more things available in chemists shops tohelp with dental hygiene. Do you use anything, other than anordinary toothbrush and toothpaste for dental hygiene purposes?
Yes - 1No - 0
If YES, what?
10. Do you have a partial denture which you usually wear?
344

09
10LII
LI
LI
LI
LI
12
13
14
15
16
How long ago did you get your present partial denture (plate)years 08
Do you usually wear your partial denture to eat?Yes - 1No - 0
Why do you wear your partial denture?Because your dentist advised it - 1
Because it improves your appearance -2Because it helps you eat - 3
Other-4
If subject is dentate in both arches (i.e. section 3 has NOT been completed)...
How old were you when you first had a denture?years____
11. Have you ever had a partial denture made which you could not ordid not wear regularly?
Yes - 1No - 0
Section 4.(AII subjects)
(The questions in this section should be answered by all subjects).
1. Talking about both your natural teeth and/or your dentures, onthe whole, how satisfied are you with your teeth?
Very satisfied - 1Reasonably satisfied -2
Not very satisfied - 3Completely unsatisfied - 4
2. How satisfied are you with the appearance of your teeth?Very satisfied - 1
Reasonably satisfied -2Not very satisfied - 3
Completely unsatisfied -4If unsatisfied or not very satisfied, What is it that makes you not satisfied?
3. How satisfied are you with your ability to bite and chew yourfood?
Very satisfied - 1Reasonably satisfied -2
Not very satisfied - 34pletely unsatisfied -4

17LII
18
19
20Hil
21HIll
22ILl
30ILl
4. Is there any food which you would like to eat but which you cannoteat because of difficulty biting or chewing it?
Yes - 1No - 0
If YES, is this because of pain or discomfort with your naturalteeth, loose or painful dentures or something else?
Pain/discomfort of natural teeth - 1Loose/painful dentures -2
Other (specify) - 3
If YES, what sort of food are you unable to eat?
5. How easy do you find it to bite and chew hard foods, such as toastor apples?
Very easy-iMinor difficulties - 2
Not very easy, but possible - 3Impossible -4
6. Have problems with your teeth made you change the way youprepare your food recently?
Yes - 1No-O
7. Do problems with your teeth affect the way that you speak?Yes - iNo-O
8. Do you have any discomfort or dryness in your mouth, other thantoothache or sensitivity, these days?
Yes - 1No - 0
If YES, is it:DrynessBurning
Pain/achingOther (specify)
No 0
24Yes=1 23
= 25__________ 26
Does it affect;Tongue
Lips/cheeksJaw(s)
9. Do you have any pain in your jaw joint (indicates) these days?Yes - 1
346 No-0
IYes=1I 27
No=0
28
29

31
32LI
33LI
34LI
35LI
36LI
37LI
38LI
10. Do you suffer from regular headaches ? (including migraine)Yes - 1No - 0
Section 5. (Dentate subjects only)
(The next six questions should be answered by dentate patients only).
I would like to ask you some questions about the sorts of things you wouldlike a dentist to do to your teeth.
1. If you went to the dentist tomorrow, do you think that you wouldneed any treatment or not?
Yes - 1No - 0
2. If you went to a dentist with an aching back tooth, would youprefer the dentist to take it out or fill it?
Take it out - 1Fill it -2
3. If the dentist said a front tooth would have to be taken out orcrowned, what would you prefer?
Taken out - 1Crowned -2
4. If the dentist said a back tooth would have to be taken out orcrowned, what would you prefer?
Taken out - 1crowned -2
5. If you had several missing teeth at the back would you prefer tohave a partial denture or manage without?
Partial denture - 1Manage without -2
6. Do you find the thought of losing all your own teeth and havingfull dentures...
very upsetting ? - 1a little upsetting ? -2
not at all upsetting ? - 3
7. Do you think that at some time you wifi have full dentures, or doyou think that you will always have some natural teeth?
Full dentures - 1Always dentate -2
Dont know -3
347

39LII
40LI
41LI
42LI
43LI
Section 6. (All subjects)
(The next section should be answered by ALL patients).
The next two sections ask some questions about visiting the dentist.
Thinking about the dental practice you went to last time, had youbeen there before or was that your first time at that practice.
been before - 1first time - 2
If "been before", please answer the next four questions
For about how many years have you been going to that dentalpractice
<lyear- 11 to <2 years -22 to <5 years - 3
5+ years -4Don't know, can't remember - 9
How easy is it to get an appointment with your dentist?Very easy - 1
Reasonably easy -2Not very easy - 3
Difficult -4
How far do you travel to see your dentist? (n.b. one way< /2mile-1
1/2-1 mile-21 - 2 miles - 3
2+ - 5 miles -45+- 10 miles-S
1O+-2Omiles-620+-30miles-7
30+miles-8Other-9
Do you have any problems getting to your dentists surgery?Yes - 1No - 0
If YES, would you like to tell me what they are?
2. How did you choose this particular dental practiceconvenience/nearest - 1
recommended -2family dentist -3
Other-4348 Dont know - 9
LI 44

54
3. The last time you went to the dentist what made you go? Was itbecause you had some trouble with your teeth, for a check up orfor some other reason?
Trouble - 1
Check-up -2
45
Other-3
4. In general, do you go to the dentist for...regular check-ups - 1
occasional check-ups -2
46
or only when you are having trouble with your teeth -3
For IRREGULAR ATTENDERS (those who go to the dentist only withtrouble)
Why is it that you only visit the dentist when you have trouble /never visit the dentist (more than one answer is acceptable)
1) dont need to2) too expensive
3) dislike or fear of the treatment4) too far to travel
5) Can't be bothered6) other (specify)
Which of the above is the MOST important reason (1 - 6, as above).
Section 7. (All subjects)
(This section should be answered by all subjects).
1. When you have dental treatment, do you usually receive alltreatment free of charge under the NIIS, do you pay a part of thecost under the NHS, do you pay for all the treatment yourself(i rivately) or is it under insurance or some other arrangement.
NHS free - 1NHS + contribution -2
Private -3Insurance -4
Other-5Dont Know -9
Yes=1 'I 48
__________ 50
51
52
53
349

4.
5.
55
56
57
58
59
If treatment normally PRIVATE
Why do you normally seek private treatment? (record the mostimportant reason)
Is it because you feel that the treatment is better? - 1or because you feel that it is easier to get an appointment? - 2
or because your dentist does not offer NHS treatment? - 3or something else? (specify) - 4
2. About how long ago was your last visit to the dentist?<1 year-i
over 1, up to 2 years -2over 2, up to 3 years - 3over 3, up to 5 years -4
over5,upto loyears-5over 10, up to 20 years - 6
over 20 years - 7Don't know, can't remember - 9
3. At your last visit, did you have your treatment carried out free ofcharge under the NIIS, did you pay part of the cost under theNUS, did you pay for all the treatment yourself (j,rivately) or wasit under insurance or some other arrangement.
NHS free - 1NHS contribution -2
Private - 3Insurance - 4
Other (specify) - 5DK-6
Did the treatment at your last visit cost......more than you expected ? - 1about what you expected ? -2
less than you expected? - 3Other ? -4
Don't know?- 5
In general do you think that dental treatment is..very expensive ? - 1
expensive ? -2value for money ? - 3
or inexpensive ? - 4Dont know? -5
350

60
61
62
63El
Section 8.(All subjects)
(This section should be answered by all subjects).
The next section asks some questions about your dentist and yourself?
1. Have you ever had problems getting dental treatment when youneeded it?
Yes - 1No -0
if YES, what were these problems?
2. Do you think it is possible for a dentist to visit people in theirhomes to carry out treatment?
Yes-iNo - 0
Don't Know -9
3. Have you ever tried to get a dentist to see you at home?Yes - 1No -0
If YES, what treatment did you receive?
If No, do you think that it would be helpful for a dentist to see youat home?
Yes - 1No - 0
Don't know-9
4. Is there anything else you would like to say about dentistry or yourown dentist that has not already been covered?
351
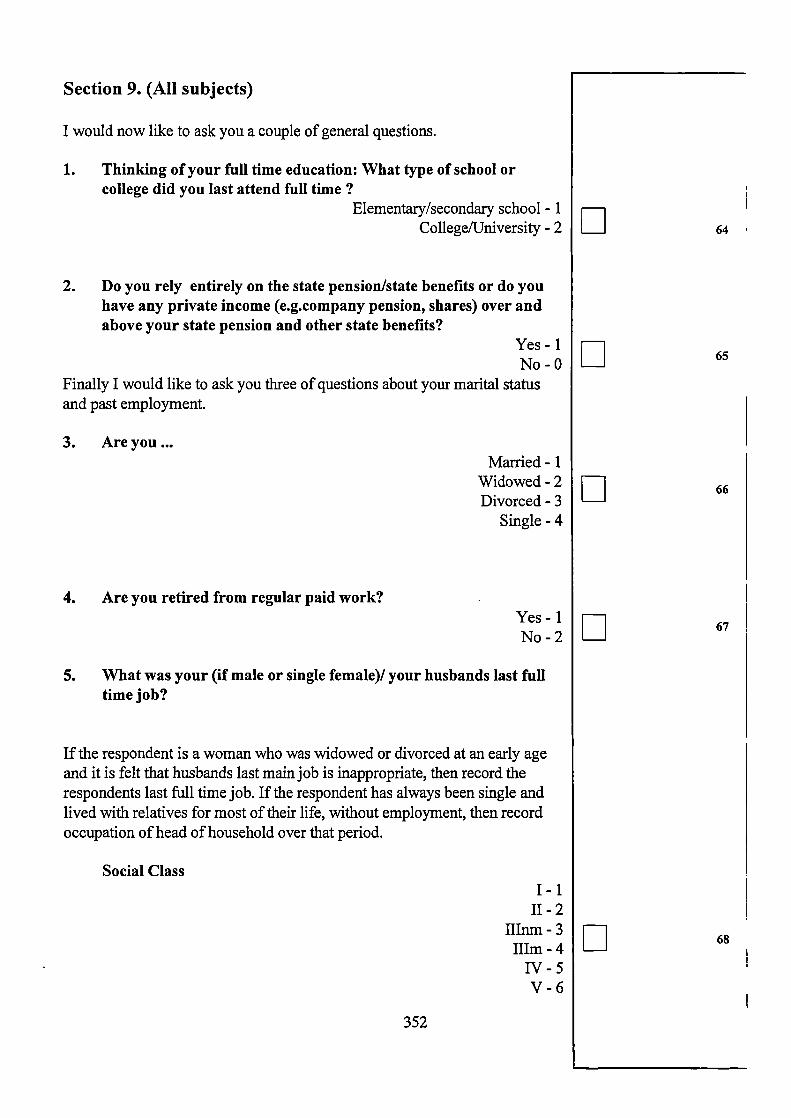
64El
65El
66El
67El
68El
Section 9. (All subjects)
I would now like to ask you a couple of general questions.
1. Thinking of your full time education: What type of school orcollege did you last attend full time?
Elementary/secondary school - 1College/University - 2
2. Do you rely entirely on the state pension/state benefits or do youhave any private income (e.g.company pension, shares) over andabove your state pension and other state benefits?
Yes - 1No - 0
Finally I would like to ask you three of questions about your marital statusand past employment.
3. Are youMarried - 1
Widowed -2Divorced - 3
Single -4
4. Are you retired from regular paid work?Yes - 1No -2
5. What was your (if male or single female)! your husbands last fulltime job?
If the respondent is a woman who was widowed or divorced at an early ageand it is felt that husbands last main job is inappropriate, then record therespondents last full time job. If the respondent has always been single andlived with relatives for most of their life, without employment, then recordoccupation of head of household over that period.
Social ClassI-i
11-2HInm-3hIm -4
IV-5V-6
352

CC
00
N
In
N
00
C
c)
C
—4
C
01)
00
U,U,
E
C.)
C/D
C0
z
C
00
00
U,CI)0
C.)
1)C.)
E5-0
VCl)0
UU
0)
0
SI ©
0.0) 0.C.) 0.
0.
0.
—0 -N
N4 -
CI) CI) C4
0) —s V
AE2CO CO0)
0)0)0)
o0 -• 1E00 ;.>0) 00 N-— 0)V ONA
S U I I I I I I I
o 0 0
-0 _Q
•_ 0)U,QCd C.) 0
•:0 Cl) + C-. z
0) C.)
I — c'i (4 If) \0 N 00 *
0)
I
V0O0000 (0•-c/D 0000
-- -- _6_ -— — — r.
0)U)CO -0.)Cd)
0
0
Cd,0)I-
0
0)
00)5-.0C.)Cd)
0)-D
0
CO
0

r1
0 o • •
—
0
0
C
a.)
0z
C,,a.)
cS-.
0
04—.
0C.)10
• —4
I.4
a.)
C,)
C,,0
C)
L)
.9
..
•C.)C,)
-- a.)
C',Cd,a.)
.— a.)— - a.)
-O U
C
C
C
IIII —
Q
ooOZQ
00
Ir
N
00
© — *
o C4
rnrnrn
a)
I-
4-.—
— —I_ — — • —
Cl) C', C,) C,)4-' — —
IH
22o
c' l ; I-. ;—, C
C
II."
;_ 4-ocn
C
00
———--- Id,e.c
0
E E •o — —OV A
Cl)
Cd)0o
rID
rID
z
C
1
N
00
— —— —— -c- --- elN
a)a.a)
a)
a.
a)
Cl)•-
a)a)
a.
a)a.a)
00
o O
o- a)
a.
Cl)
:
•
C)—
c_)
4-
a)a.
:4a)
—01!) —
-EE EEEE
— ci0--
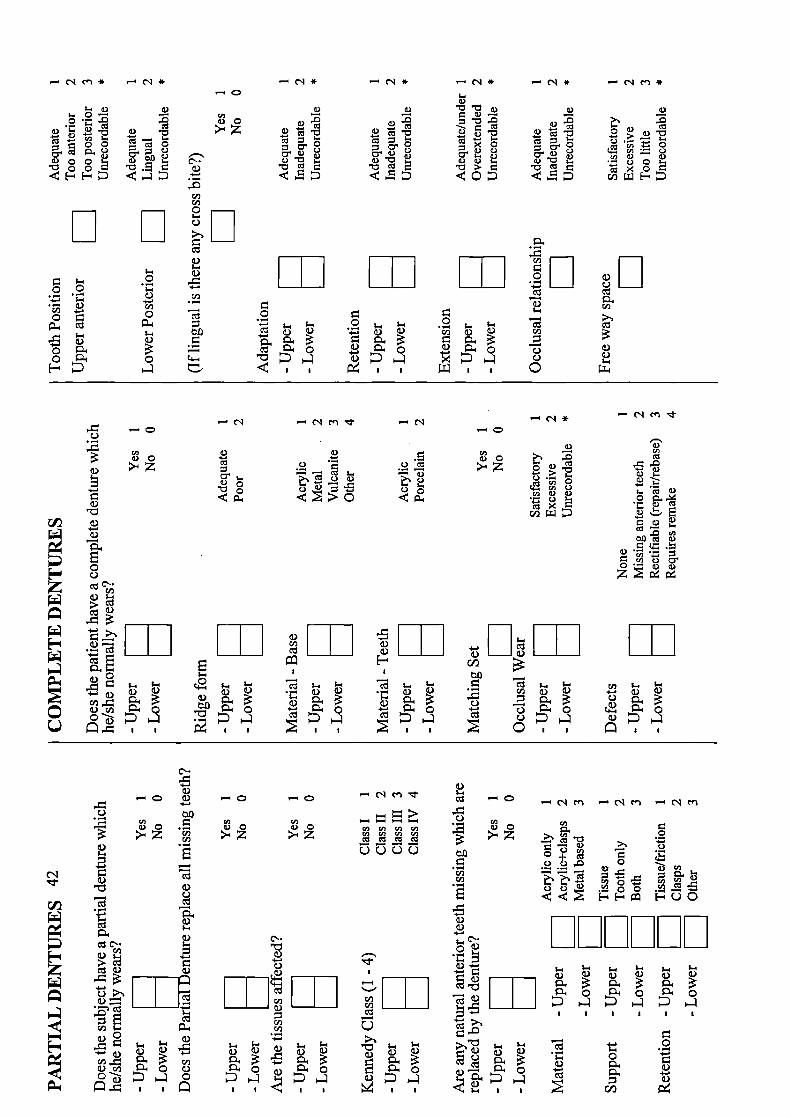
a)
0
C.' a)a) . I-
•C C-4-,'. —
a)0
0 -0
4_4 CI 0Cl)a) a)
C) 0cO
IL:
0)0
I
0)Cl)
C U--.- 0) 0.)
a)4.-
a)4-.
0
- C I-.>S C C a)
.E0C- a)
a)a) ______
r' a)
-4-.
-•0
—- - - -CI) CI) CI) 11)CI) CI)
0000
Cl)Cl) ______
C.)
a) a)
4II
C-.
a)— 0)
.44
C.)
0 .:
0)U-
0)
0)CC.-.
ca) 0)
.4 C a)0
U
0)—o — N m - N cn -. N CU
Cl) CI)
.
. 0Cl)Cl)
. 0O
I
.a) -4-. U- U- ;. ; ;. U-.
0) ) a) 0) a)
I 0 C 0__I4.-4.-
, I I I I I I
U- U- .a) a) 0) .a)
a)
I U 1D
—o
>IZ
C'..
a)
C.)______ 0) ______
Cl)a)
Cl)CI)
U-. U-. U-0) a) 0) a)
C 0)0-
U I I I
..-. N cn * — N *
a) a)I. 0- - (I)
a)0a)
a)00 C'-.oo a.-E- .4-
.-
Cl)CI)C
EE L_J
a)a)•0
-4-
.- .- ) Cl)-4.- ;-4 -4-• .-
CI) —
o 0
- ;-4' a) VCo i 0
t::,
- N * - N * - N *U-.
a)a) a)-
a)-
U-. I a)a)U- C • C • >.
o
.. U-. U- • ;_ U-
a) 0)0) )
C' 0
U I U I
• U- U-CI) a) 0)
—0
•Ea)0
a)a)0- 0
a)
ri.--,l. 4 )
- CQ
z
— ___ ___
I I Ia.) I I I I I
E
CL) . U U U
NCfl'
—0
a) a)
>-4z
'U
na)a)
a) ••
CI) C.) C.'0 • a) a)
rii
I I- C)) U- U-
Cl) 0) 0) -.- a) a)
C.) 0 o

Appendix 11
Notes for examiners on drugs regarded as contributing to xerostomia
356
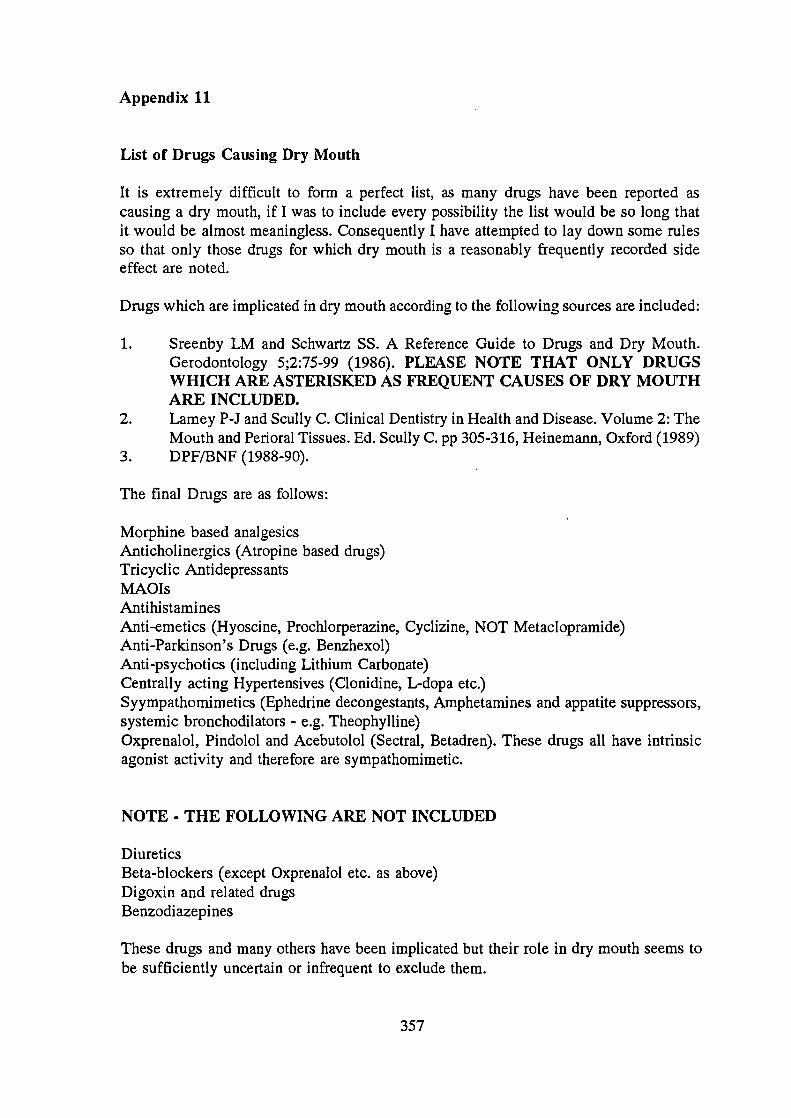
Appendix 11
List of Drugs Causing Dry Mouth
It is extremely difficult to form a perfect list, as many drugs have been reported ascausing a dry mouth, If I was to include every possibility the list would be so long thatit would be almost meaningless. Consequently I have attempted to lay down some rulesso that only those drugs for which dry mouth is a reasonably frequently recorded sideeffect are noted.
Drugs which are implicated in dry mouth according to the following sources are included:
1. Sreenby LM and Schwartz SS. A Reference Guide to Drugs and Dry Mouth.Gerodontology 5;2:75-99 (1986). PLEASE NOTE THAT ONLY DRUGSWHICH ARE ASTERISKED AS FREQUENT CAUSES OF DRY MOUTHARE INCLUDED.
2. Lamey P-J and Scully C. Clinical Dentistry in Health and Disease. Volume 2: TheMouth and Perioral Tissues. Ed. Scully C. pp 305-3 16, Heinemann, Oxford (1989)
3. DPF/BNF (1988-90).
The final Drugs are as follows:
Morphine based analgesicsAnticholinergics (Atropine based drugs)Tricyclic AntidepressantsMAOIsAntihistaminesAnti-emetics (Hyoscine, Prochiorperazine, Cyclizine, NOT Metaclopramide)Anti-Parkinson's Drugs (e.g. Benzhexol)Anti-psychotics (including Lithium Carbonate)Centrally acting Hypertensives (Clonidine, L-dopa etc.)Syympathomimetics (Ephedrine decongestants, Amphetamines and appatite suppressors,systemic bronchodilators - e.g. Theophylline)Oxprenalol, Pindolol and Acebutolol (Sectral, Betadren). These drugs all have intrinsicagonist activity and therefore are sympathomimetic.
NOTE - THE FOLLOWING ARE NOT INCLUDED
DiureticsBeta-blockers (except Oxprenalol etc. as above)Digoxin and related drugsBenzodiazepi nes
These drugs and many others have been implicated but their role in dry mouth seems tobe sufficiently uncertain or infrequent to exclude them.
357