The Decline of Pay Inequality in Argentina and Brazil following the Crises and Retreat from the...
27
The Decline of Pay Inequality in Argentina and Brazil following the Crises and Retreat from the Neo-liberal Model By James K. Galbraith, Laura Spagnolo and Sergio Pinto The University of Texas Inequality Project Lyndon B. Johnson School of Public Affairs The University of Texas at Austin Austin, Texas 78713 UTIP Working Paper 34 For the VIII Conference on Globalization and Development Havana, Cuba February 8, 2006 Abstract: In this paper we analyze the distribution of pay and changing trends of inequality in Argentina and Brazil, illuminating the specific winners and losers, by region and by economic activity (sector). In both countries we find that inequality rose in the neoliberal period, but that it declined following the severe crises of neoliberal policy, in 1993 in Brazil and in late 2001 in Argentina. This period of post-neoliberalism is characterized in both countries by a decline in the economic weight of the financial sector and a recovery of the position of the civil service. In both countries, the rise in inequality leading to the crisis produced an increase in the relative position of the major metropolitan centers; this positional advantage also declined modestly in the post-crisis recovery period. [email protected] , [email protected] , [email protected]
-
Upload
independent -
Category
Documents
-
view
4 -
download
0
Transcript of The Decline of Pay Inequality in Argentina and Brazil following the Crises and Retreat from the...

The Decline of Pay Inequality in Argentina and Brazil following the
Crises and Retreat from the Neo-liberal Model
By James K. Galbraith, Laura Spagnolo and Sergio Pinto
The University of Texas Inequality Project
Lyndon B. Johnson School of Public Affairs The University of Texas at Austin
Austin, Texas 78713
UTIP Working Paper 34
For the VIII Conference on Globalization and Development
Havana, Cuba
February 8, 2006
Abstract: In this paper we analyze the distribution of pay and changing trends
of inequality in Argentina and Brazil, illuminating the specific winners and losers, by
region and by economic activity (sector). In both countries we find that inequality rose
in the neoliberal period, but that it declined following the severe crises of neoliberal
policy, in 1993 in Brazil and in late 2001 in Argentina. This period of post-neoliberalism
is characterized in both countries by a decline in the economic weight of the financial
sector and a recovery of the position of the civil service. In both countries, the rise in
inequality leading to the crisis produced an increase in the relative position of the major
metropolitan centers; this positional advantage also declined modestly in the post-crisis
recovery period.

1
I. Introduction
This paper compares the evolution of pay inequality in Argentina and Brazil
from the early 1990s through 2004, covering the period of high neoliberalism in both
countries, the respective crises and their aftermath, which in both countries involved a
retreat from neoliberal globalization. It shows specifically how different economic
sectors, and by extension the workers within those sectors, were affected by the
structural adjustments that occurred in Brazil and Argentina.
This analysis is accomplished by decomposing Theil’s T statistic in several ways.
First, we show how the different sectors, and also the different regions within each
country, contributed to changes in inequality from year to year. Second, we decompose
the change in the Theil statistic into parts attributable to changes in relative incomes, on
one hand, and changes in population or employment structures, on the other. These
income and population effects show the character of the changing contributions of each
sector and region to inequality, by which the “winners” and “losers” can be identified.
Behind these outcomes are the policies that favor one sector (and/or region) over
another, protecting wage earners in certain sectors (and/or regions), while putting them
in jeopardy in others.
We base the analysis on entirely novel data sets for both countries, permitting us
to measure changes in inequality year to year and even month to month and to capture
in fine detail the contribution to inequality of the changing position of every major
economic sector and every geographic region (provinces and states). This approach
permits investigation into the relationship between public policies, the distribution of
power, and the distribution of income in these countries to proceed with a foundation in
fact not previously available. The data clearly reflect the changing position of the most
influential economic sectors, including the state, the banks, the trade unions and the
energy producers.
Thus we show how increasing inequality in Argentina and specifically the
concentration of income in the financial sector and in Buenos Aires city preceded the

2
economic crisis of December 2001 and how inequality began to decrease as these factors
were reversed post crisis. Brazil, which entered the period with one of the most unequal
economies in the world, had already stabilized its distribution of pay with the Plan Real
in the first part of the 1990s. This achievement was followed by decreases in pay
inequality towards the end of the decade. A marked feature of this trend was a decline in
incomes earned in the financial sector, and a gradual increase in the employment and
wages of the civil service. By these measures, inequality in Brazil now appears to have
declined to levels not seen since before the deep crisis of the early 1980s.
The common characteristic in both countries is that the financial sector is the
biggest contributor to economic inequality; the period leading up to the crisis is
characterized by an increase in the weight of this sector, and we observe a corresponding
decline in that weight as the crisis passes and a more normal situation returns. What is
different is the timing. In Brazil it began to happen in the mid-1990s, while in Argentina
it occurred only after the crisis in December, 2001.
The next section briefly discusses the recent historical and economic context of
both countries under the period of study. The third section presents the methodology
and the fourth the data used. The fifth and sixth sections present an analysis of the
evolution of pay inequality by economic sectors and regions using the between-group
component of Theil’s T in each country. The final section presents some conclusions
and some questions for further research.
II. Historical and Economic Context
The starting points for the two countries as they entered the period of study were
quite different. Brazil historically has had some of the highest levels of inequality in the
world. Argentina used to be one of the most egalitarian countries in Latin America, but
this status deteriorated significantly over the last decade, in which economic inequality
increased at a higher rate in Argentina than in any other country in the region (Gasparini,
1999, p. 60).
3
It is interesting to compare the trends in pay inequality in Argentina and Brazil at
this time, because both countries were going through the process of implementing
structural reforms derived from the Washington Consensus. Specifically, both countries
abandoned import substitution and embraced free market principles, including
privatization and deregulation. This policy shift resulted in the decline of state
intervention and the privatization of public utilities, trade and financial deregulation,
equal treatment of local and foreign capital, deregulation of domestic markets, tax
reforms, labor reforms and the creation of the Southern Common Market (Mercosur).
In addition to these changes, the new economic strategies included aggressive
measures to control inflation, necessary because both Argentina and Brazil had ended
the 1980s with hyperinflation. Under Carlos Menem, Argentina adopted the
“Convertibility Plan,” which implied two things. First, the Argentine peso was fixed to
the dollar at a rate of one peso per dollar, and second, a new legal framework was
created to regulate the process of money creation (De la Torre, Yeyaty and Schmukler,
2002). Similarly, Brazil implemented the “Plan Real” starting in 1994, under the
government of Itamar Franco Fernando, with Henrique Cardoso as Minister of Finance.
The Plan Real pegged the Real to the dollar, but with some room to float; the range was
restricted to be from 0.98 to 1.02 Reals to the dollar.
Despite these similarities, the greater rigidity of the Argentine Convertibility Plan
made Argentina more vulnerable to external shocks. In 1999, Brazil responded flexibly
to the reduced availability of foreign capital provoked by the Russian crisis, devalued the
Real, and survived the shock. Argentina chose not to devalue, maintaining convertibility
in the face of capital flight; this ultimately led the Argentine economy to descend into
collapse and bankruptcy.
III. Method for Measuring Inequality
Several studies have examined trends in income inequality in Argentina and
Brazil. Most rely on data derived from household surveys, with inequality measured

4
using the familiar gini coefficient. Here we present a different measure of inequality;
namely, the between-groups component of Theil’s T statistic, which is useful for
calculating inequality measures when the underlying data are presented in grouped form.
In particular, with data that are readily available for both Argentina and Brazil, this
approach permits us to measure the contribution of each sector and of each geographic
region to increases or decreases in overall pay inequality in the economy.1
Theil’s T for the population (T) is made up of two components, a between-
groups component (T’g) and a within-groups component (Tw
g).
Algebraically,
T = T’g + Tw
g (Equation 1)
Since individual salaries are not recorded, the within-groups component of
Theil’s T cannot be calculated. The between-groups component therefore represents a
lower bound of total pay inequality; however, it has been shown that under general
conditions this measure closely tracks the evolution of larger, but unobserved, sum of
between-groups and within-groups components.
The between group element of Theil’s T can be written as follows,
where i indexes the groups, iP is the population of group I, P is the total population,
iY is the average income in group I, and µ is the average income across the entire
population.
The use of Theil’s T computed from semi-aggregated data provides significant
advantages over other inequality measures in the resolution, breadth and reliability of the
data. Other inequality statistics are typically based on the information derived from
1 Application of Theil’s T to the measuring of economic inequality is explained in Galbraith, Conceição and Bradford, 2001.
∑=
⎪⎭
⎪⎬⎫
⎪⎩
⎪⎨⎧
⎟⎟⎠
⎞⎜⎜⎝
⎛⎟⎟⎠
⎞⎜⎜⎝
⎛⎟⎠
⎞⎜⎝
⎛=m
i
iiig
yyPpT
1
ln**'µµ

5
household surveys. These data present many problems, including a dearth of rural data;
non-response and invalid answers; misreporting; and periodic methodological changes in
the surveys’ design (Gasparini, 2004, p.3-9)2. The semi-aggregated data on which our
calculations are based come from census rather than sample information, and they
represent the work product of consistent and routine reporting by employers to
government agencies. The data may not be flawless, but they are likely to be consistent
through time, and therefore changes in the measure of inequality from one period to the
next are highly likely to be reflective of bona fide underlying events.
Theil’s T therefore permits us to make low-cost, accurate measures of trends in
inequality. But not only that, it is also possible to capture the contribution of each
economic sector and region to pay inequality, by disaggregating the inequality measure
into its constituent elements. The contribution of each element, which may be a sector
or a region, to the overall inequality of the economy can be viewed by graphing the
individual Theil elements in stacked bar format. This information can be read easily to
determine which sectors and regions gained and lost relative position from year to year.
Finally, it is possible to decompose the change of inequality between two time
periods into two effects; the income effect, which is due to changes in relative income,
and the population effect, which is due to changes in the relative number of people
employed. This decomposition allows one to determine whether gains or losses from
one year to the next, or within any given sector or region, are due to changes in average
salaries or in the number of people employed.
To calculate the population and income effect it is necessary to work with two
formulae. The first shows that the differences in inequality from period 1 to period 2 are
divisible into an income effect, which is computed by subtracting from the inequality
2For instance, the 2003 PNAD with 133,255 households and 384,834 individual observations presents 27,579 missing household total income and 1,663 zero-income observations, around 22% of all dwelling observations. It also presents 72,767 missing individual total income and 113,184 zero-incomes, around 48% of the sample.

6
measure for the second year a measure of what inequality would have been that year, had
there been no changes in the structure of employment. The remainder of any changes
must therefore be due to changes in employment structure. The “fixed-weight Theil” is
given by the formula below:
The difference between the current value and the fixed Theil measures variation
of the wage structure alone, on the assumption that no changes in the population
weights had occurred.
IV. Data
Data for Argentina come from the monthly tax filings of private entities at the
Administración Federal de Ingresos Públicos (AFIP). In these filings, each employer
declares his or her employees in order to commit the payment of contributions to social
security within the Sistema Integrado de Jubilaciones y Pensiones (SIJP). The SIJP
processes data on approximately 5 million salaried jobs from the entire country and
covers almost every economic sector. These salary and employment data allow for
calculation of the monthly Theil’s T by 22 economic sectors and by twenty three
provinces plus the City of Buenos Aires.
Data are available beginning in 1994 because that was the year in which the
reform of the Argentine pension system went into effect. Affiliation with the SIJP is
mandatory for all workers over age 18 who have the following employment status: a)
self-employed, b) employed in the private sector, or c) employed in the public sector,
including by the national government or the provinces that participate in the SIJP.
Military personnel, security forces, police staff and workers under 18 are excluded from
the system (Law 24.241: Creation of the Integrated System of Retirement and Pension
Benefits, 1993).
⎟⎟⎠
⎞⎜⎜⎝
⎛=∑
=2
2
2
2
1 1
1 ln**YY
YY
PPT ii
m
i
f
7
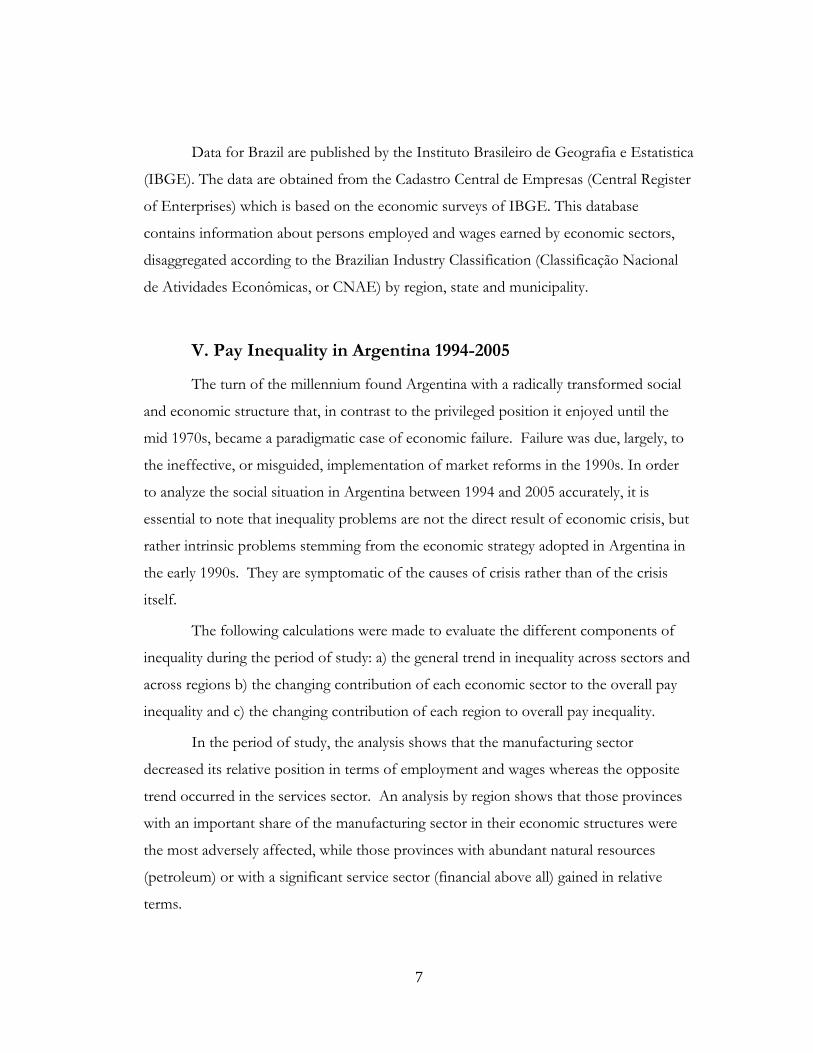
Data for Brazil are published by the Instituto Brasileiro de Geografia e Estatistica
(IBGE). The data are obtained from the Cadastro Central de Empresas (Central Register
of Enterprises) which is based on the economic surveys of IBGE. This database
contains information about persons employed and wages earned by economic sectors,
disaggregated according to the Brazilian Industry Classification (Classificação Nacional
de Atividades Econômicas, or CNAE) by region, state and municipality.
V. Pay Inequality in Argentina 1994-2005
The turn of the millennium found Argentina with a radically transformed social
and economic structure that, in contrast to the privileged position it enjoyed until the
mid 1970s, became a paradigmatic case of economic failure. Failure was due, largely, to
the ineffective, or misguided, implementation of market reforms in the 1990s. In order
to analyze the social situation in Argentina between 1994 and 2005 accurately, it is
essential to note that inequality problems are not the direct result of economic crisis, but
rather intrinsic problems stemming from the economic strategy adopted in Argentina in
the early 1990s. They are symptomatic of the causes of crisis rather than of the crisis
itself.
The following calculations were made to evaluate the different components of
inequality during the period of study: a) the general trend in inequality across sectors and
across regions b) the changing contribution of each economic sector to the overall pay
inequality and c) the changing contribution of each region to overall pay inequality.
In the period of study, the analysis shows that the manufacturing sector
decreased its relative position in terms of employment and wages whereas the opposite
trend occurred in the services sector. An analysis by region shows that those provinces
with an important share of the manufacturing sector in their economic structures were
the most adversely affected, while those provinces with abundant natural resources
(petroleum) or with a significant service sector (financial above all) gained in relative
terms.

8
Figure 1 shows the values obtained for inequality by sector and region, using the
between-groups component of Theil’s T.
Figure 1: Inequality by Sector and Region (1994-2005)
Source: Authors’ calculations based on SIJP data.
This period corresponds to the highest degree of inequality in the country’s
recorded history. We can divide the reference period into five stages. During the first
stage, from 1994 to mid-1997, the inequality indicators increased. In the second stage,
from mid-1997 to mid-1998, inequality remained almost stable: The third stage, from
mid 1998 to 2002, was dominated by a deep economic crisis and substantial increases in
inequality. In the fourth stage, from mid 2002 to mid 2003, inequality indicators
decreased. During the last stage, from mid 2003 until Dec 2004, the inequality trend
shows a stable pattern. Although inequality has been decreasing since 2002, pay
inequality remains high.
0.04
0.05
0.06
0.07
0.08
0.09
1994 1995 1996 1997 1998 1999 2000 2001 2002 2003 2004
Thei
l's T
Sta
tistic

9
Figure 2: Pay Inequality by Economic Sector
Source: Authors’ calculations based on SIJP data.
Figure 2 shows pay inequality by economic sector. The pattern is not as
pronounced as when inequality is measured across regions, nevertheless several facts
emerge. During the period of the Convertibility Plan (1991-2002), there was little change
in salary levels because adjustments in the labor market affected the level of employment
rather than salary levels. After the devaluation in 2002, Theil values follow an irregular
but declining pattern. This trend is explained by three factors: (a) the improvement in the
economic activity of the primary sector as a result of the change in relative prices after
the devaluation and the increases in the prices of Argentina’s main exported
commodities, (b) the decrease in the activity level of the financial sector after the
economic crisis (December 2001), and (c) government policies that implemented
increases in the salary levels of different sectors. These increases in salaries did not
reflect improvement in the real well-being of different sectors due to an inflation rate
0.03
0.04
0.05
0.06
0.07
0.08
0.09
0.1
Jul-9
4
Jan-
95
Jul-9
5
Jan-
96
Jul-9
6
Jan-
97
Jul-9
7
Jan-
98
Jul-9
8
Jan-
99
Jul-9
9
Jan-
00
Jul-0
0
Jan-
01
Jul-0
1
Jan-
02
Jul-0
2
Jan-
03
Jul-0
3
Jan-
04
Jul-0
4
Jan-
05
Thei
l's T
Sta
tistic
Monthly Inequality by Sector 12-mo.Moving Average

10
that was much higher than the salary increases could compensate for; nevertheless they
had an effect on relative incomes.
As shown in Figure 3, after the devaluation, the percentage increase in wages of
certain sectors--basic metals, agriculture, construction, mining, and textiles/leather--was
higher than the inflation rate. In contrast, the percentage increase in wages for the
finance, printing, public administration, health and education sectors was below the
inflation rate. Since some sectors with exceptionally low wages, including agriculture,
construction, and textiles, gained relatively to the others as well as in real terms,
inequality in the overall wage structure declined after the crisis. (Clarin, June 19, 2005, p.
14).
Figure 3: Real Wage Variation since Devaluation (November 2001/April 2005)
14.20%
13.60%
11.30%
9%
7.40%
-18.60%
-12.40%
-12%
-10.90%
-7.20%
-25.0% -20.0% -15.0% -10.0% -5.0% 0.0% 5.0% 10.0% 15.0% 20.0%
Base Metals
Agriculture
Construction
Mining
Textiles/Leather
Finance
Printing
Public Administration
Education and health
Average Wage

11
Source: Ministry of Economy published by Clarin, June 19, 2005.
Contribution by Sector
In the case of Argentina, 22 economic sectors were considered in the analysis of
sectoral contributions to inequality. Of these, those sectors that contributed the most to
increasing inequality and those that were the hardest hit are included in the following
stack-bar graph.
Figure 4: Contribution to Overall Inequality by Economic Sector
Source: Authors’ calculations based on SIJP data.
As shown in Figure 4, during the period under study (1994-2005), six economic
sectors with incomes above the average have made the largest contributions to pay
inequality in Argentina: finance; petroleum; utilities; mining; civil service and basic
metals. Of these, the financial and petroleum sectors contributed the most to the
increase in inequality during these years. On the other hand, the sectors with income
below the average (and a position in the diagram below the zero line) with the largest
-0.15-0.1
-0.050
0.050.1
0.150.2
1994 1995 1996 1997 1998 1999 2000 2001 2002 2003 2004 2005
Con
trib
utio
n to
The
il
Financial Intermediation Petroleum Mining-Quarrying Transport, Storage and CommunicationsUtilities Civil service, defense, organizations and entities abroadBasic metals Fishing and related servicesConstruction Agriculture, Livestock, Hunting and ForestryWholesale & Retail trade and workshops Social services, private education and health

12
weight were agriculture, livestock, hunting and forestry; wholesale and retail trade; social
services, private education and health; construction.
The December 2001 financial crisis and the January 2002 devaluation brought
about changes in the relative position of some sectors. Two sectors with above average
incomes – finance and the civil service – lost relative position. Four sectors with above
average incomes improved their relative position, either by increasing their relative
income position or by recovery of employment. These are mining; food, beverage and
tobacco; fishing; and basic metals.
Increasing Inequality among Regions
Figure 5: Inequality by Region
Source: Authors’ calculations based on SIJP data.
0.015
0.02
0.025
0.03
0.035
0.04
0.045
0.05
Jul-9
4
Jul-9
5
Jul-9
6
Jul-9
7
Jul-9
8
Jul-9
9
Jul-0
0
Jul-0
1
Jul-0
2
Jul-0
3
Jul-0
4
Thei
l Sta
tistic
Theil Average Jul94-Nov99 Average Dec99-Nov01

13
Figure 5 shows the movement of pay inequality by province between 1994 and
2005. Three different trends in pay inequality emerge. The first trend occurred between
July 1994 and November 1999, and was characterized by relatively constant Theil levels.
However, this pattern changed from November 1999 through November 2002. The
second trend is explained by the increase in the contribution to pay inequality by Buenos
Aires City. During this period, Argentina’s economy was already in recession, and the
relatively stronger performance of the services sector, particularly finance, in relation to
the goods-producing sector explains why incomes in Buenos Aires City held up better
than those in other Argentine provinces (GDP Report from Buenos Aires City, 2003).
The third trend, beginning in the middle of 2002, has a downward trajectory. This trend
has two primary explanations. On the one hand, since 2002, the contribution of Buenos
Aires City to overall inequality decreased – because the total income in the City
decreased. Specifically, the fact that the economic structure of Buenos Aires City
includes a large component of services, especially in the finance sector, explains why,
after the financial collapse in December 2001, the reduction in Buenos Aires’ GDP was
bigger than the one experienced in other provinces. Approximately 78 percent of the
aggregate value of the finance sector, the sector most affected by the economic crisis in
Dec. 2001, is generated in Buenos Aires City. During 2002, the activity level in the
finance sector decreased by 18.2 percent in Buenos Aires City (GDP Report from
Buenos Aires City, 2003). The other explaining factor for the decrease in inequality by
region after November 2002 is that during this time the relative position of some
provinces began to increase. The economic situation of the provinces of Chubut, Tierra
del Fuego, Santa Cruz and Neuquen improved. The economies of these provinces rely
primarily on the export of petroleum. After the devaluation, the value of their
production increased in peso terms, due mainly to the rise in domestic prices for
petroleum.

14
Contribution by Region
Twenty-four regions (23 provinces and the City of Buenos Aires) were
considered in the analysis. Those provinces that contributed the most to inequality and
those that were the hardest hit are included in Figure 6.
Figure 6: Contribution to Inequality by Region
Source: Authors’ calculations based on SIJP data.
During the period of study (1994-2005), the following provinces have enjoyed
average incomes above the national average: Buenos Aires City (BAC), Neuquen,
Chubut, Santa Cruz and Tierra del Fuego. With the exception of BAC, these provinces
-0.15
-0.1
-0.05
0
0.05
0.1
0.15
0.2
1994 1995 1996 1997 1998 1999 2000 2001 2002 2003 2004 2005
Thei
l's T
Sta
tistic
0
0.005
0.01
0.015
0.02
0.025
0.03
0.035
0.04
City of Buenos Aires Neuquén Chubut Santa CruzTierra del Fuego San Luis Formosa La PampaRío Negro Chaco Catamarca CorrientesSan Juan La Rioja Santiago del Estero MisionesJujuy Salta Entre Ríos TucumánMendoza Córdoba Buenos Aires Santa FeTheil's T Statistic
Theil's T Statistic

15
are in the South of Argentina and are part of the Patagonian region. Of the five
provinces included, Buenos Aires City contributed the most to the increase in inequality
during these years. The provinces most negatively affected by falling relative income
shares have been Mendoza, Cordoba, Buenos Aires province and Santa Fe.
Pay Inequality by Region: What Explains These Trends?
Buenos Aires City, the region that contributed the most to inequality from 1994
to 2005, has the highest GDP per capita among Argentine provinces. It enjoys relatively
low levels of poverty and unemployment. In addition, Buenos Aires City is the main
urban area in the country and is unique in terms of the share of the service sector in its
GDP. By the year 2001, the service sector accounted for 74 percent of its total GDP,
within which the share of the financial sector was 48 percent. The provinces of the
Patagonia region in the South of Argentina (Neuquen, Chubut, Santa Cruz and Tierra del
Fuego) also enjoyed above-average incomes during this period; their high GDP per
capita is related in part to significant petroleum sectors and a high participation of their
exports in the GDP. Furthermore, salaries in this region are as much as 30 percent
higher because it is considered an “Unfavorable Zone” and thus firms have to provide
employees additional incentives to relocate to these regions.
Paradoxically, though reflecting the same trend observed in the analysis of
inequality by economic sector, the provinces that lost most in relative terms in the time
of rising inequality (Buenos Aires, Santa Fe, Cordoba and Mendoza) can be distinguished
by the size and diversity of their economies. These provinces are the main exporting
provinces in the country and their economic structures are characterized by important
manufacturing sectors.
The January 2002 devaluation also accounts for a number of changes regarding
the relative position of some provinces. On one hand, Buenos Aires City has lost relative
position. The other provinces with above average incomes (Neuquen, Chubut, Santa
Cruz and Tierra del Fuego) have improved their relative position since the devaluation

16
because their economic expansion translated into increases in salaries. Changes in
relative prices allowed these provinces to increase their exports and spurred increased
activity in the tourism sector. Specifically, these petroleum-producing provinces are in
good economic conditions due to the rise in the price of petroleum in the international
market in the last years.
For example, in 2003, the province of Chubut generated $472 million in
petroleum sales in comparison with $368 million in revenue from sales of petroleum in
the previous year. Income from petroleum-related activities represented approximately
44 percent of the province’s GDP. Similar to Chubut, Santa Cruz received $507 million
in 2003 versus $299 million in 2002. This income represented 40 percent of Santa Cruz’s
GDP. Finally, the province of Neuquen generated the greatest amount of revenues from
its petroleum exports. In 2003, it generated $1.7 billion, representing 58 percent of its
GDP. (La Nacion, Provincias Petroleras ya dieron aumentos salariales, August 16, 2004).
In conclusion, Figure 6 shows how the provinces of low-to-average income
(Buenos Aires province, Cordoba, Santa Fe, Mendoza) are those with diverse economies
of which the manufacturing sectors plays a key role. Conversely, those provinces that
were most favorably situated are those in which the extractives industries are the
principal economic activity (Neuquen, Chubut, Santa Cruz and Tierra del Fuego) or
where economic activity is based mainly in the service sector (within which the finance
sector factors significantly), as in the case of Buenos Aires city. Our method thus
illustrates how the neoliberal transition has favored specialized extractive industries and
the banks, at the expense of labor-based production.

17
VI. Pay Inequality in Brazil: 1996-2003
The following section examines the main trends in inequality in Brazil from 1996 to
2003. The following calculations were made : a) the general trend in inequality considering
sectoral and regional components, b) the contribution of each economic sector to overall
pay inequality and c) the contribution of each region to overall pay inequality.
Two main conclusions can be drawn from the sectoral analysis. The financial sector
and the civil service sector are the biggest contributors to inequality in Brazil during the
period of study. Conversely, the wholesale and retail sector is the hardest hit. At the regional
level, we observe that the state of Sao Paulo and to a lesser extent Brasilia (federal district)
are the biggest contributors to overall inequality in Brazil during this period.
Figure 7: Inequality by Sector and Region (1996-2003)
Source: Authors’ calculations based on IBGE data
The calculations made to measure the general trend in pay inequality considering both the
sectoral and regional components show four clearly differentiated stages. During the first
stage (1996-97), pay inequality was stable in Brazil. Pay inequality increased in the second
stage, which lasted just one year from 1997 to 1998. In the third stage, occurring from 1998
0.08
0.09
0.1
0.11
0.12
0.13
0.14
1996 1997 1998 1999 2000 2001 2002 2003
Thei
l's T
Sta
tistic

18
to 2001, a downward trajectory is observed. Finally, from 2001 to 2003 a stable trend can be
observed. The economic program underlying the general decrease in inequality in Brazil
across this time period is the Plan Real. The plan was successful at reducing inflation, which
created stability, which in turn created a basis for economic growth.
What it is most remarkable in Figure 7 is the downward trend in inequality following
the devaluation of the Brazilian currency, which occurred in January 1999. After the
devaluation, Theil values follow a downward sloping pattern, as was also the case in
Argentina. This downward trend is explained by three primary factors:
a) improvement in the economic activity of the primary sector as a result of changes
in relative prices after the devaluation and increases in the prices for some Brazilian export
commodities;
b) reduction in the participation of the financial sector, by far the biggest contributor
to inequality until 1999;
c) improvement in the participation of the civil sector, which had already contributed
positively to increase inequality, improved its relative position to the extent that it became
the largest contributor, surpassing the financial sector.

19
Contributions to Inequality by Sector
The trend in pay inequality by sector, as shown in Figure 8, closely follows the trend
in overall inequality in Brazil displayed in Figure 7.
Figure 8: Pay Inequality by Economic Sector
Source: Authors’ calculations based on IBGE data.
As described above, the primary contributions to changes in the calculated Theil
values are associated with changes in the relative positions of various sectors in the Brazilian
economy. The contributions of each sector to the annual Theil values are displayed in Figure
9.
0.06
0.08
0.1
0.12
0.14
1996
1997
1998
1999
2000
2001
2002
2003
Thei
l's T
Sta
tistic
20
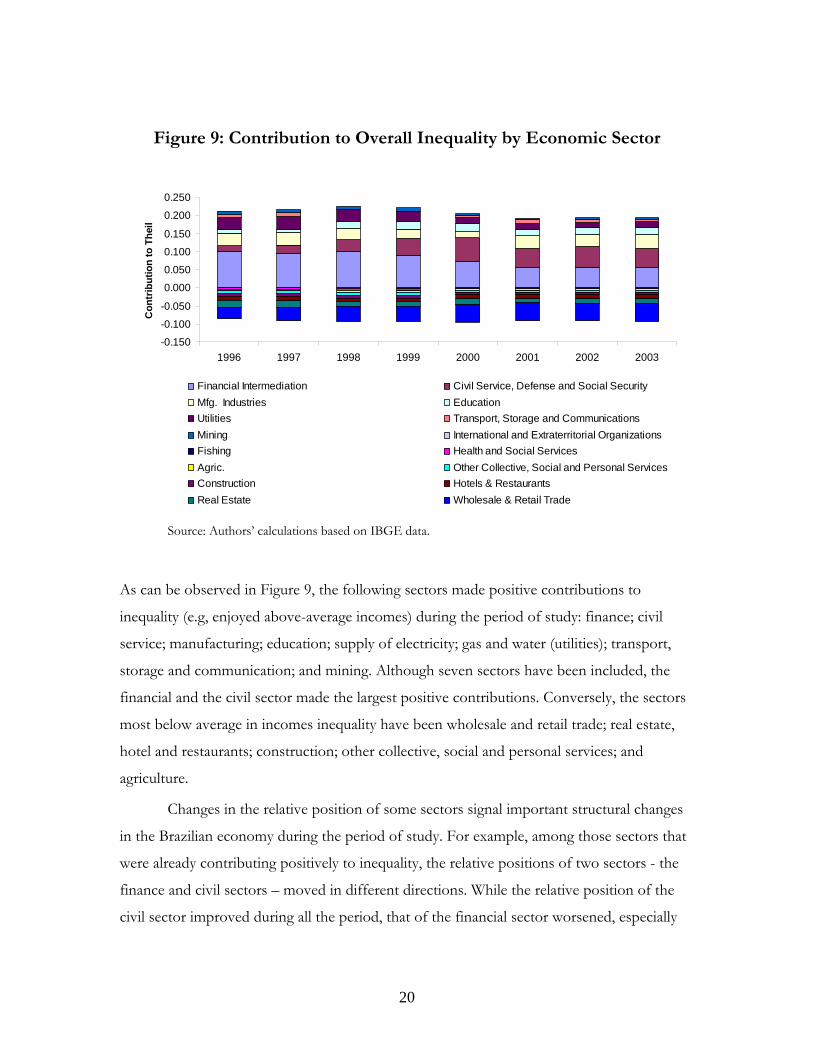
Figure 9: Contribution to Overall Inequality by Economic Sector
Source: Authors’ calculations based on IBGE data.
As can be observed in Figure 9, the following sectors made positive contributions to
inequality (e.g, enjoyed above-average incomes) during the period of study: finance; civil
service; manufacturing; education; supply of electricity; gas and water (utilities); transport,
storage and communication; and mining. Although seven sectors have been included, the
financial and the civil sector made the largest positive contributions. Conversely, the sectors
most below average in incomes inequality have been wholesale and retail trade; real estate,
hotel and restaurants; construction; other collective, social and personal services; and
agriculture.
Changes in the relative position of some sectors signal important structural changes
in the Brazilian economy during the period of study. For example, among those sectors that
were already contributing positively to inequality, the relative positions of two sectors - the
finance and civil sectors – moved in different directions. While the relative position of the
civil sector improved during all the period, that of the financial sector worsened, especially
-0.150
-0.100
-0.050
0.000
0.050
0.100
0.150
0.200
0.250
1996 1997 1998 1999 2000 2001 2002 2003
Con
trib
utio
n to
The
il
Financial Intermediation Civil Service, Defense and Social SecurityMfg. Industries EducationUtilities Transport, Storage and CommunicationsMining International and Extraterritorial OrganizationsFishing Health and Social ServicesAgric. Other Collective, Social and Personal ServicesConstruction Hotels & RestaurantsReal Estate Wholesale & Retail Trade

21
after the devaluation in January, 1999. The shrinking of the financial sector explains the
downward pattern of pay inequality after 1999.
The relative position of some of the poorest sectors also changed. For example, the
negative contribution of the wholesale and retail trade sector increases (becomes more
negative) between 1996 and 2003. In the case of real estate, the size of its negative
contribution to inequality decreases with time.
Decomposing changes in inequality into the effects of changes in relative incomes
and the effects of changes in the relative size (employment) of certain sectors allows for
deeper understanding of the causes of the changes in the relative positions of the most
important sectors. Figure 10 shows the contributions to the population and income effects
of selected sectors.
Figure 10. Population and Income Effect, 1996 - 2003
Source: Authors’ calculations based on IBGE data.
The decrease in the contribution of the financial sector is seen in both the population and
the income effects; in both cases, its effect is negative. The sector’s large negative population
outweighs the income effect, and can be explained in large part by automation of many
banks. During this period the workforce decreased from 638,652 (3.35% of the total
workforce) to 601,614 employees (2.11%). The financial sector’s mean wage dropped in
-0.1-0.08-0.06-0.04-0.02
00.020.040.060.08
Population Effect Income Effect
Con
trib
utio
n to
The
il
Financial Intermediation, Insurance and Related Services.Supply of Electricity, Gas and WaterManufacturing IndustriesWholesale & Retail Trade and Repair WorkshopsCivil Service, Defense and Social Security

22
relation to the country’s average wage. In 1996, the financial sector’s mean wage is 2.87 times
higher than the country’s average wage; in 2003, it is just 2.65 times higher.
The reduction of the financial sector’s contribution to inequality is accompanied by
an increase in the contribution of the civil service sector. Figure 10 shows that the civil
service sector’s negative population effect is outweighed by its large positive income effect.
As such, the sector’s positive contribution to changes in inequality over the time period are
related to a relative boost in sector salaries. While the absolute number of jobs in the civil
service sector increases from 5.3 million to 6.7 million between 1996 and 2003, employment
in the sector decreases from 28 percent of the workforce to below 24 percent. In 1996, the
sector’s mean wage is exactly the same as the country’s average wage. However, by 2003 the
mean wage is 15.5 percent higher than the country’s average wage. Gains in relative wages in
the civil service sector are in part due to the strength of its labor union.
The wholesale and retail trade sector makes the largest negative contribution to
inequality in Brazil because it employs a large percentage of the population and pays poorly.
An increasingly larger percentage of the workforce is employed in this sector (from 9.2
percent in 1996 to 17.4 percent in 2003). The average job in this sector paid 44 percent of
the country’s average wage in 1996 and 61 percent in 2003. While relative incomes grew,
they remain well below average.
Reduction of both total employment and salaries earned in the utilities sector
demonstrates the impact of the privatization of this sector that accompanied implementation
of the Washington Consensus. The total number of jobs in this sector dropped by 20
percent, and wages earned also dropped, by more than 9 percent.
Finally, wage and job participation are stable in the manufacturing sector during this
period. The sector employed just under 20 percent of the Brazilian workforce and paid 1.1
times the country’s average wage in both 1996 and 2003.

23
Inequality among Regions
Figure 11: Inequality by Region
Source: Authors’ calculations based on IBGE data.
Inequality by region was generally increasing from 1996 until 2001, after which regional
inequality returned to 1999 levels, as shown in Figure 11. Changes in regional inequality in
Brazil are closely tied to changes in the relative position of Sao Paulo; when its relative
contribution increases, overall inequality increases, and vice versa.
0.03
0.04
0.05
1996 1997 1998 1999 2000 2001 2002 2003
Thei
l's T
Sta
tistic

24
Contribution by Region
Figure 12: Contribution to Inequality by Region
Source: Authors’ calculations based on IBGE data.
During the period under study (1996-2003) the following states enjoyed above-
average incomes and made large positive contributions to increasing inequality: Sao Paulo,
Brazilia (federal district) and Rio de Janeiro. Of these three the largest contributor is Sao
Paulo, the richest and most populous state in Brazil. In 2003, about 30 percent of workers
employed in Brazil held jobs in São Paulo. Sao Paulo accounts for 40 percent of the jobs in
the financial sector, 37 percent of jobs in the real estate sector, 36 percent of manufacturing
jobs, and 33 percent of jobs in health and social services. Brasilia makes a large positive
contribution to regional inequality because it is the country’s political center, and as such
employs a large percentage of the civil service. Finally, Rio de Janeiro also contributes
positively due to its oil production and civil service. A vast majority of states contribute
negatively to regional inequality in Brazil. Because their shares of both population employed
-0.10
-0.05
0.00
0.05
0.10
0.15
0.20
1996 1997 1998 1999 2000 2001 2002 2003
Cont
ribut
ion
to T
heil
0.00
0.02
0.04
0.06
0.08
0.10
0.12
0.14
Thei
l's T
Sta
tistic
Sao Paulo Distrito Federal Rio de Janeiro Rio Gde Sul AmapaAmazonas Roraima Acre Rondonia TocantinsEspirito Santo Sergipe Mato Grosso Sul Mato Grosso PiauiMaranhao Para Alagoas Santa Catarina Rio Gde NorteParaiba Parana Goias Pernambuco Ceara Bahia Minas Gerais Theil's T Statistic

25
and of salaries earned are relatively small, no state stands out as a significant negative
contributor.
VII. Conclusions and Future research questions
Argentina and Brazil made similar transitions, under similar conditions, from import
substitution economic models to open market economies in the last 10 years. However, the
two countries experienced these changes differently. In Argentina, inequality rose sharply
with the failure of the Alfonsin efforts at stabilization in the 1980s, and again as the
neoliberal model took hold in the late 1990s, improving especially the relative position of the
banks and of Buenos Aires City compared to the rest of the country. In Brazil, large
increases in inequality had already occurred, beginning in 1982 with the debt crisis; there had
been a long experience of efforts to stabilize the economy by heterodox means, each of
which worked for only a short time. However, after 1993 Brazil was able substantially to
stabilize its macroeconomic environment, with the result that inequality fell in the following
years. Much of the decline, as we have seen, was due to a fall in the size of the financial
sector.
Through future research, we can perhaps learn the extent to which government
policies in Brazil allowed for a smooth transition while creating conditions for improvement
in the distribution of income in that country. We can also learn the extent to which the
policies and political decisions in Argentina that worsened that country’s inequality
contributed to the eventual collapse of its economy. Understanding the ways in which the
two countries implemented economic reforms and the consequences of these strategies may
provide insights into the effectiveness of given policies that can be used to illuminate future
policy objectives and their implementation.
Our principal point however, is a simple and definitive one. By disaggregating
changes in inequality into regional and sectoral effects, one can gain deep and reliable insight
into changing patterns of economic activity, and these can be of great value in forging
hypotheses about the underlying mechanisms of economic change.

26
References
Argentine Congress. Creation of the Integrated System of Retirement and Pension Benefits, 1993. Act: 24.241. Published in Boletin Oficial, October 1993, No 27.745. Online. Available: http://infoleg.mecon.gov.ar/infolegInternet/verNorma.do?id=639.
Argentine Congress. Convertibility Law, 1991. Act: 23.928. Published in Boletin Oficial, March, 1991, No 27.104. Online. Available: http://infoleg.mecon.gov.ar/infolegInternet/anexos/0-4999/328/norma.htm.
Bermudez, Ismael. “Desde la Devaluación, los sueldos pierden 7,2 % frente a la inflación.” Clarín (June 19, 2005), p. 14.
Buenos Aires City Website. Producto Bruto Geográfico de la Ciudad de Buenos Aires, Informe 101. Dirección General de Estadísticas y Censos. December 2003.
Castro, Maria Giselle. “Provincias Petroleras ya dieron aumentos salariales.” La Nación. (August 16, 2004), p.1.
De la Torre, Augusto; Levy Yeyati, and Schmukler, Sergio, “Argentina’s Financial Crisis: Floating Money, Sinking Banking,” World Bank 2002. Online. Available: http://www.nber.org/~confer/2002/argentina02/schmukler.pdf. Accessed: August 20, 2005.
Galbraith, James K. and Maureen Berner, eds. Inequality and Industrial Change: A Global View, Cambridge University Press, June 2001.
Galbraith James K. , Pedro Conceição, and Peter Bradford, "The Theil Index in Sequences of Nested and Hierarchical Grouping Structures: Implications for the Measurement of Inequality Through Time, With Data Aggregated at Different Levels of Industrial Classification," Eastern Economic Journal, 27(4), Fall 2001, 491-514.
Gasparini, Leonardo. “Un análisis de la distribución del ingreso en la Argentina sobre la base de descomposiciones.” In La Distribución del Ingreso en la Argentina. Fundación de Investigaciones Económicas Latinoamericanas (FIEL), Buenos Aires, 1999. Online. Available: http://www.fiel.org/publicaciones/Libros/ladistribucion.pdf.
_________. “Poverty and Inequality in Argentina: Methodological Issues and a Literature Review.” Centro de Estudios Distributivos, Laborales y Sociales (CEDLAS)-World Bank, 2004. Online. Available: http://www.depeco.econo.unlp.edu.ar/cedlas/monitoreo/pdfs/review_argentina.pdfAccessed: August 15, 2005.