The Correlation between Purchase Decision to Product Design in Nokia
78
CHAPTER I INTRODUCTION 1.1. Background of the Study Mobile phone is an electronic telecommunications device that is simple thinks that people can bring and have similar capabilities with a conventional fixed line. In Indonesia there are many mobile phone players like Motorola, Siemens, Nokia Samsung and Blackberry. For now Indonesia have 2 network that is GSM (Global System for Mobile Communication) and CDMA (Code Division Multiple Access). In Indonesia, business libration started since 1990, when government started the chance to tourist to mobile business phone with competition way. When GSM and CDMA come and change cellular technology generation that was already come to Indonesia. In 1995 Motorola produced mobile where the model is 5200, after that Nokia is launched the mobile phone in 1998 with the model is 1011. And then Iphone come to Indonesia in 2000 and blackberry come to Indonesia in with the product 8700 in 2004 with Indosat operator. Nokia Corporation is the biggest telecommunication producer in the world and the biggest in Filandia. The official office is in Espo city, Filandia, and everyone 1
Transcript of The Correlation between Purchase Decision to Product Design in Nokia
CHAPTER I
INTRODUCTION
1.1.Background of the StudyMobile phone is an electronic telecommunications device
that is simple thinks that people can bring and have
similar capabilities with a conventional fixed line. In
Indonesia there are many mobile phone players like
Motorola, Siemens, Nokia Samsung and Blackberry. For now
Indonesia have 2 network that is GSM (Global System for
Mobile Communication) and CDMA (Code Division Multiple
Access). In Indonesia, business libration started since
1990, when government started the chance to tourist to
mobile business phone with competition way. When GSM and
CDMA come and change cellular technology generation that
was already come to Indonesia. In 1995 Motorola produced
mobile where the model is 5200, after that Nokia is
launched the mobile phone in 1998 with the model is 1011.
And then Iphone come to Indonesia in 2000 and blackberry
come to Indonesia in with the product 8700 in 2004 with
Indosat operator.
Nokia Corporation is the biggest telecommunication
producer in the world and the biggest in Filandia. The
official office is in Espo city, Filandia, and everyone1
knows this company is mobile phone company product. Nokia
producing mobile phone in the whole market and first
protocol including GSM, CDMA, W-CDMA (UMTS).
Nokia come from a community that leaves in Emakoski River
in south Filandia. Nokia exist as a mills company by
Fredeik Idestam in 1865. And then they tried phone
business with Salora in 1979, where they launching Nordic
Mobile Telephone, international operator is the first
mobile phone. In 1981 Nokia created mobile phone, Mobira
Senator in 1982. And then they come to Indonesia in 1998
with model 1011.
The function of advertising is not the only promotion
(Kotler: 2000); but could be information to the product
or service or to company as a media to alert consumers to
the product and service. In a row economic growth,
advertising is very important because consumer potential
will attention about advertising from the product that
he/she will buy.
According to Richard Y. K. Fung (2007) popularly called
styling in fact there is almost no literature looking
into manufacturing flexibility with the process of
product styling. This turns out to be a research niche
because to style the exterior of a product becomes the
final criterion for developing successful products,
especially when the functional and quality of most2
products have been improve to be identically the same.
According to Springer style is embedded within and
manifested through technology and function. Technology
factors must be considered in the analysis of style and
in the search for regularities between form and process.
According to Kotler and Amstrong (2010) product is
something that can offered to market to make consumer
satisfy, including physical goods, service, people,
property, information and idea. Marketers can
clarification the product base on durability, endurance
and usefulness.
According to Kotler and Amstrong (2010), define a product
as anything that can be offered to a market for
attention, acquisition, use, or consumption that might
satisfy want or need. Product design includes label,
durability, unique, style, performance, persons, place,
and ideas or mixed of these entities.
Purchase decision is Consumer perceive risk in making a
purchase decision can be reduce by providing sufficient
information that reinforce the customer is positive
evaluation (Levmy & Weitz, 2009:110). Purchase decision
is the buyer is decision about which brand to purchase
(Kotler, 2008:140). After making a purchase, the customer
uses the product and then evaluates the experience to
3
determine whether it was satisfactory or unsatisfactory
(Levy & weitz, 2009:111).
Consumer gain knowledge of the meaning, that the end of
this through their in the past of experience to a
product. When they use the product or they watch people
that using the product. Consumers learn they have
consistency that can help them to get the objective and
important point. Situation self-relevance is determined
by the physical and social aspects of the environment
around us to immediately active the consequences and
importance thus making the products and brand seen
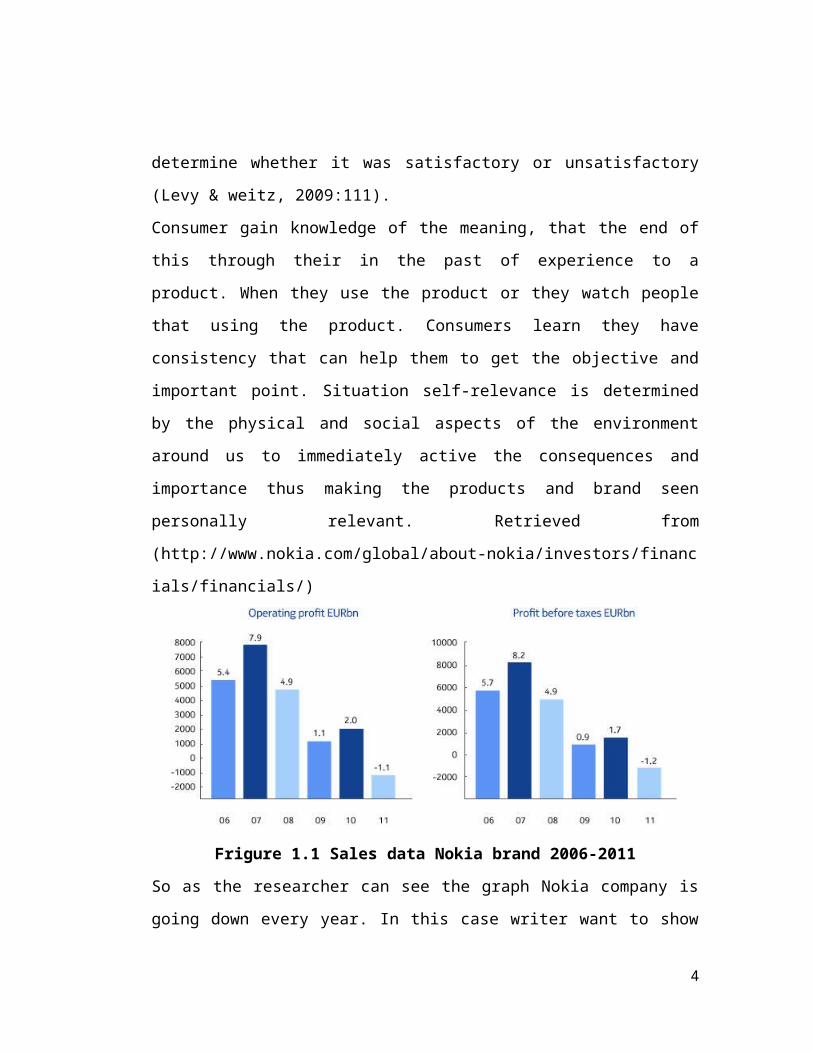
personally relevant. Retrieved from
(http://www.nokia.com/global/about-nokia/investors/financ
ials/financials/)
Frigure 1.1 Sales data Nokia brand 2006-2011
So as the researcher can see the graph Nokia company is
going down every year. In this case writer want to show
4
what is the causes of decreasing buying or profit of this
company.
1.2.Company ProfileIn 1865, mining engineer Fredrik Idestam sets up his
first wood pulp mill at the tammerkoski Rapids in south-
western finland. A few years later he opened a second mil
on the banks of the Nokianvirta River, which inspires hin
to name his company Nokia Ab in 1871. By the late 1970
and early 1980s it seems everything – from tom Selleck is
moustache to JR Ewing is list of enemies – is seriously
big. And as the mobile communications revolution starts
to gather momentum, the early handset continues the
trend. Retrieved from (http://www.nokia.com/global/about-
nokia/company/about-us/story/the-nokia-story/)
In 1912, arvid Wickstrom sets up Finnish Cable works the
foundation of Nokia is cable and electronics business. In
1960s, they were starting branching out electronics. And
1963, they starts build electronic device and developed
radio telephones for the army and emergency service –
Nokia is first foray into telecommunications. In 1987,
GSM (Global System for Mobile communications) is adopted
as the European standard for digital mobile technology.
With its high-quality voice calls, international roaming
5
and support for text message, GSM ignites a global mobile
revolution
(http://www.nokia.com/global/about-nokia/investors/financ
ials/financials/)
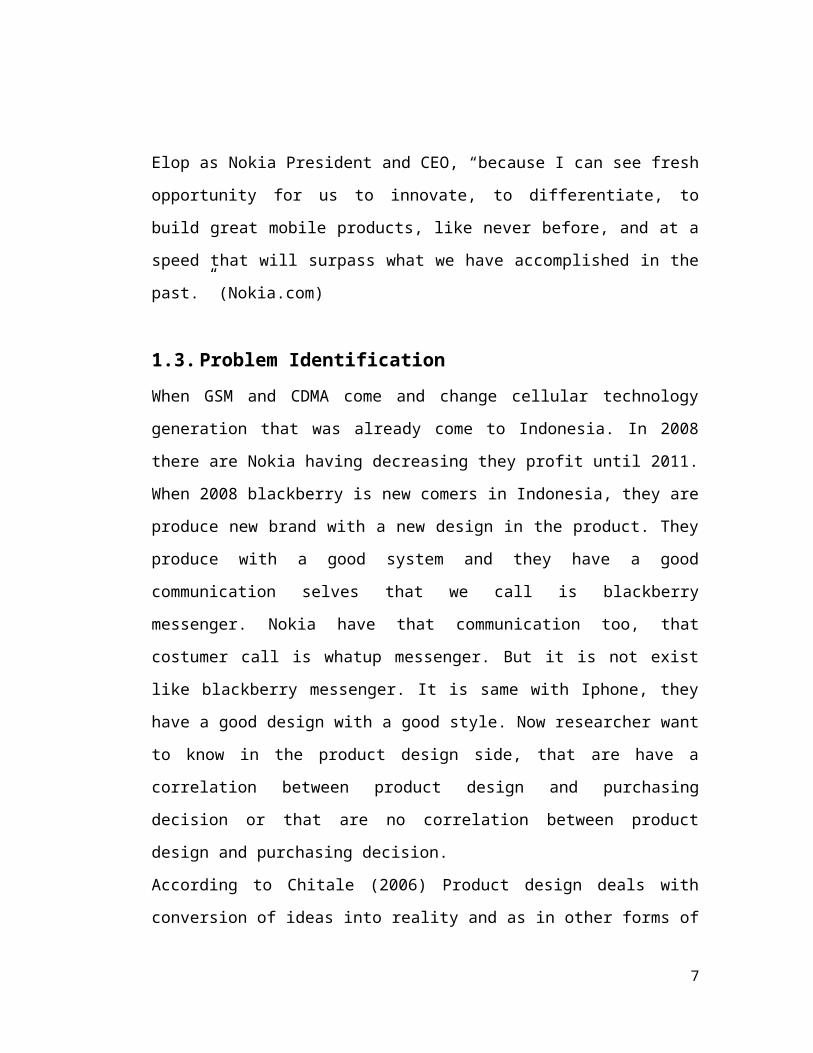
1.2.1 Company structure
Figure 1.2 Company Structure
1.2.2 Company vision and strategy
Nokia is mission is simple: connecting people. Our goal
is to build great mobile products that enable billions of
people worldwide to enjoy more of what life has to offer.
Our challenge is to achieve this in an increasingly
dynamic and competitive environment (Nokia.com)
Nokia is strategy is about investing in and ensuring
Nokia future. “I have incredible optimism,” said Stepehn
6
Elop as Nokia President and CEO, “because I can see fresh
opportunity for us to innovate, to differentiate, to
build great mobile products, like never before, and at a
speed that will surpass what we have accomplished in the
past.” (Nokia.com)
1.3.Problem IdentificationWhen GSM and CDMA come and change cellular technology
generation that was already come to Indonesia. In 2008
there are Nokia having decreasing they profit until 2011.
When 2008 blackberry is new comers in Indonesia, they are
produce new brand with a new design in the product. They
produce with a good system and they have a good
communication selves that we call is blackberry
messenger. Nokia have that communication too, that
costumer call is whatup messenger. But it is not exist
like blackberry messenger. It is same with Iphone, they
have a good design with a good style. Now researcher want
to know in the product design side, that are have a
correlation between product design and purchasing
decision or that are no correlation between product
design and purchasing decision.
According to Chitale (2006) Product design deals with
conversion of ideas into reality and as in other forms of
7
human activity, aims at fulfilling human needs. A
designer does not usually produce the goods or service
which immediately satisfy consumer is needs. Rather, he
produces the prototype which is used as a sample for
reproducing the particular goods or services as many
times as required.
Product design is that producer made something to attract
consumer to buy the product. Purchasing decision is when
the costumer wants to buying something that they need
he/she will follow the process. Such as need recognition,
information search, consuming and post-purchasing.
1.4.Statement of the ProblemBased on the case above, researcher states the problem is
1. What is the correlation between product design and
purchasing decision?
2. How big the correlation between product design and
purchasing decision is?
1.5.Research Objectives1. To know the correlation between product design and
purchasing decision
2. To know how big the correlation between product
design and purchasing decision is
8
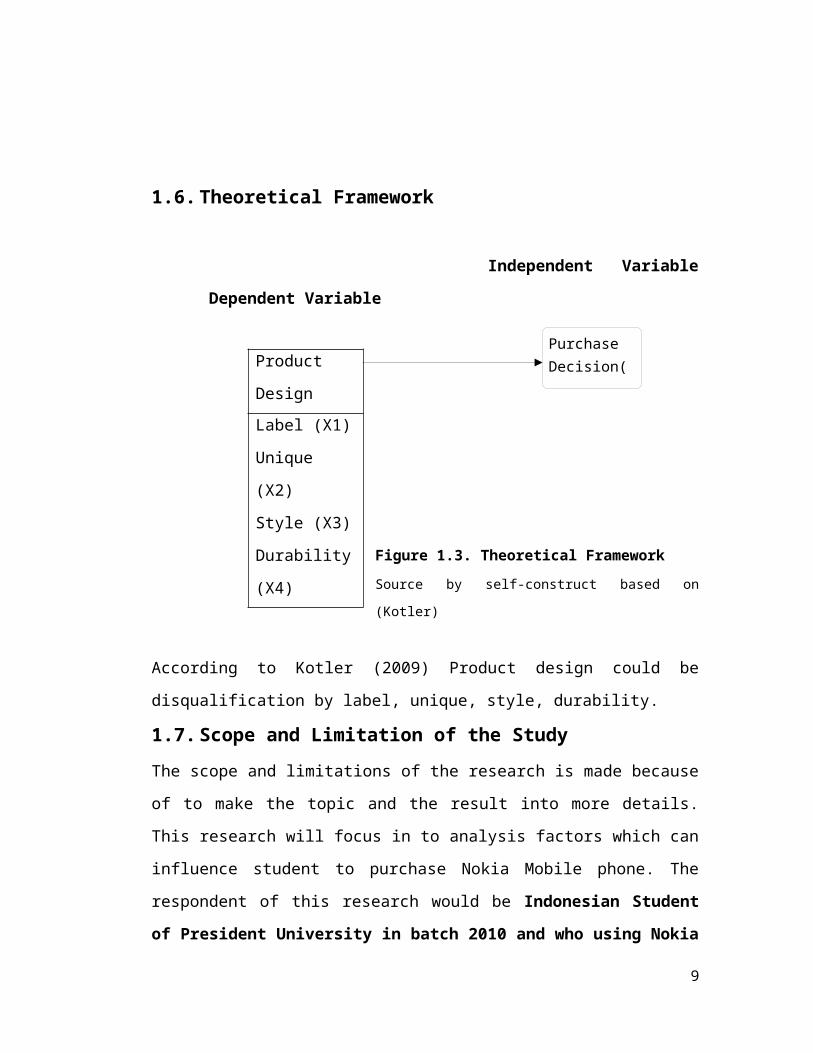
1.6.Theoretical Framework
Independent Variable
Dependent Variable
Figure 1.3. Theoretical FrameworkSource by self-construct based on
(Kotler)
According to Kotler (2009) Product design could be
disqualification by label, unique, style, durability.
1.7.Scope and Limitation of the StudyThe scope and limitations of the research is made because
of to make the topic and the result into more details.
This research will focus in to analysis factors which can
influence student to purchase Nokia Mobile phone. The
respondent of this research would be Indonesian Student
of President University in batch 2010 and who using Nokia
9
Purchase Decision(Y)
Product
DesignLabel (X1)
Unique
(X2)
Style (X3)
Durability
(X4)
mobile phone regarding to get the specific factors that
influence young generation in order to purchase the Nokia
product. Thus the limitation of this research is focus
only to the Nokia mobile phone sales in 2008-2011 is
product design.
1.8.HypothesisH0: Product design do not influence the sales of Nokia in
Indonesia
H1: Product design is influence the sales of Nokia in
Indonesia
1.9.Definition of TermProduct design: is
Label is one of the most crucial steps in the process of
building a stable pattern of deviant behavior is likely
to be the experience of being caught and publicly labeled
as a deviant.
Unique is pattern that differentiates the product with
another competitor. Product unique will make consumer
easier to identifying the product and that will make
consumer can more interesting to buy and because of that
can easier to identify the product to consumer.
10
Style is subjective measure, which describes how the
product looks and feels to the buyer.
Durability is measure of product is expected operating
life under natural or stressful conditions. This valued
attribute to certain products. Purchase decision is
CHAPTER II
LITERATURE REVIEW
2.1 Theoretical descriptionAccording to Kotler and Amstrong (2010), define a product
as anything that can be offered to a market for
11
attention, acquisition, use, or consumption that might
satisfy want or need. Product design includes label,
unique, style, performance, persons, place, and ideas or
mixed of these entities.
2.2 Product attributes definitionThe product attributes can give a clear clue about the
product. In order to give a good clue for the product,
the writer supposes the definition of the product
attributes from some specialist:
Whereas according to Kotler and Amstrong (2010), the
product attribute is a development of product and service
that giving a function definition that they insipid.
2.2.1 Product attribute element
According to Kotler and Amrtrong (2010), product
attributes have three important categories which are
product quality, product feature, and product design.
Product quality is according to the ability of a product
to perform its functions. Good quality will impact and
give some trust to the consumer. Product features is
competitive tools which give some differentiation to a
product with the other competitive product. For example,
the feature is competitive toll for the company is
12
product. Product design has an own concept about the
product. According to the design, it’s a special totality
that it could influence the presentation of product
function.
2.3 Product designAccording to Lambert M. Surhone (2010), product design
deals with the conversion of ideas into reality and the
other forms of human activity, aims at fulfilling human
needs. A designer does not usually produce some goods or
services which immediately satisfy the consumer needs.
Rather, it produces the prototype which is used as a
sample for reproducing of the particular goods or
services as many times as required. A design may be a
pattern on upholstery or a dress in fashion world. If the
producer believes that the sufficient number of customers
will be satisfied by the product, then mass production of
the item or services may be taken by the production
department.
Design is the factor that has to get more attention from
the management, especially to develop the product team.
13
Because the target is not least, they think about the
design of the product. According to Kotler and Amstrong
(2009), define a product as anything that can be offered
to a market for attention, acquisition, use, or
consumption that might satisfy want or need. Product
design includes label, durability, unique, style,
performance, persons, place, and ideas or mixed of these
entities.
2.3.1 Label
Related to layouts designs are studies which is dealing
with physical product labeling. Capturing eye movements
over products arrange on real or mock supermarket shelves
may require a head-mounted eye tracker (Li et Al (2006)).
Alternatively, label design may be compared by viewing
different design on the desktop or background.
a. Brand label, is the name of product which is given
to the product in the parcel.
b. Descriptive label is the label that giving an
objective information of product and another
characteristic which related with the product.
c. Label grade, is the label that giving identification
about the product, judge quality with letter,
number, and word.
14
According to John Wiley (2007), labeling was mainly
developed in the fields of criminological and health
research during 1960’s. Marked as an important extension
of symbolic interactionism, which deals in many ways with
some of the major problems, we encountered with Goffman.
It is most associated with Edwin Lenert and Howard
Becker. Labeling theory, the idea about the meaning of
selves, plays a key role in social life. Yet its general
orientation is compatible with more macro understandings
of how culture works.
Based on Jane Smith (2005), one of the most crucial steps
in the process of building a stable pattern of deviant
behavior is likely to be the experience of being caught
and publicly labeled as a deviant.
2.3.2 Unique
According to Kotler (2009), product is something that can
be offered to the market to make consumer satisfy,
including physical goods, service, people, property,
information and idea. Marketers can clarify the product
based on durability, endurance, and usefulness. And
consumer consists of some various classes of people who
have taste. Therefore, the merchant may choose one of the
ways below:15
1. Provide one variety goods.
2. Provide a variety of groups with many similarities.
3. Provide plenty of variety and types of goods.
Based on Rosen (2005), product unique is a pattern that
differentiates the product with another competitor.
Product unique will make the consumer to be easier for
identifying the product and it will make them more
interesting for buying the product because it becomes
easier for them to identify the product. According to
International Monetary Unique product, a product is only
manufactured once in the specification of an individual
customer. A unique selling proposition (UPS) is a
description of the qualities, which is unique for a
particular product or service. And that differentiate it
in a way which will make the customers purchase it rather
than it is rivals (Retrieved from
http://www.economist.com/node/14301696_) based on Kotler
(2008).
2.3.3 Style
Based on Kotler (2009), style is subjective measure,
which describes how the product looks and fills to the
buyer. Normally, the car buyers select a premium type for
the products, which are attractively styled. Some16
products are yawn producing rather than eye-catching.
Exceptional styling has the advantage of creating
products distinctiveness that makes it hard for the
competitors to imitate. Packaging is also a component of
style of consumer products. According to Lee et Al.
(2009), to represent the style in consumer life, there
are 3 variables to style:
1. Fashion consciousness is a consumer lifestyle that
they are young people who have better educate and
have higher incomes. Product innovative will be seen
as a part of a fashionable lifestyle.
2. Leisure orientation is a lifestyle that consumer
regards as a people who will try a new style. In
this variable people who will adopt a higher
technology or people who always update their
technology.
3. E-Shoppers inclined an innovator, they are happy the
way e-channel offered, and they have more shopping
experience then people who do not buy in e-shoppers.
According to Richard Y. K. Fung popularly called styling.
In fact, there is almost no literature which looking into
manufacturing flexibility with the process of product
styling. This turns out to be a research niche because
the exterior style of a product becomes the final17
criterion to developing a successfuls product, especially
when the functional and the quality of most products have
been improved to be identically same. Based on Springer,
style is embedded within and manifested through
technology and function. Technology factors must be
considered to the analysis of style and to the search of
regularities between form and process.
2.3.4 Durability
According to Kotler (2009), durability is a measure of
product which is expected to operating life under a
natural or a stressful condition. This value attributes
to a certain products. For example, the mobile phones
Nokia manufacture claims that its mobile phone has a long
lifespan. Similarly, the Duracell battery manufacturer
claims that their products have a long lifespan. Most of
time, the customers will pay more for such of those
products. Based on Durability, the products can be
classified as:
a. Durable goods
b. Non-durable goods.
a. Durable goods
Durable goods are products which are used for long
term in months or years together. For examples, the18
products are refrigerator, car, and washing machine.
These goods generally require more of personal selling
efforts and have a high profit margin. In case of
these goods, seller is a reputation. Also presale and
after-sale service are important determinants of
purchase decision.
b. Non-durable goods
Non-durable goods are products that are normally
consumed in one way or last for a few uses. For
examples, the products are soap, salt, pickles, and
sauce. These items are consumed quickly and the
consumers purchase these goods more often. Those items
are generally made available by the producer through
large number of convenient retail outlets. Profit
margins usually keep it low and heavy on these items.
Advertising is made to attract the people toward their
trial and use it.
According, to The MIT Press Consumer, gross surplus is
fixed as long as the product “works”. Then, quality is
measured by the amount of time between purchase and
breakdown of the product. According to Edward Elgar,
divides product durability with three goals in mind.
First, we wish to illustrate the extension of the
paradigm to an intertemporal setting. By its nature,19
product durability has a potential strategic value only
in interteporal setting. Second demonstrate it’s how the
paradigm can be used to endogenize market structure.
Third, examine the nature of bias, if any, in product
durability which strategic choice of durability entails.
2.4 Purchase DecisionConsumer perceives risk in making a purchase decision. It
can be reduced by providing sufficient information that
reinforces the customer, is a positive evaluation (Levy &
Weitz, (2009)). Purchase decision is the buyer decision
about which brand to purchase (Kotler (2009)). After
making a purchase, the customer uses the product and then
evaluates the experience to determine whether it was
satisfactory or unsatisfactory (Levy & weitz, 2009:111).
2.4.1 Purchase decision process
Purchase decision process is a process that can solve a
problem (John Dewey, Engle, 2000). The key of the
purchase decision process is an integrated process that
knowledge could be combined to evaluate many alternatives
and finally to choosing the product. And the result of
the choosing is a cognitive that reputed as intention
20
behavior which can be referred then as the plan to be
bounded in one or more behaviors (Peter & Olson 2002).
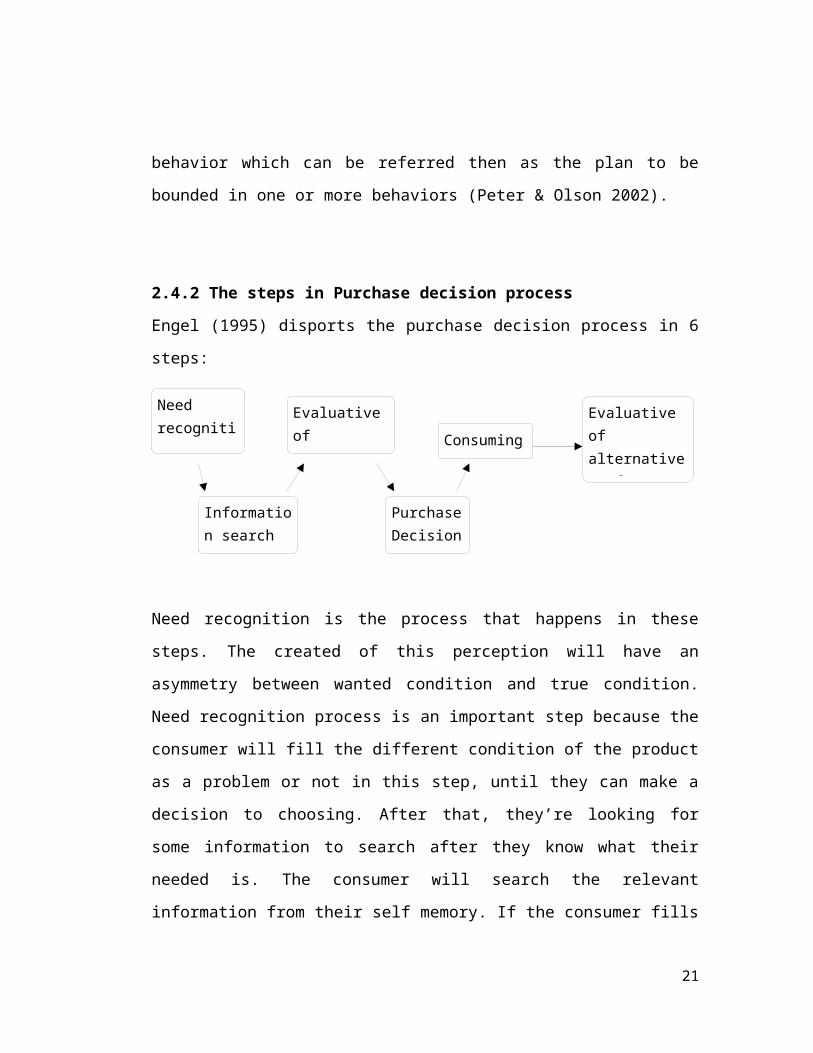
2.4.2 The steps in Purchase decision process
Engel (1995) disports the purchase decision process in 6
steps:
Need recognition is the process that happens in these
steps. The created of this perception will have an
asymmetry between wanted condition and true condition.
Need recognition process is an important step because the
consumer will fill the different condition of the product
as a problem or not in this step, until they can make a
decision to choosing. After that, they’re looking for
some information to search after they know what their
needed is. The consumer will search the relevant
information from their self memory. If the consumer fills
21
Need recognition
Information search
Evaluativeof alternativ
PurchaseDecision
ConsumingEvaluative of alternatives after
not enough, they will search from the external that is
the information which search from them.
Supposed, they will ask to their friends, their family,
or from other sources such as the consumer magazine and
the advertising. Market source supposes from the store
staff or could immediately be trying a product.
Evaluation alternative, in this step, the consumers will
be comparing the alternative after they’re buying the
product, evaluate the product, and choosing the best
product. And then, in this process, the purchase happens
when the consumer’s choosing how to buy the product when
they will buy the product, which store they have to buy,
and what they have to buy.
Consumer is not rare choosing to buy the different
product from what they already planed, because there is
another factors such as a discount that giving more
profit to the consumer. And then they consume the
product. In this step, the consumer will decide how to
consume the product that they have already bought.
The consumer could be using the product after they have
bought the product, or they will decide to save the
product for a while or they can keep the product in a22
period of time. And the last, the consumer will have some
evaluation after buying. In this step, they will evaluate
the product about how far their knowledge of the product
and how far that product satisfy the consumer. The
consumers will compare it and they hope when they do the
process of buying with the performance that the product
already gave. A satisfied respond will be appeared, if
the consumers fill the performance the product is good or
not.
According to William M. Pride (2011), the consumer buying
decision is beginning with the problem of recognition
through purchase and post-purchase evaluation. And then,
the consumers examine the situational of influence-
surroundings, time, purchase reason, buyer mood, and the
condition that will affect the purchasing decision. The
process of purchasing decision is problem recognition, an
information search, an evaluation alternative, a
purchase, and a post-purchase evaluation.
According to Springer, the process of buying decision is
becoming an active shopper, narrow the product choices,
select a retailer, and choose an item for purchase. With
regard to the same case (the buying decision). Charles W.
(2011) defines, there are five processes for buying23
decision, which are recognition, an information search,
an evaluation of alternative, a purchase, and the last
thing is a post-purchase evaluation.
2.4 SalesAccording to Karl Webber (2006), regulator was generally
unaware of the problematic sales to military member
because personnel rarely forwarded service member
complaints to them. Sales were also hampered by lack of
standardized data showing whether customers were
benefiting from their purchase. Although recognizing is a
greater need for sharing information on violations of its
solicitation policies and service member complaints, DOD
has not revised its policies to require that information
will be provided to financial regulator nor has it
coordinated with these regulators and its installations
on appropriate ways that additional sharing can occur.
According to Melissa C. (2009), for schools, churches,
sports team, events and corporation products are hot. If
you want to get into the highly profitable business of
selling custom printing, according to Kogan, the best way
to understand sales promotion is from inside. Get
involved in promotion: collect coupons, send in for
24
offers and seek out special deals. Sales promotion is
found whenever a supermarket offers “three for the price
of two”, a pub offers a happy hour, insurance or charity
mailer offers a free pen for replaying or a product
offers a free draw.
On the mobile phone too, if the permission has been
given, the offers will appear for drinks happy hours and
estate agents latest houses and flats coming on to the
market. Whatever you allow will be appeared. Now, the
mobile phone also can be used to respond the
advertisement or texting a number with a code word when
you buy a voucher mobile phone, so they will send a
feedback that includes access to a sales promotion
through a bar code reader at the point of purchase.
Based on Kotler (2010), although most sales promotion
increases sales, most lost the money. One analyst
estimated that only 17 percent of a given set of sales
promotion campaigns were profitable. Sales promotion only
attract brand switch looking for a lower price, who
naturally abandon the brand when another brand goes on
sale.
25
CHAPTER III
RESEARCH METHODOLOGY
3.1. Research MethodIn this research, the writer uses a quantitative research
method. It is used to know the correlation between the
product quality and the purchase decision. The following
definition of quantitative research method, taken based
on Goubner,D. Et al (2008: 21). This research conducts
with this method because this method is suitable with the
data, and the outcome of the calculation is very
objective to be analyzed. The purpose of this research is
to measure the analysis of correlation between the
product design and the purchase decision.
3.2. Time and Pace of ResearchThe research of this study was conducted by spreading
some questioner at President University in Cikarang. The
26
questioner was distributing to the student President
University during spare-time.
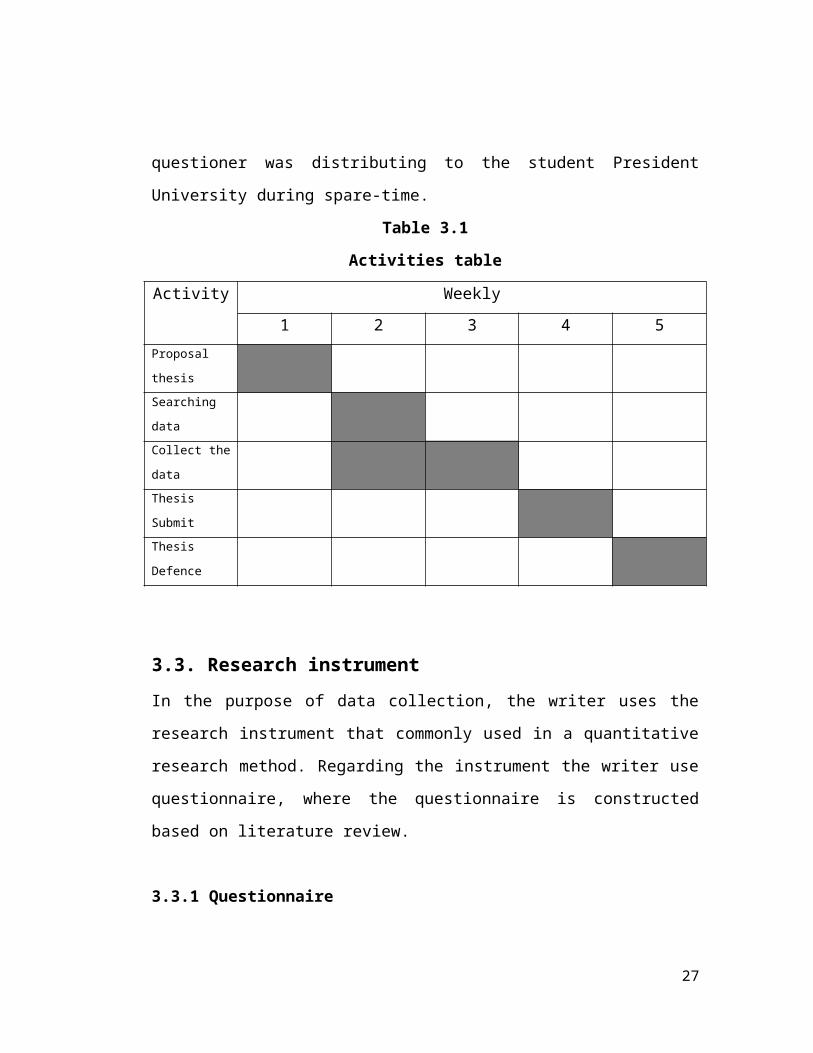
Table 3.1
Activities table
Activity Weekly1 2 3 4 5
Proposal
thesisSearching
dataCollect the
dataThesis
SubmitThesis
Defence
3.3. Research instrumentIn the purpose of data collection, the writer uses the
research instrument that commonly used in a quantitative
research method. Regarding the instrument the writer use
questionnaire, where the questionnaire is constructed
based on literature review.
3.3.1 Questionnaire
27
The writer will use that questionnaire to collect the
data in this research. According to Richardson, et al
(2005), questionnaire is a survey instrument that gathers
the required information for further investigation. A
questionnaire consists of a set of questions that will be
presented to the respondents. The reason of choosing the
questionnaire it is faster and cheaper to collect the
data. The researcher can also complete the survey in the
targeted time as well as in the lowest cost.
3.3.2 Question form
The dependent variable is purchased a decision. In this
study, the writer is going to explore the influence of
independent variable which is product at Nokia’s Company.
The questionnaire consists of three parts, the part A is
about the respondent identity (gender, age, marital
status, range, of their income), part B is contains about
the quality which is consist of 4 questions. And the last
part is the questions regarding purchasing decision at
Nokia Company which is consist of 5 questions.
3.3.3 Instrument Distribution
This research uses self-administered questionnaires,
which means the questionnaires delivered to the
respondent and by the time respondents finish answering28
the questions, the questionnaires will be submitted to
the researcher. Research chooses self-administered
questionnaires because of some reason:
1. Researcher can explain more detail of each question,
so it can prevent misunderstanding.
2. Reducing an error sampling as a result of returned
questioner.
The researcher will wait for the respondents while they
fill the questionnaire in order to when he/she did not
understand the question so research will cover or explain
the question slowly and clearly.
3.3.4 Scaling
This research uses Likert scales. A Likert scales is the
most frequently used variation of the summated rating
scale. Summated rating scales consist of statements that
express both of the favorable and unfavorable attitude
toward the object of interest (Cooper and Schindler,
2008). The participant is asked to agree or disagree by
each statement. The respondent will answer the questions
which is provided by the research in the questionnaire.
There are five points scales that will be used in the
questionnaire, “strongly, agree, neutral, disagree, and
strongly disagree”.29
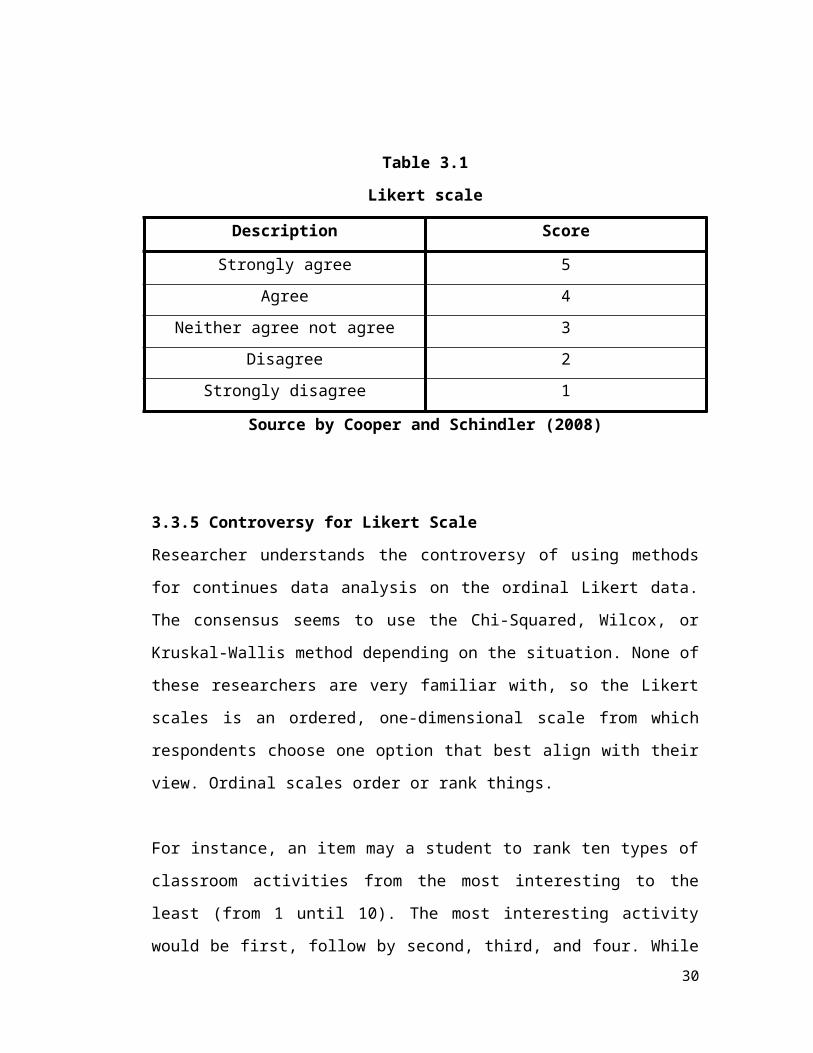
Table 3.1
Likert scale
Description Score
Strongly agree 5Agree 4
Neither agree not agree 3Disagree 2
Strongly disagree 1
Source by Cooper and Schindler (2008)
3.3.5 Controversy for Likert Scale
Researcher understands the controversy of using methods
for continues data analysis on the ordinal Likert data.
The consensus seems to use the Chi-Squared, Wilcox, or
Kruskal-Wallis method depending on the situation. None of
these researchers are very familiar with, so the Likert
scales is an ordered, one-dimensional scale from which
respondents choose one option that best align with their
view. Ordinal scales order or rank things.
For instance, an item may a student to rank ten types of
classroom activities from the most interesting to the
least (from 1 until 10). The most interesting activity
would be first, follow by second, third, and four. While30
the order is clear on such a scale, it is not clear what
the distances are along the ordering. So the ordinal
scales show us the order, but not between the distance
and the rankings. Sometime, such ordinal scales are also
called ranked scales. Interval scales show the order of
things, but with an equal between the points on the
scales. Thus, the distance between score of 50, 51, 52,
53 and forth are all assumed to be the same along the
scale. Test score is usually treated scales in language
research. Scales based on Likert items are commonly
treated as interval scales in our field.
3.4 Sampling DesignRichardson, et al (2005), defines sample is a subset of
the population being studied. In order to generalize from
a sample to a population, the sample must represent which
usually means that it is randomly selected.
3.4.1 Population
According to Cooper and Schindler (2008), “Population is
the total collection of elements about which we wish to
make some inferences”. Measuring the population is
important before start to collect the data. Because the
31
population has to determine first before determine the
sample. This research held at Nokia Company. The
population is the buyer of Nokia’s product at President
University, Cikarang.
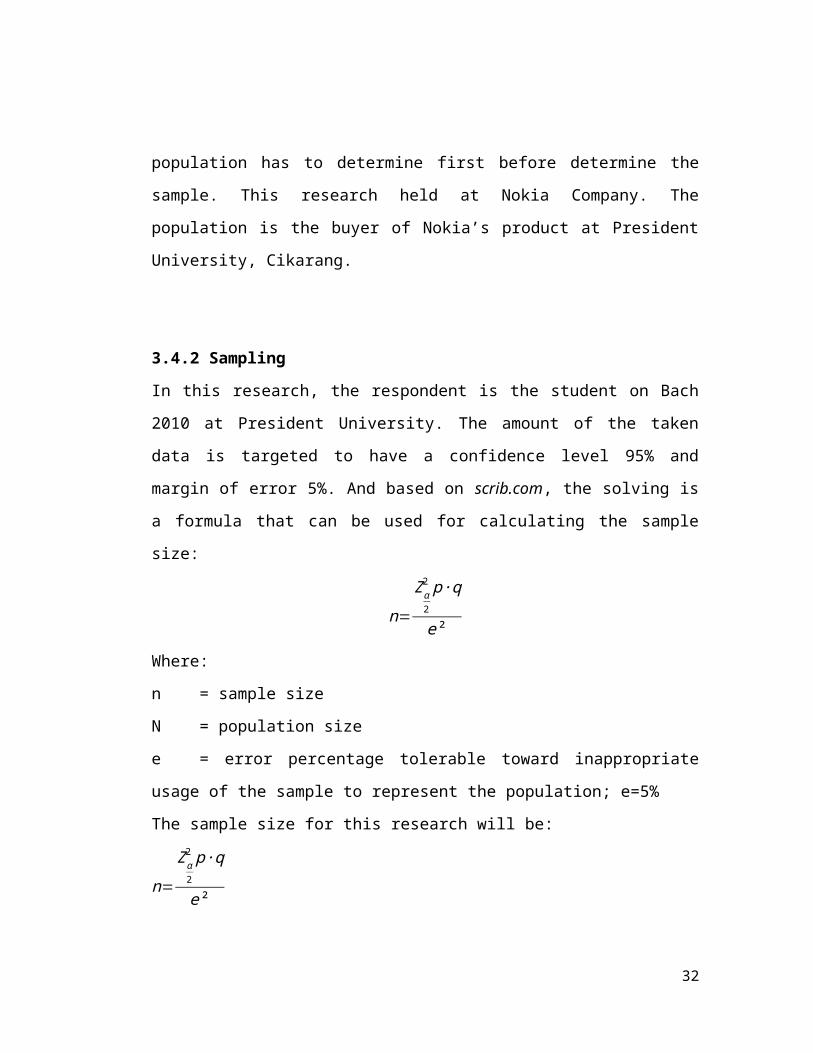
3.4.2 Sampling
In this research, the respondent is the student on Bach
2010 at President University. The amount of the taken
data is targeted to have a confidence level 95% and
margin of error 5%. And based on scrib.com, the solving is
a formula that can be used for calculating the sample
size:
n=
Zα2
2 p·q
e²Where:
n = sample size
N = population size
e = error percentage tolerable toward inappropriate
usage of the sample to represent the population; e=5%
The sample size for this research will be:
n=
Zα2
2 p·q
e²
32
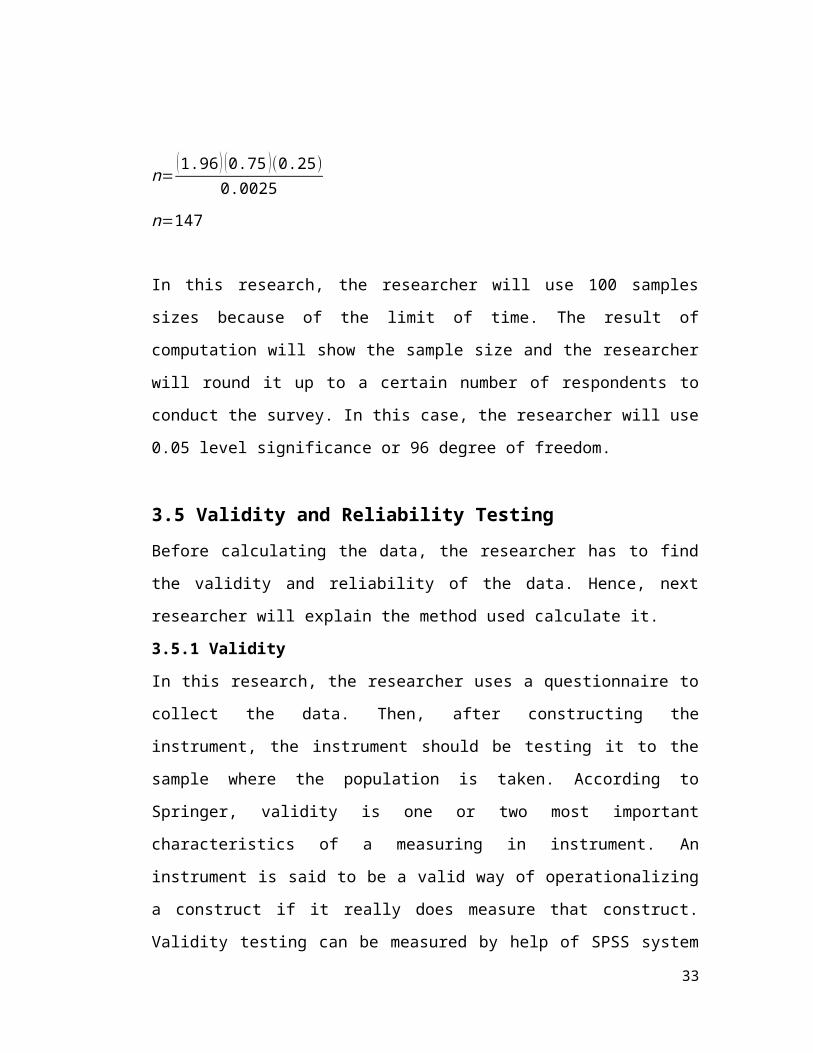
n=(1.96) (0.75 )(0.25)
0.0025n=147
In this research, the researcher will use 100 samples
sizes because of the limit of time. The result of
computation will show the sample size and the researcher
will round it up to a certain number of respondents to
conduct the survey. In this case, the researcher will use
0.05 level significance or 96 degree of freedom.
3.5 Validity and Reliability TestingBefore calculating the data, the researcher has to find
the validity and reliability of the data. Hence, next
researcher will explain the method used calculate it.
3.5.1 Validity
In this research, the researcher uses a questionnaire to
collect the data. Then, after constructing the
instrument, the instrument should be testing it to the
sample where the population is taken. According to
Springer, validity is one or two most important
characteristics of a measuring in instrument. An
instrument is said to be a valid way of operationalizing
a construct if it really does measure that construct.
Validity testing can be measured by help of SPSS system
33
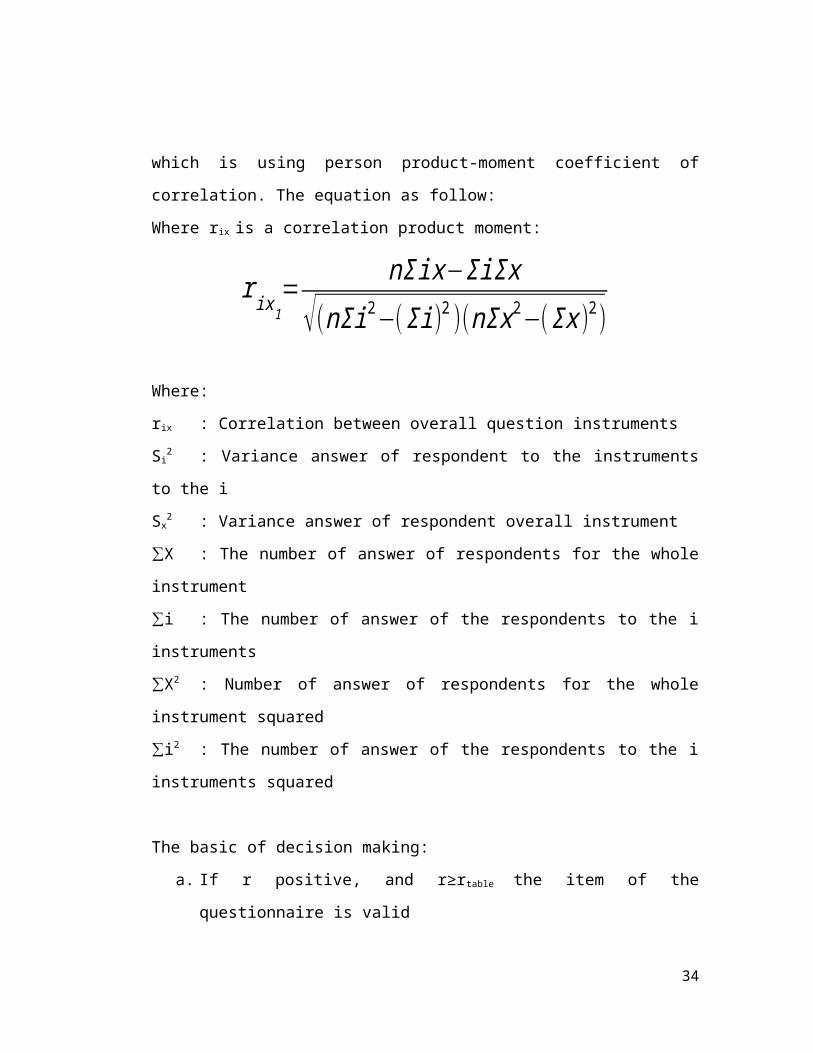
which is using person product-moment coefficient of
correlation. The equation as follow:
Where rix is a correlation product moment:
rix1=nΣix−ΣiΣx
√(nΣi2−(Σi)2 )(nΣx2−(Σx )2)
Where:
rix : Correlation between overall question instruments
Si2 : Variance answer of respondent to the instruments
to the i
Sx2 : Variance answer of respondent overall instrument
X∑ : The number of answer of respondents for the whole
instrument
i∑ : The number of answer of the respondents to the i
instruments
X∑ 2 : Number of answer of respondents for the whole
instrument squared
i∑ 2 : The number of answer of the respondents to the i
instruments squared
The basic of decision making:
a. If r positive, and r≥rtable the item of the
questionnaire is valid
34
b. If r negative, and r<table the item of questionnaire
is invalid
3.5.2 Reliability
Reliability testing is used to measure the reliability of
the instrument to use in the collecting the data.
Reliability has to do with the accuracy and precision of
a measurement procedure (Cooper and Schindler, 2008). So,
if the instrument is reliable, the researcher can use the
instrument in several times at the same object to collect
the data needed. In this research, the reliability test
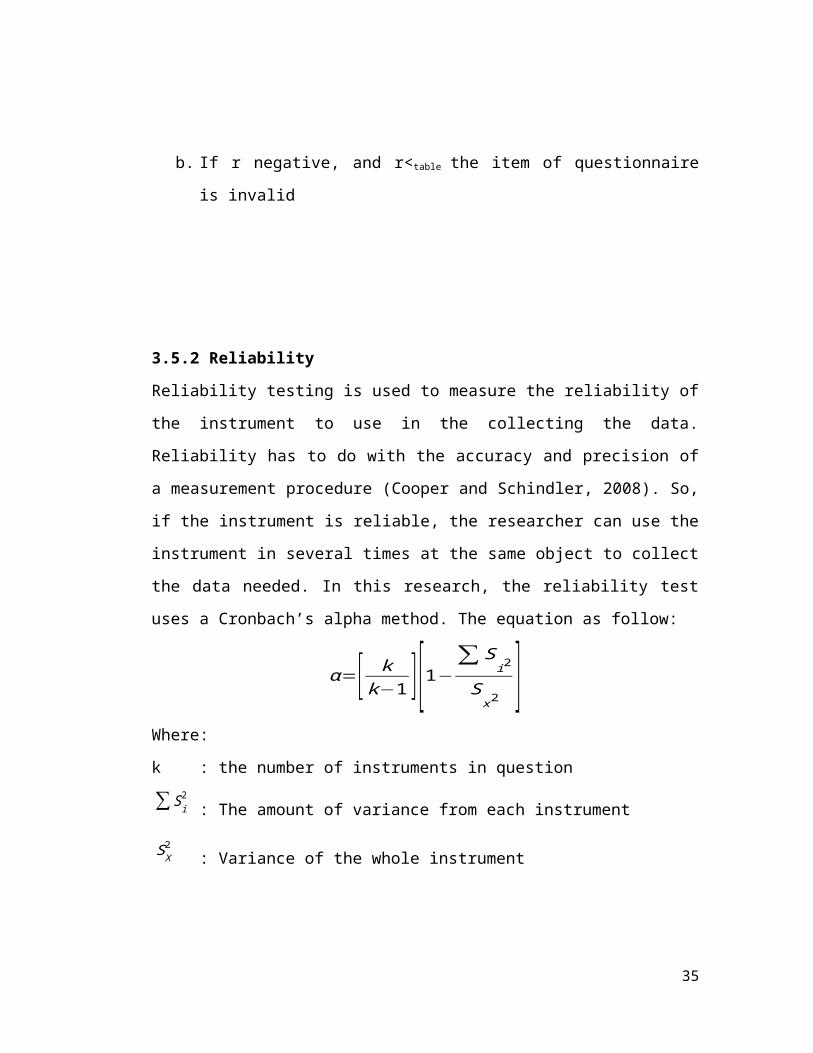
uses a Cronbach’s alpha method. The equation as follow:
α=[ kk−1 ] [1−
∑Si2
Sx2 ]
Where:
k : the number of instruments in question
∑Si2: The amount of variance from each instrument
SX2
: Variance of the whole instrument
35
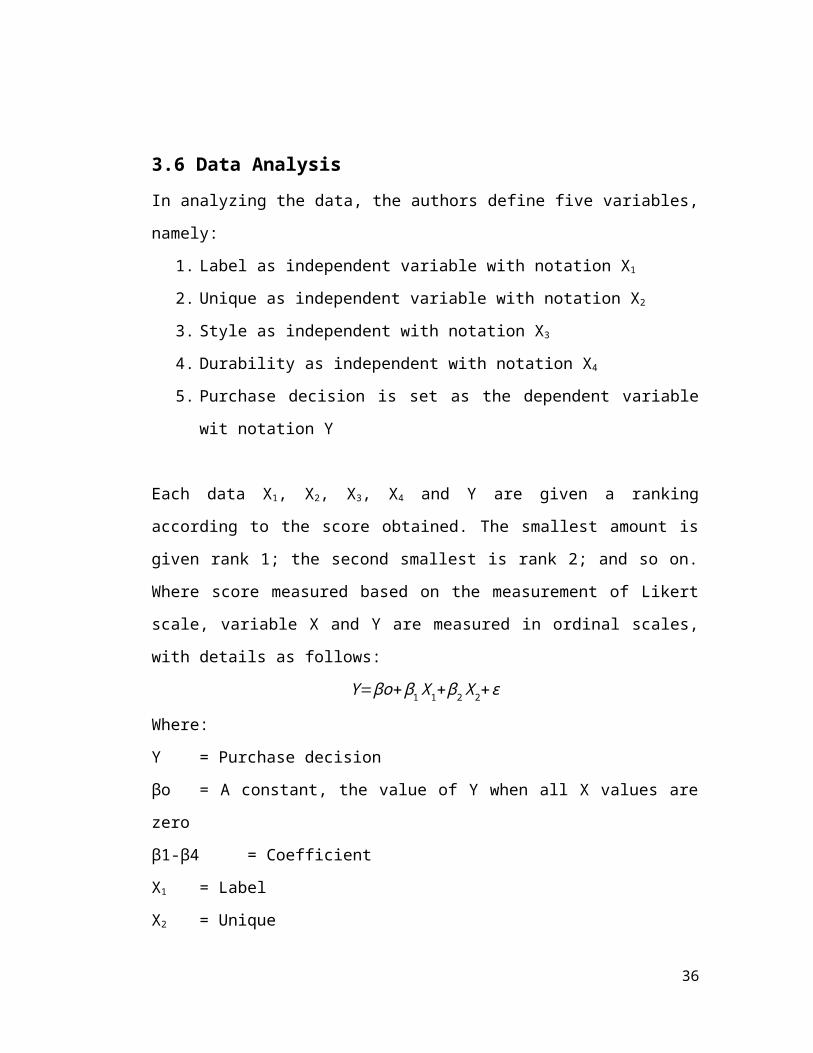
3.6 Data AnalysisIn analyzing the data, the authors define five variables,
namely:
1. Label as independent variable with notation X1
2. Unique as independent variable with notation X2
3. Style as independent with notation X3
4. Durability as independent with notation X4
5. Purchase decision is set as the dependent variable
wit notation Y
Each data X1, X2, X3, X4 and Y are given a ranking
according to the score obtained. The smallest amount is
given rank 1; the second smallest is rank 2; and so on.
Where score measured based on the measurement of Likert
scale, variable X and Y are measured in ordinal scales,
with details as follows:
Y=βo+β1X1+β2X2+ε
Where:
Y = Purchase decision
βo = A constant, the value of Y when all X values are
zero
β1-β4 = Coefficient
X1 = Label
X2 = Unique
36
X3 = Style
X4 = Durability
Then, after researcher got the result, there is some
measurement tools that used to find and to know the
correlation between the product and the purchase decision
based:
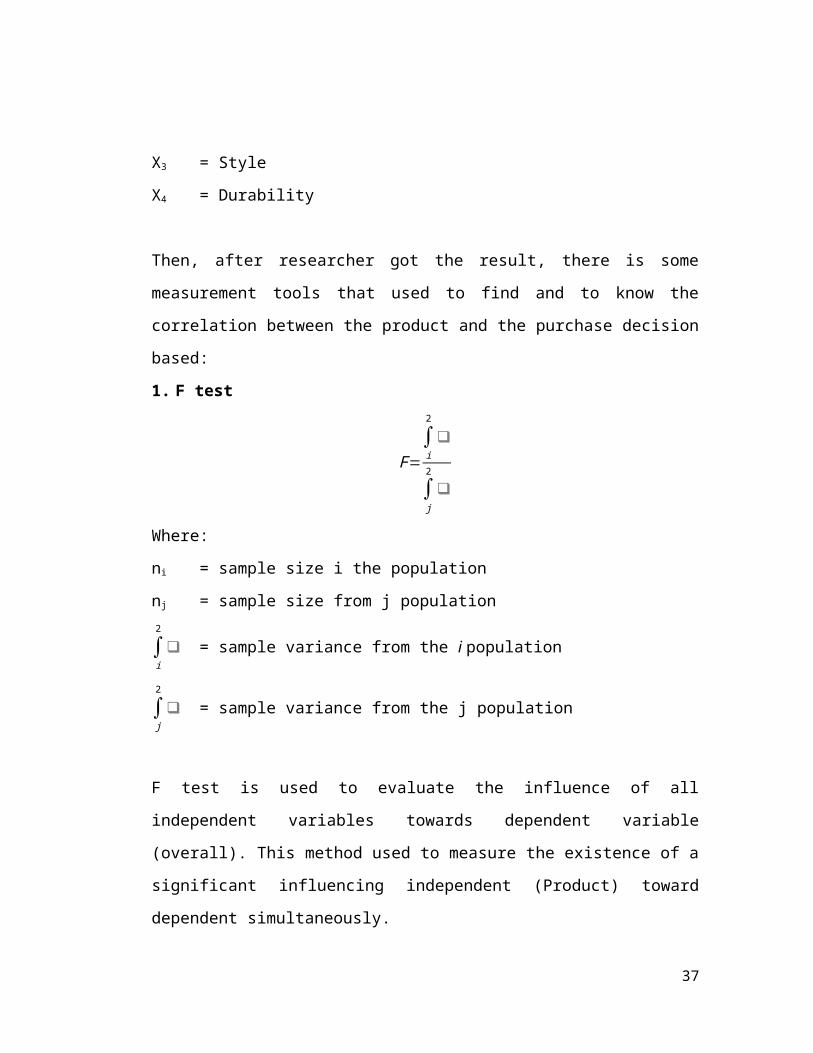
1. F test
F=∫i
2
❑
∫j
2
❑
Where:
ni = sample size i the population
nj = sample size from j population
∫i
2
❑ = sample variance from the i population
∫j
2
❑ = sample variance from the j population
F test is used to evaluate the influence of all
independent variables towards dependent variable
(overall). This method used to measure the existence of a
significant influencing independent (Product) toward
dependent simultaneously.
37
If Fcount <table at α = 5% significance level, so H0 accepted,
means that independent variables has no significant
influencing toward dependent variable simultaneously.
If Fcount <table at α = 5% significance level, so Ha accepted,
means that independent variable has significant influence
toward dependent variable simultaneously.
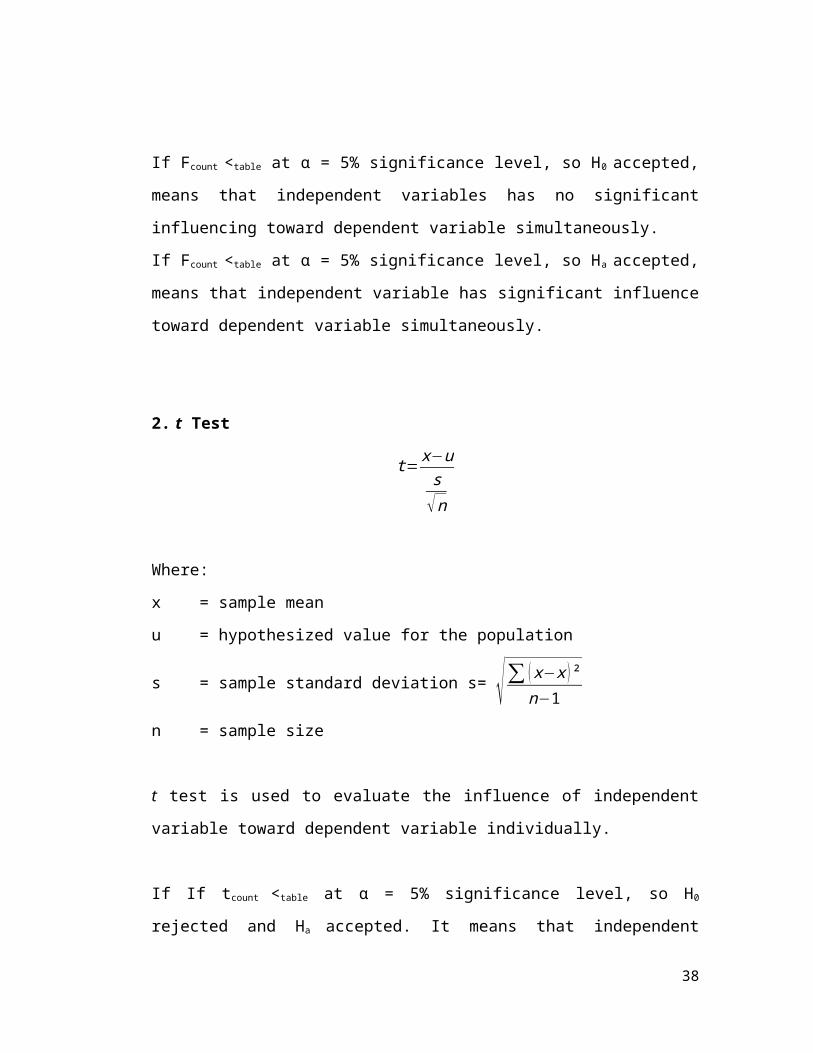
2. t Test
t=x−us√n
Where:
x = sample mean
u = hypothesized value for the population
s = sample standard deviation s= √∑ (x−x )²n−1
n = sample size
t test is used to evaluate the influence of independent
variable toward dependent variable individually.
If If tcount <table at α = 5% significance level, so H0
rejected and Ha accepted. It means that independent
38
variable has significant influencing towards dependent
variable.
If If tcount <table at α = 5% significance level, so H0
rejected and Ha accepted. It means that independent
variable has no significant influencing towards dependent
variable.
3. Classic Assumption Test
Classic assumption used to produce linear estimator, un-
bias, and to have a minimum variant (Best Linear Unbiased
Estimator = BLUE). These are the assumptions which are
used in this study:
a. Normality Test
Normality test are used to determine the normality
of the data that distribute in statistics. The
normality of data distribution can be determined from
residual value that normally distribute. Statistic test
taken based on a normal distribution, so before
analysis the data, it is required the normality. If the
assumption does not meet the target, it will influence
in conclude the conclusion, so the conclusion will not
reliable or deviate.39
b. Multicollinearity Test
Multicollinearity is the existence of a strong
relationship between independent variables in the
regression equation. The existence of Multicollinearity
will result in uncertainly estimation, thus directing
conclusion to receive null hypothesis.
Multicollinearity can be detected by using the value of
variance inflation factors (VIF) and tolerance. The
model is said a free form multicollinearity if the
value of VIF below 10 and tolerance above 0,1
(Widarjono, A., 2010).
c. Heteroscedasticity Test
Heteroscedasticity assumption is an assumption in
regression where residual variance is difference for
one observation to another observation (Santosa, P &
Ashari, 2005). Heteroscedasticity test is done by
viewing graph plot between value of dependent variable
(SRESID) and residual (ZPRED), where heteroscedasticity
can be seen by presence of specific pattern on the
graph.
40
3.7 Hypothesis TestingIn this research, the researcher uses a correlation
coefficient method to test the hypothesis.
1. F test
H0: β1, β2, β3, β4 = 0, means that there is no influencing
between independent variables (X) with purchase
decision (Y) at Nokia company in Cikarang.
H0 accepted if Fcount < F table at α = 5% significance level,
means that product design (label, unique, style,
durability) has no significant influencing purchase
decision of Nokia company in Cikarang.
Ha: β1, β2, β3, β4 ≠ 0, means that there is an influencing
between independent variables (X) with purchase
decision (Y) at Nokia company in Cikarang.
Ha accepted if Fcount > Ftable at α = 5% significance level,
means that product design (label, unique, style,
durability) has a significant influencing purchase
decision of Nokia company in Cikarang.
2. t Test
H0: β1 = 0, means that there is no influencing Product
design (label) (X1) with purchase decision (Y) at Nokia
company in Cikarang.
41
H0 accepted if tcount < ttable at α = 5% significance level,
means that product design (label) has no significant
influencing purchase decision of Nokia company in
Cikarang.
Ha: β1 ≠ 0, means that there is an influencing product
design (label) (X1) with purchase decision (Y) at Nokia
company in Cikarang.
Ha accepted if tcount > ttable at α = 5% significance level,
means that product design (label) has a significant
influencing purchase decision at Nokia company in
Cikarang.
H0: β2 = 0, means that there is no influencing Product
design (style) (X2) with the purchase decision (Y) at
Nokia company in Cikarang.
H0 accepted if tcount < ttable at α = 5% significance level,
means that product design (style) has no significant
influencing purchase decision of Nokia company in
Cikarang.
Ha: β2 ≠ 0, means that there is an influencing product
design (style) (X2) with the purchase decision (Y) at
Nokia company in cikarang.
Ha accepted if tcount > ttable at α = 5% significance level,
means that product design (style) has a significant
influencing purchase decision at Nokia company in
Cikarang.42
H0: β3 = 0, means that there is no influencing Product
design (unique) (X3) with purchase decision (Y) at
Nokia company in Cikarang.
H0 accepted if tcount < ttable at α = 5% significance level,
means that product design (unique) has no significant
influencing purchase decision of Nokia company in
Cikarang.
Ha: β3 ≠ 0, means that there is an influencing product
design (Unique) (X3) with the purchase decision (Y) at
Nokia company in Cikarang.
Ha accepted if tcount > ttable at α = 5% significance level,
means that product design (Unique) has a significant
influencing purchase decision of Tupperware product at
Nokia company in Cikarang.
H0: β4 = 0, means that there is no influencing Product
design (durability) (X4) with the purchase decision (Y)
at Nokia company in Cikarang.
H0 accepted if tcount < ttable at α = 5% significance level,
means that product design (durability) has no
significant influencing purchase decision of Nokia
company in Cikarang.
Ha: β4 ≠ 0, means that there is an influencing product
design (durability) (X4) with the purchase decision (Y)
at Nokia company in Cikarang.
43
Ha accepted if tcount > ttable at α = 5% significance level,
means that product design (durability) has a
significant influencing purchase decision at Nokia
company in Cikarang.
CHAPTER IV
ANALYSIS OF DATA AND
INTERPRETATION OF RESULT
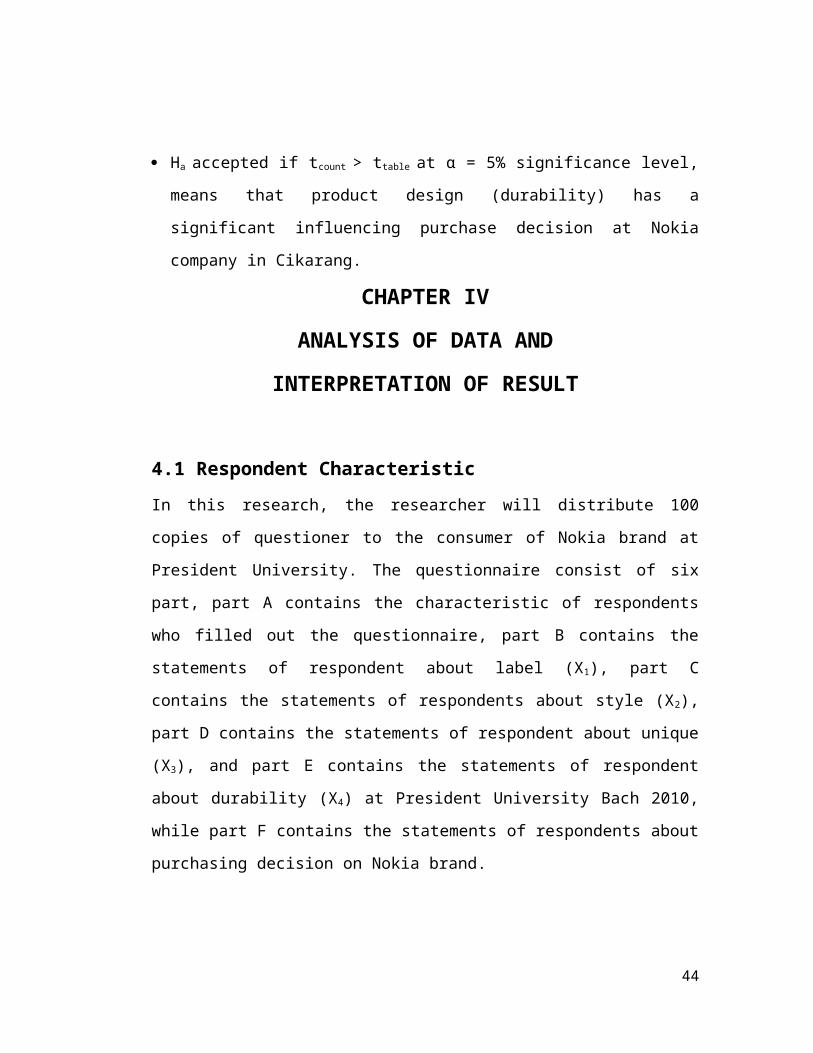
4.1 Respondent CharacteristicIn this research, the researcher will distribute 100
copies of questioner to the consumer of Nokia brand at
President University. The questionnaire consist of six
part, part A contains the characteristic of respondents
who filled out the questionnaire, part B contains the
statements of respondent about label (X1), part C
contains the statements of respondents about style (X2),
part D contains the statements of respondent about unique
(X3), and part E contains the statements of respondent
about durability (X4) at President University Bach 2010,
while part F contains the statements of respondents about
purchasing decision on Nokia brand.
44
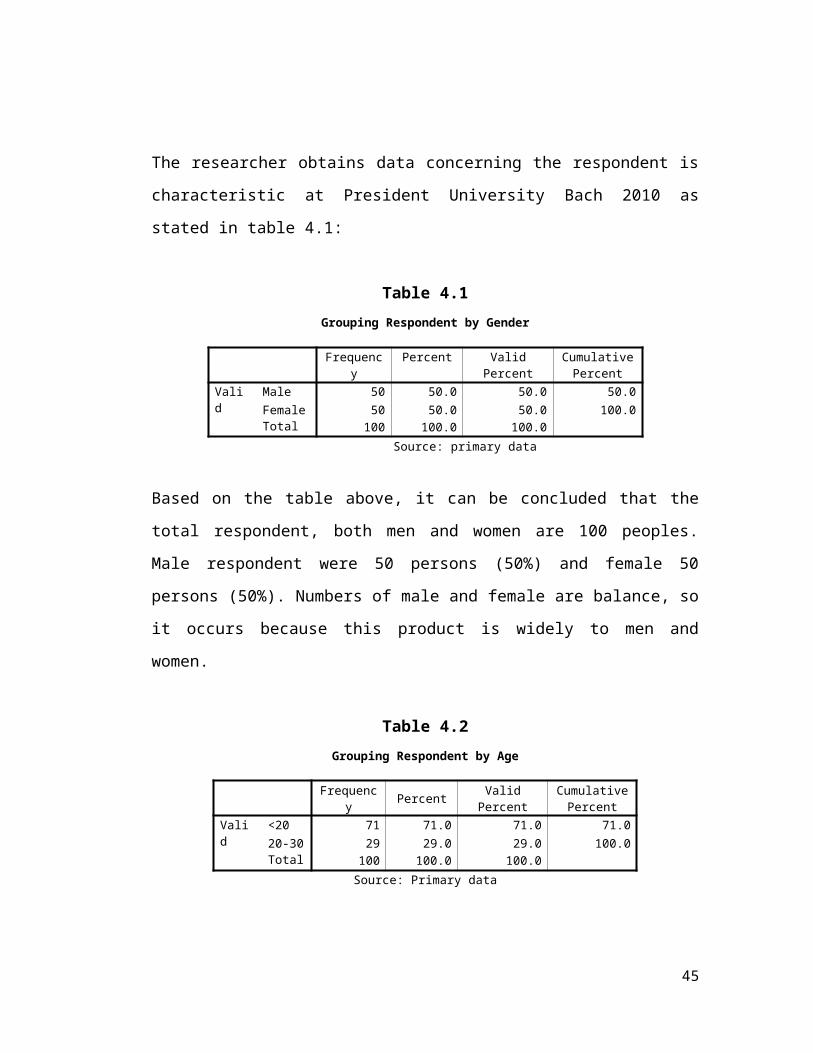
The researcher obtains data concerning the respondent is
characteristic at President University Bach 2010 as
stated in table 4.1:
Table 4.1Grouping Respondent by Gender
Frequenc
yPercent Valid
PercentCumulativePercent
Valid
Male 50 50.0 50.0 50.0Female 50 50.0 50.0 100.0Total 100 100.0 100.0
Source: primary data
Based on the table above, it can be concluded that the
total respondent, both men and women are 100 peoples.
Male respondent were 50 persons (50%) and female 50
persons (50%). Numbers of male and female are balance, so
it occurs because this product is widely to men and
women.
Table 4.2Grouping Respondent by Age
Frequenc
y Percent ValidPercent
CumulativePercent
Valid
<20 71 71.0 71.0 71.020-30 29 29.0 29.0 100.0Total 100 100.0 100.0
Source: Primary data
45
Based on table 4.2, it can be seen that the most
respondent are <20 years old groups as much as 71 people
(71%) of the respondents, age 20-30 years old as many as
29 people (29%).
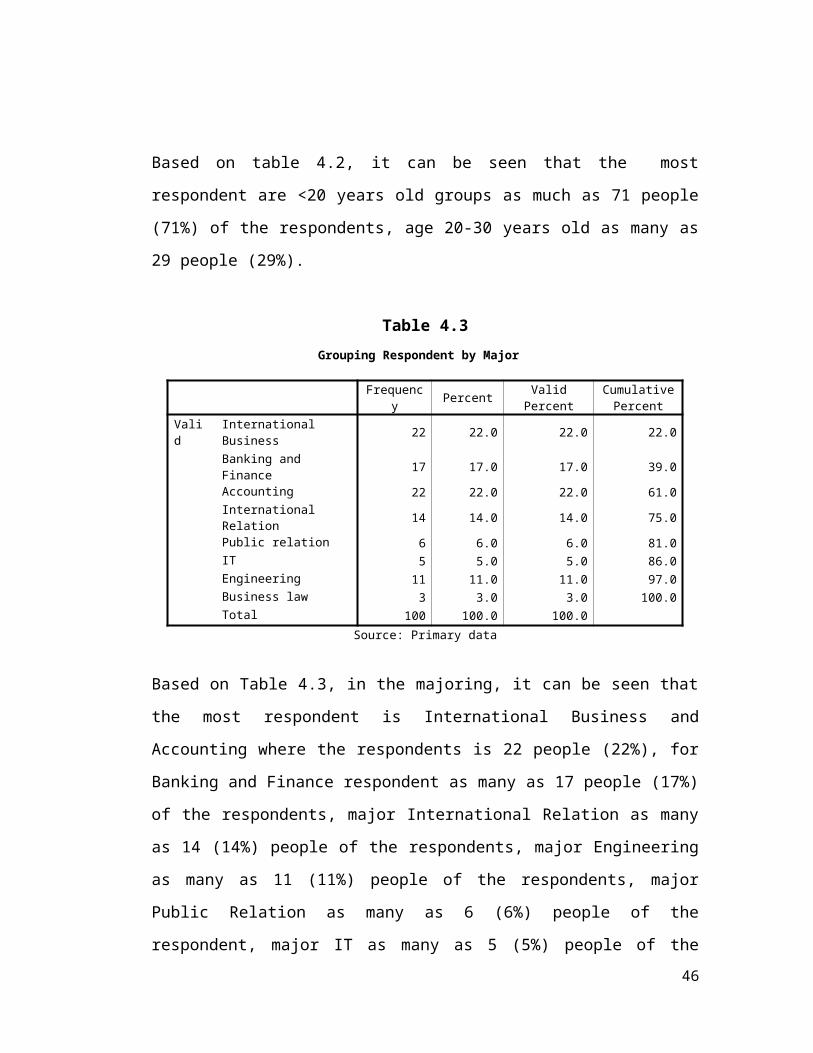
Table 4.3Grouping Respondent by Major
Frequenc
y Percent ValidPercent
CumulativePercent
Valid
International Business 22 22.0 22.0 22.0
Banking and Finance 17 17.0 17.0 39.0
Accounting 22 22.0 22.0 61.0International Relation 14 14.0 14.0 75.0
Public relation 6 6.0 6.0 81.0IT 5 5.0 5.0 86.0Engineering 11 11.0 11.0 97.0Business law 3 3.0 3.0 100.0Total 100 100.0 100.0
Source: Primary data
Based on Table 4.3, in the majoring, it can be seen that
the most respondent is International Business and
Accounting where the respondents is 22 people (22%), for
Banking and Finance respondent as many as 17 people (17%)
of the respondents, major International Relation as many
as 14 (14%) people of the respondents, major Engineering
as many as 11 (11%) people of the respondents, major
Public Relation as many as 6 (6%) people of the
respondent, major IT as many as 5 (5%) people of the46
respondents, major Business law 3 (3%) people of the
respondents.
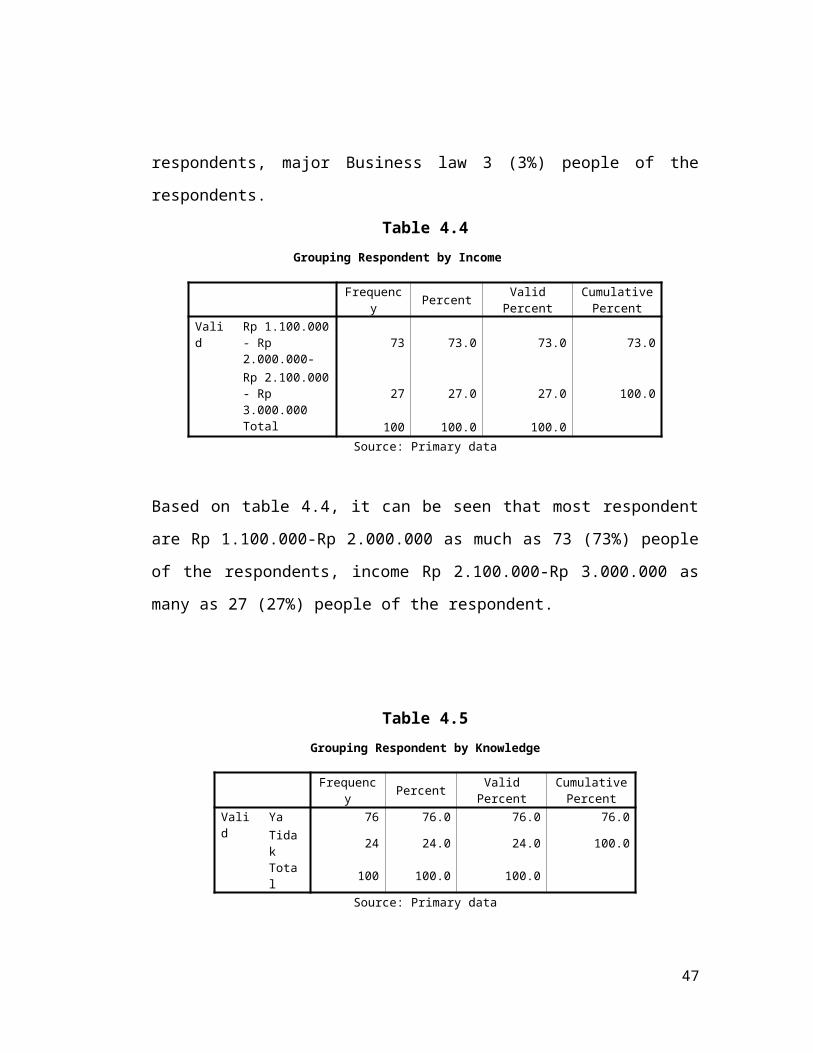
Table 4.4Grouping Respondent by Income
Frequenc
y Percent ValidPercent
CumulativePercent
Valid
Rp 1.100.000- Rp 2.000.000-
73 73.0 73.0 73.0
Rp 2.100.000- Rp 3.000.000
27 27.0 27.0 100.0
Total 100 100.0 100.0Source: Primary data
Based on table 4.4, it can be seen that most respondent
are Rp 1.100.000-Rp 2.000.000 as much as 73 (73%) people
of the respondents, income Rp 2.100.000-Rp 3.000.000 as
many as 27 (27%) people of the respondent.
Table 4.5Grouping Respondent by Knowledge
Frequency Percent Valid
PercentCumulativePercent
Valid
Ya 76 76.0 76.0 76.0Tidak 24 24.0 24.0 100.0
Total 100 100.0 100.0
Source: Primary data
47
Based on table 4.5, it can be seen that the most
respondents answered “yes” for group knowing about Nokia
as much as 76 (76%) people of the respondent. And the
rest it only 24 (34%) people of the respondents answered
“no”, who don’t know about Nokia.
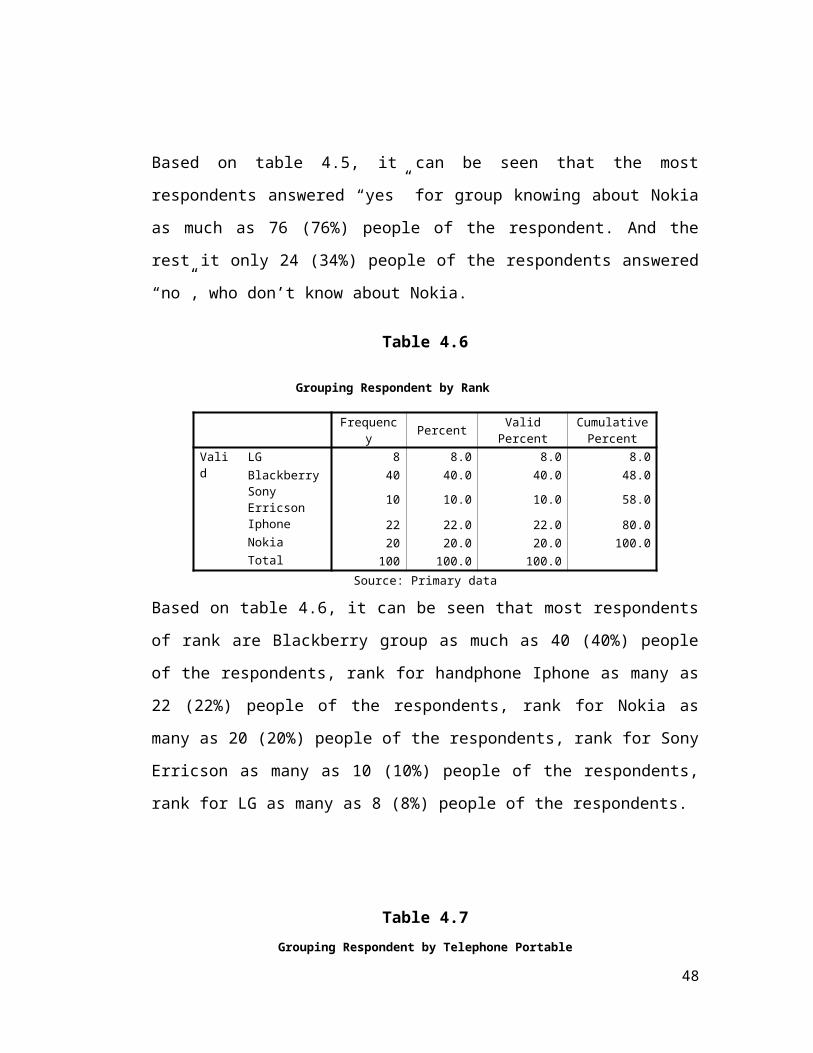
Table 4.6
Grouping Respondent by Rank
Frequenc
y Percent ValidPercent
CumulativePercent
Valid
LG 8 8.0 8.0 8.0Blackberry 40 40.0 40.0 48.0Sony Erricson 10 10.0 10.0 58.0
Iphone 22 22.0 22.0 80.0Nokia 20 20.0 20.0 100.0Total 100 100.0 100.0
Source: Primary data
Based on table 4.6, it can be seen that most respondents
of rank are Blackberry group as much as 40 (40%) people
of the respondents, rank for handphone Iphone as many as
22 (22%) people of the respondents, rank for Nokia as
many as 20 (20%) people of the respondents, rank for Sony
Erricson as many as 10 (10%) people of the respondents,
rank for LG as many as 8 (8%) people of the respondents.
Table 4.7Grouping Respondent by Telephone Portable
48
Frequency Percent Valid
PercentCumulativePercent
Valid
1 14 14.0 14.0 14.02 45 45.0 45.0 59.03 41 41.0 41.0 100.0Total 100 100.0 100.0
Source: Primary data
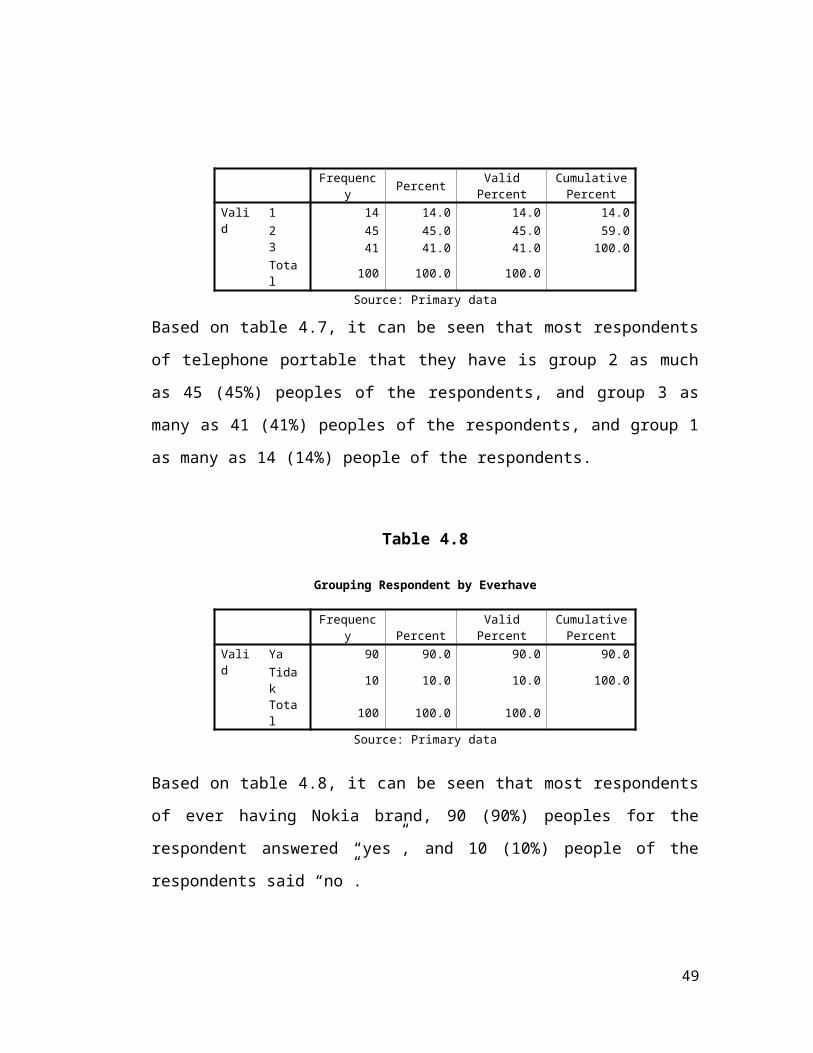
Based on table 4.7, it can be seen that most respondents
of telephone portable that they have is group 2 as much
as 45 (45%) peoples of the respondents, and group 3 as
many as 41 (41%) peoples of the respondents, and group 1
as many as 14 (14%) people of the respondents.
Table 4.8
Grouping Respondent by Everhave
Frequenc
y PercentValidPercent
CumulativePercent
Valid
Ya 90 90.0 90.0 90.0Tidak 10 10.0 10.0 100.0
Total 100 100.0 100.0
Source: Primary data
Based on table 4.8, it can be seen that most respondents
of ever having Nokia brand, 90 (90%) peoples for the
respondent answered “yes”, and 10 (10%) people of the
respondents said “no”.
49
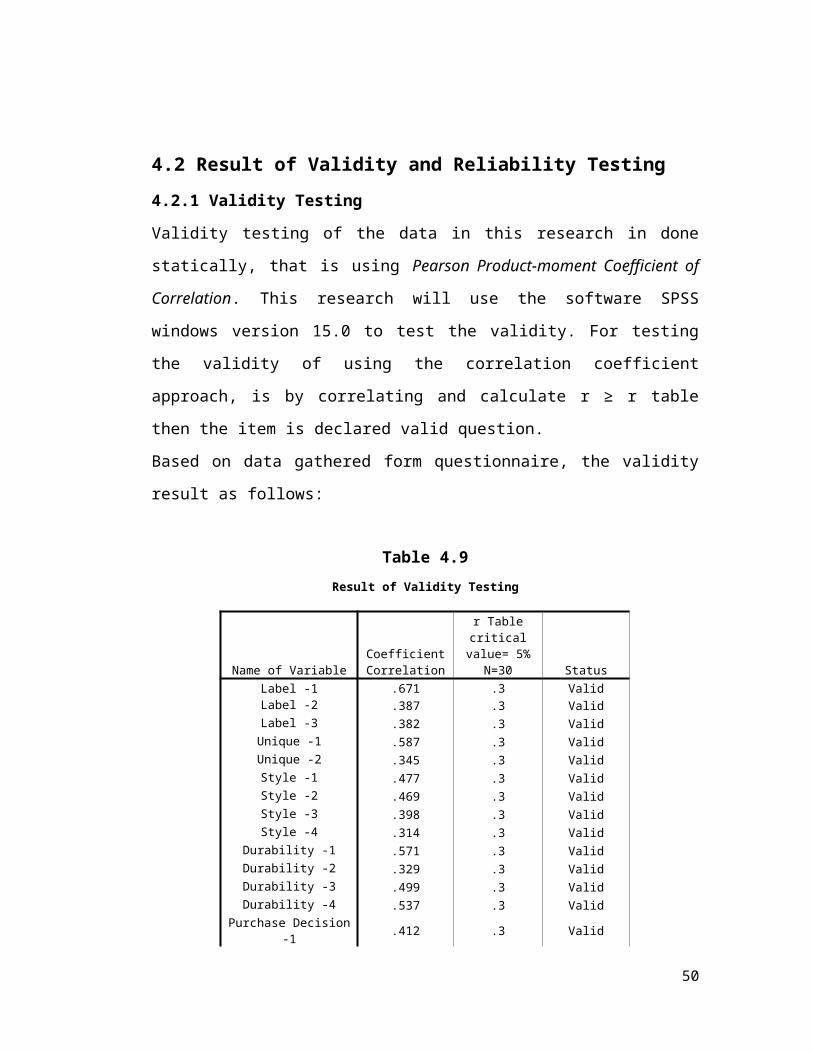
4.2 Result of Validity and Reliability Testing 4.2.1 Validity Testing
Validity testing of the data in this research in done
statically, that is using Pearson Product-moment Coefficient of
Correlation. This research will use the software SPSS
windows version 15.0 to test the validity. For testing
the validity of using the correlation coefficient
approach, is by correlating and calculate r ≥ r table
then the item is declared valid question.
Based on data gathered form questionnaire, the validity
result as follows:
Table 4.9Result of Validity Testing
Name of VariableCoefficientCorrelation
r Tablecriticalvalue= 5%
N=30 StatusLabel -1 .671 .3 ValidLabel -2 .387 .3 ValidLabel -3 .382 .3 ValidUnique -1 .587 .3 ValidUnique -2 .345 .3 ValidStyle -1 .477 .3 ValidStyle -2 .469 .3 ValidStyle -3 .398 .3 ValidStyle -4 .314 .3 Valid
Durability -1 .571 .3 ValidDurability -2 .329 .3 ValidDurability -3 .499 .3 ValidDurability -4 .537 .3 Valid
Purchase Decision-1 .412 .3 Valid
50
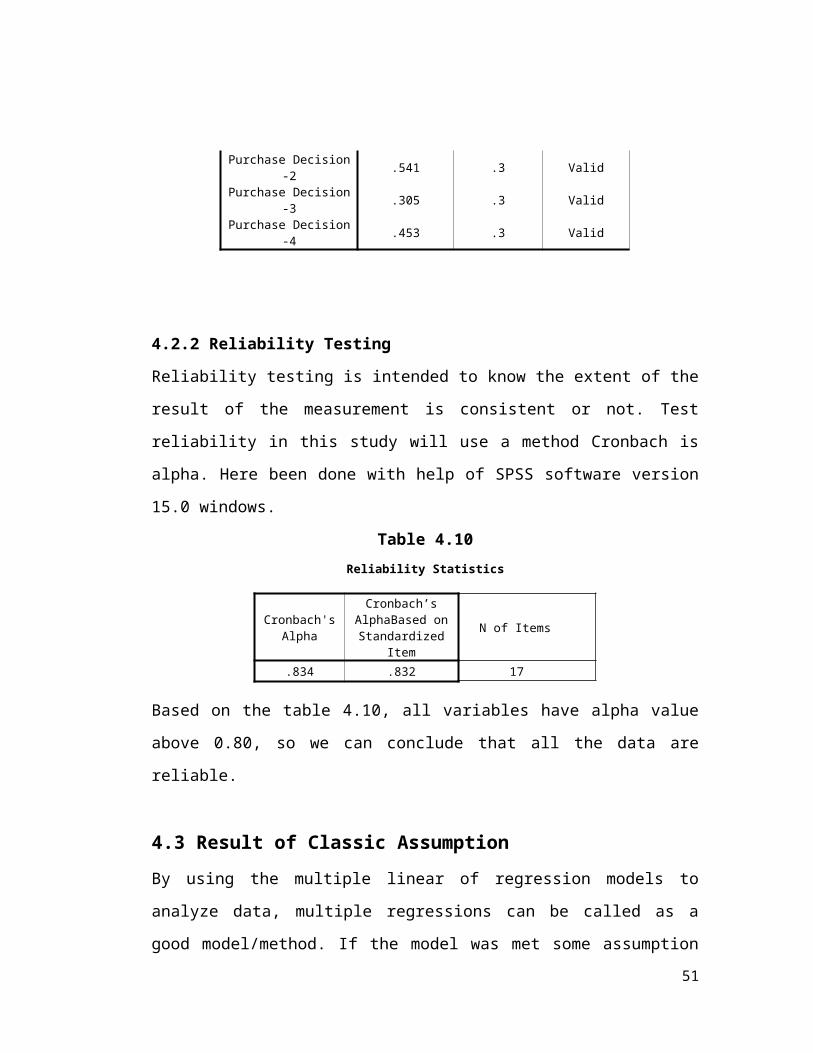
Purchase Decision-2 .541 .3 Valid
Purchase Decision-3 .305 .3 Valid
Purchase Decision-4 .453 .3 Valid
4.2.2 Reliability Testing
Reliability testing is intended to know the extent of the
result of the measurement is consistent or not. Test
reliability in this study will use a method Cronbach is
alpha. Here been done with help of SPSS software version
15.0 windows.
Table 4.10Reliability Statistics
Cronbach'sAlpha
Cronbach’sAlphaBased onStandardized
Item
N of Items
.834 .832 17
Based on the table 4.10, all variables have alpha value
above 0.80, so we can conclude that all the data are
reliable.
4.3 Result of Classic AssumptionBy using the multiple linear of regression models to
analyze data, multiple regressions can be called as a
good model/method. If the model was met some assumption51
then it called a classic assumption. Classical assumption
is required a testing to find out if results of the
regression estimation is completely done free of any
symptoms of multicollinearty and heteroscedasticity. In
this study, there are 3 kinds of assumption which are
used as follows:
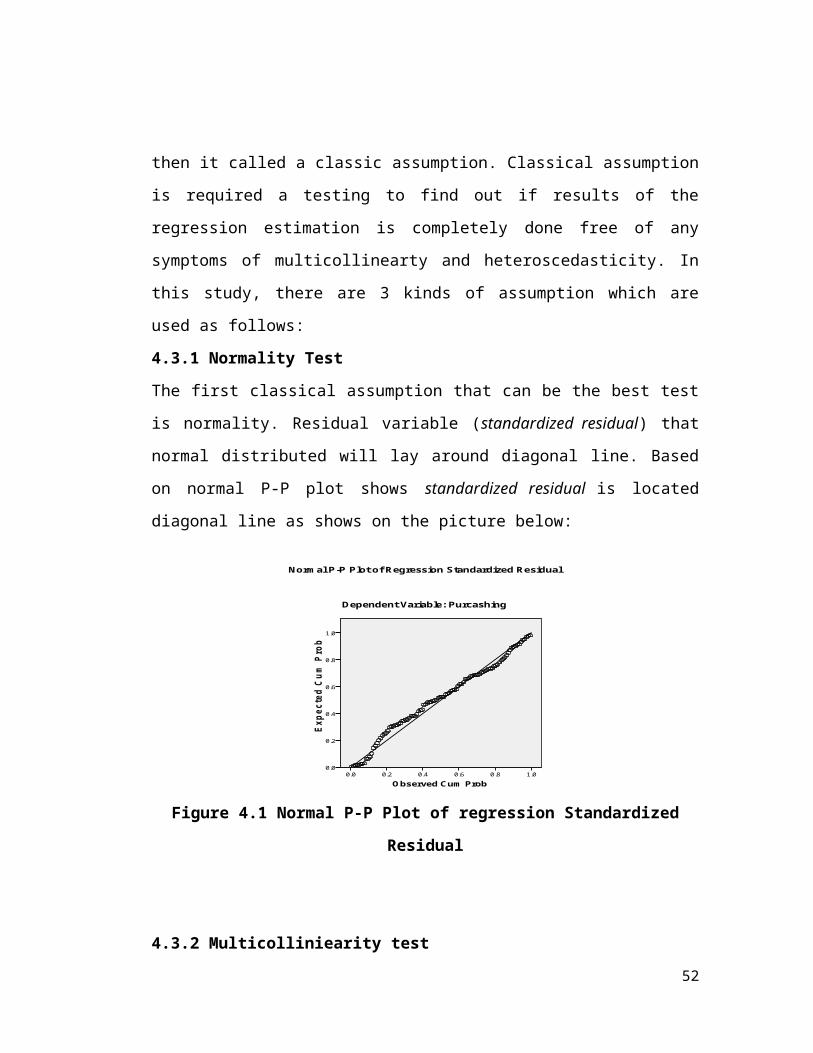
4.3.1 Normality Test
The first classical assumption that can be the best test
is normality. Residual variable (standardized residual) that
normal distributed will lay around diagonal line. Based
on normal P-P plot shows standardized residual is located
diagonal line as shows on the picture below:
O bserved Cum Prob1.00.80.60.40.20.0
Expe
cted
Cum
Pro
b
1.0
0.8
0.6
0.4
0.2
0.0
Norm al P-P Plot of Regression Standardized Residual
Dependent Variable: Purcashing
Figure 4.1 Normal P-P Plot of regression Standardized
Residual
4.3.2 Multicolliniearity test
52
Tolerance is an indication of the percent of variance in
the predictor that cannot be accounted by the other
predictors, hence some small values indicate that a
predictor is redundant, and the values which are less
than 5 may merit further investigation. A Tolerance close
to 1 means there is little multicolinearity, whereas a
value close to 0 suggests that multicolinearity may be a
threat. This is referred to as the problem of
multicolinearity. It is a problem, as the X become more
highly correlated, it becomes more and more difficult to
determine which is X actually producing the effect on Y.
In the other side if the value of VIF> 5, it indicates
the occurrence of multicollinearity (David F., Patrick
W., Kent D., Phillip C (2008)).
Based on the result above, it could be explained that all
variable indicators which are used in this study if it is
free from multicollinearity (non-multicollinearity),
because the value of VIF < 10 and tolerance > 0.1 as
required in this research.
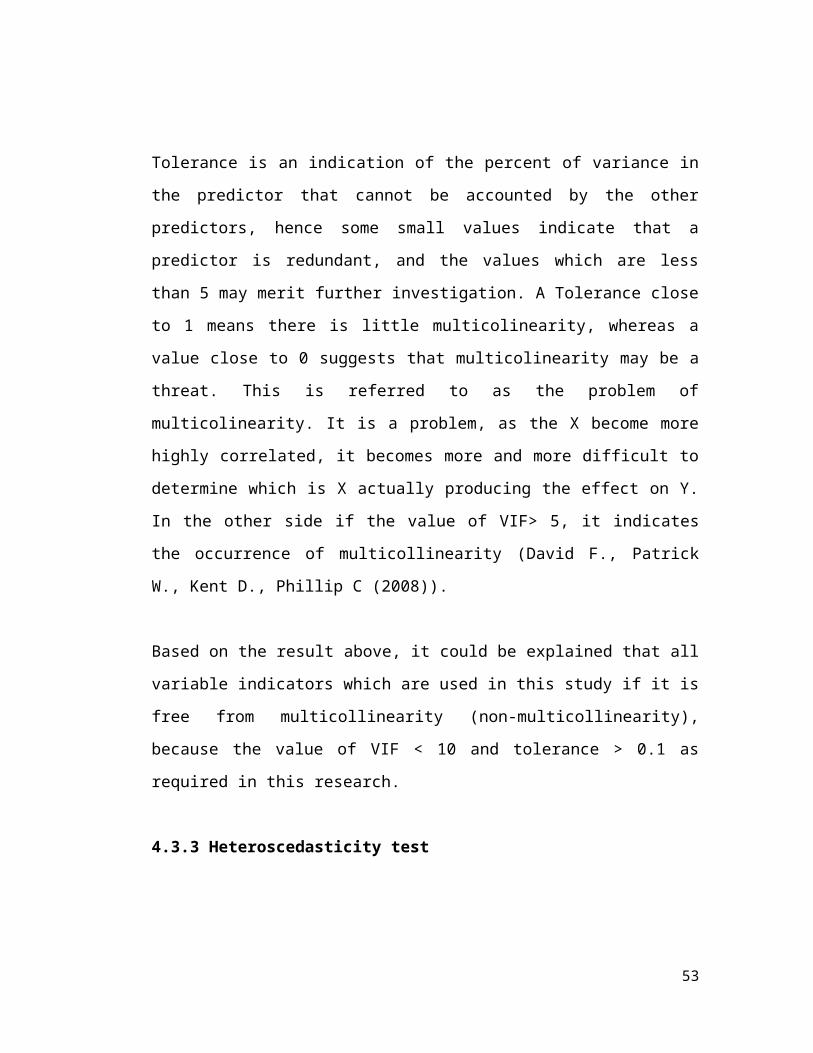
4.3.3 Heteroscedasticity test
53
Regression Standardized Predicted Value210-1-2-3
Regr
essi
on S
tude
ntize
d De
lete
d (P
ress
) Re
sidu
al3
2
1
0
-1
-2
-3
Scatterplot
Dependent Variable: Purcashing
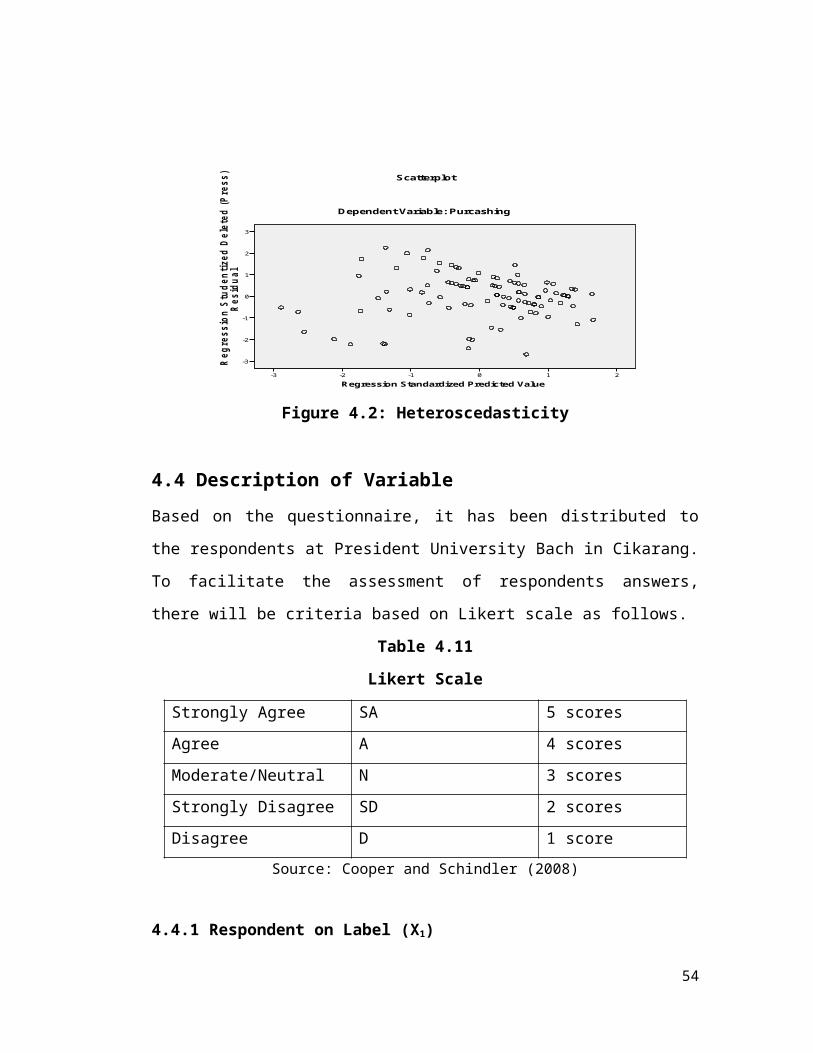
Figure 4.2: Heteroscedasticity
4.4 Description of VariableBased on the questionnaire, it has been distributed to
the respondents at President University Bach in Cikarang.
To facilitate the assessment of respondents answers,
there will be criteria based on Likert scale as follows.
Table 4.11
Likert Scale
Strongly Agree SA 5 scoresAgree A 4 scoresModerate/Neutral N 3 scoresStrongly Disagree SD 2 scoresDisagree D 1 score
Source: Cooper and Schindler (2008)
4.4.1 Respondent on Label (X1)
54
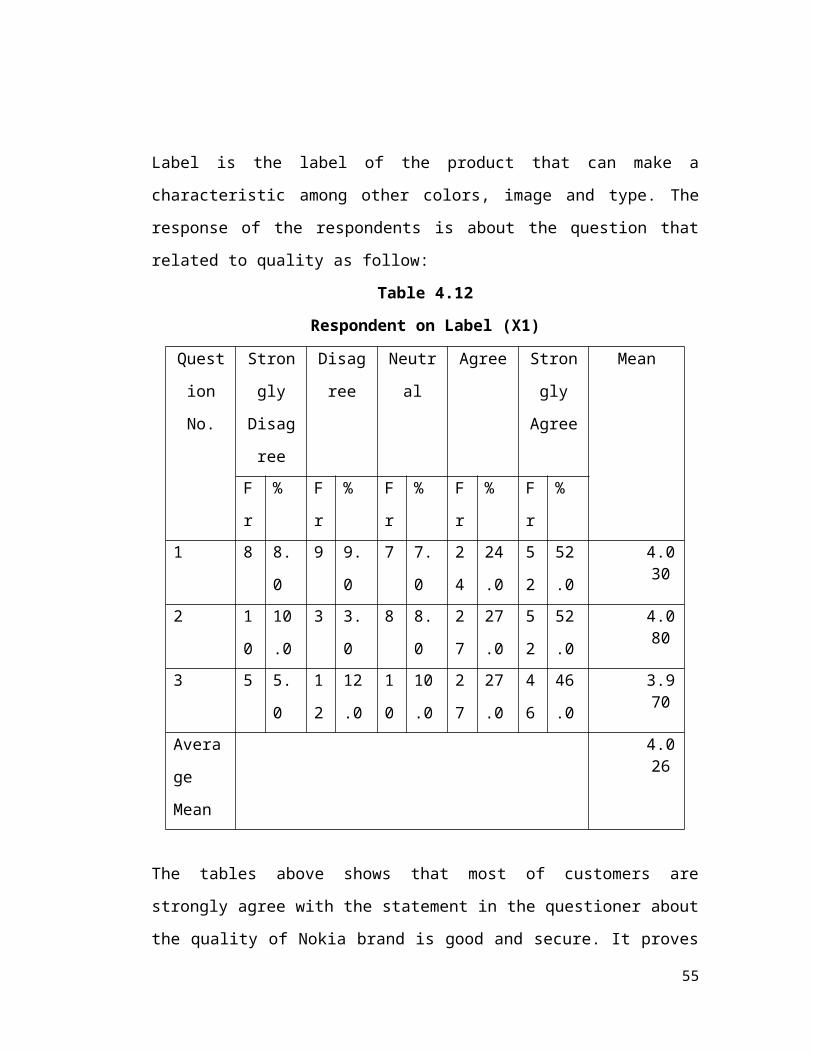
Label is the label of the product that can make a
characteristic among other colors, image and type. The
response of the respondents is about the question that
related to quality as follow:
Table 4.12
Respondent on Label (X1)
Quest
ion
No.
Stron
gly
Disag
ree
Disag
ree
Neutr
al
Agree Stron
gly
Agree
Mean
F
r
% F
r
% F
r
% F
r
% F
r
%
1 8 8.
0
9 9.
0
7 7.
0
2
4
24
.0
5
2
52
.0
4.030
2 1
0
10
.0
3 3.
0
8 8.
0
2
7
27
.0
5
2
52
.0
4.080
3 5 5.
0
1
2
12
.0
1
0
10
.0
2
7
27
.0
4
6
46
.0
3.970
Avera
ge
Mean
4.026
The tables above shows that most of customers are
strongly agree with the statement in the questioner about
the quality of Nokia brand is good and secure. It proves
55
and can be seen from the average mean of Label variable,
which 4.026.
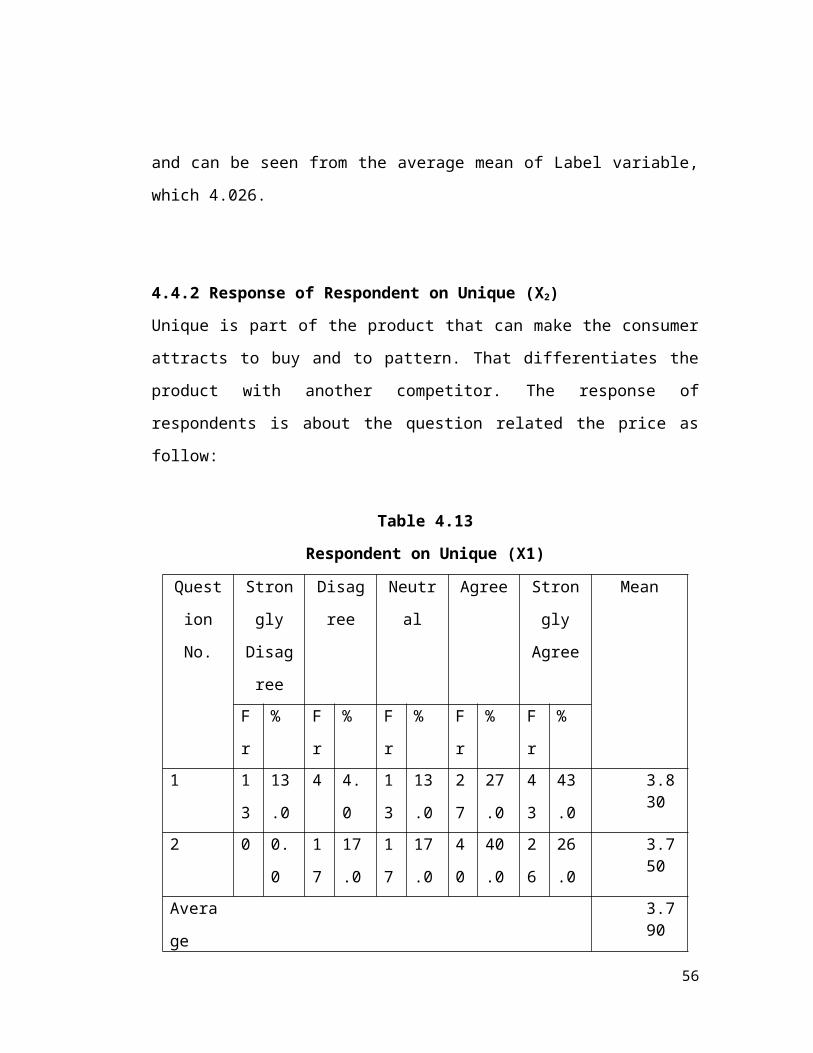
4.4.2 Response of Respondent on Unique (X2)
Unique is part of the product that can make the consumer
attracts to buy and to pattern. That differentiates the
product with another competitor. The response of
respondents is about the question related the price as
follow:
Table 4.13
Respondent on Unique (X1)
Quest
ion
No.
Stron
gly
Disag
ree
Disag
ree
Neutr
al
Agree Stron
gly
Agree
Mean
F
r
% F
r
% F
r
% F
r
% F
r
%
1 1
3
13
.0
4 4.
0
1
3
13
.0
2
7
27
.0
4
3
43
.0
3.830
2 0 0.
0
1
7
17
.0
1
7
17
.0
4
0
40
.0
2
6
26
.0
3.750
Avera
ge
3.790
56
Mean
The tables above shows that most of the consumers
strongly agree with the statement in the questionnaire
about the Nokia brand product have a special feature with
the unique variable. Based on the table 4.13, it can be
seen that average mean of price variable are 3.790.
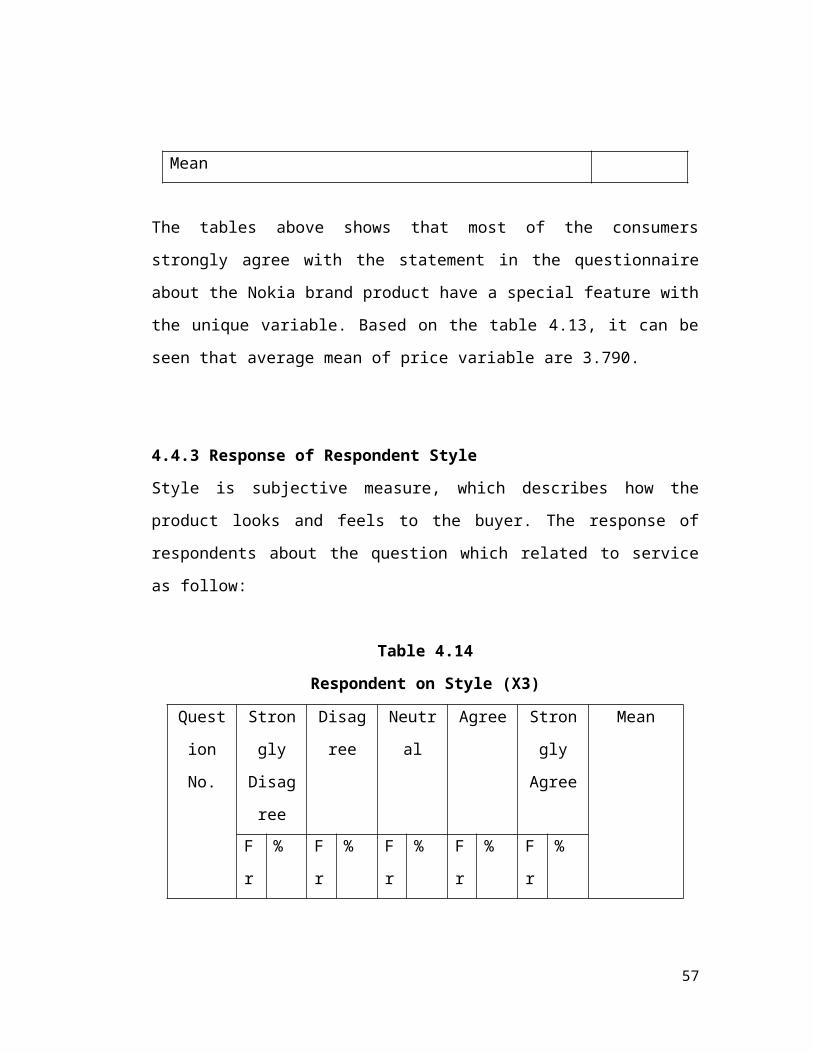
4.4.3 Response of Respondent Style
Style is subjective measure, which describes how the
product looks and feels to the buyer. The response of
respondents about the question which related to service
as follow:
Table 4.14
Respondent on Style (X3)
Quest
ion
No.
Stron
gly
Disag
ree
Disag
ree
Neutr
al
Agree Stron
gly
Agree
Mean
F
r
% F
r
% F
r
% F
r
% F
r
%
57
1 2 2.
0
1
0
10
.0
9 9.
0
3
5
35
.0
4
4
44
.0
4.090
2 0 0.
0
1
7
17
.0
1
4
14
.0
4
3
43
.0
2
7
27
.0
3.790
3 1
4
14
.0
6 6.
0
1
6
16
.0
2
0
20
.0
4
4
44
.0
3.740
4 0 0.
0
4 4.
0
1
3
13
.0
2
5
25
.0
5
8
58
.0
4.370
Avera
ge
mean
3.997
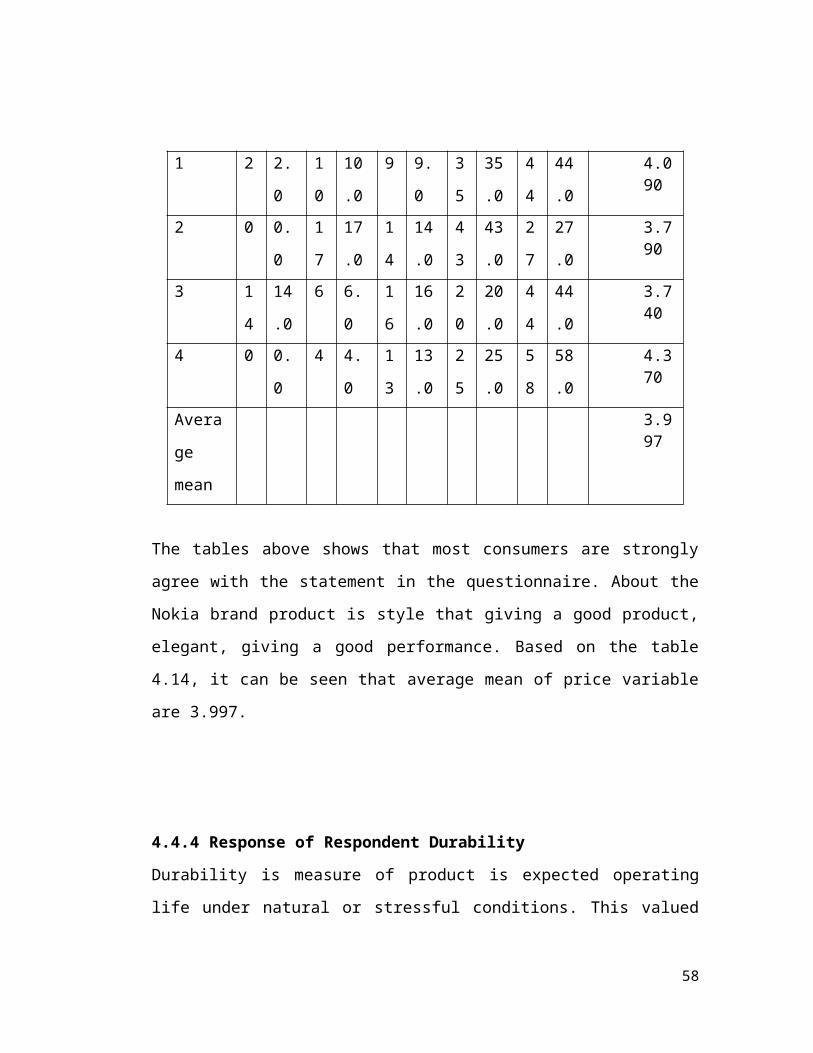
The tables above shows that most consumers are strongly
agree with the statement in the questionnaire. About the
Nokia brand product is style that giving a good product,
elegant, giving a good performance. Based on the table
4.14, it can be seen that average mean of price variable
are 3.997.
4.4.4 Response of Respondent Durability
Durability is measure of product is expected operating
life under natural or stressful conditions. This valued
58
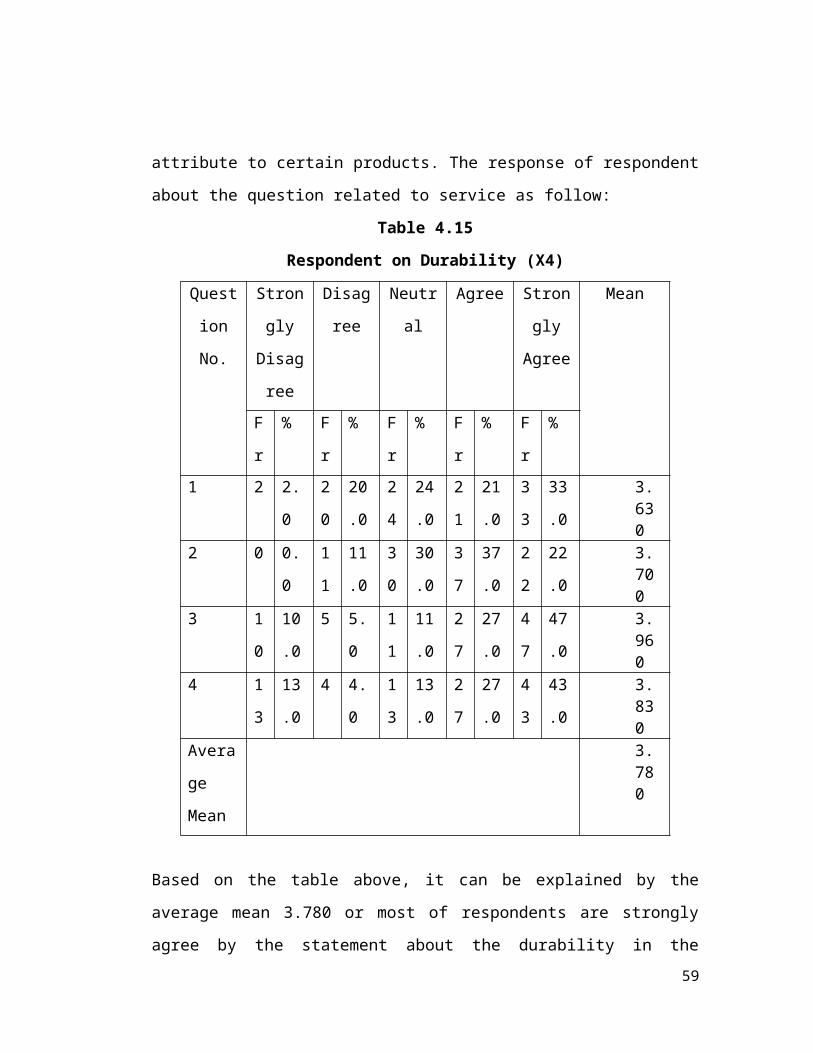
attribute to certain products. The response of respondent
about the question related to service as follow:
Table 4.15
Respondent on Durability (X4)
Quest
ion
No.
Stron
gly
Disag
ree
Disag
ree
Neutr
al
Agree Stron
gly
Agree
Mean
F
r
% F
r
% F
r
% F
r
% F
r
%
1 2 2.
0
2
0
20
.0
2
4
24
.0
2
1
21
.0
3
3
33
.0
3.630
2 0 0.
0
1
1
11
.0
3
0
30
.0
3
7
37
.0
2
2
22
.0
3.700
3 1
0
10
.0
5 5.
0
1
1
11
.0
2
7
27
.0
4
7
47
.0
3.960
4 1
3
13
.0
4 4.
0
1
3
13
.0
2
7
27
.0
4
3
43
.0
3.830
Avera
ge
Mean
3.780
Based on the table above, it can be explained by the
average mean 3.780 or most of respondents are strongly
agree by the statement about the durability in the59
questionnaire. It means that the variable can impact the
purchasing decision of Nokia brand product.
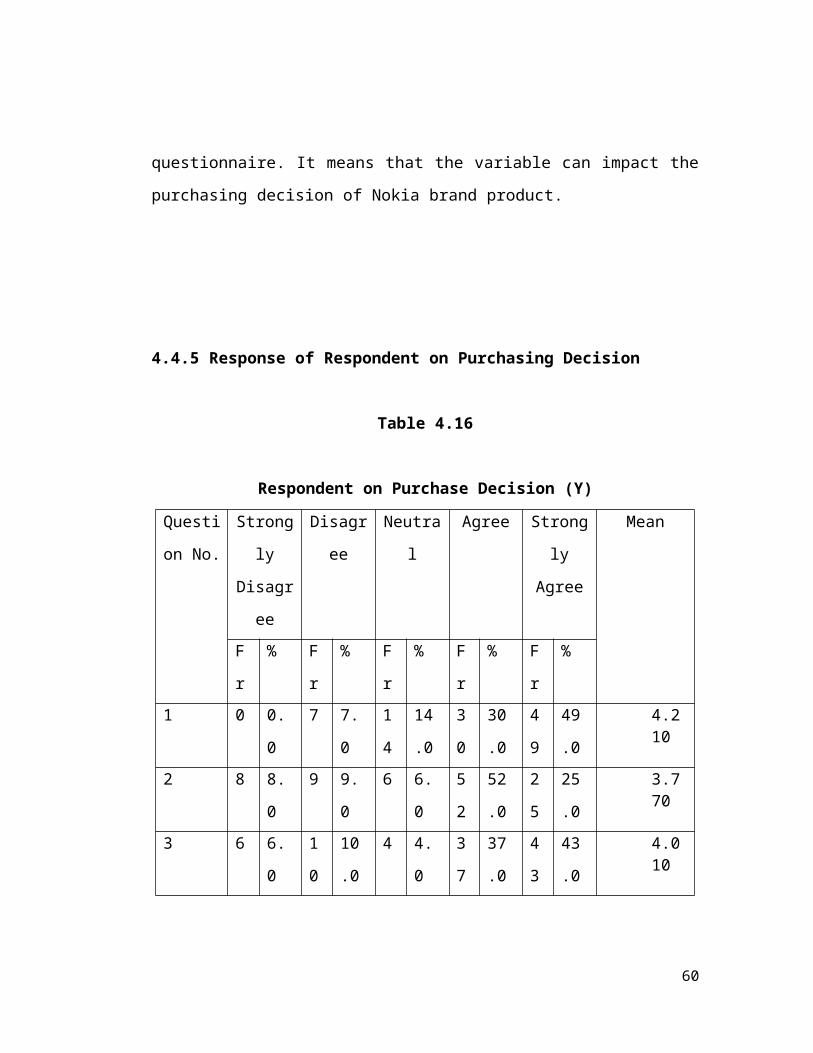
4.4.5 Response of Respondent on Purchasing Decision
Table 4.16
Respondent on Purchase Decision (Y)
Questi
on No.
Strong
ly
Disagr
ee
Disagr
ee
Neutra
l
Agree Strong
ly
Agree
Mean
F
r
% F
r
% F
r
% F
r
% F
r
%
1 0 0.
0
7 7.
0
1
4
14
.0
3
0
30
.0
4
9
49
.0
4.210
2 8 8.
0
9 9.
0
6 6.
0
5
2
52
.0
2
5
25
.0
3.770
3 6 6.
0
1
0
10
.0
4 4.
0
3
7
37
.0
4
3
43
.0
4.010
60
4 1
1
11
.0
4 4.
0
2
9
29
.0
5
0
50
.0
6 6.
0
3.360
Averag
e Mean
3.837
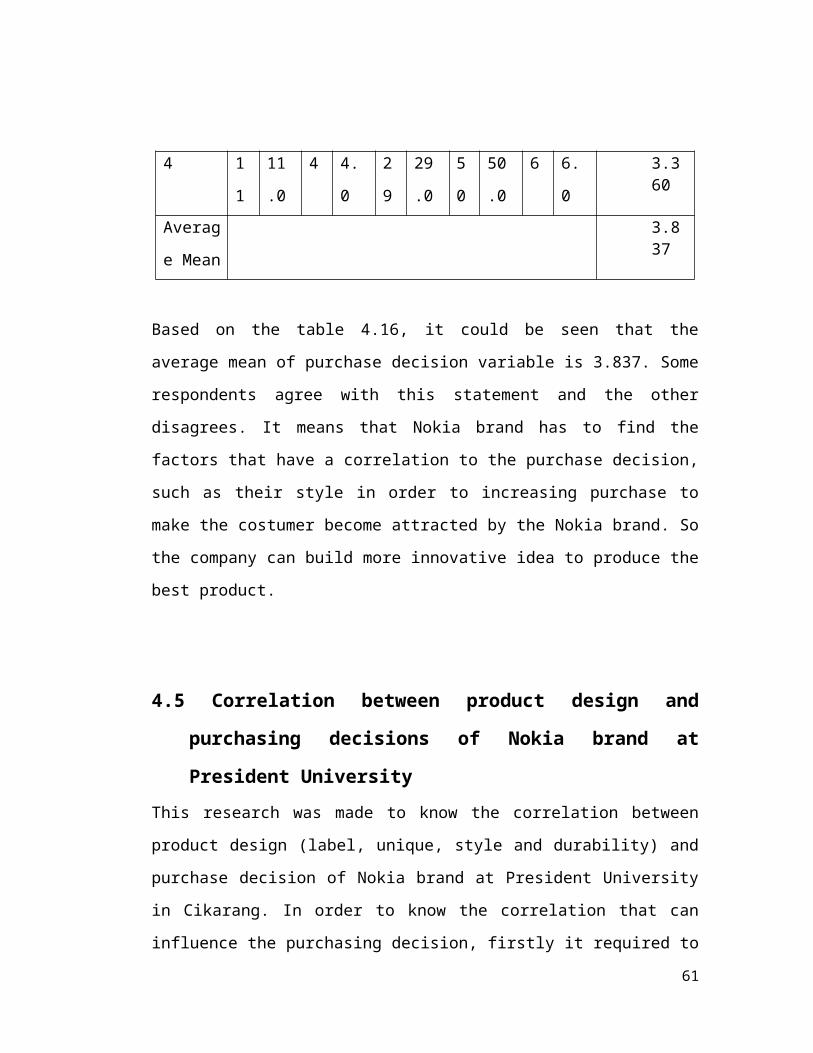
Based on the table 4.16, it could be seen that the
average mean of purchase decision variable is 3.837. Some
respondents agree with this statement and the other
disagrees. It means that Nokia brand has to find the
factors that have a correlation to the purchase decision,
such as their style in order to increasing purchase to
make the costumer become attracted by the Nokia brand. So
the company can build more innovative idea to produce the
best product.
4.5 Correlation between product design and
purchasing decisions of Nokia brand at
President UniversityThis research was made to know the correlation between
product design (label, unique, style and durability) and
purchase decision of Nokia brand at President University
in Cikarang. In order to know the correlation that can
influence the purchasing decision, firstly it required to
61
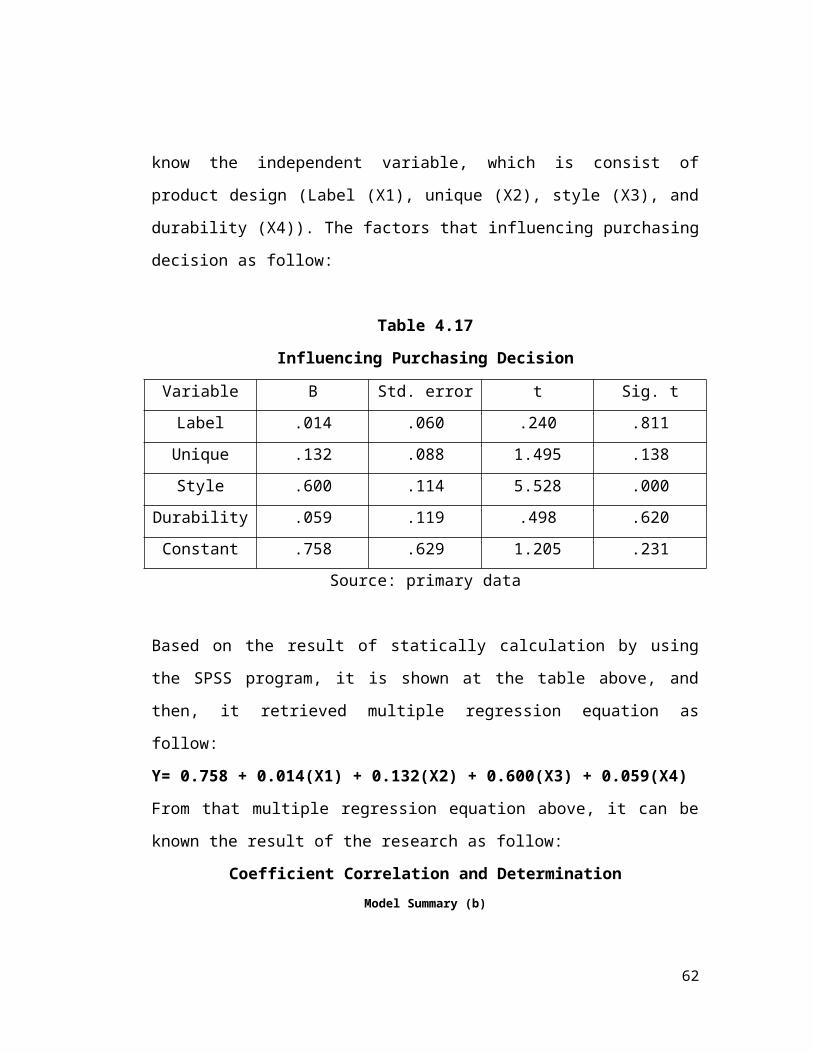
know the independent variable, which is consist of
product design (Label (X1), unique (X2), style (X3), and
durability (X4)). The factors that influencing purchasing
decision as follow:
Table 4.17
Influencing Purchasing Decision
Variable B Std. error t Sig. tLabel .014 .060 .240 .811Unique .132 .088 1.495 .138Style .600 .114 5.528 .000
Durability .059 .119 .498 .620Constant .758 .629 1.205 .231
Source: primary data
Based on the result of statically calculation by using
the SPSS program, it is shown at the table above, and
then, it retrieved multiple regression equation as
follow:
Y= 0.758 + 0.014(X1) + 0.132(X2) + 0.600(X3) + 0.059(X4)
From that multiple regression equation above, it can be
known the result of the research as follow:
Coefficient Correlation and DeterminationModel Summary (b)
62
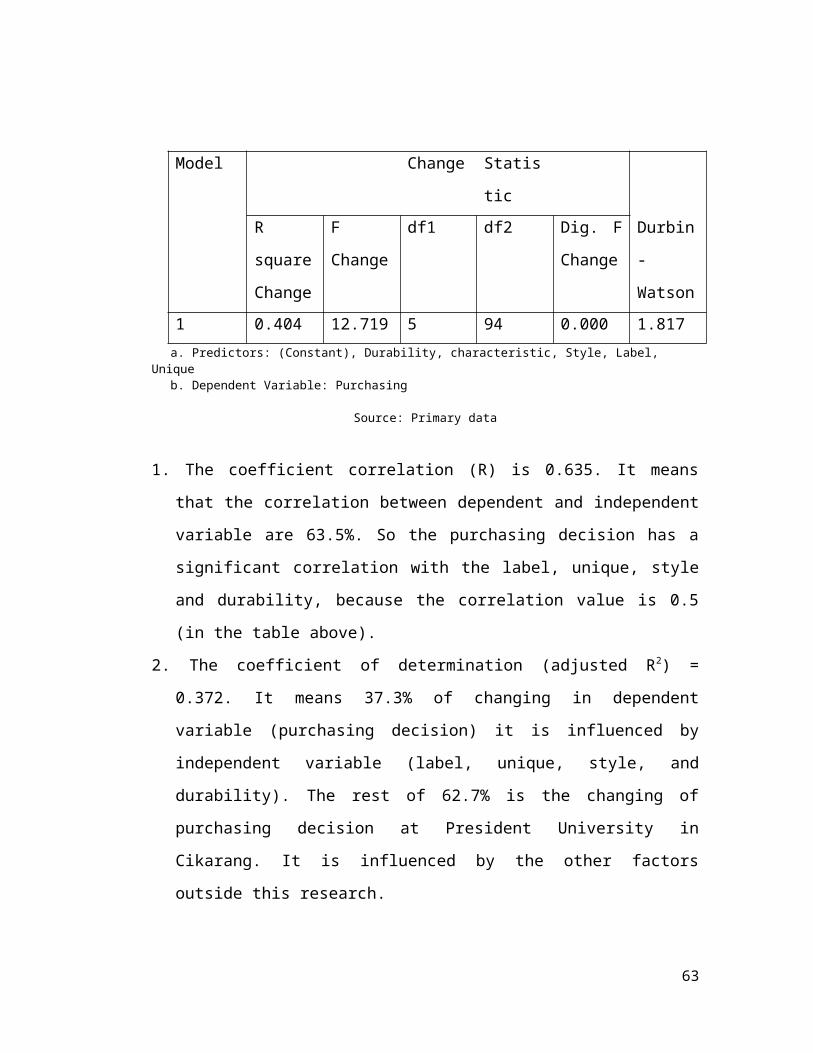
Model Change Statis
ticR
square
Change
F
Change
df1 df2 Dig. F
Change
Durbin
-
Watson1 0.404 12.719 5 94 0.000 1.817a. Predictors: (Constant), Durability, characteristic, Style, Label,
Uniqueb. Dependent Variable: Purchasing
Source: Primary data
1. The coefficient correlation (R) is 0.635. It means
that the correlation between dependent and independent
variable are 63.5%. So the purchasing decision has a
significant correlation with the label, unique, style
and durability, because the correlation value is 0.5
(in the table above).
2. The coefficient of determination (adjusted R2) =
0.372. It means 37.3% of changing in dependent
variable (purchasing decision) it is influenced by
independent variable (label, unique, style, and
durability). The rest of 62.7% is the changing of
purchasing decision at President University in
Cikarang. It is influenced by the other factors
outside this research.
63
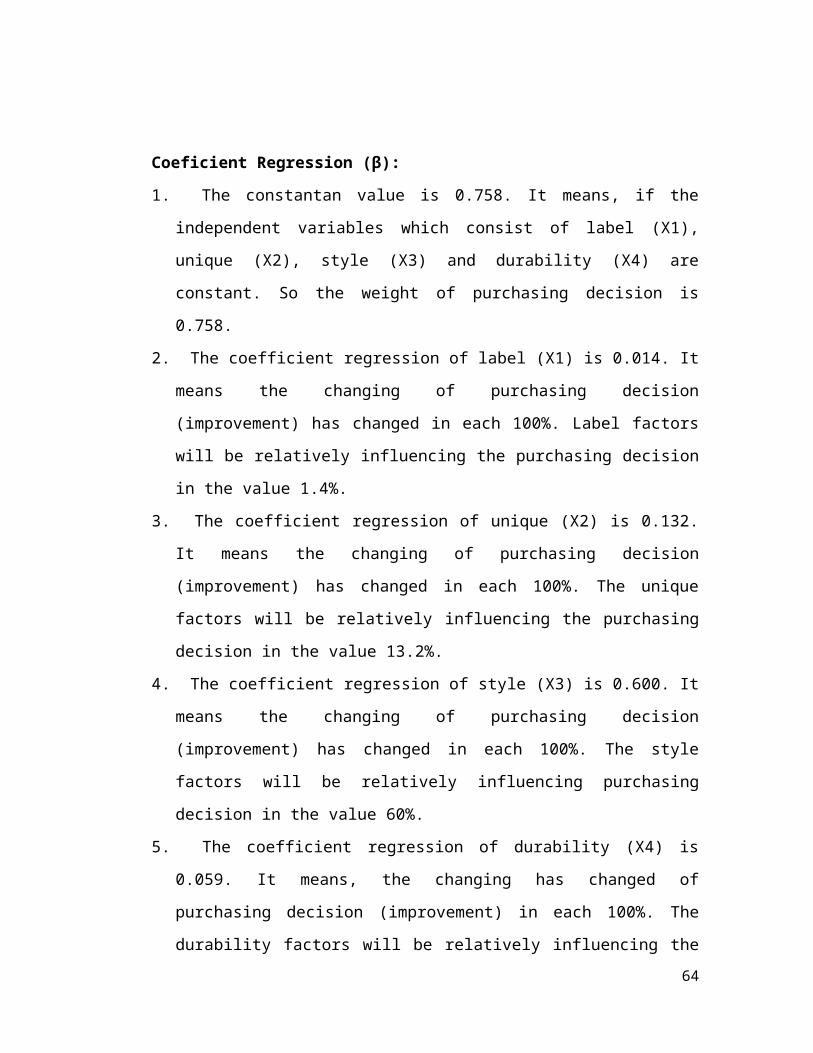
Coeficient Regression (β):
1. The constantan value is 0.758. It means, if the
independent variables which consist of label (X1),
unique (X2), style (X3) and durability (X4) are
constant. So the weight of purchasing decision is
0.758.
2. The coefficient regression of label (X1) is 0.014. It
means the changing of purchasing decision
(improvement) has changed in each 100%. Label factors
will be relatively influencing the purchasing decision
in the value 1.4%.
3. The coefficient regression of unique (X2) is 0.132.
It means the changing of purchasing decision
(improvement) has changed in each 100%. The unique
factors will be relatively influencing the purchasing
decision in the value 13.2%.
4. The coefficient regression of style (X3) is 0.600. It
means the changing of purchasing decision
(improvement) has changed in each 100%. The style
factors will be relatively influencing purchasing
decision in the value 60%.
5. The coefficient regression of durability (X4) is
0.059. It means, the changing has changed of
purchasing decision (improvement) in each 100%. The
durability factors will be relatively influencing the64
purchasing decision in the value 5.9%. So it will
increase the purchasing decision in the company, if
the company is improving the label factors,
Based on the explanations above, it could be concluded
that all of independent variables (label, unique, style,
and durability), the dominant factor that has
significantly influenced the purchasing decision is
style, with the value 60%. The other variables also
influenced the purchasing decision such as label (1.4%),
unique (13.2%), and durability (5.9%).
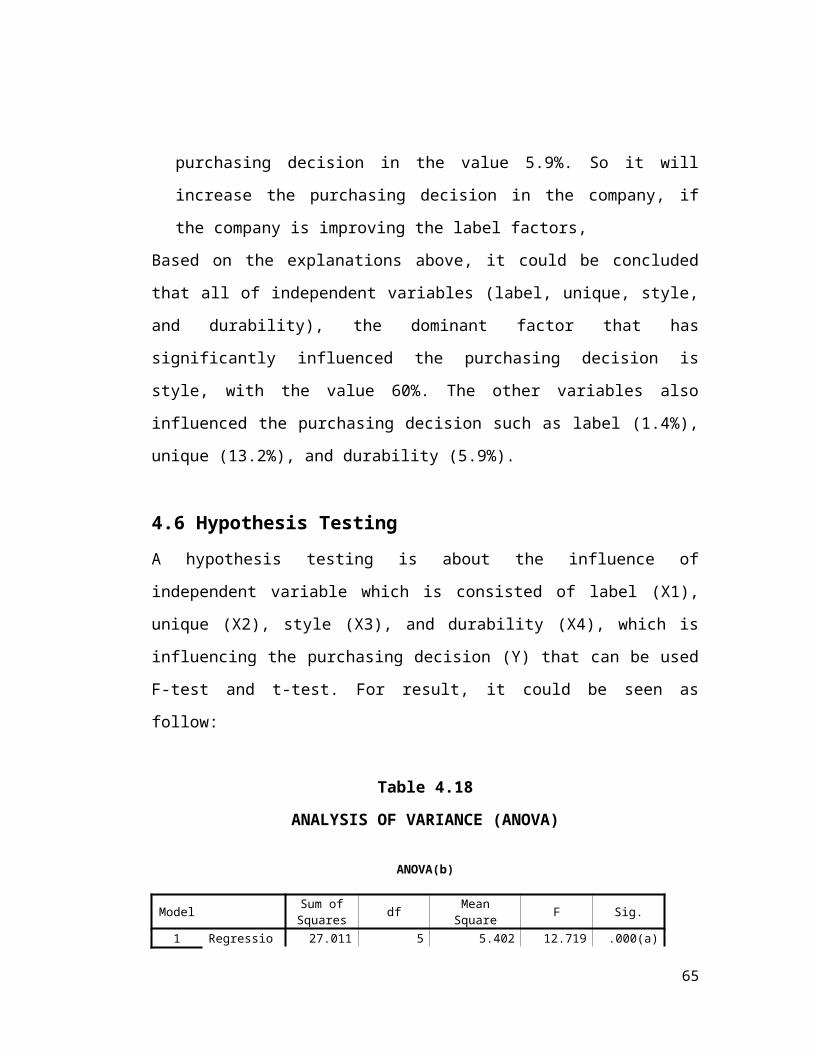
4.6 Hypothesis TestingA hypothesis testing is about the influence of
independent variable which is consisted of label (X1),
unique (X2), style (X3), and durability (X4), which is
influencing the purchasing decision (Y) that can be used
F-test and t-test. For result, it could be seen as
follow:
Table 4.18
ANALYSIS OF VARIANCE (ANOVA)
ANOVA(b)
Model Sum ofSquares df Mean
Square F Sig.
1 Regressio 27.011 5 5.402 12.719 .000(a)
65
nResidual 39.926 94 .425Total 66.938 99
a. Predictors: (Constant), Durability, characteristic, Style, Label, Uniqueb. Dependent Variable: Purchasing
Source: Primary data
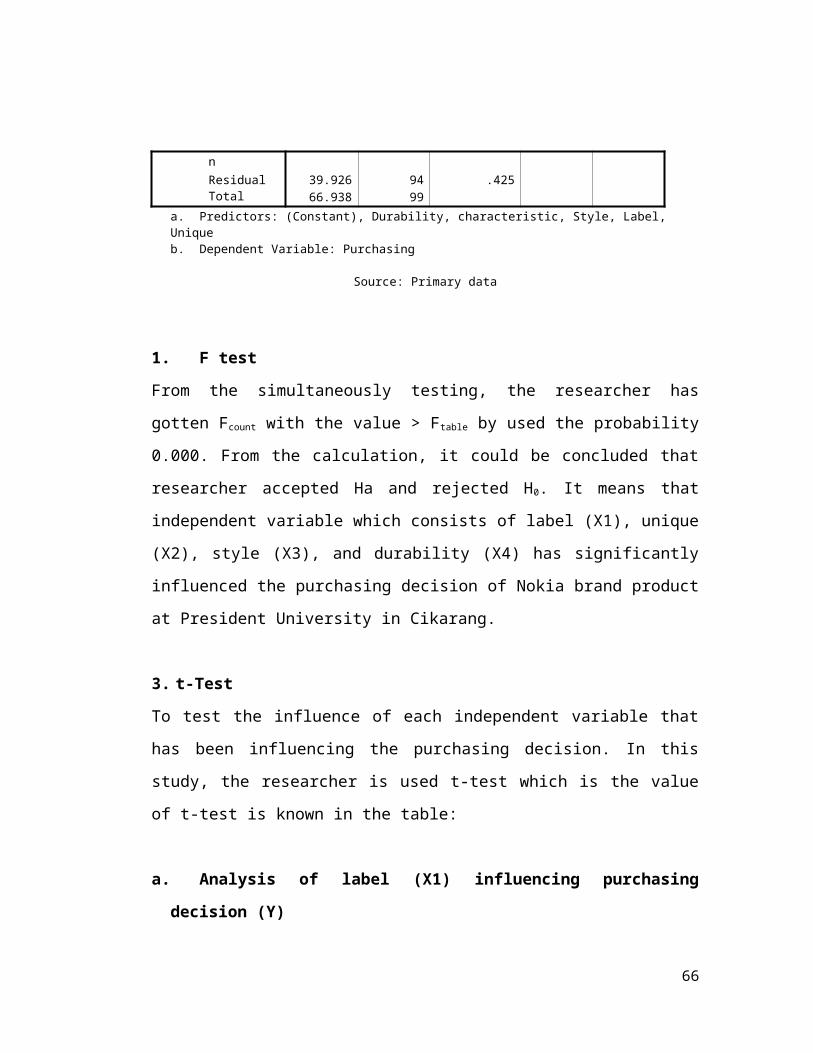
1. F test
From the simultaneously testing, the researcher has
gotten Fcount with the value > Ftable by used the probability
0.000. From the calculation, it could be concluded that
researcher accepted Ha and rejected H0. It means that
independent variable which consists of label (X1), unique
(X2), style (X3), and durability (X4) has significantly
influenced the purchasing decision of Nokia brand product
at President University in Cikarang.
3. t-Test
To test the influence of each independent variable that
has been influencing the purchasing decision. In this
study, the researcher is used t-test which is the value
of t-test is known in the table:
a. Analysis of label (X1) influencing purchasing
decision (Y)
66
The result of SPSS calculation shows, tcount of label are
0.240 and ttable are 1.985. It means, tcount with a
significant t 0.000 and a significant level α=5%. Hence,
the partially quality variable has a significant variable
which is influencing the purchasing decision. It means,
the researcher accepted Ha and rejected H0.
b. Analysis of Unique (X2) influencing purchasing
decision (Y)
The result of SPSS calculation shows, tcount of label are
1.495 and ttable are 1.985. It means that tcount with a
significant t 0.000 and a significant level α=5%. Hence,
the partially quality variable has a significant variable
which is influencing the purchasing decision. It means
the researcher accepted Ha and rejected H0.
c. Analysis of Style (X3) influencing purchasing
decision (Y)
The result of SPSS calculation shows tcount of label are
5.528 and ttable are 1.985. It means that tcount with a
significant t 0.000 and a significant level α=5%. Hence,
the partially quality variable has a significant variable
which is influencing the purchasing decision. It means
that researcher accepted Ha and rejected H0.
67
d. Analysis of Durability (X4) influencing purchasing
decision (Y)
The result of SPSS calculation shows tcount of label are
0.498 and ttable are 1.985. It means that tcount with a
significant t 0.000 and a significant level α=5%. Hence,
the partially quality variable has a significant variable
which is influencing the purchasing decision. It means
that researcher accepted Ha and rejected H0.
68
CHAPTER V
CONCLUSION AND RECOMMENDATION
5.1 Conclusion
Based on the result of the data analysis, the researcher
concludes as follow:
1. Based on analysis of multiple regression found that
every variable being observer that is the influence
of label (X1), unique (X2), style (X3), and
durability (X4) have a correlation, it is show from
69
the value of R = 0.635 and adjusted R2 = 0.372.
value of adjusted R2 show 37.2% changing purchasing
decision at Nokia brand is influence by variable
label, unique, style, and durability, and the rest
of 62.7% the changing of purchasing decision at
President University in CIkarang is influence by
another factors outside this research.
2. Based on result of t-test (partially) shows the
significant influence of independent variable
influencing purchasing decision. Style has more
significant than unique, label, and durability from
the result of t-test got that tcount of style (X3) is
bigger than label (X1), Unique (X2) and Durability
(X4).
3. Based on result of t-test (simultaneously shows that
every variables being researcher are significant
influencing to purchasing decision, iti is because
the value of Fcount = 12.719, compare with Ftable = 2.47
that means Fcount > Ftable at significance level α =
5%.
5.2 Recommendation
70
1. The result of this research show that there is a
correlation of the label, unique, style, and
durability with purchasing decision, so it is
important to increasing the purchasing decision at
Nokia brand in Cikarang. In addition, there are
dominant variable that has significant influence
such as style variable. Hence, highly expected a
Nokia brand product more give attention to style
variable.
2. Managerial of this suggestion of this research are
suggestions to management of Nokia brand product
design to more pay attention to the variable (label,
unique, style, and durability), because these
factors could be giving a good image to consumer of
Nokia brand and to increasing purchasing decision of
Nokia brand product.
3. For future improvement of the research, here is the
following recommendation to another research that
would conduct research in the same field or related
field.
a. The future research can lengthen the research
period more than this research to obtain more
result that is comprehensive.
71
b. The future research may observe other factors
that affect purchasing decision in future
studies.
BIBLIOGRAPHY
Books
Cooper, Donald & schindler, Pamela (2008). Business Research Methods. 10th
Edition. New York: MCGraw-Hill
Groebner, DF., Shannon, P., Fry, P., & Smith, K (2008). Business Statistic. 7th
Pearson Education
Kotler, P. & Amstrong, G (2010). Principle of Marketing, 13th Edition. New Jersey:
Pearson Education,
Kotler, P. & Keller, K.L (2009). Marketing Management, 13th Edistion. New Jersey
Pearson Education, Inc., Upper Saddle River
Phillip R. Cateora & John L. Graham. (2005). International Marketing, 12th Edition.
International Edition. New York: McGraw-Hill72
Journals
Rahmat S (2008). Difference Satisfaction Students Card User and CDMA GSM Mobile TechnologyJohan Oktavian (2004) Factor To consider Consumern Purchase Decision.Dimas Surya W (2011). Analisis Pengaruh Ekuitas Merek Terhadap Keputusamn Pembelian Handphone Blackberry.Hardian H (2010). Analisis Ekuitas Merek Terhadap Keputusan Pembelian Konsumens Pada Produk Handphone MerekNokia DIsemarang.Internetwww.nokia.com/global/about-nokia/www.nokia.com/global/about-nokia/investor/fiinancialswww.john-uebersax.com/stat/likert.html
73
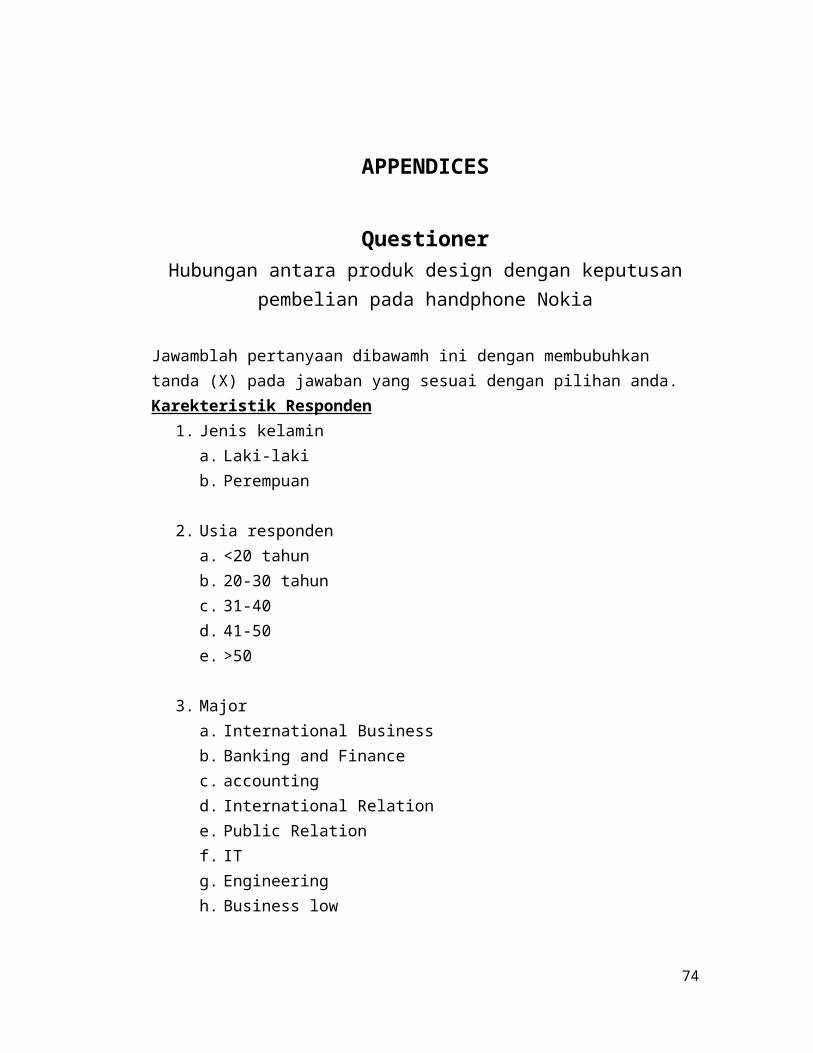
APPENDICES
QuestionerHubungan antara produk design dengan keputusan
pembelian pada handphone Nokia
Jawamblah pertanyaan dibawamh ini dengan membubuhkan tanda (X) pada jawaban yang sesuai dengan pilihan anda.Karekteristik Responden
1. Jenis kelamina. Laki-lakib. Perempuan
2. Usia respondena. <20 tahunb. 20-30 tahunc. 31-40d. 41-50e. >50
3. Majora. International Businessb. Banking and Financec. accountingd. International Relatione. Public Relationf. ITg. Engineeringh. Business low
74
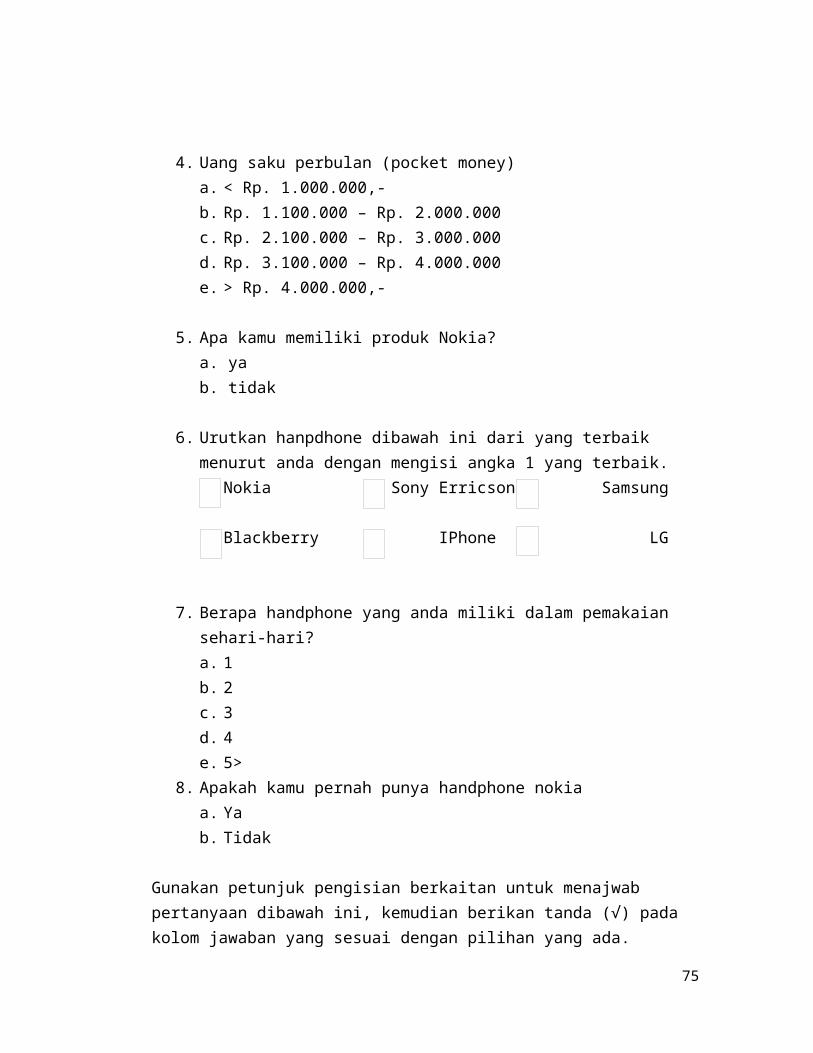
4. Uang saku perbulan (pocket money)a. < Rp. 1.000.000,-b. Rp. 1.100.000 – Rp. 2.000.000c. Rp. 2.100.000 – Rp. 3.000.000d. Rp. 3.100.000 – Rp. 4.000.000e. > Rp. 4.000.000,-
5. Apa kamu memiliki produk Nokia?a. yab. tidak
6. Urutkan hanpdhone dibawah ini dari yang terbaik menurut anda dengan mengisi angka 1 yang terbaik.
Nokia Sony Erricson Samsung
Blackberry IPhone LG
7. Berapa handphone yang anda miliki dalam pemakaian sehari-hari?a. 1b. 2c. 3d. 4e. 5>
8. Apakah kamu pernah punya handphone nokia a. Yab. Tidak
Gunakan petunjuk pengisian berkaitan untuk menajwab pertanyaan dibawah ini, kemudian berikan tanda (√) pada kolom jawaban yang sesuai dengan pilihan yang ada.
75
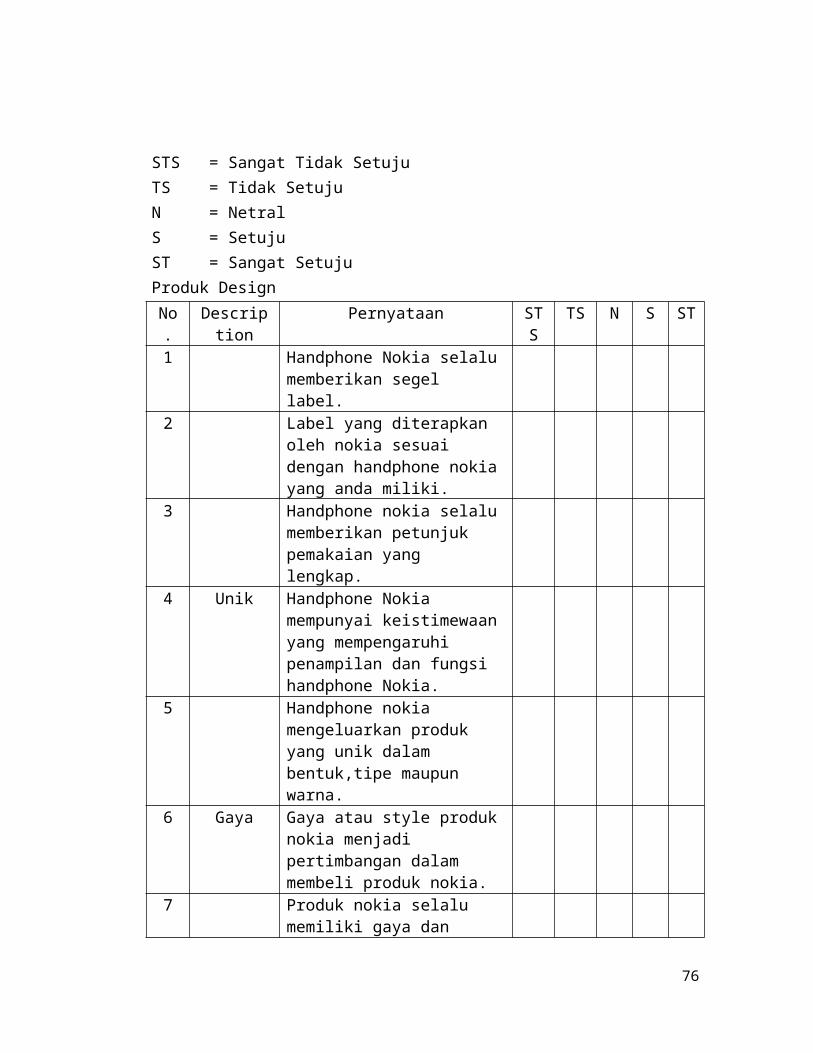
STS = Sangat Tidak SetujuTS = Tidak SetujuN = NetralS = SetujuST = Sangat SetujuProduk DesignNo.
Description
Pernyataan STS
TS N S ST
1 Handphone Nokia selalumemberikan segel label.
2 Label yang diterapkan oleh nokia sesuai dengan handphone nokiayang anda miliki.
3 Handphone nokia selalumemberikan petunjuk pemakaian yang lengkap.
4 Unik Handphone Nokia mempunyai keistimewaanyang mempengaruhi penampilan dan fungsi handphone Nokia.
5 Handphone nokia mengeluarkan produk yang unik dalam bentuk,tipe maupun warna.
6 Gaya Gaya atau style produknokia menjadi pertimbangan dalam membeli produk nokia.
7 Produk nokia selalu memiliki gaya dan
76
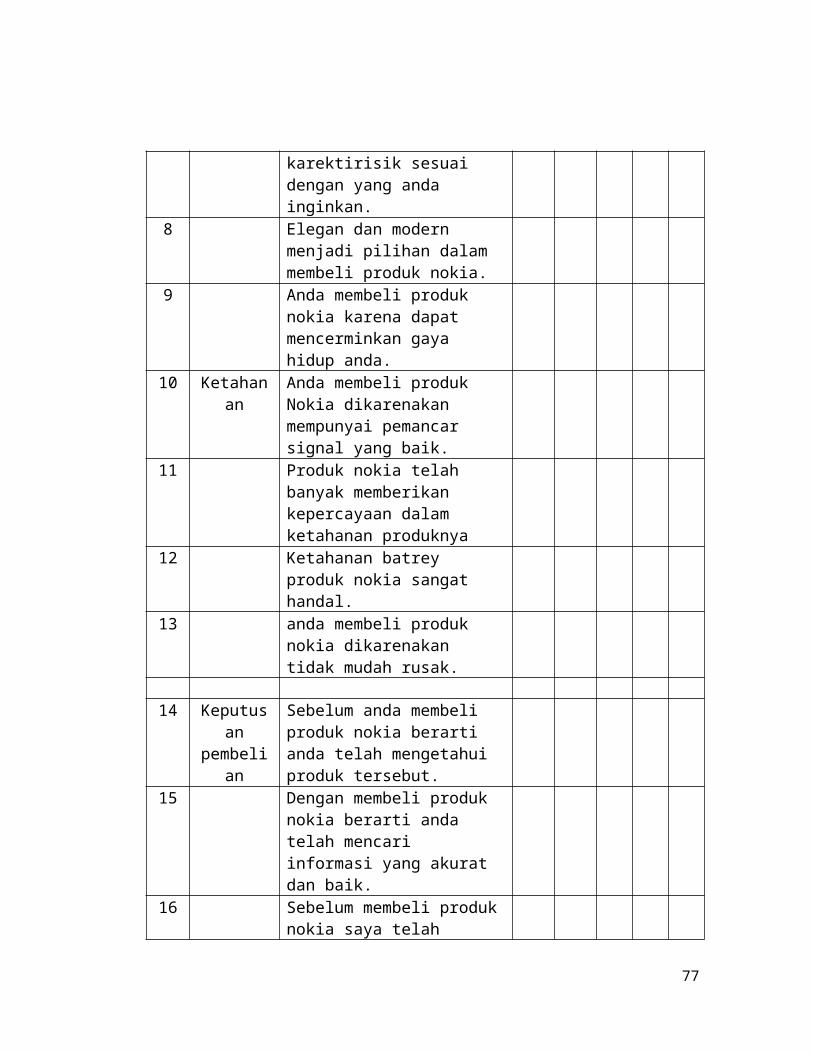
karektirisik sesuai dengan yang anda inginkan.
8 Elegan dan modern menjadi pilihan dalam membeli produk nokia.
9 Anda membeli produk nokia karena dapat mencerminkan gaya hidup anda.
10 Ketahanan
Anda membeli produk Nokia dikarenakan mempunyai pemancar signal yang baik.
11 Produk nokia telah banyak memberikan kepercayaan dalam ketahanan produknya
12 Ketahanan batrey produk nokia sangat handal.
13 anda membeli produk nokia dikarenakan tidak mudah rusak.
14 Keputusan
pembelian
Sebelum anda membeli produk nokia berarti anda telah mengetahui produk tersebut.
15 Dengan membeli produk nokia berarti anda telah mencari informasi yang akurat dan baik.
16 Sebelum membeli produknokia saya telah
77
mengevaluasi dan antisipasi produk-produk lainya.
17`
Dengan membeli produk nokia berarti anda telah melakukan pengambilan keputusan dilakukan secara sadar, objective dan terencana.
78