Values, expectations from the marketing system and product expectations
Upload
independentCategory
view
2download
0
The Correlation between Patient Characteristics andExpectations of Benefit from Phase I Clinical Trials
Kevin P. Weinfurt, Ph.D.1
Liana D. Castel, M.S.P.H.1
Yun Li, M.S.1
Daniel P. Sulmasy, O.F.M., M.D., Ph.D.2,3
Andrew M. Balshem, B.A.4
Al B. Benson III, M.D.6
Caroline B. Burnett, Sc.D., R.N.7,8
Darrell J. Gaskin, Ph.D.9
John L. Marshall, M.D.8
Elyse F. Slater, M.S.4
Kevin A. Schulman, M.D.1
Neal J. Meropol, M.D.4,5
1 Center for Clinical and Genetic Economics, DukeClinical Research Institute, Duke University Medi-cal Center, Durham, North Carolina.
2 John J. Conley Department of Ethics, St. Vin-cent’s Manhattan, Saint Vincent Catholic MedicalCenters, New York, New York.
3 Bioethics Institute of New York Medical College,Valhalla, New York.
4 Division of Population Science, Fox Chase CancerCenter, Philadelphia, Pennsylvania.
5 Division of Medical Science, Fox Chase CancerCenter, Philadelphia, Pennsylvania.
6 Division of Hematology/Oncology, NorthwesternUniversity, Chicago, Illinois.
7 School of Nursing, Georgetown University, Wash-ington, DC.
8 Lombardi Cancer Center, Georgetown University,Washington, DC.
9 Department of Health Policy and Management,Bloomberg School of Public Health, Johns HopkinsUniversity, Baltimore, Maryland.
Supported by grant R01 CA82085 from the Na-tional Cancer Institute, Bethesda, MD.
The sites, principal investigators, and projectcoordinators for this study included the follow-
ing: Fox Chase Cancer Center, Philadelphia, PA(principal investigator, Neal J. Meropol, M.D.;study coordinators, Joanne Buzaglo, Ph.D., San-dra Corbett, M.S., and Jennifer Driscoll, M.S.);Georgetown University, Washington, DC (princi-pal investigator, Caroline B. Burnett, Sc.D., R.N.;study coordinator, Shakira Washington, M.H.A.);Lurie Cancer Center, Northwestern University,Chicago, IL (principal investigator, Al B. BensonIII, M.D.; study coordinator, Kimberly Smith,M.S.); University of Maryland, Baltimore, MD(principal investigator, David Van Echo, M.D.;study coordinator, Jennifer DeSanto, R.N., M.S.);and Duke University Medical Center, Durham,NC (principal investigator, Kevin A. Schulman,M.D.; study coordinator, Liana D. Castel,M.S.P.H.).
The authors thank Damon Seils for general adviceand editorial assistance.
Address for reprints: Kevin P. Weinfurt, Ph.D., Cen-ter for Clinical and Genetic Economics, Duke Clin-ical Research Institute, P.O. Box 17969, Durham,NC 27715; Fax: (919) 668-7124; E-mail:[email protected]
The views expressed herein do not necessar-ily reflect the views of the National CancerInstitute.
Dr. Marshall has received speaker’s honorariafrom Roche (Basel, Switzerland), Pharmacia(Gaithersburg, MD), and Sanofi-Synthelabo (Paris,France). Dr. Marshall also has worked as a con-sultant for Boehringer Ingelheim.
Received December 17, 2002; revision receivedMarch 5, 2003; accepted March 18, 2003.
BACKGROUND. Patients in Phase I clinical trials sometimes report high expectations
regarding the benefit of treatment. The authors examined a range of patient
characteristics to determine which factors were associated with greater expecta-
tions of benefit from Phase I trials.
METHODS. Participants were adult patients with cancer who had been offered
participation in Phase I studies and had decided to participate. Patients completed
interviewer-administered surveys before initiation of treatment. Physicians as-
sessed Eastern Cooperative Oncology Group performance status for each patient.
Statistical analyses (Pearson product moment correlation and t tests) used multiple
imputation to account for missing data.
RESULTS. Overall, 593 patients who were offered participation in Phase I trials
were contacted, and 328 patients agreed to participate in a study of decision
making by cancer patients. Of these, 260 patients (79%) enrolled in a Phase I
trial. Patients’ expectations regarding the chance that their disease would be
controlled with experimental therapy were unrelated to age, gender, living
situation, education level, or functional status. Expectations were correlated
positively with beliefs about the benefit of standard therapy and the maximum
benefit patients may experience from experimental therapy. Greater expecta-
tions of benefit were associated with better health-related quality of life, stron-
ger religious faith, optimism, relative health stock, monetary risk seeking, and
poorer numeracy.
CONCLUSIONS. Expectations expressed as beliefs in personal outcomes may be
related more to quality of life and personality variables than to patients’ knowledge
166
Published 2003 by the American Cancer Society*
DOI 10.1002/cncr.11483
or functional status. Whether such expectations are accurate reflections of knowl-
edge has important implications for evaluating the informed consent process.
Cancer 2003;98:166 –75. © 2003 American Cancer Society.
KEYWORDS: clinical trials, phase I, decision making, informed consent, quality oflife.
A key element of the informed consent process isthe patient’s correct understanding of the treat-
ment or clinical trial in which he or she is participat-ing.1 For this reason, research on patients’ knowledgeabout treatment is critical for ensuring the adequacyof informed consent. Patients’ perceptions of theirchances of benefit from treatment or from participa-tion in a clinical trial has been a source of specialconcern. Patients with cancer who are making treat-ment decisions frequently overestimate the chance ofbenefit from particular treatments.2 For example, thiswas found to be true for many patients who wereconsidering whether to receive adjuvant therapy forbreast carcinoma. Siminoff and colleagues3 surveyedpatients and their physicians regarding the risk ofrecurrence with adjuvant therapy. Sixty percent of thepatients provided estimates of their chance of curethat were at least 20% greater compared with theestimates provided by physicians. Even among pa-tients whose physicians provided numerical estimatesof the chance of cure, close to half of the patientsoverestimated the chance of benefit by 20% or more.
Lee and colleagues4 recently examined discrepan-cies between patients’ and physicians’ estimates of thesuccess of stem cell transplantation. Patients whoagreed to undergo transplantation were surveyedprior to treatment, as were their physicians. Patientswith less severe disease provided estimates thatagreed reasonably well with those of their physicians.In contrast, patients with moderate to severe diseaseprovided estimates of the chance of cure from stemcell transplantation that were markedly higher com-pared with the estimates provided by physicians.
For patients considering participation in a trial ofa new experimental agent, there is great potential foroverestimating benefit. The primary goal of a Phase Itrial frequently is the determination of toxicity or abiologic endpoint other than therapeutic antitumoreffect. Historically, the response rate of Phase I trialshas been � 5%.5 Presumably, if the consent processfor Phase I trials is successful, then patients shouldunderstand the very small chance of personal benefitand the significant potential for experiencing toxicity.Given such an understanding, one would expect thatthe chief motivation for participation in Phase I trialswould be altruistic. A review of the literature5 suggests,however, that most patients say they are motivated
primarily by the hope of personal benefit. In a recentstudy by our group,6 patients who were offered par-ticipation in a Phase I trial were asked about theirchances that the treatment would control their cancer.The median response was 60%, with three-fourths ofthe patients reporting a chance of benefit of at least50%—a value 10 times greater than the frequency ofbenefit typically resulting from Phase I trials. Otherstudies have found similarly high expectations of ben-efit.2,7
Studies like these present clear evidence that pa-tients sometimes report expectations regarding thebenefit of treatment that are regarded as unrealisti-cally high by the medical community. It is unclear,however, what these reported expectations mean tothe patients. In a preliminary step toward answeringthis question, we examined a broad range of patientcharacteristics to determine which factors were asso-ciated with greater expectations of benefit from aPhase I trial. In doing so, we hope to understand betterthe meaning of patients’ reports of expectations ofbenefit.
A Typology of Patients’ ExpectationsPatients’ expectations take the form of statementsabout uncertain events (i.e., positive outcome fromtreatment). In attempting to understand these state-ments, it is important to be sensitive to the fact thatthere are different ways of expressing uncertainty, cor-responding to different philosophical interpretationsof the idea of probability. In the history of the philos-ophy of probability, a fundamental distinction hasbeen made between two types of probability. Whereasthe two types go by various names,8 we adopt Hack-ing’s scheme of dividing statements of uncertaintyinto frequency-type and belief-type statements.9,10 Afrequency-type statement refers to the relative fre-quency of outcomes for a group of patients. An exam-ple of such a statement might be, “Eighty out of every100 patients will benefit from the treatment I am re-ceiving. ” A belief-type statement, conversely, refers tohow confident a person is that a particular outcomewill occur for a particular patient. An example mightbe, “I am 80% confident that I will benefit from thistreatment.”
These two types of probability differ greatly fromone another. To understand this, imagine a patient
Expectations of Benefit From Phase I Trials/Weinfurt et al. 167
who says, “I understand that 10 out of 100 patients willbenefit, but I am 80% confident that I will be 1 of the10.” This statement is not illogical or contradictory,because frequency-type ideas (e.g., “X out of 100 willbenefit”) do not mean the same thing as belief-typeideas (e.g., “I am Y% confident that I will be 1 of theX”). Understanding what patients mean requires iden-tifying the type of probability they are using whencommunicating their chances of benefit. From an eth-ical standpoint, whether there should be concernabout a patient who expresses 80% confidence in agood outcome depends entirely on how such state-ments are generated and what they mean to the pa-tient (our unpublished data).
In the current study, we asked patients with can-cer about their expectations regarding the chance thatthey would benefit personally from an experimentaltreatment. Therefore, our inquiry was more likely toencourage a belief-type response than a frequency-type response. The latter may be encouraged by ask-ing patients, for example, to indicate how many pa-tients out of 100 will benefit from the treatment.Although patients may have understood our querydifferently than we intended, we assumed that mostpatients would respond with belief-type expectations.The current study constitutes a first step toward un-derstanding those expectations by examining the cor-relates of belief-type expectations about benefit froman experimental therapy among patients who agreedto participate in Phase I trials. The variables we exam-ined included demographic information, health-re-lated quality of life (HRQOL), numeracy, optimism,monetary risk preference, spirituality, and other vari-ables that have been related to patients’ decision mak-ing.
MATERIALS AND METHODSPatients and ProceduresEligible patients were adults with cancer who hadbeen offered participation in Phase I studies and haddecided to participate. Patients who already had ini-tiated treatment were excluded. Eligibility criteria in-cluded 1) advanced malignancy for which either therewas no standard effective therapy or standard therapyhad failed, 2) age 18 years or older, 3) life expectancy� 3 months, and 4) an Eastern Cooperative OncologyGroup (ECOG) performance status of 0 –2 (i.e., thepatient was ambulatory at least 50% of the time).Completion of ascertainment of patients who chose toparticipate in a Phase I study was confirmed by com-parison with protocol office enrollment lists. Physicianconsent was obtained prior to patient contact. Writtenconsent to participate in a study was then obtainedfrom the patients. Patient baseline surveys were con-
ducted either in person or by telephone. The studydesign and survey instruments were approved by theInstitutional Review Boards at each participatingstudy site and at the data center (Fox Chase CancerCenter, Philadelphia, PA; Duke University MedicalCenter, Durham, NC; University of Maryland, Balti-more; Georgetown University, Washington, DC; andNorthwestern University, Chicago, IL). Recruitmenttook place over 18 months.
MeasuresA multidisciplinary team that included medical on-cologists, nurses, psychologists, clinical economists,and a medical ethicist developed the questionnaires.Domains were developed based on study objectives,literature review, pilot tests, and relevant past stud-ies.7,11–21 The survey measures used for this analysisare described below.
Demographic characteristicsPatients reported their own age (in years), gender,level of education, marital/partnered status, and livingsituation. Education was recoded as a dichotomousvariable, with 1 indicating a college education and 0indicating no college education. Living situation alsowas recoded as a dichotomous variable (with 1 indi-cating living alone and 0 indicating other), as wasmarital/partnered status (with 1 indicating married/partnered and 0 indicating other).
Expectations of benefit and toxicityTo measure patients’ expectations of experimental orstandard treatments, we asked respondents to place amark on a horizontal bar ranging from 0% to 100% todescribe the likelihood of health outcomes associatedwith the treatments. Questions about benefit askedthe patients to indicate the probability that a treat-ment would control their cancer. Questions aboutharm asked the patients to indicate the probabilitythat a treatment would cause them to experience se-vere adverse reactions. Patients also were asked toindicate what they perceived as the maximum benefitthat any patient may experience as a result of experi-mental cancer therapy. Possible responses to thisquestion were “cancer totally cured;” “reduction of thenumber or size of tumors;” “cancer is controlled (i.e.,will not get any worse; stable disease);” “will not shrinkcancer, but will improve symptoms;” and “will notshrink cancer or improve symptoms;” as well as “notapplicable,” “don’t know,” and “unsure.” This variablewas coded as a continuous variable ranging from 1(greatest expectation of benefit or “cancer totallycured”) to 5 (no expectation of benefit or “will notshrink cancer or improve symptoms”).
168 CANCER July 1, 2003 / Volume 98 / Number 1
NumeracyA single item assessed how well patients understood astatement about the relative frequency of benefit froma hypothetical treatment. Patients were asked to imag-ine that their physician described a treatment thatcontrolled cancer in “40% of cases like yours.” Using amultiple-choice format, patients were asked to selectthe statement that best described what their physicianmeant. The correct response was, “For every 100 pa-tients like me, the treatment will work for 40 patients.”Other response options included, “the doctor is 40%confident that the treatment will control my cancer;”“the new treatment will reduce my disease by 40%;”and “I am not sure what this information means.”
HRQOLWe assessed three measures of HRQOL. To measurepatients’ overall health perceptions, we used the Gen-eral Health Perceptions scale of the Medical OutcomesStudy Short Form 36 (SF-36).21 Overall physical andmental health were measured using the Physical Com-ponent Summary (PCS) score and the Mental Compo-nent Summary (MCS) score of the Medical OutcomesStudy Short Form 12 (SF-12).20 All 3 measures ofHRQOL produce scores ranging from 0 to 100, withhigher scores reflecting better health.
Performance statusTo index the functional status of the patients, weobtained the physician-rated ECOG performance sta-tus for all patients whose physician completed a phy-sician survey. ECOG performance status ranges from 0(no symptoms) to 4 (bed-bound). To be eligible for thecurrent study, patients were required to have an ECOGperformance status of 0 –2. Due to the sparse frequen-cies, we recoded ECOG status as no symptoms (ECOGperformance status, 0) or symptoms (ECOG perfor-mance status, 1 or 2).
Decisional conflict scaleTo measure several aspects of decisional conflict, weused the previously validated Decisional ConflictScale,15 which uses five-point Likert scales. The Un-certainty subscale (three items) measures the extent ofuncertainty the person is experiencing regarding thedecision. A second subscale (nine items) addressesfeelings of uncertainty. The Effective Decision-Makingsubscale (four items) measures perceptions that a de-cision is well-informed and likely to be adhered to.Finally, the Overall Decisional Conflict score sums theitems in the subscales for an aggregate score. For allsubscales, higher scores indicate greater decisionalconflict.
SpiritualityStrength of faith was measured by asking patients,“How strong would you say your religious beliefs are?”Responses ranged from 1 (not very strong) to 4 (verystrong). Comfort of faith was measured by asking pa-tients, “How comforting to you are your religious orspiritual beliefs?” Responses ranged from 1 (not at allcomforting) to 4 (very comforting). For both ques-tions, responses of not applicable were considered toreflect a level of strength or comfort lower than notvery strong or not at all comforting. Responses werecoded such that higher scores reflected greaterstrength or comfort of faith.
OptimismWe assessed self-reported dispositional optimism us-ing a single item, which asked patients to rate them-selves on a 7-point Likert scale ranging from 1 (veryoptimistic) to 7 (very pessimistic). For the purposes ofthe analysis, we reverse-keyed this item, so that higherscores reflected greater optimism.
Monetary risk preferenceTo measure monetary risk preference, the interviewersasked patients to identify the lowest dollar amount—ranging from $100 to $800 —they would be willing toaccept instead of a lottery ticket that offered a 50%chance of winning $1000. The expected value of thisgamble is $500. Thus, we recoded responses into risk-averse (� $450), risk-neutral (� $450 and � $550), andrisk-seeking (� $550).
Control preferences scaleThe extensively studied Control Preferences Scale11
was used to assess patients’ wishes regarding shareddecision making. Patients selected from among fivedescriptions of the relative roles of patient and physi-cian, ranging from “I prefer to make the final selectionabout which treatment I will receive” (option A), to “Iprefer that my doctor and I share responsibility fordeciding which treatment is best for me” (option C), to“I prefer to leave all decisions regarding my treatmentto my doctor” (option E). Responses were coded from1 to 5, with higher values reflecting a preference forless participation in the decision.
Relative health stockHealth stock is a concept from the health economicsliterature pioneered by Grossman.22 In the Grossmanmodel, health stock is an individual’s current health,including her expected longevity and quality of life.With each day of life, an individual reduces her healthstock by 1 day. Barring disease, accident, and injury,
Expectations of Benefit From Phase I Trials/Weinfurt et al. 169
an individual will draw down her natural endowmentof health stock until she reaches old age and dies ofnatural causes. In other words, health stock representsquality-adjusted life expectancy. Illness reduces anindividual’s health stock substantially. Our concept ofrelative health stock, elaborated elsewhere by Gaskinet al.,14 refers to the patient’s health stock due to hercurrent cancer diagnosis in relation to her health stockprior to the current diagnosis of cancer or change incondition. In our questionnaire for the current study,we asked patients to think of the fullness of theirlife—prior to their most recent diagnosis—as a wholepie. Using a diagram containing eight pies rangingfrom a full pie to an empty pie, we then asked patientsto identify the portion of pie that best representedhow much of the fullness of their life was lost due totheir recent cancer diagnosis or change in condition.Responses were converted to a 0 –100 scale, with 0denoting that all of life’s fullness had been lost, and100 denoting that none of life’s fullness had been lost.
Importance of quality versus length of lifeA five-point, Likert-type scale was used to determinethe extent to which patients valued quality of lifeversus length of life, with choices including quality oflife is all that matters, quality of life is more important,both are equally important, length of life is more im-portant, and length of life is all that matters.
Previous experimental therapyPatients indicated that they received prior experimen-tal therapy (e.g., clinical trial) by placing a tick marknext to the item on a list of types of cancer treatments.
Statistical AnalysisMissing data were handled using multiple imputationby means of a full Bayes multivariate normal imputa-tion model containing all study variables.23 That is, afull Bayes multivariate normal model of the data withnoninformative priors was used to generate posteriordensities from which values were drawn to replacemissing values. For any missing value, five values weredrawn from the posterior distribution of the imputa-tion model, such that five different versions of the dataset were created. All statistical analyses (e.g., t tests,chi-square tests) were conducted separately by impu-tation sample, and the results were combined usingrules described by Schafer.23
Demographic characteristics were calculated forthe original (nonimputed) sample. Means and stan-dard errors of key study variables were calculated forcomplete data only as well as for the multiply imputedsample. The fraction of missing information23 also wascomputed for each of the key study variables. Missing
information is more informative than the percentageof respondents who miss a variable, because theformer refers to how much information about a vari-able has been lost due to the missing data. For exam-ple, 30% of the sample may be missing variable Z, butZ is associated strongly with the other variables in thestudy. So long as some other variables are observed,variance in Z will be recoverable from variance invariables that are correlated with Z; thus, the fractionof missing information on Z will be � 30%.
The correlations between expectations of benefitfrom experimental therapy and other study variableswere ascertained using the Pearson product-momentcorrelation and t tests. Nonparametric tests were con-ducted on the nonimputed data set to confirm thedirection and significance of all correlations foundusing the parametric tests. Because parametric analy-ses are required for analyzing the multiply imputeddata set, we report only the parametric results (Pear-son correlation coefficients [r] and t tests). Potentialcorrelates of expectations of benefit were selected onthe basis of a priori theory; thus � � 0.05 was thecriterion used for statistical significance in all t tests,and 95% confidence intervals were used in the case ofall Pearson correlation coefficients (r).24
RESULTSOverall, 593 patients who were offered participation inPhase I trials were contacted, and 328 patients agreedto participate in a study of cancer patients’ decisionmaking. Of these, 260 patients (79%) chose to enroll ina Phase I trial (144 men [55%] and 116 women [45%]).This group constituted the sample for the study. Phy-sician-rated ECOG performance status was availablefor 199 of 260 patients in the sample (76%).
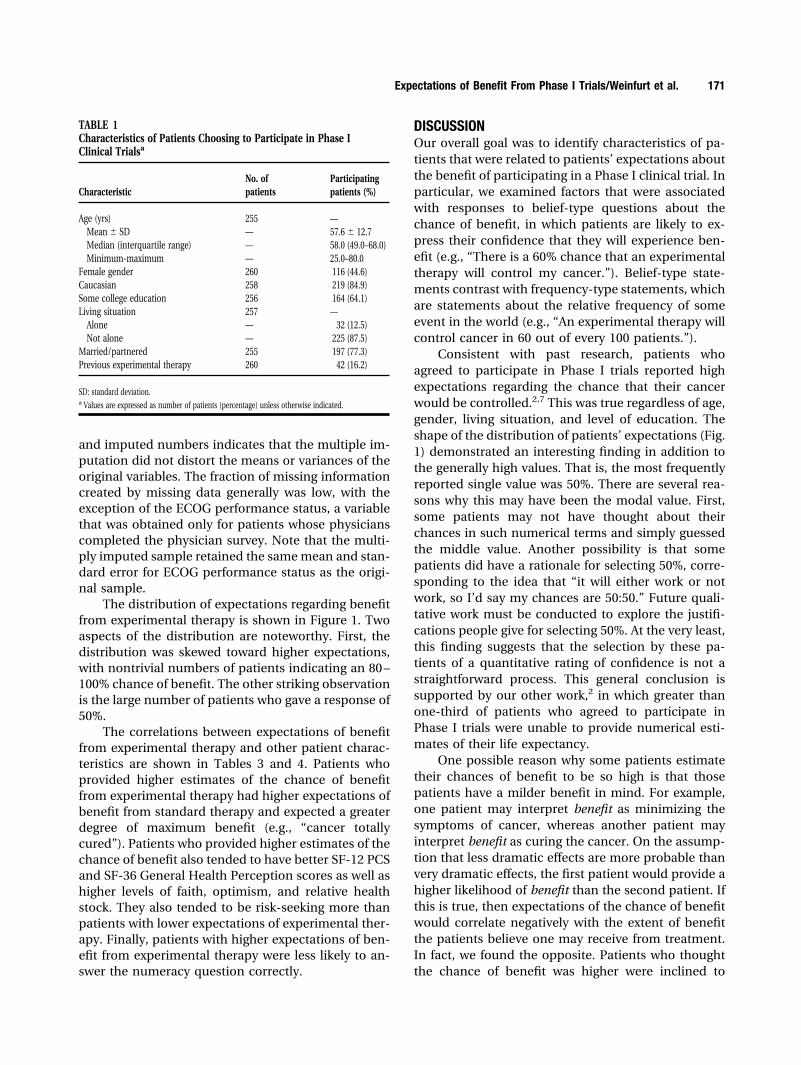
Table 1 shows the demographic and clinical char-acteristics of the sample. The mean � standard devi-ation age was 57.6 years � 12.7 years. The majority ofthe patients (85%) were Caucasian. Sixty-four percentof patients had attended at least some college. Themajority of patients (88%) did not live alone. Sixteenpercent of patients reported that they already hadreceived experimental therapy.
A total of 54 Phase I trials of different varietieswere active during the study period. These includedstudies of investigational agents alone (37%), investi-gational and standard agents (28%), and standardagents in combination (35%). Of the 20 studies ofinvestigational agents alone, 16 studies (80%) involvedcytostatic or biologic therapies.
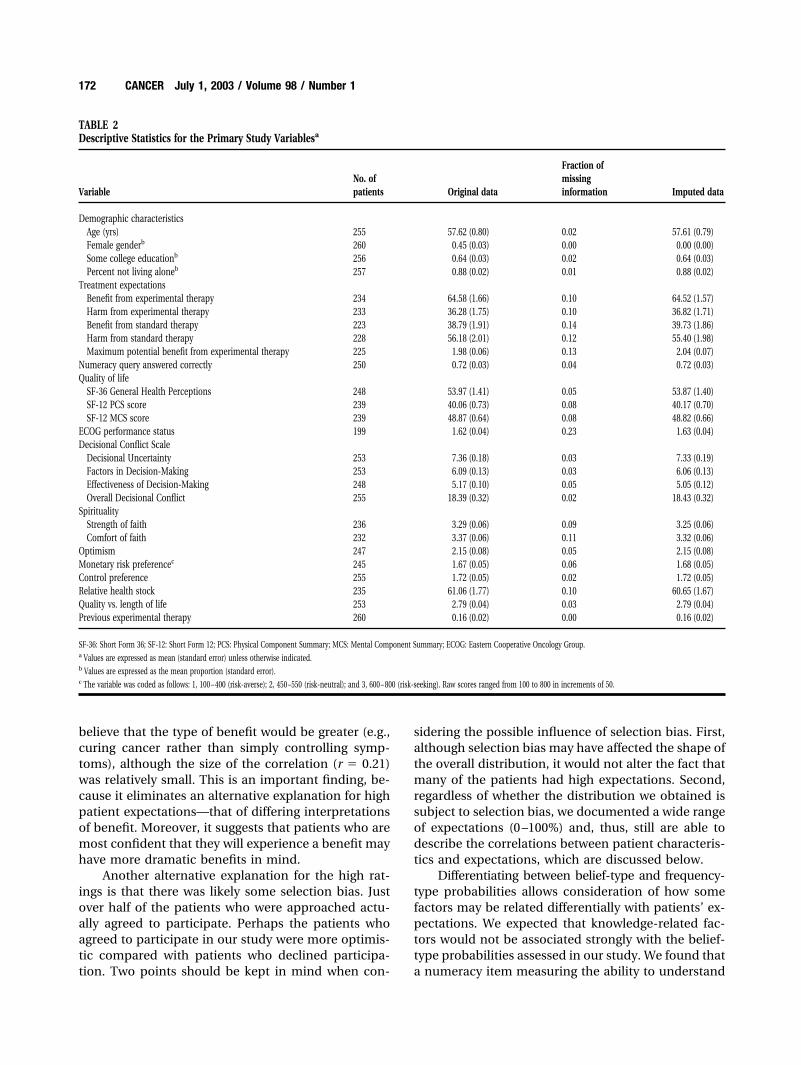
Table 2 shows the descriptive statistics for themain study variables for both the original sample andthe multiply imputed sample on which all subsequentanalyses were performed. A comparison of the original
170 CANCER July 1, 2003 / Volume 98 / Number 1
and imputed numbers indicates that the multiple im-putation did not distort the means or variances of theoriginal variables. The fraction of missing informationcreated by missing data generally was low, with theexception of the ECOG performance status, a variablethat was obtained only for patients whose physicianscompleted the physician survey. Note that the multi-ply imputed sample retained the same mean and stan-dard error for ECOG performance status as the origi-nal sample.
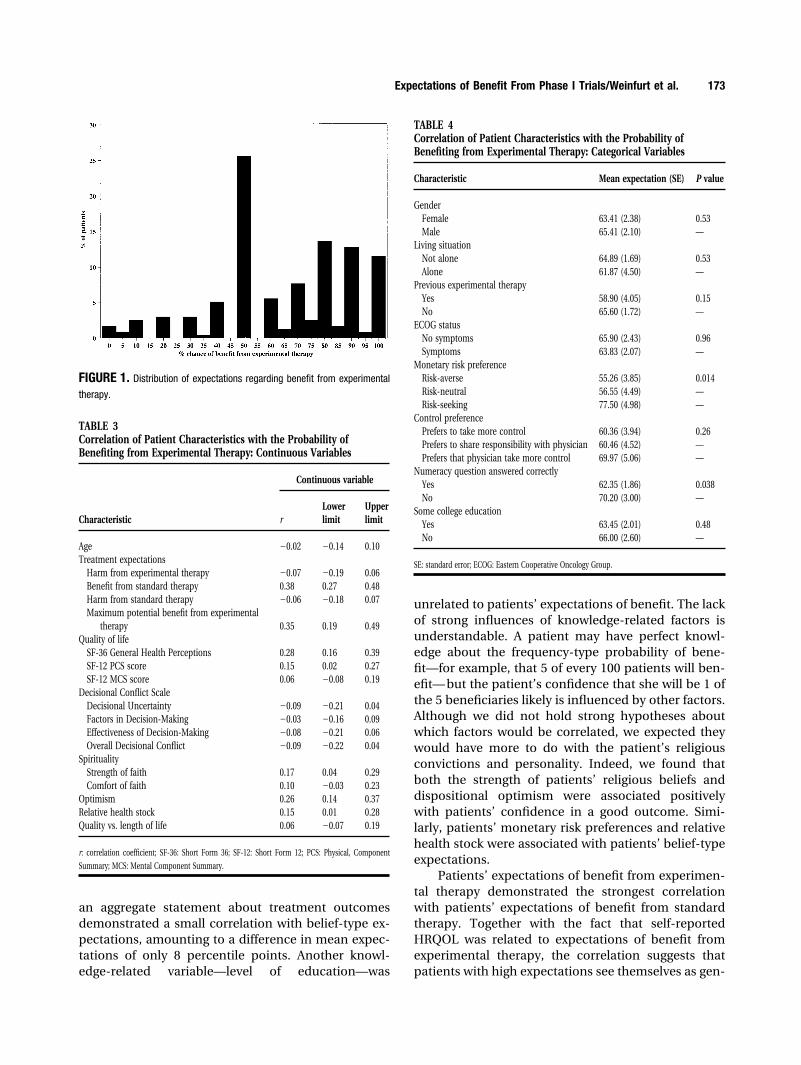
The distribution of expectations regarding benefitfrom experimental therapy is shown in Figure 1. Twoaspects of the distribution are noteworthy. First, thedistribution was skewed toward higher expectations,with nontrivial numbers of patients indicating an 80 –100% chance of benefit. The other striking observationis the large number of patients who gave a response of50%.
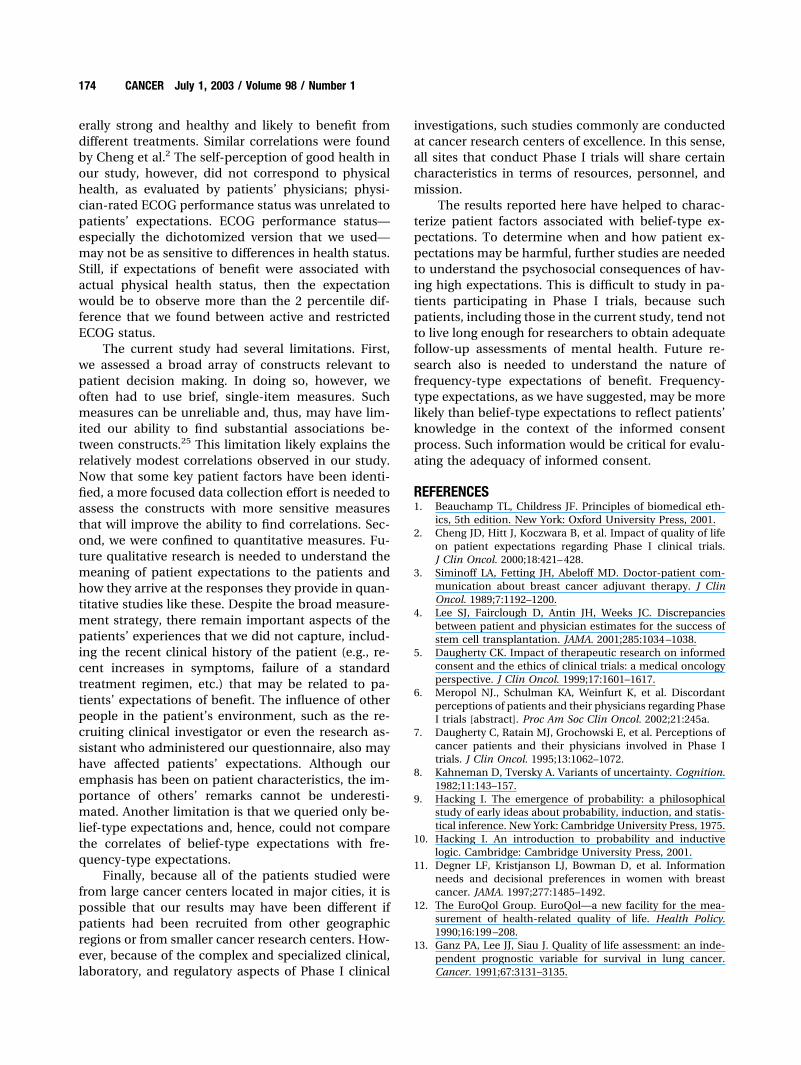
The correlations between expectations of benefitfrom experimental therapy and other patient charac-teristics are shown in Tables 3 and 4. Patients whoprovided higher estimates of the chance of benefitfrom experimental therapy had higher expectations ofbenefit from standard therapy and expected a greaterdegree of maximum benefit (e.g., “cancer totallycured”). Patients who provided higher estimates of thechance of benefit also tended to have better SF-12 PCSand SF-36 General Health Perception scores as well ashigher levels of faith, optimism, and relative healthstock. They also tended to be risk-seeking more thanpatients with lower expectations of experimental ther-apy. Finally, patients with higher expectations of ben-efit from experimental therapy were less likely to an-swer the numeracy question correctly.
DISCUSSIONOur overall goal was to identify characteristics of pa-tients that were related to patients’ expectations aboutthe benefit of participating in a Phase I clinical trial. Inparticular, we examined factors that were associatedwith responses to belief-type questions about thechance of benefit, in which patients are likely to ex-press their confidence that they will experience ben-efit (e.g., “There is a 60% chance that an experimentaltherapy will control my cancer.”). Belief-type state-ments contrast with frequency-type statements, whichare statements about the relative frequency of someevent in the world (e.g., “An experimental therapy willcontrol cancer in 60 out of every 100 patients.”).
Consistent with past research, patients whoagreed to participate in Phase I trials reported highexpectations regarding the chance that their cancerwould be controlled.2,7 This was true regardless of age,gender, living situation, and level of education. Theshape of the distribution of patients’ expectations (Fig.1) demonstrated an interesting finding in addition tothe generally high values. That is, the most frequentlyreported single value was 50%. There are several rea-sons why this may have been the modal value. First,some patients may not have thought about theirchances in such numerical terms and simply guessedthe middle value. Another possibility is that somepatients did have a rationale for selecting 50%, corre-sponding to the idea that “it will either work or notwork, so I’d say my chances are 50:50.” Future quali-tative work must be conducted to explore the justifi-cations people give for selecting 50%. At the very least,this finding suggests that the selection by these pa-tients of a quantitative rating of confidence is not astraightforward process. This general conclusion issupported by our other work,2 in which greater thanone-third of patients who agreed to participate inPhase I trials were unable to provide numerical esti-mates of their life expectancy.
One possible reason why some patients estimatetheir chances of benefit to be so high is that thosepatients have a milder benefit in mind. For example,one patient may interpret benefit as minimizing thesymptoms of cancer, whereas another patient mayinterpret benefit as curing the cancer. On the assump-tion that less dramatic effects are more probable thanvery dramatic effects, the first patient would provide ahigher likelihood of benefit than the second patient. Ifthis is true, then expectations of the chance of benefitwould correlate negatively with the extent of benefitthe patients believe one may receive from treatment.In fact, we found the opposite. Patients who thoughtthe chance of benefit was higher were inclined to
TABLE 1Characteristics of Patients Choosing to Participate in Phase IClinical Trialsa
CharacteristicNo. ofpatients
Participatingpatients (%)
Age (yrs) 255 —Mean � SD — 57.6 � 12.7Median (interquartile range) — 58.0 (49.0–68.0)Minimum-maximum — 25.0–80.0
Female gender 260 116 (44.6)Caucasian 258 219 (84.9)Some college education 256 164 (64.1)Living situation 257 —
Alone — 32 (12.5)Not alone — 225 (87.5)
Married/partnered 255 197 (77.3)Previous experimental therapy 260 42 (16.2)
SD: standard deviation.a Values are expressed as number of patients (percentage) unless otherwise indicated.
Expectations of Benefit From Phase I Trials/Weinfurt et al. 171
believe that the type of benefit would be greater (e.g.,curing cancer rather than simply controlling symp-toms), although the size of the correlation (r � 0.21)was relatively small. This is an important finding, be-cause it eliminates an alternative explanation for highpatient expectations—that of differing interpretationsof benefit. Moreover, it suggests that patients who aremost confident that they will experience a benefit mayhave more dramatic benefits in mind.
Another alternative explanation for the high rat-ings is that there was likely some selection bias. Justover half of the patients who were approached actu-ally agreed to participate. Perhaps the patients whoagreed to participate in our study were more optimis-tic compared with patients who declined participa-tion. Two points should be kept in mind when con-
sidering the possible influence of selection bias. First,although selection bias may have affected the shape ofthe overall distribution, it would not alter the fact thatmany of the patients had high expectations. Second,regardless of whether the distribution we obtained issubject to selection bias, we documented a wide rangeof expectations (0 –100%) and, thus, still are able todescribe the correlations between patient characteris-tics and expectations, which are discussed below.
Differentiating between belief-type and frequency-type probabilities allows consideration of how somefactors may be related differentially with patients’ ex-pectations. We expected that knowledge-related fac-tors would not be associated strongly with the belief-type probabilities assessed in our study. We found thata numeracy item measuring the ability to understand
TABLE 2Descriptive Statistics for the Primary Study Variablesa
VariableNo. ofpatients Original data
Fraction ofmissinginformation Imputed data
Demographic characteristicsAge (yrs) 255 57.62 (0.80) 0.02 57.61 (0.79)Female genderb 260 0.45 (0.03) 0.00 0.00 (0.00)Some college educationb 256 0.64 (0.03) 0.02 0.64 (0.03)Percent not living aloneb 257 0.88 (0.02) 0.01 0.88 (0.02)
Treatment expectationsBenefit from experimental therapy 234 64.58 (1.66) 0.10 64.52 (1.57)Harm from experimental therapy 233 36.28 (1.75) 0.10 36.82 (1.71)Benefit from standard therapy 223 38.79 (1.91) 0.14 39.73 (1.86)Harm from standard therapy 228 56.18 (2.01) 0.12 55.40 (1.98)Maximum potential benefit from experimental therapy 225 1.98 (0.06) 0.13 2.04 (0.07)
Numeracy query answered correctly 250 0.72 (0.03) 0.04 0.72 (0.03)Quality of life
SF-36 General Health Perceptions 248 53.97 (1.41) 0.05 53.87 (1.40)SF-12 PCS score 239 40.06 (0.73) 0.08 40.17 (0.70)SF-12 MCS score 239 48.87 (0.64) 0.08 48.82 (0.66)
ECOG performance status 199 1.62 (0.04) 0.23 1.63 (0.04)Decisional Conflict Scale
Decisional Uncertainty 253 7.36 (0.18) 0.03 7.33 (0.19)Factors in Decision-Making 253 6.09 (0.13) 0.03 6.06 (0.13)Effectiveness of Decision-Making 248 5.17 (0.10) 0.05 5.05 (0.12)Overall Decisional Conflict 255 18.39 (0.32) 0.02 18.43 (0.32)
SpiritualityStrength of faith 236 3.29 (0.06) 0.09 3.25 (0.06)Comfort of faith 232 3.37 (0.06) 0.11 3.32 (0.06)
Optimism 247 2.15 (0.08) 0.05 2.15 (0.08)Monetary risk preferencec 245 1.67 (0.05) 0.06 1.68 (0.05)Control preference 255 1.72 (0.05) 0.02 1.72 (0.05)Relative health stock 235 61.06 (1.77) 0.10 60.65 (1.67)Quality vs. length of life 253 2.79 (0.04) 0.03 2.79 (0.04)Previous experimental therapy 260 0.16 (0.02) 0.00 0.16 (0.02)
SF-36: Short Form 36; SF-12: Short Form 12; PCS: Physical Component Summary; MCS: Mental Component Summary; ECOG: Eastern Cooperative Oncology Group.a Values are expressed as mean (standard error) unless otherwise indicated.b Values are expressed as the mean proportion (standard error).c The variable was coded as follows: 1, 100 – 400 (risk-averse); 2, 450 –550 (risk-neutral); and 3, 600 – 800 (risk-seeking). Raw scores ranged from 100 to 800 in increments of 50.
172 CANCER July 1, 2003 / Volume 98 / Number 1
an aggregate statement about treatment outcomesdemonstrated a small correlation with belief-type ex-pectations, amounting to a difference in mean expec-tations of only 8 percentile points. Another knowl-edge-related variable—level of education—was
unrelated to patients’ expectations of benefit. The lackof strong influences of knowledge-related factors isunderstandable. A patient may have perfect knowl-edge about the frequency-type probability of bene-fit—for example, that 5 of every 100 patients will ben-efit— but the patient’s confidence that she will be 1 ofthe 5 beneficiaries likely is influenced by other factors.Although we did not hold strong hypotheses aboutwhich factors would be correlated, we expected theywould have more to do with the patient’s religiousconvictions and personality. Indeed, we found thatboth the strength of patients’ religious beliefs anddispositional optimism were associated positivelywith patients’ confidence in a good outcome. Simi-larly, patients’ monetary risk preferences and relativehealth stock were associated with patients’ belief-typeexpectations.
Patients’ expectations of benefit from experimen-tal therapy demonstrated the strongest correlationwith patients’ expectations of benefit from standardtherapy. Together with the fact that self-reportedHRQOL was related to expectations of benefit fromexperimental therapy, the correlation suggests thatpatients with high expectations see themselves as gen-
FIGURE 1. Distribution of expectations regarding benefit from experimental
therapy.
TABLE 3Correlation of Patient Characteristics with the Probability ofBenefiting from Experimental Therapy: Continuous Variables
Characteristic
Continuous variable
rLowerlimit
Upperlimit
Age �0.02 �0.14 0.10Treatment expectations
Harm from experimental therapy �0.07 �0.19 0.06Benefit from standard therapy 0.38 0.27 0.48Harm from standard therapy �0.06 �0.18 0.07Maximum potential benefit from experimental
therapy 0.35 0.19 0.49Quality of life
SF-36 General Health Perceptions 0.28 0.16 0.39SF-12 PCS score 0.15 0.02 0.27SF-12 MCS score 0.06 �0.08 0.19
Decisional Conflict ScaleDecisional Uncertainty �0.09 �0.21 0.04Factors in Decision-Making �0.03 �0.16 0.09Effectiveness of Decision-Making �0.08 �0.21 0.06Overall Decisional Conflict �0.09 �0.22 0.04
SpiritualityStrength of faith 0.17 0.04 0.29Comfort of faith 0.10 �0.03 0.23
Optimism 0.26 0.14 0.37Relative health stock 0.15 0.01 0.28Quality vs. length of life 0.06 �0.07 0.19
r: correlation coefficient; SF-36: Short Form 36; SF-12: Short Form 12; PCS: Physical, Component
Summary; MCS: Mental Component Summary.
TABLE 4Correlation of Patient Characteristics with the Probability ofBenefiting from Experimental Therapy: Categorical Variables
Characteristic Mean expectation (SE) P value
GenderFemale 63.41 (2.38) 0.53Male 65.41 (2.10) —
Living situationNot alone 64.89 (1.69) 0.53Alone 61.87 (4.50) —
Previous experimental therapyYes 58.90 (4.05) 0.15No 65.60 (1.72) —
ECOG statusNo symptoms 65.90 (2.43) 0.96Symptoms 63.83 (2.07) —
Monetary risk preferenceRisk-averse 55.26 (3.85) 0.014Risk-neutral 56.55 (4.49) —Risk-seeking 77.50 (4.98) —
Control preferencePrefers to take more control 60.36 (3.94) 0.26Prefers to share responsibility with physician 60.46 (4.52) —Prefers that physician take more control 69.97 (5.06) —
Numeracy question answered correctlyYes 62.35 (1.86) 0.038No 70.20 (3.00) —
Some college educationYes 63.45 (2.01) 0.48No 66.00 (2.60) —
SE: standard error; ECOG: Eastern Cooperative Oncology Group.
Expectations of Benefit From Phase I Trials/Weinfurt et al. 173
erally strong and healthy and likely to benefit fromdifferent treatments. Similar correlations were foundby Cheng et al.2 The self-perception of good health inour study, however, did not correspond to physicalhealth, as evaluated by patients’ physicians; physi-cian-rated ECOG performance status was unrelated topatients’ expectations. ECOG performance status—especially the dichotomized version that we used—may not be as sensitive to differences in health status.Still, if expectations of benefit were associated withactual physical health status, then the expectationwould be to observe more than the 2 percentile dif-ference that we found between active and restrictedECOG status.
The current study had several limitations. First,we assessed a broad array of constructs relevant topatient decision making. In doing so, however, weoften had to use brief, single-item measures. Suchmeasures can be unreliable and, thus, may have lim-ited our ability to find substantial associations be-tween constructs.25 This limitation likely explains therelatively modest correlations observed in our study.Now that some key patient factors have been identi-fied, a more focused data collection effort is needed toassess the constructs with more sensitive measuresthat will improve the ability to find correlations. Sec-ond, we were confined to quantitative measures. Fu-ture qualitative research is needed to understand themeaning of patient expectations to the patients andhow they arrive at the responses they provide in quan-titative studies like these. Despite the broad measure-ment strategy, there remain important aspects of thepatients’ experiences that we did not capture, includ-ing the recent clinical history of the patient (e.g., re-cent increases in symptoms, failure of a standardtreatment regimen, etc.) that may be related to pa-tients’ expectations of benefit. The influence of otherpeople in the patient’s environment, such as the re-cruiting clinical investigator or even the research as-sistant who administered our questionnaire, also mayhave affected patients’ expectations. Although ouremphasis has been on patient characteristics, the im-portance of others’ remarks cannot be underesti-mated. Another limitation is that we queried only be-lief-type expectations and, hence, could not comparethe correlates of belief-type expectations with fre-quency-type expectations.
Finally, because all of the patients studied werefrom large cancer centers located in major cities, it ispossible that our results may have been different ifpatients had been recruited from other geographicregions or from smaller cancer research centers. How-ever, because of the complex and specialized clinical,laboratory, and regulatory aspects of Phase I clinical
investigations, such studies commonly are conductedat cancer research centers of excellence. In this sense,all sites that conduct Phase I trials will share certaincharacteristics in terms of resources, personnel, andmission.
The results reported here have helped to charac-terize patient factors associated with belief-type ex-pectations. To determine when and how patient ex-pectations may be harmful, further studies are neededto understand the psychosocial consequences of hav-ing high expectations. This is difficult to study in pa-tients participating in Phase I trials, because suchpatients, including those in the current study, tend notto live long enough for researchers to obtain adequatefollow-up assessments of mental health. Future re-search also is needed to understand the nature offrequency-type expectations of benefit. Frequency-type expectations, as we have suggested, may be morelikely than belief-type expectations to reflect patients’knowledge in the context of the informed consentprocess. Such information would be critical for evalu-ating the adequacy of informed consent.
REFERENCES1. Beauchamp TL, Childress JF. Principles of biomedical eth-
ics, 5th edition. New York: Oxford University Press, 2001.2. Cheng JD, Hitt J, Koczwara B, et al. Impact of quality of life
on patient expectations regarding Phase I clinical trials.J Clin Oncol. 2000;18:421– 428.
3. Siminoff LA, Fetting JH, Abeloff MD. Doctor-patient com-munication about breast cancer adjuvant therapy. J ClinOncol. 1989;7:1192–1200.
4. Lee SJ, Fairclough D, Antin JH, Weeks JC. Discrepanciesbetween patient and physician estimates for the success ofstem cell transplantation. JAMA. 2001;285:1034 –1038.
5. Daugherty CK. Impact of therapeutic research on informedconsent and the ethics of clinical trials: a medical oncologyperspective. J Clin Oncol. 1999;17:1601–1617.
6. Meropol NJ., Schulman KA, Weinfurt K, et al. Discordantperceptions of patients and their physicians regarding PhaseI trials [abstract]. Proc Am Soc Clin Oncol. 2002;21:245a.
7. Daugherty C, Ratain MJ, Grochowski E, et al. Perceptions ofcancer patients and their physicians involved in Phase Itrials. J Clin Oncol. 1995;13:1062–1072.
8. Kahneman D, Tversky A. Variants of uncertainty. Cognition.1982;11:143–157.
9. Hacking I. The emergence of probability: a philosophicalstudy of early ideas about probability, induction, and statis-tical inference. New York: Cambridge University Press, 1975.
10. Hacking I. An introduction to probability and inductivelogic. Cambridge: Cambridge University Press, 2001.
11. Degner LF, Kristjanson LJ, Bowman D, et al. Informationneeds and decisional preferences in women with breastcancer. JAMA. 1997;277:1485–1492.
12. The EuroQol Group. EuroQol—a new facility for the mea-surement of health-related quality of life. Health Policy.1990;16:199 –208.
13. Ganz PA, Lee JJ, Siau J. Quality of life assessment: an inde-pendent prognostic variable for survival in lung cancer.Cancer. 1991;67:3131–3135.
174 CANCER July 1, 2003 / Volume 98 / Number 1
14. Gaskin DJ, Kong J, Meropol NJ, Yabroff KR, Weaver C, Schul-man KA. Treatment choices by seriously ill patients: theHealth Stock Risk Adjustment model. Med Decis Making.1998;18:84 –94.
15. O’Connor AM. Validation of a decisional conflict scale. MedDecis Making. 1995;15:25–30.
16. Stiggelbout AM, Kiebert GM, Kievit J, Leer JW, Stoter G, deHaes JC. Utility assessment in cancer patients: adjustmentof time tradeoff scores for the utility of life years and com-parison with standard gamble scores. Med Decis Making.1994;14:82–90.
17. Verhoef LC, de Haan AF, van Daal WA. Risk attitude ingambles with years of life: empirical support for prospecttheory. Med Decis Making. 1994;14:194 –200.
18. Von Neuman J, Morgenstern O. Theory of games and eco-nomic behavior, 2nd edition. Princeton: Princeton Univer-sity Press, 1947.
19. Ware J Jr., Kosinski M, Keller SD. SF-12: how to score theSF-12 Physical and Mental Health Summary Scales. Bos-
ton: The Health Institute, New England Medical Center,1995.
20. Ware J Jr., Kosinski M, Keller SD. A 12-item short-form health survey: construction of scales and prelimi-nary tests of reliability and validity. Med Care. 1996;34:220 –233.
21. Ware JE, Snow KK, Kosinski M, Gandek B. SF-36 healthsurvey: manual and interpretation guide. Boston: TheHealth Institute, New England Medical Center, 1993.
22. Grossman M. On the concept of health capital and thedemand for health. J Pol Econ. 1972;80:168 –199.
23. Schafer JL. Analysis of incomplete multivariate data. BocaRaton: Chapman & Hall/CRC, 1997.
24. Savitz DA, Olshan AF. Multiple comparisons and relatedissues in the interpretation of epidemiologic data. Am JEpidemiol. 1995;142:904 –908.
25. Ghiselli EE, Campbell JP, Zedeck S. Measurement theory forthe behavioral sciences. San Francisco: WH Freeman andCompany, 1981.
Expectations of Benefit From Phase I Trials/Weinfurt et al. 175
Copyright © 2022 FDOKUMEN