Isolating the delay component of impulsive choice in adolescent rats
PAPER REF # 8167 Proceedings: Eighth International Space Syntax Symposium Santiago, PUC, 2012
THE CONVERGENCE OF PATTERNS IN THE CITY: (Isolating) the effects of architectural morphology on movement and activity
AUTHOR: Vinicius NETTO Universidade Federal Fluminense (NEPHU‐UFF), Brazil e‐mail: [email protected] Renato SABOYA Universidade Federal de Santa Catarina (UFSC), Brazil e‐mail: [email protected] Julio VARGA S Universidade Federal do Rio Grande do Sul (UFRGS), Brazil Lucas FIGUEIREDO Universidade Federal da Paraíba (UFPB), Brazil e‐mail: [email protected] Cássio FREITAS Escola Nacional de Ciência Estatística (ENCE‐IBGE), Brazil e‐mail: [email protected] Maíra PINHEIRO Universidade Federal Fluminense (NEPHU‐UFF), Brazil e‐mail: [email protected]
KEYWORDS: Pattern Convergence, Dissonance, Street Networks, Architectural Typology, Urban Vitality
THEME: Urban Structure and Spatial Distribution
Abstract
Our paper introduces the theoretical and methodological grounds for a new approach to problems of internal relations between urban patterns in the city creation process. The first problem relates to the conditions of convergence of patterns of accessibility, location, density and pedestrian movement – distinct material processes whose deep mutual implications seem to tie and mix them in the form of the city itself. Approaches to urban morphology and growth as different as space syntax and spatial economics are based on the central proposition that patterns overlap in time, an axiom that allows them to show, for instance, how accessibility affects location or movement. We challenge such teleological perspective, arguing that convergence is likely to always contain dissonance between patterns, deeply entrenched in the collisions of materialities and temporalities of distinct urban processes, among other contingencies. Furthermore, dissonance may help to explain recognizable differences in pattern correlations. We introduce a methodology to assess levels of convergence/dissonance in urban systems in time, or how patterns relate as cities grow and change. The second problem addresses a specific set of pattern relations. States of non‐complete convergence between street networks and movement may reveal potential roles played by other patterns such as architectural morphologies – a central but mostly unexamined question. The paper unfolds a method aimed at identifying the effects of architectural typologies on local socioeconomic processes with potential large‐
Proceedings: Eighth International Space Syntax Symposium Santiago, PUC, 2012
2
scale effects independently from the effects of the street network. We apply the approach in an empirical study in twenty‐four areas in Rio de Janeiro. Such methodology allows to assess more precisely what has been defined, since Jacobs’ seminal work, as “urban vitality”, a set of social and microeconomic qualities in cities – and go back to a question that puzzles the architectural imagination: can buildings affect their urban surroundings? Would distinct architectural morphologies have distinct effects over local socioeconomic processes? Or, does architecture matter to urban vitality?
1 INTRODUCTION
This paper introduces the theoretical and methodological foundations for a new approach to problems of
internal relations of patterns in the city creation process – arguably some of the major problems in urban
studies. The first one refers to the potential convergence between them, a theoretical axiom in approaches
to urban form and growth as different as space syntax and spatial economics: the strong apparent
overlapping of patterns of accessibility, location, density and pedestrian movement (emphasised in space
syntax studies). These differentiated material processes have deep mutual implications that seem to
synthesize them in the form of the city itself, a key theoretical finding that takes the form of a central axiom
in these theories and allow them to explain, for instance, how accessibility patterns overlap with location or
movement patterns. Theoretical definitions point to a strong convergence of distributions of activity
location, architectural densities and accessibility levels in cities (either based on metrical distance, as in
spatial economics, or geometrical properties of urban grids, as in space syntax). In fact, convergence seems
taken to a point where whole dimensions (such as activity location or architectural densities) are seen as
fully dependent on accessibility levels inherent to grid patterns, serving at best as multiplier effects. That is
not necessarily the case. Rapidly growing cities – such as Rio de Janeiro, as we shall see below – may have
fast shifts in their accessibility cores with slower changes in density patterns. Weaker densities in a particular
area with high accessibility may reduce movement levels allowed by the grid; or specific architectural types
could offer poor support for retail activities potentially demanded by pedestrians. In these scenarios,
movement patterns may be biased by architectural morphology and activity location; accessibility levels may
not correspond with agglomeration. Nevertheless, spatial economics shows us that economic activities are
geared to agglomeration in the form of cities as a way to overcome distance. Space syntax works
consistently pointed out that accessibility patterns overlap substantially with pedestrian movement
patterns. But they seem to do so rendering the tensions between patterns unproblematic. We would like to
challenge these theoretical positions arguing that a strong overlapping of urban patterns could only be the
case in cities whose growth and dynamics already reached the point of full‐fledged convergence – and
proposing a closer examination of how these materially distinct patterns interrelate. We devise here
foundations for an approach to the convergence/dissonance of patterns of different materialities, and a
method to investigate its level, recognizing that changes operate in different urban dimensions. These
dimensions are all related in how we appropriate and produce cities and how they change, but not
immediately so: they are mediated by human practice and distinct materialities at play. We hope to show
that, despite a potential trend to alignment in such dimensions, taking the form of actual structures,
dissonance – in different levels at different times – is always already at work, preventing full convergence
and thereby rendering (assumptions of) a teleological, natural alignment problematic.
However, such an idea poses further questions like, is that point reachable? If cities are always changing – as
new activities are created and location patterns changed, densities transformed through new built forms –
Proceedings: Eighth International Space Syntax Symposium Santiago, PUC, 2012
3
how could it be reached? How would such city look like? Would older cities find stronger internal
convergence? We introduce below a methodology to address this problem, and assess levels of
convergence/dissonance in urban systems and its behaviour (rather than progression) in time.
This first set of hypotheses is a condition for a second problem – a relation of specific patterns still poorly
explored in theory and largely unconscious in practice: the possibility of identifiable effects of distinct
architectural morphologies over local social processes, with potential large‐scale outputs. In fact, this
problem is implied in the convergence of patterns at the heart of what Hillier (2001) calls “the city‐creation
process”: how does architectural morphology relate to the vitality of public life in streets and the activities
they support? Could it have effects over the appropriation of space – co‐presence, movement, social
interaction and microeconomic exchange? These are not trivial questions: as we shall see below, relations
between such phenomena – and the patterns emerging from their interaction – involve entirely different
materialities. They also involve different temporalities: street networks take decades or centuries to reach
stability, whereas movement patterns may take minutes to emerge. In other words, the hypothesis of
convergence of patterns – the city as a system of systems of different materialities, a pattern emerging from
the relation of emerging patterns – implies a relation of architectural form to patterns of use of space.
Notwithstanding, this research is an attempt to respond to a timely problem in cities in the developing
world, but also elsewhere: the progressive dissolution of parts of the urban fabric through the growing
production of buildings more and more inward‐oriented – i.e. detached from the street, surrounded by
fences and walls, impervious to public activities such as retail. Non‐systematic observations have led
architects and planners to fear that dissolution of certain built form patterns would lead to a similar
dissolution in the social use of streets (e.g. reasons for pedestrians to walk their neighbourhoods, or for
microeconomic exchanges to come into being in different areas). It seems to be happening at an alarming
pace, with potentially disastrous consequences to cities in general, and to the performance of morphology
as a support for localized social action in particular. We present here the unfolding of a second methodology
– this turn, developed to isolate the effects of distinct architectural typologies from the effects of other
urban patterns, i.e. in a way to render the relations between spatial and social variables more fully
identifiable. The paper brings initial results from an on‐going empirical study in twenty‐four areas in Rio de
Janeiro. Such an approach is designed to address a classic question – perhaps one that has puzzled the
architectural imagination more than any: can buildings affect what happens around them? Would distinct
architectural morphologies have distinct effects over local social and economic processes? Or more broadly:
does architecture matter to the vitality of streets and public life in the city?
2 THE CONVERGENCE AND DISSONANCE OF PATTERNS IN THE FORM OF CITIES
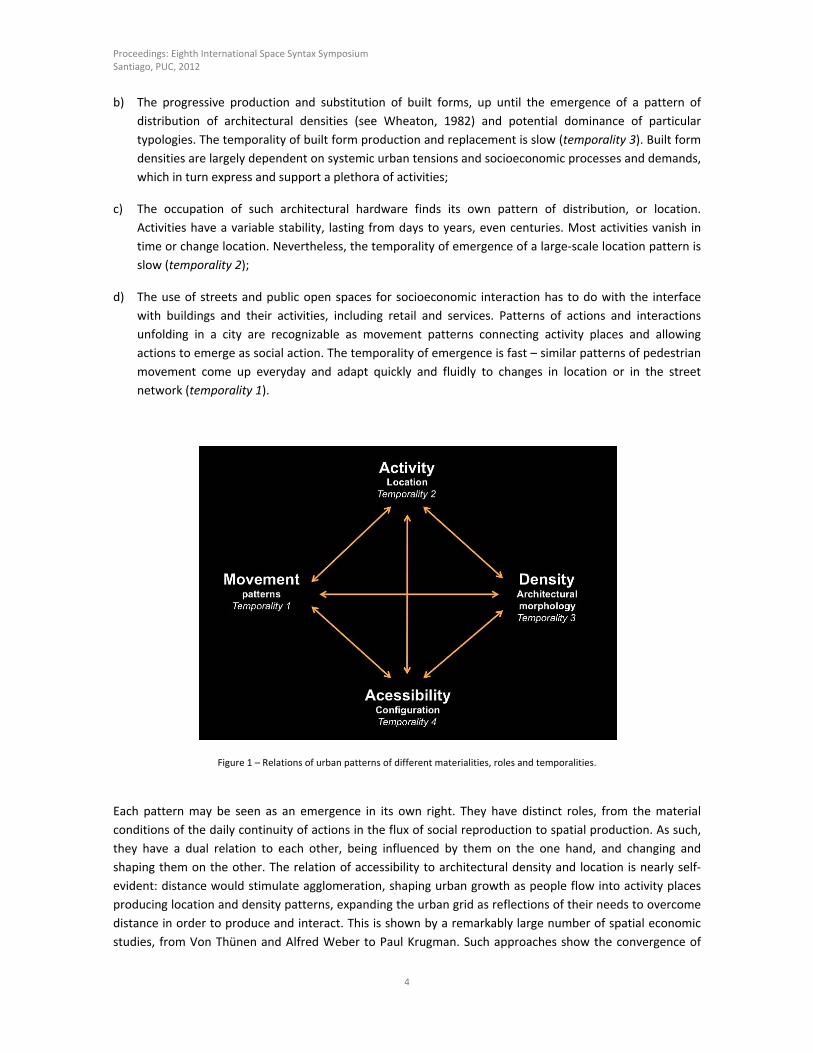
We point out four patterns as simultaneous processes with different time frames – always in progress,
consolidation and change in the history of a city (figure 1).
a) The production, growth and structuration of street networks internally differentiated into hierarchies
articulating blocks and buildings and the network of interaction among the activities they support in
time – a highly durable and stable structure (temporality 4); 1
1 See the case of the City of London in the appendix to Hillier and Netto (2002).
Proceedings: Eighth International Space Syntax Symposium Santiago, PUC, 2012
4
b) The progressive production and substitution of built forms, up until the emergence of a pattern of
distribution of architectural densities (see Wheaton, 1982) and potential dominance of particular
typologies. The temporality of built form production and replacement is slow (temporality 3). Built form
densities are largely dependent on systemic urban tensions and socioeconomic processes and demands,
which in turn express and support a plethora of activities;
c) The occupation of such architectural hardware finds its own pattern of distribution, or location.
Activities have a variable stability, lasting from days to years, even centuries. Most activities vanish in
time or change location. Nevertheless, the temporality of emergence of a large‐scale location pattern is
slow (temporality 2);
d) The use of streets and public open spaces for socioeconomic interaction has to do with the interface
with buildings and their activities, including retail and services. Patterns of actions and interactions
unfolding in a city are recognizable as movement patterns connecting activity places and allowing
actions to emerge as social action. The temporality of emergence is fast – similar patterns of pedestrian
movement come up everyday and adapt quickly and fluidly to changes in location or in the street
network (temporality 1).
Figure 1 – Relations of urban patterns of different materialities, roles and temporalities.
Each pattern may be seen as an emergence in its own right. They have distinct roles, from the material
conditions of the daily continuity of actions in the flux of social reproduction to spatial production. As such,
they have a dual relation to each other, being influenced by them on the one hand, and changing and
shaping them on the other. The relation of accessibility to architectural density and location is nearly self‐
evident: distance would stimulate agglomeration, shaping urban growth as people flow into activity places
producing location and density patterns, expanding the urban grid as reflections of their needs to overcome
distance in order to produce and interact. This is shown by a remarkably large number of spatial economic
studies, from Von Thünen and Alfred Weber to Paul Krugman. Such approaches show the convergence of
Proceedings: Eighth International Space Syntax Symposium Santiago, PUC, 2012
5
accessibility patterns assessed through metric distances with location and spatial concentration. Of course
the influence of spatial structure on accessibility and movement was further clarified by space syntax
studies. Works in this field show the convergence of accessibility and movement patterns assessed through
graph‐based topological and geometric measures (with correlations around 0.6 – see Hillier et al, 1993;
Hillier and Iida, 2005). Some works pointed out the influence of the grid on activity location (Hillier et al,
1993; Hillier, 2001). A few works in configurational studies reinforce the complex convergence of centrality
and land value with impressive results (correlations up to 0.9 – see Krafta, 1994; Spinelli and Krafta, 1998).
The mutual influence between patterns would be already active in urban peripheral growth, as they seem to
shape each other into recognizable urban structures.
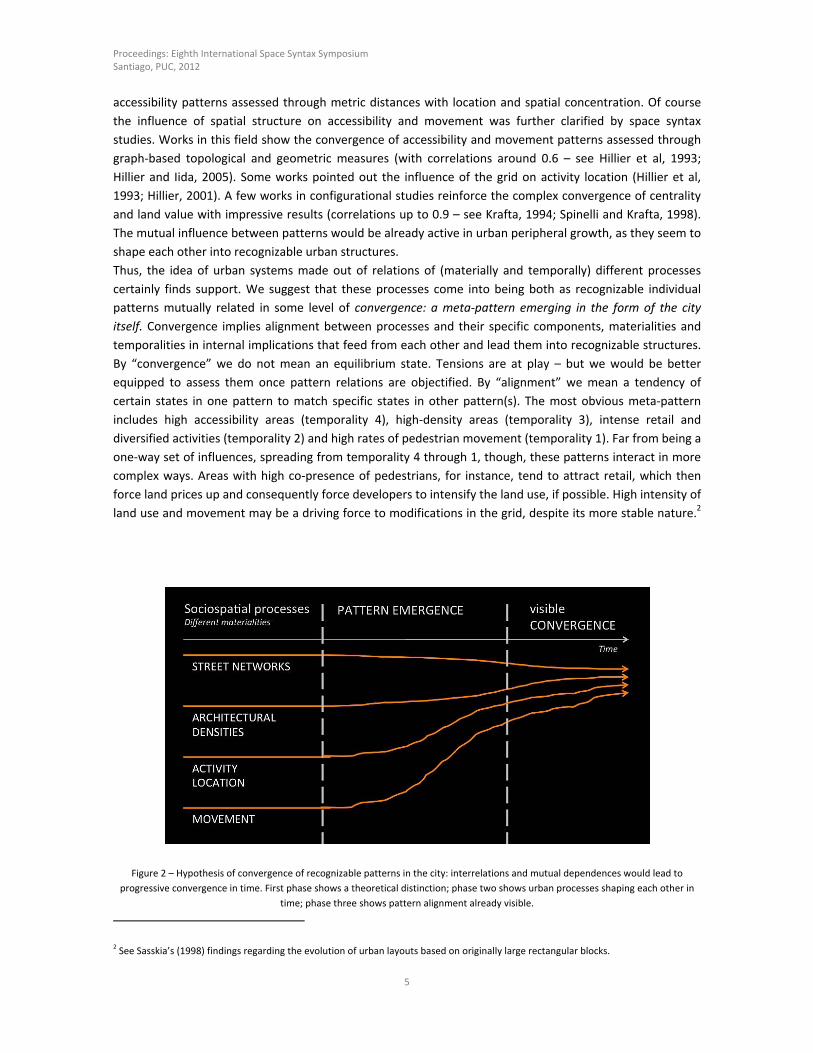
Thus, the idea of urban systems made out of relations of (materially and temporally) different processes
certainly finds support. We suggest that these processes come into being both as recognizable individual
patterns mutually related in some level of convergence: a meta‐pattern emerging in the form of the city
itself. Convergence implies alignment between processes and their specific components, materialities and
temporalities in internal implications that feed from each other and lead them into recognizable structures.
By “convergence” we do not mean an equilibrium state. Tensions are at play – but we would be better
equipped to assess them once pattern relations are objectified. By “alignment” we mean a tendency of
certain states in one pattern to match specific states in other pattern(s). The most obvious meta‐pattern
includes high accessibility areas (temporality 4), high‐density areas (temporality 3), intense retail and
diversified activities (temporality 2) and high rates of pedestrian movement (temporality 1). Far from being a
one‐way set of influences, spreading from temporality 4 through 1, though, these patterns interact in more
complex ways. Areas with high co‐presence of pedestrians, for instance, tend to attract retail, which then
force land prices up and consequently force developers to intensify the land use, if possible. High intensity of
land use and movement may be a driving force to modifications in the grid, despite its more stable nature.2
Figure 2 – Hypothesis of convergence of recognizable patterns in the city: interrelations and mutual dependences would lead to
progressive convergence in time. First phase shows a theoretical distinction; phase two shows urban processes shaping each other in
time; phase three shows pattern alignment already visible.
2 See Sasskia’s (1998) findings regarding the evolution of urban layouts based on originally large rectangular blocks.
Proceedings: Eighth International Space Syntax Symposium Santiago, PUC, 2012
6
Let us have a critical look at how these relations have been portrayed in theory – more specifically in space
syntax. The idea that the morphology of street networks would have effects on movement patterns is a
central proposition. The grid is seen as the “strong force” in generating and shaping movement patterns in
the city (Hillier et al, 1993). Such relationship is extended to a point where an assumption arises and takes
the form of a theoretical axiom. According to the theory, location and growth would be driven by the
extension of the grid and not by the location of new activities. However, growth and location are deeply
relational processes potentially active in shaping the extension of streets themselves. A step further, the
idea of the grid as the original force shaping urban dynamics also assumes that distinct patterns such as the
distribution of built form and location converge almost in an unproblematic alignment with that of the grid,
their effects reduced to multiplier effects of the latter. Behind this assumption lie risks of a non‐dynamic
understanding of the different materialities and processes at play in the city creation process. Assuming that
the effects of convergence belong to a particular material realm or process renders the role of other realms
or processes invisible, and reduces the complexity of urban dynamics. The complex tension of mutual
dependence and conflict between patterns with different materialities is downplayed. Furthermore,
contingency is not addressed as a key substantive issue, as the emphasis on the grid assumes that urban
patterns relate unproblematically to one another. Of course similar critical observations may be drawn to
works in spatial economics.
An active relation described in these terms looks indeed like a teleological process: cities seem geared to
pattern. In this sense, we certainly acknowledge that urban processes are deeply intertwined, and thereby
should shape each other to a considerable extent. If they emerge as related processes produced by actions
materially accumulated, the idea of cities geared to a certain level of visible convergence of patterns does
make sense. Changes in one pattern may indeed lead to changes in others. As we have seen, that is both a
general finding and an underlying axiom in configurational studies and spatial economics alike, and the basis
for any hypothesis of effects of urban form on social processes. If that is the case, we would like to further
explore here the complexities involved in the emergence of a generalized pattern – the city – made of
materially and temporally distinct patterns, and the conditions of any alignment. Cities as material processes
are results of convergence – at least partially, as they imply one another – but to which extent?
Convergence, if it were to happen, is a process that takes a long time to become recognizable – decades of
production of a spatial hardware aligned with a social software of activities and actions and use of built
forms and public spaces. But what would count as forces of convergence and dissonance? What are the
contingencies at play?
A specific urban process cannot fully project itself into others, however intrinsically related in urbanization
and, more broadly, in social reproduction. The passage from action and movement to change in location and
built form patterns is mediated by difficulties in social organization (the emergence from individual actions
to arrangements or sets of institutionalized activities) and material production (from new activities to new
built forms). The passage from the social software of organized action and activity to the hardware of built
forms means not only economic effort, but the production of rigid, durable structures which take long time
to take part in the urban system and, once there, are likely to remain. Furthermore, materially distinct
processes are also independent: actions change constantly, and spatial decisions in daily life such as places
to go and how to get there change with them. Access to spatial information is partial and depends on actors’
socially differentiated capabilities. Spatial production is also subject to similar issues: individual decisions like
finding the most interesting locations to produce new buildings based on partial information and
misinterpretation of potentials of location in terms of density and architectural choices (say, either
benefiting poorly from location or overestimating it) shape urbanization. Urban processes get apart all the
time in dissonance and tension only to tie over and over again by the socioeconomic and material
Proceedings: Eighth International Space Syntax Symposium Santiago, PUC, 2012
7
requirements of convergence. There is noise in every step. Urban dynamics are full of contingencies
embedded in how social systems relate to spatialities: oligopolistic decisions over new areas for urban
expansion; the stability of materialities of street networks and built forms in time followed by criticality and
phase transitions (Krafta, Netto and Lima, 2011); top‐down decisions in planning adding new transportation
systems or containing trends in land use, fixing built forms or misunderstanding potentials in their relation
with other urban processes; and so on. A key issue here is how to assess contingency and mutual influence
or causality in the convergence/divergence of urban patterns synthesized in the city itself. Thus, full
convergence could be never completely achievable: complex interactions and different materialities and
their distinct levels of stability will both entail convergence and prevent full convergence. One of the key
tasks at hand here is how to assess what is there in between patterns, preventing full convergence, a major
issue right at the heart of urbanization – one based on very essential material conditions for societies to
emerge through joint action in spite of dissonance forces. Time is clearly an issue: cities, as autopoietic
systems, seem to take a rather long time to emerge and reach minimal levels of internal structuration able
to cope with relations both in location and collective action. A proper investigation of this problem,
however, requires spatial and historical analysis of a large number of urban areas and cities.
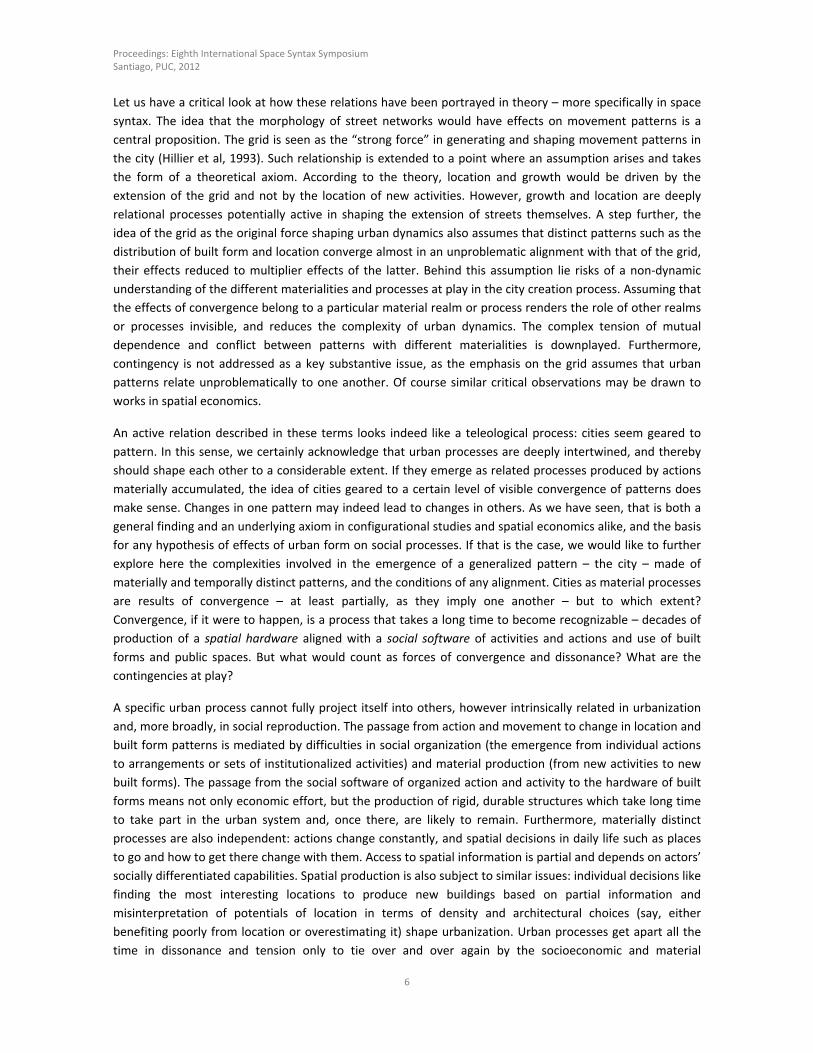
Figure 3 – Rio de Janeiro: residential densities and accessibility (integration RR).
Convergence is likely to always contain dissonance between patterns, deeply entrenched in the collisions of
materialities and temporalities of distinct urban processes and the plurality of decisions and tensions
between actors appropriating spaces that mediate them. Complete convergence would only be possible in
an open horizon of time or in an ideal world. If such hypothesis makes sense, this conceptual framework
suggests possibilities for a methodology able to indicate the stage of convergence of patterns in different
areas or cities and allow the analysis of their behaviour in time. Convergence would generally imply a
progressive alignment observable in different stages in different urban areas or cities. In other words, areas
or cities with different times of urbanization may be in different stages along the path of convergence
between those four urban processes. For example, a two hundred years neighbourhood may have its
density distribution aligned with the accessibility hierarchy across the area, whereas a much more recent
area with similar accessibility levels may have dissonance in such relation. If that would be the case,
dissonances in pattern relations could be explained historically – at least in part. Also, fast changes in one
particular pattern (like accessibility) may reverberate throughout the urban system in cycles of dissonance.
Proceedings: Eighth International Space Syntax Symposium Santiago, PUC, 2012
8
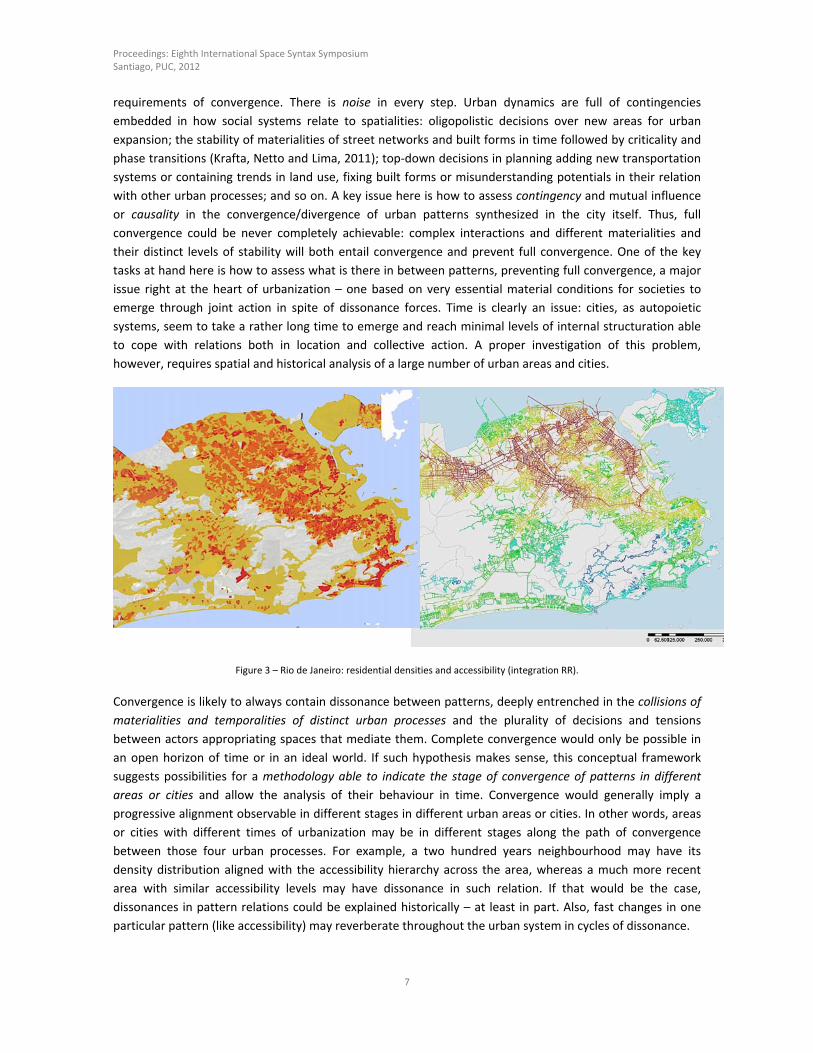
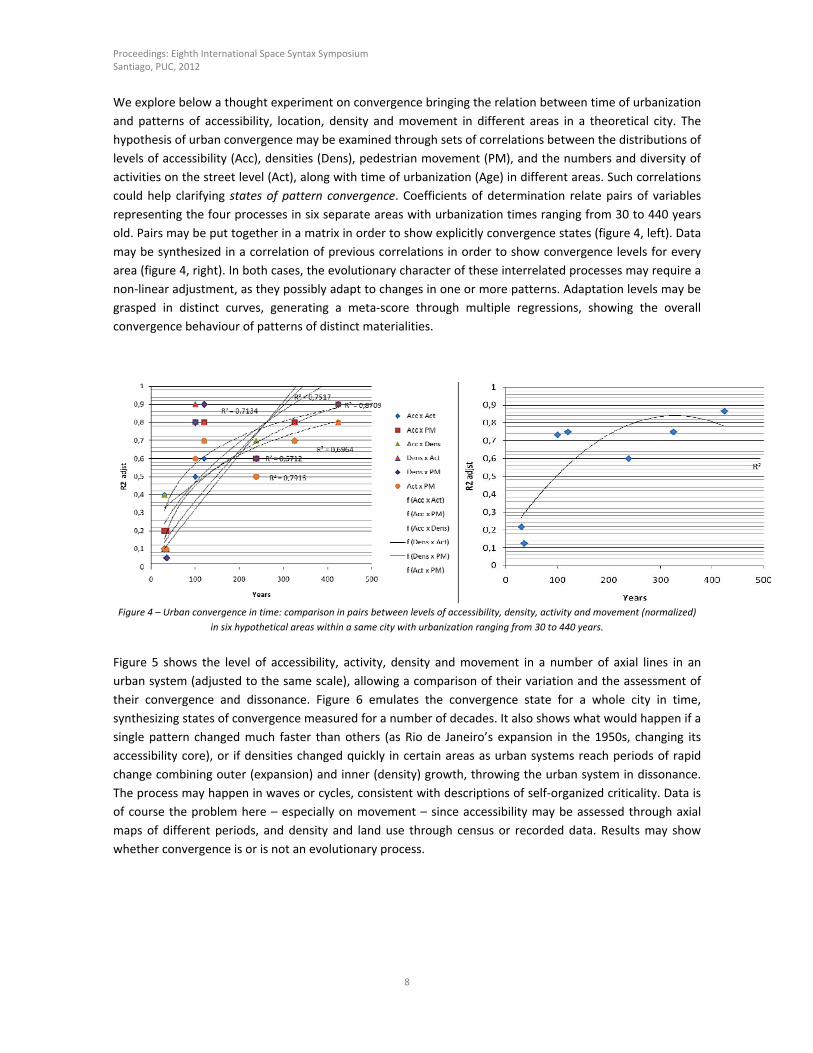
We explore below a thought experiment on convergence bringing the relation between time of urbanization
and patterns of accessibility, location, density and movement in different areas in a theoretical city. The
hypothesis of urban convergence may be examined through sets of correlations between the distributions of
levels of accessibility (Acc), densities (Dens), pedestrian movement (PM), and the numbers and diversity of
activities on the street level (Act), along with time of urbanization (Age) in different areas. Such correlations
could help clarifying states of pattern convergence. Coefficients of determination relate pairs of variables
representing the four processes in six separate areas with urbanization times ranging from 30 to 440 years
old. Pairs may be put together in a matrix in order to show explicitly convergence states (figure 4, left). Data
may be synthesized in a correlation of previous correlations in order to show convergence levels for every
area (figure 4, right). In both cases, the evolutionary character of these interrelated processes may require a
non‐linear adjustment, as they possibly adapt to changes in one or more patterns. Adaptation levels may be
grasped in distinct curves, generating a meta‐score through multiple regressions, showing the overall
convergence behaviour of patterns of distinct materialities.
Figure 4 – Urban convergence in time: comparison in pairs between levels of accessibility, density, activity and movement (normalized)
in six hypothetical areas within a same city with urbanization ranging from 30 to 440 years.
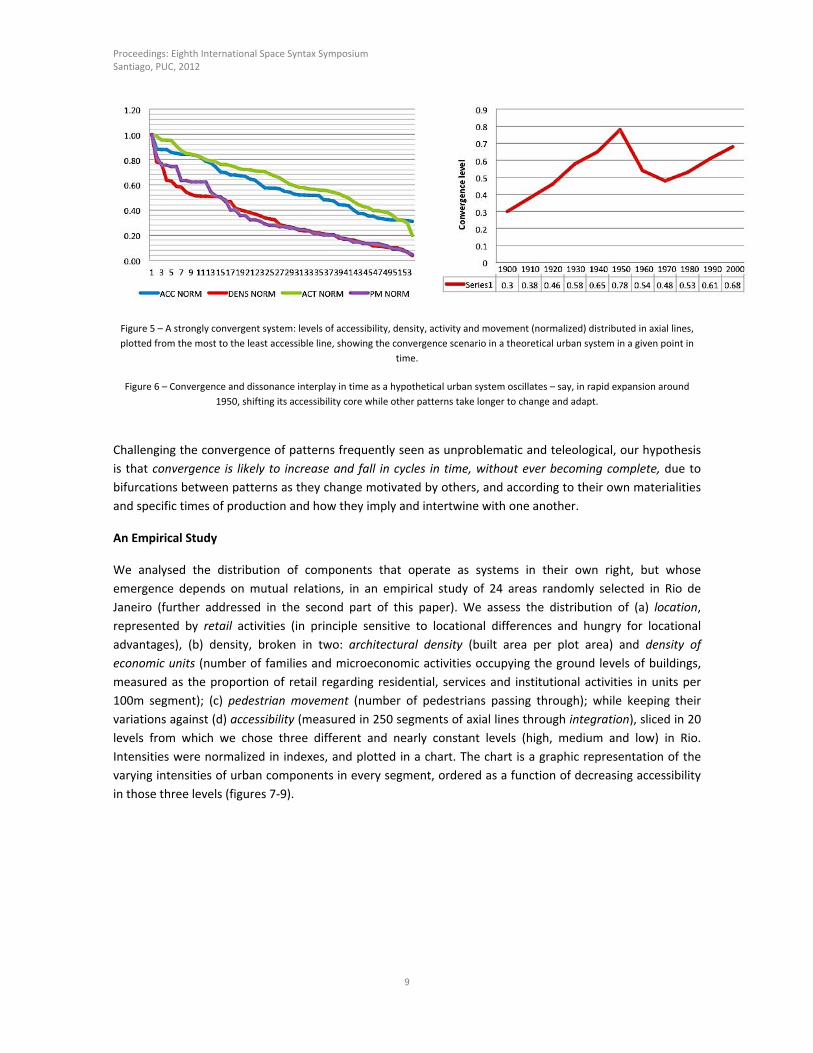
Figure 5 shows the level of accessibility, activity, density and movement in a number of axial lines in an
urban system (adjusted to the same scale), allowing a comparison of their variation and the assessment of
their convergence and dissonance. Figure 6 emulates the convergence state for a whole city in time,
synthesizing states of convergence measured for a number of decades. It also shows what would happen if a
single pattern changed much faster than others (as Rio de Janeiro’s expansion in the 1950s, changing its
accessibility core), or if densities changed quickly in certain areas as urban systems reach periods of rapid
change combining outer (expansion) and inner (density) growth, throwing the urban system in dissonance.
The process may happen in waves or cycles, consistent with descriptions of self‐organized criticality. Data is
of course the problem here – especially on movement – since accessibility may be assessed through axial
maps of different periods, and density and land use through census or recorded data. Results may show
whether convergence is or is not an evolutionary process.
Proceedings: Eighth International Space Syntax Symposium Santiago, PUC, 2012
9
Figure 5 – A strongly convergent system: levels of accessibility, density, activity and movement (normalized) distributed in axial lines,
plotted from the most to the least accessible line, showing the convergence scenario in a theoretical urban system in a given point in
time.
Figure 6 – Convergence and dissonance interplay in time as a hypothetical urban system oscillates – say, in rapid expansion around
1950, shifting its accessibility core while other patterns take longer to change and adapt.
Challenging the convergence of patterns frequently seen as unproblematic and teleological, our hypothesis
is that convergence is likely to increase and fall in cycles in time, without ever becoming complete, due to
bifurcations between patterns as they change motivated by others, and according to their own materialities
and specific times of production and how they imply and intertwine with one another.
An Empirical Study
We analysed the distribution of components that operate as systems in their own right, but whose
emergence depends on mutual relations, in an empirical study of 24 areas randomly selected in Rio de
Janeiro (further addressed in the second part of this paper). We assess the distribution of (a) location,
represented by retail activities (in principle sensitive to locational differences and hungry for locational
advantages), (b) density, broken in two: architectural density (built area per plot area) and density of
economic units (number of families and microeconomic activities occupying the ground levels of buildings,
measured as the proportion of retail regarding residential, services and institutional activities in units per
100m segment); (c) pedestrian movement (number of pedestrians passing through); while keeping their
variations against (d) accessibility (measured in 250 segments of axial lines through integration), sliced in 20
levels from which we chose three different and nearly constant levels (high, medium and low) in Rio.
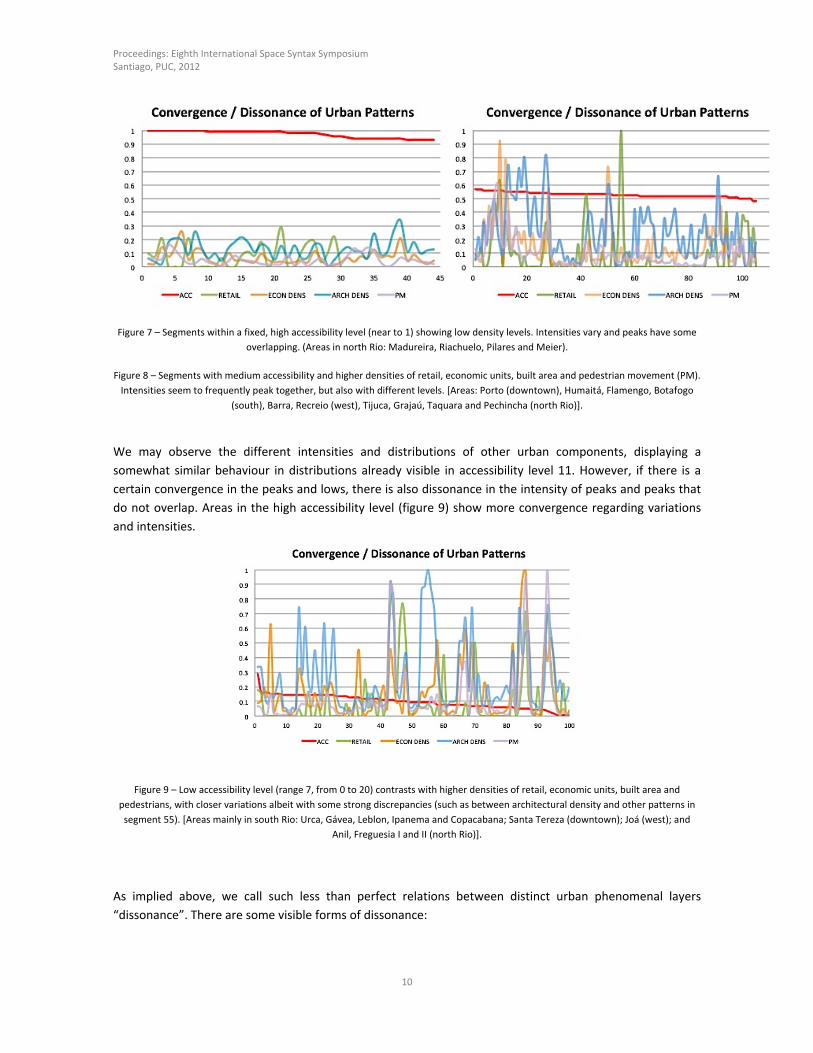
Intensities were normalized in indexes, and plotted in a chart. The chart is a graphic representation of the
varying intensities of urban components in every segment, ordered as a function of decreasing accessibility
in those three levels (figures 7‐9).
Proceedings: Eighth International Space Syntax Symposium Santiago, PUC, 2012
10
Figure 7 – Segments within a fixed, high accessibility level (near to 1) showing low density levels. Intensities vary and peaks have some
overlapping. (Areas in north Rio: Madureira, Riachuelo, Pilares and Meier).
Figure 8 – Segments with medium accessibility and higher densities of retail, economic units, built area and pedestrian movement (PM).
Intensities seem to frequently peak together, but also with different levels. [Areas: Porto (downtown), Humaitá, Flamengo, Botafogo
(south), Barra, Recreio (west), Tijuca, Grajaú, Taquara and Pechincha (north Rio)].
We may observe the different intensities and distributions of other urban components, displaying a
somewhat similar behaviour in distributions already visible in accessibility level 11. However, if there is a
certain convergence in the peaks and lows, there is also dissonance in the intensity of peaks and peaks that
do not overlap. Areas in the high accessibility level (figure 9) show more convergence regarding variations
and intensities.
Figure 9 – Low accessibility level (range 7, from 0 to 20) contrasts with higher densities of retail, economic units, built area and
pedestrians, with closer variations albeit with some strong discrepancies (such as between architectural density and other patterns in
segment 55). [Areas mainly in south Rio: Urca, Gávea, Leblon, Ipanema and Copacabana; Santa Tereza (downtown); Joá (west); and
Anil, Freguesia I and II (north Rio)].
As implied above, we call such less than perfect relations between distinct urban phenomenal layers
“dissonance”. There are some visible forms of dissonance:
Proceedings: Eighth International Space Syntax Symposium Santiago, PUC, 2012
11
Variations in intensities do not follow each, with distinct directions in their curves of distribution, amounting
into visibly different patterns and indicating that the intensities of distinct components do not reflect each
other.
Differences of intensities, when layers or patterns have similar variations in their curve of distribution, but
differences in how high are their peaks.
Qualitative differences that bring distortion to their relation to other patterns – say, non‐reflected
proportions between residential and retail densities.
The association of certain components may also bring effects over patterns, implying “more than
proportional differences” between patterns – say, why pedestrian movement would vary with higher or
lower levels than expected.
The extension of dissonance: how many patterns show evident differences in distribution.
Ruptures in the relation of patterns – say, as residential densities that should be reflected in the
intensification of retail, but find other forces getting in the way, like tendencies to residential segregation
apparent in walled façades and controlled access to ground levels in buildings.
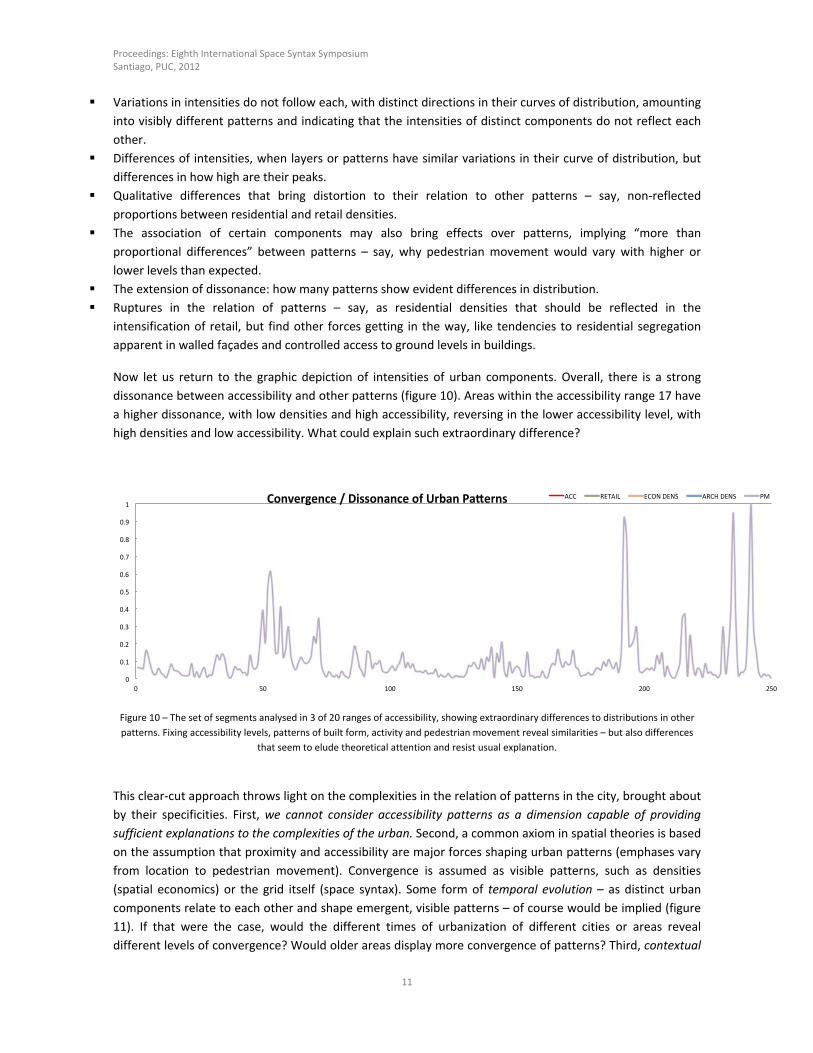
Now let us return to the graphic depiction of intensities of urban components. Overall, there is a strong
dissonance between accessibility and other patterns (figure 10). Areas within the accessibility range 17 have
a higher dissonance, with low densities and high accessibility, reversing in the lower accessibility level, with
high densities and low accessibility. What could explain such extraordinary difference?
Figure 10 – The set of segments analysed in 3 of 20 ranges of accessibility, showing extraordinary differences to distributions in other
patterns. Fixing accessibility levels, patterns of built form, activity and pedestrian movement reveal similarities – but also differences
that seem to elude theoretical attention and resist usual explanation.
This clear‐cut approach throws light on the complexities in the relation of patterns in the city, brought about
by their specificities. First, we cannot consider accessibility patterns as a dimension capable of providing
sufficient explanations to the complexities of the urban. Second, a common axiom in spatial theories is based
on the assumption that proximity and accessibility are major forces shaping urban patterns (emphases vary
from location to pedestrian movement). Convergence is assumed as visible patterns, such as densities
(spatial economics) or the grid itself (space syntax). Some form of temporal evolution – as distinct urban
components relate to each other and shape emergent, visible patterns – of course would be implied (figure
11). If that were the case, would the different times of urbanization of different cities or areas reveal
different levels of convergence? Would older areas display more convergence of patterns? Third, contextual
0
0.1
0.2
0.3
0.4
0.5
0.6
0.7
0.8
0.9
1
0 50 100 150 200 250
Convergence / Dissonance of Urban Pa erns ACC RETAIL ECON DENS ARCH DENS PM
Proceedings: Eighth International Space Syntax Symposium Santiago, PUC, 2012
12
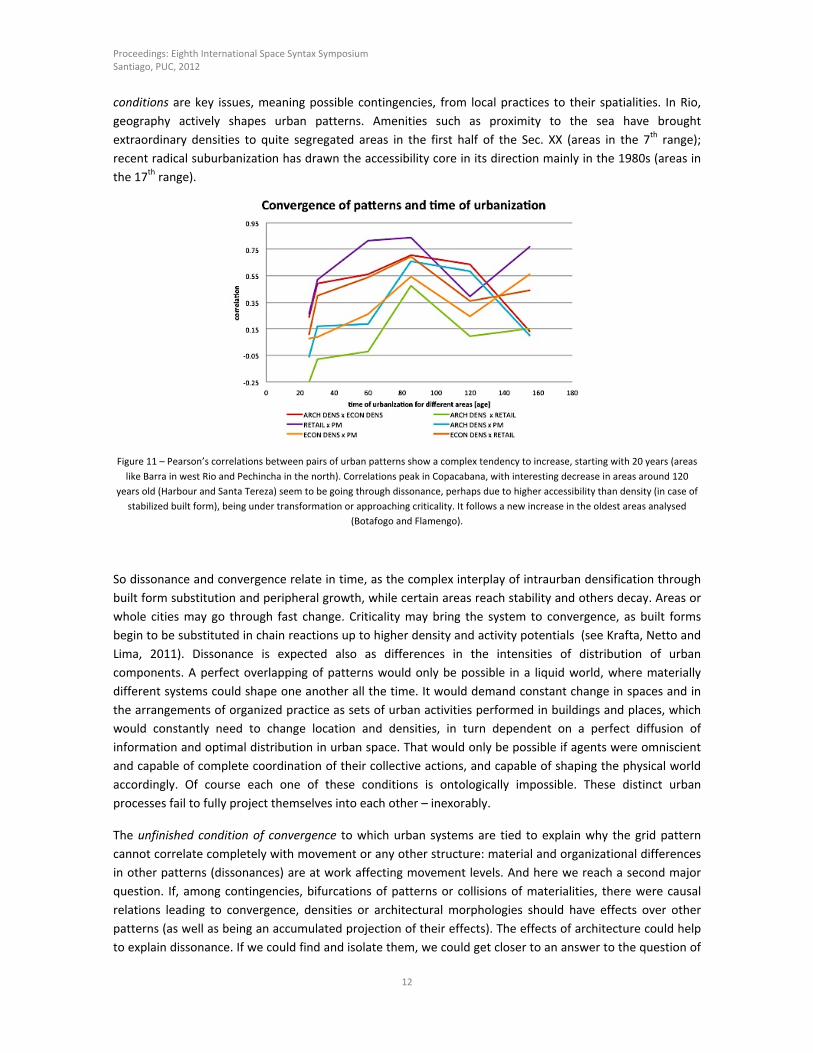
conditions are key issues, meaning possible contingencies, from local practices to their spatialities. In Rio,
geography actively shapes urban patterns. Amenities such as proximity to the sea have brought
extraordinary densities to quite segregated areas in the first half of the Sec. XX (areas in the 7th range);
recent radical suburbanization has drawn the accessibility core in its direction mainly in the 1980s (areas in
the 17th range).
Figure 11 – Pearson’s correlations between pairs of urban patterns show a complex tendency to increase, starting with 20 years (areas
like Barra in west Rio and Pechincha in the north). Correlations peak in Copacabana, with interesting decrease in areas around 120
years old (Harbour and Santa Tereza) seem to be going through dissonance, perhaps due to higher accessibility than density (in case of
stabilized built form), being under transformation or approaching criticality. It follows a new increase in the oldest areas analysed
(Botafogo and Flamengo).
So dissonance and convergence relate in time, as the complex interplay of intraurban densification through
built form substitution and peripheral growth, while certain areas reach stability and others decay. Areas or
whole cities may go through fast change. Criticality may bring the system to convergence, as built forms
begin to be substituted in chain reactions up to higher density and activity potentials (see Krafta, Netto and
Lima, 2011). Dissonance is expected also as differences in the intensities of distribution of urban
components. A perfect overlapping of patterns would only be possible in a liquid world, where materially
different systems could shape one another all the time. It would demand constant change in spaces and in
the arrangements of organized practice as sets of urban activities performed in buildings and places, which
would constantly need to change location and densities, in turn dependent on a perfect diffusion of
information and optimal distribution in urban space. That would only be possible if agents were omniscient
and capable of complete coordination of their collective actions, and capable of shaping the physical world
accordingly. Of course each one of these conditions is ontologically impossible. These distinct urban
processes fail to fully project themselves into each other – inexorably.
The unfinished condition of convergence to which urban systems are tied to explain why the grid pattern
cannot correlate completely with movement or any other structure: material and organizational differences
in other patterns (dissonances) are at work affecting movement levels. And here we reach a second major
question. If, among contingencies, bifurcations of patterns or collisions of materialities, there were causal
relations leading to convergence, densities or architectural morphologies should have effects over other
patterns (as well as being an accumulated projection of their effects). The effects of architecture could help
to explain dissonance. If we could find and isolate them, we could get closer to an answer to the question of
Proceedings: Eighth International Space Syntax Symposium Santiago, PUC, 2012
13
what is the role of architecture in urban processes in general, and in materially fragile patterns of the social
software in particular. We suggest that, rather than seen unproblematically, the relationship between
patterns in the city creating process should be held as a key theoretical problem. This section offered the
grounds of a theory of such relationship. We have argued that the possibility of a strong relation between
configuration and socioeconomic processes depends on the level of convergence/ dissonance of a number of
different urban patterns in time. The hypothesis of convergence of patterns in the form of the city allows an
investigation into the effects and role played by architecture in local socioeconomic processes – another key
question in the study of society‐space relations. But only if we were able to distinguish them from the actual
effects of the grid.
3. BEYOND STREET NETWORKS: THE EFFECTS OF ARCHITECTURAL MORPHOLOGY
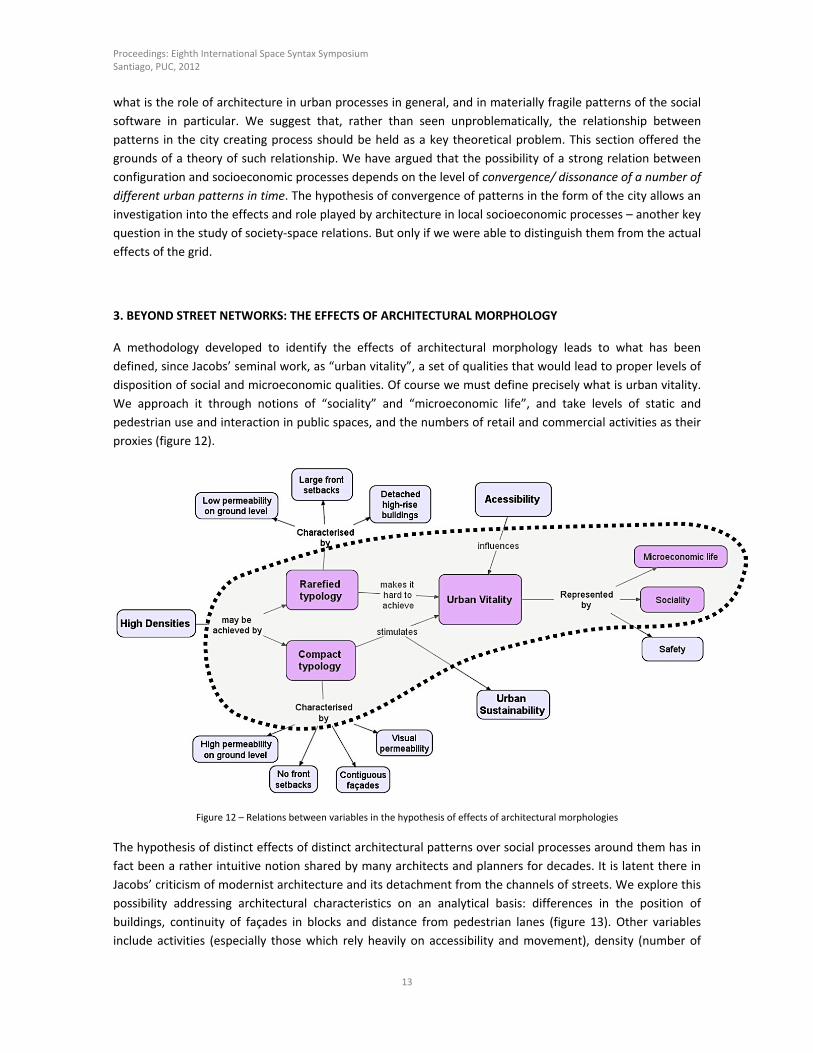
A methodology developed to identify the effects of architectural morphology leads to what has been
defined, since Jacobs’ seminal work, as “urban vitality”, a set of qualities that would lead to proper levels of
disposition of social and microeconomic qualities. Of course we must define precisely what is urban vitality.
We approach it through notions of “sociality” and “microeconomic life”, and take levels of static and
pedestrian use and interaction in public spaces, and the numbers of retail and commercial activities as their
proxies (figure 12).
Figure 12 – Relations between variables in the hypothesis of effects of architectural morphologies
The hypothesis of distinct effects of distinct architectural patterns over social processes around them has in
fact been a rather intuitive notion shared by many architects and planners for decades. It is latent there in
Jacobs’ criticism of modernist architecture and its detachment from the channels of streets. We explore this
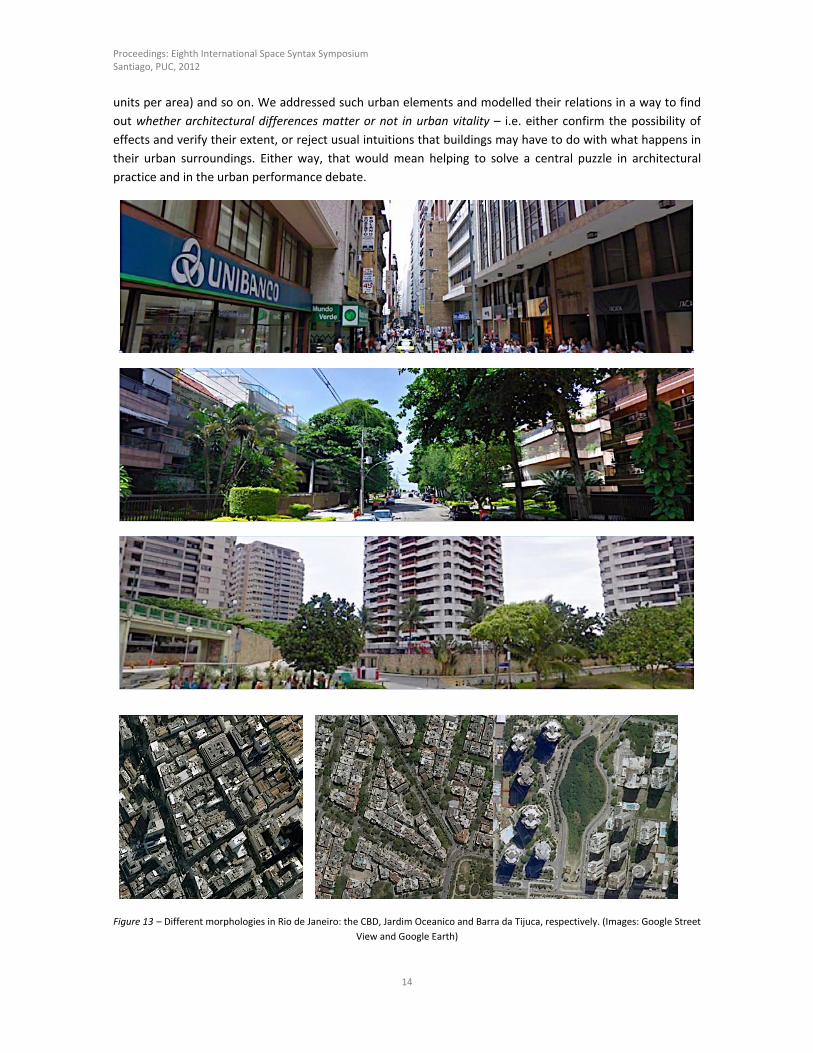
possibility addressing architectural characteristics on an analytical basis: differences in the position of
buildings, continuity of façades in blocks and distance from pedestrian lanes (figure 13). Other variables
include activities (especially those which rely heavily on accessibility and movement), density (number of
Proceedings: Eighth International Space Syntax Symposium Santiago, PUC, 2012
14
units per area) and so on. We addressed such urban elements and modelled their relations in a way to find
out whether architectural differences matter or not in urban vitality – i.e. either confirm the possibility of
effects and verify their extent, or reject usual intuitions that buildings may have to do with what happens in
their urban surroundings. Either way, that would mean helping to solve a central puzzle in architectural
practice and in the urban performance debate.
Figure 13 – Different morphologies in Rio de Janeiro: the CBD, Jardim Oceanico and Barra da Tijuca, respectively. (Images: Google Street
View and Google Earth)
Proceedings: Eighth International Space Syntax Symposium Santiago, PUC, 2012
15
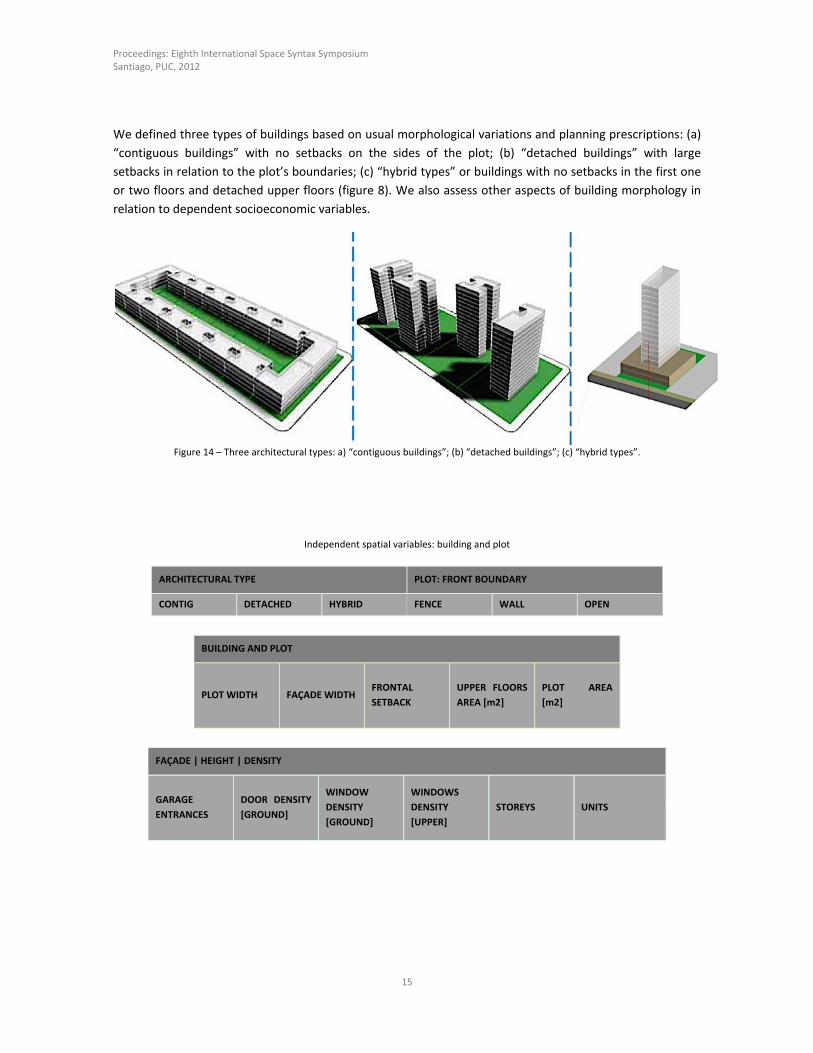
We defined three types of buildings based on usual morphological variations and planning prescriptions: (a)
“contiguous buildings” with no setbacks on the sides of the plot; (b) “detached buildings” with large
setbacks in relation to the plot’s boundaries; (c) “hybrid types” or buildings with no setbacks in the first one
or two floors and detached upper floors (figure 8). We also assess other aspects of building morphology in
relation to dependent socioeconomic variables.
Figure 14 – Three architectural types: a) “contiguous buildings”; (b) “detached buildings”; (c) “hybrid types”.
Independent spatial variables: building and plot
ARCHITECTURAL TYPE PLOT: FRONT BOUNDARY
CONTIG DETACHED HYBRID FENCE WALL OPEN
BUILDING AND PLOT
PLOT WIDTH FAÇADE WIDTH FRONTAL
SETBACK
UPPER FLOORS
AREA [m2]
PLOT AREA
[m2]
FAÇADE | HEIGHT | DENSITY
GARAGE
ENTRANCES
DOOR DENSITY
[GROUND]
WINDOW
DENSITY
[GROUND]
WINDOWS
DENSITY
[UPPER]
STOREYS UNITS
Proceedings: Eighth International Space Syntax Symposium Santiago, PUC, 2012
16
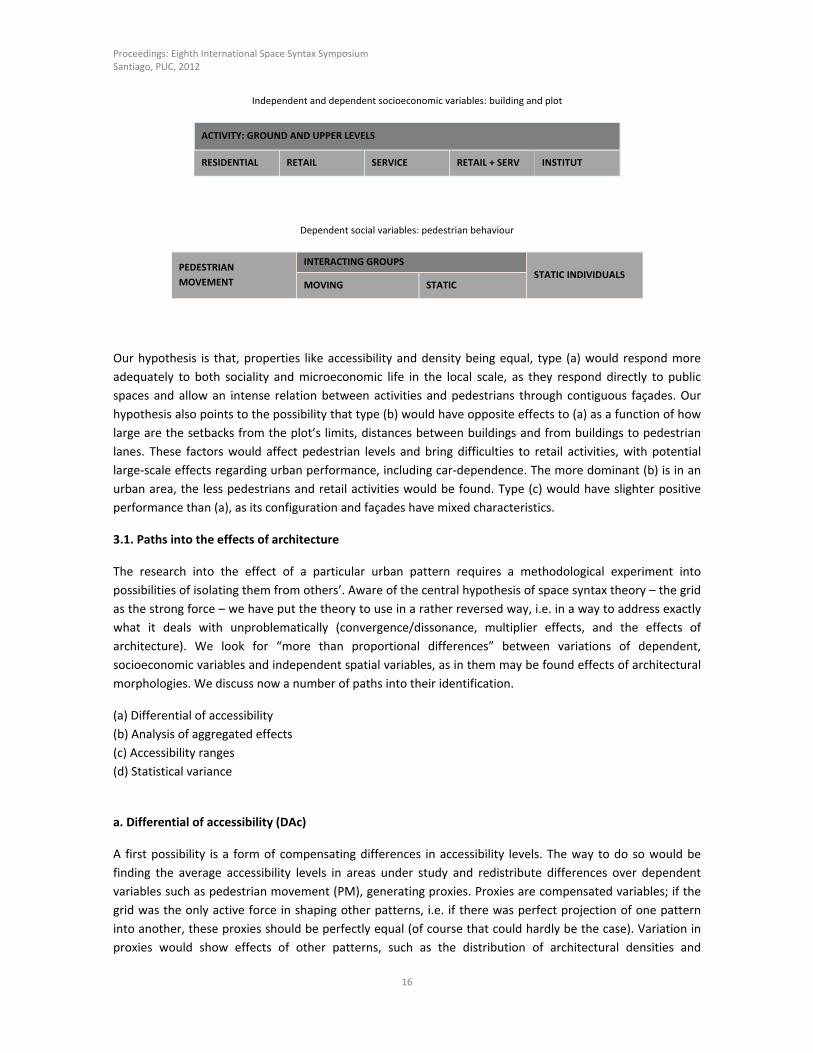
Independent and dependent socioeconomic variables: building and plot
ACTIVITY: GROUND AND UPPER LEVELS
RESIDENTIAL RETAIL SERVICE RETAIL + SERV INSTITUT
Dependent social variables: pedestrian behaviour
PEDESTRIAN
MOVEMENT
INTERACTING GROUPS STATIC INDIVIDUALS
MOVING STATIC
Our hypothesis is that, properties like accessibility and density being equal, type (a) would respond more
adequately to both sociality and microeconomic life in the local scale, as they respond directly to public
spaces and allow an intense relation between activities and pedestrians through contiguous façades. Our
hypothesis also points to the possibility that type (b) would have opposite effects to (a) as a function of how
large are the setbacks from the plot’s limits, distances between buildings and from buildings to pedestrian
lanes. These factors would affect pedestrian levels and bring difficulties to retail activities, with potential
large‐scale effects regarding urban performance, including car‐dependence. The more dominant (b) is in an
urban area, the less pedestrians and retail activities would be found. Type (c) would have slighter positive
performance than (a), as its configuration and façades have mixed characteristics.
3.1. Paths into the effects of architecture
The research into the effect of a particular urban pattern requires a methodological experiment into
possibilities of isolating them from others’. Aware of the central hypothesis of space syntax theory – the grid
as the strong force – we have put the theory to use in a rather reversed way, i.e. in a way to address exactly
what it deals with unproblematically (convergence/dissonance, multiplier effects, and the effects of
architecture). We look for “more than proportional differences” between variations of dependent,
socioeconomic variables and independent spatial variables, as in them may be found effects of architectural
morphologies. We discuss now a number of paths into their identification.
(a) Differential of accessibility
(b) Analysis of aggregated effects
(c) Accessibility ranges
(d) Statistical variance
a. Differential of accessibility (DAc)
A first possibility is a form of compensating differences in accessibility levels. The way to do so would be
finding the average accessibility levels in areas under study and redistribute differences over dependent
variables such as pedestrian movement (PM), generating proxies. Proxies are compensated variables; if the
grid was the only active force in shaping other patterns, i.e. if there was perfect projection of one pattern
into another, these proxies should be perfectly equal (of course that could hardly be the case). Variation in
proxies would show effects of other patterns, such as the distribution of architectural densities and
Proceedings: Eighth International Space Syntax Symposium Santiago, PUC, 2012
17
typologies. Such method depends on a causal relation between grid and movement, and implies interfering
with dependent variables collected empirically and converting them into proxies, which would eliminate the
validity of results, serving at best as a sign of effects of patterns other than the grid.
b. Analysis of aggregated effects
The effects of architectural morphology over local socioeconomic processes may be recognizable only as
aggregated effects emerging from scale. The intensities of socioeconomic variables in urban areas with
dominance of different types could be compared. Comparative studies could show whether the dominance
of a type coincides with consistent intensities in socioeconomic variables. Of course accessibility and
densities are still issues, so areas should either have same or similar levels or be monitored statistically, in
order to achieve proper comparisons. If variations are consistent, factors of relation between them could be
found as strong signals of socio‐spatial relation and urban convergence – one potentially useful for further
research and planning.
c. Accessibility ranges
A third way into assessing impacts of architectural typology on urban vitality is based on the definition of
ranges of accessibility found in a number of areas in a city. Within every range, the variation in built form
types and socioeconomic variables would be statistically monitored.
d. Statistical variance
A final alternative was to build a regression equation for each dependent variable using our independent
variables as its terms. This method has the advantage of simplifying the sample selection and allowing for
the inclusion of as many independent variables as considered theoretically relevant. These variables (along
with accessibility proxies and density) can then be tested for their significance in explaining the variations in
the dependent variables. However, using all the urban system as population – from the most integrated to
the most segregated streets – tends to bring a greater variance in dependent variables. Differences in vitality
tend to be very high in these situations. This variance, in turn, requires a very large sample if results are to
be statistically significant.
From these methodological possibilities, we explore below the third path, in connection with statistical
techniques pointed out above – the simpler and apparently most effective way to verify our hypotheses, but
not free from methodological challenges. We discuss now a number of dilemmas, starting with difficulties in
isolating a particular ratio of accessibility since accessibility is a relational property operating at a number of
scales and ratios simultaneously. Other problems include choosing between different measures of
accessibility (integration or choice); the entity of representation of street morphology (axial lines, continuity
lines or segments); accessibility ratios, and how to isolate typology from density.
4. ISOLATING ARCHITECTURAL VARIABLES: ACCESSIBILITY RANGES
In order to test our hypotheses, we devised a method to select samples of spaces based on similar
accessibility levels, allowing us to assess variations in architectural morphology and their potential influence
on movement and other features related to urban vitality (static use of streets, interaction levels in public
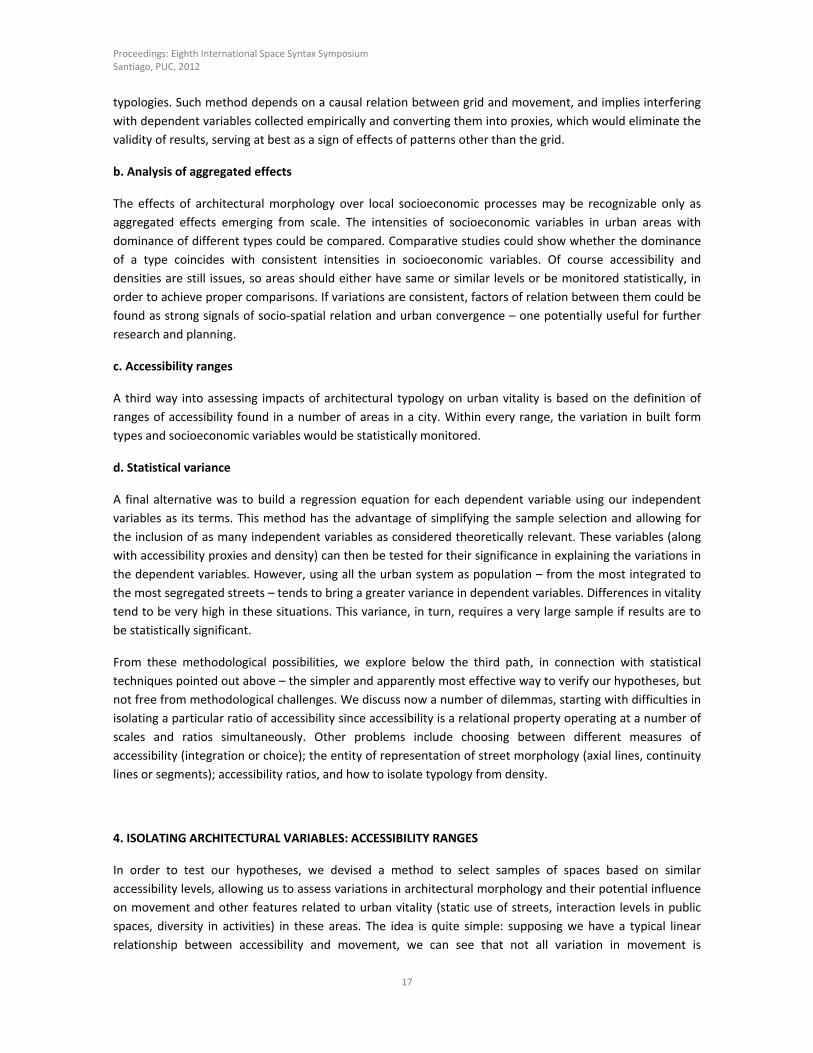
spaces, diversity in activities) in these areas. The idea is quite simple: supposing we have a typical linear
relationship between accessibility and movement, we can see that not all variation in movement is
Proceedings: Eighth International Space Syntax Symposium Santiago, PUC, 2012
18
explained by accessibility (figure 15). That would only be true if we had perfect correlation between the two
variables, which a large number of studies have consistently shown not to be the case. Thus, if we select a
narrow range of accessibility values, we see that it corresponds to a not so narrow range of movement
values. Differences in accessibility and movement are more than proportional. This greater variation in
movement is not explained by accessibility alone, thus suggesting that (a) dissonances between patterns are
at work, and (b) other urban features may play a role in explaining them. Therefore, if we analyse streets
and their morphologies from the particular set within such narrow accessibility range, we can assume that
differences in movement are nearly accessibility‐free – limited, of course, by the efficacy of the method
employed to describe accessibility. That way, we can compare the variations in movement rates with
variations in typological characteristics and examine if a correlation can be found, while minimizing the
effects of street configuration.
Figure 15 – Concept scheme for accessibility ranges as a method for isolating the effects of the grid on movement, one a key feature of
urban vitality.
In other words, we are trying to maintain key independent variables constant (namely accessibility, but also
density levels, as we shall see below) while examining variations in typology and vitality in order to see if any
pattern of correlation emerges. While the overall logic of this method is simple, other important
methodological questions must be addressed so the problem can be adequately handled. These questions
are discussed below.
How to describe – and neutralize – accessibility?
Controlling methodologically the influence of accessibility in urban vitality features is of course not an easy
task, since it is pervasive, potentially combined with other urban patterns and partially immersed in
contingencies. Space syntax measures seemed to be particularly adequate tools here, since they have been
successful in providing a detailed account of spatial differentiation in a variety of situations, and at the fine
scale we were interested in. But this led to a dilemma: which measure should be used? A survey of the
literature does not show obvious advantages for neither integration nor choice, measures most used to
represent accessibility, in what regards their ability to post‐dict movement. Hillier and Iida (2005) show a
Movement
Proceedings: Eighth International Space Syntax Symposium Santiago, PUC, 2012
19
slight advantage to the first, but the best correlations were achieved by various integration radii, making it
impossible to know beforehand which of them would yield the best results. Having similar correlations to
movement patterns, the problem turned to substantive and operational implications to our research
problem. To examine these aspects, several maps were produced using the two measures and their
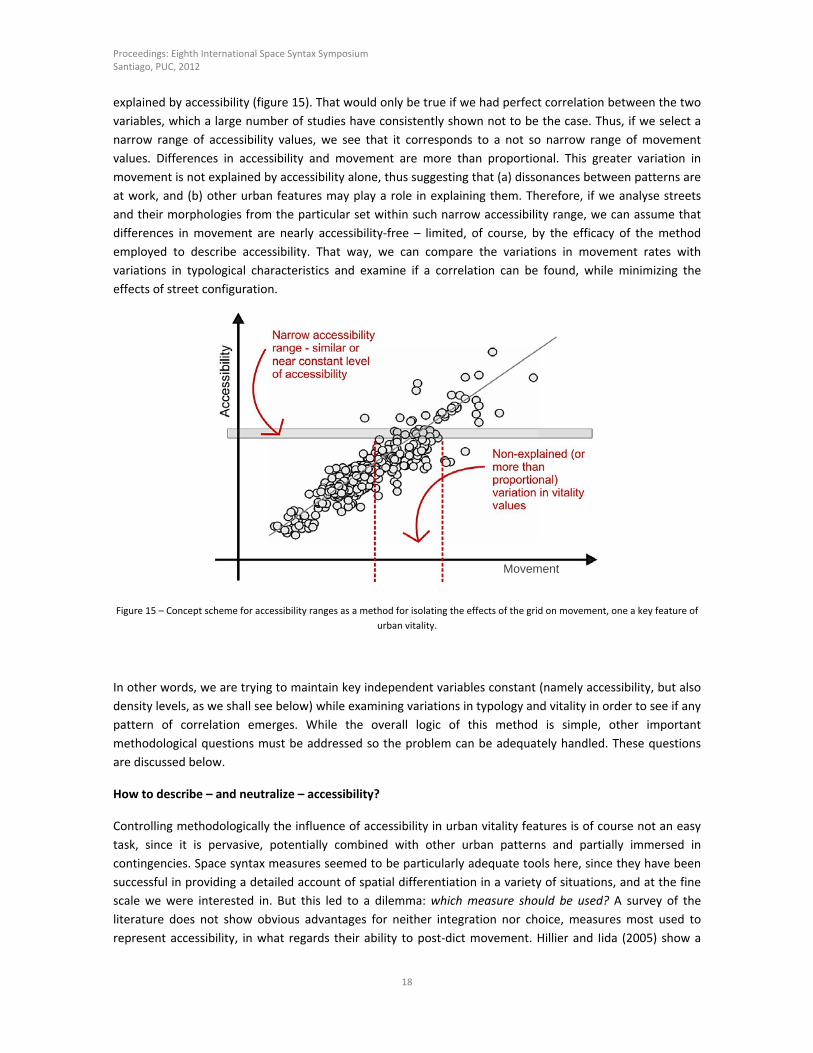
variations (radii and spatial units – axial line or segments). A striking difference between integration and
choice measures became immediately apparent when they were classified in ranges. While integration
ranges tend to manifest themselves as clusters of lines, choice ranges are scattered all over the urban
system (figure 16). This makes sense when we examine each measure in detail. Integration is concerned
with proximity, represented as the mean topological depth of a node to all other nodes of the system. Thus,
two lines connected to each other cannot have mean depths differing by more than 1 step. So, even in an
extreme situation where we have a dead end line connected to a highly integrated one, the first will not be
much deeper than the latter and, therefore, it will be almost as close as the more integrated one in relation
to all other lines. Choice, on the other hand, is concerned with through movement, since a line with high
choice value indicates that this line falls in a great number of shortest paths between all pairs of lines in the
system. Thus, the dead end street cited above would have a very low choice value, because it does not fall in
any shortest path. The more integrated line it is connected to, on the other hand, is more likely to fall on
many shortest paths, and therefore have a high choice value. Differences in choice values between two
adjacent lines can be – and often are – much higher than the difference between integration values for the
same lines.
Figure 16 – Integration or choice? Maps a, b, c show top 5% quantiles for high, medium and low choice values; d, e, f show top 5%
quantiles for high, medium and low integration values – in Rio de Janeiro. The lines with highest choice measures cover most of the
urban system, whereas the integration core is much more concentrated on a particular area. When we look at the medium and low
levels, the difference remains the same: lines lose continuity and are distributed throughout the system, while integration keeps
clusters of lines together.
Proceedings: Eighth International Space Syntax Symposium Santiago, PUC, 2012
20
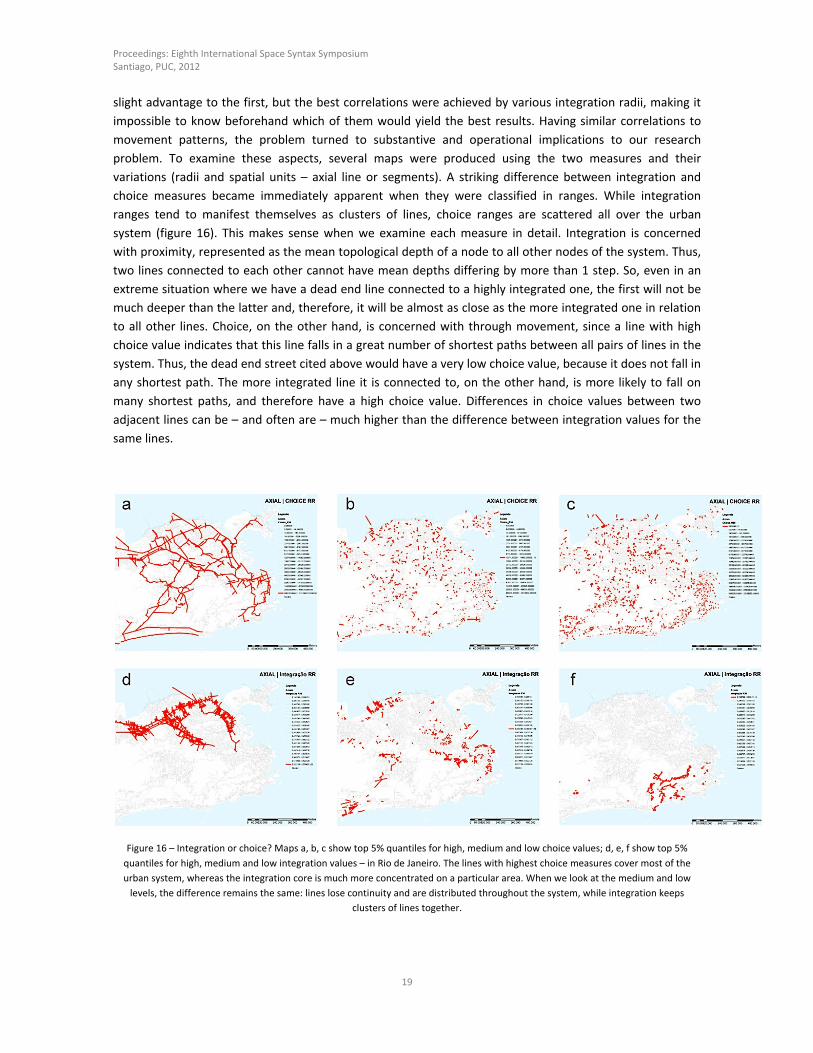
The use of different radii in integration measures had similar results. Local integration ranges were more
scattered over the system than more global ones (figure 17). Moreover, this concern about the radius to be
adopted raised a new aspect of the problem: analysis showed that no single radius would be able to fully
account for configurational influences on movement rates, since at every location there is always the
influence of multiple accessibility radii acting simultaneously. If we were to minimize properly the effects of
grid‐related accessibility patterns, we should examine more than one radius and one accessibility level.
Figure 17 – The problem of accessibility radii: (a) Integration RR; and (b) R3.
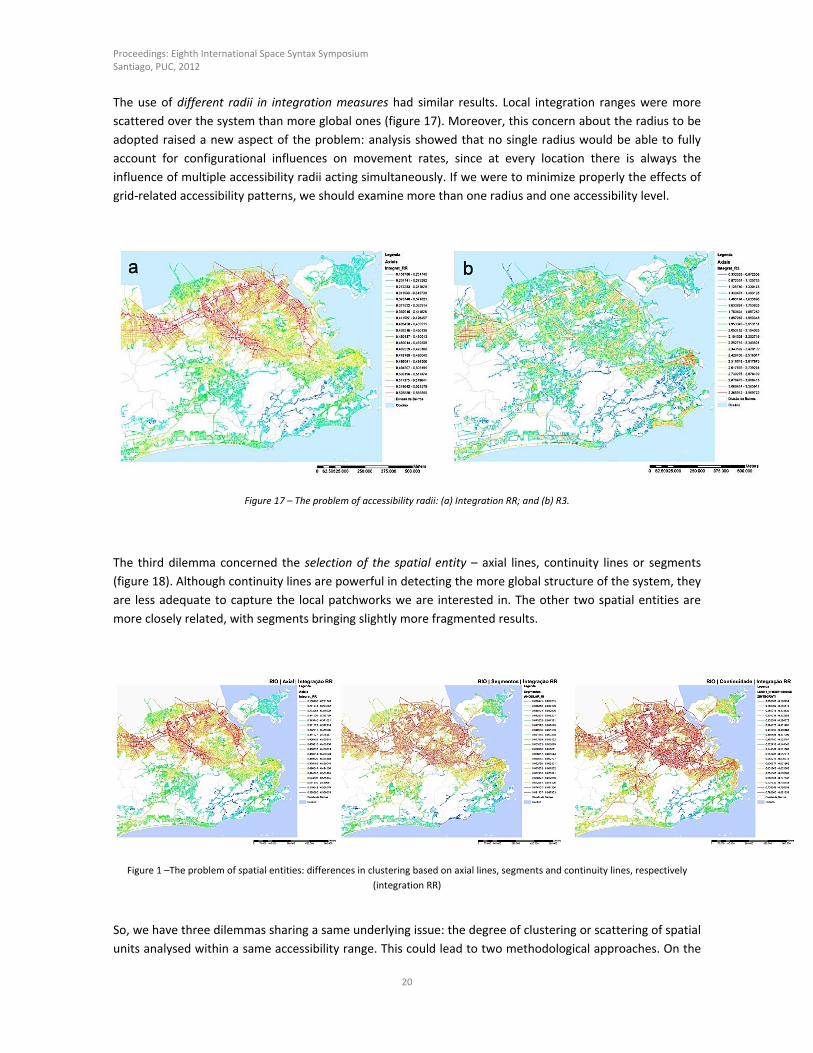
The third dilemma concerned the selection of the spatial entity – axial lines, continuity lines or segments
(figure 18). Although continuity lines are powerful in detecting the more global structure of the system, they
are less adequate to capture the local patchworks we are interested in. The other two spatial entities are
more closely related, with segments bringing slightly more fragmented results.
Figure 1 –The problem of spatial entities: differences in clustering based on axial lines, segments and continuity lines, respectively
(integration RR)
So, we have three dilemmas sharing a same underlying issue: the degree of clustering or scattering of spatial
units analysed within a same accessibility range. This could lead to two methodological approaches. On the

Proceedings: Eighth International Space Syntax Symposium Santiago, PUC, 2012
21
one hand, we could have populations (and samples, consequently) closer to each other, in a way that
resembles a neighbourhood‐like pattern of locations. On the other hand, we would have a scattered set of
locations from which to draw the sample, and thus would end up with a disperse set of streets to be
analysed quite independently from its neighbourhood. In this sense, our concern with typological influences
on urban vitality involves a degree of synergy among adjacent locations in motivating the appropriation of
public spaces, both for movement‐related and static pedestrian use and activities. Our hypothesis is that
architectural morphologies in general, and typological dominance in particular, may play a role in
stimulating both to/from and through movement by offering more destination points and a path with more
vibrant and diversified sets of activities and interactions in public spaces. Therefore, our set of proxies to
accessibility includes integration as measure, axial lines as spatial entities, and a radius equivalent to the
mean depth of the most integrated axial line in an urban system (RR integration – see Hillier 1996). Local
accessibility radii must be explicitly considered as an independent variable and its influence on dependent
variables can be tested statistically as degrees of significance in the regression equation. This way,
accessibility patterns are held as constant as possible within a number of ranges, allowing us to focus on
local characteristics in architectural and urban morphologies.
Which accessibility ranges?
In order to study the effects of architectural morphology on urban vitality, we selected three RR integration
ranges from which to draw the samples, representing high, medium and low accessibility sets of streets. The
precise range may be chosen according to the presence of architectural typologies of interest in their sets,
as long as the associated range of values is kept narrow, in order to avoind harming the validity of results
and allow comparisons. If, on the one hand, it seems clear that highly integrated areas have the property of
establishing a synergy with certain types of buildings to create and sustain vitality, on the other hand it is
unclear whether low integration areas can reach urban vitality even if they have supposedly adequate
typologies. In other words, there may be a threshold of integration above which the typology may create
vitality. However, the opposite may also prove to be the case: architectural types may not materialize
potential for vitality generated by accessibility as far as support for activities is concerned. This seems to be
a growing problem in Brazilian cities now. If this complementary hypothesis is correct, the potential for
vitality latent in the grid may or may not emerge, depending on typological characteristics. The selected
ranges in our study of Rio de Janeiro can be seen on figures 19 and 20.
Proceedings: Eighth International Space Syntax Symposium Santiago, PUC, 2012
22
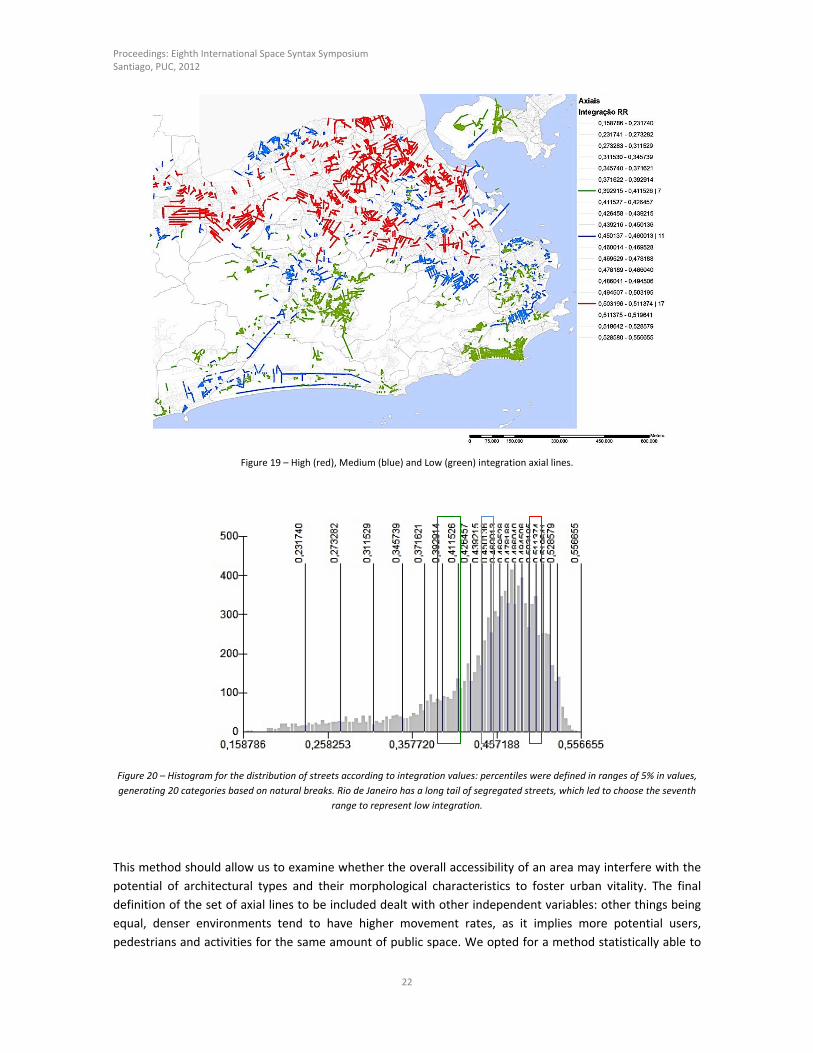
Figure 19 – High (red), Medium (blue) and Low (green) integration axial lines.
Figure 20 – Histogram for the distribution of streets according to integration values: percentiles were defined in ranges of 5% in values,
generating 20 categories based on natural breaks. Rio de Janeiro has a long tail of segregated streets, which led to choose the seventh
range to represent low integration.
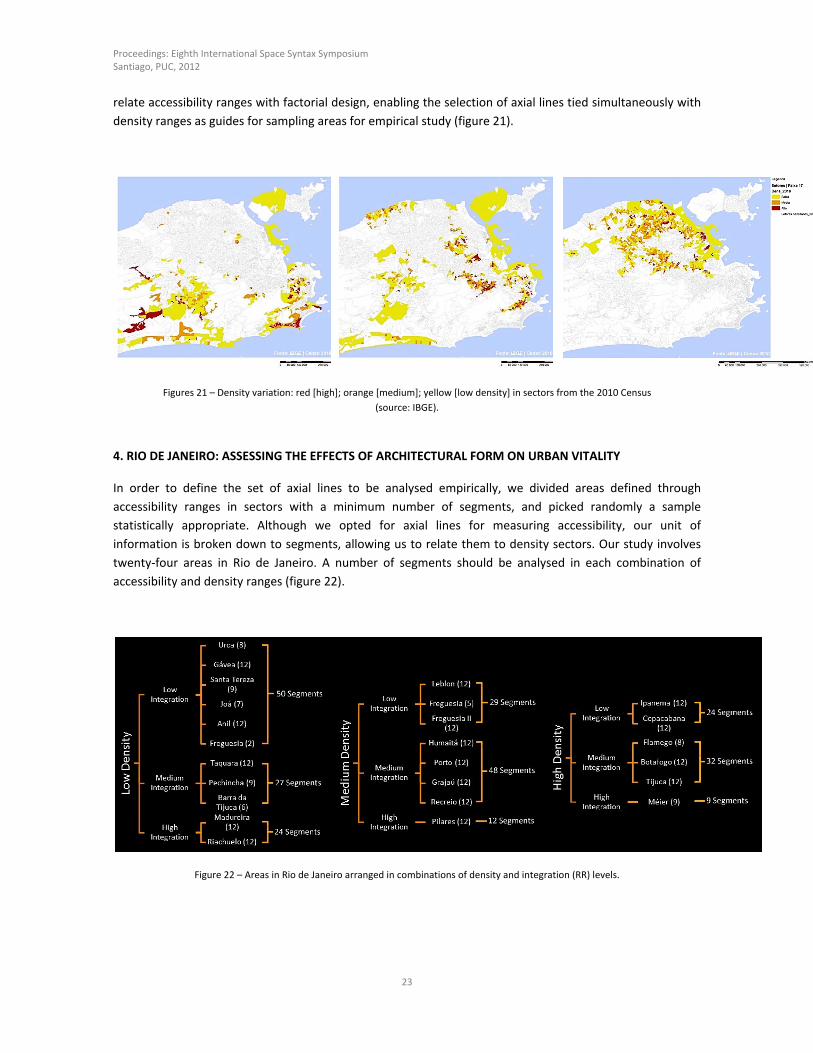
This method should allow us to examine whether the overall accessibility of an area may interfere with the
potential of architectural types and their morphological characteristics to foster urban vitality. The final
definition of the set of axial lines to be included dealt with other independent variables: other things being
equal, denser environments tend to have higher movement rates, as it implies more potential users,
pedestrians and activities for the same amount of public space. We opted for a method statistically able to
Proceedings: Eighth International Space Syntax Symposium Santiago, PUC, 2012
23
relate accessibility ranges with factorial design, enabling the selection of axial lines tied simultaneously with
density ranges as guides for sampling areas for empirical study (figure 21).
Figures 21 – Density variation: red [high]; orange [medium]; yellow [low density] in sectors from the 2010 Census
(source: IBGE).
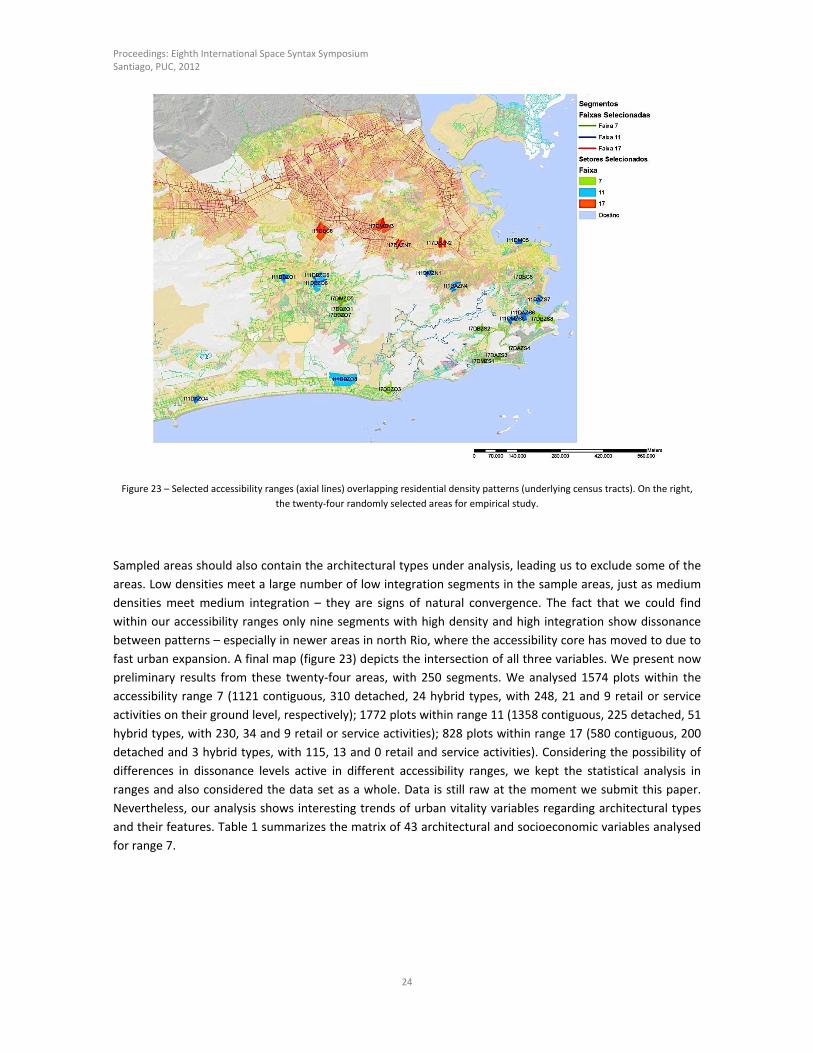
4. RIO DE JANEIRO: ASSESSING THE EFFECTS OF ARCHITECTURAL FORM ON URBAN VITALITY
In order to define the set of axial lines to be analysed empirically, we divided areas defined through
accessibility ranges in sectors with a minimum number of segments, and picked randomly a sample
statistically appropriate. Although we opted for axial lines for measuring accessibility, our unit of
information is broken down to segments, allowing us to relate them to density sectors. Our study involves
twenty‐four areas in Rio de Janeiro. A number of segments should be analysed in each combination of
accessibility and density ranges (figure 22).
Figure 22 – Areas in Rio de Janeiro arranged in combinations of density and integration (RR) levels.
Proceedings: Eighth International Space Syntax Symposium Santiago, PUC, 2012
24
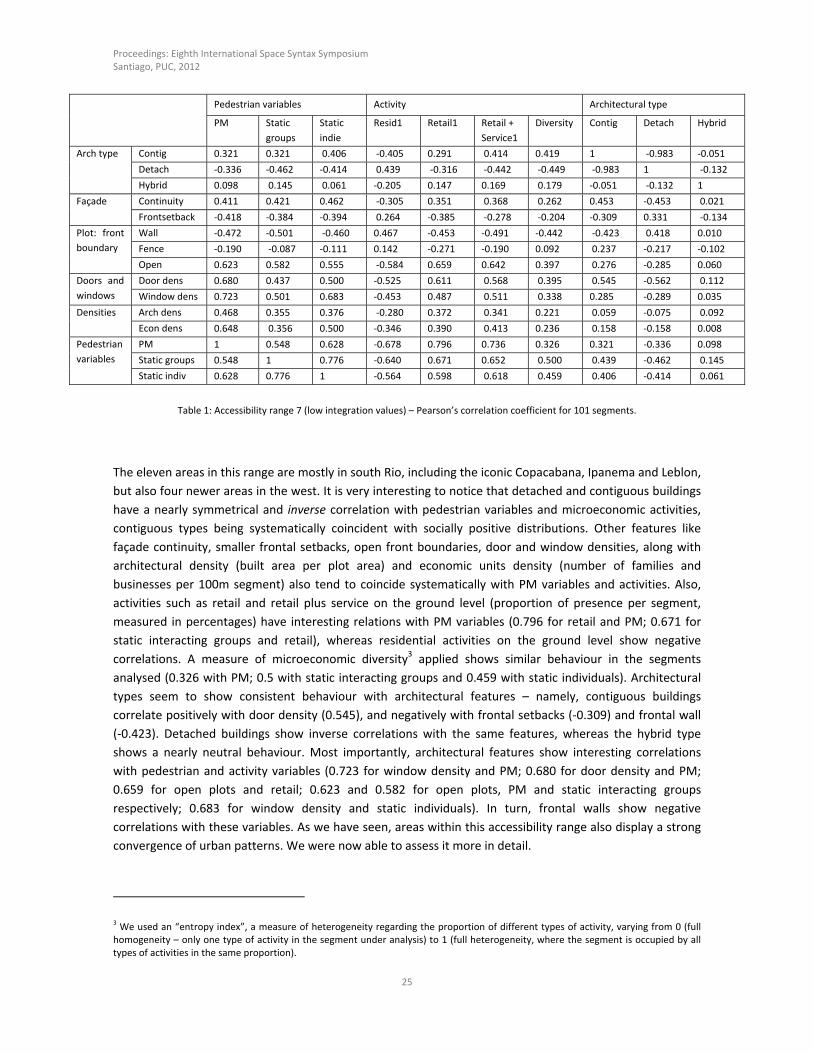
Figure 23 – Selected accessibility ranges (axial lines) overlapping residential density patterns (underlying census tracts). On the right,
the twenty‐four randomly selected areas for empirical study.
Sampled areas should also contain the architectural types under analysis, leading us to exclude some of the
areas. Low densities meet a large number of low integration segments in the sample areas, just as medium
densities meet medium integration – they are signs of natural convergence. The fact that we could find
within our accessibility ranges only nine segments with high density and high integration show dissonance
between patterns – especially in newer areas in north Rio, where the accessibility core has moved to due to
fast urban expansion. A final map (figure 23) depicts the intersection of all three variables. We present now
preliminary results from these twenty‐four areas, with 250 segments. We analysed 1574 plots within the
accessibility range 7 (1121 contiguous, 310 detached, 24 hybrid types, with 248, 21 and 9 retail or service
activities on their ground level, respectively); 1772 plots within range 11 (1358 contiguous, 225 detached, 51
hybrid types, with 230, 34 and 9 retail or service activities); 828 plots within range 17 (580 contiguous, 200
detached and 3 hybrid types, with 115, 13 and 0 retail and service activities). Considering the possibility of
differences in dissonance levels active in different accessibility ranges, we kept the statistical analysis in
ranges and also considered the data set as a whole. Data is still raw at the moment we submit this paper.
Nevertheless, our analysis shows interesting trends of urban vitality variables regarding architectural types
and their features. Table 1 summarizes the matrix of 43 architectural and socioeconomic variables analysed
for range 7.
Proceedings: Eighth International Space Syntax Symposium Santiago, PUC, 2012
25
Pedestrian variables Activity Architectural type
PM Static
groups
Static
indie
Resid1 Retail1
Retail +
Service1
Diversity Contig Detach Hybrid
Arch type Contig 0.321 0.321 0.406 ‐0.405 0.291 0.414 0.419 1 ‐0.983 ‐0.051
Detach ‐0.336 ‐0.462 ‐0.414 0.439 ‐0.316 ‐0.442 ‐0.449 ‐0.983 1 ‐0.132
Hybrid 0.098 0.145 0.061 ‐0.205 0.147 0.169 0.179 ‐0.051 ‐0.132 1
Façade Continuity 0.411 0.421 0.462 ‐0.305 0.351 0.368 0.262 0.453 ‐0.453 0.021
Frontsetback ‐0.418 ‐0.384 ‐0.394 0.264 ‐0.385 ‐0.278 ‐0.204 ‐0.309 0.331 ‐0.134
Plot: front
boundary
Wall ‐0.472 ‐0.501 ‐0.460 0.467 ‐0.453 ‐0.491 ‐0.442 ‐0.423 0.418 0.010
Fence ‐0.190 ‐0.087 ‐0.111 0.142 ‐0.271 ‐0.190 0.092 0.237 ‐0.217 ‐0.102
Open 0.623 0.582 0.555 ‐0.584 0.659 0.642 0.397 0.276 ‐0.285 0.060
Doors and
windows
Door dens 0.680 0.437 0.500 ‐0.525 0.611 0.568 0.395 0.545 ‐0.562 0.112
Window dens 0.723 0.501 0.683 ‐0.453 0.487 0.511 0.338 0.285 ‐0.289 0.035
Densities Arch dens 0.468 0.355 0.376 ‐0.280 0.372 0.341 0.221 0.059 ‐0.075 0.092
Econ dens 0.648 0.356 0.500 ‐0.346 0.390 0.413 0.236 0.158 ‐0.158 0.008
Pedestrian
variables
PM 1 0.548 0.628 ‐0.678 0.796 0.736 0.326 0.321 ‐0.336 0.098
Static groups 0.548 1 0.776 ‐0.640 0.671 0.652 0.500 0.439 ‐0.462 0.145
Static indiv 0.628 0.776 1 ‐0.564 0.598 0.618 0.459 0.406 ‐0.414 0.061
Table 1: Accessibility range 7 (low integration values) – Pearson’s correlation coefficient for 101 segments.
The eleven areas in this range are mostly in south Rio, including the iconic Copacabana, Ipanema and Leblon,
but also four newer areas in the west. It is very interesting to notice that detached and contiguous buildings
have a nearly symmetrical and inverse correlation with pedestrian variables and microeconomic activities,
contiguous types being systematically coincident with socially positive distributions. Other features like
façade continuity, smaller frontal setbacks, open front boundaries, door and window densities, along with
architectural density (built area per plot area) and economic units density (number of families and
businesses per 100m segment) also tend to coincide systematically with PM variables and activities. Also,
activities such as retail and retail plus service on the ground level (proportion of presence per segment,
measured in percentages) have interesting relations with PM variables (0.796 for retail and PM; 0.671 for
static interacting groups and retail), whereas residential activities on the ground level show negative
correlations. A measure of microeconomic diversity3 applied shows similar behaviour in the segments
analysed (0.326 with PM; 0.5 with static interacting groups and 0.459 with static individuals). Architectural
types seem to show consistent behaviour with architectural features – namely, contiguous buildings
correlate positively with door density (0.545), and negatively with frontal setbacks (‐0.309) and frontal wall
(‐0.423). Detached buildings show inverse correlations with the same features, whereas the hybrid type
shows a nearly neutral behaviour. Most importantly, architectural features show interesting correlations
with pedestrian and activity variables (0.723 for window density and PM; 0.680 for door density and PM;
0.659 for open plots and retail; 0.623 and 0.582 for open plots, PM and static interacting groups
respectively; 0.683 for window density and static individuals). In turn, frontal walls show negative
correlations with these variables. As we have seen, areas within this accessibility range also display a strong
convergence of urban patterns. We were now able to assess it more in detail.
3 We used an “entropy index”, a measure of heterogeneity regarding the proportion of different types of activity, varying from 0 (full homogeneity – only one type of activity in the segment under analysis) to 1 (full heterogeneity, where the segment is occupied by all types of activities in the same proportion).
Proceedings: Eighth International Space Syntax Symposium Santiago, PUC, 2012
26
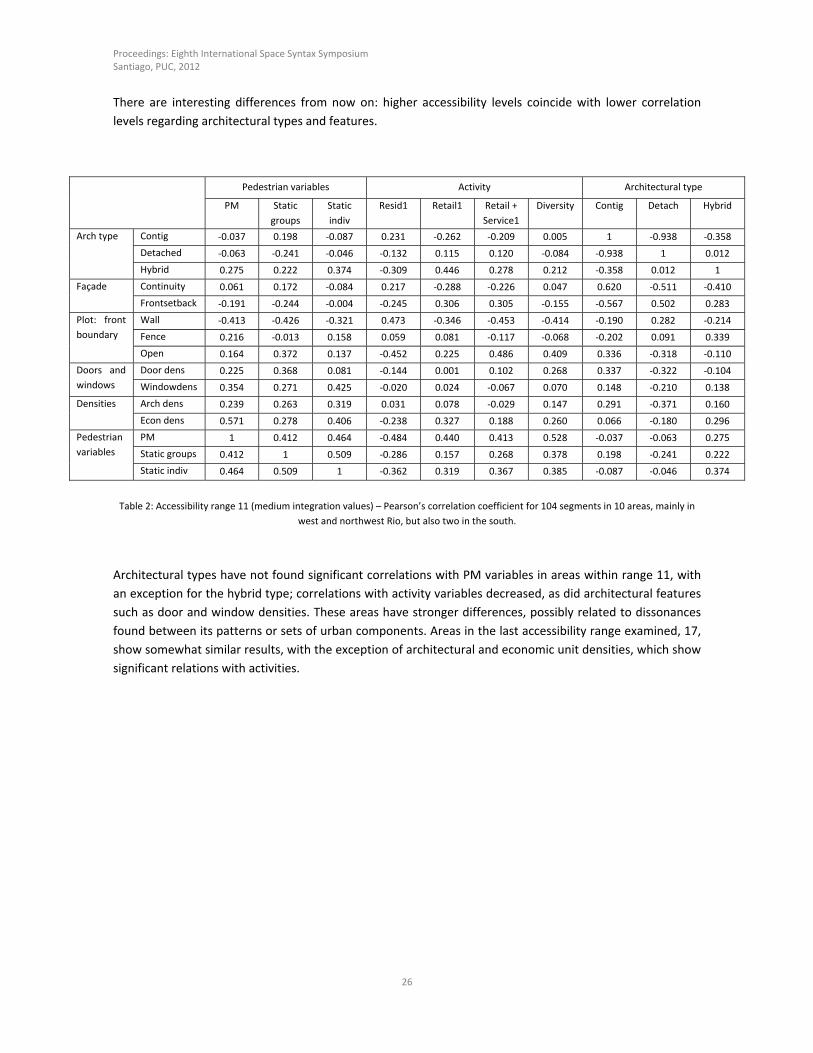
There are interesting differences from now on: higher accessibility levels coincide with lower correlation
levels regarding architectural types and features.
Pedestrian variables Activity Architectural type
PM Static
groups
Static
indiv
Resid1 Retail1
Retail +
Service1
Diversity Contig Detach Hybrid
Arch type Contig ‐0.037 0.198 ‐0.087 0.231 ‐0.262 ‐0.209 0.005 1 ‐0.938 ‐0.358
Detached ‐0.063 ‐0.241 ‐0.046 ‐0.132 0.115 0.120 ‐0.084 ‐0.938 1 0.012
Hybrid 0.275 0.222 0.374 ‐0.309 0.446 0.278 0.212 ‐0.358 0.012 1
Façade Continuity 0.061 0.172 ‐0.084 0.217 ‐0.288 ‐0.226 0.047 0.620 ‐0.511 ‐0.410
Frontsetback ‐0.191 ‐0.244 ‐0.004 ‐0.245 0.306 0.305 ‐0.155 ‐0.567 0.502 0.283
Plot: front
boundary
Wall ‐0.413 ‐0.426 ‐0.321 0.473 ‐0.346 ‐0.453 ‐0.414 ‐0.190 0.282 ‐0.214
Fence 0.216 ‐0.013 0.158 0.059 0.081 ‐0.117 ‐0.068 ‐0.202 0.091 0.339
Open 0.164 0.372 0.137 ‐0.452 0.225 0.486 0.409 0.336 ‐0.318 ‐0.110
Doors and
windows
Door dens 0.225 0.368 0.081 ‐0.144 0.001 0.102 0.268 0.337 ‐0.322 ‐0.104
Windowdens 0.354 0.271 0.425 ‐0.020 0.024 ‐0.067 0.070 0.148 ‐0.210 0.138
Densities Arch dens 0.239 0.263 0.319 0.031 0.078 ‐0.029 0.147 0.291 ‐0.371 0.160
Econ dens 0.571 0.278 0.406 ‐0.238 0.327 0.188 0.260 0.066 ‐0.180 0.296
Pedestrian
variables
PM 1 0.412 0.464 ‐0.484 0.440 0.413 0.528 ‐0.037 ‐0.063 0.275
Static groups 0.412 1 0.509 ‐0.286 0.157 0.268 0.378 0.198 ‐0.241 0.222
Static indiv 0.464 0.509 1 ‐0.362 0.319 0.367 0.385 ‐0.087 ‐0.046 0.374
Table 2: Accessibility range 11 (medium integration values) – Pearson’s correlation coefficient for 104 segments in 10 areas, mainly in
west and northwest Rio, but also two in the south.
Architectural types have not found significant correlations with PM variables in areas within range 11, with
an exception for the hybrid type; correlations with activity variables decreased, as did architectural features
such as door and window densities. These areas have stronger differences, possibly related to dissonances
found between its patterns or sets of urban components. Areas in the last accessibility range examined, 17,
show somewhat similar results, with the exception of architectural and economic unit densities, which show
significant relations with activities.
Proceedings: Eighth International Space Syntax Symposium Santiago, PUC, 2012
27
Pedestrian variables Activity Architectural type
PM Static
groups
Static
indiv
Resid1 Retail1
Retail +
Service1
Diversity Contig Detach Hybrid
Arch type Contig 0.061 0.284 0.202 ‐0.255 0.245 0.333 0.302 1 ‐0.963 ‐0.442
Detached ‐0.40 ‐0.284 ‐0.218 0.259 ‐0.268 ‐0.344 ‐0.302 ‐0.963 1 0.188
Hybrid ‐0.115 ‐0.110 ‐0.025 0.094 ‐0.020 ‐0.089 ‐0.119 ‐0.442 0.188 1
Façade Continuity 0.203 0.317 0.411 ‐0.349 0.254 0.391 0.257 0.379 ‐0.396 ‐0.076
Frontsetback ‐0.105 ‐0.392 ‐0.245 0.187 ‐0.164 ‐0.181 ‐0.168 ‐0.316 0.320 0.073
Plot: front
boundary
Wall ‐0.459 ‐0.322 ‐0.352 0.541 ‐0.444 ‐0.559 ‐0.524 ‐0.273 0.284 0.083
Fence 0.144 ‐0.128 0.046 ‐0.088 0.199 0.118 0.072 ‐0.165 0.166 0.027
Open 0.387 0.490 0.446 ‐0.534 0.317 0.526 0.530 0.469 ‐0.483 ‐0.120
Doors and
windows
Door dens 0.173 0.139 0.423 ‐0.287 0.158 0.306 0.338 0.469 ‐0.427 ‐0.268
Windowdens 0.178 0.280 0.038 ‐0.095 0.134 0.074 0.072 0.199 ‐0.182 ‐0.134
Densities Arch dens 0.271 0.187 0.076 ‐0.154 0.023 0.071 0.109 0.339 ‐0.333 ‐0.130
Econ dens 0.282 0.090 ‐0.001 ‐0.068 0.101 0.061 0.090 0.317 ‐0.331 ‐0.066
Pedestrian
variables
PM 1 0.403 0.511 ‐0.684 0.565 0.652 0.598 0.061 ‐0.40 ‐0.115
Static groups 0.403 1 0.581 ‐0.356 0.315 0.375 0.312 0.284 ‐0.284 ‐0.110
Static indiv 0.511 0.581 1 ‐0.529 0.384 0.533 0.501 0.202 ‐0.218 ‐0.025
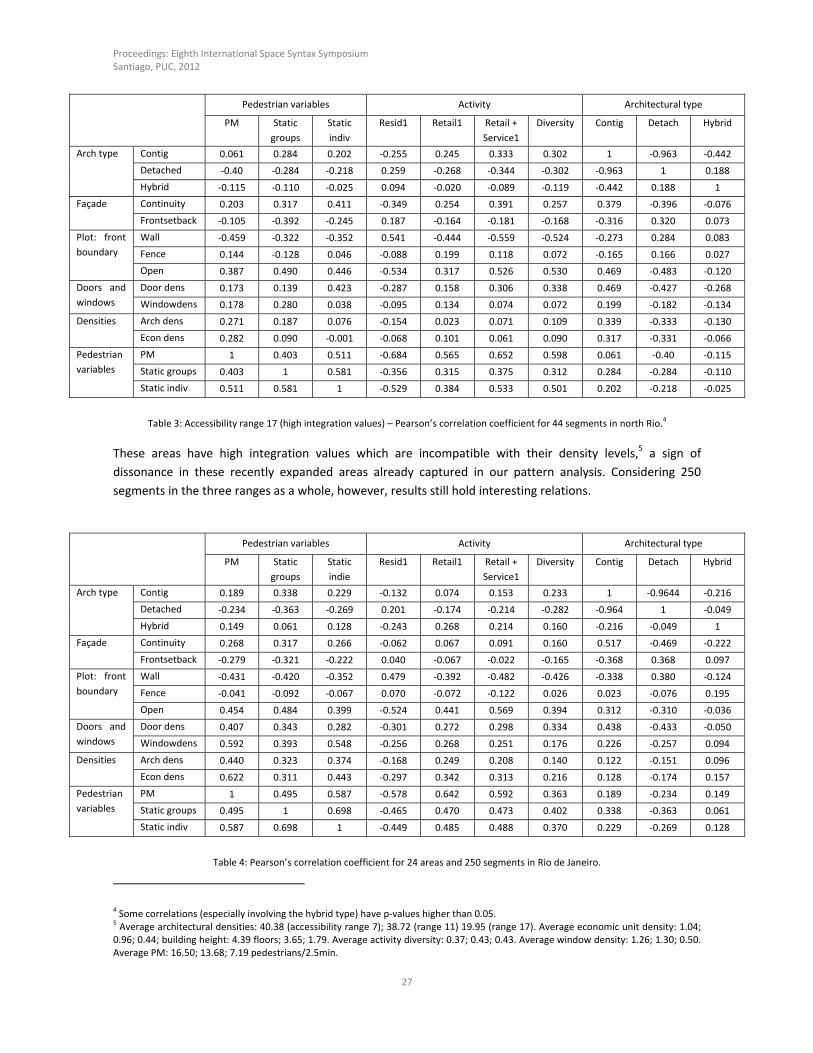
Table 3: Accessibility range 17 (high integration values) – Pearson’s correlation coefficient for 44 segments in north Rio.
4
These areas have high integration values which are incompatible with their density levels,5 a sign of
dissonance in these recently expanded areas already captured in our pattern analysis. Considering 250
segments in the three ranges as a whole, however, results still hold interesting relations.
Pedestrian variables Activity Architectural type
PM Static
groups
Static
indie
Resid1 Retail1
Retail +
Service1
Diversity Contig Detach Hybrid
Arch type Contig 0.189 0.338 0.229 ‐0.132 0.074 0.153 0.233 1 ‐0.9644 ‐0.216
Detached ‐0.234 ‐0.363 ‐0.269 0.201 ‐0.174 ‐0.214 ‐0.282 ‐0.964 1 ‐0.049
Hybrid 0.149 0.061 0.128 ‐0.243 0.268 0.214 0.160 ‐0.216 ‐0.049 1
Façade Continuity 0.268 0.317 0.266 ‐0.062 0.067 0.091 0.160 0.517 ‐0.469 ‐0.222
Frontsetback ‐0.279 ‐0.321 ‐0.222 0.040 ‐0.067 ‐0.022 ‐0.165 ‐0.368 0.368 0.097
Plot: front
boundary
Wall ‐0.431 ‐0.420 ‐0.352 0.479 ‐0.392 ‐0.482 ‐0.426 ‐0.338 0.380 ‐0.124
Fence ‐0.041 ‐0.092 ‐0.067 0.070 ‐0.072 ‐0.122 0.026 0.023 ‐0.076 0.195
Open 0.454 0.484 0.399 ‐0.524 0.441 0.569 0.394 0.312 ‐0.310 ‐0.036
Doors and
windows
Door dens 0.407 0.343 0.282 ‐0.301 0.272 0.298 0.334 0.438 ‐0.433 ‐0.050
Windowdens 0.592 0.393 0.548 ‐0.256 0.268 0.251 0.176 0.226 ‐0.257 0.094
Densities Arch dens 0.440 0.323 0.374 ‐0.168 0.249 0.208 0.140 0.122 ‐0.151 0.096
Econ dens 0.622 0.311 0.443 ‐0.297 0.342 0.313 0.216 0.128 ‐0.174 0.157
Pedestrian
variables
PM 1 0.495 0.587 ‐0.578 0.642 0.592 0.363 0.189 ‐0.234 0.149
Static groups 0.495 1 0.698 ‐0.465 0.470 0.473 0.402 0.338 ‐0.363 0.061
Static indiv 0.587 0.698 1 ‐0.449 0.485 0.488 0.370 0.229 ‐0.269 0.128
Table 4: Pearson’s correlation coefficient for 24 areas and 250 segments in Rio de Janeiro.
4 Some correlations (especially involving the hybrid type) have p‐values higher than 0.05. 5 Average architectural densities: 40.38 (accessibility range 7); 38.72 (range 11) 19.95 (range 17). Average economic unit density: 1.04; 0.96; 0.44; building height: 4.39 floors; 3.65; 1.79. Average activity diversity: 0.37; 0.43; 0.43. Average window density: 1.26; 1.30; 0.50. Average PM: 16.50; 13.68; 7.19 pedestrians/2.5min.
Proceedings: Eighth International Space Syntax Symposium Santiago, PUC, 2012
28
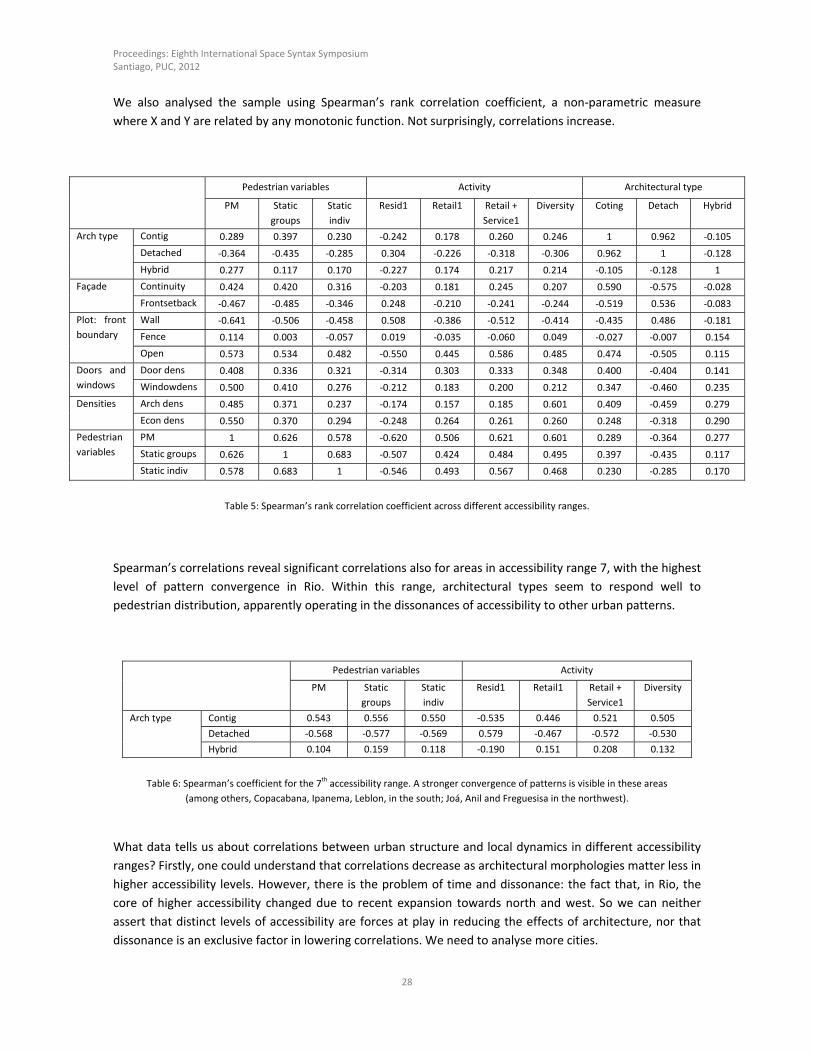
We also analysed the sample using Spearman’s rank correlation coefficient, a non‐parametric measure
where X and Y are related by any monotonic function. Not surprisingly, correlations increase.
Pedestrian variables Activity Architectural type
PM Static
groups
Static
indiv
Resid1 Retail1
Retail +
Service1
Diversity Coting Detach Hybrid
Arch type Contig 0.289 0.397 0.230 ‐0.242 0.178 0.260 0.246 1 0.962 ‐0.105
Detached ‐0.364 ‐0.435 ‐0.285 0.304 ‐0.226 ‐0.318 ‐0.306 0.962 1 ‐0.128
Hybrid 0.277 0.117 0.170 ‐0.227 0.174 0.217 0.214 ‐0.105 ‐0.128 1
Façade Continuity 0.424 0.420 0.316 ‐0.203 0.181 0.245 0.207 0.590 ‐0.575 ‐0.028
Frontsetback ‐0.467 ‐0.485 ‐0.346 0.248 ‐0.210 ‐0.241 ‐0.244 ‐0.519 0.536 ‐0.083
Plot: front
boundary
Wall ‐0.641 ‐0.506 ‐0.458 0.508 ‐0.386 ‐0.512 ‐0.414 ‐0.435 0.486 ‐0.181
Fence 0.114 0.003 ‐0.057 0.019 ‐0.035 ‐0.060 0.049 ‐0.027 ‐0.007 0.154
Open 0.573 0.534 0.482 ‐0.550 0.445 0.586 0.485 0.474 ‐0.505 0.115
Doors and
windows
Door dens 0.408 0.336 0.321 ‐0.314 0.303 0.333 0.348 0.400 ‐0.404 0.141
Windowdens 0.500 0.410 0.276 ‐0.212 0.183 0.200 0.212 0.347 ‐0.460 0.235
Densities Arch dens 0.485 0.371 0.237 ‐0.174 0.157 0.185 0.601 0.409 ‐0.459 0.279
Econ dens 0.550 0.370 0.294 ‐0.248 0.264 0.261 0.260 0.248 ‐0.318 0.290
Pedestrian
variables
PM 1 0.626 0.578 ‐0.620 0.506 0.621 0.601 0.289 ‐0.364 0.277
Static groups 0.626 1 0.683 ‐0.507 0.424 0.484 0.495 0.397 ‐0.435 0.117
Static indiv 0.578 0.683 1 ‐0.546 0.493 0.567 0.468 0.230 ‐0.285 0.170
Table 5: Spearman’s rank correlation coefficient across different accessibility ranges.
Spearman’s correlations reveal significant correlations also for areas in accessibility range 7, with the highest
level of pattern convergence in Rio. Within this range, architectural types seem to respond well to
pedestrian distribution, apparently operating in the dissonances of accessibility to other urban patterns.
Pedestrian variables Activity
PM Static
groups
Static
indiv
Resid1 Retail1
Retail +
Service1
Diversity
Arch type Contig 0.543 0.556 0.550 ‐0.535 0.446 0.521 0.505
Detached ‐0.568 ‐0.577 ‐0.569 0.579 ‐0.467 ‐0.572 ‐0.530
Hybrid 0.104 0.159 0.118 ‐0.190 0.151 0.208 0.132
Table 6: Spearman’s coefficient for the 7
th accessibility range. A stronger convergence of patterns is visible in these areas
(among others, Copacabana, Ipanema, Leblon, in the south; Joá, Anil and Freguesisa in the northwest).
What data tells us about correlations between urban structure and local dynamics in different accessibility
ranges? Firstly, one could understand that correlations decrease as architectural morphologies matter less in
higher accessibility levels. However, there is the problem of time and dissonance: the fact that, in Rio, the
core of higher accessibility changed due to recent expansion towards north and west. So we can neither
assert that distinct levels of accessibility are forces at play in reducing the effects of architecture, nor that
dissonance is an exclusive factor in lowering correlations. We need to analyse more cities.
Proceedings: Eighth International Space Syntax Symposium Santiago, PUC, 2012
29
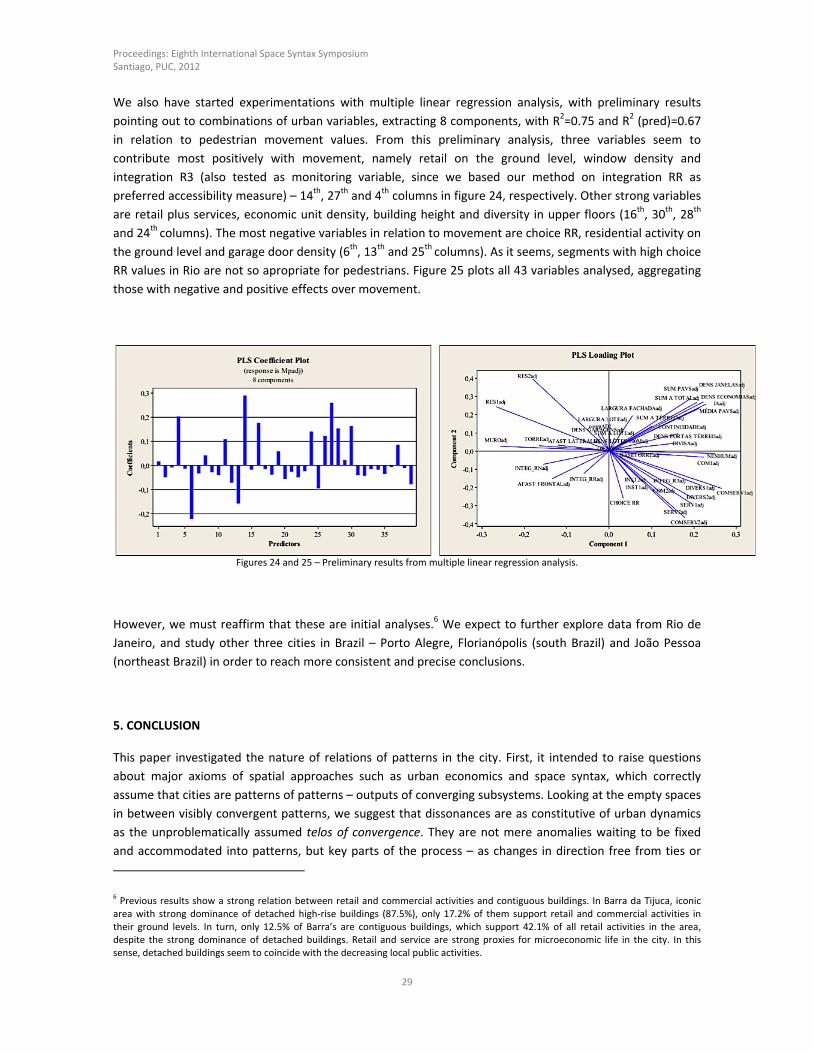
We also have started experimentations with multiple linear regression analysis, with preliminary results
pointing out to combinations of urban variables, extracting 8 components, with R2=0.75 and R2 (pred)=0.67
in relation to pedestrian movement values. From this preliminary analysis, three variables seem to
contribute most positively with movement, namely retail on the ground level, window density and
integration R3 (also tested as monitoring variable, since we based our method on integration RR as
preferred accessibility measure) – 14th, 27th and 4th columns in figure 24, respectively. Other strong variables
are retail plus services, economic unit density, building height and diversity in upper floors (16th, 30th, 28th
and 24th columns). The most negative variables in relation to movement are choice RR, residential activity on
the ground level and garage door density (6th, 13th and 25th columns). As it seems, segments with high choice
RR values in Rio are not so apropriate for pedestrians. Figure 25 plots all 43 variables analysed, aggregating
those with negative and positive effects over movement.
Figures 24 and 25 – Preliminary results from multiple linear regression analysis.
However, we must reaffirm that these are initial analyses.6 We expect to further explore data from Rio de
Janeiro, and study other three cities in Brazil – Porto Alegre, Florianópolis (south Brazil) and João Pessoa
(northeast Brazil) in order to reach more consistent and precise conclusions.
5. CONCLUSION
This paper investigated the nature of relations of patterns in the city. First, it intended to raise questions
about major axioms of spatial approaches such as urban economics and space syntax, which correctly
assume that cities are patterns of patterns – outputs of converging subsystems. Looking at the empty spaces
in between visibly convergent patterns, we suggest that dissonances are as constitutive of urban dynamics
as the unproblematically assumed telos of convergence. They are not mere anomalies waiting to be fixed
and accommodated into patterns, but key parts of the process – as changes in direction free from ties or
6 Previous results show a strong relation between retail and commercial activities and contiguous buildings. In Barra da Tijuca, iconic area with strong dominance of detached high‐rise buildings (87.5%), only 17.2% of them support retail and commercial activities in their ground levels. In turn, only 12.5% of Barra’s are contiguous buildings, which support 42.1% of all retail activities in the area, despite the strong dominance of detached buildings. Retail and service are strong proxies for microeconomic life in the city. In this sense, detached buildings seem to coincide with the decreasing local public activities.
Proceedings: Eighth International Space Syntax Symposium Santiago, PUC, 2012
30
telos; variations at play, inherent to the relation of materialities and distinct temporalities of production
involved in the emergence of urban structures and dynamics. They are always there, part and counterpart of
the very same substance of pattern and dynamics of convergence. They are expressions of the differences in
entities which find the status of systems in their own right; expressions of the impossibility of full
synchronization, full passage from action to completely cooperated joint action, and from every event in the
realm of practice to its manifestation in the physical realm of space.
Second, we studied more closely certain empty spaces in between these relations – namely, between
architectural form, urban structure and social dynamics – through a methodological principle derived from a
well‐known theory (the apparently causal relation of accessibility and movement in space syntax), used here
in a reversed way: to somehow neutralize the effects of the grid. Our study, still in an early stage, aims at
investigating precisely the extension of “the social effects of architecture”, and the levels of causality and
contingency involved. Results asserting or not a role for architecture in local socioeconomic processes are
equally important in clarifying a challenging problem still poorly addressed on a systematic basis.
We attempted to “collide” methodologically – through statistics – a large number of urban components in
order to see what combinations may correspond to the chemistry of urban vitality. Although analysis is still
ongoing, preliminary results seem to point to consistencies in the relation of certain architectural features
and local socioeconomic variables. It also shows nearly reversed relations between different architectural
types and such variables – the type more traditionally produced in cities, frequently contiguous, and
architectural types that resulted from modernist morphological experimentation. Results suggest that the
contiguous type is not an exclusive factor of urban vitality, as it may support both residential and
commercial activities (which lower correlations with dependent variables), but is either intimately
associated with or a condition for other architectural features that seem to correlate well with urban vitality
– such as retail and services located close to the streets, diversity in activities, density of windows and doors,
absence of frontal walls, architectural and economic unit densities. A next stage in our research is to
examine distributions of variables “from within” these sets – say, within the collection of buildings with
commercial activities facing the street. The study of combinations of variables may reveal complexes of
associated features that could be closer to urban vitality. We search more than incidental effects possibly
related to combinations of spatial features, perhaps as latent causalities only emergent through chains of
associations and contexts as complexes of urban entities and properties. That would be a step towards the
identification of “strings of partial causality” in the web of contingency and dissonance: answers to
questions like why certain spatialities seem frequently associated with certain local social dynamics, a form
of feedback more likely to be active in certain combinations than others.
This work also intended to explore methodological possibilities in modelling urban processes in a way to
isolate specific patterns and features, and support the diagnosis of problems in urban performance
concerned with buildings, i.e. the relation between urban processes and architectural form, or what types
are more efficient in supporting the diversity of activities and uses of public spaces, supporting pedestrian
movement and reducing car‐dependence in cities – key issues in the urban sustainability debate.
There are severe implications that would follow a study along these lines in relation to the observation of
current trends in cities in Brazil and elsewhere, where types of architecture unrelated to the openness of
urban life become dominating over the fabric that holds the connections of our actions together through
encounter and communication. Whole areas in our cities become less and less walkable due to difficulties
imposed by growing distances and the progressive disappearance of local activities that support daily life.
Perhaps blinded by the visuality of architecture, architects and planners have unconsciously reproduced
Proceedings: Eighth International Space Syntax Symposium Santiago, PUC, 2012
31
spatially the perverse social logic of prejudice and fear while ignoring the systemic effects of architecture.
We are concerned with forms of architecture responsible to their built environment and the public realm –
beyond visuality, and aware of the vitality of their own presence in urban space and role in social life.
ACKNOWLEDGMENTS
We would like to thank Renato Remiro, our most reliable research assistant; Hetecliphe Neto, Nathalia
Gonçalves, Luisa Seixas, Paula Moreira, Taiana Milward, Thiago da Costa and Samuel Jachetti –
undergraduate students from Universidade Federal Fluminense (UFF) and dedicated observers in our
empirical study.
We thank CNPq for supporting this research, and Romulo Krafta for our sustained debate. Finally, we thank
Larissa Suguri, Vinicius Philot, Bruno Hoelz, Felipe Nascimento, João Folie, Marina Paganotti, Daniela
Manfredi, Tainá Canivelo, Andreia Henrique, Carolina Targino, Michelle Torres, Francisco Meyer, Julia
Benayon, Lais Valente, Elenice Lessa, Guilherme Siqueira, Ana Carolina Menescal, Mercedes Leal, Joana
Ferreira, Lucas Faulhaber, Clara Buckley, Leonardo David, Camila Cardoso and Rafael Alves, undergraduate
students who took part in a pilot study in 2010, part of a course in UFF.
This work is dedicated to Bill Hillier.
REFERENCES
Hillier, B. (2001) “A theory of the city as an object” in Proceedings of III International Space Syntax
Symposium (GeorgiaTech Press, Atlanta).
Hillier, B. and Iida, S. (2005) Network effects and psychological effects: a theory of urban movement. In
Proceedings of 5th International Space Syntax Symposium Delft: TU Delft, Faculty of Architecture.
Hillier, B. and Netto, V.M. (2002) Society seen through the prism of space: outline of a theory of society and
space. Urban Design International, 7, 181‐203.
Hillier, B. and Hanson, J. (1984) The social logic of space. Cambridge: Cambridge University Press.
Hillier, B. (1996) Space is the machine. London: Cambridge University Press.
Hillier, B., Penn, A., Hanson, J., Grajewski, T., & Xu, J. (1993) Natural movement: or, configuration and
attraction in urban pedestrian movement. Environment and Planning B: Planning and Design, 20, 29‐66.
Jacobs, J. (1961) Death and Life of the Great American City. New York: Random House.
Krugman, P. (1991) Geography and Trade. MIT Press, Cambridge MA.
Spinelli, J. and Krafta R. (1998) Configuração espacial e distribuição do valor do solo urbano. In: Cadernos
IPPUR, ano XII, n. 2, Rio de Janeiro, p.83‐104.
Krafta, R., Netto, V.M. and Lima, L. (2011) Urban built form grows critical. Cybergeo: European Journal of
Geography. http://cybergeo.revues.org/24787; DOI : 10.4000/cybergeo.24787
Proceedings: Eighth International Space Syntax Symposium Santiago, PUC, 2012
32
Krafta, R. (1994) Modelling intraurban configurational development. Environment and Planning B: Planning
and Design, 21, 67‐82.
Martin, L. (2000) The grid as generator. Architectural Research Quarterly, 4, 309‐322.
Penn, A., Hillier, B., Banister, D., and Xu, J. (1998) Configurational modelling of urban movement networks.
Environment and Planning B: Planning and Design, 25, 59‐84.
Wheaton W 1982 “Urban spatial development with durable but replaceable capital” Journal of Urban
Economics 12 53–67.
Copyright © 2022 FDOKUMEN