Smoothness of the law of manifold-valued Markov ... - Project Euclid
Upload
independentCategory
view
0download
0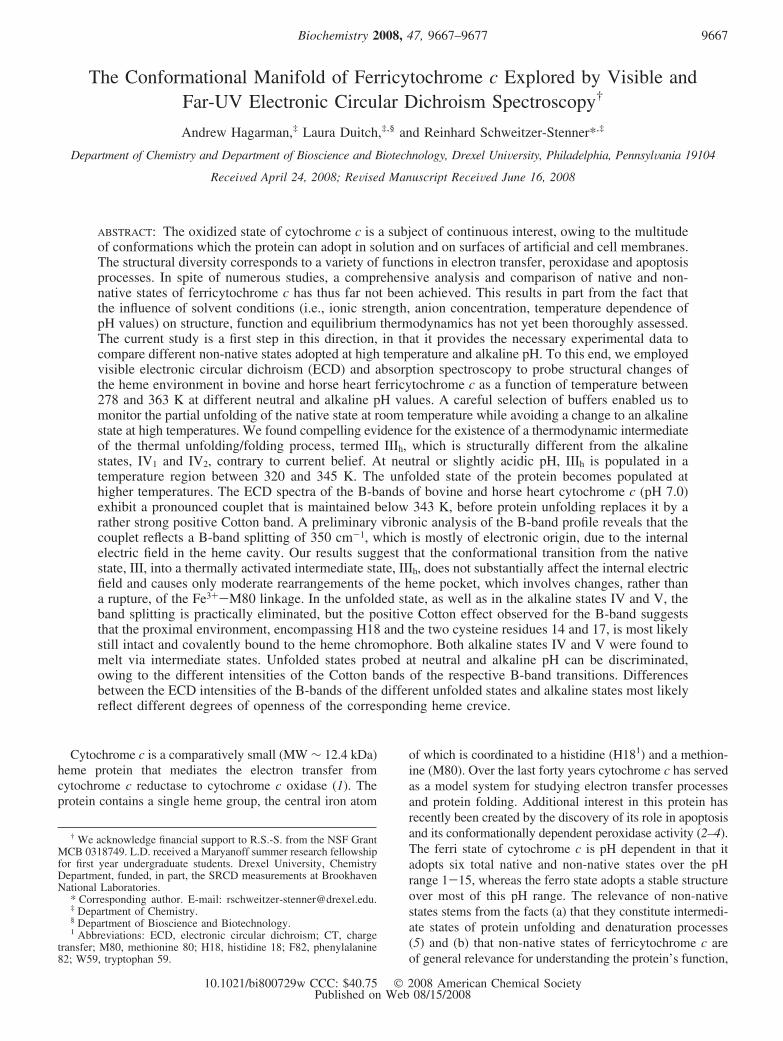
The Conformational Manifold of Ferricytochrome c Explored by Visible andFar-UV Electronic Circular Dichroism Spectroscopy†
Andrew Hagarman,‡ Laura Duitch,‡,§ and Reinhard Schweitzer-Stenner*,‡
Department of Chemistry and Department of Bioscience and Biotechnology, Drexel UniVersity, Philadelphia, PennsylVania 19104
ReceiVed April 24, 2008; ReVised Manuscript ReceiVed June 16, 2008
ABSTRACT: The oxidized state of cytochrome c is a subject of continuous interest, owing to the multitudeof conformations which the protein can adopt in solution and on surfaces of artificial and cell membranes.The structural diversity corresponds to a variety of functions in electron transfer, peroxidase and apoptosisprocesses. In spite of numerous studies, a comprehensive analysis and comparison of native and non-native states of ferricytochrome c has thus far not been achieved. This results in part from the fact thatthe influence of solvent conditions (i.e., ionic strength, anion concentration, temperature dependence ofpH values) on structure, function and equilibrium thermodynamics has not yet been thoroughly assessed.The current study is a first step in this direction, in that it provides the necessary experimental data tocompare different non-native states adopted at high temperature and alkaline pH. To this end, we employedvisible electronic circular dichroism (ECD) and absorption spectroscopy to probe structural changes ofthe heme environment in bovine and horse heart ferricytochrome c as a function of temperature between278 and 363 K at different neutral and alkaline pH values. A careful selection of buffers enabled us tomonitor the partial unfolding of the native state at room temperature while avoiding a change to an alkalinestate at high temperatures. We found compelling evidence for the existence of a thermodynamic intermediateof the thermal unfolding/folding process, termed IIIh, which is structurally different from the alkalinestates, IV1 and IV2, contrary to current belief. At neutral or slightly acidic pH, IIIh is populated in atemperature region between 320 and 345 K. The unfolded state of the protein becomes populated athigher temperatures. The ECD spectra of the B-bands of bovine and horse heart cytochrome c (pH 7.0)exhibit a pronounced couplet that is maintained below 343 K, before protein unfolding replaces it by arather strong positive Cotton band. A preliminary vibronic analysis of the B-band profile reveals that thecouplet reflects a B-band splitting of 350 cm-1, which is mostly of electronic origin, due to the internalelectric field in the heme cavity. Our results suggest that the conformational transition from the nativestate, III, into a thermally activated intermediate state, IIIh, does not substantially affect the internal electricfield and causes only moderate rearrangements of the heme pocket, which involves changes, rather thana rupture, of the Fe3+-M80 linkage. In the unfolded state, as well as in the alkaline states IV and V, theband splitting is practically eliminated, but the positive Cotton effect observed for the B-band suggeststhat the proximal environment, encompassing H18 and the two cysteine residues 14 and 17, is most likelystill intact and covalently bound to the heme chromophore. Both alkaline states IV and V were found tomelt via intermediate states. Unfolded states probed at neutral and alkaline pH can be discriminated,owing to the different intensities of the Cotton bands of the respective B-band transitions. Differencesbetween the ECD intensities of the B-bands of the different unfolded states and alkaline states most likelyreflect different degrees of openness of the corresponding heme crevice.
Cytochrome c is a comparatively small (MW ∼ 12.4 kDa)heme protein that mediates the electron transfer fromcytochrome c reductase to cytochrome c oxidase (1). Theprotein contains a single heme group, the central iron atom
of which is coordinated to a histidine (H181) and a methion-ine (M80). Over the last forty years cytochrome c has servedas a model system for studying electron transfer processesand protein folding. Additional interest in this protein hasrecently been created by the discovery of its role in apoptosisand its conformationally dependent peroxidase activity (2–4).The ferri state of cytochrome c is pH dependent in that itadopts six total native and non-native states over the pHrange 1-15, whereas the ferro state adopts a stable structureover most of this pH range. The relevance of non-nativestates stems from the facts (a) that they constitute intermedi-ate states of protein unfolding and denaturation processes(5) and (b) that non-native states of ferricytochrome c areof general relevance for understanding the protein’s function,
† We acknowledge financial support to R.S.-S. from the NSF GrantMCB 0318749. L.D. received a Maryanoff summer research fellowshipfor first year undergraduate students. Drexel University, ChemistryDepartment, funded, in part, the SRCD measurements at BrookhavenNational Laboratories.
* Corresponding author. E-mail: [email protected].‡ Department of Chemistry.§ Department of Bioscience and Biotechnology.1 Abbreviations: ECD, electronic circular dichroism; CT, charge
transfer; M80, methionine 80; H18, histidine 18; F82, phenylalanine82; W59, tryptophan 59.
Biochemistry 2008, 47, 9667–9677 9667
10.1021/bi800729w CCC: $40.75 2008 American Chemical SocietyPublished on Web 08/15/2008
because they, rather than the so-called native state, seem toresemble conformations adopted in electron transfer pro-cesses, peroxidase activity and apoptosis (6). The native state,referred to as state III, is adopted at neutral pH. At moreacidic pH values (pH 2-4) state II is populated, constitutinga partially folded protein structure (7). At even lower pHvalues (pH < 2) an unfolded state, termed state I, is adoptedby the protein at low ionic strength, whereas anion bindingcan switch it back to a molten globule-like state (8). A well-documented alkaline transition into states IV1 and IV2 occursaround pH 9-11, which has been studied quite extensivelyfor yeast cytochrome c. Mauk, Hildebrand and co-workersdiscovered that state IV comprises two substates withdifferent lysines (K73 and K79) as axial ligands and differenteffective pK-values for the corresponding alkaline transitions(9, 10). This alkaline transition is generally thought to createa more open heme crevice. In each substate the respectivelysine replaces the axial M80 ligand. Optical spectroscopyinvestigations of Blouin et al. indicate that the situation iseven more complicated for horse heart cytochrome c, forwhich these authors found evidence for the existence ofanother alkaline conformer which is separated from IV1 andIV2 by a rather high energy barrier (11).
With respect to complexes of cytochrome c with cyto-chrome c oxidase, another state, V, which is adopted at pHvalues above 11.0, seems to be relevant as well (12). In thisstate the lysine ligand of the heme iron is thought to bereplaced by hydroxide, but a final identification of the sixthligand has not yet been accomplished. The state is generallyconsidered to be mostly molten globule with an intactsecondary and a perturbed tertiary structure. Whether adenatured molten globule state adopted at more alkaline pHvalues is different from V has to be clarified (13).
The thermal stability of the oxidized and reduced statesof cytochrome c is also vastly different. While the thermalunfolding of ferrocytochrome c generally requires temper-atures above 100 °C (373 K) (14), the native state III offerricytochrome c starts the unfolding process at considerablylower temperatures (40 °C (313 K) to 70 °C (343 K).Generally, the unfolding of ferricytochrome c involves thepopulation of a thermodynamic intermediate IIIh above 50°C (323 K) and the subsequent unfolding into the state Uabove 70 °C (343 K) (15). The III f IIIh transition isgenerally probed by the 695 nm charge transfer band, whichdisappears or is considerably weaker in IIIh (16). Based onthe 1H and 13C NMR spectra of oxidized horse heartcytochrome c, Taler et al. argued that M80 is replaced byanother amino acid residue in IIIh (5). The authors concludedthat IIIh is identical with the aforementioned alkaline stateIV populated between pH 9.0 and 11.0 at room temperature(17). Both the thermal and the alkaline transition cause asubstantial decrease of the redox potential (18). Taler et al.rationalized the identity of states IIIh and IV as being causedby a drastic decrease of the effective pK-value of the alkalinetransition, which allows a population of the alkaline state atneutral pH and high temperatures (5). The downshift of theapparent pK-value has indeed been observed in severalthermodynamic and electrochemical experiments (18, 19).However, several lines of yet not fully appreciated evidenceargue against the identity of IIIh and IV. First, Battistuzzi etal. showed that the van’t Hoff plot of the apparent pK-valueof the alkaline transition is biphasic, which these authors
interpreted as indicative of the existence of a neutral hightemperature state which is identical neither with the alkalinenor with the native state (19). Recently, Schweitzer-Stenneret al. showed that the 695 nm absorption and the corre-sponding circular dichroism band of horse heart ferricyto-chrome c decrease above 50 °C (323 K) at pH 6 and 7 (20).The transition temperatures of the respective III f IIIh
transitions at these pH values are practically identical. If IIIh
was indeed identical with IV, the transition between themshould not be detectable in the temperature range between0° (273 K) and 60 °C (333 K) at pH 6. In view of thesecontradictions it is desirable to reinvestigate the identity ofstate IIIh.
While numerous studies have been performed to explorethermodynamics and electrochemistry of the above confor-mational transitions (5, 9, 11, 18, 19), information about thestructural properties of the involved non-native states islimited. Where optical and resonance Raman spectra indicatethat the low-spin state of the heme iron is maintained in bothIIIh and IV (9), it is unclear to what extent the correspondingconformational transitions change functionally relevantheme-protein interactions and the structure of the hememacrocycle. Concomitant changes of the secondary structureare indicated by far-UV electronic circular dichroism (ECD)spectra and by FTIR data for III f IIIh (21), but theirquantitative assessment and specific assignment to distinctregions of the protein have not yet been achieved.
The current study was guided by the hypothesis that thethermally excited intermediate state, IIIh, is thermodynami-cally and structurally distinct from the frequently investigatedalkaline states, IV1 and IV2, contrary to the conclusions drawnby Taler et al. (5). The examination of this hypothesis wasembedded into a general spectroscopic investigation of non-native ferricytochrome c conformations adopted at neutraland alkaline pH. To this end we utilized visible and, to alimited extent, far-UV electronic circular dichroism (ECD)spectroscopy. While visible ECD has been frequently usedto monitor structural changes of the heme group in a varietyof cytochrome c derivatives (21–25), the structural andphysical interpretation of the observed spectra and theirrespective changes remain speculative, owing to a lack ofquantitative analysis. Woody and associates provided aphysical picture of the origin of heme circular dichroism,namely, interactions between the electronic transitions of theheme and the protein environment (26). In this context,dipolar coupling between the heme group and adjacentaromatic side chains are of particular relevance. A study fromthis group also showed that nonplanar deformations cansubstantially modulate the ECD spectrum of the Soret (B)band (27). Only recently, Dragomir et al. showed that B-and Q-band CD spectra of both ferri- and ferrocytochromec are diagnostic of band splitting, which arises fromelectronic and vibronic perturbations of the heme group (28).A similar discovery has been made for deoxymyoglobin andMbCN (29). These findings prompted us to combine visibleECD and absorption spectroscopy to probe heme-proteininteractions in bovine heart cytochrome c (bhc) as a functionof temperature between 278 and 363 K for different pHvalues between 7.0 and 11.5. Bovine cytochrome c has beenselected because compared with horse heart and particularlyyeast cytochrome c is less prone to aggregation at very hightemperatures. However, some experiments were also carried
9668 Biochemistry, Vol. 47, No. 36, 2008 Hagarman et al.

out with horse heart cytochrome c (hhc) for a mutualconfirmation of the obtained results and for checking whethersmall structural differences are caused by the substitutionsS(47) f T, G(60) f K and G(89) f T (30). The set ofspectra obtained in our study allows a comparison of thestates III, IIIh, IV and V. Moreover, the spectra allow for usto check for the existence of thermally populated intermediatestates for states IV and V. Our experimental data enable usto compare heme-protein interactions in the folding/unfold-ing intermediate IIIh, in the alkaline states IV and V and inthe thermally unfolded state (U) which the protein adoptsabove 70 °C (343 K). At neutral pH, concomitant changesof the secondary structure associated with the III f IIIh
transitions were probed by far UV-ECD measurements. Arepresentative set of the obtained spectra were analyzed interms of a recently developed vibronic coupling model (29).The results of this analysis yielded the electronic perturba-tions of the excited B-state in the investigated states. Weargue that these perturbations result predominantly from aStark effect, owing to the internal electric field at theheme (29, 31).
MATERIAL AND METHODS
Materials. Cytochrome c from bovine heart and horse heartwas purchased from Sigma-Aldrich (St. Louis, MO) anddissolved (a) in a 0.1 M Tris ·HCl (Trizma) buffer (pH 7.2,I ) 0.1 M), from Sigma-Aldrich (St. Louis, MO) and (b) ina 1 mM MOPS (3-(N-morpholino)propanesulfonic acid)buffer (pH 7 and 8.5, I ) 0.001 M), from Sigma-Aldrich(St. Louis, MO). An alkaline solution was obtained with a50 mM Bis/Tris buffer (pH 9.6) titrated with small amountsof 0.1 M NaOH solution to achieve pH values of 10.5 and11.5. Complete oxidation was achieved by adding a smallamount of potassium ferricyanide obtained from FisherScientific (Pittsburgh, PA) to the sample. Subsequently, theexcess oxidant was removed from the sample by dialysisagainst the respective buffer solution.
CD Measurements. We prepared 50 µM protein solutionsfor visible ECD and absorption measurements. The B-bandspectra were measured as a function of temperature in digitalform with a J-810 spectrapolarimeter (Jasco Inc.), in thespectral region from 350 to 550 nm. Far-UV ECD spectrawere measured in the spectral region from 185-240 nm witha protein concentration of 0.5 mM in Tris HCl buffer,measured with the same instrument and the followingparameters. The temperature was controlled by a Peltierheating/cooling system from 5°-90 °C ((0.1 °C) (278-363K). Between ten and twenty accumulations were averagedusing a 5 nm bandwidth, a 500 nm/min scanning speed, anda 0.1 or 0.5 nm data pitch. Additionally, a backgroundsubtraction was carried out for all the spectra using similarparameters. A 1.0 mm quartz cell (Helma) was used for allmeasurements. The pH was measured before and after eachmeasurement.
Synchrotron radiation circular dichroism (SRCD) mea-surements were performed at Brookhaven National Labo-ratories. Beamline U11 was used to measure the SRCDspectra in the spectral region from 170-260 nm of horseand bovine heart cytochrome c. The proteins were dissolvedin 0.1 M TrisHCl buffer at a concentration of 6 mg/mL (∼0.5mM). Three accumulations were averaged at each indicated
temperature, controlled by a Peltier heating/cooling system,with similar parameters used for the background subtraction.
RESULTS
This section of the paper is organized as follows. First,we introduce a protocol which enables us to unambiguouslydiscriminate, thermodynamically, between the states IIIh andIV. Second, we detail temperature dependent far-UV ECDspectra to elucidate the secondary structure of IIIh. Next, weanalyze representative ECD and absorption spectra by meansof a recently developed algorithm to estimate the splittingof the B-band, owing to electronic and vibronic perturbations(29). Finally, we characterize differences between alkalinestates as well as thermally populated intermediate states. Inwhat follows we do not discriminate between the substatesIV1 and IV2 and V1 and V2 discovered by Dopner et al. (9).
Thermal Unfolding of the NatiVe State III. To separatethe thermal unfolding of the native state from the alkalineIIIf IV transition, we had to select experimental conditionswhich allow the protein to sample the native state at ambienttemperatures and avoid a detectable population of the alkalinestate at high temperatures. To this end, we used a 0.1 MTris HCl buffer to ensure that the aforementioned require-ments were met. The pH value of this buffer decreases by0.03 pH units per °C increase of temperature. The pH ofthis buffer was 7.6 at the lowest temperature (278 K). Withrising temperature, the pH decreased to reach 6.3 at 333 Kand 5.6 at 363 K. This downshift of the pH value iscomparable with the temperature dependence of the effectivepK value of the IIIf IV transition, for which Battistuzzi etal. obtained 9.4 at 278 K and 7.9 at 340 K for the ionicstrength of 0.1 M used in our experiment (18, 19). Thus, wekept the “distance” between the actual pH value of ourexperiment and the pK value of the III f IV transitionapproximately constant, so that a detectable occupation ofstate IV at high temperatures can be ruled out. Figure 1exhibits the corresponding ECD and absorption spectra ofbhc and hhc in the aforementioned buffer measured asfunction of temperature between 278 K and 363 K inincrements of 5 K. The rather high ionic strength, whichensures the binding of 2 (3) Cl- ions to the surface of bhc(hhc) (18), resembles the conditions frequently used forexploring the temperature dependence of ferricytochromec (15, 16, 30, 32). The ECD spectra display a pronounced,slightly negatively biased couplet at room temperature, whichgradually changes into a more symmetric couplet withincreasing temperature between 278 and 338 K. The insetsof Figures 1B and 1D display the respective extinction value,εmax, at the peak position as a function of temperature. εmax
decreases with rising temperatures between 278 and 333 Kand subsequently increases between 343 and 363 K. Thissecond phase additionally involves a blueshift of the absorp-tion spectrum. At higher temperatures the CD coupletdisappears and is replaced by a slightly blueshifted, positiveCotton band. The temperature dependence of the ∆ε valuesat the maximum (∆εmax), central (∆εcent) and minimum(∆εmin) position of the couplet are displayed in Figure 2. Asexpected, corresponding values of hhc and bhc are verysimilar, but hhc systematically exhibits slightly more negativevalues at the minimum and the central position of the coupletbetween 278 and 343 K. Interestingly, the three ∆ε values
Conformational Manifold of Ferricytochrome c Biochemistry, Vol. 47, No. 36, 2008 9669

show different temperature dependences. ∆εmin increases and∆εmax decreases with rising temperature below 343 K, whichyields the more symmetric couplet at higher temperatures.All values sharply increase above 343 K, reflecting thecooperativity of the unfolding process. Thus, our data suggesta similar melting temperature for both proteins, but the slopeof ∆ε(T) is clearly steeper for hhc, indicating a higher degreeof cooperativity. This result seems to be at variance withresults from recent IR spectroscopic investigations of thethermal unfolding of horse heart and bovine ferricytochromec, which suggest different unfolding mechanisms for the twoproteins (30). For horse heart cytochrome c, Filosa et al.proposed a sequential unfolding of protein domains (inagreement with work from the Englander group (33)),whereas the data for bovine cytochrome c were interpretedas indicating a more global, cooperative unfolding (15, 30, 32).However, our data are likely to reflect the specific secondaryand tertiary structure of the heme environment rather thanglobal changes of the protein.
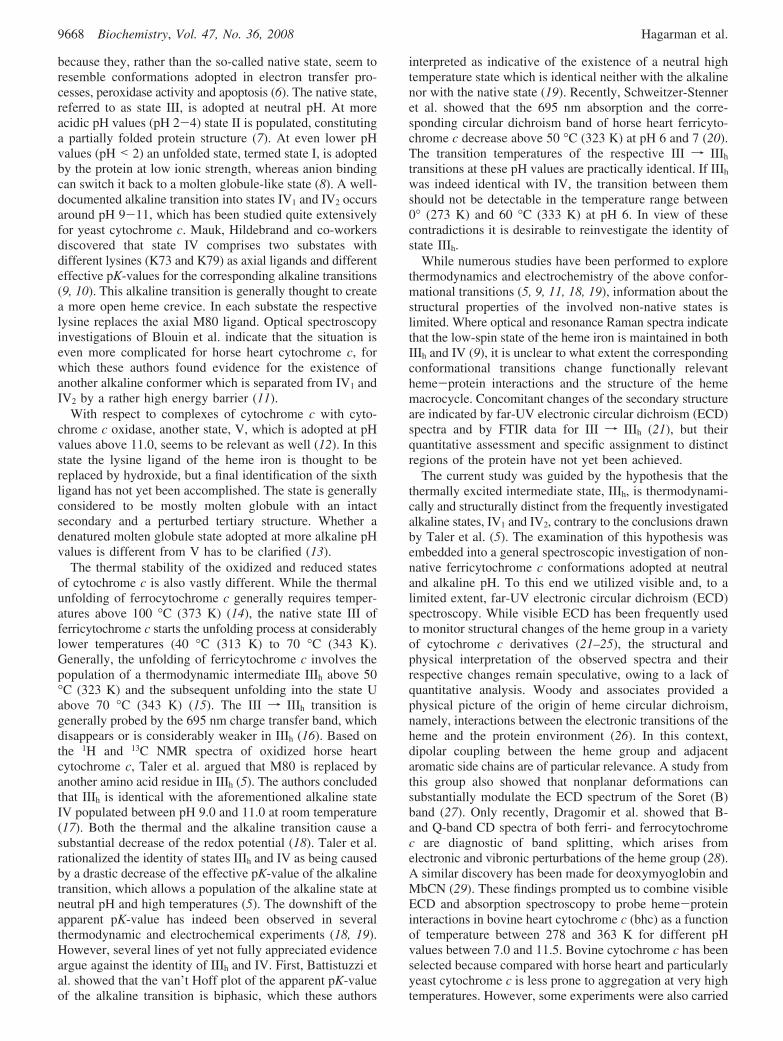
The data in Figures 1 and 2 indicate only modest spectral(and thus also structural) changes in the temperature regionbetween 320 and 340 K, with which the thermal intermediate,IIIh, is generally associated. However, the temperaturedependencies of ε and ∆ε values exhibited in Figures 1 and2, respectively, clearly indicate the population of an inter-mediate in the temperature region where IIIh is generallypopulated. To check whether this state really resembles thewell-known characteristics of the IIIh state, we also measuredthe temperature dependence of absorption and ECD profileof the charge transfer band at 695 nm between 278 and 348K, which are exhibited in Figure 3. The data clearly revealthe decrease of this band’s intensity above 310 K (Figure 3inset) as first observed by Schejter and George (16), which
is generally viewed as characteristic for a IIIf IIIh transition.Altogether, these findings suggest that IIIh is thermodynami-cally distinct from state IV, since the latter cannot besignificantly populated at the chosen experimental conditions.
Most of the investigations of the IIIf IIIh transition havethus far been performed at neutral pH with a temperature-dependent buffer (5, 15, 30, 32). The question arises whetherstate IIIh or IV is populated at higher temperatures, if atemperature-independent buffer with a low ionic strength isused. To address this issue, we measured the ECD andabsorption spectra of the B-band in a buffer that remainedat (nearly) constant pH as a function of temperature. Thisexperiment was achieved by using a 1 mM MOPS (3-(N-morpholino)propanesulfonic acid) buffer. This buffer has atemperature coefficient of -1.3 × 10⁻³ pH units per °C. Thelow ionic strength of the corresponding solution ensured arather low effective pK-value of the alkaline transition (∼9at room temperature and 8 in IIIh region). The correspondingspectra are shown in Figure S1, Supporting Information.Apparently, the ECD spectrum and its temperature depen-dence are qualitatively very similar to what we obtained byusing a Tris HCl buffer to decrease the pH while increasingthe temperature. This notion is corroborated by the respective∆ε(T) plots in Figure 4. Quantitatively, the two sets of spectra(Figures 1, left side, and Figure S1) differ slightly, whichcan be attributed to the anion concentrations used for thetwo experiments (34). Our data thus far indicate that the non-native states populated at pH 7 and 6 in the IIIh temperatureregion are identical.
An earlier attempt to probe the thermal transitions ofoxidized horse heart cytochrome c by ECD deserves to bementioned in this context. Myer reported a change of Soretband ellipticity to occur at 313 K, which is not reproduced
FIGURE 1: Visible circular dichroism (A and C) and absorption (B and D) spectra of bovine (left column) and horse heart ferricytochromec (right column) taken at pH 7 in a Tris HCl buffer between 278 and 363 K in increments of 5 K. The arrows in these and all subsequentfigures indicate the spectral changes with increasing temperature. The solid vertical line indicates maximum absorption frequency positionat low temperature and dotted line indicates maximum absorption frequency at high temperature. Inset: ε vs temperature at the maximumabsorption frequency. Spectra taken at temperatures between 278 and 348 K are plotted as solid lines; spectra taken at 353, 358 and 363K are plotted as dotted, dashed, dashed-dotted line.
9670 Biochemistry, Vol. 47, No. 36, 2008 Hagarman et al.
by any of our data (neither for bovine nor for horse heart)(21). An inspection of his visible ECD spectra shows adisappearance of the couplet already at 333 K. An explana-tion for the observed data was not provided. We have noexplanation for this discrepancy, but it should be noted thatMyer did not use a buffer for his protein solution.
Secondary Structure Analysis of IIIh by UV-ECD Mea-surements. We used far-UV ECD spectroscopy to probesecondary structure changes associated with the transitionbetween different III-states. Far UV-ECD spectra recordedin the temperature range used for the visible-ECD measure-ments are consistent with the two melting phases reportedfor horse heart ferricytochrome c by Myer (21). Figure 5shows the ∆ε value of bhc measured at 218 nm (44964 cm-1)in 0.1 M Tris HCl buffer as a function of temperature. Theonset of the first phase is at 323 K, while the second onestarts at 343 K. The first phase can be assigned to the III fIIIh transition and the second one to the melting of most ofthe secondary structure. These data add further support to
the notion that the III f IIIh transition takes place at pHvalues well below the pK value of the alkaline transition.
To quantitatively probe secondary structure changes as-sociated with the III f IIIh transition we performed far-UVECD experiments using the synchrotron radiation (SR) sourceat Brookhaven National Laboratories. Thus, we obtainedECD spectra in a wavelength range between 170 and 260nm, which allow for a more reliable secondary structureanalysis than ECD spectra taken with a conventional instru-ment. SRCD spectra were taken at 296 K and 345 K (Figure6). The spectra were processed with the spectral processingprogram CDTools (35) and analyzed with the secondarystructure from circular dichroism spectroscopic data program,Dichroweb (36, 37), using the program ContinLL andreference set 1. This analysis yielded approximately a 15%loss of R-helical content, redistributed to mostly extendedand to a minor extent turn and unordered structures at 345K (state IIIh) compared with 296 K (III). Hence, state IIIh ispartially unfolded rather than a classical molten globule state.
Interpretation of Visible ECD and Absorption Spectra. Amore thorough understanding of the above-reported ECDspectra requires a comparison with the respective absorptionspectra. The spectra in Figures 1 and 4 reveal that the peak ofB-band absorption is situated between the couplet extrema attemperatures below 343 K. At higher temperatures, however,the peak coincides with the maximum of the Cotton band. Thisresult indicates that the B-band is split into its Bx and By
components below 343 K, owing to electronic and vibronicperturbations imposed by the protein environment (28, 29).
We used a recently developed vibronic coupling model(29) to simulate three ECD spectra of bovine cytochrome c(in Tris HCl buffer), recorded at 278, 338 (data not shown)
FIGURE 2: ∆ε vs temperature of bovine heart (open circles) andhorse heart (closed circles) ferricytochrome c between 278 and 363K measured in pH 7 Tris HCl buffer. The upper panel is at 24010cm-1, the middle is at 24450 cm-1, and the lower is at 24876 cm-1,corresponding to the minimum, the center and the maximumposition of the B-band couplet at room temperature. The temperatureregimes of the three states III, IIIh and U (unfolded) are indicated.
FIGURE 3: Temperature-dependent ECD (top) and absorption(bottom) spectra of bovine heart cytochrome c measured in thecharge-transfer band region from 13000 to 16000 cm-1. The spectrawere measured in a pH 7 Tris HCl buffer with a 5 mMconcentration. Inset: ε vs temperature at the maximum absorptionfrequency.
Conformational Manifold of Ferricytochrome c Biochemistry, Vol. 47, No. 36, 2008 9671

and 363 K (simulations shown in Figure 7). Since theoxidation marker band ν4 dominates the resonance Ramanspectrum for excitations of the B-band region (data notshown), we considered only the contribution of this modeto the vibronic sideband. This model is a simplification, butit is sufficient for exploring the amount of splitting. Thegeneral theory of the model is described in ref 29, so weconfine ourselves here to presenting the most relevantequations and some modifications. If one neglects couplingbetween |Bx⟩ and |By⟩ states, the energy eigenvalues associ-ated with the 0 f 0 transition are written as
El,0B′ )El,0
B -∑Γ″
[cBlBl
Γ′′ (ν4)]2
Ων4
B(1)
where El,0B′ (l ) x, y) denotes the eigenenergies of the
vibronically and electronically perturbed B-state and El,0B are
the energies of the electronically perturbed states |Bl,0⟩. Ων4B
denotes the vibrational energies of the ν4 vibration in the excited
B-states. The parameter ce,sΓ′′(ν4) (e, s ) Bl) denotes the
corresponding vibronic coupling matrix element. Γ′ is theeffective symmetry of the respective vibration in the pres-ence of symmetry lowering perturbations. The second term onthe right of eq 1 describes the contribution from intrastateFranck-Condon (A1g) and Jahn-Teller (B1g, B2g) couplingassociated with the ν4 mode, which is totally symmetric in idealD4h. The pure electronic eigenenergies, Ex,0
B and Ey,0B are identical
in D4h, but are split in a protein environment. The total electronicsplitting of the B0 is written as (38)
∆EB )∆Stark +2δQB
A1gδQBB1g
EB0 -EQ0(2)
FIGURE 4: ∆ε vs temperature of bovine heart pH 7.0 (closed squares)and bovine heart pH 8.5 (open squares) ferricytochrome c between278 and 363 K measured in MOPS buffer. The upper panel is at24010 cm-1, the middle is at 24450 cm-1, and the lower is at 24876cm-1, corresponding to the minimum, the center and the maximumposition of the B-band couplet at room temperature. The temperatureregimes of the three states III, IIIh and U (unfolded) are indicated.
FIGURE 5: ∆ε of bovine (closed circles) and horse heart (opencircles) ferricytochrome c as a function of temperature at 44964cm-1 in the far UV region with a pH 7 Tris HCl buffer.
FIGURE 6: Temperature-dependent far-UV SRCD spectra of bovine(top) and horse (bottom) heart ferricytochrome c. Solid line: 296K. Dotted line: 345 K.
9672 Biochemistry, Vol. 47, No. 36, 2008 Hagarman et al.

where δQBA1g and δQB
B1g describe electronic perturbations of A1g
and B1g symmetry. The latter is assigned to the quadrupolemoment of the internal electric field. These perturbationscause a mixing of Q- and B-states and an equal splitting oftheir energies. ∆Stark denotes the different shifts of Bx andBy, owing to a quadratic Stark effect, which mixes theground-state with both components of the excited B-state(31). Since the Stark splitting scales with the square of thecorresponding transition dipole moment, it is much largerfor the B- than for the Q-band. The electronic part of theQ-band splitting can be nearly exclusively assigned to theelectric field’s quadrupole moment (31, 39).
As mentioned above, the vibronic sideband Bv is modeledas mainly resulting from the vibronic coupling of ν4. This isa rather crude approximation of the vibronic sideband. Therespective transition dipole moments (electronic and mag-netic) πbl,1ν4
B are described by the equation:
πfl,1ν4
B )cBlBl
Γ″ (ν4)
Ων4
Bπfl,1ν4
B (3)
Figure 7 compares experimental data and simulation for thespectra recorded at 278 and 363 K. The simulation for the338 K spectra is of similar quality. This analysis yielded anidentical splitting of 360 cm-1 for 278 and 338 K (data notshown), whereas the splitting is practically zero for the 363K measurement. Interestingly, our splitting value is onlyslightly larger than what Manas et al. observed for the B-bandin the low temperature spectrum of Zn-substituted horse heartcytochrome c (296 cm-1) (40). Compared with the lowtemperature spectrum, the rotational strength values for Bx
and By at 338 K are reduced by factors of 0.81 and 0.76,respectively. At 363 K the amount of the total rotationalstrength is increased by a factor of 1.6 compared to thecorresponding value obtained for 338 K. The splitting mostlikely provides us with a lower limit for the electronic
perturbation energy, since vibronic perturbations, which arenot fully accounted for at the present level of analysis,generally reduce, rather than increase, the splitting (38).
Our experimental data suggest that the B-state electric fieldstrength in the heme plane is not significantly changed bythe III f IIIh transition. The concomitant decrease of therotational strength for Bx and By might reflect a reduction ofout-of-plane deformations, which have been shown to causesubstantial rotational strength of opposite sign for bothB-band transitions (41). Additionally, invoked orientationalchanges of aromatic residues in the heme pocket (e.g., F82)certainly contribute to the rotational strength (26). Specificsite-directed mutations experiments are necessary to clarifythis issue. A final assessment of the B-band’s Stark effecthas recently been made by virtue of a full vibronic analysisof the Q- and the B-band splitting of ferri- and ferrocyto-chrome c (42).
The absence of any detectable splitting in the ECD spectraof bhc in the unfolded states and, as shown below, in statesIV and V seems to suggest an absence of a quadratic Starkeffect. This hypothesis is unlikely for a variety of reasons.First, our spectra indicate that the heme is still bound to theprotein in these states. It is therefore likely that the proteinstill produces an electric field in the heme plane. Moreover,a substantial decrease of the electric field would cause asignificant redshift of both Q- and B-band (31), which isnot observed. The absence of splitting can be rationalizedin terms of a compensation of vibronic and electronicperturbations, which generally have opposite signs for theQ-band. Alternatively, one may invoke larger protein fluc-tuations as giving rise to a distribution of different orienta-tions of the electric field with respect to the heme plane. Ifthis distribution is nearly symmetric with respect to one ofthe CmFeCm of the heme macrocycle, the effective electronicsplitting could be very small, even though the electric fieldis still rather strong (31, 42, 43).
FIGURE 7: Experimental (dots) and simulated (solid line) ECD (upper panel) and absorption spectra (lower panel) of bovine heartferricytochrome c. The experimental spectra were measured at the indicated temperatures.
Conformational Manifold of Ferricytochrome c Biochemistry, Vol. 47, No. 36, 2008 9673

It is necessary in this context to point out that theinterpretations of visible CD spectra of heme proteins areoften too simplistic. The absence of the B-band couplet inspectra of yeast-cytochrome c mutants, in which F82 isreplaced by another residue (44), cannot be interpreted asindicating that the negative component of the couplet arisesfrom coupling between the heme and the phenylalanine ring(45). On the contrary, since phenylalanine is aromatic andhydrophobic, its contribution to the internal field is verysmall. By the same token, it is incorrect to assign thesubstitution of a couplet by a single, positive Cotton bandto a disruption of the coupling between the heme group andaromatic acid residue in the heme pocket (46). For hemo-globin and myoglobin (26, 29), single positive Cotton bands,were measured for the respective intact molecules. Theabsence of a couplet in the B-band regions can have severalreasons. First, the band splitting is small and one component(x or y) has more rotational strength than the other one. Thisis most likely the case for the above-discussed thermallyunfolded state of cytochrome c. That this is possible has beenshown by Blauer et al. (41). Second, it is possible that onlyone of the two components carries substantial rotationalstrength. If the band is split, this can lead to a positive (ornegative) Cotton band, the wavenumber position of whichdoes not coincide with that of the respective absorption band.As recently shown, this is the case in deoxymyoglobin andmyoglobin cyanide (29).
Characterizing the Alkaline States. The results discussedthus far show that IIIh and IV are thermodynamically distinct.The III f IIIh transition state is generally associated withthe disappearance of the 695 nm band, which is interpretedas reflecting the rupture of the Fe3+-M80 bond (5, 16). Thisis certainly the case for state IV, but the data displayed inFigure 3 suggest a decrease of the 695 nm band’s oscillatorstrength rather than its disappearance in IIIh. This notion isstrongly corroborated by the still significant rotationalstrength of the band in the IIIh temperature region. Wetherefore infer that IIIh differs structurally from IV-states inthat the Fe3+-M80 bond, even though weakened, is stillpresent in the former. This notion is consistent with theabove-discussed similarity of the ECD spectra of III and IIIh.To explain possible structural differences, we measured thetemperature dependence of the B-band (ECD and absorption)of bhc at pH 8.5 and 10.5. The respective pH values wereadjusted by adding NaOH to a 1 mM MOPS buffer solutionfor the former and to a 50 mM Bis/Tris buffer solution forthe latter. Figure S2, Supporting Information, depicts thespectra measured at pH 8.5. The corresponding insets exhibitthe temperature dependence of εmax. The couplet observedat low temperatures converts to a positive Cotton band atsignificantly lower temperatures (333 K) than the coupletsobtained at neutral (Figure S1) and (slightly) acidic pH(Figure 1). Figure 8 compares the temperature dependenceof both ∆ε and the Kuhn anisotropy, measured at pH 8.5with the respective data recorded with solution exhibitingpH 7 at room temperature. The rather smooth temperaturedependencies of ∆ε and ∆ε/ε recorded at pH 8.5 stretch overthe entire temperature range investigated, thus indicating anoncooperative transition between a low and high temper-ature state, which, based on the respective ECD spectra,resemble IIIh and U. However, a two-state transition is ruledout by the absence of an isodichroic point and by the
corresponding nonmonotonous temperature-dependence ofεmax (inset Figure S2), which exhibits a pronounced minimumat 310 K. At this temperature the effective pK-value of thealkaline transition is nearly identical with the adjusted pHof 8.5 (19), so that the minimum coincides with the half-point of the III f IV transition. It should be noted that theCD spectra in Figure S2 bear some resemblance with theaforementioned spectra reported by Myer, which mightindicate that his actual pH was slightly basic (21).
More information about state(s) IV can be inferred fromthe ECD (and absorption) profiles measured at pH 10.5,which are exhibited in Figure S3, Supporting Information.At this pH the alkaline state(s) IV are predominantlypopulated even at room temperature. The corresponding ECDspectra already show a positive Cotton band in the Soretregion, which is quite distinct from the symmetric coupletobserved for the IIIh state. The rotational strength increaseswith increasing temperature while the absorption peakexhibits a redshift, in contrast to what was observed for theIIIh f U transition at neutral and modestly acidic pH. Thepositive Cotton band and its coincidence with the absorptionmaximum reflect again the drastically reduced splittingbetween the Bx and By bands. Figure 9 exhibits the corre-sponding temperature dependence of ∆εmax. Additionally, therespective Kuhn anisotropies (47), ∆ε/ε, are plotted in Figure9. While ∆εmax seems to be nearly temperature independentbetween 278 and 338 K within the experimental uncertainty
FIGURE 8: (Top) ∆ε vs temperature and (bottom) Kuhn anisotropy,∆ε/ε, vs temperature at the indicated frequency position of pH 7(tris buffer) bhc (open circles), pH 7 (MOPS buffer) bhc (closedcircles) and pH 8.5 (MOPS buffer) bhc (triangles), between 278and 363 K.
9674 Biochemistry, Vol. 47, No. 36, 2008 Hagarman et al.

(i.e., 6%), the Kuhn anisotropy exhibits a statisticallysignificant though small increase with rising temperature.Both ∆εmax and Kuhn anisotropy exhibit a steep increase withincreasing temperatures above 348 K. The data indicate theexistence of at least two thermal transitions, involving anintermediate IVh and a certainly unfolded state IVu. Appar-ently, the rotational strength is significantly larger at pH 10.5than at 8.5 and at lower pH values for the entire temperaturerange. This indicates that at pH 8.5 state IV still coexistswith other states (IIIh or some yet unidentified state) even athigh temperatures. The interpretation of the data at this pHis complicated by the possible coexistence of most likelythree alkaline isomers and also by the fact that the (lysine)protonation and the dissociation of M80 are thermodynami-cally distinct processes (11).
To gain a complete picture of the conformational manifoldsampled at alkaline pH we also measured the temperaturedependence of the ECD and absorption spectra of bhc at pH11.5. The alkaline state, V, can be expected to be populatedat room temperature at this pH (9). The ECD spectra inFigure S4, Supporting Information (pH 11.5), are qualita-tively similar to those obtained at pH 10.5 in that they startas a positive Cotton band as well and, like the spectra inFigure S3, increase with increasing temperature. However,the corresponding spectra (Figure S4) are quantitativelydifferent from that observed in Figure S3. The magnitudeof this difference can be seen by comparing plots in Figure
9, where the associated ∆εmax are plotted as a function oftemperature. The maximal dichroism of the Cotton bandrepresenting state IV is smaller than that of state V attemperatures above 320 K. The respective temperaturedependences of the εmax values are also significantly different.The maximal extinction decreases nearly monotonously withincreasing temperature for state IV (Figure S3). For state V,εmax first increases to reach a plateau at 330 K, from whereit decreases further to a minimum at 350 K. Upon increasingthe temperature further, εmax increases dramatically. On thecontrary, the Kuhn anisotropy increases already above 320K. It reaches a plateau at 340 K and increases only slightlyat higher temperatures. The data clearly indicate that themelting of state V involves at least two intermediates whichexhibit significantly different εmax and slightly different ∆εmax
values. The unfolded states of IV and V exhibit similar Kuhnanisotropies, but the rather different εmax and ∆εmax valuessuggest that this coincidence is accidental. It should be notedthat the population of the unfolded V state causes a dramaticupshift of the Soret band (Figure S4), which was notobserved for the unfolded state of IV (Figure S3).
For comparative purposes, Figure 10 depicts the differ-ences of the ECD and absorption spectra of bhc, which reflectthe aforementioned native and non-native conformations. Thelow-temperature spectra represent the states III-V. Spectrataken at the indicated intermediate temperature can at leastpartially be assigned to the corresponding thermal intermedi-ates, and the spectra taken at high temperature reflect thecorresponding unfolded state. At room temperature, the ECDspectra obtained in state III (pH 7 and 8.5) display coupletsin the Soret region with the peak extinctions situated in themiddle of the couplet. The higher pH measurements in statesIV (pH 10.5) and V (pH 11.5) display positive Cotton bandsat room temperature, though the intensity of the band in stateV is much larger than any of the other investigated states.At high temperature all of the ECD profiles turn into positiveCotton bands and become (nearly) coincident with theirrespective absorption profiles. However, in terms of absoluterotational strength, band shapes and absorptivity, the bandsassignable to the unfolded states of III, IV and V aredifferent, thus indicating that these states are not structurallyidentical in the vicinity of the heme group. In what followswe term these states IIIu, IVu and Vu.
We deduce the following minimal thermodynamic schemefrom our data:
The further characterization of the newly identifiedconformations is currently underway in our laboratory. Wewish to reiterate in this context that state IV, and to someextent also state III, encompasses conformational substateswith different axial ligands (for IV) (11) or differentFe3+-M80 bonding strengths (III) (20, 34).
FIGURE 9: (Top) ∆εmax vs temperature and (bottom) Kuhn anisot-ropy, ∆ε/ε, vs temperature at the indicated frequency position ofpH 10.5 (bis/tris buffer) bhc (closed circles) and pH 11.5 (bis/trisbuffer) bhc (open circles) between 278 and 363 K.
Conformational Manifold of Ferricytochrome c Biochemistry, Vol. 47, No. 36, 2008 9675

One would naively expect that the rotational strength of aheme band decreases upon thermal unfolding. Our dataindicate, however, that not only ∆εmax but also the integratedrotational strength increases, as does the Kuhn anisotropy.Since ∆ε/ε ∝ mbB · cos(µbB,mbB)/µb′B), with mbB as the magneticand µb′B as the electronic matrix element of the transitioninto the B-states, our data are indicative of a substantialincrease of a magnetic dipole component in the heme plane.Since the latter arises from heme-protein interactions (26),our data thus indicate an increase of some electronic couplingbetween the heme and protein chromophores in non-nativestates, which contradicts the notion of reduced heme-proteincoupling in unfolded states.
SUMMARY
Taken together, this article demonstrates how visible ECDand absorption spectroscopy can be used to elucidatedifferences between native, non-native, thermally populatedintermediates and thermally unfolded states of ferricyto-chrome c by a spectral comparison with carefully definedparameters, i.e. buffer conditions and ionic strength. Theextent of band splitting caused by electrostatic interactionsbetween the heme group and the protein was determined bya vibronic analysis of the B-band’s ECD and absorptionspectrum. We demonstrated that the states IIIh and IV arethermodynamically and also conformationally different,contrary to the current belief. With respect to ferricytochromec our results suggest that the overall structure is maintainedin the intermediate state populated above 323 K. Confor-mational changes might involve increasing distances betweenthe heme and aromatic residues such as F82 and a reducednonplanarity of the heme macrocycle. The band splitting issubstantially reduced in the unfolded states, but the hemeenvironment encompassing H18 and the two cysteineresidues 14 and 17 is most likely still intact and covalentlybound to the heme chromophore. Most importantly, this work
exemplifies the need for a comprehensive thermodynamicanalysis of all native and non-native states of ferricytochromec under well-defined conditions which would explicitlyconsider the fact that not only the “ground state” populatedat room temperature but also the thermally excited, partiallyor mostly unfolded states are still pH dependent.
ACKNOWLEDGMENT
We would like to acknowledge John Trunk at BrookhavenNational Laboratories for his assistance recording the SRCDspectra.
SUPPORTING INFORMATION AVAILABLE
Figures S1-S4 exhibit ECD spectra measured at pH 7,8.5, 10.5 and 11.5. This material is available free of chargevia the Internet at http://pubs.acs.org.
REFERENCES
1. Moore, G. W., and Pettigrew, G. W. (1990) Cytochrome c 194eVolutionary, structural and physicochemical aspects, Springer,Berlin, Heidelberg, New York.
2. Liu, X., Kim, C. N., Yang, J., Jemmerson, R., and Wang, X. (1996)Induction of apoptotic program in cell-free extracts: requirementfor dATP and cytochrome c. Cell 86, 147–157.
3. Jemmerson, R., Liu, J., Hausauer, D., Lam, K-P., Mondino, A.,and Nelson, R. D. (1999) A conformational change in cytochromec of apoptotic and necrotic cells is detected by monoclonal antibodybinding and mimicked by association of the native antigen withsynthetic phospholipid vesicles. Biochemistry 38, 3599–3609.
4. Belikova, N. A., Vladimirov, Y. A., Osipov, A. N., Kapralov, A. A.,Tyurin, V. A., Potapovich, M. V., Basova, L. V., Peterson, J.,Kurnikov, I. V., and Kagan, V. E. (2006) Peroxidase activity andstructural transitions of cytochrome c bound to cardiolipin-containing membranes. Biochemistry 45, 4998–5009.
5. Taler, G., Schejter, A., Navon, G., Vig, I., and Margoliash, E.(1995) The nature of the thermal equilibrium affecting the ironcoordination of ferric cytochrome c. Biochemistry 34, 14209–14212.
6. Kluck, R. M., Ellerby, L. M., Ellerby, H. M., Naiem, S., Yaffe,M. P., Margoliash, E., Bredesen, D., Mauk, G., Sherman, F., and
FIGURE 10: ECD (top) and absorption (bottom) of all investigated pH measurements (pH 7 Tris HCl buffer, solid line; pH 7.0 MOPS buffer,dotted line; pH 8.5 MOPS buffer, short dashed line; pH 10.5 Bis/Tris buffer, dashed-dot-dot line; and pH 11.4 Bis/Tris buffer, long dashedline) of bovine heart cytochrome c at room temperature (left panels), intermediate temperature (middle panels) and high temperature (rightpanels). Exact temperatures are indicated in individual panels.
9676 Biochemistry, Vol. 47, No. 36, 2008 Hagarman et al.

Newmeyer, D. M. (2000) Determinants of cytochrome c pro-apoptotic activity. The role of lysine 72 trimethylation. J. Biol.Chem. 275, 16127–16133.
7. Dyson, H. J., and Beattie, J. K. (1982) Spin state and unfoldingequilibria of ferri-cytochrome c in acidic solution. J. Biol. Chem.257, 2267–2273.
8. Goto, Y., Takahashi, N., and Fink, A. L. (1990) Mechanism ofAcid-Induced Folding of Proteins. Biochemistry 29, 3480–3488.
9. Dopner, S., Hildebrandt, P., Rosell, F. I., and Mauk, A. G. (1998)The alkaline conformational transitions of ferricytochrome c studiedby resonance Raman spectroscopy. J. Am. Chem. Soc. 120, 11246–11255.
10. Rossel, F. I., Ferrer, J. C., and Mauk, A. G. (1998) Proton-linkedprotein conformational switching: definition of the alkaline con-formational transition of yeast iso-l-ferricytochrome c. J. Am. Chem.Soc. 120, 11234–11245.
11. Blouin, C., Guillemette, J. G., and Wallace, C. J. A. (2001)Resolving the individual components of a pH-induced conforma-tional change. Biophys. J. 81, 2331–2338.
12. Dopner, S., Hildebrandt, P., Rosell, F. I., Mauk, A. G., von Walter,M., Soulimane, T., and Buse, G. (1999) The structural andfunctional role of lysine residues in the binding domain ofcytochrome c for the redox process with cytochrome c oxidase.Eur. J. Biochem. 261, 379–391.
13. Kumar, R., Prabhu, N. P., Rao, D. K., and Bhuyan, A. K. (2006)The alkali molten globule state of horse ferricytochrome c:Observation of cold denaturation. J. Mol. Biol. 364, 483–495.
14. Sagle, L. B., Zimmermann, J., Dawson, P. E., and Romesberg,F. E. (2006) Direct and high resolution characterization ofcytochrome C equilibrium folding. J. Am. Chem. Soc. 128, 14232–14233.
15. Filosa, A., and English, A. M. (2000) Probing local thermalstabilities of bovine, horse, and tuna ferricytochromes c at pH 7.JBIC, J. Biol. Inorg. Chem. 4, 448–454.
16. Schejter, A., and George, P. (1964) The 695 mµ band offerricytochrome c and its relationship to protein conformation.Biochemistry 3, 1045–1049.
17. Barker, P. D., and Mauk, A. G. (1992) pH-Linked conformationalregulation of a metalloprotein oxidation-reduction equilibrium:electrochemical analysis of the alkaline form of cytochrome c.J. Am. Chem. Soc. 114, 3619–3624.
18. Battistuzzi, G., Loschi, L., Borsari, M., and Sola, M. (1999) Effectsof nonspecific ion-protein interactions on the redox chemistry ofcytochrome c. JBIC, J. Biol. Inorg. Chem. 4, 601–607.
19. Battistuzzi, G., Borsari, M., Loschi, L., Martinelli, A., and Sola,M. (1999) Thermodynamics of the alkaline transition of cytochromec. Biochemistry 38, 7900–7907.
20. Schweitzer-Stenner, R., Shah, R., Hagarman, A., and Dragomir, I.(2007) Conformational substates of horse heart cytochrome cexhibit different thermal unfolding of the heme cavity. J. Phys.Chem. B 111, 9603–9607.
21. Myer, Y. P. (1968) Conformation of cytochromes. III. Effect ofurea, temperature, extrinsic ligands and pH variation on theconformation of horse heart ferricytochrome-c. Biochemistry 7,765–776.
22. Myer, Y. P., and Harbury, H. A. (1966) Optical rotatory dispersionof cytochrome c II. Comparative data for a heme octapeptide.J. Biol. Chem. 241, 4299–4303.
23. Urry, D. W., and Doty, P. (1967) J. Am. Chem. Soc. 87, 2756.24. Urry, D. W. (1965) Protein-heme interactions in heme-proteins:
cytochrome C. Proc. Natl. Acad. Sci. U.S.A. 54, 640–648.25. Drucker, H., Campbell, L. L., and Woody, R. W. (1970) Optical
rotary properties of the cytochrome c8 species of DesulfoVibrio.Biochemistry 9, 1519–1527.
26. Hsu, M. C., and Woody, R. W. (1971) The origin of the hemecotton effects in myoglobin and hemoglobin. J. Am. Chem. Soc.93, 3515–3525.
27. Kiefl, C., Sreerama, N., Haddad, R., Sun, L., Jentzen, W., Lu, Y.,Qiu, Y., Shelnutt, J. A., and Woody, R. W. (2002) Heme distortionsin sperm-whale carbonmonoxy myoglobin: correlations betweenrotational strengths and heme distortions in MD-generated struc-tures. J. Am. Chem. Soc. 124, 3385–3394.
28. Dragomir, I., Hagarman, A., Wallace, C., and Schweitzer-Stenner,R. (2007) Optical band splitting and electronic perturbations ofthe heme chromophore in cytochrome c at room temperature probedby visible electronic circular dichroism spectroscopy. Biophys. J.92, 989–998.
29. Schweitzer-Stenner, R., Gorden, J. P., and Hagarman, A. (2007)The asymmetric band profile of the soret band of deoxymyoglobinis caused by electronic and vibronic perturbations of the heme grouprather than by a doming deformation. J. Chem. Phys. 127, 135103.
30. Filosa, A., Yang, Y., Ismail, A. A., and English, A. M. (2001)Two-dimensional infrared correlation spectroscopy as a probe ofsequential events in the thermal unfolding of cytochromes c.Biochemistry 40, 8256–8263.
31. Manas, E. S., Vaderkooi, J. M., and Sharp, K. A. (1999) The effectsof protein environment on the low temperature electronic spec-troscopy of cytochrome c and microperoxidase-11. J. Phys. Chem.B 103, 6334–6348.
32. Filosa, A., Ismail, A. A., and English, A. M. (1999) FTIR-monitored thermal titration reveals different mechanisms for thealkaline isomerization of tuna compared to horse and bovinecytochromes c. JBIC, J. Biol. Inorg. Chem. 4, 717–726.
33. Krishna, M. M. G., Maity, H., Rumbley, J. N., Lin, Y., andEnglander, S. W. (2006) Order of steps in the cytochrome c foldingpathway: Evidence for a sequential stabilization mechanism. J. Mol.Biol. 359, 1410–1419.
34. Shah, R., and Schweitzer-Stenner, R. (2008) Structural changesof horse heart ferricytochrome c induced by changes of ionicstrength and anion binding. Biochemistry, in press.
35. Lees, J. G., Smith, B., Wien, F., Miles, A., and Wallace, B. A.(2004) CDtoolsAn integrated software package for circulardichroism spectroscopic data processing, analysis and archiving.Anal. Biochem. 332, 285–289.
36. Whitmore, L., and Wallace, B. A. (2004) DICHROWEB, an onlineserver for protein secondary structure analyses from circulardichroism spectroscopic data. Nucleic Acids Res. 32, W668-W673.
37. Lobley, A., Whitmore, L., and Wallace, B. A. (2002) DICHROWEB:An interactive website for the analysis of protein secondarystructure from circular dichroism spectra. Bioinformatics 18, 211–212.
38. Schweitzer-Stenner, R., and Bigman, D. (2001) Electronic andvibronic contributions to the band splitting in optical spectra ofheme proteins. J. Phys. Chem. B 105, 7064–7073.
39. Levantino, M., Huang, Q., Cupane, A., Laberge, M., Hagarman,A., and Schweitzer-Stenner, R. (2005) The importance of vibronicperturbations in ferrocytochrome c spectra: A reevaluation ofspectral properties based on low-temperature optical absorption,resonance Raman, and molecular-dynamics simulations. J. Chem.Phys. 123, 054508.
40. Manas, E. S., Wright, W. W., Sharp, K. A., Friedrich, J., andVanderkooi, J. M. (2000) The influence of protein environmenton the low temperature electronic spectroscopy of Zn-substitutedcytochrome c. J. Phys. Chem. B 104, 6932–6941.
41. Blauer, G., Sreerama, N., and Woody, R. W. (1993) Optical activityof hemoproteins in the soret region. circular dichroism of the hemeundecapeptide of cytochrome c in aqueous solution. Biochemistry32, 6674–6679.
42. Schweitzer-Stenner, R. (2008) The Internal Electric Field inCytochrome C Explored by Visible Electronic Circular DichroismSpectroscopy. J. Phys. Chem. B. [Online early access]. DOI:10.1021/jp802495q. Published Online: July 30, 2008. http://pubs.acs.org/cgi-bin/asap.cgi/jpcbfk/asap/html/jp802495q.html.
43. Prabhu, N. V., Dalosto, S. D., Sharp, K. A., Wright, W. W., andVanderkooi, J.M. (2002) Optical Spectra of Fe(II) Cytochrome cInterpreted Using Molecular Dynamics Simulations and Quantummechanical Calculations. J. Phys. Chem. B 106, 5561–5571.
44. Pielak, G. J., Oikawa, K., Mauk, A. G., Smith, M., and Kay, C. M.(1986) Elimination of the Negative Soret Cotton Effect ofCytochrome c by Replacement of the Invariant Phenylalanine UsingSite-Directed Mutagenesis. J. Am. Chem. Soc. 108, 2724–2727.
45. Indiani, C., de Sanctis, G., Neri, F., Santos, H., Smulevich, G.,and Coletta, M. (2000) Effect of pH on Axial Ligand Coordinationof Cytochrome c′′ from Methylophilus methylotrophus and HorseHeart Cytochrome c. Biochemistry 39, 8234–8242.
46. Pinheiro, T. J. T., Elove, G., Watts, A., and Roder, H. (1997)Structural and Kinetic Description of Cytochrome c UnfoldingInduced by the Interaction with Lipid Vesicles. Biochemistry 36,13122–13132.
47. Addison, A. W., and Stephanos, J. J. (1986) Nitrosyl (III)hemoglobin: autorerduction and spectroscopy. Biochemistry 25,4104–4113.
BI800729W
Conformational Manifold of Ferricytochrome c Biochemistry, Vol. 47, No. 36, 2008 9677
Copyright © 2022 FDOKUMEN