
The Complex Network Analysis of Power Grid: A Case Study of the West Bengal Power Network
13
The Complex Network Analysis of Power Grid: A Case Study of the West Bengal Power Network Himansu Das, Gouri Sankar Panda, Bhagaban Muduli and Pradeep Kumar Rath Abstract Complex network analysis is a new multidisciplinary approach to characterize the structure and function of power grid as a complex network to establish the communication topology between the grid stations. By taking this into consideration, we are trying to design a reliable system which continuously supplies power to the grid station which can able to avoid the cascading failures, i.e., blackouts. In this article, we model the power grid as an undirected graph through which the different connectivity of power grid is represented as a measure to evaluate structure and function of power grid. The goal of this paper is to characterize the topological structure of the West Bengal of India power grid and evaluate the performance of electricity infrastructures. Keywords Grid computing Power grid Complex network Topological analysis Power system H. Das (&) Department of CSE, Roland Institute of Technology, Berhampur, Odisha, India e-mail: [email protected] G. S. Panda Department of EEE, Roland Institute of Technology, Berhampur, Odisha, India e-mail: [email protected] B. Muduli P. K. Rath Department of MCA, Roland Institute of Technology, Berhampur, Odisha, India e-mail: [email protected] P. K. Rath e-mail: [email protected] D. P. Mohapatra and S. Patnaik (eds.), Intelligent Computing, Networking, and Informatics, Advances in Intelligent Systems and Computing 243, DOI: 10.1007/978-81-322-1665-0_3, ȑ Springer India 2014 17
Transcript of The Complex Network Analysis of Power Grid: A Case Study of the West Bengal Power Network
The Complex Network Analysis of PowerGrid: A Case Study of the West BengalPower Network
Himansu Das, Gouri Sankar Panda, Bhagaban Muduliand Pradeep Kumar Rath
Abstract Complex network analysis is a new multidisciplinary approach tocharacterize the structure and function of power grid as a complex network toestablish the communication topology between the grid stations. By taking thisinto consideration, we are trying to design a reliable system which continuouslysupplies power to the grid station which can able to avoid the cascading failures,i.e., blackouts. In this article, we model the power grid as an undirected graphthrough which the different connectivity of power grid is represented as a measureto evaluate structure and function of power grid. The goal of this paper is tocharacterize the topological structure of the West Bengal of India power grid andevaluate the performance of electricity infrastructures.
Keywords Grid computing � Power grid � Complex network � Topologicalanalysis � Power system
H. Das (&)Department of CSE, Roland Institute of Technology, Berhampur, Odisha, Indiae-mail: [email protected]
G. S. PandaDepartment of EEE, Roland Institute of Technology, Berhampur, Odisha, Indiae-mail: [email protected]
B. Muduli � P. K. RathDepartment of MCA, Roland Institute of Technology, Berhampur, Odisha, Indiae-mail: [email protected]
P. K. Rathe-mail: [email protected]
D. P. Mohapatra and S. Patnaik (eds.), Intelligent Computing, Networking,and Informatics, Advances in Intelligent Systems and Computing 243,DOI: 10.1007/978-81-322-1665-0_3, � Springer India 2014
17
1 Introduction
The current power system is based on the renewable energy sources [1] such ascoal, natural gas, and oil, which emits CO2 to the atmosphere. To maintain thenature clean and green, the power system should be changed toward renewableenergy sources [2] such as wind, solar, tide, and water. The future power system(smart grid) is the integration of secure, reliable, and high-speed communicationinfrastructure to manage the complex power grid network [3] toward more intel-ligently. Although the technologies are enhancing, but still the rate of cascadingfailures is not decreased, which leads to major blackouts in the power grid. Themajor cause of the cascading failure is that there is some flaw in power trans-mission line, which leads to blackouts in power grid. By taking this into consid-eration, we modeled the power grid as a graph to trace the cause of failure in thepower grid, and in the same time, it also monitors [4] the power grid continuouslyto provide harness power supply to the power network.
To study the power grids as a complex network, some simplifications arenecessary. In the undirected graphs, each node represents a bus. In physical grid,the buses having different electrical properties, like nodes, are assumed to behomogeneous. This representation ignores whether transformers, generators, loads,or transmission lines attach to the bus. All communication lines are modeled asedges with equal weights. Physical length and electrical impedance are ignored inthe undirected graph representation.
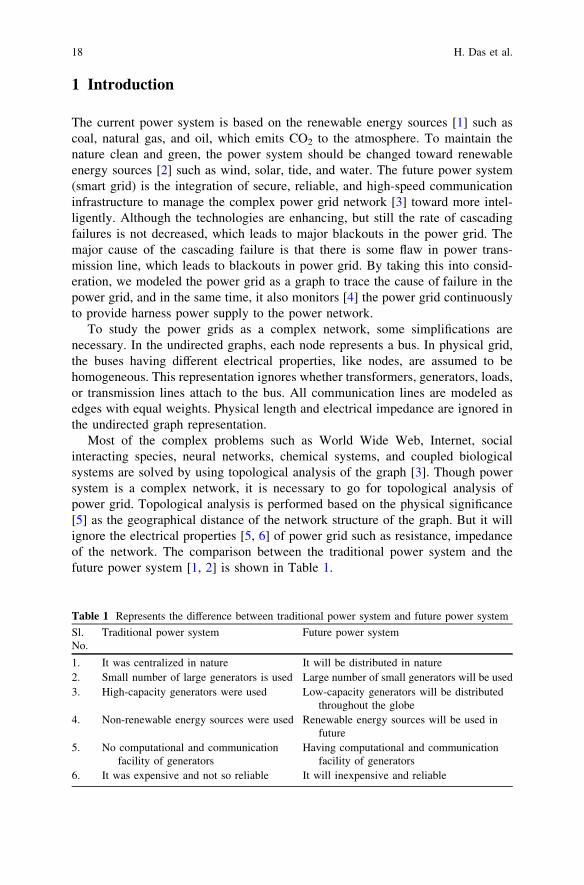
Most of the complex problems such as World Wide Web, Internet, socialinteracting species, neural networks, chemical systems, and coupled biologicalsystems are solved by using topological analysis of the graph [3]. Though powersystem is a complex network, it is necessary to go for topological analysis ofpower grid. Topological analysis is performed based on the physical significance[5] as the geographical distance of the network structure of the graph. But it willignore the electrical properties [5, 6] of power grid such as resistance, impedanceof the network. The comparison between the traditional power system and thefuture power system [1, 2] is shown in Table 1.
Table 1 Represents the difference between traditional power system and future power system
Sl.No.
Traditional power system Future power system
1. It was centralized in nature It will be distributed in nature2. Small number of large generators is used Large number of small generators will be used3. High-capacity generators were used Low-capacity generators will be distributed
throughout the globe4. Non-renewable energy sources were used Renewable energy sources will be used in
future5. No computational and communication
facility of generatorsHaving computational and communication
facility of generators6. It was expensive and not so reliable It will inexpensive and reliable
18 H. Das et al.
In this paper, a framework for communication between different buses ofelectric power grid has been presented, which employs the grid computing as thebackbone of ICT infrastructure. The remaining part of this paper is organized asfollows: Sect. 2 gives a brief overview of graph theoretic interpretation of thepower grid. Section 3 provides the graph theoretic model of power grid as acomplex network and also gives different parameters that are associated withpower network. Section 4 gives the case study of West Bengal power grid andpresented the results. Section 5 concludes the paper. In this paper, a number ofPCs have been aggregated together to set up a grid environment that employs GridGain 2.0 as a middleware [7]. It is a collection of software components whichprovide many of the building blocks (services) necessary to create a grid-basedapplication. The most attractive feature of Grid Gain 2.0 was its java-based nature.
2 Fundamentals of Power System as a GraphTheoretic Model
In this section, we present the basic concepts of modeling power system as a graph.An undirected graph is defined as a pair of sets G (n, m) such that n is the numberof nodes and m is the number of edges. There are some basic definitions of graphthat are as follows.
Definition 1 (Graph): A graph G (V, E) is a pair of sets where V is the set ofvertices and E is the set of edges.
Definition 2 (Power Grid as Graph): A graph G (V, E) is called power grid graphif and only if each element vi Æ V is a transformer, substation, generating station,or load unit of physical power grid and if there is an edge ei,j Æ E representing theexistence of physical cable between two nodes vi to vj in the power grid fromvertex vi to vj.
Definition 3 (Degree of Graph): In an undirected graph, the degree of vertex isthe number of edges e Æ E incident in a vertex v Æ V and is called degree of thatvertex in the graph. Simply, we can say that the degree of a node specifies thenumber of nodes adjacent to that node.
Definition 4 (Adjacency Matrix): Let Vi be the vertices of graph G (V, E), then theadjacency matrix A is the n 9 n matrix, where A represents the configuration ofthe graph, such that aij = 1 if and only if there is an edge between the nodes i andj otherwise 0.
A ¼ aij ¼1; when Vi and Vj are adjacent0; otherwise
�ð1Þ
The Complex Network Analysis of Power Grid 19

Definition 5 (Incidence Matrix): Let vi be the vertices and ei be the edges of graphG (V, E), then the incidence matrix I is the n 9 m matrix where
I ¼1 If there is a direct path between i to j�1 If there is a direct path between j to i0 if branch j is not incident at node i:
8<: ð2Þ
Definition 6 (Laplacian Matrix): Let D be the degree matrix having n 9 n diag-onal matrix where Dii = d(vi) is the degree of vi in graph G(V, E) and A be theadjacency matrix, then Laplacian matrix can be defined as follows:
L ¼ D� A ð3Þ
3 Modeling the Topology of Power Grid as a ComplexNetwork
To represent the power grid as a complex network [3], we build an unweighted andundirected graph [8] composed of nodes and edges. Using metrics from graphtheory and modern complex network analysis, the results provide insight into theproperties of power grids [9], considering only topological information. The goalis to characterize the topological structure of the West Bengal power grids andhighlight implications for the performance of electricity infrastructures.
3.1 Topological Analysis of Power Grid
An undirected graph [5, 6, 8, 9] is defined in graph theory as a pair of vertices andedges, G = {N, m} where Nj j is the number of nodes and Mj j is the number ofedges. There are many useful statistical measures for graphs. Among the mostuseful are degree distributions, characteristic path length, graph diameter, clus-tering coefficient, and degree assortativity. These measures provide a useful set ofstatistics for comparing power grids with other graph structures.
3.1.1 Number of Links (m)
The total number of links [8] of any graph is
m ¼ 12
Xi
Lði; iÞ ð4Þ
whereP
L(i, i) is the sum of all diagonal values of L matrix.
20 H. Das et al.
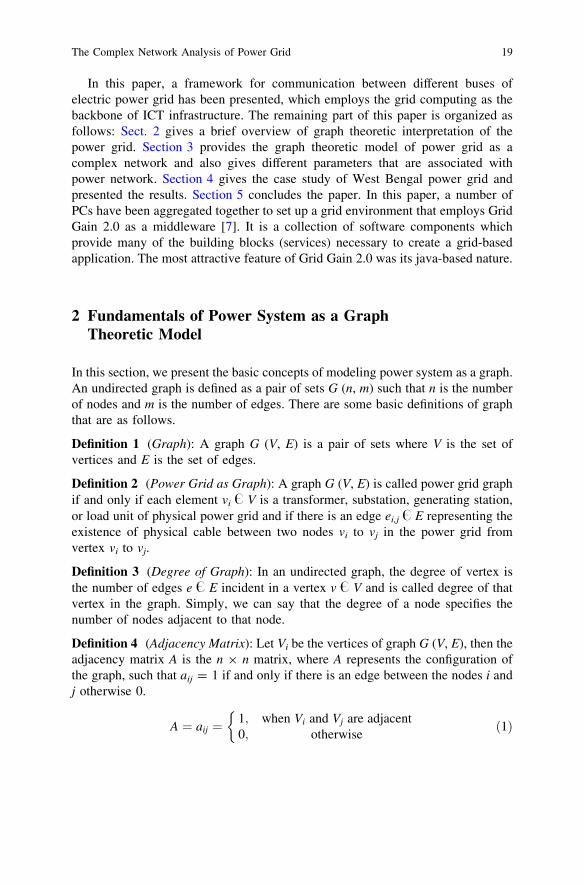
3.1.2 Average Nodal Degree (hki)
The nodal degree vector is determined from the Laplacian matrix
K ¼ k1; k2; k3; . . .; kNf g ¼ diagonal ðLÞ: ð5Þ
The average nodal degree [8, 9] can be represented as the average numbers ofedges that are connected to a node. The average nodal degree is defined as follows:
hki ¼ 1N
Xi
Lði; iÞ ð6Þ
whereP
L(i, i) is the sum of all diagonal values of L matrix.The average degree of a node seen at the end of a randomly selected edge is
�k ¼ ð2 mÞ�1Xði; jÞ
ki þ kj
� �¼ ð2 mÞ�1
XðiÞ
k2i
� �¼ hk
2ihki ð7Þ
3.1.3 Ratio Parameter (r)
It determines the maximum node degree of the nodes of graph of a network.Then, the ratio r {k [ �k} can be obtained as follows:
r fk [�kg¼ki; ki [ �k� ��� ��
1N
ð8Þ
where ki is the individual node degree.
3.1.4 Pearson Coefficient (q)
The Pearson coefficient (q) is also called correlation coefficient [5, 8, 9], whichgives a measure to evaluate the correlation of node degrees in the network. It tellsus about the assortativity of the electrical networks.
q ¼Pði; jÞ ki � �kð Þ kj � �k
� �ffiffiffiffiffiffiffiffiffiffiffiffiffiffiffiffiffiffiffiffiffiffiffiffiffiffiffiffiffiffiffiffiffiffiffiffiffiffiffiffiffiffiffiffiffiffiffiffiPði; jÞ ki � �kð Þ2 kj � �k
� �2q ð9Þ
where, for a network having m links, we define
�k ¼ m�1Xði; jÞ
ki and �k ¼ m�1Xði; jÞ
kj ð10Þ
The Complex Network Analysis of Power Grid 21
Pearson coefficient for some kinds of networks is consistently positive, whichmeans less assortative, while for others, it is negative, which means more assor-tative. So we can say that Pearson coefficient can be used to differentiate tech-nological networks from social networks.
3.1.5 Degree Distribution
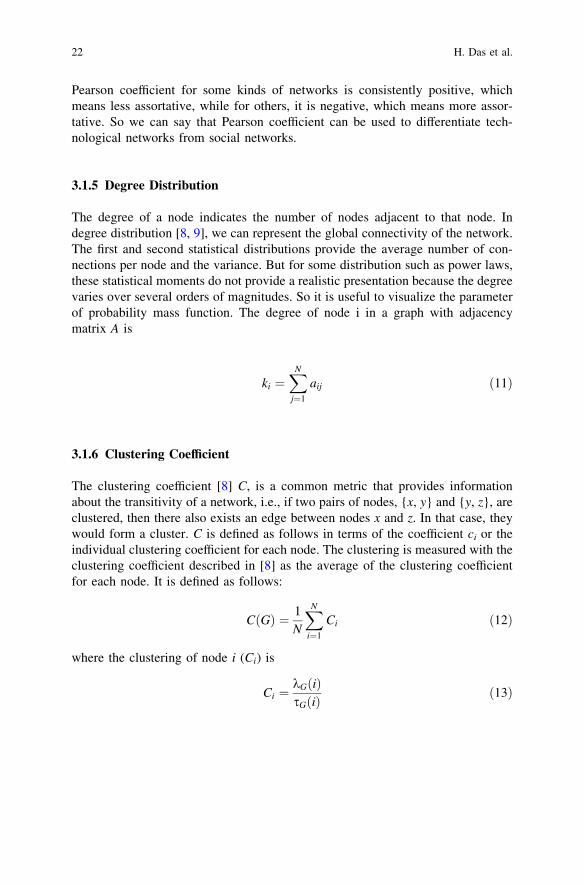
The degree of a node indicates the number of nodes adjacent to that node. Indegree distribution [8, 9], we can represent the global connectivity of the network.The first and second statistical distributions provide the average number of con-nections per node and the variance. But for some distribution such as power laws,these statistical moments do not provide a realistic presentation because the degreevaries over several orders of magnitudes. So it is useful to visualize the parameterof probability mass function. The degree of node i in a graph with adjacencymatrix A is
ki ¼XN
j¼1
aij ð11Þ
3.1.6 Clustering Coefficient
The clustering coefficient [8] C, is a common metric that provides informationabout the transitivity of a network, i.e., if two pairs of nodes, {x, y} and {y, z}, areclustered, then there also exists an edge between nodes x and z. In that case, theywould form a cluster. C is defined as follows in terms of the coefficient ci or theindividual clustering coefficient for each node. The clustering is measured with theclustering coefficient described in [8] as the average of the clustering coefficientfor each node. It is defined as follows:
CðGÞ ¼ 1N
XN
i¼1
Ci ð12Þ
where the clustering of node i (Ci) is
Ci ¼kGðiÞsGðiÞ
ð13Þ
22 H. Das et al.
where kG ið Þ is the number of edges between the neighbors of node i and sGðiÞ isthe total number of edges that could possibly exist among the neighbors of node.For undirected graphs, sGðiÞ ¼ kiðki � 1Þ=2 is the node degree.
The clustering coefficient for a random graph network theoretically equals theprobability of randomly selecting links from all possible links.
C Rð Þ ¼ 2 mNðN � 1Þ ¼
hkiN � 1
ð14Þ
3.1.7 Average Shortest Path
The average shortest path or characteristic path length, hli, is used to measure theshortest path between any given pair of nodes relative to the size of the network[8]. hli is determined from the distance matrix as the average value of all thepossible entries for every combination of nodes, given that the entry dij is thenumber of edges along the shortest path from i to j.
hli ¼ 1nðn� 1Þ
X8i; ji 6¼ j
dij ð15Þ
It can also be determined by using Floyd–Warshall algorithm directly.
3.2 Random Graphs (ER)
In this paper, random graphs are created following the standard algorithmdescribed in Erdos and Renyi [10] for a given number of nodes and edges such thatthey are comparable to the power grid under study, namely the West Bengal powersystem. In the random graph (ER) model, every edge is generated by randomlyselecting endpoints from a uniform distribution.
3.3 Preferential Attachment (PA)
The generation of scale-free graphs was described by Barabasi and Albert [11].This model has introduced variations in the degree distribution by modifying theattachment mechanisms, implementing dynamic edge rewiring, etc. In every
The Complex Network Analysis of Power Grid 23
iteration, it will generate a new node and approximately m/n edges; the result is agraph with n nodes and roughly m edges.
4 Experimental Results and Discussions
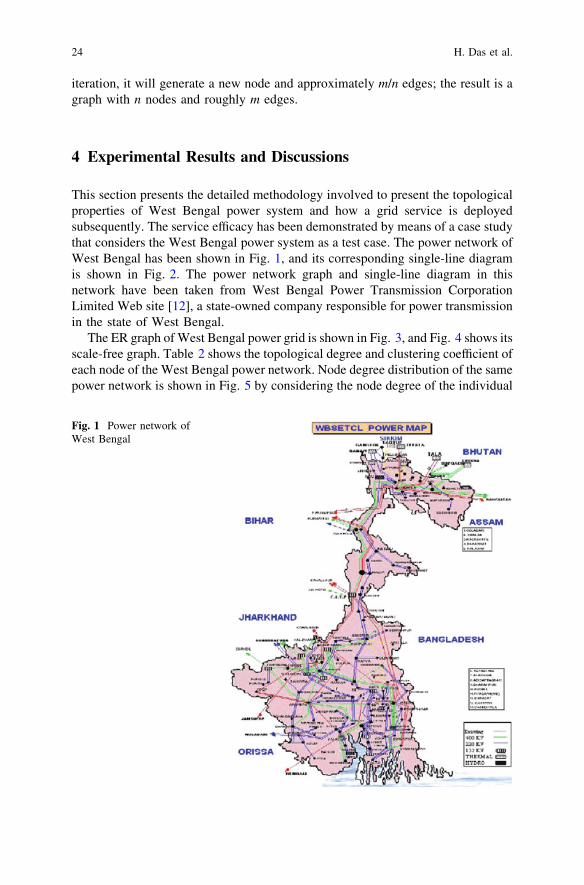
This section presents the detailed methodology involved to present the topologicalproperties of West Bengal power system and how a grid service is deployedsubsequently. The service efficacy has been demonstrated by means of a case studythat considers the West Bengal power system as a test case. The power network ofWest Bengal has been shown in Fig. 1, and its corresponding single-line diagramis shown in Fig. 2. The power network graph and single-line diagram in thisnetwork have been taken from West Bengal Power Transmission CorporationLimited Web site [12], a state-owned company responsible for power transmissionin the state of West Bengal.
The ER graph of West Bengal power grid is shown in Fig. 3, and Fig. 4 shows itsscale-free graph. Table 2 shows the topological degree and clustering coefficient ofeach node of the West Bengal power network. Node degree distribution of the samepower network is shown in Fig. 5 by considering the node degree of the individual
Fig. 1 Power network ofWest Bengal
24 H. Das et al.
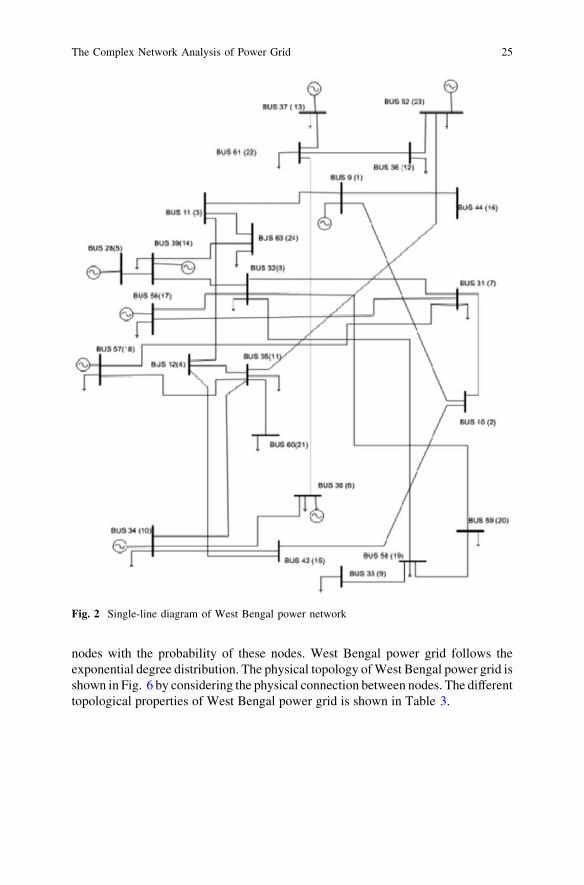
nodes with the probability of these nodes. West Bengal power grid follows theexponential degree distribution. The physical topology of West Bengal power grid isshown in Fig. 6 by considering the physical connection between nodes. The differenttopological properties of West Bengal power grid is shown in Table 3.
Fig. 2 Single-line diagram of West Bengal power network
The Complex Network Analysis of Power Grid 25

Fig. 4 Scale-free network ofWest Bengal
Fig. 3 Random graph ofWest Bengal
26 H. Das et al.
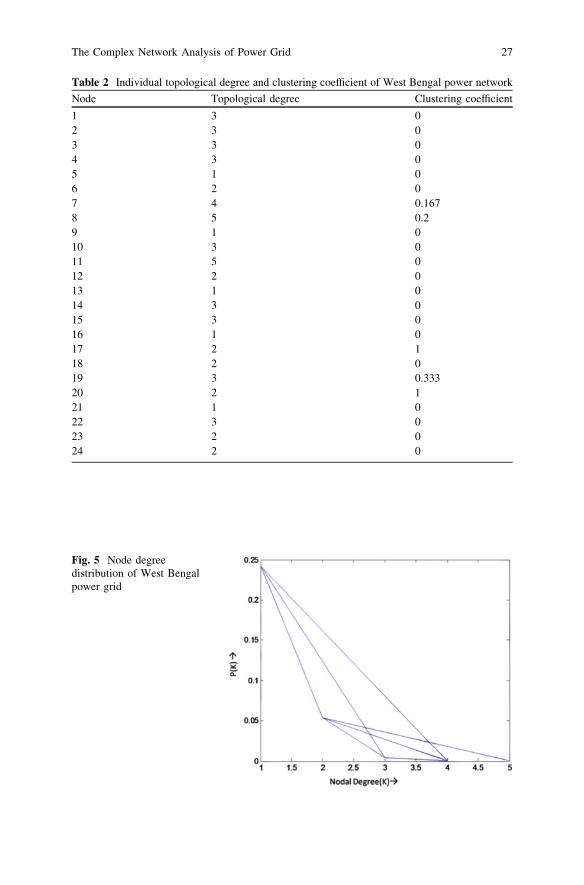
Fig. 5 Node degreedistribution of West Bengalpower grid
Table 2 Individual topological degree and clustering coefficient of West Bengal power network
Node Topological degree Clustering coefficient
1 3 02 3 03 3 04 3 05 1 06 2 07 4 0.1678 5 0.29 1 010 3 011 5 012 2 013 1 014 3 015 3 016 1 017 2 118 2 019 3 0.33320 2 121 1 022 3 023 2 024 2 0
The Complex Network Analysis of Power Grid 27

5 Conclusions
Complex network analysis is an emerging technology to characterize the structuraland functional connectivity of the power grid. In this paper, we have described andpresented a number of measures that characterize the topological structure of theWest Bengal power network. The topology determines the physical connectivity ofthe network. It provides the physical parameters and constraints characterizing thepower network. It only focuses the physical significance of the network rather theelectrical parameters. It may present the strategies to evolve physical topologies toimprove the forthcoming smart grid which might require reshaping of the powernetwork in case of cascading failures, which leads to blackouts.
Table 3 Topologicalparameters of West Bengalpower grid
Topological parameters of West Bengal power grid
Nodes (N) 24Edges (m) 30Average nodal degree hKi 2.5Average shortest path hli 3.524306Diameter (D) 9Pearson coefficient (q) -0.2821r{k [ k bar} 0.125C (G) 0.1125C (R) 0.1087
Fig. 6 Regular graph ofWest Bengal power grid
28 H. Das et al.
References
1. Irving, M., Taylor, G., Hobson, P.: Plug into grid computing. Power Energy Mag. IEEE 2(2),40–44 (2004)
2. Taylor, G.A., Irving, M.R., Hobson, P.R., Huang, C., Kyberd, P., Taylor, R.J.: Distributedmonitoring and control of future power systems via grid computing. In: Power EngineeringSociety General Meeting, 2006. IEEE, p. 5. IEEE, (2006)
3. Boccaletti, S., Latora, V., Moreno, Y., Chavez, M., Hwang, D.-U.: Complex networks:structure and dynamics. Phys. Rep. 424(4), 175–308 (2006)
4. Himansu, D., Roy, D.S.: Article: a grid computing service for power system monitoring. Int.J. Comput. Appl. 62(20), 1–6 (2013)
5. Cotilla-Sanchez, E., Hines, P.D.H., Barrows, C., Blumsack, S.: Comparing the topologicaland electrical structure of the North American electric power infrastructure. pp. 1–1. (2012)
6. Hines, P., Blumsack, S., Cotilla Sanchez, E., Barrows, C.: The topological and electricalstructure of power grids. In: System Sciences (HICSS), 2010 43rd Hawaii InternationalConference on, pp. 1–10. IEEE, (2010)
7. Grid Gain: www.gridgain.com. Last accessed on 13 May 20138. Wang, Z., Scaglione, A., Thomas, R.J.: Generating statistically correct random topologies for
testing smart grid communication and control networks. Smart Grid IEEE Trans. 1(1), 28–39(2010)
9. Wang, Z., Thomas, R.J., Scaglione, A: Generating random topology power grids. In:Proceedings of the 41st Annual Hawaii International Conference on System Sciences,pp. 183–183. IEEE, (2008)
10. Erdos, P., Renyi, A.: On random graphs. Publ. Math. Debrecen 6, 290–297 (1959)11. Watts, D.J., Strogatz S.H.: Collective dynamics of ‘small-world’ networks. Nature
393(6684), 440–442 (1998)12. http://www.wbsldc.in/docs/2.%20WBSETLC%20POWER%20MAP.gif. Last accessed on 13
May 2013
The Complex Network Analysis of Power Grid 29