POWER CONSUMPTION OF NETWORK TECHNOLOGIES IN ...
38
-
Upload
khangminh22 -
Category
Documents
-
view
1 -
download
0
Transcript of POWER CONSUMPTION OF NETWORK TECHNOLOGIES IN ...

POWER CONSUMPTION OF NETWORK
TECHNOLOGIES IN MODERN
SMARTPHONES
Janne Oksanen
Bachelor's ThesisMay 2013
Degree Programme in Software EngineeringTechnology, communication and transport
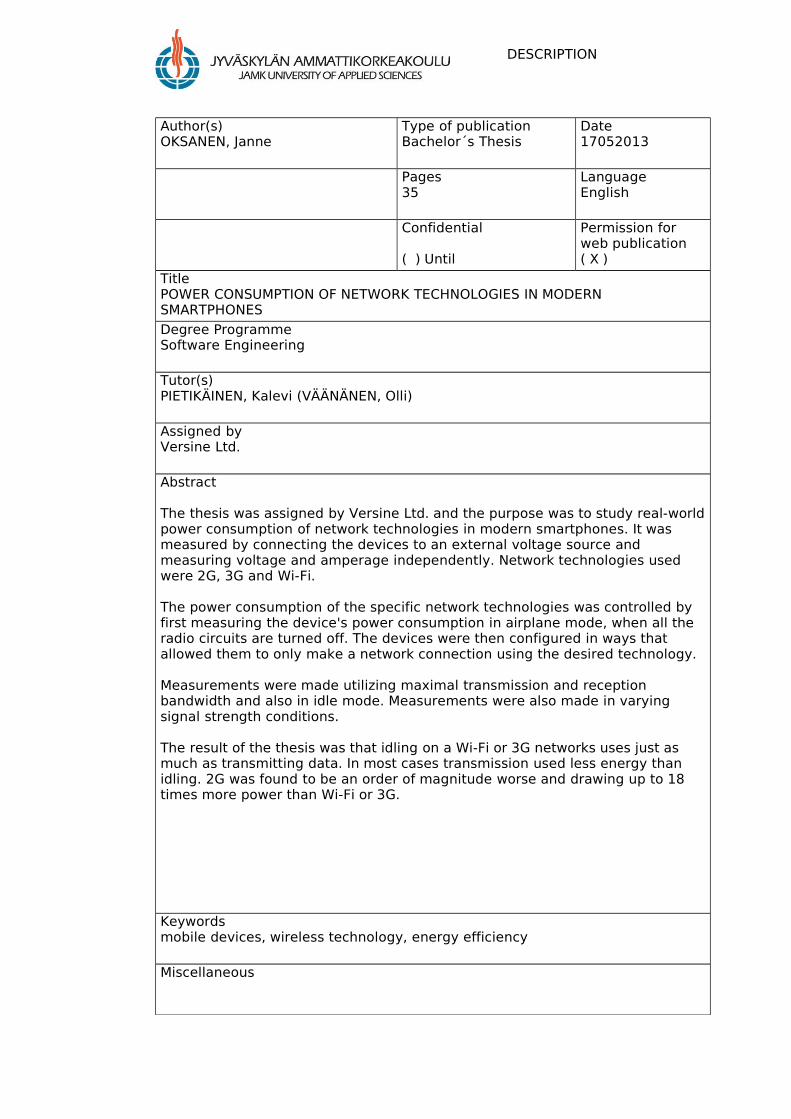
DESCRIPTION
Author(s)OKSANEN, Janne
Type of publicationBachelor´s Thesis
Date17052013
Pages 35
LanguageEnglish
Confidential
( ) Until
Permission for web publication( X )
TitlePOWER CONSUMPTION OF NETWORK TECHNOLOGIES IN MODERN SMARTPHONES
Degree ProgrammeSoftware Engineering
Tutor(s)PIETIKÄINEN, Kalevi (VÄÄNÄNEN, Olli)
Assigned byVersine Ltd.
Abstract
The thesis was assigned by Versine Ltd. and the purpose was to study real-world power consumption of network technologies in modern smartphones. It was measured by connecting the devices to an external voltage source and measuring voltage and amperage independently. Network technologies used were 2G, 3G and Wi-Fi.
The power consumption of the specific network technologies was controlled by first measuring the device's power consumption in airplane mode, when all the radio circuits are turned off. The devices were then configured in ways that allowed them to only make a network connection using the desired technology.
Measurements were made utilizing maximal transmission and reception bandwidth and also in idle mode. Measurements were also made in varying signal strength conditions.
The result of the thesis was that idling on a Wi-Fi or 3G networks uses just as much as transmitting data. In most cases transmission used less energy than idling. 2G was found to be an order of magnitude worse and drawing up to 18 times more power than Wi-Fi or 3G.
Keywordsmobile devices, wireless technology, energy efficiency
Miscellaneous
OPINNÄYTETYÖNKUVAILULEHTI
Tekijä(t) OKSANEN, Janne
Julkaisun laji Opinnäytetyö
Päivämäärä17.05.2013
Sivumäärä 35
Julkaisun kieli englanti
Verkkojulkaisulupa myönnetty( X )
Työn nimi POWER CONSUMPTION OF NETWORK TECHNOLOGIES IN MODERN SMARTPHONES
Koulutusohjelma Ohjelmistotekniikka
Työn ohjaaja(t) PIETIKÄINEN, Kalevi (VÄÄNÄNEN, Olli)
Toimeksiantaja(t)Versine Oy
Tiivistelmä
Versine Oy:n tilaaman tutkimuksen tarkoitus oli verkkoteknologioiden käytännön tehonkulutuksen mittaaminen älypuhelimissa. Puhelimet kytkettiin tasajännitelähteeseen ja niiden käyttämä teho mitattiin VA-mittauksella. Mitatut teknologiat olivat 2G, 3G sekä Wi-Fi.
Verkkoteknologioiden tehonkulutus eristettiin mittaamalla puhelimien tehonkulutus ensin lentokonetilassa, jolloin radiolähettimet olivat pois päältä ja sen jälkeen muuttamalla puhelimen asetuksia siten, että puhelimet saatiin muodostamaan yhteys halutulla teknologialla.
Mittaukset tehtiin tyhjäkäyntitilassa sekä maksimaalisilla lähetys- ja vastaanottokaistoilla useissa eri signaaliolosuhteissa.
Tulos oli, että sekä Wi-Fi että 3G-verkoissa yhteyden ylläpitäminen vie yhtä paljon energiaa kuin datan lähettäminen. Useimmissa tapauksissa jopa datan lähettäminen kulutti vähemmän energiaa kuin yhteyden ollessa tyhjäkäyntitilassa. 2G oli kertaluokkaa huonompi energiatehokkuudeltaan ja käytti paikoittain jopa 18 kertaa enemmän energiaa kuin Wi-Fi tai 3G.
Avainsanat (asiasanat) mobiililaitteet, langaton tekniikka, energiatehokkuus
Muut tiedot

1
Contents
1 Introduction 5
1.1 Lagging Batteries . . . . . . . . . . . . . . . . . . . . . . . . . . . 5
1.2 Radio Overload . . . . . . . . . . . . . . . . . . . . . . . . . . . . . 6
1.3 Energy Trap . . . . . . . . . . . . . . . . . . . . . . . . . . . . . . 7
1.4 Green-T . . . . . . . . . . . . . . . . . . . . . . . . . . . . . . . . 7
1.5 End User Power Saving Strategies . . . . . . . . . . . . . . . . . . . 8
1.6 Programmer Power Saving Strategies . . . . . . . . . . . . . . . . . 8
2 Method 9
2.1 Electric Power . . . . . . . . . . . . . . . . . . . . . . . . . . . . . 9
2.2 Circuit . . . . . . . . . . . . . . . . . . . . . . . . . . . . . . . . . 9
2.3 Hardware . . . . . . . . . . . . . . . . . . . . . . . . . . . . . . . . 10
2.3.1 Handsets . . . . . . . . . . . . . . . . . . . . . . . . . . . . 10
2.3.2 Multimeters . . . . . . . . . . . . . . . . . . . . . . . . . . 11
2.4 Software . . . . . . . . . . . . . . . . . . . . . . . . . . . . . . . . 11
2.5 Technologies . . . . . . . . . . . . . . . . . . . . . . . . . . . . . . 11
2.5.1 Wi-Fi . . . . . . . . . . . . . . . . . . . . . . . . . . . . . . 11
2.5.2 2G . . . . . . . . . . . . . . . . . . . . . . . . . . . . . . . 12
2.5.3 3G . . . . . . . . . . . . . . . . . . . . . . . . . . . . . . . 12
2.6 Work�ow . . . . . . . . . . . . . . . . . . . . . . . . . . . . . . . . 12
2.7 Setups . . . . . . . . . . . . . . . . . . . . . . . . . . . . . . . . . 13
2.7.1 Controls . . . . . . . . . . . . . . . . . . . . . . . . . . . . 13
2
2.7.2 Wi-Fi . . . . . . . . . . . . . . . . . . . . . . . . . . . . . . 13
2.7.3 Mobile . . . . . . . . . . . . . . . . . . . . . . . . . . . . . 14
3 Results 15
3.1 Controls . . . . . . . . . . . . . . . . . . . . . . . . . . . . . . . . 15
3.2 Wi-Fi . . . . . . . . . . . . . . . . . . . . . . . . . . . . . . . . . . 16
3.2.1 Great Signal Conditions . . . . . . . . . . . . . . . . . . . . 16
3.2.2 Poor Signal Conditions . . . . . . . . . . . . . . . . . . . . . 17
3.3 2G . . . . . . . . . . . . . . . . . . . . . . . . . . . . . . . . . . . 18
3.3.1 Great Signal Conditions . . . . . . . . . . . . . . . . . . . . 18
3.3.2 Damped Signal Conditions . . . . . . . . . . . . . . . . . . . 19
3.4 3G . . . . . . . . . . . . . . . . . . . . . . . . . . . . . . . . . . . 20
3.4.1 Great Signal Conditions . . . . . . . . . . . . . . . . . . . . 20
3.4.2 Damped Signal Conditions . . . . . . . . . . . . . . . . . . . 21
4 Discussion 22
4.1 Controls . . . . . . . . . . . . . . . . . . . . . . . . . . . . . . . . 22
4.2 Wi-Fi . . . . . . . . . . . . . . . . . . . . . . . . . . . . . . . . . . 23
4.3 2G . . . . . . . . . . . . . . . . . . . . . . . . . . . . . . . . . . . 23
4.4 3G . . . . . . . . . . . . . . . . . . . . . . . . . . . . . . . . . . . 24
4.5 Estimating Error . . . . . . . . . . . . . . . . . . . . . . . . . . . . 25
4.6 Signal Damping . . . . . . . . . . . . . . . . . . . . . . . . . . . . 25
4.7 Lessons Learned . . . . . . . . . . . . . . . . . . . . . . . . . . . . 26
3
References 27
Appendices 28
List of Figures
1 Evolution of mobile phones (Wikipedia) . . . . . . . . . . . . . . . . 6
2 Stripped down view of the internal components and the several radio
chips of a Nokia handset. (Wikipedia) . . . . . . . . . . . . . . . . 7
3 Circuit diagram of the measurement setup. . . . . . . . . . . . . . . 9
4 Langer EMV-Technik ESA 1 Shielding Tent (Source: langer-emv.de) 14
5 Signal blocking pouch with the Huawei Ideos partly immerged inside.
The titanium coloured lining is the conductive mesh that makes up
the Faraday cage when the pouch is sealed. . . . . . . . . . . . . . . 15
6 Current drawn by the Huawei Ideos while idling on Wi-Fi in great
conditions . . . . . . . . . . . . . . . . . . . . . . . . . . . . . . . 17
7 Current drawn by the Huawei Ideos while saturating uplink on Wi-Fi
in great conditions . . . . . . . . . . . . . . . . . . . . . . . . . . . 17
8 Nexus S idling on 2g network. . . . . . . . . . . . . . . . . . . . . . 19
9 Nexus S idling on 2g network in damped signal conditions. The device
being placed in and taken out of the Faraday cage can be seen. . . . 20
10 Galaxy SII idling on 3g network. . . . . . . . . . . . . . . . . . . . . 21
11 Galaxy SII idling on 3g network in damped signal conditions. . . . . . 22
12 Figure 8-27 from Buchmanns book Batteries in a Portable World: A
Handbook on Rechargeable Batteries for Non-Engineers. . . . . . . . 24
4
List of Tables
1 Technical details of handsets. See GSM Arena for full listing. . . . . 10
2 Power consumption with MDO Analyzer and no network connectivity. 16
3 Power consumption with Wi-Fi in great signal conditions. . . . . . . 16
4 Power consumption with Wi-Fi in poor signal conditions. . . . . . . . 18
5 Power consumption with 2G in great signal conditions. . . . . . . . . 18
6 Power consumption with 2G in damped signal conditions. . . . . . . 19
7 Power consumption with 3G in great signal conditions. . . . . . . . . 20
8 Power consumption with 3G in damped signal conditions. . . . . . . 21
5
1 Introduction
1.1 Lagging Batteries
The evolution of mobile phones over the last decade has been nothing short of
phenomenal. Back in 2002 a typical mobile phone could operate up to two weeks on
a single charge. Since then the introduction of large backlit colour screens,
advanced operating systems and new radio technologies have had a hugely negative
impact on the battery life of these devices. While the devices have become more
and more powerful in computation the battery technology has not been able to keep
up to accomodate the increased thirst for charge. Modern smartphones, if used
actively, can hardly make it through a work day without recharging. In his book
Batteries in a Portable World: A Handbook on Rechargeable Batteries for
Non-Engineers the author Isidor Buchmann writes
The battery has not advanced at the same speeed as microelectronics,
and the industry has only gained 8 to 10 percent in the last two
decades. This is a far cry from Moore's Law that speci�es a doubling of
the number of transistors in a integrated circuit every two years. Instead
of two years, the capacity of lithium-ion took 10 years to double.
(Buchmann 2011.)
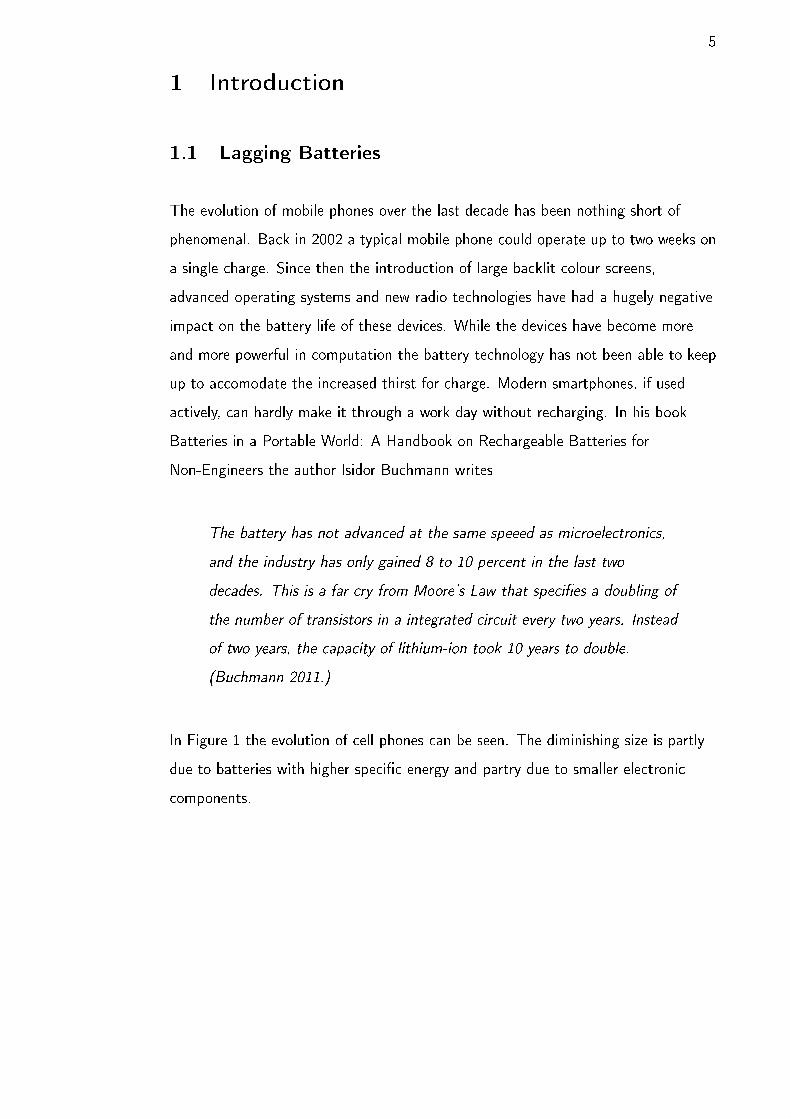
In Figure 1 the evolution of cell phones can be seen. The diminishing size is partly
due to batteries with higher speci�c energy and partry due to smaller electronic
components.
6
Figure 1: Evolution of mobile phones (Wikipedia)
1.2 Radio Overload
A modern smartphone comes with a plethora of radio chips. Some of them are
receivers only, such as FM radio and GPS, while majority of them are transceivers.
GSM connectivity alone requires two to three radios. On top of that the devices
typically have Wi-Fi and Bluetooth, both requiring their own radio chips. Latest
top-of-the-line models come with yet another radio technology called Near Field
Communication (NFC) that is thought to become a regular feature in all mobile
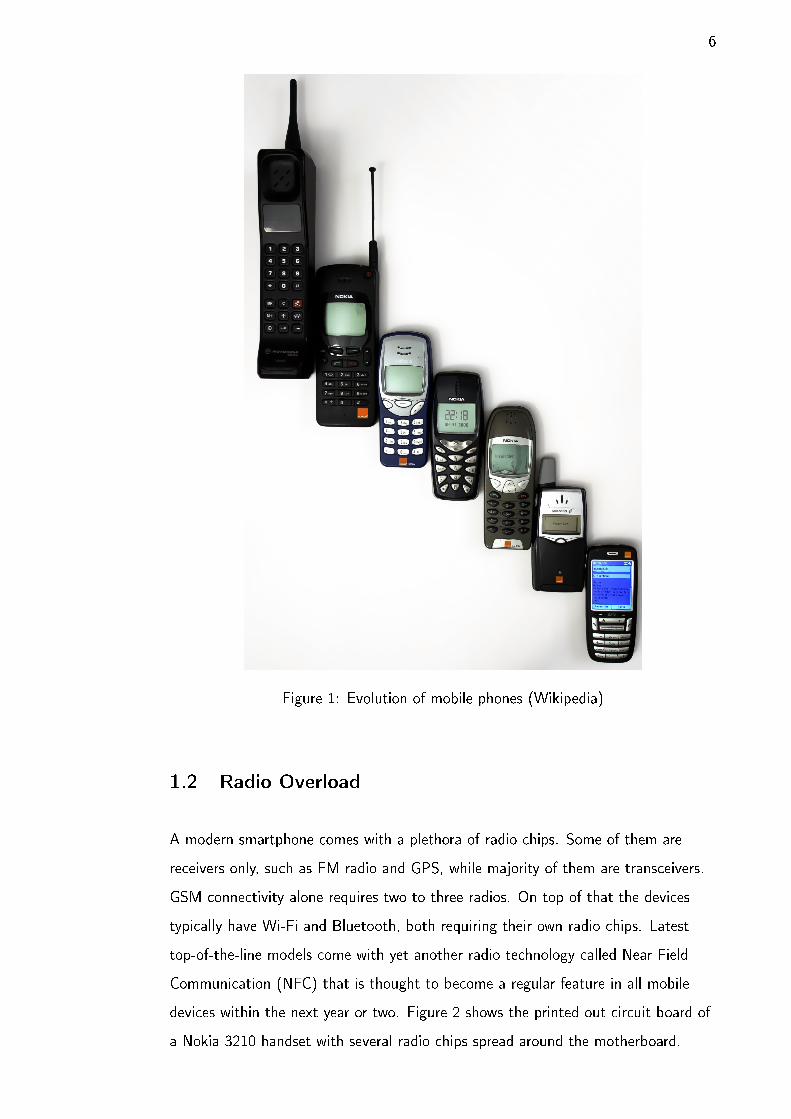
devices within the next year or two. Figure 2 shows the printed out circuit board of
a Nokia 3210 handset with several radio chips spread around the motherboard.

7
Figure 2: Stripped down view of the internal components and the several radio chips
of a Nokia handset. (Wikipedia)
1.3 Energy Trap
With the emergence of LTE the mobile communications industry is growing worried
about a phenomenon known as the Energy Trap. They fear that with the increased
power consumption of the next generation mobile technologies the mobile devices
become inceasingly immobile and the users �nd themselves searching for power
outlets rather than network access.
1.4 Green-T
Green-T is a project trying to �nd ways to limit the power consumption thus
prolonging the operational times of mobile devices. The project investigates the use
of cooperative strategies and cognitive radios to lower power consumption while
preserving proper quality of service.
Cognitive radio is a radio device that is aware of its surroundings and and the level
of serivce that is required of it at any given moment. Therefore it is able to select
the right connection technology considering the circumstances and either use more
power for more rapid transmission speeds or preserve battery and use less bandwidth
when high speeds are not needed. Reference �gures of the power consumption and
bandwidth capabilities of di�erent radio technologies are needed to make those
decisions.
While these tehcnologies are widely used it is di�cult to �nd reference �gures about
their power consumption. This may be due to device and chip manufacturers
8
wanting to share as little information as possible with their competitors. However,
lowering the energy consumption of devices is not purely a matter of hardware
design. Software must be e�cient in its energy consumption to prolong battery life.
Withhout reference �gures such optimisation is mostly guess work.
1.5 End User Power Saving Strategies
Android operating system has many power saving features built in. The most
obvious of them are the ones controlling the screen backlight. The brightness and
turn-o� delay can be set. The turn-o� delay, however, can be overridden by
software. Screen turning o� while watching a video for example is not a desirable
feature. Android also allows disabling data sync. This means that applications can
only initiate data connections when they are running in the foreground. For example
a micro blogging client will not be periodically checking for new messages.
There are also other features that have the side e�ect of prolonging battery life.
Most drastic of them is airplane mode, which turns o� all the radio chips altogether.
Even though it might be hard to understand the rationale it seems to also turn o�
some of the chips that do not transmit anything, GPS for example. Another
example is forcing the cell network connection to 2G. This will of course also slow
down mobile data speed.
1.6 Programmer Power Saving Strategies
Periodically checking for new messages is quite problematic because of the potential
overhead when there are no new messages to fetch. Push-to-phone technologies
have been developed to remove that overhead. The radio needs to be turned on
periodically for incoming messages to get through. Synchronising all tra�c with
those mandatory on-times reduces the need to turn on the radio thus saving energy.
9
2 Method
2.1 Electric Power
Power is de�ned as
P = V · I (1)
where V is voltage and I is current. Thus if we measure voltage and current we can
calculate the power.
2.2 Circuit
The handsets were initially powered by a Amrel PPS-2322 programmable DC power
supply. After the �rst day of measurements the unit broke down and was replaced
by a Kenwood PD18-20D Regulated DC Power Supply. After a few days of
measurements the unit was found to have a hard time delivering enough current to
the handsets and it was replaced with Aplab ZS3205 Regulated DC Power Supply.
The battery was removed and the power supply connected directly to the battery
terminals on the handset, e�ectively fooling it into thinking it was on battery power.
This way there was no bu�ering of energy and it was possible to get real time power
consumption �gures. The voltage was dialed in so that it was equivalent to the
battery on full charge. The nominal voltage for all devices was rated at 3.7V but
actual voltage at full charge varied.
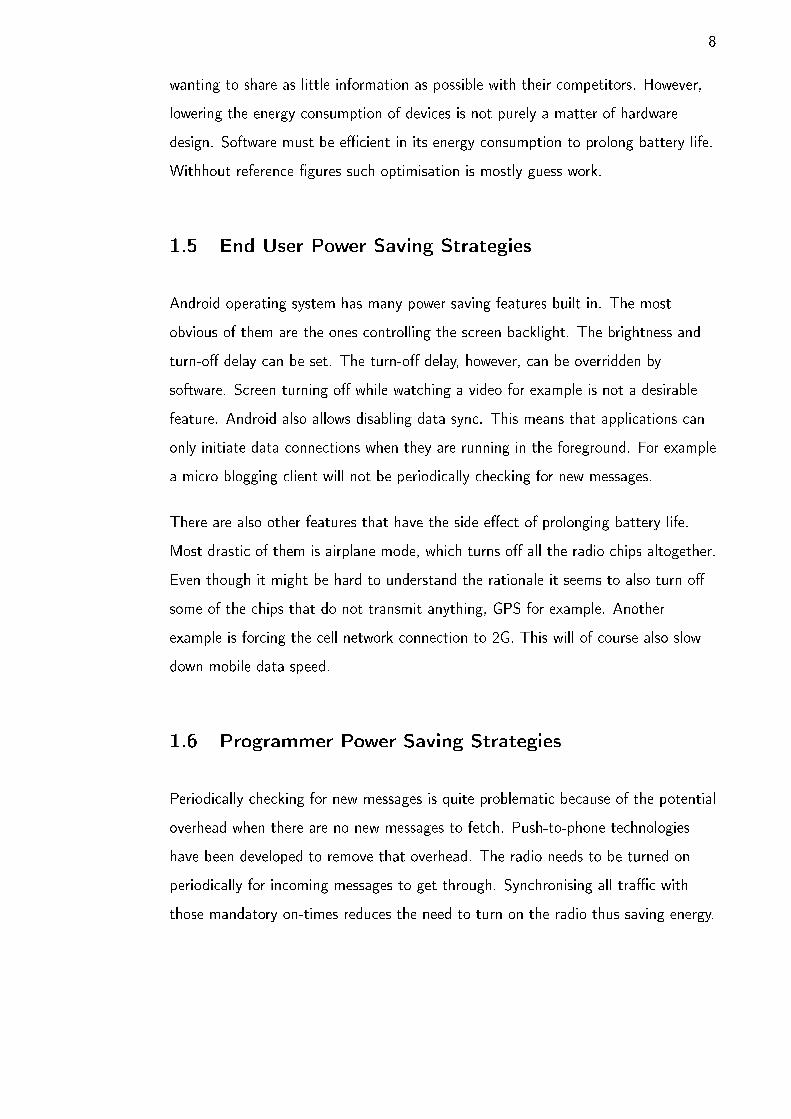
A voltage meter was connected in parallel with the voltage source and the handset.
An ammeter was connected in series between the positive terminal of the voltage
source and the positive battery pin of the handset. The circuit in all its simplicity is
laid out in Figure 3.
Figure 3: Circuit diagram of the measurement setup.

10
2.3 Hardware
2.3.1 Handsets
Three handsets were chosen for the experiment. Huawei Ideos was representing the
low-cost spectrum of Android smartphone and was running the oldest Android
version of the bunch. Samsung Galaxy SII, one of the most popular handsets ever
made, was running Android 4.1.2. The last device chosen was Google's reference
phone Nexus S running a vanilla version of Android 4.1.2. The relevant technical
details of the handsets are listed in Table 1.
Table 1: Technical details of handsets. See GSM Arena for full listing.
Huawei Ideos Samsung Nexus S Samsung Galaxy SII
Model U8150 I9023 GT-I9100
CPU 528 MHz ARM 11 1 GHz Cortex-A8 Dual-core 1.2 GHz
Cortex-A9
Chipset Qualcomm
MSM7225
Hummingbird Exynos
Android version 2.2 4.1.2 4.1.2
2G frequencies 850/900/1800/1900 850/900/1800/1900 850/900/1800/1900
3G frequencies 850/900/1900/2100 900/1700/2100 850/900/1900/2100
Screen technology TFT S-LCD Super AMOLED
Screen size 240x320 pixels, 2.8" 480x800 pixels, 4.0" 480x800 pixels, 4.3"
Battery 1200 mAh Li-Ion 1500 mAh Li-Ion 1650 Li-Ion
A factory reset was performed on all the handsets and a fresh Google account was
used to log in. All reporting and synchonization features were turned o� and
services like email were not con�gured. For Wi-Fi measurements the handsets were
not provided with a SIM card thus preventing them from connecting to cellular
networks. It should be noted that even devices without SIM cards can make
emergency calls. Since that capability is probably not subject to power saving
measures it should not a�ect the �ndings in this study.
11
2.3.2 Multimeters
As described previously two multimeters were used for measuring voltage and
current. Fluke 179 was user to monitor instantaneous voltage during the sessions.
Fluke 179 was set on DC voltage setting and the range was set by its Auto Range
feature. The manufacturer reports accuracy of 0.09%.
Fluke 289 True RMS Multimeter was used for current measurement. It was set on
milliampere range and the manufacturer promises 0.06% accuracy.
2.4 Software
Handsets were equipped with software to log signal conditions during the
measurements. A special build of MDO Analyzer by Versine Ltd. was used to log
signal strength and saturate uplink or downlink when required. Data was then
uploaded to a server for viewing. Power overhead caused by logging software was
controlled by measuring the energy consumption with MDO Analyzer running in
airplane mode. It should be noted that MDO Analyzer utilizes a wake lock
mechanism to prevent the handset from going into power saving mode and thus
interrupting logging.
2.5 Technologies
2.5.1 Wi-Fi
Wi-Fi is the name used for wireless local area networks (WLAN) that conform with
the Institute of Electrical and Electronics Engineers standards IEEE 802.11x. Wi-Fi
trademark is owned by the Wi-Fi Alliance organisation. Because virtually all WLAN
networks are based on Wi-Fi technology, the terms Wi-Fi and WLAN have become
almost synonymous. Technically, however, not all WLAN networks necessarily are
Wi-Fi.
Wi-Fi is a great supplement to a mobile device, because it typically o�ers faster
connections at a cheaper price than mobile data plans. When using private networks
12
congestion is usually less of a problem. Typical use case for Wi-Fi is when the user is
relatively stationary for longer periods at a time, such as when at home or at work.
To conserve energy, Wi-Fi should be turned o� when regularly used Wi-Fi networks
are out of range. This has one side e�ect that might not be apparent to the user.
Modern smartphones use Wi-Fi acceess spot scanning to improve location data
when GPS signal is not available. This might be the case when sky view is
obstructed by trees, tall buldings or when indoors.
2.5.2 2G
2G is short for second generation mobile network technology. In our case the
available 2G technologies are GPRS (General Packet Radio Service) and EDGE
(Enhanced Data rates for GSM Evolution). Both are signi�cant improvements over
the original circuit switched 2G networks. Because they are packet switched they're
sometimes refered to as 2.5G and 2.75 respectively.
2.5.3 3G
Third generation mobile network technologies are de�ned by the International
Mobile Telecommunications-2000 (IMT-2000) speci�cation. The technologies are
based on UMTS (Universal Mobile Telecommunications System), which uses
Wideband Code Division Multiple Access (WCDMA) radio access technology.
Original Release '99 has since been improved upon and the evolved newer
technologies sometimes denoted 3.5 are called HSPA (High Speed Packet Access).
2.6 Work�ow
The battery was removed from the handset and a programmable regulated DC
power source was connected to the positive and negative pins on the handsets. The
voltage was adjusted to match a fully charged battery, thus eliminating any
potential power saving features that might be triggered by low battery charge.
Logging software was started, handset screen turned o� and a measurement session
was started on the Fluke 289 measuring current.
13
Initially the measurements were performed as a series of �ve minute sessions, but
later on single 15 minute sessions were logged instead. This decision was made to
save time by eliminating all the overhead that comes with starting an stopping a
measurement session.
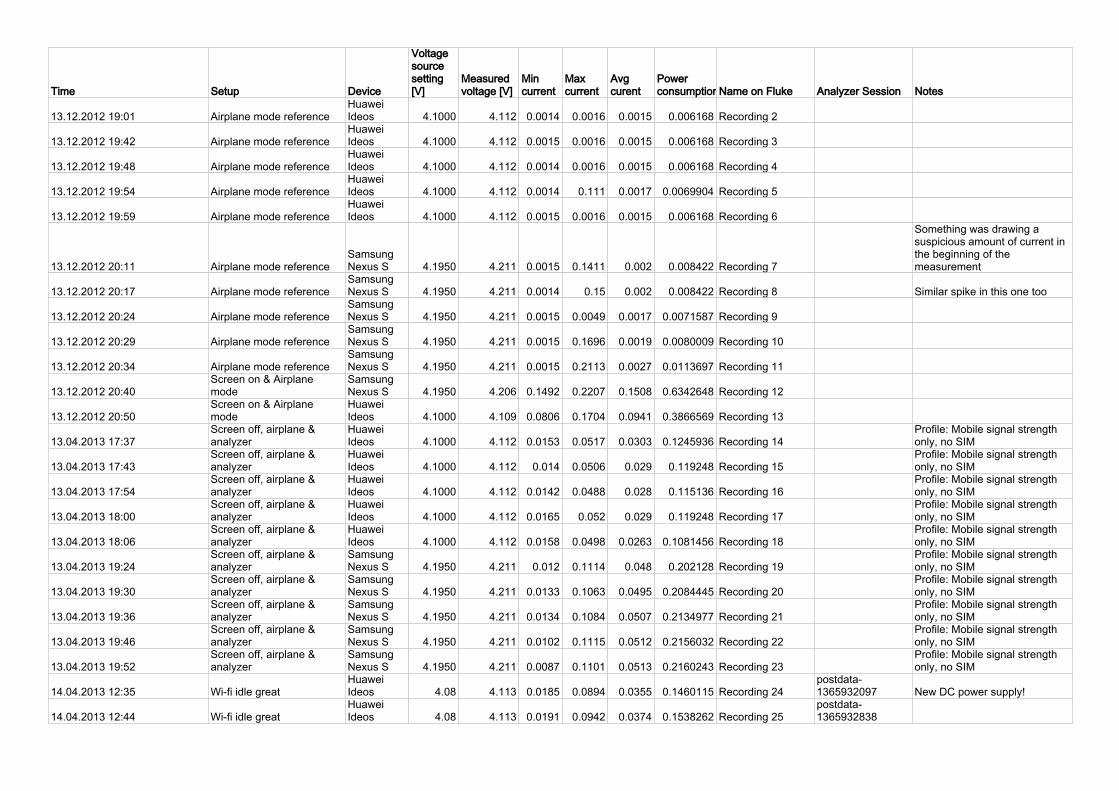
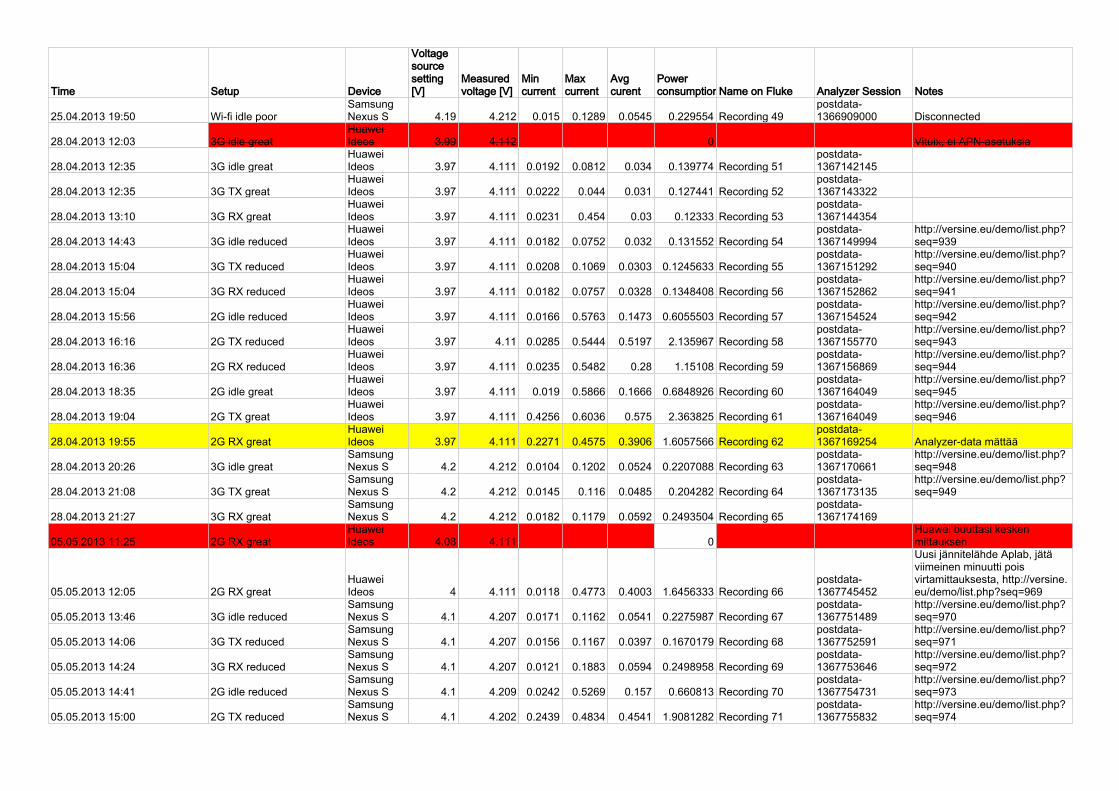
When the time on the Fluke 289 ran out the session was saved locally on the
multimeter. Data was later extracted from the device using Fluke Forms sofware
and exported as CSV (comma separated values) �les. Session maximum, minimum
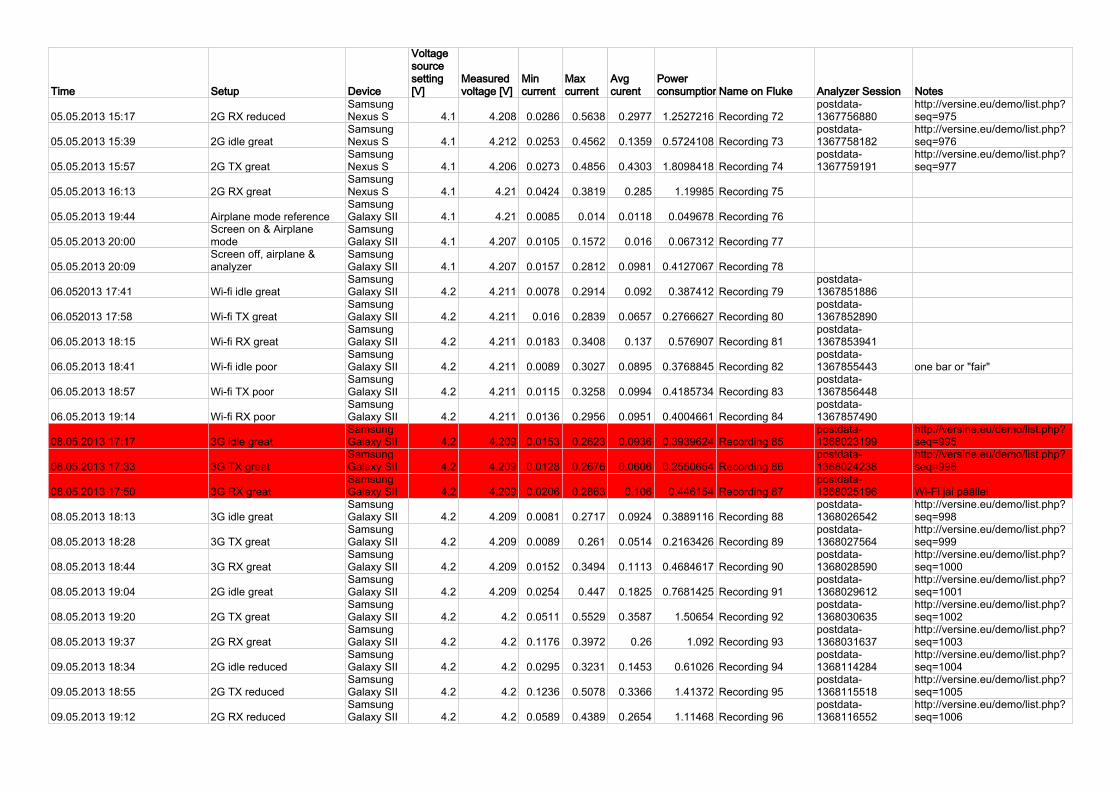
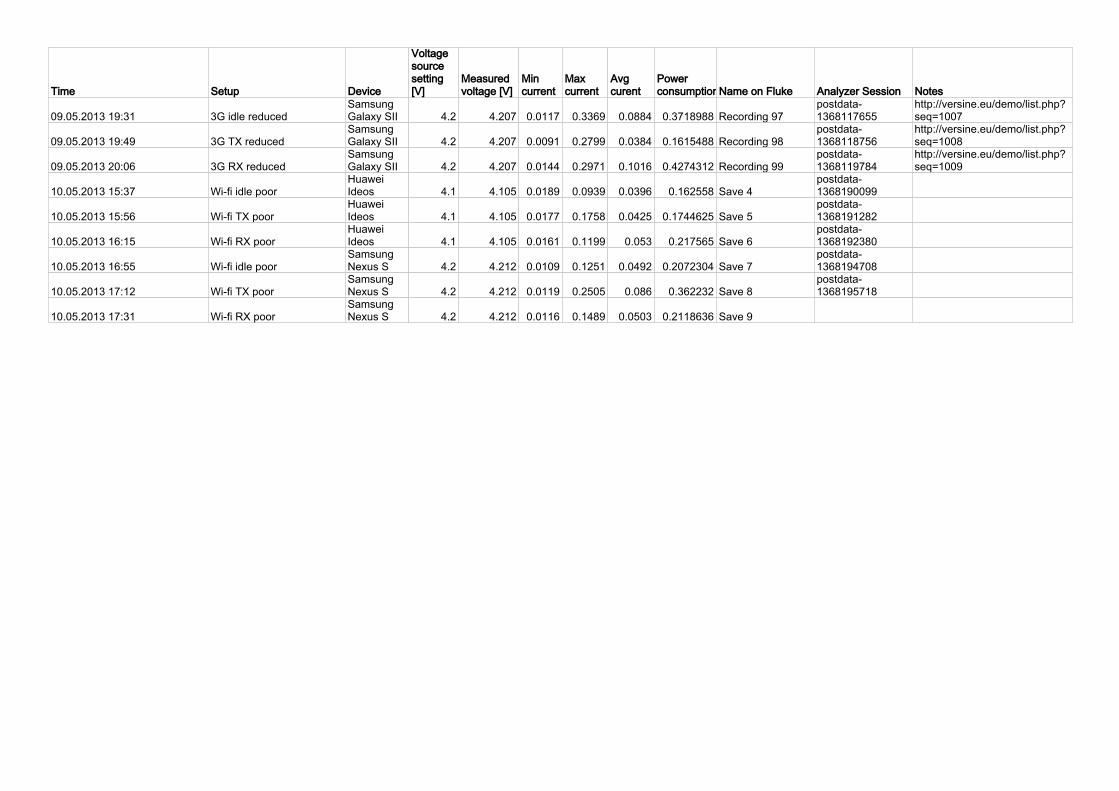
and average values were logged in a measurement record kept in a Google Drive
spreadsheet. Copy of the measurement record can be found in the appendices.
On the handset signal strength logging session was stopped and the data
immediately uploaded to server and then downloaded as a database �le onto a
computer for local browsing. With cell network technologies the signal strength was
veri�ed using MDO Visualizer web interface.
2.7 Setups
2.7.1 Controls
Power consumption was �rst measured in airplane more with the screen o� to
measure the power consumption of the operating system when all the radios are o�.
Then for reference power consumption was measured with the screen on. The third
control was measured with the handsets in airplane mode, screen o� and Versine
MDO Analyzer software running to see the impact of the logging software on the
power consumption.
2.7.2 Wi-Fi
For a Wi-Fi mesurements an ad hoc access point was made out of a Android
handset by using Wi-Fi hotspot connection sharing capability of the Android
operating system. For measurements with good signal conditions the access point
device was placed on the same table with the device under test approximately 10 cm
apart. To weaken the signal the access point device was taken a couple of rooms
14
over and put in a signal blocking pouch lines with a conductive mesh that e�ectively
makes it a Faraday cage.
2.7.3 Mobile
For mobile network measurements Wi-Fi was turned o� and the devices were
provided with a SIM card. The cellular provider was DNA. For 2G the option in
Androd mobile network settings to only allow 2G connections was used. Similar
option for 3G was not found in the handsets, but they always connected to 3G when
not explicitly told to do otherwise. For good signal conditions the device under test
was simply put on the table with no ar�ticial obstruction of signal reception. For
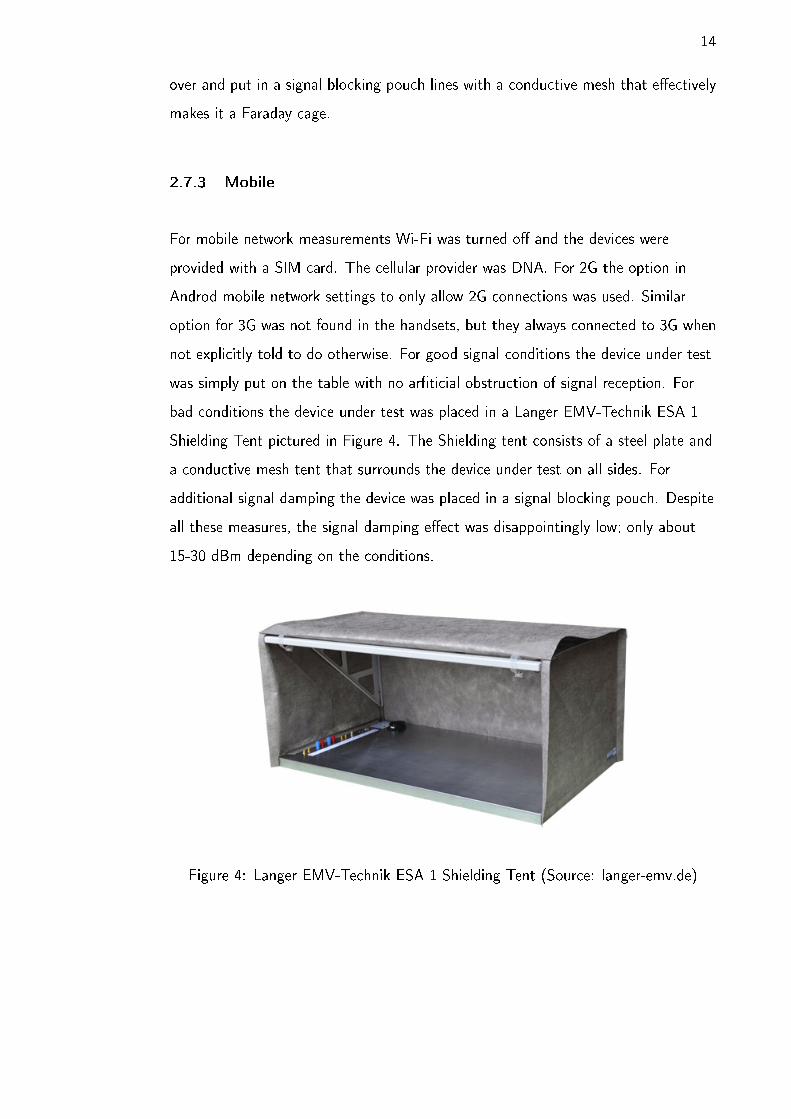
bad conditions the device under test was placed in a Langer EMV-Technik ESA 1
Shielding Tent pictured in Figure 4. The Shielding tent consists of a steel plate and
a conductive mesh tent that surrounds the device under test on all sides. For
additional signal damping the device was placed in a signal blocking pouch. Despite
all these measures, the signal damping e�ect was disappointingly low; only about
15-30 dBm depending on the conditions.
Figure 4: Langer EMV-Technik ESA 1 Shielding Tent (Source: langer-emv.de)
15
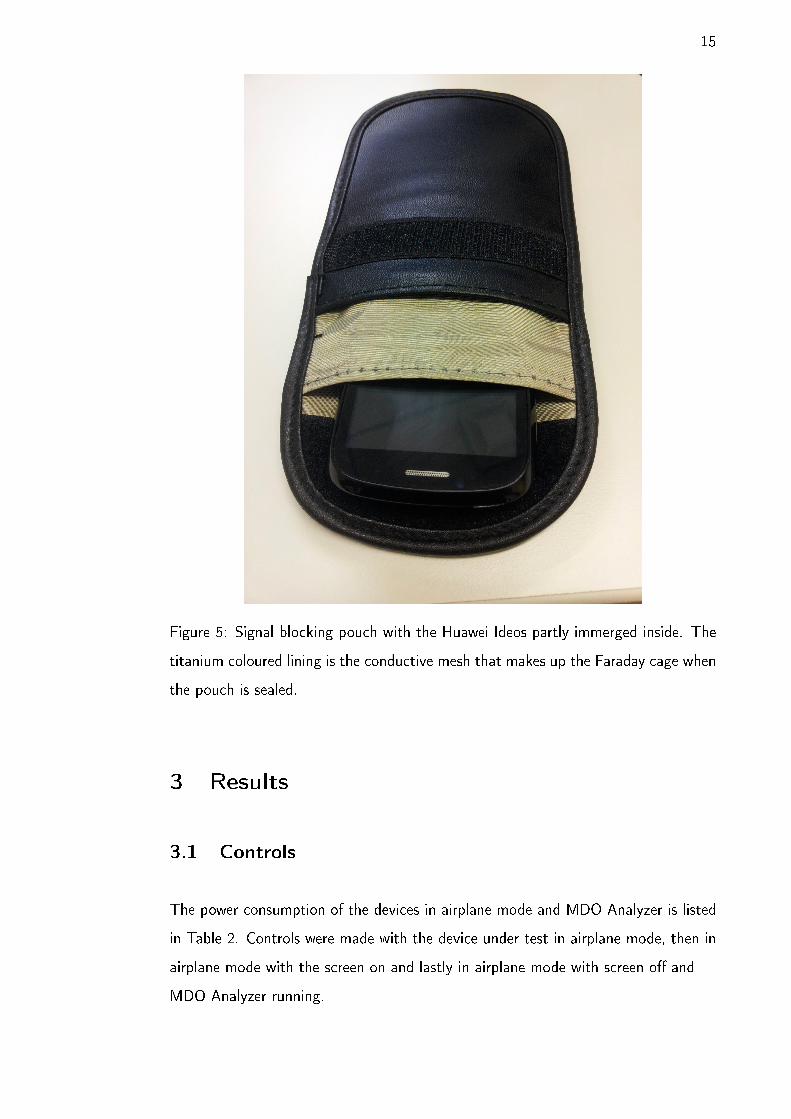
Figure 5: Signal blocking pouch with the Huawei Ideos partly immerged inside. The
titanium coloured lining is the conductive mesh that makes up the Faraday cage when
the pouch is sealed.
3 Results
3.1 Controls
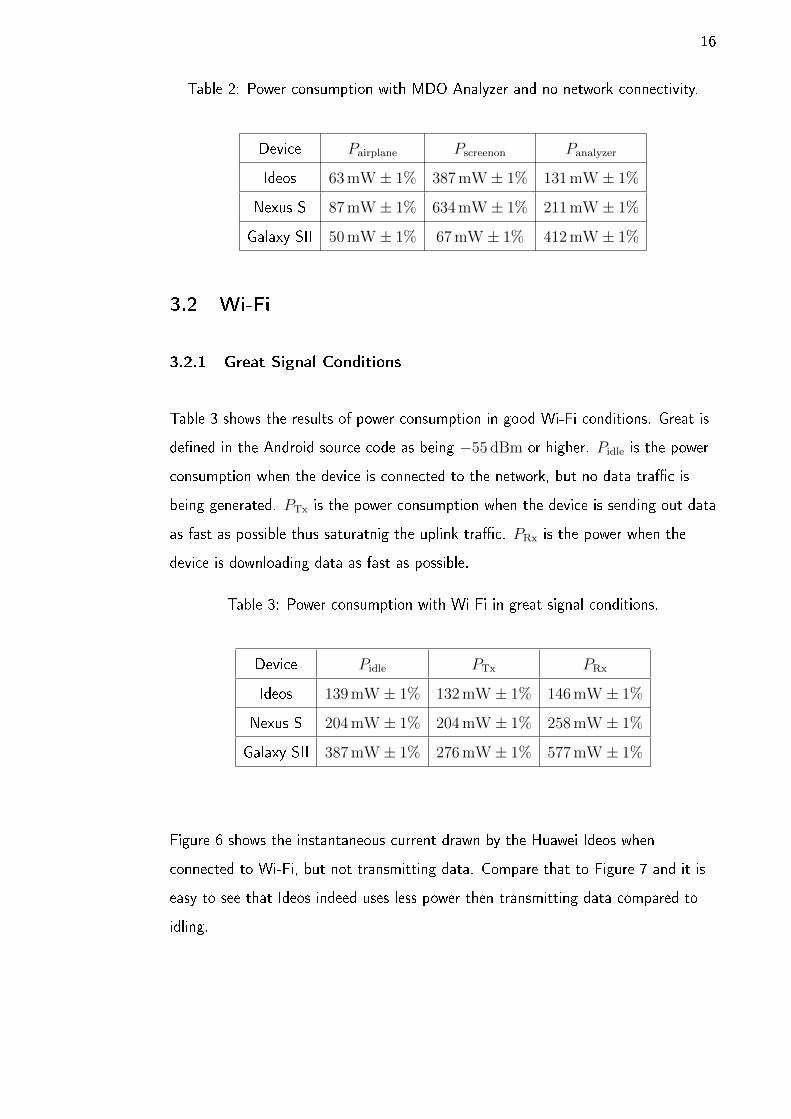
The power consumption of the devices in airplane mode and MDO Analyzer is listed
in Table 2. Controls were made with the device under test in airplane mode, then in
airplane mode with the screen on and lastly in airplane mode with screen o� and
MDO Analyzer running.
16
Table 2: Power consumption with MDO Analyzer and no network connectivity.
Device Pairplane Pscreenon Panalyzer
Ideos 63mW ± 1% 387mW ± 1% 131mW ± 1%
Nexus S 87mW ± 1% 634mW ± 1% 211mW ± 1%
Galaxy SII 50mW ± 1% 67mW ± 1% 412mW ± 1%
3.2 Wi-Fi
3.2.1 Great Signal Conditions
Table 3 shows the results of power consumption in good Wi-Fi conditions. Great is
de�ned in the Android source code as being −55 dBm or higher. Pidle is the power
consumption when the device is connected to the network, but no data tra�c is
being generated. PTx is the power consumption when the device is sending out data
as fast as possible thus saturatnig the uplink tra�c. PRx is the power when the
device is downloading data as fast as possible.
Table 3: Power consumption with Wi-Fi in great signal conditions.
Device Pidle PTx PRx
Ideos 139mW ± 1% 132mW ± 1% 146mW ± 1%
Nexus S 204mW ± 1% 204mW ± 1% 258mW ± 1%
Galaxy SII 387mW ± 1% 276mW ± 1% 577mW ± 1%
Figure 6 shows the instantaneous current drawn by the Huawei Ideos when
connected to Wi-Fi, but not transmitting data. Compare that to Figure 7 and it is
easy to see that Ideos indeed uses less power then transmitting data compared to
idling.

17
Figure 6: Current drawn by the Huawei Ideos while idling on Wi-Fi in great conditions
Figure 7: Current drawn by the Huawei Ideos while saturating uplink on Wi-Fi in
great conditions
3.2.2 Poor Signal Conditions
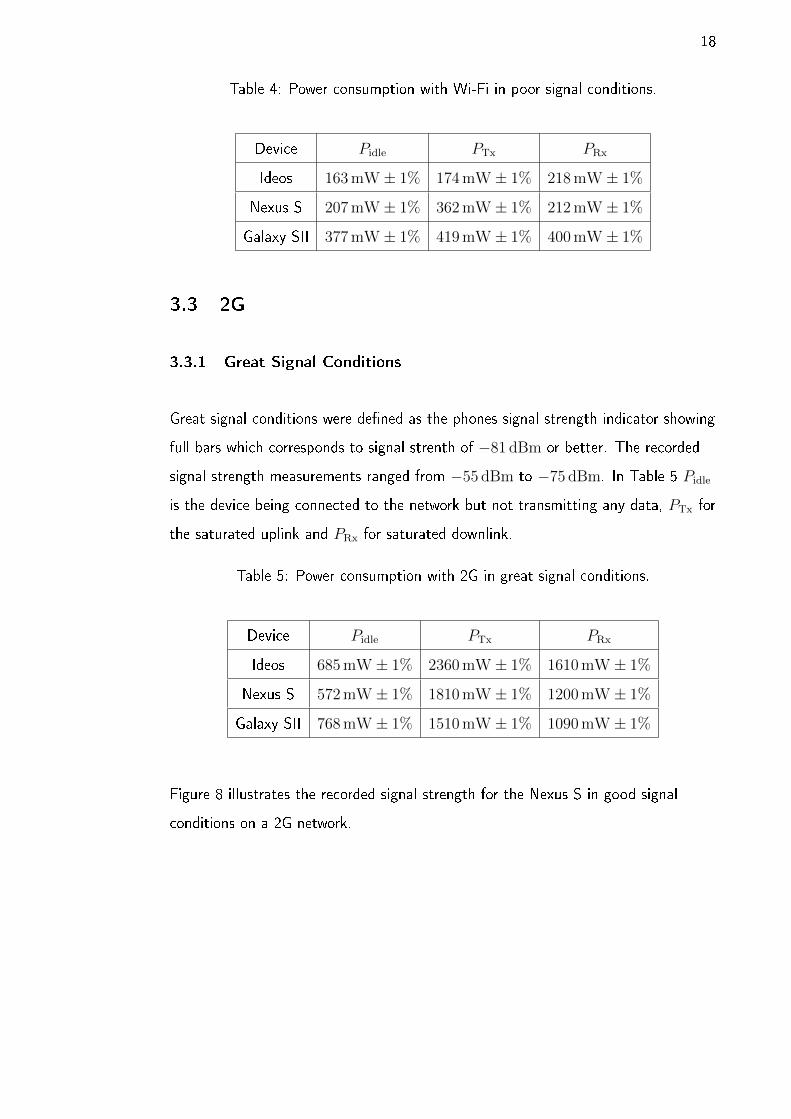
Table 4 displays the results in poor or fair Wi-Fi conditions. In this case fair was
de�ned as −70 dBm to −85 dBm and poor for anything below that. Again Pidle is
the device being connected to an access point but not transmitting any data, PTx
for the saturated uplink and PRx for saturated downlink.
18
Table 4: Power consumption with Wi-Fi in poor signal conditions.
Device Pidle PTx PRx
Ideos 163mW ± 1% 174mW ± 1% 218mW ± 1%
Nexus S 207mW ± 1% 362mW ± 1% 212mW ± 1%
Galaxy SII 377mW ± 1% 419mW ± 1% 400mW ± 1%
3.3 2G
3.3.1 Great Signal Conditions
Great signal conditions were de�ned as the phones signal strength indicator showing
full bars which corresponds to signal strenth of −81 dBm or better. The recorded
signal strength measurements ranged from −55 dBm to −75 dBm. In Table 5 Pidle
is the device being connected to the network but not transmitting any data, PTx for
the saturated uplink and PRx for saturated downlink.
Table 5: Power consumption with 2G in great signal conditions.
Device Pidle PTx PRx
Ideos 685mW ± 1% 2360mW ± 1% 1610mW ± 1%
Nexus S 572mW ± 1% 1810mW ± 1% 1200mW ± 1%
Galaxy SII 768mW ± 1% 1510mW ± 1% 1090mW ± 1%
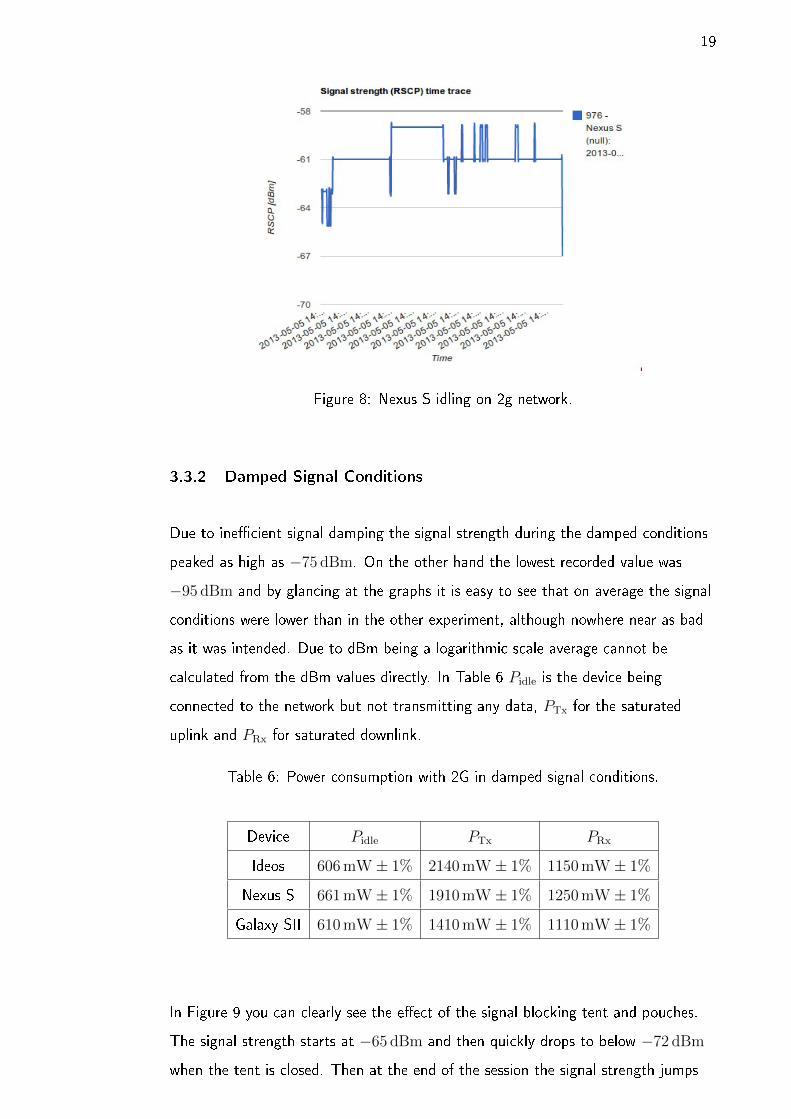
Figure 8 illustrates the recorded signal strength for the Nexus S in good signal
conditions on a 2G network.
19
Figure 8: Nexus S idling on 2g network.
3.3.2 Damped Signal Conditions
Due to ine�cient signal damping the signal strength during the damped conditions
peaked as high as −75 dBm. On the other hand the lowest recorded value was
−95 dBm and by glancing at the graphs it is easy to see that on average the signal
conditions were lower than in the other experiment, although nowhere near as bad
as it was intended. Due to dBm being a logarithmic scale average cannot be
calculated from the dBm values directly. In Table 6 Pidle is the device being
connected to the network but not transmitting any data, PTx for the saturated
uplink and PRx for saturated downlink.
Table 6: Power consumption with 2G in damped signal conditions.
Device Pidle PTx PRx
Ideos 606mW ± 1% 2140mW ± 1% 1150mW ± 1%
Nexus S 661mW ± 1% 1910mW ± 1% 1250mW ± 1%
Galaxy SII 610mW ± 1% 1410mW ± 1% 1110mW ± 1%
In Figure 9 you can clearly see the e�ect of the signal blocking tent and pouches.
The signal strength starts at −65 dBm and then quickly drops to below −72 dBm
when the tent is closed. Then at the end of the session the signal strength jumps

20
back to −65 dBm when the tent is opened and the device pulled out of the signal
blocking pouch to stop the logging session.
Figure 9: Nexus S idling on 2g network in damped signal conditions. The device
being placed in and taken out of the Faraday cage can be seen.
3.4 3G
3.4.1 Great Signal Conditions
During the measurements with 3G in great signal conditions (de�ned as better than
−81 dBm) the recorded signal strengths ranged from −55 dBm to −71 dBm. In
Table 7 Pidle is the device being connected to the network but not transmitting any
data, PTx for the saturated uplink and PRx for saturated downlink.
Table 7: Power consumption with 3G in great signal conditions.
Device Pidle PTx PRx
Ideos 140mW ± 1% 127mW ± 1% 123mW ± 1%
Nexus S 221mW ± 1% 204mW ± 1% 249mW ± 1%
Galaxy SII 389mW ± 1% 216mW ± 1% 468mW ± 1%
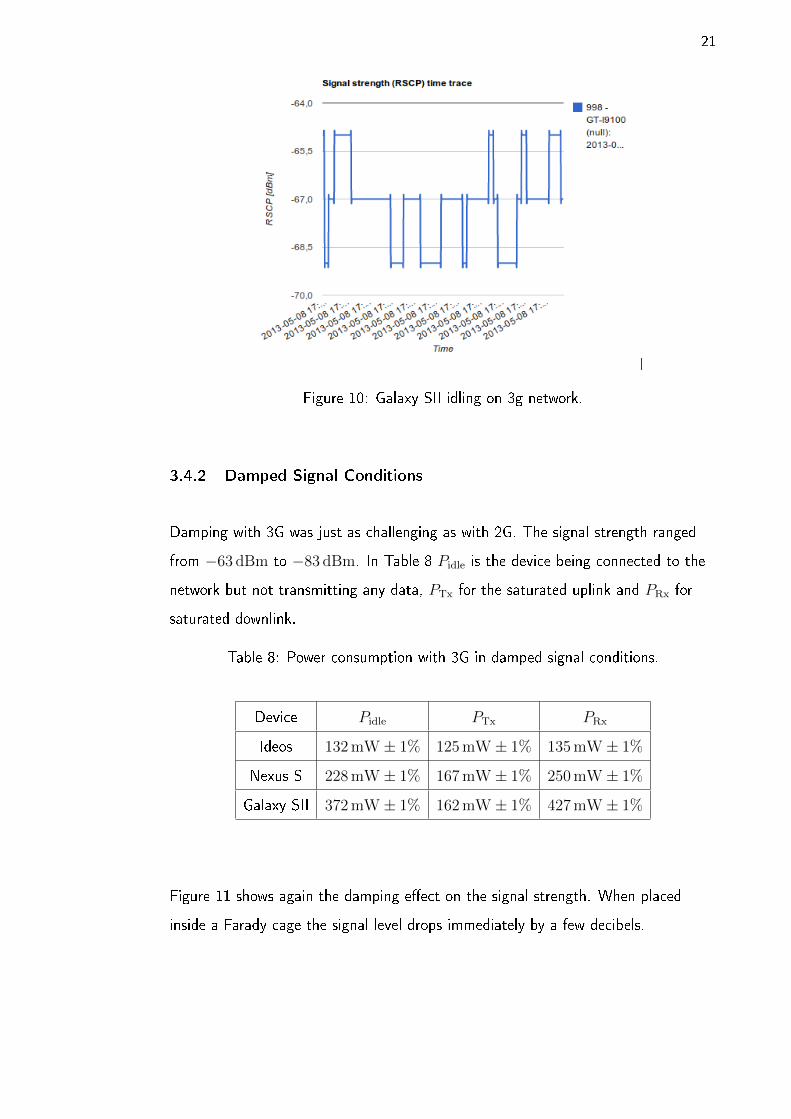
3G signal strength on the Galaxy SII in great signal conditions is shown in Figure 10.
21
Figure 10: Galaxy SII idling on 3g network.
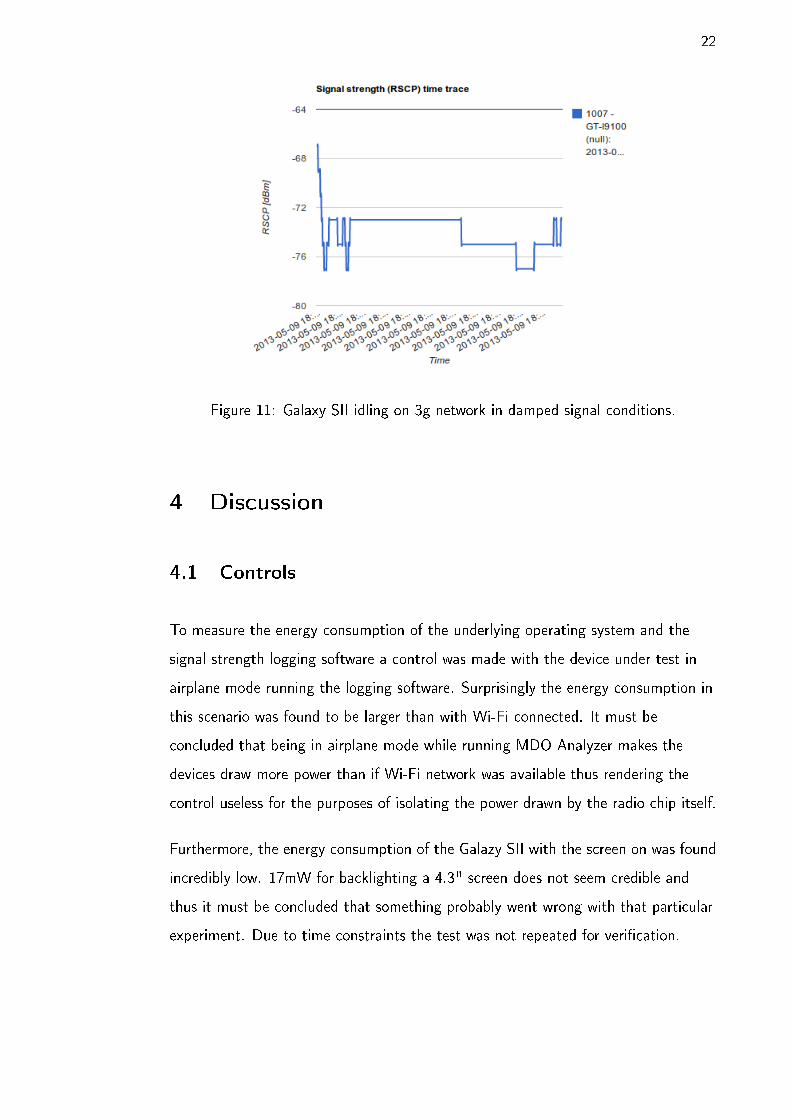
3.4.2 Damped Signal Conditions
Damping with 3G was just as challenging as with 2G. The signal strength ranged
from −63 dBm to −83 dBm. In Table 8 Pidle is the device being connected to the
network but not transmitting any data, PTx for the saturated uplink and PRx for
saturated downlink.
Table 8: Power consumption with 3G in damped signal conditions.
Device Pidle PTx PRx
Ideos 132mW ± 1% 125mW ± 1% 135mW ± 1%
Nexus S 228mW ± 1% 167mW ± 1% 250mW ± 1%
Galaxy SII 372mW ± 1% 162mW ± 1% 427mW ± 1%
Figure 11 shows again the damping e�ect on the signal strength. When placed
inside a Farady cage the signal level drops immediately by a few decibels.
22
Figure 11: Galaxy SII idling on 3g network in damped signal conditions.
4 Discussion
4.1 Controls
To measure the energy consumption of the underlying operating system and the
signal strength logging software a control was made with the device under test in
airplane mode running the logging software. Surprisingly the energy consumption in
this scenario was found to be larger than with Wi-Fi connected. It must be
concluded that being in airplane mode while running MDO Analyzer makes the
devices draw more power than if Wi-Fi network was available thus rendering the
control useless for the purposes of isolating the power drawn by the radio chip itself.
Furthermore, the energy consumption of the Galazy SII with the screen on was found
incredibly low. 17mW for backlighting a 4.3" screen does not seem credible and
thus it must be concluded that something probably went wrong with that particular
experiment. Due to time constraints the test was not repeated for veri�cation.
23
4.2 Wi-Fi
Wi-Fi provided a surprise. It would appear that idling on Wi-Fi uses just as much
power as uploading data at full speed. In fact under optimal signal conditions
uploading seemed to use less power than idling. This e�ect was more pronounced
with the Galaxy SII; however, the other handsets provided similar results.
When signal conditions were made worse the results became mixed. With Ideos all
the measurements provided a little bit higher energy consumption, but with the
Samsung devices downloading appeared to be using less power than under optimal
conditions. This might be explained by Android's energy saving feature that seems
to turn the radio o� if the access point signal strenghth drops below −90 dBm for
an extended period of time. When that happens the operating system reports the
connection status as Temporarily avoiding poor connection rather than as
Disconnected. When the received signal strength dropped below −100 dBm
Android would disconnect immediately.
4.3 2G
Another surprise was the performance of 2G networking. Right away it was clear
that the power consumption was an order of magnitude higher compared to 3G.
Especially uploading under good signal conditions would use up to 18 times more
power than with 3G. That combined with the lower tansmission speeds means that
one might end up using over 100 times the amount energy to upload a �le on 2G.
Damping the signal strenght by 20 dBm seemed to produce counter intuitive results
with the Huawei handset. All measurements yielded lower energy usage. More
detailed review of the logging data revealed that under good conditions the handset
was connected using GPRS, but in the damped signal scenario it was switching
between EDGE and GPRS. It could be that EDGE was the reason the total energy
consumption was lower. However this was not experimentally veri�ed due to time
constraints.
In the book Batteries in a Portable World: A Handbook on Rechargeable Batteries
for Non-Engineers author Isidor Buchmann writes about the progress made on
lowering the energy consumption of mobile devices.
24
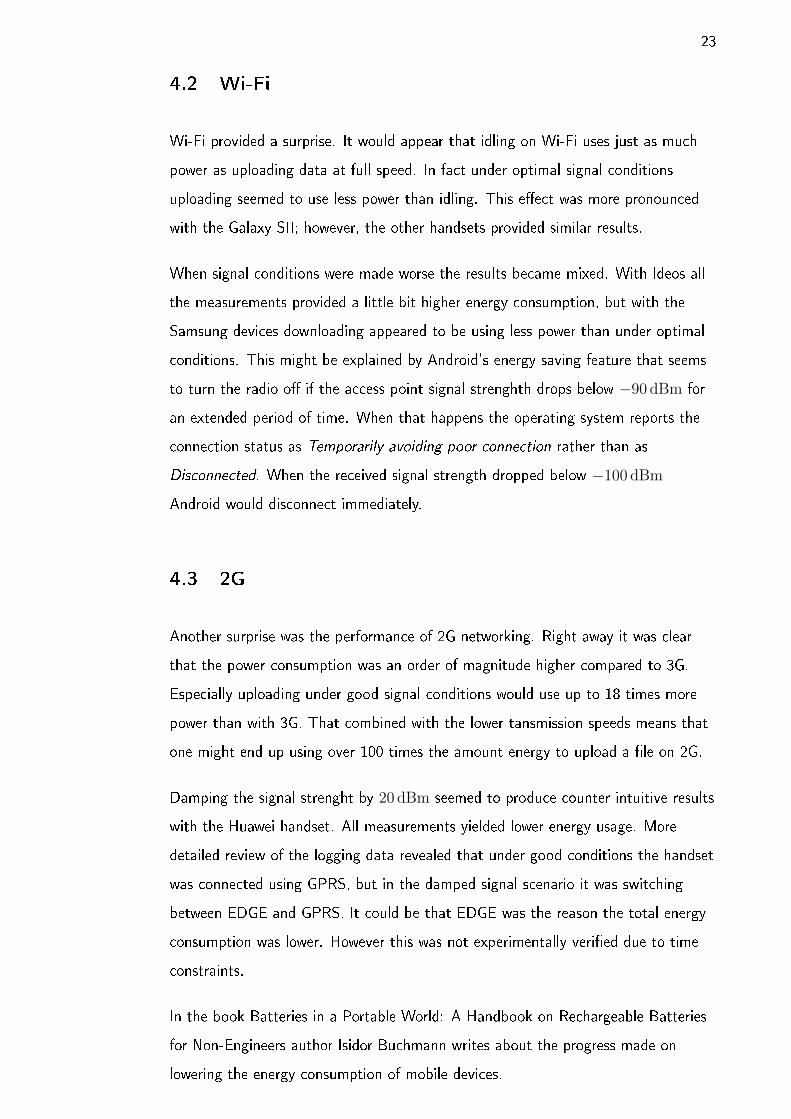
During the last few years, sandby and talk-times on cell phones have
improved. Besides increases in the speci�c energy of lithium-ion,
improvements in receiver and demodulator circuits have achieved
notable energy savings. Figure 8-27 illustrates the reduction of power
consumption in these circuits since 2002. We must keep in mind that
the energy savings apply mainly to standby and receiving circuits.
Transmitting still requires about �ve times the powere of the receiving
and demodulation. (Buchmann 2011.)
Figure 12: Figure 8-27 from Buchmanns book Batteries in a Portable World: A
Handbook on Rechargeable Batteries for Non-Engineers.
The trajectory illustrated in Figure 12 corresponds well with the results in 2G
networks. However, the days when transmission used �ve times more power than
reception are over. Even more so in 3G networks where receiving proved to be more
expensive. In many cases idling on the networks used more power than transmission.
4.4 3G
3G provided results similar to Wi-Fi in the sense that idling was found to draw more
power than transmitting data. Again the e�ect was more pronounced with Galaxy
SII but appeared in all the test cases. Damping the signal strength yielded mixed
results. In most cases worse signal strength resulted in lower power consumption.
This might be due to poor signal damping and random variation. A more thorough
study with better signal damping could not be performed due to time constraints.

25
4.5 Estimating Error
An error was estimated by taking into account the accuracy as reported by the
multimeter manufacturer and by looking at the voltage oscillation during the
measurements. It was estimated that voltage was accurate to ±0.020V. With
voltages around 4V range that would correspond with the accuracy of ±0.5%.
That added with the reported accuracy of ±0.06% of the Fluke 289 the error of the
product was estimated as being well under ±1%.
The current measurements consisted of the average current over a data set of 900
to 1500 samples in all cases except the reference with the screen on, which only had
300 samples. When the measurements were made in multiple �ve minute sessions
there were cases where measurements provided identical results up to four decimal
places. That would suggest that the current measurement results should be quite
consistent.
4.6 Signal Damping
Damping signal strength was found to be the most challenging part of the
experiment. Initial tests with signal blocking pouches were promising and the
devices lost all connectivity when placed in the pouch and the Faraday cage was
sealed. However, it turned out that the leads that connected the DC power supply
to the battery pins prevented sealing the pouch and the device was only partially
covered by the conductive mesh. This did not provide the level of signal reduction
that was desired. A EMS shielding tent that basically is a large Faraday cage on its
own was used. The tent only reduced the signal by 10− 20 dBm. A few additional
dBm was shaved by partially placing the device under test in signal blocking
pouches inside the tent. This was nowhere near the desired level of damping of
50− 60 dBm. In hindsight it would have been better to �nd a basement of a
building with bad cell reception and run the tests there instead of trying to use
Faraday cages which proved highly ine�ective in dampening the signal strength.
26
4.7 Lessons Learned
The most di�cult part as explained earlier was fabricating poor signal conditions
reliably.
Also logging the signal strength with minimal power overhead is something that
could have used more looking into. Due to time and resource limitations more time
could not be spent on modifying MDO Analyzer for this experiment.
Right now LTE is the hot topic in the mobile network industry, but the lack of
available handsets and even LTE capable SIM cards excluded LTE from the study.
At the time of writing this thesis the �rst LTE capable smartphones have hit the
market in Finland and if this project was starting now LTE would probably be the
main focus of the study.
One of the hardest tasks was estimating the time required for making the
experiments. All kinds of unexpected obstacles kept delaying �nishing up the
measurements. These obstacles varied from personal time management failures to
broken hardware and laboratory access problems.
27
References
Buchmann, I. 2011. Batteries in a Portable World: A Handbook on Rechargeable
Batteries for Non-Engineers. Ed: 3rd. Richmond, British Columbia, Canada: Cadex
Electronics Inc.
GSM Arena. Huawei U8150 IDEOS. Referenced 11.5.2013.
Http://www.gsmarena.com/huawei_u8150_ideos-3513.php
GSM Arena. Samsung Google Nexus S I9023. Referenced 11.5.2013.
Http://www.gsmarena.com/samsung_google_nexus_s_i9023-3910.php
GSM Arena. Samsung I9100 Galaxy S II. Referenced 11.5.2013.
Http://www.gsmarena.com/samsung_i9100_galaxy_s_ii-3621.php
Fluke Series 170 Multimeters. Referenced 11.5.2013. Http://www.fluke.com/
fluke/usen/digital-multimeters/fluke-170.htm?PID=56027, Speci�cations
Fluke 289 True-rms Industrial Logging Multimeter with TrendCapture. Referenced
11.5.2013. Http://www.fluke.com/fluke/usen/digital-multimeters/
fluke-289.htm?PID=56061&trck=289specifications, Speci�cations
Lagner EMV-Technik. Components of ESA1 Development System Disturbance
Emission. Referenced 12.5.2013. Http://www.langer-emv.de/en/products/
disturbance-emission/development-system/esa-1/sets-data/
Wikipedia. Mobile phone. Referenced 12.5.2013.
Http://en.wikipedia.org/wiki/Mobile_phone

28
Appendices
Measurement Record
13.12.2012 19:01 Airplane mode referenceHuaweiIdeos 4.1000 4.112 0.0014 0.0016 0.0015 0.006168 Recording 2
13.12.2012 19:42 Airplane mode referenceHuaweiIdeos 4.1000 4.112 0.0015 0.0016 0.0015 0.006168 Recording 3
13.12.2012 19:48 Airplane mode referenceHuaweiIdeos 4.1000 4.112 0.0014 0.0016 0.0015 0.006168 Recording 4
13.12.2012 19:54 Airplane mode referenceHuaweiIdeos 4.1000 4.112 0.0014 0.111 0.0017 0.0069904 Recording 5
13.12.2012 19:59 Airplane mode referenceHuaweiIdeos 4.1000 4.112 0.0015 0.0016 0.0015 0.006168 Recording 6
13.12.2012 20:11 Airplane mode referenceSamsungNexus S 4.1950 4.211 0.0015 0.1411 0.002 0.008422 Recording 7
Something was drawing asuspicious amount of current inthe beginning of themeasurement
13.12.2012 20:17 Airplane mode referenceSamsungNexus S 4.1950 4.211 0.0014 0.15 0.002 0.008422 Recording 8 Similar spike in this one too
13.12.2012 20:24 Airplane mode referenceSamsungNexus S 4.1950 4.211 0.0015 0.0049 0.0017 0.0071587 Recording 9
13.12.2012 20:29 Airplane mode referenceSamsungNexus S 4.1950 4.211 0.0015 0.1696 0.0019 0.0080009 Recording 10
13.12.2012 20:34 Airplane mode referenceSamsungNexus S 4.1950 4.211 0.0015 0.2113 0.0027 0.0113697 Recording 11
13.12.2012 20:40Screen on & Airplanemode
SamsungNexus S 4.1950 4.206 0.1492 0.2207 0.1508 0.6342648 Recording 12
13.12.2012 20:50Screen on & Airplanemode
HuaweiIdeos 4.1000 4.109 0.0806 0.1704 0.0941 0.3866569 Recording 13
13.04.2013 17:37Screen off, airplane &analyzer
HuaweiIdeos 4.1000 4.112 0.0153 0.0517 0.0303 0.1245936 Recording 14
Profile: Mobile signal strengthonly, no SIM
13.04.2013 17:43Screen off, airplane &analyzer
HuaweiIdeos 4.1000 4.112 0.014 0.0506 0.029 0.119248 Recording 15
Profile: Mobile signal strengthonly, no SIM
13.04.2013 17:54Screen off, airplane &analyzer
HuaweiIdeos 4.1000 4.112 0.0142 0.0488 0.028 0.115136 Recording 16
Profile: Mobile signal strengthonly, no SIM
13.04.2013 18:00Screen off, airplane &analyzer
HuaweiIdeos 4.1000 4.112 0.0165 0.052 0.029 0.119248 Recording 17
Profile: Mobile signal strengthonly, no SIM
13.04.2013 18:06Screen off, airplane &analyzer
HuaweiIdeos 4.1000 4.112 0.0158 0.0498 0.0263 0.1081456 Recording 18
Profile: Mobile signal strengthonly, no SIM
13.04.2013 19:24Screen off, airplane &analyzer
SamsungNexus S 4.1950 4.211 0.012 0.1114 0.048 0.202128 Recording 19
Profile: Mobile signal strengthonly, no SIM
13.04.2013 19:30Screen off, airplane &analyzer
SamsungNexus S 4.1950 4.211 0.0133 0.1063 0.0495 0.2084445 Recording 20
Profile: Mobile signal strengthonly, no SIM
13.04.2013 19:36Screen off, airplane &analyzer
SamsungNexus S 4.1950 4.211 0.0134 0.1084 0.0507 0.2134977 Recording 21
Profile: Mobile signal strengthonly, no SIM
13.04.2013 19:46Screen off, airplane &analyzer
SamsungNexus S 4.1950 4.211 0.0102 0.1115 0.0512 0.2156032 Recording 22
Profile: Mobile signal strengthonly, no SIM
13.04.2013 19:52Screen off, airplane &analyzer
SamsungNexus S 4.1950 4.211 0.0087 0.1101 0.0513 0.2160243 Recording 23
Profile: Mobile signal strengthonly, no SIM
14.04.2013 12:35 Wi-fi idle greatHuaweiIdeos 4.08 4.113 0.0185 0.0894 0.0355 0.1460115 Recording 24
postdata-1365932097 New DC power supply!
14.04.2013 12:44 Wi-fi idle greatHuaweiIdeos 4.08 4.113 0.0191 0.0942 0.0374 0.1538262 Recording 25
postdata-1365932838
Time Setup Device
Voltagesourcesetting[V]
Measuredvoltage [V]
Mincurrent
Maxcurrent
Avgcurent
PowerconsumptionName on Fluke Analyzer Session Notes

14.04.2013 12:56 Wi-fi idle greatHuaweiIdeos 4.08 4.113 0.0161 0.08 0.0333 0.1369629 Recording 26
postdata-1365933449
14.04.2013 13:06 Wi-fi idle greatHuaweiIdeos 4.08 4.113 0.0186 0.0764 0.0322 0.1324386 Recording 27
postdata-1365934118
14.04.2013 13:14 Wi-fi idle greatHuaweiIdeos 4.08 4.113 0.0166 0.0734 0.0309 0.1270917 Recording 28
postdata-1365934499
14.04.2013 14:24 Wi-fi TX greatHuaweiIdeos 4.08 4.113 0.016 0.0703 0.0301 0.1238013 Recording 29
postdata-1365938749
14.04.2013 14:31 Wi-fi TX greatHuaweiIdeos 4.08 4.113 0.0156 0.0812 0.0288 0.1184544 Recording 30
postdata-1365939232
14.04.2013 14:39 Wi-fi TX greatHuaweiIdeos 4.08 4.113 0.0164 0.0774 0.0337 0.1386081 Recording 31
postdata-1365939605
14.04.2013 14:46 Wi-fi TX greatHuaweiIdeos 4.08 4.113 0.0169 0.0779 0.0338 0.1390194 Recording 32
postdata-1365940031
14.04.2013 14:54 Wi-fi TX greatHuaweiIdeos 4.08 4.113 0.0184 0.0752 0.0344 0.1414872 Recording 33
postdata-1365940493
14.04.2013 15:00 Wi-fi RX greatHuaweiIdeos 4.08 4.113 0.0196 0.0685 0.036 0.148068 Recording 34
postdata-1365940869
14.04.2013 15:07 Wi-fi RX greatHuaweiIdeos 4.08 4.113 0.0191 0.0627 0.0347 0.1427211 Recording 35
postdata-1365941255
14.04.2013 15:16 Wi-fi RX greatHuaweiIdeos 4.08 4.113 0.0195 0.0708 0.036 0.148068 Recording 36
postdata-1365941836
14.04.2013 16:54 Wi-fi idle poorHuaweiIdeos 4.08 4.113 0.0168 0.0653 0.029 0.119277 Recording 37 Analyzer ei toiminut
14.04.2013 17:09 Wi-fi idle poorHuaweiIdeos 4.08 4.113 0.0157 0.068 0.0288 0.1184544 Recording 38
14.04.2013 18:18 Wi-fi idle poorHuaweiIdeos 4.08 4.113 0.0167 0.0737 0.0314 0.1291482 Save 2
postdata-1365952836
24.04.2013 18:11 Wi-fi idle greatSamsungNexus S 4.16 4.212 0.013 0.1135 0.0497 0.2093364 Recording 39
25.04.2013 17:38 Wi-fi idle greatSamsungNexus S 4.19 4.212 0.0136 0.1091 0.0495 0.208494 Recording 40
postdata-1366900687
25.04.2013 17:45 Wi-fi idle greatSamsungNexus S 4.19 4.212 0.0135 0.1142 0.0464 0.1954368 Recording 41
postdata-1366901237
25.04.2013 17:59 Wi-fi TX greatSamsungNexus S 4.19 4.212 0.0139 0.1823 0.0409 0.1722708 Recording 42
postdata-1366902029
25.04.2013 18:06 Wi-fi TX greatSamsungNexus S 4.19 4.212 0.0152 0.171 0.0526 0.2215512 Recording 43
postdata-1366902478
25.04.2013 18:15 Wi-fi TX greatSamsungNexus S 4.19 4.212 0.0139 0.1386 0.0516 0.2173392 Recording 44
postdata-1366902941
25.04.2013 18:32 Wi-fi RX greatSamsungNexus S 4.19 4.212 0.0122 0.2111 0.0581 0.2447172 Recording 45
postdata-1366903980
25.04.2013 18:41 Wi-fi RX greatSamsungNexus S 4.19 4.212 0.0175 0.2146 0.0756 0.3184272 Recording 46
postdata-1366904454
25.04.2013 18:49 Wi-fi RX greatSamsungNexus S 4.19 4.212 0.0127 0.2013 0.0503 0.2118636 Recording 47
postdata-1366905060
May have disconnected fromWifi during the session
25.04.2013 19:35 Wi-fi idle poorSamsungNexus S 4.19 4.212 0.0147 0.1133 0.0483 0.2034396 Save 3
postdata-1366909000
25.04.2013 19:42 Wi-fi idle poorSamsungNexus S 4.19 4.212 0.0148 0.1096 0.0507 0.2135484 Recording 48
postdata-1366909000 Disconnected
Time Setup Device
Voltagesourcesetting[V]
Measuredvoltage [V]
Mincurrent
Maxcurrent
Avgcurent
PowerconsumptionName on Fluke Analyzer Session Notes
25.04.2013 19:50 Wi-fi idle poorSamsungNexus S 4.19 4.212 0.015 0.1289 0.0545 0.229554 Recording 49
postdata-1366909000 Disconnected
28.04.2013 12:03 3G idle greatHuaweiIdeos 3.99 4.112 0 Vituix, ei APN-asetuksia
28.04.2013 12:35 3G idle greatHuaweiIdeos 3.97 4.111 0.0192 0.0812 0.034 0.139774 Recording 51
postdata-1367142145
28.04.2013 12:35 3G TX greatHuaweiIdeos 3.97 4.111 0.0222 0.044 0.031 0.127441 Recording 52
postdata-1367143322
28.04.2013 13:10 3G RX greatHuaweiIdeos 3.97 4.111 0.0231 0.454 0.03 0.12333 Recording 53
postdata-1367144354
28.04.2013 14:43 3G idle reducedHuaweiIdeos 3.97 4.111 0.0182 0.0752 0.032 0.131552 Recording 54
postdata-1367149994
http://versine.eu/demo/list.php?seq=939
28.04.2013 15:04 3G TX reducedHuaweiIdeos 3.97 4.111 0.0208 0.1069 0.0303 0.1245633 Recording 55
postdata-1367151292
http://versine.eu/demo/list.php?seq=940
28.04.2013 15:04 3G RX reducedHuaweiIdeos 3.97 4.111 0.0182 0.0757 0.0328 0.1348408 Recording 56
postdata-1367152862
http://versine.eu/demo/list.php?seq=941
28.04.2013 15:56 2G idle reducedHuaweiIdeos 3.97 4.111 0.0166 0.5763 0.1473 0.6055503 Recording 57
postdata-1367154524
http://versine.eu/demo/list.php?seq=942
28.04.2013 16:16 2G TX reducedHuaweiIdeos 3.97 4.11 0.0285 0.5444 0.5197 2.135967 Recording 58
postdata-1367155770
http://versine.eu/demo/list.php?seq=943
28.04.2013 16:36 2G RX reducedHuaweiIdeos 3.97 4.111 0.0235 0.5482 0.28 1.15108 Recording 59
postdata-1367156869
http://versine.eu/demo/list.php?seq=944
28.04.2013 18:35 2G idle greatHuaweiIdeos 3.97 4.111 0.019 0.5866 0.1666 0.6848926 Recording 60
postdata-1367164049
http://versine.eu/demo/list.php?seq=945
28.04.2013 19:04 2G TX greatHuaweiIdeos 3.97 4.111 0.4256 0.6036 0.575 2.363825 Recording 61
postdata-1367164049
http://versine.eu/demo/list.php?seq=946
28.04.2013 19:55 2G RX greatHuaweiIdeos 3.97 4.111 0.2271 0.4575 0.3906 1.6057566 Recording 62
postdata-1367169254 Analyzer-data mättää
28.04.2013 20:26 3G idle greatSamsungNexus S 4.2 4.212 0.0104 0.1202 0.0524 0.2207088 Recording 63
postdata-1367170661
http://versine.eu/demo/list.php?seq=948
28.04.2013 21:08 3G TX greatSamsungNexus S 4.2 4.212 0.0145 0.116 0.0485 0.204282 Recording 64
postdata-1367173135
http://versine.eu/demo/list.php?seq=949
28.04.2013 21:27 3G RX greatSamsungNexus S 4.2 4.212 0.0182 0.1179 0.0592 0.2493504 Recording 65
postdata-1367174169
05.05.2013 11:25 2G RX greatHuaweiIdeos 4.08 4.111 0
Huawei buuttasi keskenmittauksen
05.05.2013 12:05 2G RX greatHuaweiIdeos 4 4.111 0.0118 0.4773 0.4003 1.6456333 Recording 66
postdata-1367745452
Uusi jännitelähde Aplab, jätäviimeinen minuutti poisvirtamittauksesta, http://versine.eu/demo/list.php?seq=969
05.05.2013 13:46 3G idle reducedSamsungNexus S 4.1 4.207 0.0171 0.1162 0.0541 0.2275987 Recording 67
postdata-1367751489
http://versine.eu/demo/list.php?seq=970
05.05.2013 14:06 3G TX reducedSamsungNexus S 4.1 4.207 0.0156 0.1167 0.0397 0.1670179 Recording 68
postdata-1367752591
http://versine.eu/demo/list.php?seq=971
05.05.2013 14:24 3G RX reducedSamsungNexus S 4.1 4.207 0.0121 0.1883 0.0594 0.2498958 Recording 69
postdata-1367753646
http://versine.eu/demo/list.php?seq=972
05.05.2013 14:41 2G idle reducedSamsungNexus S 4.1 4.209 0.0242 0.5269 0.157 0.660813 Recording 70
postdata-1367754731
http://versine.eu/demo/list.php?seq=973
05.05.2013 15:00 2G TX reducedSamsungNexus S 4.1 4.202 0.2439 0.4834 0.4541 1.9081282 Recording 71
postdata-1367755832
http://versine.eu/demo/list.php?seq=974
Time Setup Device
Voltagesourcesetting[V]
Measuredvoltage [V]
Mincurrent
Maxcurrent
Avgcurent
PowerconsumptionName on Fluke Analyzer Session Notes
05.05.2013 15:17 2G RX reducedSamsungNexus S 4.1 4.208 0.0286 0.5638 0.2977 1.2527216 Recording 72
postdata-1367756880
http://versine.eu/demo/list.php?seq=975
05.05.2013 15:39 2G idle greatSamsungNexus S 4.1 4.212 0.0253 0.4562 0.1359 0.5724108 Recording 73
postdata-1367758182
http://versine.eu/demo/list.php?seq=976
05.05.2013 15:57 2G TX greatSamsungNexus S 4.1 4.206 0.0273 0.4856 0.4303 1.8098418 Recording 74
postdata-1367759191
http://versine.eu/demo/list.php?seq=977
05.05.2013 16:13 2G RX greatSamsungNexus S 4.1 4.21 0.0424 0.3819 0.285 1.19985 Recording 75
05.05.2013 19:44 Airplane mode referenceSamsungGalaxy SII 4.1 4.21 0.0085 0.014 0.0118 0.049678 Recording 76
05.05.2013 20:00Screen on & Airplanemode
SamsungGalaxy SII 4.1 4.207 0.0105 0.1572 0.016 0.067312 Recording 77
05.05.2013 20:09Screen off, airplane &analyzer
SamsungGalaxy SII 4.1 4.207 0.0157 0.2812 0.0981 0.4127067 Recording 78
06.052013 17:41 Wi-fi idle greatSamsungGalaxy SII 4.2 4.211 0.0078 0.2914 0.092 0.387412 Recording 79
postdata-1367851886
06.052013 17:58 Wi-fi TX greatSamsungGalaxy SII 4.2 4.211 0.016 0.2839 0.0657 0.2766627 Recording 80
postdata-1367852890
06.05.2013 18:15 Wi-fi RX greatSamsungGalaxy SII 4.2 4.211 0.0183 0.3408 0.137 0.576907 Recording 81
postdata-1367853941
06.05.2013 18:41 Wi-fi idle poorSamsungGalaxy SII 4.2 4.211 0.0089 0.3027 0.0895 0.3768845 Recording 82
postdata-1367855443 one bar or "fair"
06.05.2013 18:57 Wi-fi TX poorSamsungGalaxy SII 4.2 4.211 0.0115 0.3258 0.0994 0.4185734 Recording 83
postdata-1367856448
06.05.2013 19:14 Wi-fi RX poorSamsungGalaxy SII 4.2 4.211 0.0136 0.2956 0.0951 0.4004661 Recording 84
postdata-1367857490
08.05.2013 17:17 3G idle greatSamsungGalaxy SII 4.2 4.209 0.0153 0.2623 0.0936 0.3939624 Recording 85
postdata-1368023199
http://versine.eu/demo/list.php?seq=995
08.05.2013 17:33 3G TX greatSamsungGalaxy SII 4.2 4.209 0.0128 0.2676 0.0606 0.2550654 Recording 86
postdata-1368024238
http://versine.eu/demo/list.php?seq=996
08.05.2013 17:50 3G RX greatSamsungGalaxy SII 4.2 4.209 0.0206 0.2863 0.106 0.446154 Recording 87
postdata-1368025196 Wi-Fi jäi päälle!
08.05.2013 18:13 3G idle greatSamsungGalaxy SII 4.2 4.209 0.0081 0.2717 0.0924 0.3889116 Recording 88
postdata-1368026542
http://versine.eu/demo/list.php?seq=998
08.05.2013 18:28 3G TX greatSamsungGalaxy SII 4.2 4.209 0.0089 0.261 0.0514 0.2163426 Recording 89
postdata-1368027564
http://versine.eu/demo/list.php?seq=999
08.05.2013 18:44 3G RX greatSamsungGalaxy SII 4.2 4.209 0.0152 0.3494 0.1113 0.4684617 Recording 90
postdata-1368028590
http://versine.eu/demo/list.php?seq=1000
08.05.2013 19:04 2G idle greatSamsungGalaxy SII 4.2 4.209 0.0254 0.447 0.1825 0.7681425 Recording 91
postdata-1368029612
http://versine.eu/demo/list.php?seq=1001
08.05.2013 19:20 2G TX greatSamsungGalaxy SII 4.2 4.2 0.0511 0.5529 0.3587 1.50654 Recording 92
postdata-1368030635
http://versine.eu/demo/list.php?seq=1002
08.05.2013 19:37 2G RX greatSamsungGalaxy SII 4.2 4.2 0.1176 0.3972 0.26 1.092 Recording 93
postdata-1368031637
http://versine.eu/demo/list.php?seq=1003
09.05.2013 18:34 2G idle reducedSamsungGalaxy SII 4.2 4.2 0.0295 0.3231 0.1453 0.61026 Recording 94
postdata-1368114284
http://versine.eu/demo/list.php?seq=1004
09.05.2013 18:55 2G TX reducedSamsungGalaxy SII 4.2 4.2 0.1236 0.5078 0.3366 1.41372 Recording 95
postdata-1368115518
http://versine.eu/demo/list.php?seq=1005
09.05.2013 19:12 2G RX reducedSamsungGalaxy SII 4.2 4.2 0.0589 0.4389 0.2654 1.11468 Recording 96
postdata-1368116552
http://versine.eu/demo/list.php?seq=1006
Time Setup Device
Voltagesourcesetting[V]
Measuredvoltage [V]
Mincurrent
Maxcurrent
Avgcurent
PowerconsumptionName on Fluke Analyzer Session Notes
09.05.2013 19:31 3G idle reducedSamsungGalaxy SII 4.2 4.207 0.0117 0.3369 0.0884 0.3718988 Recording 97
postdata-1368117655
http://versine.eu/demo/list.php?seq=1007
09.05.2013 19:49 3G TX reducedSamsungGalaxy SII 4.2 4.207 0.0091 0.2799 0.0384 0.1615488 Recording 98
postdata-1368118756
http://versine.eu/demo/list.php?seq=1008
09.05.2013 20:06 3G RX reducedSamsungGalaxy SII 4.2 4.207 0.0144 0.2971 0.1016 0.4274312 Recording 99
postdata-1368119784
http://versine.eu/demo/list.php?seq=1009
10.05.2013 15:37 Wi-fi idle poorHuaweiIdeos 4.1 4.105 0.0189 0.0939 0.0396 0.162558 Save 4
postdata-1368190099
10.05.2013 15:56 Wi-fi TX poorHuaweiIdeos 4.1 4.105 0.0177 0.1758 0.0425 0.1744625 Save 5
postdata-1368191282
10.05.2013 16:15 Wi-fi RX poorHuaweiIdeos 4.1 4.105 0.0161 0.1199 0.053 0.217565 Save 6
postdata-1368192380
10.05.2013 16:55 Wi-fi idle poorSamsungNexus S 4.2 4.212 0.0109 0.1251 0.0492 0.2072304 Save 7
postdata-1368194708
10.05.2013 17:12 Wi-fi TX poorSamsungNexus S 4.2 4.212 0.0119 0.2505 0.086 0.362232 Save 8
postdata-1368195718
10.05.2013 17:31 Wi-fi RX poorSamsungNexus S 4.2 4.212 0.0116 0.1489 0.0503 0.2118636 Save 9
Time Setup Device
Voltagesourcesetting[V]
Measuredvoltage [V]
Mincurrent
Maxcurrent
Avgcurent
PowerconsumptionName on Fluke Analyzer Session Notes
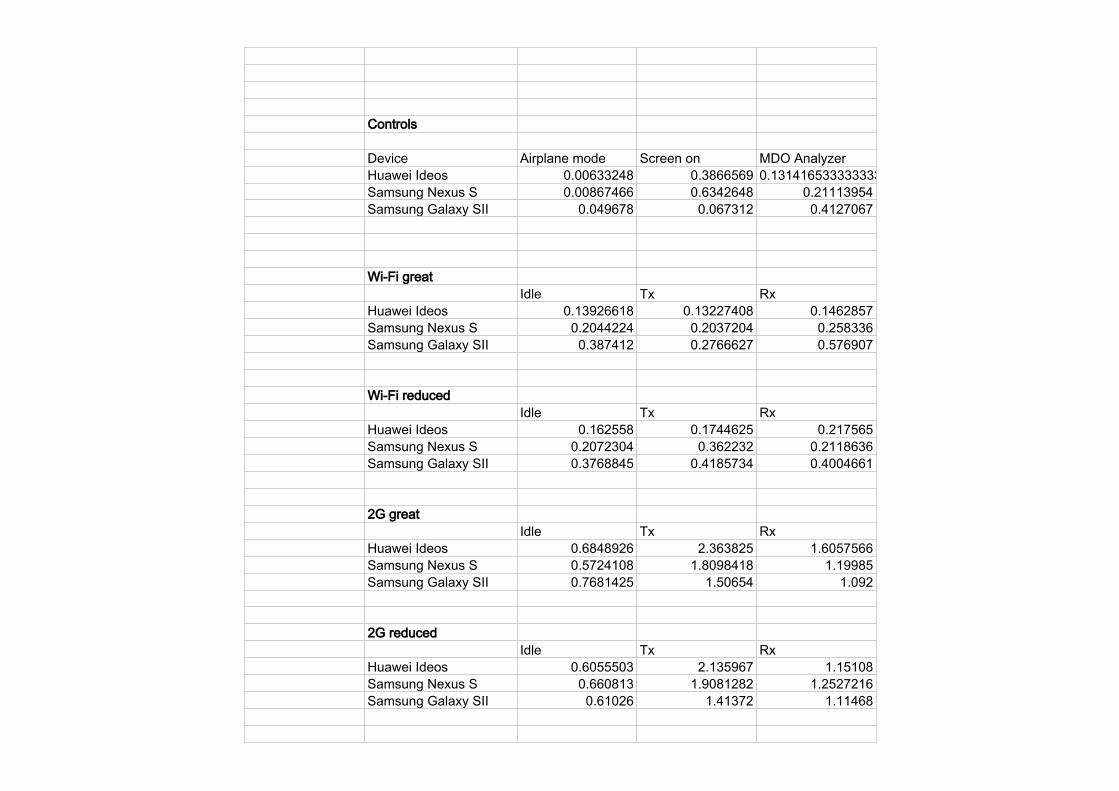
Controls
Device Airplane mode Screen on MDO AnalyzerHuawei Ideos 0.00633248 0.3866569 0.131416533333333Samsung Nexus S 0.00867466 0.6342648 0.21113954Samsung Galaxy SII 0.049678 0.067312 0.4127067
Wi-Fi greatIdle Tx Rx
Huawei Ideos 0.13926618 0.13227408 0.1462857Samsung Nexus S 0.2044224 0.2037204 0.258336Samsung Galaxy SII 0.387412 0.2766627 0.576907
Wi-Fi reducedIdle Tx Rx
Huawei Ideos 0.162558 0.1744625 0.217565Samsung Nexus S 0.2072304 0.362232 0.2118636Samsung Galaxy SII 0.3768845 0.4185734 0.4004661
2G greatIdle Tx Rx
Huawei Ideos 0.6848926 2.363825 1.6057566Samsung Nexus S 0.5724108 1.8098418 1.19985Samsung Galaxy SII 0.7681425 1.50654 1.092
2G reducedIdle Tx Rx
Huawei Ideos 0.6055503 2.135967 1.15108Samsung Nexus S 0.660813 1.9081282 1.2527216Samsung Galaxy SII 0.61026 1.41372 1.11468

3G greatIdle Tx Rx
Huawei Ideos 0.139774 0.127441 0.12333Samsung Nexus S 0.2207088 0.204282 0.2493504Samsung Galaxy SII 0.3889116 0.2163426 0.4684617
3G reducedIdle Tx Rx
Huawei Ideos 0.131552 0.1245633 0.1348408Samsung Nexus S 0.2275987 0.1670179 0.2498958Samsung Galaxy SII 0.3718988 0.1615488 0.4274312