The Competitiveness of Agriculture in Bulgaria and the Czech Republic Vis-à-Vis the European Union...
28
COMPARATIVE ECONOMIC STUDIES, XLII, NO. 1 (SPRING 2000), 59-86 The Competitiveness of Agriculture in Bulgaria and the Czech Republic Vis-k-Vis the European Union (CEEC and EU Agricultural Competitiveness) Matthew Gorton University of Newcastle Sophia Davidova Wye College, London University Tomas Ratinger Institute of Agricultural Economics, Prague This paper considers the competitiveness of agricultural production in Bulgaria and the Czech Republic compared to (i) international markets and (ii) EU. Competitiveness was measured in terms of revealed comparative advantage (RCA) and domestic resource cost (DRC) ratios, adjusted for bilateral analysis with the EU. The DRC estimations indicate that Czech and Bulgarian cereal pro- ducers were competitive at world market prices as well as at the EU prices. However, they did not show RCA in trade with the EU, partially due to trade restrictions. Czech livestock production was not competitive on the world market. The same was true for Bulgaria with the exception of pork 1. Introduction The ability of the agri-food sector to deal with increasing competitive pressures from trade liberalisation and likely accession to the EU will have a bearing on the overall macroeconomic fortunes of Bulgaria and the Czech Republic. Relative changes in competitiveness compared to international mar- kets and existing EU members will have an effect on future economic growth, the development of agriculture, the spatial location of economic activities and regional standards of living. This paper looks at the competitiveness of agri- cultural production in Bulgaria and the Czech Republic compared to (a) inter- national markets and (b) existing members of the EU. Two methodological The authors acknowledge Phare ACE financial support. They are grateful to an anonymous referee who commented on a previous draft. 59
-
Upload
independent -
Category
Documents
-
view
1 -
download
0
Transcript of The Competitiveness of Agriculture in Bulgaria and the Czech Republic Vis-à-Vis the European Union...
COMPARATIVE ECONOMIC STUDIES, XLII, NO. 1 (SPRING 2000), 59-86
The Competitiveness of Agriculture in Bulgaria and the CzechRepublic Vis-k-Vis the European Union
(CEEC and EU Agricultural Competitiveness)
Matthew Gorton
University of Newcastle
Sophia Davidova
Wye College, London University
Tomas Ratinger
Institute of Agricultural Economics, Prague
This paper considers the competitiveness of agricultural production inBulgaria and the Czech Republic compared to (i) international markets and(ii) EU. Competitiveness was measured in terms of revealed comparativeadvantage (RCA) and domestic resource cost (DRC) ratios, adjusted forbilateral analysis with the EU.
The DRC estimations indicate that Czech and Bulgarian cereal pro-ducers were competitive at world market prices as well as at the EU prices.However, they did not show RCA in trade with the EU, partially due to traderestrictions. Czech livestock production was not competitive on the worldmarket. The same was true for Bulgaria with the exception of pork
1. Introduction
The ability of the agri-food sector to deal with increasing competitivepressures from trade liberalisation and likely accession to the EU will have abearing on the overall macroeconomic fortunes of Bulgaria and the CzechRepublic. Relative changes in competitiveness compared to international mar-kets and existing EU members will have an effect on future economic growth,the development of agriculture, the spatial location of economic activities andregional standards of living. This paper looks at the competitiveness of agri-cultural production in Bulgaria and the Czech Republic compared to (a) inter-national markets and (b) existing members of the EU. Two methodological
The authors acknowledge Phare ACE financial support. They are grateful to ananonymous referee who commented on a previous draft.
59
60 GORTON-DA VIDOVA-RATINGER
approaches are applied: revealed comparative advantage (RCA) analysis andthe estimation of domestic resource costs (DRCs). Both of these methodolo-gies are adapted in this paper for bilateral analysis with the EU.
The paper is organised as follows. The next section compares the transi-tion process and performance of agriculture in Bulgaria and the Czech Repub-lic, and discusses the heterogeneity in the importance of agriculture in theanalysed countries. Part 3 outlines the methodologies employed and derivesthe measures of bilateral competitiveness. The data used in the analysis arediscussed in section 4. The RCA and DRC estimations are reported in sections5 and 6 respectively. Part 7 defines some of the reasons for the divergence inRCA and DRCs estimations. The conclusions outline for which staple prod-ucts Bulgaria and the Czech Republic have a comparative advantage withregard to international and EU markets.
2. Overview of the Role of Agriculture in Bulgaria and theCzech Republic
While both Bulgaria and the Czech Republic have formally applied formembership of the EU, their fortunes during transition have sharply diverged.As a comprehensive comparison of the transition process and its outcome inthe two countries is beyond the objectives of this paper, only those aspectsthat are necessary for a better understanding of the analysis that follows arediscussed below.
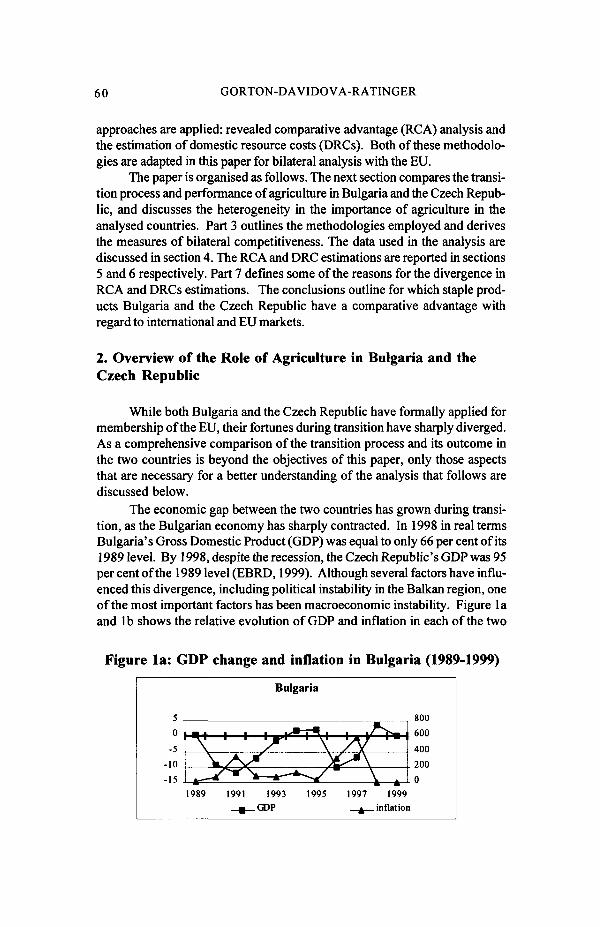
The economic gap between the two countries has grown during transi-tion, as the Bulgarian economy has sharply contracted. In 1998 in real termsBulgaria's Gross Domestic Product (GDP) was equal to only 66 per cent of its1989 level. By 1998, despite the recession, the Czech Republic's GDP was 95per cent of the 1989 level (EBRD, 1999). Although several factors have influ-enced this divergence, including political instability in the Balkan region, oneof the most important factors has been macroeconomic instability. Figure laand lb shows the relative evolution of GDP and inflation in each of the two
Figure la: GDP change and inflation in Bulgaria (1989-1999)
5
0
-5
-10
-15
Bulgaria
800
600
400
200
1989 1991 1993 1995 1997 1999
_m_GDP . inflation
AGRICULTURAL COMPETITIVENESS 61
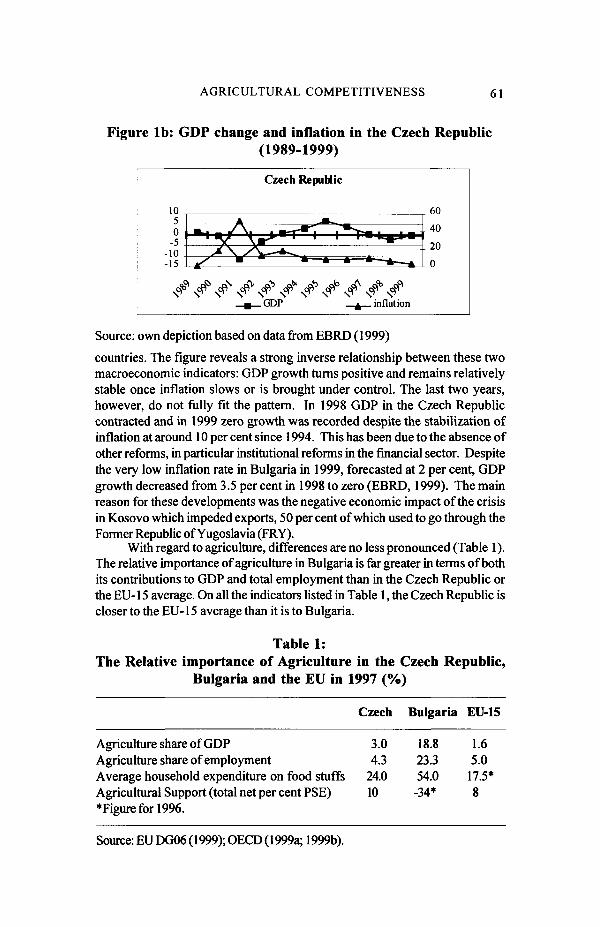
Figure lb: GDP change and inflation in the Czech Republic(1989-1999)
1050
-5-10-15
Czech
, nnp
Republic
a
*"• r•*—*—
* •
60
40
20
0
^ inflation
Source: own depiction based on data from EBRD (1999)
countries. The figure reveals a strong inverse relationship between these twomacroeconomic indicators: GDP growth turns positive and remains relativelystable once inflation slows or is brought under control. The last two years,however, do not fully fit the pattern. In 1998 GDP in the Czech Republiccontracted and in 1999 zero growth was recorded despite the stabilization ofinflation at around 10 per cent since 1994. This has been due to the absence ofother reforms, in particular institutional reforms in the financial sector. Despitethe very low inflation rate in Bulgaria in 1999, forecasted at 2 per cent, GDPgrowth decreased from 3.5 per cent in 1998 to zero (EBRD, 1999). The mainreason for these developments was the negative economic impact of the crisisin Kosovo which impeded exports, 50 per cent of which used to go through theFormer Republic of Yugoslavia (FRY).
With regard to agriculture, differences are no less pronounced (Table 1).The relative importance of agriculture in Bulgaria is far greater in terms of bothits contributions to GDP and total employment than in the Czech Republic orthe EU-15 average. On all the indicators listed in Table 1, the Czech Republic iscloser to the EU-15 average than it is to Bulgaria.
Table 1:The Relative importance of Agriculture in the Czech Republic,
Bulgaria and the EU in 1997
Czech Bulgaria EU-15
Agriculture share of GDPAgriculture share of employmentAverage household expenditure on food stuffsAgricultural Support (total net per cent PSE)•Figure for 1996.
3.04.3
24.010
18.823.354.0
-34*
1.65.0
17.5*8
Source: EU DG06 (1999); OECD (1999a; 1999b).
62 GORTON-DAVIDOVA-RATINGER
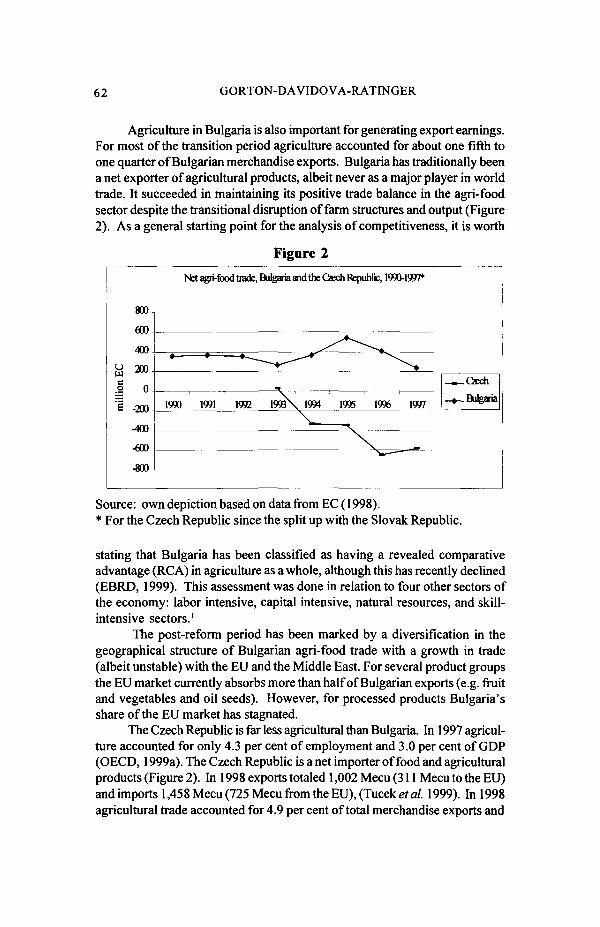
Agriculture in Bulgaria is also important for generating export earnings.For most of the transition period agriculture accounted for about one fifth toone quarter of Bulgarian merchandise exports. Bulgaria has traditionally beena net exporter of agricultural products, albeit never as a major player in worldtrade. It succeeded in maintaining its positive trade balance in the agri-foodsector despite the transitional disruption of farm structures and output (Figure2). As a general starting point for the analysis of competitiveness, it is worth
Figure 2
on E
Cm
illi
Nfet agri-food trade, Bulgaria and the Qech Republic, 1990-1997*
1990 1991 1992 1993\ 1994 1995 1996 1997
\ _
Gaech
_ » _ Bulgaria
Source: own depiction based on data from EC (1998).* For the Czech Republic since the split up with the Slovak Republic.
stating that Bulgaria has been classified as having a revealed comparativeadvantage (RCA) in agriculture as a whole, although this has recently declined(EBRD, 1999). This assessment was done in relation to four other sectors ofthe economy: labor intensive, capital intensive, natural resources, and skill-intensive sectors.1
The post-reform period has been marked by a diversification in thegeographical structure of Bulgarian agri-food trade with a growth in trade(albeit unstable) with the EU and the Middle East. For several product groupsthe EU market currently absorbs more than half of Bulgarian exports (e.g. fruitand vegetables and oil seeds). However, for processed products Bulgaria'sshare of the EU market has stagnated.
The Czech Republic is far less agricultural than Bulgaria. In 1997 agricul-ture accounted for only 4.3 per cent of employment and 3.0 per cent of GDP(OECD, 1999a). The Czech Republic is a net importer of food and agriculturalproducts (Figure 2). In 1998 exports totaled 1,002 Mecu (311 Mecu to the EU)and imports 1,45 8 Mecu (725 Mecu from the EU), (Tucek et al. 1999). In 1998agricultural trade accounted for 4.9 per cent of total merchandise exports and
AGRICULTURAL COMPETITIVENESS 63
6.6 per cent of imports. Although these shares seem insignificant, the agricul-tural trade deficit contributes substantially to the Czech Republic's overallnegative foreign trade balance. Agri-food trade accounted for 25 per cent ofthis balance in 1998. Based on the same methodology as for Bulgaria, theEBRD estimated that the Czech Republic does not have RCA in agricultureand that its comparative disadvantage has been increasing (EBRD, 1999).
The main export markets for Czech agricultural products are the EU (31.1per cent in 1998) and the Slovak Republic (25.5 per cent). The most importantexport products are hops, malt and beer, livestock, meat and dairy products.Agri-food imports mainly come from the EU (49.7 per cent of total agri-foodimports in 1998) and the Slovak Republic (9.4 per cent) (Tucek et al. 1999).The main imports include fruit and vegetables, coffee, tea, cocoa, soya cakeand grains.
One of the key characteristics of Bulgarian and Czech food supplychains during transition has been the leftwards shift in both supply and de-mand. The contraction of agriculture had been expected as an outcome of themarket re-allocation of resources in both countries. The rationale for thiscontraction is that during the period of central planning more resources weremaintained in agriculture than would have been the case under market condi-tions in countries with a similar level of economic development (Kydd et al.1997). Taking into account the fact that in general Bulgaria has a RCA inagriculture while the Czech Republic has a comparative disadvantage, it couldbe assumed that due to the post-reform reallocation of resources the Bulgar-ian agricultural sector would contract less than the Czech one. The transitionevidence has confirmed this. The contribution of agriculture to GDP in theCzech Republic dropped from 6.3 per cent in 1990 to 3 per cent in 1997, or inother words it halved. In Bulgaria it dropped from 18 per cent in 1990 to 11 percent in 1996. During the deep macroeconomic recession in Bulgaria in 1996-1997 agriculture contracted less than the rest of the economy and in 1997 itsshare of GDP came back to the pre-reform level, 18.8 per cent.
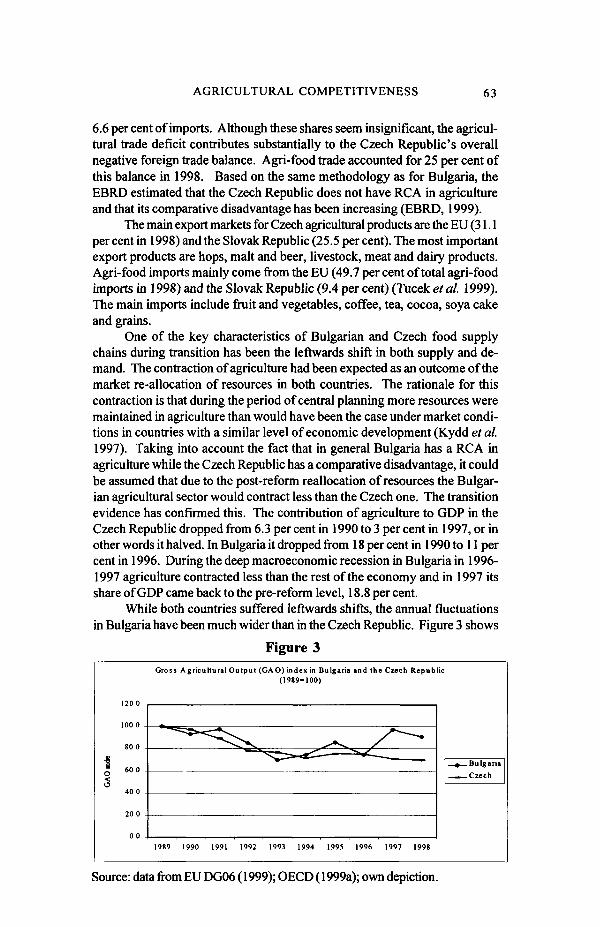
While both countries suffered leftwards shifts, the annual fluctuationsin Bulgaria have been much wider than in the Czech Republic. Figure 3 shows
Figure 3Gross Agricultural Output (GAO) index in Bulgaria and the Czech Republic
(1989=100)
120 0
100 0
80 0
60 0
40 0
-Bulgaria
.Czech
1989 1990 1991 1992 1993 1994 1995 1996 1997 1998
Source: data from EU DG06 (1999); OECD (1999a); own depiction.
64 GORTON-DAVIDOVA-RATINGER
that the Czech Gross Agricultural Output (GAO) incurred a steady declineduring the first decade of transition. The drop in Bulgarian GAO was of asimilar magnitude as the Czech one up to 1996. In 1998 and 1999, however,production recovered so that by 1998 Bulgarian GAO was nearly at its pre-reform level. However, due to the low input intensity of farming, unsettled farmstructures and the general economy still adjusting to the effects of the deep1996-1997 macro-economic crisis, there are doubts that this change in trendwill be sustained.
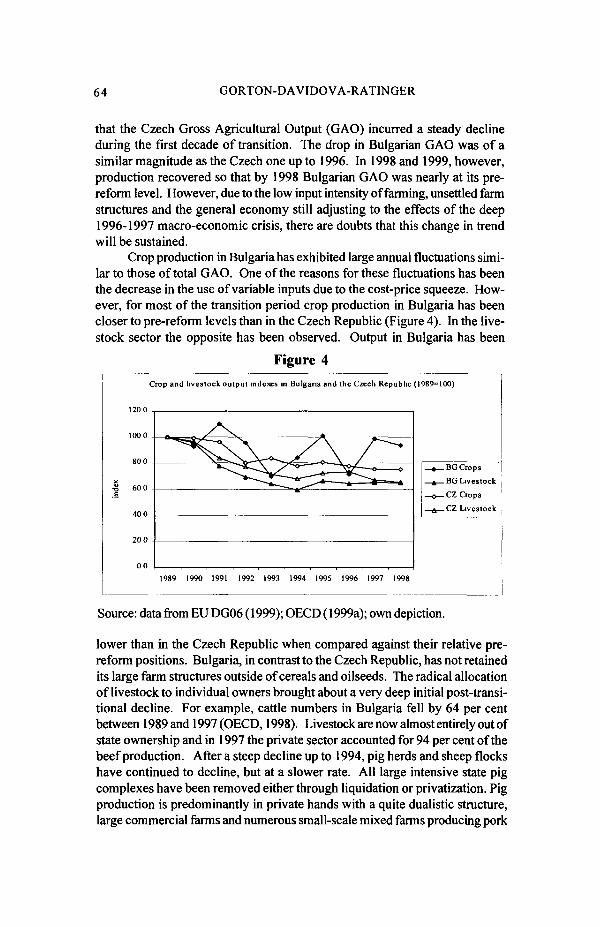
Crop production in Bulgaria has exhibited large annual fluctuations simi-lar to those of total GAO. One of the reasons for these fluctuations has beenthe decrease in the use of variable inputs due to the cost-price squeeze. How-ever, for most of the transition period crop production in Bulgaria has beencloser to pre-reform levels than in the Czech Republic (Figure 4). In the live-stock sector the opposite has been observed. Output in Bulgaria has been
Figure 4
Crop and livestock output indexes in Bulgaria and the Czech Repubhc (1989=100)
P0 0
1000
80 0
I 600 -
.£
40 0
20 0 .
0 0 1989 1990 1991 1992 1993 1994 1995 1996 1997 1998
, BG Crops_ 4 _ BO Livestock_©_CZ Crops—a—CZ Livestock
Source: data from EU DG06 (1999); OECD (1999a); own depiction.
lower than in the Czech Republic when compared against their relative pre-reform positions. Bulgaria, in contrast to the Czech Republic, has not retainedits large farm structures outside of cereals and oilseeds. The radical allocationof livestock to individual owners brought about a very deep initial post-transi-tional decline. For example, cattle numbers in Bulgaria fell by 64 per centbetween 1989 and 1997 (OECD, 1998). Livestock are now almost entirely out ofstate ownership and in 1997 the private sector accounted for 94 per cent of thebeef production. After a steep decline up to 1994, pig herds and sheep flockshave continued to decline, but at a slower rate. All large intensive state pigcomplexes have been removed either through liquidation or privatization. Pigproduction is predominantly in private hands with a quite dualistic structure,large commercial farms and numerous small-scale mixed farms producing pork
AGRICULTURAL COMPETITIVENESS 65
mainly for self-consumption. Poultry production has also been largely priva-tized and it is increasing.
The tendencies in the Czech livestock sector have been similar and itwas badly hit by the disruption of transition. Cattle, including dairy cows, andsheep numbers dropped to around 50 and 20 per cent of their pre-reform level(EU, 1998). The decrease in domestic consumption of dairy products by around40 per cent brought about a downward adjustment of production of a compa-rable magnitude.
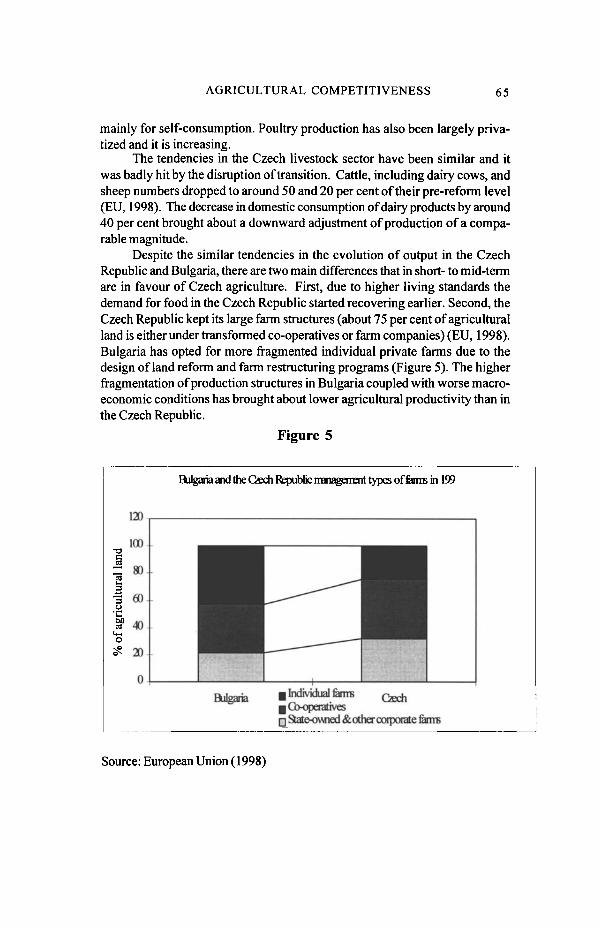
Despite the similar tendencies in the evolution of output in the CzechRepublic and Bulgaria, there are two main differences that in short- to mid-termare in favour of Czech agriculture. First, due to higher living standards thedemand for food in the Czech Republic started recovering earlier. Second, theCzech Republic kept its large farm structures (about 75 per cent of agriculturalland is either under transformed co-operatives or farm companies) (EU, 1998).Bulgaria has opted for more fragmented individual private farms due to thedesign of land reform and farm restructuring programs (Figure 5). The higherfragmentation of production structures in Bulgaria coupled with worse macro-economic conditions has brought about lower agricultural productivity than inthe Czech Republic.
Figure 5
Bulgaria and the Gech Republic management types of ferns in 199
120
100
i"•3 60o
I 1 4°20i
Bulgaria Gschp Individual firmsI Co-operatives• State-owned & other corporate ferns
Source: European Union (1998)
66 GORTON-DAVIDOVA-RATINGER
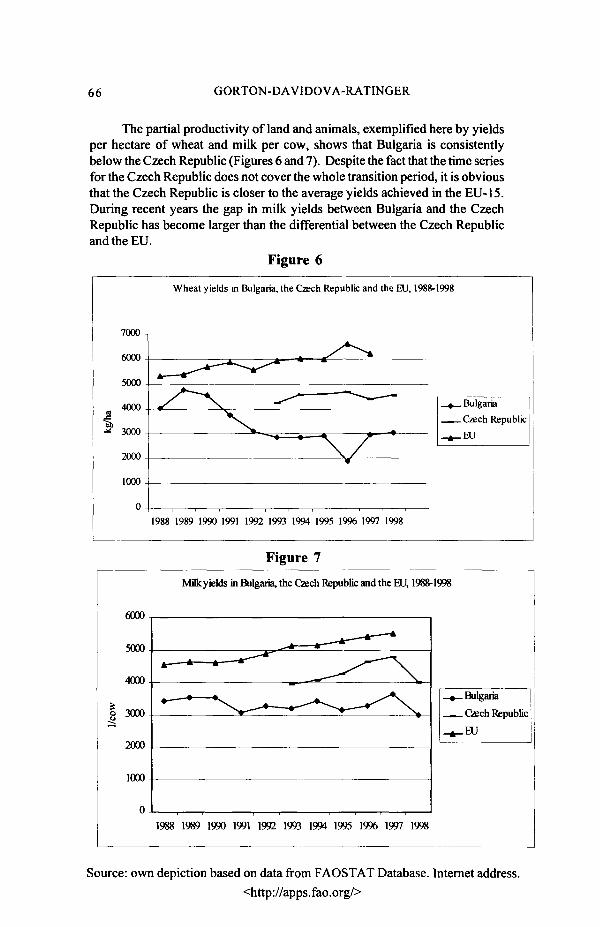
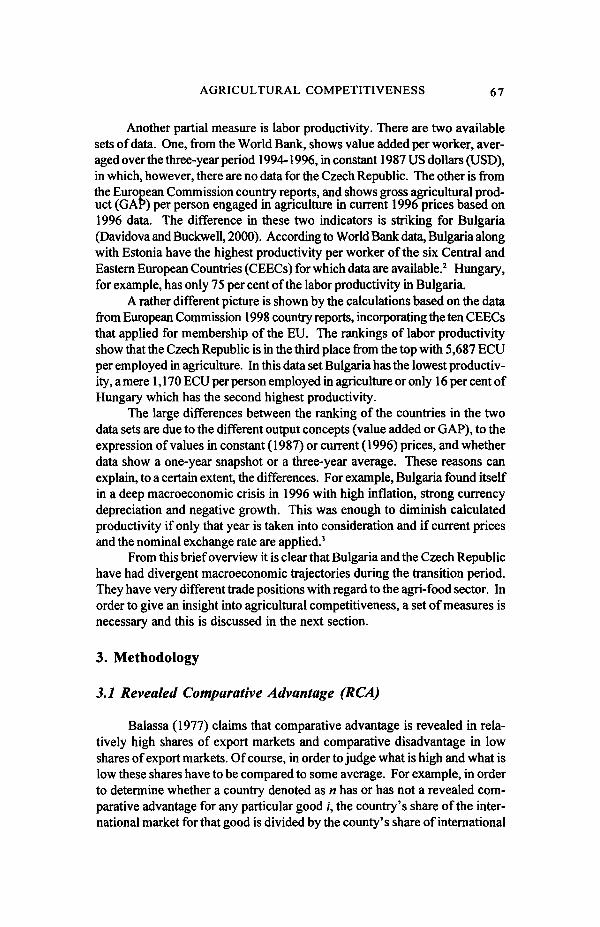
The partial productivity of land and animals, exemplified here by yieldsper hectare of wheat and milk per cow, shows that Bulgaria is consistentlybelow the Czech Republic (Figures 6 and 7). Despite the fact that the time seriesfor the Czech Republic does not cover the whole transition period, it is obviousthat the Czech Republic is closer to the average yields achieved in the EU-15.During recent years the gap in milk yields between Bulgaria and the CzechRepublic has become larger than the differential between the Czech Republicand the EU.
Figure 6
Wheat yields in Bulgaria, the Czech Republic and the EU, 1988-1998
7000
1988 1989 1990 1991 1992 1993 1994 1995 1996 1997 1998
Figure 7
Milk yields in Bulgaria, the Caech Republic and the EU, 1988-1998
6000
2000
1000
Bulgaria
Czech Republic
1988 1989 1990 1991 1992 1993 1994 1995 1996 1997 1998
Source: own depiction based on data from FAOSTAT Database. Internet address.
<http://apps.fao.org/>
AGRICULTURAL COMPETITIVENESS 67
Another partial measure is labor productivity. There are two availablesets of data. One, from the World Bank, shows value added per worker, aver-aged over the three-year period 1994-1996, in constant 1987 US dollars (USD),in which, however, there are no data for the Czech Republic. The other is fromthe European Commission country reports, and shows gross agricultural prod-uct (GAP) per person engaged in agriculture in current 1996 prices based on1996 data. The difference in these two indicators is striking for Bulgaria(Davidova and Buckwell, 2000). According to World Bank data, Bulgaria alongwith Estonia have the highest productivity per worker of the six Central andEastern European Countries (CEECs) for which data are available.2 Hungary,for example, has only 75 per cent of the labor productivity in Bulgaria.
A rather different picture is shown by the calculations based on the datafrom European Commission 1998 country reports, incorporating the ten CEECsthat applied for membership of the EU. The rankings of labor productivityshow that the Czech Republic is in the third place from the top with 5,687 ECUper employed in agriculture. In this data set Bulgaria has the lowest productiv-ity, a mere 1,170 ECU per person employed in agriculture or only 16 per cent ofHungary which has the second highest productivity.
The large differences between the ranking of the countries in the twodata sets are due to the different output concepts (value added or GAP), to theexpression of values in constant (1987) or current (1996) prices, and whetherdata show a one-year snapshot or a three-year average. These reasons canexplain, to a certain extent, the differences. For example, Bulgaria found itselfin a deep macroeconomic crisis in 1996 with high inflation, strong currencydepreciation and negative growth. This was enough to diminish calculatedproductivity if only that year is taken into consideration and if current pricesand the nominal exchange rate are applied.3
From this brief overview it is clear that Bulgaria and the Czech Republichave had divergent macroeconomic trajectories during the transition period.They have very different trade positions with regard to the agri-food sector. Inorder to give an insight into agricultural competitiveness, a set of measures isnecessary and this is discussed in the next section.
3. Methodology
3.1 Revealed Comparative Advantage (RCA)
Balassa (1977) claims that comparative advantage is revealed in rela-tively high shares of export markets and comparative disadvantage in lowshares of export markets. Of course, in order to judge what is high and what islow these shares have to be compared to some average. For example, in orderto determine whether a country denoted as n has or has not a revealed com-parative advantage for any particular good /, the country's share of the inter-national market for that good is divided by the county's share of international
68 GORTON-DAVIDOVA-RATINGER
markets for all goods m. This fraction is multiplied by 100 for ease of presenta-tion and figures above 100 indicate a RCA and vice versa. The formula can beexpressed as:
RCA = *100 [1]
where Xin refers to the value of exports of commodity / from the country inquestion n, X.w value of exports of commodity /' from all countries in the world,X ^ value of exports of all goods m from the country n and Xmw value ofexports of all goods from all countries.
The RCA measure is, therefore, taken to identify sectors for which anindividual country has a comparative advantage and a comparative disadvan-tage (Pitts et al, 1995). To derive a more focused set of measures for thefollowing analysis, the RCA has been adjusted here to derive a commodity-weighting index for both countries and an EU share of exports index. Theanalysis is limited to agri-food trade, therefore the notation for all goods m,incorporates only agri-food products.
The commodity weighting index compares the exports to the EU fromeach of the two analysed countries (Bulgaria and the Czech Republic), com-modity by commodity, with the rest of the non-EU member states exporting thesame commodity to the EU. The substance of this index is to determine whetherBulgaria and the Czech Republic have a RCA for the good / in their trade withthe EU in comparison with the rest of the world. The commodity-weightingindex is calculated by comparing two shares. The first is Bulgaria's and theCzech Republic's share of exports to the EU of a commodity / in the export ofthe same commodity from all non-EU member-states. The second is an identi-cal share but for all agri-food exports m:
CWI =
AGRICULTURAL COMPETITIVENESS 69
where Aricb_eii isthevalueofexportsofcommodity/totheEU from the country
in question (Czech Republic or Bulgaria), A".WHJU is the total exports to the EU of/ from non-member countries, Amcb_eu is the total value of agri-food exportsfrom the Czech Republic or Bulgaria to the EU and J ^ is the total value ofagri-food exports to the EU from all non-member countries. In the followinganalysis it is assumed that exports of commodity / and of all agri-food com-modities m from the non-member countries equal the extra-EU imports of/ andm. As a result the calculations are done on the basis of extra EU import data.
The EU share of exports index compares the share of commodity / in acountry cb (Bulgaria or the Czech Republic) which goes to the EU against theidentical share of total agri-food exports (jri). In other words, if the commodityweighting index serves to compare the competitiveness of Bulgarian and Czechagriculture with the rest of the countries in the world which export to the EU,the EU share of exports index provides an insight into the national structure ofagri-food exports. The EU share of exports index is expressed in [3]:
EUI = *100 [3]
mcb J
where X|cb is the total value of all exports of commodity / from the country inquestion and Xmcb is the total value of all agri-food exports from the country inquestion.
As previously discussed, this paper applies two methodological ap-proaches to estimate competitiveness, RCA, and DRCs which are discussedbelow.
3.2 Domestic Resource Costs (DRCs) and Effective ProtectionRates (EPRs)
The DRC ratio is a measure of the relative efficiency of domestic produc-tion. The DRC measures the relative efficiency of domestic production interms of its international cost competitiveness. The DRC compares the oppor-tunity costs of domestic production to the value added it generates (Tsakok,1990). The numerator is the sum of the costs of using domestic primary re-sources - land, labor and capital - and of non-traded inputs. The denominatoris the value-added in border prices. The DRC for the production of commodity/ in the Czech Republic or Bulgaria is calculated as:
70 GORTON-DAVIDOVA-RATINGER
i=\
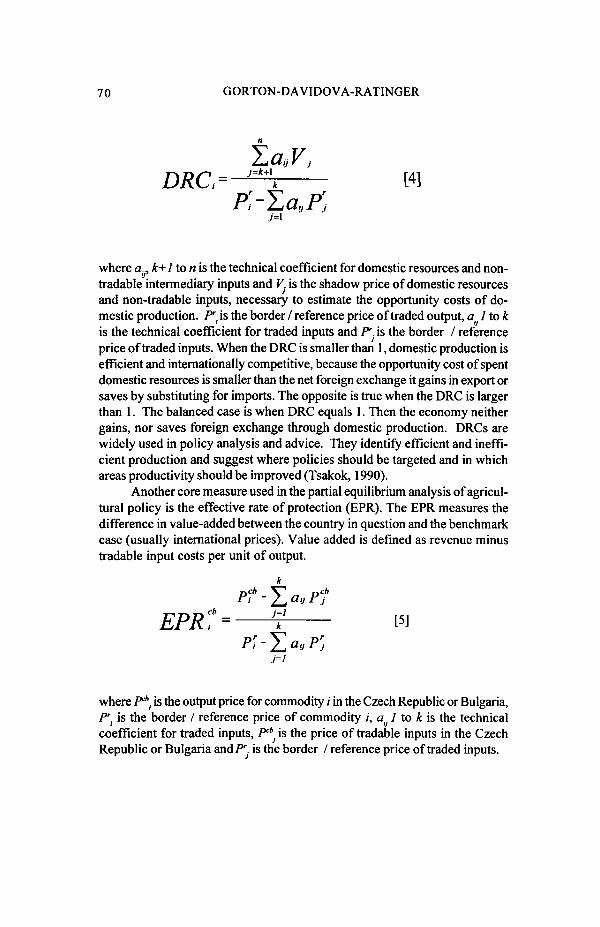
where a.., k+lton is the technical coefficient for domestic resources and non-tradable intermediary inputs and V. is the shadow price of domestic resourcesand non-tradable inputs, necessary to estimate the opportunity costs of do-mestic production. Pr
i is the border / reference price of traded output, at 1 to kis the technical coefficient for traded inputs and Pr. is the border / referenceprice of traded inputs. When the DRC is smaller than 1, domestic production isefficient and internationally competitive, because the opportunity cost of spentdomestic resources is smaller than the net foreign exchange it gains in export orsaves by substituting for imports. The opposite is true when the DRC is largerthan 1. The balanced case is when DRC equals 1. Then the economy neithergains, nor saves foreign exchange through domestic production. DRCs arewidely used in policy analysis and advice. They identify efficient and ineffi-cient production and suggest where policies should be targeted and in whichareas productivity should be improved (Tsakok, 1990).
Another core measure used in the partial equilibrium analysis of agricul-tural policy is the effective rate of protection (EPR). The EPR measures thedifference in value-added between the country in question and the benchmarkcase (usually international prices). Value added is defined as revenue minustradable input costs per unit of output.
EPR>
where Pcbl is the output price for commodity /' in the Czech Republic or Bulgaria,
Pr. is the border / reference price of commodity /, a 1 to k is the technicalcoefficient for traded inputs, /"* is the price of tradable inputs in the CzechRepublic or Bulgaria and/" is the border / reference price of traded inputs.
AGRICULTURAL COMPETITIVENESS 71
3.3 Bilateral DRCs
As Bureau and Kazlaitzandokanes (1995) remark, the ratio defined in [4]does not incorporate any substitution effects when prices change. Therefore,having DRCs for two countries (e.g. the EU and Bulgaria) yield little compara-tive information about competitiveness, unless production technologies andborder prices (representing world prices) of inputs and outputs are assumed tobe the same.
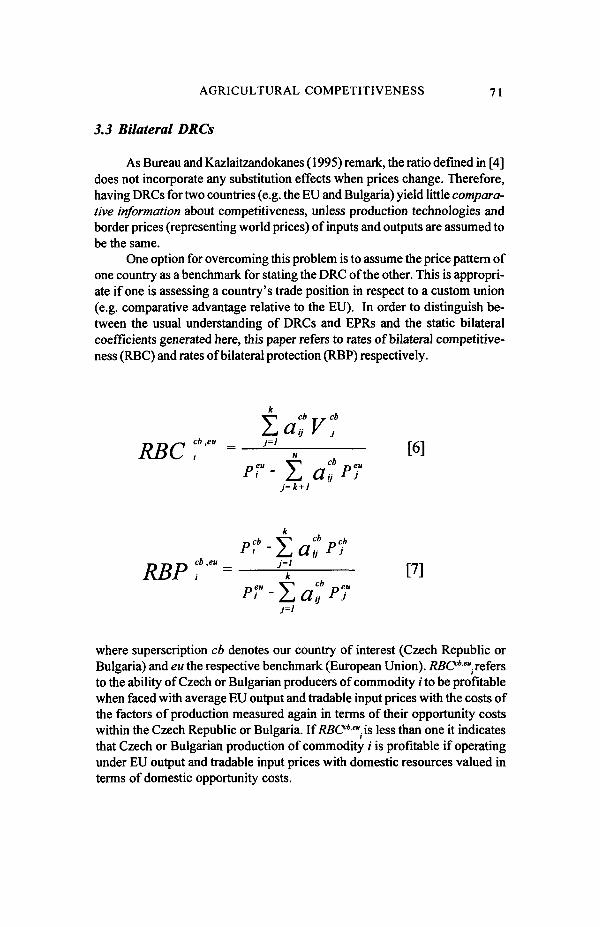
One option for overcoming this problem is to assume the price pattern ofone country as a benchmark for stating the DRC of the other. This is appropri-ate if one is assessing a country's trade position in respect to a custom union(e.g. comparative advantage relative to the EU). In order to distinguish be-tween the usual understanding of DRCs and EPRs and the static bilateralcoefficients generated here, this paper refers to rates of bilateral competitive-ness (RBC) and rates of bilateral protection (RBP) respectively.
Z cb -rj-cb
a, V j
RBC cbr = -J=L-m—— ra
RBPc!eu = —J-k mpr-Tatp?
J=l
where superscription cb denotes our country of interest (Czech Republic orBulgaria) and eu the respective benchmark (European Union). RBCcb"1. refersto the ability of Czech or Bulgarian producers of commodity i to be profitablewhen faced with average EU output and tradable input prices with the costs ofthe factors of production measured again in terms of their opportunity costswithin the Czech Republic or Bulgaria. If RBCcbeu. is less than one it indicatesthat Czech or Bulgarian production of commodity i is profitable if operatingunder EU output and tradable input prices with domestic resources valued interms of domestic opportunity costs.
72 GORTON-DAVIDOVA-RATINGER
RBPcb'"i measures the level of value added using Czech or Bulgarianoutput and tradable input prices compared against the value added generatedif EU output and tradable input prices apply. \iRBPcb'"i is less than one it is thecase that the value added gained by Czech or Bulgarian producers operating atdomestic prices in a given year was less than what would be achieved if theyhad faced EU output and tradable prices in that year.
To understand the estimations made, it is useful to comprehend thepotential correlation between the EPRs and producer subsidy equivalents(PSEs), which are probably the most widely used measure of producer protec-tion (OECD, 1997) and this is outlined in Appendix 1.
4. Data Sources and Assumptions
In assessing the competitiveness of Czech and Bulgarian agriculturalproducts, the focus is on five main commodities (wheat, barley, milk, beef andpork meat), two target markets (competitiveness on the world and EU-markets)and two policy frameworks. These frameworks are current Czech and Bulgarianagricultural policy, and current EU Common Agricultural Policy (CAP).
Due to lack of data, a number of assumptions and/or simplifications weremade. First, since the technical coefficients a( were not known, the consump-tion of inputs was expressed only in values. The latter were gathered from thefarm budget (sample) surveys conducted by the Czech Institute of Agricul-tural Economics ( VUZE) and from a small FAO administered farm accountingsurvey in Bulgaria augmented with price and yield information from the Bulgar-ian Ministry of Agriculture. While all output prices were available from theCzech Statistical Office (CSO), OECD and the Bulgarian National StatisticsInstitute (NSI), only limited information on input prices was accessible. Thus,it was assumed that if no trade restrictions were in place world and domesticprices for tradable inputs in the Czech Republic and Bulgaria were equal. Al-though in the EU tradable inputs of non-agricultural origin are not subject tohigh import tariffs, for the period of the analysis their price level was signifi-cantly higher than in the Czech Republic and Bulgaria. This may be due tohigher derived demand (from higher output prices) and more costly marketing.The evaluation of inputs at the EU price level was done by the construction ofan index that was derived from a comparison of input prices for selected trad-able inputs as monitored by the CSO, NSI and Eurostat. The PSE calculationsfor the Czech Republic were taken from OECD (1998) and for Bulgaria fromGorton etal. (1998).
Denominators of all equation [4] like coefficients were evaluated in CzechKoruna and Bulgaria Leva by using an average nominal exchange rate for theyear in question. The PSE approximation (equation [6]) was used for calculat-ing the EPR coefficient at world prices. Otherwise, the formula [4] was usedwith costs adjusted by the appropriate index.
AGRICULTURAL COMPETITIVENESS 73
5. Revealed Comparative Advantage (RCA) Results
Bulgaria
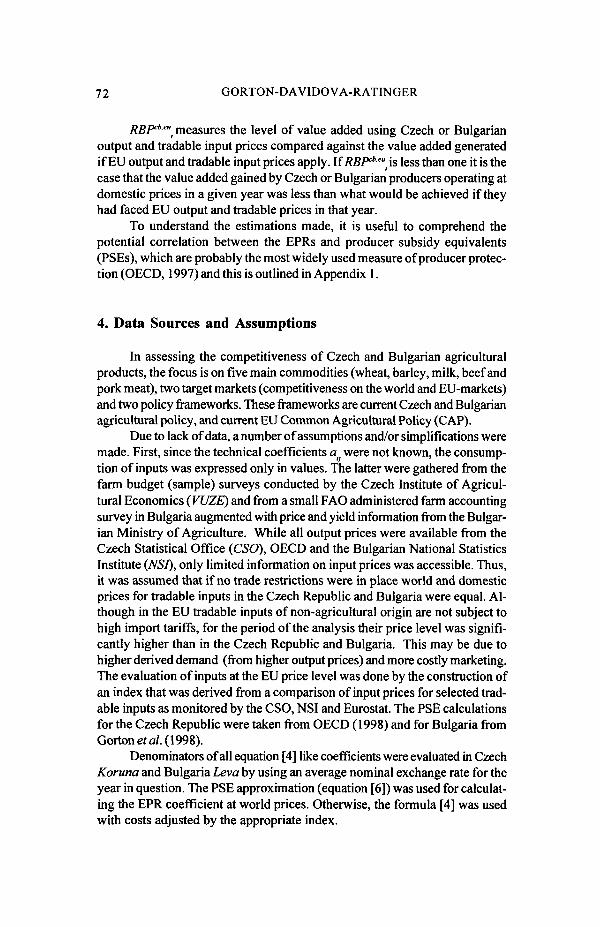
Table 2 details the highest scoring products in the commodity-weightingindex for trade in 1996. The largest scores were recorded for: jams, fruit jellies,marmalades, fruit or nut purees; wine, cucumbers and gherkins, and meat andedible offal from fowls, ducks, geese, turkeys, guinea fowls (in that order).Sunflower seeds, assorted vegetables and sheep and goat meat were alsoprominent.
Table 2:Commodity Weighting Index for Bulgaria
Product Index
Jams, Fruit Jellies, Marmalades, Fruit or nut Purees 2560Wine of fresh Grapes 2178Cucumbers and Gherkins, Fresh or Chilled 1050Meat and Edible Offal from Fowls, Ducks, Geese, Turkeys, Guinea 620Fowls: fresh, chilled or frozenFresh or chilled Vegetables 550Natural Honey 532Birds' Eggs (not in shell) and egg yolks: fresh, dried, cooked 482Vegetables: cooked or uncooked 455Sunflower Seeds 448Meat of Sheep or Goats: Fresh, chilled or frozen 437Live Bovine Animals 150
Source: own calculations from EUROSTAT-COMEXT (1997)
The lowest index scores were derived for tropical fruits and nuts thatBulgaria does not produce. Other low scores were derived for prunes, datesand figs, tea, nutmeg, mace and cardamoms and coconut butter. These can allbe attributed to geographical and climatic factors. Bulgaria also achieved be-low 100 scores for the main dairy products (except cheese), wheat and barley,and pork. The main staple goods are, therefore, relatively unimportant in Bul-garian agri-food exports to the EU.
Table 3 details the figures for the EU share of Bulgarian exports and thereis a degree of correlation with the commodity-weighting index. The highestscores were achieved for: jams, fruit jellies, marmalades; wine; and meat andedible offal from fowls, ducks, geese, turkeys, guinea fowls (in that order).Bulgaria performed poorly for milk and dairy products (except cheese); wheatand barley; and pork. Bulgaria's main advantage would, thus, appear to rest at
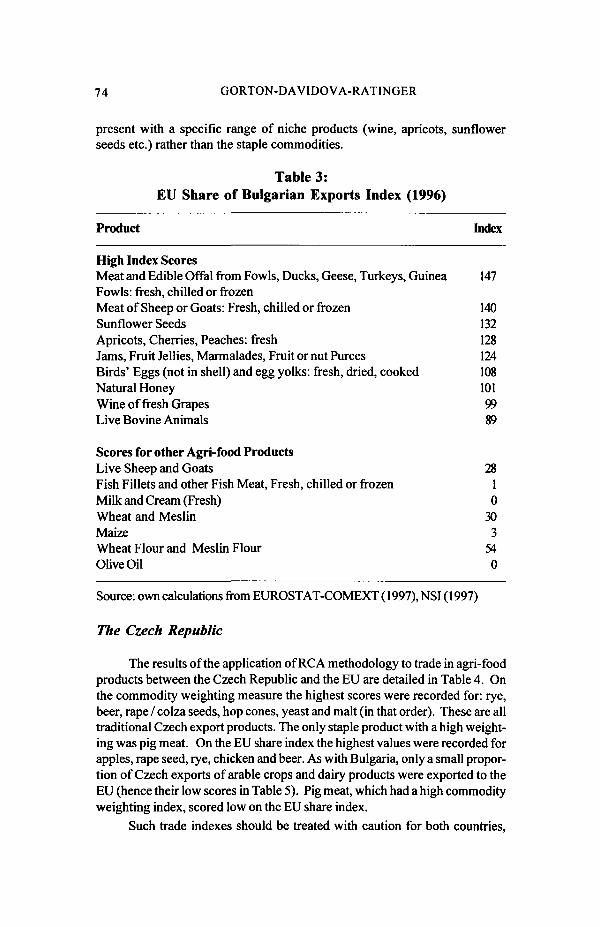
74 GORTON-DAVIDOVA-RATINGER
present with a specific range of niche products (wine, apricots, sunflowerseeds etc.) rather than the staple commodities.
Table 3:EU Share of Bulgarian Exports Index (1996)
Product
High Index ScoresMeat and Edible Offal from Fowls, Ducks, Geese, Turkeys, GuineaFowls: fresh, chilled or frozenMeat of Sheep or Goats: Fresh, chilled or frozenSunflower SeedsApricots, Cherries, Peaches: freshJams, Fruit Jellies, Marmalades, Fruit or nut PureesBirds' Eggs (not in shell) and egg yolks: fresh, dried, cookedNatural HoneyWine of fresh GrapesLive Bovine Animals
Scores for other Agri-food ProductsLive Sheep and GoatsFish Fillets and other Fish Meat, Fresh, chilled or frozenMilk and Cream (Fresh)Wheat and MeslinMaizeWheat Flour and Meslin FlourOlive Oil
Index
147
1401321281241081019989
2810
303
540
Source: own calculations from EUROSTAT-COMEXT(1997), NSI( 1997)
The Czech Republic
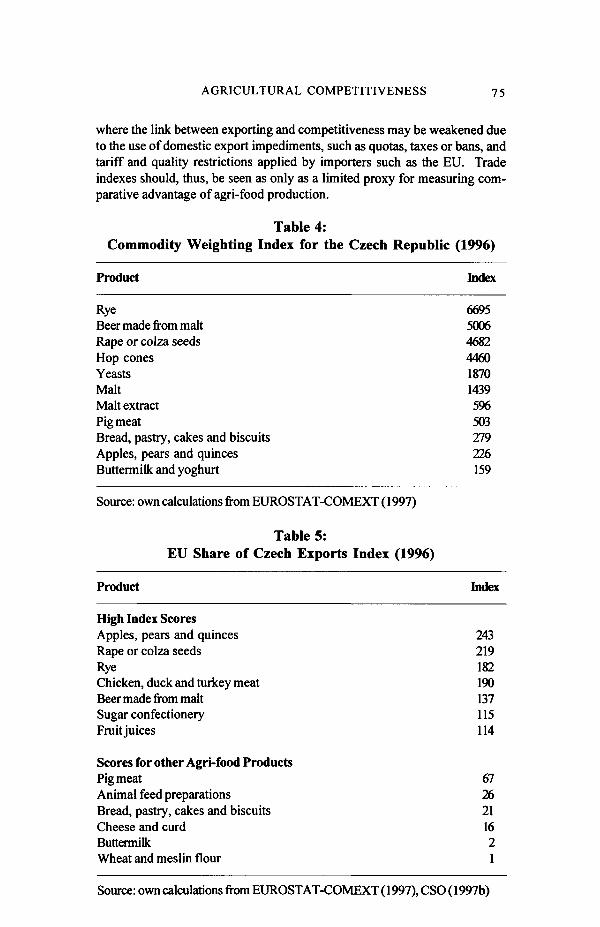
The results of the application of RCA methodology to trade in agri-foodproducts between the Czech Republic and the EU are detailed in Table 4. Onthe commodity weighting measure the highest scores were recorded for: rye,beer, rape / colza seeds, hop cones, yeast and malt (in that order). These are alltraditional Czech export products. The only staple product with a high weight-ing was pig meat. On the EU share index the highest values were recorded forapples, rape seed, rye, chicken and beer. As with Bulgaria, only a small propor-tion of Czech exports of arable crops and dairy products were exported to theEU (hence their low scores in Table 5). Pig meat, which had a high commodityweighting index, scored low on the EU share index.
Such trade indexes should be treated with caution for both countries,
AGRICULTURAL COMPETITIVENESS 75
where the link between exporting and competitiveness may be weakened dueto the use of domestic export impediments, such as quotas, taxes or bans, andtariff and quality restrictions applied by importers such as the EU. Tradeindexes should, thus, be seen as only as a limited proxy for measuring com-parative advantage of agri-food production.
Table 4:
Commodity Weighting Index for the Czech Republic (1996)
Product Index
Rye 6695
Beer made from malt 5006Rape or colza seeds 4682Hop cones 4460Yeasts 1870Malt 1439Malt extract 596Pig meat 503Bread, pastry, cakes and biscuits 279Apples, pears and quinces 226Buttermilk and yoghurt 159Source: own calculations from EUROSTAT-COMEXT(1997)
Table 5:EU Share of Czech Exports Index (1996)
Product Index
High Index ScoresApples, pears and quinces 243Rape or colza seeds 219Rye 182Chicken, duck and turkey meat 190Beer made from malt 137Sugar confectionery 115Fruit juices 114
Scores for other Agri-food ProductsPig meat 67Animal feed preparations 26Bread, pastry, cakes and biscuits 21Cheese and curd 16Buttermilk 2Wheat and meslin flour 1
Source: own calculations from EUROSTAT-COMEXT(1997), CSO( 1997b)
76 GORTON-DAVIDOVA-RATINGER
6. Domestic Resource Costs Results
Bulgaria
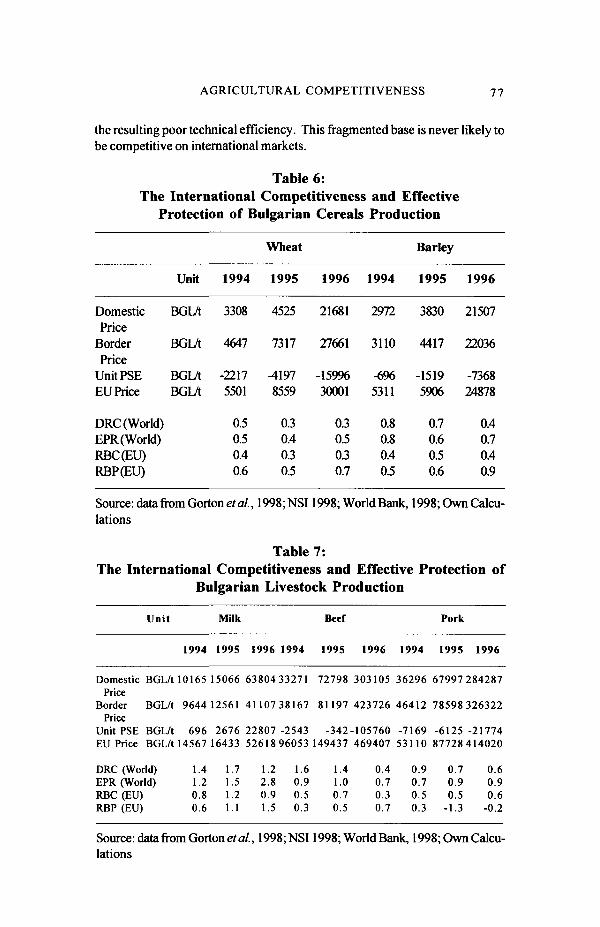
The estimations of DRCs for grains and livestock in Bulgaria are shownin Tables 6 and 7. According to the derived measures, Bulgarian cereal produc-tion for the period 1994 to 1996 was efficient both at world market prices andcompared to the EU (Table 6). The DRCs for wheat were 0.5,0.3 and 0.3 in theyears 1994 to 1996 respectively and for barley 0.8,0.7 and 0.4 during the sameperiod. Bulgarian wheat production in 1994 and barley in 1994 and 1995 wereeven more competitive compared to the EU. In 1994 the value of RBC indicesfor wheat was 0.4 and for barley 0.4,0.5 for 1994 and 1995 respectively (Table 6).This reflects the mark up between border and EU prices during these years forthe two commodities.
However, the derived values of the coefficients overestimate the com-petitiveness of the Bulgarian grain sector. This is due to two main reasons.First, the technical coefficients supplied by the Ministry of Agriculture onwhich the Bulgarian analysis is based, draws on the sample of large farms.Smaller farmers are likely to be less competitive (Hughes, 1999).
Second, during the analysed period the domestic prices for wheat andbarley were kept below world market prices through the use of various impedi-ments to exports. This effective taxation of farmers (the prices they received fortheir output being below adjusted border prices) is reflected in the negativePSE estimations, shown in Table 6. This was the result of both deliberategovernment policy and under-developed downstream markets. During theperiod 1994-1996 the main silo facilities were still in state hands and both grainswere bought immediately after the harvest mainly by state agents. So, theremoval of distortions introduced by export impediments and the developmentof grain marketing system are expected to eliminate some the price competitive-ness of the Bulgarian grain sector. In order to have a better understandingabout the changes in competitiveness, such analyses have to be repeated.This is particularly valid for countries in transition as they are characterised byfrequent switches in agricultural policies and quite dynamic adjustments ofproduct and factor prices. However, as a broad assumption, it could be formu-lated that in view of potential accession to the EU and policy alignment to theUnion, which also includes a gradual price alignment and the likelihood ofrising factor costs, Bulgarian international competitiveness in the grain sectorwill be decreasing.
The livestock DRCs are less clear-cut (Table 7). Overall, milk and beefproduction was not internationally competitive during the period of analysis(except beef in 1996). Pork production, in contrast, was competitive in each ofthe three years. The non-competitive nature of Bulgarian milk and beef produc-tion reflects the small-scale nature of Bulgarian dairy and beef sub-sectors and
AGRICULTURAL COMPETITIVENESS 77
the resulting poor technical efficiency. This fragmented base is never likely tobe competitive on international markets.
Table 6:
The International Competitiveness and Effective
Protection of Bulgarian Cereals Production
DomesticPrice
BorderPrice
UnitPSEEU Price
DRC (World)EPR (World)RBC(EU)RBP(EU)
Unit
BGL/t
BGL/t
BGL/tBGLA
1994
3308
4647
-22175501
0.50.50.40.6
Wheat
1995
4525
7317
^1978559
0.30.40.30.5
1996
21681
27661
-1599630001
0.30.50.30.7
1994
2972
3110
-6%5311
0.80.80.40.5
Barley
1995
3830
4417
-15195906
0.70.60.50.6
1996
21507
22036
-736824878
0.40.70.40.9
Source: data from Gorton ef al., 1998; NSI1998; World Bank, 1998; Own Calcu-lations
Table 7:
The International Competitiveness and Effective Protection of
Bulgarian Livestock Production
Unit Milk Beef Pork
1994 1995 1996 1994 1995 1996 1994 1995 1996
Domestic BGL/t 10165 15066 63804 33271 72798 303105 36296 67997 284287Price
Border BGL/t 9644 12561 41107 38167 81197 423726 46412 78598 326322Price
UnitPSE BGL/t 696 2676 22807-2543 -342-105760 -7169 -6125-21774EU Price BGL/t 14567 16433 52618 96053 149437 469407 53110 87728414020
DRCEPRRBCRBP
(World)(World)(EU)(EU)
1100
.4
.2
.8
.6
1.71.51.21.1
1.22.80.91.5
1.60.90.50.3
1.41.00.70.5
0000
.4
.7
.3
.7
0000
.9
.7
.5
.3
000
-1
.7
.9
.5
.3
0.60.90.6
-0.2
Source: data from Gortons al, 1998;NSI 1998; World Bank, 1998; Own Calcu-lations
78 GORTON-DA VIDOVA-RATINGER
Compared to the EU, Bulgarian livestock production was competitive(RBCs<l) for the three years analysed. This ability to compete arose becausethe high EU output prices were more than enough to offset the poorer level oftechnical efficiency in Bulgaria. For example, in 1994 the Bulgarian domesticbeef price was 33,271 leva per tonne compared to an EU average price equiva-lent to 96,053 leva per tonne. It should be noted that in the livestock sectorthere were not consistently implemented policy measures, which aimed at keep-ing the farmers' price below the adjusted border prices. Thus, the picture hasbeen less distorted by the government policies that for cereals.
The Czech Republic
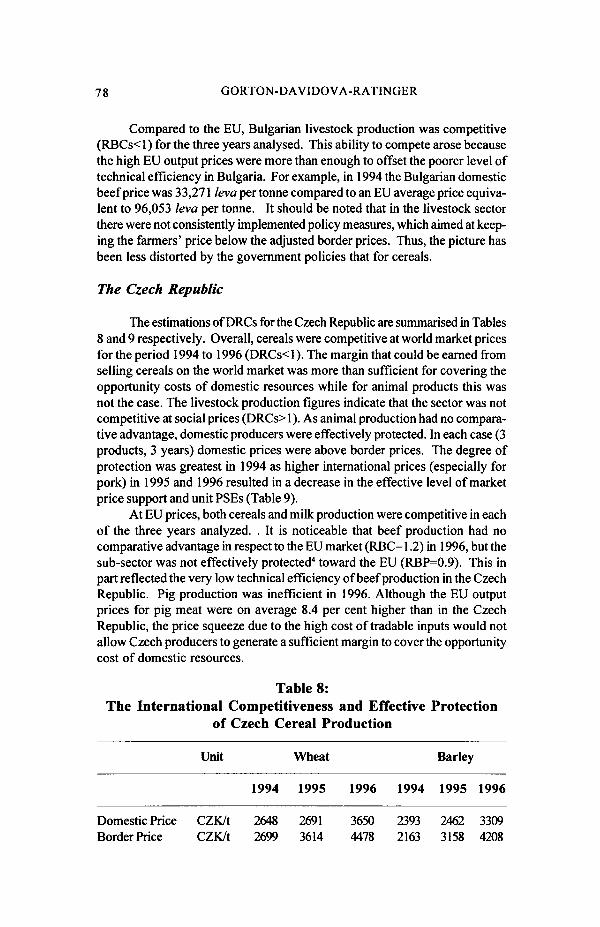
The estimations of DRCs for the Czech Republic are summarised in Tables8 and 9 respectively. Overall, cereals were competitive at world market pricesfor the period 1994 to 1996 (DRCs<l). The margin that could be earned fromselling cereals on the world market was more than sufficient for covering theopportunity costs of domestic resources while for animal products this wasnot the case. The livestock production figures indicate that the sector was notcompetitive at social prices (DRCs>l). As animal production had no compara-tive advantage, domestic producers were effectively protected. In each case (3products, 3 years) domestic prices were above border prices. The degree ofprotection was greatest in 1994 as higher international prices (especially forpork) in 1995 and 1996 resulted in a decrease in the effective level of marketprice support and unit PSEs (Table 9).
At EU prices, both cereals and milk production were competitive in eachof the three years analyzed. . It is noticeable that beef production had nocomparative advantage in respect to the EU market (RBC= 1.2) in 1996, but thesub-sector was not effectively protected4 toward the EU (RBP=0.9). This inpart reflected the very low technical efficiency of beef production in the CzechRepublic. Pig production was inefficient in 1996. Although the EU outputprices for pig meat were on average 8.4 per cent higher than in the CzechRepublic, the price squeeze due to the high cost of tradable inputs would notallow Czech producers to generate a sufficient margin to cover the opportunitycost of domestic resources.
Table 8:The International Competitiveness and Effective Protection
of Czech Cereal Production
Domestic PriceBorder Price
Unit
CZK/tCZK/t
1994
26482699
Wheat
1995
26913614
1996
36504478
1994
23932163
Barley
1995
24623158
1996
33094708

AGRICULTURAL COMPETITIVENESS 79
Table 8: (cont'd)The International Competitiveness and Effective Protection
of Czech Cereal Production
UnitPSEEU Price
DRC (World)EPR (World)RBC(EU)RBP(EU)
Unit
CZK/tCZK/t
1994
164027
0.81.00.50.6
Wheat
1995
-11084105
0.50.60.50.6
1996
-9933877
0.50.70.71.1
1994
3493889
1.5130.70.6
Barley
1995
-7793989
0.80.70.60.6
1996
-9923905
0.50.70.70.9
Source: data from VoloSin etal. (1997), Kraus etal. 1997, CSO (1997a, b); OwnCalculations
Table 9:The International Competitiveness and Effective Protection
of Czech Livestock Production
Unit
1994
Milk
1995 1996 1994
Beef
1995 1996 1994
Pork
1995 1996
Domestic CZK/t 5895 6435 6847 59309 64266 64956 37228 40246 46205Price
Border CZK/t 4303 4934 5321 44153 51634 52343 29446 36654 41998PriceUnitPSE CZK/t 1890 1935 2052 17974 16976 17127 10774 5570 6669EU Price CZK/t 10666 11101 10476 96990 100948 82359 38885 40472 54791DRC 2.5 1.9 2.0 2.2 1.8 1.9 3.1 1.7 1.4(World)EPR 1.7 1.6 1.6 1.6 1.5 1.5 4.0 1.6 1.6(World)RBC(EU) 0.9 0.7 0.9 0.9 0.8 1.2 6.1RBP(EU) 0.5 0.6 0.6 0.6 0.6 0.9 6.2
Source: data from CSO(1996,1997c), Ministry of Agriculture, (1994,1995,1996,1997) Kraus etal. 1997; Own calculations
80 GORTON-DAVIDOVA-RATINGER
7. Differences Between the RCA and DRC Estimates
The above results show that both Bulgaria and the Czech Republic com-pare favourably with the EU in terms of cereal production on the DRC estima-tions. However, this is not reflected in the RCA results. There are a number ofreasons for this discrepancy. First, agricultural trade between the EU and tenCEECs (associated countries) is regulated by their respective Europe Agree-ments (EA). As with previous trade agreements, full liberalisation of agricul-tural trade was considered impractical by the EU due to fears of strong oppo-sition by EU farmers worried about a flood of cheap food imports from EasternEurope (Frohberg and Hartmann, 1997). The EU has, thus, opened a limitedpreferential access to its agricultural markets through a series of tariff quotas.Quotas were defined for the most sensitive commodities (dairy products, meatand cereals). These quotas were based on historic, pre-reform trading patternswhen trade in agricultural products, especially staple goods, was minimal.
From preliminary estimations for the Czech Republic, it can be concludedthat less than 20 per cent of the value of Czech agricultural exports to the EUactually benefited from the preferential regime. There are two main reasons forthe relatively low impact of the EA. First, quotas for commodities of interest toCzech exporters were too small (for example for malting barley, malt, hops, andskimmed milk powder [SMP]). Second, only 40 per cent of export quotas werefully used in 1995 and 1996. There has been almost no export for some prod-ucts included in the special regime of the EA. The lack of full utilisation of tariffquotas has been due to three main reasons: imposition of additional tradebarriers, such as entry prices which lie outside of the EA; the poor level ofmarketing experience of Czech exporters and the low reduction of tariffs rela-tive to the appreciation of the Czech currency. Bulgaria's Europe Agreementlikewise provides for preferential access. However, either the substantial cutsin the tariffs have been accompanied by quantity limits or despite the cuts thetariffs have remained relatively high (especially at the beginning of the periodfor which the Europe Agreement was re-negotiated) (Davidova, 1997).
8. Conclusions
The degree to which the agri-food sector can compete on internationaland EU markets is of vital importance to Bulgaria and the Czech Republic. Thispaper has presented a comparative analysis of competitiveness based on atrade measure (RCA) and accounting procedure (DRCs). These indices havebeen adjusted to develop bilateral measures allowing comparison with the EU.
The result of this analysis indicates that Czech and Bulgarian cerealproducers were competitive at world market prices as well as at current EUprices (using the DRC and RBC measures). Large-scale arable farming in bothcountries seems efficient in the employment of scarce economic resources.However, caution should be applied in interpreting the Bulgarian results for
AGRICULTURAL COMPETITIVENESS 81
the competitiveness of the cereal sector. Due to the policies implemented dur-ing the analysed period and the predominantly state-owned grain marketingsystem, farmers' prices were depressed below adjusted border prices. Theremoval of the distortive policies (which took place in 1997) will lead to a rise inEPRs. As the real cost of factors of production rises with economic recovery,DRCs are also likely to increase. Therefore, it is recommendable to repeat suchanalyses in order to capture the impact of the policy switches.
Bulgarian and Czech staple crop production did not achieve high scoreson the RCA trade measures with the EU. This divergence was in part due totrade restrictions. The EU has given the associated countries only limitedpreferential access to its agricultural markets. This access has been based onhistoric, pre-reform trading patterns when trade in agricultural products wasthin.
The DRC calculations for the Czech livestock sector indicate that it is notcompetitive on the world market. For Bulgaria all the DRCs for milk and beef(apart from beef in 1996) were greater than 1, indicating a similar lack of com-petitiveness. The non-competitive nature of Bulgarian milk and beef produc-tion reflects the poor technical efficiency of the sector (based on farm surveyand Ministry of Agriculture estimates). The coefficients used reflect the small-scale nature of Bulgarian dairy and beef production: in 1996 the average milk-ing herd size was 1.6 cows (Gorton etai, 1998). This fragmented base is neverlikely to be competitive on international markets. In contrast, Bulgarian porkproduction was competitive in each year analysed.
The results for Bulgaria and the Czech Republic, showing a tendency forarable crops to be more competitive than livestock products, mirror the resultsof other DRC based studies for CEEC countries. Michalek' s (1995) analysis forSlovakia indicated that for barley, maize, oilseeds sheep and pig meat Slovakianproducers were socially profitable, but milk and beef production was non-competitive. At early 1998 prices, DRC calculations for Romania indicated thatdomestic maize, sunflower and wheat production was internationally competi-tive, but the DRCs for milk, beef and poultry production were greater than 1(Gorton and Deaconescu, 1998). These results indicate that arable producersin Bulgaria and the Czech Republic might be competitive within the EU, al-though they are not the only CEECs to which this applies. This competitive-ness has not so far emerged in trading patterns (as reflected in low RCAscores) due to the substantial trade restrictions that remain between the asso-ciated countries and existing members of the EU.
N o t e s
1. Details about this classification are available in EBRD (1999): notes to Table 9.1.1.2. Bulgaria, Estonia, Hungary, Latvia, Poland and Romania3. However, there is also a problem of how the number of people engaged in agriculturehas been estimated. The World Bank defined this as 'workers' (Davidova and Buckwell,2000). It is possible that some countries may report only the number of certain categories
82 GORTON-DAVIDOVA-RATINGER
of people employed in agriculture which, according to the management records of thecorporate farms, would be described as hired workers. For such countries it could bethat the World Bank has underestimated the numbers engaged in agriculture, and thuslabor productivity has been overestimated. On the other hand, the EU reports arebased on national statistics, in which it is not clear whether the number of peoplereported to be in agriculture has been accurately adjusted into full-time equivalentannual work units. Thus, the calculations based on the European Commission DGVIcountry reports might underestimate labor productivity, particularly in the countrieswith a large number of small farmers such as Bulgaria. This illustrates a generic problemof conducting even a simple analysis of CEEC agriculture.4. There might be a problem with the interpretation of effective protection. The commonnotion is that whenever the value of EPR or RBC is larger than 1 foreign competitors areeffectively restricted in their penetration of the domestic market, while they shouldhave an access to that market in the other case. However, it can happen that the marketis effectively protected by a high tariff, but this is not revealed by the coefficients dueto the fact that the domestic price is still lower than the price of the other country (orin the extreme case than the world price). This is particularly the case of economies intransition, as market efficiency and price transmission are relatively low.5. Similarly, one can deal with general services if they are not considered as fullydecoupled.
References
Balassa, B. 1977. '"Revealed" comparative advantage revisited: an analysis of relativeexport shares of the industrial countries 1953-1971," Manchester School, Vol.45, pp.327-44
Bureau, J. C. and Kazlaitzandokanes, N. G. 1995. "Measuring Effective Protection inEuropean Agriculture," American Journal of Agricultural Economics, Vol.77, pp.279-290
CSO 1997a. Analysis and updated forecast of macro-economic development in theCR in 1997 and 1998, Czech Statistical Office, Prague.
CSO 1997b. National Accounts, 1992, 1993,1994, Czech Statistical Office, Prague.
CSO 1996,1997c. Statistical Yearbook, Czech Statistical Office, Prague.
Davidova, S. 1997. "Bulgaria and Romania en route to CEFTA and their AgriculturalPolicies" In: Regional Trade Arrangements and Agricultural Policy in Central andEastern Europe, PHARE multi-country Trade Development Programme and WyeCollege, Wye College Press, pp. 131-159.
Davidova, S. and Buckwell, A. 2000. "Transformation of CEEC Agriculture andIntegration with the EU: Progress and Issues" In: Tangermann, S. and Banse, M. (eds)Central and Eastern European Agriculture in an Expanding European Union,Wallingford, Oxon: CABI Publishing.
EBRD. 1999. Transition Report London: European Bank for Reconstruction and
AGRICULTURAL COMPETITIVENESS 83
Development.
European Union. 1998. "Agricultural Situation and Prospects in the Central andEastern European Countries. Agriculture and Rural Development," Working Documents.
EU DG06. 1999. Agricultural Statistics on-line database. Internet address: http://europa.eu.int/comm/dg06/agrista/table_en/2012.pdf.
EUROSTAT-COMEXT. 1997. Trade Database, European Commission.
Frohberg, K. and Hartmann, M. 1997. 'Promoting CEC Agricultural Exports throughAssociation Agreements with the EU - why it is not working," IAMO Halle, DiscussionPaper No. 1.
Gorton, M., Buckwell, A. and Davidova, S. 1998. "Impediments to Efficiency in theAgro-Food Chain: Bulgaria," Report to the Organisation for Economic Co-operationand Development (OECD), Paris, September.
Gorton, M. and Deaconescu, D. 1998. The International Competitiveness of RomanianAgriculture, report presented to EU PHARE Technical Assistance Project, Bucharest.
Hughes, G. 1999. "Total Productivity of Emergent Farm Structures in Central andEastern Europe," Wye College - University of London, mimeo.
Kydd, J., Buckwell, A., and Morrison, J. 1997. "The role of the agricultural sector inthe transition to the market economy in Central and Eastern Europe: an analyticalframework," pp 1-20 in Kydd, J., Davidova, S., Mackay, M., and Mech, T. (eds.) Therole of agriculture in the transition process towards a market economy, United NationsCommission for Europe, Economic Studies No. 9, New York: UN.
Kraus, J. et al. 1997. Estimated impacts of EU accession for the Czech republic,Research report, VUZE.
Michalek, J. 1995. "The Application of the Policy Analysis Matrix for an Evaluationof Agricultural Policies in the Slovak Republic," Oxford Agrarian Studies, 23,177-196.
Ministry of Agriculture. 1994, 1995, 1996, 1997. Report on Agriculture, Ministry ofAgriculture of the Czech Republic.
NSI. 1997. Statistical Reference Book 1997, Sofia: NSI.
OECD. 1997. Agricultural Policies, Markets and Trade in OECD Countries, OECD,Paris.
. 1998. Agricultural Policies in Emerging and Transition Economies: Monitoringand Evaluation. Paris: OECD Center for Co-operation with Non-Members.
. 1999a. Agricultural Policies in Emerging and Transition Economies, Vol. 1,Paris: OECD Center for Co-operation with Non-Members.
84 GORTON-DA VIDOVA-RATINGER
. 1999b. Politiques Agricoles des Pays de I 'OCDE: Suivi et Evaluation, Paris:OECD.
Pitts, E., Viaene, J., Traill, B. and Gellynk, X. 1995. Measuring Food IndustryCompetitiveness, EU AAIR Programme on Structural Change in the European FoodIndustries, Discussion Paper No.7, July.
Tsakok, 1.1990. Agricultural Price Policy: A Practitioner's Guide to Partial-EquilibriumAnalysis. Ithaca and London: Cornell University Press.
Tucek, P. et al. 1999. Agrarian External Trade of the Czech Republic Yearbook 1998.Prague: VUZE.
Volosin, J et al. 1997. Charekteristika celkoveho agrdrniho zahranieniho obchoduER, obchodu s EUcelkem a v rdmci Evropske dohody, Prague: VUZE.
VUZE. 1998. Expected impacts of the Accession of the Czech Republic into the EuropeanUnion on the Czech Agriculture, Prague: VUZE.
World Bank. 1997. Bulgaria Agriculture Sector Review: Agricultural Competitivenessand Incentives, Report presented to the World Bank, Sofia.
Appendix 1:Equivalence Between The EPR And PSE Ratios
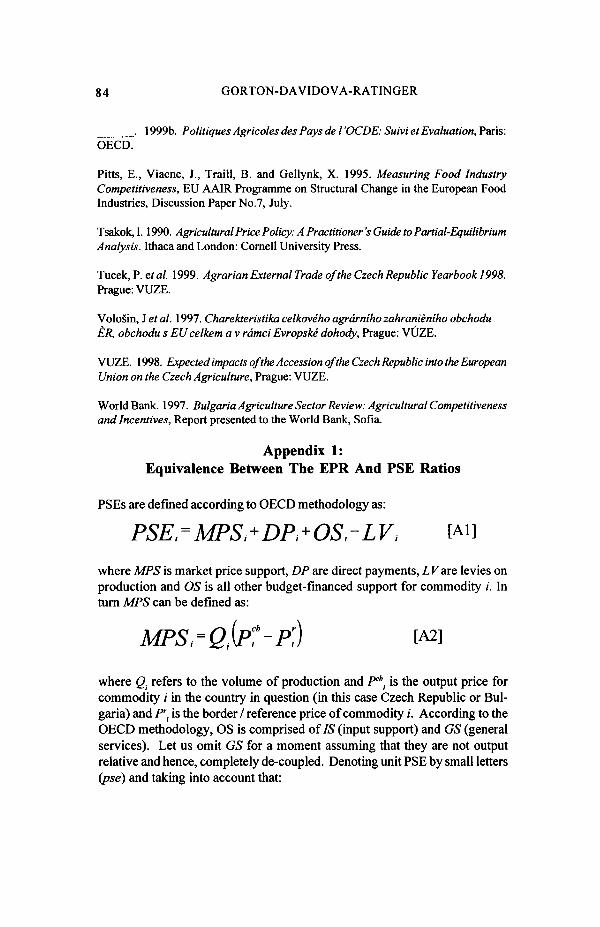
PSEs are defined according to OECD methodology as:
PSErMPSi+DPi+OSrLV, [Ai]
where MPS is market price support, DP are direct payments, LFare levies onproduction and OS is all other budget-financed support for commodity /. Inturn MPS can be defined as:
!) [A2]
where Q. refers to the volume of production and /**. is the output price forcommodity / in the country in question (in this case Czech Republic or Bul-garia) and Pr. is the border / reference price of commodity i. According to theOECD methodology, OS is comprised of IS (input support) and GS (generalservices). Let us omit GS for a moment assuming that they are not outputrelative and hence, completely de-coupled. Denoting unit PSE by small letters(pse) and taking into account that:
AGRICULTURAL COMPETITIVENESS 85
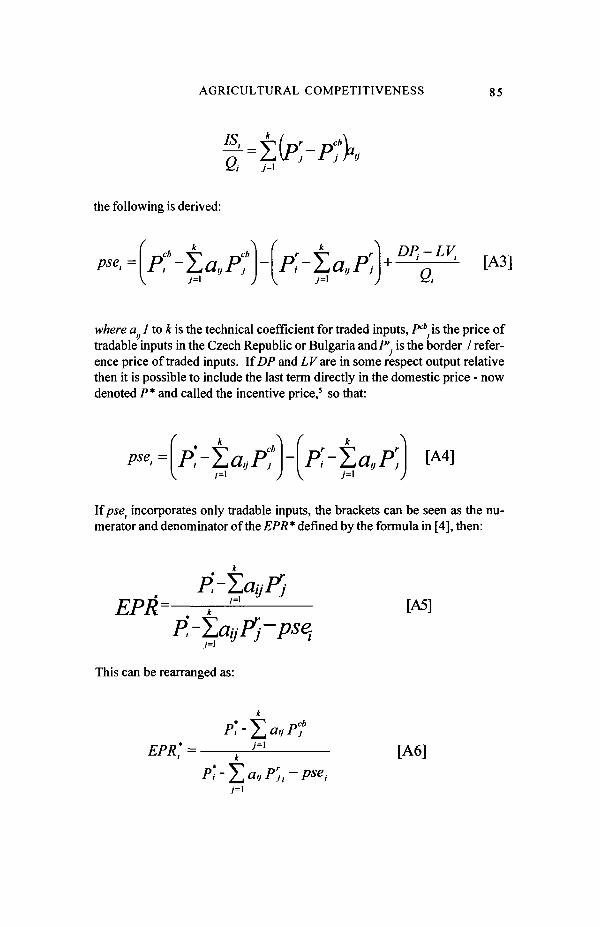
the following is derived:
~ " [A3]
where at 1 to k is the technical coefficient for traded inputs, Pcb is the price oftradable inputs in the Czech Republic or Bulgaria andi* is the border / refer-ence price of traded inputs. If DP and L V are in some respect output relativethen it is possible to include the last term directly in the domestic price - nowdenoted P* and called the incentive price,5 so that:
. =1 P-Ya.jP': -IP'rY,a,P'\
If/we incorporates only tradable inputs, the brackets can be seen as the nu-merator and denominator of the EPR* defined by the formula in [4], then:
EPR=
This can be rearranged as:
[A6]
7=1
86 GORTON-DAVIDOVA-RATINGER
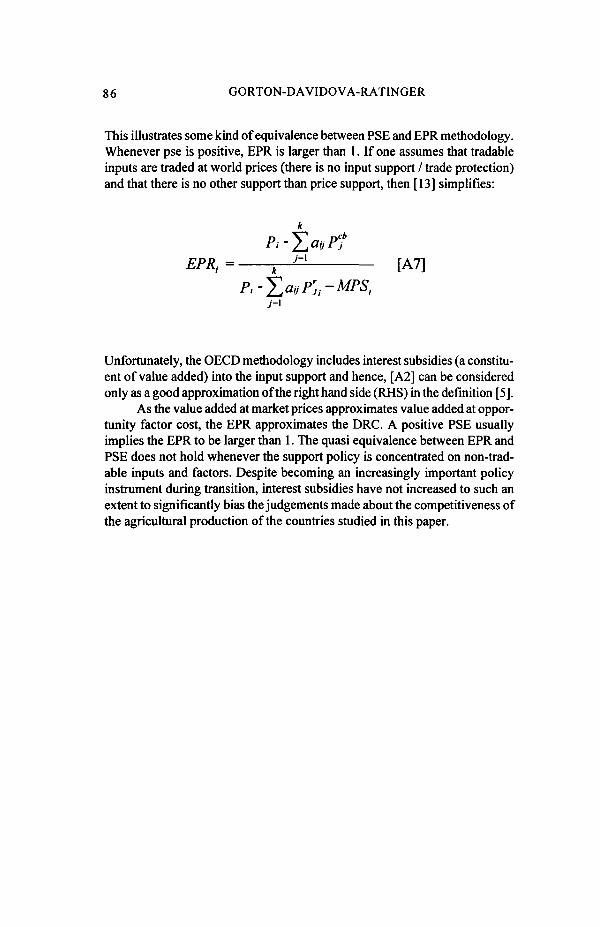
This illustrates some kind of equivalence between PSE and EPR methodology.Whenever pse is positive, EPR is larger than 1. If one assumes that tradableinputs are traded at world prices (there is no input support / trade protection)and that there is no other support than price support, then [13] simplifies:
EPR, = r - ^ [A7]
Unfortunately, the OECD methodology includes interest subsidies (a constitu-ent of value added) into the input support and hence, [A2] can be consideredonly as a good approximation of the right hand side (RHS) in the definition [5].
As the value added at market prices approximates value added at oppor-tunity factor cost, the EPR approximates the DRC. A positive PSE usuallyimplies the EPR to be larger than 1. The quasi equivalence between EPR andPSE does not hold whenever the support policy is concentrated on non-trad-able inputs and factors. Despite becoming an increasingly important policyinstrument during transition, interest subsidies have not increased to such anextent to significantly bias the judgements made about the competitiveness ofthe agricultural production of the countries studied in this paper.