The Combined Effect of Vegetation and Soil Erosion in the Water Resource Management SRTM · MSS ·...
14
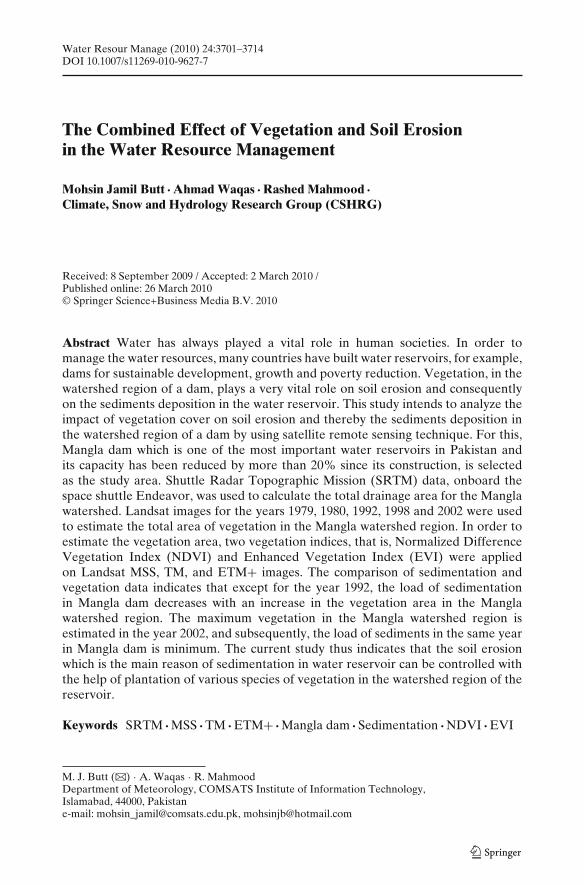
Water Resour Manage (2010) 24:3701–3714 DOI 10.1007/s11269-010-9627-7 The Combined Effect of Vegetation and Soil Erosion in the Water Resource Management Mohsin Jamil Butt · Ahmad Waqas · Rashed Mahmood · Climate, Snow and Hydrology Research Group (CSHRG) Received: 8 September 2009 / Accepted: 2 March 2010 / Published online: 26 March 2010 © Springer Science+Business Media B.V. 2010 Abstract Water has always played a vital role in human societies. In order to manage the water resources, many countries have built water reservoirs, for example, dams for sustainable development, growth and poverty reduction. Vegetation, in the watershed region of a dam, plays a very vital role on soil erosion and consequently on the sediments deposition in the water reservoir. This study intends to analyze the impact of vegetation cover on soil erosion and thereby the sediments deposition in the watershed region of a dam by using satellite remote sensing technique. For this, Mangla dam which is one of the most important water reservoirs in Pakistan and its capacity has been reduced by more than 20% since its construction, is selected as the study area. Shuttle Radar Topographic Mission (SRTM) data, onboard the space shuttle Endeavor, was used to calculate the total drainage area for the Mangla watershed. Landsat images for the years 1979, 1980, 1992, 1998 and 2002 were used to estimate the total area of vegetation in the Mangla watershed region. In order to estimate the vegetation area, two vegetation indices, that is, Normalized Difference Vegetation Index (NDVI) and Enhanced Vegetation Index (EVI) were applied on Landsat MSS, TM, and ETM+ images. The comparison of sedimentation and vegetation data indicates that except for the year 1992, the load of sedimentation in Mangla dam decreases with an increase in the vegetation area in the Mangla watershed region. The maximum vegetation in the Mangla watershed region is estimated in the year 2002, and subsequently, the load of sediments in the same year in Mangla dam is minimum. The current study thus indicates that the soil erosion which is the main reason of sedimentation in water reservoir can be controlled with the help of plantation of various species of vegetation in the watershed region of the reservoir. Keywords SRTM · MSS · TM · ETM+ · Mangla dam · Sedimentation · NDVI · EVI M. J. Butt (B ) · A. Waqas · R. Mahmood Department of Meteorology, COMSATS Institute of Information Technology, Islamabad, 44000, Pakistan e-mail: [email protected], [email protected]
-
Upload
independent -
Category
Documents
-
view
0 -
download
0
Transcript of The Combined Effect of Vegetation and Soil Erosion in the Water Resource Management SRTM · MSS ·...
Water Resour Manage (2010) 24:3701–3714DOI 10.1007/s11269-010-9627-7
The Combined Effect of Vegetation and Soil Erosionin the Water Resource Management
Mohsin Jamil Butt · Ahmad Waqas · Rashed Mahmood ·Climate, Snow and Hydrology Research Group (CSHRG)
Received: 8 September 2009 / Accepted: 2 March 2010 /Published online: 26 March 2010© Springer Science+Business Media B.V. 2010
Abstract Water has always played a vital role in human societies. In order tomanage the water resources, many countries have built water reservoirs, for example,dams for sustainable development, growth and poverty reduction. Vegetation, in thewatershed region of a dam, plays a very vital role on soil erosion and consequentlyon the sediments deposition in the water reservoir. This study intends to analyze theimpact of vegetation cover on soil erosion and thereby the sediments deposition inthe watershed region of a dam by using satellite remote sensing technique. For this,Mangla dam which is one of the most important water reservoirs in Pakistan andits capacity has been reduced by more than 20% since its construction, is selectedas the study area. Shuttle Radar Topographic Mission (SRTM) data, onboard thespace shuttle Endeavor, was used to calculate the total drainage area for the Manglawatershed. Landsat images for the years 1979, 1980, 1992, 1998 and 2002 were usedto estimate the total area of vegetation in the Mangla watershed region. In order toestimate the vegetation area, two vegetation indices, that is, Normalized DifferenceVegetation Index (NDVI) and Enhanced Vegetation Index (EVI) were appliedon Landsat MSS, TM, and ETM+ images. The comparison of sedimentation andvegetation data indicates that except for the year 1992, the load of sedimentationin Mangla dam decreases with an increase in the vegetation area in the Manglawatershed region. The maximum vegetation in the Mangla watershed region isestimated in the year 2002, and subsequently, the load of sediments in the same yearin Mangla dam is minimum. The current study thus indicates that the soil erosionwhich is the main reason of sedimentation in water reservoir can be controlled withthe help of plantation of various species of vegetation in the watershed region of thereservoir.
Keywords SRTM · MSS · TM · ETM+ · Mangla dam · Sedimentation · NDVI · EVI
M. J. Butt (B) · A. Waqas · R. MahmoodDepartment of Meteorology, COMSATS Institute of Information Technology,Islamabad, 44000, Pakistane-mail: [email protected], [email protected]
3702 M.J. Butt et al.
1 Introduction
Water is an important input to almost all production (agriculture, industry, energy,transport, ecosystems) and at the same time is also a force for destruction by themeans of floods and droughts. The increased water shortage risk has driven manycountries in the world to develop strategies for water resource management. Due tointense water scarcity problem it is anticipated that many parts of the world willface major problems particularly in the form of drought. Many researchers haveemphasized the importance of water resource management for drought mitigation(Nalbantis and Tsakiris 2009; Tsakiris et al. 2007; Giakoumakis and Tsakiris 1997).Construction of water reservoirs (dams) is an example to manage the water re-sources. In the watershed area of a dam the role of vegetation is very significant.Vegetation growth is one of the most important natural resources to mankind due toseveral reasons. For example, it reduces carbon in the atmosphere that is the majorsource of global warming and is an alternate for fuel in several developing countries.Vegetation (forests and shrubs) is also a natural habitat for several animal speciesin the world. The role of vegetation however, in a watershed area, is very importantas it reduces the sediment’s load in the dam by compacting the soil in the regionwhich consequently reduces the maintenance cost of the reservoirs and increases thelife of the dam (Ouyang et al. 2010). This factor becomes essentially important fora country like Pakistan as it has large reservoirs built on several rivers. For exam-ple the Terbela dam is built around the Indus river, Mangla dam is constructedaround the Jhelum river and Warsak dam is constructed around the Kabul river.In addition, the country has several barrages constructed on river Indus. Thesereservoirs and barrages are the back bones of Pakistan’s economy as more than 70%of the GDP directly or indirectly is dependant on the agricultural sector.
The capacity of the dams and barrages in Pakistan has been reducing continu-ously since their construction due to rapid soil erosion and subsequent increase insediments load in the water reservoirs. Nasir et al. (2006) indicates that large riversin the world are causing huge amounts of sedimentation in different reservoirs. Thesedimentation load rate mainly depends on the topography of the catchments areas(Owens et al. 2004). The region with more steep slopes results in higher rates ofsedimentation deposition in the dam. In addition, the higher elevations often triggerlandslides, especially in the rainy seasons, causing soil erosion and mud floods whichresult in the higher rate of sediment accumulation in the dam (Weerakoon 2005).Furthermore, melting of snow is also an important factor for increase in water volumeflow rate subsequently enhancing talus in the rivers.
Soil erosion is a natural phenomenon that occurs in every part of the world andcauses several concerns for large structures, including huge reservoirs, roads andeven buildings, thus, resulting in economical and environmental losses in the region(Verstraeten et al. 2002). However from an agricultural point of view, the alluviumbrings minerals with it that makes the agricultural land more fertile. Several factorsincluding topography (Owens et al. 2004), amount of rainfall (Wischmeier and Smith1978) and vegetation cover (Kathiresan 2003; Carson and Younie 2003) affect the soilerosion and thereby the process of sedimentation load in the water reservoirs (Nagle2002). In order to reduce the problem of sedimentation it is therefore necessary toemploy the watershed management emphasized by several research groups (Apitzand Power 2002; Wenning and Ingersoll 2002; Apitz and White 2003). Several
Effect of Vegetation and Soil Erosion in the Water Management 3703
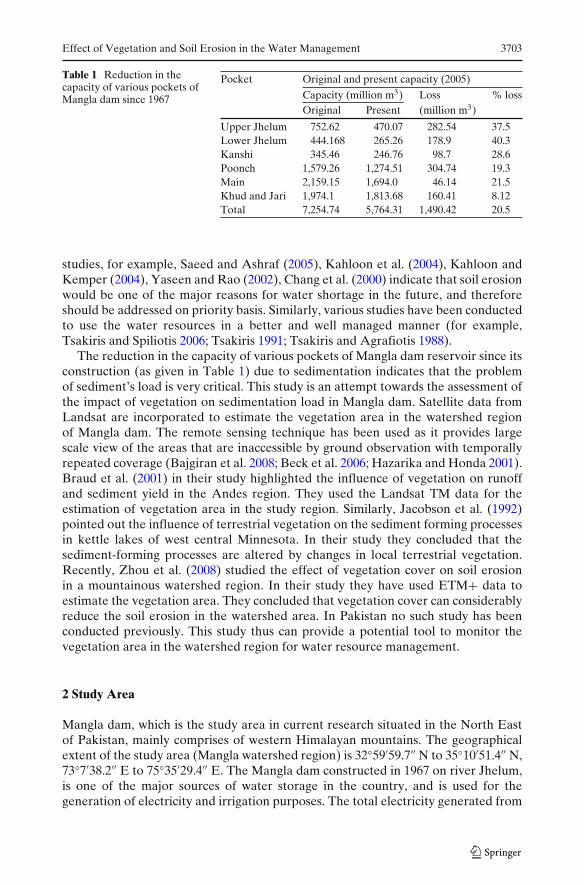
Table 1 Reduction in thecapacity of various pockets ofMangla dam since 1967
Pocket Original and present capacity (2005)
Capacity (million m3) Loss % lossOriginal Present (million m3)
Upper Jhelum 752.62 470.07 282.54 37.5Lower Jhelum 444.168 265.26 178.9 40.3Kanshi 345.46 246.76 98.7 28.6Poonch 1,579.26 1,274.51 304.74 19.3Main 2,159.15 1,694.0 46.14 21.5Khud and Jari 1,974.1 1,813.68 160.41 8.12Total 7,254.74 5,764.31 1,490.42 20.5
studies, for example, Saeed and Ashraf (2005), Kahloon et al. (2004), Kahloon andKemper (2004), Yaseen and Rao (2002), Chang et al. (2000) indicate that soil erosionwould be one of the major reasons for water shortage in the future, and thereforeshould be addressed on priority basis. Similarly, various studies have been conductedto use the water resources in a better and well managed manner (for example,Tsakiris and Spiliotis 2006; Tsakiris 1991; Tsakiris and Agrafiotis 1988).
The reduction in the capacity of various pockets of Mangla dam reservoir since itsconstruction (as given in Table 1) due to sedimentation indicates that the problemof sediment’s load is very critical. This study is an attempt towards the assessment ofthe impact of vegetation on sedimentation load in Mangla dam. Satellite data fromLandsat are incorporated to estimate the vegetation area in the watershed regionof Mangla dam. The remote sensing technique has been used as it provides largescale view of the areas that are inaccessible by ground observation with temporallyrepeated coverage (Bajgiran et al. 2008; Beck et al. 2006; Hazarika and Honda 2001).Braud et al. (2001) in their study highlighted the influence of vegetation on runoffand sediment yield in the Andes region. They used the Landsat TM data for theestimation of vegetation area in the study region. Similarly, Jacobson et al. (1992)pointed out the influence of terrestrial vegetation on the sediment forming processesin kettle lakes of west central Minnesota. In their study they concluded that thesediment-forming processes are altered by changes in local terrestrial vegetation.Recently, Zhou et al. (2008) studied the effect of vegetation cover on soil erosionin a mountainous watershed region. In their study they have used ETM+ data toestimate the vegetation area. They concluded that vegetation cover can considerablyreduce the soil erosion in the watershed area. In Pakistan no such study has beenconducted previously. This study thus can provide a potential tool to monitor thevegetation area in the watershed region for water resource management.
2 Study Area
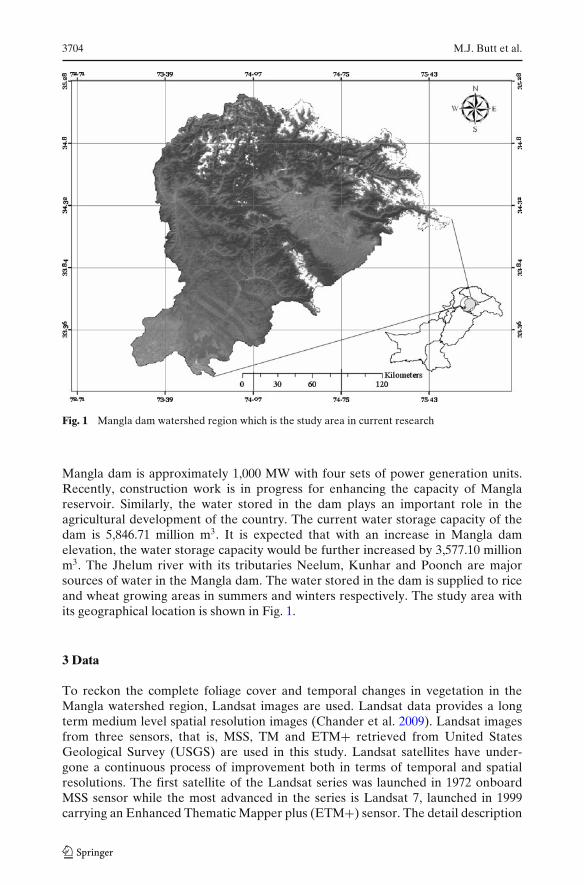
Mangla dam, which is the study area in current research situated in the North Eastof Pakistan, mainly comprises of western Himalayan mountains. The geographicalextent of the study area (Mangla watershed region) is 32◦59′59.7′′ N to 35◦10′51.4′′ N,73◦7′38.2′′ E to 75◦35′29.4′′ E. The Mangla dam constructed in 1967 on river Jhelum,is one of the major sources of water storage in the country, and is used for thegeneration of electricity and irrigation purposes. The total electricity generated from
3704 M.J. Butt et al.
Fig. 1 Mangla dam watershed region which is the study area in current research
Mangla dam is approximately 1,000 MW with four sets of power generation units.Recently, construction work is in progress for enhancing the capacity of Manglareservoir. Similarly, the water stored in the dam plays an important role in theagricultural development of the country. The current water storage capacity of thedam is 5,846.71 million m3. It is expected that with an increase in Mangla damelevation, the water storage capacity would be further increased by 3,577.10 millionm3. The Jhelum river with its tributaries Neelum, Kunhar and Poonch are majorsources of water in the Mangla dam. The water stored in the dam is supplied to riceand wheat growing areas in summers and winters respectively. The study area withits geographical location is shown in Fig. 1.
3 Data
To reckon the complete foliage cover and temporal changes in vegetation in theMangla watershed region, Landsat images are used. Landsat data provides a longterm medium level spatial resolution images (Chander et al. 2009). Landsat imagesfrom three sensors, that is, MSS, TM and ETM+ retrieved from United StatesGeological Survey (USGS) are used in this study. Landsat satellites have under-gone a continuous process of improvement both in terms of temporal and spatialresolutions. The first satellite of the Landsat series was launched in 1972 onboardMSS sensor while the most advanced in the series is Landsat 7, launched in 1999carrying an Enhanced Thematic Mapper plus (ETM+) sensor. The detail description
Effect of Vegetation and Soil Erosion in the Water Management 3705
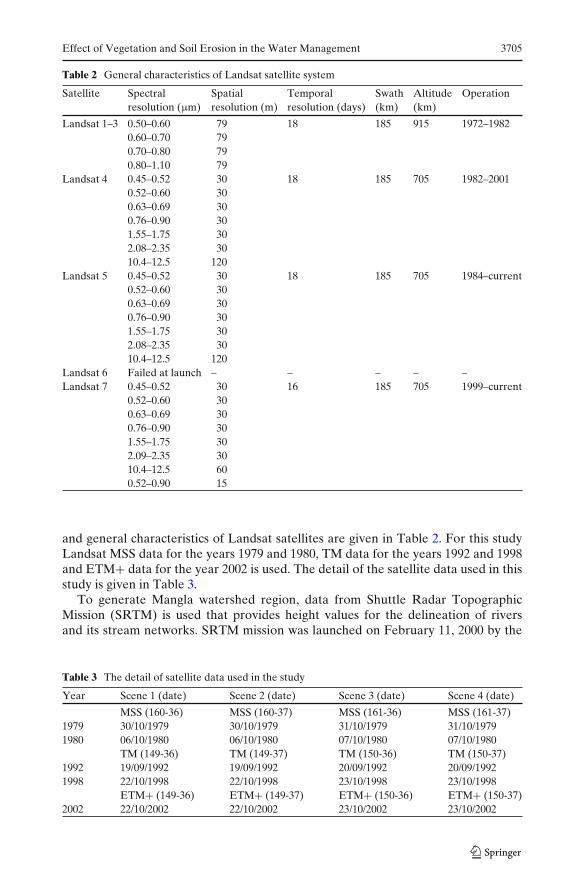
Table 2 General characteristics of Landsat satellite system
Satellite Spectral Spatial Temporal Swath Altitude Operationresolution (μm) resolution (m) resolution (days) (km) (km)
Landsat 1–3 0.50–0.60 79 18 185 915 1972–19820.60–0.70 790.70–0.80 790.80–1.10 79
Landsat 4 0.45–0.52 30 18 185 705 1982–20010.52–0.60 300.63–0.69 300.76–0.90 301.55–1.75 302.08–2.35 3010.4–12.5 120
Landsat 5 0.45–0.52 30 18 185 705 1984–current0.52–0.60 300.63–0.69 300.76–0.90 301.55–1.75 302.08–2.35 3010.4–12.5 120
Landsat 6 Failed at launch – – – – –Landsat 7 0.45–0.52 30 16 185 705 1999–current
0.52–0.60 300.63–0.69 300.76–0.90 301.55–1.75 302.09–2.35 3010.4–12.5 600.52–0.90 15
and general characteristics of Landsat satellites are given in Table 2. For this studyLandsat MSS data for the years 1979 and 1980, TM data for the years 1992 and 1998and ETM+ data for the year 2002 is used. The detail of the satellite data used in thisstudy is given in Table 3.
To generate Mangla watershed region, data from Shuttle Radar TopographicMission (SRTM) is used that provides height values for the delineation of riversand its stream networks. SRTM mission was launched on February 11, 2000 by the
Table 3 The detail of satellite data used in the study
Year Scene 1 (date) Scene 2 (date) Scene 3 (date) Scene 4 (date)
MSS (160-36) MSS (160-37) MSS (161-36) MSS (161-37)1979 30/10/1979 30/10/1979 31/10/1979 31/10/19791980 06/10/1980 06/10/1980 07/10/1980 07/10/1980
TM (149-36) TM (149-37) TM (150-36) TM (150-37)1992 19/09/1992 19/09/1992 20/09/1992 20/09/19921998 22/10/1998 22/10/1998 23/10/1998 23/10/1998
ETM+ (149-36) ETM+ (149-37) ETM+ (150-36) ETM+ (150-37)2002 22/10/2002 22/10/2002 23/10/2002 23/10/2002
3706 M.J. Butt et al.
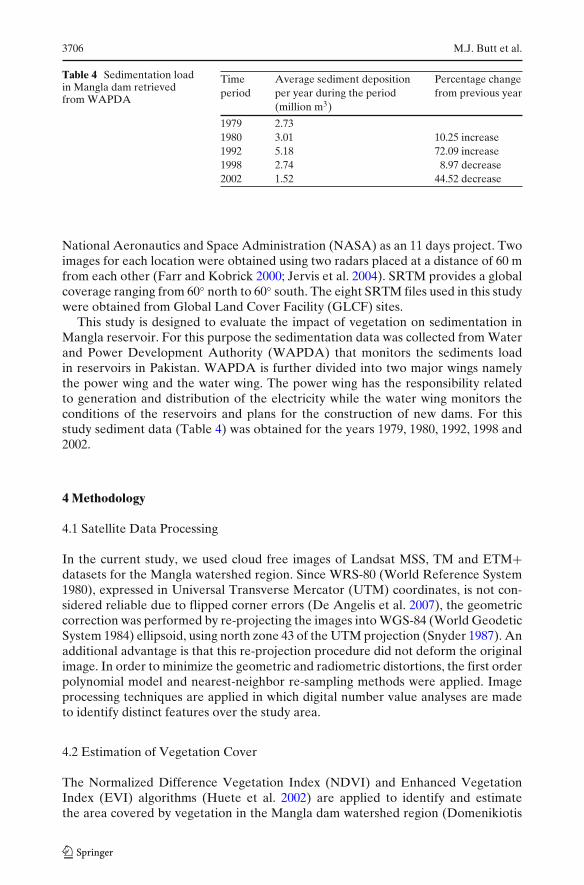
Table 4 Sedimentation loadin Mangla dam retrievedfrom WAPDA
Time Average sediment deposition Percentage changeperiod per year during the period from previous year
(million m3)
1979 2.731980 3.01 10.25 increase1992 5.18 72.09 increase1998 2.74 8.97 decrease2002 1.52 44.52 decrease
National Aeronautics and Space Administration (NASA) as an 11 days project. Twoimages for each location were obtained using two radars placed at a distance of 60 mfrom each other (Farr and Kobrick 2000; Jervis et al. 2004). SRTM provides a globalcoverage ranging from 60◦ north to 60◦ south. The eight SRTM files used in this studywere obtained from Global Land Cover Facility (GLCF) sites.
This study is designed to evaluate the impact of vegetation on sedimentation inMangla reservoir. For this purpose the sedimentation data was collected from Waterand Power Development Authority (WAPDA) that monitors the sediments loadin reservoirs in Pakistan. WAPDA is further divided into two major wings namelythe power wing and the water wing. The power wing has the responsibility relatedto generation and distribution of the electricity while the water wing monitors theconditions of the reservoirs and plans for the construction of new dams. For thisstudy sediment data (Table 4) was obtained for the years 1979, 1980, 1992, 1998 and2002.
4 Methodology
4.1 Satellite Data Processing
In the current study, we used cloud free images of Landsat MSS, TM and ETM+datasets for the Mangla watershed region. Since WRS-80 (World Reference System1980), expressed in Universal Transverse Mercator (UTM) coordinates, is not con-sidered reliable due to flipped corner errors (De Angelis et al. 2007), the geometriccorrection was performed by re-projecting the images into WGS-84 (World GeodeticSystem 1984) ellipsoid, using north zone 43 of the UTM projection (Snyder 1987). Anadditional advantage is that this re-projection procedure did not deform the originalimage. In order to minimize the geometric and radiometric distortions, the first orderpolynomial model and nearest-neighbor re-sampling methods were applied. Imageprocessing techniques are applied in which digital number value analyses are madeto identify distinct features over the study area.
4.2 Estimation of Vegetation Cover
The Normalized Difference Vegetation Index (NDVI) and Enhanced VegetationIndex (EVI) algorithms (Huete et al. 2002) are applied to identify and estimatethe area covered by vegetation in the Mangla dam watershed region (Domenikiotis
Effect of Vegetation and Soil Erosion in the Water Management 3707
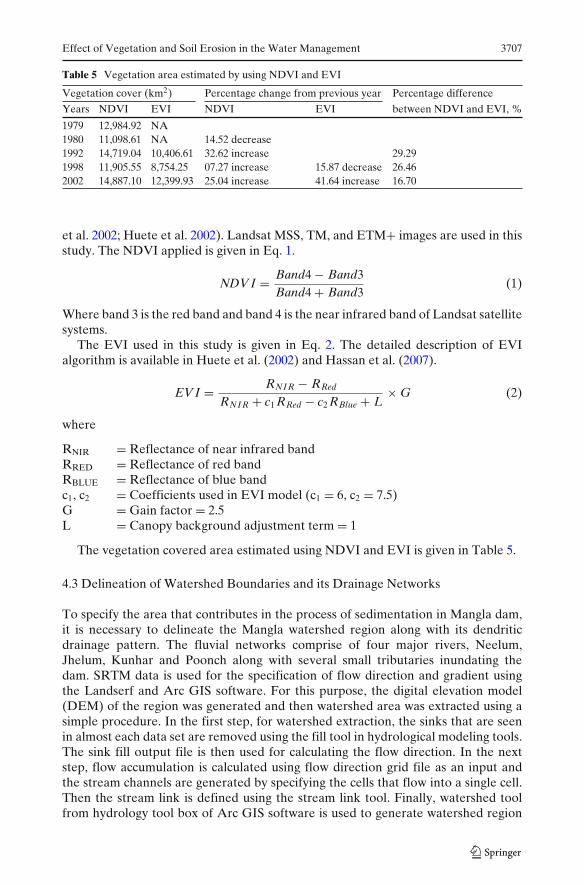
Table 5 Vegetation area estimated by using NDVI and EVI
Vegetation cover (km2) Percentage change from previous year Percentage difference
Years NDVI EVI NDVI EVI between NDVI and EVI, %
1979 12,984.92 NA1980 11,098.61 NA 14.52 decrease1992 14,719.04 10,406.61 32.62 increase 29.291998 11,905.55 8,754.25 07.27 increase 15.87 decrease 26.462002 14,887.10 12,399.93 25.04 increase 41.64 increase 16.70
et al. 2002; Huete et al. 2002). Landsat MSS, TM, and ETM+ images are used in thisstudy. The NDVI applied is given in Eq. 1.
NDV I = Band4 − Band3Band4 + Band3
(1)
Where band 3 is the red band and band 4 is the near infrared band of Landsat satellitesystems.
The EVI used in this study is given in Eq. 2. The detailed description of EVIalgorithm is available in Huete et al. (2002) and Hassan et al. (2007).
EV I = RNI R − RRed
RNI R + c1 RRed − c2 RBlue + L× G (2)
where
RNIR = Reflectance of near infrared bandRRED = Reflectance of red bandRBLUE = Reflectance of blue bandc1, c2 = Coefficients used in EVI model (c1 = 6, c2 = 7.5)G = Gain factor = 2.5L = Canopy background adjustment term = 1
The vegetation covered area estimated using NDVI and EVI is given in Table 5.
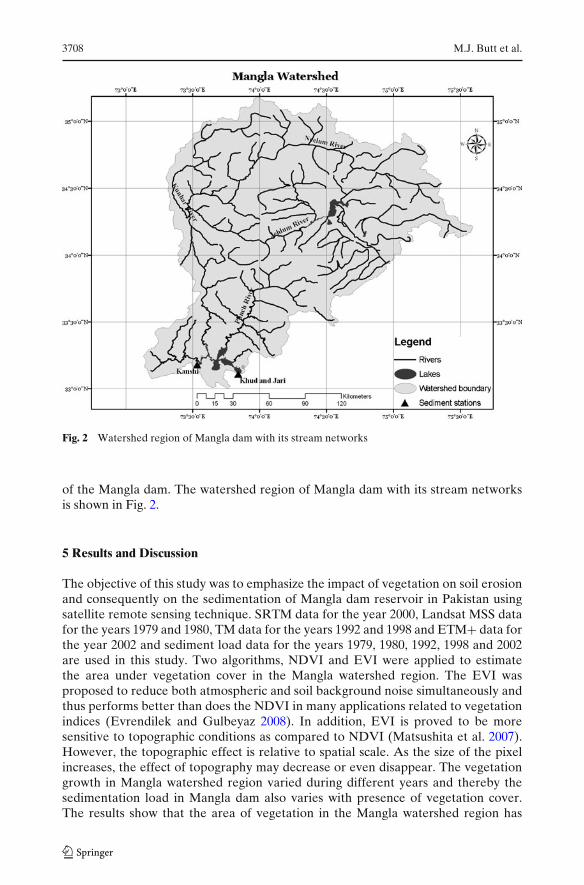
4.3 Delineation of Watershed Boundaries and its Drainage Networks
To specify the area that contributes in the process of sedimentation in Mangla dam,it is necessary to delineate the Mangla watershed region along with its dendriticdrainage pattern. The fluvial networks comprise of four major rivers, Neelum,Jhelum, Kunhar and Poonch along with several small tributaries inundating thedam. SRTM data is used for the specification of flow direction and gradient usingthe Landserf and Arc GIS software. For this purpose, the digital elevation model(DEM) of the region was generated and then watershed area was extracted using asimple procedure. In the first step, for watershed extraction, the sinks that are seenin almost each data set are removed using the fill tool in hydrological modeling tools.The sink fill output file is then used for calculating the flow direction. In the nextstep, flow accumulation is calculated using flow direction grid file as an input andthe stream channels are generated by specifying the cells that flow into a single cell.Then the stream link is defined using the stream link tool. Finally, watershed toolfrom hydrology tool box of Arc GIS software is used to generate watershed region
3708 M.J. Butt et al.
Fig. 2 Watershed region of Mangla dam with its stream networks
of the Mangla dam. The watershed region of Mangla dam with its stream networksis shown in Fig. 2.
5 Results and Discussion
The objective of this study was to emphasize the impact of vegetation on soil erosionand consequently on the sedimentation of Mangla dam reservoir in Pakistan usingsatellite remote sensing technique. SRTM data for the year 2000, Landsat MSS datafor the years 1979 and 1980, TM data for the years 1992 and 1998 and ETM+ data forthe year 2002 and sediment load data for the years 1979, 1980, 1992, 1998 and 2002are used in this study. Two algorithms, NDVI and EVI were applied to estimatethe area under vegetation cover in the Mangla watershed region. The EVI wasproposed to reduce both atmospheric and soil background noise simultaneously andthus performs better than does the NDVI in many applications related to vegetationindices (Evrendilek and Gulbeyaz 2008). In addition, EVI is proved to be moresensitive to topographic conditions as compared to NDVI (Matsushita et al. 2007).However, the topographic effect is relative to spatial scale. As the size of the pixelincreases, the effect of topography may decrease or even disappear. The vegetationgrowth in Mangla watershed region varied during different years and thereby thesedimentation load in Mangla dam also varies with presence of vegetation cover.The results show that the area of vegetation in the Mangla watershed region has
Effect of Vegetation and Soil Erosion in the Water Management 3709
great impact on the sedimentations accumulation rate. In the Mangla watershed,six pockets of sedimentation monitoring (Upper Jehlum, Lower Jehlum, Kanshi,Poonch, Main and Khud and Jari) exist (Table 1). The total sedimentation depositionand total vegetation area are given in Tables 4 and 5 respectively.
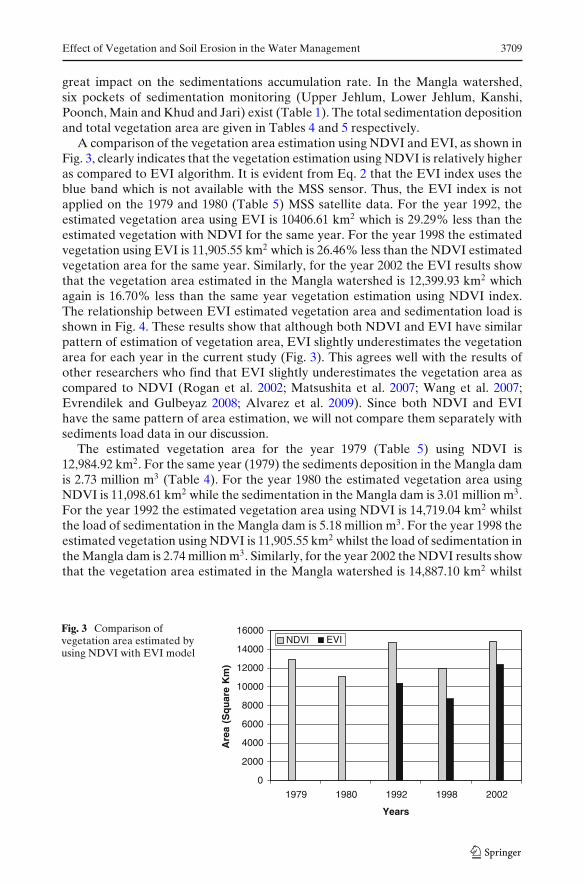
A comparison of the vegetation area estimation using NDVI and EVI, as shown inFig. 3, clearly indicates that the vegetation estimation using NDVI is relatively higheras compared to EVI algorithm. It is evident from Eq. 2 that the EVI index uses theblue band which is not available with the MSS sensor. Thus, the EVI index is notapplied on the 1979 and 1980 (Table 5) MSS satellite data. For the year 1992, theestimated vegetation area using EVI is 10406.61 km2 which is 29.29% less than theestimated vegetation with NDVI for the same year. For the year 1998 the estimatedvegetation using EVI is 11,905.55 km2 which is 26.46% less than the NDVI estimatedvegetation area for the same year. Similarly, for the year 2002 the EVI results showthat the vegetation area estimated in the Mangla watershed is 12,399.93 km2 whichagain is 16.70% less than the same year vegetation estimation using NDVI index.The relationship between EVI estimated vegetation area and sedimentation load isshown in Fig. 4. These results show that although both NDVI and EVI have similarpattern of estimation of vegetation area, EVI slightly underestimates the vegetationarea for each year in the current study (Fig. 3). This agrees well with the results ofother researchers who find that EVI slightly underestimates the vegetation area ascompared to NDVI (Rogan et al. 2002; Matsushita et al. 2007; Wang et al. 2007;Evrendilek and Gulbeyaz 2008; Alvarez et al. 2009). Since both NDVI and EVIhave the same pattern of area estimation, we will not compare them separately withsediments load data in our discussion.
The estimated vegetation area for the year 1979 (Table 5) using NDVI is12,984.92 km2. For the same year (1979) the sediments deposition in the Mangla damis 2.73 million m3 (Table 4). For the year 1980 the estimated vegetation area usingNDVI is 11,098.61 km2 while the sedimentation in the Mangla dam is 3.01 million m3.For the year 1992 the estimated vegetation area using NDVI is 14,719.04 km2 whilstthe load of sedimentation in the Mangla dam is 5.18 million m3. For the year 1998 theestimated vegetation using NDVI is 11,905.55 km2 whilst the load of sedimentation inthe Mangla dam is 2.74 million m3. Similarly, for the year 2002 the NDVI results showthat the vegetation area estimated in the Mangla watershed is 14,887.10 km2 whilst
Fig. 3 Comparison ofvegetation area estimated byusing NDVI with EVI model
0
2000
4000
6000
8000
10000
12000
14000
16000
1979 1980 1992 1998 2002
Years
Are
a (S
qu
are
Km
)
NDVI EVI
3710 M.J. Butt et al.
0
1
2
3
4
5
6
0
2000
4000
6000
8000
10000
12000
14000
16000
1979 1980 1984 1988 1992 1995 1998 2002
An
nu
al S
edim
enta
tio
n (
Cu
bic
mill
ion
met
er)
Veg
etat
ion
Are
a (S
qu
are
Km
)
Years
NDVI EVI Sediments
1 y 12 y 6 y 4 y
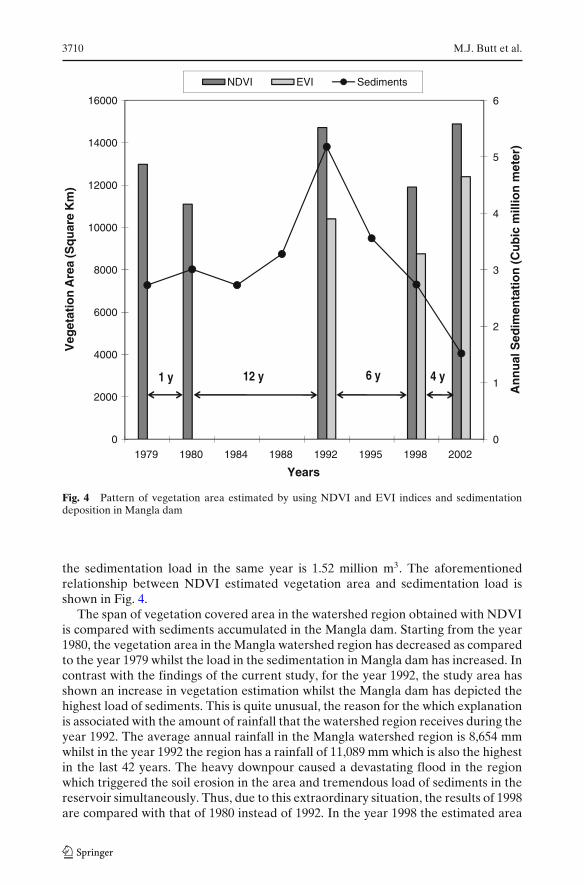
Fig. 4 Pattern of vegetation area estimated by using NDVI and EVI indices and sedimentationdeposition in Mangla dam
the sedimentation load in the same year is 1.52 million m3. The aforementionedrelationship between NDVI estimated vegetation area and sedimentation load isshown in Fig. 4.
The span of vegetation covered area in the watershed region obtained with NDVIis compared with sediments accumulated in the Mangla dam. Starting from the year1980, the vegetation area in the Mangla watershed region has decreased as comparedto the year 1979 whilst the load in the sedimentation in Mangla dam has increased. Incontrast with the findings of the current study, for the year 1992, the study area hasshown an increase in vegetation estimation whilst the Mangla dam has depicted thehighest load of sediments. This is quite unusual, the reason for the which explanationis associated with the amount of rainfall that the watershed region receives during theyear 1992. The average annual rainfall in the Mangla watershed region is 8,654 mmwhilst in the year 1992 the region has a rainfall of 11,089 mm which is also the highestin the last 42 years. The heavy downpour caused a devastating flood in the regionwhich triggered the soil erosion in the area and tremendous load of sediments in thereservoir simultaneously. Thus, due to this extraordinary situation, the results of 1998are compared with that of 1980 instead of 1992. In the year 1998 the estimated area
Effect of Vegetation and Soil Erosion in the Water Management 3711
of vegetation in the Mangla watershed region has increased as compared with 1980and as expected the sedimentation load deposited in the Mangla dam has decreasedduring the same period of observation. Similarly, in the year 2002 the estimated areaof vegetation in the Mangla watershed region has increased as compared with 1998and as expected the sedimentation load deposited in the Mangla dam has decreasedduring the same period of observation. It is evident from the current study that thesediments load rate has a reverse relationship with the vegetation. An increase invegetation causes a decrease in the sedimentation load in the dam and vice versa. Insummary, the estimated vegetation area in the Mangla watershed (Table 5) showsthat the sedimentation load in Mangla dam (Table 4) decreases with an increase inthe vegetation area except for the year 1992 when the sediments deposition has anabrupt increase due to heavy rainfall even though the region has increased vegetationcovered area as compared to 1980.
6 Summary and Conclusion
The impact of vegetation on soil erosion and consequently on load of sedimentsin the Mangla reservoir is presented in this study. The area vulnerable for the soilerosion and sediments deposition in Mangla dam is the Mangla watershed region.The drainage pattern in the Mangla watershed region is generated using SRTM datawhich has been proved as a very useful source to produce DEM. In addition, theconstructed DEM can be very helpful to identify the expanses that contribute in thesedimentation process. The other data used in the current research are sedimentsaccumulation data retrieved from WAPDA and Landsat Images retrieved fromUSGS. The current research shows that the sedimentation load decreases with anincrease in vegetation cover in the Mangla watershed region except for the year1992 when huge floods, due to heavy rainfall in the region, triggered soil erosionand a gigantic sedimentation took place. One of the main limitations of currentresearch is the non-availability of continuous satellite data of the study area. Thus,the analyses are made on the basis of time lags, that is, time lag of 1 year (1979–1980),12 years (1980–1992), 6 years (1992–1998) and 4 years (1998–2002). For instance, inthe first time lag of 1 year the decrease in percentage of the area under vegetationis 14.52%, whilst increase in percentage of sedimentation during the same period is10.25%. Similarly, in the second time lag of 12 years the increase in the percentageof vegetation area is 32.62% whilst the percentage of sedimentation is increasedby 72.09% during the same period. This exceptional reversal change observed insediments deposition is attributed to the swift flood and heavy downpour in theMangla watershed region experienced in the year 1992. During the third time lagof 6 years the area under vegetation has increased by 7.27% while decrease inpercentage of sediments load sounds 8.97% during the same period. For the fourthtime lag of 4 years the vegetation area is further expanded by 25.04% causinga decrease in percentage of sediments load by 44.52% during the same span oftime.
These results indicate that the sedimentation in Mangla reservoir is related tovegetation area and its growth tendency in the watershed region. Conservation ofwater resources has become critical for several countries including Pakistan. Thewater storage capacity in major reservoirs of Pakistan are decreasing continuously
3712 M.J. Butt et al.
due to the sedimentation in several river basins and dams such as Tarbela, Mangla,Warsak, Rawal and Chashma. There are several ongoing and proposed dam con-struction projects in Pakistan including Diamir Bhasha dam, Munda dam and Akhoridam which with the passage of time would also be vulnerable to the sedimentationproblem. These mega projects are very important for boosting the economy of thecountry and it is therefore very imperative to identify the inherent characteristicsof watershed regions controlling the soil erosion and the huge sedimentation issuesreducing the age of newly built dams. This study is an attempt to identify therole of natural and anthropogenic forests on soil erosion and consequently onsedimentation load in the reservoirs. The vegetation growth is important in curtailingthe sedimentation process. This specifically implies to the regions that are vulnerableto hazardous landslides, landslips, soil creep and land degradation. The main causesare the summer monsoon torrential rainfalls that prevail in the country from Julyto September. Climate change resulting in alternate drought and heavy rainfalls indifferent regions is also an important factor while considering the management ofthe sedimentation prone areas. Therefore, it is necessary to make proper plans tocombat the problem of sedimentation load. It concludes that vegetation growth isvital for the reduction in sediments load.
This research has aimed to investigate the impact of vegetation on sedimentationin Mangla dam using SRTM, Landsat MSS, TM, ETM+ and Sedimentation data.The availability of the data from USGS and WAPDA have provided a usefulsource measuring sedimentation with different seasonal variations and episodesin the Mangla dam and the periphery. Currency of this research provides goodgrasp and better understanding of sophisticated relationship pertinent to vegetationon soil detachment and sedimentation in the reservoir. It is recommended thatfurther research refinement is required to sense the delicate relationship betweenthe presence of vegetation cover in the watershed region and sedimentation in thedam. There is great potential in the current field of research encompassing forvarious hydrological, climatological and numerical modeling applications scenarios.In almost every country of the world there has been a constant struggle to reduce thedestructive impacts of water and increase its productive impacts. It is believed thatsustainable growth and poverty eradication cannot be achieved until water resourcesare managed in a well planned way.
Acknowledgements The authors are thankful to Professor Dr. Gul Muhammad for his consider-able perspective assistance in the production of this paper. The authors are also indebted to theformer Director General, Pakistan Meteorological Department, Mr. Ghulam Farid for his valuablecomments and discussion. The authors are also grateful to the editor-in-chief of WRM for significanteditorial assistance in the production of this paper.
References
Alvarez HG, Herrick JE, Mattocks M, Zee JV (2009) Comparison of three vegetation monitoringmethods: their relative utility for ecological assessment and monitoring. Ecol Ind 9:1001–1008
Apitz SE, Power B (2002) From risk assessment to sediment management: an international perspec-tive. J Soils Sediments 2:61–66
Apitz SE, White S (2003) A conceptual framework for river-basin-scale sediment management.J Soils Sediments 3:132–138
Bajgiran PR, Darvishsefat AA, Khalili A, Makhdoum MF (2008) Using AVHRR-based vegetationindices for drought monitoring in the Northwest of Iran. J Arid Environ 72:1086–1096
Effect of Vegetation and Soil Erosion in the Water Management 3713
Beck PSA, Atzberger C, Hogda KA, Johansen B, Skidmore AK (2006) Improved monitoring ofvegetation dynamics at very high latitudes: a new method using MODIS NDVI. Remote SensEnviron 100:321–334
Braud I, Vich AIJ, Zuluaga J, Fornero L, Pedrani A (2001) Vegetation influence on runoff andsediment yield in the Andes region: observation and modeling. J Hydrol 254:124–144
Carson B, Younie M (2003) Managing coastal forest roads to mitigate surface erosion and sedimen-tation: an operational perspective. Watershed Manag Bull 7:10–13
Chander G, Markham BL, Helder DL (2009) Summary of current radiometric calibration coeffi-cients for Landsat MSS, TM, ETM+ and EO-1 ALI sensors. Remote Sens Environ 113:893–903
Chang MH, Leghari AM, Sipio QA (2000) Management of poor quality irrigation water. J DrainWater Manag 4:19
De Angelis H, Rau F, Skvarca P (2007) Snow zonation on Hielo Patagónico Sur, Southern Patagonia,derived from Landsat 5 TM data. Glob Planet Change 59:149–158
Domenikiotis C, Dalezios NR, Loukas A, Karteris M (2002) Agreement assessment ofNOAA/AVHRR NDVI with Landsat TM NDVI for mapping burned forested areas. Int JRemote Sens 23:4235–4246
Evrendilek F, Gulbeyaz O (2008) Deriving vegetation dynamics of natural terrestrial ecosystemsfrom MODIS NDVI/EVI data over Turkey. Sensors 8:5270–5302. doi:10.3390/s8095270
Farr TG, Kobrick M (2000) Shuttle radar topography mission produces a wealth of data. AGU EosTrans 81:583–585
Giakoumakis SG, Tsakiris GP (1997) Meteorological drought effect on sediment yield. WaterResour Manag 11:365–376
Hassan QK, Charles P, Bourque A, Meng FR (2007) Application of Landsat-7 ETM+ and MODISproducts in mapping seasonal accumulation of growing degree days at an enhanced resolution. JAppl Remote Sens 1:1–10
Hazarika MK, Honda K (2001) Estimating the soil erosion using remote sensing and GIS, itsevaluation and its economical implications on agricultural production. In: Stott DE, MohtarRH, Steinhardt GC (eds) Sustaining the global farm, selected papers from the 10th internationalsoil conservation organization meeting, Purdue University and the USDA-ARS National SoilErosion Research Laboratory, Indiana, USA, 24–29 May 1999, pp 1090–1093
Huete A, Didan K, Miura T, Rodriguez EP, Gao X, Ferreira LG (2002) Overview of the radiomet-ric and biophysical performance of the MODIS vegetation indices. Remote Sens Environ 83:197–2
Jacobson HA, Almendinger JE, Hobbie S (1992) Influence of terrestrial vegetation on sediment-forming processes in kettle lakes of west-central Minnesota. Quat Res 38:103–116
Jarvis A, Rubiano J, Nelson A, Farrow A, Mulligan M (2004) Practical use of SRTM data in thetropics—comparisons with digital elevation models generated from cartographic data. Workingdocument no 198, International Center for Tropical Agriculture, Apartado Aereo 6713, Cali,Colombia
Kahloon MA, Kemper WD (2004) Conveyance losses as affected by watercourse leaks. Pak J WaterResour 8:9–12
Kahloon MA, Ashraf M, Ashfaq A (2004) Contribution of small dams in the development of waterresources of the Pothwar Region. Pak J Water Resour 8:23–38
Kathiresan K (2003) How do mangrove forests induce sedimentation? Rev Biol Trop 51:355–360Matsushita B, Yang W, Chen J, Onda Y, Qiu G (2007) Sensitivity of the enhanced vegetation index
(EVI) and normalized difference vegetation index (NDVI) to topographic effects: a case studyin high-density cypress forest. Sensors 7:2636–2651
Nagle GN (2002) The contribution of agricultural erosion to reservoir sedimentation in theDominican Republic. Water Policy 3:491–505
Nalbantis I, Tsakiris G (2009) Assessment of hydrological drought revisited. Water Resour Manag23:881–897
Nasir A, Uchida K, Ashraf M (2006) Estimation of soil erosion by using RUSLE and GIS for smallmountainous watershed in Pakistan. Pak J Water Resour 10:11–21
Ouyang W, Hao FH, Lin C (2010) Vegetation response to 30 years hydropower cascade exploitationin upper stream of Yellow River. Comun Nonlinear Sci Numer Simul 15:1928–1941
Owens PN, Apitz S, Batalla R, Collins A, Eisma M, Glindemann H, Hoonstra S, Köthe H, QuintonJ, Taylor K, Westrich B, White S, Wilkinson H (2004) Sediment management at the river basinscale: synthesis of SedNet Working Group 2 outcomes. J Soils Sediments 4:219–222
Rogan J, Franklin J, Roberts DA (2002) A comparison of methods for monitoring multitemporalvegetation change using Thematic Mapper imagery. Remote Sens Environ 80:143–156
3714 M.J. Butt et al.
Saeed MM, Ashraf M (2005) Feasible design and operational guidelines for skimming wells in theIndus Basin. Pak Agric Water Manag 74:165–188
Snyder JP (1987) Map projections. A working manual. U.S. Geological Survey Professional Paper1395, 383 pp
Tsakiris G (1991) Micro-catchment water harvesting in semi-arid regions: basic design considera-tions. Water Resour Manag 5:85–92
Tsakiris G, Agrafiotis G (1988) Aggregated runoff from small watersheds based on stochastic repre-sentation of storm events. Water Resour Manag 2:77–86
Tsakiris G, Spiliotis M (2006) Cropping pattern planning under water supply from multiple sources.Irrig Drain 20:57–68
Tsakiris G, Pangalou D, Vangelis H (2007) Regional drought assessment based on the reconnais-sance drought index (RDI). Water Resour Manag 21:821–833
Verstraeten G, Van OK, Rampaey VA, Poesen J, Govers G (2002) Evaluating an integrated ap-proach to catchment management to reduce soil loss and sediment pollution through modeling.Soil Use Manag 19:386–394
Wang X, Xie H, Guan H, Xiaobing Z (2007) Different responses of MODIS-derived NDVI to root-zone soil moisture in semi-arid and humid regions. J Hydrol 340:12–24
Weerakoon SB (2005) Assessment of seasonal sedimentation in rain-fed irrigation reservoirs by ahillslope erosion modeling approach. J Mt Sci 2:225–232
Wenning RJ, Ingersoll CG (2002) Summary of the SETAC Pellston workshop on use of sedimentquality guidelines and related tools for the assessment of contaminated sediments. Executivesummary booklet, Pensacola, FL
Wischmeier WH, Smith DD (1978) Predicting rainfall erosion losses: a guide to conservation plan-ning. Agricultural handbook, vol 537. US Department of Agriculture, Washington, DC
Yaseen SM, Rao MI (2002) Effect of marginal quality groundwater on crop yields and soil. J DrainWater Manag 6:49
Zhou P, Luukkanen O, Tokola T, Nieminen J (2008) Effect of vegetation cover on soil erosion in amountainous watershed. Catena 75:319–325