The CO2 consumption potential during gray shale weathering: Insights from the evolution of carbon...
21
The CO 2 consumption potential during gray shale weathering: Insights from the evolution of carbon isotopes in the Susquehanna Shale Hills critical zone observatory Lixin Jin a,⇑ , Nives Ogrinc b , Tiffany Yesavage c , Elizabeth A. Hasenmueller d,1 , Lin Ma a , Pamela L. Sullivan c , Jason Kaye d , Christopher Duffy e , Susan L. Brantley c a Department of Geological Sciences, University of Texas at El Paso, El Paso, TX, USA b Department of Environmental Sciences, Jozef Stefan Institute, Ljubljana, Slovenia c Earth and Environmental Systems Institute, Department of Geological Sciences, Pennsylvania State University, State College, PA, USA d Department of Ecosystem Science and Management, Pennsylvania State University, State College, PA, USA e Department of Civil Engineering, Pennsylvania State University, State College, PA, USA Received 8 February 2014; accepted in revised form 8 July 2014; Available online 22 July 2014 Abstract Shale covers about 25% of the land surface, and is therefore an important rock type that consumes CO 2 during weathering. We evaluated the potential of gray shale to take up CO 2 from the atmosphere by investigating the evolution of dissolved inor- ganic carbon (DIC) concentrations and its carbon isotopic ratio (d 13 C DIC ) along water flow paths in a well-characterized crit- ical zone observatory (Susquehanna Shale Hills catchment). In this catchment, chemical weathering in shallow soils is dominated by clay transformation as no carbonates are present, and soil pore waters are characterized by low DIC and pH. In shallow soil porewaters, the DIC, dominated by dissolved CO 2 , is in chemical and isotopic equilibrium with CO 2 in the soil atmosphere where pCO 2 varies seasonally to as high as 40 times that of the atmosphere. The degradation of ancient organic matter is negligible in contributing to soil CO 2 . The chemistry of groundwater varies along different flowpaths as soil pore water recharges to the water table and then dissolves ankerite or secondary calcite under the valley floor. Weathering of carbonate leads to much higher concentrations of DIC (2500 lmol/L) and divalent cations (Ca 2+ and Mg 2+ ) in groundwa- ters than soil waters. The depth to the ankerite weathering front is hypothesized to be roughly coincident with the water table but it varies due to heterogeneities in the protolith composition. Groundwater chemistry therefore shows different saturation indices with respect to ankerite depending upon location along the valley. The d 13 C DIC values of these groundwaters docu- ment mixing between the ankerite and soil CO 2 . The major element concentrations, DIC, and d 13 C DIC in the first-order stream incising the valley of the catchment are derived from groundwater and soil waters in proportions that vary both spatially and temporally. The CO 2 degassed slightly in the stream but little evidence of C isotopic equilibration with the atmosphere is observed, due to the short length of the stream and short contact time with air. The ankerite reaction front also lies close to the pyrite dissolution front. Pyrite oxidation in bedrock likely released sulfuric acid and played a minor role in the ankerite dissolution, shifting groundwater d 13 C DIC slightly above the expected mixing values. At the catchment scale, the stream SO 4 2 is also dominantly derived from wet deposition, as stream has d 34 S SO4 values around 3&, well within the range of acid deposition. http://dx.doi.org/10.1016/j.gca.2014.07.006 0016-7037/Ó 2014 Elsevier Ltd. All rights reserved. ⇑ Corresponding author. Tel.: +1 915 747 5559; fax: +1 915 747 5073. E-mail address: [email protected] (L. Jin). 1 Current address: Department of Earth & Atmospheric Sciences, Saint Louis University, Saint Louis, MO, USA. www.elsevier.com/locate/gca Available online at www.sciencedirect.com ScienceDirect Geochimica et Cosmochimica Acta 142 (2014) 260–280
Transcript of The CO2 consumption potential during gray shale weathering: Insights from the evolution of carbon...

Available online at www.sciencedirect.com
www.elsevier.com/locate/gca
ScienceDirect
Geochimica et Cosmochimica Acta 142 (2014) 260–280
The CO2 consumption potential during gray shaleweathering: Insights from the evolution of carbon isotopes
in the Susquehanna Shale Hills critical zone observatory
Lixin Jin a,⇑, Nives Ogrinc b, Tiffany Yesavage c, Elizabeth A. Hasenmueller d,1,Lin Ma a, Pamela L. Sullivan c, Jason Kaye d, Christopher Duffy e,
Susan L. Brantley c
a Department of Geological Sciences, University of Texas at El Paso, El Paso, TX, USAb Department of Environmental Sciences, Jozef Stefan Institute, Ljubljana, Slovenia
c Earth and Environmental Systems Institute, Department of Geological Sciences, Pennsylvania State University, State College, PA, USAd Department of Ecosystem Science and Management, Pennsylvania State University, State College, PA, USA
e Department of Civil Engineering, Pennsylvania State University, State College, PA, USA
Received 8 February 2014; accepted in revised form 8 July 2014; Available online 22 July 2014
Abstract
Shale covers about 25% of the land surface, and is therefore an important rock type that consumes CO2 during weathering.We evaluated the potential of gray shale to take up CO2 from the atmosphere by investigating the evolution of dissolved inor-ganic carbon (DIC) concentrations and its carbon isotopic ratio (d13CDIC) along water flow paths in a well-characterized crit-ical zone observatory (Susquehanna Shale Hills catchment). In this catchment, chemical weathering in shallow soils isdominated by clay transformation as no carbonates are present, and soil pore waters are characterized by low DIC andpH. In shallow soil porewaters, the DIC, dominated by dissolved CO2, is in chemical and isotopic equilibrium with CO2
in the soil atmosphere where pCO2 varies seasonally to as high as 40 times that of the atmosphere. The degradation of ancientorganic matter is negligible in contributing to soil CO2. The chemistry of groundwater varies along different flowpaths as soilpore water recharges to the water table and then dissolves ankerite or secondary calcite under the valley floor. Weathering ofcarbonate leads to much higher concentrations of DIC (�2500 lmol/L) and divalent cations (Ca2+ and Mg2+) in groundwa-ters than soil waters. The depth to the ankerite weathering front is hypothesized to be roughly coincident with the water tablebut it varies due to heterogeneities in the protolith composition. Groundwater chemistry therefore shows different saturationindices with respect to ankerite depending upon location along the valley. The d13CDIC values of these groundwaters docu-ment mixing between the ankerite and soil CO2. The major element concentrations, DIC, and d13CDIC in the first-order streamincising the valley of the catchment are derived from groundwater and soil waters in proportions that vary both spatially andtemporally. The CO2 degassed slightly in the stream but little evidence of C isotopic equilibration with the atmosphere isobserved, due to the short length of the stream and short contact time with air.
The ankerite reaction front also lies close to the pyrite dissolution front. Pyrite oxidation in bedrock likely released sulfuricacid and played a minor role in the ankerite dissolution, shifting groundwater d13CDIC slightly above the expected mixingvalues. At the catchment scale, the stream SO4
2� is also dominantly derived from wet deposition, as stream has d34SSO4 valuesaround 3&, well within the range of acid deposition.
http://dx.doi.org/10.1016/j.gca.2014.07.006
0016-7037/� 2014 Elsevier Ltd. All rights reserved.
⇑ Corresponding author. Tel.: +1 915 747 5559; fax: +1 915 747 5073.E-mail address: [email protected] (L. Jin).
1 Current address: Department of Earth & Atmospheric Sciences, Saint Louis University, Saint Louis, MO, USA.

L. Jin et al. / Geochimica et Cosmochimica Acta 142 (2014) 260–280 261
A mass balance calculation shows that silicate and ankerite dissolution of the Rose Hill shale at Shale Hills consumes CO2
at a rate of �44 and �42–48 mol m�2 ky�1 respectively, while degradation of ancient organic matter releases CO2 at a rate of�1.3 mol m�2 ky�1. Silicate dissolution at the shallow soils is facilitated by low pH and high soil pCO2. As ankeritedissolution and organic matter oxidation are shown to occur early during shale alteration, CO2 consumption by shaleweathering is thus limited by initiation of rock disintegration (e.g., fractures) and exposure of fresh surface area to infiltratingCO2- and O2-rich water.� 2014 Elsevier Ltd. All rights reserved.
1. INTRODUCTION
Chemical weathering transforms bedrock into soils atthe Earth’s surface, and these reactions take up atmo-spheric CO2 and control inorganic carbon fluxes in hydro-logical systems. On global scales, an important negativefeedback between continental weathering and global aver-age surface temperature entails the consumption of CO2
through dissolution of silicate minerals and transport ofdissolved inorganic carbon (DIC) to the oceans, where mostCO2 is ultimately isolated from the active carbon pool bycarbonate precipitation (Holland, 1978; Berner andBerner, 1996; Williams et al., 2007; Szramek et al., 2007).Dissolution rates of silicate minerals are elevated at higheratmospheric temperatures, leading to more sequestration ofatmospheric CO2, and thus lower atmospheric temperature.This negative feedback has been modeled based on investi-gations of the major silicate rock types (Amiotte-Suchetet al., 2003). However, few studies have focused on shaleeven though it is ubiquitous and represents as much as25% of continental land area.
Amiotte-Suchet et al. (2003) concluded that shale mightaccount for as much as 40% of the global annual soil/atmo-spheric CO2 consumption during weathering, probablypartly due to the presence of carbonate minerals in shales(e.g., as inter-bedded carbonate layers). The potential forcarbonate mineral weathering to sequester CO2 differs fromthat of silicate minerals because carbonate mineral weather-ing products are subject to eventual re-precipitation andrelease of CO2 in approximately the same proportion tothat which was sequestered over geological timescales(e.g., Ridgwell and Edwards, 2007). Thus it is importantthat we can separate the contribution of dissolution of sili-cates from carbonates during shale weathering, and identifythe C sources.
Stable C isotope ratios (d13C) are commonly used toidentify C sources because of distinctively different ratiosobserved in major C reservoirs: �0& for marine carbonate,��8.0& for atmospheric CO2, and �27& to �12& fororganic matter (based on C3 and C4 assimilation pathwaysduring photosynthesis, respectively) (Friedli et al., 1986;Vogel, 1993; Yang et al., 1996; Telmer and Veizer, 1999;Karim and Veizer, 2000; Helie et al., 2002; Allison et al.,2003; Singh et al., 2005; Jin et al., 2010). The d13C valuesof respired CO2 in soil depend largely on the organic car-bon (OC) sources. The d13C values of soil CO2 becomeslightly heavier due to soil gas diffusion which preferentiallyremoves lighter C isotopes or mixing with atmospheric CO2
(Hillaire-Marcel, 1986; Ehleringer et al., 1991; Vogel, 1993;
Jin et al., 2010). Consequently, DIC in natural watersshows a wide range of C isotopic ratios that are controlledby the C sources as well as the kinetic and equilibriumfractionation factors.
In addition to carbonic acid (dissolved CO2), sulfuric,nitric or organic acids are also key dissolution agents thatdrive silicate and carbonate weathering. However, reactionswith these acids do not take up CO2, and thus are notinvolved in Earth’s climate-weathering negative feedback.In contrast, strong acid can react with carbonate rocks torelease CO2. For example, dissolution of liming materialby strong acids derived from fertilizers in farmlands hasbeen shown to be an important source of greenhouse gasto the atmosphere (Raymond and Cole, 2003; Hamiltonet al., 2007).
Shales are known to contain pyrite that dissolves oxida-tively to produce sulfuric acid. However, contribution ofthe sulfuric, instead of carbonic acid to chemical weatheringreactions is hard to quantify using only elemental stoichi-ometry. This is because sulfate (SO4
2�) in natural waterscan also derive from atmospheric deposition, and thisSO4
2� is not necessarily involved in chemical weatheringreactions. Similar to C isotopes, the d34SSO4 of soil water,groundwater and riverine SO4
2� is an environmental tracerbecause of the large natural variation of d34S observed indifferent S-bearing reservoirs such as sulfide, gypsum, andS-containing coals (Lueth et al., 2005; Cambell andLueth, 2008). The range of d34S isotope ratios in anthropo-genic sulfur in acid rain is narrow, constrained between�1& and 6& (Wadleigh et al., 1994; Benkovitz et al.,1996; Alewell et al., 2000; Herut et al., 2005). When SO4
2�
is rapidly immobilized in the soils, the fractionation of theS isotopes has been shown to be negligible (Trust andFry, 1992). In shale, sulfides are generally present as pyriteand their d34S values range from �20& to 15& (Migdisovet al., 1983; Strauss, 1999). Since the geochemical reactionsof weathering and oxidation cause only small S isotopefractionations in hydrological systems, the d34SSO4 pin-points with high accuracy the primary sources of S andthe rock formations undergoing water–rock interaction(Krouse and Grinenko, 1991; Clark and Fritz, 1997).
The global inventory of carbon as OC in sedimentaryrocks is greater than all the other surface reservoirs com-bined (oceans, soils, biomass and atmosphere) (Hedgesand Oades, 1997; Petsch et al., 2001; Jaffe et al., 2002;Copard et al., 2007). Shale, especially black shale with anaverage of 1 wt% OC, stores the majority of the fossil OC(Copard et al., 2007). Although most of the ancient organicmatter in sedimentary rocks is relatively refractory, it is

262 L. Jin et al. / Geochimica et Cosmochimica Acta 142 (2014) 260–280
susceptible to alteration at Earth’s surface (e.g., Claytonand Swetland, 1978; Littke et al., 1991; Keller and Bacon,1998; Petsch et al., 2000; Jaffe et al., 2002; Jin et al.,2013). The fossil organic matter is lost by biogeochemicalweathering through oxidation, hydrolysis and microbialconsumption (Copard et al., 2007). It is important to under-stand the fate of organic matter during chemical weatheringas this transformation reaction releases CO2 and consumesO2 levels on global scales (Petsch et al., 2000; Sagemanet al., 2003; Petsch et al., 2005).
Here we present a study of inorganic and organic car-bon dynamics in central Pennsylvania soils developed ongray shale of the Silurian Rose Hill Formation at the Sus-quehanna Shale Hills critical zone observatory (SSHO).With carbonate minerals completely leached in the shallowhorizons, the reaction front for carbonate weathering liesat depth in the bedrock, offering the opportunity to deter-mine the relative contribution of DIC from carbonatemineral C versus soil CO2. Likewise, degradation ofmodern vegetation occurs in the soil whereas oxidationof fossil organic matter occurs in bedrock at depth. Lastly,pyrite is present and reactive at SSHO, and its weatheringfront is inferred to lie at depth roughly parallel with thatof carbonates near the ridge site. So a transition isexpected for the sources of sulfuric acid, where acid raindominates the signal at the soil surface and pyrite dissolu-tion dominates at depth. These features make SSHO anideal field site to study C transformation processes amongOC, soil CO2 and DIC in natural waters as well as car-bonic versus sulfuric acid weathering pathways duringshale weathering.
In this study our main goal is to quantify the releaserates of CO2 from decomposition of fossil carbon and con-sumption rates of CO2 from shale weathering, and thusevaluate the net CO2 consumption potential of gray shale.Toward that end, we: (1) evaluate the relative contributionof “old” versus “modern” organic matter sources to soilCO2; (2) study the controls on DIC acquisition as waterpasses through the vadose zone to a shallow aquifer andto a first-order stream; and (3) investigate the sources of dis-solved SO4
2� at the Shale Hills watershed, and quantify therelative importance of sulfuric acid versus carbonic acidweathering. This case study leads to better understandingof the weathering of individual minerals, and places impor-tant constraints on shale’s potential to consume CO2, espe-cially for shale containing only trace carbonate minerals.
2. STUDY AREA
Susquehanna Shale Hills critical zone observatory(SSHO) is an 8-ha catchment, located in central Pennsylva-nia, and with mean annual temperature of 10 �C and meanannual precipitation of 107 cm according to long-term cli-mate record (NOAA, 2007). The hydrology and hydro-chemistry of the SSHO have been well studied. Thehydrological processes and responses of this catchmenthave been well characterized through monitoring and mod-eling (Qu and Duffy, 2007; Graham and Lin, 2011; Jinet al., 2011; Thomas et al., 2013). Precipitation is evenly dis-tributed throughout the year, but also characterized by
large intermittent storms. The V-shaped catchment has a1st-order ephemeral stream with a channel generallyaligned from east to west in the valley (Fig. 1). The streamdischarge is dominated by snowmelt in early spring andrainstorms in the fall. It dries out in the summer due toenhanced evapotranspiration, except for during majorstorms. The depths to water table in the wells next to thestream fluctuate seasonally, �1.5 m in the summer anddry months, and approach or rise above the ground surfacein the wetter spring and fall seasons (Brantley et al., 2013).Our sampling campaign focused on spring and late fall, thetwo seasons with high discharge and thus major elementalfluxes out of the catchment.
The catchment is hydrologically responsive, and thepeaks in stream discharge are observed less than a weekafter a major rainfall event. This is attributed to preferentialflowpaths and the macropores which have been identifiedwithin soils or possibly due to fractures within underlyingsaprock (Lin, 2006; Jin et al., 2011; Kuntz et al., 2011).Indeed, the residence time of soil water and groundwaterwas estimated to be less than one year from H/O isotopedata (Jin et al., 2011). The soil waters are hydrologicallyclosely connected to the shallow groundwaters, and thestream. The stream receives contributions mainly fromgroundwater during the warmer months characterized bylow discharge and by soil waters during high discharge sea-sons. Thus, the stream chemistry has been shown to varyseasonally (with discharge) (Jin et al., 2011). Approximately50% of annual precipitation is lost through evapotranspira-tion, while the other 50% leaves as stream discharge (Jinet al., 2011).
The catchment is developed almost entirely uponSilurian Rose Hill shale (Clinton group; Folk, 1960;Lynch, 1976; Lynch and Corbett, 1985), consisting ofolive-pink to grayish-buff shale with a few layers of inter-bedded limestone (Lynch, 1976). Previous geochemicalstudies at SSHO have focused on isotopic, elemental andmineralogical observations (Jin et al., 2010, 2011;Herndon et al., 2011; Ma et al., 2011; Yesavage et al.,2012; Brantley et al., 2013). The silicate fraction of the bed-rock underlying the SSHO contains mainly quartz andclays (illite and chlorite), with trace amounts of feldspar,pyrite and organic matter. Various amounts of ankeriteare observed only deep in the subsurface. In the Rose Hillshale bedrock, about 0.1% S is observed in the form of pyr-ite; in contrast, the soils contain only �0.01 wt% S. Severalweathering reactions at the northern ridge are observed(from deep to shallow): pyrite dissolution at 23 m depth,ankerite (Fe, Mn-rich dolomite) dissolution at �22 mdepth, plagioclase dissolution at �4–5 m depth, and claymineral dissolution at �0.5 m depth (Jin et al. 2010; Jinet al., 2011; Brantley et al., 2013). The depths to weatheringfronts for pyrite and carbonates, however, are much shal-lower at the valley floor locations (Brantley et al., 2013).At SSHO, relatively unfractured and chemically/mineralog-ically unaltered shale is defined as ‘bedrock’ (below 23 m atnorthern ridge); the in-place rock that is somewhat frac-tured and geochemically altered to a small extent is definedas ‘saprock’ (23 to 0.5 m at northern ridge); the unconsoli-dated and highly weathered materials that are augerable are

Bedrock DepthHigh: 1.38m
Low: 0.25m
0 50 100 200 Meters
N
Pore water nest
Groundwater
SPRT
SPVF
SPMS
Stream
PA
SW
SM
SH
DC1
Sampling sites:
4
5
68
10 11
17
18
Drilled core
2
3
Soil gas nest
SSVF
SSMS
SSRT
DC3
Soil profile
Fig. 1. Sample locations on a depth-to-bedrock map of the Susquehanna Shale Hills critical zone observatory (SSHO; Lin, 2006). Watersamples include soil water from nested lysimeters at three sites along a southern planar transect (SPRT, SPMS, and SPVF; blue circles), riverwaters at three locations along the first order stream (SH, SM and SW; white circles), and groundwaters at 10 wells along the valley (well #2,3, 4, 5, 6, 8, 10, 11, 17, 18; grey circles). Soil gas samples were collected at different depths at the SPRT, SPMS and SPVF sites as well as threesites along a southern swale transect (SSRT, SSMS and SSVF) (green circles). Soil CO2 effluxes were measured at 7 locations along thesouthern planar transect and at 9 locations along the southern swale transect. Solid samples include archived soils from the SPRT site (blackcircle) and drilled core samples from DC1 and DC3 (black stars). (For interpretation of the references to color in this figure legend, the readeris referred to the web version of this article.)
L. Jin et al. / Geochimica et Cosmochimica Acta 142 (2014) 260–280 263
termed as ‘soil’ (0.5 m to soil surface). Soil thickness varieswith landscape location in the catchment, with thinner soilsat the ridge top and thicker soils in the valley floor and intopographic depressions (Fig. 1; Lin, 2006).
The SSHO is a forested catchment, with oak (63% oftotal basal area), hemlock (16%), hickory (13%), and pines(8%) as the dominant species (Wubbels, 2010). Deciduoustrees (maple and oak) cover the slopes while hemlocksand pines are present in the valley (Lin, 2006). The SSHOwas recently logged in the 1930s. Organic matter contentin different landscape locations and DOC in soil waters,groundwaters and streams have been investigated(Andrews et al., 2011). Degradation of organic matterand thus subsequent release of DOC and CO2 are moreimportant within the swales, where soils are thicker andmore hydrologically active (Andrews et al., 2011;Hasenmueller et al., 2014).
The SSHO is a relatively pristine watershed, but hasbeen impacted by minor recent industrial pollution. Evi-dence for such anthropogenic contamination includesenrichment of Mn and Pb at the soil surface from steeland ferroalloy manufacturing, gasoline additives, and coalcombustion (Herndon et al., 2011; Ma et al., 2014). TheSSHO is also impacted by acid deposition. The
biogeochemistry of S derived from acid rain has been inten-sively studied in the soils of northeastern USA (Nordstrom,1982; Ulrich and Pankrath, 1983; Reuss and Johnson, 1986;Mayer et al., 1995; Sharpe and Drohan, 1999; Canfield,2001). It has been shown that the residence time of S in soilsis longer than several months because of adsorption ofsulfate to Fe oxyhydroxide and clays, precipitation asAl-hydroxy sulfate minerals, or/and microbial sulfate min-eralization (Fitzgerald, 1976; Rajan, 1978; Nordstrom,1982; Khanna et al., 1987; Mayer et al., 1995).
3. METHODS
3.1. Collection of water, gas and solid samples
Nests of lysimeters (tension soil water samplers) wereinstalled in 2006 at three sites along a planar transect onthe southern slope of the watershed: the ridge top (SPRT),mid-slope (SPMS) and valley floor (SPVF) (Fig. 1; detailsin Jin et al. 2011; Andrews et al., 2011). One day to oneweek prior to sampling these lysimeters, a vacuum of0.5 bar was applied to draw water into the ceramic cups.Groundwater samples at the SSHO were collected fromten wells along the valley floor (Fig. 1). These wells, cased

264 L. Jin et al. / Geochimica et Cosmochimica Acta 142 (2014) 260–280
to �3 m below land surface, are situated in the shallowaquifers and linked hydrologically and geochemically tothe soil waters and streams. The first-order ephemeralstream water was sampled at three locations: SH at theheadwater, SM near the mid-point, and SW by the old weirat the outlet of the catchment (Fig. 1).
Soil water, groundwater and stream samples were col-lected three times: November 2011, May 2012 and April2013, when the soils were wet and stream discharge washigh. Groundwater and stream samples were filteredthrough 0.45 lm Whatman polypropylene filters. Ceramiccups of lysimeters have a maximum pore size of 1.3 lm,so soil waters were not further filtered. A previous studyat SSHO has shown that further filtration to <0.45 lm doesnot change the concentrations of major ions, such as Mg2+,Ca2+, and sulfate, but does lower those of relatively insolu-ble elements such as Fe and Al (Yesavage et al., 2012).Thus, it is reasonable to assume that Ca2+ etc is predomi-nantly in the dissolved form, while Fe and Mn in soil watersare partially lost via colloidal transport. One aliquot ofeach water sample was stored in pre-cleaned HDPE bottlesand acidified with high-purity nitric acid for cation analy-ses. Another filtered aliquot was left untreated for alkalinitytitrations, anion analyses and S isotopes. Samples for thestable isotope analyses of DIC were stored in glass bottles,capped with a stopper leaving no headspace and subse-quently crimped to avoid any exchange with atmosphere.All samples were stored at 4 �C until analysis.
Nests of soil gas tubes were installed at the SPRT, SPMSand SPVF sites in 2008, following a modified USGSprotocol, at 10 or 20 cm depth intervals until the depth ofrefusal during augering. Specifically, the tubes consistedof 1/8-inch ID stainless steel tubing with one end wrappedby stainless steel mess to keep soil materials from cloggingthe tubing. The other end is fit with a Swagelok� cap.Another three nests of soil gas tubes were installed at asouthern swale transect in 2009 (Fig. 1): the ridge top(SSRT), mid-slope (SSMS) and valley floor (SSVF). Thesoil gas samples were collected in the field using 60-mLplastic syringes and needles after purging to clear the sam-pler tube. Gas samples were immediately transferred to15 mL Labco�pre-evacuated glass vials. Soil gas CO2 sam-ples were collected twice over the study period (June 2012and April 2013). Soil gas samples for d13C analysis werecollected in the same way as CO2 concentration samples.
Solid samples were collected previously and archived,including soils at SPRT as well as weathered and unweath-ered rocks from a drilled core (DC1) at the northern ridge(Fig. 1; Jin et al., 2010). By combining soils, saprock andbedrock samples from DC1, we have a complete weatheringprofile.
3.2. Analyses of solid samples
Solid samples, including soil and rock, were air-dried atroom temperature for a week, then ground to pass a 100-mesh sieve (150 lm). Total OC contents of these sampleshave been reported previously (Jin et al., 2010). Soil androck samples for C isotope measurements in OC (d13COC)were combusted in an elemental analyzer (Costech) and
measured on a continuous-flow isotope ratio massspectrometer (IRMS; Finnigan Delta PlusXL). Precisionfor d13COC is ±0.1& or better (1r). In order to measureC isotope composition of the carbonate minerals (d13CCa),soil or rock samples were reacted with dehydrated H3PO4
under vacuum at 70 �C. The released CO2 was thenmeasured by an IRMS (Finnigan MAT 252). For thesemeasurements, precision is better than ±0.08& (1r).
3.3. Analyses of gas samples
Soil gas CO2 concentrations (pCO2) were measured by aLiCOR 7000, calibrated with CO2 standards with concen-trations of 970 and 10300 ppmv. The isotopic compositionof soil CO2 was determined using a Europa 20–20 continu-ous flow IRMS with an ANCA TG preparation module fortrace gas samples. Gas samples were flushed with He acrosstwo chemical traps that removed water and then trappedthe CO2. The isotope ratios of soil gas samples were ana-lyzed at the Jozef Stefan Institute in Slovenia. Precision isbetter than ±0.1& (1r), based on repeated internalstandards.
In addition to soil gas sample collection, a LICOR 6200analyzer was attached to a respiration chamber to measureCO2 efflux in-situ at the SPRT, SPMS and SPVF sites(details on data collection are reported in Hasenmuelleret al. (2014)).
3.4. Analyses of water samples
Water pH was measured in the field using a Corning 315portable pH meter and a Ross glass-body combination pHelectrode calibrated on the NBS scale using two low-ionic-strength buffer solutions (4 and 7). With the vacuumapplied to the lysimeters during the sampling period, degas-sing could not be totally avoided. The pH values measuredare thus the maximum values, and the estimated uncer-tainty is ±0.05 units. Water temperature was immediatelymeasured after sample collection.
Concentrations of major cations, (Ca, Mg, Na, K, Sr,Fe, Mn) and anions (Cl, nitrate, and sulfate) as well as silicawere measured with a Perkin Elmer inductively coupledplasma optical emission spectrometer (ICP-OES, DV5300)and Dionex-2100 ion chromatograph (IC), respectively atthe Low-Temperature Geochemistry Laboratory of theUniversity of Texas at El Paso (UTEP). The precision ofICP-OES and IC analyses was better than ±3% for majorelements and ±10% for minor elements. Total alkalinitywas determined on refrigerated water samples by weakhydrochloric acid titration using Mettler Toledo DL15auto-titrator and data reanalyzed using the Gran alkalinitymethod (Edmond, 1970; Gieskes and Roders, 1973; Stummand Morgan, 1996). Alkalinities of water samples fromNovember 2011 and May 2013 were not titrated, but calcu-lated based on charge balance. The uncertainty for alkalin-ity titrations is ±10% for most of groundwater and streamsamples, but much higher for soil water, groundwater andstream samples with very low alkalinity values. Uncertain-ties were estimated by comparing measured and calculatedalkalinity values where both were available.

L. Jin et al. / Geochimica et Cosmochimica Acta 142 (2014) 260–280 265
The mineral saturation states and pCO2 concentrationsof the water samples were calculated using the USGS pro-gram Solmineq.88 (Kharaka et al., 1988) using measuredmajor ion concentrations, dissolved silica content, pH andalkalinity. For most groundwater samples, alkalinity wasnot measured and estimated based on charge balance. Forsamples where temperature was not measured in the field,a temperature of 10 �C, the mean annual air temperature,was assumed for groundwaters, and mean daily air temper-ature for a given sample date (monitored by the weatherstation at SSHO) was assumed for soil water and streamwater samples. The saturation index, SI, is defined as log(IAP/Ksp) where IAP and Ksp are the ion activity productof mineral dissolution reaction and the solubility constantof the mineral, respectively. Positive SI values indicate thewater is supersaturated with respect to a given mineral,while negative values indicate the water is undersaturatedwith respect to a given mineral. The SI values for both cal-cite and dolomite were used as proxies of ankerite satura-tion. Given the likely variability in pH and temperature,the saturation index estimates were assumed to be only reli-able within ±0.5 log units.
The stable isotope composition of dissolved inorganiccarbon (d13CDIC) was determined with an IRMS (Thermo-Quest Finnigan Delta PlusXL) coupled with a Gasbenchautomated sampler (also manufactured by Finnigan). Sam-ples were reacted for >1 h with phosphoric acid at roomtemperature in vials previously flushed with He gas. Thedissolved sulfate in water samples was precipitated asBaSO4 and its isotope composition (d34SSO4) was measuredas SO2 gas in a continuous-flow gas-ratio mass spectrome-ter (ThermoQuest Finnigan Delta PlusXL). Precision isestimated to be ±0.15 or better (1r), based on repeatedinternal standards.
All stable isotope measurements of C and S isotoperatios of water samples were commercially analyzed by
Table 1d13C, organic carbon and ankerite concentrations in SSHO soil and rock
Sample depth (m) OCa wt% Ankeritea wt% d13C (&) OM d13
Soil profile: SPRT
0.05 1.76 0 �25.80.15 0.79 0 �25.60.25 0.37 0 �25.3
Drilled core (DC1)
1.2 0 �26.23.5 0.05 0 �26.84.4 0.05 0 �27.36.2 0 �26.810.8 0.03 0 �26.515.3 0.04 0 �26.923.0 1.5 �25.9 �624.5 7.8 �27.1 �5
Drilled core (DC3)
6.5 �27.8 �16.56.914.5
a Data for DC1 core have been previously reported in Jin et al. (2010)b Data for those DC3 core samples have been previously reported in B
the Environmental Isotope Laboratory at the Universityof Arizona. Results are expressed in the conventional delta(d) notation, defined as per mil (&) deviation from refer-ence standard VPDB and CDT.
4. RESULTS
4.1. Carbon content and isotopic composition of solid samples
The C isotopic compositions of solid samples, includingorganic carbon in the soils, drilled bedrock samples, andcarbonate minerals in the drilled bedrock are reported inTable 1. Also included are organic and inorganic carboncontents, published previously for the same samples (Jinet al., 2010). The organic carbon (OC) concentrations ofthe DC1 core samples, previously published for the samesamples in Jin et al. (2010), ranges from 0.03 to 0.05 wt%,much lower than those of the shallow soils where carbonis mainly derived from modern vegetation (Table 1;Fig. 2A). For example, for the soil profile SPRT, OC con-centrations are almost 1.8 wt% at surface but decrease shar-ply with depth.
The d13COC values of the DC1 samples are variable(�27.3& to �25.9&), but more negative than those of soils(�25.8& to �25.3&) (Table 1; Fig. 2B). When the OC con-centrations are plotted versus the isotopic compositions twoclusters are defined, delineating the ancient and modernorganic carbon sources (Fig. 2C). The d13COC values ofthe soils increase with depth (Fig. 2C). Only the two bot-tom-most samples in the DC1 drill core contain measurableamounts of the carbonate mineral ankerite (1.5–7.8 wt%)(Table 1). The ankerite has C isotope ratios averaging�5.9 ± 0.3& (n = 2). One sample from another corederived from borehole DC3 drilled in the valley (Fig. 1),contains calcite with a d13CCa value of �1.1&, differentfrom that of the DC1 core (Table 1).
samples.
C (&) carbonate d13C (&)b total carbon Total carbonb wt%
.1
.7
.1�2.9 2.9�10 0.8�11.5 0.7
.rantley et al. (2013).

0
5
10
15
20
25
30 0.01 0.1 1 10
Dep
th (m
)
0
5
10
15
20
25
30 -28 -27 -26 -25
-27.5
-27.0
-26.5
-26.0
-25.5
-25.0
0.1 1 10 100 1/[OC] (1/%)
δ13C
OC(‰
)
Dep
th (m
)
δ13COC(‰)[OC] (%)
A B C
modern
ancient
increasing depth
Fig. 2. Organic carbon concentration ([OC] in wt%; A) and its carbon isotope ratio (d13COC in &, B) as a function of depth at SSHO. Thedata shown here are combined profiles from the soils at the SPRT site and drill core samples from the DC1 site. The cross plot of twoparameters (C) shows two groups of organic carbon: modern and ancient (from the Silurian bedrock shale).
266 L. Jin et al. / Geochimica et Cosmochimica Acta 142 (2014) 260–280
4.2. Soil gas CO2 concentrations and 13CCO2
The CO2 concentration (pCO2) and carbon isotopiccomposition (d13CCO2) of soil gas samples are reported inTable 2. The soil pCO2 ranges from 1200 to 30,000 ppmv.The June samples have higher pCO2 than those from April(Fig. 3A). The highest concentrations are observed atSPVF, SSMS and SSVF sites, where soils are much thicker(>70 cm) (Table 2). In all three sites, soil pCO2 increaseswith depth, and even the soil gas samples collected at10 cm have much higher pCO2 than atmosphere. This con-centration gradient drives CO2 loss from soils to atmo-sphere via diffusion. The CO2 fluxes, which vary amongsites, also vary seasonally from 1.1 to 7.3 lmol m�2 s�1
(Hasenmueller et al., 2014). Indeed, the average surfaceCO2 fluxes measured at the SPRT, SPMS and SPVF sitesare 3.1, 2.5, and 3.1 lmol m�2 s�1, respectively(Hasenmueller et al., 2014).
The values of d13CCO2 in soil gas range from �26.9& to�11.7&. These values are distinctively different from thatof atmospheric CO2 (�8&) (Fig. 3B). At the SPRT site,where both d13CCO2 and d13COC were measured, soil gasCO2 is about 2& enriched relative to the soil organic car-bon. Near the surface, soil d13CCO2 values are closer to thatof the atmosphere (Fig. 3B). Indeed, shallow soil gas sam-ples, especially those collected from April, have much lowerpCO2, due to mixing with the atmosphere (Fig. 3C).
4.3. Soil water, groundwater and stream chemistry
Elemental and isotope chemistry of soil waters, ground-waters, and stream waters at SSHO are reported in Table 3.The soil waters are dilute, with low Mg2+ and Ca2+ concen-trations (<100 lM) and alkalinity (<200 leq/L) (Fig. 4A).Groundwater chemistry varies among sites, but is generallymore concentrated than soil waters (Fig. 4A). The highestMg2+, Ca2+ and alkalinity concentrations are observed inthe wells near the outlet of the catchment (wells #17, #18,#2, and #3), and the lowest concentrations are observedhigher in the catchment (wells #10, #11) (Table 3). StreamMg2+ and Ca2+ concentrations increase downstream fromSH to SM and SW (Fig. 4A; Table 3). Strontium behavessimilarly to Ca and Mg, and follows their concentrationtrends (Table 3). Dissolved Fe and Mn concentrations are
low in these groundwaters (<2 lM), except in well #8(>20 lM) (Table 3).
Soil waters have lower pH (4–5.5) than groundwaters(5.5–7.5), and stream pH lies between (Fig. 4B). The pH ofthe stream becomes higher moving downstream from theheadwater to outlet (Table 3). The pH of the stream at eachlocation varies among the three sampling trips, possibly dueto the relative contributions from groundwater and soilwater, and due to the in-situ biological activities. All thewater samples are unsaturated with respect to calcite and dis-ordered dolomite, with negative saturation indices (Table 3;Fig. 4B). The soil waters are the farthest from equilibrium(Fig. 4B). The saturation indices of the groundwaters withrespect to calcite vary among sites, and those near the outletare close to 0 (Table 3), in agreement with trends of Ca, Mgand alkalinity concentrations as well as pH values. The satu-ration indices for calcite in the stream waters are intermedi-ate, and slightly overlap with groundwaters (Fig. 4B).
The d13CDIC values range from �22& to �17& in soilwaters, from �18.4& to �9.9& in groundwaters, and from�17.9& to �10.6& in streams (Table 3, Fig. 4C). Well #8was documented to have much higher d13CDIC values:�3.1& in November 2011 and �0.9& in April 2012. Thed13CDIC values increase systematically downstream fromvalues similar to soil waters to that of ground waters (SH:�19.9& and �17.4&; SM: �15.8& and �15.9&; andSW: �12.6& and �10.6&, for November 2011 and April2012, respectively) (Table 3).
The SO42� concentrations in soil waters vary from 25 to
150 lM, while most groundwaters have SO42� concentra-
tions higher than 80 lM, except for wells #8 and #18. Incontrast, SO4
2� concentrations vary little in the stream(Table 3). The d34SSO4 values of the stream also remain con-stant at � 3&; however, groundwaters have a wider rangeof d34SSO4 values (Table 3).
5. DISCUSSION
The SSHO catchment provides a natural laboratory toinvestigate C transformations during shale weathering ina watershed of relatively simple lithology and hydrology.This case study constrained shale’s potential to consumeCO2, by weathering of silicate minerals in shallow soilsand by dissolution of trace carbonate minerals deep in
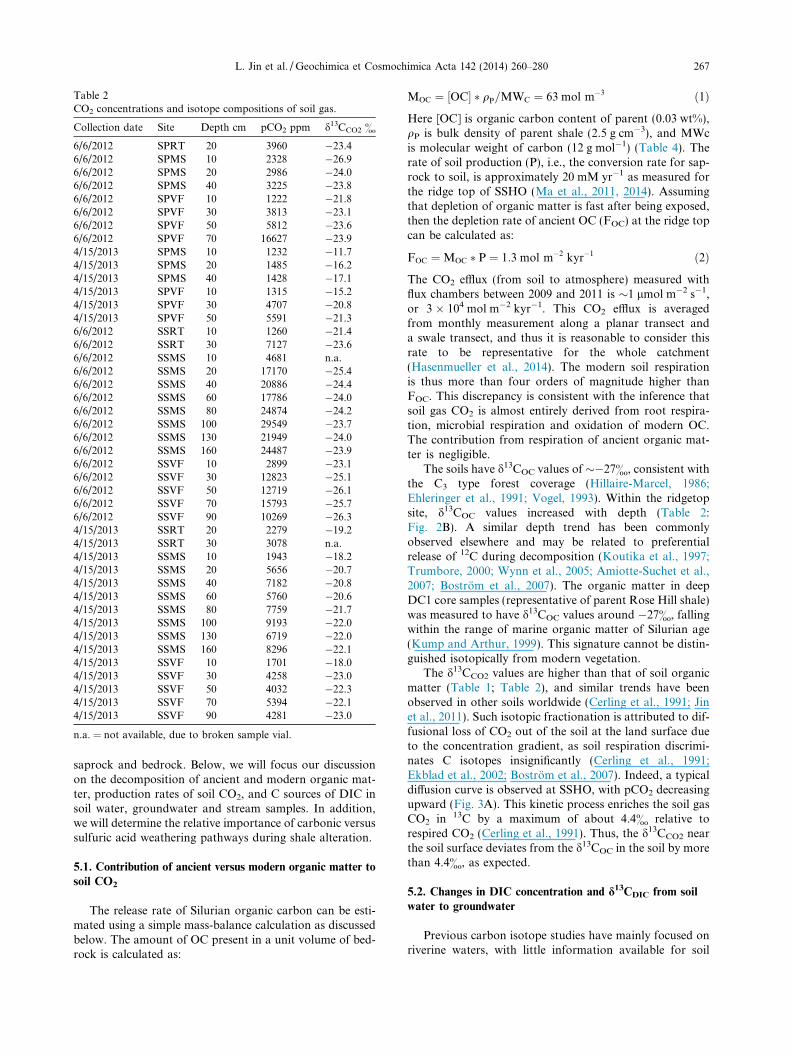
Table 2CO2 concentrations and isotope compositions of soil gas.
Collection date Site Depth cm pCO2 ppm d13CCO2 &
6/6/2012 SPRT 20 3960 �23.46/6/2012 SPMS 10 2328 �26.96/6/2012 SPMS 20 2986 �24.06/6/2012 SPMS 40 3225 �23.86/6/2012 SPVF 10 1222 �21.86/6/2012 SPVF 30 3813 �23.16/6/2012 SPVF 50 5812 �23.66/6/2012 SPVF 70 16627 �23.94/15/2013 SPMS 10 1232 �11.74/15/2013 SPMS 20 1485 �16.24/15/2013 SPMS 40 1428 �17.14/15/2013 SPVF 10 1315 �15.24/15/2013 SPVF 30 4707 �20.84/15/2013 SPVF 50 5591 �21.36/6/2012 SSRT 10 1260 �21.46/6/2012 SSRT 30 7127 �23.66/6/2012 SSMS 10 4681 n.a.6/6/2012 SSMS 20 17170 �25.46/6/2012 SSMS 40 20886 �24.46/6/2012 SSMS 60 17786 �24.06/6/2012 SSMS 80 24874 �24.26/6/2012 SSMS 100 29549 �23.76/6/2012 SSMS 130 21949 �24.06/6/2012 SSMS 160 24487 �23.96/6/2012 SSVF 10 2899 �23.16/6/2012 SSVF 30 12823 �25.16/6/2012 SSVF 50 12719 �26.16/6/2012 SSVF 70 15793 �25.76/6/2012 SSVF 90 10269 �26.34/15/2013 SSRT 20 2279 �19.24/15/2013 SSRT 30 3078 n.a.4/15/2013 SSMS 10 1943 �18.24/15/2013 SSMS 20 5656 �20.74/15/2013 SSMS 40 7182 �20.84/15/2013 SSMS 60 5760 �20.64/15/2013 SSMS 80 7759 �21.74/15/2013 SSMS 100 9193 �22.04/15/2013 SSMS 130 6719 �22.04/15/2013 SSMS 160 8296 �22.14/15/2013 SSVF 10 1701 �18.04/15/2013 SSVF 30 4258 �23.04/15/2013 SSVF 50 4032 �22.34/15/2013 SSVF 70 5394 �22.14/15/2013 SSVF 90 4281 �23.0
n.a. = not available, due to broken sample vial.
L. Jin et al. / Geochimica et Cosmochimica Acta 142 (2014) 260–280 267
saprock and bedrock. Below, we will focus our discussionon the decomposition of ancient and modern organic mat-ter, production rates of soil CO2, and C sources of DIC insoil water, groundwater and stream samples. In addition,we will determine the relative importance of carbonic versussulfuric acid weathering pathways during shale alteration.
5.1. Contribution of ancient versus modern organic matter to
soil CO2
The release rate of Silurian organic carbon can be esti-mated using a simple mass-balance calculation as discussedbelow. The amount of OC present in a unit volume of bed-rock is calculated as:
MOC ¼ ½OC� � qP=MWC ¼ 63 mol m�3 ð1Þ
Here [OC] is organic carbon content of parent (0.03 wt%),qP is bulk density of parent shale (2.5 g cm�3), and MWcis molecular weight of carbon (12 g mol�1) (Table 4). Therate of soil production (P), i.e., the conversion rate for sap-rock to soil, is approximately 20 mM yr�1 as measured forthe ridge top of SSHO (Ma et al., 2011, 2014). Assumingthat depletion of organic matter is fast after being exposed,then the depletion rate of ancient OC (FOC) at the ridge topcan be calculated as:
FOC ¼MOC � P ¼ 1:3 mol m�2 kyr�1 ð2Þ
The CO2 efflux (from soil to atmosphere) measured withflux chambers between 2009 and 2011 is �1 lmol m�2 s�1,or 3 � 104 mol m�2 kyr�1. This CO2 efflux is averagedfrom monthly measurement along a planar transect anda swale transect, and thus it is reasonable to consider thisrate to be representative for the whole catchment(Hasenmueller et al., 2014). The modern soil respirationis thus more than four orders of magnitude higher thanFOC. This discrepancy is consistent with the inference thatsoil gas CO2 is almost entirely derived from root respira-tion, microbial respiration and oxidation of modern OC.The contribution from respiration of ancient organic mat-ter is negligible.
The soils have d13COC values of ��27&, consistent withthe C3 type forest coverage (Hillaire-Marcel, 1986;Ehleringer et al., 1991; Vogel, 1993). Within the ridgetopsite, d13COC values increased with depth (Table 2:Fig. 2B). A similar depth trend has been commonlyobserved elsewhere and may be related to preferentialrelease of 12C during decomposition (Koutika et al., 1997;Trumbore, 2000; Wynn et al., 2005; Amiotte-Suchet et al.,2007; Bostrom et al., 2007). The organic matter in deepDC1 core samples (representative of parent Rose Hill shale)was measured to have d13COC values around �27&, fallingwithin the range of marine organic matter of Silurian age(Kump and Arthur, 1999). This signature cannot be distin-guished isotopically from modern vegetation.
The d13CCO2 values are higher than that of soil organicmatter (Table 1; Table 2), and similar trends have beenobserved in other soils worldwide (Cerling et al., 1991; Jinet al., 2011). Such isotopic fractionation is attributed to dif-fusional loss of CO2 out of the soil at the land surface dueto the concentration gradient, as soil respiration discrimi-nates C isotopes insignificantly (Cerling et al., 1991;Ekblad et al., 2002; Bostrom et al., 2007). Indeed, a typicaldiffusion curve is observed at SSHO, with pCO2 decreasingupward (Fig. 3A). This kinetic process enriches the soil gasCO2 in 13C by a maximum of about 4.4& relative torespired CO2 (Cerling et al., 1991). Thus, the d13CCO2 nearthe soil surface deviates from the d13COC in the soil by morethan 4.4&, as expected.
5.2. Changes in DIC concentration and d13CDIC from soil
water to groundwater
Previous carbon isotope studies have mainly focused onriverine waters, with little information available for soil

0
20
40
60
80
100
120
140
160
180 102 103 104 105
Dep
th (c
m)
pCO2 (ppm)
SS (June)
SS (April)
SP (June)
SP (April)
0
20
40
60
80
100
120
140
160
180 -30 -20 -10 0
Dep
th (c
m)
δ13CCO2 (‰)
-28
-26
-24
-22
-20
-18
-16
-14
-12
-10 0 200 400 600 800 1000
1/pCO2
δ13C
CO
2 (‰
)
atm
atmatm
A B C
Fig. 3. Soil gas CO2 concentrations (pCO2 in ppmv; A) and its carbon isotope ratio (d13CCO2 in &; B) as a function of depth for the ridge top(SSRT, SPRT), mid-slope (SSMS, SPMS) and valley floor (SSVF, SPVF) locations. Atmospheric pCO2 and d13CCO2 are plotted forcomparison as stars. The SPRT soil CO2 is slightly enriched in 13C relative to its soil organic carbon source (dashed lines delineate the range invalues). Correlation between pCO2 and d13CCO2 documents the mixing curve between soil and atmospheric CO2 (arrow).
268 L. Jin et al. / Geochimica et Cosmochimica Acta 142 (2014) 260–280
waters even though this is a critical zone of carbon transfor-mation (Brunet et al., 2005; Jin et al., 2009). The weatheringsequences at SSHO are closely linked to carbon cycles (Jinet al., 2010; Brantley et al., 2013), as silicate and carbonatedissolution each have a different capacity to consume CO2:
Silicate dissolution : Ca� silicateþ 2CO2 þH2O
) Ca2þ þ 2HCO�3 þ secondary clay
ðRxn:1Þ
Carbonate dissolution : MgCaðCO3Þ2 þH2Oþ 2CO2
) Mg2þ þ Ca2þ þ 4HCO�3ðRxn:2Þ
Before the CO2 consumption extents can be quantified,the atmospheric contribution needs to be evaluated. To doso, monthly rainfall chemistry data (2010–2013) from twonearby National Atmospheric Deposition Program(NADP) sites (PA15 and PA42) near SSHO were down-loaded. The Ca and Mg concentrations in the snow or rainvaried among different months (Ca: 0.8–8.4 lM; Mg: 0.33–2.2 lM) and averaged 3.0 lM and 0.86 lM, respectively.Given that half of the precipitation is lost through evapo-transpiration (Jin et al., 2011), the remaining Ca and Mgin water that infiltrates to the deeper soils and underlyingrock is thus doubled in concentration (6.0 and 1.7 lM,respectively). However these values are still much lower thanthose observed in soil water, stream water and groundwatersamples. Thus the contribution from precipitation to theoverall elemental budget is negligible for Ca and Mg but stillis corrected as discussed below. The average sulfate concen-tration in the wet precipitation is 11 lM for 2011–2013.
A variable amount of ankerite is present in the Rose Hillbedrock, but it is depleted in the soils and the saprock (Jinet al., 2010; Brantley et al., 2013). Thus, the soil water iscontrolled by silicate dissolution (with a negligible contri-bution from wet precipitation). This is in agreement withthe low concentrations of Ca2+, Mg2+ and alkalinityobserved (Fig. 4A; Jin et al., 2011). Here, the only C sourcein soil water DIC is soil CO2 (Rxn. (1)). If the soil water is
in contact with soil CO2 for a long time, then all DIC spe-cies (i.e., H2CO3, HCO3
� and CO32�) will reach isotopic
equilibrium with soil CO2 with fractionation factors dic-tated by the soil water temperature (Mook et al., 1974).Given that the speciation of DIC (i.e., the relative abun-dance of the three carbonate species) depends on pH andtemperature, the overall difference between d13CDIC andd13CCO2 is also governed by pH and temperature. We mod-eled such relationships using measured parameters (pH,d13CCO2) and fractionation factors in the literature (Mooket al., 1974). The mean annual air temperature of 10 �Cwas used for all calculations reported below. Calculationsbased on 5 and 15 �C revealed that neither the isotope frac-tionation factors nor the d13CDIC values were greatlyaffected by variations in temperature. Isotopic equilibriumbetween soil CO2 and soil water DIC is expected (Jinet al., 2009) because: (1) the soil gas is a relatively large Creservoir while the consumption of CO2 by silicate dissolu-tion is small; and (2) soil water stays in the soil profile fordays (Jin et al., 2011), providing sufficient time to reach iso-topic equilibrium with soil CO2.
If the DIC in natural waters does not attain isotopicequilibrium with soil CO2, for example, in a closed system,then d13CDIC is controlled by the isotopic composition of itscarbon sources. In the case of silicate weathering with soilCO2, the d13CDIC equals d13CCO2. In the case of carbonateweathering with CO2 (Rxn. (2)), the d13CDIC equals½(d13CCO2 + d13CCaCO3), i.e., ��14& in our system usingmeasured parameters (d13CCO2 = �22&; d13CCaCO3 =�6&). At the higher pH of the groundwaters, the valuesassociated with equilibration with soil d13CCO2 and withmixing with d13CDIC are similar, and thus C isotopic com-position alone cannot be used to determine if the system isclosed to CO2.
Even so, we assume that groundwaters that have muchhigher DIC concentrations have C isotope ratios controllednot by soil CO2 but rather by mixing with deeper waters thathave dissolved carbonates. This inference is defensiblebecause CO2 transport is limited by diffusion and groundwa-ter is too deep to be connected with soil CO2. Furthermore,

Table 3Chemistry and isotope composition of soil water, groundwater and stream water samples.
Sample Depthcm
Samplingdate
Temp�C
pH Conductivityls/cm
d13CDIC
&
d34S&
Alkalinityleq/L
Cl�
lMNO3
�
lMSO4
2�
lMAllM
Ca2+
lMFelM
K+
lMMg2+
lMMnlM
Na+
lMH4SiO4
lMSr2+
lMAlk1
leq/L
pCO22
BarCalcite2
Log SIDolomite2
Log SI
Well
#10 11/6/2011 5.26 �16.3 40 30.2 121 0.4 94 0.2 32 103 0.3 40 116 0.2 151 0.049 �4.7 �8.3#11 11/6/2011 5.80 �15.2 23 7.1 91 8.5 95 2.4 23 114 0.0 45 133 0.2 269 0.024 �3.9 �6.7#17 11/6/2011 6.58 �9.9 55 17.1 117 BD 1236 BD 18 225 0.0 58 104 1.0 2686 0.039 �1.1 �1.9#18 11/6/2011 6.61 �11.6 51 29.7 55 38.3 759 9.6 73 172 1.3 500 243 0.7 2237 0.030 �1.3 �2.3#4 11/6/2011 6.53 �11.5 48 46.7 120 0.7 324 0.2 32 198 0.2 71 101 0.8 807 0.014 �2.2 �3.5#5 11/6/2011 5.70 �17.3 21 2.1 78 1.0 101 0.2 23 68 BD 19 100 0.1 199 0.023 �4.1 �7.3#6 11/6/2011 6.40 �13.1 24 3.5 107 0.9 452 0.1 24 289 BD 175 111 1.0 1436 0.033 �1.9 �3.0#8 11/6/2011 6.48 �3.1 36 41.4 44 0.7 424 13.9 62 329 45.0 86 113 0.5 1482 0.028 �1.8 �2.8#10 5/1/2012 5.86 �17.7 1.8 203 24 2.1 125 2.3 72 0.1 27 88 BD 28 170 0.1 0.016 �4.1 �7.0#11 5/1/2012 6.04 �18.0 3.1 330 22 8.3 90 3.8 88 6.2 20 106 0.2 21 179 0.2 0.017 �3.6 �8.8#17 5/1/2012 7.42 �10.7 0.6 1941 51 2.6 114 1.7 1104 0.1 10 218 1.4 43 140 1.0 0.011 �0.8 �1.3#18 5/1/2012 6.70 625 149 16.5 26#4 5/1/2012 7.39 �10.6 �9.6 1401 26 8.4 144 1.9 580 0.1 22 355 BD 82 142 1.6 0.003 �0.8 �0.9#5 5/1/2012 5.85 �18.4 4.0 215 18 5.7 80 2.3 89 0.1 21 67 0.1 11 134 0.1 0.017 �3.9 �7.0#6 5/1/2012 7.35 �13.3 �7.7 1215 18 5.3 108 2.4 422 0.3 29 266 0.3 142 145 0.9 0.003 �1.1 �1.3#8 5/1/2012 6.49 �0.9 6.5 2000 20 0.2 13 2.4 387 34.3 44 297 50.5 59 191 0.5 0.037 �1.8 �2.6#2 4/13/2013 9.4 7.40 264.0 �13.1 1.6 37 1.3 130 8.4 1333 4.3 19 120 0.7 40 143 0.8 2665 0.006 �0.3 �2.3#3 4/13/2013 7.2 6.65 164.0 �16.4 3.8 35 0.4 147 46.1 805 16.8 19 78 2.1 37 209 0.6 1493 0.017 �1.6 �4.8#4 4/13/2013 6.8 7.24 160.0 �13.5 �2.0 23 2.0 135 BD 345 BD 19 216 0.3 55 116 1.0 899 0.003 �1.5 �3.9#5 4/13/2013 8.2 6.05 45.8 �20.9 4.5 15 0.4 81 7.8 111 4.5 24 70 2.4 16 127 0.1 224 0.011 �3.8 �8.4#6 4/13/2013 7.9 7.26 215.0 �13.2 �14.9 21 0.3 150 1.5 684 1.3 22 415 0.4 252 142 1.7 2152 0.007 �0.8 �2.6#8 4/13/2013 8.3 6.58 118.0 �14.1 6.5 36 2.9 98 2.9 141 14.7 54 156 18.7 58 140 0.3 472 0.007 �2.8 �6.2#10 4/13/2013 8.2 6.30 41.2 �21.8 3.9 18 1.9 109 11.8 64 6.5 29 84 0.7 25 157 0.2 112 0.003 �4.1 �8.8#11 4/13/2013 7.9 6.22 50.6 �19.4 3.9 20 7.5 95 1.4 84 0.8 22 107 0.3 36 157 0.2 225 0.008 �3.7 �8.0#17 4/13/2013 7.7 7.52 266.8 �12.1 �0.1 49 0.1 114 BD 1122 0.1 13 207 0.2 38 126 1.0 2433 0.004 �0.3 �2.1
Stream
SH 11/18/2011 4.62 �17.9 21 2.4 86 0.8 57 0.1 24 78 0.1 23 88 0.1 120SM 11/18/2011 5.09 �15.8 25 1.9 93 1.1 100 0.1 24 90 BD 32 93 0.2 218SW 11/18/2011 5.25 �12.6 22 0.0 91 0.8 126 0.1 22 96 BD 30 93 0.2 287SH 5/1/2012 6.04 �17.4 3.9 142 19 5.6 92 2.3 58 0.1 23 79 BD 20 136 0.1 0.007 �4.1 �7.1SM 5/1/2012 6.22 �15.9 4.0 198 18 6.6 93 2.4 55 0.3 20 80 BD 16 137 0.1 0.007 �3.8 �6.4SW 5/1/2012 6.85 �10.6 3.1 351 20 2.7 97 2.4 169 0.3 21 94 0.1 26 137 0.3 0.003 �2.5 �4.2
SH 4/13/2013 7.6 6.05 31.5 �21.1 4.4 16 2.5 88 1.0 46 0.9 23 65 0.8 11 103 0.1 62 0.003 �4.7 �9.9SM 4/13/2013 7.8 6.52 32.7 �19.3 3.5 16 2.7 90 BD 47 BD 22 68 BD 14 109 0.1 67 0.001 �4.2 �8.8SW 4/13/2013 8.5 7.10 42.0 �16.3 3.6 17 1.6 91 0.1 90 0.1 21 71 BD 16 112 0.2 158 0.001 �2.9 �6.1
L.
Jinet
al./G
eoch
imica
etC
osm
och
imica
Acta
142(2014)
260–280269

Soil water
SPVF 10 11/18/2011 4.77 �19.1 39 3.1 100 8.4 63 0.5 16 33 0.1 22 99 0.2 �13SPVF 20 11/18/2011 4.68 �19.4 57 BD 73 8.0 60 0.9 16 42 0.2 23 87 0.2 32SPVF 30 11/18/2011 4.90 �20.2 34 2.9 118 11.5 90 0.4 17 55 0.3 31 140 0.3 63SPVF 40 11/18/2011 5.20 �18.9 34 1.2 68 1.8 66 0.1 18 61 0.2 32 88 0.2 131SPVF 60 11/18/2011 5.33 35 11.4 94 3.5 86 0.9 22 86 0.3 35 98 0.3 163SPMS 10 11/18/2011 4.71 7 0.6 54 3.1 18 0.2 9 32 0.7 15 89 0.1 6SPMS 40 11/18/2011 4.35 �17.1 28 1.8 104 4.2 58 0.1 9 74 0.3 25 127 0.2 56SPMS 50 11/18/2011 4.72 �19.7 20 BD 134 1.6 54 0.3 10 50 0.9 24 93 0.2 �49SPRT 10 11/18/2011 4.47 �19.7 31 BD 79 18.5 54 1.1 26 32 2.1 22 85 0.2 28SPRT 20 11/18/2011 4.33 �18.1 15 2.7 60 5.0 42 0.3 12 21 0.8 18 71 0.2 15SPRT 30 11/18/2011 4.49 15 BD 62 2.6 59 0.1 9 20 0.2 23 84 0.2 46SPVF 20 5/1/2012 5.46 85.9 16 3.6 68 6.6 47 0.3 14 34 0.1 10 124 0.1 0.016 �5.0 �9.2SPVF 30 5/1/2012 5.18 �21.8 15 5.7 133 12.0 88 0.4 14 58 0.2 27 270 0.3SPVF 40 5/1/2012 5.61 �21.0 165 30 3.5 94 3.4 59 0.1 18 56 0.1 28 125 0.2 0.023 �4.5 �8.0SPVF 60 5/1/2012 �17.1 22 2.2 88 2.5 66 0.1 14 71 BD 4 147 0.2SPMS 40 5/1/2012 5.15 83 9 0.7 107 4.5 42 0.1 6 56 0.2 7 181 0.1 0.034 �5.4 �9.6SPRT 20 5/1/2012 5.34 �19.2 16 0.4 53 5.2 37 0.1 8 21 0.2 1 107 0.1SPRT 30 5/1/2012 5.46 �19.6 22 3.9 61 4.4 45 0.1 5 21 0.1 BD 120 0.2SPRT 10 4/15/2013 10.3 4.99 �21.7 25 0.8 33 9.6 28 0.6 23 14 1.0 16 85 0.1 32 0.002 �6.2 �13.4SPRT 20 4/15/2013 10.7 5.04 49 5.7 54 1.3 28 BD 12 16 0.2 12 102 0.1 �51SPRT 30 4/15/2013 10.4 5.04 �22.1 44 2.0 63 3.6 41 0.3 20 21 1.6 21 101 0.1 �8SPMS 40 4/15/2013 10.8 5.03 43 18.4 106 1.8 39 0.1 6 54 0.2 16 198 0.1 �65SPMS 50 4/15/2013 10.8 5.18 49 11.3 117 11.5 43 2.1 38 40 2.2 25 133 0.1 �65SPVF 20 4/15/2013 9.8 5.17 22 3.6 70 4.8 46 0.2 16 34 0.1 12 128 0.2 23 0.008 �6.0 �12.8SPVF 30 4/15/2013 9.8 4.97 18 1.0 91 12.5 71 0.2 12 43 0.2 14 214 0.2 53 0.031 �5.6 �12.1SPVF 40 4/15/2013 9.6 5.27 22 0.7 92 1.5 55 BD 13 51 BD 16 125 0.2 34 0.010 �5.6 �11.9SPVF 60 4/15/2013 10.6 5.66 139 BD 88 0.1 61 3.7 14 67 BD 19 110 0.2 -27
1 Alkalinity was calculated based on charge balance.2 Saturation indexes and pCO2 were calculated using geochemical models. See text for details.
270L
.Jin
etal./
Geo
chim
icaet
Co
smo
chim
icaA
cta142
(2014)260–280

100
101
102
103
104
100 101 102 103 104
Alk
alin
ity (μ
M)
Ca+Mg (μM)
Groundwater
Stream
Soil water2:1 line
-7
-6
-5
-4
-3
-2
-1
0 3 4 5 6 7 8
Log
SI (
calc
ite)
pH
-25
-20
-15
-10
-5
0
0 400 800 1200
δ13C
DIC
(‰)
Ca (μM)
A
B
C
Fig. 4. Plot showing the correlation between divalent cations(Mg2+ + Ca2+) and alkalinity (A). This correlation demonstratesthe evolution of natural waters (soil water, groundwater, andstream water) with progress of chemical weathering. The transitionfrom silicate-dissolution dominated (in soil waters) to carbonate-dissolution dominated (in groundwaters) conditions, is accompa-nied by increases in pH and saturation indices as the water movestoward equilibrium with carbonates (B). The C isotope composi-tion of DIC (d13CDIC) changes with Ca2+ concentrations in thesenatural waters, as the system progresses from waters dominated bysilicate dissolution to those dominated by carbonate dissolution(C). Well #8 is an outlier in this diagram indicating differentcontrols on its chemistry and C isotope composition as described inthe text.
L. Jin et al. / Geochimica et Cosmochimica Acta 142 (2014) 260–280 271
the dissolution rate of ankerite might be much higher thanthe rate of replenishment of soil CO2-charged water to thewater table. Previous work using an optical televiewershowed that the Rose Hill bedrock at SSHO is fractured(Kuntz et al., 2011) especially in the upper�5–7 m. This sur-ficial fracturing has been attributed to frost-relating fractur-ing during glacial periods (Jin et al., 2010). Residence timesfor groundwaters in this surficial fractured zone are likely lessthan 1 year, as roughly estimated by water isotopes (Jin et al.,2011; Thomas et al., 2013). Furthermore, below the watertable, the diffusion of CO2 is probably slow (Jahne et al.,
1987), so that ankerite dissolution occurs in a system closedto CO2.
If so, Ca2+ and d13CDIC can help identify the dominanceof silicate and carbonate dissolution in natural waters(Fig. 4C): soil waters and some groundwaters are influencedonly by silicate dissolution while other groundwaters, areinfluenced by carbonate weathering (except for the oneanomalous well, #8). These observations lead to the infer-ence that carbonate dissolution controls groundwaterchemistry near or below the water table (Fig. 4A and B).
Groundwater from well #8 has elemental chemistry andpH values similar to other groundwater samples, except forextremely elevated dissolved Fe and Mn concentrations andlow SO4
2� concentrations. Ankerite has significant Fe andMn in its dolomite-like structure, and thus Fe and Mnare released during ankerite dissolution. For most of thewells, the groundwaters probably remain oxic, leading toFe and Mn precipitation immediately after dissolution.Monitoring of water isotopes has revealed almost constantd18O and d2H values for deep wells (>3 m) (Jin et al., 2011;Thomas et al., 2013), indicative of a longer residence timeand thus deep sources of groundwater. It is therefore likelythat samples from well #8 are O2-depleted. This reducingcondition in well #8 allows elevated dissolved Fe andMn, which are otherwise insoluble in oxic environments.These groundwater samples from well #8 are also charac-terized by higher d13CDIC values, deviated from the mixinglines defined by silicate and carbonate dissolution (Fig. 4C).This probably suggests that carbon reduction (methanogen-esis) might be occurring, producing methane with extremelynegative d13CDIC, leaving residual DIC that is enriched in13C. These arguments could be consistent with the conclu-sion that groundwaters from well #8 are from a muchdeeper source than are accessed by the other boreholes thatallow access only to shallow groundwater systems. Thegroundwater from well #8 could flow up through fracturesfrom deep bedrock. Future work is needed to constrain thisC transformation process.
5.3. Other acidity involved in chemical weathering
Besides CO2, other sources of acidity are also involvedin chemical dissolution reactions at the SSHO. Indeed, dis-solved organic carbon (DOC) concentrations of soil watersare high in shallow soils and decrease with depth (Andrewset al., 2011; Jin et al., 2011). In addition, the wet precipita-tion and biological processes contribute to nitric acids inthe shallow soils. Thus organic and nitric acids are expectedto be important in shallow soils, where only silicate miner-als dissolve. In this case, these organic and inorganic acidsimpact DIC and d13CDIC by modifying the pH. DOC isconsumed by micro-organisms to release CO2; however,CO2 will not likely directly alter d13CDIC values. Acidsinvolved in silicate versus carbonate weathering in differentlocations are presented in Fig. 5A.
At more than 20 m depth, the pyrite-weathering front isobserved near the ankerite weathering front, and both arewithin meters of the water table (Brantley et al., 2013).Oxidative dissolution of pyrite releases sulfuric acid and
Table 4Parameters and their values used for CO2 flux calculation.
Parameters Symbol Values Units
Parent organic carbon concentration [OC] 0.03 wt%Molecular weight for carbon MWC 12 g mol�1
Parent ankerite concentration Cankerite 7.8 wt%Molecular weight for dolomite (estimate for ankerite) MWankerite 184 g mol�1
Soil production ratea P 20 mM yr�1
Parent bulk density qP 2.5 g cm�3
Mean annual precipitation MAP 107 cm yr�1
Discharge from the catchment D = 1/2MAP 53.5 cm yr�1
Ca concentration in the rain [Ca2+]ppn 3 lmol L�1
Mg concentration in the rain [Mg2+]ppn 0.9 lmol L�1
Ca concentration in soil water [Ca2+]SoilWater 55 lmol L�1
Mg concentration in soil water [Mg2+]SoilWater 48 lmol L�1
Ca concentration in the stream [Ca2+]stream 108 lmol L�1
Mg concentration in the stream [Mg2+]stream 86 lmol L�1
Average soil CO2 concentrations pCO2 40000 ppmvHenry’s Law constant for CO2 at 10 �C KCO2
10�1.47
CO2 fluxes from soils to groundwater, controlled by equilibrium with pCO2 FH2CO3* 72 mol m�2 kyr�1
CO2 release rate by OM oxidation FOC 1.3 mol m�2 kyr�1
CO2 consumption rate by silicate dissolution (short-term) Fsilicate 44 mol m�2 kyr�1
CO2 consumption rate by ankerite dissolution (long-term) Fankerite 42 mol m�2 kyr�1
CO2 consumption rate by ankerite dissolution (short-term) Fankerite 48 mol m�2 kyr�1
a From Ma et al. (2010).
A
B C
Fig. 5. A conceptual model illustrating the locations of silicate and carbonate dissolution and the sources of acidity involved in these reactions(A). Three flow pathways are hypothesized to explain three types of groundwater (1: silicate dissolution driven by precipitation-derivedprotons; 2: secondary carbonate dissolution driven by precipitation-derived protons; and 3: primary carbonate (ankerite) dissolution drivenby pyrite-dissolution). As the mineral–water interfacial area per unit volume decreases downward (due to increasing grain size and decreasingfracture spacing), solute transport in groundwater can be conceptualized as dominated by advection with diffusion into rock matrix as a minorcontributor in shallow layers, to advection with diffusion into rock matrix as a major contributor in deeper layers. The systematics of sulfur atthe SSHO (B) and Sr2+ vs. Ca2+ + Mg2+ (C) clearly show the three types of groundwater (squares), corresponding to the three flow pathwaysin (A). The d34SSO4 of streams at the outlet (triangles) indicates that wet deposition is the dominant source of SO4
2�.
272 L. Jin et al. / Geochimica et Cosmochimica Acta 142 (2014) 260–280

L. Jin et al. / Geochimica et Cosmochimica Acta 142 (2014) 260–280 273
thus helps dissolve the carbonate mineral, ankerite (Rxns.((3)–(5))).
Pyrite dissolution : FeS2 þ 3:75O2 þ 2:5H2O
) FeOOHþ 4Hþ þ 2SO2�4 ðRxn:3Þ
Carbonate dissolution : MgCaðCO3Þ2 þ 2Hþ
) Mg2þ þ Ca2þ þ 2HCO�3 ðRxn:4Þ
MgCaðCO3Þ2 þ 4Hþ ) Mg2þ þ Ca2þ þ 2CO2 þ 2H2O
ðRxn:5Þ
Depending on the molar ratio of H+ and carbonate, eitherHCO3
� or CO2 could be formed (Rxn. (4) or Rxn. (5)),impacting the C speciation and its isotope ratios differently.Li et al. (2008) observed a positive correlation betweenSO4
2�/DIC and riverine d13CDIC in southwest China as sul-furic acid of an atmospheric origin reacted with carbonateas opposed to carbonic acid. Similarly, weathering of sul-fide minerals is shown to be as important as carbonic acidin the McKenzie River Basin (Calmels et al., 2007;Beaulieu et al., 2011). Also, in volcanic Caribbean islands,magmatically-derived CO2, H2S and SO2 lead to fast volca-nic rock weathering where magmatic CO2 contributes up to60% of riverine DIC (Rive et al., 2013).
C isotope systematics during carbonate dissolution bystrong acids can be quantitatively evaluated using SO4
2�/DIC equivalent ratios. Indeed, the SO4
2�/DIC ratio is 0 ifneither Rxn. (3) nor Rxn. (4) occurs in carbonic acid-dom-inate scenarios. The ratio is 1 if Rxn. (2) does not occur insulfuric acid-dominated scenarios. At the SSHO, only traceamounts of pyrite are present, versus �7.8 wt% of ankeriteobserved in the Rose Hill bedrock (Jin et al., 2010). Indeed,Brantley et al. (2013) defined the acid-generating capacity R(the molar ratio of pyrite to calcite in parent materials) tobe much smaller than 1, and suggested that sulfuric acidis completely consumed during carbonate dissolution. Thusit is reasonable to assume that Rxn. (5) is insignificant. Tosummarize, for carbonate weathering, Rxn. (2) dominateswith some influence from Rxn. (4). Thus, C in DIC issourced from both CO2 and CaCO3, but their relative con-tribution is not 1:1. Instead, more C is from CaCO3 thanfrom CO2 and thus d13CDIC values of groundwaters thathave been impacted by carbonate dissolution are closer tothat of the CaCO3 end-member (Fig. 4C).
At the SSHO, aqueous SO42� is derived from pyrite dis-
solution and wet deposition (Fig. 5A). Specifically, this partof central Pennsylvania has been highly impacted by acidrain (Wadleigh et al., 1994; Alewell et al., 2000), makingit impossible to model the d13CDIC of groundwaters in greatdetail. Nonetheless, it is defensible to assume that DIC wasderived in a 1:1 ratio from CO2 and ankerite. As pyrite islargely absent from the soils, we assume that soil waterSO4
2� is entirely from wet deposition (both modern andancient). The SO4
2� concentrations show more complex var-iation with depth and also landscape position, probablyrelated to S cycling within soil profiles.
The source of SO42� in the pyrite-free zone is confirmed
by S isotope ratios. Although the S isotopes in soil waterwere not measured due to insufficient volume of samples,SO4
2� in some groundwaters has d34SSO4 values between
0& and 8& (Fig. 5B), well within the range of acid deposi-tion observed for this region (Wadleigh et al., 1994; Alewellet al., 2000). This confirms that SO4
2� in shallow soils ismainly derived from precipitation, as pyrite has beenalmost completely removed from these weathered materials.At the catchment scale, the stream SO4
2� is also dominantlyderived from wet deposition, as stream SW has d34SSO4
values �3& (Table 3; Fig. 5B).The sulfate concentrations of input fluxes (modern pre-
cipitation: 11 lM) is much lower than those of outputfluxes (streams: 90 lM), suggesting net lost of S from thewatershed. This is likely due to the slow release of sulfatethat was loaded to the watershed during acid depositionin the northeastern US or/and dry deposition. A study atthe Leading-Ridge forested watershed (less than 10 kmfrom SSHO) reported five years of data (1979–1985) for sul-fate export fluxes as river discharge as well as atmosphericwet sulfate deposition, and showed that input fluxes weremuch lower than output fluxes (Lynch and Corbett,1989). Long-term monitoring at the well-characterizedHubbard Brook Experimental Forest had shown similartrends (Likens et al., 2002).
Given the oxic conditions observed in SSHO soils(Brantley et al., 2013), S that was deposited from acid rainhas remained as sulfate instead of being reduced. d34SSO4 ofgroundwaters that have interacted with pyrite beneath theoxidation front should look like S from pyrite because Sisotopes are negligibly fractionated during pyrite dissolu-tion (Van Stempvoort et al., 1990; Mayer et al., 1995; Schiffet al., 2005). The S isotopes of the pyrite end-member werenot directly measured, but framboidal pyrite has beenobserved in the Rose Hills shale bedrock under scanningelectron microscope (Brantley et al., 2013). This indicatesthat pyrite in Rose Hill shale is formed during early diagen-esis, and thus it has relatively low d34S values (Strauss,1999). Indeed, some groundwaters have d34S as negativeas �15&, in the range of pyrite (Fig. 5B).
5.4. Acquisition of groundwater DIC in different flow
pathways
The comparison among groundwater chemistries for theten wells at SSHO suggests that the degree of ankerite dis-solution and chemical evolution are generally higher mov-ing towards the outlet of the catchment, although thesewells are cased to about the same depth. Three distinctgroups of water chemistry are observed among the sampledwells (Fig. 5B; Table 3): group 1 with low Ca2+ and highd34SSO4 values; group 2 with high Ca2+ and high d34SSO4
values; and group 3 with high Ca2+ and low d34SSO4 values.Similarly, Sr2+ concentrations and the ratios of Sr to diva-lent cations (Ca2+ + Mg2+ concentrations) also group thesegroundwaters into the same three clusters (Fig. 5C). Forexample, the groundwaters with lower d34SSO4 values arecharacterized by higher Sr2+/(Ca2+ + Mg2+) ratios. Theco-variation of d34SSO4 values and Ca2+ concentrations ingroundwaters (Fig. 5B) is likely controlled by pyrite andankerite dissolution. At the northern ridge of SSHO, wherethe entire weathering profile was sampled, the weatheringfronts of pyrite and ankerite, were observed at almost

274 L. Jin et al. / Geochimica et Cosmochimica Acta 142 (2014) 260–280
coincident depths (Jin et al., 2010). We attributed this cou-pling to the dissolution of pyrite that produces acidity anddissolves ankerite. If so, it is reasonable to observe higherCa2+ (ankerite dissolution) and lower d34SSO4 values (pyritedissolution) in group 3 along flow pathway 3 (Fig. 5A andB). Here, groundwater near the weir drains almost theentire catchment and has longer residence times. Ground-waters near the upper reach of the stream in group 1 havelower Ca2+ concentrations (no ankerite, flow pathway 1,Fig. 5A) and thus d34SSO4 values of acid rain (no pyrite).Here groundwaters discharging into the stream in the upperreach have only drained a small portion of the catchmentand are characterized with a shorter residence time. Fur-thermore, a previous study on the Leading-Ridgewatershed in central Pennsylvania has shown that duringspring runoff, the water table rises quickly to the surfaceand almost the entire soil profile near the stream is satu-rated (Lynch and Corbett, 1989). During this time, solutesbetween unsaturated and saturated zones are displaced,leading to similar soil water and groundwater chemistry.However, some groundwaters near the outlet (group 2)are not falling on this trend. In these sites, groundwatersare characterized by carbonate dissolution (higher Ca2+
concentrations) but with S isotope signatures of wet depo-sition and lower Sr2+/(Ca2+ + Mg2+) ratios, following flowpathway 2. This observation suggests the decoupling of pyr-ite and ankerite dissolution fronts. One hypothesis to inter-pret this is presented below.
The negative saturation indices calculated for soilwaters, groundwaters and streams from SSHO indicate car-bonate unsaturation. However, a previous study showedthat secondary carbonate may have precipitated at the val-ley floor soils at around 4 m below land surface of SSHO,as C isotopic composition of calcite at this site was differentfrom that of the primary ankerite in the Rose Hills(Brantley et al., 2013; Table 1). The equilibrium fraction-ation factor between pedogenic calcite and soil CO2 isapproximately 8.4& at 25 �C (Clark and Fritz, 1997). Thus,given the observed range of d13CCO2 values through thiswork, the pedogenic carbonate (d13CCa of �1.1&) pro-posed by Brantley et al. (2013) may not be formed recently;instead the carbonate could have precipitated before amature forest was established when C4 vegetation domi-nated. Work is needed to test this hypothesis and under-stand the precipitation kinetics and controls on secondarycalcite.
It can be assumed that weathering fronts of ankerite andpyrite are much deeper than a few meters and thus ground-waters collected near the outlet are dissolving secondarycalcite, but not pyrite or ankerite (Fig. 5A). This hypothesisis consistent with Sr systematics in these groundwaters: pre-sumably primary ankerite dissolution yields much higherSr2+/(Ca2+ + Mg2+) ratios (pathway 3) than those fromsecondary calcite dissolution (pathway 2) (Fig. 5). Thisagrees well with the distribution coefficients observed forSr in calcite, such that Sr prefers to remain in solutioninstead of substituting Ca in secondary mineral phases likepedogenic calcite (e.g., Mucci and Morse, 1983; Gabitovand Watson, 2006; Gabitov et al., 2014).
5.5. Controls on stream water C isotopes and DIC: mixing of
groundwater and soil water?
As shown in Rxn (1) and Rxn (2) and also discussed inmany research papers, stream chemistry alone cannot beused to differentiate silicate versus carbonate dissolutionin watersheds of mixed lithology or mineralogy (e.g.,Gaillardet et al., 1999; Tipper et al., 2006). At SSHO, thechemical weathering reactions have completely depletedankerite, the carbonate mineral, in the soils and saprock,allowing us to investigate silicate mineral dissolution whichdominates at shallow depths and carbonate dissolution atdepth in the groundwaters. As discussed earlier, thed13CDIC values and Ca2+ concentrations define the predom-inant weathering reactions in the SSHO: low Ca2+ and rel-atively low, but variable, d13CDIC values are controlled bysilicate dissolution in the presence of soil CO2 in shallowsoils and (carbonate-depleted) saprock; however, higherCa2+ and constant but higher d13CDIC values are attributedto ankerite dissolution at depth near the saprock–bedrockinterface (Fig. 4B). The depth of this interface variesthroughout the catchment from 23 meters beneath thenorthern ridge to 3 meters beneath the outlet of the catch-ment. Stream water chemistry is controlled by mixing ofsoil water (dominated by silicate dissolution) and ground-water (impacted by carbonate dissolution). More interest-ingly, the stream water becomes more concentrated inMg2+ and Ca2+ downstream, probably as a result of hydro-logical control. For example, the stream towards the outletreceives a higher contribution from groundwater relative toshallow soil water. Studies on a few small watersheds haveshown that DOC and DIC in streams vary considerablybetween flooding versus low-flow conditions (e.g.,Andrews et al., 2011; Lloret et al., 2011). This has beenattributed to differences in carbon contents of the contribu-tions from surface runoff versus shallow groundwater(Lloret et al., 2011). Alternatively, the groundwater is moreconcentrated in Mg and Ca towards the outlet, so streamwater towards the outlet could be more concentrated evenif the relative contributions from soil water and groundwa-ter remain the same along the stream. The groundwaterchemistry data support the latter hypothesis (Fig. 4B).
The d13CDIC values of the stream collected at the threesampling locations also evolve towards the groundwaterend-member values moving from headwater downstream.The observation that d13CDIC values along the stream aredifferent suggests that carbon isotope ratios of soil wateror groundwater and their relative contributions are the pri-mary controls of stream d13CDIC. Other studies have madesimilar observations. For example, Kanduc et al. (2007)and Zavadlav et al. (2013) studied a karst drainage areaof Sava (Slovenia), and concluded that riverine d13CDIC
were controlled mainly by carbonate weathering with highDIC. Similarly, in the Arcachon lagoon catchment ofFrance, constant d13CDIC values around �20& wereobserved throughout the year for the streams, pointing tothe constancy of terrestrial organic carbon and silicateweathering as the DIC carbon sources (Polsenaere et al.,2013). In summary, case studies including ours at Shale

L. Jin et al. / Geochimica et Cosmochimica Acta 142 (2014) 260–280 275
Hills have shown that mineral dissolution is the primarycontrols on riverine d13CDIC values.
A few other secondary controls on the river waterd13CDIC values may also be important, including equilibra-tion with the atmosphere, CO2 degassing, and in-situ river-ine biological processes (e.g., Parker et al., 2010). In somecatchments, for example, equilibration with the atmosphereis observed to increase d13CDIC values of streams. Forexample, atmospheric exchange was promoted by the pres-ence of dams and lakes in Patagonian rivers of Argentina,and in that system the d13CDIC values varied little despiteseasonal changes (Brunet et al., 2005). Even at the outlet,the SSHO stream is still far from equilibrium with theatmosphere with respect to its C isotope composition(Fig. 5A). This is likely explained by: (1) the short lengthof the stream and short water residence time in the stream(stream length � 300 m), and (2) the continual discharge ofhigh pCO2 groundwater into the stream, maintaining thestream far from equilibrium with the atmosphere as evi-denced by major elemental chemistry. Equilibration of astream can occur over long distances: for example, monitor-ing in the Pinal Creek (Arizona) showed that CO2
gas-exchange continued to increase stream pH over 3 kmdownstream from a groundwater input point (Choi et al.,1998). Based on the AZ data, degassing is a relatively slowprocess, and equilibration is unlikely over the 300 m stretchof stream at SSHO.
Consistent with these conclusions, the pCO2 of streamwaters (ranging from 700 to 7500 ppm) calculated frompH and DIC is generally lower than those of soil water(ranging from 1700 to 34,000 ppm) or groundwater (rang-ing from 2600 to 49,000 ppm) but higher than atmosphericCO2. Thus it is reasonable to assume that CO2 beginsdegassing from the groundwater underlying the valley(Table 3). Indeed, the pCO2 of the stream decreased slightlyfrom the headwater (SH) to the outlet (SW) (Table 3). Atthe pH range observed in streams at SSHO (4.5–7.0), thedominant DIC species is H2CO3, and thus the measuredd13CDIC values can be approximately interpreted asd13CH2CO3. The fractionation factor between CO2(aq)(namely H2CO3
*) and CO2(gas) is small, �1.1& (Clarkand Fritz, 1997); thus we do not expect significant C isotopeshifts in the stream d13CDIC due to degassing.
Enhanced photosynthesis in rivers can also consumeCO2, preferentially removing 12C-rich carbon and leavingthe remaining DIC with higher d13CDIC values. For exam-ple, a study of the upper Danube River and its tributariesrevealed that impounded reservoirs increased the transittime of water and allowed photosynthesis to increase thed13CDIC values (Pawellek and Veizer, 1994). Indeed, moni-toring of riverine d13CDIC over 1000 km in Upper Danuberiver shows showed slow CO2 degassing and changes ind13CDIC downstream due to the oxidation of organic matter(Pawellek and Veizer, 1994). At the SSHO, the DOC con-centrations in the first-order ephemeral stream increaseddramatically in late summer, and was “attributed to pro-cesses in the stream itself such as in-stream processing (suchas leaching and decomposition of allochthonous particulateorganic matter and release by stream algae)” (Andrewset al., 2011). However, in the rest of the year, the stream
was observed to be well connected to shallow soil watersfrom the hillslopes, especially during high-flow conditions.During those periods, DOC is mainly contributed fromsoils (Andrews et al., 2011). For this study where samplingwas completed in the high-flow seasons of November andApril, it is unlikely that C isotope fractionation due toin-situ riverine photosynthesis was significant.
In summary, all of the evidence cited here is bestexplained by the conclusion that water in the first-orderstream at SSHO is primarily derived from mixing of the soilwater and carbonate-dissolution impacted groundwaters.Stream water d13CDIC values are controlled by the isotopicsignature of these two end-members as dictated by theirrelative contributions during different flow conditions.
5.6. CO2 consumption potential of gray shale weathering
Shale weathering can release CO2 by decomposition offossil organic matter and consume CO2 by dissolution ofsilicate and carbonate minerals. Below we presented a sim-ple calculation to estimate the carbon mass balance of theseprocesses. The first contribution is a small one: the CO2
release rate by fossil OC degradation was calculated to be1.3 mol m�2 kyr�1 as shown in Eqn. (1) (Table 4).
The second contribution, the consumption of atmo-spheric CO2 by silicate dissolution, is estimated using twomethods. As ankerite is completely depleted from the soils,we can assume soil water chemistry is solely controlled bysilicate dissolution (after correction for contributions fromwet precipitation). With this assumption, each mole of Ca2+
or Mg2+ that is solubilized by silicate dissolution is equiva-lent to one mole of CO2 drawdown. The CO2 consumptionrate was roughly calculated as:
ð½Ca2þ þMg2þ�SoilWater � 2½Ca2þ þMg2þ�ppnÞ �D
¼ ð103� 8Þ lmol L�1 � 53:5 cm yr�1
¼ 44 mol m�2 kyr�1 ð3Þ
Here ([Ca2+ + Mg2+]SoilWater) is the sum of average soilwater Ca2+ and Mg2+ concentrations observed at the deep-est lysimeters (Table 4). The [Ca2+ + Mg2+]ppn is the sum ofaverage rainwater Ca2+ and Mg2+ concentrations at the twoNADP sites (Table 4). As half of the rainfall is evapotran-spired and thus the rainwater becomes concentrated by afactor of 2. An important assumption is that silicate dissolu-tion becomes insignificant below soils and at depths abovethe reaction front for ankerite. This is very likely given that(1) silicate dissolution at soil waters already moves the sys-tem closer to silicate equilibrium and thus reaction slowsdown (e.g., Zhu, 2005; Jin et al., 2008) and (2) the pH ofthe groundwater is near neutral where clay dissolution isthe slowest according to compiled experimental data(Brantley et al., 2008).
As a comparison, we can calculate the CO2 fluxtransported by soil waters at 10oC (Table 4):
FH2CO�3¼ pCO2 �KCO2 �D
¼ 40; 000 ppm � 10�1:47 � 53:5 cm yr�1
¼ 72 mol m�2 kyr�1 ð4Þ

276 L. Jin et al. / Geochimica et Cosmochimica Acta 142 (2014) 260–280
Here [H2CO3*] (or [DIC]eq) is dissolved CO2 concentrations,
as controlled by its equilibrium with soil pCO2 (KCO2 asHenry’s Law constant). This is the maximum CO2 fluxmoving to the groundwater by soil waters. This value ishigher than the estimate based only on divalent cation con-centrations but on the same order of magnitude. Impor-tantly, this CO2 dissolved in the soil water will be utilizedduring carbonate dissolution at depth as discussed below.
Given that two moles of CO2 are consumed by one moleof ankerite dissolution (Rxn. (2)), the long-term rate of con-sumption of CO2 out of the atmosphere can be calculatedusing ankerite depletion rates:
Fankerite ¼ Cankerite � P � qP=MWankerite
¼ 42 mol m�2 kyr�1 ð5Þ
Eq. (5) is in principle similar to Eqn. (1) and Eqn. (2). Here,Cankerite is wt% of ankerite in Rose Hill bedrock, andMWankerite is molecular weight of ankerite.
Similar to silicate dissolution rates, the CO2 consump-tion rates from carbonate dissolution can be compared tothose estimates based on divalent cation concentrations.In this exercise, the stream Ca and Mg concentrations([Ca2+ + Mg2+]stream) are assumed to be from rain, silicateor carbonate dissolution, and soil water Ca and Mg concen-trations ([Ca2+ + Mg2+]soilwater) are good estimates of con-tribution from rain and silicate dissolution (Eqn. (3)). Thusthe CO2 consumption rates by carbonate dissolution are:
Fankerite ¼ ð½Ca2þ þMg2þ�stream � ½Ca2þ þMg2þ�soilwaterÞ �D
¼ ð194� 103ÞlM � 53:5 cm yr�1
¼ 48 mol m�2 kyr�1 ð6Þ
This stream-derived CO2 consumption rate by carbon-ate dissolution is a short-term average, and is very similarto the long-term CO2 consumption rate estimated usingrock chemistry based on Eqn (5). The contribution of pro-tons from other species such as sulfuric acid contributed bypyrite dissolution is negligible for the whole catchment, asstream sulfate has similar d34SSO4 values compared to wetdeposition (Fig. 4D).
This first-order estimate clearly shows that consumptionof CO2 by silicate mineral dissolution is as important asconsumption by carbonate dissolution and is much largerthan the CO2 production rate from ancient OC degrada-tion. Therefore, weathering of Rose Hill shale in this catch-ment is a sink for atmospheric CO2 and is a net exporter ofDIC to the larger Shavers creek watershed. Furthermore,our work on the Rose Hill shale as well as other studiesin the literature document that reactions with organic mat-ter and carbonates in shales occur quickly, often proceedingtoward completion in the saprock beneath the soil in cli-mates where precipitation exceeds evapotranspiration(Petsch et al., 2005; Jin et al., 2013; Brantley et al., 2013).These deep reactions occur as oxygenated and CO2-chargedfluids advect downward along fractures in the shale: thereaction with CO2 is fast and is likely limited only by themineral–water interfacial area.
Besides DIC, DOC can be an important component ofthe dissolved carbon budget that is transported out of acatchment (Amiotte-Suchet et al., 2007; Lloret et al.,
2011). As discussed the majority of DOC in the stream isfrom degradation of modern vegetation in soils or riverinebiological processes, with little to no contribution from theancient organic matter in the Rose Hill formation. Furtherstudies are needed to quantify this flux.
6. CONCLUSIONS AND IMPLICATIONS
This study has examined all major carbon reservoirs in awell-studied first-order catchment and evaluated the poten-tial of gray shale to take up atmospheric CO2 during shalealteration. We focused on two aspects of the C cycle: con-sumption of CO2 by silicate versus carbonate dissolutionand release of CO2 by degradation of ancient organicmatter.
Our results document that degradation of Silurianorganic matter releases CO2 at a rate of �1 mol m�2 ky�1.The CO2 efflux from soil to atmosphere (measured at 7 sitesalong a planar transect between 2009 and 2011) is on theorder of 1 lmol m�2 s�1, or 31,500 mol m�2 kyr�1. Thus,soil CO2 is derived almost exclusively from C in the atmo-sphere or degradation of modern vegetation. Soil water dis-solves silicate minerals (clays and plagioclase) whilemaintaining relatively low DIC (<100 lmol/L) in equilib-rium with CO2 in the soil atmosphere. Above the depthwhere carbonate minerals are encountered in the subsurface(3 m below land surface at valley floor) the shallowestgroundwater behaves similarly to the soil waters. At deeperdepths where groundwater is exposed to carbonate mineralssuch as primary ankerite or secondary calcite, DIC concen-trations in groundwaters increase to �2500 lmol/L,approaching chemical equilibrium with carbonate. Thed13CDIC values of these groundwaters are consistent with1:1 mixing of the carbonate and soil CO2 to the groundwa-ter DIC. The S isotope data is consistent with the release ofsulfuric acid due to pyrite dissolution in the bedrockbeneath the ankerite dissolution front, but this S is minorwhen compared to the contribution of S to the stream thatis derived from wet deposition in the whole catchment.
The net result of weathering in the SSHO is that therates of carbonate dissolution and silicate dissolution aresimilar – �40 mol CO2 m�2 ky�1 – and are much higherthan the estimated CO2 release rates contributed by ancientorganic matter oxidation (�1 mol CO2 m�2 ky�1). Impor-tantly, the depths at which carbonates and silicates dissolveare vastly different in the catchment and are dictated by theoverall relief (�30 m from northern ridge to valley floor)and the depth to the water table. Specifically, carbonatesdissolve near the water table – more than 20 m deep underthe ridgeline and 3 meters deep under the valley floor. Incontrast, silicates dissolve mostly in the fractured rocks thatcomprise the upper 5 meters of the catchment. Thus, tounderstand the total impact of weathering of shale in thistemperate climate requires not only analysis of soils butalso the reaction fronts at depth.
ACKNOWLEDGEMENTS
Special thanks go to Stojan Zigon from the Department ofEnvironmental Sciences at Jozef Stefan Institute in Slovenia for

L. Jin et al. / Geochimica et Cosmochimica Acta 142 (2014) 260–280 277
his help with carbon stable isotope analyses of soil, soil gas and DICsamples. Emmanuel Sosa helped with alkalinity titration. Financialsupport to L. Jin includes a University Research Initiative grantfrom University of Texas at El Paso and a seed grant from theNational Science Foundation through Pennsylvania State Univer-sity as part of the SSHO. Financial Support was also provided byNational Science Foundation Grant EAR – 0725019 (to C. Duffy),EAR – 1239285 (to S. Brantley), and EAR – 1331726 (to S. Brant-ley) for the Susquehanna Shale Hills Critical Zone Observatory.Logistical support and data from the Observatory are acknowl-edged. We conducted this research at the Penn State Stone ValleyForest which is funded by the Penn State College of Agriculture Sci-ences, Department of Ecosystem Science and Management andmanaged by the staff of the Forestlands Management Office.
REFERENCES
Alewell C., Mitchell M. J., Likens G. E. and Krouse H. R. (2000)Assessing the origin of sulfate deposition at the Hubbard Brookexperimental forest. J. Environ. Qual. 29, 759–767.
Allison C.E., Francey R.J. and Krummel P.B. (2003) d13C in CO2
from sites in the CSIRO Atmospheric Research GASLAB airsampling network, (April 2003 version). In Trends: A Compen-
dium of Data on Global Change. Carbon Dioxide InformationAnalysis Center, Oak Ridge National Laboratory, U.S.Department of Energy, Oak Ridge, TN, U.S.A.
Amiotte-Suchet P., Probst J. and Ludwig W. (2003) Worldwidedistribution of continental rock lithology: Implications for theatmospheric/soil CO2 uptake by continental weathering andalkalinity river transport to the oceans. Global Biogeochem.
Cycles 17, 1038. http://dx.doi.org/10.1029/2002GB001891.Amiotte-Suchet P., Linglois N., Leveque J. and Andreux F. (2007)
13C composition of dissolved organic carbon in upland forestedcatchments of the Morvan Mountains (France): influence ofconiferous and deciduous vegetation. J. Hydrol. 335, 354–363.
Andrews D. M., Lin H., Zhu Q., Jin L. and Brantley S. L. (2011)Hot spots and hot moments of dissolved organic carbon exportand soil organic carbon storage in the Shale Hills Critical ZoneObservatory. Vadose Zone J. 10, 943–954. http://dx.doi.org/10.2136/vzj2010.0149.
Beaulieu, Godderis E. Y., Labat D., Roelandt C., Calmels C. andGaillardet J. (2011) Modeling of water-rock interaction in theMackenzie basin: competition between sulfuric and carbonicacids. Chem. Geol. 289, 114–123.
Benkovitz C. M., Scholtze C. M., Pacyna J., Tarrason L., DignonJ., Voldner E. C., Spiro P. A., Logan J. A. and Graedel T. E.(1996) Global gridded inventories of anthropogenic emissionsof sulfur and nitrogen. J. Geophy. Res. 101, 29239–29253.
Berner E. K. and Berner R. A. (1996) Global Environment: Water,
Air, and Geochemical Cycles. Prentice-Hall, p. 376.Bostrom B., Comstedt D. and Ekblad A. (2007) Isotope fraction-
ation and 13C enrichment in soil profiles during the decompo-sition of soil organic matter. Oecologia 153, 89–98.
Brantley S. L., Holleran M. E., Jin L. and Bazilevskaya E. (2013)Probing chemical reactions underlying the Shale Hills CriticalZone Observatory, Pennsylvania (U.S.A.): nested weatheringreaction fronts. Earth Surf. Proc. Land.. http://dx.doi.org/10.1002/esp.3415.
Brantley S. L., Kubicki J. D. and White A. F. (2008) Kinetics of
water–rock interaction. Springer Science + Business Media,LLC, p. 833.
Brunet F., Gaiero D., Probst J. L., Depetris P. J., Lafaye F. G. andStille P. (2005) d13C tracing of dissolved inorganic carbonsources in Patagonian rivers (Argentina). Hydrol. Process. 19,3321–3344.
Calmels D., Gaillardet J., Brenot A. and France-Lanord C. (2007)Sustained sulfide oxidation by physical erosion processes in theMackenzie River Basin: climatic perspectives. Geology 35,1003–1006.
Cambell A. R. and Lueth V. W. (2008) Isotopic and texturaldiscrimination between hypogene, ancient supergene, andmodern sulfates at the Questa Mine, New Mexico. Appl.
Geochem. 23, 308–319.Canfield D.E. (2001) Biogeochemistry of sulfur isotopes. In Stable
Isotope Geochemistry (eds. J.W. Valley and D.R. Cole), vol. 43.Mineralogical Society of America, Blacksburg, VA. pp. 607–636.
Cerling T. E., Solomon D. K., Quade J. and Borman J. R. (1991)On the isotopic composition of carbon in soil carbon dioxide.Geochim. Cosmochim. Acta 55, 3403–3405.
Choi J., Hulseapple S. M., Conklin M. H. and Harvey J. W. (1998)Modelling CO2 degassing and pH in a stream-aquifer system. J.
Hydrol. 209, 297–310.Clark I. D. and Fritz P. (1997) Environmental Isotopes in
Hydrogeology. Lewis Publishers, New York, p. 328.Clayton J. L. and Swetland P. J. (1978) Subaerial weathering of
sedimentary organic matter. Geochim. Cosmochim. Acta 42,305–312.
Copard Y., Amiotte-Suchet P. and Di-Giovanni C. (2007) Storageand release of fossil organic carbon related to weathering ofsedimentary rocks. Earth Planet. Sci. Lett. 258, 345–357.
Edmond J. M. (1970) High precision determination of titrationalkalinity and total carbon dioxide content of sea water. Deep-
Sea Res. 17, 737–750.Ehleringer J. R., Sage R. F., Flanagan L. B. and Pearcy R. W.
(1991) Climate change and the evolution of C4 photosynthesis.Trends Ecol. Evol. 6, 95–99.
Ekblad A., Nyberg G. and Hohgberg P. (2002) 13C-discriminationduring microbial respiration of added C3-, C4- and 13C-labelledsugars to a C3-forest soil. Oecologia 131, 245–249.
Fitzgerald J. W. (1976) Sulfate ester formation and hydrolysis: apotentially important yet often ignored aspect of the sulfurcycle of aerobic soils. Bacteriol. Rev. 40, 698–721.
Folk R. L. (1960) Peterography and origin of the Tuscarora, RoseHill, and Keefer formations, lower and middle Silurian ofeastern west Virginia. J. Sediment. Petrol. 30, 1–58.
Friedli H., Lotscher H., Oeschger H., Siegenthaler U. and StaufferB. (1986) Ice core record of the 13C/12C ratio of atmosphericCO2 in the past two centuries. Nature 324, 237–238.
Gabitov R. I. and Watson E. B. (2006) Partitioning of strontiumbetween calcite and fluid. Geochem. Geophys. Geosyst. Q11004.http://dx.doi.org/10.1029/2005GC001216.
Gabitov R. I., Sadekov A. and Leinweber A. (2014) Crystal growthrate effect on Mg/Ca and Sr/Ca partitioning between calciteand fluid: an in-situ approach. Chem. Geol. 367, 70–82.
Gaillardet J., Dupre B., Louvat P. and Allegre C. J. (1999) Globalsilicate weathering and CO2 consumption rates deduced fromthe chemistry of large rivers. Chem. Geol. 159, 3–30.
Gieskes J. M. and Roders W. C. (1973) Alkalinity determinationsin interstitial waters of marine sediments. J. Sediment. Petrol.
43, 272–277.Graham C. and Lin H. (2011) Controls and frequency of
preferential flow occurrence: a 175-event analysis. Vadose Zone
J. 10, 816–831. http://dx.doi.org/10.2136/vzj2010.0119.Hamilton S. K., Kurzman A. L., Arango C., Jin L. and Robertson
G. P. (2007) Evidence for carbon sequestration by agriculturalliming. Global Biogeochem. Cycles 21, GB2021, doi:10.1029/2006GB002738.
Hasenmueller E. A., Jin L., Smith L. A., Kaye M. W., Lin H.,Brantley S. L. and Kaye J. P. (2014) Topographic controls andsoil depth impacts on soil CO2 concentrations and effluxes in asmall temperate watershed. Rev. Biogeochem..

278 L. Jin et al. / Geochimica et Cosmochimica Acta 142 (2014) 260–280
Hedges J. I. and Oades J. M. (1997) Comparative organicgeochemistries of soils and sediments. Org. Geochem. 27, 319–361.
Helie J., Hillaire-Marcel C. and Rondeau B. (2002) Seasonalchanges in the sources and fluxes of dissolved inorganic carbonthrough the St. Lawrence River-isotope and chemical con-straint. Chem. Geol. 186, 117–138.
Herndon E. M., Jin L. and Brantley S. L. (2011) Soils revealwidespread Manganese enrichment from industrial inputs.Environ. Sci. Technol. 45(1), 241–247.
Herut B., Zohary T., Krom M. D., Fauzi R., Mantoura C., PittaP., Psarra S., Rassoulzadegan F., Tanaka T. and Thingstad T.F. (2005) Response of East Mediterranean surface water toSaharan dust: on-board microcosm experiment and fieldobservations. Deep-Sea Res. II 52, 3024–3040.
Hillaire-Marcel C. (1986) Isotopes and food. Chapter 12. InHandbook of Environmental Isotope Geochemistry, vol. 2, The
Terrestrial Environment, B. (eds. P. Fritz and J.-Ch. Fontes).Elsevier, Amsterdam, The Netherlands, pp. 507–548.
Holland H. D. (1978) The Chemistry of the Atmosphere and Oceans.John Wiley and Sons, New York, p. 351.
Jaffe L. A., Peucker-Ehrenbrink B. and Petsch S. T. (2002)Mobility of rhenium, platinum group elements and organiccarbon during black shale weathering. Earth Planet. Sci. Lett.
198, 339–353.Jahne B., Heinz G. and Dietrich W. (1987) Measurement of the
diffusion coefficients of sparingly soluble gases in water. J.
Geophys. Res. 92, 10767–10776.Jin L., Andrews D. M., Holmes G. H., Lin H. and Brantley S. L.
(2011) Opening the “black box”: water chemistry revealshydrological controls on weathering in the Susquehanna ShaleHills Critical Zone Observatory. Vadose Zone J. 10, 928–942.http://dx.doi.org/10.2136/vzj2010.0133.
Jin L., Mathur R., Rother G., Cole D., Bazilevskaya E., WilliamsJ., Carone A. and Brantley S. L. (2013) Evolution of porosityand geochemistry in Marcellus formation black shale duringweathering. Chem. Geol. 356, 50–63.
Jin L., Ogrinc N., Hamilton S. K., Szrmek K., Kanduc T. andWalter L. M. (2009) Inorganic carbon isotope systematics insoil profiles undergoing silicate and carbonate weathering(Southern Michigan, USA). Chem. Geol. 264, 139–153.
Jin L., Ravella R., Ketchum B., Bierman P. R., Heaney P., WhiteT. and Brantley S. L. (2010) Mineral weathering and elementaltransport during hillslope evolution at the Susquehanna/ShaleHills Critical Zone Observatory. Geochim. Cosmochim. Acta 74,3669–3691.
Jin L., Williams E., Szramek K., Walter L. M. and Hamilton S. K.(2008) Silicate and carbonate mineral weathering in soil profilesdeveloped on Pleistocene glacial drift (Michigan, USA): massbalances based on soil water geochemistry. Geochim. Cosmo-
chim. Acta 72, 1027–1042.Kanduc T., Szramek K., Ogrinc N. and Walter L. M. (2007) Origin
and cycling of riverine inorganic carbon in the Sava Riverwatershed (Slovenia) inferred from major solutes and stablecarbon isotopes. Biogeochemistry 86, 137–154.
Karim A. and Veizer J. (2000) Weathering processes in the IndusRiver Basin: implications from riverine carbon, sulfur, oxygenand strontium isotopes. Chem. Geol. 170, 153–177.
Keller C. K. and Bacon D. H. (1998) Soil respiration andgeorespiration distinguished by transport analyses of vadoseCO2, 13CO2, and 14CO2. Global Biogeochem. Cycles 12,361–372.
Khanna P. K., Prenzel J., Meiwes K. J., Urich B. and Matzner E.(1987) Dynamics of sulfate retention by acid forest soils in anacidic deposition environment. Soil. Sci. Soc. Am. J. 51,446–452.
Kharaka Y. K., Gunter W. D., Aggarwal P. K., Perkins E. H. andDeBraal J. D. (1988) SOLMINEQ.88: a computer program forgeochemical modeling of water–rock interactions. U. S. Geol.
Surv..Koutika L., Bartoli F., Andreux F., Cerri C. C., Burtin G., Chone
T. and Philippy R. (1997) Organic matter dynamics andaggregation in soils under rain forest and pastures of increasingage in the eastern Amazon basin. Geoderma 76, 87–112.
Krouse H.R. and Grinenko V.A. (1991) Stable Isotopes: Natural
and Anthropogenic Sulphur in the Environment. p. 440.Kump L. R. and Arthur M. A. (1999) Interpreting carbon-
isotope excursions: carbonates and organic matter. Chem.
Geol. 161(1–3), 181–198.Kuntz B., Rubin S., Berkowitz B. and Singha K. (2011) Quanti-
fying solute transport behavior at the Shale Hills critical zoneobservatory. Vadose Zone J. 10, 1–15, http:// dx.doi.org/10.2136/vzj2010.0130.
Li S. L., Calmels D., Han G., Gaillardet J. and Liu C. Q. (2008)Sulfuric acid as an agent of carbonate weathering constrainedby delta C-13(DIC): examples from Southwest China. Earth
Planet. Sci. Lett. 270, 189–199.Likens G. E., Driscoll C. T., Buso D. C., Mitchell M. J., Lovett G.
M., Bailey S. W., Siccama T. G., Reiners W. A. and Alewell C.(2002) The biogeochemistry of sulfur at Hubbard Brook.Biogeochemistry 60, 235–316.
Lin H. S. (2006) Temporal stability of soil moisture spatial patternand subsurface preferential flow pathways in the Shale HillsCatchment. Vadose Zone J. 5, 317–340.
Littke R., Klussmann U., Krooss B. and Leythaeuser D. (1991)Quantification of loss of calcite, pyrite, and organic matter dueto weathering of Toarcian black shales and effects on kerogenand bitumen characteristics. Geochim. Cosmochim. Acta 55,3369–3378.
Lloret E., Dessert C., Gaillardet J., Alberic P., Crispi O.,Chaduteau C. and Benedetti M. F. (2011) Comparison ofdissolved inorganic and organic carbon yields and fluxes in thewatersheds of tropical volcanic islands, examples from Guade-loupe (French West Indies). Chem. Geol. 280, 65–78.
Lueth V. W., Rye R. O. and Peters L. (2005) “Sour gas”
hydrothermal jarosite: ancient to modern acid-sulphate miner-alization in the southern Rio Grande Rift. Chem. Geol. 215,339–360.
Lynch J.A. (1976) Effects of Antecedent Soil Moisture on Storm
Hydrographs. Pennsylvania State University, University Park.Lynch J.A. and Corbett E.S. (1985) Source-area variability during
peak flow. In J. Irrig. Drain. Div. Am. Soc. Civ. Eng (eds. E.B.Jones and T.J. Ward). pp. 300–307. In Watershed Management
in the 1980s (eds. E. Jones and T. Ward). ASCE, Reston, VA.pp. 300–307.
Lynch J. A. and Corbett E. S. (1989) Hydrologic control of sulfatemobility in a forested watershed. Water Resour. Res. 25(7),1695–1703.
Ma L., Chabaux F., Pelt E., Blaes E., Jin L. and Brantley S. L.(2010) Regolith production rates calculated with uranium-seriesisotopes at Susquehanna/Shale Hills Critical Zone Observatory.Earth Planet. Sci. Lett. 297, 211–225.
Ma L., Jin L. and Brantely S. L. (2011) How mineralogy and slopeaspect affect REE release and fractionation during shaleweathering in the Susquehanna/Shale Hills Critical ZoneObservatory. Chem. Geol. 290, 31–49.
Ma, L., Konter, J., Sanchez, D., Herndon, E., Jin, L. and Brantley,S.L. (2014). Quantifying the signature of the industrial revolu-tion from Pb concentrations and isotopes in Pennsylvania soils.In review for Anthropocene.
Mayer B., Fritz P., Prietzel J. and Krouse H. R. (1995) The use ofstable sulfur and oxygen isotope ratios for interpreting the

L. Jin et al. / Geochimica et Cosmochimica Acta 142 (2014) 260–280 279
mobility of sulfate in aerobic forest soils. Appl. Geochem. 10,161–173.
Migdisov A. A., Ronov A. B. and Grinenko V. A. (1983) Thesulfur cycle in the lithosphere. In The Global Biogeochemical
Sulphur Cycles, SCOPE 19 (eds. M. V. Ivanov and J. R.Freney). John Wiley & Sons, Chichester, pp. 25–95.
Mook W. G., Bommerson J. C. and Staverman W. H. (1974)Carbon isotope fractionation between bicarbonate and gaseouscarbon dioxide. Earth Planet. Sci. Lett. 22, 169–176.
Mucci A. and Morse J. W. (1983) The incorporation of Mg2+ andSr2+ into calcite overgrowths: influences of growth rate andsolution composition. Geochim. Cosmochim. Acta 47, 217–233.
National Oceanographic and Atmospheric Administration(NOAA) (2007) U. S. Divisional and Station Climatic Dataand Normals, Asheville, N.C., U.S. Dept. of Commerce,National Oceanic and Atmospheric Administration.
Nordstrom D. K. (1982) The effect of sulfate on aluminumconcentrations in natural waters: some stability relations in thesystem Al2O3–SO3–H2O at 298 K. Geochim. Cosmochim. Acta
46, 681–692.Parker S. R., Poulson S. R., Smith M. G., Weyer C. L. and Bates
K. M. (2010) Temporal variability in the concentration andstable carbon isotope composition of dissolved inorganic andorganic carbon in two Montana, USA rivers. Aquat. Geochem.
16, 61–84. http://dx.doi.org/10.1007/s10498-009-9068-1.Pawellek F. and Veizer J. (1994) Carbon cycle in the upper Danube
and its tributaries: 13CDIC constraints. Israel J. Earth Sci. 43,187–194.
Petsch S. T., Berner R. A. and Eglinton T. I. (2000) A field study ofthe chemical weathering of ancient sedimentary organic matter.Org. Geochem. 31, 475–487.
Petsch S. T., Edwards K. J. and Eglinton T. I. (2005) Microbialtransformations of organic matter in black shales and implica-tions for global biogeochemical cycles. Palaeogeogr. Palaeocl-
matol. Palaeoecol. 219, 157–170.Petsch S. T., Eglinton T. I. and Edwards K. J. (2001) 14C-dead
living biomass: evidence for microbial assimilation of ancientorganic carbon during shale weathering. Science 292, 1127–1131.
Polsenaere P., Savoye N., Etcheber H., Canton M., Poirier D.,Bouillon S. and Abril G. (2013) Export and degassing ofterrestrial carbon through watercourses draining a temperatepodzolized catchment. Aquat. Sci. 75, 299–319.
Qu Y. and Duffy C. J. (2007) A semidiscrete finite volumeformulation for multiprocess watershed simulation. Water
Resour. Res. 43, W08419. http://dx.doi.org/10.1029/2006WR005752.
Rajan S. S. S. (1978) Sulfate adsorbed on hydrous alumina, ligandsdisplaced, and changes in surface charge. Soil Sci. Soc. Am. J.
42, 39–44.Raymond P. A. and Cole J. J. (2003) Increase in the export of
alkalinity from North America’s largest river. Science 302, 88–91.
Reuss J.O. and Johnson D.W. (1986) Acid deposition and theacidification of soils and waters. In Ecological Studies, vol. 59.Springer, Berlin.
Ridgwell A. and Edwards U. (2007) Geological carbon sinks. InGreenhouse Gas Sinks (eds. D. Reay, N. Hewitt, J. Grace andK. Smith). pp. 74–97.
Rive K., Gaillardet J., Agrinier P. and Rad S. (2013) Carbonisotopes in the rivers from the Lesser Antilles: origin of thecarbonic acid consumed by weathering reactions in the LesserAntilles. Earth Surf. Proc. Land. 38, 1020–1035.
Sageman B. B., Murphy A. E., Werne J. P., Staeten C. A.,Hollander D. J. and Lyons T. W. (2003) A tale of shales: therelative roles of production, decomposition, and dilution in the
accumulation of organic-rich strata, Middle-Upper Devonian,Appalachian basin. Chem. Geol. 195, 229–273.
Sharpe W.E. and Drohan J. R. (1999) The effects of acidicdeposition on aquatic ecosystems in Pennsylvania. In Proceed-
ings of the 1998 Pennsylvania Acidic Deposition Conference, vol.II. Environmental Resources Research Institute, UniversityPark, PA.
Singh S. K., Sarin M. M. and France-Lanord C. (2005) Chemicalerosion in eastern Himalaya: major ion composition of theBrahmaputra and 13C of dissolved inorganic carbon. Geochim.
Cosmochim. Acta 69, 3573–3588.Strauss H. (1999) Geological evolution from isotope proxy signals-
sulfur. Chem. Geol. 161, 89–101.Stumm W. and Morgan J. J. (1996) Aquatic Chemistry, 3rd ed.
Wiley-Interscience, New York.Szramek K., McIntosh J. C., Williams E. L., Kanduc T., Ogrinc N.
and Walter L. M. (2007) Relative weathering intensity of calcitevs. dolomite in carbonate-bearing temperate zone watersheds:carbonate geochemistry and fluxes from catchments within theSt. Lawrence and Danube River Basin. Geochem. Geophys.
Geosyst. 8, Q04002, doi: 10.1029/2006GC001337.Telmer K. and Veizer J. (1999) Carbon fluxes, pCO2, and substrate
weathering in a large northern river basin, Canada: carbonisotope perspectives. Chem. Geol. 159, 61–86.
Thomas E., Lin H., Duffy C., Sullivan P., Holmes G. H., BrantleyS. and Jin L. (2013) Spatiotemporal patterns of water stableisotope compositions at the Shale Hills Critical Zone Observa-tory: linkages to subsurface hydrologic processes. Vadose Zone
J.. http://dx.doi.org/10.2136/vzj2013.01.0029.Tipper E. T., Bickle M. J., Galy A., West A. J., Pomies C. and
Chapman H. J. (2006) The short term climatic sensitivity ofcarbonate and silicate weathering fluxes: insights from seasonalvariations in river chemistry. Geochim. Cosmochim. Acta 70(11),2737–2754.
Trumbore S. E. (2000) Constraints on below-ground carboncycling from radiocarbon: the age of soil organic matter andrespired CO2. Ecol. Appl. 10, 399–411.
Trust B. A. and Fry B. (1992) Stable sulphur isotopes in plants: areview. Plant Cell Environ. 15, 1105–1110.
Ulrich B. and Pankrath J. (1983) Effects of accumulation of air
pollutants in forest ecosystems. Redel, Dordrecht.Van Stempvoort D. R., Reardon E. J. and Fritz P. (1990)
Fractionation of sulfur and oxygen isotopes in sulfate by soilsorption. Geochim. Cosmochim. Acta 54, 2817–2826.
Vogel J. C. (1993) Variability of carbon isotope fractionationduring photosynthesis. In Stable Isotopes and Plant Carbon–
Water Relations (eds. J. R. Ehleringer, A. E. Hall and G. D.Farquhar). Academic Press, San Diego, CA, pp. 29–38.
Wadleigh W. A., Schwarcz H. P. and Kramer J. R. (1994) Sulphurisotope tests of seasalt correction factors in precipitation: NovaScotia, Canada. Water Air Soil Pollut. 77, 1–16.
Williams E. L., Szramek K., Jin L., Ku T. C. W. and Walter L. M.(2007) The carbonate system geochemistry of shallow ground-water/surface water systems in temperate glaciated watersheds(Michigan, USA): significance of open system dolomite weath-ering. Geol. Soc. Am. Bull. 119, 511–528. http://dx.doi.org/10.1130/B25967.1.
Wubbels J. K. (2010) Tree species distribution in relation to stemhydraulic traits and soil moisture in a mixed hardwood forest incentral Pennsylvania. Master’s Thesis, The Pennsylvania StateUniversity.
Wynn J. G., Bird M. I. and Wong V. N. L. (2005) Rayleighdistillation and the depth profile of 13C/12C ratios of soilorganic carbon from soils of disparate texture in Iron RangeNational Park, Far North Queensland, Australia. Geochim.
Cosmochim. Acta 69, 1961–1973.

280 L. Jin et al. / Geochimica et Cosmochimica Acta 142 (2014) 260–280
Yang C., Telmer K. and Veizer J. (1996) Chemical dynamic of the“St. Lawrence” riverine system: DH2O, 18OH2O, 13CDIC, 34Ssul-
fate, and dissolved 87Sr/86Sr. Geochim. Cosmochim. Acta 60,851–866.
Yesavage T., Fantle M. S., Vervoort J., Mathur R., Jin L.,Liermann L. J. and Brantley S. L. (2012) Fe cycling in the ShaleHills Critical Zone Observatory, Pennsylvania: an analysis ofmicrobiology, chemical weathering, and Fe isotope fraction-ation. Geochim. Cosmochim. Acta 99, 18–38.
Zavadlav S., Kanduc T., McIntosh J. and Lojen S. (2013) Isotopicand chemical constraints on the biogeochemistry of dissolvedinorganic carbon and chemical weathering in the Karstwatershed of Krka River (Slovenia). Aquat. Geochem. 19,209–230.
Zhu C. (2005) In situ feldspar dissolution rates in an aquifer.Geochim. Cosmochim. Acta 69, 1435–1453.
Associate editor: Andrew D. Jacobson