The Classroom Observation Protocol for Undergraduate STEM (COPUS): a new instrument to characterize...
10
CBE—Life Sciences Education Vol. 12, 618–627, Winter 2013 Article The Classroom Observation Protocol for Undergraduate STEM (COPUS): A New Instrument to Characterize University STEM Classroom Practices Michelle K. Smith,* Francis H. M. Jones, † Sarah L. Gilbert, ‡ and Carl E. Wieman ‡ *School of Biology and Ecology and Maine Center for Research in STEM Education, University of Maine–Orono, Orono, ME 04469-5751; † Department of Earth, Ocean, and Atmospheric Sciences, University of British Columbia, Vancouver, BC V6T 1Z4, Canada; ‡ Carl Wieman Science Education Initiative, University of British Columbia, Vancouver, BC V6T 1Z3, Canada Submitted August 10, 2013; Revised September 8, 2013; Accepted September 9, 2013 Monitoring Editor: Erin L. Dolan Instructors and the teaching practices they employ play a critical role in improving student learning in college science, technology, engineering, and mathematics (STEM) courses. Consequently, there is increasing interest in collecting information on the range and frequency of teaching practices at department-wide and institution-wide scales. To help facilitate this process, we present a new classroom observation protocol known as the Classroom Observation Protocol for Undergraduate STEM or COPUS. This protocol allows STEM faculty, after a short 1.5-hour training period, to reliably characterize how faculty and students are spending their time in the classroom. We present the protocol, discuss how it differs from existing classroom observation protocols, and describe the process by which it was developed and validated. We also discuss how the observation data can be used to guide individual and institutional change. INTRODUCTION A large and growing body of research indicates that un- dergraduate students learn more in courses that use active- engagement instructional approaches (Prince, 2004; Knight and Wood, 2005; Michael, 2006; Blanchard et al., 2010). As a re- sult, the importance of teaching science, technology, engineer- ing, and mathematics (STEM) courses more effectively has been stressed in numerous reports, including the President’s Council of Advisors on Science and Technology Engage to Ex- cel report (2012), the National Science Foundation/American Association for the Advancement of Science Vision and Change DOI: 10.1187/cbe.13-08-0154 Address correspondence to: Michelle K. Smith (michelle.k.smith@ maine.edu). c 2013 M. K. Smith et al. CBE—Life Sciences Education c 2013 The American Society for Cell Biology. This article is distributed by The American Society for Cell Biology under license from the author(s). It is available to the public under an Attribution– Noncommercial–Share Alike 3.0 Unported Creative Commons Li- cense (http://creativecommons.org/licenses/by-nc-sa/3.0). “ASCB R ” and “The American Society for Cell Biology R ” are regis- tered trademarks of The American Society for Cell Biology. report (AAAS, 2010), and the National Research Council Discipline-Based Education Research report (Singer et al., 2012). Given these compelling, evidence-based recommendations and the recognized need for measures of teaching effective- ness beyond student evaluations (Association of American Universities, 2011), higher education institutions are strug- gling to determine the extent to which faculty members are teaching in an interactive manner. This lack of information is a major barrier to transforming instruction and evaluating the success of programs that support such change. To collect information about the nature of STEM teaching practices as a means to support institutional change, faculty at both the University of British Columbia (UBC) and the University of Maine (UMaine) created classroom observation programs. The results of such observations were needed to: 1) characterize the general state of STEM classroom teaching at both institutions, 2) provide feedback to instructors who desired information about how they and their students were spending time in class, 3) identify faculty professional de- velopment needs, and 4) check the accuracy of the faculty reporting on the Teaching Practices Survey that is now in use at UBC (CWSEI Teaching Practices Survey, 2013). To achieve these goals, the programs needed an observa- tion protocol that could be used by faculty member observers 618 by guest on June 22, 2016 http://www.lifescied.org/ Downloaded from http://www.lifescied.org/content/suppl/2013/11/14/12.4.618.DC1.html Supplemental Material can be found at:
-
Upload
independent -
Category
Documents
-
view
0 -
download
0
Transcript of The Classroom Observation Protocol for Undergraduate STEM (COPUS): a new instrument to characterize...
CBE—Life Sciences EducationVol. 12, 618–627, Winter 2013
Article
The Classroom Observation Protocol for UndergraduateSTEM (COPUS): A New Instrument to CharacterizeUniversity STEM Classroom PracticesMichelle K. Smith,* Francis H. M. Jones,† Sarah L. Gilbert,‡ and Carl E. Wieman‡
*School of Biology and Ecology and Maine Center for Research in STEM Education, University of Maine–Orono,Orono, ME 04469-5751; †Department of Earth, Ocean, and Atmospheric Sciences, University of British Columbia,Vancouver, BC V6T 1Z4, Canada; ‡Carl Wieman Science Education Initiative, University of British Columbia,Vancouver, BC V6T 1Z3, Canada
Submitted August 10, 2013; Revised September 8, 2013; Accepted September 9, 2013Monitoring Editor: Erin L. Dolan
Instructors and the teaching practices they employ play a critical role in improving student learningin college science, technology, engineering, and mathematics (STEM) courses. Consequently, thereis increasing interest in collecting information on the range and frequency of teaching practicesat department-wide and institution-wide scales. To help facilitate this process, we present a newclassroom observation protocol known as the Classroom Observation Protocol for UndergraduateSTEM or COPUS. This protocol allows STEM faculty, after a short 1.5-hour training period, toreliably characterize how faculty and students are spending their time in the classroom. We presentthe protocol, discuss how it differs from existing classroom observation protocols, and describe theprocess by which it was developed and validated. We also discuss how the observation data can beused to guide individual and institutional change.
INTRODUCTION
A large and growing body of research indicates that un-dergraduate students learn more in courses that use active-engagement instructional approaches (Prince, 2004; Knightand Wood, 2005; Michael, 2006; Blanchard et al., 2010). As a re-sult, the importance of teaching science, technology, engineer-ing, and mathematics (STEM) courses more effectively hasbeen stressed in numerous reports, including the President’sCouncil of Advisors on Science and Technology Engage to Ex-cel report (2012), the National Science Foundation/AmericanAssociation for the Advancement of Science Vision and Change
DOI: 10.1187/cbe.13-08-0154Address correspondence to: Michelle K. Smith ([email protected]).
c© 2013 M. K. Smith et al. CBE—Life Sciences Education c© 2013The American Society for Cell Biology. This article is distributedby The American Society for Cell Biology under license fromthe author(s). It is available to the public under an Attribution–Noncommercial–Share Alike 3.0 Unported Creative Commons Li-cense (http://creativecommons.org/licenses/by-nc-sa/3.0).“ASCB R©” and “The American Society for Cell Biology R©” are regis-tered trademarks of The American Society for Cell Biology.
report (AAAS, 2010), and the National Research CouncilDiscipline-Based Education Research report (Singer et al., 2012).Given these compelling, evidence-based recommendationsand the recognized need for measures of teaching effective-ness beyond student evaluations (Association of AmericanUniversities, 2011), higher education institutions are strug-gling to determine the extent to which faculty members areteaching in an interactive manner. This lack of informationis a major barrier to transforming instruction and evaluatingthe success of programs that support such change.
To collect information about the nature of STEM teachingpractices as a means to support institutional change, facultyat both the University of British Columbia (UBC) and theUniversity of Maine (UMaine) created classroom observationprograms. The results of such observations were needed to:1) characterize the general state of STEM classroom teachingat both institutions, 2) provide feedback to instructors whodesired information about how they and their students werespending time in class, 3) identify faculty professional de-velopment needs, and 4) check the accuracy of the facultyreporting on the Teaching Practices Survey that is now in useat UBC (CWSEI Teaching Practices Survey, 2013).
To achieve these goals, the programs needed an observa-tion protocol that could be used by faculty member observers
618
by guest on June 22, 2016http://www.lifescied.org/Downloaded from
http://www.lifescied.org/content/suppl/2013/11/14/12.4.618.DC1.htmlSupplemental Material can be found at:
Observation Protocol for STEM Classes
to reliably characterize how students and instructors werespending their time in undergraduate STEM classrooms. Acritical requirement of the protocol was that observers whowere typical STEM faculty members could achieve those re-sults with only 1 or 2 hours of training, as it is unrealistic toexpect they would have more time than that available. In thequest for a suitable observation protocol, multiple existingoptions were considered, and ultimately rejected.
The observation protocols considered were divided intotwo categories: open-ended or structured. When observersuse open-ended protocols, they typically attend class, makenotes, and respond to such statements as: “Comment on stu-dent involvement and interaction with the instructor” (Millis,1992). Although responses to these types of questions can pro-vide useful feedback to observers and instructors, the dataare observer dependent and cannot easily be standardized orcompared across multiple classrooms (e.g., all STEM coursesat UBC or UMaine).
Alternatively, structured protocols provide a common setof statements or codes to which the observers respond. Often,these protocols ask observers to make judgments about howwell the teaching conforms to a specific standard. Examples ofsuch protocols include the Inside the Classroom: Observationand Analytic Protocol (Weiss et al., 2003) and the ReformedTeaching Observation Protocol (RTOP; Sawada et al., 2002).These protocols consist of statements that observers typicallyscore on a Likert scale from “not at all” to “to a great extent”and contain such statements as: “The teacher had a solidgrasp of the subject matter content inherent in the lesson”(from RTOP; Sawada et al., 2002).
The RTOP in particular has been used to observe uni-versity STEM instruction. For example, it has been used toevaluate university-level courses at several different insti-tutions to measure the effectiveness of faculty professionaldevelopment workshops (Ebert-May et al., 2011) and to com-pare physics instructors in a study examining coteaching as amethod to help new faculty develop learner-centered teach-ing practices (Henderson et al., 2011). The RTOP is also beingused to characterize classroom practices in many institutionsand in all levels of geoscience classes (Classroom ObservationProject, 2011).
The RTOP was found to be unsuitable for the UBC andUMaine programs for two main reasons. The first is that theprotocol involves many observational judgments that can beawkward to share with the instructor and/or the larger uni-versity community. The second is that observers must com-plete a multiday training program to achieve acceptable in-terrater reliability (IRR; Sawada et al., 2002).
More recently, new observation protocols have been devel-oped that describe instructional practices without any judg-ment as to whether or not the practices are effective or alignedwith specific pedagogic strategies. These observation proto-cols use a series of codes to characterize instructor and/orstudent behaviors in the classroom; observers indicate howoften each behavior occurs during a class period (Hora et al.,2013; West et al., 2013). One observation protocol in particu-lar, the Teaching Dimensions Observation Protocol (TDOP),was expressly developed to observe postsecondary nonlabo-ratory courses. For this protocol, observers document class-room behaviors in 2-min intervals throughout the durationof the class session (Hora et al., 2013). The possible class-room behaviors are described in 46 codes in six categories,
and observers make a checkmark when any of the behaviorsoccur.
The TDOP instrument avoids the judgment issues associ-ated with the RTOP, but it still requires substantial training,as one might expect for a protocol that was designed to bea complex research instrument. Preliminary work suggeststhat, after a 3-day training session, observers have acceptableIRR scores when using the TDOP (Hora et al., 2013). Observersat our institutions tried using this instrument, but without thefull training, they found it difficult to use the TDOP in a re-liable way, due to the complexity of the items being codedand the large number of possible behavior codes. We alsofound that the particular research questions it was designedto address did not entirely align with our needs. For exam-ple, it covers some aspects that are not necessary for facultyobservation programs, such as whether an instructor uses in-structional artifacts (e.g., a laser pointer or computer; Horaet al., 2013) and fails to capture others that are needed, suchas whether an instructor encourages peer discussion alongwith clicker questions (Mazur, 1997; Smith et al., 2009, 2011).We also wanted to better characterize the student behaviorsduring the class period than the TDOP easily allowed.
Out of necessity, we created a new protocol called the Class-room Observation Protocol for Undergraduate STEM, orCOPUS. Like the TDOP, this new protocol documents class-room behaviors in 2-min intervals throughout the durationof the class session, does not require observers to make judg-ments of teaching quality, and produces clear graphical re-sults. However, COPUS is different in that it is limited to 25codes in only two categories (“What the students are doing”and “What the instructor is doing”) and can be reliably usedby university faculty with only 1.5 hours of training (Figure1 has a description of the codes; the Supplemental Materialincludes the full protocol and coding sheet). Observers whorange from STEM faculty members without a backgroundin science education research to K–12 STEM teachers havereliably used this protocol to document instruction in under-graduate science, math, and engineering classrooms. Takentogether, their results show the broad usability of COPUS.
DEVELOPMENT
The development of COPUS was an evolutionary processextending across more than 2 years, involving many itera-tions and extensive testing. It began at UBC, where scienceeducation specialists (SESs) who were working with sciencefaculty on improving teaching (Wieman et al., 2010) wantedto characterize what both the students and instructors weredoing during class. The SESs began testing various existingprotocols, including the TDOP, in different classes at UBC inlate 2011 and early 2012. The original TDOP did not meetour needs (as described above), so we iteratively modifiedthe protocol through nine different versions. These changesresulted in a format, procedure, data structure, and codingstrategy that was easy to implement on paper or electron-ically and convenient for analysis and display. The overallformat of the observation protocol remained largely stable,but the categories and codes continued to evolve.
During the Fall term of 2012, 16 SESs, who are highlytrained and experienced classroom observers, used thisevolving protocol to observe a variety of courses in singles,
Vol. 12, Winter 2013 619
by guest on June 22, 2016http://www.lifescied.org/Downloaded from

M. K. Smith et al.
Figure 1. Descriptions of the COPUS student andinstructor codes.
pairs, or trios across most of the departments in the UBC Fac-ulty of Science (including the disciplines of biology, computerscience, earth sciences, mathematics, physics, and statistics).We analyzed the SES generated observation data to identifycoding disagreements and met with the SESs to discuss theevolving protocol and coding. These discussions covered ob-served behaviors they found difficult to code and/or hard tointerpret, and other important elements of instructor or stu-dent behavior they felt were not being adequately captured.The protocol evolved through five different versions duringthis stage of testing and feedback. The final version had sub-stantially simplified categories and all identified problemswith the wording on the codes had been eliminated. Notably,it was quite simple to reliably code classes taught with tradi-tional lectures, as a very small number of behaviors need to becoded. Therefore, the majority of the work went into improv-ing the protocol so it could reliably characterize classes thathad substantial and varied interactions between instructorand students and multiple student activities.
One substantial change during Fall 2012 was eliminatinga category for judging the cognitive level of the activities.Observers had been asked to code the level of cognitive so-phistication of current classroom activities, based on Bloom’staxonomy of educational objectives (Bloom et al., 1956). Aftermultiple unsuccessful attempts to find a simple and reliablecoding scheme that could capture this aspect of the classroomactivities, we dropped this category. Our decision to drop thiscategory is supported by recent work showing that, whenfaculty members write and evaluate higher-order questions,
they use several criteria beyond the Bloom’s level, includ-ing: question difficulty, time required to answer the ques-tions, whether students are using a new or well-practicedapproach, and whether the questions have multiple reason-able solutions (Lemons and Lemons, 2012).
The second substantial change during this time waschanging another category—coding the level of studentengagement—from required to optional. Having a measureof student engagement is useful for providing feedback tothe instructor and for judging the overall effectiveness ofmany instructional activities. With the coding of the levels ofengagement simplified to only discriminating between low(0–20% of the students engaged), medium, or high (≥80% ofthe student engaged), some observers, particularly those whohad some experience with observing levels of student engage-ment, could easily code engagement along with the other twocategories, and there was reasonable consistency between ob-servers. However, less-experienced observers found it quitehard to simultaneously code what the students were doing,what the instructor was doing, and the student engagementlevel. Also, there were difficulties with obtaining consistentcoding of student engagement across all observers; the judg-ments were often dependent on the levels of engagementcommon to the specific disciplines and courses with whichthe observers were familiar. For this reason, the student en-gagement category was made optional. We recommend ob-servers do not try to code it until after they have becomeexperienced at coding the “What the students are doing” and“What the instructor is doing” categories.
620 CBE—Life Sciences Education
by guest on June 22, 2016http://www.lifescied.org/Downloaded from
Observation Protocol for STEM Classes
Another recurring theme of the discussions with the SESswas the extent to which classroom observations could accu-rately capture the quality of instruction or the efficacy of stu-dent work. In the end, after SESs observed different classesacross many disciplines, there was a consensus that accu-rately evaluating the quality of instruction and the efficacyof student work was generally not possible. These highlytrained and experienced observers concluded that these eval-uations require a high degree of training of the observer in thematerial and the pedagogic strategies, as well as familiaritywith the student population (prior knowledge, typical class-room behaviors, etc.). We concluded that quality judgmentsof this type were not realistic goals for limited classroomobservations carried out by STEM faculty members. Thus,the present version of COPUS captures the actions of bothinstructors and students, but does not attempt to judge thequality of those actions for enhancing learning.
After the completion of this development work at UBC, theCOPUS was further tested by 16 K–12 teachers participatingin a teacher professional development program at UMaine.The teachers used the COPUS to observe 16 undergraduateSTEM courses in five different departments (biology, engi-neering, math, chemistry, and physics). While the teacherseasily interpreted many of the codes, they found a few to bedifficult and suggested additional changes. For example, thestudent code “Listening: paying attention/taking notes, etc.”
was changed to “Listening to instructor/taking notes, etc.”The code was clarified, so observers knew they should se-lect this code only when the students were listening to theirinstructor, not when students were listening to their peers.Also, new codes were added to capture behaviors the teachersthought were missing, such as the instructor code “AnQ: Lis-tening to and answering student questions with entire classlistening.”
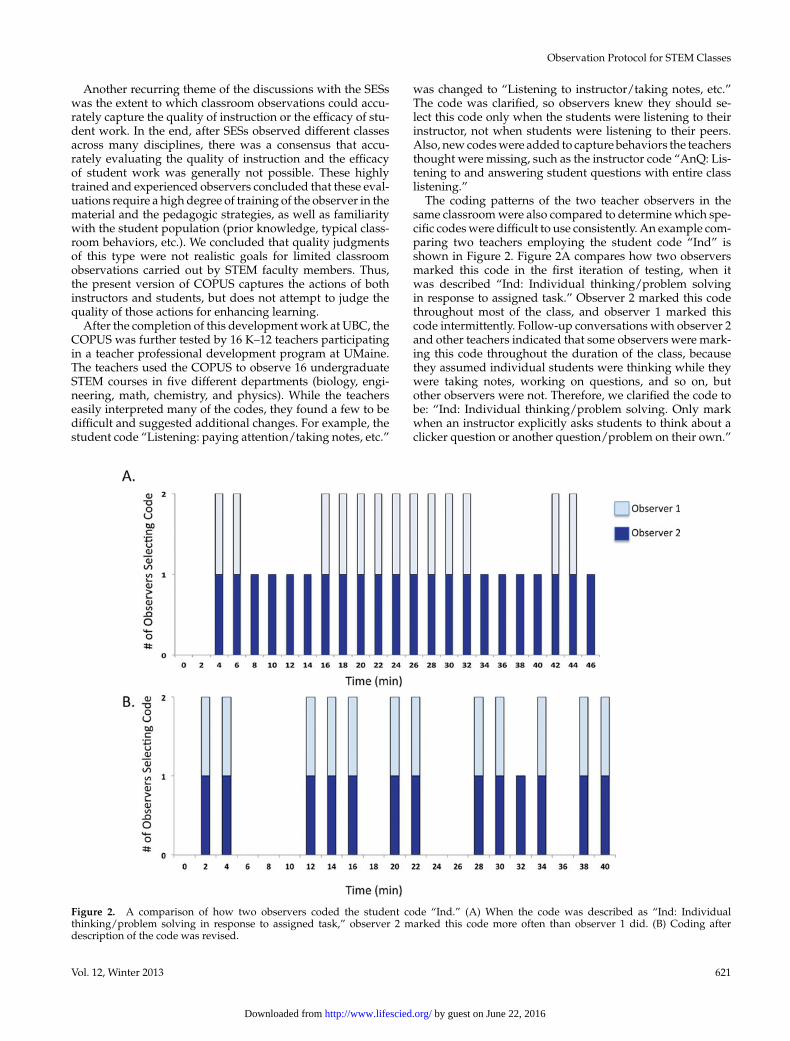
The coding patterns of the two teacher observers in thesame classroom were also compared to determine which spe-cific codes were difficult to use consistently. An example com-paring two teachers employing the student code “Ind” isshown in Figure 2. Figure 2A compares how two observersmarked this code in the first iteration of testing, when itwas described “Ind: Individual thinking/problem solvingin response to assigned task.” Observer 2 marked this codethroughout most of the class, and observer 1 marked thiscode intermittently. Follow-up conversations with observer 2and other teachers indicated that some observers were mark-ing this code throughout the duration of the class, becausethey assumed individual students were thinking while theywere taking notes, working on questions, and so on, butother observers were not. Therefore, we clarified the code tobe: “Ind: Individual thinking/problem solving. Only markwhen an instructor explicitly asks students to think about aclicker question or another question/problem on their own.”
Figure 2. A comparison of how two observers coded the student code “Ind.” (A) When the code was described as “Ind: Individualthinking/problem solving in response to assigned task,” observer 2 marked this code more often than observer 1 did. (B) Coding afterdescription of the code was revised.
Vol. 12, Winter 2013 621
by guest on June 22, 2016http://www.lifescied.org/Downloaded from
M. K. Smith et al.
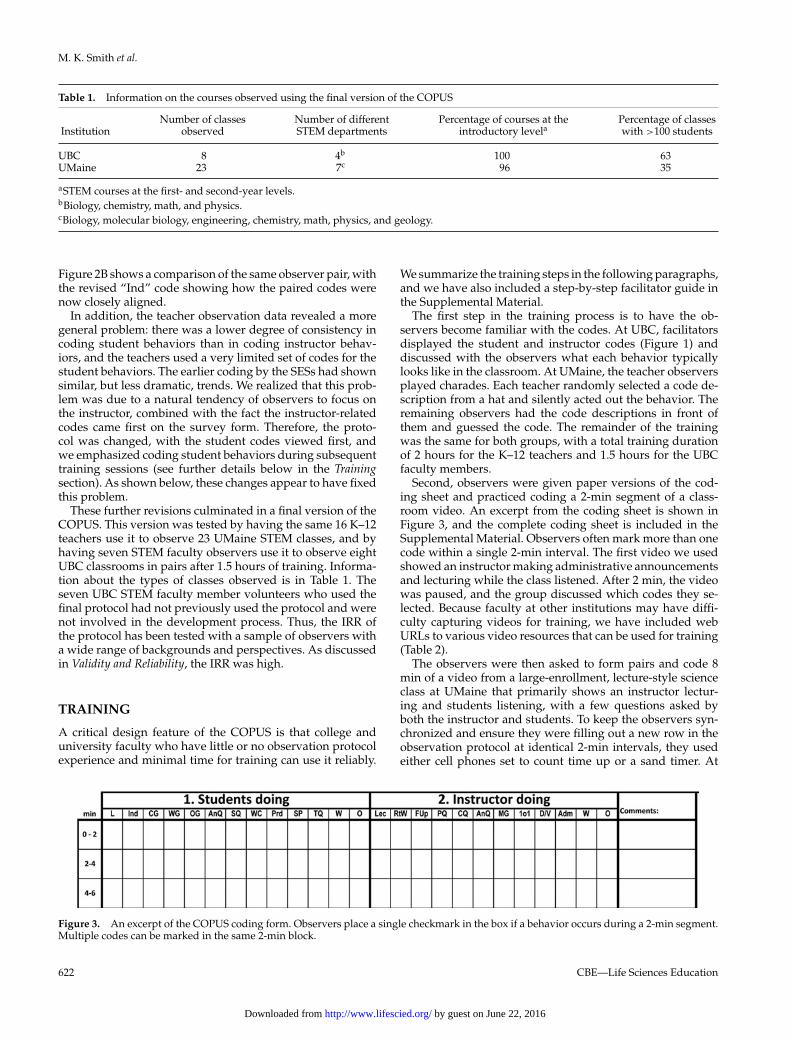
Table 1. Information on the courses observed using the final version of the COPUS
InstitutionNumber of classes
observedNumber of differentSTEM departments
Percentage of courses at theintroductory levela
Percentage of classeswith >100 students
UBC 8 4b 100 63UMaine 23 7c 96 35
aSTEM courses at the first- and second-year levels.bBiology, chemistry, math, and physics.cBiology, molecular biology, engineering, chemistry, math, physics, and geology.
Figure 2B shows a comparison of the same observer pair, withthe revised “Ind” code showing how the paired codes werenow closely aligned.
In addition, the teacher observation data revealed a moregeneral problem: there was a lower degree of consistency incoding student behaviors than in coding instructor behav-iors, and the teachers used a very limited set of codes for thestudent behaviors. The earlier coding by the SESs had shownsimilar, but less dramatic, trends. We realized that this prob-lem was due to a natural tendency of observers to focus onthe instructor, combined with the fact the instructor-relatedcodes came first on the survey form. Therefore, the proto-col was changed, with the student codes viewed first, andwe emphasized coding student behaviors during subsequenttraining sessions (see further details below in the Trainingsection). As shown below, these changes appear to have fixedthis problem.
These further revisions culminated in a final version of theCOPUS. This version was tested by having the same 16 K–12teachers use it to observe 23 UMaine STEM classes, and byhaving seven STEM faculty observers use it to observe eightUBC classrooms in pairs after 1.5 hours of training. Informa-tion about the types of classes observed is in Table 1. Theseven UBC STEM faculty member volunteers who used thefinal protocol had not previously used the protocol and werenot involved in the development process. Thus, the IRR ofthe protocol has been tested with a sample of observers witha wide range of backgrounds and perspectives. As discussedin Validity and Reliability, the IRR was high.
TRAINING
A critical design feature of the COPUS is that college anduniversity faculty who have little or no observation protocolexperience and minimal time for training can use it reliably.
We summarize the training steps in the following paragraphs,and we have also included a step-by-step facilitator guide inthe Supplemental Material.
The first step in the training process is to have the ob-servers become familiar with the codes. At UBC, facilitatorsdisplayed the student and instructor codes (Figure 1) anddiscussed with the observers what each behavior typicallylooks like in the classroom. At UMaine, the teacher observersplayed charades. Each teacher randomly selected a code de-scription from a hat and silently acted out the behavior. Theremaining observers had the code descriptions in front ofthem and guessed the code. The remainder of the trainingwas the same for both groups, with a total training durationof 2 hours for the K–12 teachers and 1.5 hours for the UBCfaculty members.
Second, observers were given paper versions of the cod-ing sheet and practiced coding a 2-min segment of a class-room video. An excerpt from the coding sheet is shown inFigure 3, and the complete coding sheet is included in theSupplemental Material. Observers often mark more than onecode within a single 2-min interval. The first video we usedshowed an instructor making administrative announcementsand lecturing while the class listened. After 2 min, the videowas paused, and the group discussed which codes they se-lected. Because faculty at other institutions may have diffi-culty capturing videos for training, we have included webURLs to various video resources that can be used for training(Table 2).
The observers were then asked to form pairs and code 8min of a video from a large-enrollment, lecture-style scienceclass at UMaine that primarily shows an instructor lectur-ing and students listening, with a few questions asked byboth the instructor and students. To keep the observers syn-chronized and ensure they were filling out a new row in theobservation protocol at identical 2-min intervals, they usedeither cell phones set to count time up or a sand timer. At
Figure 3. An excerpt of the COPUS coding form. Observers place a single checkmark in the box if a behavior occurs during a 2-min segment.Multiple codes can be marked in the same 2-min block.
622 CBE—Life Sciences Education
by guest on June 22, 2016http://www.lifescied.org/Downloaded from
Observation Protocol for STEM Classes
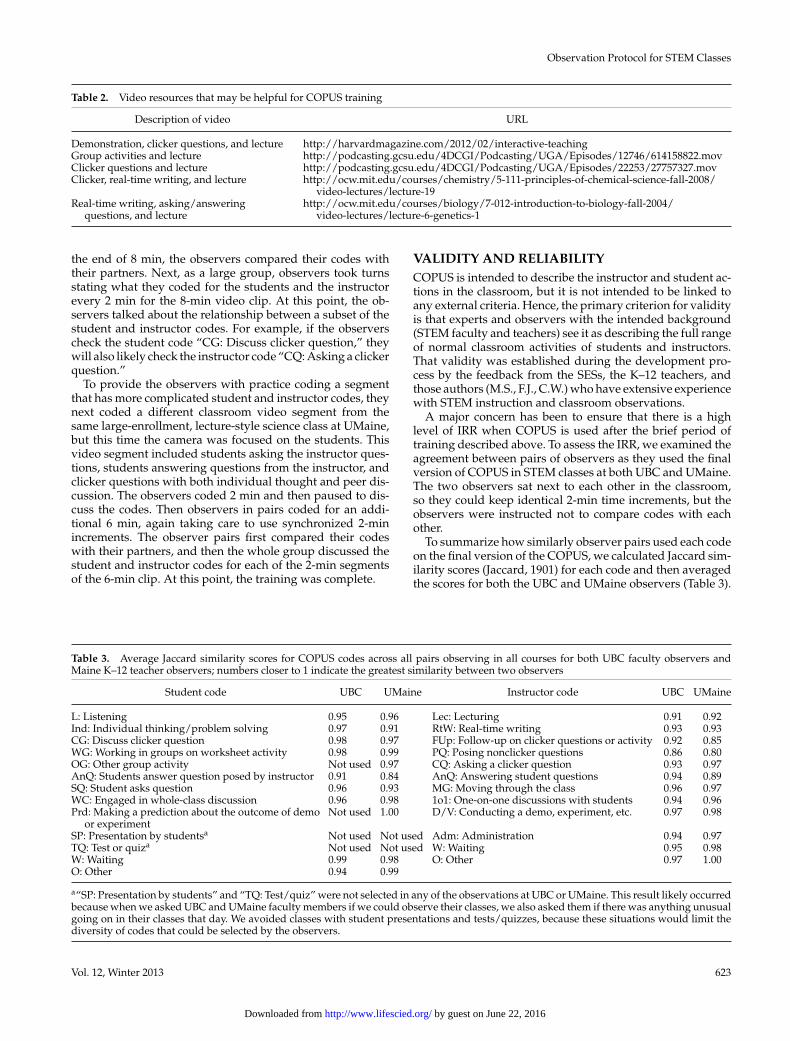
Table 2. Video resources that may be helpful for COPUS training
Description of video URL
Demonstration, clicker questions, and lecture http://harvardmagazine.com/2012/02/interactive-teachingGroup activities and lecture http://podcasting.gcsu.edu/4DCGI/Podcasting/UGA/Episodes/12746/614158822.movClicker questions and lecture http://podcasting.gcsu.edu/4DCGI/Podcasting/UGA/Episodes/22253/27757327.movClicker, real-time writing, and lecture http://ocw.mit.edu/courses/chemistry/5-111-principles-of-chemical-science-fall-2008/
video-lectures/lecture-19Real-time writing, asking/answering
questions, and lecturehttp://ocw.mit.edu/courses/biology/7-012-introduction-to-biology-fall-2004/
video-lectures/lecture-6-genetics-1
the end of 8 min, the observers compared their codes withtheir partners. Next, as a large group, observers took turnsstating what they coded for the students and the instructorevery 2 min for the 8-min video clip. At this point, the ob-servers talked about the relationship between a subset of thestudent and instructor codes. For example, if the observerscheck the student code “CG: Discuss clicker question,” theywill also likely check the instructor code “CQ: Asking a clickerquestion.”
To provide the observers with practice coding a segmentthat has more complicated student and instructor codes, theynext coded a different classroom video segment from thesame large-enrollment, lecture-style science class at UMaine,but this time the camera was focused on the students. Thisvideo segment included students asking the instructor ques-tions, students answering questions from the instructor, andclicker questions with both individual thought and peer dis-cussion. The observers coded 2 min and then paused to dis-cuss the codes. Then observers in pairs coded for an addi-tional 6 min, again taking care to use synchronized 2-minincrements. The observer pairs first compared their codeswith their partners, and then the whole group discussed thestudent and instructor codes for each of the 2-min segmentsof the 6-min clip. At this point, the training was complete.
VALIDITY AND RELIABILITYCOPUS is intended to describe the instructor and student ac-tions in the classroom, but it is not intended to be linked toany external criteria. Hence, the primary criterion for validityis that experts and observers with the intended background(STEM faculty and teachers) see it as describing the full rangeof normal classroom activities of students and instructors.That validity was established during the development pro-cess by the feedback from the SESs, the K–12 teachers, andthose authors (M.S., F.J., C.W.) who have extensive experiencewith STEM instruction and classroom observations.
A major concern has been to ensure that there is a highlevel of IRR when COPUS is used after the brief period oftraining described above. To assess the IRR, we examined theagreement between pairs of observers as they used the finalversion of COPUS in STEM classes at both UBC and UMaine.The two observers sat next to each other in the classroom,so they could keep identical 2-min time increments, but theobservers were instructed not to compare codes with eachother.
To summarize how similarly observer pairs used each codeon the final version of the COPUS, we calculated Jaccard sim-ilarity scores (Jaccard, 1901) for each code and then averagedthe scores for both the UBC and UMaine observers (Table 3).
Table 3. Average Jaccard similarity scores for COPUS codes across all pairs observing in all courses for both UBC faculty observers andMaine K–12 teacher observers; numbers closer to 1 indicate the greatest similarity between two observers
Student code UBC UMaine Instructor code UBC UMaine
L: Listening 0.95 0.96 Lec: Lecturing 0.91 0.92Ind: Individual thinking/problem solving 0.97 0.91 RtW: Real-time writing 0.93 0.93CG: Discuss clicker question 0.98 0.97 FUp: Follow-up on clicker questions or activity 0.92 0.85WG: Working in groups on worksheet activity 0.98 0.99 PQ: Posing nonclicker questions 0.86 0.80OG: Other group activity Not used 0.97 CQ: Asking a clicker question 0.93 0.97AnQ: Students answer question posed by instructor 0.91 0.84 AnQ: Answering student questions 0.94 0.89SQ: Student asks question 0.96 0.93 MG: Moving through the class 0.96 0.97WC: Engaged in whole-class discussion 0.96 0.98 1o1: One-on-one discussions with students 0.94 0.96Prd: Making a prediction about the outcome of demo
or experimentNot used 1.00 D/V: Conducting a demo, experiment, etc. 0.97 0.98
SP: Presentation by studentsa Not used Not used Adm: Administration 0.94 0.97TQ: Test or quiza Not used Not used W: Waiting 0.95 0.98W: Waiting 0.99 0.98 O: Other 0.97 1.00O: Other 0.94 0.99
a“SP: Presentation by students” and “TQ: Test/quiz” were not selected in any of the observations at UBC or UMaine. This result likely occurredbecause when we asked UBC and UMaine faculty members if we could observe their classes, we also asked them if there was anything unusualgoing on in their classes that day. We avoided classes with student presentations and tests/quizzes, because these situations would limit thediversity of codes that could be selected by the observers.
Vol. 12, Winter 2013 623
by guest on June 22, 2016http://www.lifescied.org/Downloaded from
M. K. Smith et al.
For single codes, we calculated Jaccard similarity scores in-stead of IRR Cohen’s kappa values, because observer pairsoccasionally marked the same code for every 2-min incre-ment throughout the duration of the class. For example, ina class that is lecture-based, observers would likely markthe student code “L: Listening” for the entire time. In acase such as this, the observer opinion is defined as a con-stant rather than a variable, which interferes with the IRRcalculation.
The equation for the Jaccard coefficient is T = nc/(na + nb
− nc), where nc = the number of 2-min increments that aremarked the same (either checked or not checked) for both ob-servers, na = the number of 2-min increments that are markedthe same for both observers plus 2-min increments observer 1marked that observer 2 did not, nb = number of 2-min incre-ments that are marked the same for both observers plus 2-minincrements observer 2 marked that observer 1 did not. For ex-ample, for the data in Figure 2B, the class period is 42 min inlength, so there are 21 possible 2-min segments. The studentcode “Ind: Individual thinking” was marked 12 times by ob-servers 1 and 2, not marked eight times by both observers,and marked by observer 2 one time when observer 1 did not.Therefore, the calculation is: 20/(20 + 21 − 20) = 0.95. Num-bers closer to 1 indicate greater consistency between how thetwo observers coded the class.
Eighty-nine percent of the similarity scores are greater than0.90, and the lowest is 0.80. These values indicate strong sim-ilarity between how two observers use each code. The lowestscore for both the UBC and UMaine observers was for the in-structor code “PQ: Posing nonclicker questions.” Commentsfrom observers suggest that, when instructors were followingup/giving feedback on clicker questions or activities, they of-ten posed questions to the students. Observers checked theinstructor code “FUp: Follow-up” to describe this behaviorbut stated they occasionally forgot to also select the instructorcode “PQ.”
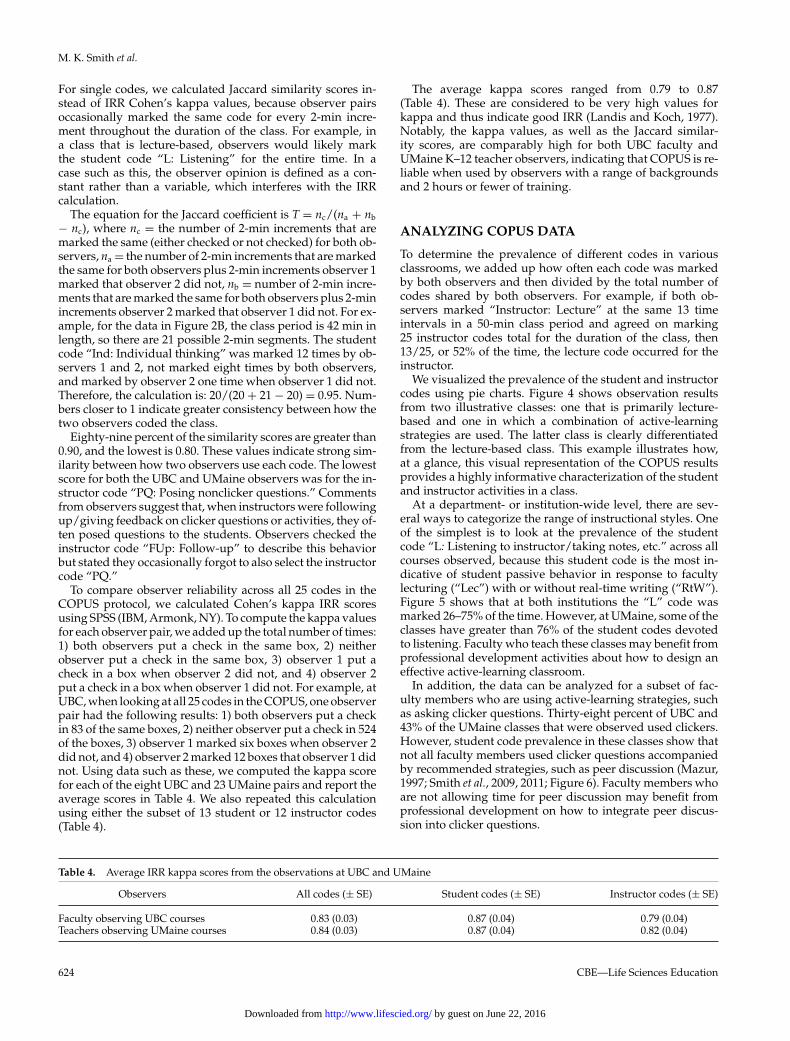
To compare observer reliability across all 25 codes in theCOPUS protocol, we calculated Cohen’s kappa IRR scoresusing SPSS (IBM, Armonk, NY). To compute the kappa valuesfor each observer pair, we added up the total number of times:1) both observers put a check in the same box, 2) neitherobserver put a check in the same box, 3) observer 1 put acheck in a box when observer 2 did not, and 4) observer 2put a check in a box when observer 1 did not. For example, atUBC, when looking at all 25 codes in the COPUS, one observerpair had the following results: 1) both observers put a checkin 83 of the same boxes, 2) neither observer put a check in 524of the boxes, 3) observer 1 marked six boxes when observer 2did not, and 4) observer 2 marked 12 boxes that observer 1 didnot. Using data such as these, we computed the kappa scorefor each of the eight UBC and 23 UMaine pairs and report theaverage scores in Table 4. We also repeated this calculationusing either the subset of 13 student or 12 instructor codes(Table 4).
The average kappa scores ranged from 0.79 to 0.87(Table 4). These are considered to be very high values forkappa and thus indicate good IRR (Landis and Koch, 1977).Notably, the kappa values, as well as the Jaccard similar-ity scores, are comparably high for both UBC faculty andUMaine K–12 teacher observers, indicating that COPUS is re-liable when used by observers with a range of backgroundsand 2 hours or fewer of training.
ANALYZING COPUS DATA
To determine the prevalence of different codes in variousclassrooms, we added up how often each code was markedby both observers and then divided by the total number ofcodes shared by both observers. For example, if both ob-servers marked “Instructor: Lecture” at the same 13 timeintervals in a 50-min class period and agreed on marking25 instructor codes total for the duration of the class, then13/25, or 52% of the time, the lecture code occurred for theinstructor.
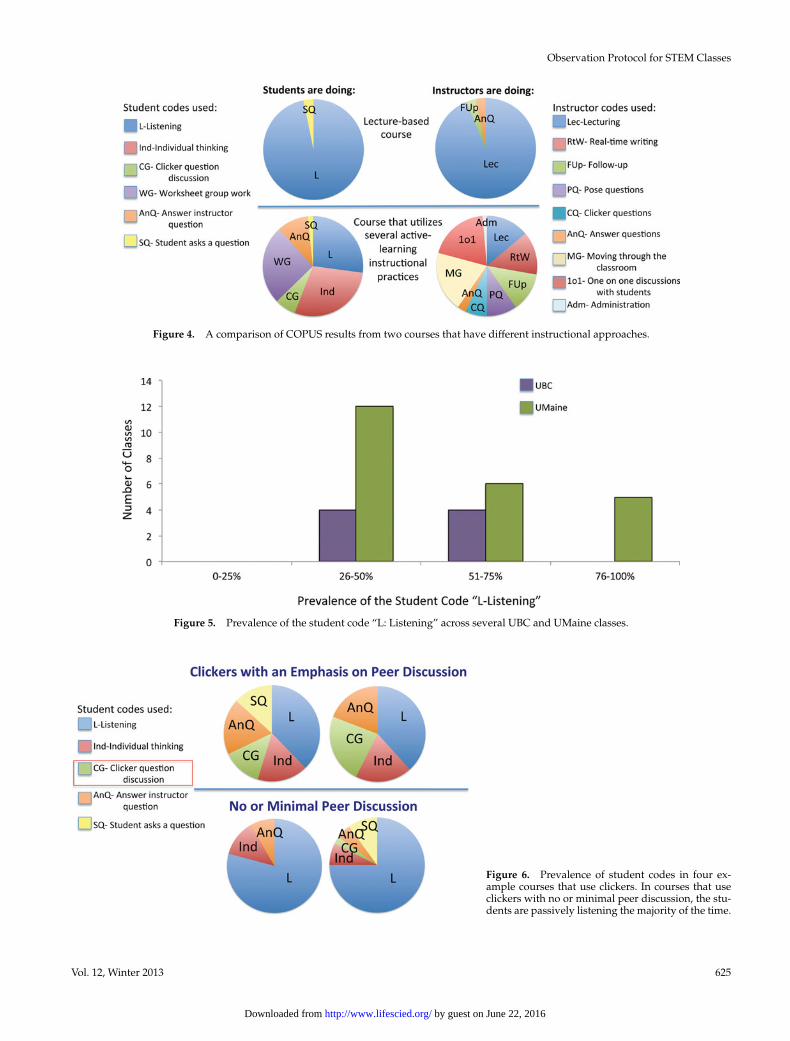
We visualized the prevalence of the student and instructorcodes using pie charts. Figure 4 shows observation resultsfrom two illustrative classes: one that is primarily lecture-based and one in which a combination of active-learningstrategies are used. The latter class is clearly differentiatedfrom the lecture-based class. This example illustrates how,at a glance, this visual representation of the COPUS resultsprovides a highly informative characterization of the studentand instructor activities in a class.
At a department- or institution-wide level, there are sev-eral ways to categorize the range of instructional styles. Oneof the simplest is to look at the prevalence of the studentcode “L: Listening to instructor/taking notes, etc.” across allcourses observed, because this student code is the most in-dicative of student passive behavior in response to facultylecturing (“Lec”) with or without real-time writing (“RtW”).Figure 5 shows that at both institutions the “L” code wasmarked 26–75% of the time. However, at UMaine, some of theclasses have greater than 76% of the student codes devotedto listening. Faculty who teach these classes may benefit fromprofessional development activities about how to design aneffective active-learning classroom.
In addition, the data can be analyzed for a subset of fac-ulty members who are using active-learning strategies, suchas asking clicker questions. Thirty-eight percent of UBC and43% of the UMaine classes that were observed used clickers.However, student code prevalence in these classes show thatnot all faculty members used clicker questions accompaniedby recommended strategies, such as peer discussion (Mazur,1997; Smith et al., 2009, 2011; Figure 6). Faculty members whoare not allowing time for peer discussion may benefit fromprofessional development on how to integrate peer discus-sion into clicker questions.
Table 4. Average IRR kappa scores from the observations at UBC and UMaine
Observers All codes (± SE) Student codes (± SE) Instructor codes (± SE)
Faculty observing UBC courses 0.83 (0.03) 0.87 (0.04) 0.79 (0.04)Teachers observing UMaine courses 0.84 (0.03) 0.87 (0.04) 0.82 (0.04)
624 CBE—Life Sciences Education
by guest on June 22, 2016http://www.lifescied.org/Downloaded from
Observation Protocol for STEM Classes
Figure 4. A comparison of COPUS results from two courses that have different instructional approaches.
Figure 5. Prevalence of the student code “L: Listening” across several UBC and UMaine classes.
Figure 6. Prevalence of student codes in four ex-ample courses that use clickers. In courses that useclickers with no or minimal peer discussion, the stu-dents are passively listening the majority of the time.
Vol. 12, Winter 2013 625
by guest on June 22, 2016http://www.lifescied.org/Downloaded from
M. K. Smith et al.
DISCUSSION AND SUMMARY
COPUS was developed because university observation pro-grams needed a protocol to: 1) characterize the general stateof teaching, 2) provide feedback to instructors who desired in-formation about how they and their students were spendingclass time, and 3) identify faculty professional developmentneeds. COPUS meets all of these goals by allowing observerswith little observation protocol training and experience to re-liably characterize what both faculty and students are doingin a classroom.
There are several uses for COPUS data. On an individuallevel, faculty members can receive pie charts with their codeprevalence results (examples in Figure 4). These results pro-vide a nonthreatening way to help faculty members evaluatehow they are spending their time. We discovered that fac-ulty members often did not have a good sense of how muchtime they spent on different activities during class, and foundCOPUS data helpful.
In addition, faculty members can use COPUS data in theirtenure and promotion documents to supplement their normaldocumentation, which typically includes student evaluationinformation and a written description of classroom practices.Having observation data gives faculty members substantiallymore information to report about their use of active-learningstrategies than is usually the case.
COPUS data can also be used to develop targeted pro-fessional development. For example, anonymized, aggregateCOPUS data across all departments have been shared withthe UMaine Center for Excellence in Teaching and Assess-ment, so workshops and extended mentoring opportunitiescan better target the needs of the faculty. One area in particularthat will be addressed in an upcoming professional develop-ment workshop is using clickers in a way that promotes peerdiscussion. The idea for this workshop came about as a resultof the COPUS evidence showing the prevalence of UMaineSTEM classes that were using clickers but allowing no orminimal time for recommended student peer discussions(Figure 6).
Other planned uses for COPUS include carrying out sys-tematic observations of all instructors in a department at UBCin order to characterize teaching practices. The informationwill be used with other measures to characterize current us-age of research-based instructional practices across the de-partment’s courses and curriculum.
In the end, the choice of observation protocol and strategywill depend on the needs of each unique situation. COPUS iseasy to learn, characterizes nonjudgmentally what instructorsand students are doing during a class, and provides datathat can be useful for a wide range of applications, fromimproving an individual’s teaching or a course to comparingpractices longitudinally or across courses, departments, andinstitutions.
ACKNOWLEDGMENTS
This work was supported at UBC through the Carl Wieman ScienceEducation Initiative and by the National Science Foundation undergrant #0962805. We are grateful for the assistance of all of the UBCSESs who contributed to the development of the survey; Lisa McDon-nell and Bridgette Clarkston for running the UBC training session;MacKenzie Stetzer, Susan McKay, Erika Allison, Medea Steinman,
and Joanna Meyer for helping to run the UMaine training session;Jeremy Smith for developing scripts to parse and analyze the data;the Maine K–12 teachers and UBC faculty volunteers who served asobservers; and the faculty at UBC and UMaine who allowed theircourses to be observed.
Approval to observe classrooms and instruction at UBC and pub-lish results of that work is provided to the Carl Wieman ScienceEducation Initiative by the University of British Columbia underthe policy on institutional research. Approval to evaluate teacherobservations of classrooms (exempt status, protocol no. 2013-02-06)was granted by the Institutional Review Board at the University ofMaine.
REFERENCES
American Association for the Advancement of Science (2010). Visionand Change: A Call to Action, Washington, DC.
Association of American Universities (2011). Five-Year Initiativefor Improving Undergraduate STEM Education, AAU, Washington,DC. www.aau.edu/WorkArea/DownloadAsset.aspx?id=14357 (ac-cessed 7 August 2013).
Blanchard MR, Southerland SA, Osborne JW, Sampson VD, AnnettaLA, Granger EM (2010). Is inquiry possible in light of accountability?A quantitative comparison of the relative effectiveness of guidedinquiry and verification laboratory instruction. Sci Educ 94, 577–616.
Bloom B, Engelhart MD, Furst EJ, Hill WH, Krathwohl DR (1956).Taxonomy of Educational Objectives: The Classification of Educa-tional Goals, Handbook I: Cognitive Domain, New York: DavidMcKay.
Classroom Observation Project (2011). Classroom ObservationProject: Understanding and Improving Our Teaching Usingthe Reformed Teaching Observation Protocol (RTOP). http://serc.carleton.edu/NAGTWorkshops/certop/about.html (accessed 7August 2013).
CWSEI Teaching Practices Survey (2013). http://www.cwsei.ubc.ca/resources/TeachPracticeSurvey.htm (accessed 29 October 2013).
Ebert-May D, Derting TL, Hodder J, Momsen JL, Long TM, JardelezaSE (2011). What we say is not what we do: effective evaluation offaculty professional development programs. BioSci 61, 550–558.
Henderson C, Beach A, Finkelstein N (2011). Facilitating change inundergraduate STEM instructional practices: an analytic review ofthe literature. J Res Sci Teach 48, 952–984.
Hora MT, Oleson A, Ferrare JJ (2013). Teaching DimensionsObservation Protocol (TDOP) User’s Manual, Madison: Wiscon-sin Center for Education Research, University of Wisconsin–Madison. http://tdop.wceruw.org/Document/TDOP-Users-Guide.pdf (accessed 7 August 2013).
Jaccard P (1901). Etude comparative de la distribution florale dansune portion des Alpes et des Jura. Bull de la Societe Vaudoise des SciNat 37, 547–579.
Knight JK, Wood WB (2005). Teaching more by lecturing less. CellBiol Educ 4, 298–310.
Landis JR, Koch GG (1977). The measurement of observer agreementfor categorical data. Biometrics 33, 159–174.
Lemons PP, Lemons JD (2012). Questions for assessing higher-ordercognitive skills: it’s not just Bloom’s. CBE Life Sci Educ 12, 47–58.
Mazur E (1997). Peer Instruction, Upper Saddle River, NJ: PrenticeHall.
Michael J (2006). Where’s the evidence that active learning works?Adv Physiol Educ 30, 159–167.
Millis B (1992). Conducting effective peer classroom observations.http://digitalcommons.unl.edu/cgi/viewcontent.cgi?article=1249&context=podimproveacad (accessed 28 October 2013).
626 CBE—Life Sciences Education
by guest on June 22, 2016http://www.lifescied.org/Downloaded from
Observation Protocol for STEM Classes
President’s Council of Advisors on Science and Technology (2012).Report to the President: Engage to Excel: Producing One Mil-lion Additional College Graduates with Degrees in Science, Tech-nology, Engineering, and Mathematics, Washington, DC: Execu-tive Office of the President. www.whitehouse.gov/sites/default/files/microsites/ostp/pcast-engage-to-excel-v11.pdf (accessed 7August 2013).
Prince M (2004). Does active learning work? A review of the research.J Eng Educ 93, 223–231.
Sawada D, Piburn MD, Judson E, Turley J, Falconer K, Benford R,Bloom I (2002). Measuring reform practices in science and math-ematics classrooms: the Reformed Teaching Observation Protocol.Sch Sci Math 102, 245–253.
Singer SR, Nielsen NR, Schweingruber HA (2012). Discipline-BasedEducation Research: Understanding and Improving Learning in Un-dergraduate Science and Engineering, Washington, DC: NationalAcademies Press.
Smith MK, Wood WB, Adams WK, Wieman C, Knight JK, Guild N,Su TT (2009). Why peer discussion improves student performanceon in-class concept questions. Science 323, 122–124.
Smith MK, Wood WB, Krauter K, Knight JK (2011). Combining peerdiscussion with instructor explanation increases student learningfrom in-class concept questions. CBE Life Sci Educ 10, 55–63.
Weiss IR, Pasley JD, Smith PS, Banilower ER, Heck DJ (2003).Looking Inside the Classroom: A Study of K–12 Mathematics andScience Education in the United States, Chapel Hill, NC: HorizonResearch.
West EA, Paul CA, Webb D, Potter WH (2013). Variation of instructor-student interactions in an introductory interactive physics course.Phys Rev ST Phys Educ Res 9, 010109.
Wieman C, Perkins K, Gilbert S (2010). Transforming science educa-tion at large research universities: a case study in progress. Change42, 7–14.
Vol. 12, Winter 2013 627
by guest on June 22, 2016http://www.lifescied.org/Downloaded from