The Chemical Table: An Open Dialog between Visualization ...
31
The Chemical Table: An Open Dialog between Visualization and Design Francis T. Marchese Department of Computer Science Pace University New York, NY 10038 http://csis.pace.edu/~marchese [email protected]
-
Upload
khangminh22 -
Category
Documents
-
view
2 -
download
0
Transcript of The Chemical Table: An Open Dialog between Visualization ...

The Chemical Table: An Open Dialog between Visualization and Design
Francis T. Marchese Department of Computer Science Pace University New York, NY 10038
http://csis.pace.edu/[email protected]
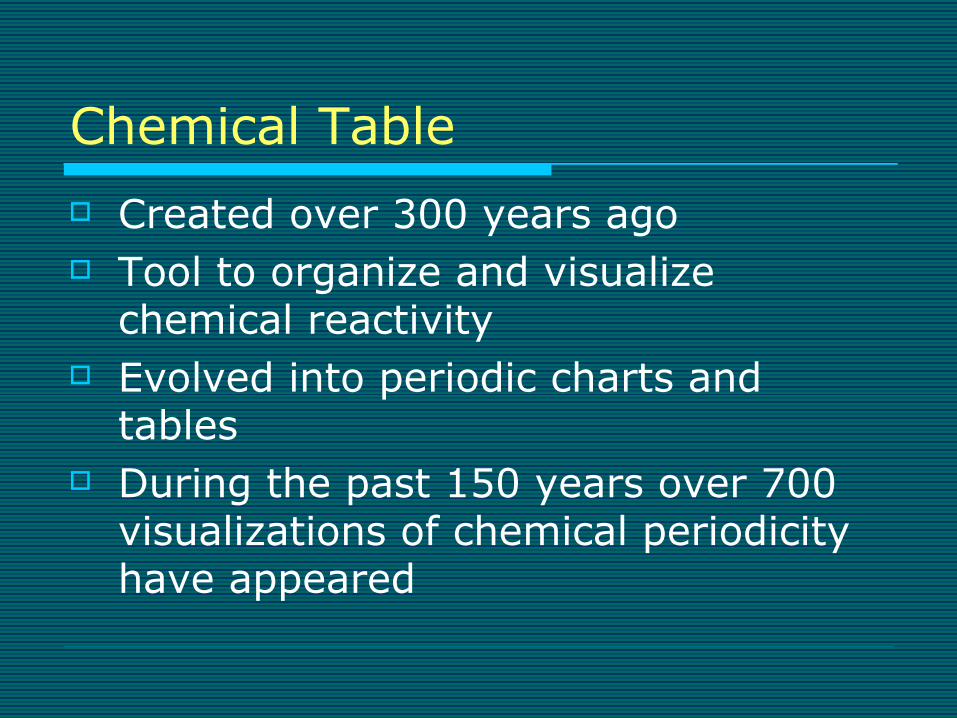
Chemical Table Created over 300 years ago Tool to organize and visualize
chemical reactivity Evolved into periodic charts and
tables During the past 150 years over 700
visualizations of chemical periodicity have appeared
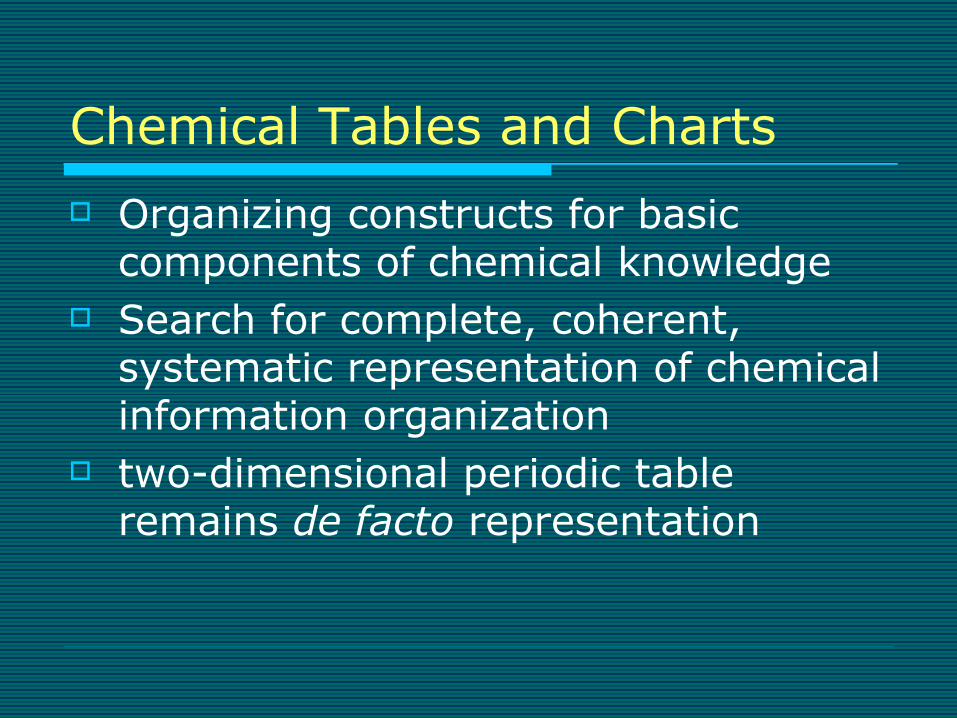
Chemical Tables and Charts Organizing constructs for basic
components of chemical knowledge Search for complete, coherent,
systematic representation of chemical information organization
two-dimensional periodic table remains de facto representation

Chemical Tables and Charts Contents: chemical information
e.g. atomic weights, ionization potentials, oxidation states, reaction rates, melting points, crystal structures
Physically measurable quantities But have neither intrinsic nor causal
geometric correlations Must be considered a visualization of
abstract data organized on a conceptual substrate such as a xy grid.
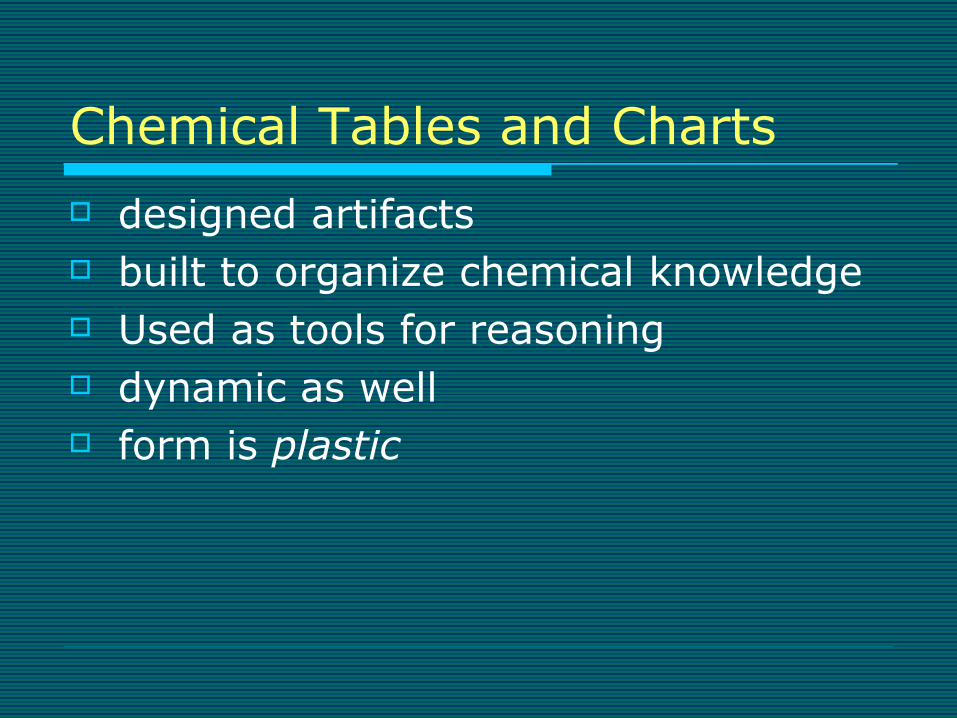
Chemical Tables and Charts designed artifacts built to organize chemical knowledge Used as tools for reasoning dynamic as well form is plastic
Purpose of Talk Review the chemical table from an
historical perspective as a designed tool for information visualization
Argue why the 2D Periodic Table is the de facto representation of chemical information

Representations Tables Charts Physical Models
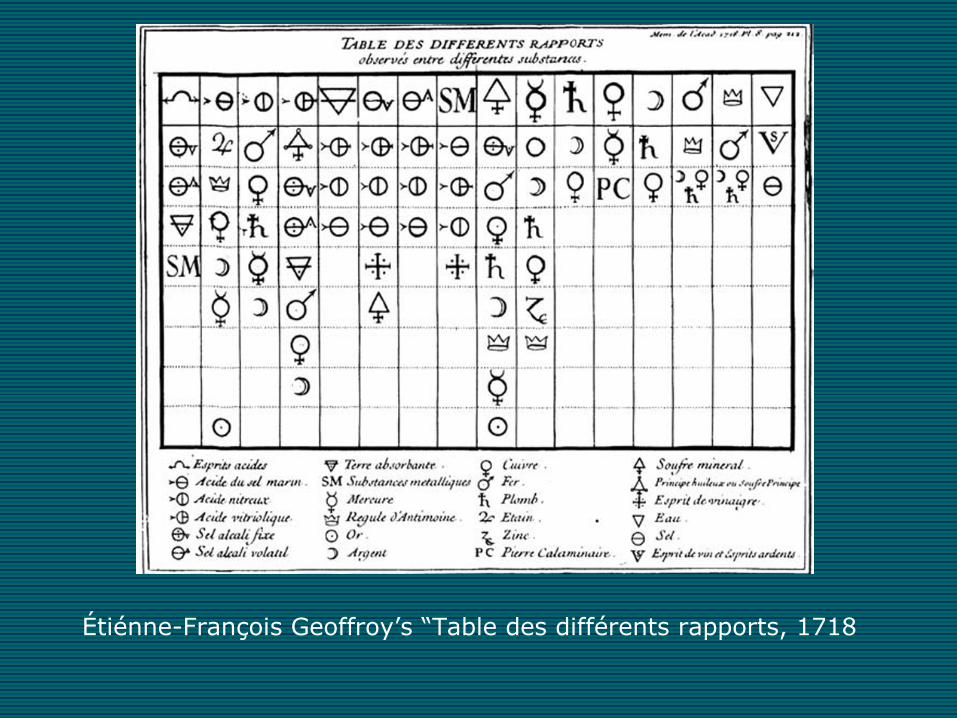
Étiénne-François Geoffroy’s “Table des différents rapports, 1718
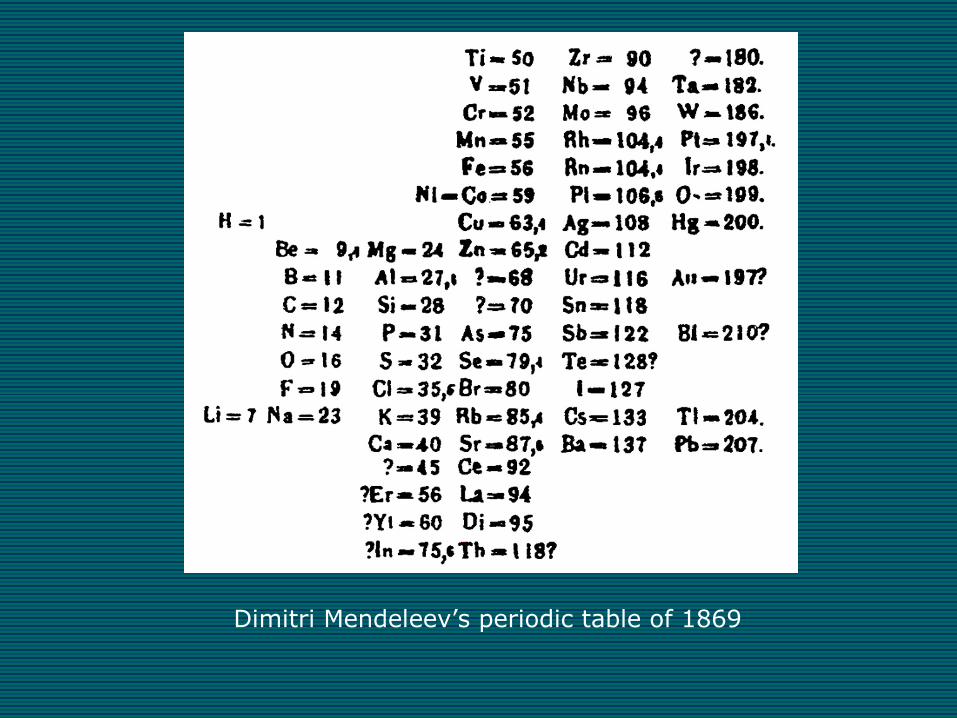
Dimitri Mendeleev’s periodic table of 1869
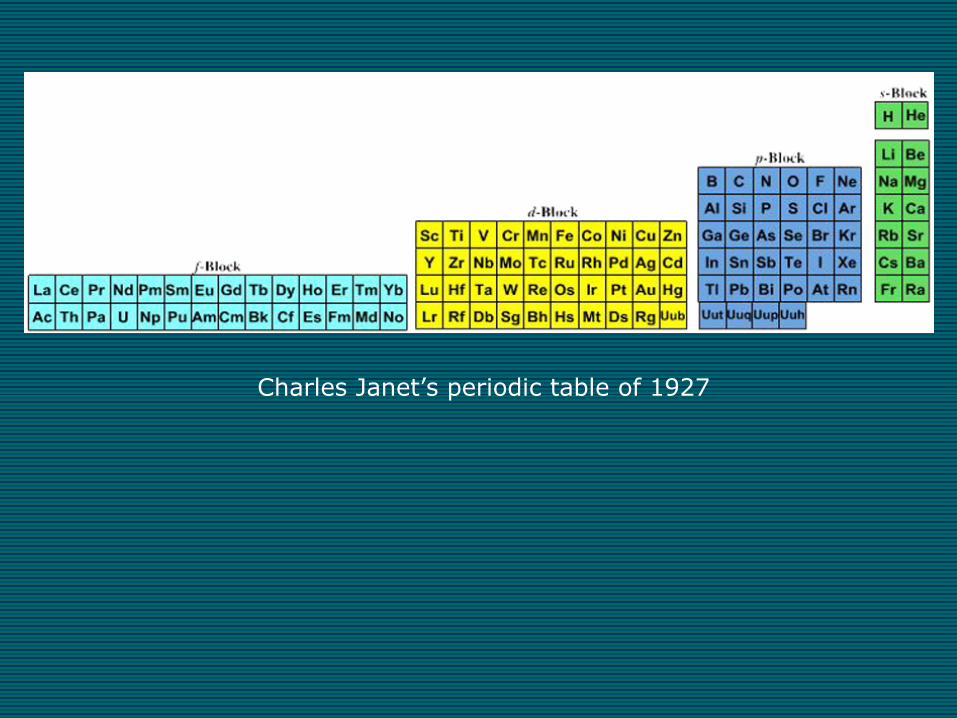
Charles Janet’s periodic table of 1927
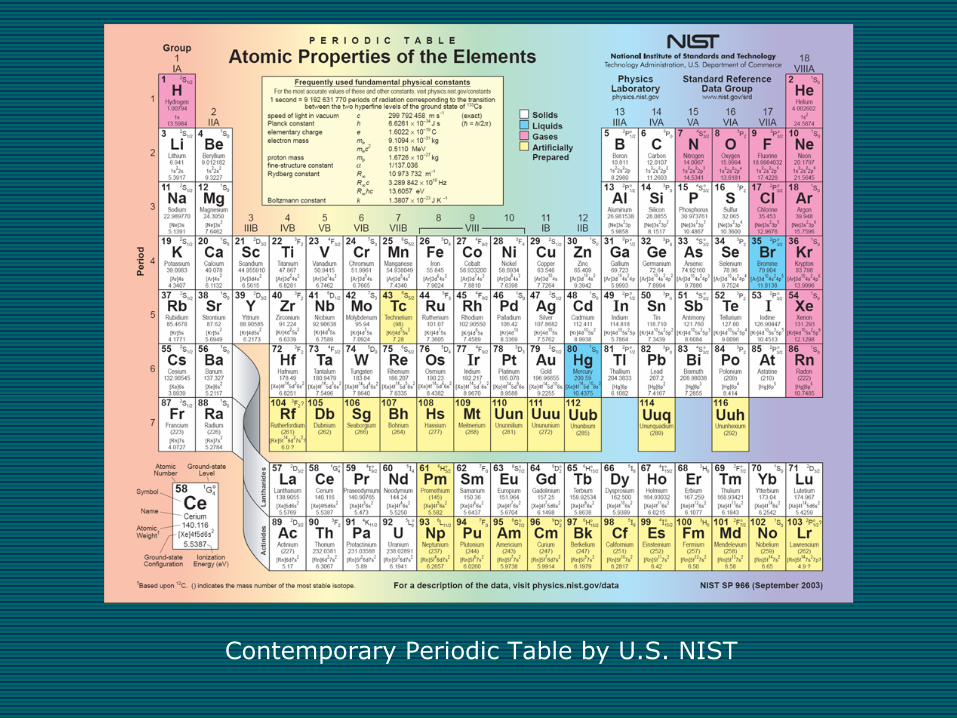
Contemporary Periodic Table by U.S. NIST

Bayley-Thomsen-Bohr Periodic Table of 1882, 1895, 1922, & 1989
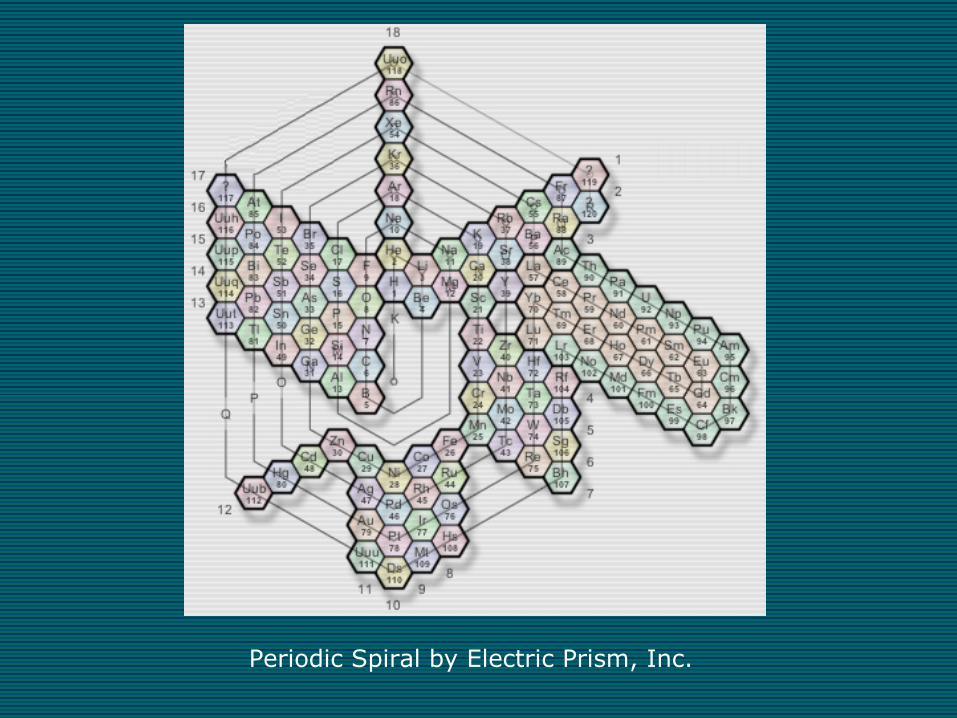
Periodic Spiral by Electric Prism, Inc.
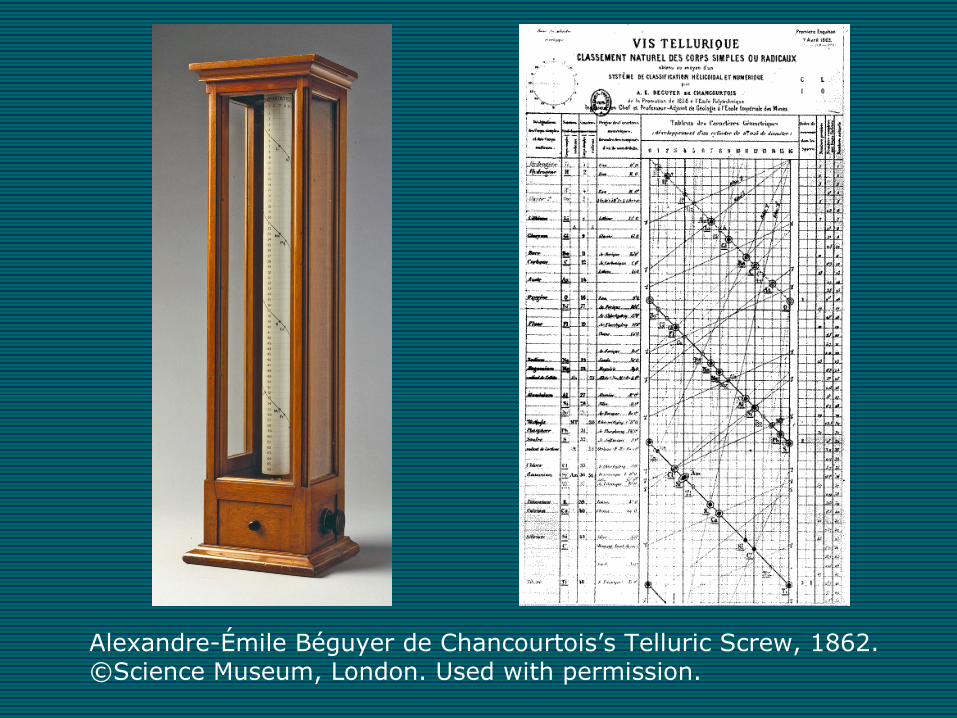
Alexandre-Émile Béguyer de Chancourtois’s Telluric Screw, 1862. ©Science Museum, London. Used with permission.
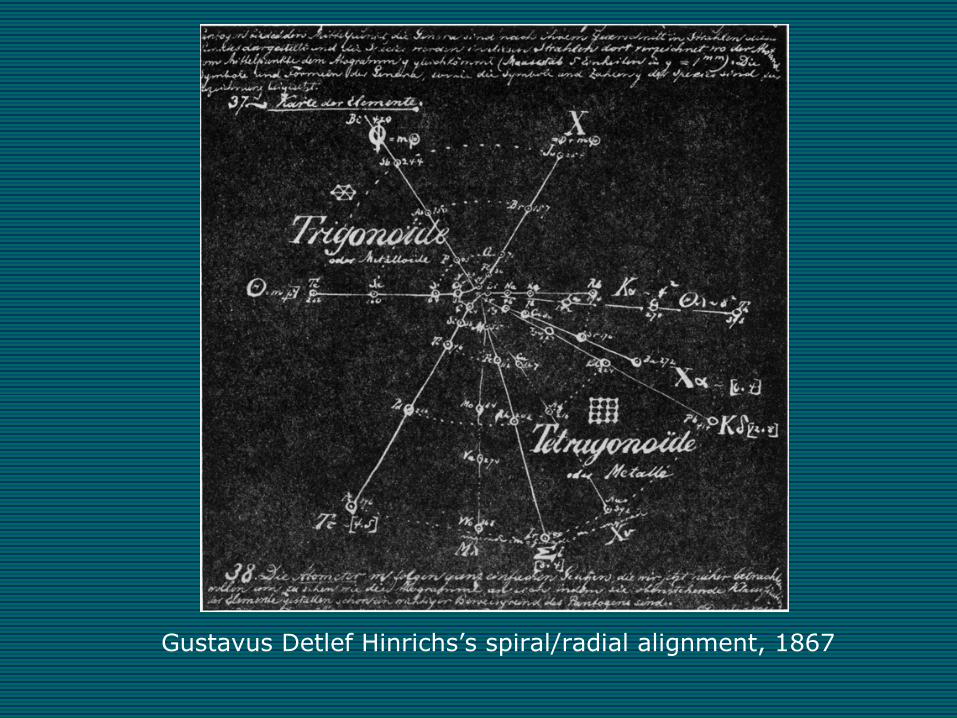
Gustavus Detlef Hinrichs’s spiral/radial alignment, 1867
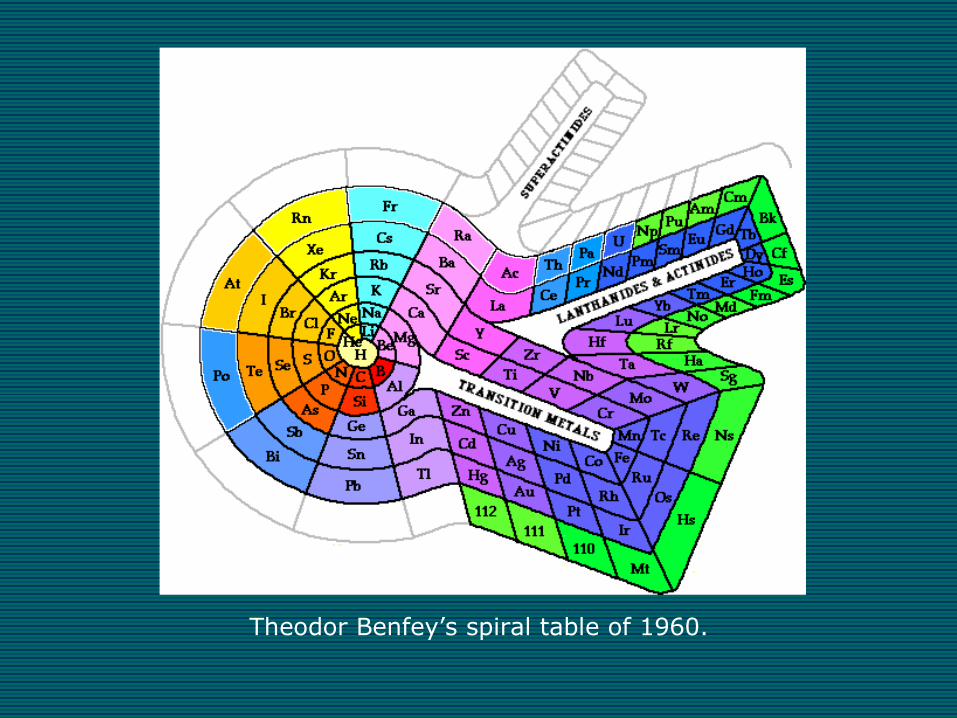
Theodor Benfey’s spiral table of 1960.
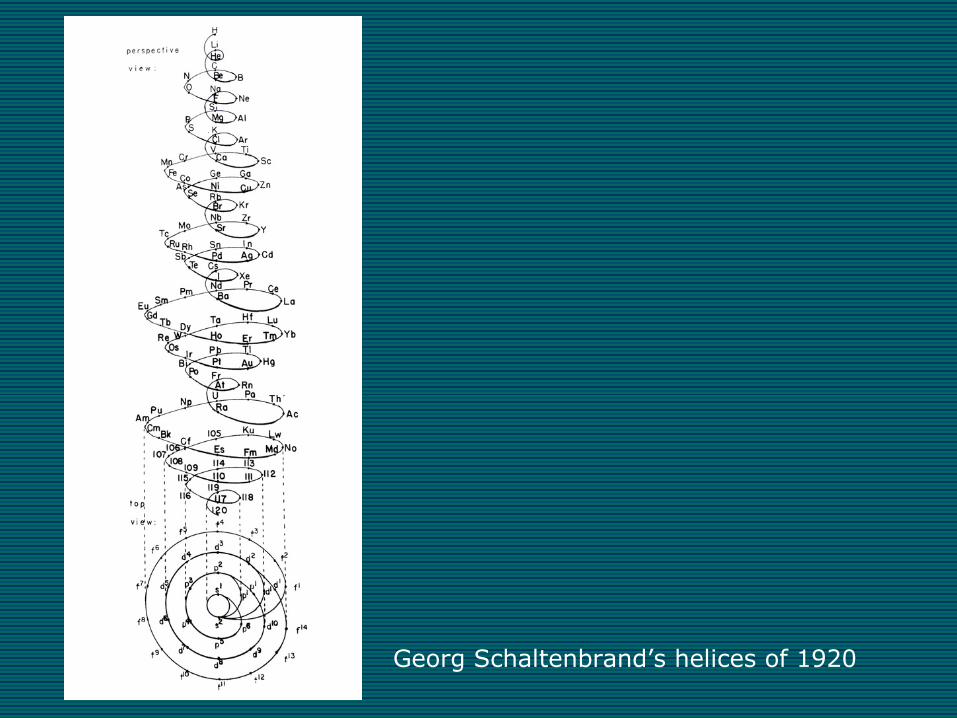
Georg Schaltenbrand’s helices of 1920

William Crooke’s pretzel model of 1888. ©Science Museum, London. Used with permission.
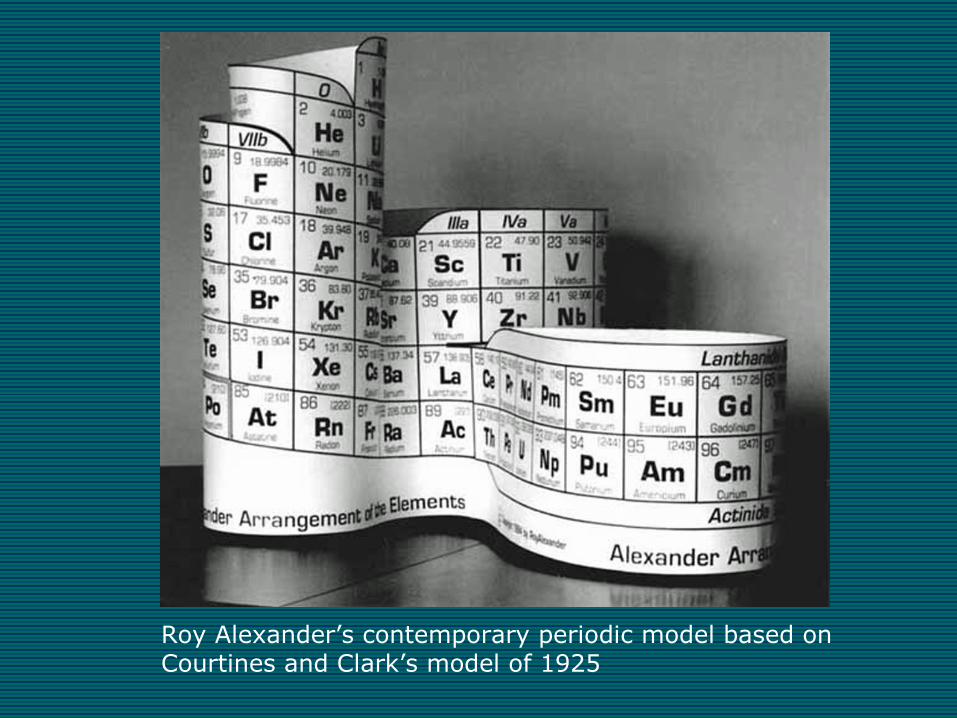
Roy Alexander’s contemporary periodic model based on Courtines and Clark’s model of 1925
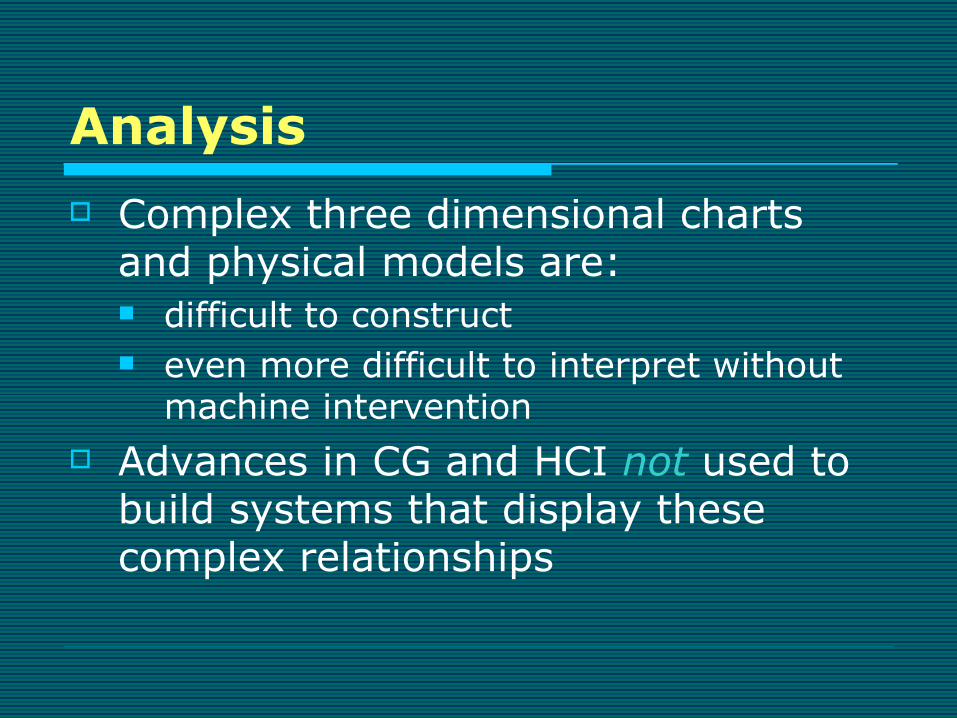
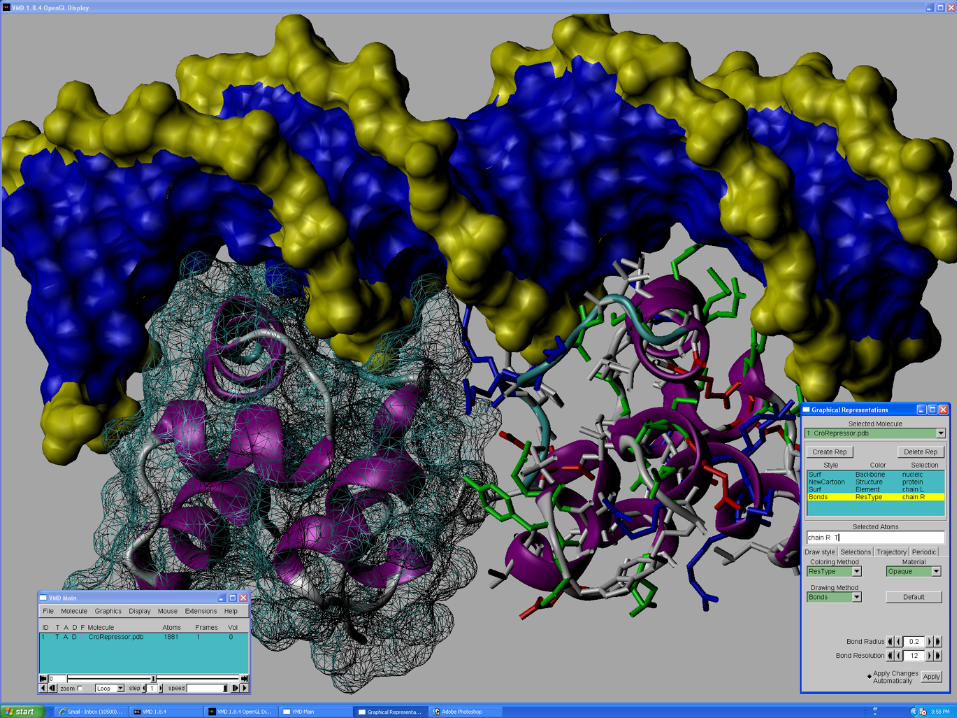
Analysis Complex three dimensional charts
and physical models are: difficult to construct even more difficult to interpret without
machine intervention Advances in CG and HCI not used to
build systems that display these complex relationships


Tables important data visualization tool first stage in information visualization
pipeline compactly organized structure facilitates understanding of
relationships among different data
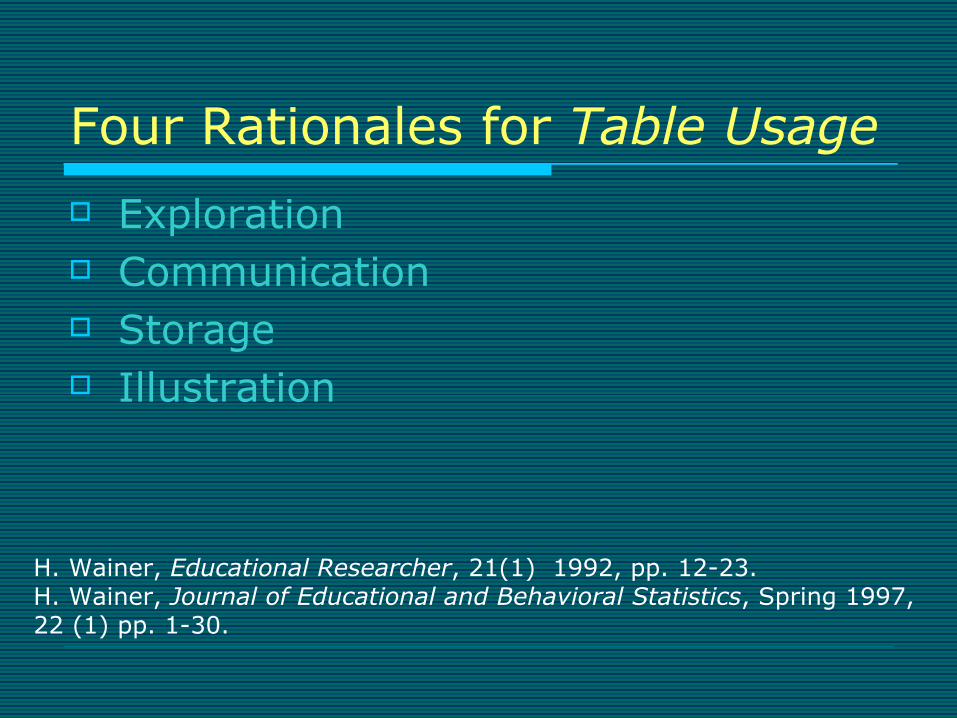
Four Rationales for Table Usage Exploration Communication Storage Illustration
H. Wainer, Educational Researcher, 21(1) 1992, pp. 12-23. H. Wainer, Journal of Educational and Behavioral Statistics, Spring 1997, 22 (1) pp. 1-30.

Analysis of Geoffroy's Table Usage Table explored
Used to find best reaction to solve laboratory separation problems
Communication medium translated chemical narrative of reaction
selection into understandable graphic form Open-ended storage medium
contained a history of chemical practice that could be appended to over time
an illustration serving the greater narrative of chemical synthesis acted as a focal point for analysis and discourse
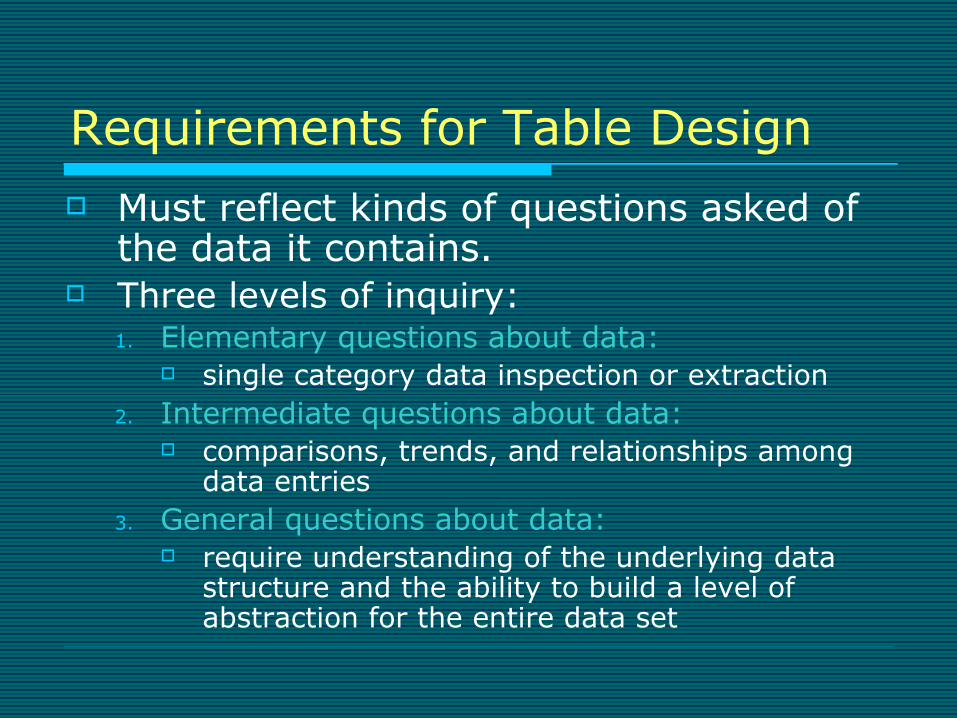
Must reflect kinds of questions asked of the data it contains.
Three levels of inquiry:1. Elementary questions about data:
single category data inspection or extraction2. Intermediate questions about data:
comparisons, trends, and relationships among data entries
3. General questions about data: require understanding of the underlying data
structure and the ability to build a level of abstraction for the entire data set
Requirements for Table Design

Analysis of Modern Table Design Single category data inspection :
each location is a box, a container that displays atomic data.
Comparisons and relationships : Designed to organize chemical
information so that relationships among chemical properties may be exposed
Understanding of the data structure : chemical table continued design and
redesign

Requirements for Tool Design Direct access to data Accurate encoding of information Easy integration into work practice Short learning curve
Further requirements for Hypermedia Tables
Ability to display meaningful patterns trends, and exceptions
Use of visualization best practices Dynamic linking of table contents to
supporting chemical documentation and narrative
Summary & Conclusions Explored the historical development of the
chemical table as a tool designed for chemical information visualization
Shown why the design of the two-dimensional periodic table remains the de facto standard for chemical information display
Periodic Table is dynamic and continues to evolve

Thank you !
Suzanne Caporael, Periodic Table of the Elements, 1995. 112 books, oil on linen, muslin, 78” x 192”