Are water vole resistant to anticoagulant rodenticides following field treatments

This article has been accepted for publication and undergone full peer review but has not been through the copyediting,
typesetting, pagination and proofreading process, which may lead to differences between this version and the Version of
Record. Please cite this article as doi: 10.1111/evo.12476.
This article is protected by copyright. All rights reserved. 1
The changing pace of insular life: 5000 years of microevolution in the Orkney vole
(Microtus arvalis orcadensis)
Running title: 5000 years of insular evolution in the Orkney vole
Thomas Cucchi1,2
, Ross Barnett3, Natália Martínková
4,5, Sabrina Renaud
6, Elodie Renvoisé
7,
Allowen Evin2,1
, Alison Sheridan8, Ingrid Mainland
9, Caroline Wickham-Jones
2, Christelle
Tougard10
, Jean Pierre Quéré11
, Michel Pascal12†
, Marine Pascal12
, Gerald Heckel13,14
, Paul
O’Higgins15
, Jeremy B. Searle16
, Keith M. Dobney2
† deceased
1 CNRS-Muséum National d’Histoire Naturelle, UMR 7209, Archéoozoologie, histoire des
sociétés humaines et de peuplements animaux, 55 rue Buffon, 75005 Paris, France
2 Department of Archaeology, University of Aberdeen, St. Mary’s Building, Elphinstone
Road, United Kingdom
3 Durham Evolution and Ancient DNA, Department of Archaeology, Durham University,
South Road, Durham DH1 3LE, United Kingdom
4 Institute of Vertebrate Biology, Academy of Sciences of the Czech Republic, v.v.i., Květná
8, 60365 Brno, Czech Republic
5 Institute of Biostatistics and Analyses, Masaryk University, Kamenice 3, 62500 Brno,
Czech Republic
6 Laboratoire de Biométrie et Biologie Evolutive, UMR 5558, CNRS, Université Lyon 1,
69622, Villeurbanne, France
7 Institute of Biotechnology, University of Helsinki, P.O. Box 56 (Viikinkaari 9), FIN-00014
Helsinki, Finland
8 National Museums Scotland, Chambers Street, Edinburgh EH1 1JF, United Kingdom
9 Dept. of Archaeology, University of the Highlands and Islands, Orkney College, Kirkwall,
Orkney, KW15 1LX, United Kingdom
This article is protected by copyright. All rights reserved. 2
10Institut des Sciences de l'Evolution de Montpellier, UMR CNRS 5554 and UMR IRD 226,
Université Montpellier II, Place Eugène Bataillon, CC065, 34095 Montpellier cedex 05,
France
11 UMR CBGP (Inra/Ird/Cirad /Montpellier SupAgro), INRA, Campus international de
Baillarguet, CS 30016, F-34988 Montferrier-sur-Lez cedex, France
12 INRA, UMR 0985 EIB, Campus de Beaulieu F-35000 Rennes Cedex, France
13 Computational and Molecular Population Genetics (CMPG), Institute of Ecology and
Evolution, University of Bern, CH 3012 Bern, Switzerland
14 Swiss Institute of Bioinformatics, Genopode, CH 1015 Lausanne, Switzerland
15 Centre for Anatomical and Human Sciences. Hull York Medical School, The University of
York, Heslington, York YO10 5DD, United Kingdom
16 Department of Ecology and Evolutionary Biology, Corson Hall, Cornell University, Ithaca,
NY 14853-2701
ABSTRACT
Island evolution may be expected to involve fast initial morphological divergence followed
by stasis. We tested this model using the dental phenotype of modern and ancient common
voles (Microtus arvalis), introduced onto the Orkney archipelago (Scotland) from continental
Europe some 5000 years ago. First, we investigated phenotypic divergence of Orkney and
continental European populations and assessed climatic influences. Second, phenotypic
differentiation amongst Orkney populations was tested against geography, time and neutral
genetic patterns. Finally, we examined evolutionary change along a time series for the
Orkney Mainland. Molar gigantism and anterior lobe hypertrophy evolved rapidly in Orkney
voles following introduction, without any transitional forms detected. Founder events and
adaptation appear to explain this initial rapid evolution. Idiosyncrasy in dental features
among different island populations of Orkney voles is also likely the result of local founder
events following Neolithic translocation around the archipelago. However, against our initial
expectations, a second marked phenotypic shift occurred between the 4th
and 12th
centuries

This article is protected by copyright. All rights reserved. 3
AD, associated with increased pastoral farming and introduction of competitors (mice and
rats) and terrestrial predators (foxes and cats). These results indicate that human agency can
generate a more complex pattern of morphological evolution than might be expected in island
rodents.
Keywords
Island evolution, geometric morphometrics, tooth shape, zooarchaeology, dispersal,
evolutionary rate
INTRODUCTION
Alien species on islands, whether they arrive with humans or by natural dispersal
(Williamson 1981), can show rapid changes, where evolutionary and ecological processes
overlap (Lambrinos 2004; Bradshaw and Holzapfel 2006; Kinnison and Hairston 2007). Both
founder events and adaptation to specific insular conditions should promote rapid initial
divergence, with subsequent stasis once the population reaches a demographic equilibrium
and its local ecological optimum (Sondaar 2000; Millien 2006; Nagorsen and Cardini 2009).
However, many islands suffer human-induced disturbances (destruction of habitat,
introduction of species) that may also promote rapid phenotypic changes (Palumbi 2001;
Price et al. 2003; Pigliucci et al. 2006; Ghalambor et al. 2007; Carrol et al. 2007; Hendry et
al. 2008). In Europe the bioarchaeological record reveals that island systems were subjected
to substantial anthropogenic disturbance through the early to mid Holocene, when the first
(Neolithic) farmers spread across Eurasia (Cherry 1990, Blondel and Vigne 1993, Schüle
1993, Vigne 1999). A phenotypic stasis for introduced animals in these insular contexts is,

This article is protected by copyright. All rights reserved. 4
therefore, unlikely. Instead, many phenotypic changes should be expected in order to
maintain fitness in a dynamic environment where directions of selection driven by human
activities fluctuated.
Testing these ideas requires documenting phenotypic change through time. However,
most studies of phenotypic evolution following island colonization make inferences solely
from present day populations (e.g. Clegg et al. 2008) or on the basis of laboratory (e.g.
Templeton 1996) or field experiments (e.g. Losos et al. 1997). In their study of natural
colonization, it is notable that Nargosen and Cardini (2009) did compare 30 sub-fossil
specimens of an endemic insular marmot (Marmota vancouverensis) with its extant insular
and continental relatives. They found that most of the divergence occurred soon after the
island became isolated during the Pleistocene (with subsequent morphological stasis
continuing to the present day), supporting the ecological “optimum model.” However, this
model remains largely untested in situations where human introduction and human impact to
the environment thereafter occurs, a fact largely due to the lack of continuous sub-fossil
records documenting each step of insular evolution.
In this paper, our objective is to examine morphological change through time in
populations of the Orkney vole, Microtus arvalis orcadensis (Major 1905) - an endemic
subspecies of the common vole Microtus arvalis (Pallas 1778) - introduced to the Orkney
archipelago (Figure 1) by Neolithic farmers around 5000 years ago, from a source outside the
British Isles (Martínková et al. 2013). Large samples of archaeological Orkney voles, as well
as good palaeo-environmental records revealing anthropization of the Orkney archipelago
(Bunting 1994, 1996), provided an important opportunity to investigate the pace of
evolutionary change in this insular rodent over the last 5000 years, within the context of an
island environment impacted by humans.

This article is protected by copyright. All rights reserved. 5
Present-day Orkney voles are morphologically characterized by a large body size -
twice that of their continental European cousins - and differing in many other skeletal traits
and pelage (Berry 1996). Considerable morphological diversity has been described amongst
the different island populations of the archipelago (Figure 1). For instance, those from islands
in the northern part of the archipelago (Westray and Sanday), show a darker pelage and a
molar morphology different to those from the main island (Mainland) and the South Isles
(Corbet 1964). Divergence within Orkney vole populations has been attributed to either
founding events (Berry 1996) or fast adaptive radiation (Corbet 1986). A recent study has
also revealed higher genetic diversity in Orkney voles from Mainland (compared to those of
the outer isles). These data suggest an initial introduction of voles to Mainland, from where
successive founding events occurred in other islands of the group through further human-
mediated dispersal (Martínková et al. 2013).
To investigate microevolution in Orkney voles through time, we used molar
morphology as a phenotypic marker. Vole teeth are the most abundant and diagnostic element
in the fossil and sub-fossil record and their complex form is evolutionary tractable (Guthrie
1965; Renvoisé et al. 2012). First we examined the extent of molar size and shape divergence
of Orkney voles from their continental counterparts and from other insular populations.
Increase in molar size (as a marker for body size increase) is expected in insular populations
of rodents according to the island rule (Foster 1964, Van Valen 1973), while niche widening
and reduction of predation and interspecific competition (together with founder events and
drift in small, isolated populations) may induce rapid molar shape change (Renaud et al.
2011, Renaud et al. 2013). To test the influence of climatic gradients (Piras et al. 2009,
McGuire 2010) on the phenotype of M. arvalis, we assessed how much molar size and shape
covaries with climate among populations from Western Europe - including Orkney (Figure
1).

This article is protected by copyright. All rights reserved. 6
We then investigated morphological divergence among Orkney populations since
their introduction. To test the expectation of greater divergence on more remote and smaller
islands (Renaud and Millien 2001, Millien 2011), we examined phenotypic variation in the
context of inter-island distances, as well as island areas. The suggestion of dispersal
throughout the archipelago from a source population on Mainland (Martínková et al. 2013)
was tested using the correlation between molar shape and geographic distances calculated
from Mainland. Further, the hypothesis of stochastic processes of divergence by e.g. founding
events and genetic drift (Berry 1996) was assessed by testing (1) the influence of the time
elapsed since introduction using radiocarbon age of the sample and (2) the covariance
between dental morphology and neutral molecular markers from the same modern and
ancient individuals from Orkney. A significant correlation between morphological and
neutral genetic variation is expected if random processes underlie phenotypic diversification
in Orkney voles since their introduction (Clegg et al. 2002).
Finally, because of the detailed archaeological record on Mainland Orkney, we were
able to examine the pace of evolutionary change in molar shape for a single island, along a
time series spanning the 5000 years since the introduction of M. arvalis onto the Orkney
archipelago.
MATERIAL AND METHODS
Modern and ancient samples
A total of 853 Microtus arvalis first lower molars (M1) were measured: 582 modern (Table 1)
and 271 ancient (Table 2). The modern dataset includes 378 specimens from across mainland
continental Europe, 73 specimens from three islands off the coast of France (Guernsey, Yeu
and Noirmoutier) and 131 M. arvalis orcadensis from seven Orkney islands (Figure 1). The

This article is protected by copyright. All rights reserved. 7
modern continental dataset cover several (previously identified) mitochondrial DNA
(mtDNA) haplogroups of M. arvalis (Table 1): the Western-North (WN), Western-South
(WS), Italian (IT), Eastern (EA) and Central (CE) clades (and the Orkney [OR] clade within
the WN clade), based either on direct genotyping or on the geographic distribution of
evolutionary lineages (Haynes et al. 2003; Heckel et al. 2005; Tougard et al. 2008; Braaker
and Heckel 2009; Martínková et al. 2013). The three coastal island populations of Guernsey,
Yeu and Noirmoutier are considered here as subspecies and potential relic populations from
the Last Glacial Maximum (Berry and Rose 1975), although no fossil evidence exists to
support this assumption. The Guernsey voles belong to the same WN haplogroup as the
Orkney vole but with very distinctive mtDNA haplotypes (Martínková et al. 2013), while
Noirmoutier and Yeu voles belong to the WS haplotype lineage.
The archaeological samples included 237 M. a. orcadensis from nine sites in Orkney
and 34 M. arvalis from four continental European sites (Figure 1, Table 2). The M. arvalis
sub-fossils from continental Europe required preliminary identification (see Statistical
analyses), which was unnecessary for Orkney voles. The sub-fossil Orkney voles were
sampled from archaeological sites on Mainland, Westray, Papa Westray and Sanday (Figure
1). Mainland samples span the longest temporal transect; from Neolithic Skara Brae (Clarke
1976) and Quanterness (Renfrew 1979) - dating between 3500 and 2500 BC, the Iron Age
broch at Howe (Smith and Carter 1994) – dating between 4th
and 7th
c. AD and Medieval
Earl’s Bu (Batey et al. 1993) - dating between the 11th
and 12th
c. AD. Northern isles samples
include those from Westray, Papa Westray and Sanday. From the former two islands,
specimens have been recovered from four Neolithic contexts; the chambered tombs at Point
of Cott (Barber 1997), Pierowall Quarry (Sharples 1984), Holm of Papa Westray North
(Ritchie 2009) and the settlement at the Links of Noltland (Clarke and Sharples 1985), whilst,

This article is protected by copyright. All rights reserved. 8
on Sanday, samples have been collected from the Late Bronze Age phase of occupation at
Tofts Ness (Simpson and Dockrill 1996; Dockrill et al. 1994).
Ancient samples from continental Europe (Table 2) include those from the Upper
Pleistocene cave deposits from L’Abreda (M. S. Segui, pers. com.) in Spain, the Mesolithic
deposits of L’Abeurador cave (Marquet 1993) in France, the Iron Age settlement of Melun
Grüber (Mistrot 2000) in France, and the Late Medieval Abbaye Ninove (Wouters and
Peersman 1994; A. Ervynck, pers. com.) in Belgium.
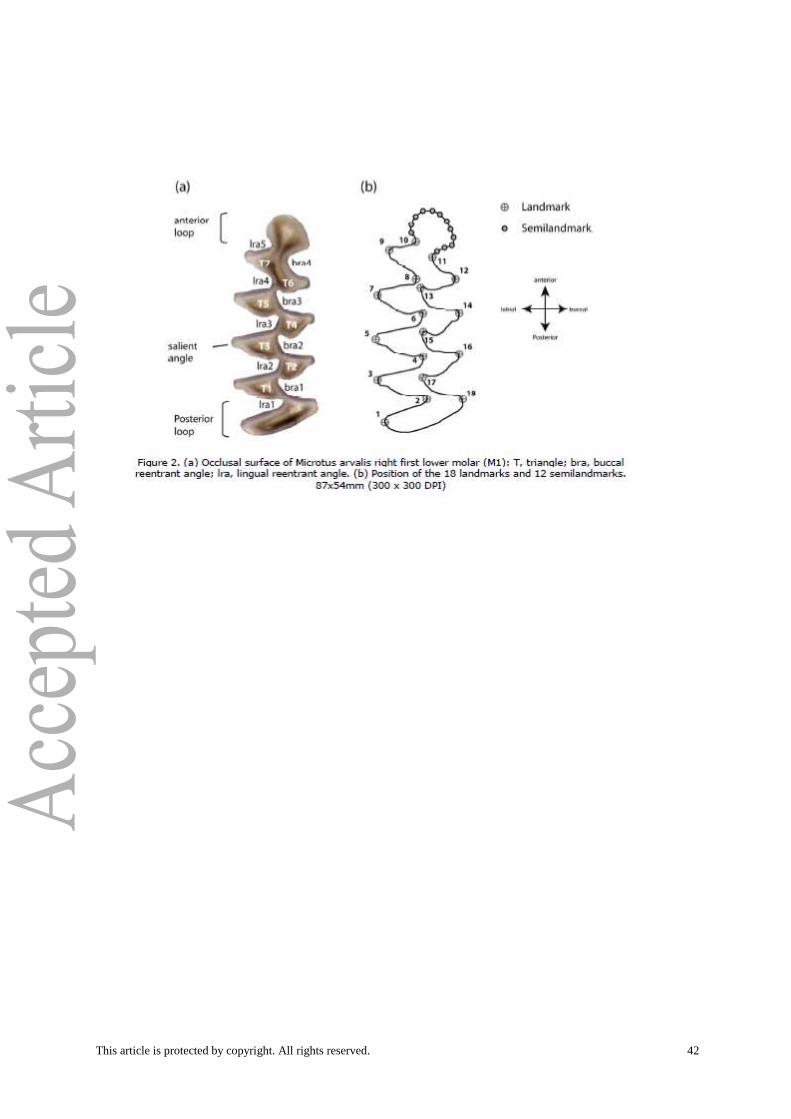
Geometric morphometrics of the first lower molar
To quantify molar size and shape, we used a two dimensional geometric
morphometric approach (Zelditch et al. 2012, Adams et al. 2013). The form of the occlusal
surface of the M1 in M. arvalis (Figure 2a) was quantified using eighteen landmarks
positioned at the maximum curvature of the salient and reentrant angles of the posterior loop
and the triangle cusps on the buccal and lingual sides of the M1 (Figure 2b). The smooth
curve of the anterior loop (Figure 2a), which is lacking landmarks, was further quantified
using 12 equidistant sliding semilandmarks (Figure 2b) to extend the landmark-based
statistics to curves (Miterroecker and Gunz 2009). The Cartesian coordinates of the
landmarks and semilandmarks were captured using TPSdig2 v.2.16 (Rohlf 2010a).
This molar shape dataset (SI 1) was analyzed using a generalized Procrustes analysis
(GPA) (Rohlf and Slice 1990). Using this procedure, information on position, scale and
orientation are removed from the Cartesian coordinates configuration and the semilandmarks
are forced to slide on a tangent according to the Bending Energy algorithm (Bookstein 1997).
The resulting Procrustes shape coordinates (SI 1) from this superimposition were used as
shape variables for subsequent statistical analyses. Overall M1 size was measured by the
centroid size (CS), i.e. the square root of the sum of the squared distances between each point

This article is protected by copyright. All rights reserved. 9
and the centroid of the configuration (SI 1). GPA was performed with TPSrelw v. 1.49 (Rohlf
2010b).
Acquisition of climatic, geographic, temporal and genetic data
Geoclimatic data – i.e. longitude, latitude, altitude and annual mean monthly, maximal
monthly, minimal monthly values of precipitation and temperature (SI 2) - were collected
throughout the distribution of the modern vole dataset (Figure 1) from weather stations
between 1960 and 1995 (WMO stations; sources: NOAA, NCDC and GCPS).
Geographic characteristics (SI 3) of the different Orkney islands such as their size
(km2) and their shortest inter-island linear distances (km) were acquired from the EDINA
Digimap collections software (Edinburgh University).
Dating of Orkney vole specimens collected from the different archaeological sites was
ascertained through direct 14
C assays using Accelerator Mass Spectrometry (AMS) on hemi-
mandibles (Martínková et al. 2013). The mean of the calibrated 14
C age values in years before
present (BP) for each archaeological site was used as the radiocarbon age of the different
Orkney vole samples in our dataset. Vole samples without direct 14
C dating (such as those
from the Links of Noltland and Tofts Ness) have been assigned ages in calendar years BP
estimated from 14
C dating of the archaeological context from which they have been collected.
We could match 61 modern and ancient specimens from Orkney for combined
geometric morphometric and genetic analyses (SI 4), using the molar and mtDNA sequence
data (mt-cytb, Martínková et al. 2013). Modern samples that were morphologically and
genetically analyzed were from locations widely distributed over the Orkney archipelago
(Table 1), while ancient specimens similarly analysed were from Neolithic Westray (Orkney)
and Iron Age Mainland (Orkney) (see Table 2). The molecular distance between individuals
(SI 5) was generated using the Kimura 2-parameter (K2P) model in PAUP* (Swofford 2002).

This article is protected by copyright. All rights reserved. 10
Statistical Methods
Taxonomic identification of archaeological specimens
Two sympatric species of Microtus (arvalis and agrestis) occur in continental Europe
and display very similar tooth morphology (Chaline and Mein 1979) that can result in
misidentification (Hall and Yalden 1978). Therefore, species identification of archaeological
voles from continental Europe were performed with a predictive approach based on a linear
discriminant analysis (LDA) using a modern comparative sample of 31 M. arvalis and 29 M.
agrestis from France (Table 1). Of the available 26 principal components (PC) of shape, the
first nine were used to classify specimens following dimensionality reduction based on cross-
validation percentages (leave-one-out procedure) of correct re-assignments (Baylac and
Friess 2005; Sheets et al. 2006). This classification was based on the generalized distance
(D2) and the associated probability of group membership between the archaeological
specimen and the centroid of both reference taxonomic groups. Only ancient specimens
associated to M. arvalis with a predictive probability above 0.9 have been included in the
study.
Differentiation of molar size and shape in Microtus arvalis
Molar size variation was assessed among samples by an analysis of variance
(ANOVA) on the log transformed centroid size, with subsequent pairwise t-tests between
samples with a Bonferroni correction.
The molar shape variation among samples was tested using multivariate analysis of
variance (MANOVA) and measured by Procrustes distances (Euclidian distances between
two configurations of Procrustes coordinates) using permutation tests (10,000 runs). The

This article is protected by copyright. All rights reserved. 11
main axes of variation are displayed with a principal components analysis (PCA). The
visualization of molar shape-change along the principal axes is depicted by the magnitude of
change in Procrustes distances.
Covariates of molar size and shape differentiation
To assess the influence of climatic factors (latitude, longitude, altitude, precipitation,
temperature), island size (area) and time elapsed since introduction on molar size and shape
difference among Orkney vole populations, we used univariate (centroid size) and
multivariate (Procrustes coordinates) linear regressions with permutation tests (10,000 runs).
The influence of geographic distance from Mainland Orkney on shape divergence among
other Orkney populations was tested with a linear regression model and Pearson’s R
correlation test between the paired geographic and shape distances of each modern sample
from Mainland, respectively measured in kilometers and Procrustes distances.
The size related shape changes (allometry) among samples were tested with a
multivariate analysis of covariance (MANCOVA) with Procrustes coordinates as dependent
variables and log centroid size as a covariate. The lack of a significant interaction between
the shape and size differences among samples would signal a lack of influence of size over
the patterns of shape divergence, interpreted as common allometric trajectories among
samples. The amount of shape change explained by size difference was assessed by
multivariate regression with Procrustes coordinates as dependent variables and the log
transformed centroid size as the independent variable. To test the null hypothesis of
independence, permutation tests (1000 runs) were carried out.
The influence of the inter-island and genetic distances over molar shape
differentiation among the Orkney vole populations was tested using PROTEST, since it has
proven to perform better than the Mantel test (Jackson, 1995; Peres-Neto and Jackson, 2001).

This article is protected by copyright. All rights reserved. 12
We used a principal coordinate analysis (PCoA) to convert distances matrices into a Cartesian
coordinate system (Gower 1966) and 1,000 random permutations to test for the significance
of the correlation index (Monte-Carlo) (Jackson, 1995).
Allochronic changes along the Orkney Mainland time series
The evolution of molar shape changes in Mainland Orkney voles, from their Neolithic
introduction until the present time, is an allochronic design (Hendry and Kinisson 1999),
involving Mainland Orkney populations composed of six assemblages representing a time
series of four broad chronological periods: Neolithic (Quanterness, Skara Brae 1 and Skara
Brae 2), Iron Age (Howe), Medieval (Earl’s Bu) and present-day (Modern Mainland), with
varying time intervals between the successive samples. Evolutionary rates are dependent on
the time interval over which they are measured, with shorter time intervals tending to lead to
higher observed evolutionary rates, because short-term fluctuations are buffered over long
time periods (Gingerich 1983). The limited number of successive samples and the uneven
time intervals separating them renders it difficult to calculate evolutionary rates accurately.
Instead, morphological distances among successive samples were calculated. Mahalanobis’s
distances (D) (Mahalanobis 1936) were chosen, because expressing among-sample difference
relative to within-sample variance provides a multivariate analogue to the morphological
distances used to estimate evolutionary rate of complex traits in haldanes (Lerman 1965,
Cherry et al. 1982), appropriate for geometric morphometric analyses (Arnegard et al. 2010;
Carlson et al 2011, Adams 2014). The calculation of D was performed based on 32 PCs,
according to a procedure of dimensionality reduction described previously (Taxonomic
identification of archaeological specimens).
Size (log CS), shape (estimated by the second axis of the analysis focused on Orkney)
and morphological distances (D) were expressed against time in order to provide a

This article is protected by copyright. All rights reserved. 13
comprehensive picture of phenotypic evolutionary change in Orkney following initial
divergence.
PCA, multivariate regressions and visualizations of shape change were performed
with MorphoJ (Klingenberg 2010). Linear regressions, PCA, LDA, ANOVA,
MANOVA/MANCOVA, and PROTEST were carried out with R version 2.13.0 (R
development Core Team) with the ade4 package (Dray and Dufour2007) and the library
Rmorph (Baylac 2012).
RESULTS
Divergence of Orkney voles from their continental and other insular relatives: molar
size, shape and allometry
Ancient and modern Orkney voles have larger molars than ancient and modern
continental and other insular populations of M. arvalis (F= 79.77, P < 0.0001), a tooth size
only matched by the insular population from Guernsey (Figure 3). Molar sizes in ancient
voles are 5% larger than present-day ones, both in continental Europe (F=40.03, P < 0.0001)
and Orkney (F= 10.11, P < 0.0001) - except in Spain where M. arvalis shows no reduction in
molar size since the last glacial maximum (LGM). Despite significant differences (F= 49.06,
P < 0.0001), the size range of M. arvalis’ molars remains stable, from the LGM (Spanish
Abr1) till Medieval times (Belgium AN), and show no evidence for the drastic size reduction
manifested in current populations (Figure 3). Modern Orkney voles display a molar size
reduction of 5% compared to archaeological samples (Figure 3, SI 6). However, only the
medieval specimens from Earl’s Bu are significantly smaller than all the other archaeological
samples from Orkney (SI 6), suggesting that in Orkney, a decrease in molar size occurred
earlier than on the continent - i.e. between the 4th
and 12th
c. AD.

This article is protected by copyright. All rights reserved. 14
Despite great variability of molar size across recent continental European samples
(ANOVA, F=30.83, P < 0.0001), tooth size does not correlate with genetic lineage (Figure
3). Insular samples tend to have a larger M1 compared to their continental European
counterparts (SI 6), with only Orkney and Guernsey (WNgue) displaying “gigantism” (Figure
3). No significant size difference was found amongst modern Orkney populations according
to pairwise t-tests (SI 6).
As with size, molar shape distinguishes Orkney and Guernsey voles from other M.
arvalis (Figure 4a). The main variation in M. arvalis molar shape corresponds to a
broadening/narrowing of the M1 anterior loop associated with the closing/narrowing of
reentrant angle (lra5) between triangle 7 and the anterior loop (Figure 4b). The shape
disparity among Orkney voles contrasts with the conservatism observed in continental M.
arvalis over time, where (despite significant variation among samples (Pillai’s= 6.434; F=
2.405; P < 0.0001) no clear patterning emerges amongst genetic lineages or between ancient
and modern samples (Figure 4a). No intermediate phenotype can be observed between
continental and Orkney voles, not even in the samples from northern coastal France and
medieval Belgium (AN) - areas considered likely geographic sources of Orkney voles
(Martínková et al. 2013).
Overall, there is no common signature for island populations, since Noirmoutier
(WSnoi) and Yeu (WSyeu) lie within the range of variation of mainland European samples
(Figure 4a). Guernsey voles show aspects of shape that are close to voles from the northern
Orkney isles (Westray and Sanday) along PC1 and PC2. However, the shape of Orkney and
Guernsey voles is highly differentiated (Pillai’s= 3.432; F= 6.976; P < 0.0001; Procrustes
distance: 0.049; P < 0.001).
What does differentiate the Orkney and the Guernsey populations of M. arvalis from
all their continental (mainland and island) European relatives is the hypertrophy of the

This article is protected by copyright. All rights reserved. 15
anterior loop of their molars. This peculiar trait is partly size related as suggested (firstly) by
the relationship between the PC1 (Figure 4) and the centroid size (slope = -10.449; intercept
= 4.813; r2= 0.469; permut. P < 0.0001) and (secondly) by the significant allometric
component explaining 20% of the shape variation (permut. P < 0.0001) mainly localized in
the anterior part of the M1 (Figure 5). However, a MANCOVA with tooth shape as a
dependent factor showed significant effects of size (Pillai's = 0.4788; F = 10.4103, P <
0.0001), geographic groups (Pillai's = 8.3995; F = 2.6993, P < 0.0001), and size*group
interaction (Pillai's = 4.1818; F = 1.2083, P < 0.0001). The latter indicates that the allometric
pattern varies among samples.
Local divergence among Orkney voles
The diversification in modern and ancient Orkney voles (Figure 6) seems to have been
driven first by the geography of the archipelago (PC1 separating southern from northern
populations) and second by the time elapsed since their introduction (as shown by variation
along PC2). Voles from Mainland (ORmai) and its satellite islets (ORsha, ORbur, ORsro,
ORrou) are phenotypically close compared to the highly divergent (P < 0.001) Westray
(ORwes) and Sanday (ORsan) specimens (Figure 6a). The molar shape differences associated
with this geographic divergence are related to modifications in the buccal (bra4) and labial
(lra5) reentrant angles of the 6th and 7th cusps, with a relatively smaller and less rounded
anterior loop present in the southern isles populations (Figure 6b).
Time elapsed since introduction appears to have contributed to the pattern of
diversification in Orkney voles, according to the significant association between radiocarbon
age of the ancient samples and their molar shape (permut P: 0.038) - predicting 22% of
variation. Shape divergence over time, which has been more pronounced in the northern isles

This article is protected by copyright. All rights reserved. 16
(Figure 6a), is associated with a reduction of the anterior loop (Figure 6b). On the Orkney
Mainland, the temporal divergence is less substantial and suggests periods of relative
morphological stability, contrasting with intervals of marked changes.
Part of the divergence in shape of Orkney voles since introduction is associated with a
small (7.2 %) but significant (P < 0.0001) allometric adjustment attributable to molar size
reduction between ancient and extant populations (Figure 5).
Climatic, geographic and genetic determinants of morphological divergence
The climatic factors tested in relation to molar variation in the modern M. arvalis
populations of our dataset (Table 3AB) show that only size (not shape) is influenced within
the geographic range studied. Thirty percent of the molar size variation is correlated with
latitude, mean and maximum precipitation, and maximum temperature (Table 3A) suggesting
that M. arvalis molar size is influenced by the latitudinal gradient.
Molar shape diversification among Orkney island populations (Figure 5) is neither
related to island size (P = 0.992) nor to the distances between them (PROTEST, Monte-Carlo
= 0.569, P = 0.122). However, the distance from Mainland Orkney (probably the first island
colonised and thus the source for subsequent dispersal: Martínková et al. 2013) appears to be
a factor that has contributed significantly to this molar shape diversification according to
Pearson’s test (Pearson’s R = 0.825, P = 0.042) and close to significant according to the
linear regression (slope = 0.0016; intercept = 0.0531; r2
= 0.682; permut P < 0.0566).
A significant correlation was found between pairwise genetic differentiation and shape
differentiation measured by Procrustes distances among combined modern and ancient M.
arvalis orcadensis populations (PROTEST, Monte-Carlo = 0.404, P < 0.001), suggesting
some concordance between molar shape and genetic divergence.

This article is protected by copyright. All rights reserved. 17
Morphological changes in Mainland Orkney voles after initial diversification
After the major divergence following their introduction, tooth morphology in Mainland
Orkney voles did not follow the expected pattern of stasis (Figure 7). During the earliest
phase of the Neolithic, molar size experienced a further increase - seen between the sites of
Quanterness (Qu) and Skara Brae (SB1), apparently followed by a stasis until the Late Iron
Age - represented by specimens from Howe (Ho). Thereafter, specimens from Earl’s Bu (EB)
document a drastic size reduction between the 4th
and the 12th
c. AD, which continued until
the present time.
Far from displaying stasis after initial divergence, molar shape in Mainland Orkney
voles also changed over time. During the early part of the record, limited divergence occurred
more or less proportionally to the time elapsed. As was observed for size, a more substantial
shift in molar shape occurred during the interval between Ho and EB (i.e. between later
prehistory and early Medieval times. Shape remained rather stable thereafter until modern
times. This overall pattern is corroborated by considering morphological distance between
successive samples, with the greatest morphological change occurring between Ho and EB
(Figure 7).
DISCUSSION
Rapid divergence of Orkney voles after their Neolithic introduction
The dental characteristics of Orkney voles - molar size gigantism and hypertrophied
anterior loop - were acquired within less than a century (possibly within a few decades) after
their Neolithic introduction and colonisation of Orkney. No intermediate phenotype between
continental European and Orkney M. arvalis was observed in the earliest (4th
millennium BC)

This article is protected by copyright. All rights reserved. 18
specimens from either Mainland Orkney or Westray, providing further evidence that newly
colonising island rodents exhibit extremely rapid initial divergence (Millien 2006; Nagorsen
and Cardini 2009; Evans et al. 2012). Hence, phenotypic similarities that likely existed with a
continental European source population were completely erased by this rapid morphological
shift, rendering the identification of an ancestral phenotype among the continental
populations all but impossible (Corbet 1986).
The molar size increase observed in M. arvalis on Orkney presumably reflects body
size and may be a response to different levels of primary productivity (Blois et al 2008,
Medina et al. 2007, Rosenzeig 1968, Yom-Tov and Geffen 2006, 2011) and/or a
thermoregulatory response in accordance with Bergmann’s rule. An alternative hypothesis
would be that release of predation and competition pressure allowed the rodents to track their
metabolic optimum by becoming larger (Adler and Levins 1994, Damuth 1993; Michaux et
al. 2002, Lomolino 2005, McNab 2010). This hypothesis is supported by a similar trend
towards gigantism in Orkney and Guernsey voles, located on islands experiencing a different
environmental regime but both characterized by the absence of the two major terrestrial
predators of M. arvalis in continental Europe – i.e. stoats (Mustela erminea) and weasels
(Mustela nivalis) (Yalden 1999). Voles introduced to Orkney by Neolithic farmers faced only
avian predation from hen harriers (Circus cyaneus) and short eared owls (Asio flammeus)
(Berry 1985) - and interspecific competition was reduced to only the wood mouse (Apodemus
sylvaticus) (Corbet 1979). In contrast, voles from Yeu and Noirmoutier - where weasels are
present (Saint-Girons and Nicolau-Guillomet 1987) - do not display molar size gigantism as
seen in the Guernsey and Orkney populations.
This molar gigantism apparently contributed to the hypertrophy seen in the anterior
loop of the M1 through size allometry (Klingenberg 1996). In Microtus sp., the M1 anterior
loop is the most variable and evolvable part of the tooth (Jernvall et al. 2000; Renvoisé et al.

This article is protected by copyright. All rights reserved. 19
2009; Chaline et al. 1999) due to its late development during morphogenesis (Jernvall et al.
2000). A similar mechanism has been evoked to explain parallel evolution in molar shape in
insular house mice (Mus musculus domesticus) (Renaud et al. 2011). The anterior elongation
of the molar may correspond to a “line of least resistance to evolution” (Schluter 1996)
related to developmental properties that are prone to being mobilized by size increase. Hence,
drastic molar size increase driven by predation release and change in food resources (acting
on overall body size) could have induced a broadening of the anterior loop of the molar.
The parallel evolution of a partly similar dental phenotype in Orkney and Guernsey
voles - despite different phylogenetic signatures (Martínková et al. 2013) - supports the
interpretation of a line of least evolutionary resistance, rather than a consequence of a
common origin, as suggested by early 20th
century naturalists (Miller 1912).
Founding events and Orkney vole diversification
The molar shape divergence revealed among Orkney voles - first separating voles from the
southern and northern isles, and then islands within the two parts of the archipelago - could
fit a scenario of diversification related to progressive subdivision of a single landmass as a
consequence of sea-level rise. This scenario, however, is not supported by the geology of the
archipelago. Although Orkney was a single island during the Younger Dryas 13,000 years
ago (Bates et al. 2013), relative sea-level around Orkney by the time of Neolithic colonisation
between 5,300 and 5,100 years ago, is thought to have been approximately only two metres
lower than today (Bates et al 2013).
Given the environmental uniformity among the Orkney islands, the most likely
processes driving this local evolution are chance effects related to successive founder events
and subsequent genetic drift in the progressive colonisation of the archipelago, together with

This article is protected by copyright. All rights reserved. 20
the impermeability of the local population (once installed) to later invaders (Granjon and
Cheylan 1988; Hardouin et al. 2010). According to data from mitochondrial and nuclear
DNA, colonization occurred first on Mainland Orkney, followed by human-mediated
transportation of a few founders to the northern islands (Martínková et al. 2013). This
colonisation scenario is supported by the influence of geographic distance from Mainland
Orkney in molar shape divergence of current Orkney vole populations, the small but
significant overall influence of time elapsed since introduction on molar shape divergence
and the congruence between the divergence patterns provided by molar shape and neutral
molecular markers.
Anthropogenic forces triggering post Neolithic evolutionary changes
The archaeological time series on Mainland Orkney has also recorded phenotypic
shifts in the morphology of Orkney voles millenia after their prehistoric introduction (Figure
7). This finding contradicts the expectation that in an island setting, the voles should achieve
an ecological optimum (after an initial divergence), and then change little after that. Instead, a
major phenotypic shift is observed between the late Iron Age (4th
-7th
c. AD) and the Medieval
times (11th
-12th
c. AD). This phenotypic shift, long after their Neolithic introduction, suggests
that evolution in the Orkney vole has been intimately linked with human influence on habitat
and environment of the archipelago throughout its Holocene history (Hendry et al. 2008).
A later (post-medieval) molar size reduction in continental European Microtus arvalis
appears to be recorded in our data. This suggests that, for M. arvalis at least, body size
reduction between fossil and modern specimens has not been a response to a long-term,
natural global warming since the LGM (Millien et al. 2006b), but rather a more recent
anthropogenic phenomenon (Sheridan & Bickford 2011). A similar trend observed in mice
species has been linked with pervasive anthropogenic perturbations - from habitat destruction

This article is protected by copyright. All rights reserved. 21
to climate change (Cassaing et al. 2011; Stoetzel et al. 2013) - during very recent times.
However, the archaeological record for Mainland Orkney shows size reduction in voles much
earlier, between the 4th
and 12th
c. AD, suggesting that anthropogenic impacts could have had
greater/earlier effects on small mammals in confined/insular environments and/or in higher
latitudinal locations.
The most dramatic shift in molar shape within Orkney voles is observed at the same
time as size change, supporting the idea that major changes in the environment of the voles
occurred at that period. Although human-induced modification of the Orkney landscape was
initiated as early as 5,000 BP (Bunting 1994), the expansion of pastoral farming during the
early and middle Iron Age (Bond 2002) led to an almost entirely open landscape with
increasing numbers of livestock (Bunting 1994).
Around the same time commensal mice (Mus musculus domesticus) and rats (Rattus
rattus) were probably introduced to Orkney - they were present in mainland Britain during
the Iron Age and Roman times, respectively (Yalden 1999). These commensal alien species
might not have had a drastic effect on the Orkney vole populations since they did not
compete for the same habitat. However, during the Iron Age, new terrestrial predators such as
the domestic cat (Felis sylvestris) and fox (Vulpes vulpes) - both considered major predators
of Orkney voles - were introduced to Orkney. Foxes are first recorded on Orkney in various
Iron Age sites (Fairnell and Barrett 2007), whilst domestic cats are present as early as the 1st
c. AD at Howe (Ballin Smith 1994, O’Connor 2007), Mine Howe (Mainland; unpublished
data) and in later Iron Age deposits at Pool (Bond 2007) on Sanday. By the Viking and Norse
periods, between 8th
and 12th
c. AD, cats were clearly well established, occurring frequently
in most archaeological sites of this period (Fairnell and Barrett 2007).
The various changes associated with the increase in pasture land, and especially the
introduction of foxes and cats, likely impacted Orkney vole populations (Whittaker 1998),

This article is protected by copyright. All rights reserved. 22
disturbing the local ecological equilibrium (Yom-Tov et al. 1999; Sondaar 2000) of the
species. Nevertheless, the impact of these changes on vole morphology seems to have
become significant only when anthropogenic changes had become extensive.
Conclusion
Orkney voles have evolved their own particular dental phenotype, likely the result of
human agency influencing its evolutionary trajectory in different ways over the last 5000
years. This human influence began with its Neolithic introduction to the Orkney Mainland at
a time when there were no terrestrial predators and only one competing species (the wood
mouse). The Orkney vole population rapidly diverged from continental European M. arvalis
to reach a new ecological optimum, including evolutionary changes in morphology of the
molar teeth. Neolithic farmers then dispersed the species to other islands of the archipelago -
from Mainland to Westray and probably during the Bronze Age to Sanday - generating
several founding events contributing to idiosyncratic differences in dental characteristics.
This initial divergence and diversification in Orkney voles was not followed by
morphological stasis because the Orkney environment was subjected to continued human
disturbance.
The case of the Orkney vole presented here demonstrates how, from Neolithic times,
humans have played a major role in species evolution and suggests that anthropogenic
modifications of the environment may have repeatedly disturbed the phenotypic evolutionary
stasis of insular species. Given the continental-scale and increasing intensity of human-
induced impact on ecosystems in the last centuries, such changes in the evolutionary
trajectories of vertebrates are likely not restricted to insular systems.

This article is protected by copyright. All rights reserved. 23
Acknowledgments
We dedicate this article to the memory of our colleague Michel Pascal who passed away on
the 5th
January 2013 and to Anne Brundle who passed away on 18th
January 2011. Michel
was renowned in the field of biological invasions, particularly in relation to rodents, and he
was known to everyone as the “Ratator”. Anne was museum curator at the Tankerness house
Museum in Kirkwall and was instrumental in providing us with access to key archaeological
collections of Orkney voles.
We thank V. Bretille, N. Gould, J. S. Herman, E. P. Jones, S. Martínek, R. Marwick, J.
Michaux, S. Montuire, J. Pauperio, C. Scott, B. Walther and N. Wheale for field specimens.
We are most grateful to A. Shepherd, A. Ritchie, M. S. Segui, A. Tresset and V. Mistrot for
the archaeological samples and archaeological advice.
We thank A. Cardini and D. Polly for morphometric advice.
We thank M. Fujita and L. Killick for their help in the acquisition of teeth images.
We thank the following for access to museum and archaeological samples: J. Barrett
(MacDonald Institute, University of Cambridge), A. Brundle (Orkney Museum), C. David
(Guernsey Museum), A. Ervynck (Flemish Heritage Institute), L. Gordon (Smithsonian
Institute), J. S. Herman (National Museums of Scotland), D. Lee (Orkney College), R. Sabin
(British Museum - Natural History, London), G. Veron (Muséum national d'Histoire
naturelle, Paris).
We thank A. R. Hoelzel for his contribution to the Orkney vole project.
We acknowledge receipt of major funding from the Arts and Humanities Research Council
(project grant 119396) for K.M.D. and J.B.S., a Marie Curie Intra European Fellowship (to
N.M.), support from a Wellcome Trust University award to K.M.D. (GR071037).
Finally, we are most grateful to Virginie Millien for all the useful comments of her review
that have greatly improved the quality of the manuscript.

This article is protected by copyright. All rights reserved. 24
References
Adams, D. C., F. J. Rohlf, and D. E. Slice. 2013. A field comes of age: geometric
morphometrics in the 21st century. Hystrix, the Italian Journal of Mammalogy 24:7-
14.
Adams, D. C. 2014. Quantifying and comparing phylogenetic evolutionary rates for shape
and other high-dimensional phenotypic data. Systematic Biology 63:166-177.
Adler, G. H., and R. Levins. 1994. The Island Syndrome in rodent populations. The Quarterly
Review of Biology 69:473-490.
Arnegard, M. E., P. B. McIntyre, L. J. Harmon, M. L. Zelditch, W. G. R. Crampton, J. K.
Davis, J. P. Sullivan, S. Lavoué, and C. D. Hopkins. 2010. Sexual signal evolution
outpaces ecological divergence during electric fish species radiation. The American
Naturalist 176:335-356.
Ballin Smith, B. 1994. Howe. Four Millenia of Orkney Prehistory. Edinburgh: Society of
Antiquaries of Scotland.
Barber, J. 1997. The excavation of a stalled cairn at the Point of Cott, Westray, Orkney.
Scottish Trust for Archaeological Research, Edinburgh.
Bates, M. R., N. Nayling, R. Bates, S. Dawson, D. Huws, and C. Wickham-Jones. 2013. A
multi-disciplinary approach to the archaeological investigation of a bedrock-
dominated shallow-marine landscape: an example from the Bay of Firth, Orkney, UK.
International Journal of Nautical Archaeology 42:24-43.
Batey, C. E., R. C. Harry, and C. D. Morris. 1993. Excavations at the Earl's Bu, Orphir,
Orkney, 1993. Glasgow University Archaeological Research Division, Glasgow.
Baylac, M., and M. Friess. 2005. Fourier descriptors, Procrustes superimposition, and data
dimensionality: an example of cranial shape analysis in modern human populations.

This article is protected by copyright. All rights reserved. 25
Pp. 145-166 in D. E. Slice, ed. Modern Morphometrics in Physical Anthropology.
University of Chicago, Chicago.
Baylac, M., 2012. Rmorph: A R geometric and multivariate morphometrics library.
Berry, R. J. 1985. The Natural History of Orkney. Collins, London.
Berry, R. J. 1996. Small mammal differentiation on islands. Philosophical Transactions of the
Royal Society: Biological Sciences 351:753-764.
Berry, R. J., and F. E. N. Rose. 1975. Islands and the evolution of Microtus arvalis
(Microtinae). Journal of Zoology 177:395-409.
Blois, J. L., R. S. Feranec, and E. A. Hadly. 2008. Environmental influences on spatial and
temporal patterns of body-size variation in California ground squirrels (Spermophilus
beecheyi). Journal of Biogeography. 35:602-613.
Blondel, J., and J.-D. Vigne. 1993. Space, time and man as determinants of diversity of birds
and mammals in the Mediterranean region. Pp. 135-146 in R. E. Ricklefs, and D.
Schluter, eds. Species Diversity in Ecological Communities. Ecological and
Geographical perspectives. Chicago University Press.
Bond, J. 2002. Pictish pigs and Celtic cowboys: food and farming in the Atlantic Iron Age.
Pp. 177-184 in B. Ballin Smith, and I. Banks, eds. In the Shadow of the Brochs.
Tempus: Stroud.
Bond, J. 2007 The bioarchaeological evidence. Pp. 169-286 in J. Hunter, ed. Investigations in
Sanday, Orkney. Vol 1: Excavations at Pool, Sanday. The Orcadian Ltd., Kirkwall.
Bookstein, F. L. 1997. Landmark methods for forms without landmarks: morphometrics of
group differences in outline shape. Medical Image Analysis 1:225-243.
Bradshaw, W. E., and C. M. Holzapfel. 2006. Evolutionary response to rapid climate change.
Science 312:1477-1478.

This article is protected by copyright. All rights reserved. 26
Braaker, S., and G. Heckel. 2009 Transalpine colonisation and partial phylogeographic
erosion by dispersal in the common vole (Microtus arvalis). Molecular Ecology
18:2518-2531.
Bunting, M. J. 1994. Vegetation history of Orkney, Scotland; pollen records from two small
basins in West Mainland. New Phytologist 128:771-792.
Bunting, M. J. 1996. The development of heathland in Orkney, Scotland: pollen records from
Loch of Knitchen (Rousay) and Loch of Torness (Hoy). The Holocene 6:193-212.
Carlson, B. A., S. M. Hasan, M. Hollmann, D. B. Miller, L. J. Harmon, and M. E. Arnegard.
2011. Brain evolution triggers increased diversification of electric fishes. Science
332:583-586.
Carroll, S. P., A. P. Hendry, D. N. Reznick, and C. W. Fox. 2007. Evolution on ecological
time-scales. Functional Ecology 21:387-393.
Cassaing, J., F. Sénégas, J. Claude, and B. L. P. de la Rivière. 2011. A spatio-temporal
decrease in molar size in the western European house mouse. Mammalian Biology -
Zeitschrift für Säugetierkunde 76:51-57.
Chaline, J., P. Brunet-Lecomte, S. Montuire, L. Viriot, and F. Courant. 1999 Anatomy of the
arvicoline radiation (Rodentia): Palaeogeographical, palaeoecological history and
evolutionary data. Annales Zoologici Fennici 36:239-267.
Chaline, J., and P. Mein. 1979. Les rongeurs et l'évolution, Doin, Paris.
Cherry, J. F. 1990. The first colonization of Mediterranean islands: A review of recent
research. Journal of Mediterranean Archaeology 3:145-221.
Cherry, L. M., S. M. Case, J. G. Kunkel, J. S. Wyles, and A. C. Wilson. 1982. Body shape
metrics and organismal evolution. Evolution 36:914-933.
Clarke, D. V. 1976. The Neolithic village at Skara Brae, Orkney 1972-1973 Excavations. Pp.
4-27. National Museum of Antiquities of Scotland, Edinburgh.

This article is protected by copyright. All rights reserved. 27
Clarke, D. V., and N. Sharples. 1985. Settlement and subsistence in the third Millennium BC
Pp. 54-82 in C. Renfrew, ed. The Prehistory of Orkney. Society of Antiquaries of
Scotland., Edinburgh.
Clegg, S. M., S. M. Degnan, C. Moritz, A. Estoup, J. Kikkawa, and I. P. F. Owens. 2002.
Microevolution in island forms: the role of drift and directional selection in
morphological divergence of passerine birds. Evolution 56:2090-2099.
Clegg, S. M., F. D. Frentiu, J. Kikkawa, G. Tavecchia, and I. P. F. Owens. 2008. 4000 years
of phenotypic change in an island bird: heterogeneity of selection over three
microevolutionary timescales. Evolution 62:2393-2410.
Corbet, G. B. 1964. The identification of British mammals. British Museum, London.
Corbet, G. B. 1979. Report on rodent remains. Pp. 135-137 in C. Renfrew, ed. Investigations
in Orkney. The Society of Antiquaries of London, London.
Corbet, G. B. 1986. Temporal and spatial variation of dental pattern in the voles, Microtus
arvalis, of the Orkney Islands. Journal of Zoology 208:395-402.
Damuth, J. 1993 Cope's rule, the island rule and the scaling of mammalian population
density. Nature 365:748-750.
Dockrill, S. J., J. M. Bond, A. Milles, I. Simpson, and J. Ambers. 1994. Tofts Ness, Sanday,
Orkney. An integrated study of a buried Orcadian landscape. Pp. 115-132 in R. Luff,
and P. Rowley-Conwy, eds. Whither environmental archaeology. Oxbow Monograph,
Oxford.
Dray, S., and A. B. Dufour. 2007. The ade4 Package: Implementing the Duality Diagram for
Ecologists. Journal of Statistical Software 22.
Evans, A. R., D. Jones, A. G. Boyer, J. H. Brown, D. P. Costa, S. K. M. Ernest, E. M. G.
Fitzgerald, M. Fortelius, J. L. Gittleman, M. J. Hamilton, L. E. Harding, K.
Lintulaakso, S. K. Lyons, J. G. Okie, J. J. Saarinen, R. M. Sibly, F. A. Smith, P. R.

This article is protected by copyright. All rights reserved. 28
Stephens, J. M. Theodor, and M. D. Uhen. 2012. The maximum rate of mammal
evolution. Proceedings of the National Academy of Sciences of the United States of
America 109:4023-4336.
Fairnell, E. H., and J. H. Barrett. 2007. Fur-bearing species and Scottish islands. Journal of
Archaeological Science 34:463-484.
Foster, J. B. 1964. Evolution of mammals on islands. Nature 202:234-235.
Ghalambor, C. K., J. K. McKay, S. P. Carroll, and D. N. Reznick. 2007. Adaptive versus
non-adaptive phenotypic plasticity and the potential for contemporary adaptation in
new environments. Functional Ecology 21:394-407.
Gingerich, P. D. 1983. Rates of evolution - Effects of time and temporal scaling. Science
222:159-161.
Gower, J. C. 1966. Some distance properties of latent root and vector methods used in
multivariate analysis. Biometrika 53:325-328
Granjon, L., and G. Cheylan. 1988. Mécanismes de coexistence dans une guilde de muridés
insulaires (Rattus rattus L., Apodemus sylvaticus L., et Mus musculus domesticus
Rutty) en Corse: Conséquences évolutives. Zeitschrift für Säugetierkunde 53:301-316.
Guthrie, R. D. 1965. Variability in characters undergoing rapid evolution, an analysis of
Microtus molars. Evolution 19:214-233.
Hall, J. and D.W.Yalden. 1978. A plea for caution over the identification of Late Pleistocene
Microtus in Britain. Journal of Zoology 186: 556-560
Hardouin, E., J.-L. Chapuis, M. I. Stevens, J. B. van Vuuren, P. Quillfeldt, R. J. Scavetta, M.
Teschke, and D. Tautz. 2010 House mouse colonization patterns on the sub-Antarctic
Kerguelen Archipelago suggest singular primary invasions and resilience agains re-
invasion. BMC Evolutionary Biology 10:325.

This article is protected by copyright. All rights reserved. 29
Haynes, S., M. Jaarola, and J. B. Searle. 2003. Phylogeography of the common vole
(Microtus arvalis) with particuliar emphasis on the colonization of the Orkney
archipelago. Molecular Ecology 12:951-956.
Heckel, G., R. Burri, S. Fink, J.-F. Desmet, and L. Excoffier. 2005. Genetic structure and
colonization processes in European populations of the common vole, Microtus
arvalis. Evolution 59:2231-2242.
Hendry, A. P., and M. T. Kinnison. 1999. Perspective: The pace of modern life: Measuring
rates of contemporary microevolution. Evolution 53:1637-1653.
Hendry, A. P., T. J. Farrugia, and M. T. Kinnison. 2008. Human influences on rates of
phenotypic change in wild animal populations. Molecular Ecology 17:20-29.
Jackson, D.A. 1995. PROTEST: a Procrustean randomization test of community environment
concordance. Ecoscience 2:297–303.
Jernvall, J., S. V. E. Keränen, and I. Thesleff. 2000. Evolutionary modification of
development in mammalian teeth: Quantifying gene expression patterns and
topography. Proceedings of the National Academy of Sciences of the United States of
America 97:14444-14448.
Kinnison, M. T., and N. G. Hairston. 2007. Eco-evolutionary conservation biology:
contemporary evolution and the dynamics of persistence. Functional Ecology 21:444-
454.
Klingenberg, C. P. 1996. Multivariate allometry. Pp. 23-49 in L. F. Marcus, M. Corti, A. G.
Loy, J. P. Naylor, and S. D. E., eds. Advances in morphometrics. Plenum Press, New
York.
Klingenberg, C. P. 2010. MorphoJ: an integrated software package for geometric
morphometrics. Molecular Ecology Resources 11:353–357
This article is protected by copyright. All rights reserved. 30
Lambrinos, J. G. 2004. How interactions between ecology and evolution influence
contemporary invasion dynamics. Ecology 85:2051-2070.
Lerman, A. 1965. On rates of evolution of unit characters and character complexes. Evolution
19:16-25.
Lomolino, M. V. 2005. Body size evolution in insular vertebrates: generality of the island
rule. Journal of Biogeography 32:1683-1699.
Losos, J. B., K. I. Warheitt, and T. W. Schoener. 1997. Adaptive differentiation following
experimental island colonization in Anolis lizards. Nature 387:70-73.
Mahalanobis, P. C. 1936. On the generalised distance in statistics. Proceedings National
Institute of Science, India 2:49-55.
Major, C. I. 1905 The affinities of the Orkney vole (Microtus orcadensis Millais). Annals and
Magazine of Natural History 7 :323-324.
Marquet, J.-C. 1993. Paléoenvironnement et chronologie des sites du domaine atlantique
français d'âge Pléistocène moyen et supérieur d'après l'étude des rongeurs. Les
Cahiers de la Claise Supplément 2:1-346.
Martínková, N., R. Barnett, T. Cucchi, R. Struchen, M. Pascal, M. Pascal, M. C. Fischer, T.
Higham, S. Brace, S. Y. W. Ho, J.-P. Quéré, P. O'Higgins, L. Excoffier, G. Heckel, A.
R. Hoelzel, K. M. Dobney, and J. B. Searle. 2013. Divergent evolutionary processes
associated with colonization of offshore islands. Molecular Ecology 22:5205-5220.
McGuire, J. L. 2010. Geometric morphometrics of vole (Microtus californicus) dentition as a
new paleoclimate proxy: Shape change along geographic and climatic clines.
Quaternary International 212:198-205.
McNab, B. K. 2010. Geographic and temporal correlations of mammalian size reconsidered:
a resource rule. Oecologia 164:13-23.

This article is protected by copyright. All rights reserved. 31
Medina, A. I., D. A. Martí, and C. J. Bidau. 2007. Subterranean rodents of the genus
Ctenomys (Caviomorpha, Ctenomyidae) follow the converse to Bergmann's rule.
Journal of Biogeography 34:1439-1454.
Michaux, J. R., J. Goüy de Bellocq, M. Sarà, and S. Morand. 2002. Body size increase in
insular rodent populations: a role for predators. Global Ecology & Biogeography
11:427-436.
Miller, G. S. 1909. Twelve new European mammals. Annual Magazine of Natural History
8:415-422.
Millien, V. 2006. Morphological evolution is accelerated among island mammals. Public
Library of Science Biology 4:1863-1868.
Millien, V., S. Kathleen Lyons, L. Olson, F. A. Smith, A. B. Wilson, and Y. Yom-Tov. 2006.
Ecotypic variation in the context of global climate change: revisiting the rules.
Ecology Letters 9:853-869.
Millien, V. 2011. Mammals evolve faster on smaller islands. Evolution 65:1935-1944.
Mistrot, V. 2000. Les micromammifères, marqueurs de l'anthropisation du milieu. Études
rurales 153-154:195-206.
Mitteroecker, P., and P. Gunz. 2009. Advances in geometric morphometrics. Evolutionary
Biology 36:235-247.
Nagorsen, D. W., and A. Cardini. 2009. Tempo and mode of evolutionary divergence in
modern and Holocene Vancouver Island marmots (Marmota vancouverensis)
(Mammalia, Rodentia). Journal of Systematic and Evolutionary Research 47:258-267.
O'Connor, T. P. 2007 Wild or domestic? Biometric variation in the cat Felis silvestris
Schreber. International Journal of Osteoarchaeology 17 581-595.
Palumbi, S. 2001. Humans as the world's greatest evolutionary force. Science 29:1786-1790.

This article is protected by copyright. All rights reserved. 32
Peres-Neto, P., and D. Jackson. 2001. How well do multivariate data sets match? The
advantages of a Procrustean superimposition approach over the Mantel test.
Oecologia 129:169-178.
Pigliucci, M., C. J. Murren, and C. D. Schlichting. 2006. Phenotypic plasticity and evolution
by genetic assimilation. Journal of Experimental Biology 209:2362-2367.
Piras, P., F. Marcolini, P. Raia, M. T. Curcio, and T. Kotsakis. 2009. Testing evolutionary
stasis and trends in first lower molar shape of extinct Italian populations of Terricola
savii (Arvicolidae, Rodentia) by means of geometric morphometrics. Journal of
Evolutionary Biology 22:179-191.
Price, T. D., A. Qvarnström, and D. E. Irwin. 2003. The role of phenotypic plasticity in
driving genetic evolution. Proceedings of the Royal Society of London: Biological
Sciences 270:1433-1440.
Renaud, S., and V. Millien. 2001. Intra- and interspecific morphological variation in the field
mouse species Apodemus argenteus and A. speciosus in the Japanese archipelago: the
role of insular isolation and biogeographic gradients. Biological Journal of the
Linnean Society 74:557-569.
Renaud, S., S. Pantalacci, and J. C. Auffray. 2011. Differential evolvability along lines of
least resistance of upper and lower molars in island house mice. Public Library of
Science One 6:e18951
Renaud, S., E. A. Hardouin, B. Pisanu, and J. L. Chapuis. 2013. Invasive house mice facing a
changing environment on the Sub-Antarctic Guillou Island (Kerguelen Archipelago).
Journal of Evolutionary Biology 26:612-624.
Renfrew, C. 1979. Investigations in Orkney. Society of Antiquaries, London.

This article is protected by copyright. All rights reserved. 33
Renvoisé, E., A. R. Evans, A. Jebrane, C. Labruère, R. Laffont, and S. Montuire. 2009.
Evolution of mammal tooth patterns: new insights from a developmental prediction
model. Evolution 63:1327-1340.
Renvoisé, E., S. Montuire, Y. Richard, J.-P. Quéré, S. Gerber, T. Cucchi, C. Chateau-Smith,
and C. Tougard. 2012. Microevolutionary relationships between phylogeographical
history, climate change and morphological variability in the common vole (Microtus
arvalis) across France. Journal of Biogeography 39:698-712.
Ritchie, A., 2009. On the Fringe of Neolithic Europe. Excavation of a chambered cairn on the
Holm of Papa Westray, Orkney. Society of Antiquaries of Scotland, Edinburgh.
Rohlf, F. J. 2010a. TpsDig 2-Thin Plate Spline Digitizer. Ecology & Evolution, State
University at Stony Brook, New York.
Rohlf, F. J. 2010b. TpsRelw 1.49-Thin Plate Spline Relative Warp. Ecology & Evolution,
State University at Stony Brook, New York.
Rohlf, F. J., and D. E. Slice. 1990. Extensions of the Procrustes method for the optimal
superimposition of landmarks. Systematic Zoology 39:40-59.
Rosenzweig, M. L. 1968. The strategy of body size in mammalian carnivores. American
Midland Naturalist 80:299-315.
Saint Girons, M.-C., and P. Nicolau-Guillomet. 1987. Les phénomènes d'insularité dans les
îles du Ponant (France). Mammifères et oiseaux. Bulletin de la société zoologique de
France 112:61-79.
Sheridan, J. A., and D. Bickford. 2011. Shrinking body size as an ecological response to
climate change. Nature Climate Change 1:401-406.
Schluter, D. 1996. Adaptive radiation along genetic lines of least resistance. Evolution
50:1766-1774.

This article is protected by copyright. All rights reserved. 34
Schüle, W. 1993. Mammals, vegetation and the initial human settlement of the Mediterranean
islands: a palaeoecological approach. Journal of Biogeography 20:399-411.
Sharples, N. M. 1984. Excavations at Pierowall Quarry, Westray, Orkney. Proceedings of the
Society of Antiquaries of Scotland 114: 75-126.
Sheets, A. D., K. M. Covino, J. M. Panasiewicz, and S. R. Morris. 2006. Comparison of
geometric morphometric outline methods in discrimination of age-related differences
in feather shape. Frontiers in Biology 3:15
Shenbrot, G. I., and B. R. Krasnov. 2005. An atlas of the geographic distribution of the
arvicoline rodents of the world (Rodentia, Muridae: Arvicolinae). Pensoft Publishers.
Shennan, I., and B. Horton. 2002. Holocene land- and sea-level changes in Great Britain.
Journal of Quaternary Science 17:511-526.
Simpson, I. A., and S. J. Dockrill. 1996. Early cultivated soils at Tofts Ness, Sanday, Orkney.
Pp. 130-144 in A. M. Hall, ed. The Quaternary of Orkney Field Guide. Quaternary
Research Association.
Smith, B. B., and S. Carter. 1994. Howe: four millennia of Orkney prehistory excavations,
1978-1982. Society of Antiquaries of Scotland, Edinburgh.
Sondaar, P. Y. 2000. Early human exploration and exploitation of islands. Tropics 10:203-
230.
Stoetzel, E., C. Denys, J. Michaux, and S. Renaud. 2013. Mus in Morocco: a Quaternary
sequence of intraspecific evolution. Biological Journal of the Linnean Society
109:599-621.
Swofford, D. L. 2002. Phylogenetic analysis using parsimony (*and other methods) v4.0b10
Sinauer Associates, Sunderland, Massachusets.
Templeton, A. R. 1996. Experimental evidence for the genetic-transilience model of
speciation. Evolution 50:909-915.

This article is protected by copyright. All rights reserved. 35
Tougard, C., E. Renvoisé, A. Petitjean, and J.-P. Quéré. 2008. New insight into the
colonization processes of common voles: inferences from molecular and fossil
evidence. Public Library of Science One 3:e3532.
Van Valen, L. 1973. Pattern and the balance of nature. Evolution Theory 1:31-49.
Vigne, J.-D. 1999. The large "true" Mediterranean as a model for the Holocene human impact
on the European vertebrate fauna? Recent data and new reflections. Pp. 295-322 in N.
Benecke, ed. The Holocene History of the European Vertebrate Fauna. Modern
Aspects of Research (Workshop, 6th-9th April 1998, Berlin). Deutsches
Archaologisches Institut, Eurasian-Abteilung, Berlin.
Whittaker, R. J. 1998. Island Biogeography: Ecology, Evolution and Conservation. Oxford
University Press, Oxford.
Williamson, M. 1981. Island Populations. Oxford University Press, Oxford.
Wouters, W., and J. Peersman. 1994. Een opgraving heropgegraven. Norbertijnen in Ninove
(prov. Oost-Vlaanderen). Interimverslag. Archeologie in Vlaanderen 3:339-357.
Yalden, D. 1999. The History of British Mammals. Poyser, London.
Yom-Tov, Y., S. Yom-Tov, and H. Moller. 1999. Competition, coexistence, and adaptation
amongst rodent invaders to Pacific and New Zealand islands. Journal of
Biogeography 26:947-958.
Yom-Tov, Y., and E. Geffen. 2006. Geographic variation in body size: the effects of ambient
temperature and precipitation. Oecologia 148:213-218.
Yom-Tov, Y., and E. Geffen. 2011. Recent spatial and temporal changes in body size of
terrestrial vertebrates: probable causes and pitfalls. Biological Reviews 86:531-541.
Zelditch, M. L., D. L. Swiderski, A. D. Sheets, and W. L. Fink. 2012. Geometric
Morphometrics for Biologists. A Primer. Elsevier, Berlin.

This article is protected by copyright. All rights reserved. 36
Table 1: Modern samples of Microtus arvalis. I, insular samples; C, continental samples; M,
material from museum collections; T, trapped animals (genotype available); N, number of
molars included in the morphometric study with, in parentheses, the number of specimens
with mt-cytb sequence (See SI 4).
Country Localities MtDNA lineages Code N
France Various (M) M. agrestis 29
UK (I)
Orkney, Burray (T) Orkney ORbur 2 (2)
Orkney, Mainland (T) Orkney ORmai 46 (19)
Orkney, Rousay (T) Orkney ORrou 10 (1)
Orkney, Sanday (T) Orkney ORsan 20 (3)
Orkney, Shapinsay (T) Orkney ORsha 3
Orkney, South Ronaldsay (T) Orkney ORsro 17 (15)
Orkney, Westray (T) Orkney ORwes 33 (10)
Guernsey (M) Western-North WNgue 35
France (I)
Noirmoutier (T) Western-South WSnoi 30
Yeu (T) Western-South WSyeu 8
France (C)
Morbihan (T) Western-South WSmor 13
Vendée (T) Western-South WSven 19
Loire Atlantique (M) Western-South WSlat 12
Mt Saint-Michel (T) Western-North WNmsm 8
Caen (T) Western-North WNcae 29
Calais (T) Western-North WNcal 23
Île-de-France (T) Western-North WNidf 17
Vienne (T) Western-North WNvie 13
Cantal (M) Western-North WNcan 27
Côte-D'or (M) Western-North WNcdo 24

This article is protected by copyright. All rights reserved. 37
Aude (T) Western-South WSaud 30
Haute-Savoie (M) Western-North WNhsa 19
Spain (C) Various (M) Western-South WSspa 15
Germany (C)
Wolfach (T) Western-North WNwol 17
Lower Saxony (M) Central CElsa 23
Italy (C) Various (M) Italian IT 6
Balkan countries (C) Various (M) Eastern EAblk 30
Hungary (C) Various (M) Eastern EAhun 24
This article is protected by copyright. All rights reserved. 38
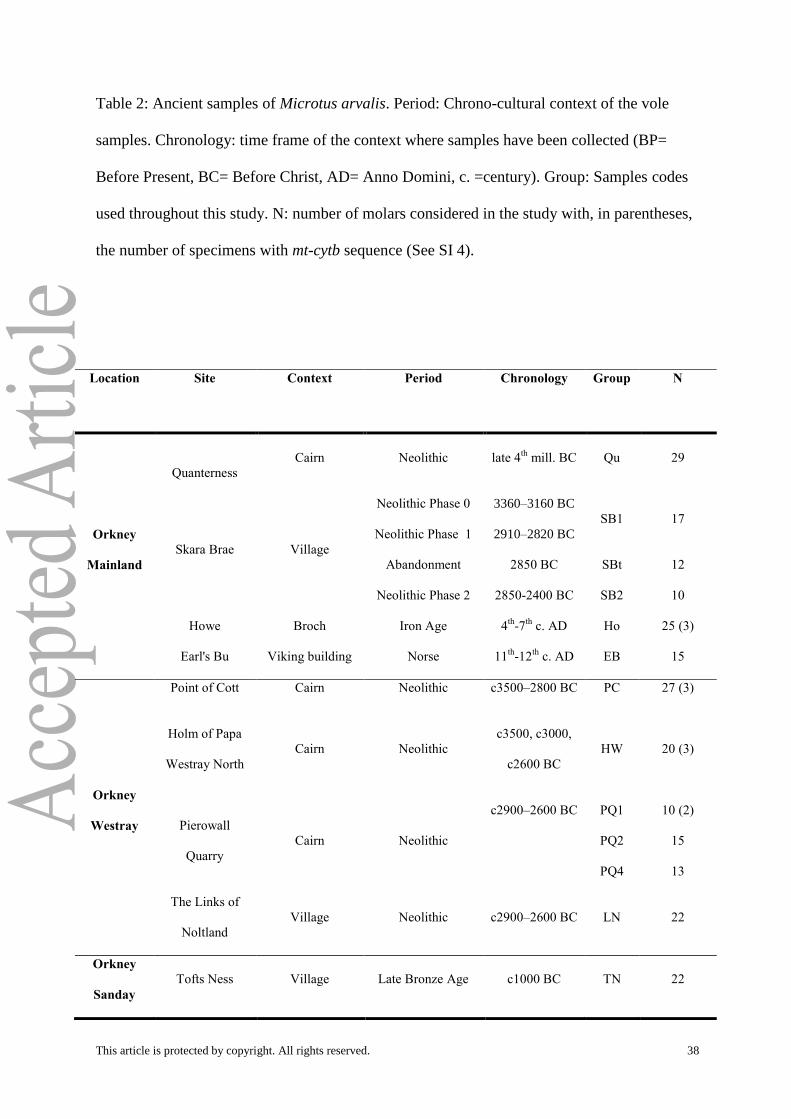
Table 2: Ancient samples of Microtus arvalis. Period: Chrono-cultural context of the vole
samples. Chronology: time frame of the context where samples have been collected (BP=
Before Present, BC= Before Christ, AD= Anno Domini, c. =century). Group: Samples codes
used throughout this study. N: number of molars considered in the study with, in parentheses,
the number of specimens with mt-cytb sequence (See SI 4).
Location Site Context Period Chronology Group N
Orkney
Mainland
Quanterness
Cairn Neolithic late 4th
mill. BC Qu 29
Skara Brae Village
Neolithic Phase 0
Neolithic Phase 1
3360–3160 BC
2910–2820 BC
SB1 17
Abandonment 2850 BC SBt 12
Neolithic Phase 2 2850-2400 BC SB2 10
Howe Broch Iron Age 4th
-7th
c. AD Ho 25 (3)
Earl's Bu Viking building Norse 11th
-12th
c. AD EB 15
Orkney
Westray
Point of Cott Cairn Neolithic c3500–2800 BC PC 27 (3)
Holm of Papa
Westray North
Cairn
Neolithic
c3500, c3000,
c2600 BC
HW 20 (3)
Pierowall
Quarry
Cairn Neolithic
c2900–2600 BC PQ1 10 (2)
PQ2 15
PQ4 13
The Links of
Noltland
Village Neolithic c2900–2600 BC LN 22
Orkney
Sanday
Tofts Ness Village Late Bronze Age c1000 BC TN 22

This article is protected by copyright. All rights reserved. 39
Spain L’Abreda Cave Solutrean
22000–17000
BP
Abr1 8
France
L'Abeurador Rock shelter Mesolithic 8000–6000 BC Abe 11
Melun Grüber Village Iron Age 1st–4
th c. AD MG 7
Belgium Abbaye Ninove Building Medieval 12th
c. AD AN 8

This article is protected by copyright. All rights reserved. 40
Table 3. A. Linear regression model testing for influence of climatic factors on centroid size.
B. Multivariate regression model testing for influence of climatic factors on shape (Procrustes
coordinates). r2 Permutation P values in bold and followed by an asterisk (*) remain
significant at 0.05 level.
A slope error intercept error r
2 Permutation P
latitude 21.0740 8.0120 16.6440 12.0780 0.30 0.0302*
longitude 0.0131 0.0272 4.5113 4.5113 0.01 0.6483
Tm -0.56663 0.89727 13.759 4.0787 0.01 0.6483
Tmax -2.6312 1.0362 30.444 4.7101 0.29 0.0327*
Tmin 1.1388 1.0088 -0.67746 4.5857 0.07 0.2681
Pm 14.625 5.3215 2.2146 24.19 0.33 0.0128*
Pmax 124.5200 58.1860 -86.9090 87.7180 0.22 0.0460*
Pmin 14.1480 19.4410 18.6460 21.8470 0.03 0.4767
B Predicted Sum of Squares Residual Sum of Squares % predicted Permutation P
latitude 0.001571 0.012390 11.25 0.0989
longitude 0.001262 0.012699 9.04 0.1504
altitude 0.000421 0.013540 3.01 0.0824
Tm 0.001667 0.012294 11.94 0.0674
Tmax 0.001724 0.012237 12.35 0.0743
Tmin 0.007832 0.013178 5.61 0.4128
Pm 0.001564 0.012396 11.21 0.0739
Pmax 0.001424 0.012537 10.20 0.1010
Pmin 0.000322 0.013639 2.31 0.9426

This article is protected by copyright. All rights reserved. 41
This article is protected by copyright. All rights reserved. 42

This article is protected by copyright. All rights reserved. 43

This article is protected by copyright. All rights reserved. 44

This article is protected by copyright. All rights reserved. 45

This article is protected by copyright. All rights reserved. 46

This article is protected by copyright. All rights reserved. 47
Copyright © 2022 FDOKUMEN