Long-term microtine dynamics in north Fennoscandian tundra: the vole cycle and the lemming chaos
12
ECOGRAPHY 15: 226-236. Copenhagen 1992 Long-term microtine dynamics in north Fennoscandian tundra: the vole cycle and the lemming chaos Lauri Oksanen and Tarja Oksanen Oksanen, L and Oksanen, T 1992 Long-term microtine dynamics in north Fen- noscandian tundra the vole cycle and the lemming chaos -Ecography 15 226-236 Densities of microtine rodents in two habitat complexes in the tundra of Finnmarks- vidda, Norwegian Lapland, were studied dunng 1977-89 by means of snap trapping (Small Quadrat Method) Predator populations were studied by mapping breeding raptors and by snow-tracking small mustelids During 1977-85, snow-trackmg was conducted only during peak and decline years, whereas during 1986-89, snow- trackmg was conducted every winter (November-December) and live-trapping (in August) was used as an additional method Lowland vole populations had regular density fluctuations with peaks in 1978-79. 1982-84 and 1987-88 Highland vole populations fluctuated less regularly and at lower over-all densities Highland lemming populations had two outbreaks, in 1978 and 1988, ending in abrupt winter crashes In the lowland, outbreak levels were reached only in 1978 All microtine declines in relatively productive lowland habitats were accompanied by intense activity of small mustelids. whereas avian predators were common only in 1983 Lowland declines also showed clear between-habitat asynchrony they started m areas with an exceptional abundance of productive habitats and then spread to more barren areas TTiese lowland data are consistent with the hypothesis of a mustelid-microtine hmit cycle, although also several other hypotheses remain unrefuted The highland lemming data suggest a simple exploiter- victim interaction between lemmings and the vegetation L Oksanen, Dept of Ecological Botany, Univ of Vme&, S-90I 87 Umed, Sweden - T Oksanen, Dept of Animal Ecology, Vniv of Umed, S-901 87 Umed, Sweden Introduction There is still no general agreement concerning the causes of sustained, multiannual piopulation fluctuations in herbivorous small mammals However, we are begin- ning to understand their geographical distribution. They occur at high latitudes (or altitudes) in areas with long, snowy winters (Keith 1974, Fntzgerald 1977, Batzli et al. 1980. Hansson and Henttonen 1985, Hansson 1987, 1988) Analysis of long-term data sets (L. Oksanen 1990) suggests that the fluctuations can be subdivided into two categones, each associated with a different geography Boreal taiga and subarctic brushwood areas are characterized by genuine, jjenodic cycles of voles Accepted 12 March 1991 © ECOGRAPHY 226 (or hares), while typical tundra areas show extremely violent but chaotic (ajjeriodic) lemming fluctuations The pattern of population fluctuations has implica- tions to the underlying causal mechanism. Chaotic fluc- tuations can be generated by strict resource-hmitation in a seasonal environment (L Oksanen 1990, see also May and Oster 1976). Cyclic fluctuations, m turn, can be created by cyclicity in external factors (Tast and Kalela 1971) or by density dependent regulation with substantial time-delay (May 1981) Such mechanisms include induced chemical defenses of food plants (Hau- kioja and Hakala 1975, Rhoades 1985), predation by specialists (L Oksanen 1990, Hanski et al 1991), a combination of predation and moderate food shortage ECOGRAPHY 15 2 (1992)
Transcript of Long-term microtine dynamics in north Fennoscandian tundra: the vole cycle and the lemming chaos

ECOGRAPHY 15: 226-236. Copenhagen 1992
Long-term microtine dynamics in north Fennoscandian tundra:the vole cycle and the lemming chaos
Lauri Oksanen and Tarja Oksanen
Oksanen, L and Oksanen, T 1992 Long-term microtine dynamics in north Fen-noscandian tundra the vole cycle and the lemming chaos -Ecography 15 226-236
Densities of microtine rodents in two habitat complexes in the tundra of Finnmarks-vidda, Norwegian Lapland, were studied dunng 1977-89 by means of snap trapping(Small Quadrat Method) Predator populations were studied by mapping breedingraptors and by snow-tracking small mustelids During 1977-85, snow-trackmg wasconducted only during peak and decline years, whereas during 1986-89, snow-trackmg was conducted every winter (November-December) and live-trapping (inAugust) was used as an additional methodLowland vole populations had regular density fluctuations with peaks in 1978-79.1982-84 and 1987-88 Highland vole populations fluctuated less regularly and atlower over-all densities Highland lemming populations had two outbreaks, in 1978and 1988, ending in abrupt winter crashes In the lowland, outbreak levels werereached only in 1978 All microtine declines in relatively productive lowland habitatswere accompanied by intense activity of small mustelids. whereas avian predatorswere common only in 1983 Lowland declines also showed clear between-habitatasynchrony they started m areas with an exceptional abundance of productivehabitats and then spread to more barren areas TTiese lowland data are consistentwith the hypothesis of a mustelid-microtine hmit cycle, although also several otherhypotheses remain unrefuted The highland lemming data suggest a simple exploiter-victim interaction between lemmings and the vegetation
L Oksanen, Dept of Ecological Botany, Univ of Vme&, S-90I 87 Umed, Sweden -T Oksanen, Dept of Animal Ecology, Vniv of Umed, S-901 87 Umed, Sweden
IntroductionThere is still no general agreement concerning thecauses of sustained, multiannual piopulation fluctuationsin herbivorous small mammals However, we are begin-ning to understand their geographical distribution. Theyoccur at high latitudes (or altitudes) in areas with long,snowy winters (Keith 1974, Fntzgerald 1977, Batzli etal. 1980. Hansson and Henttonen 1985, Hansson 1987,1988) Analysis of long-term data sets (L. Oksanen1990) suggests that the fluctuations can be subdividedinto two categones, each associated with a differentgeography Boreal taiga and subarctic brushwood areasare characterized by genuine, jjenodic cycles of voles
Accepted 12 March 1991© ECOGRAPHY
226
(or hares), while typical tundra areas show extremelyviolent but chaotic (ajjeriodic) lemming fluctuations
The pattern of population fluctuations has implica-tions to the underlying causal mechanism. Chaotic fluc-tuations can be generated by strict resource-hmitationin a seasonal environment (L Oksanen 1990, see alsoMay and Oster 1976). Cyclic fluctuations, m turn, canbe created by cyclicity in external factors (Tast andKalela 1971) or by density dependent regulation withsubstantial time-delay (May 1981) Such mechanismsinclude induced chemical defenses of food plants (Hau-kioja and Hakala 1975, Rhoades 1985), predation byspecialists (L Oksanen 1990, Hanski et al 1991), acombination of predation and moderate food shortage
ECOGRAPHY 15 2 (1992)
(Hanssoti 1969, 1979, 1987, Keith 1974) and diseases,alone (Anderson 1981) or linked with malnutntion(Hansson 1988, 1989) Social regulation has also beenclaimed to work this way (Chitty 1960, Krebs and Myers1974), although it seems to be difficult to generate suffi-cient time delays in social interactions without resortingto biologically unreasonable assumptions (Stenseth1981a, 1986)
Further clues to the causes of cyclic fluctuations canbe seen m the degree of between-habitat synchronyExternal sources of cyclicity predict synchrony betweenhabitats Similar synchrony should also be observed ifthe decline were initiated by forage depletion and se-vere malnutrition, because starving animals must beexpected to disperse widely m a desperate search forremaining habitats still supplying forage Predation, inturn, should generate substantial asychrony in areaswith large differences m habitat quahty Basic theory ofhabitat choice (Fretwell 1972) predicts that predatorsshould always fill the best habitat first and becomeinterested in low-quality habitats only after prey densi-ties in the best habitats have been substantially de-pressed Other hypotheses (induced defense, diseases,purely intrinsic mechanisms) are compatible with vari-ous degrees of between-habitat synchrony
In the present paper, we report a relatively long re-cord (1977 to 1989) of population changes in microtinerodents in an area at the transition between typical voleand lemming habitats We also report some data onpredator numbers, especially for the last four years ofthe study The trapping program is connected to a set ofstudies that aim to test the hypothesis of exploitationecosystems (Fretwell 1977, Oksanen et al. 1981, L. Ok-sanen 1990, T. Oksanen 1990), predicting that herb-ivore populations of barren areas are strictly resource-hmited, whereas those of more productive areas arecontrolled by predation In the present context, how-ever, we focus on reporting the general pattern of pop-ulation fluctuations and will consider other hypotheses,too
Area and methods of studyThe study was carried out in the IeSjavn basin, Norwe-gian Lapland (69°45'N, 24°E, 380-630 m a.s.l) during1977-1989 The basin belongs to the Baltic Shield and islimited to the north by the thrust cliff of the ScandesThe largest part of the basin can be regarded as he-miarctic or low aretic tundra (chiefly open terrain butwith willow thickets and, in the lowermost parts, evenpatches of birch woodland in favorable sites, see Ahti etal. 1%8). This part will be referred to as the lowlandAreas above 530 m a.s.l. were devoid of trees andwillow thickets. All even moderately abundant plantcommunities were dommated by mosses, lichens, trail-
ing dwarf shrubs or graminoids This zone will be re-ferred to as the highland complex
We lnitally tried to study small mammal dynamics bymeans of randomly sampled Small Quadrates (see Myl-lymaki et al 1971) However, we soon realized that,with the trapping effort realistic for us, such samplingwould not yield any voles during years of jxjpulationlows We thus resorted to stratified sampling The low-land was divided into following nine habitat types whoseabundances (percentages out of the whole complex)were estimated by a line transect of 32 6 km wind-barrens (19 8%), hchen-blueberry heaths (42 1%),mossy blueberry heaths (7 6%), dry meadows (2 6%),moist meadows (0 9%), alluvial thickets (0 2%), willowmires (1 0%), cloudberry bogs (1 1%) and open bogs(24 9%) (The word "meadow" is used in the broadbotanical sense, including all herb-rich habitats, ac-tually, the "meadows" were chiefly herb-rich willow ordwarf birch thickets, see KaUiola 1939) The highlandwas divided into following three habitat types whoseabundances were estimated by a line transect of 16 4km heaths and heath snowbeds (71 3%), meadowsnowbeds (2 1%) and bogs (26 6%) Each habitat wasinitially represented by 5 Small Ouadrats, each with 12traps arranged in groups of three at intervals of 15 m,kept open for two days and checked daily After 1982,the prevailing lichen heath habitat of the lowland wasrepresented by 7 SO s and after 1985, the highlandheath complex was represented by 6 quadrates Trap-ping was performed twice a year (immediately after thesnowmelt and after the tundra had turned red) Therewas no autumn trapping m 1980-82 or m 1985
Although the exact location of SO s has changedduring the course of the work, all fieldwork has beencarried out withm a radius of 15 km from Lake IeSjavnDuring 1977-82 the SO.s were subjectively distributedalong convenient trapping routes in an area east ofIesjavn (map. Oksanen and Oksanen 1981, Fig 1)During 1983-85, lowland trapping was performed southof the lake (map Oksanen et al 1991, Fig 6) and thearea was divided into two subareas "riverside" (dis-tance to the main river < 1 km, birch woodlots andwillow thickets abundant) and "upland" (treeless tun-dra) In 1986, the study area was moved to the north-western part of the basin A north-south coordinateline, running from the lowermost part of the lowlandacross the thrust cliff to a highland plateau, was chosenas a baseline and SQ s were situated at least 50 m fromeach other and as close to the baseline as possible (mapOksanen 1991, Fig 2a) The area transected by the linewas divided into five sections (one for highland, four forlowland, with vastly different habitat distributions: the"slope" immediately below the thrust cliff having thehighest abundance of productive habitats, the "marsh"(at the base of the slope), "valley" (1-2 km south of thecliff) and "divide" (> 2 km south of the cliff) withsuccessively heavier predominance of barren heaths andbop.
15* ECOORAPHY 15.2 (1992) 227
10-
5-
—• Voles-o Lemmings
i\
0 05- / / !
77 78 79 80 81 82 83 84 85 86 87 88 89Year
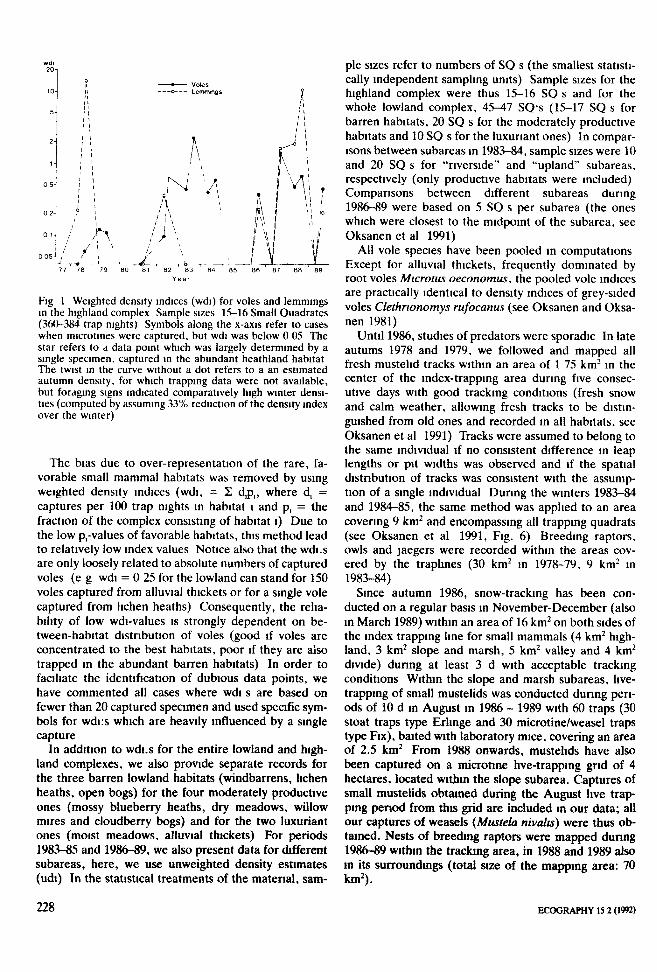
Fig 1 Weighted density indices (wdi) for voles and lemmingsin the highland complex Sample sizes 15-16 Small Quadrates(360-384 trap nights) Symbols along the x-axis refer to caseswhen microtines were captured, but wdi was below 0 05 Thestar refers to a data point which was largely determined by asingle specimen, captured in the abundant heathland habitatThe twist in the curve without a dot refers to a an estimatedautumn density, for which trapping data were not available,but foraging signs indicated comparatively high winter densi-ties (computed by assuming 33% reduction of the density indexover the winter)
The bias due to over-representation of the rare, fa-vorable small mammal habitats was removed by usingweighted density indices (wdi, = 2 d.p,, where d, =captures per 100 trap nights in habitat l and p, = thefraction of the complex consisting of habitat l) Due tothe low p,-values of favorable habitats, this method leadto relatively low index values Notice also that the wdi.sare only loosely related to absolute numbers of capturedvoles (e g wdi = 0 25 for the lowland can stand for 150voles captured from alluvial thickets or for a single volecaptured from lichen heaths) Consequently, the relia-bility of low wdi-values is strongly dependent on be-tween-habitat distribution of voles (good if voles areconcentrated to the best habitats, poor if they are alsotrapped in the abundant barren habitats) In order tofacihate the identification of dubious data points, wehave commented all cases where wdi s are based onfewer than 20 captured specimen and used specific sym-bols for wdi:s which are heavily influenced by a singlecapture
In addition to wdi.s for the entire lowland and high-land complexes, we also provide separate records forthe three barren lowland habitats (windbarrens, lichenheaths, open bogs) for the four moderately productiveones (mossy blueberry heaths, dry meadows, willowmires and cloudberry bogs) and for the two ltixuriantones (moist meadows, alluvial thickets) For periods1983-85 and 1986-89, we also present data for differentsubareas, here, we use unweighted density estimates(udi) In the statistical treatments of the matenal, sam-
ple sizes refer to numbers of SO s (the smallest statisti-cally independent sampling units) Sample sizes for thehighland complex were thus 15-16 SO s and for thewhole lowland complex, 45^7 SO s (15-17 SO s forbarren habitats, 20 SO s for the moderately productivehabitats and 10 SO s for the luxuriant ones) In compar-isons between subareas m 1983-84, sample sizes were 10and 20 SO s for "riverside" and "upland" subareas.respectively (only productive habitats were included)Comparisons between different subareas during1986-89 were based on 5 SO s per subarea (the oneswhich were closest to the midpoint of the subarea, seeOksanen et al 1991)
All vole species have been pooled in computationsExcept for alluvial thickets, frequently dominated byroot voles Mtcrottis oeconomus. the pooled vole indicesare practically identical to density indices of grey-sidedvoles Clethrtonomys rufocanus (see Oksanen and Oksa-nen 1981)
Until 1986, studies of predators were sporadic In lateautums 1978 and 1979, we followed and mapped allfresh mustelid tracks withm an area of 1 75 km- m thecenter of the index-trapping area dunng five consec-utive days with good tracking conditions (fresh snowand calm weather, allowing fresh tracks to be distin-guished from old ones and recorded m all habitats, seeOksanen et al 1991) Tracks were assumed to belong tothe same individual if no consistent difference in leaplengths or pit widths was observed and if the spatialdistnbution of tracks was consistent with the assump-tion of a single individual Dunng the winters 1983-84and 1984-85, the same method was applied to an areacovering 9 km^ and encompassing all trapping quadrats(see Oksanen et al 1991, Fig. 6) Breeding raptors,owls and jaegers were recorded within the areas cov-ered by the traphnes (30 km^ m 1978-79, 9 km' in1983-84)
Since autumn 1986, snow-tracking has been con-ducted on a regular basis in November-December (alsoin March 1989) within an area of 16 km^ on both sides ofthe index trapping line for small mammals (4 km^ high-land, 3 km^ slope and marsh, 5 km^ valley and 4 km^divide) dunng at least 3 d with acceptable trackingconditions Withm the slope and marsh subareas, live-trapping of small mustelids was conducted dunng peri-ods of fO d in August in 1986 - 1989 with 60 traps (30stoat traps type Erlinge and 30 microtine/weasel trapstype Fix), baited with laboratory mice, covering an areaof 2.5 km^ From 1988 onwards, mustelids have alsobeen captured on a microtme hve-trappmg gnd of 4hectares, located within the slope subarea. Captures ofsmall mustelids obtained during the August live trap-ping penod from this grid are included in our data; allour captures of weasels {Mustela nivalis) were thtis ob-tained. Nests of breeding raptors were mapped dunng1986-89 withm the tracking area, in 1988 and 1989 alsoin its surroundings (total size of the mapping area: 70k ^ )
228 ECOGRAPHY 15 2 (1992)

• voleso Lemmtngs
80 81 82 83 84 85 86 87 88 69
Year
Fig 2 Weighted density indices (wdi) for voles and lemmingsin the lowland Sample sizes 45-47 Small Quadrats (1080 -1152 trap nights) Symbols as in Fig 1
ResultsGeneral population trends in microtine rodents
Lemmings had two outbreaks in highland habitats, m1978 and 1988 Both outbreaks were characterized byJ-shaped growth curves, ending m abrupt crashes (Fig.1) No lemmings were trapped immediately after thecrash, but dozens of apparently intact dead bodies werefound m places where lemmings were trapped in theprevious fall, and the habitat was largely destroyed (Ok-sanen and Oksanen 1981, Moen et al unpubl data)The first indications of a developing lemming peak wereobtained in 1977, when 11 specimens were captured inthe uppermost willow thickets of the study area, at thetransition between the lowland and the highland com-plexes (6 from regular grids, 5 from an additional trap-hne) In 1978, lemmings reached outbreak levels in thewhole study area (Figs 1 and 2). The lemming crashensued in 1978-79, when vole indices remained high inthe lowland and low but unchanged in the highland Thenext lemming outbreak m 1988 coincided with a voledecline and was largely restricted to the highland. Lem-mings were present in the majonty of lowland habitats,but in low numbers only The 198S-*9 decline in low-land populations of lemmings was neither dramatical(absolute numbers of captured specimens. 18 in autumn1988,1 in spnng 1989, 2 in autumn 1989) nor accompa-nied by visible habitat devastation
During the period 1979-^5, only five lemmings weretrapped. Two ones were caught m 1981 in the lowlandand dose to the lowland-highland interface. Three werecaptured in 1982-83 m the uppermost part of the high-land (above 600 m a.s.l.), where also the first lemmingsof the next outbreak were caught (two specimens in
wdi. n
20-
— Voles, kixunant haMats— Voles, modsrately productfve haMats° Stoats• Weasels
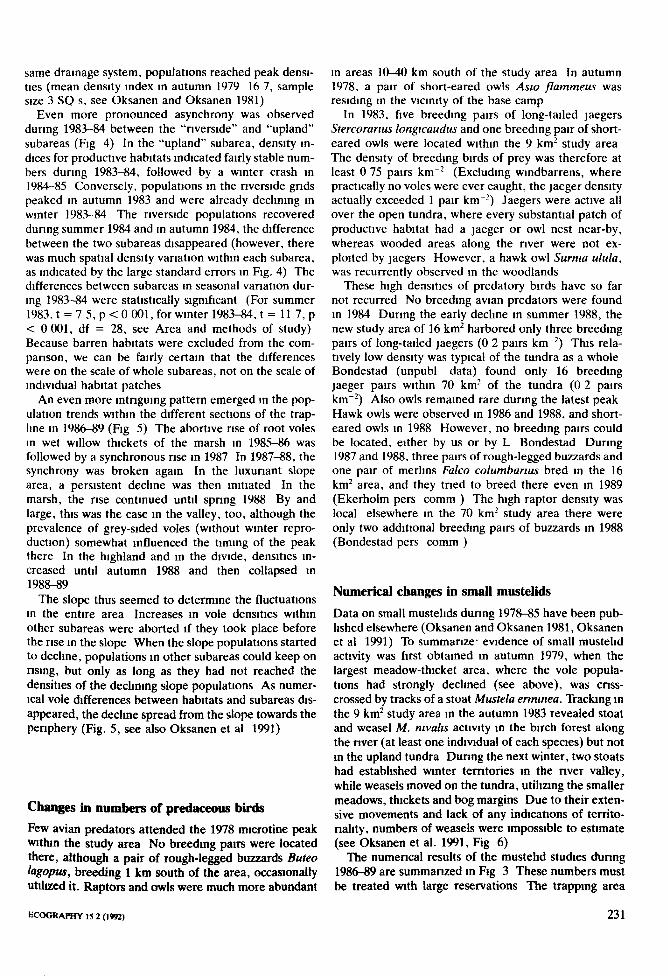
Fig 3 Weighted density indices (wdi) for voles in moderatelyproductive lowland habitats (sample sizes 20 SQ s or 480 trapnights) and in luxuriant ones (sample sizes 10 SO s or 240 trapnights), results of mustelid censuses (n, minimum numbersalive)
autumn 1986) Additional information of lemmings dur-ing population lows was obtained by interviewing rein-deer herdsmen during their spnng and autumn migra-tions Both in 1979 and m 1989, sightings were onlyreported from lowland areas
Vole populations in the lowland fluctuated in a seem-ingly regular cycle with a periodicity of 4 5 yr (Fig 2)The largest aberration in lowland wdi s was a summerdecline m 1983 in the middle of an extended peakphase (Due to the difference m reproductive statusbetween spnng and autumn, this decline m index valuesneed not indicate an actual numerical decrease, morehkely, it indicates an abnormally weak summer in-crease ) The 1982-84 peak was extended over a largepart of northern Fennoscandia (Henttonen et al 1987),but summer declines m density indices were not re-ported from other areas The depths of populationcrashes also seemed variable However, due to the lownumbers of lndivduals captured during rock-bottomsprings (1 to 12) and the relatively even between-habitat
Table 1 Numbers of captured voles in barren lowland habitats(windblown ndges, blueberry-lichen heaths and open bogs)Sample sizes 15 SO s (360 trap nights) in 1977-82, 17 SO s(408 trap nights) in 1983-^9 - = no trapping
spring autumn
1977197819791980198119821983198419851986198719881989
—06005173101101
0145--—1213-320132
ECOGRAPHY 15:2 (1992)229

s83 s84 f84 s85
Fig 4 Unweighted mean density indices (udi) dunng 1983-85for upland and riverside quadrates representing luxuriant andmoderately productive habitats collectively Bars refer to stan-dard errors Sample sizes upland 20 SO s. nvenside 10 SO s
distribution of voles during declines (Oksanen and Ok-sanen 1981, Ekerholm and Oksanen unpubl. data), thewdi:s for collapsing populations have wide margins oferror
Population trends in the productive habitats (Fig 3)by and large matched the over-all picture The maindistinctive feature was an abortive rise in 1985-86 andstagnation in 1986 within the luxuriant habitats Ac-tually, It was a question of two different phenomena astagnation at a low level within tall herb habitats (onlyone vole captured in spnng and in autumn 1986) and asummer crash m alluvial thickets (9 root voles caught inthe spnng, none in the autumn) Although the numbersinvolved were low, this development was in such strik-ing contrast with the strong nse in moderately produc-tive habitats (Fig. 3) that it calls for an explanation.
In barren habitats, vole densities were always low(Table 1) The fact that some voles were captured frombarren habitats during two of the three crash yearssuggests that the amplitude m barren habitats was es-sentially lower than in productive ones The data areconsistent with the idea that population fluctuations inbarren habitats were basically seasonal, but the winterdechnes were occasionally swamf)ed by dispersal of re-producing voles from densely populated productivehabitats (see Ims 1987, 1990)
There were very few voles in the highland complexEven during the "peaks" (1978-1979, 1983, 1987), thenumbers of captured specimens per trapping occasionwere low (7 to 11) The large difference in wdi:s be-tween the 1978-1979 "peak" and the two subsequent
ones was due to differences m the habitat distribution(only meadows yielded voles m 1978-1979)
Spatial differences in population trends
In broad outline, the vole fluctuations in the study areawere synchronous with those of Finnish Lapland (Hent-tonen and Jarvinen 1981, Henttonen et al 1987, Jarvi-nen 1987, Haukisalmi et al 1989), and fairly synchro-nous even with those of central Scandinavia (Hornfeldt1991) However, strict local synchrony was limited tothe final stages of the crashes, whereas the initial stagesof declines showed pronounced local variations In1979, there was a summer crash m the largest patch ofluxuriant herb habitats (mean density index in autumn1979 2 5, sample size 5 SQ s), while in smaller andmore isolated patches of the same habitats within the
ud
30-
20-
10- J
I I
•[//'/
\\\
jI
jI
—
\
A. i
\i1»i;l• t
; 1
;
highland
marshvaliey
aiviue
I
- ';\\\\\\\\'^n\\\
i l
86 87 88 89
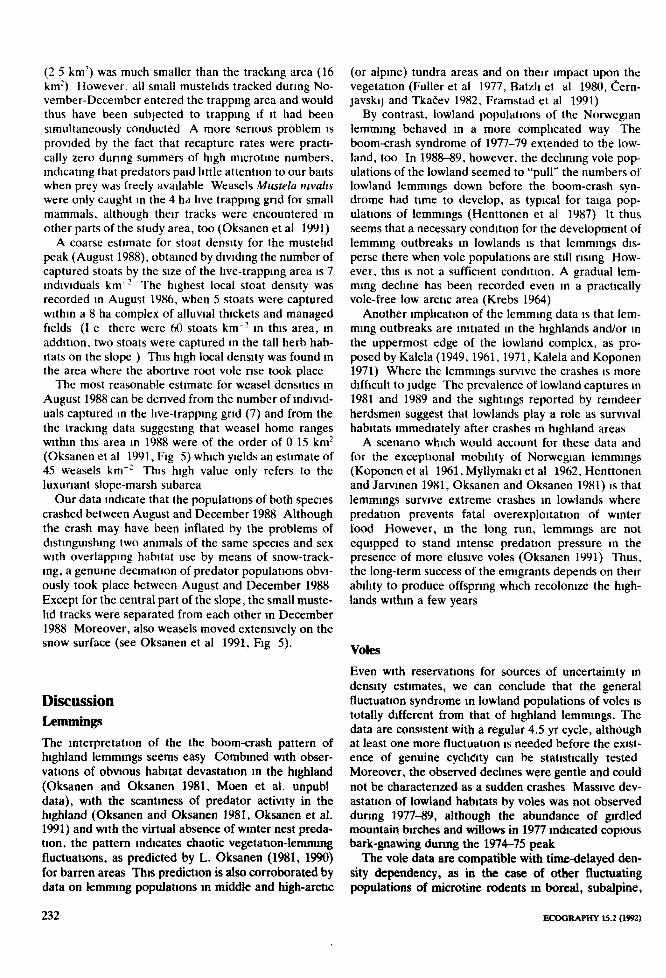
Fig 5 Unweighted mean density indices (udi) for the foursubareas of the lowland and for the highland dunng 1986-89Sample sizes 5 SQ: s for all subareas
230 ECOGRAWIY 15 2 (W92)
same drainage system, populations reached peak densi-ties (mean density index in autumn 1979 16 7, samplesize 3 SQ s. see (3ksanen and Oksanen 1981)
Even more pronounced asynchrony was observedduring 1983-84 between the "riverside" and "upland"subareas (Fig 4) In the "upland" subarea, density in-dices for productive habitats indicated fairly stable num-bers during 1983-84, followed by a winter crash in1984-85 Conversely, populations m the riverside gridspeaked in autumn 1983 and were already declining mwinter 1983-84 The riverside populations recoveredduring summer 1984 and in autumn 1984, the differencebetween the two subareas disappeared (however, therewas much spatial density variation within each subarea,as indicated by the large standard errors in Fig. 4) Thedifferences between subareas in seasonal variation dur-ing 1983-84 were statistically significant (For summer1983, t = 7 5, p < 0 001, for winter 1983-84, t = 11 7, p< 0 001, df = 28, see Area and methods of study)Because barren habitats were excluded from the com-parison, we can be fairly certain that the differenceswere on the scale of whole subareas, not on the scale ofindividual habitat patches
An even more intriguing pattern emerged in the pop-ulation trends within the different sections of the trap-line m 1986-89 (Fig 5) The abortive rise of root volesin wet willow thickets of the marsh in 1985-86 wasfollowed by a synchronous nse in 1987 In 1987-88, thesynchrony was broken again In the luxuriant slopearea, a persistent decline was then initiated In themarsh, the nse continued until spnng 1988 By andlarge, this was the case in the valley, too, although theprevalence of grey-sided voles (without winter repro-duction) somewhat influenced the timing of the peakthere In the highland and m the divide, densities in-creased until autumn 1988 and then collapsed in198&-89
The slope thus seemed to determine the fluctuationsin the entire area Increases in vole densities withmother subareas were aborted if they took place beforethe rise in the slope When the slope populations startedto decline, populations m other subareas could keep onnsmg, but only as long as they had not reached thedensities of the dechning slope populations As numer-ical vole differences between habitats and subareas dis-appeared, the decline spread from the slope towards thepenphery (Fig. 5, see also Oksanen et al 1991)
in numbers of predaceous birds
Few avian predators attended the 1978 microtine peakwithin the study area No breedmg pairs were locatedthere, although a pair of rough-legged buzzards Buteolagopus, breeding 1 km south of tlie area, occasionallyutilized it. Raptors and owls were much more abundant
in areas 10-40 km south of the study area In autumn1978, a pair of short-eared owls Asto flammeus wasresiding m the vicinity of the base camp
In 1983, five breeding pairs of long-tailed jaegersStercorartus longicaudus and one breeding pair of short-eared owls were located within the 9 km' study areaThe density of breeding birds of prey was therefore atleast 0 75 pairs km"' (Excluding windbarrens, wherepractically no voles were ever caught, the jaeger densityactually exceeded 1 pair km"^) Jaegers were active allover the open tundra, where every substantial patch ofproductive habitat had a jaeger or owl nest near-by,whereas wooded areas along the river were not ex-ploited by jaegers However, a hawk owl Surnta ulula,was recurrently observed in the woodlands
These high densities of predatory birds have so farnot recurred No breeding avian predators were foundin 1984 Dunng the early decline in summer 1988, thenew study area of 16 km' harbored only three breedingpairs of long-tailed jaegers (0 2 pairs km"^) This rela-tively low density was typical of the tundra as a wholeBondestad (unpubl data) found only 16 breedingjaeger pairs within 70 km* of the tundra (0 2 pairskm"^) Also owls remained rare dunng the latest peakHawk owls were observed in 1986 and 1988, and short-eared owls in 1988 However, no breeding pairs couldbe located, either by us or by L Bondestad Dunng1987 and 1988, three pairs of rough-legged buzzards andone pair of merlins Palco columbarius bred m the 16km^ area, and they tned to breed there even in 1989(Ekerholm pers comm ) The high raptor density waslocal elsewhere in the 70 km^ study area there wereonly two additional breeding pairs of buzzards m 1988(Bondestad pers comm )
Numerical changes in small mustelids
Data on small mustelids dunng 1978-85 have been pub-lished elsewhere (Oksanen and Oksanen 1981, Oksanenet al 1991) To summanze- evidence of small mustelidactivity was first obtained in autumn 1979, when thelargest meadow-thicket area, where the vole popula-tions had strongly declined (see above), was criss-crossed by tracks of a stoat Mustela erminea. Tracking inthe 9 km^ study area in the autumn 1983 revealed stoatand weasel M. ntvalis activity in the birch forest alongthe river (at least one individual of each species) but notm the upland tundra Dunng the next winter, two stoatshad established winter terntories in the nver valley,while weasels moved on the tundra, utilizing the smallermeadows, thickets and bog margins Due to their exten-sive movements and lack of any indications of territo-nality, numbers of weasels were impossible to estimate(see Oksanen et al. 1991, Fig 6)
The numencal results of the mustelid studies dtinng1986-89 are summanzed in Fig 3 These numbers mustbe treated with large reservations The trapping area
ECOORAPHY 15 2 (1992) 231
(2 5 km-) was much smaller than the tracking area (16km") However, all small mustelids tracked during No-vember-December entered the trapping area and wouldthus have been subjected to trapping if it had beensimultaneously conducted A more serious problem isprovided by the fact that recapture rates were practi-cally zero dunng summers of high microtine numbers,indicating that predators paid little attention to our baitswhen prey was freely available Weasels Mttstela ntvaltswere only caught m the 4 ha live trapping grid for smallmammals, although their tracks were encountered mother parts of the study area, too (Oksanen et al 1991)
A coarse estimate for stoat density for the mustelidpeak (August 1988), obtained by dividing the number ofcaptured stoats by the size of the hve-trapping area is 7individuals km^- The highest local stoat density wasrecorded in August 1986, when 5 stoats were capturedwithin a 8 ha complex of alluvial thickets and managedfields (I e there were 60 stoats km"- in this area, inaddition, two stoats were captured in the tall herb hab-itats on the slope ) This high local density was found inthe area where the abortive root vole nse took place
The most reasonable estimate for weasel densities inAugust 1988 can be derived from the number of individ-uals captured in the live-trapping grid (7) and from thethe tracking data suggesting that weasel home rangeswithin this area in 1988 were of the order of 0 15 km^(Oksanen et al 1991, Fig 5) which yields an estimate of45 weasels km"- This high value only refers to theluxuriant slope-marsh subarea
Our data indicate that the populations of both speciescrashed between August and December 1988 Althoughthe crash may have been inflated by the problems ofdistinguishing two animals of the same species and sexwith overlapping habitat use by means of snow-track-mg, a genuine decimation of predator populations obvi-ously took place between August and December 1988Except for the central part of the slope, the small muste-lid tracks were separated from each other m December1988 Moreover, also weasels moved extensively on thesnow surface (see Oksanen et al 1991, Fig 5).
DiscussionLemmings
The interpretation of the the boom-crash pattem ofhighland lemmings seems easy Combined with obser-vations of obvious habitat devastation in the highland(Oksanen and Oksanen 1981, Moen et al. unpubidata), with the scantiness of predator activity in thehighland (Oksanen and Oksanen 1981, Oksanen et al.1991) and with the virtual absence of winter nest preda-tion, the pattem indicates chaotic vegetation-lemmingfluctuations, as predicted by L. Oksanen (1981, 1990)for barren areas This prediction is also corroborated bydata on lemming populations in middle and high-arctic
(or alpine) tundra areas and on their impact upon thevegetation (Fuller et al 1977, Batzli et al 1980, Cern-javskij and Tkacev 1982, Framstad et al 1991)
By contrast, lowland populations of the Norwegianlemming behaved in a more complicated way Theboom-crash syndrome of 1977-79 extended to the low-land, too In 1988-89, however, the declining vole pop-ulations of the lowland seemed to "pull" the numbers oflowland lemmings down before the boom-crash syn-drome had time to develop, as typical for taiga pop-ulations of lemmings (Henttonen et al 1987) It thusseems that a necessary condition for the development oflemming outbreaks in lowlands is that lemmings dis-jjerse there when vole populations are still rising How-ever, this IS not a sufficient condition. A gradual lem-ming decline has been recorded even in a practicallyvole-free low arctic area (Krebs 1964)
Another implication of the lemming data is that lem-ming outbreaks are initiated in the highlands and/or mthe uppermost edge of the lowland complex, as pro-posed by Kalela (1949,1961,1971, Kalela and Koponen1971) Where the lemmings survive the crashes is moredifficult to judge The prevalence of lowland captures in1981 and 1989 and the sightings reported by reindeerherdsmen suggest that lowlands play a role as survivalhabitats immediately after crashes in highland areas
A scenano which would account for these data andfor the exceptional mobility of Norwegian lemmings(Koponen etal 1%1, Myllymakiet al 1962, Henttonenand Jarvinen 1981, Oksanen and Oksanen 1981) is thatlemmings survive extreme crashes m lowlands wherepredation prevents fatal overexploitation of winterfood However, in the long run, lemmings are notequipped to stand intense predation pressure in thepresence of more elusive voles (Oksanen 1991) Thus,the long-term success of the emigrants dep)ends on theirability to produce offspring which recolonize the high-lands within a few years
Voles
Even with reservations for sources of uncertainly indensity estimates, we can conclude that the generalfluctuation syndrome in lowland populations of voles istotally different from that of highland lemmings. Thedata are consistent with a regular 4.5 yr cycle, althoughat least one more fluctuation is needed before the exist-ence of genuine cychdity can be statistically testedMoreover, the observed declines were gentle and couldnot be characterized as a sudden crashes Massive dev-astation of lowland habitats by voles was not observeddunng 1977-89, although the abundance of girdledmountain birches and willows in 1977 indicated copiousbark-gnawing dunng the 1974-75 peak
The vole data are compatible with time-delayed den-sity dependency, as in the case of other fluctuatingpopulations of microtine rodents in boreal, subdpine,
232 ECOORAPHY 15J (1992)

subarctic and low-arctic areas (Krebs 1964, Fitzgerald1977, Viitala 1977, Henttonen et al 1977, 1987, An-dersson and Jonasson 1986, Hornfeldt 1991) Acutefood shortage may have occurred in 1975 even in thebest habitats, as indicated by signs of widespread bark-gnawmg (above, see also Hansson 1969) Dunng1977-89 however, the coverages of willows and dwarfbirches were more than doubled m our permanent plots(Oksanen 1988, Table 2) and massive bark-gnawing wasnever observed Thus, obvious food depletion in thebest habitats does not form a recurrent component inthe cycle
The summer decline (or lack of summer rise) in opentundra dunng 1983 co-occurred with exceptionally highjaeger densities (compare to Andersson 1976) Evenmore pronounced summer declines are common in thearctic where they are usually attributed to jaegers, owlsor both (Pitelka 1973, Fuller et al 1977, Batzli et al1980) Thus, the Korpimaki-Norrdahl (1989) hypothesisof the dampening impact of avian predators on micro-tine peaks seems to be sometimes applicable to tundraareas, too. However, in Fennoscandian conditions, suchimpacts are not regular components of the cycle
The wave-like spreading of microtine declines fromareas with exceptional abundance of luxuriant vegeta-tion to typical tundra areas seems to rule out all mecha-nisms where weather or synchrony in production ofhigh-quality plant organs plays a central role (Kalela1962, Tast and Kalela 1971, see also Lame and Hentto-nen 1983, Oksanen and Encson 1987) Also Keith's(1974) hypothesis of starvation due to acute food short-age as a triggering cause for the decline is difficult toreconcile with this asynchrony, because starving animalsshould disperse to areas where food still is available
Two classes of hypotheses can be readily reconciledwith the spatial asynchrony of population declines Thefirst one consists those hypotheses, where the decline istightly connected to the local population developmentthe stress hypothesis of Christian and Davies (1964), thegenetic-behavioral hypothesis (Chitty 1960, Krebs andMyers 1974), the social fence hypothesis of Hestbeck(1982), the hypothesis of lnducible chemical defenses(Haukioja and Hakala 1975) and its vanant which con-nects chemical defenses to juvenile shoot morphology(Bryant and Kuropat 1980). Under these hypotheses,local asynchrony can anse as a consequence of differenttiming of population nses m optimal and suboptimalareas Another class of hypoteses compatible with localasynchrony consists of those where natural enemieshave a central position (Anderson 1981, Oksanen et al1981, L. Oksanen 1981,1990, Hansson 1987,1988, Sin-clair et al. 1988, Hanski et al. 1991). Here, the source ofasynchrony lies either in infestation dynamics of patho-gens or in the habitat choise of predators
Our data present some problems for both classes ofhypotheses. The fact that lemmings declined in the low-land in 1988-^9 without having even approached out-break numben (see also Henttonen et al 1987) pro-
vides difficulties for the first-mentioned class Lem-mings are aggressively superior to grey-sided voles(Henttonen et al 1977) and have practically no overlapm feeding niche with them (Kalela 1957, 1961, 1971)Thus, both interspecific aggression and lnterpecific in-duction of chemical defenses seem implausible. Thehyjx)thesis of induced defense has also other problems,when applied to the interaction between grey-sidedvoles and blueberry twigs of the Fennoscandian tundraChanges in secondary chemistry of the blueberry do notfollow the vole cycle (Jonasson et al 1986, Lame andHenttonen 1987) and heavy grazing seems to improvethe quality of blueberry twigs (Oksanen et al 1987)
The problem with hypotheses emphasizing the role ofnatural enemies lies in numbers and in the apparenthealthiness of voles in 1988 In our hve-trappmg studyof microtines (Ekerholm et al unpubl data), we did notfind any indications of poor condition or lowered repro-ductive output during the dechne summer Vole densi-ties of within the slope subarea were c 50ha"'(ie 5000km"^) This implies a monthly production rate of c 15000 voles km'- Our data for the same subarea indicatea peak density of c 50 small mustelids km - Thus, c300 voles were monthly produced for each small muste-lid The assumption of copious surplus killing at highprey densities (Stenseth 1981b, Abrams 1982, Oksanenet al 1985) is well needed if the summer decline is to beattributed to predation
Conclusions and perspectives for futureworkThe data reported here suggest that the dichotomy be-tween vole cycles and lemming chaos (L. Oksanen1990) exists even locally at a transition between areaswith low and middle arctic characteristics The chaoscan be readily understood as a consequence of interac-tions between lemmings and the plant cover Conver-sely, the cycles can be produced by a number of mech-nisms incorporating time-delayed density dependenceThe observed spatial differences in the timing of thedecline seem to rule out some candidates, but a manyothers remain unrefuted.
When trying to identify the sufficient conditions forthe cyclic dechnes, we can proceed by using a pop-ulation-level modification of Koch's (1881) postulatesAccording to this approach, a factor can be regarded asa sufficient cause of the decline if (1) it is always theredunng population declines, (2) its experimental intro-duction creates a decline while surrounding populationsare not declining and (3) its presence can be verifieddunng the final stages of the experimental decline Pos-tulates (2) and (3) can be replaced by following, log-ically equivalent postulates: (2') the experimental exclu-sion of the factor prevents a decline while surroundingpopulations are declining and (3') the absence of the
ECOGRAPHY 15-2 (W92) 233

factor m the expenmental area can be verified duringthe collapse of surrounding jropulations
In the case of natural enemies, postulate (1) is solidlycorroborated for microparasites, macroparasites, avianpredators and mammalian ones (above, Krebs 1964,Andersson 1976, Viitala 1977, Fitzgerald 1977, Horn-feldt 1978, Korpimaki 1985, Henttonen et al 1987,Haukisalmi et al 1989, Hornfeldt et al 1989) How-ever, a stronger version of postulate (1), requiring pres-ence m sufficiently large numbers to indicate a plausiblecausal connection to population declines remains to beverified for natural enemies other than small mustelids
Postulate (2) has been once verified for small muste-lids Experimental introduction of a weasel to an islandwith 7 ha of productive habitat coincided with a localdecline while populations on other islands increased(Oksanen and Oksanen 1981) However, the weaselwas not recaptured Later attempts to repeat the experi-ment have failed due to technical problems (escape of aradio-collared expenmental stoat, uncontrolled preda-tor invasions, Oksanen and Oksanen unpubl data) Amacro-scale test of postulate (2') was provided by theNorwegian jwlicy to exterminate all predators during1900-1920, which seemed to stop vole cycles (Steen etal 1990) However, the experiment sufferes from the"Kaibab syndrome" (lack of control, vague data) Desyand Batzli (1989) executed a predator exclosure experi-ment with impeccable design, but in such small spatialand temporal scale that the results are inconclusive mthe present context
The probably most fruitful way to go further consistsof mesoscale experiments, focusing on postulates (2')and (3') The scale of the experiment needs to be largeenough to allow treatment of entire landscape units, sothat blocked dispersal can be excluded as an alternativeexplanation (see Krebs et al 1973) Due to financialconstraints, this scale can probably be only achieved bysacrificing replication, as done m the island experimentof Marcstrom et al (1988) on the impact of martens andfoxes upon population dynamics of gallinaceous birds
Acknowledgements - In the field work, the contribution ofseveral field assistents has been indispensable The most pro-found contributions were made by A Lukkan, L Bondestad,P Ekerholm, S From, A Graner, P Lundberg, M Norberg,R Nordbakke, S Oksanen and B Romsdal H Henttonenprovided valuable advice in several stages of the work Alsodiscussions with S Fretwell, L Hansson and J Moen havebeen instructive The logistical help of A Johnsen and HRomsdal were indispensable, and the co-operative attitude ofNorwegian authorities, particularly J Halvorsnid and TAseth, was extremely valuable Earlier drafts of the manu-script were contstructively cnticized by L Hansson, C King,C Otto and N C Stenseth TTie figures were drawn by GMarklund The study was supported by a grants from NFR(Swedish Natural Science Research Council), the Academy ofFinland, the Kempe Foundation and the Hierta-Retzius foun-dation
ReferencesAbrams, P A 1982 Functional responses of optimal foragers
- A m Nat 120 382-390Ahti, T , Hamet-Ahti, L and Jalas, J 1968 Vegetation zones
and their sections in northwestern Europe - Ann BotFenniciS 169-211
Anderson, R M 1981 Population ecology of infectious dis-ease agents - In May, R (ed ), Theoretical ecology pnn-ciples and applications Blackwell, London, pp 318-355
Andersson. M 1976 Population ecology of the long-tailedskua. {StercorariuslongicaudusViell ) - J Anim Ecol 45537-559
- and Jonasson. S 1986 Rodent cycles m relation to foodresources on an alpine heath - Oikos 46 93-106
Batzh, G O , White, R G , MacLean, S F Jr , Pitelka, F Aand Collier, B D 1980 The herbivore-based trophic sys-tem - In Brown, J et al (eds). An arctic ecosystem thecoastal tundra at Barrow, Alaska Dowden, Hutchinson &Ross. Stroudsburg PA. pp 335^10
Bryant, J P and Kuropat, P J 1980 Selection of winterforage by subarctic browsmg vertebrates the role of plantchemistry -Ann Rev Ecol Syst 11 261-258
Cernjavskij,F B andTkacev,A V 1982 Populacionnye cikhlemmmgov v arktike ekologiceskie l endokrynnye aspekty- Nauka. Moscow
Chitty, D 1960 Population processes m the vole and theirrelevance to general theory -Can J Zool 38 99-113
Christian, J J and Davies, D D 1964 Endocrmes, behaviorand populations - Science 146 1550-1560
Desy, E A and Batzh, G O 1989 Effects of food availabihtyand predation on praine vole demography a field experi-ment -Ecology 70 411-421
Fitzgerald, B M 1977 Weasel predation on a cyclic pop-ulation of the montane vole {Microtus montanus) in Cali-fornia - J Anim Ecol 46 367-379
Framstad, E , Stenseth, N C and Ostbye, E 1991 Fluc-utations and variations in demographic characters of Lem-mus lemmus at Finse, Hardangervidda, south Norway -Biol J Linn Soc (Lond ), (m press)
Fretwell, S D 1972 Populations in a seasonal environment -Princeton Univ Press. Princeton NJ
- 1977 The regulation of plant communities by food chainsexploiting them - Perspect Biol Med 20 169-185
Fuller, W A , Martell, A M , Smith, R F C and Speller, SW 1977 Biology and secondary production of Dicrostonyxgroenlandtcus on Tnielove lowland - In Bliss, L C (ed ),Tnielove Lowland, Devon Island, Canada a high arcticecosystem Univ Alberta Press, Edmonton, Alb , pp 437-466
Hanski, I , Hansson, L and Henttonen, H 1991 Specialistpredators, generalist predators, and the microtine rodentcycle - J Anim Ecol , (in press)
Hansson, L 1969 Spnng populations of small mammals incentral Swedish Lapland m 1964-68 - Oikos 20 431-450
- 1979 Food as a limiting factor for small rodent numbers atest of two hypotheses - Oecologia (Berl) 37- 297-314
- 1987 An interpretation of rodent dynamics as due to trophicinteractions - Oikos 50 308-318
- 1988 Grazing impact of rodents in a steep cyclicity gra-dient -Oikos 51 31-42'
- 1989 Tracking of or delay effects in microtine reproduc-tion? - Acta Thenol 34 125-132
- and Henttonen, H 1985 gradients in density vanations ofsmall rodents the importance of latitude and snow cover -Oecologia (Berl.) 67- 394-402
Haukisalmi, V , Henttonen, H and Tenora, F 1989 Pop-ulation dynamics of common and rare helminths in cyclicvole populations - J Amm Ecol. 57 807-^5
Haukioja, E and Hakala, T 1975 Herbivore cycles and pen-odic outbreaks: formulation of a general hypothesis - Rep.Kevo Subarctic Res. Stn. 12- 1-9.
234 ECOGRAPHY IS 2 (1992)

Henttonen, H and Jarvinen, A 1981 Lemmings m 1978 atKilpisjarvi population characteristics of a small peak -Memoranda Soc Fauna Flora Fennica 57 25-30
- . Kaikusalo. A , Tast, J and Viitala, J 1977 Interspecificcompetition between small rodents in subarctic and borealecosystems - Oikos 29 581-590
- . Oksanen. T . Jortikka, A and Haukisalmi, V 1987 Howmuch do weasels shape microtine cycles in the northernFennoscandian taiga'' - Oikos 50 353-365
Hestbeck.J B 1982 Population regulation of small mammalsthe social fence hypothesis - Oikos 39 157-163
Hornfeldt, B 1991 Cycles of voles, predators and alternativeprey m boreal Sweden - Ph D thesis, Univ of Umea
Ims, R A 1987 Responses in spatial organization and behav-ior to manipulations of the food resource in the vole Cleth-rionomys rufocanus - J Anim Ecol 56 585-596
- 1990 Determinants of natal dispersal and space use in thegrey-sided voles, Clethrionomys rufocanus a combinedfield and laboratory experiment - Oikos 57 106-113
Jarvmen.A 1987 Microtine cycles and plant production whatIS the cause and the effecf - Oikos 49 352-357
Jonasson, S , Bryant, J P , Chapin, F S III and Andersson,M 1986 Plant phenols and nutrients in relation to var-iations in climate and rodent grazing - Am Nat 128394-^8
Kalela, O 1949 Uber Fjeldlemming-Invasionen und anderenlrregularen Tienvanderungen - Ann Zool Soc "Va-namo" 13 1-90
- 1957 Regulation of reproductive rate in subarctic pop-ulations of the vole Clethrionomys rufocanus (Sund ) -Ann Acad Sci Fenn A IV "Biologica" 55 1-60
- 1961 Seasonal change of habitat m the Norwegian Lem-ming, Lemmus lemmus (L ) - Ann Acad Sci Fenn , AIV "Biologica" 55 1-72
- 1962 On the fluctuation in the numbers of of arctic andboreal small rodents as a problem of production biology -Ann Acad Sci Fenn A IV "Biologica" 66 1-38
- 1971 Seasonal differences in habitats of the Norwegianlemming, Lemmus lemmus (L ) m 1959 and 1960 at Kilpis-jarvi, Finnish Lapland - Ann Acad Sci Fenn , A IV"Biologica" 178 1-22
- and Koponen, T 1971 Food consumption and movementsof the Norwegian lemming in areas characterized by iso-lated fells - Ann Zool Fennici 8 80-84
Kalhola, R 1939 Pflanzensoziologische Untersuchungen inder alpinen Stufe Finnisch-Lapplands - Ann Bot Soc"Vanamo" 13(2) 1-321
Keith, L B 1974 Some features of population dynamics inmammals - In Kjerner, I and Bjurholm, P (eds), ProcXI International Congr Game Biol Stockholm, pp 17-58
Koch, R 1881 Zur Untersuchung von pathogenen Organis-men - Mitteil Kaiserl Ges Amt 1 148
Koponen, T , Kokkonen A and Kalela, O 1%1 On a case ofspnng migration in the Norwegian lemming - Ann AcadSci Fenn A IV "Biologica" 52 1-30
Korpimaki, E and Norrdahl, K 1989 Predation of Teng-malm's owls numencal responses, functional responsesand dampening impact on population fluctuation of micro-tines -Oikos 54 154-164
Krebs, C J 1964 The lemming cycle at Baker Lake, North-west Temtones - Arctic Inst N Amer Tech Paper 151-104
- and Myers, J 1974 Population cycles in small mammals -Adv Ecol Res 8 267-399
- , Games, M S , Keller, B L , Myers, J H and Tamann,R. H 1973. Population cycles in small rodents - Science179 35-41
Lame, K and Henttonen, H 1983 The role of plant produc-tion in microtine cycles in northern Fennoscandia - Oikos40 407-418
- and Henttonen, H 1987 Phenolics/nitrogen ratio m theblueberry Vaccmium myrultus m relation to temperature
and microtine density in Finnish Lapland - Oikos 50 389-395
Marcstrom, V , Kenward, R E and Engren, E 1988 Theimpact of predation on boreal tetraonids during vole cyclesan experimental study - J Anim Ecol 57 859-872
May, R M 1981 Models for single populations - In May, R(ed ), Theoretical ecology principles and applicationsBlackwell, London, pp 5-29
- and Oster, G F 1976 Bifurcations and dynamical com-plexity m simple ecological models - Am Nat 110 573-599
Myllymaki, A , Aho, J , Lind, E and Tast, J 1962 Behaviourand daily activity of the Norwegian lemming, Lemmus lem-mus (L ), dunng autumn migration - Ann Zool Soc"Vanamo" 24 1-31
- , Paasikallio, A , Pankakoski, E and Kanervo, V 1971Removal experiments on small quadrats as a means of rapidassesment of the abundance of small mammals - AnnZool Fennici 8 177-185
Oksanen, L 1981 Theoretical and empirical considerations ontwo-link ecosystems - Ph D thesis, Kansas State Univ
- 1988 Ecosystem organization mutualism and cyberneticsor plain darwinian struggle for existence''- Am Nat 131424-444
- 1990 Exploitation ecosystems in seasonal environments -Oikos 57 14-24
- and Ericson, L 1987 Dynamics of tundra and taiga pop-ulations of herbaceous plants in relation to the Tihomirov-Fretwell and Kalela-Tast hypotheses - Oikos 50 381-388
- and Oksanen, T 1981 Lemmings {Lemmus lemmus) andgrey sided voles {Clethrionomys rufocanus) m interactionwith their resources and predators on Finnmarksvidda,northern Norway - Rep Kevo Subarct Res Stn 17 7-31
- , Fretwell, S D , Arruda, J and Niemela, P 1981 Exploi-tation ecosystems m gradients of primary productivity -Am Nat 118 240-261
- , Oksanen, T , Lukkari, A and Siren, S 1987 The role ofphenol-based lnducible defense in the interaction betweentundra populations of the vole Clethrionomys rufocanusand the dwarf shrub Vfltcmiu/n myrti/Zux - Oikos 50 371-380
Oksanen, T 1990 Exploitation ecosystems in heterogeneoushabitat complexes - Evol Ecol 4 220-234
- 1991 Does predation prevent Norwegian lemmings fromestablishing permanent populations in lowland forests'' -Biol J Linnean Soc (Lond ), (in press)
- , Oksanen, L and Fretwell, S D 1985 Surplus killing inthe hunting strategy of small predators - Am Nat 126328-346
- , Oksanen, L and Norberg, M 1992 Habitat use of smallmustelids in north fennoscandian tundra a test of the hy-pothesis of patchy exploitation ecosystems - Ecography15 237-244
Pitelka F A 1973 Cyclic pattern in lemming populations nearBarrow, Alaska - Arct Inst N Amer , Techn Papers 25199-215
Rhoades, D F 1985 Offensive-defensive interactions betweenherbivores and plants their relevance in herbivore pop-ulation dynamics and ecological theory - Am Nat 125205-238
Sinclair, A R E , Krebs, C J , Smith, J N M and Boutin, S1988 Population biology of snowshoe hares III nutrition,plant secondary compounds and food limitation - J AnimEcol 57 787-806
Steen, H , Yoccoz, N G and Ims, R A 1990 Predators andsmall rodent cycles an analysis of a 79-year time series onsmall rodent ix>pulation fluctuations - Oikos 59' 115-120
Stenseth, N C 1981a On Chitty's theory for fluctuating pop-ulations the importance of genetic polymorphism in thegeneration of regular cycles - J Theor Biol 90 9-36
- 1981b Optimal food selection some further considerations
ECOGRAPHY 15 2 (1992) 235

with special reference to the grazer-hunter distinction - cycles and plant production in Finnish Lapland - AnnAm Nat 117 457-475 Acad Sci Fenn A IV "Biologica" 186 1-14
- 1986 On the mteraction between stabilizmg social factors Vutala, J 1977 Social organization in cyclic subarctic pop-and destabilizing trophic factors m small rodent popula- ulations of the voles Clethrionomys rufoeanus (Sund ) andtions - Theor Pop Biol 29 365-384 and Mierotus agrestis (L ) - Ann Zool Fennici 14 53-93
Tast, J and Kalela, O 1971 Companson between rodent
2 3 6 ECOGRAPHY 15 2 (19«2)