Phylogeography of the narrow-headed vole Lasiopodomys (Stenocranius) gregalis (Cricetidae, Rodentia)...
12
1 Laboratory of Molecular Systematics, Zoological Institute RAS, Saint-Petersburg Russia; 2 Laboratory of Vertebrate Ecology, Institute for Biological Problems of Cryolithozone SB RAS, Yakutsk, Russia; 3 Department of Zoology, National University of Mongolia, Ulaanbaatar, Mongolia Phylogeography of the narrow-headed vole Lasiopodomys (Stenocranius) gregalis (Cricetidae, Rodentia) inferred from mitochondrial cytochrome b sequences: an echo of Pleistocene prosperity TATYANA V. PETROVA 1, *, EUGENIY S. ZAKHAROV 2 ,RAVCHIG SAMIYA 3 and NATALIA I. ABRAMSON 1, * Abstract A species-wide phylogeographic study of the narrow-headed vole Lasiopodomys (Stenocranius) gregalis was performed using the mitochondrial (mt) cytochrome b gene. We examined 164 specimens from 50 localities throughout the species distribution range. Phylogeographic pattern clearly demon- strates the division into four major mtDNA lineages with further subdivision. The level of genetic differentiation between them was found to be extre- mely high even for the species level: about 6–11%. The most striking result of our study is extremely high mutation rate of cytb in L. gregalis. Our estimates suggested its value of 3.1 9 10 5 that is an order of magnitude higher than previous estimates for Microtus species. The mean estimated time of basal differentiation of the narrow-headed vole is about 0.8 Mya. This time estimate is congruent with the known paleontological record. The greatest mitochondrial diversity is found in Southern Siberia where all four lineages occur; therewith, three of them are distributed exclusively in that area. The lineage that is distributed in south-eastern Transbaikalia is the earliest derivate and exhibits the highest genetic divergence from all the others (11%). It is quite probable that with further research, this lineage will turn out to represent a cryptic species. Spatial patterns of genetic variation in populations of the narrow-headed vole within the largest mt lineage indicate the normal or stepping stone model of dispersal to the north and south- west from the Altay region in Middle Pleistocene. Both paleontological data and genetic diversity estimates suggest that this species was very success- ful during most of the Pleistocene, and we propose that climate humidification and wide advance of tree vegetation at the Pleistocene–Holocene boundary promoted range decrease and fragmentation for this typical member of tundra-steppe faunistic complex. However, we still observe high genetic diversity within isolated fragments of the range. Key words: Narrow-headed vole – Lasiopodomys (Stenocranius) gregalis – cytochrome b – Pleistocene glaciations – genetic diversity Introduction The narrow-headed vole Lasiopodomys 1 (Stenocranius) gregalis Pallas, 1779 is a wide-ranging Eurasian species, the range of which currently is represented by few highly isolated regions (Fig. 1). They cover very diverse landscapes and environmental zones from tundra and forest-tundra in the north to steppe and alpine meadows in the south, occurring at altitudes of up to 4000 m. (Shenbrot and Krasnov 2005). However, during the Late Pleistocene and through the Last Glacial Maximum (LGM), the species range extended very far to the west from the modern boundaries. In Pleistocene, the species ranged through the Carpa- thian Basin (Pazonui 2011) and reached the British Isles (Sutc- liffe and Kowalski 1976; Kowalski 2001) and central regions of the present-day France (Sese and Villa 2008). According to Cha- line (1972), it was present in France during both the last and the penultimate glaciations. Moreover, in the Late Pleistocene, it was the most abundant and common species at all sites throughout Eurasia, tightly associated with the so-called mammoth faunistic complex, typical of periglacial tundra and tundra-steppe environ- ment (Gerasimov and Velichko 1982; Markova and van Kolf- schoten 2008). According to the paleoecological evidence, northern Eurasia was covered by treeless vegetation during gla- cial periods (West 2000), so steppe species had a wide range. This landscape provided conditions favourable for habitation of the narrow-headed vole, and there was no division into northern (tundra) and southern (steppe and mountains) parts. For instance, the territory of Southern Transural region nowadays is covered with forests, and the narrow-headed vole does not occur here. However, at least from the first part of the Late Pleistocene and through the LGM, it dominated the rodent communities of the hyperboreal complex in the region. The relative abundance of this species reached 70% during the late Valdai cold maximum, but in Holocene, it remained here as a rare faunistic element (Smirnov et al. 2007). Thus, it is quite obvious that the present range fragmentation of the narrow-headed vole occurred in the Holocene, simulta- neously with the forest advance and the formation of the wide taiga zone. Dramatic climatic changes at the transition between the Pleistocene and Holocene caused migrations, fragmentation, mixing or extinction of populations and serious range alterations (Hewitt 1996, 2000; Bennett 1997) that left its signatures in the genetic structure of modern populations. Genetic consequences of these alterations and broadscale phylogeographic patterns were well documented for many small rodent species in Northern Hemisphere, both for the Old and New Worlds (Ohdachi et al. 2001; Fedorov and Stenseth 2002; Brunhoff et al. 2003; Runck and Cook 2005; Fedorov et al. 2008; Obolenskaya et al. 2009; Abramson et al. 2012). These consequences and evolutionary histories of species during Pleistocene evidently should differ for forest dwellers, species of open humid environments and steppe and tundra-steppe habitats. As the periodic glacial advances shifted the borders of tree vegetation in Europe and Siberia far to the south and disrupted the continuous forest belt to multiple Corresponding author: Natalia I. Abramson ([email protected]) Contributing authors: Tatyana V. Petrova ([email protected]), Eugeniy S. Zakharov ([email protected]), Ravchig Samiya ([email protected]) *These authors contributed equally to this work. 1 The generic name Lasiopodomys was chosen for the narrow-headed vole according to the last checklist of Russian fauna (Abramson and Lissov- sky 2012). The sister-group relationship of the narrow-headed vole with Lasiopodomys species is based on the evidence from nuclear genes (Abramson et al. 2009a; Martinkova and Moravec 2012), but cytb data alone do not resolve the relationships within the generic group ‘Micro- tus’, (Jaarola et al. 2004; Yannic et al. 2011; Martinkova and Moravec 2012). Accepted on 24 July 2014 © 2014 Blackwell Verlag GmbH J Zoolog Syst Evol Res doi: 10.1111/jzs.12082
Transcript of Phylogeography of the narrow-headed vole Lasiopodomys (Stenocranius) gregalis (Cricetidae, Rodentia)...

1Laboratory of Molecular Systematics, Zoological Institute RAS, Saint-Petersburg Russia; 2Laboratory of Vertebrate Ecology,Institute for Biological Problems of Cryolithozone SB RAS, Yakutsk, Russia; 3Department of Zoology, National University ofMongolia, Ulaanbaatar, Mongolia
Phylogeography of the narrow-headed vole Lasiopodomys (Stenocranius) gregalis(Cricetidae, Rodentia) inferred from mitochondrial cytochrome b sequences: anecho of Pleistocene prosperity
TATYANA V. PETROVA1,*, EUGENIY S. ZAKHAROV
2, RAVCHIG SAMIYA3 and NATALIA I. ABRAMSON
1,*
AbstractA species-wide phylogeographic study of the narrow-headed vole Lasiopodomys (Stenocranius) gregalis was performed using the mitochondrial (mt)cytochrome b gene. We examined 164 specimens from 50 localities throughout the species distribution range. Phylogeographic pattern clearly demon-strates the division into four major mtDNA lineages with further subdivision. The level of genetic differentiation between them was found to be extre-mely high even for the species level: about 6–11%. The most striking result of our study is extremely high mutation rate of cytb in L. gregalis. Ourestimates suggested its value of 3.1 9 10�5 that is an order of magnitude higher than previous estimates for Microtus species. The mean estimatedtime of basal differentiation of the narrow-headed vole is about 0.8 Mya. This time estimate is congruent with the known paleontological record. Thegreatest mitochondrial diversity is found in Southern Siberia where all four lineages occur; therewith, three of them are distributed exclusively in thatarea. The lineage that is distributed in south-eastern Transbaikalia is the earliest derivate and exhibits the highest genetic divergence from all the others(11%). It is quite probable that with further research, this lineage will turn out to represent a cryptic species. Spatial patterns of genetic variation inpopulations of the narrow-headed vole within the largest mt lineage indicate the normal or stepping stone model of dispersal to the north and south-west from the Altay region in Middle Pleistocene. Both paleontological data and genetic diversity estimates suggest that this species was very success-ful during most of the Pleistocene, and we propose that climate humidification and wide advance of tree vegetation at the Pleistocene–Holoceneboundary promoted range decrease and fragmentation for this typical member of tundra-steppe faunistic complex. However, we still observe highgenetic diversity within isolated fragments of the range.
Key words: Narrow-headed vole – Lasiopodomys (Stenocranius) gregalis – cytochrome b – Pleistocene glaciations – genetic diversity
Introduction
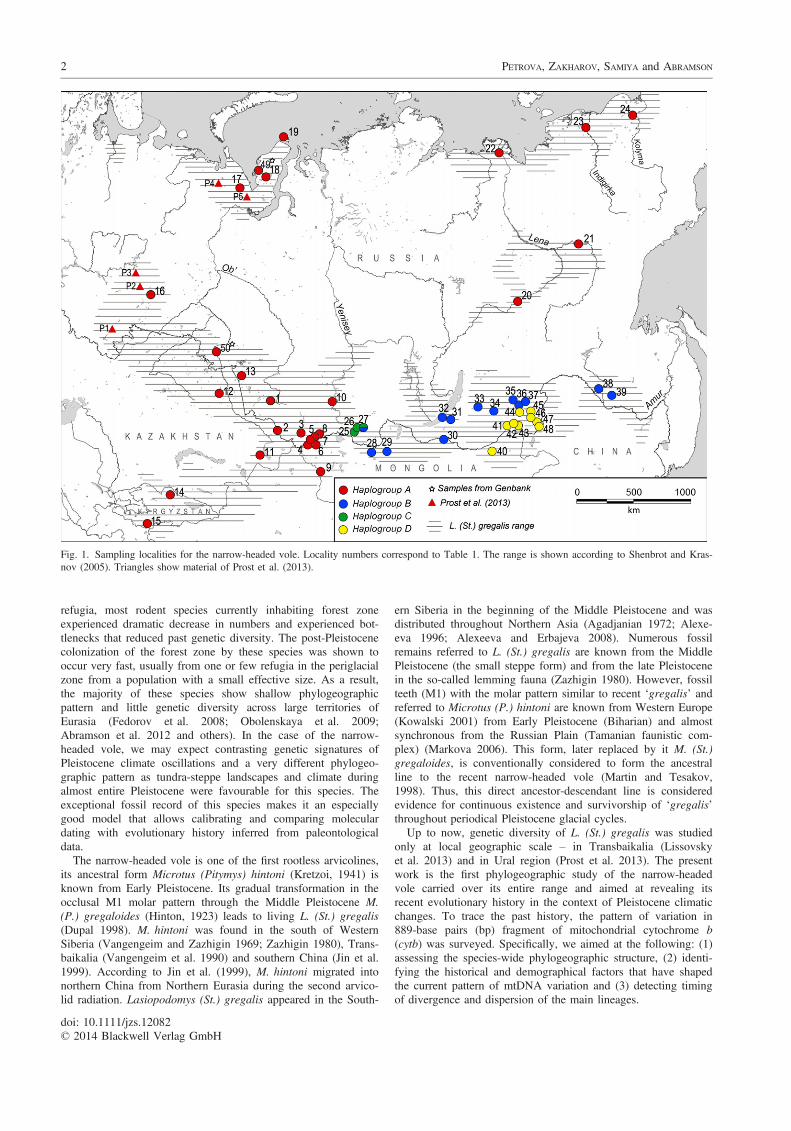
The narrow-headed vole Lasiopodomys1 (Stenocranius) gregalisPallas, 1779 is a wide-ranging Eurasian species, the range ofwhich currently is represented by few highly isolated regions(Fig. 1). They cover very diverse landscapes and environmentalzones from tundra and forest-tundra in the north to steppe andalpine meadows in the south, occurring at altitudes of up to4000 m. (Shenbrot and Krasnov 2005). However, during theLate Pleistocene and through the Last Glacial Maximum (LGM),the species range extended very far to the west from the modernboundaries. In Pleistocene, the species ranged through the Carpa-thian Basin (Pazonui 2011) and reached the British Isles (Sutc-liffe and Kowalski 1976; Kowalski 2001) and central regions ofthe present-day France (Sese and Villa 2008). According to Cha-line (1972), it was present in France during both the last and thepenultimate glaciations. Moreover, in the Late Pleistocene, it wasthe most abundant and common species at all sites throughoutEurasia, tightly associated with the so-called mammoth faunisticcomplex, typical of periglacial tundra and tundra-steppe environ-ment (Gerasimov and Velichko 1982; Markova and van Kolf-
schoten 2008). According to the paleoecological evidence,northern Eurasia was covered by treeless vegetation during gla-cial periods (West 2000), so steppe species had a wide range.This landscape provided conditions favourable for habitation ofthe narrow-headed vole, and there was no division into northern(tundra) and southern (steppe and mountains) parts. For instance,the territory of Southern Transural region nowadays is coveredwith forests, and the narrow-headed vole does not occur here.However, at least from the first part of the Late Pleistocene andthrough the LGM, it dominated the rodent communities of thehyperboreal complex in the region. The relative abundance ofthis species reached 70% during the late Valdai cold maximum,but in Holocene, it remained here as a rare faunistic element(Smirnov et al. 2007).
Thus, it is quite obvious that the present range fragmentationof the narrow-headed vole occurred in the Holocene, simulta-neously with the forest advance and the formation of the widetaiga zone. Dramatic climatic changes at the transition betweenthe Pleistocene and Holocene caused migrations, fragmentation,mixing or extinction of populations and serious range alterations(Hewitt 1996, 2000; Bennett 1997) that left its signatures in thegenetic structure of modern populations. Genetic consequencesof these alterations and broadscale phylogeographic patterns werewell documented for many small rodent species in NorthernHemisphere, both for the Old and New Worlds (Ohdachi et al.2001; Fedorov and Stenseth 2002; Brunhoff et al. 2003; Runckand Cook 2005; Fedorov et al. 2008; Obolenskaya et al. 2009;Abramson et al. 2012). These consequences and evolutionaryhistories of species during Pleistocene evidently should differ forforest dwellers, species of open humid environments and steppeand tundra-steppe habitats. As the periodic glacial advancesshifted the borders of tree vegetation in Europe and Siberia far tothe south and disrupted the continuous forest belt to multiple
Corresponding author: Natalia I. Abramson ([email protected])Contributing authors: Tatyana V. Petrova ([email protected]), EugeniyS. Zakharov ([email protected]), Ravchig Samiya ([email protected])*These authors contributed equally to this work.1The generic name Lasiopodomys was chosen for the narrow-headed voleaccording to the last checklist of Russian fauna (Abramson and Lissov-sky 2012). The sister-group relationship of the narrow-headed vole withLasiopodomys species is based on the evidence from nuclear genes(Abramson et al. 2009a; Martinkova and Moravec 2012), but cytb dataalone do not resolve the relationships within the generic group ‘Micro-tus’, (Jaarola et al. 2004; Yannic et al. 2011; Martinkova and Moravec2012).
Accepted on 24 July 2014© 2014 Blackwell Verlag GmbH J Zoolog Syst Evol Res doi: 10.1111/jzs.12082
refugia, most rodent species currently inhabiting forest zoneexperienced dramatic decrease in numbers and experienced bot-tlenecks that reduced past genetic diversity. The post-Pleistocenecolonization of the forest zone by these species was shown tooccur very fast, usually from one or few refugia in the periglacialzone from a population with a small effective size. As a result,the majority of these species show shallow phylogeographicpattern and little genetic diversity across large territories ofEurasia (Fedorov et al. 2008; Obolenskaya et al. 2009;Abramson et al. 2012 and others). In the case of the narrow-headed vole, we may expect contrasting genetic signatures ofPleistocene climate oscillations and a very different phylogeo-graphic pattern as tundra-steppe landscapes and climate duringalmost entire Pleistocene were favourable for this species. Theexceptional fossil record of this species makes it an especiallygood model that allows calibrating and comparing moleculardating with evolutionary history inferred from paleontologicaldata.
The narrow-headed vole is one of the first rootless arvicolines,its ancestral form Microtus (Pitymys) hintoni (Kretzoi, 1941) isknown from Early Pleistocene. Its gradual transformation in theocclusal M1 molar pattern through the Middle Pleistocene M.(P.) gregaloides (Hinton, 1923) leads to living L. (St.) gregalis(Dupal 1998). M. hintoni was found in the south of WesternSiberia (Vangengeim and Zazhigin 1969; Zazhigin 1980), Trans-baikalia (Vangengeim et al. 1990) and southern China (Jin et al.1999). According to Jin et al. (1999), M. hintoni migrated intonorthern China from Northern Eurasia during the second arvico-lid radiation. Lasiopodomys (St.) gregalis appeared in the South-
ern Siberia in the beginning of the Middle Pleistocene and wasdistributed throughout Northern Asia (Agadjanian 1972; Alexe-eva 1996; Alexeeva and Erbajeva 2008). Numerous fossilremains referred to L. (St.) gregalis are known from the MiddlePleistocene (the small steppe form) and from the late Pleistocenein the so-called lemming fauna (Zazhigin 1980). However, fossilteeth (M1) with the molar pattern similar to recent ‘gregalis’ andreferred to Microtus (P.) hintoni are known from Western Europe(Kowalski 2001) from Early Pleistocene (Biharian) and almostsynchronous from the Russian Plain (Tamanian faunistic com-plex) (Markova 2006). This form, later replaced by it M. (St.)gregaloides, is conventionally considered to form the ancestralline to the recent narrow-headed vole (Martin and Tesakov,1998). Thus, this direct ancestor-descendant line is consideredevidence for continuous existence and survivorship of ‘gregalis’throughout periodical Pleistocene glacial cycles.
Up to now, genetic diversity of L. (St.) gregalis was studiedonly at local geographic scale – in Transbaikalia (Lissovskyet al. 2013) and in Ural region (Prost et al. 2013). The presentwork is the first phylogeographic study of the narrow-headedvole carried over its entire range and aimed at revealing itsrecent evolutionary history in the context of Pleistocene climaticchanges. To trace the past history, the pattern of variation in889-base pairs (bp) fragment of mitochondrial cytochrome b(cytb) was surveyed. Specifically, we aimed at the following: (1)assessing the species-wide phylogeographic structure, (2) identi-fying the historical and demographical factors that have shapedthe current pattern of mtDNA variation and (3) detecting timingof divergence and dispersion of the main lineages.
Fig. 1. Sampling localities for the narrow-headed vole. Locality numbers correspond to Table 1. The range is shown according to Shenbrot and Kras-nov (2005). Triangles show material of Prost et al. (2013).
doi: 10.1111/jzs.12082© 2014 Blackwell Verlag GmbH
2 PETROVA, ZAKHAROV, SAMIYA and ABRAMSON

Materials and Methods
Sampling
The total of 164 specimens of the narrow-headed voles sampled at 50localities covering almost the entire geographical range was analysed(Fig. 1). Voucher specimens of most studied individuals were depositedin museum collections (Table 1). Several specimens were taken frommuseum skins (museum ID numbers are marked with asterisk inTable 1). Twenty-eight L. gregalis sequences (KF751077–KF751104)were published in the previous paper (Lissovsky et al. 2013), andsequences AF163895 (Conroy and Cook 2000), AF429817 (Dekonenkoet al. 2003) and AY513803 (Jaarola et al. 2004) were taken from Gen-Bank. We also included partial sequences of cytb (461 bp) from the LatePleistocene and Holocene specimens from Ural area reported in Prostet al. (2013): KC295791–KC295822.
DNA extraction, amplification and sequencing
Genomic DNA was isolated from tissues fixed with 96% ethanol usingstandard salt extraction protocol using a lysis buffer and proteinase K, de-proteinized with NaCl and precipitated with 96% ethanol (Miller et al.1988). DNA from museum specimens was isolated using a genomicDNA isolation kit (Omnix, Russia) with proteinase K added to the lysisbuffer and digesting at 60°C for 5 h.
A segment (889 bp) of the cytochrome b (cytb) gene was amplifiedusing primers UCBU-LM and with standard protocol described elsewhere(Abramson et al. 2009b). To amplify short overlapping cytb fragmentsfrom museum skins, we used five pairs of primers generated to avoidamplification of cytb-like pseudogene that occurs when universal primersL14728–H15985 are employed (Ohdachi et al. 2001; Lebedev et al.2007): UCBU – Gre-R297 50 TGAARAATATGGARGCTCCGT 30, Gre-F246 50 ACAGCATTCTCATCAGTAGCCCA 30 – Gre-R551 50 GTGAGTGTGGCTTTATCTACTG 30, Gre-F441 50 GCATTCATAGGCTACGTACT 30 – Gre-R656 50 TCCTGTTGGGTTGTTGGA 30, Gre-F573 50
GTAGAYAAAGCCACACTCACMCG 30 – Gre-R976 50 GGAAGGYTAGTGTTCGTTGT 30 and Gre-F835 50 GCAAACCCACTMAAYACC30 – LM. Thermal profiles for short-fragment PCR were as follows: 5-minheating to 94°C, 35 cycles of denaturation (94°C for 15 s), annealing (55–60°C for 20 s) and extension (72°C for 20 s) with final elongation at 72°Cfor 5 min. Each PCR included a negative control. The PCR products werepurified on columns of an Omnix kit (Omnix, St. Petersburg, Russia) andwere sequenced in both directions using the BigDye Terminator CycleSequencing Ready Reaction Kit on an ABI PRISM 3130 (Applied Biosys-tems Inc., Foster City, CA, USA). Sequences were edited and assembledusing program Sequencher 4.6 (Gene Codes Corporation, Ann Arbor, MI,USA http://www.genecodes.com) and aligned with CLUSTALW algorithm(Thompson et al. 1994) implemented in BioEdit (Hall 1999). Allsequences were translated to amino acids and examined for internal stopcodons, transition/transversion rate ratio and relative first, second and thirdposition changes in codons that might indicate a pseudogene.
Phylogenetic analyses
The level of genetic differentiation in cytb based on p-distances was esti-mated in MEGA 5.2 (Tamura et al. 2011). Tree reconstructions were per-formed using 100 narrow-headed vole haplotypes and two specimens asan outgroup (Lasiopodomys mandarinus FJ986322 and L. brandtiiJF906120). The final alignment comprised the 889-bp cytb fragment (Fig.S1).
To choose the best model of molecular evolution (TIM1+G), we usedAkaike’s information criterion (AIC) in JMODELTEST 2.1.1 (Darriba et al.2012). Phylogenies were reconstructed using Bayesian inference (BI) andmaximum likelihood (ML) approaches. BI for cytb data performed inMRBAYES 3.2.2 (Ronquist and Huelsenbeck 2003). As it was shown inHuelsenbeck and Ronquist (2005), that use of a more complicated modelinstead of the suggested one does not affect the result, so we ran theanalysis with nst = 6 and gamma-distributed rate variation across sites.To achieve proportion of successful state exchanges between neighbour-ing chains higher than 30%, the chain temperature was set to 0.07. Wetried two variants of the analysis: with and without data partitioningaccording to codon position. Each analysis started with random trees and
performed two independent runs with four Markov chains Monte Carlo(MCMC) for 10 million generations with sampling every 1000th genera-tion. In both variants, convergence diagnostic parameters for the MCMCruns were as follows: average standard deviation of split frequencies wasbelow 0.01, potential scale reduction factor for model parametersapproached 1.000. Consensus trees were constructed based on the treessampled after the 25% burn-in. Both variants of BI (with and withoutpartitioning) showed identical tree topologies and tree lengths and slightlydiffered in posterior probabilities of several nodes. MCMC convergencewas faster with the simpler model, so the tree obtained under the modelwithout partitioning is reported.
ML analysis and the optimal model of molecular evolution (GTR:G:5)were calculated with TREEFINDER (Jobb 2008). Bootstrap analysisemployed 1000 replicates. The 95% credibility intervals of the treelengths from BI were compared to the tree length obtained from MLanalysis. The combined alignment including Prost et al. (2013) sequencescomprised 461 bp cytb fragment cut according to the ancient sequencelength (Fig. S2). The BI analysis was conducted without partitioning withthe settings described above.
Divergence dates estimation
To calibrate the Bayesian coalescence analysis for time estimations, weused BEAUTI implemented in program BEAST v2.1.0 (Drummond andRambaut 2007; Drummond et al. 2013). Bayes factors (Kass and Raftery1995) were used to choose between strict, lognormal and exponentialclock models (Drummond et al. 2006), choosing strict as the best fittingone. As a substitution rate for cytb, we selected the rate recently deter-mined by Prost et al. (2013) from heterochronous data as 4.6 9 10�6
substitutions per site per year. We also tried to run the same analysisbased exclusively on recent specimens, without Prost et al., (2013) dataand used substitution rate estimated in the present study as 3.1 9 10�5
substitutions per site per year.The following time constraints were used in molecular dating in addi-
tion to the substitution rate. Lasiopodomys probrandti and ‘Pitymys’ hin-toni (=Stenocranius) were found together in Danangou (Nihewan Basin,northern China) dated at 1.1–1.8 Mya (Zheng and Cai 1991), and Stenoc-ranius species were already found in Western Siberia about 1.2–1.3 Mya(Zazhigin 1980). The calibration point for the split between L. gregalisand (L. mandarinus + L. brandtii) was thus set to a prior varying normallywith mean 1.55 Mya, so that 95% of its normal distribution fell between1.3 and 1.8 Mya. Dates of the late Pleistocene and Holocene specimensincluded in the alignment were given according to Prost et al. (2013).
A comparison using Bayes factors (Kass and Raftery 1995; Suchardet al. 2001) as implemented in TRACER v1.6 (Rambaut and Drummond2007) selected the constant size coalescent prior as the most appropriatedemographic model. Substitution model and rates were set as suggestedby JMODELTEST 2.1.1 (Darriba et al. 2012), and all remaining priors wereset to the defaults. Two replicate runs of 100 million MCMC generationseach were performed, sampling trees and parameter estimators every10 000 generations. The convergence of run parameters was examined inTRACER v1.6 (Rambaut and Drummond 2007), and the independent runsappeared to sample all parameters well. The first 25 million generationswere discarded as burnin in LOGCOMBINER v2.1.0 (http://beast.bio.ed.ac.uk/LogCombiner). The comparison with an empty ‘prior run’ in BEAST
(Drummond et al. 2006) showed that the data were informative for esti-mating the divergence dates.
The final tree was summarized using TREEANNOTATOR v2.1.0 (Drum-mond and Rambaut 2007), using the maximum clade credibility treeoption and fixing node heights as mean heights. Divergence time barswere obtained automatically in FIGTREE v1.4.0 (http://tree.bio.ed.ac.uk/software/figtree/) from the output using the 95% highest posterior density(HPD) of the ages for each node.
Demographic analyses
Phylogenetic network for cytb data was computed with a median-joiningalgorithm implemented in NETWORK 4.6 (Bandelt et al. 1999) with anequal transition/transversion rate ratio.
Haplotype (Hd) and nucleotide (Pi) diversities with their standarddeviations within cytb haplogroups were calculated using the program
doi: 10.1111/jzs.12082© 2014 Blackwell Verlag GmbH
Phylogeography of the narrow-headed vole Lasiopodomys (Stenocranius) gregalis 3

Table 1. The list of specimens analysed
Map numbers and sampling localities n H Clade Haplotypes Museum ID Accession Nos.
1 Altay Territory, Aleisky District52.45°N, 83.01°E
8 6 A1 aleisk1–6 LMS 2706, 2709, 2710, 2713, 2714,2719, 2643, 2644
KJ192239–KJ192244
2 Gorno-Altay, Ust-Koksinsky District50.18°N, 84.70°E
1 1 A4 kholzun ZIN 90973 KJ192282
3 Gorno-Altay, Ulagansky District50.32°N, 87.75°E
2 2 A3 aktash1, 2 ZIN 90974, 90976 KJ192272, KJ192273
4 Gorno-Altay, Kosh-Agachsky District49.83°N, 89.49°E
2 2 A3, A4 kindiktik1, 2 ZIN 98875, 98879 KJ192270, KJ192271
5 Gorno-Altay, KoshAgachskyDistrict 50.08°N, 89.45°E
1 1 A4 chikhach ZMMU S-188075 KJ192284
6 Gorno-Altay, Kosh-Agachsky District49.58°N, 89.07°E
3 2 A3 ulandrik1, 2 LMS 4099, 4100, 4101 KJ192323, KJ192324
7 Gorno-Altay, Kosh-Agachsky District49.71°N, 89.50°E
3 3 A3, A4 aday1–3 LMS 4105, 4110, 4111 KJ192325–KJ192327
8 Tuva, Mongun-Tayginsky District50.42°N, 89.99°E
9 8 A4 karasu1–8 ZIN 99512, 99514–99516, 99521;LMS 2533, 2552–2554
KJ192274–KJ192281
9 Mongolia, Bayan-Olgiy District47.45°N, 90.88°E
5 4 A3 ulagchin1–4 ZMMU S-183318, 183320, 183324,183327, 183336
KJ192266–KJ192269
10 Khakassia, Beysky District53.19°N, 91.28°E
8 5 A1 khakassia1–5 LMS 2707, 2708, 2712, 2715, 2717,2718, 2721, 2722
KJ192318–KJ192322
11 Kazakhstan, Zaisan Basin47.87°N, 83.22°E
1 1 A4 zaisan ZIN 96304 KJ192283
12 Kazakhstan, Ekibastuz51.82°N, 75.92°E
1 1 A1 ekibastuz ZMMU S-182784 KJ192245
13 Novosibirsk Region, Karasuk53.75°N, 78.06°E
5 5 A1 novosib1–5 DTA coll 01-05, 05-05, 06-05,10-05, 24-05
KJ192250–KJ192254
14 Kyrgyzstan, vicinities of Bishkek42.65°N, 74.48°E
2 2 A6 bishkek1, 2 ZIN 78596*, 78604* KJ192289, KJ192290
15 Kyrgyzstan, Alay Valley39.72°N, 73.24°E
2 1 A6 alay ZIN 23066*, 29710* KJ192288
16 Sverdlovsk Region, ZarechnyDistrict 56.83°N, 61.33°E
6 4 A1 kurmanka1–4 IPAE 309982, 309983, 309985, 309986,309989, LMS 471
KJ192246–KJ192249
17 Yamal, Yuribey 68.0°N, 66.0°E 1 1 A2 yuribey ZIN 96291 KJ19228718 Yamal, Yasavei-To Lake
69.74°N, 70.09°E1 1 A2 yasaveito LMS 210 KJ192286
19 Yamal, Beliy Is. 73.33°N, 70.06°E 1 1 A2 beliy LMS 209 KJ19228520 Yakutia, Olekminsky District
60.37°N, 120.63°E2 2 A5 olekma1, 2 ZIN 97384, 97386 KJ192255, KJ192256
21 Yakutia, Tomponsky District62.88°N, 133.94°E
1 1 A5 aldan ZIN 80729* KJ192257
22 Yakutia, Bulunsky District72.38°N, 126.47°E
4 2 A5 ustlena1, 2 LMS 481–484 KJ192258, KJ192259
23 Yakutia, Allaikhovsky District70.63°N, 147.87°E
10 5 A5 indigirka1–5 LMS 4051–4056, 4058, 4067–4069 KJ192261–KJ192265
24 Yakutia, Nizhnekolymsky District68.90°N, 157.60°E
7 1 A5 kolyma LMS 4091–4097 KJ192260
25 Tuva, Kyzylsky District51.29°N, 94.94°E
1 1 C shambalyg ZIN 99526 KJ192311
26 Tuva, Tandinsky District50.99°N, 94.52°E
2 2 C chagitay1, 2 ZIN 99523, 99524 KJ192310, KJ192311
27 Tuva, Kyzylsky District51.38°N, 95.70°E
3 2 B,C ustburen1, 2 LMS 2776–2778 KJ192307–KJ192309
28 Mongolia, Dzavhan District49.40°N, 96.92°E
1 1 B khangay ZIN 55985* KJ192296
29 Mongolia, Khuvsgul District49.53°N, 98.9°E
1 1 B burenhaan ZMMU S-179176 KJ192295
30 Buryatia, Kyakhtinsky District50.37°N, 106.25°E
2 2 B naushki1, 2 ZMMU S-179177, S-179178 KF751098, KF751099
31 Buryatia, Ulan-Udinsky District51.96°N, 107.40°E
1 1 B oshurkovo IBSS 1989 KF751100
32 Buryatia, Kabansky District52.14°N, 106.32°E
4 3 B istomino1–3 IBSS 2029, 2032, 2033, 2035 KF751101–KF751104
33 Buryatia, Yeravninsky District52.63°N, 111.30°E
1 1 B indola LMS 3092 KJ192306
34 Zabaikalsky Kray, Chitinsky District52.11°N, 113.41°E
1 1 B ugdan LMS 2794 KF751077
35 Zabaikalsky Kray, Nerchinsky District52.68°N, 116.28°E
1 1 B zulzikan ZMMU S-23252* KJ192297
36 Zabaikalsky Kray, Nerchinsky District52.10°N, 116.89°E
2 2 B kluchi1–2 ZIN 101668, LMS 4033 KJ192304, KJ192305
(continued)
doi: 10.1111/jzs.12082© 2014 Blackwell Verlag GmbH
4 PETROVA, ZAKHAROV, SAMIYA and ABRAMSON

DNASP v5.1 (Librado and Rozas 2009). Three neutrality test statisticsTajima’s D (Tajima 1989), Fu’s Fs (Fu 1997) and R2 (Ramos-Onsins andRozas 2002) were calculated to detect recent population expansion, whichresults in an excess of singleton mutations in the external branches of thephylogenies. The R2 analysis was performed with coalescent simulationsin 1000 replicates on the number of segregating sites as implemented inDNASP. Tajima’s D and Fu’s Fs tests were performed as implementedin the ARLEQUIN v3.5 software program (Excoffier et al. 2005).
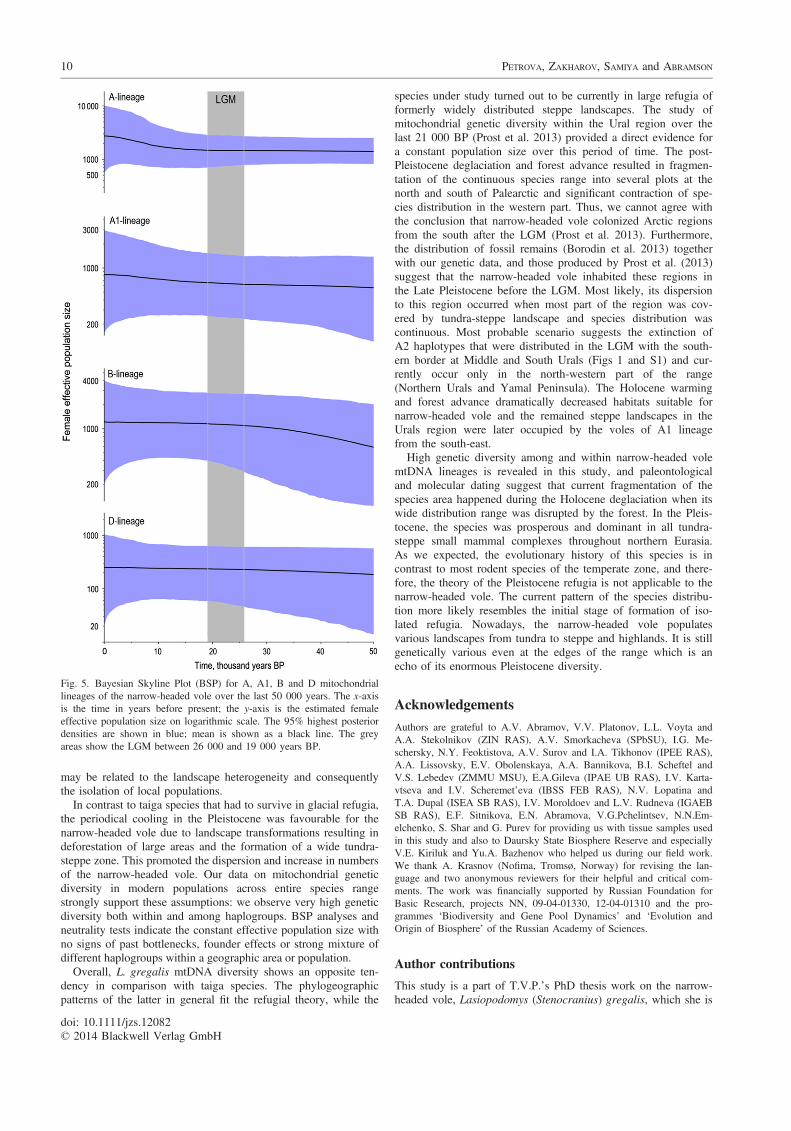
We used the Bayesian Skyline Plot (BSP; Drummond et al. 2005) asimplemented in BEAST v2.1.0 to investigate the changes in the femaleeffective population sizes of A (and separately A1 since it showed signif-icant values of three neutrality test statistics, as it is shown below), Band D lineages over time. The C lineage was not analysed because of itssmall sample size. The input file for the analyses was obtained with theapplication BEAUTI v2.1.0. The BSP analyses were performed with theconstant population size demographic function, under the HKY + Gnucleotide substitution model and using strict molecular clock as sug-gested by the Bayes factor analysis. We performed three independentMCMC runs of 100 million iterations each, sampling every 1000th stepfor each lineage. The results of the independent runs were combined withLOGCOMBINER v2.1.0 after the removal of 25% burn-in. TRACER v1.6(Rambaut and Drummond 2007) was used to verify that the runs weresuccessful (e.g. likelihood profile and ESS >200) and to visualize plotsof the female effective population sizes (Ne) over time.
Results
Sequence analysis
There were 100 different cytb haplotypes defined by 227 (25.5%)variable sites among the 164 specimens of L. (St.) gregalis. Theoverall haplotype and nucleotide diversity with their standard devi-ations was 0.986 � 0.003 and 0.065 � 0.002, respectively. Acrossan 889-bp-long alignment 199 nucleotide sites were parsimonyinformative. The majority of polymorphic sites were at the thirdpositions (164, 72.2%), followed by the first positions (48, 21.1%)
and finally the second positions (15, 6.6%). The estimated transi-tion/transversion rate ratio is 4.77. The average base composition ofcytb (T/C/A/G) was 22.9/25.2/27.8/24.0% for the first codon; 41.7/25.6/20.2/12.6 for the second and 16.5/39.3/40.5/3.6 for the thirdone that corresponds with other mammals (Irwin et al. 1991). Thedeficit of guanines is similar to that previously described in arvico-lines (Conroy and Cook 2000; Jaarola et al. 2004).
Sequences were deposited in GenBank with the AccessionNumbers KJ192239–KJ192327 (Table 1).
Phylogenetic analysis and divergence time
The phylogenetic analysis revealed only several haplotypesshared between different localities, so to simplify understandingof the figures, the identical sequences were added after analysis– they are marked with braces (Fig. 2).
Trees built with the use of ML, and both variants of the BImethods display similar topology slightly differing in support ofindividual nodes. There are four main phylogroups A, B, C andD all with 100% bootstrap values and 1.0 posterior probabilities(Fig. 2), corresponding to specific geographical regions. GroupA is formed by haplotypes from most of the area of the speciesdistribution (from the Ural Mountains and Tien Shan in the westto the Kolyma River in the east) (Fig. 1), with further subdivi-sion into six subclusters A1–A6. All subclusters, excluding theA4, show 1.0 BI posterior probability values, and ML bootstrapsupports are lower but mostly robust. Subclades A1, A2, A5 andA6 correspond to the particular geographical regions: A1 unitesspecimens from southern Ural to Khakassia (localities 1–13, 16),A2 – Yamal Peninsula (localities 17–19), A5 – Yakutia (locali-ties 20–24) and A6 – Kirgizia (localities 14, 15). Subclades A3(Southern Altay) and A4 (from eastern Kazakhstan to westernTuva) are parapatric (Table 1, Fig. 1).
Table 1. (continued)
Map numbers and sampling localities n H Clade Haplotypes Museum ID Accession Nos.
37 Zabaikalsky Kray, Sretensky District52.28°N, 117.65°E
8 7 B matakan1–7 ZIN 101669–101674; KJ192298–KJ192303ZMMU S-182032, S-182034 KF751078, KF751079
38 Amur Region, Svobodnensky District51.45°N, 127.65°E
1 1 B svobodn ZIN 41190* KJ192294
39 Amur Region, Romnensky District50.52°N, 128.84°E
10 3 B dalnev1–3 IBSS 233(08)-236(08), 2420,2421, 2426–2429
KJ192291–KJ192293
40 Mongolia, Dornod District, Uldzi River48.86°N, 112.19°E
5 3 D uldzi1–3 LMS 4145–4149 KJ192315–KJ192317
41 Zabaikalsky Kray, Aginsky-buryatskiyDistrict 50.69°N, 114.68°E
4 3 D khargan1–3 ZMMU S-191190–191193 KF751088–KF751091
42 Zabaikalsky Kray, Ononskiy District50.64°N, 115.67°E
1 1 D borzya ZMMU S-180439 KF751097
43 Zabaikalsky Kray, Borzinskiy District50.48°N, 116.07°E
11 2 D adon1, 2 ZIN 101658–665; LMS 3952–3954 KJ192313, KJ192314
44 Zabaikalsky Kray, Baleyskiy District51.56°N, 116.67°E
2 1 D baley ZIN 96277, 96283 KF751085
45 Zabaikalsky Kray, Kalgansky District51.36°N, 118.22°E
5 1 D kozlovo ZMMU S-178590–S-178594 KF751096
46 Zabaikalsky Kray, Aleksandro-ZavodskyDistrict 50.93°N, 117.94°E
1 1 D alzavod ZMMU S-191194 KF751087
47 Zabaikalsky Kray, KrasnokamenskiyDistrict 50.30°N, 118.5°E
1 1 D kujtun3 ZIN 101666 KJ192312
48 Zabaikalsky Kray, KrasnokamenskiyDistrict 50.12°N, 118.67°E
6 2 D kujtun1, 2 ZMMU S-180440–180443;S-180446; S-180447
KF751080–KF751084
49 Yamal 2 1 A2 AY513803 AF163895, AY51380350 Omsk region 1 1 A2 AF429817 AF429817y
n, number of specimens; H, number of haplotypes. Museum names are abbreviated as follows: ZIN, Zoological Institute RAS (Saint-Petersburg);LMS, Laboratory of Molecular Systematics (Zoological Institute RAS); ZMMU, Zoological Museum of Moscow State University; IBSS, Institute ofBiology and Soil Science FEB RAS (Vladivostok); IPAE, Institute of Plant and Animal Ecology UB RAS (Yekaterinburg); DTA, collection of DupalT.A. (Novosibirsk). Asterisks mark sequences obtained from museum samples.
doi: 10.1111/jzs.12082© 2014 Blackwell Verlag GmbH
Phylogeography of the narrow-headed vole Lasiopodomys (Stenocranius) gregalis 5

According to the results of the molecular clock analysis(Fig. 3), the basal differentiation of L. gregalis lineages occurredabout 0.8 Mya. The analysis conducted only with recent speci-mens (Fig. S3) showed the time of basal differentiation about 0.7Mya. However, using a single gene and a single calibrationpoint, the time estimates are unlikely to be free from errors and,hence, one needs to interpret dating results cautiously.
Differentiation within the haplogroup A started about 0.2–0.3Mya. It is noteworthy that the Late Pleistocene DNA haplotypesfrom Middle Ural (P2, P3, Fig. 1) reported in Prost et al. (2013)belong to haplogroup A2, whereas nowadays, this territory isinhabited by voles with haplotypes referred to haplogroup A1.However, among the specimens from the South Ural site ofHolocene age (P1, Fig. 1), there was one haplotype belonging tothe A2 group, whereas most specimens from this site yet possesshaplotypes A1. The ML tree using Prost et al. (2013) sequencesis given in Fig. S4.
The group B unites haplotypes from western Tuva, NorthernMongolia, Buryatia, the North of the Chita Region and the AmurRegion. This clade is also highly heterogeneous; nucleotidediversity within it is about 1.4% (Table 2). Several specimensfrom Tuva (localities 25–27, Fig. 1) form a cluster C. Datingwith the strict molecular clock shows that the B–C split tookplace 0.25–0.45 Mya.
Group D is the most divergent one and unites haplotypes fromsouth-east Transbaikalia. The genetic distances from the othergroups are 10–11.5% (Table 2), and these values are very highfor species level in arvicolines. The basal position of the phylo-group D on the tree is highly supported in every analysis.According to our estimates, D–(A, B, C) split occurred about0.6–1.0 Mya (Fig. 3).
The levels of genetic differentiation in cytb based on p-distancesbetween major L. (St.) gregalis haplogroups (Table 2) are about 6–11%, between A1 and A6 subclades 2.7–4.2%. Nucleotide diversi-ties within major haplogroups vary from 0.16% to 2.5%.
Population genetics and demographic analysis
Median-joining haplotype network (Fig. 4) shows the genealogi-cal relationships among cytb haplogroups of the narrow-headedvole. The largest haplogroup A includes 94 specimens (64 haplo-types). Subclades A3 and A4 differ by 14 mutation steps (Fig. 4),and p-distance is about 3% (Table 2). It is noteworthy that theyare located so close to each other that it is rather difficult to findthe geographical border; moreover, populations 4 and 7 (Fig. 1)have specimens belonging to both A3 and A4 subclades.
The network clearly shows the separate position of B and Chaplogroups divided by 45 mutations, and still, they demonstratethe sympatric location on the territory of the Tuva Republic.
As it was already underlined, haplogroup D extremely differsfrom all the rests, p-distance with the neighbouring clade C is10.5% (Table 2). At the same time, the indexes of genetic diver-sity within this group are very low (Table 3) – 13 individuals of36 studied turned out to have identical haplotypes; therewith,these 13 were found in different sites across rather large transectof south-east Transbaikal region (localities 40, 44, 45 and 48,Fig. 1).
The haplotype network shows that except D haplogroup, allclades and subclades show extremely high genetic diversity(Table 3); we nowhere observe a star-like structure at the haplo-type network, and there are just several haplotypes sharedbetween different localities.
Neutrality test statistics (Table 3) are mostly insignificant. Fu’sFs is significant only in the case of A and A1 (p < 0.02). Taj-ima’s D values are mostly statistically indistinguishable fromzero (except D clade where Tajima’s D is negative with
p < 0.05). Significant R2 statistics with p < 0.05 is performedonly for A1 and D groups.
The Bayesian Skyline Plot (Fig. 5) showed no signs of expan-sion for the A1 lineage, despite the significant neutrality test statis-tics values (Table 3) for this population. Within B and D lineages,BSP also did not reveal any dramatic expansions or bottlenecks.Some slight signs of a recent expansion event that began after theLGM are displayed for A haplogroup. These data together with theneutrality test results suggest that the hypothesis of a stable effec-tive population size in most cases cannot be rejected.
Discussion
Our data demonstrate that the narrow-headed vole is character-ized with a high rate of cytb evolution in comparison with otherMicrotus species. Trees in phylogeographic studies are com-monly calibrated in two ways – traditional fossil calibration thatis often based on incomplete data and calibration with ancientDNA from radiocarbon-dated specimens. Fossil calibration byspecies divergence times usually underestimates the clock ratesfor intraspecific events (Herman and Searle 2011), providinglower mutation rate compared with a DNA calibration. Triantand DeWoody (2006) suggested cytb mutation rate for Microtusof 8 9 10�8 substitution/site/year, while in the recent studies, itwas estimated to being 4–5 times higher: 3.27 9 10�7 forMicrotus arvalis (Martinkova et al. 2013) and 3.89 9 10�7 forMicrotus agrestis (Herman and Searle 2011). Prost et al. (2013)suggested 4.6 9 10�6 as the lower border of cytb mutation ratein L. gregalis, and our estimates suggested its value of3.1 9 10�5, that is an order of magnitude higher than previousestimates for Microtus species.
One of our most intriguing findings is the high genetic diver-sity in the modern narrow-headed vole populations, which maysuggest long-term occupation of the region. The phylogeographicpattern clearly demonstrates the division into four major mtDNAlineages with further subdivision (Fig. 2). The largest mitochon-drial diversity is found in the south-eastern part of the range.According to paleontological evidence (Vangengeim and Zazhi-gin 1969; Zazhigin 1980), this species occurred in SouthernSiberia since Early Pleistocene and this is in line with our esti-mates (Fig. 3). The phylogenetic analysis (Fig. 2) showed thatthe voles with D haplotypes were the earliest derivates. At thesame time, no difference from the geographically neighbouring Bhaplogroup was detected with the morphological characters ofthe skull (Lissovsky et al. 2013) and the karyotype structure(Kowalskaya 1989). Apparently, there is no obvious geographicalbarrier, which prevents sympatric distribution of B and D lin-eages. However, the forests along the Shilka and Ingoda Rivers(Lissovsky et al. 2013) may account for this isolation. It is possi-ble that the voles, which constitute haplogroup D distributed insouth-eastern Transbaikalia, may represent a cryptic species. Pau-perio et al. (2012) defined three cryptic species within Microtusagrestis using a multilocus approach. Two of these lineagesshowed cytb genetic divergence about 5.2–6.3% (Jaarola et al.2002) that is two times less than in L. gregalis. The taxonomicstatus of the Transbaikal clade is a task for future research,which will use conservative nuclear markers. In addition to theextremely high divergence from other lineages, the D haplogroupdiffers from all other clades by markedly low genetic diversityalong a rather large transect, which was confirmed with sufficientsampling (Table 1, Figs 1 and 4). We can speculate that the lowgenetic diversity is a result of genetic drift due to isolated exis-tence since the first split in the Early Pleistocene (Fig. 3). Analternative hypothesis states that the south of the Transbaikalregion is inhabited by the edge populations of this lineage,
doi: 10.1111/jzs.12082© 2014 Blackwell Verlag GmbH
6 PETROVA, ZAKHAROV, SAMIYA and ABRAMSON

Fig. 2. BI tree for the narrow-headed vole constructed using cytb haplotypes. Haplotypes shared between localities are marked with braces. Valuesabove nodes display maximum likelihood bootstrap supports and those below nodes – Bayesian posterior probabilities. Black circles show nodes with100% support in both analyses. For haplotype codes and location numbers (in brackets), refer to Table 1 and Fig. 1. Mitochondrial phylogroups arelabelled.
doi: 10.1111/jzs.12082© 2014 Blackwell Verlag GmbH
Phylogeography of the narrow-headed vole Lasiopodomys (Stenocranius) gregalis 7

whereas the main range is located in Eastern Mongolia orwestern China. Then, the low genetic diversity may be explainedby a founder effect with the leptokurtic mode of dispersion(Ibrahim et al. 1996).
According to the fossil record, appearance of the ancestralforms of the narrow-headed vole in the Baikal region dates backto the Early Pleistocene (around 0.78 Mya), the teeth identifiedas belonging to Microtus (Stenocranius) gregalis were found atseveral sites of this age in the western Transbaikal area (Alexe-eva and Erbajeva 2005). It was underlined that long-term molec-ular clock rates derived from species divergence times oftenunderestimate the clock rate for intraspecific events (Herman andSearle 2011), and it is noteworthy to mention that our moleculardating estimates are concordant with the paleontological data –we obtained the mean estimate of 0.8 Mya for the basal differen-tiation of L. (St.) gregalis lineages. An estimate of 0.4 Mya wasmade for the B+C group separation (the representatives of theseclades are currently distributed in Northern Mongolia, Transbai-kal area and eastward) and 0.27 Mya for its division into B andC clades. The estimated time for diversification within B groupis about 0.1 Mya. During this period, climate in Transbaikaliabecame more arid, the landscape was mosaic but stable, and evenHolocene humidization did not wipe out steppe zones (Alexeevaet al. 2009). Stable environmental conditions might preserve aconstant effective population size of the narrow-headed vole and
consequently high genetic diversity of the B haplogroup and onanother hand promote its stepping stone dispersion to the east.The tectonic region of the Stanovoy Range restricted thedispersion of voles of that haplogroup at the north. The horstuplifting of the Stanovoy Range was formed in the Pliocene –Early Pleistocene period. The last significant raise of the Stano-voy Range occurred at the border of the Early and the MiddlePleistocene (Delvaux et al. 1997). The current sympatric distribu-tion of the haplogroups B and C in Tuva is of particular interest.We can suppose that extremely mosaic landscapes of this regionconsisting of numerous depressions surrounded by mountainshave contributed to the long-term isolation and survivorship ofthe C haplogroup after it was separated from the B haplogroupin the Early-Middle Pleistocene. Tuva territory is known to befaunistically heterogeneous due to its basin structure. Forinstance, the relict subspecies of the Eurasian beaver Castor fibertuvinicus was described there (Babik et al. 2005). The finding ofnarrow-headed voles with highly diverged B and C haplotypeswithin one site (Fig. 1, 27) was most likely caused by a recentinvasion of the B lineage, which is genetically highly similar tothe voles of their lineage in the neighbouring areas of Mongoliaand Buryatia. At present, inference of demographic history of theC haplogroup is hampered with insufficient sampling in the Tuvaregion. However, we may hypothesize that low genetic diversitywas possibly caused by drift in conditions of long isolation.
Table 2. Average genetic distances for the major haplogroups
A B C D A1 A2 A3 A4 A5 A6
AB 0.074C 0.069 0.062D 0.104 0.114 0.105A 1 0.076 0.072 0.105A 2 0.082 0.076 0.102 0.035A 3 0.073 0.072 0.107 0.033 0.034A 4 0.077 0.068 0.105 0.033 0.031 0.031A 5 0.071 0.064 0.102 0.027 0.029 0.027 0.029A 6 0.071 0.064 0.099 0.040 0.042 0.039 0.040 0.036
Below diagonal elements – average p-distances between haplogroups
Fig. 3. Maximum clade credibility tree for narrow-headed vole cytb haplotypes. The posterior probability of each clade is presented at nodes, and bluebars show 95% highest posterior density intervals of node heights. L. mandarinus and L. brandtii are used as an outgroup.
doi: 10.1111/jzs.12082© 2014 Blackwell Verlag GmbH
8 PETROVA, ZAKHAROV, SAMIYA and ABRAMSON

The largest genetic diversity of the phylogroup A is allocatedin the south of Western Siberia (Altay and Sayan mountains),and it is the junction point of A1, A3, A4 and C haplogroups.These data provide strong support for a view of this area as asource of Middle Pleistocene colonization of the northern andnorth-eastern areas of Eurasia by the A phylogroup. Approxi-mately 50 000 years ago (Fig. 3), the ancestral populations ofA5 haplogroup dispersed from this territory to Northeastern Asia(Central and Northern Yakutia, Figs 1 and 2). The data ongenetic diversity within the haplogroup A and its subclades sug-gest that this gradual range enlargement occurred without thepopulation expansion, because there are no signs of foundereffects or bottlenecks marked by significant loss of genetic diver-
sity. Spatial patterns of genetic variation in populations of thenarrow-headed vole indicate normal or stepping stone mode ofdispersal from the south of Western Siberia (Ibrahim et al.1996). It is worth mentioning that at the south of Western Sibe-ria, there are still relict landscapes of the Pleistocene tundra-steppe (Sobolevskaya 1946; Krasnoborov 1986) which was themain biotope of the narrow-headed voles. Therefore, we do notexclude a possibility that the high genetic diversity in this regionmight be due to the survivorship of several lineages since theMiddle Pleistocene. The high genetic diversity in populations ofnarrow-headed voles inhabiting the Altay and Sayan mountainterritory is concordant with high morphological variability in thisregion (Dupal 1994). High genetic and morphological diversity
Fig. 4. Median-joining network of the narrow-headed vole cytb haplotypes. For haplotype labels, refer to Table 1. Size of circles is proportional to thehaplotype frequency. Number of mutational steps separating the haplotypes is proportional to the branch lengths (excluding three longest ones markedwith an asterisk – they are interrupted), and the length is indicated for the branches longer than 10 steps.
Table 3. Genetic diversity within the major haplogroups
n H Hd (SD) Pi % (SD) Fs (p-value) D (p-value) R2 (p-value)
A 89 61 0.987 (0.005) 2.548 (0.090) �18.0482 (0.0030) �0.3999 (0.4270) 0.0850 (0.4210)A1 29 20 0.966 (0.019) 0.584 (0.051) �9.7736 (0.0010) �1.4009 (0.0680) 0.0685 (0.0250)A2 5 4 0.900 (0.161) 0.225 (0.058) �1.0116 (0.1120) 0.2735 (0.6520) 0.1936 (0.1154)A3 12 10 0.970 (0.044) 0.576 (0.074) �3.5518 (0.0260) �0.3917 (0.3640) 0.1294 (0.2040)A4 15 13 0.981 (0.031) 1.185 (0.213) �3.0896 (0.0680) �0.4203 (0.3740) 0.1253 (0.3540)A5 24 11 0.884 (0.045) 0.571 (0.105) �0.9436 (0.3590) �0.3589 (0.4060) 0.1142 (0.3720)A6 4 3 0.833 (0.222) 1.069 (0.286) 2.5384 (0.8240) 0.9021 (0.8150) 0.2270 (0.3956)B 34 25 0.975 (0.014) 1.379 (0.103) �6.4187 (0.0230) �0.7539 (0.2530) 0.0866 (0.1910)C 5 3 0.800 (0.164) 0.157 (0.055) 0.0607 (0.3020) �0.1747 (0.4710) 0.2848 (0.4840)D 36 11 0.822 (0.046) 0.219 (0.038) �3.8081 (0.0290) �1.8371 (0.0290) 0.0640 (0.0381)
n, sample size; H, number of haplotypes; Hd, haplotype diversity; Pi, nucleotide diversity; SD, standard deviation; Fs, Fu’s Fs; D, Tajima’s D; R2,Ramos-Onsins and Rozas’s R2. Significant values of neutrality test statistics are signed in bold.
doi: 10.1111/jzs.12082© 2014 Blackwell Verlag GmbH
Phylogeography of the narrow-headed vole Lasiopodomys (Stenocranius) gregalis 9
may be related to the landscape heterogeneity and consequentlythe isolation of local populations.
In contrast to taiga species that had to survive in glacial refugia,the periodical cooling in the Pleistocene was favourable for thenarrow-headed vole due to landscape transformations resulting indeforestation of large areas and the formation of a wide tundra-steppe zone. This promoted the dispersion and increase in numbersof the narrow-headed vole. Our data on mitochondrial geneticdiversity in modern populations across entire species rangestrongly support these assumptions: we observe very high geneticdiversity both within and among haplogroups. BSP analyses andneutrality tests indicate the constant effective population size withno signs of past bottlenecks, founder effects or strong mixture ofdifferent haplogroups within a geographic area or population.
Overall, L. gregalis mtDNA diversity shows an opposite ten-dency in comparison with taiga species. The phylogeographicpatterns of the latter in general fit the refugial theory, while the
species under study turned out to be currently in large refugia offormerly widely distributed steppe landscapes. The study ofmitochondrial genetic diversity within the Ural region over thelast 21 000 BP (Prost et al. 2013) provided a direct evidence fora constant population size over this period of time. The post-Pleistocene deglaciation and forest advance resulted in fragmen-tation of the continuous species range into several plots at thenorth and south of Palearctic and significant contraction of spe-cies distribution in the western part. Thus, we cannot agree withthe conclusion that narrow-headed vole colonized Arctic regionsfrom the south after the LGM (Prost et al. 2013). Furthermore,the distribution of fossil remains (Borodin et al. 2013) togetherwith our genetic data, and those produced by Prost et al. (2013)suggest that the narrow-headed vole inhabited these regions inthe Late Pleistocene before the LGM. Most likely, its dispersionto this region occurred when most part of the region was cov-ered by tundra-steppe landscape and species distribution wascontinuous. Most probable scenario suggests the extinction ofA2 haplotypes that were distributed in the LGM with the south-ern border at Middle and South Urals (Figs 1 and S1) and cur-rently occur only in the north-western part of the range(Northern Urals and Yamal Peninsula). The Holocene warmingand forest advance dramatically decreased habitats suitable fornarrow-headed vole and the remained steppe landscapes in theUrals region were later occupied by the voles of A1 lineagefrom the south-east.
High genetic diversity among and within narrow-headed volemtDNA lineages is revealed in this study, and paleontologicaland molecular dating suggest that current fragmentation of thespecies area happened during the Holocene deglaciation when itswide distribution range was disrupted by the forest. In the Pleis-tocene, the species was prosperous and dominant in all tundra-steppe small mammal complexes throughout northern Eurasia.As we expected, the evolutionary history of this species is incontrast to most rodent species of the temperate zone, and there-fore, the theory of the Pleistocene refugia is not applicable to thenarrow-headed vole. The current pattern of the species distribu-tion more likely resembles the initial stage of formation of iso-lated refugia. Nowadays, the narrow-headed vole populatesvarious landscapes from tundra to steppe and highlands. It is stillgenetically various even at the edges of the range which is anecho of its enormous Pleistocene diversity.
Acknowledgements
Authors are grateful to A.V. Abramov, V.V. Platonov, L.L. Voyta andA.A. Stekolnikov (ZIN RAS), A.V. Smorkacheva (SPbSU), I.G. Me-schersky, N.Y. Feoktistova, A.V. Surov and I.A. Tikhonov (IPEE RAS),A.A. Lissovsky, E.V. Obolenskaya, A.A. Bannikova, B.I. Scheftel andV.S. Lebedev (ZMMU MSU), E.A.Gileva (IPAE UB RAS), I.V. Karta-vtseva and I.V. Scheremet’eva (IBSS FEB RAS), N.V. Lopatina andT.A. Dupal (ISEA SB RAS), I.V. Moroldoev and L.V. Rudneva (IGAEBSB RAS), E.F. Sitnikova, E.N. Abramova, V.G.Pchelintsev, N.N.Em-elchenko, S. Shar and G. Purev for providing us with tissue samples usedin this study and also to Daursky State Biosphere Reserve and especiallyV.E. Kiriluk and Yu.A. Bazhenov who helped us during our field work.We thank A. Krasnov (Nofima, Tromsø, Norway) for revising the lan-guage and two anonymous reviewers for their helpful and critical com-ments. The work was financially supported by Russian Foundation forBasic Research, projects NN, 09-04-01330, 12-04-01310 and the pro-grammes ‘Biodiversity and Gene Pool Dynamics’ and ‘Evolution andOrigin of Biosphere’ of the Russian Academy of Sciences.
Author contributions
This study is a part of T.V.P.’s PhD thesis work on the narrow-headed vole, Lasiopodomys (Stenocranius) gregalis, which she is
Fig. 5. Bayesian Skyline Plot (BSP) for A, A1, B and D mitochondriallineages of the narrow-headed vole over the last 50 000 years. The x-axisis the time in years before present; the y-axis is the estimated femaleeffective population size on logarithmic scale. The 95% highest posteriordensities are shown in blue; mean is shown as a black line. The greyareas show the LGM between 26 000 and 19 000 years BP.
doi: 10.1111/jzs.12082© 2014 Blackwell Verlag GmbH
10 PETROVA, ZAKHAROV, SAMIYA and ABRAMSON

developing under the supervision of N.I.A. Genetic laboratorywork and analyses were conducted at the Molecular systematicslaboratory of the Zoological Institute RAS, T.V.P conductedmost of laboratory work and analyses, N.I.A. also contributed todata analyses, both T.V.P. and N.I.A. participated in data collec-tion and contributed equally to writing the manuscript. E.S.Z car-ried special sampling in northern Yakutia, and R.S. provided theinvaluable material from northeastern Mongolia.
References
Abramson NI, Lissovsky AA (2012) Subfamily Arvicolinae. In: PavlinovI, Lissovsky AA (eds), The Mammals of Russia: A Taxonomic andGeographic Reference (Archive of the Zoological Museum of MSU),Vol. 52. KMK Scientific Press, Moscow, pp 220–276.
Abramson NI, Lebedev VS, Tesakov AS, Bannikova AA (2009a)Supraspecies relationships in the subfamily Arvicolinae (Rodentia,Cricetidae): an unexpected result of nuclear gene analysis.Molekulyarnaya Biologiya 43:834–846. [In Russian]
Abramson NI, Rodchenkova EN, Kostygov A (2009b) Genetic variationand phylogeography of the bank vole (Clethrionomys glareolus,Arvicolinae, Rodentia) in Russia with special reference to theintrogression of the mtDNA of a closely related species, red-backedvole (Cl. rutilus). Russ J Genet 45:533–545.
Abramson NI, Petrova TV, Dokuchaev NE, Obolenskaya EV,Lissovsky AA (2012) Phylogeography of the gray red-backed voleCraseomys rufocanus (Rodentia: Cricetidae) across the distributionrange inferred from nonrecombining molecular markers. Russ JTheriol 11:137–156.
Agadjanian AK (1972) Rodents from the Pleistocene deposits ofMamontovaya Gora. In: Agadjanian AK, Motuzko A.N. (ed.),Theriofauna of the Pleistocene. Moscow State University, Moscow, pp24–69. [In Russian]
Alexeeva NV (1996) Pleistocene small mammals of Tologoi (WesternTransbaikalia, Siberia). Acta Zoologica Cracoviensia 39:57–60.
Alexeeva NV, Erbajeva MA (2005) Changes in the fossil mammalfaunas of Western Transbaikalia during the Pliocene-Pleistoceneboundary and the Early-Middle Pleistocene transition. Quatern Int131:109–115.
Alexeeva NV, Erbajeva MA (2008) Diversity of Late Neogene-Pleistocene small mammals of the Baikalian region and implicationsfor paleoenvironment and biostratigraphy: an overview. Quatern Int179:190–195.
Alexeeva NV, Erbajeva MA, Khenzykhenova FI (2009) Paleogeographyand biota of Baikal region in the Late Cenosoic. In: Tulukhonov AK(ed.), An Atlas of Baikal, Nature and Human. ECOS: BuryatianScientific Center, Siberian Branch Russian Academy of Sciences,Ulan-Ude, pp 220–226.
Babik W, Durka W, Radwan J (2005) Sequence diversity of the MHCDRB gene in the Eurasian beaver (Castor fiber). Mol Ecol 14:4249–4257.
Bandelt HJ, Forster P, R€ohl A (1999) Median-joining networks forinferring intraspecific phylogenies. Mol Biol Evol 16:37–48.
Bennett KD (1997) Evolution and Ecology: The Pace of Life. CambridgeUniversity Press, Cambridge, 260 p.
Borodin A, Markova E, Zinovyev E, Strukova T, Fominykh M, Zykov S(2013) Quaternary rodent and insect faunas of the Urals and WesternSiberia: connection between Europe and Asia. Quatern Int 284:132–150.
Bouckaert R, Heled J, Kühnert D, Vaughan TG, Wu C-H, Xie D,Suchard MA, Rambaut A, Drummond AJ (2014) “BEAST2: Asoftware platform for Bayesian evolutionary analysis”. PLOSComputational Biogogy 10(4):e1003537. 2014. doi:10.1371/journal.pcbi.1003537 full text.
Brunhoff C, Galbreath KE, Fedorov VB, Cook JA, Jaarola M (2003)Holarctic phylogeography of the root vole (Microtus oeconomus):implications for late Quaternary biogeography of high latitudes. MolEcol 12:957–968.
Chaline J (1972) Les Rongeurs du Pleistocene Moyen et Superieur deFrance. Paris, �Editions du Centre national de la recherche scientifique,Paris, 410 p.
Conroy CJ, Cook JA (2000) Molecular systematics of a Holarctic rodent(Microtus: Muridae). J Mammal 81:344–359.
Darriba D, Taboada GL, Doallo R, Posada D (2012) jModelTest 2: moremodels, new heuristics and parallel computing. Nat Methods 9:772.
Dekonenko A, Yakimenko V, Ivanov A, Morozov V, Nikitin P,Khasanova S, Dzagurova T, Tkachenko E, Schmaljohn C (2003)Genetic similarity of Puumala viruses found in Finland and westernSiberia and of the mitochondrial DNA of their rodent hosts suggests acommon evolutionary origin. Infect Genet Evol 3:245–257.
Delvaux D, Moeys R, Stapel G, Petit C, Levi K, Miroshnichenko A,Ruzhich V, Sankov V (1997) Paleostress reconstructions andgeodynamics of the Baikal region, Central Asia. Part II.Tectonophysics 282:1–38.
Drummond AJ, Rambaut A (2007) BEAST: Bayesian evolutionaryanalysis by sampling trees. BMC Evol Biol 7:214.
Drummond AJ, Rambaut A, Shapiro B, Pybus OG (2005) Bayesiancoalescent inference of past population dynamics from molecularsequences. Mol Biol Evol 22:1185–1192.
Drummond AJ, Ho SYW, Phillips MJ, Rambaut A (2006) Relaxedphylogenetics and dating with confidence. PLoS Biol 4:699–710.
Dupal TA (1994) Morphological Diversity of Recent and Extinct Formsof the Narrow-Headed Vole. Thesis of dissertation, Institute of AnimalSystematic and Ecology, Siberian Branch of Russian Academy ofSciences, Novosibirsk. [In Russian]
Dupal TA (1998) Paleotheriological study of caves of the NorthwesternAltai. In: Derevyznko A.P. (ed.), The Problem of Reconstruction ofClimate and Environment of Holocene and Pleistocene in Siberia.Institute of Archaelogy and Ethnography SB RAS, Novosibirsk, pp147–150. [In Russian]
Excoffier L, Laval G, Schneider S (2005) Arlequin ver. 3.0: an integratedsoftware package for population genetics data analysis. Evol BioinformOnline 1:47–50.
Fedorov VB, Stenseth NC (2002) Multiple glacial refugia in the NorthAmerican Arctic: inference from phylogeography of the collaredlemming (Dicrostonyx groenlandicus). Proc Biol Sci 269:2071–2077.
Fedorov VB, Goropashnaya AV, Boeskorov GG, Cook JA (2008)Comparative phylogeography and demographic history of the woodlemming (Myopus schisticolor): implications for late Quaternaryhistory of the taiga species in Eurasia. Mol Ecol 17:598–610.
Fu X (1997) Statistical tests of neutrality of mutations against populationgrowth, hitchhiking and background selection. Genetics 147:915–925.
Gerasimov IP, Velichko AA (1982) Paleogeography of Europe Duringthe Last 100,000 Years (Atlas-Monograph). Nauka, Moscow. [InRussian]
Hall TA (1999) BioEdit: a user-friendly biological sequence alignmenteditor and analysis program for Windows 95/98/NT. Nucleic AcidsSymp Ser 41:95–98.
Herman JS, Searle JB (2011) Post-glacial partitioning of mitochondrialgenetic variation in the field vole. Proc Biol Sci 278:3601–3607.
Hewitt GM (1996) Some genetic consequences of ice ages, and their rolein divergence and speciation. Biol J Linn Soc Lond 58:247–276.
Hewitt GM (2000) The genetic legacy of the Quaternary ice ages. Nature405:907–913.
Huelsenbeck JP, Ronquist F (2005) Bayesian analysis of molecularevolution using MrBayes. In: Nielsen R (ed.), Statistical Methods inMolecular Evolution. Springer, New York.
Ibrahim KM, Nichols RA, Hewitt GM (1996) Spatial patterns of geneticvariation generated by different forms of dispersal during rangeexpansion. Heredity 77:282–291.
Irwin DM, Kocher TD, Wilson AC (1991) Evolution of the cytochromeb gene of mammals. J Mol Evol 32:128–144.
Jaarola M, Mart�ınkova N, G€und€uz I, Brunhoff C, Zima J, NadachowskiA, Amori G, Bulatova NS, Chondropoulos B, Fraguedakis-Tsolis S,Gonz�alez-Esteban J, L�opez-Fuster MJ, Kandaurov AS, Kefelioglu H,da Luz Mathias M, Villate I, Searle JB (2004) Molecular phylogeny ofthe speciose vole genus Microtus (Arvicolinae, Rodentia) inferred frommitochondrial DNA sequences. Mol Phylogenet Evol 33:647–663.
Jaarola M, Searle JB (2002) Phylogeography of field voles (Microtusagrestis) in Eurasia inferred from mitochondrial DNA sequences.Molecular Ecology 11:2613–2621.
Jin C, Kawamura Y, Taruno H (1999) Pliocene and early pleistoceneinsectivore and rodent faunas from Dajushan, Qipanshan and Haimao
doi: 10.1111/jzs.12082© 2014 Blackwell Verlag GmbH
Phylogeography of the narrow-headed vole Lasiopodomys (Stenocranius) gregalis 11

in North China and the reconstruction of the faunal succession fromthe Late Miocene to Middle Pleistocene. J Geosci 42:1–19.
Jobb G (2008) TREEFINDER. Version of October, 2008. Munich,Germany. Available at: http://www.treefinder.de/.
Kass RE, Raftery AE (1995) Bayes factors. J Am Stats Assoc 90:773–795.
Kowalskaya Y (1989) Karyotype variability of the narrow-headed volefrom Northern Mongolia (Rodentia, Cricetidae). ZoologicheskiiZhurnal 68:77–84. [In Russian]
Kowalski K (2001) Pleistocene Rodents of Europe. Folia Quaternaria72:389.
Krasnoborov IM (1986) About “tundro-steppes” in the South of CentralSiberia. Plant World of Highlands. Nauka, Leningrad, pp 131–136.
Lebedev VS, Bannikova AA, Tesakov AS, Abramson NI (2007)Molecular phylogeny of the genus Alticola (Cricetidae, Rodentia) asinferred from the sequence of the cytochrome b gene. Zoolog Scr36:547–563.
Librado P, Rozas J (2009) DnaSP v5: a software for comprehensiveanalysis of DNA polymorphism data. Bioinformatics 25:1451–1452.
Lissovsky AA, Obolenskaya EV, Petrova TV (2013) Morphological andgenetic variation of narrow-headed voles Lasiopodomys gregalis fromSouth-East Transbaikalia. Russ J Theriol 12:83–90.
Markova AK (2006) Pleistocene mammal faunas of Eastern Europe.Quatern Int 160:100–111.
Markova A, van Kolfschoten T (2008) Evolution of the EuropeanEcosystems During Pleistocene-Holocene Transition (24–8 kyr BP).KMK Scientific Press, Moscow, 556 p.
Martin RA, Tesakov A (1998) Introductory remarks: does Allophaiomysexist? Paludicola 2:1–7.
Martin Y, Gerlach G, Schlotterer C, Meyer A (2000) Molecularphylogeny of European b sequences. Mol Phylogenet Evol 37–47.
Martinkova N, Moravec J (2012) Multilocus phylogeny of arvicolinevoles (Arvicolini, Rodentia) shows small tree terrace size. Folia Zool61:254–267.
Martinkova N, Barnett R, Cucchi T, Struchen R, Pascal M, Pascal M,Fischer MC, Higham T, Brace S, HO SYW, Quere J-P, O’Higgins P,Excoffier L, Heckel G, Hoelzel AR, Dobney KM, Searle JB (2013)Divergent evolutionary processes associated with colonization ofoffshore islands. Mol Ecol 22:5205–5220.
Miller SA, Dykes DD, Polesky HF (1988) A simple salting outprocedure for extracting DNA from human nucleated cells. NucleicAcids Res 16:1215.
Obolenskaya EV, Lee M-Y, Dokuchaev NE, Oshida T, Lee M-S, Lee H,Lissovsky AA (2009) Diversity of Palaearctic chipmunks (Tamias,Sciuridae). Mammalia 73:281–298.
Ohdachi S, Dokuchaev NE, Hasegawa M, Masuda R (2001) Intraspecificphylogeny and geographical variation of six species of northeasternAsiatic Sorex shrews based on the mitochondrial cytochrome bsequences. Mol Ecol 10:2199–2213.
Paupério J, Herman JS, Melo-Ferreira J, Jaarola M, Alves PC, Searle JB(2012) Cryptic speciation in the field vole: a multilocus approachconfirms three highly divergent lineages in Eurasia. Molecular Ecology21(24):6015–6032.
Pazonui P (2011) Palaeoecology of Late Pliocene and Quaternarymammalian communities in the Carpathian Basin. Acta ZoologicaCracoviensia 54:1–29.
Prost S, Guralnick RP, Waltari E, Fedorov VB, Kuzmina E, Smirnov N,van Kolfschoten T, Hofreiter M, Vrieling K (2013) Losing ground:past history and future fate of Arctic small mammals in a changingclimate. Glob Chang Biol 19:1854–1864.
Rambaut A, Drummond AJ (2007) Tracer v1.4. Available from http://beast.bio.ed.ac.uk/Tracer
Ramos-Onsins SE, Rozas J (2002) Statistical properties of new neutralitytest against population growth. Mol Biol Evol 19:2092–2100.
Ronquist F, Huelsenbeck JP (2003) MrBayes 3: Bayesian phylogeneticinference under mixed models. Bioinformatics 19:1572–1574.
Runck AM, Cook JA (2005) Postglacial expansion of the southern red-backed vole (Clethrionomys gapperi) in North America. Mol Ecol14:1445–1456.
Sese C, Villa P (2008) Micromammals (rodents and insectivores) fromthe early Late Pleistocene cave site of Bois Roche (Charente, France):systematics and paleoclimatology. Geobios 41:399–414.
Shenbrot GI, Krasnov BR (2005) An Atlas of the GeographicDistribution of the Arvicoline Rodents of the World (Rodentia,Muridae: Arvicolinae). Pensoft Publ, Sofia, 350 p.
Smirnov NG, Kuz’mina EA, Golovachev IB, Fadeeva TV (2007) Thenarrow-skulled vole (Microtus gregalis Pall.) in the dynamics of zonalrodent communities of northern Eurasia. Russ J Ecol 38:106–111.
Sobolevskaya KA (1946) On the question of relict flora of the KuznetskyAlatau eastern descents and steppes of Khakassia. Izvestiya Zapadno-Sibirskogo filiala AS USSR Ser Biol 1:33–40. [In Russian]
Suchard MA, Weiss RE, Sinsheimer JS (2001) Bayesian selection ofcontinuous-time Markov chain evolutionary models. Mol Biol Evol18:1001–1013.
Sutcliffe AJ, Kowalski KZ (1976) Pleistocene Rodents of the BritishIsles, Vol. 27. Bulletin of the British Museum (Natural History),London, 147 p.
Tajima F (1989) Statistical method for testing the neutral mutationhypothesis by DNA polymorphism. Genetics 123:585–595.
Tamura K, Peterson D, Peterson N, Stecher G, Nei M, Kumar S (2011)MEGA5: molecular evolutionary genetics analysis using maximumlikelihood, evolutionary distance, and maximum parsimony methods.Mol Biol Evol 28:2731–2739.
Thompson JD, Higgins DG, Gibson TJ (1994) CLUSTAL W: improvingthe sensitivity of progressive multiple sequence alignment throughsequence weighting, position-specific gap penalties and weight matrixchoice. Nucleic Acids Res 22:4673–4680.
Triant DA, DeWoody JA (2006) Accelerated molecular evolution inMicrotus (Rodentia) as assessed via complete mitochondrial genomesequences. Genetica. 128(1–3):95–108.
Vangengeim EA, Zazhigin VS (1969) Mammal faunas of siberianeopleistocene and their correlation with East European. Osnovnyeproblem geologii antropogena Evrazii. eds. Gromov V.I. andNikiforova K.V. Nauka, Moscow, pp 47–58.
Vangengeim EA, Erbajeva MA, Sotnikova MV (1990) Pleistocenemammals from Zasukhino, Western Transbaikalia.Quartaerpalaeontologie 8:257–264.
West KJ (2000) Plant Life of the Quaternary Cold Stages. CambridgeUniversity Press, Cambridge, 320 p.
Yannic G, Burri R, Malikov VG, Vogel P (2011) Systematics of snowvoles (Chionomys, Arvicolinae) revisited. Mol Phylogenet Evol62:806–815.
Zazhigin VS (1980) Gryzuny Pozdnego Pliocena i Antropogena YugaZapadnoi Sibiri [Late Pliocene and Anthropogene Rodents of theSouth of Western Siberia]. Nauka, Moscow, 156 p. [In Russian]
Zheng S, Cai B (1991) Micromammalian fossils from Danangou ofYuxian, Hebei, Contributions to the XIII INQUA. Beijing Scientificand Technological Publishing House, Beijing, pp 100–131.
Supporting InformationAdditional Supporting Information may be found in the onlineversion of this article:Figure S1. An 889-bp cytochrome b alignment used for phy-
logeny reconstructions.Figure S2. An 461-bp cytochrome b alignment including Prost
et al. (2013) sequences used for time estimates and BSP analy-ses.Figure S3. Maximum clade credibility tree for the recent cytb
haplotypes of the narrow-headed vole.Figure S4. BI tree constructed using Pleistocene and Holocene
narrow-headed vole 461-bp cytb sequences (Prost et al. 2013).
doi: 10.1111/jzs.12082© 2014 Blackwell Verlag GmbH
12 PETROVA, ZAKHAROV, SAMIYA and ABRAMSON